| FREE WRITING PROSPECTUS | ||
| FILED PURSUANT TO RULE 433 | ||
| REGISTRATION FILE NO.: 333-227446-07 | ||
 |  |  |
MSC 2019-L3
Free Writing Prospectus
Structural and Collateral Term Sheet
$1,021,169,362
(Approximate Total Mortgage Pool Balance)
$907,564,000
(Approximate Offered Certificates)
Morgan Stanley Capital I Inc.
as Depositor
Morgan Stanley Mortgage Capital Holdings LLC
Starwood Mortgage Capital LLC
Argentic Real Estate Finance LLC
KeyBank National Association
Cantor Commercial Real Estate Lending, L.P.
as Sponsors and Mortgage Loan Sellers
Commercial Mortgage Pass-Through Certificates
Series 2019-L3
November 4, 2019
| MORGAN STANLEY Co-Lead Bookrunning Manager | Cantor Fitzgerald & Co. Co-Lead Bookrunning Manager | KeyBanc Capital Markets Co-Lead Bookrunning Manager |
The Williams Capital Group, L.P. Co-Manager |
STATEMENT REGARDING THIS FREE WRITING PROSPECTUS
The depositor has filed a registration statement (including a prospectus) with the SEC (File No. 333-227446) for the offering to which this communication relates. Before you invest, you should read the prospectus in that registration statement and other documents the depositor has filed with the SEC for more complete information about the depositor, the issuing entity and this offering. You may get these documents for free by visiting EDGAR on the SEC web site atwww.sec.gov. Alternatively, the depositor or any underwriter or any dealer participating in the offering will arrange to send you the prospectus if you request it by calling toll free 1-866-718-1649 or by email toprospectus@ms.com.
| This is not a research report and was not prepared by any Underwriter’s research department. It was prepared by the Underwriters’ sales, trading, banking or other non-research personnel. Please see additional important information and qualifications at the end of this Term Sheet. |
| MSC 2019-L3 |
Neither this Term Sheet nor anything contained herein shall form the basis for any contract or commitment whatsoever.The information contained herein is preliminary as of the date hereof.This Term Sheet is subject to change, completion or amendment from time to time.The information contained herein supersedes information in any other communication relating to the securities described herein, provided, that the information contained herein will be superseded by similar information delivered to you as part of the Preliminary Prospectus.The information contained herein should be reviewed only in conjunction with the entire Preliminary Prospectus.All of the information contained herein is subject to the same limitations and qualifications contained in the Preliminary Prospectus.The information contained herein does not contain all relevant information relating to the underlying mortgage loans or mortgaged properties.Such information is described in the Preliminary Prospectus.The information contained herein will be more fully described in the Preliminary Prospectus.The information contained herein should not be viewed as projections, forecasts, predictions or opinions with respect to value.Prior to making any investment decision, prospective investors are strongly urged to read the Preliminary Prospectus in its entirety.Neither the Securities and Exchange Commission nor any state securities commission has approved or disapproved of these securities or determined if this Term Sheet is truthful or complete.Any representation to the contrary is a criminal offense.
IMPORTANT NOTICE RELATING TO AUTOMATICALLY GENERATED EMAIL DISCLAIMERS
Any legends, disclaimers or other notices that may appear at the bottom of, or attached to, the email communication to which this Term Sheet may have been attached are not applicable to this Term Sheet and should be disregarded. Such legends, disclaimers or other notices have been automatically generated as a result of this Term Sheet having been sent via Bloomberg or another email system.
IMPORTANT NOTICE REGARDING THE CONDITIONS FOR THIS OFFERING OF ASSET-BACKED SECURITIES
THE ASSET-BACKED SECURITIES REFERRED TO IN THIS TERM SHEET ARE BEING OFFERED WHEN, AS AND IF ISSUED. IN PARTICULAR, YOU ARE ADVISED THAT THE ASSET-BACKED SECURITIES, AND THE ASSET POOL BACKING THEM, ARE SUBJECT TO MODIFICATION OR REVISION (INCLUDING, AMONG OTHER THINGS, THE POSSIBILITY THAT ONE OR MORE CLASSES OF SECURITIES MAY BE SPLIT, COMBINED OR ELIMINATED), AT ANY TIME PRIOR TO ISSUANCE OR AVAILABILITY OF A FINAL PROSPECTUS. AS A RESULT, YOU MAY COMMIT TO PURCHASE SECURITIES THAT HAVE CHARACTERISTICS THAT MAY CHANGE, AND YOU ARE ADVISED THAT ALL OR A PORTION OF THE SECURITIES MAY NOT BE ISSUED THAT HAVE THE CHARACTERISTICS DESCRIBED IN THIS TERM SHEET. OUR OBLIGATION TO SELL SECURITIES TO YOU IS CONDITIONED ON THE SECURITIES AND THE UNDERLYING TRANSACTION HAVING THE CHARACTERISTICS DESCRIBED IN THIS TERM SHEET. IF WE DETERMINE THAT THE FOREGOING CONDITION IS NOT SATISFIED IN ANY MATERIAL RESPECT, WE WILL NOTIFY YOU, AND NEITHER THE ISSUING ENTITY NOR ANY UNDERWRITER WILL HAVE ANY OBLIGATION TO YOU TO DELIVER ALL OR ANY PORTION OF THE SECURITIES WHICH YOU HAVE COMMITTED TO PURCHASE, AND THERE WILL BE NO LIABILITY BETWEEN US AS A CONSEQUENCE OF THE NON-DELIVERY.
| This is not a research report and was not prepared by any Underwriter’s research department. It was prepared by the Underwriters’ sales, trading, banking or other non-research personnel. Please see additional important information and qualifications at the end of this Term Sheet. |
2
| MSC 2019-L3 | Structural Overview |
Offered Certificates
| Class | Expected Ratings (Fitch/KBRA/S&P)(1) | Approximate Initial Certificate Balance or Notional Amount(2) | Approximate Initial Available Certificate Balance or Notional Amount(2)(3) | Approximate Initial Retained Certificate Balance or Notional Amount(2)(3) | Approximate Initial Credit Support(4) | Pass-Through Rate Description | Expected Weighted Average Life (Years)(5) | Expected Principal Window (Months)(5) | Certificate Principal UW NOI Debt Yield(6) | Certificate Principal to Value Ratio(7) | ||||||||||||||||||||||||||
| Class A-1 | AAAsf/AAA(sf)/AAA(sf) | $ | 11,300,000 | $ | 10,832,000 | $ | 468,000 | 30.000 | % | (8) | 3.10 | 1 – 60 | 14.4% | 41.4% | ||||||||||||||||||||||
| Class A-2 | AAAsf/AAA(sf)/AAA(sf) | $ | 9,200,000 | $ | 8,819,000 | $ | 381,000 | 30.000 | % | (8) | 4.98 | 60 – 60 | 14.4% | 41.4% | ||||||||||||||||||||||
| Class A-SB | AAAsf/AAA(sf)/AAA(sf) | $ | 24,600,000 | $ | 23,582,000 | $ | 1,018,000 | 30.000 | % | (8) | 7.37 | 60 – 115 | 14.4% | 41.4% | ||||||||||||||||||||||
| Class A-3 | AAAsf/AAA(sf)/AAA(sf) | (9) | (9) | (9) | 30.000 | % | (8) | (9) | (9) | 14.4% | 41.4% | |||||||||||||||||||||||||
| Class A-4 | AAAsf/AAA(sf)/AAA(sf) | (9) | (9) | (9) | 30.000 | % | (8) | (9) | (9) | 14.4% | 41.4% | |||||||||||||||||||||||||
| Class X-A | AAAsf/AAA(sf)/AAA(sf) | $ | 714,818,000 | (10) | $ | 685,257,000 | (10) | $ | 29,561,000 | (10) | N/A | Variable(11) | N/A | N/A | N/A | N/A | ||||||||||||||||||||
| Class X-B | A-sf/AAA(sf)/NR | $ | 192,746,000 | (10) | $ | 184,775,000 | (10) | $ | 7,971,000 | (10) | N/A | Variable(11) | N/A | N/A | N/A | N/A | ||||||||||||||||||||
| Class A-S | AAAsf/AAA(sf)/AAA(sf) | $ | 94,458,000 | $ | 90,552,000 | $ | 3,906,000 | 20.750 | % | (8) | 9.98 | 120 – 120 | 12.7% | 46.8% | ||||||||||||||||||||||
| Class B | AA-sf/AA(sf)/AA-(sf) | $ | 53,612,000 | $ | 51,395,000 | $ | 2,217,000 | 15.500 | % | (8) | 9.98 | 120 – 120 | 12.0% | 49.9% | ||||||||||||||||||||||
| Class C | A-sf/A-(sf)/NR | $ | 44,676,000 | $ | 42,828,000 | $ | 1,848,000 | 11.125 | % | (8) | 9.98 | 120 – 120 | 11.4% | 52.5% | ||||||||||||||||||||||
Privately Offered Certificates(12)
| Class | Expected Ratings (Fitch/KBRA/S&P)(1) | Approximate Initial Certificate Balance or Notional Amount(2) | Approximate Initial Available Certificate Balance or Notional Amount(2)(3) | Approximate Initial Retained Certificate Balance or Notional Amount(2)(3) | Approximate Initial Credit Support(4) | Pass-Through Rate Description | Expected Weighted Average Life (Years)(5) | Expected Principal Window (Months)(5) | Certificate Principal UW NOI Debt Yield(6) | Certificate Principal to Value Ratio(7) | |||||||||||||||||||||||||
| Class X-D | BBB-sf/BBB-(sf)/NR | $ | 47,229,000 | (10) | $ | 45,275,000 | (10) | $ | 1,954,000 | (10) | N/A | Variable(11) | N/A | N/A | N/A | N/A | |||||||||||||||||||
| Class X-F | BB+sf/BB+(sf)/NR | $ | 11,488,000 | (10) | $ | 11,012,000 | (10) | $ | 476,000 | (10) | N/A | Variable(11) | N/A | N/A | N/A | N/A | |||||||||||||||||||
| Class X-G | BB-sf/BB-(sf)/NR | $ | 10,212,000 | (10) | $ | 9,789,000 | (10) | $ | 423,000 | (10) | N/A | Variable(11) | N/A | N/A | N/A | N/A | |||||||||||||||||||
| Class X-H | B-sf/B-(sf)/NR | $ | 10,211,000 | (10) | $ | 9,788,000 | (10) | $ | 423,000 | (10) | N/A | Variable(11) | N/A | N/A | N/A | N/A | |||||||||||||||||||
| Class D | BBBsf/BBB+(sf)/NR | $ | 26,805,000 | $ | 25,696,000 | $ | 1,109,000 | 8.500 | % | (8) | 9.98 | 120 – 120 | 11.0% | 54.1% | |||||||||||||||||||||
| Class E | BBB-sf/BBB-(sf)/NR | $ | 20,424,000 | $ | 19,579,000 | $ | 845,000 | 6.500 | % | (8) | 9.98 | 120 – 120 | 10.8% | 55.3% | |||||||||||||||||||||
| Class F | BB+sf/BB+(sf)/NR | $ | 11,488,000 | $ | 11,012,000 | $ | 476,000 | 5.375 | % | (8) | 9.98 | 120 – 120 | 10.7% | 55.9% | |||||||||||||||||||||
| Class G | BB-sf/BB-(sf)/NR | $ | 10,212,000 | $ | 9,789,000 | $ | 423,000 | 4.375 | % | (8) | 9.98 | 120 – 120 | 10.6% | 56.5% | |||||||||||||||||||||
| Class H | B-sf/B-(sf)/NR | $ | 10,211,000 | $ | 9,788,000 | $ | 423,000 | 3.375 | % | (8) | 9.98 | 120 – 120 | 10.5% | 57.1% | |||||||||||||||||||||
| Class J-RR | NR/NR/NR | $ | 34,465,361 | $ | 33,040,218 | $ | 1,425,143 | 0.000 | % | (8) | 9.98 | 120 – 120 | 10.1% | 59.1% | |||||||||||||||||||||
| (1) | Ratings shown are those of Fitch Ratings, Inc. (“Fitch”), Kroll Bond Rating Agency, Inc. (“KBRA”) and S&P Global Ratings, a Standard & Poor’s Financial Services LLC business (“S&P”). Certain nationally recognized statistical rating organizations that were not hired by the depositor may use information they receive pursuant to Rule 17g-5 under the Securities Exchange Act of 1934, as amended, or otherwise to rate the certificates. There can be no assurance as to what ratings a non-hired nationally recognized statistical rating organization would assign. See “Risk Factors—Other Risks Relating to the Certificates—Nationally Recognized Statistical Rating Organizations May Assign Different Ratings to the Certificates; Ratings of the Certificates Reflect Only the Views of the Applicable Rating Agencies as of the Dates Such Ratings Were Issued; Ratings May Affect ERISA Eligibility; Ratings May Be Downgraded” and “Ratings” in the Preliminary Prospectus, expected to be dated on or about the date hereof (the “Preliminary Prospectus”). Capitalized terms used but not defined herein have the meanings assigned to such terms in the Preliminary Prospectus. |
| (2) | Approximate, subject to a permitted variance of plus or minus 5% or, in the case of the Class A-3 and Class A-4 certificates, such greater percentages as are contemplated by footnote (9) below. In addition, the notional amounts of the Class X-A, Class X-B, Class X-D, Class X-F, Class X-G and Class X-H certificates may vary depending upon the final pricing of the classes of principal balance certificates whose certificate balances comprise such notional amounts, and, if as a result of such pricing the pass-through rate of any class of the Class X-A, Class X-B, Class X-D, Class X-F, Class X-G or Class X-H certificates, as applicable, would be equal to zero at all times, such class of certificates will not be issued on the closing date of this securitization. |
| (3) | On the Closing Date, Starwood Mortgage Capital LLC, as “retaining sponsor” (as defined in Regulation RR) for the securitization constituted by the issuance of the certificates, is expected to cause two separate “majority-owned affiliates” (as defined in Regulation RR) to purchase (i) an “eligible vertical interest” (as defined in Regulation RR) in the form of certificates representing 4.135% of the initial certificate balance, notional amount or percentage interest, as applicable, of each class of certificates other than the Class R certificates (collectively, the “VRR Interest”), as set forth in the table above under “Approximate Initial Retained Certificate Balance or Notional Amount,” and (ii) an “eligible horizontal residual interest” (as defined in Regulation RR) in the form of the Class J-RR certificates (excluding the portion thereof that comprises a part of the VRR Interest) (referred to herein as the “HRR Interest”), representing approximately 0.887% of the aggregate fair value of the certificates (other than the Class R certificates). See “Credit Risk Retention” in the Preliminary Prospectus. The entity purchasing the VRR Interest is expected to purchase slightly more than 4.135% of some or all of the classes of certificates, which excess over 4.135% (with respect to all classes except the Class J-RR certificates) is included in the amounts set forth under “Approximate Initial Retained Certificate Balance or Notional Amount” but does not constitute part of the VRR Interest. |
| This is not a research report and was not prepared by any Underwriter’s research department. It was prepared by the Underwriters’ sales, trading, banking or other non-research personnel. Please see additional important information and qualifications at the end of this Term Sheet. |
3
| MSC 2019-L3 | Structural Overview |
| (4) | The approximate initial credit support percentages set forth for the certificates are approximate and, for the Class A-1, Class A-2, Class A-SB, Class A-3 and Class A-4 certificates, are represented in the aggregate. |
| (5) | The Expected Weighted Average Life and Expected Principal Window during which distributions of principal would be received as set forth in the foregoing table with respect to each class of certificates having a certificate balance are based on the assumptions set forth under “Yield and Maturity Considerations—Weighted Average Life” in the Preliminary Prospectus and on the assumptions that there are no prepayments, modifications or losses in respect of the mortgage loans and that there are no extensions or forbearances of maturity dates or anticipated repayment dates of the mortgage loans. |
| (6) | Certificate Principal UW NOI Debt Yield for any class of principal balance certificates is calculated as the product of (a) the weighted average UW NOI Debt Yield for the mortgage pool, multiplied by (b) a fraction, the numerator of which is the total initial certificate balance of all the principal balance certificates, and the denominator of which is the total initial certificate balance of the subject class of principal balance certificates and all other classes of principal balance certificates, if any, that are senior to such class. The Certificate Principal UW NOI Debt Yields of the Class A-1, Class A-2, Class A-SB, Class A-3 and Class A-4 certificates are calculated in the aggregate for those classes as if they were a single class. |
| (7) | Certificate Principal to Value Ratio for any class of principal balance certificates is calculated as the product of (a) the weighted average Cut-off Date LTV Ratio of the mortgage pool, multiplied by (b) a fraction, the numerator of which is the total initial certificate balance of the subject class of principal balance certificates and all other classes of principal balance certificates, if any, that are senior to such class, and the denominator of which is the total initial certificate balance of all the principal balance certificates. The Certificate Principal to Value Ratios of the Class A-1, Class A-2, Class A-SB, Class A-3 and Class A-4 certificates are calculated in the aggregate for those classes as if they were a single class. |
| (8) | The pass-through rate for each class of the Class A-1, Class A-2, Class A-SB, Class A-3, Class A-4, Class A-S, Class B, Class C, Class D, Class E, Class F, Class G, Class H and Class J-RR certificates (collectively referred to as the “principal balance certificates”) will be one of the following: (i) a fixed rateper annum, (ii) a variable rateper annum equal to the weighted average of the net mortgage interest rates on the mortgage loans for the related distribution date, (iii) a variable rateper annumequal to the lesser of (a) a fixed rate and (b) the weighted average of the net mortgage interest rates on the mortgage loans for the related distribution date or (iv) a variable rateper annum equal to the weighted average of the net mortgage interest rates on the mortgage loans for the related distribution date minus a specified percentage. For purposes of the calculation of the weighted average of the net mortgage interest rates on the mortgage loans for each distribution date, the net mortgage interest rates will be adjusted as necessary to a 30/360 basis. |
| (9) | The exact initial certificate balances of the Class A-3 and Class A-4 certificates are unknown and will be determined based on the final pricing of those classes of certificates. However, the initial certificate balances (and corresponding available and retained portions thereof), weighted average lives and principal windows of the Class A-3 and Class A-4 certificates are expected to be within the applicable ranges reflected in the following chart. The aggregate initial certificate balance of the Class A-3 and Class A-4 certificates is expected to be approximately $669,718,000, subject to a variance of plus or minus 5%. |
Class of Certificates | Expected Range of Initial | Expected Range of Initial Available | Expected Range of Initial | Expected Range | Expected Range of |
| Class A-3 | $200,000,000 – $315,000,000 | $191,730,000 – $301,974,000 | $8,270,000 – $13,026,000 | 9.77 – 9.82 | 115 – 119 / 115 – 119 |
| Class A-4 | $354,718,000 – $469,718,000 | $340,050,000 – $450,295,000 | $14,668,000 – $19,423,000 | 9.95 – 9.97 | 119 – 120 / 119 – 120 |
| (10) | The Class X-A, Class X-B, Class X-D, Class X-F, Class X-G and Class X-H certificates (collectively referred to as the “Class X certificates”) are notional amount certificates and will not be entitled to distributions of principal. The notional amount of the Class X-A certificates will be equal to the aggregate certificate balance of the Class A-1, Class A-2, Class A-SB, Class A-3 and Class A-4 certificates. The notional amount of the Class X-B certificates will be equal to the aggregate certificate balance of the Class A-S, Class B and Class C certificates. The notional amount of the Class X-D certificates will be equal to the aggregate certificate balance of the Class D and Class E certificates. The notional amount of each class of the Class X-F, Class X-G and Class X-H certificates will be equal to the certificate balance of the class of principal balance certificates that, with the addition of “X-,” has the same alphabetical designation as the subject class of Class X certificates. If the certificate balance of a class of principal balance certificates constitutes all or part of the notional amount of a class of Class X certificates, then such class of principal balance certificates constitutes an underlying class of principal balance certificates for such class of Class X certificates. |
| (11) | The pass-through rate for the Class X-A certificates for any distribution date will be aper annum rate equal to the excess, if any, of (a) the weighted average of the net mortgage interest rates on the mortgage loans for the related distribution date, over (b) the weighted average of the pass-through rates on the Class A-1, Class A-2, Class A-SB, Class A-3 and Class A-4 certificates for the related distribution date, weighted on the basis of their respective certificate balances outstanding immediately prior to that distribution date. The pass-through rate for the Class X-B certificates for any distribution date will be aper annum rate equal to the excess, if any, of (a) the weighted average of the net mortgage interest rates on the mortgage loans for the related distribution date, over (b) the weighted average of the pass-through rates on the Class A-S, Class B and Class C certificates for the related distribution date, weighted on the basis of their respective certificate balances outstanding immediately prior to that distribution date. The pass-through rate for the Class X-D certificates for any distribution date will be aper annum rate equal to the excess, if any, of (a) the weighted average of the net mortgage interest rates on the mortgage loans for the related distribution date, over (b) weighted average of the pass-through rates on the Class D and Class E certificates for the related distribution date, weighted on the basis of their respective certificate balances outstanding immediately prior to that distribution date. The pass-through rate for each class of the Class X-F, Class X-G and Class X-H certificates for any distribution date will be aper annum rate equal to the excess, if any, of (a) the weighted average of the net mortgage interest rates on the mortgage loans for the related distribution date, over (b) the pass-through rate for the related distribution date of the class of principal balance certificates that, with the addition of “X-,” has the same alphabetical designation as the subject class of Class X certificates. For purposes of the calculation of the weighted average of the net mortgage interest rates on the mortgage loans for each distribution date, the net mortgage interest rates will be adjusted as necessary to a 30/360 basis. |
| (12) | Not offered pursuant to the Preliminary Prospectus or this Term Sheet. Information provided in this Term Sheet regarding the characteristics of these certificates is provided only to enhance your understanding of the offered certificates. The privately offered certificates also include the Class V and Class R certificates, which do not have a certificate balance, notional amount, pass-through rate, rating or rated final distribution date, and which are not shown in the chart. The Class V certificates represent a beneficial ownership interest held through the grantor trust in certain excess interest in respect of mortgage loans having anticipated repayment dates, if any. The Class R certificates represent the beneficial ownership of the residual interest in each of the real estate mortgage investment conduits, as further described in the Preliminary Prospectus. Because there are no mortgage loans with anticipated repayment dates in the mortgage pool, there will be no excess interest distributable to the Class V certificates. |
| This is not a research report and was not prepared by any Underwriter’s research department. It was prepared by the Underwriters’ sales, trading, banking or other non-research personnel. Please see additional important information and qualifications at the end of this Term Sheet. |
4
| MSC 2019-L3 | Structural Overview |
Issue Characteristics
| Offered Certificates: | $907,564,000 (approximate) monthly pay, multi-class, commercial mortgage pass-through certificates, consisting of eight principal balance classes (Class A-1, Class A-2, Class A-SB, Class A-3, Class A-4, Class A-S, Class B and Class C) and two interest-only classes (Class X-A and Class X-B) |
| Co-Lead Bookrunning Managers: | Morgan Stanley & Co. LLC, KeyBanc Capital Markets Inc. and Cantor Fitzgerald & Co. |
| Co-Manager: | The Williams Capital Group, L.P. |
| Mortgage Loan Sellers: | Morgan Stanley Mortgage Capital Holdings LLC, Starwood Mortgage Capital LLC, Argentic Real Estate Finance LLC, KeyBank National Association and Cantor Commercial Real Estate Lending, L.P. |
| Rating Agencies: | Fitch, KBRA and S&P |
| Master Servicer: | Wells Fargo Bank, National Association |
| Special Servicer: | LNR Partners, LLC (or Situs Holdings, LLC with respect to the ILPT Industrial Portfolio whole loan) |
| Trustee: | Wilmington Trust, National Association |
| Certificate Administrator/ Certificate Registrar/Custodian: | Wells Fargo Bank, National Association |
| Operating Advisor: | Park Bridge Lender Services LLC |
| Asset Representations Reviewer: | Park Bridge Lender Services LLC |
| Initial Directing Certificateholder: | LNR Securities Holdings, LLC or an affiliate thereof |
| Risk Retention Consultation Party: | LNR Securities Holdings, LLC or an affiliate thereof |
| Credit Risk Retention: | Eligible vertical interest and eligible horizontal residual interest |
| Cut-off Date: | The mortgage loans will be considered part of the trust fund as of their respective cut-off dates. The cut-off date with respect to each mortgage loan is the respective due date for the monthly debt service payment that is due in November 2019 (or, in the case of any mortgage loan that has its first due date after November 2019, the date that would have been its due date in November 2019 under the terms of that mortgage loan if a monthly debt service payment were scheduled to be due in that month). |
| Expected Pricing Date: | Week of November 4, 2019 |
| Expected Closing Date: | On or about November 21, 2019 |
| Determination Dates: | The 11th day of each month or, if the 11th day is not a business day, then the business day immediately following such 11th day. |
| Distribution Dates: | The 4th business day following each determination date. The first distribution date will be in December 2019. |
| Rated Final Distribution Date: | The distribution date in November 2052 |
| Interest Accrual Period: | Preceding calendar month |
| Payment Structure: | Sequential pay |
| Tax Treatment: | REMIC |
| Optional Termination: | 1.00% clean-up call |
| Minimum Denominations: | $10,000 for each class of Offered Certificates (other than Class X-A and Class X-B certificates); $1,000,000 for the Class X-A and Class X-B certificates |
| Settlement Terms: | DTC, Euroclear and Clearstream |
| Legal/Regulatory Status: | Each class of Offered Certificates is expected to be eligible for exemptive relief under ERISA. No class of Offered Certificates is SMMEA eligible. |
| Analytics: | The certificate administrator is expected to make available all distribution date statements, CREFC® reports and supplemental notices received by it to certain modeling financial services as described in the Preliminary Prospectus. |
| Bloomberg Ticker: | MSC 2019-L3<MTGE><GO> |
| Risk Factors: | THE OFFERED CERTIFICATES INVOLVE CERTAIN RISKS AND MAY NOT BE SUITABLE FOR ALL INVESTORS. SEE THE “RISK FACTORS” SECTION OF THE PRELIMINARY PROSPECTUS. |
| This is not a research report and was not prepared by any Underwriter’s research department. It was prepared by the Underwriters’ sales, trading, banking or other non-research personnel. Please see additional important information and qualifications at the end of this Term Sheet. |
5
| MSC 2019-L3 | Structural Overview |
Structural Overview
| Accrual: | Each class of Offered Certificates will accrue interest on a 30/360 basis. |
| Amount and Order of Distributions: | On each distribution date, funds available for distribution from the mortgage loans (which are net of specified expenses of the issuing entity, including fees payable to, and advances, costs and expenses reimbursable to, the master servicer, any primary servicer, the special servicer, the certificate administrator, the trustee, the operating advisor, the asset representations reviewer and CREFC®) other than (i) any yield maintenance charges and prepayment premiums and (ii) any excess interest will be distributed in the following amounts and order of priority:
First, to the Class A-1, Class A-2, Class A-SB, Class A-3, Class A-4, Class X-A, Class X-B, Class X-D, Class X-F, Class X-G and Class X-H certificates, in respect of interest, up to an amount equal to, andpro rata in accordance with, the interest entitlements for those classes;
Second, to the Class A-1, Class A-2, Class A-SB, Class A-3 and Class A-4 certificates as follows, to the extent of funds allocated to principal and available for distribution: either (i)(a)first, to principal on the Class A-SB certificates, until the certificate balance of the Class A-SB certificates is reduced to the planned principal balance for the related distribution date set forth in Annex E to the Preliminary Prospectus, and (b)second, to principal on each class of the Class A-1, Class A-2, Class A-3, Class A-4 and Class A-SB certificates, in that order, in each case until the certificate balance of such class of certificates has been reduced to zero, or (ii) if the certificate balance of each class of principal balance certificates other than the Class A-1, Class A-2, Class A-SB, Class A-3 and Class A-4 certificates has been reduced to zero as a result of the allocation of losses on the mortgage loans to those certificates, to principal on the Class A-1, Class A-2, Class A-SB, Class A-3 and Class A-4 certificates,pro rata, without regard to the distribution priorities described above or the planned principal balance of the Class A-SB certificates;
Third, to the Class A-1, Class A-2, Class A-SB, Class A-3 and Class A-4 certificates: (a)first, up to an amount equal to, andpro rata based on, any previously unreimbursed losses on the mortgage loans allocable to principal that were previously borne by each such class, and (b)second, up to an amount equal to, andpro rata based on, interest on such unreimbursed losses previously allocated to each such class at the pass-through rate for such class from the date the related loss was allocated to such class;
Fourth, to each class of the Class A-S, Class B and Class C certificates, in that order, as follows: (a) to interest on such class of certificates in the amount of its interest entitlement; (b) to the extent of funds allocable to principal and available for distribution that remain after distributions in respect of principal to each class with a higher priority (as set forth in this clause or prior enumerated clauses set forth above), to principal on such class of certificates until its certificate balance has been reduced to zero; and (c) to reimburse such class of certificates,first, for any previously unreimbursed losses on the mortgage loans that were previously allocated to those certificates, andsecond, for interest on such unreimbursed losses at the pass-through rate for such class from the date the related loss was allocated to such class;
Fifth, to the Class D, Class E, Class F, Class G, Class H and Class J-RR certificates in the amounts and order of priority described in “Description of the Certificates—Distributions” in the Preliminary Prospectus; and
Sixth, to the Class R certificates, any remaining amounts.
|
| Interest and Principal Entitlements: | The interest entitlement of each class of Offered Certificates on each distribution date generally will be the interest accrued during the related interest accrual period on the related certificate balance or notional amount at the related pass-through rate, net of any prepayment interest shortfalls allocated to that class for such distribution date as described below. If prepayment interest shortfalls arise from voluntary prepayments on serviced mortgage loans during any collection period, the master servicer is required to make a limited compensating interest payment to offset those shortfalls. See “Description of the Certificates—Prepayment Interest Shortfalls” in the Preliminary Prospectus. The remaining amount of prepayment interest shortfalls will be allocated to reduce the interest entitlement on all classes of certificates (other than the Class V and Class R certificates),pro rata, based on their respective amounts of accrued interest for the related distribution date. If a class receives less than the entirety of its interest entitlement on any distribution date, then the shortfall (excluding any shortfall due to prepayment interest shortfalls), together with interest thereon, will be added to its interest entitlement for the next succeeding distribution date.
The principal distribution amount for each distribution date generally will be the aggregate amount of principal received or advanced in respect of the mortgage loans, net of any non-recoverable advances and interest thereon and any workout-delayed reimbursement amounts that are reimbursed to the master servicer or the trustee during the related collection period. Non-recoverable advances and interest thereon are reimbursable from principal collections before reimbursement from other amounts. Workout-delayed reimbursement amounts will be reimbursable from principal collections.
|
| Special Servicer Compensation: | The principal compensation to be paid to the special servicer in respect of its special servicing activities will be the special servicing fee, the workout fee and the liquidation fee.
The special servicing fee for each distribution date is calculated at the special servicing fee rate based on the outstanding principal balance of each mortgage loan (and any related companion loan) that is serviced under the pooling and servicing agreement for this securitization (a “serviced mortgage loan” and “serviced companion loan”, respectively) and that is being specially serviced or as to which the related mortgaged property has become an REO property. The special servicing fee rate will be a rate equal to the greater of 0.25%per annum and theper annum rate that would result in a special servicing fee of $3,500 for the related month. The special
|
| This is not a research report and was not prepared by any Underwriter’s research department. It was prepared by the Underwriters’ sales, trading, banking or other non-research personnel. Please see additional important information and qualifications at the end of this Term Sheet. |
6
| MSC 2019-L3 | Structural Overview |
servicing fee will be payable monthly,first, from liquidation proceeds, insurance and condemnation proceeds, and other collections in respect of the related specially serviced mortgage loan or REO property and,then, from general collections on all the mortgage loans and any REO properties. The special servicer will also be entitled to (i) liquidation fees generally equal to 1.0% of liquidation proceeds and certain other collections in respect of a specially serviced mortgage loan (and any related serviced companion loan) or related REO property and of amounts received in respect of mortgage loan repurchases by the related mortgage loan sellers and (ii) workout fees generally equal to 1.0% of interest (other than post-ARD excess interest on mortgage loans with anticipated repayment dates and other than default interest) and principal payments made in respect of a rehabilitated mortgage loan (and any related serviced companion loan), in the case of each of clause (i) and (ii), subject to a cap of $1,000,000 and a floor of $25,000 with respect to any mortgage loan, whole loan or related REO property and subject to certain adjustments and exceptions as described in the Preliminary Prospectus under “Pooling and Servicing Agreement—Servicing and Other Compensation and Payment of Expenses—Special Servicing Compensation”.
With respect to any non-serviced mortgage loan, the related special servicer under the related other pooling and servicing agreement pursuant to which such mortgage loan is being serviced will be entitled to similar compensation as that described above with respect to such non-serviced mortgage loan under such other pooling and servicing agreement as further described in the Preliminary Prospectus, although any related fees may accrue at a different rate and there may be a higher (or no) cap on liquidation and workout fees.
| |
| Prepayment Premiums/Yield Maintenance Charges: | If any yield maintenance charge or prepayment premium is collected during any collection period with respect to any mortgage loan, then on the immediately succeeding distribution date, the certificate administrator will pay to the holders of each class of the Class A-1, Class A-2, Class A-SB, Class A-3, Class A-4, Class A-S, Class B, Class C, Class D and Class E certificates the product of (a) the amount of such yield maintenance charge or prepayment premium (net of any liquidation fees payable therefrom), (b) the related Base Interest Fraction for such class and the applicable principal prepayment, and (c) a fraction, the numerator of which is equal to the amount of principal distributed to such class for that distribution date, and the denominator of which is the total amount of principal distributed to all principal balance certificates (other than the Control Eligible Certificates) for that distribution date. Any portion of the yield maintenance charge or prepayment premium described in the prior sentence that is remaining after the distributions in the preceding sentence (as to the applicable distribution date, the “Class X YM Distribution Amount”) will be distributed to the holders of the Class X certificates as follows: (1) first, to the Class X-A and Class X-B certificates, in the case of each such class in an amount equal to the product of (i) a fraction, the numerator of which is equal to the amount of principal distributed on the applicable distribution date with respect to the underlying class(es) of principal balance certificates whose certificate balance(s) comprise the notional amount of such class of Class X certificates, and the denominator of which is the total amount of principal distributed on the applicable distribution date with respect to the principal balance certificates, multiplied by (ii) the Class X YM Distribution Amount for the applicable distribution date, and (2) second, to the Class X-D certificates, in an amount equal to the portion of the Class X YM Distribution Amount remaining after the distributions to the holders of the Class X-A and Class X-B certificates.
Notwithstanding any of the foregoing to the contrary, if at any time the certificate balances of the principal balance certificates (other than the Control Eligible Certificates) have been reduced to zero as a result of the allocation of principal payments on the mortgage loans, the certificate administrator will pay to the holders of each remaining class of principal balance certificates then entitled to distributions of principal on the subject distribution date the product of (a) any yield maintenance charge or prepayment premium distributable on the subject distribution date (net of any liquidation fees payable therefrom) and (b) a fraction, the numerator of which is equal to the amount of principal distributed to such class for that distribution date, and the denominator of which is the total amount of principal distributed to all principal balance certificates for that distribution date.
“Base Interest Fraction” means, with respect to any principal prepayment of any mortgage loan that provides for the payment of a yield maintenance charge or prepayment premium, and with respect to any class of principal balance certificates, a fraction (A) the numerator of which is the greater of (x) zero and (y) the difference between (i) the pass-through rate on that class, and (ii) the applicable discount rate and (B) the denominator of which is the difference between (i) the mortgage interest rate on the related mortgage loan and (ii) the applicable discount rate;provided, that: under no circumstances will the Base Interest Fraction be greater than one; if the discount rate referred to above is greater than or equal to both the mortgage interest rate on the related mortgage loan and the pass-through rate on that class, then the Base Interest Fraction will equal zero; and if the discount rate referred to above is greater than or equal to the mortgage interest rate on the related mortgage loan and is less than the pass-through rate on that class, then the Base Interest Fraction will be equal to 1.0.
Consistent with the foregoing, the Base Interest Fraction is equal to:
|
| (Pass-Through Rate – Discount Rate) | |||
| (Mortgage Rate – Discount Rate) |
| Realized Losses: | On each distribution date, immediately following the distributions to be made to the certificateholders on that date, the certificate administrator is required to calculate the amount, if any, by which (i) the aggregate stated principal balance of the mortgage loans, including any successor REO loans expected to be outstanding immediately following that distribution date is less than (ii) the then aggregate certificate balance of the principal balance certificates after giving effect to distributions of principal on that distribution date (any such deficit, a “Realized Loss”), which amount will be applied to reduce the certificate balances of the Class J-RR, Class H, Class G, Class F, Class E, Class D, Class C, Class B and Class A-S certificates, in that order, in each case until the related certificate balance has been reduced to zero, and then to the Class A-1, Class A-2, Class A-SB, |
| This is not a research report and was not prepared by any Underwriter’s research department. It was prepared by the Underwriters’ sales, trading, banking or other non-research personnel. Please see additional important information and qualifications at the end of this Term Sheet. |
7
| MSC 2019-L3 | Structural Overview |
| Class A-3 and Class A-4 certificates,pro rata, based upon their respective certificate balances, until their respective certificate balances have been reduced to zero. | |
| Serviced Whole Loans: | Each of the following mortgaged properties or portfolios of mortgaged properties secures a mortgage loan and one or morepari passu promissory notes and, in some cases, one or more generally subordinate promissory notes (each suchpari passu or generally subordinate promissory note, a “serviced companion loan”) that will be serviced pursuant to the related intercreditor agreement and the pooling and servicing agreement for this transaction: The Parklawn Building, East Village Multifamily Portfolio, ILPT Industrial Portfolio, Royal Palm Place (prior to the securitization of the related control note), Wells Fargo Place and American Metro Center. With respect to each such mortgaged property or portfolio of mortgaged properties, the related mortgage loan, together with the related serviced companion loan(s), is referred to herein (for so long as it is serviced under the pooling and servicing agreement for this transaction) as a “serviced whole loan.” Each serviced companion loan is not part of the mortgage pool and may be contributed to one or more future securitization transactions (if not already securitized) or may be otherwise transferred at any time, subject to compliance with the related intercreditor agreement. See the tables below entitled “Mortgage Loans with Pari Passu Companion Loans” and“Mortgage Loans with Subordinate Debt” and “Description of the Mortgage Pool—The Whole Loans” in the Preliminary Prospectus, for additional information regarding each such whole loan.
With respect to the Royal Palm Place whole loan (a “servicing shift whole loan”), the pooling and servicing agreement for this transaction will govern servicing of such whole loan until the securitization of the related control note; however, servicing of such whole loan will generally be directed by the holder of the related control note (which is not included in this securitization), and such holder will have the right to replace the special servicer with respect to the related whole loan with or without cause. After the securitization of the related control note, a servicing shift whole loan will cease to be a serviced whole loan and will be serviced pursuant to the pooling and servicing agreement for another securitization transaction (see “Non-Serviced Whole Loans” below).
|
| Non-Serviced Whole Loans: | Each of the following mortgaged properties or portfolios of mortgaged properties secures a mortgage loan (each, a “non-serviced mortgage loan”), one or morepari passu promissory notes and, in some cases, one or more generally subordinate promissory notes (each suchpari passu or generally subordinate promissory note, a “non-serviced companion loan”) that will be serviced pursuant to the related intercreditor agreement and the pooling and servicing agreement or trust and servicing agreement (referred to herein as a related “pooling and servicing agreement”) for another securitization transaction: GNL Office and Industrial Portfolio, Grand Canal Shoppes, Royal Palm Place (on and after the securitization of the related control note), Bushwick Avenue Portfolio, Osborn Triangle, Hilton Portfolio and National Anchored Retail Portfolio. With respect to each such mortgaged property, the related mortgage loan, together with the related non-serviced companion loan(s), is referred to herein (for so long as it is serviced under the pooling and servicing agreement for another securitization transaction) as a “non-serviced whole loan.” Each non-serviced companion loan is not part of the mortgage pool and may be contributed to one or more future securitization transactions (if not already securitized) or may be otherwise transferred at any time, subject to compliance with the related intercreditor agreement. Servicing of each non-serviced whole loan will generally be directed by the holder of the related control note (or, if such control note is included in a securitization, the directing certificateholder thereunder (or other party designated to exercise the rights of such control note)), and such holder will have the right to replace the special servicer with respect to the related whole loan with or without cause. See the table below entitled “Mortgage Loans with Pari Passu Companion Loans” and“Mortgage Loans with Subordinate Debt” and “Description of the Mortgage Pool—The Whole Loans” in the Preliminary Prospectus for additional information regarding each such whole loan. |
| Directing Certificateholder/ Controlling Class: | The initial Directing Certificateholder is expected to be LNR Securities Holdings, LLC or an affiliate thereof.
The “Directing Certificateholder” will be the Controlling Class Certificateholder (or its representative) selected by more than 50% (by certificate balance) of the Controlling Class Certificateholders;provided, that (1) absent that selection, (2) until a Directing Certificateholder is so selected or (3) upon receipt of a notice from a majority of the Controlling Class Certificateholders (by certificate balance) that a Directing Certificateholder is no longer designated, the Controlling Class Certificateholder that owns the largest aggregate certificate balance of the Controlling Class (or its representative) will be the Directing Certificateholder;provided, that (i) if such holder elects or has elected to not be the Directing Certificateholder, the holder of the next largest aggregate certificate balance of the Controlling Class will be the Directing Certificateholder, (ii) in the event no one holder owns the largest aggregate certificate balance of the Controlling Class, then there will be no Directing Certificateholder until appointed in accordance with the terms of the pooling and servicing agreement, and (iii) the certificate administrator and the other parties to the pooling and servicing agreement will be entitled to assume that the identity of the Directing Certificateholder has not changed until such parties receive written notice of a replacement of the Directing Certificateholder from a party holding the requisite interest in the Controlling Class (as confirmed by the certificate registrar) or the resignation of the then current Directing Certificateholder.
The “Controlling Class” will be, as of any time of determination, the most subordinate class of Control Eligible Certificates then outstanding that has an aggregate certificate balance (as notionally reduced by any Cumulative Appraisal Reduction Amounts (as defined below)) at least equal to 25% of the initial certificate balance thereof; provided, that if at any time the certificate balances of the principal balance certificates other than the Control Eligible Certificates have been reduced to zero as a result of principal payments on the mortgage loans, then the Controlling Class will be the most subordinate class of Control Eligible Certificates that has a certificate balance greater than zero without regard to the application of any Cumulative Appraisal Reduction Amounts. The Controlling Class as of the closing date will be the Class J-RR certificates.
The “Control Eligible Certificates” will be any of the Class F, Class G, Class H and Class J-RR certificates.
|
| This is not a research report and was not prepared by any Underwriter’s research department. It was prepared by the Underwriters’ sales, trading, banking or other non-research personnel. Please see additional important information and qualifications at the end of this Term Sheet. |
8
| MSC 2019-L3 | Structural Overview |
| Control Rights: | Prior to a Control Termination Event, the Directing Certificateholder will have certain consent and consultation rights under the pooling and servicing agreement with respect to certain major decisions and other matters. A “Control Termination Event” will occur when the most senior class of Control Eligible Certificates has a certificate balance (taking into account the application of any Cumulative Appraisal Reduction Amounts to notionally reduce the certificate balance thereof) of less than 25% of the initial certificate balance thereof; provided, that a Control Termination Event will be deemed not continuing in the event that the certificate balances of the principal balance certificates other than the Control Eligible Certificates have been reduced to zero as a result of principal payments on the mortgage loans.
After the occurrence of a Control Termination Event but prior to the occurrence of a Consultation Termination Event, the Directing Certificateholder will not have any consent rights, but the Directing Certificateholder and the operating advisor will each have certain non-binding consultation rights under the pooling and servicing agreement with respect to certain major decisions and other matters. A “Consultation Termination Event” will occur when there is no class of Control Eligible Certificates that has a then-outstanding certificate balance at least equal to 25% of the initial certificate balance of that class, in each case, without regard to the application of any Cumulative Appraisal Reduction Amounts; provided, that a Consultation Termination Event will be deemed not continuing in the event that the certificate balances of the principal balance certificates other than the Control Eligible Certificates have been reduced to zero as a result of principal payments on the mortgage loans.
After the occurrence of a Consultation Termination Event, the Directing Certificateholder will not have any consent or consultation rights, except with respect to any rights expressly set forth in the pooling and servicing agreement, and the operating advisor will have certain non-binding consultation rights under the pooling and servicing agreement with respect to certain major decisions and other matters.
Notwithstanding any proviso to, or other contrary provision in, the definitions of “Control Termination Event” and “Consultation Termination Event,” a Control Termination Event and a Consultation Termination Event will be deemed to have occurred with respect to any Excluded DCH Loan, and neither the Directing Certificateholder nor any Controlling Class Certificateholder will have any consent or consultation rights with respect to the servicing of such Excluded DCH Loan.
An “Excluded DCH Loan” is a mortgage loan or whole loan with respect to which the Directing Certificateholder or the holder of the majority of the Controlling Class is a Borrower Party. It is expected that there will be no Excluded DCH Loans as of the closing date with respect to this securitization.
“Borrower Party” means a borrower, a manager of a mortgaged property, an Accelerated Mezzanine Loan Lender or any Borrower Party Affiliate.
“Borrower Party Affiliate” means, with respect to a borrower, a manager of a mortgaged property or an Accelerated Mezzanine Loan Lender, (a) any other person or entity controlling or controlled by or under common control with such borrower, manager or Accelerated Mezzanine Loan Lender, as applicable, or (b) any other person or entity owning, directly or indirectly, 25% or more of the beneficial interests in such borrower, manager or Accelerated Mezzanine Loan Lender, as applicable. For the purposes of this definition, “control” when used with respect to any specified person or entity means the power to direct the management and policies of such person or entity, directly or indirectly, whether through the ownership of voting securities, by contract or otherwise and the terms “controlling” and “controlled” have meanings correlative to the foregoing.
“Accelerated Mezzanine Loan Lender” means a mezzanine lender under a mezzanine loan that has been accelerated or as to which foreclosure or enforcement proceedings have been commenced against the equity collateral pledged to secure such mezzanine loan.
Notwithstanding any of the foregoing to the contrary, if any mortgage loan is part of a whole loan, the Directing Certificateholder’s consent and/or consultation rights with respect thereto may be limited as described in the Preliminary Prospectus. In particular, with respect to each non-serviced whole loan and any servicing shift whole loan, the Directing Certificateholder will only have certain consultation rights with respect to certain major decisions and other matters related to such whole loan, in each case only prior to a Control Termination Event (and, in the case of any such whole loan with a subordinate companion loan, only if the holder of such subordinate companion loan is no longer the controlling noteholder), and the holder of the related control note (or, if such control note has been securitized, the directing certificateholder with respect to such securitization or other designated party under the related pooling and servicing agreement) will be entitled to similar consent and/or consultation rights with respect to such whole loan. With respect to any serviced A/B whole loan, for so long as the holder of the related subordinate companion loan is the controlling note holder, the holder of such subordinate companion loan (in lieu of the Directing Certificateholder) will be entitled to exercise such consent and consultation rights with respect to such whole loan.
|
| Risk Retention Consultation Party: | The risk retention consultation party will be the party selected by the retaining sponsor, Starwood Mortgage Capital LLC. The initial risk retention consultation party is expected to be LNR Securities Holdings, LLC, or an affiliate thereof.
With respect to certain material servicing actions related to serviced mortgage loans that are not Excluded RRCP Loans, upon request of the risk retention consultation party, the party processing such servicing action will generally be required to consult on a non-binding basis with the risk retention consultation party, in each case within the same time period as such party would be required to consult with the Directing Certificateholder with respect to such servicing action (assuming the Directing Certificateholder had such right with respect to such mortgage loan); provided, that prior to the occurrence and continuance of a Consultation Termination Event, such mortgage loan must also be a specially serviced mortgage loan; provided, further, that if the party
|
| This is not a research report and was not prepared by any Underwriter’s research department. It was prepared by the Underwriters’ sales, trading, banking or other non-research personnel. Please see additional important information and qualifications at the end of this Term Sheet. |
9
| MSC 2019-L3 | Structural Overview |
processing such servicing action is LNR Partners, LLC, as special servicer, it will not be required to consult with the risk retention consultation party. An “Excluded RRCP Loan” is a mortgage loan or whole loan with respect to which the Risk Retention Consultation Party, the retaining sponsor or the holder of the majority of the VRR Interest is a Borrower Party. It is expected that there will be no Excluded RRCP Loans as of the Closing Date with respect to this securitization. The “VRR Interest” will be comprised of the percentage of each class of certificates (other than the Class R certificates) retained by the retaining sponsor in satisfaction of the risk retention requirements as described under “Credit Risk Retention” in the Preliminary Prospectus. | |
| Appraisal Reduction Amounts and Collateral Deficiency Amounts: | An “Appraisal Reduction Amount” generally will be created in the amount, if any, by which the principal balance of a required appraisal loan (which is a mortgage loan with respect to which certain defaults, modifications or insolvency events have occurred as further described in the Preliminary Prospectus) plus other amounts overdue or advanced in connection with such mortgage loan exceeds 90% of the appraised value of the related mortgaged property plus certain escrows and reserves (including letters of credit) held with respect to the mortgage loan.
A mortgage loan will cease to be subject to an Appraisal Reduction Amount when it has been brought current for at least three consecutive months, no additional event of default is foreseeable in the reasonable judgment of the special servicer and no other circumstances exist that would cause such mortgage loan or any related companion loan to be a specially serviced mortgage loan; however, a “Collateral Deficiency Amount” may exist with respect to any mortgage loan that is modified into an AB loan structure (an “AB Modified Loan”) and remains a rehabilitated mortgage loan and, if so, will generally equal the excess of (i) the stated principal balance of such AB Modified Loan (taking into account the related junior note(s) and anypari passu notes included therein, as well as any equity interests or other obligations senior to such junior notes), over (ii) the sum of (in the case of a whole loan, solely to the extent allocable to the subject mortgage loan) (x) the most recent appraised value for the related mortgaged property or mortgaged properties plus (y) solely to the extent not reflected or taken into account in such appraised value and to the extent on deposit with, or otherwise under the control of, the lender (or otherwise on deposit with a party acceptable to the lender or expended for the benefit of the mortgaged property or the mortgage loan at the time the mortgage loan became subject of a workout and became (and as part of the modification related to) such AB Modified Loan) as of the date of such determination, any capital or additional collateral contributed by the related borrower at the time the mortgage loan became the subject of a workout and became (and as part of the modification related to) such AB Modified Loan for the benefit of the related mortgaged property or mortgaged properties (provided, that in the case of a non-serviced mortgage loan, the amounts set forth in this clause (y) will be taken into account solely to the extent relevant information is received by the special servicer), plus (z) any other escrows or reserves (in addition to any amounts set forth in the immediately preceding clause (y)) held by the lender in respect of such AB Modified Loan as of the date of such determination.
As used herein, a “Cumulative Appraisal Reduction Amount” will be, as of any date of determination, the sum of (i) with respect to any Mortgage Loan, any Appraisal Reduction Amount then in effect, and (ii) with respect to any AB Modified Loan, any Collateral Deficiency Amount then in effect.
Any Appraisal Reduction Amount in respect of any non-serviced mortgage loan generally will be calculated in accordance with the other servicing agreement pursuant to which such mortgage loan is being serviced, which calculations are expected to be generally similar to those provided for in the pooling and servicing agreement for this transaction.
If any mortgage loan is part of a whole loan, any Appraisal Reduction Amount or Collateral Deficiency Amount will (or effectively will) be calculated in respect of such whole loan taken as a whole and allocated, to the extent provided in the related intercreditor agreement and the related pooling and servicing agreement,first, to any related subordinate companion loan(s) until the principal balance(s) thereof has been notionally reduced to zero, andsecond, to the related mortgage loan and anypari passu companion loan(s) on apro rata basis by unpaid principal balance.
Appraisal Reduction Amounts in respect of, or allocable to, any mortgage loan will proportionately reduce the interest portion of debt service advances required to be made in respect of such mortgage loan. Appraisal Reduction Amounts and Collateral Deficiency Amounts will be taken into account in determining the identity of the controlling class entitled to appoint the Directing Certificateholder, the existence of a Control Termination Event and the allocation and/or exercise of voting rights for certain purposes (see“—Directing Certificateholder/Controlling Class” above).
|
| Appraised-Out Class: | An “Appraised-Out Class” is any class of Control Eligible Certificates, the certificate balance of which (taking into account the application of any Appraisal Reduction Amounts or Collateral Deficiency Amounts to notionally reduce the certificate balance of such class) has been reduced to less than 25% of its initial certificate balance. Any Appraised-Out Class may not exercise any direction, control, consent and/or similar rights of the Controlling Class until such time, if any, as such class is reinstated as the Controlling Class, and the rights of the Controlling Class will be exercised by the most subordinate class of Control Eligible Certificates that is not an Appraised-Out Class, if any, during such period. |
| Appraisal Remedy: | The holders of the majority (by certificate balance) of an Appraised-Out Class (such holders, the “Requesting Holders”) will have the right, at their sole expense, to require the special servicer to order (or, with respect to a non-serviced mortgage loan, require the master servicer to request from the applicable outside special servicer) a second appraisal of any mortgage loan (or serviced whole loan) for which an appraisal reduction event has |
| This is not a research report and was not prepared by any Underwriter’s research department. It was prepared by the Underwriters’ sales, trading, banking or other non-research personnel. Please see additional important information and qualifications at the end of this Term Sheet. |
10
| MSC 2019-L3 | Structural Overview |
| occurred or as to which there exists a Collateral Deficiency Amount. With respect to any serviced mortgage loan, the special servicer will be required to use its reasonable best efforts to ensure that such appraisal is delivered within 30 days from receipt of the Requesting Holders’ written request and will be required to ensure that such appraisal is prepared on an “as-is” basis by an MAI appraiser. With respect to any non-serviced mortgage loan, the master servicer will be required to use commercially reasonable efforts to obtain such second appraisal from the applicable outside special servicer and to forward such second appraisal to the special servicer. Upon receipt of such supplemental appraisal, the outside special servicer (for Appraisal Reduction Amounts on non-serviced mortgage loans, but only to the extent provided for in the applicable outside pooling and servicing agreement and applicable intercreditor agreement) and the special servicer (for Collateral Deficiency Amounts on serviced mortgage loans and non-serviced mortgage loans and for Appraisal Reduction Amounts on serviced mortgage loans) will be required to determine, in accordance with the applicable servicing standard, whether, based on its assessment of such supplemental appraisal, any recalculation of the applicable Appraisal Reduction Amount or Collateral Deficiency Amount is warranted and, if so warranted, will be required to recalculate such Appraisal Reduction Amount or Collateral Deficiency Amount, as applicable, based upon such supplemental appraisal and receipt of information requested by the special servicer from the master servicer. If required by any such recalculation, the applicable Appraised-Out Class will be reinstated as the Controlling Class and each Appraised-Out Class will, if applicable, have its related certificate balance notionally restored to the extent required by such recalculation of the Appraisal Reduction Amount or Collateral Deficiency Amount, if applicable. | |
| Sale of Defaulted Loans: | Under certain circumstances, the special servicer may be required to use reasonable efforts to solicit offers for a defaulted serviced mortgage loan (and any relatedpari passucompanion loan (to the extent provided under the related intercreditor agreement) and/or related REO properties). If the special servicer does not receive a cash offer at least equal to the outstanding principal balance plus all accrued and unpaid interest and outstanding costs and expenses and certain other specified amounts (the “Par Purchase Price”), the special servicer may purchase the defaulted loan or REO property at the Par Purchase Price or may accept the highest cash offer received from any person that constitutes a fair price for such defaulted loan or REO property. If multiple offers are received during the period designated by the special servicer for receipt of offers, the special servicer is generally required to select the highest offer. If the highest offer is made by an Interested Person (i.e., certain specified parties under the pooling and servicing agreement for this transaction, including the parties to such agreement, the Directing Certificateholder, the risk retention consultation party, any sponsor, any Borrower Party and known affiliates of the foregoing), the trustee, rather than the special servicer, will generally be required to determine whether the offer constitutes a fair price. Absent an offer at least equal to the Par Purchase Price, no offer from an Interested Person will constitute a fair price unless (x) it is the highest offer received and (y) at least one other offer is (or, if required by a related intercreditor agreement, two other offers are) received from an independent third party. Neither the trustee nor any of its affiliates may make an offer for or purchase any specially serviced loan or REO property. See “Pooling and Servicing Agreement—Sale of Defaulted Loans and REO Properties” in the Preliminary Prospectus.
Notwithstanding any of the foregoing to the contrary, the special servicer will not be required to accept the highest cash offer for a defaulted loan or REO property if it determines (in consultation with the Directing Certificateholder (unless a Consultation Termination Event exists or the mortgage loan is an Excluded DCH Loan), the risk retention consultation party (upon request) and any related companion loan holders), in accordance with the Servicing Standard (and subject to the requirements of any related intercreditor agreement), that rejection of such offer would be in the best interests of the certificateholders and any related companion loan holders (as a collective whole as if they constituted a single lender, and, if applicable, taking into account the subordinate nature of any subordinate companion loan). In addition, the special servicer may accept a lower offer (from any person other than itself or an affiliate) if it determines, in its reasonable and good faith judgment (but in all cases in accordance with the Servicing Standard), that acceptance of such offer would be in the best interests of the certificateholders and any related companion loan holders (as a collective whole as if they constituted a single lender, and, if applicable, taking into account the subordinate nature of any subordinate companion loan).
If title to any mortgaged property is acquired by the trust fund, the special servicer will be required to sell such mortgaged property prior to the close of the third calendar year beginning after the year of acquisition, unless (a) the IRS grants or has not denied an extension of time to sell such mortgaged property or (b) the special servicer, trustee and the certificate administrator receive an opinion of independent counsel to the effect that the holding of the property by the trust longer than the above-referenced three-year period will not result in the imposition of a tax on any REMIC of the trust fund or cause any REMIC of the trust fund to fail to qualify as a REMIC.
The Directing Certificateholder will not have a right of first refusal to purchase a defaulted loan.
The foregoing applies to mortgage loans serviced under the pooling and servicing agreement for this transaction. With respect to any non-serviced whole loan, if the special servicer under the applicable pooling and servicing agreement determines to sell the related controlling companion loan if it becomes a defaulted mortgage loan, then the applicable special servicer will be required to sell the related whole loan, including the related mortgage loan included in the MSC 2019-L3 securitization trust and the relatedpari passu companion loan(s) and, under certain circumstances, any subordinate companion loan(s), as a single loan. In connection with any such sale, the special servicer under the applicable pooling and servicing agreement will be required to follow procedures substantially similar to those set forth above.
In addition, with respect to the Grand Canal Shoppes mortgage loan, Venetian Casino Resort, LLC has the right to purchase such mortgage loan following an acceleration thereof, subject to certain conditions. See “Description of the Mortgage Pool—Mortgage Pool Characteristics—Condominium and Other Split Interests” in the Preliminary Prospectus.
|
| This is not a research report and was not prepared by any Underwriter’s research department. It was prepared by the Underwriters’ sales, trading, banking or other non-research personnel. Please see additional important information and qualifications at the end of this Term Sheet. |
11
| MSC 2019-L3 | Structural Overview |
Appointment and Replacement of Special Servicer:
| The Directing Certificateholder will appoint the initial special servicer as of the closing date. Prior to the occurrence and continuance of a Control Termination Event, the special servicer may generally be replaced by the Directing Certificateholder (a) for cause at any time and (b) without cause if (i) LNR Partners, LLC or its affiliate is not the special servicer that will be replaced or (ii) LNR Securities Holdings, LLC or its affiliate owns less than 25% of the then controlling class of certificates.
After the occurrence and during the continuance of a Control Termination Event and upon (a) the written direction of holders of principal balance certificates evidencing not less than 25% of the voting rights allocable to the principal balance certificates (taking into account the application of Cumulative Appraisal Reduction Amounts to notionally reduce the certificate balances of the respective classes thereof) requesting a vote to replace the special servicer with a replacement special servicer, (b) payment by such requesting holders to the certificate administrator of all reasonable fees and expenses to be incurred by the certificate administrator in connection with administering such vote and (c) delivery by such holders to each applicable rating agency of a rating agency communication, the certificate administrator will be required to post such notice on its internet website and by mail and conduct the solicitation of votes of all certificates in such regard, which such vote must occur within 180 days of the posting of such notice. Upon the written direction of holders of principal balance certificates evidencing at least 75% of the voting rights that constitute a minimum Certificateholder Quorum, the trustee will be required to immediately replace the special servicer with a qualified replacement special servicer designated by such holders of certificates.
After the occurrence of a Consultation Termination Event, if the operating advisor determines that (i) the special servicer is not performing its duties as required under the pooling and servicing agreement or is otherwise not acting in accordance with the servicing standard and (ii) the replacement of the special servicer would be in the best interests of certificateholders as a collective whole, then the operating advisor will have the right to recommend the replacement of the special servicer. The operating advisor’s recommendation to replace the special servicer must be confirmed within 180 days of the posting of such notice by an affirmative vote of holders of principal balance certificates evidencing at least a majority of the aggregate voting rights (taking into account the application of any Cumulative Appraisal Reduction Amounts to notionally reduce the respective certificate balances) of all principal balance certificates on an aggregate basis.
A “Certificateholder Quorum” means, in connection with any solicitation of votes in connection with the replacement of the special servicer or the asset representations reviewer, the holders of principal balance certificates evidencing at least 75% of the aggregate voting rights allocable to all principal balance certificates (taking into account, other than with respect to the termination of the asset representations reviewer, the application of any Cumulative Appraisal Reduction Amounts to notionally reduce the certificate balances of the respective classes thereof).
With respect to each serviced whole loan, any holder of a relatedpari passu companion loan, following a servicer termination event with respect to the special servicer that affects such holder, will be entitled to direct the trustee (and the trustee will be required) to terminate the special servicer solely with respect to such serviced whole loan. A replacement special servicer will be selected by the trustee or, prior to a Control Termination Event, by the Directing Certificateholder;provided, that any successor special servicer appointed to replace the special servicer with respect to such whole loan can generally not be the entity (or its affiliate) that was terminated at the direction of the holder of the relatedpari passu companion loan.
Notwithstanding any of the foregoing to the contrary, with respect to any servicing shift whole loan and any serviced A/B whole loans as to which the subordinate companion loan holder is the related controlling note holder, the holder of the related control note will be entitled to replace the special servicer with respect to such whole loan at any time, with or without cause, and while it is a serviced whole loan, no other party may replace the special servicer for such whole loan unless there is a servicer termination event with respect thereto.
With respect to any non-serviced whole loan, the MSC 2019-L3 trust, as holder of the related mortgage loan, has the right to terminate the special servicer under the related pooling and servicing agreement if a servicer termination event occurs with respect to such special servicer that affects the trust in its capacity as such holder. Such rights may be exercised by the Directing Certificateholder prior to a Control Termination Event (or the special servicer, following the occurrence and during the continuance of a Control Termination Event). The successor special servicer will be selected pursuant to the applicable pooling and servicing agreement by the related directing holder prior to a control termination event under such pooling and servicing agreement.
References herein to the “special servicer” mean individually or collectively, as the context may require, (i) LNR Partners, LLC as special servicer with respect to all mortgage loans other than the ILPT Industrial Portfolio mortgage loan and any Excluded Special Servicer Loan, (ii) Situs Holdings, LLC as special servicer with respect to the ILPT Industrial Portfolio mortgage loan (unless it is an Excluded Special Servicer Loan), and (iii) any Excluded Special Servicer as special servicer with respect to Excluded Special Servicer Loans.
|
| Servicing Standard: | Each of the master servicer and the special servicer is obligated to service and administer the mortgage loans (and, if applicable, the serviced companion loans) in accordance with the definition of the “Servicing Standard” described in the Preliminary Prospectus and the terms of the pooling and servicing agreement, provided that each non-serviced mortgage loan, if any, will be serviced by another master servicer or special servicer under the pooling and servicing agreement with respect to the securitization of the related companion loan, which entities will be obligated to service and administer such non-serviced mortgage loan pursuant to a similar standard set forth in the related pooling and servicing agreement. |
| Voting Rights: | Voting rights for the certificates will be allocated as follows: (1) 2% in the case of the Class X Certificates, allocated pro rata among the respective classes thereof based upon their respective notional amounts as of the |
| This is not a research report and was not prepared by any Underwriter’s research department. It was prepared by the Underwriters’ sales, trading, banking or other non-research personnel. Please see additional important information and qualifications at the end of this Term Sheet. |
12
| MSC 2019-L3 | Structural Overview |
| date of determination; and (2) in the case of any class of principal balance certificates, a percentage equal to the product of 98% and a fraction, the numerator of which is equal to the related certificate balance of such class of principal balance certificates, determined as of the prior determination date, and the denominator of which is equal to the aggregate of the certificate balances of all classes of the principal balance certificates, determined as of the prior determination date (and solely in connection with certain votes relating to the replacement of the special servicer and the operating advisor as described in the Preliminary Prospectus, such numerator and denominator will take into account any notional reduction in the certificate balance of any class of principal balance certificates for Cumulative Appraisal Reduction Amounts allocated to such class). The voting rights of any class of certificates will be allocated among certificate holders of such class in proportion to their respective percentage interests. The Class V and the Class R certificates will not be entitled to any voting rights. | |
| Excluded Special Servicer: | If the special servicer obtains knowledge that it has become a Borrower Party with respect to any serviced mortgage loan or serviced whole loan (an “Excluded Special Servicer Loan”), the special servicer will be required to resign as special servicer of that Excluded Special Servicer Loan. Prior to the occurrence and continuance of a Control Termination Event, the Directing Certificateholder will be entitled to select (and may remove and replace with or without cause) a successor special servicer that is not a Borrower Party (an “Excluded Special Servicer”) with respect to any Excluded Special Servicer Loan, unless such Excluded Special Servicer Loan is also an Excluded DCH Loan. After the occurrence and during the continuance of a Control Termination Event, if at any time the applicable Excluded Special Servicer Loan is also an Excluded DCH Loan or if the Directing Certificateholder is entitled to appoint the Excluded Special Servicer but does not so appoint within 30 days of notice of such resignation, the resigning special servicer will be required to select the related Excluded Special Servicer. Any Excluded Special Servicer will be required to perform all of the obligations of the special servicer and will be entitled to all special servicing compensation with respect to such Excluded Special Servicer Loan earned while the related mortgage loan is an Excluded Special Servicer Loan. |
| Liquidated Loan Waterfall: |
On liquidation of any mortgage loan, all net liquidation proceeds related to the mortgage loan (but not any related companion loan) will be applied so that amounts allocated as a recovery of accrued and unpaid interest will not, in the first instance, include any delinquent interest that was not advanced as a result of Appraisal Reduction Amounts (or would not have been advanced in the absence of a non-recoverability determination) or accrued on the portion of the stated principal balance thereof equal to any related Collateral Deficiency Amount in effect from time to time and as to which no advance was made (collectively, the “Subordinated Interest Amount”). After the adjusted interest amount is so allocated, any remaining liquidation proceeds will be allocated to offset certain advances and to pay principal on the mortgage loan until the unpaid principal amount of the mortgage loan has been reduced to zero. Any remaining liquidation proceeds will then be allocated to pay the Subordinated Interest Amount.
|
| Operating Advisor: | The operating advisor will have access to any final asset status report and information available with respect to the transaction on the certificate administrator’s website and will have certain monitoring responsibilities on behalf of the entire issuing entity. After the occurrence and during the continuance of a Control Termination Event, the operating advisor will be entitled to consult with the special servicer with respect to certain major decisions on behalf of the issuing entity and in the best interest of, and for the benefit of, the certificateholders, as a collective whole, as if those certificateholders constituted a single lender.
After the occurrence and during the continuance of a Consultation Termination Event, the operating advisor will be subject to termination without cause upon (i) the written direction of certificateholders evidencing not less than 25% of the voting rights (taking into account the application of Cumulative Appraisal Reduction Amounts to notionally reduce the Certificate Balances of classes to which such Cumulative Appraisal Reduction Amounts are allocable) requesting a vote to replace the operating advisor with a replacement operating advisor that is an eligible operating advisor selected by such certificateholders, (ii) payment by such requesting holders to the certificate administrator of all reasonable fees and expenses to be incurred by the certificate administrator in connection with administering such vote and (iii) receipt by the trustee of the rating agency confirmation with respect to such removal. Upon the vote or written direction of holders of at least 75% of the voting rights (taking into account the application of Cumulative Appraisal Reduction Amounts to notionally reduce the certificate balances of classes to which such Cumulative Appraisal Reduction Amounts are allocable), the trustee will be required to immediately replace the operating advisor with the replacement operating advisor.
|
| Operating Advisor Expenses: | In addition to the Operating Advisor Fee and the Operating Advisor Consulting Fee, the operating advisor will be entitled to reimbursement of Operating Advisor Expenses in accordance with the terms of the pooling and servicing agreement for this transaction. “Operating Advisor Expenses” for each distribution date will equal any unreimbursed indemnification amounts or additional trust fund expenses payable to the operating advisor pursuant to the pooling and servicing agreement for this transaction (other than the Operating Advisor Fee and the Operating Advisor Consulting Fee). |
| Asset Representations Reviewer: | The asset representations reviewer will be required to review certain delinquent mortgage loans after a specified delinquency threshold has been met and the required percentage of certificateholders vote to direct a review as described below. The asset representations reviewer will be entitled to the Asset Representations Reviewer Fee with respect to such review. See “Pooling and Servicing Agreement—The Asset Representations Reviewer” in the Preliminary Prospectus.
The certificate administrator will be required to notify certificateholders if the specified delinquency threshold has been met as described in the Preliminary Prospectus under “Pooling and Servicing Agreement—The Asset Representations Reviewer”.
|
| This is not a research report and was not prepared by any Underwriter’s research department. It was prepared by the Underwriters’ sales, trading, banking or other non-research personnel. Please see additional important information and qualifications at the end of this Term Sheet. |
13
| MSC 2019-L3 | Structural Overview |
If certificateholders entitled to not less than 5.0% of the voting rights request a vote to commence an asset review, and if subsequently (i) a majority of the voting rights allocable to those certificateholders who cast votes and (ii) a majority of the voting rights that constitute a minimum Asset Review Quorum authorizes an asset review within 150 days of the request for a vote, the asset representations reviewer will be required to conduct an asset review of delinquent loans.
An “Asset Review Quorum” is, in connection with any solicitation of votes to authorize an asset review as described above, the holders of certificates evidencing at least 5.0% of the aggregate voting rights.
The asset representations reviewer may be terminated and replaced without cause. Upon (i) the written direction of certificateholders entitled to not less than 25% of the voting rights (without regard to the application of any Cumulative Appraisal Reduction Amounts) requesting a vote to terminate and replace the asset representations reviewer with a proposed successor asset representations reviewer that is an eligible asset representations reviewer, and (ii) payment by such holders to the certificate administrator of the reasonable fees and expenses to be incurred by the certificate administrator in connection with administering such vote, the certificate administrator will be required to promptly provide notice to all certificateholders and the asset representations reviewer of such request by posting such notice on its internet website, and by mailing such notice to all certificateholders and the asset representations reviewer. Upon the written direction of certificateholders representing at least 75% of the voting rights that constitute a minimum Certificateholder Quorum (without regard to the application of any Cumulative Appraisal Reduction Amounts), the trustee will be required to terminate all of the rights and obligations of the asset representations reviewer under the pooling and servicing agreement (other than any rights or obligations that accrued prior to the date of such termination and other than indemnification rights arising out of events occurring prior to such termination) by written notice to the asset representations reviewer, and the proposed successor asset representations reviewer will be appointed. See “Pooling and Servicing Agreement—The Asset Representations Reviewer” in the Preliminary Prospectus. | |
| Dispute Resolution Provisions: | The mortgage loan sellers will be subject to the dispute resolution provisions set forth in the pooling and servicing agreement for this transaction to the extent those provisions are triggered with respect to any mortgage loan sold to the depositor by a mortgage loan seller, and such mortgage loan seller will be obligated under the related mortgage loan purchase agreement to comply with all applicable provisions and to take part in any mediation or arbitration proceedings that may result. Generally, in the event that a Repurchase Request is not “Resolved” within 180 days after the related mortgage loan seller receives such Repurchase Request, then the enforcing servicer will be required to send a notice to the first certificateholder (or beneficial owner) to deliver a certificateholder repurchase request with respect to the mortgage loan (the “Initial Requesting Certificateholder”) (if any) and to the certificate administrator (which will be required to make such notice available to certificateholders via the certificate administrator’s website) indicating the enforcing servicer’s intended course of action with respect to the Repurchase Request. If (a) the enforcing servicer’s intended course of action with respect to the Repurchase Request does not involve pursuing further action to exercise rights against the related mortgage loan seller with respect to the Repurchase Request and the Initial Requesting Certificateholder, if any, or any other certificateholder or certificate owner wishes to exercise its right to refer the matter to mediation (including nonbinding arbitration) or arbitration, or (b) the enforcing servicer’s intended course of action is to pursue further action to exercise rights against the related mortgage loan seller with respect to the Repurchase Request but the Initial Requesting Certificateholder, if any, or any other certificateholder or certificate owner does not agree with the dispute resolution method selected by the enforcing servicer, then the Initial Requesting Certificateholder, if any, or such other certificateholder or certificate owner may deliver a written notice to the special servicer indicating its intent to exercise its right to refer the matter to either mediation or arbitration.
Notwithstanding any of the foregoing to the contrary, the depositor, the mortgage loan sellers and any of their respective affiliates will not be entitled to be an Initial Requesting Certificateholder.
“Resolved” means, with respect to a Repurchase Request, (i) that the related material defect or breach has been cured, (ii) the related mortgage loan has been repurchased in accordance with the related mortgage loan purchase agreement, (iii) a mortgage loan has been substituted for the related mortgage loan in accordance with the related mortgage loan purchase agreement, (iv) the applicable mortgage loan seller has made a loss of value payment, (v) a contractually binding agreement has been entered into between the enforcing servicer, on behalf of the issuing entity, and the related mortgage loan seller that settles the related mortgage loan seller’s obligations under the related mortgage loan purchase agreement, or (vi) the related mortgage loan is no longer property of the issuing entity as a result of a sale or other disposition in accordance with the pooling and servicing agreement. See “Pooling and Servicing Agreement—Dispute Resolution Provisions” in the Preliminary Prospectus.
|
| Investor Communications: | The certificate administrator is required to include on any Form 10-D any request received from a certificateholder to communicate with other certificateholders related to certificateholders exercising their rights under the terms of the pooling and servicing agreement for this transaction. Any certificateholder wishing to communicate with other certificateholders regarding the exercise of its rights under the terms of the pooling and servicing agreement for this transaction will be able to deliver a written request signed by an authorized representative of the requesting investor to the certificate administrator. |
| Deal Website: | The certificate administrator is required to include on any Form 10-D any request received from a certificateholder to communicate with other certificateholders related to certificateholders exercising their rights under the terms of the pooling and servicing agreement for this transaction. Any certificateholder wishing to communicate with other certificateholders regarding the exercise of its rights under the terms of the pooling and servicing agreement for this transaction will be able to deliver a written request signed by an authorized representative of the requesting investor to the certificate administrator. |
| This is not a research report and was not prepared by any Underwriter’s research department. It was prepared by the Underwriters’ sales, trading, banking or other non-research personnel. Please see additional important information and qualifications at the end of this Term Sheet. |
14
| MSC 2019-L3 | Collateral Overview |
| Mortgage Loan Sellers | No. of Mortgage Loans | No. of Mortgaged Properties | Aggregate Cut-off Date Balance | % of Pool(1) |
| Morgan Stanley Mortgage Capital Holdings LLC | 15 | 35 | $242,751,123 | 23.8% |
| Starwood Mortgage Capital LLC | 14 | 22 | $234,072,239 | 22.9% |
| Argentic Real Estate Finance LLC | 8 | 15 | $193,540,000 | 19.0% |
| KeyBank National Association | 7 | 19 | $188,706,000 | 18.5% |
| Cantor Commercial Real Estate Lending, L.P. | 7 | 9 | $162,100,000 | 15.9% |
| Total: | 51 | 100 | $1,021,169,362 | 100.0% |
Pool Statistics
| Aggregate Cut-off Date Balance: | $1,021,169,362 |
| Number of Mortgage Loans: | 51 |
| Average Cut-off Date Balance per Mortgage Loan: | $20,022,929 |
| Number of Mortgaged Properties: | 100 |
| Average Cut-off Date Balance per Mortgaged Property: | $10,211,694 |
| Weighted Average Mortgage Rate: | 3.6825% |
| % of Pool Secured by 5 Largest Mortgage Loans: | 29.8% |
| % of Pool Secured by 10 Largest Mortgage Loans: | 50.2% |
| % of Pool Secured by ARD Loans(2): | 0.0% |
| Weighted Average Original Term to Maturity (months)(2): | 119 |
| Weighted Average Remaining Term to Maturity (months)(2): | 119 |
| Weighted Average Seasoning (months): | 1 |
| % of Pool Secured by Single Tenant Mortgaged Properties: | 15.3% |
| % of Pool Secured by Refinance Loans: | 66.1% |
| % of Pool Secured by Acquisition Loans: | 28.3% |
| % of Pool Secured by Recapitalization Loans: | 5.6% |
Additional Debt
| % of Pool withPari Passu Mortgage Debt: | 48.8% |
| % of Pool with Subordinate Mortgage Debt: | 12.1% |
Credit Statistics(3)
| Weighted Average UW NOI DSCR: | 2.54x |
| Weighted Average UW NOI Debt Yield(4): | 10.1% |
| Weighted Average UW NCF DSCR: | 2.40x |
| Weighted Average UW NCF Debt Yield(4): | 9.5% |
| Weighted Average Cut-off Date LTV Ratio(4)(5): | 59.1% |
| Weighted Average Maturity Date LTV Ratio(2)(5): | 56.8% |
Footnotes are set forth on the following page.
| This is not a research report and was not prepared by any Underwriter’s research department. It was prepared by the Underwriters’ sales, trading, banking or other non-research personnel. Please see additional important information and qualifications at the end of this Term Sheet. |
15
| MSC 2019-L3 | Collateral Overview |
Amortization
| Weighted Average Original Amortization Term (months)(2)(6): | 360 |
| Weighted Average Remaining Amortization Term (months)(2)(6): | 360 |
| % of Pool Interest Only through Maturity: | 73.0% |
| % of Pool Interest Only followed by Amortizing Balloon: | 20.1% |
| % of Pool Amortizing Balloon: | 6.9% |
Lockboxes
| % of Pool with Springing Lockboxes: | 40.7% |
| % of Pool with Hard Lockboxes: | 36.4% |
| % of Pool with Soft Lockboxes: | 20.6% |
| % of Pool with No Lockboxes: | 2.3% |
Reserves
| % of Pool Requiring Tax Reserves: | 69.1% |
| % of Pool Requiring Insurance Reserves: | 44.6% |
| % of Pool Requiring Replacement Reserves: | 65.6% |
| % of Pool Requiring TI/LC Reserves(7): | 45.2% |
Call Protection
| % of Pool with lockout period, followed by defeasance until open period: | 75.2% | |
| % of Pool with lockout period, followed by the greater of a prepayment premium and yield maintenance until open period: | 19.3% | |
| % of Pool with lockout period, followed by defeasance or the greater of a prepayment premium and yield maintenance until open period: | 5.6% | |
| (1) | Unless otherwise indicated, all references to “% of Pool” in this Term Sheet reflect a percentage of the aggregate principal balance of the mortgage pool as of the Cut-off Date, after application of all payments of principal due during or prior to November 2019. |
| (2) | With respect to any ARD Loan, unless otherwise indicated, references in this Term Sheet to the applicable “maturity date” or “maturity” refer to the applicable anticipated repayment date with respect to such ARD Loan, and such applicable anticipated repayment date is treated as its maturity date for all purposes hereof. |
| (3) | With respect to any mortgage loan that is part of a whole loan, unless otherwise indicated, all LTV, DSCR and Debt Yield calculations in this Term Sheet include any relatedpari passu companion loans and exclude any subordinate companion loans, as applicable. Additionally, LTV, DSCR and Debt Yield figures in this Term Sheet are calculated for mortgage loans without regard to any additional indebtedness that may be incurred at a future date. |
| (4) | With respect to certain mortgage loans, debt yields and LTVs (such as, for example, UW NOI Debt Yield, UW NCF Debt Yield or Cut-off Date LTV Ratio) have been calculated based on a principal balance that is net of a holdback or earnout reserve. Such mortgage loans are identified under the definitions of “Underwritten NOI Debt Yield”, “Underwritten NCF Debt Yield” and “Cut-off Date LTV Ratio” set forth under “Description of the Mortgage Pool—Certain Calculations and Definitions” in the Preliminary Prospectus. |
| (5) | The LTV ratios set forth in this Term Sheet are generally based on the “as-is” values of the related mortgaged properties; provided that the “as-is” value for a portfolio of mortgaged properties may include a premium relating to the valuation of the mortgaged properties as a whole rather than as the sum of the appraised values of the individually valued mortgaged properties; provided, further, that such LTV ratios may be based on “as-stabilized”, “as complete” or other contingent values in certain cases in which reserves have been established at origination for the applicable condition or circumstance that is expected to result in stabilization; provided, further, that such LTV ratios may have been calculated based on a principal balance that is net of a holdback or earnout reserve. See the definition of “Appraised Value” under“Description of the Mortgage Pool—Certain Calculations and Definitions”in the Preliminary Prospectus. |
| (6) | Excludes mortgage loans that provide for payments of interest only through the related maturity date or anticipated repayment date, as applicable. |
| (7) | Excludes hospitality, multifamily, self storage, leased fee and manufactured housing properties. |
| This is not a research report and was not prepared by any Underwriter’s research department. It was prepared by the Underwriters’ sales, trading, banking or other non-research personnel. Please see additional important information and qualifications at the end of this Term Sheet. |
16
| MSC 2019-L3 | Characteristics of the Mortgage Loans |
| Top 10 Mortgage Loans or Groups of Cross-Collateralized Mortgage Loans(1) | |||||||||||||
| Loan No. | Mortgage Loan Seller | Property Name | City | State | Property Type | Cut-off Date Balance | % of Pool | SF/Units/ Rooms | Cut-off Date Balance per SF/Unit/Room | UW NCF DSCR | UW NOI Debt Yield | Cut-off Date LTV | Maturity Date LTV |
| 1 | KeyBank | GNL Office and Industrial Portfolio | Various | Various | Various | $70,000,000 | 6.9% | 2,195,042 | $92.94 | 2.60x | 10.6% | 55.1% | 55.1% |
| 2 | KeyBank | Parklawn Building | Rockville | MD | Office | $70,000,000 | 6.9% | 1,283,646 | $203.79 | 2.68x | 9.4% | 60.0% | 60.0% |
| 3 | AREF | East Village Multifamily Portfolio | New York | NY | Various | $60,500,000 | 5.9% | 144 | $593,750.00 | 2.07x | 7.0% | 61.2% | 61.2% |
| 4 | MSMCH | Grand Canal Shoppes | Las Vegas | NV | Retail | $53,846,154 | 5.3% | 759,891 | $1,000.14 | 2.46x | 9.6% | 46.3% | 46.3% |
| 5 | MSMCH | ILPT Industrial Portfolio | Various | Various | Industrial | $50,000,000 | 4.9% | 8,209,036 | $26.12 | 5.05x | 14.8% | 39.2% | 39.2% |
| 6 | AREF | Royal Palm Place | Boca Raton | FL | Mixed Use | $50,000,000 | 4.9% | 462,695 | $237.74 | 2.16x | 8.5% | 62.9% | 62.9% |
| 7 | CCRE | The Hendry | Garland | TX | Multifamily | $45,600,000 | 4.5% | 399 | $114,285.71 | 1.45x | 8.2% | 59.0% | 53.4% |
| 8 | SMC | Wells Fargo Place | St. Paul | MN | Office | $40,000,000 | 3.9% | 646,459 | $123.75 | 2.92x | 10.8% | 64.0% | 64.0% |
| 9 | SMC | Bushwick Avenue Portfolio | Brooklyn | NY | Various | $40,000,000 | 3.9% | 347,203 | $374.42 | 1.81x | 6.8% | 65.0% | 65.0% |
| 10 | CCRE | AVR Homewood Suites Carle Place | Carle Place | NY | Hospitality | $32,500,000 | 3.2% | 150 | $216,666.67 | 3.12x | 12.8% | 65.0% | 65.0% |
| Total/Wtd. Avg. | $512,446,154 | 50.2% | 2.62x | 9.8% | 57.2% | 56.7% | |||||||
| (1) | With respect to any mortgage loan that is part of a whole loan, unless otherwise indicated, all LTV, DSCR, Debt Yield and Cut-off Date Balance per SF/Unit/Room calculations in this Term Sheet include any relatedpari passu companion loans and exclude any subordinate companion loans, as applicable. Additionally, LTV, DSCR, Debt Yield and Cut-off Date Balance per SF/Unit/Room figures in this Term Sheet are calculated for mortgage loans without regard to any additional indebtedness that may be incurred at a future date. With respect to any leased fee loans, the SF/Units/Rooms and Cut-off Date Balance per SF/Unit/Room figures in this Term Sheet are based on the size of the non-collateral improvements. |
| This is not a research report and was not prepared by any Underwriter’s research department. Please see additional important information and qualifications at the end of this Term Sheet. |
17
| MSC 2019-L3 | Characteristics of the Mortgage Loans |
| Mortgage Loans with Pari Passu Companion Loans | ||||||||||||
| Loan No. | Mortgage Loan Seller | Property Name | Mortgage Loan Cut-off Date Balance | Aggregate Pari Passu Companion Loan Cut-off Date Balance | Combined Cut-off Date Balance | Lead Servicing Agreement | Master Servicer | Special Servicer | Control Rights | Combined UW NCF DSCR(1) | Combined UW NOI Debt Yield(1) | Combined Cut-off Date LTV(1) |
| 1 | KeyBank | GNL Office and Industrial Portfolio | $70,000,000 | $134,000,000 | $204,000,000 | CF 2019-CF2 | KeyBank | LNR | CF 2019-CF2 | 2.60x | 10.6% | 55.1% |
| 2 | KeyBank | Parklawn Building | $70,000,000 | $191,600,000 | $261,600,000 | MSC 2019-L3 | Wells Fargo | LNR | MSC 2019-L3 | 2.68x | 9.4% | 60.0% |
| 3 | AREF | East Village Multifamily Portfolio | $60,500,000 | $25,000,000 | $85,500,000 | MSC 2019-L3 | Wells Fargo | LNR | MSC 2019-L3 | 2.07x | 7.0% | 61.2% |
| 4 | MSMCH | Grand Canal Shoppes | $53,846,154 | $706,153,846 | $760,000,000 | MSC 2019-H7 | Midland | LNR | (2) | 2.46x | 9.6% | 46.3% |
| 5 | MSMCH | ILPT Industrial Portfolio | $50,000,000 | $164,400,000 | $214,400,000 | MSC 2019-L3 | Wells Fargo | LNR | (2) | 5.05x | 14.8% | 39.2% |
| 6 | AREF | Royal Palm Place | $50,000,000 | $60,000,000 | $110,000,000 | MSC 2019-L3 | Wells Fargo | LNR | (3) | 2.16x | 8.5% | 62.9% |
| 8 | SMC | Wells Fargo Place | $40,000,000 | $40,000,000 | $80,000,000 | MSC 2019-L3 | Wells Fargo | LNR | MSC 2019-L3 | 2.92x | 10.8% | 64.0% |
| 9 | SMC | Bushwick Avenue Portfolio | $40,000,000 | $90,000,000 | $130,000,000 | CF 2019-CF2 | KeyBank | LNR | CF 2019-CF2 | 1.81x | 6.8% | 65.0% |
| 18 | CCRE | Osborn Triangle | $20,000,000 | $410,000,000 | $430,000,000 | JPMXB 2019-OSB | KeyBank | Situs | JPMXB 2019-OSB | 3.12x | 12.5% | 37.1% |
| 19 | AREF | American Metro Center | $20,000,000 | $13,200,000 | $33,200,000 | MSC 2019-L3 | Wells Fargo | LNR | MSC 2019-L3 | 1.66x | 7.0% | 68.3% |
| 24 | SMC | Hilton Portfolio | $12,000,000 | $56,000,000 | $68,000,000 | CF 2019-CF2 | KeyBank | LNR | CF 2019-CF2 | 2.05x | 13.6% | 61.8% |
| 25 | MSMCH | National Anchored Retail Portfolio | $12,000,000 | $105,000,000 | $117,000,000 | BANK 2019-BNK21 | Wells Fargo | Rialto | BANK 2019-BNK21 | 2.96x | 11.6% | 62.8% |
| (1) | DSCR, Debt Yield and LTV calculations include any related pari passu companion loans and exclude any subordinate companion loans, as applicable. |
| (2) | The initial directing holder is the holder of the related Note B until the occurrence of a control appraisal event under the related intercreditor agreement, at which time the directing holder will be the directing certificateholder (or other designated party) under the related lead servicing agreement. See “Description of the Mortgage Pool—The Whole Loans” in the Prospectus. |
| (3) | The Royal Palm Place pari passu companion loans are currently held by AREF and are expected to be contributed to one or more future securitization transactions. The Royal Palm Place whole loan will be serviced pursuant to the MSC 2019-L3 pooling and servicing agreement until the securitization of the related control note. |
| This is not a research report and was not prepared by any Underwriter’s research department. Please see additional important information and qualifications at the end of this Term Sheet. |
18
| MSC 2019-L3 | Characteristics of the Mortgage Loans |
| Prior Securitization History(1) | ||||||||||||||
| Loan No. | Mortgage Loan Seller | Property Name | City | State | Property Type | Cut-off Date Balance | % of Pool | SF/ Rooms/ Units | Cut-off Room/Unit | UW NCF DSCR | UW NOI Debt Yield | Cut-off Date LTV | Maturity Date LTV | Prior Securitization |
| 4 | MSMCH | Grand Canal Shoppes | Las Vegas | NV | Retail | $53,846,154 | 5.3% | 759,891 | $1,000.14 | 2.46x | 9.6% | 46.3% | 46.3% | GSMS 2012-SHOP |
| 8 | SMC | Wells Fargo Place | St. Paul | MN | Office | $40,000,000 | 3.9% | 646,459 | $123.75 | 2.92x | 10.8% | 64.0% | 64.0% | KREF 2018-FL1 |
| 9 | SMC | Bushwick Avenue Portfolio | Brooklyn | NY | Various | $40,000,000 | 3.9% | 347,203 | $374.42 | 1.81x | 6.8% | 65.0% | 65.0% | BSPRT 2019-FL5 |
| 10 | CCRE | AVR Homewood Suites Carle Place | Carle Place | NY | Hospitality | $32,500,000 | 3.2% | 150 | $216,666.67 | 3.12x | 12.8% | 65.0% | 65.0% | COMM 2014-UBS6 |
| 17 | CCRE | McHenry Village Shopping Center | Modesto | CA | Retail | $21,000,000 | 2.1% | 275,422 | $76.25 | 3.05x | 13.3% | 53.0% | 53.0% | COMM 2013-CR7 |
| 26 | SMC | Audubon Court Apartments | Norristown | PA | Multifamily | $11,500,000 | 1.1% | 174 | $66,091.95 | 1.58x | 9.3% | 53.2% | 46.0% | FREMF 2014-K715 |
| 27 | AREF | Woodbridge Apartments | Kentwood | MI | Multifamily | $11,500,000 | 1.1% | 168 | $68,452.38 | 2.74x | 9.7% | 61.5% | 61.5% | FNA 2016-M9 |
| 31 | MSMCH | Cal Ranch Plaza | Las Vegas | NV | Retail | $9,830,000 | 1.0% | 109,303 | $89.93 | 1.56x | 10.0% | 67.3% | 61.3% | COMM 2015-CR26 |
| 36 | AREF | Highland Village Apartments | Clarkston | GA | Multifamily | $8,500,000 | 0.8% | 134 | $63,432.84 | 1.78x | 10.3% | 59.4% | 53.8% | WFCM 2015-C26 |
| 41 | MSMCH | Holiday Inn Jacksonville East | Jacksonville | FL | Hospitality | $6,875,000 | 0.7% | 98 | $70,153.06 | 1.97x | 13.7% | 59.8% | 50.7% | GSMS 2013-GC14 |
| Total | $235,551,154 | 23.1% | ||||||||||||
| (1) | Includes mortgage loans for which all or a portion of the previously existing debt was most recently securitized within the last 10 years, based on information provided by the related borrower or obtained through searches of a third-party database. The information has not otherwise been confirmed by the mortgage loan sellers. With respect to any mortgage loan that is part of a whole loan, unless otherwise indicated, all LTV, DSCR, Debt Yield and Cut-off Date Balance per SF/ Room/Unit calculations include any relatedpari passu companion loans and exclude any related subordinate companion loans, as applicable. |
| This is not a research report and was not prepared by any Underwriter’s research department. Please see additional important information and qualifications at the end of this Term Sheet. |
19
| MSC 2019-L3 | Characteristics of the Mortgage Loans |
| Mortgage Loans with Subordinate Debt | |||||||||||
| Loan No. | Mortgage Loan Seller | Property Name | Mortgage Loan Cut-off Date Balance | Cut-off Date Balance per Unit/SF | Subordinate Debt Cut-off Date Balance | UW NCF DSCR | UW NOI Debt Yield | Cut-off Date LTV | Whole Loan UW NCF DSCR(1) | Whole Loan UW NOI Debt Yield(1) | Whole Loan Cut-off Date LTV(1) |
| 4 | MSMCH | Grand Canal Shoppes | $53,846,154 | $1,000.14 | $215,000,000 | 2.46x | 9.6% | 46.3% | 1.67x | 7.5% | 59.5% |
| 5 | MSMCH | ILPT Industrial Portfolio | $50,000,000 | $26.12 | $135,600,000 | 5.05x | 14.8% | 39.2% | 2.47x | 9.1% | 64.0% |
| 18 | CCRE | Osborn Triangle | $20,000,000 | $635.20 | $145,000,000 | 3.12x | 12.5% | 37.1% | 2.33x | 9.3% | 49.7% |
| (1) | Whole Loan UW NCF DSCR, Whole Loan UW NOI Debt Yield and Whole Loan Cut-off Date LTV figures shown above are calculated based on any relatedpari passu notes and any related subordinate note(s). |
| This is not a research report and was not prepared by any Underwriter’s research department. Please see additional important information and qualifications at the end of this Term Sheet. |
20
| MSC 2019-L3 | Characteristics of the Mortgage Loans |
Mortgage Loans with Scheduled Balloon Payments and Related Classes(1)
| Class A-2 ($9,200,000) | ||||||||||||||||
| Loan No. | Mortgage Loan Seller | Property Name | State | Property Type | Cut-off Date Balance | % of Pool | Maturity Date Balance | % of Class A-2 Certificate Principal Balance | SF/Units | Cut-off Date Balance per SF/ Unit | UW NCF DSCR | UW NOI Debt Yield | Cut-off Date LTV | Maturity Date LTV | Rem. IO Period (mos.) | Rem. Term to Maturity (mos.) |
| 32 | SMC | Yosemite Office | CO | Office | $9,700,000 | 0.9% | $9,280,167 | 100.9% | 126,436 | $76.72 | 1.88x | 12.0% | 67.8% | 64.9% | 30 | 60 |
| Total/Wtd. Avg. | $9,700,000 | 0.9% | $9,280,167 | 100.9% | 1.88x | 12.0% | 67.8% | 64.9% | 30 | 60 | ||||||
| (1) | The table above reflects the mortgage loans whose balloon payments will be applied to pay down the Class A-2 certificates, assuming (i) that none of the mortgage loans experience prepayments, defaults or losses; (ii) there are no extensions of maturity dates; and (iii) each mortgage loan is paid in full on its stated maturity date or, in the case of any mortgage loan with an anticipated repayment date, on such anticipated repayment date. The table above is otherwise based on the Structuring Assumptions set forth under “Yield and Maturity Considerations—Weighted Average Life” in the Preliminary Prospectus. |
| This is not a research report and was not prepared by any Underwriter’s research department. Please see additional important information and qualifications at the end of this Term Sheet. |
21
| MSC 2019-L3 | Characteristics of the Mortgage Loans |
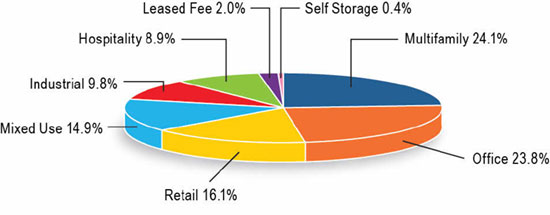
| Property Type Distribution(1) | ||||||||
| Property Type | Number of Mortgaged Properties | Aggregate Cut-off Date Balance | % of Pool | Wtd. Avg. Mortgage Rate | Wtd. Avg. UW NCF DSCR | Wtd. Avg. UW NOI Debt Yield | Wtd. Avg. Cut-off Date LTV | Wtd. Avg. Maturity Date LTV |
| Multifamily | 15 | $246,458,905 | 24.1% | 3.7045% | 1.95x | 8.5% | 61.4% | 58.8% |
| Garden | 9 | $171,978,256 | 16.8% | 3.7100% | 1.92x | 8.8% | 61.1% | 57.4% |
| Mid Rise | 5 | $63,880,649 | 6.3% | 3.6494% | 2.07x | 7.9% | 61.6% | 61.6% |
| High Rise | 1 | $10,600,000 | 1.0% | 3.9490% | 1.74x | 7.0% | 64.2% | 64.2% |
| Office | 11 | $243,372,800 | 23.8% | 3.5471% | 2.56x | 10.3% | 61.0% | 59.6% |
| Suburban | 7 | $139,334,300 | 13.6% | 3.6201% | 2.38x | 10.1% | 62.1% | 59.6% |
| CBD | 2 | $52,873,876 | 5.2% | 3.4609% | 2.84x | 10.8% | 61.8% | 61.8% |
| Medical | 1 | $32,000,000 | 3.1% | 3.3100% | 2.86x | 10.1% | 58.2% | 58.2% |
| R&D Lab | 1 | $19,164,623 | 1.9% | 3.6500% | 2.60x | 10.6% | 55.1% | 55.1% |
| Retail | 18 | $164,357,258 | 16.1% | 3.8143% | 2.25x | 10.4% | 57.6% | 53.9% |
| Anchored | 12 | $75,984,969 | 7.4% | 3.8233% | 2.33x | 11.3% | 63.7% | 58.7% |
| Specialty Retail | 1 | $53,846,154 | 5.3% | 3.7408% | 2.46x | 9.6% | 46.3% | 46.3% |
| Shadow Anchored | 3 | $28,975,000 | 2.8% | 3.8556% | 1.80x | 9.7% | 60.7% | 54.8% |
| Unanchored | 1 | $3,845,135 | 0.4% | 4.2360% | 1.47x | 9.0% | 69.9% | 56.2% |
| Single Tenant | 1 | $1,706,000 | 0.2% | 4.0800% | 1.55x | 9.9% | 62.0% | 56.5% |
| Mixed Use | 14 | $152,619,351 | 14.9% | 3.6251% | 2.28x | 8.6% | 57.8% | 57.6% |
| Multifamily, Retail & Office | 2 | $58,300,000 | 5.7% | 3.7587% | 2.36x | 9.2% | 59.3% | 59.3% |
| Multifamily/Retail | 7 | $57,619,351 | 5.6% | 3.3400% | 2.07x | 7.0% | 61.2% | 61.2% |
| Office/Laboratory | 3 | $20,000,000 | 2.0% | 3.7970% | 3.12x | 12.5% | 37.1% | 37.1% |
| Multifamily/Office | 1 | $12,200,000 | 1.2% | 3.7100% | 1.81x | 6.8% | 65.0% | 65.0% |
| Retail/Office | 1 | $4,500,000 | 0.4% | 4.5500% | 1.39x | 9.3% | 68.2% | 59.9% |
| Industrial | 26 | $99,869,700 | 9.8% | 3.1980% | 3.72x | 12.8% | 48.5% | 47.8% |
| Warehouse Distribution | 20 | $77,187,662 | 7.6% | 3.0842% | 4.07x | 13.2% | 45.2% | 44.8% |
| Flex | 2 | $11,640,000 | 1.1% | 3.5240% | 2.41x | 11.7% | 64.5% | 61.3% |
| Manufacturing | 4 | $11,042,037 | 1.1% | 3.6500% | 2.60x | 10.6% | 55.1% | 55.1% |
| Hospitality | 14 | $90,391,348 | 8.9% | 4.2709% | 2.36x | 13.3% | 61.9% | 55.1% |
| Extended Stay | 3 | $36,152,941 | 3.5% | 3.7337% | 3.01x | 12.9% | 64.7% | 63.6% |
| Resort | 4 | $28,000,000 | 2.7% | 4.9500% | 1.89x | 14.0% | 58.5% | 48.1% |
| Limited Service | 6 | $19,363,407 | 1.9% | 4.3171% | 1.96x | 13.0% | 62.5% | 51.0% |
| Full Service | 1 | $6,875,000 | 0.7% | 4.2000% | 1.97x | 13.7% | 59.8% | 50.7% |
| Leased Fee | 1 | $20,000,000 | 2.0% | 4.1500% | 1.66x | 7.0% | 68.3% | 68.3% |
| Leased Fee | 1 | $20,000,000 | 2.0% | 4.1500% | 1.66x | 7.0% | 68.3% | 68.3% |
| Self Storage | 1 | $4,100,000 | 0.4% | 3.7960% | 1.63x | 9.3% | 64.8% | 54.4% |
| Self Storage | 1 | $4,100,000 | 0.4% | 3.7960% | 1.63x | 9.3% | 64.8% | 54.4% |
| Total/Wtd. Avg. | 100 | $1,021,169,362 | 100.0% | 3.6825% | 2.40x | 10.1% | 59.1% | 56.8% |
| (1) | All numerical information concerning the mortgage loans is approximate and, in the case of mortgage loans secured by multiple properties, is based on allocated loan amounts with respect to such properties. All weighted average information regarding the mortgage loans reflects the weighting of the mortgage loans based on their outstanding principal balances as of the Cut-off Date or, in the case of mortgage loans secured by multiple properties, allocated loan amounts. The sum of numbers and percentages in columns may not match the “Total” due to rounding. With respect to any mortgage loan that is part of a whole loan, unless otherwise indicated, all LTV, DSCR and Debt Yield calculations include any relatedpari passu companion loans and exclude any related subordinate companion loans, as applicable. |
| This is not a research report and was not prepared by any Underwriter’s research department. It was prepared by the Underwriters’ sales, trading, banking or other non-research personnel. Please see additional important information and qualifications at the end of this Term Sheet. |
22
| MSC 2019-L3 | Characteristics of the Mortgage Loans |
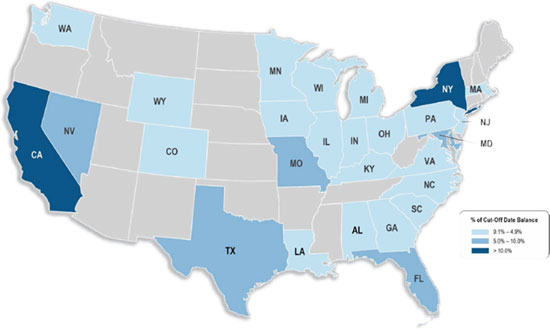
| Geographic Distribution(1) | ||||||||
| State or Other Jurisdiction | Number of Mortgaged Properties | Aggregate Cut-off Date Balance | % of Pool | Wtd. Avg. Mortgage Rate | Wtd. Avg. UW NCF DSCR | Wtd. Avg. UW NOI Debt Yield | Wtd. Avg. Cut-off | Wtd. Avg. Maturity Date LTV |
| New York | 14 | $152,600,000 | 14.9% | 3.5879% | 2.16x | 8.2% | 63.7% | 63.7% |
| California | 7 | $133,084,623 | 13.0% | 3.6037% | 2.48x | 10.2% | 56.1% | 54.7% |
| California – Southern(2) | 6 | $112,084,623 | 11.0% | 3.5669% | 2.38x | 9.6% | 56.7% | 55.0% |
| California – Northern(2) | 1 | $21,000,000 | 2.1% | 3.8000% | 3.05x | 13.3% | 53.0% | 53.0% |
| Florida | 8 | $90,980,882 | 8.9% | 4.2356% | 2.02x | 10.7% | 61.6% | 57.1% |
| Texas | 6 | $86,270,594 | 8.4% | 3.7589% | 1.83x | 9.2% | 60.0% | 54.5% |
| Nevada | 3 | $73,238,654 | 7.2% | 3.7887% | 2.25x | 9.9% | 50.5% | 48.7% |
| Maryland | 2 | $72,696,527 | 7.1% | 3.3704% | 2.77x | 9.6% | 59.2% | 59.2% |
| Missouri | 6 | $51,389,854 | 5.0% | 3.4364% | 2.95x | 10.5% | 56.8% | 56.8% |
| Pennsylvania | 7 | $48,010,678 | 4.7% | 3.9901% | 1.91x | 10.8% | 63.6% | 55.6% |
| Minnesota | 1 | $40,000,000 | 3.9% | 3.4000% | 2.92x | 10.8% | 64.0% | 64.0% |
| Massachusetts | 4 | $31,016,348 | 3.0% | 3.9863% | 2.68x | 12.5% | 46.3% | 42.0% |
| South Carolina | 1 | $29,950,000 | 2.9% | 3.8250% | 1.92x | 7.6% | 68.5% | 68.5% |
| Alabama | 2 | $27,445,707 | 2.7% | 3.7716% | 2.14x | 10.4% | 62.3% | 56.5% |
| Michigan | 5 | $27,174,772 | 2.7% | 3.7174% | 2.17x | 9.5% | 64.2% | 60.4% |
| Indiana | 7 | $25,010,938 | 2.4% | 2.9318% | 4.38x | 13.7% | 44.0% | 44.0% |
| Virginia | 6 | $20,861,966 | 2.0% | 3.4704% | 2.85x | 12.6% | 61.5% | 51.5% |
| New Jersey | 1 | $20,000,000 | 2.0% | 4.1500% | 1.66x | 7.0% | 68.3% | 68.3% |
| Illinois | 3 | $15,139,487 | 1.5% | 3.8301% | 2.54x | 10.5% | 63.4% | 63.4% |
| Georgia | 3 | $12,997,307 | 1.3% | 3.7023% | 2.06x | 10.4% | 57.9% | 54.2% |
| Ohio | 2 | $12,153,245 | 1.2% | 2.9416% | 4.34x | 13.6% | 43.8% | 43.8% |
| Colorado | 2 | $11,990,000 | 1.2% | 3.8323% | 2.01x | 11.7% | 67.0% | 64.7% |
| Kentucky | 2 | $9,676,856 | 0.9% | 3.2386% | 3.09x | 13.3% | 55.0% | 51.2% |
| Wisconsin | 2 | $9,555,000 | 0.9% | 3.8709% | 2.33x | 10.9% | 65.2% | 63.7% |
| Washington | 1 | $8,300,000 | 0.8% | 3.4500% | 3.55x | 13.1% | 37.7% | 37.7% |
| North Carolina | 2 | $5,247,059 | 0.5% | 3.9062% | 1.72x | 10.2% | 64.1% | 53.7% |
| Iowa | 1 | $2,970,750 | 0.3% | 2.6533% | 5.05x | 14.8% | 39.2% | 39.2% |
| Louisiana | 1 | $1,963,852 | 0.2% | 3.6500% | 2.60x | 10.6% | 55.1% | 55.1% |
| Wyoming | 1 | $1,444,263 | 0.1% | 3.6500% | 2.60x | 10.6% | 55.1% | 55.1% |
| Total/Wtd. Avg. | 100 | $1,021,169,362 | 100.0% | 3.6825% | 2.40x | 10.1% | 59.1% | 56.8% |
| (1) | All numerical information concerning the mortgage loans is approximate and, in the case of mortgage loans secured by multiple properties, is based on allocated loan amounts with respect to such properties. All weighted average information regarding the mortgage loans reflects the weighting of the mortgage loans based on their outstanding principal balances as of the Cut-off Date or, in the case of mortgage loans secured by multiple properties, allocated loan amounts. The sum of numbers and percentages in columns may not match the “Total” due to rounding. With respect to any mortgage loan that is part of a whole loan, unless otherwise indicated, all LTV, DSCR and Debt Yield calculations include any relatedpari passu companion loans and exclude any related subordinate companion loans, as applicable. |
| (2) | “California – Northern” includes zip codes above 93600, and “California – Southern” includes zip codes at or below 93600. |
| This is not a research report and was not prepared by any Underwriter’s research department. It was prepared by the Underwriters’ sales, trading, banking or other non-research personnel. Please see additional important information and qualifications at the end of this Term Sheet. |
23
| MSC 2019-L3 | Collateral Statistics |
Collateral Statistics(1)
Cut-off Date Balance ($)
| No. of Mortgage Loans | Aggregate Cut-off Date Balance ($) | % of Pool | |
| 1,706,000 - 10,000,000 | 21 | 136,723,635 | 13.4 |
| 10,000,001 - 20,000,000 | 13 | 182,349,573 | 17.9 |
| 20,000,001 - 30,000,000 | 6 | 157,650,000 | 15.4 |
| 30,000,001 - 40,000,000 | 4 | 144,500,000 | 14.2 |
| 40,000,001 - 55,000,000 | 4 | 199,446,154 | 19.5 |
| 55,000,001 - 70,000,000 | 3 | 200,500,000 | 19.6 |
| Total: | 51 | $1,021,169,362 | 100.0% |
| Min: $1,706,000 Max: $70,000,000 Avg: $20,022,929 | |||
State or Other Jurisdiction(2)
| No. of Mortgaged Properties | Aggregate Cut-off Date Balance ($) | % of Pool | |
| New York | 14 | 152,600,000 | 14.9 |
| California | 7 | 133,084,623 | 13.0 |
| California – Southern(3) | 6 | 112,084,623 | 11.0 |
| California – Northern(3) | 1 | 21,000,000 | 2.1 |
| Florida | 8 | 90,980,882 | 8.9 |
| Texas | 6 | 86,270,594 | 8.4 |
| Nevada | 3 | 73,238,654 | 7.2 |
| Maryland | 2 | 72,696,527 | 7.1 |
| Missouri | 6 | 51,389,854 | 5.0 |
| Pennsylvania | 7 | 48,010,678 | 4.7 |
| Minnesota | 1 | 40,000,000 | 3.9 |
| Massachusetts | 4 | 31,016,348 | 3.0 |
| South Carolina | 1 | 29,950,000 | 2.9 |
| Alabama | 2 | 27,445,707 | 2.7 |
| Michigan | 5 | 27,174,772 | 2.7 |
| Indiana | 7 | 25,010,938 | 2.4 |
| Virginia | 6 | 20,861,966 | 2.0 |
| New Jersey | 1 | 20,000,000 | 2.0 |
| Illinois | 3 | 15,139,487 | 1.5 |
| Georgia | 3 | 12,997,307 | 1.3 |
| Ohio | 2 | 12,153,245 | 1.2 |
| Colorado | 2 | 11,990,000 | 1.2 |
| Kentucky | 2 | 9,676,856 | 0.9 |
| Wisconsin | 2 | 9,555,000 | 0.9 |
| Washington | 1 | 8,300,000 | 0.8 |
| North Carolina | 2 | 5,247,059 | 0.5 |
| Iowa | 1 | 2,970,750 | 0.3 |
| Louisiana | 1 | 1,963,852 | 0.2 |
| Wyoming | 1 | 1,444,263 | 0.1 |
| Total: | 100 | $1,021,169,362 | 100.0% |
Property Type(2)
| No. of Mortgaged Properties | Aggregate Cut-off Date Balance ($) | % of Pool | |
| Multifamily | 15 | 246,458,905 | 24.1 |
| Garden | 9 | 171,978,256 | 16.8 |
| Mid Rise | 5 | 63,880,649 | 6.3 |
| High Rise | 1 | 10,600,000 | 1.0 |
| Office | 11 | 243,372,800 | 23.8 |
| Suburban | 7 | 139,334,300 | 13.6 |
| CBD | 2 | 52,873,876 | 5.2 |
| Medical | 1 | 32,000,000 | 3.1 |
| R&D Lab | 1 | 19,164,623 | 1.9 |
| Retail | 18 | 164,357,258 | 16.1 |
| Anchored | 12 | 75,984,969 | 7.4 |
| Specialty Retail | 1 | 53,846,154 | 5.3 |
| Shadow Anchored | 3 | 28,975,000 | 2.8 |
| Unanchored | 1 | 3,845,135 | 0.4 |
| Single Tenant | 1 | 1,706,000 | 0.2 |
| Mixed Use | 14 | 152,619,351 | 14.9 |
| Multifamily, Retail & Office | 2 | 58,300,000 | 5.7 |
| Multifamily/Retail | 7 | 57,619,351 | 5.6 |
| Office/Laboratory | 3 | 20,000,000 | 2.0 |
| Multifamily/Office | 1 | 12,200,000 | 1.2 |
| Retail/Office | 1 | 4,500,000 | 0.4 |
| Industrial | 26 | 99,869,700 | 9.8 |
| Warehouse Distribution | 20 | 77,187,662 | 7.6 |
| Flex | 2 | 11,640,000 | 1.1 |
| Manufacturing | 4 | 11,042,037 | 1.1 |
| Hospitality | 14 | 90,391,348 | 8.9 |
| Extended Stay | 3 | 36,152,941 | 3.5 |
| Resort | 4 | 28,000,000 | 2.7 |
| Limited Service | 6 | 19,363,407 | 1.9 |
| Full Service | 1 | 6,875,000 | 0.7 |
| Leased Fee | 1 | 20,000,000 | 2.0 |
| Leased Fee | 1 | 20,000,000 | 2.0 |
| Self Storage | 1 | 4,100,000 | 0.4 |
| Self Storage | 1 | 4,100,000 | 0.4 |
| Total/Wtd. Avg. | 100 | $1,021,169,362 | 100.0% |
Mortgage Rate (%)
| No. of Mortgage Loans | Aggregate Cut-off Date Balance ($) | % of Pool | |
| 2.65326 - 2.9990 | 1 | 50,000,000 | 4.9 |
| 3.0000 - 3.4990 | 11 | 299,720,000 | 29.4 |
| 3.5000 - 3.9990 | 25 | 516,783,623 | 50.6 |
| 4.0000 - 4.4990 | 12 | 122,165,739 | 12.0 |
| 4.5000 - 4.9500 | 2 | 32,500,000 | 3.2 |
| Total: | 51 | $1,021,169,362 | 100.0% |
| Min: 2.65326% Max: 4.9500% Wtd Avg: 3.6825% | |||
Original Term to Maturity or ARD (mos.)
| No. of Mortgage Loans | Aggregate Cut-off Date Balance ($) | % of Pool | |
| 60 | 1 | 9,700,000 | 0.9 |
| 120 | 50 | 1,011,469,362 | 99.1 |
| Total: | 51 | $1,021,169,362 | 100.0% |
| Min: 60 mos. Max: 120 mos. Wtd Avg: 119 mos. | |||
Remaining Term to Maturity or ARD (mos.)
| No. of Mortgage Loans | Aggregate Cut-off Date Balance ($) | % of Pool | |
| 60 | 1 | 9,700,000 | 0.9 |
| 115 - 120 | 50 | 1,011,469,362 | 99.1 |
| Total: | 51 | $1,021,169,362 | 100.0% |
| Min: 60 mos. Max: 120 mos. Wtd Avg: 119 mos. | |||
Original Amortization Term (mos.)
| No. of Mortgage Loans | Aggregate Cut-off Date Balance ($) | % of Pool | |
| Interest Only | 28 | 745,296,154 | 73.0 |
| 360 | 23 | 275,873,208 | 27.0 |
| Total: | 51 | $1,021,169,362 | 100.0% |
| Min: 360 mos. Max: 360 mos. Wtd Avg: 360 mos. | |||
Remaining Amortization Term (mos.)
| No. of Mortgage Loans | Aggregate Cut-off Date Balance ($) | % of Pool | |
| Interest Only | 28 | 745,296,154 | 73.0 |
| 359 | 4 | 42,324,708 | 4.1 |
| 360 | 19 | 233,548,500 | 22.9 |
| Total: | 51 | $1,021,169,362 | 100.0% |
| Min: 359 mos. Max: 360 mos. Wtd Avg: 360 mos. | |||
Mortgage Loan Sellers
| No. of Mortgage Loans | Aggregate Cut-off Date Balance ($) | % of Pool | |
| MSMCH | 15 | 242,751,123 | 23.8 |
| SMC | 14 | 234,072,239 | 22.9 |
| AREF | 8 | 193,540,000 | 19.0 |
| KeyBank | 7 | 188,706,000 | 18.5 |
| CCRE | 7 | 162,100,000 | 15.9 |
| Total: | 51 | $1,021,169,362 | 100.0% |
Amortization Type
| No. of Mortgage Loans | Aggregate Cut-off Date Balance ($) | % of Pool | |
| Interest Only | 28 | 745,296,154 | 73.0 |
| Partial Interest Only | 18 | 205,548,500 | 20.1 |
| Amortizing Balloon | 5 | 70,324,708 | 6.9 |
| Total: | 51 | 1,021,169,362 | 100.0% |
Cut-off Date LTV Ratio (%)
| No. of Mortgage Loans | Aggregate Cut-off Date Balance ($) | % of Pool | |
| 37.1 - 50.0 | 5 | 139,646,154 | 13.7 |
| 50.1 - 55.0 | 4 | 84,700,000 | 8.3 |
| 55.1 - 60.0 | 9 | 289,957,500 | 28.4 |
| 60.1 - 65.0 | 19 | 348,800,604 | 34.2 |
| 65.1 – 74.9 | 14 | 158,065,104 | 15.5 |
| Total: | 51 | $1,021,169,362 | 100.0% |
| Min: 37.1% Max: 74.9% Wtd Avg: 59.1% | |||
Maturity Date or ARD LTV Ratio (%)
| No. of Mortgage Loans | Aggregate Cut-off Date Balance ($) | % of Pool | |
| 37.1 - 40.0 | 3 | 78,300,000 | 7.7 |
| 40.1 - 50.0 | 5 | 110,408,654 | 10.8 |
| 50.1 - 55.0 | 11 | 197,689,604 | 19.4 |
| 55.1 - 60.0 | 10 | 214,341,104 | 21.0 |
| 60.1 - 65.0 | 18 | 355,480,000 | 34.8 |
| 65.1 - 69.2 | 4 | 64,950,000 | 6.4 |
| Total: | 51 | $1,021,169,362 | 100.0% |
| Min: 37.1% Max: 69.2% Wtd Avg: 56.8% | |||
UW NCF DSCR (x)
| No. of Mortgage Loans | Aggregate Cut-off Date Balance ($) | % of Pool | |
| 1.39 - 1.40 | 1 | 4,500,000 | 0.4 |
| 1.41 - 1.60 | 10 | 131,829,391 | 12.9 |
| 1.61 - 1.80 | 7 | 92,612,500 | 9.1 |
| 1.81 - 2.00 | 9 | 144,481,317 | 14.1 |
| 2.01 - 2.20 | 3 | 122,500,000 | 12.0 |
| 2.21 - 5.05 | 21 | 525,246,154 | 51.4 |
| Total: | 51 | $1,021,169,362 | 100.0% |
| Min: 1.39x Max: 5.05x Wtd Avg: 2.40x | |||
UW NOI Debt Yield (%)
| No. of Mortgage Loans | Aggregate Cut-off Date Balance ($) | % of Pool | |
| 6.8 - 9.0 | 11 | 303,945,135 | 29.8% |
| 9.1 - 10.0 | 13 | 244,400,410 | 23.9% |
| 10.1 - 11.0 | 13 | 243,414,969 | 23.8% |
| 11.1 - 12.0 | 4 | 33,797,500 | 3.3 |
| 12.1 - 13.0 | 4 | 69,436,348 | 6.8 |
| 13.1 - 14.0 | 5 | 76,175,000 | 7.5 |
| 14.1 - 14.8 | 1 | 50,000,000 | 4.9 |
| Total: | 51 | $1,021,169,362 | 100.0% |
| Min: 6.8% Max: 14.8% Wtd Avg: 10.1% | |||
| (1) | All numerical information concerning the mortgage loans is approximate. All weighted average information regarding the mortgage loans reflects the weighting of the mortgage loans based on their outstanding principal balances as of the Cut-off Date. The sum of numbers and percentages in columns may not match the “Total” due to rounding. With respect to any mortgage loan that is part of a whole loan, unless otherwise indicated, all LTV, DSCR and Debt Yield calculations include any relatedpari passu companion loans and exclude any related subordinate companion loans, as applicable. |
| (2) | In the case of mortgage loans secured by multiple properties, Cut-off Date Balance information is based on allocated loan amounts with respect to such properties. |
| (3) | “California – Northern” includes zip codes above 93600, and “California – Southern” includes zip codes at or below 93600. |
| This is not a research report and was not prepared by any Underwriter’s research department. It was prepared by the Underwriters’ sales, trading, banking or other non-research personnel. Please see additional important information and qualifications at the end of this Term Sheet. |
24
(THIS PAGE INTENTIONALLY LEFT BLANK)
25
| Various | Loan #1 | Cut-off Date Balance: | $70,000,000 | |
| Various | GNL Office and Industrial Portfolio | Cut-off Date LTV: | 55.1% | |
| Various | U/W NCF DSCR: | 2.60x | ||
| U/W NOI Debt Yield: | 10.6% |
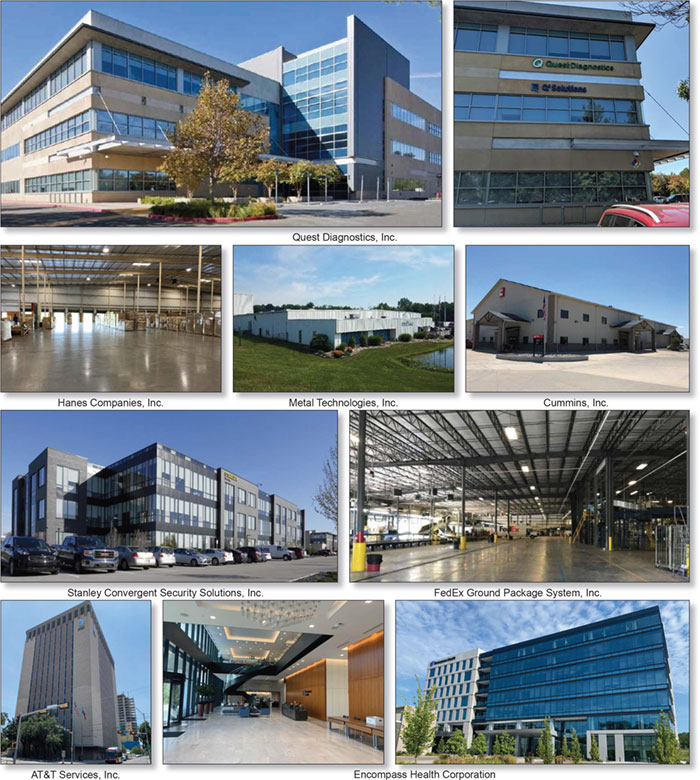
| This is not a research report and was not prepared by any Underwriter’s research department. It was prepared by the Underwriters’ sales, trading, banking or other non-research personnel. Please see additional important information and qualifications at the end of this Term Sheet. |
26
| Various | Loan #1 | Cut-off Date Balance: | $70,000,000 | |
| Various | GNL Office and Industrial Portfolio | Cut-off Date LTV: | 55.1% | |
| Various | U/W NCF DSCR: | 2.60x | ||
| U/W NOI Debt Yield: | 10.6% |

| This is not a research report and was not prepared by any Underwriter’s research department. It was prepared by the Underwriters’ sales, trading, banking or other non-research personnel. Please see additional important information and qualifications at the end of this Term Sheet. |
27
| Mortgage Loan No. 1 – GNL Office and Industrial Portfolio |
| Mortgage Loan Information | Property Information | ||||||
| Mortgage Loan Seller: | KeyBank | Single Asset/Portfolio: | Portfolio | ||||
| Credit Assessment (KBRA/Fitch/S&P): | NR/NR/NR | Location: | Various | ||||
| Original Balance(1): | $70,000,000 | General Property Type: | Various | ||||
| Cut-off Date Balance(1): | $70,000,000 | Detailed Property Type: | Various | ||||
| % of Initial Pool Balance: | 6.9% | Title Vesting: | Fee | ||||
| Loan Purpose: | Refinance | Year Built/Renovated: | Various/Various | ||||
| Sponsor: | Global Net Lease Operating Partnership, L.P. | Size: | 2,195,042 SF | ||||
| Guarantor: | Global Net Lease Operating Partnership, L.P. | Cut-off Date Balance per SF(1): | $93 | ||||
| Mortgage Rate: | 3.6500% | Maturity Date Balance per SF(1): | $93 | ||||
| Note Date: | 9/12/2019 | Property Managers: | Global Net Lease Properties, LLC | ||||
| First Payment Date: | 11/1/2019 | (borrower-related); | |||||
| Maturity Date: | 10/1/2029 | Cushman & Wakefield U.S., Inc. | |||||
| Original Term to Maturity: | 120 months | ||||||
| Original Amortization Term: | 0 months | Underwriting and Financial Information | |||||
| IO Period: | 120 months | UW NOI: | $21,583,336 | ||||
| Seasoning: | 1 month | UW NOI Debt Yield(1): | 10.6% | ||||
| Prepayment Provisions: | LO (25); YM1 (91); O (4) | UW NOI Debt Yield at Maturity(1): | 10.6% | ||||
| Lockbox/Cash Mgmt Status: | Hard/Springing | UW NCF DSCR(1): | 2.60x | ||||
| Additional Debt Type(1)(2): | Pari Passu | Most Recent NOI(4): | N/A | ||||
| Additional Debt Balance(1)(2): | $134,000,000 | 2nd Most Recent NOI(4): | N/A | ||||
| Future Debt Permitted (Type): | No (N/A) | 3rd Most Recent NOI(4): | N/A | ||||
| Reserves(3) | Most Recent Occupancy: | 100.0% (11/1/2019) | |||||
| Type | Initial | Monthly | Cap | 2nd Most Recent Occupancy(5): | 100.0% (12/31/2018) | ||
| RE Tax: | $0 | Springing | N/A | 3rd Most Recent Occupancy(5): | 100.0% (12/31/2017) | ||
| Insurance: | $0 | Springing | N/A | Appraised Value (as of)(6): | $370,310,000 (9/12/2019) | ||
| Recurring Replacements: | $0 | Springing | N/A | Appraised Value per SF(6): | $169 | ||
| TI/LC: | $0 | Springing | $6,000,000 | Cut-off Date LTV Ratio(1)(6): | 55.1% | ||
| Deferred Maintenance: | $320,700 | $0 | N/A | Maturity Date LTV Ratio(1)(6): | 55.1% | ||
| Major Tenant Reserve: | $0 | Springing | Various | ||||
| Sources and Uses | ||||||
| Sources | Proceeds | % of Total | Uses | Proceeds | % of Total | |
| Whole Loan Amount(1): | $204,000,000 | 100.0% | Return of Equity(7): | $114,602,556 | 56.2% | |
| Loan Payoff(8): | $86,542,124 | 42.4% | ||||
| Closing Costs: | $2,534,621 | 1.2% | ||||
| Reserves: | $320,700 | 0.2% | ||||
| Total Sources: | $204,000,000 | 100.0% | Total Uses: | $204,000,000 | 100.0% | |
| (1) | The GNL Office and Industrial Portfolio Mortgage Loan (as defined below) is part of the GNL Office and Industrial Portfolio Whole Loan (as defined below), which is comprised of eightpari passu promissory notes with an aggregate original principal balance of $204,000,000. The Cut-off Date Balance per SF, Maturity Date Balance per SF, UW NOI Debt Yield, UW NOI Debt Yield at Maturity, UW NCF DSCR, Cut-off Date LTV Ratio and Maturity Date LTV Ratio numbers presented above are based on the aggregate principal balance of the promissory notes comprising the GNL Office and Industrial Portfolio Whole Loan. |
| (2) | See “The Mortgage Loan” and “Additional Secured Indebtedness (not including trade debts)” below for a discussion of additional debt. |
| (3) | See “Escrows and Reserves” below for further discussion of reserve requirements. |
| (4) | Historical NOI is unavailable due to the GNL Office and Industrial Portfolio Properties (as defined below) all being leased to single tenants, each on a triple net basis. In addition, nine of the GNL Office and Industrial Portfolio Properties were acquired in 2019. |
| (5) | The following properties were excluded from occupancy figures prior to the respective years of construction: Stanley Convergent Security Solutions, Inc. (2017), Encompass Health Corporation (2018), and ComDoc, Inc. (2019). The following properties were excluded from occupancy figures prior to the current lease start dates due to the sellers not providing occupancy history: Heatcraft Refrigeration Products, LLC (June 2018), Hanes Companies, Inc. (September 2018), UP Central Leasing LLC (April 2019), and Metal Technologies, Inc. (June 2019). |
| (6) | The appraisal provided a bulk portfolio value for the GNL Office and Industrial Portfolio Properties of $370,310,000, which includes a portfolio premium of approximately 1.5% over the aggregate “as is” appraised values for the individual GNL Office and Industrial Portfolio Properties. The aggregate “as is” appraised values for the individual GNL Office and Industrial Portfolio Properties is $364,710,000, which results in a Cut-off Date LTV Ratio and a Maturity Date LTV Ratio of 55.9% and 55.9%, respectively. |
| (7) | The borrower sponsor acquired nine of the GNL Office and Industrial Portfolio Properties between March and June 2019 for $178.1 million. |
| (8) | Loan Payoff represents two loans encumbering the Quest Property (as defined below) and the AT&T Property (as defined below) with payoff amounts of approximately $52.8 million and $33.7 million, respectively. |
| This is not a research report and was not prepared by any Underwriter’s research department. It was prepared by the Underwriters’ sales, trading, banking or other non-research personnel. Please see additional important information and qualifications at the end of this Term Sheet. |
28
| Various | Loan #1 | Cut-off Date Balance: | $70,000,000 | |
| Various | GNL Office and Industrial Portfolio | Cut-off Date LTV: | 55.1% | |
| Various | U/W NCF DSCR: | 2.60x | ||
| U/W NOI Debt Yield: | 10.6% |
The Mortgage Loan. The largest mortgage loan (the “GNL Office and Industrial Portfolio Mortgage Loan”) is part of a whole loan (the “GNL Office and Industrial Portfolio Whole Loan”) evidenced by eightpari passu promissory notes in the aggregate original principal amount of $204,000,000. The GNL Office and Industrial Portfolio Whole Loan is secured by the fee interests in a portfolio of 12 office and industrial properties, totaling 2,195,042 SF located in 10 states (the “GNL Office and Industrial Portfolio Properties”). The non-controlling Note A-3, Note A-5 and Note A-6, in the aggregate original principal amount of $70,000,000, represent the GNL Office and Industrial Portfolio Mortgage Loan and will be included in the MSC 2019-L3 securitization transaction. A summary of the remaining promissory notes (the “GNL Office and Industrial Portfolio Non-ServicedPari Passu Companion Loans”) is shown in the table below. The GNL Office and Industrial Portfolio Whole Loan is serviced pursuant to the pooling and servicing agreement for the CF 2019-CF2 securitization transaction. See “Description of the Mortgage Pool—The Whole Loans—The Non-Serviced Pari Passu Whole Loans” and“Pooling and Servicing Agreement—Servicing of the Non-Serviced Mortgage Loans” in the Preliminary Prospectus.
| GNL Office and Industrial Portfolio Whole Loan Summary | ||||
Notes | Original Balance | Cut-off Date Balance | Anticipated Note Holder | Controlling Piece |
| A-1 | $60,000,000 | $60,000,000 | CF 2019-CF2 | Yes |
| A-2 | $50,000,000 | $50,000,000 | BBCMS 2019-C5(1) | No |
| A-3 | $50,000,000 | $50,000,000 | MSC 2019-L3 | No |
| A-4 | $11,000,000 | $11,000,000 | BBCMS 2019-C5(1) | No |
| A-5 | $10,000,000 | $10,000,000 | MSC 2019-L3 | No |
| A-6 | $10,000,000 | $10,000,000 | MSC 2019-L3 | No |
| A-7 | $8,000,000 | $8,000,000 | CF 2019-CF2 | No |
| A-8 | $5,000,000 | $5,000,000 | BBCMS 2019-C5(1) | No |
| Total | $204,000,000 | $204,000,000 | ||
| (1) | Anticipated to be contributed to the BBCMS 2019-C5 securitization upon the closing of such transaction. |
The Borrowers and the Borrower Sponsor. The borrowers are ARG CMGLTWY001, LLC, ARG SSFSRIN001, LLC, ARG EQWBGPA001, LLC, ARG HCCLHGA001, LLC, ARG UPDBNMI001, LLC, ARG CDNCNOH001, LLC, ARG MT2PKSLB001, LLC, ARG HRTFTGA001, LLC, ARC FELKCLA001, LLC, ARG EHBIRAL001, LLC, ARC ATSNTTX001, LLC and ARC SLSTCCA001, LLC (individually and collectively, the “GNL Office and Industrial Portfolio Borrowers”), each a Delaware limited liability company structured to be bankruptcy-remote with at least two independent directors.
The borrower sponsor and nonrecourse carve-out guarantor is Global Net Lease Operating Partnership, L.P., a Delaware limited partnership and the business operations entity of Global Net Lease, Inc. (NYSE: GNL) (“GNL”). Founded in 2011, GNL is a publicly traded real estate investment trust focused on acquiring a diversified global portfolio of commercial properties, with an emphasis on sale-leaseback transactions involving single tenant, mission critical, income producing net-lease assets across the United States and western and northern Europe. As of June 30, 2019, GNL owned a portfolio of 288 properties totaling approximately 28.3 million SF. GNL is an affiliate of AR Global Investments, LLC, which has raised and invested over $30.0 billion in capital, served over 150,000 shareholders and grown to one of the largest external managers of direct investment programs in the United States. See “Description of the Mortgage Pool—Litigation and Other Considerations” in the Preliminary Prospectus.
The Properties.The GNL Office and Industrial Portfolio Properties are comprised of 12 single-tenant office and industrial properties with an aggregate of approximately 2.2 million SF. The borrower sponsor acquired the GNL Office and Industrial Portfolio Properties in separate transactions, with three purchased in 2014 and nine purchased in 2019, for a total cost basis of approximately $344.6 million and resulting in a loan-to-cost ratio of 59.2%.
The GNL Office and Industrial Portfolio Properties are each 100.0% leased to a single tenant with a weighted average remaining lease term across the 12 leases of approximately 9.0 years. Approximately 79.3% of the NRA is leased to publicly traded entities (or subsidiaries of publicly traded entities) and 65.3% of NRA is leased to investment grade tenants (or subsidiaries of investment grade tenants). The GNL Office and Industrial Portfolio Properties are geographically diverse, with properties located in 10 different states and 12 different markets. Additionally, the tenants operate in a wide range of industries, including automotive parts, security systems, natural gas, fabrics, logistics, imaging solutions, technology, refrigeration and freight.
| This is not a research report and was not prepared by any Underwriter’s research department. It was prepared by the Underwriters’ sales, trading, banking or other non-research personnel. Please see additional important information and qualifications at the end of this Term Sheet. |
29
| Various | Loan #1 | Cut-off Date Balance: | $70,000,000 | |
| Various | GNL Office and Industrial Portfolio | Cut-off Date LTV: | 55.1% | |
| Various | U/W NCF DSCR: | 2.60x | ||
| U/W NOI Debt Yield: | 10.6% |
The following table presents detailed information with respect to each of the GNL Office and Industrial Portfolio Properties.
| GNL Office and Industrial Portfolio Properties Summary | ||||||||
Property Name / Tenant Location | Property Type - Subtype | SF | % Office | Year Built / Renovated | Allocated Whole Loan Amount (“ALA”) | % of ALA | Appraised Value(1) | UW NOI |
| Quest Diagnostics, Inc. 27027 Tourney Road Santa Clarita, CA 91355 | Office - R&D Lab | 222,193 | 40% | 2004 / N/A | $55,851,188 | 27.4% | $103,300,000 | $5,662,397 |
| Encompass Health Corporation 9001 Liberty Parkway Birmingham, AL 35242 | Office - Suburban | 199,305 | 100% | 2018 / N/A | $41,078,918 | 20.1% | $76,900,000 | $4,173,562 |
| AT&T Services, Inc. 1010 North Saint Mary’s Street San Antonio, TX 78215 | Office - CBD | 401,516 | 100% | 1961 / N/A | $37,518,154 | 18.4% | $70,600,000 | $4,249,709 |
| UP Central Leasing LLC 4343 Wyoming Avenue Dearborn, MI 48126 | Industrial - Manufacturing | 220,000 | 6% | 1959 / 2016 | $10,706,026 | 5.2% | $16,800,000 | $1,130,998 |
| ComDoc, Inc. 8247 Pittsburg Avenue Northwest North Canton, OH 44720 | Industrial - Manufacturing | 107,500 | 30% | 2019 / N/A | $10,244,355 | 5.0% | $17,700,000 | $1,114,989 |
| Stanley Convergent Security Solutions, Inc. 8350 Sunlight Drive Fishers, IN 46037 | Office - Suburban | 80,000 | 100% | 2017 / N/A | $10,130,329 | 5.0% | $16,400,000 | $1,114,774 |
| EQT Gathering, LLC 317 East Roy Furman Highway Waynesburg, PA 15370 | Industrial - Warehouse/Distribution | 127,135 | 9% | 1985 / N/A | $8,412,095 | 4.1% | $13,700,000 | $928,401 |
| Metal Technologies, Inc. 909 East State Road 54 Bloomfield, IN 47424 | Industrial - Manufacturing | 234,377 | 2% | 1986 / N/A | $7,020,275 | 3.4% | $10,810,000 | $744,837 |
| Heatcraft Refrigeration Products, LLC 7814 Magnolia Industrial Boulevard Tifton, GA 31794 | Industrial - Warehouse/Distribution | 214,757 | 2% | 1992 / 2000 | $6,942,258 | 3.4% | $11,500,000 | $758,153 |
| Hanes Companies, Inc. 200 Union Grove Road Calhoun, GA 30701 | Industrial - Warehouse/Distribution | 275,500 | 2% | 2000 / 2007 | $6,164,179 | 3.0% | $10,100,000 | $656,286 |
| FedEx Ground Package System, Inc. 6013 Horsemans Drive Lake Charles, LA 70615 | Industrial - Warehouse/Distribution | 76,039 | 2% | 2009 / 2014 | $5,723,227 | 2.8% | $9,800,000 | $618,177 |
| Cummins, Inc. 2600 East 2nd Street Gillette, WY 82718 | Industrial - Manufacturing | 36,720 | 25% | 2008 / N/A | $4,208,996 | 2.1% | $7,100,000 | $431,053 |
| Total/Wtd. Avg. | 2,195,042 | 39% | $204,000,000 | 100.0% | $370,310,000 | $21,583,336 | ||
| (1) | The Total Appraised Value of $370,310,000 reflects an approximately 1.5% portfolio premium attributed to the aggregate “as-is” appraised value of the individual GNL Office and Industrial Portfolio Properties. The sum of the appraised values of each of the GNL Office and Industrial Portfolio Properties on an individual basis, which are reflected in the table above, is $364,710,000. |
Quest Diagnostics, Inc. (222,193 SF; 27.4% of ALA; 10.1% of NRA; 26.9% of UW Base Rent). The property consists of a four-story office and laboratory/R&D building constructed in 2004 (the “Quest Property”). The Quest Property is 100.0% occupied by Specialty Laboratories, Inc., a subsidiary of Quest Diagnostics, Inc. (NYSE: DGX) (rated BBB/Baa2/BBB+ by Fitch/Moody’s/S&P) (“Quest”), and is comprised of 60% laboratory space and 40% office space. The Quest Property was constructed as a build-to-suit for Specialty Laboratories, Inc., which occupies the space on an approximately 20-year lease that expires in August 2024 and is guaranteed by Quest. The lease contains two, five-year renewal options, followed by one, 4.5-year renewal option. The lease does not provide any early termination or contraction options, but does provide an expansion option as detailed under “Release of Property” below.
The Quest Property is located in Santa Clarita, Los Angeles County, California within the Los Angeles-Long Beach-Anaheim, CA metropolitan statistical area. Santa Clarita had a 2018 population of approximately 216,589, making it the third largest city in the county. The Quest Property’s neighborhood is served by Interstate 5, which is located to the immediate west and provides access to downtown Los Angeles approximately 25 miles to the southeast of the Quest Property. The Los Angeles International Airport is located approximately 35 miles south of Santa Clarita. Land uses in the immediate area consist of a country club and golf course adjacent to the Quest Property as well as office, retail and industrial uses, with single and multi-family removed from major arterials.
Quest is a global provider of diagnostic testing, information and services for patients, healthcare providers, and pharmaceutical companies, life insurance companies and employers. The primary services offered by Quest include diagnostic testing, clinical trials testing, healthcare information technology, and wellness and risk management. Headquartered in Secaucus, New Jersey, Quest operates approximately 2,200 patient locations and dozens of clinical laboratories throughout the United States, with additional international laboratory facilities. Quest reported 2018 revenues in excess of $7.5 billion. With 60% of the building utilized as laboratory space, specialized testing and clinical trials are among the operations performed at the Quest Property.
Encompass Health Corporation (199,305 SF; 20.1% of ALA; 9.1% of NRA; 19.8% of UW Base Rent). The property is a seven-story, Class A, single-tenant office building that was constructed on 6.88 acres as a build-to-suit in 2018 (the “Encompass Property”). The Encompass Property serves as the corporate headquarters for Encompass Health Corporation (NYSE: EHC) (rated B1/BB- by Moody’s/S&P) (“Encompass”). Amenities at the newly constructed building include large training and conference rooms, cafeteria and dining room, fitness center, and break areas on each floor. A three-story parking garage is located on the south side of the Encompass Property, providing approximately 700 parking spaces. Encompass occupies 100.0% of
| This is not a research report and was not prepared by any Underwriter’s research department. It was prepared by the Underwriters’ sales, trading, banking or other non-research personnel. Please see additional important information and qualifications at the end of this Term Sheet. |
30
| Various | Loan #1 | Cut-off Date Balance: | $70,000,000 | |
| Various | GNL Office and Industrial Portfolio | Cut-off Date LTV: | 55.1% | |
| Various | U/W NCF DSCR: | 2.60x | ||
| U/W NOI Debt Yield: | 10.6% |
the net rentable area via a 15-year lease expiring in March 2033, with 1.5% annual rent increases and four, five-year renewal options. The lease does not provide any early termination or contraction options.
The Encompass Property is located in Birmingham, Alabama, in the north-central portion of the state, approximately 101 miles northwest of Montgomery and 158 miles west of Atlanta, Georgia. Birmingham has a diversified economy with prominent sectors including healthcare, finance, education and service industries. In addition to Encompass, other major companies headquartered in the area include Books-A-Million and Regions Financial. Interstate 459 is adjacent to the Encompass Property and can be accessed within one mile. The Encompass Property is located along the main corridor of Liberty Park, a 4,000-acre master-planned community with residential, office, and retail uses. Liberty Parkway, which was expanded from two to four lanes to accommodate local growth, serves as the entrance into an area known as Urban Center, which is home to the Encompass Property as well as many other office buildings. The Urban Center is surrounded by residential and commercial uses that serve as demand generators and amenities for the large office presence.
Encompass is a provider of facility-based and home-based post-acute healthcare services, offered in 37 states and Puerto Rico through its network of inpatient rehabilitation hospitals, home health agencies, and hospice agencies. Encompass has over 40,000 employees and reported 2018 revenues of approximately $4.3 billion. Encompass’ footprint includes 132 hospitals, 245 home health locations, and 82 hospice locations.
AT&T Services, Inc. (401,516 SF; 18.4% of ALA; 18.3% of NRA; 19.4% of UW Base Rent). The property consists of one, 16-story office building constructed in 1961 with extensive renovations and upgrades completed throughout AT&T Services, Inc.’s tenancy (the “AT&T Property”). The building features typical office finishes, including private offices, conference and meeting rooms, and break rooms, as well as a cafeteria on the second floor. The AT&T Property contains 405 parking spaces, the majority of which are located in an adjacent surface parking lot and a smaller portion in a covered garage. AT&T Services, Inc. occupies 100.0% of the net rentable area on an absolute triple net lease through July 2026, with 2.0% annual rent increases and three, five-year renewal options. The lease does not provide any early termination or contraction options.
Located on 3.76 acres, the AT&T Property is located in downtown San Antonio, Texas, within the San Antonio-New Braunfels metropolitan statistical area, which is the third largest metropolitan area in the state of Texas with a population of approximately 2.5 million as of 2018. The San Antonio economy is driven by a diverse mix of industries including tourism, military and defense, biosciences, manufacturing, aerospace, and education and healthcare services. Tourism and hospitality in particular benefit from attractions such as the Alamo, Sea World, Six Flags Fiesta Texas, and the San Antonio River Walk, a public park of walkways along the banks of the San Antonio River that is lined with restaurants, shops, hotels, bars, and other attractions. The AT&T Property is situated within two miles of three interstate highways, including Interstates 37, 35, and 10, and has frontage along the River Walk and the primary arterial of North St. Mary’s Street. The immediately surrounding area predominantly consists of office and retail properties along major arterials.
AT&T Services, Inc. is a subsidiary of AT&T Inc. (NYSE: T) (rated A-/Baa2/BBB by Fitch/Moody’s/S&P) (“AT&T”), a telecommunications, media and technology services company headquartered in Dallas, Texas. AT&T operates through four distinct business units, AT&T Communications, WarnerMedia, AT&T Latin America, and Xandr, and together the four units are focused on premium video content, direct-to-consumer relationships, high-speed networks, and advertising technology.
UP Central Leasing LLC (220,000 SF; 5.2% of ALA; 10.0% of NRA; 5.2% of UW Base Rent).The property consists of four, two-story industrial manufacturing buildings constructed in 1959 on 19.20 acres, with renovations completed in 2016 (the “UP Central Property”). The buildings have clear ceiling heights between 33 and 36 feet and a total of six dock high loading doors and three doors at grade level. UP Central Leasing LLC (“UP Central”) occupies 100.0% of the net rentable area on a 10-year triple net lease through March 2029. The lease provides two, five-year renewal options and no early termination or contraction options. UP Central is owned by Chicago-based UPG Enterprises LLC (formerly Union Partners I LLC), an operator of metals and logistics companies, including Maksteel, which operates out of the UP Central Property. Maksteel is a provider of purchasing, gauging, leveling, cutting and storage of steel pipe, tube and rolled steel.
The UP Central Property is located in Dearborn, Michigan, five miles west of the Detroit central business district. Dearborn is home to the Ford Motor Company world headquarters and has an economy largely supported by the manufacturing and healthcare sectors. The UP Central Property is situated in a heavily industrial neighborhood and has rail access to the active CSX line, which connects to other rail lines throughout the United States. Three major freeways are located within three miles of the UP Central Property and the Detroit Metropolitan Wayne County Airport is located six miles to the southwest.
ComDoc, Inc. (107,500 SF; 5.0% of ALA; 4.9% of NRA; 4.9% of UW Base Rent).The property consists of a single-story light manufacturing building with 30% office build-out that was constructed in 2019 on 13.43 acres (the “ComDoc Property”). The building has 35-foot clear ceiling heights and a total of 15 dock high loading doors and three doors at grade level. ComDoc, Inc., a subsidiary of Xerox Holdings Corporation (NYSE: XRX), occupies 100.0% of the net rentable area on a 10-year triple net lease through April 2029. The lease provides 1.5% annual rent increases, four, five-year renewal options and no early termination or contraction options. Xerox Holdings Corporation, through its wholly owned subsidiary Xerox Corporation (rated BB/Ba1/BB+ by Fitch/Moody’s/S&P), is a provider of print technology and intelligent work solutions. The ComDoc Property serves as the corporate headquarters for ComDoc, Inc., which is a document imaging company that offers document management, mobile and cloud solutions, printing and production services, and document imaging devices and technology.
The ComDoc Property is located in North Canton, Ohio, approximately 18 miles southeast of Akron and 51 miles south of Cleveland. North Canton is a suburban community of the Canton metropolitan area, which has an economy based on the healthcare, education, accommodation/food services, and wholesale/retail trade industries. The ComDoc Property is situated in a largely industrial area and has access to Interstate 77 within one mile.
| This is not a research report and was not prepared by any Underwriter’s research department. It was prepared by the Underwriters’ sales, trading, banking or other non-research personnel. Please see additional important information and qualifications at the end of this Term Sheet. |
31
| Various | Loan #1 | Cut-off Date Balance: | $70,000,000 | |
| Various | GNL Office and Industrial Portfolio | Cut-off Date LTV: | 55.1% | |
| Various | U/W NCF DSCR: | 2.60x | ||
| U/W NOI Debt Yield: | 10.6% |
The following table presents certain information relating to the leases at the GNL Office and Industrial Portfolio Properties:
| Tenant Summary(1) | |||||||||
| Tenant Name | Credit Rating (S&P/Moody’s/Fitch)(2) | Tenant SF | Approx. % of Total SF | Annual UW Rent | % of Total Annual UW Rent | Annual UW Rent PSF | Lease Expiration | Renewal Options | Term. Options (Y/N) |
| AT&T Services, Inc. | BBB/Baa2/A- | 401,516 | 18.3% | $4,753,929 | 19.4% | $11.84 | 7/17/2026 | 3 x 5 Yrs | N |
| Hanes Companies, Inc. | BBB/Baa1/NA | 275,500 | 12.6% | $728,346 | 3.0% | $2.64 | 9/30/2028 | 4 x 5 Yrs | N |
| Metal Technologies, Inc. | NA / NA / NA | 234,377 | 10.7% | $841,943 | 3.4% | $3.59 | 6/30/2033 | 4 x 5 Yrs | N |
| Quest Diagnostics, Inc. | BBB+/Baa2/BBB | 222,193 | 10.1% | $6,599,251 | 26.9% | $29.70 | 8/31/2024 | 3 x 4.5-5 Yrs(3) | N |
| UP Central Leasing LLC | NA / NA / NA | 220,000 | 10.0% | $1,265,000 | 5.2% | $5.75 | 3/31/2029 | 2 x 5 Yrs | N |
| Heatcraft Refrigeration Products, LLC | BBB/Baa3/NA | 214,757 | 9.8% | $839,482 | 3.4% | $3.91 | 5/31/2028 | 1 x 5 Yrs | N |
| Encompass Health Corporation | BB-/B1/NA | 199,305 | 9.1% | $4,853,793 | 19.8% | $24.35 | 3/30/2033 | 4 x 5 Yrs | N |
| Subtotal/Wtd. Avg. | 1,767,648 | 80.5% | $19,881,742 | 81.1% | $11.25 | ||||
| Other Tenants | 427,394 | 19.5% | $4,626,215 | 18.9% | $10.82 | ||||
| Vacant Space | 0 | 0.0% | $0 | 0.0% | $0.00 | ||||
| Total/Wtd. Avg. | 2,195,042 | 100.0% | $24,507,957 | 100.0% | $11.17 | ||||
| (1) | Information is based on the underwritten rent roll. |
| (2) | Certain ratings are those of the parent company whether or not the parent guarantees the lease. |
| (3) | The Quest lease contains two, five-year renewal options, followed by one, 4.5-year renewal. |
The following table presents certain information relating to the lease rollover schedule at the GNL Office and Industrial Portfolio Properties:
| Lease Rollover Schedule(1) | ||||||||
| Year | # of Leases Rolling | SF Rolling | Annual UW Base Rent PSF Rolling | Approx. % of Total SF Rolling | Approx. Cumulative % of SF Rolling | Total UW Base Rent Rolling | Approx. % of Total Rent Rolling | Approx. Cumulative % of Total Rent Rolling |
| MTM | 0 | 0 | $0.00 | 0.0% | 0.0% | $0 | 0.0% | 0.0% |
| 2019 | 0 | 0 | $0.00 | 0.0% | 0.0% | $0 | 0.0% | 0.0% |
| 2020 | 0 | 0 | $0.00 | 0.0% | 0.0% | $0 | 0.0% | 0.0% |
| 2021 | 0 | 0 | $0.00 | 0.0% | 0.0% | $0 | 0.0% | 0.0% |
| 2022 | 0 | 0 | $0.00 | 0.0% | 0.0% | $0 | 0.0% | 0.0% |
| 2023 | 0 | 0 | $0.00 | 0.0% | 0.0% | $0 | 0.0% | 0.0% |
| 2024 | 2 | 298,232 | $24.40 | 13.6% | 13.6% | $7,275,495 | 29.7% | 29.7% |
| 2025 | 0 | 0 | $0.00 | 0.0% | 13.6% | $0 | 0.0% | 29.7% |
| 2026 | 1 | 401,516 | $11.84 | 18.3% | 31.9% | $4,753,929 | 19.4% | 49.1% |
| 2027 | 0 | 0 | $0.00 | 0.0% | 31.9% | $0 | 0.0% | 49.1% |
| 2028 | 4 | 606,977 | $5.41 | 27.7% | 59.5% | $3,283,333 | 13.4% | 62.5% |
| 2029 | 2 | 327,500 | $7.56 | 14.9% | 74.5% | $2,475,450 | 10.1% | 72.6% |
| 2030 & Beyond | 3 | 560,817 | $11.98 | 25.5% | 100.0% | $6,719,750 | 27.4% | 100.0% |
| Vacant | 0 | 0 | $0.00 | 0.0% | 100.0% | $0 | 0.0% | 100.0% |
| Total/Wtd. Avg. | 12 | 2,195,042 | $11.17 | 100.0% | $24,507,957 | 100.0% | ||
| (1) | Information is based on the underwritten rent roll. |
The Markets. The GNL Office and Industrial Portfolio Properties are located across 12 separate markets. The top three properties, which generate 66.1% of the GNL Office and Industrial Portfolio underwritten base rent, consist of the Quest Property (26.9%), the Encompass Property (19.8%), and the AT&T Property (19.4%). These three properties are located in the Los Angeles, California, Birmingham, Alabama, and San Antonio, Texas markets, respectively.
According to a third-party market research report, as of the second quarter of 2019, the Los Angeles office market consisted of approximately 419.1 million SF of office space with an overall market vacancy of 9.7% and average asking rents of approximately $39.88 per SF. The Santa Clarita Valley office submarket totaled approximately 4.9 million SF with an average vacancy of 7.8% and average market asking rents of $36.70 per SF.
According to a third-party market research report, as of the second quarter of 2019, the Birmingham office market consisted of approximately 56.5 million SF of office space with an overall market vacancy of 10.3% and average asking rents of approximately $19.63 per SF. The Hwy 280/Jefferson County office submarket totaled approximately 5.5 million SF with an average vacancy of 7.4% and average market asking rents of $23.23 per SF.
According to a third-party market research report, as of the second quarter of 2019, the San Antonio office market consisted of approximately 82.1 million SF of office space with an overall market vacancy of 9.5% and average asking rents of approximately $25.99 per SF. The CBD office submarket totaled approximately 9.9 million SF with an average vacancy of 8.7% and average market asking rents of $25.41 per SF.
| This is not a research report and was not prepared by any Underwriter’s research department. It was prepared by the Underwriters’ sales, trading, banking or other non-research personnel. Please see additional important information and qualifications at the end of this Term Sheet. |
32
| Various | Loan #1 | Cut-off Date Balance: | $70,000,000 | |
| Various | GNL Office and Industrial Portfolio | Cut-off Date LTV: | 55.1% | |
| Various | U/W NCF DSCR: | 2.60x | ||
| U/W NOI Debt Yield: | 10.6% |
| GNL Office and Industrial Portfolio 2019 Demographic Summary | ||||||||
| Property Name / Tenant | City, State | 1-mile Population | 3-mile Population | 5-mile Population | 1-mile Median Household Income | 3-mile Median Household Income | 5-mile Median Household Income | |
| Quest Diagnostics, Inc. | Santa Clarita, CA | 7,052 | 86,624 | 174,556 | $110,520 | $108,659 | $108,990 | |
| Encompass Health Corporation | Birmingham, AL | 1,738 | 29,720 | 100,488 | $81,871 | $94,104 | $81,195 | |
| AT&T Services, Inc. | San Antonio, TX | 13,278 | 144,291 | 382,062 | $31,601 | $30,875 | $34,325 | |
| UP Central Leasing LLC | Dearborn, MI | 7,978 | 133,534 | 312,228 | $28,650 | $32,849 | $32,320 | |
| ComDoc, Inc. | North Canton, OH | 2,302 | 33,733 | 94,450 | $70,146 | $67,216 | $69,021 | |
| Stanley Convergent Security Solutions, Inc. | Fishers, IN | 5,769 | 61,134 | 173,980 | $94,145 | $87,034 | $92,954 | |
| EQT Gathering, LLC | Waynesburg, PA | 2,712 | 9,923 | 13,851 | $78,582 | $48,283 | $49,039 | |
| Metal Technologies, Inc. | Bloomfield, IN | 1,349 | 4,132 | 5,777 | $40,498 | $47,216 | $50,893 | |
| Heatcraft Refrigeration Products, LLC | Tifton, GA | 104 | 9,716 | 25,399 | $45,036 | $29,357 | $35,252 | |
| Hanes Companies, Inc. | Calhoun, GA | 949 | 8,377 | 29,292 | $55,220 | $46,484 | $43,968 | |
| FedEx Ground Package System, Inc. | Lake Charles, LA | 1,691 | 8,916 | 44,903 | $42,115 | $37,823 | $35,488 | |
| Cummins, Inc. | Gillette, WY | 2,067 | 20,899 | 37,595 | $66,361 | $67,022 | $76,553 | |
Source: Third-party market research reports.
Underwritten Net Cash Flow.The following table presents certain information relating to the Underwritten Net Cash Flow at the GNL Office and Industrial Portfolio Properties:
| Cash Flow Analysis(1) | ||
| UW | UW PSF | |
| Base Rent(2) | $23,941,469 | $10.91 |
| Straight-lined Rent(3) | $566,488 | $0.26 |
| Reimbursements | $7,808,359 | $3.56 |
| Other Income | $0 | $0.00 |
| Vacancy | ($2,228,647) | ($1.02) |
| Effective Gross Income | $30,087,669 | $13.71 |
| Real Estate Taxes | $4,180,774 | $1.90 |
| Insurance | $326,025 | $0.15 |
| Other Expenses | $3,997,534 | $1.82 |
| Total Operating Expenses | $8,504,333 | $3.87 |
| Net Operating Income | $21,583,336 | $9.83 |
| TI/LC | $1,536,057 | $0.70 |
| Capital Expenditures | $410,771 | $0.19 |
| Net Cash Flow | $19,636,508 | $8.95 |
| Occupancy %(4) | 93.1% | |
| NOI DSCR(5) | 2.86x | |
| NCF DSCR(5) | 2.60x | |
| NOI Debt Yield(5) | 10.6% | |
| NCF Debt Yield(5) | 9.6% | |
| (1) | Historical cash flows are unavailable due to the GNL Office and Industrial Portfolio Properties all being leased to single tenants, each on a triple net basis. In addition, the majority of the GNL Office and Industrial Portfolio Properties were acquired in 2019. |
| (2) | UW Base Rent is based on the underwritten rent roll and includes rent increases through June 2020. |
| (3) | Straight-lined Rent represents the average contractual rent increases through the earlier of the loan term or the terms of the applicable leases for the investment grade tenants AT&T Services, Inc., EQT Gathering, LLC, Hanes Companies, Inc., Heatcraft Refrigeration Products, LLC, Stanley Convergent Security Solutions, Inc., and Cummins, Inc. |
| (4) | UW Occupancy is 93.1%. The GNL Office and Industrial Portfolio Properties are 100.0% leased as of November 1, 2019. |
| (5) | Debt service coverage ratios and debt yields are based on the GNL Office and Industrial Portfolio Whole Loan. |
| This is not a research report and was not prepared by any Underwriter’s research department. It was prepared by the Underwriters’ sales, trading, banking or other non-research personnel. Please see additional important information and qualifications at the end of this Term Sheet. |
33
| Various | Loan #1 | Cut-off Date Balance: | $70,000,000 | |
| Various | GNL Office and Industrial Portfolio | Cut-off Date LTV: | 55.1% | |
| Various | U/W NCF DSCR: | 2.60x | ||
| U/W NOI Debt Yield: | 10.6% |
Escrows and Reserves.
Real Estate Taxes - The GNL Office and Industrial Portfolio Borrowers are required to deposit into a real estate tax reserve, on a monthly basis, 1/12th of the estimated annual real estate taxes for each respective property; provided, such monthly deposits will be waived for each applicable property so long as (i) no event of default exists, (ii) each applicable lease is in full force and effect and requires the applicable tenant to pay taxes directly and such tenant pays all applicable taxes prior to the due date thereof, (iii) the GNL Office and Industrial Portfolio Borrowers have delivered to lender copies of all tax bills within 30 days of receipt and (iv) the lender has received reasonably satisfactory evidence that all applicable taxes have been paid as and when required pursuant to the mortgage loan documents with respect to the applicable property.
Insurance- The GNL Office and Industrial Portfolio Borrowers are required to deposit into an insurance reserve, on a monthly basis, 1/12 of estimated insurance premiums for each respective property; provided, such monthly deposits will be waived for each applicable property so long as (i) no event of default exists and (ii) the GNL Office and Industrial Portfolio Borrowers maintain a blanket insurance policy acceptable to the lender.
Deferred Maintenance - The GNL Office and Industrial Portfolio Borrowers deposited $320,700 for deferred maintenance at origination.
Recurring Replacements - During the continuance of a Cash Sweep Period (as defined below), the GNL Office and Industrial Portfolio Borrowers are required to deposit into a replacement reserve on a monthly basis, an amount equal to $0.20 multiplied by the then existing aggregate net leasable area of the GNL Office and Industrial Portfolio Properties, divided by 12, for replacements.
TI/LC Reserve - During the continuance of a Cash Sweep Period, the GNL Office and Industrial Portfolio Borrowers are required to deposit into a TI/LC reserve on a monthly basis, an amount equal to $1.00 multiplied by the then existing aggregate net leasable area of the GNL Office and Industrial Portfolio Properties, divided by 12, for tenant improvement and leasing commission obligations, subject to a cap of $6,000,000. In lieu of such monthly deposits, the GNL Office and Industrial Portfolio Borrowers will be allowed to deposit an unconditional irrevocable letter of credit in the amount set forth in the mortgage loan documents, and on every third payment date thereafter occurring during the existence of a Cash Sweep Period, the GNL Office and Industrial Portfolio Borrowers are required to cause such letter of credit to be increased by an amount equal to $1.00 multiplied by the then existing aggregate net leasable area of the applicable property, divided by four, up to a cap of $6,000,000.
Additionally, during the continuance of a Lease Rollover Event (as defined below), all excess cash flow will be deposited into the TI/LC reserve.
Major Tenant Reserve - During the continuance of a Major Tenant Cash Flow Sweep Event (as defined below), all excess cash flow will be deposited into a major tenant reserve.
Lockbox and Cash Management. The GNL Office and Industrial Portfolio Whole Loan is structured with a hard lockbox and springing cash management. The GNL Office and Industrial Portfolio Borrowers were required to send direction letters to all tenants instructing them to deposit all rents directly into a clearing account controlled by the lender. Notwithstanding the foregoing, the GNL Office and Industrial Portfolio Borrowers and the property managers are required to deposit all revenues otherwise received into the clearing account within two business days of receipt. Provided no Cash Sweep Period is in effect, all funds in the clearing account are required to be transferred on each business day to an account controlled by the GNL Office and Industrial Portfolio Borrowers. Upon the occurrence of a Cash Sweep Period, all sums on deposit in the clearing account are required to be transferred on each business day to a cash management account controlled by the lender and applied and disbursed in accordance with the mortgage loan documents, with any excess cash held by the lender as additional collateral for the GNL Office and Industrial Portfolio Whole Loan during the continuance of such Cash Sweep Period.
A “Cash Sweep Period” will commence upon:
| (i) | the occurrence of an event of default and will continue until such event of default is cured; |
| (ii) | the occurrence of any bankruptcy action of the GNL Office and Industrial Portfolio Borrowers (in no event will a Cash Sweep Period due to a bankruptcy of the GNL Office and Industrial Portfolio Borrowers be cured); |
| (iii) | the occurrence of a Manager Sweep Event (as defined below) and will continue until cured; |
| (iv) | the date on which the interest-only debt service coverage ratio as calculated in the loan documents based on the trailing three-month period is less than 1.85x and will continue until such time as (a) the interest-only debt service coverage ratio for the immediately preceding three-month period is at least 2.00x for two consecutive calendar quarters (a “DSCR Cure”), (b) the GNL Office and Industrial Portfolio Borrowers have delivered a letter of credit in an amount initially equal to the amount of excess cash flow for the immediately preceding three-month period, with such amount recalculated and increased every three-month period thereafter, up to any applicable capped amount (the “DSCR/Tenant Cure – Letter of Credit”), or (c) the GNL Office and Industrial Portfolio Borrowers have completed a partial prepayment of the loan (including any prepayment consideration) to the extent required to achieve an interest-only debt service coverage ratio for the immediately preceding three-month period of 2.00x or greater; |
| (v) | the occurrence of a Major Tenant Cash Flow Sweep Event and will continue until cured; or |
| (vi) | the occurrence of a Lease Rollover Event and will continue until cured. |
A “Major Tenant Cash Flow Sweep Event” means the occurrence of (i) any bankruptcy action of Quest, AT&T Services, Inc. or Encompass, any successor or assign thereof as tenant under the respective lease, or any subsequent tenant under a replacement lease (each, a “Major Tenant”) or any person or entity that controls a Major Tenant (a “Major Tenant Parent”); (ii) the earlier to occur of (a) the date a Major Tenant gives notice of its intention to vacate or abandon substantially all of its premises, or go dark at the premises or (b) the date that a Major Tenant vacates, abandons, surrenders, or goes dark at substantially all of its applicable premises for five consecutive business days; (iii) the continuation of any default by a Major Tenant under its respective lease beyond any applicable notice and cure periods; or (iv) the earlier to occur of (a) the date of any early termination or cancellation of a Major Tenant lease or (b) the earlier to occur of the date (x) that is nine months prior to the then applicable expiration of the applicable Major Tenant lease or (y) on which notice for extension is due under the applicable lease.
| This is not a research report and was not prepared by any Underwriter’s research department. It was prepared by the Underwriters’ sales, trading, banking or other non-research personnel. Please see additional important information and qualifications at the end of this Term Sheet. |
34
| Various | Loan #1 | Cut-off Date Balance: | $70,000,000 | |
| Various | GNL Office and Industrial Portfolio | Cut-off Date LTV: | 55.1% | |
| Various | U/W NCF DSCR: | 2.60x | ||
| U/W NOI Debt Yield: | 10.6% |
A ”Lease Rollover Event” means the last day of the loan year immediately preceding any loan year during which one or more leases are scheduled to expire, which leases constitute or represent, in the aggregate, either (i) more than 20% of the total net rentable area of the GNL Office and Industrial Portfolio Properties or (ii) more than 20% of the total annual rents from all GNL Office and Industrial Portfolio Properties.
A Cash Sweep Period caused by a Major Tenant Cash Flow Sweep Event or a Lease Rollover Event will continue until, in general, (A) with respect to clause (i) of a Major Tenant Cash Flow Sweep Event, the applicable Major Tenant (or applicable Major Tenant Parent) is no longer the subject of a bankruptcy or similar proceeding and has satisfied all other conditions under the mortgage loan documents, (B) with respect to clause (ii) of a Major Tenant Cash Flow Sweep Event, the applicable Major Tenant has resumed operations in its Major Tenant premises and has satisfied all other requirements under the mortgage loan documents, (C) with respect to clause (iii) of a Major Tenant Cash Flow Sweep Event, the applicable Major Tenant has fully cured all applicable defaults under its lease, (D) with respect to clause (iv), the GNL Office and Industrial Portfolio Borrowers have provided acceptable evidence to the lender that the applicable Major Tenant has renewed the term of its lease pursuant to the terms set forth therein, (E) the applicable Major Tenant has been replaced with an acceptable replacement tenant under the mortgage loan documents, (F) with respect to clause (ii), the applicable Major Tenant has subleased its premises to an acceptable subtenant under the mortgage loan documents and all other conditions under the mortgage loan documents have been satisfied, (G) funds swept as a result of a Major Tenant Cash Flow Sweep Event have reached (1) $9,000,000 if related to the Quest Property, (2) $7,500,000 if related to the AT&T Property, (3) $7,150,000 if related to the Encompass Property, or (4) an amount equal to the sum of each applicable amount set forth in the preceding clauses, if related to more than one of the Quest Property, AT&T Property and Encompass Property, (H) the GNL Office and Industrial Portfolio Borrowers have delivered the DSCR/Tenant Cure – Letter of Credit, (I) the occurrence of a DSCR Cure, or (J) with respect to a Lease Rollover Event, one or more leases have been renewed pursuant to the terms set forth therein such that all leases set to expire during the applicable loan year then constitute or represent, in the aggregate, (x) 20% or less of the total net rentable area of the GNL Office and Industrial Portfolio Properties or (y) 20% or less of the total annual rents from all GNL Office and Industrial Portfolio Properties.
A “Manager Sweep Event” means (i) for a borrower affiliated manager, any bankruptcy action of the manager and (ii) for a manager that is not affiliated with the GNL Office and Industrial Portfolio Borrowers, (a) an involuntary bankruptcy petition or (b) the date which is 60 days after the occurrence of any other bankruptcy action of such manager unless the manager is replaced with a qualified manager within such 60 day period. In any case, a Manager Sweep Event will continue until the manager is replaced with a qualified manager under a replacement management agreement.
Additional Secured Indebtedness (not including trade debts). The GNL Office and Industrial Portfolio Properties also secure the GNL Office and Industrial Portfolio Non-ServicedPari Passu Companion Loans, which have an aggregate Cut-off Date principal balance of $134,000,000. The GNL Office and Industrial Portfolio Non-ServicedPari Passu Companion Loans accrue interest at the same rate as the GNL Office and Industrial Portfolio Mortgage Loan. The GNL Office and Industrial Portfolio Mortgage Loan is entitled to payments of interest and principal on a pro rata and pari passu basis with the GNL Office and Industrial Portfolio Non-ServicedPari Passu Companion Loans. The holders of the GNL Office and Industrial Portfolio Mortgage Loan and the GNL Office and Industrial Portfolio Non-ServicedPari Passu Companion Loans have entered into a co-lender agreement which sets forth the allocation of collections on the GNL Office and Industrial Portfolio Whole Loan. See “Description of the Mortgage Pool—The Whole Loans— The Non-Serviced Pari Passu Whole Loans” in the Preliminary Prospectus.
Mezzanine Loan and Preferred Equity. Not permitted.
Release of Property. At any time after November 1, 2021, and prior to the GNL Office and Industrial Portfolio Whole Loan maturity date, the GNL Office and Industrial Portfolio Borrowers may obtain the release of any of the GNL Office and Industrial Portfolio Properties,provided that, among other things, (i) no event of default has occurred and is continuing (other than an event of default which applies only to the property to be released), (ii) the GNL Office and Industrial Portfolio Borrowers prepay a portion of the GNL Office and Industrial Portfolio Whole Loan equal to 115% (or 120% if the property to be released is transferred to a borrower affiliate) of the allocated loan amount of the property being released (the “Release Amount”), (iii) the debt service coverage ratio for the remaining properties following the release based on the trailing 12 months is no less than the greater of (1) the interest-only debt service coverage ratio immediately preceding such release and (2) 2.65x, (iv) the debt yield for the remaining properties based on the trailing 12 months is no less than the greater of (1) the debt yield immediately preceding such release and (2) 9.82%, and (v) the release is permitted under REMIC requirements. Notwithstanding the foregoing, the Release Amount will be an amount equal to 105% of the allocated loan amount of the property being released, if with respect to such property, (a) the applicable tenant at such property is the subject of a bankruptcy action, (b) the applicable tenant at such property has gone dark or provided notice of its intention to go dark at all or substantially all of its premises, (c) a default by the applicable tenant at such property is then continuing under its applicable lease, or (d) a Cash Sweep Period as described in clause (iv) of the definition thereof has occurred and the lender has determined that the interest-only debt service coverage ratio, based on the trailing three-month period and calculated excluding the applicable property, is greater than or equal to 1.85x; provided, however, that the aggregate amount of the allocated loan amounts for all properties that may be released at the Release Amount of 105% of the allocated loan amount may not exceed $40,800,000.
Additionally, in the event that the GNL Office and Industrial Portfolio Borrowers receive from the tenant at the Quest Property an expansion notice pursuant to its lease requesting that the GNL Office and Industrial Portfolio Borrowers construct a new building on certain adjacent non-collateral parcels, then the GNL Office and Industrial Portfolio Borrowers will, within five business days of receipt of such expansion notice, provide written notice of the receipt of the expansion notice to the lender. Within 60 days of receipt of such expansion notice or as soon as reasonably practical, the GNL Office and Industrial Portfolio Borrowers will take such actions as reasonably necessary to cause the release from the collateral of the unimproved land parcel(s) identified for construction of the new building. The GNL Office and Industrial Portfolio Borrowers will not be permitted to commence construction of the new building until the identified parcel(s) have been released subject to all conditions of release under the mortgage loan documents.
Rights of First Refusal/Purchase Options.See “Description of the Mortgage Pool—Tenant Issues—Purchase Options and Rights of First Refusal” for information regarding purchase options and/or rights of first refusal or first offer in the Preliminary Prospectus.
Ground Lease.None.
Letter of Credit.None.
| This is not a research report and was not prepared by any Underwriter’s research department. It was prepared by the Underwriters’ sales, trading, banking or other non-research personnel. Please see additional important information and qualifications at the end of this Term Sheet. |
35
| Various | Loan #1 | Cut-off Date Balance: | $70,000,000 | |
| Various | GNL Office and Industrial Portfolio | Cut-off Date LTV: | 55.1% | |
| Various | U/W NCF DSCR: | 2.60x | ||
| U/W NOI Debt Yield: | 10.6% |
Terrorism Insurance.The GNL Office and Industrial Portfolio Borrowers are required to obtain and maintain property insurance that covers perils of terrorism and acts of terrorism in an amount equal to the full replacement cost of the GNL Office and Industrial Portfolio Properties and business interruption insurance of at least 18 months,provided, if the Terrorism Risk Insurance Program Reauthorization Act of 2007 or subsequent statute is not in effect, the GNL Office and Industrial Portfolio Borrowers are not required to pay annual premiums in excess of two times the premium of the required property and rental loss/business income insurance (without giving effect to the cost of terrorism components of such property and rental loss/business income insurance) insuring the GNL Office and Industrial Portfolio Properties as of the date of loan origination. See“Risk Factors—Risks Relating to the Mortgage Loans—Terrorism Insurance May Not Be Available for All Mortgaged Properties” in the Preliminary Prospectus.
| This is not a research report and was not prepared by any Underwriter’s research department. It was prepared by the Underwriters’ sales, trading, banking or other non-research personnel. Please see additional important information and qualifications at the end of this Term Sheet. |
36
(THIS PAGE INTENTIONALLY LEFT BLANK)
37
| Office - Suburban | Loan #2 | Cut-off Date Balance: | $70,000,000 | |
| 5600 Fishers Lane | Parklawn Building | Cut-off Date LTV: | 60.0% | |
| Rockville, MD 20852 | U/W NCF DSCR: | 2.68x | ||
| U/W NOI Debt Yield: | 9.4% |

| This is not a research report and was not prepared by any Underwriter’s research department. It was prepared by the Underwriters’ sales, trading, banking or other non-research personnel. Please see additional important information and qualifications at the end of this Term Sheet. |
38
| Office - Suburban | Loan #2 | Cut-off Date Balance: | $70,000,000 | |
| 5600 Fishers Lane | Parklawn Building | Cut-off Date LTV: | 60.0% | |
| Rockville, MD 20852 | U/W NCF DSCR: | 2.68x | ||
| U/W NOI Debt Yield: | 9.4% |
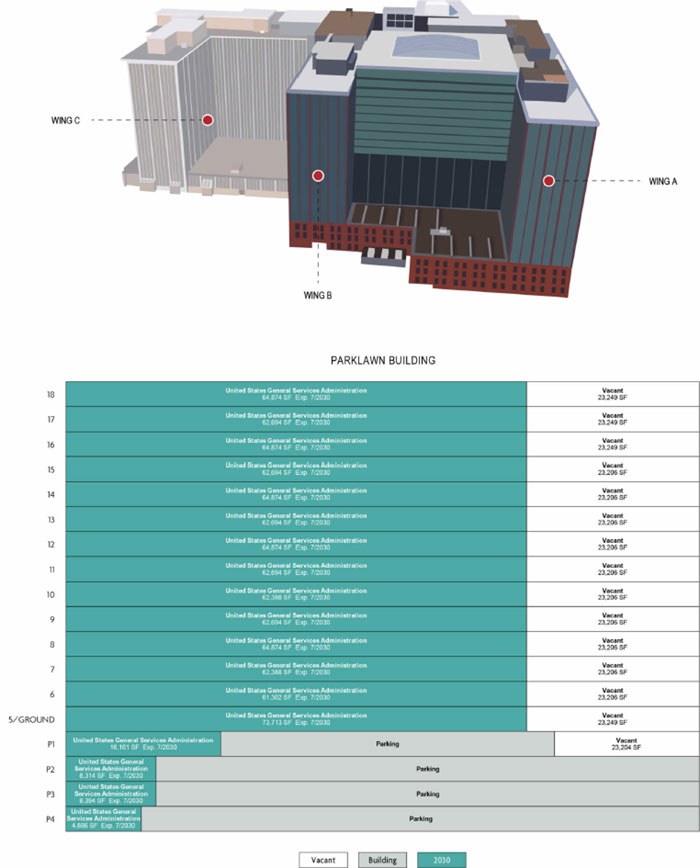
| This is not a research report and was not prepared by any Underwriter’s research department. It was prepared by the Underwriters’ sales, trading, banking or other non-research personnel. Please see additional important information and qualifications at the end of this Term Sheet. |
39
| Office - Suburban | Loan #2 | Cut-off Date Balance: | $70,000,000 | |
| 5600 Fishers Lane | Parklawn Building | Cut-off Date LTV: | 60.0% | |
| Rockville, MD 20852 | U/W NCF DSCR: | 2.68x | ||
| U/W NOI Debt Yield: | 9.4% |

| This is not a research report and was not prepared by any Underwriter’s research department. It was prepared by the Underwriters’ sales, trading, banking or other non-research personnel. Please see additional important information and qualifications at the end of this Term Sheet. |
40
| Mortgage Loan No. 2 – Parklawn Building |
| Mortgage Loan Information | Property Information | ||||||
| Mortgage Loan Seller: | KeyBank | Single Asset/Portfolio: | Single Asset | ||||
| Credit Assessment (KBRA/Fitch/S&P): | NR/NR/NR | Location: | Rockville, MD 20852 | ||||
| Original Balance(1): | $70,000,000 | General Property Type: | Office | ||||
| Cut-off Date Balance(1): | $70,000,000 | Detailed Property Type: | Suburban | ||||
| % of Initial Pool Balance: | 6.9% | Title Vesting: | Fee | ||||
| Loan Purpose: | Acquisition | Year Built/Renovated: | 1970/2015 | ||||
| Sponsor: | Boyd Watterson Asset Management | Size: | 1,283,646 SF | ||||
| Guarantor: | BW Government Properties II, LLC | Cut-off Date Balance per SF(1): | $204 | ||||
| Mortgage Rate: | 3.3980% | Maturity Date Balance per SF(1): | $204 | ||||
| Note Date: | 10/25/2019 | Property Manager: | JBGS/TRS, L.L.C. | ||||
| First Payment Date: | 12/1/2019 | ||||||
| Maturity Date: | 11/1/2029 | Underwriting and Financial Information | |||||
| Original Term to Maturity: | 120 months | UW NOI: | $24,626,402 | ||||
| Original Amortization Term: | 0 months | UW NOI Debt Yield(1): | 9.4% | ||||
| IO Period: | 120 months | UW NOI Debt Yield at Maturity(1): | 9.4% | ||||
| Seasoning: | 0 months | UW NCF DSCR(1): | 2.68x | ||||
| Prepayment Provisions(2): | LO (24); DEF (90); O (6) | Most Recent NOI: | $25,437,810 (8/31/2019 TTM) | ||||
| Lockbox/Cash Mgmt Status: | Hard/In Place | 2nd Most Recent NOI: | $23,893,473 (12/31/2018) | ||||
| Additional Debt Type(1)(3): | Pari Passu | 3rd Most Recent NOI: | $27,578,749 (12/31/2017) | ||||
| Additional Debt Balance(1)(3): | $191,600,000 | Most Recent Occupancy: | 72.9% (7/1/2019) | ||||
| Future Debt Permitted (Type): | No (N/A) | 2nd Most Recent Occupancy: | 72.9% (12/31/2018) | ||||
| Reserves(4) | 3rd Most Recent Occupancy: | 72.9% (12/31/2017) | |||||
| Type | Initial | Monthly | Cap | Appraised Value (as of)(5): | $436,000,000 (9/18/2019) | ||
| RE Tax: | $372,746 | $124,249 | N/A | Appraised Value per SF: | $340 | ||
| Insurance: | $19,441 | $9,720 | N/A | Cut-off Date LTV Ratio(1): | 60.0% | ||
| Deferred Maintenance: | $111,869 | $0 | N/A | Maturity Date LTV Ratio(1): | 60.0% | ||
| Sources and Uses | ||||||
| Sources | Proceeds | % of Total | Uses | Proceeds | % of Total | |
| Whole Loan Amount(1): | $261,600,000 | 58.8% | Purchase Price: | $436,000,000 | 97.9% | |
| Borrower Equity: | $183,626,789 | 41.2% | Closing Costs: | $8,722,733 | 2.0% | |
| Reserves: | $504,056 | 0.1% | ||||
| Total Sources: | $445,226,789 | 100.0% | Total Uses: | $445,226,789 | 100.0% | |
| (1) | The Parklawn Building Mortgage Loan (as defined below) is part of the Parklawn Building Whole Loan (as defined below), which is comprised of fivepari passupromissory notes with an aggregate original principal balance of $261,600,000. The Cut-off Date Balance per SF, Maturity Date Balance per SF, UW NOI Debt Yield, UW NOI Debt Yield at Maturity, UW NCF DSCR, Cut-off Date LTV Ratio, and Maturity Date LTV Ratio numbers presented above are based on the aggregate principal balance of the promissory notes comprising the Parklawn Building Whole Loan. |
| (2) | Defeasance of the Parklawn Building Whole Loan is permitted at any time after the earlier to occur of (a) the end of the two-year period commencing on the closing date of the securitization of the last portion of the Parklawn Building Whole Loan to be securitized and (b) December 1, 2023. The assumed prepayment lockout period of 24 payments is based on the closing date of this transaction in November 2019. |
| (3) | See “The Mortgage Loan” and “Additional Secured Indebtedness (not including trade debts)” below for a discussion of additional debt. |
| (4) | See “Escrows and Reserves”below for further discussion of reserve information. |
| (5) | The appraised value includes $16,235,773 attributed to the present value of an economic development grant and the remainder of a LEED tax credit. |
The Mortgage Loan. The second largest mortgage loan (the “Parklawn Building Mortgage Loan”) is part of a whole loan (the “Parklawn Building Whole Loan”) evidenced by fivepari passu promissory notes with an aggregate original principal balance of $261,600,000, all secured by a first priority fee mortgage encumbering a suburban office property located in Rockville, Maryland ( the “Parklawn Building Property”). The Parklawn Building Whole Loan was co-originated by KeyBank and Bank of America, National Association (“BANA”). The controlling Note A-1, with an original principal balance of $70,000,000, represents the Parklawn Building Mortgage Loan and will be included in the MSC 2019-L3 securitization transaction. The non-controlling Notes A-2 and A-3, with an aggregate original principal balance of $60.8 million, are held by KeyBank and are expected to be contributed to one or more future securitization transactions. The non-controlling Notes A-4 and A-5 (together with the Notes A-2 and A-3, the “Parklawn Building ServicedPari Passu Companion Loans”), with an aggregate original principal balance of $130.8 million, are held by BANA and are expected to be contributed to one or more future securitization transactions. The Parklawn Building Whole Loan will be serviced pursuant to the pooling and servicing agreement for the MSC 2019-L3 securitization transaction. See “Description of the Mortgage Pool—The Whole Loans—The Serviced Pari Passu Whole Loans” and “Pooling and Servicing Agreement” in the Preliminary Prospectus.
| This is not a research report and was not prepared by any Underwriter’s research department. It was prepared by the Underwriters’ sales, trading, banking or other non-research personnel. Please see additional important information and qualifications at the end of this Term Sheet. |
41
| Office - Suburban | Loan #2 | Cut-off Date Balance: | $70,000,000 | |
| 5600 Fishers Lane | Parklawn Building | Cut-off Date LTV: | 60.0% | |
| Rockville, MD 20852 | U/W NCF DSCR: | 2.68x | ||
| U/W NOI Debt Yield: | 9.4% |
| Parklawn Building Whole Loan Summary | ||||
Notes | Original Balance | Cut-off Date Balance | Anticipated Note Holder | Controlling Piece |
| Parklawn Building Mortgage Loan | ||||
| A-1 | $70,000,000 | $70,000,000 | MSC 2019-L3 | Yes |
| Parklawn Building ServicedPari Passu Companion Loans | ||||
| A-2 | $50,000,000 | $50,000,000 | KeyBank | No |
| A-3 | $10,800,000 | $10,800,000 | KeyBank | No |
| A-4 | $65,400,000 | $65,400,000 | BANA | No |
| A-5 | $65,400,000 | $65,400,000 | BANA | No |
| Total | $261,600,000 | $261,600,000 | ||
Proceeds of the Parklawn Building Whole Loan, along with approximately $183.6 million of borrower equity, were used to acquire the Parklawn Building Property for $436.0 million, fund reserves and pay closing costs.
The Borrower and the Sponsors. The borrower is 5600 Fishers Lane, LLC (the “Parklawn Building Borrower”), a single-purpose Delaware limited liability company, with two independent directors. The non-recourse carve-out guarantor is BW Government Properties II, LLC, which is owned by Boyd Watterson Asset Management (0.5% equity interest; 100.0% voting interest) (“Boyd Watterson”) and Government Properties Investments II Limited, a fund managed by Union Bancaire Privée (99.5% equity interest; 0.0% voting interest). BW Government Properties II, LLC holds 100% of the ownership interests of the Parklawn Building Borrower which, at the time of the Parklawn Building Whole Loan closing, was the entity’s sole asset. The borrower sponsor is Boyd Watterson. Headquartered in Cleveland, Ohio and formed in 2009, Boyd Watterson is an independent investment advisor specializing in fixed income, real estate and equities. Boyd Watterson invests in commercial properties leased to local, state, and federal government tenants and manages such assets in separate client accounts and private funds. As of September 30, 2019, Boyd Watterson manages over $4.2 billion in real estate assets. Union Bancaire Privée is a wealth management firm headquartered in Geneva, Switzerland, that focuses on private and institutional clients throughout the world.
The Property. The Parklawn Building Property is a 14-story suburban office building totaling 1,283,646 SF across three wings originally constructed in 1970. Wings A and B contain an aggregate of 935,386 SF and wing C contains 348,260 SF. The Parklawn Building Property was originally 100.0% leased to the United States of America General Services Administration (“GSA”) on behalf of the U.S. Department of Health & Human Services (“HHS”), with the Parklawn Building Property serving as the headquarters for HHS. In 2015, the GSA and the prior owner of the Parklawn Building Property collectively spent nearly $300 million to completely renovate wings A and B into Class A office space featuring a 14-story atrium with a glass ceiling and glass exterior. Following the renovation, the GSA consolidated operations of HHS into wings A and B, and as a result, wing C was left vacant and in its original condition. There are no immediate plans to renovate or lease the space. As of July 1, 2019, wings A and B are 100.0% occupied by the GSA; however, the entire Parklawn Building Property, inclusive of wing C, is 72.9% occupied.
The Parklawn Building Property is LEED Platinum and Energy Star rated and features on-site amenities that include a one-acre park with a fountain, an outdoor plaza, café tables and seating, an on-site bank, a convenience store, a fitness center, and a direct trail to the nearby 1,700-acre Rock Creek Park. As part of the 2015 renovation, HHS invested more than $165 million of the total $300 million on specific upgrades including the main HHS data center for all national operations, back-up generators, modular conference center, full service cafeteria, and employee retail amenities. The 14-story, main interior atrium serves as the focal point of the Parklawn Building Property and allows HHS to host national and international symposiums and major training events on-site. Approximately 2,147 parking spaces are available throughout the Parklawn Building Property, consisting of 909 surface parking spaces and 1,238 parking spaces in a four-level below-grade parking garage beneath wings A, B, and C.
The Parklawn Building Property is situated on a 12.03-acre site in the Twinbrook neighborhood of Rockville, Maryland, approximately one-half mile northeast of Rockville Pike (Route 355) and two miles east of Interstate 270 and Montrose Road interchange. The Twinbrook Metrorail station is located approximately one-half mile to the west, connecting the area to Bethesda and downtown Washington, D.C. The Parklawn Building Property is located in a government life sciences district that features the 550,000 SF national headquarters for the companion agency, the National Institute of Allergy and Infectious Diseases, and two laboratory buildings leased to the National Institute of Health, directly across the street.
The Parklawn Building Borrower is a party to that certain Economic Development Fund Agreement (the “Grant”) with Montgomery County, Maryland (the “County”). Pursuant to the Grant, the Parklawn Building Borrower is entitled to 15 annual disbursements of $1,300,000 from 2017 through and including 2031. The County is only obligated to make disbursements once it has verified that the Parklawn Building Borrower has paid real property taxes in full for the corresponding tax year. The Parklawn Building Borrower was assigned the Grant at closing, but any further assignment of the Grant requires the assignee to demonstrate to the County that it is financially capable of fulfilling the Parklawn Building Borrower’s obligations and execute an assignment in form and substance reasonably satisfactory to the County. See “Description of the Mortgage Pool—Mortgage Pool Characteristics—Property Types—Office Properties” in the Preliminary Prospectus.
Major Tenant.
United States General Services Administration (935,386 SF, 72.9% of NRA, 100.0% of underwritten rent). The United States General Services Administration (rated AAA/Aaa/AA+ by Fitch/Moody’s/S&P) utilizes the Parklawn Building Property for HHS which occupies the space via a lease that expires in July 2030. The lease contains one, 10-year renewal option with a notice period of at least 36 months. The lease does not provide any termination or contraction options.
HHS is a department of the United States government with the stated objective of improving the health, safety, and well-being of America. HHS originally took occupancy of the Parklawn Building Property after it was constructed approximately 50 years ago. As part of the most recent renovation and lease renewal, HHS aggregated the Agency for Healthcare Research and Quality, the Indian Health Service and the Substance Abuse and Mental Health Services Administration into the Parklawn Building Property. In total, 4,500 government healthcare employees are housed at the Parklawn Building Property.
| This is not a research report and was not prepared by any Underwriter’s research department. It was prepared by the Underwriters’ sales, trading, banking or other non-research personnel. Please see additional important information and qualifications at the end of this Term Sheet. |
42
| Office - Suburban | Loan #2 | Cut-off Date Balance: | $70,000,000 | |
| 5600 Fishers Lane | Parklawn Building | Cut-off Date LTV: | 60.0% | |
| Rockville, MD 20852 | U/W NCF DSCR: | 2.68x | ||
| U/W NOI Debt Yield: | 9.4% |
The following table presents certain information relating to the leases at the Parklawn Building Property:
| Tenant Summary(1) | ||||||||
| Tenant Name | Credit Rating (Fitch/Moody’s/S&P) | Tenant SF | Approx. % of SF | Annual UW Rent | % of Total Annual UW Rent | Annual UW Rent PSF(2) | Lease Expiration | Term. Options (Y/N) |
| United States General Services Administration | AAA/Aaa/AA+ | 935,386 | 72.9% | $29,695,152 | 100.0% | $31.75 | 7/31/2030 | N |
| Subtotal/Wtd. Avg. | 935,386 | 72.9% | $29,695,152 | 100.0% | $31.75 | |||
| Vacant | 348,260 | 27.1% | $0 | 0.0% | $0.00 | |||
| Total/Wtd. Avg. | 1,283,646 | 100.0% | $29,695,152 | 100.0% | $31.75 | |||
| (1) | Information obtained from the underwritten rent roll. |
| (2) | Total/Wtd. Avg. Annual UW Rent PSF excludes vacant space. |
The following table presents certain information relating to the lease rollover schedule at the Parklawn Building Property:
| Lease Rollover Schedule(1) | ||||||||
| Year | # of Leases Rolling | SF Rolling | Annual UW Rent PSF Rolling(2) | Approx. % of Total SF Rolling | Approx. Cumulative % of SF Rolling | Total UW Rent Rolling(2) | Approx. % of Total Rent Rolling | Approx. Cumulative % of Total Rent Rolling |
| MTM | 0 | 0 | $0.00 | 0.0% | 0.0% | $0 | 0.0% | 0.0% |
| 2019 | 0 | 0 | $0.00 | 0.0% | 0.0% | $0 | 0.0% | 0.0% |
| 2020 | 0 | 0 | $0.00 | 0.0% | 0.0% | $0 | 0.0% | 0.0% |
| 2021 | 0 | 0 | $0.00 | 0.0% | 0.0% | $0 | 0.0% | 0.0% |
| 2022 | 0 | 0 | $0.00 | 0.0% | 0.0% | $0 | 0.0% | 0.0% |
| 2023 | 0 | 0 | $0.00 | 0.0% | 0.0% | $0 | 0.0% | 0.0% |
| 2024 | 0 | 0 | $0.00 | 0.0% | 0.0% | $0 | 0.0% | 0.0% |
| 2025 | 0 | 0 | $0.00 | 0.0% | 0.0% | $0 | 0.0% | 0.0% |
| 2026 | 0 | 0 | $0.00 | 0.0% | 0.0% | $0 | 0.0% | 0.0% |
| 2027 | 0 | 0 | $0.00 | 0.0% | 0.0% | $0 | 0.0% | 0.0% |
| 2028 | 0 | 0 | $0.00 | 0.0% | 0.0% | $0 | 0.0% | 0.0% |
| 2029 | 0 | 0 | $0.00 | 0.0% | 0.0% | $0 | 0.0% | 0.0% |
| 2030 & Beyond | 1 | 935,386 | $31.75 | 72.9% | 72.9% | $29,695,152 | 100.0% | 100.0% |
| Vacant | 0 | 348,260 | $0.00 | 27.1% | 100.0% | $0 | 0.0% | 100.0% |
| Total/Wtd. Avg.(2) | 1 | 1,283,646 | $31.75 | 100.0% | $29,695,152 | 100.0% | ||
| (1) | Information obtained from the underwritten rent roll. |
| (2) | Total/Wtd. Avg. Annual UW Rent PSF Rolling excludes vacant space. |
The Market. The Parklawn Building Property is located in Rockville, Montgomery County, Maryland, within the Washington-Arlington-Alexandria, DC-VA-MD-WV metropolitan statistical area and approximately 13 miles northwest of the Washington D.C. central business district. Historically, Rockville’s main office demand driver has been government and quasi-government tenants, accounting for nearly 40% of occupied office space; however, the biotechnology industry has increased its presence. The I-270 Technology Corridor, which serves as a local demand generator for the Rockville market area, is a life science corridor that is home to numerous biotechnology companies and federal government institutions. Health institutions located in the area include Johns Hopkins Montgomery County campus and University of Maryland Institute for Bioscience and Biotechnology Research, as well as large pharmaceutical companies including GlaxoSmithKline, Sanofi, and MedImmune.
According to the appraisal, the estimated 2019 populations within a one-, three- and five-mile radius of the Parklawn Building Property were 27,386, 160,957, and 357,052, respectively. The 2019 average household incomes within the same radii were $96,465, $117,574, and $130,980, respectively.
According to a third party research report, the Parklawn Building Property is part of the Washington office market and the Rockville office submarket. As of the third quarter of 2019, the Washington office market had a total office inventory of approximately 501.4 million SF with a vacancy rate of 12.9% and an average asking rent of $37.96 PSF. The Rockville office submarket had a total office inventory of approximately 10.8 million SF with a vacancy rate of 10.8% and an average asking rent of $30.18 PSF. The submarket had no additional inventory delivered in the third quarter of 2019, which had positive net absorption of 14,921 SF. No office buildings are currently under construction in the submarket. The appraiser analyzed twelve comparable government office leases with lease terms ranging from approximately two to 15 years and asking rents ranging from $23.36 PSF to $45.00 PSF. The appraiser concluded to a market rent of $35.00 PSF for the office space at wings A and B of the Parklawn Building Property.
| This is not a research report and was not prepared by any Underwriter’s research department. It was prepared by the Underwriters’ sales, trading, banking or other non-research personnel. Please see additional important information and qualifications at the end of this Term Sheet. |
43
| Office - Suburban | Loan #2 | Cut-off Date Balance: | $70,000,000 | |
| 5600 Fishers Lane | Parklawn Building | Cut-off Date LTV: | 60.0% | |
| Rockville, MD 20852 | U/W NCF DSCR: | 2.68x | ||
| U/W NOI Debt Yield: | 9.4% |
The following table presents recent government agency leasing data at comparable office properties with respect to the Parklawn Building Property:
| Comparable Lease Summary | ||||||||||
| Property | Year Built/ Renovated(1) | Distance from Subject | Property | Tenant | Lease Area (SF) | Lease Date | Initial Rent PSF | Lease Term (Yrs.) | Lease Type | |
| Parklawn Building(2) Rockville, MD | 1970 / 2015 | N/A | 1,283,646 | United States General Services Administration | 935,386 | Aug-15 | $31.75 | 15.0 | Modified Gross | |
Centerstone at Tysons McLean, VA | N/A | 14.5 miles | N/A | Freddie Mac | 151,949 | May-19 | $27.50 | 10.2 | NNN | |
| West Gude Office Park Rockville, MD | N/A | 4.9 miles | N/A | FBI (renewal) | 10,646 | Jan-19 | $23.36 | 10.0 | Full Service | |
| Reston Sunrise Reston, VA | N/A | 21.9 miles | N/A | GSA | 43,346 | Dec-18 | $35.00 | 15.0 | Full Service | |
| Centerpark I Calverton, MD | N/A | 15.0 miles | N/A | FDA | 78,918 | Nov-18 | $24.51 | 10.0 | Full Service | |
| American Square at Quantum Park Ashburn, VA | N/A | 31.9 miles | N/A | GSA – CBP | 444,595 | May-18 | $38.25 | 15.0 | Full Service | |
| American Center West Tysons, VA | N/A | 15.9 miles | N/A | GSA (renewal) | 21,214 | Apr-18 | $33.00 | 5.3 | Full Service | |
| The Cinema Building Hyattsville, MD | N/A | 15.6 miles | N/A | FEMA (renewal) | 54,000 | Nov-17 | $30.30 | 4.0 | Full Service | |
| 2115 East Jefferson Rockville, MD | N/A | 2.0 miles | N/A | NIH (extension) | 89,708 | Nov-17 | $29.00 | 2.1 | None | |
| Campus at Sunrise Reston, VA | N/A | 21.5 miles | N/A | CIA (renewal) | 31,230 | Oct-17 | $33.50 | 5.0 | Plus Electric | |
| Freedom Forum Arlington, VA | N/A | 17.1 miles | N/A | Trade and Development Agency | 36,346 | Jun-17 | $45.00 | 10.75 | Full Service | |
| 1701 Fort Myer Arlington, VA | N/A | 17.3 miles | N/A | Department of State | 342,967 | Jun-17 | $39.00 | 15.0 | Full Service | |
| Woodmont Place Rockville, MD | N/A | 1.2 miles | N/A | FDA | 44,761 | Mar-16 | $27.00 | 5.0 | Full Service | |
Source: Appraisal.
| (1) | Property Size (SF) for the comparable leases was not provided in the appraisal. |
| (2) | Based on the underwritten rent roll with the exception of Year Built/Renovated. |
| This is not a research report and was not prepared by any Underwriter’s research department. It was prepared by the Underwriters’ sales, trading, banking or other non-research personnel. Please see additional important information and qualifications at the end of this Term Sheet. |
44
| Office - Suburban | Loan #2 | Cut-off Date Balance: | $70,000,000 | |
| 5600 Fishers Lane | Parklawn Building | Cut-off Date LTV: | 60.0% | |
| Rockville, MD 20852 | U/W NCF DSCR: | 2.68x | ||
| U/W NOI Debt Yield: | 9.4% |
Operating History and Underwritten Net Cash Flow.The following table presents certain information relating to the historical operating performance and Underwritten Net Cash Flow of the Parklawn Building Property:
| Cash Flow Analysis | |||||
| 2017 | 2018 | 8/31/2019 TTM | UW | UW PSF | |
| Gross Potential Rent(1) | $29,333,705 | $29,307,147 | $29,307,147 | $40,142,952 | $31.27 |
| Total Recoveries(2) | $1,075,796 | ($71,488) | ($779,982) | $276,172 | $0.22 |
| Parking Income | $3,474,485 | $3,547,672 | $3,631,939 | $4,011,560 | $3.13 |
| Total Other Income(3) | ($798) | $0 | $57,118 | $1,300,000 | $1.01 |
| Vacancy | $0 | $0 | $0 | ($10,447,800) | ($8.14) |
| Effective Gross Income | $33,883,188 | $32,783,331 | $32,216,222 | $35,282,884 | $27.49 |
| Real Estate Taxes | $393,436 | $2,779,279 | $1,459,065 | $4,212,000 | $3.28 |
| Insurance | $180,883 | $138,229 | $126,910 | $179,664 | $0.14 |
| Other Operating Expenses | $5,730,120 | $5,972,350 | $5,192,436 | $6,264,818 | $4.88 |
| Total Expenses | $6,304,439 | $8,889,858 | $6,778,412 | $10,656,482 | $8.30 |
| Net Operating Income | $27,578,749 | $23,893,473 | $25,437,810 | $24,626,402 | $19.18 |
| Capital Expenditures | $0 | $0 | $0 | $319,897 | $0.25 |
| TI/LC(4) | $0 | $0 | $0 | $147,245 | $0.11 |
| Net Cash Flow | $27,578,749 | $23,893,473 | $25,437,810 | $24,159,260 | $18.82 |
| Occupancy % | 72.9% | 72.9% | 72.9%(5) | 77.2% | |
| NOI DSCR(6) | 3.06x | 2.65x | 2.82x | 2.73x | |
| NCF DSCR(6) | 3.06x | 2.65x | 2.82x | 2.68x | |
| NOI Debt Yield(6) | 10.5% | 9.1% | 9.7% | 9.4% | |
| NCF Debt Yield(6) | 10.5% | 9.1% | 9.7% | 9.2% | |
| (1) | UW Gross Potential Rent is greater than the historical periods due to the inclusion of $10,447,800 for grossed-up vacant space. |
| (2) | Negative amounts for 2018 and 8/31/2019 TTM Total Recoveries reflect CPI and tax reconciliations as a result of estimated payments made during the respective year exceeding actual amounts due at the end of the respective year. |
| (3) | UW Total Other Income represents a Montgomery County grant, which includes 15 annual payments of $1.3 million to be paid out from 2017 through 2031. The Parklawn Building Borrower was assigned the grant at closing, but any further assignment of the grant requires the assignee to demonstrate to the County that it is financially capable of fulfilling the Parklawn Building Borrower’s obligations and execute an assignment in form and substance reasonably satisfactory to the County. |
| (4) | UW TI/LC includes a credit associated with the springing major tenant cash flow sweep set to occur 29 months prior to lease expiration and estimated to collect $1,901,631. |
| (5) | As of the underwritten rent roll dated July 1, 2019. |
| (6) | Debt service coverage ratios and debt yields are based on the Parklawn Building Whole Loan. |
Escrows and Reserves.
Real Estate Taxes- The Parklawn Building Borrower deposited $372,746 into a real estate tax reserve at origination and is required to deposit an ongoing monthly real estate tax reserve payment in an amount equal to 1/12 of the annual estimated real estate taxes, which currently equates to $124,249.
Insurance- The Parklawn Building Borrower deposited $19,441 into an insurance reserve at origination and is required to deposit an ongoing monthly insurance reserve payment in an amount equal to 1/12 of the annual estimated insurance premiums, which currently equates to $9,720.
Deferred Maintenance- The Parklawn Building Borrower deposited $111,869 for deferred maintenance at origination.
Lockbox and Cash Management. The Parklawn Building Whole Loan is structured with a hard lockbox and in place cash management. The Parklawn Building Borrower is required to direct each tenant of the Parklawn Building Property to deposit funds directly into the clearing account controlled by the lender. Notwithstanding the foregoing, the Parklawn Building Borrower and property manager are required to deposit all revenues otherwise received into the clearing account within one business day of receipt. All funds in the clearing account will be transferred into the cash management account daily and are required to be applied and disbursed in accordance with the Parklawn Building Whole Loan documents in the following order: (i) to required deposits into the tax and insurance reserve, (ii) to fees of the cash management bank, (iii) to scheduled monthly debt service, (iv) to interest at the default rate, late charges and other amounts due under the Parklawn Building Whole Loan documents, (v) during a Cash Sweep Period (other than due to an event of default), to budgeted operating expenses, (vi) during a Cash Sweep Period (other than due to an event of default), all remaining funds after any applicable payments according to the aforementioned clauses (i) – (v) will be held by the lender as additional collateral for the Parklawn Building Whole Loan and, during an event of default, applied in the lender’s sole discretion and (vi) so long as no Cash Sweep Period exists, to the Parklawn Building Borrower.
A “Cash Sweep Period” will commence upon:
| (a) | the occurrence of an event of default under the Parklawn Building Whole Loan and will continue until such event of default is cured; |
| (b) | the occurrence of any bankruptcy action of the Parklawn Building Borrower (in no event will a Cash Sweep Period due to a bankruptcy action of the Parklawn Building Borrower be cured); |
| This is not a research report and was not prepared by any Underwriter’s research department. It was prepared by the Underwriters’ sales, trading, banking or other non-research personnel. Please see additional important information and qualifications at the end of this Term Sheet. |
45
| Office - Suburban | Loan #2 | Cut-off Date Balance: | $70,000,000 | |
| 5600 Fishers Lane | Parklawn Building | Cut-off Date LTV: | 60.0% | |
| Rockville, MD 20852 | U/W NCF DSCR: | 2.68x | ||
| U/W NOI Debt Yield: | 9.4% |
| (c) | the date on which the amortizing debt service coverage ratio as calculated in the Parklawn Building Whole Loan documents based on the trailing three-month period is less than 1.55x and will continue until the amortizing debt service coverage ratio based on the trailing three-month period is at least 1.60x for two consecutive calendar quarters; |
| (d) | the occurrence of any bankruptcy action of the property manager, and will continue until the Parklawn Building Borrower replaces the manager with a qualified manager under a replacement management agreement within 60 days of such bankruptcy action; |
| (e) | the date on which (i) a Sweep Tenant (as defined below) fails to exercise a renewal option under its lease on or prior to the date by which notice of such renewal option is required or (ii) a Sweep Tenant terminates or cancels its lease and will continue until a Sweep Tenant Re-Leasing Event (as defined below) occurs; |
| (f) | the date on which (iii) a Sweep Tenant ceases to operate in 50% or more of the premises demised under the Sweep Tenant lease unless the balance of the space has been subleased to a subtenant which has and maintains a credit rating of at least BBB- by S&P and Baa3 by Moody’s and will continue until (A) such Sweep Tenant has resumed operations in more than 50% of the premises, or (B) a Sweep Tenant Re-Leasing Event has occurred; |
| (g) | the occurrence of a default beyond applicable notice and cure periods on the part of a Sweep Tenant under its lease and will continue until the date on which the Parklawn Building Borrower has accepted a cure of the default in a manner acceptable to the lender; |
| (h) | the occurrence of the bankruptcy or insolvency of a Sweep Tenant and/or the parent of a Sweep Tenant and will continue until the insolvency proceedings have terminated and the Sweep Tenant’s lease has been affirmed, assumed, or assigned in a manner satisfactory to the lender; |
| (i) | if the credit rating of a Sweep Tenant (and/or the parent of a Sweep Tenant) falls below BBB- by S&P or Baa3 by Moody’s and will continue until (A) the credit rating of the Sweep Tenant has been restored to at least BBB- by S&P and Baa3 by Moody’s, or (B) a Sweep Tenant Re-Leasing Event has occurred. |
A “Sweep Tenant” means each of (i) the United States of America, acting by and through the designated representative of the General Services Administration and/or (ii) any replacement tenant for the foregoing which covers 75% or more of the net rentable square footage of the premises demised under the Sweep Tenant lease as of loan closing.
A “Sweep Tenant Re-Leasing Event” means the Parklawn Building Borrower enters into a new lease(s) acceptable to the lender for the entire premises pursuant to the applicable Sweep Tenant’s lease with such tenant(s) having and maintaining a credit rating of at least BBB- by S&P and Baa3 by Moody’s, provided that (A) such replacement lease(s) are in full force and effect, (B) all tenant improvements, leasing commissions, and other landlord obligations with respect to such lease(s) have been paid and or performed in full, (C) the tenant under such replacement lease(s) has commenced payment of full, unabated rent thereunder, and (D) the lender receives an estoppel certifying the forgoing matters.
Additional Secured Indebtedness (not including trade debts). The Parklawn Building Property also secures the Parklawn Building ServicedPari Passu Companion Loans, which have an aggregate Cut-off Date principal balance of $191,600,000. The Parklawn Building ServicedPari Passu Companion Loans accrue interest at the same rate as the Parklawn Building Mortgage Loan. The Parklawn Building Mortgage Loan is entitled to payments of interest and principal on apro rata andpari passu basis with the Parklawn Building Serviced PariPassu Companion Loans. The holders of the Parklawn Building Mortgage Loan and the Parklawn Building Serviced PariPassu Companion Loans have entered into a co-lender agreement which sets forth the allocation of collections on the Parklawn Building Whole Loan. See “Description of the Mortgage Pool—The Whole Loans— The Serviced Pari Passu Whole Loans” in the Preliminary Prospectus.
Mezzanine Loan and Preferred Equity.Not permitted.
Release of Property.Any time after the Permitted Defeasance Date (as defined below), the Parklawn Building Borrower may establish a condominium regime acceptable to the lender for the Parklawn Building Property in order to release a portion of the collateral comprised of the above-grade portion of wing C (the “Release Unit”), provided that, among other things, (i) no Cash Sweep Period is continuing, (ii) the Parklawn Building Borrower establishes a condominium in accordance with the requirements of the Parklawn Building Whole Loan documents, (iii) the Parklawn Building Borrower defeases a portion of the Parklawn Building Whole Loan in an amount equal to (1) $2,400,000 if released to an unaffiliated third-party or (2) in connection with a transfer to any affiliate of the Parklawn Building Borrower, the greater of (A) $2,400,000, or (B) 100% of the net sales proceeds, (iv) following the release of the Release Unit and partial defeasance of the Parklawn Building Whole Loan, the debt yield (calculated with a vacancy adjustment equal to the greater of actual vacancy or 3%) is equal to or greater than the greater of (x) the debt yield immediately preceding such release and (y) 9.24%, (v) the debt service coverage ratio (calculated with a vacancy adjustment equal to the greater of actual vacancy or 3% and assuming a 30-year amortization period) is equal to or greater than the greater of (x) the debt service coverage ratio immediately preceding such release and (y) 1.74x and (vi) the loan to value ratio is equal to or less than the lesser of (x) the loan to value ratio immediately preceding such partial release and (y) 60.0%; provided that if the tests in clauses (iv), (v), and (vi) above are not satisfied, the Parklawn Building Borrower may deposit cash with the lender in the amount that if applied to the reduction of the outstanding principal balance of the Parklawn Building Whole Loan, would result in the satisfaction of such tests, which cash will be held as additional collateral for the Parklawn Building Whole Loan.
“Permitted Defeasance Date” means the date that is the earlier to occur of (i) two years from the closing date of the securitization trust which holds the last portion of the Parklawn Building Whole Loan to be securitized, or (ii) the payment date occurring on December 1, 2023.
Right of First Offer/Right of First Refusal.None.
Ground Lease. None.
Letter of Credit.None.
| This is not a research report and was not prepared by any Underwriter’s research department. It was prepared by the Underwriters’ sales, trading, banking or other non-research personnel. Please see additional important information and qualifications at the end of this Term Sheet. |
46
| Office - Suburban | Loan #2 | Cut-off Date Balance: | $70,000,000 | |
| 5600 Fishers Lane | Parklawn Building | Cut-off Date LTV: | 60.0% | |
| Rockville, MD 20852 | U/W NCF DSCR: | 2.68x | ||
| U/W NOI Debt Yield: | 9.4% |
Terrorism Insurance.The Parklawn Building Borrower is required to obtain and maintain “all risk” property insurance that covers perils of terrorism and acts of terrorism in an amount equal to the full replacement cost of the Parklawn Building Property and business interruption insurance for 18 months with a six-month extended period of indemnity. See “Risk Factors—Risks Relating to the Mortgage Loans—Terrorism Insurance May Not Be Available for All Mortgaged Properties” in the Preliminary Prospectus.
| This is not a research report and was not prepared by any Underwriter’s research department. It was prepared by the Underwriters’ sales, trading, banking or other non-research personnel. Please see additional important information and qualifications at the end of this Term Sheet. |
47
| Various | Loan #3 | Cut-off Date Balance: | $60,500,000 | |
| Various | East Village Multifamily Portfolio | Cut-off Date LTV: | 61.2% | |
| New York, NY Various | U/W NCF DSCR: | 2.07x | ||
| U/W NOI Debt Yield: | 7.0% |
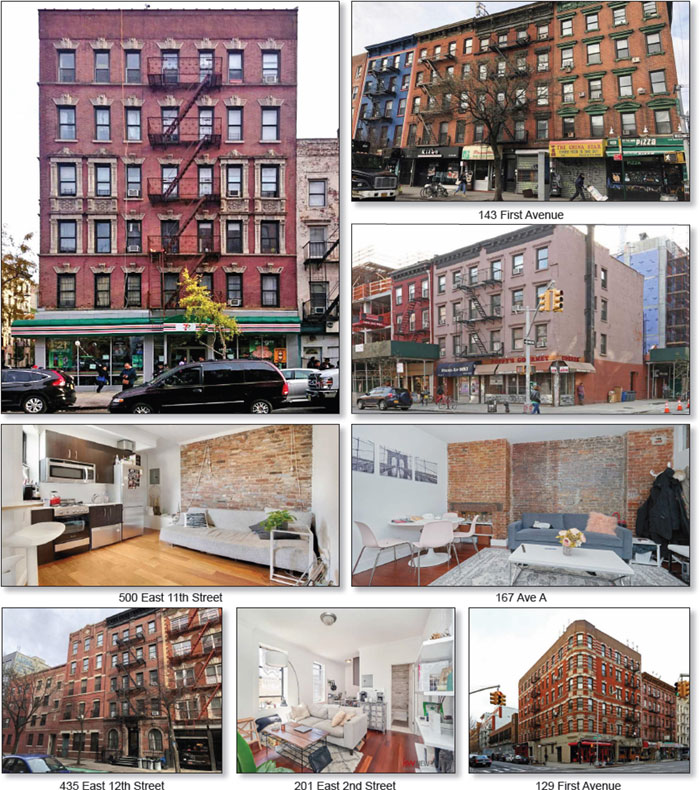
| This is not a research report and was not prepared by any Underwriter’s research department. It was prepared by the Underwriters’ sales, trading, banking or other non-research personnel. Please see additional important information and qualifications at the end of this Term Sheet. |
48
| Various | Loan #3 | Cut-off Date Balance: | $60,500,000 | |
| Various | East Village Multifamily Portfolio | Cut-off Date LTV: | 61.2% | |
| New York, NY Various | U/W NCF DSCR: | 2.07x | ||
| U/W NOI Debt Yield: | 7.0% |
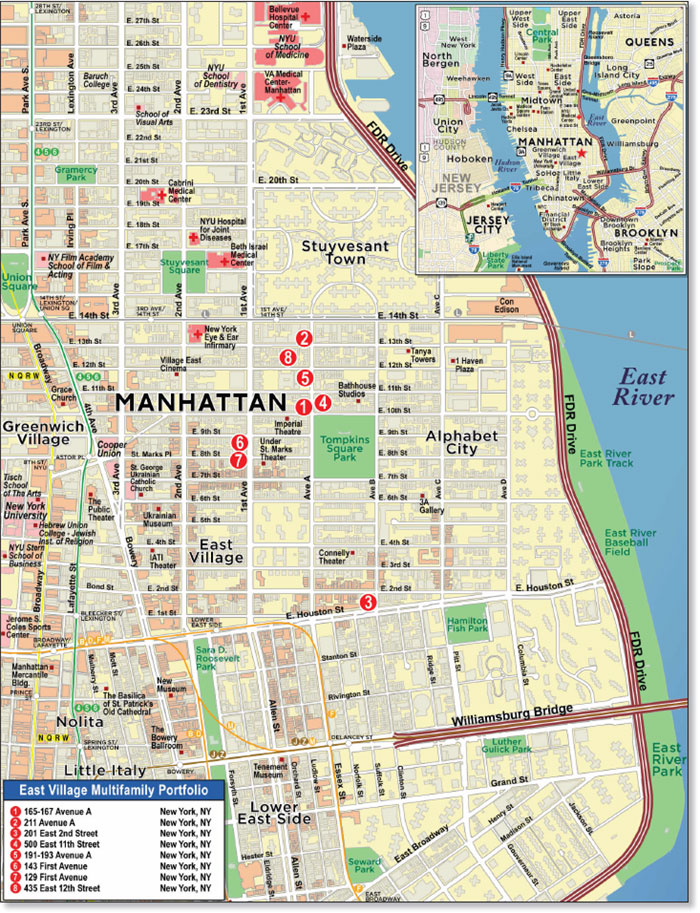
| This is not a research report and was not prepared by any Underwriter’s research department. It was prepared by the Underwriters’ sales, trading, banking or other non-research personnel. Please see additional important information and qualifications at the end of this Term Sheet. |
49
| Mortgage Loan No. 3 – East Village Multifamily Portfolio |
| Mortgage Loan Information | Property Information | |||||||
| Mortgage Loan Seller: | AREF | Single Asset/Portfolio: | Portfolio | |||||
| Credit Assessment (KBRA/Fitch/S&P): | NR/NR/NR | Location: | New York, NY Various | |||||
| Original Balance(1): | $60,500,000 | General Property Type(5): | Various | |||||
| Cut-off Date Balance(1): | $60,500,000 | Detailed Property Type(6): | Various | |||||
| % of Initial Pool Balance: | 5.9% | Title Vesting: | Fee | |||||
| Loan Purpose: | Refinance | Year Built/Renovated: | Various/Various | |||||
| Sponsor: | Seryl Kushner | Size(7): | 144 Units | |||||
| Guarantor: | Seryl Kushner | Cut-off Date Balance per Unit(1): | $593,750 | |||||
| Mortgage Rate: | 3.3400% | Maturity Date Balance per Unit(1): | $593,750 | |||||
| Note Date: | 9/9/2019 | Property Manager: | Westminster Management, L.L.C | |||||
| First Payment Date: | 11/6/2019 | (borrower-related) | ||||||
| Maturity Date: | 10/6/2029 | |||||||
| Original Term to Maturity: | 120 months | Underwriting and Financial Information | ||||||
| Original Amortization Term: | 0 months | UW NOI: | $6,019,492 | |||||
| IO Period: | 120 months | UW NOI Debt Yield(1): | 7.0% | |||||
| Seasoning: | 1 month | UW NOI Debt Yield at Maturity(1): | 7.0% | |||||
| Prepayment Provisions: | LO (25); DEF (91); O (4) | UW NCF DSCR(1): | 2.07x | |||||
| Lockbox/Cash Mgmt Status(2): | Soft/Springing | Most Recent NOI: | $6,045,651 (7/31/2019 TTM) | |||||
| Additional Debt Type(1)(3): | Pari Passu | 2nd Most Recent NOI: | $6,045,841 (12/31/2018) | |||||
| Additional Debt Balance(1)(3): | $25,000,000 | 3rd Most Recent NOI: | $6,103,166 (12/31/2017) | |||||
| Future Debt Permitted (Type): | No (N/A) | Most Recent Occupancy: | 99.3% (8/13/2019) | |||||
| Reserves(4) | 2nd Most Recent Occupancy: | 93.9% (12/31/2018) | ||||||
| Type | Initial | Monthly | Cap | 3rd Most Recent Occupancy: | 91.1% (12/31/2017) | |||
| RE Tax: | $580,862 | $129,081 | N/A | Appraised Value (as of)(8): | $139,800,000 (8/22/2019) | |||
| Insurance: | $0 | Springing | N/A | Appraised Value per Unit: | $970,833 | |||
| Deferred Maintenance: | $0 | $0 | N/A | Cut-off Date LTV Ratio(1): | 61.2% | |||
| Recurring Replacements: | $0 | $3,000 | N/A | Maturity Date LTV Ratio(1): | 61.2% | |||
| TI/LC: | $0 | $0 | N/A | |||||
| Sources and Uses | ||||||
| Sources | Proceeds | % of Total | Uses | Proceeds | % of Total | |
| Whole Loan Amount(1): | $85,500,000 | 100.0% | Loan Payoff: | $79,096,419 | 92.5% | |
| Return of Equity: | $4,066,627 | 4.8% | ||||
| Closing Costs: | $1,756,093 | 2.1% | ||||
| Reserves: | $580,862 | 0.7% | ||||
| Total Sources: | $85,500,000 | 100.0% | Total Uses: | $85,500,000 | 100.0% | |
| (1) | The East Village Multifamily Portfolio Mortgage Loan (as defined below) is part of the East Village Multifamily Portfolio Whole Loan (as defined below), which is comprised of sixpari passu promissory notes with an aggregate original principal balance of $85,500,000. The Cut-off Date Balance per Unit, Maturity Date Balance per Unit, UW NOI Debt Yield, UW NOI Debt Yield at Maturity, UW NCF DSCR, Cut-off Date LTV Ratio and Maturity Date LTV Ratio numbers presented above are based on the aggregate principal balance of the promissory notes comprising the East Village Multifamily Portfolio Whole Loan. |
| (2) | The lockbox for the East Village Multifamily Portfolio Whole Loan is soft for residential tenants and hard for commercial tenants. |
| (3) | See “The Mortgage Loan” and “Additional Secured Indebtedness not including Trade Debts” below for further discussion of additional debt. |
| (4) | See “Escrows and Reserves” below for further discussion of reserve requirements. |
| (5) | The General Property Type for the East Village Multifamily Portfolio Properties (as defined below) consists of seven mixed use properties and one multifamily property. |
| (6) | The Detailed Property Type for the East Village Multifamily Portfolio Properties consists of seven multifamily/retail properties, and one multifamily property. |
| (7) | The East Village Multifamily Portfolio Properties also include 17,930 SF of retail space. |
| (8) | See “Property Summary” chart below for breakout of appraised values for the East Village Multifamily Portfolio Properties. |
| This is not a research report and was not prepared by any Underwriter’s research department. It was prepared by the Underwriters’ sales, trading, banking or other non-research personnel. Please see additional important information and qualifications at the end of this Term Sheet. |
50
| Various | Loan #3 | Cut-off Date Balance: | $60,500,000 | |
| Various | East Village Multifamily Portfolio | Cut-off Date LTV: | 61.2% | |
| New York, NY Various | U/W NCF DSCR: | 2.07x | ||
| U/W NOI Debt Yield: | 7.0% |
The Mortgage Loan. The third largest mortgage loan (the “East Village Multifamily Portfolio Mortgage Loan”) is part of a whole loan (the “East Village Multifamily Portfolio Whole Loan”) evidenced by sixpari passu promissory notes in the aggregate original principal balance of $85,500,000, which are secured by first priority fee mortgages encumbering seven mixed use properties and one multifamily property located in New York, New York (the “East Village Multifamily Portfolio Properties”). The controlling Note A-1 and non-controlling Notes A-2 and A-3 in the aggregate original principal balance of $60,500,000, represent the East Village Multifamily Portfolio Mortgage Loan and will be included in the MSC 2019-L3 securitization trust. The non-controlling Notes A-4, A-5 and A-6, in the aggregate original principal balance of $25,000,000 are anticipated to be contributed to the GSMS 2019-GSA1 securitization trust (the “East Village Multifamily PortfolioPari Passu Companion Loans”). The East Village Multifamily Portfolio Whole Loan is expected to be serviced pursuant to the pooling and servicing agreement for the GSMS 2019-GSA1 securitization transaction until the controlling Note A-1 is securitized, at which time it will be serviced pursuant to the pooling and servicing agreement for the MSC 2019-L3 securitization transaction. See“Description of the Mortgage Pool—The Whole Loans—The Serviced Pari Passu Whole Loans”and“Pooling and Servicing Agreement”in the Preliminary Prospectus.
| East Village Multifamily Portfolio Whole Loan Summary | ||||
| Notes | Original Balance | Cut-off Date Balance | Anticipated Note Holder | Controlling Piece |
| East Village Multifamily Portfolio Mortgage Loan | ||||
| A-1, A-2, A-3 | $60,500,000 | $60,500,000 | MSC 2019-L3 | Yes |
| East Village Multifamily PortfolioPari Passu Companion Loans | ||||
| A-4 | $10,000,000 | $10,000,000 | GSMS 2019-GSA1(1) | No |
| A-5 | $10,000,000 | $10,000,000 | GSMS 2019-GSA1(1) | No |
| A-6 | $5,000,000 | $5,000,000 | GSMS 2019-GSA1(1) | No |
| Total | $85,500,000 | $85,500,000 | ||
| (1) | Anticipated to be contributed to the GSMS 2019-GSA1 securitization upon the closing of such transaction. |
The Borrowers and the Borrowers Sponsor.The borrowers are Village JV 129 First Avenue LLC, Village JV 143 First Avenue LLC, Village JV 165 Avenue A LLC, Village JV 191-193 Avenue A LLC, Village JV 201 East 2nd LLC, Village JV 211 Avenue A LLC, Village JV 435 East 12th LLC, and Village JV 500 East 11th LLC (the “East Village Multifamily Portfolio Borrowers”), each a single-purpose Delaware limited liability company with one independent director. The borrower sponsor and non-recourse carve-out guarantor is Seryl Kushner, who has a 1.9% indirect ownership interest in each of the East Village Multifamily Portfolio Borrowers. Seryl Kushner is the wife of Charles Kushner, who is the founder of Kushner Companies, a privately held real estate developer and landlord. The family-owned firm holds a portfolio of 20,000 multifamily residential units and 13 million square feet of office, industrial, and retail space. See “Description of the Mortgage Pool—Litigation and Other Considerations.” Furthermore, Gaia Investments Corp, an Israel based real estate company and its affiliates have an 85.0% indirect ownership interest in the East Village Multifamily Portfolio Borrowers.
The Properties.The East Village Multifamily Portfolio Properties are comprised of seven mixed use properties and one multifamily property totaling 110,930 SF located in the East Village submarket of New York, New York. The East Village Multifamily Portfolio consists of eight, 4-6 story buildings constructed between 1900 and 1925 ranging from 5,835 SF to 24,628 SF. The East Village Multifamily Portfolio Properties contain 144 residential units, 15 commercial units (17,930 SF on the ground floor), and two rooftop antenna leases. The East Village Multifamily Portfolio Properties are walk-up apartment buildings with ground floor retail.
The residential units at the East Village Multifamily Portfolio Properties are 99.3% occupied by unit count as of August 13, 2019. The residential units comprise 83.8% of the total NRA and contribute 70.3% of the underwritten effective gross income. Of the 144 apartment units, 114 are leased at market rents, 24 are rent stabilized and six are rent controlled. The 30 rent controlled and stabilized units contribute approximately 8.7% of the residential income. In place rents for the rent controlled and stabilized units are more than 60% lower per SF on average compared to the market/unregulated units. The unit mix at the East Village Multifamily Portfolio Properties consists of 49 one-bedroom units, 60 two-bedroom units, 21 three-bedroom units, and 14 four-bedroom units. Unit amenities include hardwood floors in living areas, gas/electric oven/range combination, dishwasher, and refrigerator/freezer. A small fraction of units have washer/dryer sets in the unit.
The commercial units at the East Village Multifamily Portfolio Properties are 100.0% occupied as of August 13, 2019 by 15 tenants. Commercial tenants comprise 16.2% of the total NRA and contribute 26.9% of the underwritten effective gross income (including tenant recoveries). The three largest tenants by SF and underwritten base rent are 7-Eleven, Inc., Stand-Up MRI of Manhattan, and Mamafinas, a Filipino restaurant. The remaining 12 tenants consist of a mix of restaurants and service type businesses.
The Housing Stability and Tenant Protection Act of 2019 (the “HSTP ACT”) which was enacted in June 2019, among other things, limits the ability of landlords to increase rents in rent stabilized apartments at the time of lease renewal and after a vacancy. In particular, the impact of the HSTP Act on the appraised value of mortgaged real properties located in the City of New York that have significant numbers of rent stabilized units is uncertain. According to the appraisal, a capitalization rate premium was implemented to account for the effect of the HSTP ACT on the East Village Multifamily Portfolio Properties. See “Risk Factors— Multifamily Properties Have Special Risks” in the Preliminary Prospectus.
| This is not a research report and was not prepared by any Underwriter’s research department. It was prepared by the Underwriters’ sales, trading, banking or other non-research personnel. Please see additional important information and qualifications at the end of this Term Sheet. |
51
| Various | Loan #3 | Cut-off Date Balance: | $60,500,000 | |
| Various | East Village Multifamily Portfolio | Cut-off Date LTV: | 61.2% | |
| New York, NY Various | U/W NCF DSCR: | 2.07x | ||
| U/W NOI Debt Yield: | 7.0% |
The following table presents certain information relating to the East Village Multifamily Portfolio Properties:
| Property Summary | ||||||||||
| Property Name | Year Built/Renovated | Allocated Whole Loan Amount | % of ALA | Number of Stories | SF(1) | Occupancy %(1) | Number of Residential Units(1) | Number of Commercial Units(1) | Appraised Value | LTV |
| 165-167 Avenue A | 1910 / 2015 | $18,640,000 | 21.8% | 5 | 15,941 | 100.0% | 17 | 2 | $29,000,000 | 64.3% |
| 211 Avenue A | 1900 / 2017 | 17,331,000 | 20.3 | 6 | 24,628 | 100.0% | 35 | 3 | 28,600,000 | 60.6% |
| 201 East 2nd Street | 1925 / 2014 | 16,257,000 | 19.0 | 6 | 19,721 | 100.0% | 25 | 3 | 27,700,000 | 58.7% |
| 500 East 11th Street | 1920 / 2013 | 11,752,000 | 13.7 | 6 | 17,875 | 95.8% | 24 | 1 | 19,300,000 | 60.9% |
| 191-193 Avenue A | 1900 / 2019 | 7,444,000 | 8.7 | 4 | 9,530 | 100.0% | 9 | 2 | 11,500,000 | 64.7% |
| 143 First Avenue | 1900 / 2015 | 5,284,000 | 6.2 | 5 | 6,000 | 100.0% | 8 | 2 | 8,700,000 | 60.7% |
| 129 First Avenue | 1900 / 2019 | 4,721,000 | 5.5 | 5 | 5,835 | 100.0% | 8 | 2 | 8,200,000 | 57.6% |
| 435 East 12th Street | 1900 / 2018 | 4,071,000 | 4.8 | 5 | 11,400 | 100.0% | 18 | 0 | 6,800,000 | 59.9% |
| Total/Wtd. Avg. | $85,500,000 | 100.0% | 110,930 | 99.3% | 144 | 15 | $139,800,000 | 61.2% | ||
Source:Appraisal
| (1) | Information is based on the underwritten rent roll dated August 13, 2019. |
The following table presents the residential unit mix at the East Village Multifamily Portfolio Properties:
| Unit Mix(1) | ||||||||||
| Property Name | Occupancy % | One-Bedroom | Two-Bedroom | Three-Bedroom | Four-Bedroom | Total Units | Rent Stabilized / Controlled Units | Average SF Per Unit | Average Rent Per Unit Per Month | Average Rent Per SF Per Month |
| 165-167 Avenue A | 100.0% | 2 | 1 | 1 | 13 | 17 | 1 | 749 | $5,751 | $7.68 |
| 211 Avenue A | 100.0% | 19 | 9 | 7 | 0 | 35 | 12 | 591 | $2,815 | $4.77 |
| 201 East 2nd Street | 100.0% | 0 | 16 | 9 | 0 | 25 | 0 | 668 | $3,954 | $5.92 |
| 500 East 11th Street | 95.8% | 10 | 13 | 1 | 0 | 24 | 3 | 597 | $2,951 | $4.74 |
| 191-193 Avenue A | 100.0% | 4 | 2 | 3 | 0 | 9 | 3 | 756 | $3,045 | $4.03 |
| 143 First Avenue | 100.0% | 0 | 8 | 0 | 0 | 8 | 2 | 600 | $2,960 | $4.93 |
| 129 First Avenue | 100.0% | 3 | 5 | 0 | 0 | 8 | 2 | 613 | $2,855 | $4.66 |
| 435 East 12th Street | 100.0% | 11 | 6 | 0 | 1 | 18 | 7 | 633 | $2,593 | $4.09 |
| Total/Wtd. Avg. | 99.3% | 49 | 60 | 21 | 14 | 144 | 30 | 641 | $3,382 | $5.24 |
| (1) | Information is based on the underwritten rent roll dated August 13, 2019. |
The following table presents a summary regarding the major commercial tenants at the East Village Multifamily Portfolio Properties:
| Tenant Summary(1) | |||||||||
| Tenant Name | Credit Rating (Fitch/Moody's/ S&P)(2) | Tenant SF | Approx. % of Commercial SF | Annual UW Rent(3) | Annual UW Rent PSF(3)(4) | % of Total Annual UW Commercial Rent(3) | Renewal Options | Lease Expiration | |
| Term. Options (Y/N) | |||||||||
| 7-Eleven, Inc. | NR/NR/AA- | 2,875 | 16.0% | $369,307 | $128.45 | 16.4% | 1 x 3 Yrs | N | 10/31/2025 |
| Stand-Up MRI of Manhattan | NR/NR/NR | 2,105 | 11.7% | $236,039 | $112.13 | 10.5% | 2 x 3 Yrs | N | 7/18/2021 |
| Mamafinas | NR/NR/NR | 1,800 | 10.0% | $216,424 | $120.24 | 9.6% | 1 x 5 Yrs | N | 10/31/2027 |
| Peace and Love Hospitality LLC | NR/NR/NR | 1,456 | 8.1% | $177,397 | $121.84 | 7.9% | 1 x 5 Yrs | N | 4/30/2024 |
| Sage the Cat | NR/NR/NR | 1,416 | 7.9% | $116,348 | $82.17 | 5.2% | N/A | N | 9/30/2026 |
| Subtotal/Wtd. Avg. | 9,652 | 53.8% | $1,115,515 | $115.57 | 49.5% | ||||
| Other Tenants(5) | 8,278 | 46.2% | $1,137,700 | $137.44 | 50.5% | ||||
| Vacant | 0 | 0.0% | $0 | $0.00 | 0.0% | ||||
| Total/Wtd. Avg. | 17,930 | 100.0% | $2,253,215 | $125.67 | 100.0% | ||||
| (1) | Information is based on the underwritten rent roll as of August 13, 2019. |
| (2) | Certain ratings are those of the parent company whether or not the parent guarantees the lease. |
| (3) | Annual UW Rent, Annual UW Rent PSF, and % of Total Annual Commercial UW Rent includes underwritten rent steps through July 2020. |
| (4) | Total/Wtd. Avg. Annual UW Rent PSF excludes vacant space. |
| (5) | The remaining lease term of Other Tenants ranges from 0.6 years to 8.8 years, with a weighted average of 4.4 years. |
| This is not a research report and was not prepared by any Underwriter’s research department. It was prepared by the Underwriters’ sales, trading, banking or other non-research personnel. Please see additional important information and qualifications at the end of this Term Sheet. |
52
| Various | Loan #3 | Cut-off Date Balance: | $60,500,000 | |
| Various | East Village Multifamily Portfolio | Cut-off Date LTV: | 61.2% | |
| New York, NY Various | U/W NCF DSCR: | 2.07x | ||
| U/W NOI Debt Yield: | 7.0% |
The Market. The East Village Multifamily Portfolio Properties are located in New York, New York. The East Village Multifamily Portfolio Properties are located within the East Village neighborhood of Manhattan and have exposure along multiple streets. The East Village is a neighborhood in the southeast of Manhattan and traditionally bounded by 14th Street to the north, Houston Street to the south, the East River to the east and Third Avenue to the west. The immediate area surrounding the East Village Multifamily Portfolio Properties contains a mix of commercial, residential and light industrial uses. The nearest subway station is the 1st Avenue and 14th Street L Station and there are multiple bus lines within the neighborhood. Other nearby subway lines include the F, 4, 5, 6, N, Q, W, and R.
According to the appraisal, the East Village Multifamily Portfolio Properties are in the West Village/Downtown multifamily submarket of the New York City multifamily market. As of the second quarter of 2019, the West Village/Downtown multifamily submarket consisted of 27,220 units, and had an average vacancy of 4.0% and average asking rents of $4,733 per unit. As of the second quarter of 2019, the New York City multifamily market consisted of 219,294 units, and had an average vacancy of 4.5% and average asking rents of $3,783 per unit. According to the appraisal, the East Village Multifamily Portfolio Properties are also part of the East Village Retail market. As of the second quarter of 2019, the East Village Retail market consisted of 1,085,145 SF, and had an average vacancy of 1.5% and average asking rents of $129.89 PSF.
The following table presents certain information relating to comparable multifamily properties to the East Village Multifamily Portfolio Properties:
| Comparable Multifamily Properties | ||||
| Property Name | One-Bedroom Market Rent | Two-Bedroom Market Rent | Three-Bedroom Market Rent | Four-Bedroom Market Rent |
| 129 First Avenue | $3,100 | $3,650 | N/A | N/A |
| 143 First Avenue | N/A | $3,800 | N/A | N/A |
| 165-167 Avenue A | $3,000 | $3,400 | $5,000 | $6,500 |
| 191-193 Avenue A | $2,850 | $3,500 | $5,200 | N/A |
| 201 East 2nd Street | N/A | $3,650 | $5,000 | N/A |
| 211 Avenue A | $3,400 | $3,600 | $5,000 | N/A |
| 435 East 12th Street | $2,900 | $3,550 | NA | $6,700 |
| 500 East 11th Street | $3,200 | $3,650 | $5,000 | N/A |
| East Village Multifamily Portfolio(1) | $2,267 | $3,165 | $4,573 | $6,411 |
| Concluded Market Rent(2) | $2,850-$3,400 | $3,400-$3,800 | $5,000-$5,200 | $6,500-$6,700 |
Source:Appraisal
| (1) | Represents average in place contract rent at the East Village Multifamily Portfolio Properties as of August 13, 2019. |
| (2) | Represents Appraisal’s concluded market rent. |
The following table presents certain information relating to comparable retail leases to the East Village Multifamily Portfolio Properties:
| Comparable Retail Properties | |||||
| Property Address | Tenant Name | Size (SF) | Asking Rent PSF | Lease Term (Yrs) | Lease Type |
| 53-55 First Avenue | H. Brickman & Sons | 3,840 | $109.38 | 20 | Modified Gross |
| 195 Avenue A | Boris & Horton Dog Café | 1,100 | $136.00 | 10 | Modified Gross |
| 117 Avenue A | St. Dymphna’s | 2,000 | $113.97 | 5 | Modified Gross |
| 194 First Avenue | VVNS Teas | 1,050 | $129.00 | 5 | Modified Gross |
| 175 Avenue B | Khliadi | 1,300 | $120.00 | 10 | Modified Gross |
| 164 Ludlow Street | Ludlow | 1,800 | $120.00 | 3 | Modified Gross |
Source:Appraisal
| This is not a research report and was not prepared by any Underwriter’s research department. It was prepared by the Underwriters’ sales, trading, banking or other non-research personnel. Please see additional important information and qualifications at the end of this Term Sheet. |
53
| Various | Loan #3 | Cut-off Date Balance: | $60,500,000 | |
| Various | East Village Multifamily Portfolio | Cut-off Date LTV: | 61.2% | |
| New York, NY Various | U/W NCF DSCR: | 2.07x | ||
| U/W NOI Debt Yield: | 7.0% |
Operating History and Underwritten Net Cash Flow. The following table presents certain information relating to the historical operating performance and Underwritten Net Cash Flow at the East Village Multifamily Portfolio Properties:
| Cash Flow Analysis | ||||||
| 2016 | 2017 | 2018 | 7/31/2019 TTM | UW | UW per unit | |
| Residential Gross Potential Rent | $5,661,925 | $5,786,196 | $5,765,550 | $5,782,408 | $5,891,013 | $40,909.81 |
| Commercial Rent(1) | 2,009,452 | 2,053,163 | 2,099,071 | 2,115,999 | 2,253,215 | 15,647.32 |
| Total Reimbursement Revenue | 137,753 | 232,685 | 310,940 | 354,121 | 544,318 | 3,779.99 |
| Less Vacancy & Credit Loss | (332,027) | (282,502) | (251,225) | (181,701) | (434,427) | (3,016.86) |
| Gross Revenue | $7,477,103 | $7,789,541 | $7,924,335 | $8,070,827 | $8,254,119 | $57,320.27 |
| Other Revenue(2) | 164,875 | 110,995 | 136,889 | 131,461 | 131,461 | 912.92 |
| Effective Gross Income | $7,641,977 | $7,900,536 | $8,061,224 | $8,202,287 | $8,385,579 | $58,233.19 |
| Real Estate Taxes | $773,937 | $1,025,940 | $1,211,376 | $1,330,739 | $1,548,966 | $10,756.71 |
| Insurance | 66,636 | 64,525 | 103,365 | 74,870 | 59,039 | 409.99 |
| Other Expenses | 663,862 | 706,906 | 700,642 | 751,028 | 758,082 | 5,264.46 |
| Total Expenses | $1,504,435 | $1,797,370 | $2,015,383 | $2,156,636 | $2,366,088 | $16,431.16 |
| Net Operating Income | $6,137,543 | $6,103,166 | $6,045,841 | $6,045,651 | $6,019,492 | $41,802.02 |
| Replacement Reserves | 0 | 0 | 0 | 0 | 36,000 | 250.00 |
| TI/LC | 0 | 0 | 0 | 0 | 0 | 0.00 |
| Net Cash Flow | $6,137,543 | $6,103,166 | $6,045,841 | $6,045,651 | $5,983,492 | $41,552.02 |
| Occupancy % | 96.1% | 91.1% | 93.9% | 95.9% | 99.4%(3) | |
| NOI DSCR (IO)(4) | 2.12x | 2.11x | 2.09x | 2.09x | 2.08x | |
| NCF DSCR (IO)(4) | 2.12x | 2.11x | 2.09x | 2.09x | 2.07x | |
| NOI Debt Yield(4) | 7.2% | 7.1% | 7.1% | 7.1% | 7.0% | |
| NCF Debt Yield(4) | 7.2% | 7.1% | 7.1% | 7.1% | 7.0% | |
| (1) | Commercial Rent is based on contractual rents as of August 13, 2019 and contractual rent steps through July 2020. |
| (2) | Other Revenue consists of antenna income, residential utility reimbursement, various fees, and other miscellaneous income. |
| (3) | UW Occupancy represents physical occupancy as of August 13, 2019. |
| (4) | The debt service coverage ratios and debt yields are calculated based on the East Village Multifamily Portfolio Whole Loan. |
Escrows and Reserves.
Real Estate Taxes -The East Village Multifamily Portfolio Borrowers escrowed an initial real estate tax reserve of $580,862 at origination and are required to escrow monthly 1/12 of the annual estimated real estate taxes (initially, $129,081 per month).
Insurance -The East Village Multifamily Portfolio Borrowers are required to escrow monthly 1/12 of the annual estimated insurance premiums (unless the East Village Multifamily Portfolio Borrowers maintain acceptable blanket insurance policies).
Replacement Reserves –The East Village Multifamily Portfolio Borrowers are required to escrow monthly replacement reserves of 1/12 of $250 multiplied by the total number of residential units (initially, $3,000 per month).
Lockbox and Cash Management. The East Village Multifamily Portfolio Whole Loan is structured with a soft lockbox for residential tenants and a hard lockbox for commercial tenants and springing cash management. The East Village Multifamily Portfolio Borrowers are required to deposit all rents with respect to the residential component into a lender-controlled lockbox account within two business days of receipt. The related loan documents also require the East Village Multifamily Portfolio Borrowers to send tenant direction letters directing commercial tenants to pay rent directly to a lender-controlled lockbox account and all cash revenues relating to the East Village Multifamily Portfolio Properties and all other money received by the East Village Multifamily Portfolio Borrowers or the property manager with respect to the East Village Multifamily Portfolio Properties (other than tenant security deposits required to be held in escrow accounts) is required to be deposited into such lockbox account or cash management account within two business days of receipt. For so long as no East Village Multifamily Portfolio Cash Management Period (as defined below) under the East Village Multifamily Portfolio Whole Loan is continuing, all funds in the lockbox account are required to be swept into a borrower-controlled operating account on a daily basis. During the continuance of an East Village Multifamily Portfolio Cash Management Period, all funds in the lockbox account are required to be swept into the cash management account on a daily basis and all amounts on deposit in the cash management account after payment of debt service, required reserves (if the lender so elects, with respect to the continuance of an event of default) and operating expenses are required to be reserved in an excess cash flow reserve account.
An “East Village Multifamily Portfolio Cash Management Period” will commence upon: (a) trailing 12-month debt service coverage ratio as calculated under the loan documents as of any calendar quarter is less than 1.35x until the debt service coverage ratio is at least 1.35x for two consecutive calendar quarters, (b) upon the stated maturity date until the East Village Multifamily Whole Loan is repaid in full, or (c) an event of default until cured. During any East Village Multifamily Portfolio Cash Management Period, if the rent for any reregulated unit is decreased as a result of any claim of a violation of rent regulations, the East Village Multifamily Portfolio Borrowers are required to pay to the lender an amount equal to the amount by which the monthly rent disclosed to the lender on the most recently provided rent roll exceeds the monthly rent then being legally charged to the tenant under such lease. Any losses to the lender pursuant to the preceding sentence are recourse to the guarantor.
| This is not a research report and was not prepared by any Underwriter’s research department. It was prepared by the Underwriters’ sales, trading, banking or other non-research personnel. Please see additional important information and qualifications at the end of this Term Sheet. |
54
| Various | Loan #3 | Cut-off Date Balance: | $60,500,000 | |
| Various | East Village Multifamily Portfolio | Cut-off Date LTV: | 61.2% | |
| New York, NY Various | U/W NCF DSCR: | 2.07x | ||
| U/W NOI Debt Yield: | 7.0% |
Additional Secured Indebtedness. In addition to the East Village Multifamily Portfolio Mortgage Loan, the East Village Multifamily Portfolio Properties also secure the East Village Multifamily PortfolioPari Passu Companion Loans, which have an aggregate Cut-off Date principal balance of $25,000,000. The East Village Multifamily PortfolioPari Passu Companion Loans accrue interest at the same rate as the East Village Multifamily Portfolio Mortgage Loan. The East Village Multifamily Portfolio Mortgage Loan ispari passu in right of payment with the East Village Multifamily PortfolioPari Passu Companion Loans. The holders of the East Village Multifamily Portfolio Mortgage Loan and the East Village Multifamily PortfolioPari Passu Companion Loans have entered into a co-lender agreement which sets forth the allocation of collections on the East Village Multifamily Portfolio Whole Loan. See “Description of the Mortgage Pool—The Whole Loans” in the Preliminary Prospectus.
Mezzanine Loan and Preferred Equity.Not permitted.
Release of Property. Provided no event of default under the East Village Multifamily Portfolio Whole Loan has occurred and is continuing, the East Village Multifamily Portfolio Borrowers have the right to obtain the release of one or more of the East Village Multifamily Portfolio Properties upon a third-party sale and after the earlier to occur of (i) the second anniversary of the closing date of the securitization into which the last East Village Multifamily Portfolio Companion Loan is deposited and (ii) September 9, 2022 subject to the satisfaction of certain conditions, including, among others: (i) delivery of defeasance collateral in an amount equal to the greater of (a) 115% of the allocated loan amount of the individual property being released or (b) 100% of the net sales proceeds, (ii) after giving effect to such release, the loan to value ratio for the remaining properties is not greater than the lesser of (x) 61.16% (the East Village Multifamily Portfolio Whole Loan loan to value ratio at origination) and (y) the loan to value ratio for the East Village Multifamily Portfolio Properties including such released individual property immediately prior to such release, (iii) after giving effect to such release, the debt yield for the remaining East Village Multifamily Portfolio Properties is not less than the greater of (x) 7.0% and (y) the debt yield for the East Village Multifamily Portfolio Properties immediately prior to such release, and (iv) compliance with REMIC requirements.
Right of First Offer/Right of First Refusal.None.
Ground Lease. None.
Letter of Credit. None.
Terrorism Insurance. The East Village Multifamily Portfolio Borrowers are required to maintain terrorism insurance in an amount equal to the full replacement cost of the East Village Multifamily Portfolio Properties, as well as 18 months of rental loss and/or business interruption coverage, together with a six month extended period of indemnity following restoration. If TRIPRA is no longer in effect, then the East Village Multifamily Portfolio Borrowers’ requirement will be capped at insurance premiums equal to two times the amount of the insurance premium payable in respect of the property and business interruption/rental loss insurance required under the related loan documents. See“Risk Factors—Terrorism Insurance May Not Be Available for All Mortgaged Properties” in the Preliminary Prospectus.
| This is not a research report and was not prepared by any Underwriter’s research department. It was prepared by the Underwriters’ sales, trading, banking or other non-research personnel. Please see additional important information and qualifications at the end of this Term Sheet. |
55
| Retail – Specialty Retail | Loan #4 | Cut-off Date Balance: | $53,846,154 | |
| 3327 & 3377 Las Vegas Boulevard South | Grand Canal Shoppes | Cut-off Date LTV: | 46.3% | |
| Las Vegas, NV 89109 | U/W NCF DSCR: | 2.46x | ||
| U/W NOI Debt Yield: | 9.6% |

| This is not a research report and was not prepared by any Underwriter’s research department. It was prepared by the Underwriters’ sales, trading, banking or other non-research personnel. Please see additional important information and qualifications at the end of this Term Sheet. |
56
| Retail – Specialty Retail | Loan #4 | Cut-off Date Balance: | $53,846,154 | |
| 3327 & 3377 Las Vegas Boulevard South | Grand Canal Shoppes | Cut-off Date LTV: | 46.3% | |
| Las Vegas, NV 89109 | U/W NCF DSCR: | 2.46x | ||
| U/W NOI Debt Yield: | 9.6% |

| This is not a research report and was not prepared by any Underwriter’s research department. It was prepared by the Underwriters’ sales, trading, banking or other non-research personnel. Please see additional important information and qualifications at the end of this Term Sheet. |
57
| Retail – Specialty Retail | Loan #4 | Cut-off Date Balance: | $53,846,154 | |
| 3327 & 3377 Las Vegas Boulevard South | Grand Canal Shoppes | Cut-off Date LTV: | 46.3% | |
| Las Vegas, NV 89109 | U/W NCF DSCR: | 2.46x | ||
| U/W NOI Debt Yield: | 9.6% |
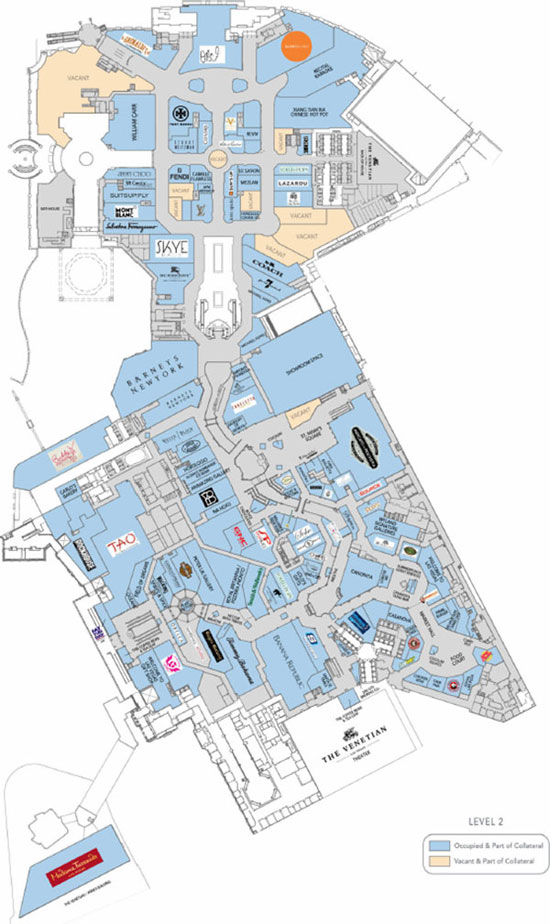
| This is not a research report and was not prepared by any Underwriter’s research department. It was prepared by the Underwriters’ sales, trading, banking or other non-research personnel. Please see additional important information and qualifications at the end of this Term Sheet. |
58
| Retail – Specialty Retail | Loan #4 | Cut-off Date Balance: | $53,846,154 | |
| 3327 & 3377 Las Vegas Boulevard South | Grand Canal Shoppes | Cut-off Date LTV: | 46.3% | |
| Las Vegas, NV 89109 | U/W NCF DSCR: | 2.46x | ||
| U/W NOI Debt Yield: | 9.6% |

| This is not a research report and was not prepared by any Underwriter’s research department. It was prepared by the Underwriters’ sales, trading, banking or other non-research personnel. Please see additional important information and qualifications at the end of this Term Sheet. |
59
| Retail – Specialty Retail | Loan #4 | Cut-off Date Balance: | $53,846,154 | |
| 3327 & 3377 Las Vegas Boulevard South | Grand Canal Shoppes | Cut-off Date LTV: | 46.3% | |
| Las Vegas, NV 89109 | U/W NCF DSCR: | 2.46x | ||
| U/W NOI Debt Yield: | 9.6% |

| This is not a research report and was not prepared by any Underwriter’s research department. It was prepared by the Underwriters’ sales, trading, banking or other non-research personnel. Please see additional important information and qualifications at the end of this Term Sheet. |
60
| Mortgage Loan No. 4 – Grand Canal Shoppes |
| Mortgage Loan Information | Property Information |
| Mortgage Loan Seller(1): | MSMCH | Single Asset/Portfolio: | Single Asset | |||
| Credit Assessment (KBRA/Fitch/S&P): | A-/BBB-/NR | Location: | Las Vegas, NV 89109 | |||
| Original Balance(1): | $53,846,154 | General Property Type: | Retail | |||
| Cut-off Date Balance(1): | $53,846,154 | Detailed Property Type: | Specialty Retail | |||
| % of Initial Pool Balance: | 5.3% | Title Vesting: | Fee/Leasehold | |||
| Loan Purpose: | Refinance | Year Built/Renovated: | 1999/2007 | |||
| Borrower Sponsors: | Brookfield Properties REIT Inc.; Nuveen | Size(6): | 759,891 SF | |||
| Real Estate | Cut-off Date Balance per SF(1)(6): | $1,000 | ||||
| Guarantor: | BPR Nimbus LLC | Maturity Date Balance per SF(1)(6): | $1,000 | |||
| Mortgage Rate(2): | 3.7408% | Property Manager: | Brookfield Properties Retail Inc. | |||
| Note Date: | 6/3/2019 | (borrower-related) | ||||
| First Payment Date: | 8/1/2019 | |||||
| Maturity Date: | 7/1/2029 | |||||
| Original Term to Maturity: | 120 months | |||||
| Original Amortization Term: | 0 months | |||||
| IO Period: | 120 months | Underwriting and Financial Information | ||||
| Seasoning: | 4 months | UW NOI: | $73,021,709 | |||
| Prepayment Provisions(3): | LO (28); DEF (87); O (5) | UW NOI Debt Yield(1): | 9.6% | |||
| Lockbox/Cash Mgmt Status: | Hard/Springing | UW NOI Debt Yield at Maturity(1): | 9.6% | |||
| Additional Debt Type(1)(4): | Pari Passu/ Subordinate | UW NCF DSCR(1): | 2.46x | |||
| Additional Debt Balance(1)(4): | $706,153,846 / $215,000,000 | Most Recent NOI: | $71,465,811 (3/31/2019 TTM) | |||
| Future Debt Permitted (Type): | No (N/A) | 2nd Most Recent NOI: | $71,326,473 (12/31/2018) | |||
| Reserves(5) | 3rd Most Recent NOI: | $74,425,947 (12/31/2017) | ||||
| Type | Initial | Monthly | Cap | Most Recent Occupancy: | 94.0% (5/31/2019) | |
| RE Tax: | $0 | Springing | N/A | 2nd Most Recent Occupancy: | 93.3% (12/31/2018) | |
| Insurance: | $0 | Springing | N/A | 3rd Most Recent Occupancy: | 93.0% (12/31/2017) | |
| Recurring Replacements: | $0 | Springing | $386,928 | Appraised Value (as of): | $1,640,000,000 (4/3/2019) | |
| TI/LC: | $12,309,694 | Springing | $2,321,544 | Appraised Value per SF(6): | $2,158 | |
| Ground Rent: | $0 | Springing | N/A | Cut-off Date LTV Ratio(1): | 46.3% | |
| Gap Rent Reserve Funds: | $1,218,246 | $0 | N/A | Maturity Date LTV Ratio(1): | 46.3% | |
| Sources and Uses | ||||||
| Sources | Proceeds | % of Total | Uses | Proceeds | % of Total | |
| Senior Loan Amount(1): | $760,000,000 | 77.9% | Loan Payoff: | $627,284,452 | 64.3% | |
| Subordinate Companion Loan: | $215,000,000 | 22.1% | Return of Equity: | $333,044,567 | 34.2% | |
| Upfront Reserves: | $13,527,940 | 1.4% | ||||
| Closing Costs: | $1,143,041 | 0.1% | ||||
| Total Sources: | $975,000,000 | 100.0% | Total Uses: | $975,000,000 | 100.0% | |
| (1) | The Grand Canal Shoppes Mortgage Loan (as defined below) is part of the Grand Canal Shoppes Whole Loan (as defined below), which is comprised of 25pari passu senior promissory notes with an aggregate original principal balance of $760,000,000 (the “Senior Notes” and, collectively, the “Grand Canal Shoppes Senior Loan”) and one promissory note that is subordinate to the Senior Notes with an original principal balance of $215,000,000 (the “Grand Canal Shoppes Subordinate Companion Loan” and, together with the Grand Canal Shoppes Senior Loan, the “Grand Canal Shoppes Whole Loan”). The Cut-off Date Balance per SF, Maturity Date Balance per SF, UW NOI Debt Yield, UW NOI Debt Yield at Maturity, UW NCF DSCR, Cut-off Date LTV Ratio and Maturity Date LTV Ratio numbers presented above are based on the aggregate principal balance of the promissory notes comprising the Grand Canal Shoppes Senior Loan, without regard to the Grand Canal Shoppes Subordinate Companion Loan. The Cut-off Date Balance per SF, Maturity Date Balance per SF, UW NOI Debt Yield, UW NOI Debt Yield at Maturity, UW NCF DSCR, Cut-off Date LTV Ratio and Maturity Date LTV Ratio numbers based on the combined balance of the entire Grand Canal Shoppes Whole Loan are $1,283, $1,283, 7.5%, 7.5%, 1.67x, 59.5% and 59.5%, respectively. The Grand Canal Shoppes Whole Loan was co-originated by Morgan Stanley Bank, N.A. (“MSBNA”), JPMorgan Chase Bank, National Association (“JPMCB”), Goldman Sachs Bank USA (“GSB”) and Wells Fargo Bank, N.A. (“WFB”) on June 3, 2019. Note A-3-4 was subsequently transferred to Cantor Commercial Real Estate Lending, L.P. (“CCRE”). |
| (2) | Reflects the Senior Notes only. The Grand Canal Shoppes Subordinate Companion Loan accrues interest at the rate of 6.25%per annum. |
| (3) | Defeasance of the Grand Canal Shoppes Whole Loan is permitted at any time after the earlier to occur of (a) the end of the two-year period commencing on the closing date of the securitization of the last Grand Canal Shoppes Whole Loan promissory note to be securitized and (b) June 3, 2022. The assumed defeasance lockout period of 28 payments is based on the closing date of this transaction in November 2019. |
| (4) | See “The Mortgage Loan” and “Additional Secured Indebtedness (not including trade debts)” below for further discussion of additional debt. |
| (5) | See “Escrows and Reserves” below for further discussion of reserve requirements. |
| (6) | Size excludes the 84,743 SF space currently leased to Barneys New York. This space is included in the collateral; however, the Grand Canal Shoppes Whole Loan documents permit a free release with respect to such space. As such, no value or rental income has been attributed to this space. |
| This is not a research report and was not prepared by any Underwriter’s research department. It was prepared by the Underwriters’ sales, trading, banking or other non-research personnel. Please see additional important information and qualifications at the end of this Term Sheet. |
61
| Retail – Specialty Retail | Loan #4 | Cut-off Date Balance: | $53,846,154 | |
| 3327 & 3377 Las Vegas Boulevard South | Grand Canal Shoppes | Cut-off Date LTV: | 46.3% | |
| Las Vegas, NV 89109 | U/W NCF DSCR: | 2.46x | ||
| U/W NOI Debt Yield: | 9.6% |
The Mortgage Loan. The fourth largest mortgage loan (the “Grand Canal Shoppes Mortgage Loan”) is part of the Grand Canal Shoppes Whole Loan in the original principal balance of $975,000,000. The Grand Canal Shoppes Whole Loan is secured by a first priority fee and leasehold mortgage encumbering a 759,891 SF retail center located in Las Vegas, Nevada (the “Grand Canal Shoppes Property”). The Grand Canal Shoppes Whole Loan was co-originated by MSBNA, JPMCB, GSB and WFB on June 3, 2019. The Grand Canal Shoppes Whole Loan is comprised of 25 promissory notes, which arepari passu with each other, with an aggregate original principal balance of $760,000,000, and one subordinate promissory note in the original principal balance of $215,000,000. The non-controlling Notes A-1-3 and A-1-5, in the original aggregate principal balance of $53,846,154, together evidence the Grand Canal Shoppes Mortgage Loan and will be included in the MSC 2019-L3 securitization trust. The remaining Senior Notes (collectively, the “Grand Canal Shoppes Non-ServicedPari PassuCompanion Loans”), which had an aggregate original principal balance of $706,153,846, have been or are expected to be contributed in the future to one or more securitization transactions or may be otherwise transferred at any time. The Grand Canal Shoppes Whole Loan will be serviced pursuant to the pooling and servicing agreement for the MSC 2019-H7 securitization trust. See “Description of the Mortgage Pool—The Whole Loans—The Non-Serviced Pari Passu-A/B Whole Loans—The Grand Canal Shoppes Whole Loan”and “Pooling and Servicing Agreement—Servicing of the Non-Serviced Mortgage Loans” in the Preliminary Prospectus.
| Grand Canal Shoppes Whole Loan Summary | ||||
| Notes | Original Balance | Cut-off Date Balance | Anticipated Note Holder | Controlling Piece |
| Grand Canal Shoppes Mortgage Loan | ||||
| A-1-3 and A-1-5 | $53,846,154 | $53,846,154 | MSC 2019-L3 | No |
| Grand Canal Shoppes Non-ServicedPari Passu Companion Loans | ||||
| A-1-1 | $60,000,000 | $60,000,000 | MSC 2019-H7 | No(1) |
| A-1-2 | $50,000,000 | $50,000,000 | BANK 2019-BNK19 | No |
| A-1-4 | $40,000,000 | $40,000,000 | BANK 2019-BNK21 | No |
| A-1-6 | $10,000,000 | $10,000,000 | MSC 2019-H7 | No |
| A-1-7 | $10,000,000 | $10,000,000 | BANK 2019-BNK20 | No |
| A-1-8 | $10,000,000 | $10,000,000 | BANK 2019-BNK20 | No |
| A-2-1 | $50,000,000 | $50,000,000 | BANK 2019-BNK19 | No |
| A-2-2-1 | $20,000,000 | $20,000,000 | BANK 2019-BNK20 | No |
| A-2-2-2 | $30,000,000 | $30,000,000 | CSAIL 2019-C17 | No |
| A-2-3 | $40,000,000 | $40,000,000 | UBS 2019-C17 | No |
| A-2-4 | $25,000,000 | $25,000,000 | UBS AG | No |
| A-2-5 | $10,384,615 | $10,384,615 | UBS 2019-C17 | No |
| A-3-1 | $50,000,000 | $50,000,000 | Benchmark 2019-B12 | No |
| A-3-2 | $50,000,000 | $50,000,000 | Benchmark 2019-B13 | No |
| A-3-3-1 | $20,000,000 | $20,000,000 | Benchmark 2019-B14(2) | No |
| A-3-3-2 | $20,000,000 | $20,000,000 | JPMCB | No |
| A-3-4 | $25,000,000 | $25,000,000 | CF 2019-CF2 | No |
| A-3-5 | $10,384,615 | $10,384,615 | Benchmark 2019-B14(2) | No |
| A-4-1 | $60,000,000 | $60,000,000 | CGCMT 2019-GC41 | No |
| A-4-2 | $60,000,000 | $60,000,000 | GSB | No |
| A-4-3 | $20,000,000 | $20,000,000 | GSMS 2019-GC42 | No |
| A-4-4 | $25,000,000 | $25,000,000 | GSB | No |
| A-4-5 | $10,384,615 | $10,384,615 | GSB | No |
| Grand Canal Shoppes Subordinate Companion Loan | ||||
| B | $215,000,000 | $215,000,000 | CPPIB Credit Investments II Inc. | Yes(1) |
| Total | $975,000,000 | $975,000,000 | ||
| (1) | The holder of the Grand Canal Shoppes Subordinate Companion Loan will have the right to appoint the special servicer of the Grand Canal Shoppes Whole Loan and to direct certain decisions with respect to the Grand Canal Shoppes Whole Loan, unless a control appraisal event exists under the related co-lender agreement (in which case Note A-1-1 will be the controlling note). The Grand Canal Shoppes Whole Loan will be serviced pursuant to the pooling and servicing agreement for the MSC 2019-H7 securitization. |
| (2) | Anticipated to be contributed to the Benchmark 2019-B14 securitization upon the closing of such transaction. |
The Borrower and the Borrower Sponsors. The borrowers are Grand Canal Shops II, LLC and The Shoppes at the Palazzo, LLC, each organized as a Delaware limited liability company and each structured to be bankruptcy remote with two independent directors (the “Grand Canal Shoppes Borrowers”).
The borrower sponsors are Brookfield Properties REIT Inc. and Nuveen Real Estate, and the non-recourse carveout guarantor is BPR Nimbus LLC (the “Grand Canal Shoppes Guarantor”), an affiliate of Brookfield Properties REIT Inc.
Brookfield Properties REIT Inc. ranks among the largest retail real estate companies in the United States. Its portfolio of mall properties spans the nation, encompassing 170 locations across 42 states and representing over 146 million SF of retail space. The company is focused on managing, leasing and redeveloping retail properties.
Nuveen Real Estate is the investment management arm of Teachers Insurance and Annuity Association. Nuveen Real Estate manages various funds and mandates, across both public and private investments and spanning both debt and equity, and has over 80 years of real estate investing experience and more than 500 employees located across over 20 cities throughout the United States, Europe and Asia Pacific.
| This is not a research report and was not prepared by any Underwriter’s research department. It was prepared by the Underwriters’ sales, trading, banking or other non-research personnel. Please see additional important information and qualifications at the end of this Term Sheet. |
62
| Retail – Specialty Retail | Loan #4 | Cut-off Date Balance: | $53,846,154 | |
| 3327 & 3377 Las Vegas Boulevard South | Grand Canal Shoppes | Cut-off Date LTV: | 46.3% | |
| Las Vegas, NV 89109 | U/W NCF DSCR: | 2.46x | ||
| U/W NOI Debt Yield: | 9.6% |
The Property. The Grand Canal Shoppes Property is a 759,891 SF specialty retail center that predominantly comprises the first-, second- and third-levels of the Venetian Hotel and Casino and Palazzo Resort and Casino. The Grand Canal Shoppes Property opened in 1999, with an expansion in conjunction with the completion of The Palazzo in 2007, and is anchored by an 84,743 SF, three level Barneys New York. Barneys New York was part of the collateral for the Grand Canal Shoppes Whole Loan at loan origination, but the Grand Canal Shoppes Borrowers have the right to obtain a free release of the Barneys Parcel (as defined below). At origination, no value or rental income was attributed to the Barneys Parcel.
The Venetian Hotel and Casino and Palazzo Resort and Casino are luxury hotels and casino resorts situated within the southeast quadrant of Las Vegas Boulevard and Sands Avenue. The Venetian Hotel and Casino and the Palazzo Resort and Casino are owned and operated by Las Vegas Sands. The overall resort complex is the largest on The Strip (as defined below), and includes 4,049 rooms within The Venetian, 3,068 rooms/suites within The Palazzo, and 225,000 SF of gaming space (combined), none of which are collateral for the Grand Canal Shoppes Whole Loan. The Grand Canal Shoppes Property is physically connected to the Venetian Hotel and Casino and the Palazzo Resort and Casino, which combine to create a large hotel and resort complex with over 7,000 hotel rooms, 2.3 million SF of meeting space,one million SF of retail space and more than 30 restaurants. In addition, the Grand Canal Shoppes Property is within walking distance to over 140,000 hotel rooms.
The Grand Canal Shoppes Property is situated across 21.1 acres of land along the central portion of Las Vegas Boulevard (“The Strip”). The Grand Canal Shoppes Property is a premier shopping, entertainment, and dining venue in Las Vegas featuring a unique Venetian-inspired setting with luxury retailers and restaurant concepts. Attractions include a gondola ride through the canals of the Grand Canal Shoppes Property as well as showroom/theater space for live performances.
The Grand Canal Shoppes Property is currently 94.0% leased as of May 31, 2019. According to the appraisal, the Grand Canal Shoppes Property generates average mall shop sales of over $1,000 PSF. The Grand Canal Shoppes Property generated $427.6 million in gross sales with comparable in-line sales of $1,182 PSF as of the trailing twelve months ended February 28, 2019. The Grand Canal Shoppes Property generates over 60% of its top-line revenue from food and entertainment offerings, including restaurants such as Tao Asian Bistro, which features a night and beach club, Grand Lux Café, Sushi Samba, Delmonico Steakhouse, Cut by Wolfgang Puck, Smith & Wollensky, Verdugo West Brewery, Xiang Tian Xia Chinese Hot Pot and Recital Karaoke, among others. Noteworthy luxury retailers at the Grand Canal Shoppes Property include Louis Vuitton, Salvatore Ferragamo, Fendi and Jimmy Choo.
From 2015 through January 2019, capital expenditures, inclusive of development capital and landlord work, of approximately $20.3 million ($26.70 PSF) were invested in the Grand Canal Shoppes Property. In addition, there is a planned renovation and redevelopment of the common areas within the shopping areas above The Palazzo. Ownership is budgeting approximately $12.0 million to improve lighting and finishes, in an attempt to maintain existing and attract new tenants to this portion of the Grand Canal Shoppes Property. According to management, renovations began in September 2019. In addition, renovation, new finishes and lighting are expected to be completed in conjunction with a proposed, 27,422 SF international food hall proposed to be completed in 2020. Such renovation and redevelopment, as well as development of the new food hall, are not required by or reserved for under the Grand Canal Shoppes Whole Loan documents, and we cannot assure you that any such renovation, redevelopment or food hall development will be effected.
The following table presents a summary of historical tenant sales at the Grand Canal Shoppes Property:
| Historical Tenant Sales Summary(1) | ||||||
| 2015 | 2016 | 2017 | 2018 | TTM February 2019 Sales | TTM February 2019 Sales PSF | |
| Anchor/Major Sales | $129,599,970 | $129,282,829 | $130,862,228 | $138,705,093 | $140,317,346 | $1,046 |
| Comparable In-Line Sales | $200,973,916 | $207,912,708 | $223,524,143 | $244,916,086 | $244,795,176 | $1,154 |
| Comparable Food Court Sales | $17,055,210 | $19,744,070 | $21,275,466 | $23,538,795 | $23,688,945 | $1,580 |
| (1) | Information as provided by the borrower sponsor and only includes tenants reporting sales. |
The Grand Canal Shoppes Property is anchored by 18 major tenants, which combined generate approximately $140.3 million in annual sales as of TTM February 2019. Since 2015, the Grand Canal Shoppes Property’s sales performance has steadily increased year-over-year, growing 21.4% over this period. Furthermore, comparable sales have consistently exceeded $1,100 PSF reaching $1,182 PSF as of TTM February 2019.
The first floor of Barneys New York and the casino level (ground floor) space are leased by the Grand Canal Shoppes Borrowers, pursuant to air rights ground leases, which do not include the underlying land. The casino level space consists of restaurants and retail shops contained on the casino levels (ground floor) of the Venetian Hotel and Casino and the Palazzo Resort and Casino. The ground lease for the casino level of the Venetian Hotel and Casino portion of the Grand Canal Shoppes Property expires in 2093, and the ground lease for the casino level of the Palazzo Resort and Casino portion of the Grand Canal Shoppes Property expires in 2097. Each of the annual rents for these leases is $1 and the Grand Canal Shoppes Borrowers have the option to purchase the premises for $1 on the respective expiration dates. The remaining collateral, except for the Walgreens air rights lease space, is owned in fee. A portion of the fee is located at the ground level (the retail annex), with the majority fee located on levels 2 and 3. The collateral is part of a vertical subdivision;i.e. the fee ownership is solely of the designated space on the ground level and levels 2 and 3, and doesn’t include the land. A reciprocal easement agreement governs the relationship among the owner of the Grand Canal Shoppes Property and the owners of other interests in the complex that includes the Venetian Hotel and Casino and the Palazzo Resort and Casino. The Walgreens air rights lease space refers to the air rights above the Walgreens space (the Walgreens space itself is owned by a third party), for which the air rights lease expires in 2064 with one, 40 year extension option. The Walgreens air rights space is currently occupied by Buddy V's Ristorante and Carlo’s Bakery (12,839 SF, 1.5% of underwritten base rent). The Venetian Hotel and Casino subleases a portion of the air rights parcel from the Grand Canal Shoppes Borrowers pursuant to a separate sublease. The Venetian Hotel and Casino is responsible under its sublease for an amount equal to 80.68% of the ground rent under the Walgreens lease.
| This is not a research report and was not prepared by any Underwriter’s research department. It was prepared by the Underwriters’ sales, trading, banking or other non-research personnel. Please see additional important information and qualifications at the end of this Term Sheet. |
63
| Retail – Specialty Retail | Loan #4 | Cut-off Date Balance: | $53,846,154 | |
| 3327 & 3377 Las Vegas Boulevard South | Grand Canal Shoppes | Cut-off Date LTV: | 46.3% | |
| Las Vegas, NV 89109 | U/W NCF DSCR: | 2.46x | ||
| U/W NOI Debt Yield: | 9.6% |
Pursuant to the reciprocal easement and ground lease documents, transfers (other than to a lender in connection with foreclosure or delivery of a deed-in-lieu of foreclosure of a mortgage secured by the Grand Canal Shoppes Property or the first subsequent transferee from the lender) of the Grand Canal Shoppes Property are subject to certain transfer restrictions. Additionally, under such documents, Venetian Casino Resort, LLC has the right to cure certain defaults of the Grand Canal Shoppes Borrowers under the Grand Canal Shoppes Whole Loan. See also “Right of First Offer/Right of First Refusal” below.
Historical and Current Occupancy(1) | ||||||
| 2014 | 2015 | 2016 | 2017 | 2018 | Current(2) | |
| The Venetian Hotel and Casino | 95.1% | 92.6% | 98.3% | 95.7% | 99.1% | 97.1% |
| Palazzo Resort and Casino | 88.2% | 89.5% | 86.2% | 88.4% | 83.0% | 86.2% |
| Total/Wtd. Avg. | 92.6% | 91.5% | 93.9% | 93.0% | 93.3% | 94.0% |
| (1) | Historical occupancy provided by the borrower sponsor. |
| (2) | Current occupancy is based on the May 31, 2019 underwritten rent roll. |
The following table presents certain information relating to the major tenants at the Grand Canal Shoppes Property:
| Tenant Summary(1) | |||||||||||
| Tenant Name | Credit Rating (Fitch/Moody’s/ S&P)(2) | Tenant SF | Approx. % of SF | Annual UW Rent(3) | % of Annual UW Rent | Annual UW Rent PSF(4) | TTM February 2019 Sales | Term. Options | Lease Expiration | ||
| $ | PSF | Occ. Cost %(5) | |||||||||
| Major Tenants | |||||||||||
| Emporio D'Gondola(6) | NR/NR/NR | 922 | 0.1% | $4,051,692 | 6.0% | $4,394.46 | NAV | NAV | NAV | N | 5/31/2029 |
| The Venetian Resort (Showroom/Theater) | BBB-/NR/BBB- | 38,920 | 5.1% | $4,051,619 | 6.0% | $104.10 | NAV | NAV | NAV | N | 5/31/2029 |
| Regis Galerie(7) | NR/NR/NR | 28,099 | 3.7% | $2,367,955 | 3.5% | $84.27 | $7,010,021 | $249 | 33.8% | N | Various |
| Sephora | NR/NR/A+ | 10,074 | 1.3% | $2,299,995 | 3.4% | $228.31 | NAV | NAV | NAV | N | 7/31/2021 |
| Welcome to Las Vegas(8) | NR/NR/NR | 14,234 | 1.9% | $2,000,502 | 3.0% | $140.54 | $6,612,970 | $465 | 30.3% | N | Various |
| Grand Lux Café | NR/NR/NR | 19,100 | 2.5% | $1,463,633 | 2.2% | $76.63 | $21,992,535 | $1,151 | 6.7% | N | 12/31/2029 |
| CUT By Wolfgang Puck | NR/NR/NR | 12,247 | 1.6% | $1,261,441 | 1.9% | $103.00 | $14,171,737 | $1,157 | 8.9% | N | 5/31/2028 |
| Mercato Della Pescheria | NR/NR/NR | 16,479 | 2.2% | $1,131,448 | 1.7% | $68.66 | $9,158,574 | $556 | 12.4% | N | 11/30/2025 |
| Bellusso Jewelry | NR/NR/NR | 2,999 | 0.4% | $1,068,964 | 1.6% | $356.44 | $8,173,547 | $2,725 | 13.1% | N | 11/30/2022 |
| Golden Gai | NR/NR/NR | 12,820 | 1.7% | $1,034,959 | 1.5% | $80.73 | NAV | NAV | NAV | N | 12/31/2029 |
| TAO Asian Bistro | NR/NR/NR | 15,175 | 2.0% | $980,002 | 1.5% | $64.58 | $35,724,404 | $2,354 | 2.7% | N | 1/31/2025 |
| Peter Lik Gallery | NR/NR/NR | 4,394 | 0.6% | $979,686 | 1.5% | $222.96 | $3,859,320 | $878 | 25.4% | N | 8/31/2021 |
| Smith & Wollensky | NR/NR/NR | 14,751 | 1.9% | $942,502 | 1.4% | $63.89 | NAV | NAV | NAV | N | 6/30/2028 |
| Michael Kors(9) | BBB-/NR/BBB- | 4,066 | 0.5% | $917,907 | 1.4% | $225.75 | $3,264,594 | $803 | 28.1% | N | Various |
| Recital Karaoke | NR/NR/NR | 14,062 | 1.9% | $897,999 | 1.3% | $63.86 | NAV | NAV | NAV | N | 2/28/2029 |
| Subtotal/Wtd. Avg. | 208,342 | 27.4% | $25,450,304 | 38.0% | $122.16 | ||||||
| Other Tenants | 506,286 | 66.6% | $41,584,578 | 62.0% | $82.14 | ||||||
| Vacant Space | 45,263 | 6.0% | $0 | 0.0% | $0.00 | ||||||
| Total/Wtd. Avg. | 759,891 | 100.0% | $67,034,881 | 100.0% | $93.80 | ||||||
| (1) | Information is based on the underwritten rent roll. Tenants are listed in order of underwritten rent. |
| (2) | Certain ratings are those of the parent company whether or not the parent guarantees the lease. |
| (3) | Total/Wtd. Avg. Annual UW Rent reflects the following: (a) in-place leases based on the May 2019 rent roll and (b) contractual rent steps of $2,184,628 through May 31, 2020. |
| (4) | Total/Wtd. Avg. Annual UW Rent PSF excludes vacant space. |
| (5) | Occ. Cost % is based on the underwritten rent as of the May 31, 2019 rent roll divided by the most recently reported sales. |
| (6) | This tenant operates as the gondola attraction at the Grand Canal Shoppes Property. |
| (7) | Regis Galerie has 8,406 SF expiring on December 31, 2020, 4,654 SF expiring on February 29, 2020 and 15,039 SF expiring on May 31, 2025. |
| (8) | The Welcome to Las Vegas lease commencement is expected to be February 1, 2020. Gap rent was reserved by the lender at origination. 10,239 SF is expiring on December 31, 2020 and the remaining 3,995 SF is expiring on January 31, 2030. |
| (9) | Michael Kors has 3,733 SF expiring on January 31, 2026 and 333 SF expiring on March 31, 2020. |
| This is not a research report and was not prepared by any Underwriter’s research department. It was prepared by the Underwriters’ sales, trading, banking or other non-research personnel. Please see additional important information and qualifications at the end of this Term Sheet. |
64
| Retail – Specialty Retail | Loan #4 | Cut-off Date Balance: | $53,846,154 | |
| 3327 & 3377 Las Vegas Boulevard South | Grand Canal Shoppes | Cut-off Date LTV: | 46.3% | |
| Las Vegas, NV 89109 | U/W NCF DSCR: | 2.46x | ||
| U/W NOI Debt Yield: | 9.6% |
The following table presents certain information relating to the lease rollover at the Grand Canal Shoppes Property:
| Lease Rollover Schedule(1)(2) | ||||||||
| Year | # of Leases Rolling | SF Rolling | Annual UW Rent PSF Rolling(3) | Approx. % of Total SF Rolling | Approx. Cumulative % of SF Rolling | Total UW Rent Rolling(4) | Approx. % of Total Rent Rolling | Approx. Cumulative % of Total Rent Rolling |
| MTM | 3 | 2,080 | $0.00 | 0.3% | 0.3% | $0 | 0.0% | 0.0% |
| 2019 | 17 | 39,567 | $61.58 | 5.2% | 5.5% | $2,436,560 | 3.6% | 3.6% |
| 2020 | 26 | 80,052 | $55.90 | 10.5% | 16.0% | $4,475,224 | 6.7% | 10.3% |
| 2021 | 16 | 28,634 | $200.74 | 3.8% | 19.8% | $5,748,002 | 8.6% | 18.9% |
| 2022 | 13 | 35,084 | $133.50 | 4.6% | 24.4% | $4,683,674 | 7.0% | 25.9% |
| 2023 | 20 | 41,038 | $133.79 | 5.4% | 29.8% | $5,490,655 | 8.2% | 34.1% |
| 2024 | 23 | 60,412 | $105.63 | 8.0% | 37.8% | $6,381,261 | 9.5% | 43.6% |
| 2025 | 22 | 146,378 | $71.87 | 19.3% | 57.0% | $10,519,793 | 15.7% | 59.3% |
| 2026 | 9 | 29,721 | $92.59 | 3.9% | 60.9% | $2,751,933 | 4.1% | 63.4% |
| 2027 | 3 | 6,142 | $139.93 | 0.8% | 61.7% | $859,431 | 1.3% | 64.7% |
| 2028 | 9 | 48,011 | $102.91 | 6.3% | 68.1% | $4,940,574 | 7.4% | 72.0% |
| 2029 | 27 | 185,418 | $97.34 | 24.4% | 92.5% | $18,048,649 | 26.9% | 99.0% |
| 2030 & Beyond | 2 | 12,091 | $57.82 | 1.6% | 94.0% | $699,125 | 1.0% | 100.0% |
| Vacant | 0 | 45,263 | $0.00 | 6.0% | 100.0% | $0 | 0.0% | 100.0% |
| Total/Wtd. Avg. | 190 | 759,891 | $93.80 | 100.0% | $67,034,881 | 100.0% | ||
| (1) | Information is based on the underwritten rent roll. |
| (2) | Certain tenants may have lease termination options that are exercisable prior to the originally stated expiration date of the subject lease and that are not considered in the lease rollover schedule. |
| (3) | Total/Wtd. Avg. Annual UW Rent PSF Rolling excludes vacant space. |
| (4) | Total UW Rent Rolling reflects the following: (a) in-place leases based on the May 2019 rent roll and (b) contractual rent steps of $2,184,628 through May 31, 2020. |
The Market. The Grand Canal Shoppes Property is located in Las Vegas, Nevada along The Strip. The Grand Canal Shoppes Property’s tenant mix of retail, restaurants and entertainment offerings benefits from Las Vegas’s significant number of tourists, convention center attendees and residents. The Grand Canal Shoppes Property is adjacent to the Sands Expo Convention Center, a 1.8 million SF meeting and convention center. Additionally, Las Vegas has various developments in process that are expected to be completed in 2020 and beyond and that are expected to enhance the appeal of the market to visitors. The most notable of these developments is the MSG Sphere, an 18,000 seat performance venue being developed by Madison Square Garden and Las Vegas Sands just east of the Grand Canal Shoppes Property, the construction of the 65,000 seat Las Vegas Stadium, the new home of the NFL’s Oakland Raiders, which is expected to also double as a live entertainment and convention venue, and the Las Vegas Convention Center District is under redevelopment, with a 1.4 million SF expansion. We cannot assure you as to whether or when such developments will be completed.
Primary access to the Grand Canal Shoppes Property is provided by Interstate 15, the region’s primary north-south route, which is situated approximately one mile west of the Grand Canal Shoppes Property, with access gained via Spring Mountain Road/Sands Avenue. The Grand Canal Shoppes Property is located approximately 3 miles north of the McCarran International Airport and has direct access to Citizen Area Transit, which has over 41 routes running throughout the region. According to the appraisal, in 2018, there were over 42.1 million visitors traveling to Las Vegas and over 6.5 million convention visitors. According to the appraisal, the estimated 2018 population within a five-, seven- and ten-mile radius of the Grand Canal Shoppes Property was 410,151, 911,414 and 1,661,641, respectively. The estimated 2018 average household income within a five-, seven- and ten-mile radius was $54,257, $60,146 and $70,983, respectively.
The Grand Canal Shoppes Property is located in the Southeast submarket of the Las Vegas retail market. According to the appraisal, as of the fourth quarter of 2018, the vacancy rate in the Southeast submarket was approximately 14.5%, with average asking rents of $19.41 PSF and inventory of approximately 5.1 million SF. According to the appraisal, as of the fourth quarter of 2018, the vacancy rate in the Las Vegas retail market was approximately 13.4%, with average asking rents of $22.34 PSF and inventory of approximately 29.9 million SF. The appraiser concluded to a market rent of $98.23 PSF for the space at the Grand Canal Shoppes Property.
| This is not a research report and was not prepared by any Underwriter’s research department. It was prepared by the Underwriters’ sales, trading, banking or other non-research personnel. Please see additional important information and qualifications at the end of this Term Sheet. |
65
| Retail – Specialty Retail | Loan #4 | Cut-off Date Balance: | $53,846,154 | |
| 3327 & 3377 Las Vegas Boulevard South | Grand Canal Shoppes | Cut-off Date LTV: | 46.3% | |
| Las Vegas, NV 89109 | U/W NCF DSCR: | 2.46x | ||
| U/W NOI Debt Yield: | 9.6% |
The following table presents certain competitive properties to the Grand Canal Shoppes Property:
| Competitive Property Summary | |||||||
| Property, Location | Type | Year Built/ Renovated | Size (SF) | Occ. | Sales PSF | Anchor Tenants | Distance to Subject (mi.) |
Grand Canal Shoppes Property Las Vegas, NV | Fashion/Specialty | 1999/2007 | 759,891 | 94.0%(1) | $1,182(2) | TAO Nightclub, Theater, Grand Lux Café, Mercato Della Pescheria, TAO Asian Bistro, Recital Karaoke, Madame Tussaud Las Vegas, Verdugo West Brewery, Golden Gai | N/A |
| Primary Competition | |||||||
| Forum Shops at Caesars Las Vegas, NV | Fashion/Specialty | 1992/1997, 2004 | 650,000 | 99% | $1,400 - $1,700 | Upscale/themed retail project at Caesars with 1-2 levels | 0.5 |
Wynn Las Vegas Retail Las Vegas, NV | Fashion/Specialty | 2005/2008 | 150,000 | 95% | $2,000 - $3,000 | Upscale retail areas located within The Wynn Las Vegas and Wynn Encore | 0.3 |
The Shops at Crystals Las Vegas, NV | Fashion/Specialty | 2009/NAP | 360,000 | 94% | $1,200 - $1,400 | Upscale specialty retail center with 3-levels on Las Vegas Strip part of City Center | 1.1 |
Miracle Mile Shops Las Vegas, NV | Fashion/Specialty | 2000/2008, 2016 | 494,000 | 93% | $825 - $875 | Mid-Tier specialty retail center with 1 and 2 stories at Planet Hollywood | 1.0 |
Fashion Show Mall Las Vegas, NV(3) | Super-Regional Center | 1981/Various | 1,875,400 | 95% | $825 - $875 | Neiman Marcus, Dillard's, Macy's, Saks, Forever 21, Nordstrom, Dick's Sporting Goods | 0.3 |
| Secondary Competition | |||||||
| The Linq Promenade Las Vegas, NV | Fashion/Specialty | 2014/NAP | 268,000 | 93% | - - - | Retail and entertainment specialty center including a number of restaurants and performance venues | 0.4 |
| Bellagio Shops Las Vegas, NV | Fashion/Specialty | 1998/NAP | - | 100% | - - - | Upscale shopping area located within Bellagio Resort and Casino | 0.8 |
The Showcase Las Vegas, NV | Specialty Retail | 1997/2003, 2009 | 347,281 | 97% | - - - | Coca-Cola, Ross, Hard Rock, M&M's, Adidas | 1.6 |
| Las Vegas Premium Outlets Las Vegas, NV | Outlet Center | 2003/NAP | 676,113 | 100% | $1,400 - $1,600 | Last Call Neiman Marcus, Off 5th Saks 5th Avenue, Nike | 3.5 |
Source:Appraisal
| (1) | Occupancy as of May 31, 2019. |
| (2) | Comparable inline sales shown as of February 28, 2019. |
| (3) | Owned by an affiliate of the Grand Canal Shoppes Borrowers. |
Operating History and Underwritten Net Cash Flow.The following table presents certain information relating to the historical operating performance and the Underwritten Net Cash Flow at the Grand Canal Shoppes Property:
| Cash Flow Analysis | ||||||
| 2016 | 2017 | 2018 | 3/31/2019 TTM | UW | UW PSF | |
| Base Rent(1) | $68,255,204 | $67,507,328 | $66,471,558 | $66,941,590 | $67,034,881 | $88.22 |
| Total Recoveries | $31,633,869 | $27,875,777 | $25,766,223 | $25,166,107 | $26,539,087 | $34.92 |
| Other Income(2) | $12,765,993 | $12,203,223 | $10,872,872 | $10,365,738 | $10,455,366 | $13.76 |
| Less Vacancy & Credit Loss | $0 | $0 | $0 | $0 | $0 | $0.00 |
| Effective Gross Income | $112,655,066 | $107,586,327 | $103,110,653 | $102,473,435 | $104,029,334 | $136.90 |
| Real Estate Taxes | $1,952,631 | $1,995,183 | $2,076,447 | $2,102,023 | $2,102,023 | $2.77 |
| Insurance | $268,881 | $248,826 | $253,530 | $260,040 | $260,040 | $0.34 |
| Other Operating Expenses(3) | $31,074,924 | $30,916,371 | $29,454,203 | $28,645,562 | $28,645,562 | $37.70 |
| Total Expenses | $33,296,436 | $33,160,381 | $31,784,180 | $31,007,624 | $31,007,624 | $40.81 |
| Net Operating Income(1) | $79,358,630 | $74,425,947 | $71,326,473 | $71,465,811 | $73,021,709 | $96.09 |
| Capital Expenditures | $0 | $0 | $0 | $0 | $0 | $0.00 |
| TI/LC | $0 | $0 | $0 | $0 | $2,023,806 | $2.66 |
| Net Cash Flow | $79,358,630 | $74,425,947 | $71,326,473 | $71,465,811 | $70,997,903 | $93.43 |
| Occupancy %(4) | 93.9% | 93.0% | 93.3% | 93.9% | 94.0% | |
| NOI DSCR(5) | 2.75x | 2.58x | 2.47x | 2.48x | 2.53x | |
| NCF DSCR(5) | 2.75x | 2.58x | 2.47x | 2.48x | 2.46x | |
| NOI Debt Yield(5) | 10.4% | 9.8% | 9.4% | 9.4% | 9.6% | |
| NCF Debt Yield(5) | 10.4% | 9.8% | 9.4% | 9.4% | 9.3% | |
| (1) | UW Base Rent reflects the following: (a) in-place leases based on the March 2019 rent roll and (b) contractual rent steps of $2,184,628 through May 31, 2020. UW Base Rent excludes any rent associated with the Barneys New York space. The increase from 3/31/2019 TTM to UW Base Rent and Net Operating Income is due to recent leasing activity. |
| (2) | Other Income includes vending income, enterprise income, advertising revenue sponsorship income, specialty leasing income, overage rent and percent in lieu. |
| (3) | Other Operating Expenses includes the Walgreens air rights lease rent, of which $133,475 (19.32% of the annual ground lease payment) was underwritten. The Venetian Hotel and Casino is responsible under its sublease for the remaining 80.68% of the ground rent under the Walgreens air rights lease. |
| (4) | UW Occupancy % is as of May 31, 2019. |
| (5) | Debt service coverage ratios and debt yields are based on the Grand Canal Shoppes Senior Loan and exclude the Grand Canal Shoppes Subordinate Companion Loan. |
| This is not a research report and was not prepared by any Underwriter’s research department. It was prepared by the Underwriters’ sales, trading, banking or other non-research personnel. Please see additional important information and qualifications at the end of this Term Sheet. |
66
| Retail – Specialty Retail | Loan #4 | Cut-off Date Balance: | $53,846,154 | |
| 3327 & 3377 Las Vegas Boulevard South | Grand Canal Shoppes | Cut-off Date LTV: | 46.3% | |
| Las Vegas, NV 89109 | U/W NCF DSCR: | 2.46x | ||
| U/W NOI Debt Yield: | 9.6% |
Escrows and Reserves.
Real Estate Taxes and Insurance Reserves– During the continuance of a Cash Management Period (as defined below), the Grand Canal Shoppes Borrowers are required to reserve monthly 1/12 of the estimated property taxes and 1/12 of the estimated insurance premiums, provided that the monthly insurance reserve requirement is waived if the Grand Canal Shoppes Borrowers provide the lender with evidence that (a) the insurance policies required to be maintained by the Grand Canal Shoppes Borrowers are maintained pursuant to blanket policies that comply with the requirements of the Grand Canal Shoppes Whole Loan documents and (b) the insurance premiums payable in connection with such policies have been prepaid for not less than one year in advance (or, for the period of coverage under the policies as to which certificates are delivered at origination, such period, if less than one year).
Recurring Replacements Reserve– During the continuance of a Cash Management Period, the Grand Canal Shoppes Borrowers are required to deposit monthly $16,122 for recurring replacements reserves. However, the Grand Canal Shoppes Borrowers will not be required to make any portion of the monthly recurring replacements deposit if the amount then on deposit in the recurring replacements reserve is equal to or exceeds $386,928.
TI/LC Reserve– The Grand Canal Shoppes Whole Loan documents provide for the following deposits into the reserve for tenant improvements and leasing commissions (“TI/LCs”) (i) an upfront deposit of $12,309,694 for unfunded TI/LCs, including for the following tenants: $1,177,693 for Recital Karaoke, $1,472,330 for Verdugo West Brewery, $967,269 for Golden Gai, $63,000 for CUT By Wolfgang Puck, $882,000 for Smith & Wollensky and $20,000 for Once and (ii) during the continuance of a Cash Management Period, monthly deposits in an amount equal to $96,731. However, the Grand Canal Shoppes Borrowers will not be required to make any portion of the monthly TI/LC reserve deposit if the amount then on deposit in the TI/LC reserve is equal to or exceeds $2,321,544.
Ground Rent Reserve– During the continuance of a Cash Management Period, the Grand Canal Shoppes Borrowers are required to deposit monthly 1/12 of the annual amounts due by each of the Grand Canal Shoppes Borrowers, as applicable, under the Ground Leases (as defined below).
Gap Rent Reserve– The Grand Canal Shoppes Whole Loan documents provide for an upfront reserve of $1,218,246 for outstanding gap rents.
Notwithstanding the foregoing, the Grand Canal Shoppes Borrowers’ obligations to make any monthly deposits into the real estate taxes and insurance reserves, recurring replacements reserve, TI/LC reserve and/or ground rent reserve, as applicable, is deemed to be satisfied to the extent there are sufficient funds to make such deposits in the cash management account, in which case no actual payment from the Grand Canal Shoppes Borrowers is required.
Lockbox and Cash Management. The Grand Canal Shoppes Whole Loan is structured with a hard lockbox and springing cash management. The Grand Canal Shoppes Borrowers are required to direct each tenant of the Grand Canal Shoppes Property to deposit all funds (other than Non-Core Income (as defined below)) directly into the lockbox account, and to deposit any funds received by the Grand Canal Shoppes Borrowers and property manager, notwithstanding such direction, into the lockbox account within two business days of receipt. Within two business days of written notification of the commencement of a Cash Management Period, the Grand Canal Shoppes Borrowers are required to establish a lender-controlled cash management account with a cash management bank, into which all funds in the lockbox account will be required to be deposited periodically so long as a Cash Management Period is continuing. So long as a Cash Management Period is continuing, funds in the cash management account are required to be applied (i) to make deposits into the real estate taxes and insurance reserves (if then required), as described above under “Escrows and Reserves”, (ii) to make deposits into the ground rent reserve, as described above under “Escrows and Reserves”, (iii) to pay debt service on the Grand Canal Shoppes Whole Loan, (iv) provided no event of default under the Grand Canal Shoppes Whole Loan is continuing as to which the lender has initiated an enforcement action, to pay operating expenses set forth in the annual budget (which is required to be approved by the lender) and extraordinary operating or capital expenses reasonably approved by the lender, (v) to make deposits into the recurring replacements reserve and the TI/LC reserve, as described above under “Escrows and Reserves,” (vi) in the event a Cash Sweep Period is continuing, to deposit any excess amount remaining in the lockbox account into an excess cash flow account to be held by the lender as additional security for the Grand Canal Shoppes Whole Loan during the continuance of the Cash Sweep Period (provided that so long as no event of default exists as to which the lender has initiated an enforcement action, funds in such reserve may be applied to operating expenses) and (vii) if no Cash Sweep Period and no event of default under the Grand Canal Shoppes Whole Loan are continuing, all funds in the lockbox account are required to be disbursed to the Grand Canal Shoppes Borrowers.
A “Cash Sweep Period” means a period:
| (a) | commencing upon an event of default under the Grand Canal Shoppes Whole Loan and ending if such event of default is cured or waived; or |
| (b) | commencing upon the determination that the debt yield of the Grand Canal Shoppes Whole Loan is less than 6.0% as of the end of any calendar year and ending upon the date that such debt yield is equal to or in excess of 6.0% for two consecutive calendar quarters. |
A “Cash Management Period” means a period:
| (a) | commencing upon an event of default under the Grand Canal Shoppes Whole Loan and ending if such event of default is cured or waived; or |
| (b) | commencing upon the determination that the debt yield of the Grand Canal Shoppes Whole Loan is less than 6.5% as of the end of any calendar year and ending upon the date that such debt yield is equal to or in excess 6.5% for two consecutive calendar quarters. |
“Non-Core Income” means (i) certainde minimis amounts of rents received directly by the Grand Canal Shoppes Borrowers from miscellaneous revenue items such as holiday photos and change retrieved from fountains (but excluding rent from Seasonal Leases) and (ii) certain rents generated pursuant to multi-property sponsorship and advertising programs which are directly attributable to the Grand Canal Shoppes Property.
“Seasonal Leases” means leases and/or license agreements having a maximum term of one year or less.
Additional Secured Indebtedness (not including trade debts). In addition to the Grand Canal Shoppes Mortgage Loan, the Grand Canal Shoppes Property also secures the Grand Canal Shoppes Non-ServicedPari Passu Companion Loans, which have an aggregate Cut-off Date principal balance of $706,153,846, and the Grand Canal Shoppes Subordinate Companion Loan, which has a Cut-off Date principal balance of $215,000,000. The Grand
| This is not a research report and was not prepared by any Underwriter’s research department. It was prepared by the Underwriters’ sales, trading, banking or other non-research personnel. Please see additional important information and qualifications at the end of this Term Sheet. |
67
| Retail – Specialty Retail | Loan #4 | Cut-off Date Balance: | $53,846,154 | |
| 3327 & 3377 Las Vegas Boulevard South | Grand Canal Shoppes | Cut-off Date LTV: | 46.3% | |
| Las Vegas, NV 89109 | U/W NCF DSCR: | 2.46x | ||
| U/W NOI Debt Yield: | 9.6% |
Canal Shoppes Non-ServicedPari Passu Companion Loans accrue interest at the same rate as the Grand Canal Shoppes Mortgage Loan. The Grand Canal Shoppes Subordinate Companion Loan accrues interest at a rate of 6.2500%per annum. The Grand Canal Shoppes Senior Loan is generally senior in right of payment to the Grand Canal Shoppes Subordinate Companion Loan. The holders of the Grand Canal Shoppes Mortgage Loan, the Grand Canal Shoppes Non-ServicedPari Passu Companion Loans and the Grand Canal Shoppes Subordinate Companion Loan have entered into a co-lender agreement which sets forth the allocation of collections on the Grand Canal Shoppes Whole Loan. See “Description of the Mortgage Pool—The Whole Loans—The Non-Serviced Pari Passu-A/B Whole Loan” in the Preliminary Prospectus.
Mezzanine Loan and Preferred Equity.Not permitted.
Release of Barneys Parcel. The Grand Canal Shoppes Borrowers may obtain the release of a portion of the Grand Canal Shoppes Property comprised of the approximately 84,743 SF, three-level space currently demised to Barneys New York (the “Barneys Parcel”) pursuant to a lease that is expected to expire on January 31, 2020, upon abona fide sale to a third party not affiliated with the Grand Canal Shoppes Borrowers or the Grand Canal Shoppes Guarantor;provided that, among other things, and in accordance with the Grand Canal Shoppes Whole Loan documents: (i) no event of default has occurred and is continuing, (ii) the lender has received reasonably satisfactory evidence that all portions of the Barneys Parcel owned by the Grand Canal Shoppes Borrowers in fee simple have been legally subdivided from all portions of the Grand Canal Shoppes Property remaining after the release, (iii) upon request by the lender, the Grand Canal Shoppes Borrowers deliver a legal opinion stating that the release does not constitute a “significant modification” of the Grand Canal Shoppes Whole Loan under Section 1001 of the Internal Revenue Code of 1986 or otherwise cause a tax to be imposed on a “prohibited transaction” by any REMIC trust, (iv) following such release, the loan-to-value ratio (as determined by the lender in its sole discretion using only the portion of the remaining Grand Canal Shoppes Property which constitutes acceptable real estate collateral under the Code for a REMIC Trust) is equal to or less than 125% (provided that the Grand Canal Shoppes Borrowers may prepay the “qualified amount” as that term is defined in the Internal Revenue Service Revenue Procedure 2010-30, as the same may be amended, modified or supplemented from time to time, in order to meet the foregoing loan-to-value ratio). From and after the release of the Barneys Parcel, without the prior consent of the lender, neither the Grand Canal Shoppes Borrowers nor any of their affiliates may solicit, cause or facilitate the relocation of any existing tenant at the Grand Canal Shoppes Property to the Barneys Parcel.
Right of First Offer/Right of First Refusal.A transfer of either the Grand Canal Shoppes or the Palazzo Shoppes portion of the Grand Canal Shoppes Property (other than to a lender in connection with foreclosure or delivery of a deed-in-lieu of foreclosure of a mortgage secured by the Grand Canal Shoppes Property or the first subsequent transferee from the lender) is subject to a right of first offer in favor of Venetian Casino Resort, LLC.
Additionally, in the case of acceleration of the Grand Canal Shoppes Whole Loan, Venetian Casino Resort, LLC has the right, subject to the satisfaction of certain financial covenants, to purchase the Grand Canal Shoppes Whole Loan at a price equal to (a) the outstanding principal balance of the Grand Canal Shoppes Whole Loan (b) accrued and unpaid interest up to (but excluding) the date of purchase, (c) all other amounts owed under the Grand Canal Shoppes Whole Loan documents, including, without limitation (but only to the extent so owed) (1) any unreimbursed advances made by the servicer, with interest at the applicable rate, (2) any servicing and special servicing fees, (3) any exit fees, (4) any prepayment, yield maintenance or similar premiums and (5) if the date of purchase is not a scheduled payment date, accrued and unpaid interest from the date of purchase up to (but excluding) the scheduled payment date next succeeding the date of purchase and (d) all reasonable fees and expenses incurred by the lender in connection with the purchase.
Ground/Air Rights Leases. The Grand Canal Shoppes Borrowers have air rights ground leases (which do not include the underlying land) with Venetian Casino Resort, LLC, as lessor, for portions of the retail and restaurant space on the casino level of each of the Venetian Hotel and the Palazzo Resort and Casino portions of the Grand Canal Shoppes Property. The ground lease for the retail and restaurant space on the casino level of the Venetian Hotel is for an 89-year term commencing on May 14, 2004 and expiring on May 14, 2093, with no extension options. The ground lease for the retail and restaurant space on the casino level of the Palazzo Resort and Casino is for an 89-year term commencing on February 29, 2008 and expiring on February 28, 2097, with no extension options. Each of the annual rents for these ground leases is $1 and the Grand Canal Shoppes Borrowers have the option to purchase the premises for $1 on the respective expiration dates.
The air rights above the space leased to Walgreens Co. and used as a Walgreen’s store are leased by a third party to the Grand Canal Shoppes Borrowers, as tenants for a 60-year term commencing on March 1, 2004 and expiring on February 29, 2064, with one 40-year extension option (such lease, together with the ground leases of the casino level restaurant/retail of the Venetian Hotel and Casino and the Palazzo Resort and Casino level restaurant/retail, the “Ground Leases”). The ground rent under the Walgreens air rights lease was initially $600,000; however it escalates annually each year after the seventh lease year (which commenced March 1, 2011) by the same percentage that the consumer price index has increased from the prior year, not to exceed a 2.00% increase in any year. The Venetian Casino Resort, LLC subleases a portion of the Walgreens air rights from the Grand Canal Shoppes Borrowers and is responsible under the sublease to pay an amount equal to 80.68% of the rent under the prime lease. The sublease is coterminous with the Walgreens air rights lease.
Letter of Credit. None.
Terrorism Insurance. The Grand Canal Shoppes Whole Loan documents require that the comprehensive “special perils” insurance policy required to be maintained by the Grand Canal Shoppes Borrowers provide coverage in an amount equal to the “full replacement cost” of the Grand Canal Shoppes Property. The Grand Canal Shoppes Whole Loan documents also require business income insurance covering no less than the 24-month period commencing at the time of casualty, together with a 12-month extended period of indemnity. Notwithstanding the foregoing, for so long as the Terrorism Risk Insurance Act of 2002, as extended and modified by the Terrorism Risk Insurance Program Reauthorization Act of 2007 and by the Terrorism Risk Insurance Program Reauthorization Act of 2015 (“TRIPRA”) is in effect (including any extensions thereof or if another federal governmental program is in effect relating to “acts of terrorism” which provides substantially similar protections as TRIPRA), and covers both domestic and foreign acts of terrorism, the lender is required to accept terrorism insurance which insures against “covered acts” as defined by TRIPRA (or such other program);provided, however, that the Grand Canal Shoppes Borrowers will not be obligated to pay terrorism insurance premiums in excess of two times the premium for the “special perils” and business income coverage on a stand-alone basis (excluding any earthquake insurance or terrorism insurance components of such policies) in any policy year.See “Risk Factors—Risks Relating to the Mortgage Loans—Terrorism Insurance May Not Be Available for All Mortgaged Properties”in the Preliminary Prospectus.
| This is not a research report and was not prepared by any Underwriter’s research department. It was prepared by the Underwriters’ sales, trading, banking or other non-research personnel. Please see additional important information and qualifications at the end of this Term Sheet. |
68
(THIS PAGE INTENTIONALLY LEFT BLANK)
69
| Various | Loan #5 | Cut-off Date Balance: | $50,000,000 | |
| Various | ILPT Industrial Portfolio | Cut-off Date LTV: | 39.2% | |
| Various | U/W NCF DSCR: | 5.05x | ||
| U/W NOI Debt Yield: | 14.8% |

| This is not a research report and was not prepared by any Underwriter’s research department. It was prepared by the Underwriters’ sales, trading, banking or other non-research personnel. Please see additional important information and qualifications at the end of this Term Sheet. |
70
| Various | Loan #5 | Cut-off Date Balance: | $50,000,000 | |
| Various | ILPT Industrial Portfolio | Cut-off Date LTV: | 39.2% | |
| Various | U/W NCF DSCR: | 5.05x | ||
| U/W NOI Debt Yield: | 14.8% |

| This is not a research report and was not prepared by any Underwriter’s research department. It was prepared by the Underwriters’ sales, trading, banking or other non-research personnel. Please see additional important information and qualifications at the end of this Term Sheet. |
71
| Mortgage Loan No. 5 – ILPT Industrial Portfolio |
| Mortgage Loan Information | Property Information | ||||||
| Mortgage Loan Seller(1): | MSMCH | Single Asset/Portfolio: | Portfolio | ||||
| Credit Assessment (KBRA/Fitch/S&P): | BBB+/BBB-sf/NR | Location: | Various | ||||
| Original Balance(1): | $50,000,000 | General Property Type: | Industrial | ||||
| Cut-off Date Balance(1): | $50,000,000 | Detailed Property Type: | Warehouse Distribution | ||||
| % of Initial Pool Balance: | 4.9% | Title Vesting: | Fee | ||||
| Loan Purpose: | Recapitalization | Year Built/Renovated: | Various | ||||
| Sponsor: | Industrial Logistics Properties Trust | Size: | 8,209,036 SF | ||||
| Guarantor: | Industrial Logistics Properties Trust | Cut-off Date Balance per SF(1): | $26 | ||||
| Mortgage Rate(2): | 2.65326% | Maturity Date Balance per SF(1): | $26 | ||||
| Note Date: | 10/21/2019 | Property Manager: | The RMR Group LLC | ||||
| First Payment Date: | 12/7/2019 | (borrower-related) | |||||
| Maturity Date: | 11/7/2029 | Underwriting and Financial Information | |||||
| Original Term to Maturity: | 120 months | UW NOI: | $31,836,916 | ||||
| Original Amortization Term: | 0 months | UW NOI Debt Yield(1): | 14.8% | ||||
| IO Period: | 120 months | UW NOI Debt Yield at Maturity(1): | 14.8% | ||||
| Seasoning: | 0 months | UW NCF DSCR(1): | 5.05x | ||||
| Prepayment Provisions(3): | LO (24); DEF/YM1 (89); O (7) | Most Recent NOI: | $28,890,150 (12/31/2018) | ||||
| Lockbox/Cash Mgmt Status: | Hard/Springing | 2nd Most Recent NOI: | $27,259,856 (12/31/2017) | ||||
| Additional Debt Type(1)(4): | Pari Passu /Subordinate | 3rd Most Recent NOI: | $16,319,258 (12/31/2016) | ||||
| Additional Debt Balance(1)(4): | $164,400,000 / $135,600,000 | Most Recent Occupancy: | 100.0% (Various) | ||||
| Future Debt Permitted (Type): | No (N/A) | 2nd Most Recent Occupancy: | N/A | ||||
| Reserves(5) | 3rd Most Recent Occupancy: | N/A | |||||
| Type | Initial | Monthly | Cap | Appraised Value (as of): | $547,000,000 (Various) | ||
| RE Tax: | $0 | Springing | N/A | Appraised Value per SF: | $67 | ||
| Insurance: | $0 | Springing | N/A | Cut-off Date LTV Ratio(1): | 39.2% | ||
| Toro Expansion: | $6,134,904 | $0 | N/A | Maturity Date LTV Ratio(1): | 39.2% | ||
| Sources and Uses | ||||||
| Sources | Proceeds | % of Total | Uses | Proceeds | % of Total | |
| Senior Loan Amount(1): | $214,400,000 | 61.3% | Return of Equity(6): | $342,661,643 | 97.9% | |
| Subordinate Companion Loan(1): | $135,600,000 | 38.7% | Reserves: | $6,134,904 | 1.8% | |
| Closing Costs: | $1,203,453 | 0.3% | ||||
| Total Sources: | $350,000,000 | 100.0% | Total Uses: | $350,000,000 | 100.0% | |
| (1) | The ILPT Industrial Portfolio Mortgage Loan (as defined below) is part of the ILPT Industrial Portfolio Whole Loan (as defined below), which is comprised of eightpari passu senior promissory notes with an aggregate original principal balance of $214,400,000 (the “Senior Notes”, and collectively, the “ILPT Industrial Portfolio Senior Loan”) and three promissory notes that are subordinate to the Senior Notes with an original principal balance of $135,600,000 (collectively, the “ILPT Industrial Portfolio Subordinate Companion Loan”, and together with the ILPT Industrial Portfolio Senior Loan, the “ILPT Industrial Portfolio Whole Loan”). The Cut-off Date Balance per SF, Maturity Date Balance per SF, UW NOI Debt Yield, UW NOI Debt Yield at Maturity, UW NCF DSCR, Cut-off Date LTV Ratio and Maturity Date LTV Ratio numbers presented above are based on the aggregate principal balance of the promissory notes comprising the ILPT Industrial Portfolio Senior Loan, without regard to the ILPT Industrial Portfolio Subordinate Companion Loan. The Cut-off Date Balance per SF, Maturity Date Balance per SF, UW NOI Debt Yield, UW NOI Debt Yield at Maturity, UW NCF DSCR, Cut-off Date LTV Ratio and Maturity Date LTV Ratio numbers based on the combined balance of the entire ILPT Industrial Portfolio Whole Loan are $43, $43, 9.1%, 9.1%, 2.47x, 64.0% and 64.0%, respectively. The ILPT Industrial Portfolio Whole Loan was co-originated by Morgan Stanley Bank, N.A. (“MSBNA”), Bank of America, N.A. (“BANA”) and UBS AG (“UBS”) on October 21, 2019. |
| (2) | Reflects the Senior Notes only. The ILPT Industrial Portfolio Subordinate Companion Loan accrues interest at the rate of 4.40% per annum. |
| (3) | Defeasance or prepayment of the ILPT Industrial Portfolio Whole Loan is permitted at any time after the earlier to occur of (a) the end of the two-year period commencing on the closing date of the securitization of the last ILPT Industrial Portfolio Whole Loan promissory note to be securitized and (b) October 21, 2022. The assumed defeasance and prepayment lockout period of 24 payments is based on the closing date of this transaction in November 2019. |
| (4) | See “The Mortgage Loan” and “Additional Secured Indebtedness (not including trade debts)” below for further discussion of additional debt. |
| (5) | See “Escrows and Reserves” below for further discussion of reserve requirements. |
| (6) | The borrower sponsor acquired the ILPT Industrial Portfolio Properties from primarily September 2018 to April 2019 for a combined purchase price of approximately $555.0 million and expects to use the proceeds of the ILPT Industrial Portfolio Loan to reduce outstanding borrowings under its $750 million unsecured revolving credit facility. |
The Mortgage Loan. The fifth largest mortgage loan (the “ILPT Industrial Portfolio Mortgage Loan”) is part of the ILPT Industrial Portfolio Whole Loan in the original principal balance of $350,000,000. The ILPT Industrial Portfolio Whole Loan is secured by a first priority fee mortgage encumbering 11 industrial properties located in eight states (the “ILPT Industrial Portfolio” or the “ILPT Industrial Portfolio Properties”). The ILPT Industrial Portfolio Whole Loan was co-originated by MSBNA, BANA and UBS on October 21, 2019. The ILPT Industrial Portfolio Whole Loan is comprised of eight senior promissory notes, which arepari passu with each other, with an aggregate original principal balance of $214,400,000, and three subordinate promissory notes, which are subordinate to the senior notes andpari passu with each other, with an aggregate original principal balance of $135,600,000. The Note A-1, in the original principal balance of $50,000,000, represents the ILPT Industrial Portfolio Mortgage Loan and will be included in the MSC 2019-L3 securitization trust. The remaining Senior Notes (collectively, the “ILPT Industrial Portfolio ServicedPari Passu Companion Loans”), which had an aggregate original principal balance of $164,400,000, are expected to be contributed to one or more future securitization transactions or may be otherwise transferred at any time. The ILPT Industrial Portfolio Whole Loan will be serviced pursuant to the pooling and servicing agreement for the MSC 2019-L3 securitization trust. See “Description of the Mortgage Pool—The Whole Loans—The Serviced Pari Passu-A/B Whole Loan—The ILPT Industrial Portfolio Whole Loan”and “Pooling and Servicing Agreement” in the Preliminary Prospectus.
| This is not a research report and was not prepared by any Underwriter’s research department. It was prepared by the Underwriters’ sales, trading, banking or other non-research personnel. Please see additional important information and qualifications at the end of this Term Sheet. |
72
| Industrial – Warehouse Distribution | Loan #5 | Cut-off Date Balance: | $50,000,000 | |
| Various | ILPT Industrial Portfolio | Cut-off Date LTV: | 39.2% | |
| Various | U/W NCF DSCR: | 5.05x | ||
| U/W NOI Debt Yield: | 14.8% |
| ILPT Industrial Portfolio Whole Loan Summary | ||||
| Notes | Original Balance | Cut-off Date Balance | Note Holder | Controlling Piece |
| ILPT Industrial Portfolio Mortgage Loan | ||||
| A-1 | $50,000,000 | $50,000,000 | MSC 2019-L3 | No(1) |
| ILPT Industrial Portfolio ServicedPari Passu Companion Loans | ||||
| A-2 | $35,760,000 | $35,760,000 | MSBNA | No |
| A-3 | $39,240,000 | $39,240,000 | BANA | No |
| A-4 | $25,080,000 | $25,080,000 | BANA | No |
| A-5 | $25,000,000 | $25,000,000 | UBS | No |
| A-6 | $20,000,000 | $20,000,000 | UBS | No |
| A-7 | $10,000,000 | $10,000,000 | UBS | No |
| A-8 | $9,320,000 | $9,320,000 | UBS | No |
| ILPT Industrial Portfolio Subordinate Companion Loan | ||||
| B-1 | $52,240,000 | $52,240,000 | MSBNA | Yes(1) |
| B-2 | $40,680,000 | $40,680,000 | BANA | Yes(1) |
| B-3 | $40,680,000 | $40,680,000 | UBS | Yes(1) |
| Total | $350,000,000 | $350,000,000 | ||
| (1) | The holder of the ILPT Industrial Portfolio Subordinate Companion Loan will have the right to appoint the special servicer of the ILPT Industrial Portfolio Whole Loan and to direct certain decisions with respect to the ILPT Industrial Portfolio Whole Loan, unless a control appraisal event exists under the related co-lender agreement (in which case Note A-1 will be the controlling note). The ILPT Industrial Portfolio Whole Loan will be serviced pursuant to the pooling and servicing agreement for the MSC 2019-L3 securitization. |
The Borrower and the Sponsor. The borrowers are The Industrial Fund St. Louis LLC, The Industrial Fund PA LLC, The Industrial Fund MS LLC, and The Industrial Fund Ankeny LLC (collectively, the “ILPT Industrial Portfolio Borrowers”), each a Delaware limited liability company structured to be bankruptcy-remote with two independent directors. Industrial Logistics Properties Trust (“ILPT”) is the borrower sponsor and non-recourse carveout guarantor with respect to the ILPT Industrial Portfolio Whole Loan. The obligations of ILPT for any guaranteed obligations for which the ILPT Industrial Portfolio Whole Loan documents provide full recourse (consisting generally of bankruptcy related events) is capped at 15% of the outstanding principal balance of the ILPT Industrial Portfolio Whole Loan.
ILPT is a real estate investment trust (“REIT”) formed to own and lease industrial and logistics properties throughout the United States. As of June 30, 2019, ILPT owned 298 industrial and logistics properties with approximately 42.4 million rentable SF, which were approximately 99.3% leased to 265 tenants with a weighted average remaining lease term of approximately 9.8 years. Approximately 58.0% of ILPT’s annualized rental revenues as of June 30, 2019 come from 72 industrial and logistics properties with approximately 25.6 million SF located in 29 states on the U.S. mainland and approximately 42.0% of annualized rental revenues come from 226 properties (buildings, leasable land parcels and easements) with approximately 16.8 million SF located on the island of Oahu, Hawaii, most of which are long-term ground leases to tenants that have constructed buildings and operate businesses on land owned by ILPT.
The Properties. The ILPT Industrial Portfolio consists of a total of eleven industrial properties containing a total of 8,209,036 SF. The ILPT Industrial Portfolio Properties are located across eight states. The ILPT Industrial Portfolio Properties are located in Indiana (four properties, 40.2% of NRA), Ohio (one property, 21.8% of NRA), and Virginia (one property, 12.4% of NRA), with the five remaining ILPT Industrial Portfolio Properties located in Missouri, Iowa, Maryland, Kentucky and Pennsylvania. Built between 2001 and 2016, with seven of the eleven properties built between 2012 and 2016, the ILPT Industrial Portfolio Properties range in size from 205,090 SF to 1,791,246 SF. Based on the rent roll as of September 1, 2019, the ILPT Industrial Portfolio was 100.0% leased by a mix of national and local tenants. The largest tenant, Amazon, occupies approximately 25.0% of the ILPT Industrial Portfolio SF and contributes approximately 24.5% of underwritten base rent, and the second largest tenant, Procter & Gamble, occupies approximately 21.8% of the ILPT Industrial Portfolio SF and contributes approximately 19.5% of underwritten base rent. Excluding Amazon and Procter & Gamble, no single tenant accounts for more than 11.4% of underwritten rent or more than 11.7% of total SF of the ILPT Industrial Portfolio. The largest amount of rollover occurs in 2024, when leases comprising approximately 43.3% of the ILPT Industrial Portfolio SF and 36.0% of underwritten base rent expire. The weighted average remaining lease term at the ILPT Industrial Portfolio is approximately 6.5 years as of November 2019, and approximately 15.8% of the ILPT Industrial Portfolio SF and 24.2% of underwritten base rent rolls after the maturity of the ILPT Industrial Portfolio Whole Loan.
| This is not a research report and was not prepared by any Underwriter’s research department. It was prepared by the Underwriters’ sales, trading, banking or other non-research personnel. Please see additional important information and qualifications at the end of this Term Sheet. |
73
| Industrial – Warehouse Distribution | Loan #5 | Cut-off Date Balance: | $50,000,000 | |
| Various | ILPT Industrial Portfolio | Cut-off Date LTV: | 39.2% | |
| Various | U/W NCF DSCR: | 5.05x | ||
| U/W NOI Debt Yield: | 14.8% |
The following table presents a summary of certain information relating to the ILPT Industrial Portfolio Properties:
| ILPT Industrial Portfolio Properties Summary(1) | ||||||||||
Property Name | City | State | Year Built | Total GLA (SF) | % of Total GLA | Occ. % | Cut-off Date Allocated Loan Amount(2) | % of ALA(2) | Appraised Value(3) | 12/31/2018 NOI |
| 1800 Union Airpark Boulevard | Union | OH | 2014 | 1,791,246 | 21.8% | 100.0% | $37,039,854 | 17.3% | $94,500,000 | $6,123,103 |
| 4237-4255 Anson Boulevard | Whitestown | IN | 2006 | 1,036,573 | 12.6% | 100.0% | $28,612,797 | 13.3% | $73,000,000 | $4,805,740 |
| 5000 Commerce Way | Petersburg | VA | 2012 | 1,016,065 | 12.4% | 100.0% | $27,319,342 | 12.7% | $69,700,000 | $3,628,743 |
| 5142 & 5148 North Hanley Road | St. Louis | MO | 2016 | 430,986 | 5.3% | 100.0% | $24,183,693 | 11.3% | $61,700,000 | $2,679,435 |
| 945 Monument Drive | Lebanon | IN | 2014 | 962,500 | 11.7% | 100.0% | $20,068,154 | 9.4% | $51,200,000 | $2,881,565 |
| 2801 Airwest Boulevard | Plainfield | IN | 2001 | 804,586 | 9.8% | 100.0% | $16,854,113 | 7.9% | $43,000,000 | $2,411,524 |
| 20 Logistics Boulevard | Walton | KY | 2006 | 603,586 | 7.4% | 100.0% | $16,109,397 | 7.5% | $41,100,000 | $2,339,909 |
| 5500 Southeast Delaware Avenue | Ankeny | IA | 2012 | 644,104 | 7.8% | 100.0% | $12,738,574 | 5.9% | $32,500,000 | $1,497,139 |
| 2150 Stanley Road | Plainfield | IN | 2007 | 493,500 | 6.0% | 100.0% | $11,837,075 | 5.5% | $30,200,000 | $1,743,981 |
| 16101 Queens Court | Upper Marlboro | MD | 2016 | 220,800 | 2.7% | 100.0% | $11,562,706 | 5.4% | $29,500,000 | $297,684 |
| 5 Logistics Drive | Carlisle | PA | 2016 | 205,090 | 2.5% | 100.0% | $8,074,296 | 3.8% | $20,600,000 | $481,327 |
| Total/Wtd. Avg. | 8,209,036 | 100.0% | 100.0% | $214,400,000 | 100.0% | $547,000,000 | $28,890,150 | |||
| (1) | Based on the underwritten rent roll dated September 1, 2019. |
| (2) | Based on the Senior Notes. |
| (3) | Based on the appraisals dated August 31, 2019 to September 5, 2019. |
The following table presents a summary of amenity information relating to the ILPT Industrial Portfolio Properties:
| ILPT Industrial Portfolio Properties Summary | |||||||
Property Name | State | Year Built | Total GLA (SF) | Tenant | Dock Doors / Drive-in Doors | Clear Height | Parking Spaces |
| 1800 Union Airpark Boulevard | OH | 2014 | 1,791,246 | Procter & Gamble | 230 / 2 | 36’ | 756 |
| 4237-4255 Anson Boulevard | IN | 2006 | 1,036,573 | Amazon | 80 / 4 | 36’ | 1,560 |
| 5000 Commerce Way | VA | 2012 | 1,016,065 | Amazon | 75 / 2 | 32’ | 952 |
| 5142 & 5148 North Hanley Road | MO | 2016 | 430,986 | SKF USA | 24 / 7 | 31’ | 385 |
| 945 Monument Drive | IN | 2014 | 962,500 | Subaru of America Distribution | 96 / 6 | 34’ | 260 |
| 2801 Airwest Boulevard | IN | 2001 | 804,586 | Whirlpool Corporation | 71 / 4 | 32’ – 34’ | 345 |
| 20 Logistics Boulevard | KY | 2006 | 603,586 | Cummins, Inc. | 70 / 3 | 32’ | 192 |
| 5500 Southeast Delaware Avenue | IA | 2012 | 644,104 | The Toro Company | 56 / 3 | 28’ | 45 |
| 2150 Stanley Road | IN | 2007 | 493,500 | Siemens Corporation; M D Logistics, Inc. | 57 / 4 | 36’ | 174 |
| 16101 Queens Court | MD | 2016 | 220,800 | La-Z-Boy Incorporated | 29 / 2 | 32’ | 171 |
| 5 Logistics Drive | PA | 2016 | 205,090 | Transamerica Auto Parts | 28 / 2 | 32’ | 141 |
| Total/Wtd. Avg. | 8,209,036 | ||||||
Source:Appraisals.
| This is not a research report and was not prepared by any Underwriter’s research department. It was prepared by the Underwriters’ sales, trading, banking or other non-research personnel. Please see additional important information and qualifications at the end of this Term Sheet. |
74
| Industrial – Warehouse Distribution | Loan #5 | Cut-off Date Balance: | $50,000,000 | |
| Various | ILPT Industrial Portfolio | Cut-off Date LTV: | 39.2% | |
| Various | U/W NCF DSCR: | 5.05x | ||
| U/W NOI Debt Yield: | 14.8% |
The following table presents certain information relating to the leases at the ILPT Industrial Portfolio Properties:
| Tenant Summary(1) | |||||||||
| Tenant Name | Credit Rating (Fitch/Moody's/ S&P)(2) | Tenant SF | Approx. % of SF | Annual UW Base Rent | Annual UW Base Rent PSF | % of Total Annual UW Base Rent | Lease Expiration | Renewal Options | Term. Option |
| Amazon | A+/A3/AA- | 2,052,638 | 25.0% | $8,122,434 | $3.96 | 24.5% | 9/30/2027(3) | Various(3) | N |
| Procter & Gamble | NR/Aa3/AA- | 1,791,246 | 21.8% | $6,456,575 | $3.60 | 19.5% | 10/31/2024 | 3 x 5 year | N |
| Subaru of America Distribution | NR/NR/NR | 962,500 | 11.7% | $2,994,750 | $3.11 | 9.0% | 5/31/2024 | 2 x 5 year | N |
| Whirlpool Corporation | BBB/Baa1/BBB | 804,586 | 9.8% | $2,465,221 | $3.06 | 7.4% | 1/31/2024 | 3 x 2 year | N |
| The Toro Company(4) | NR/Baa3/BBB | 644,104 | 7.8% | $2,873,813 | $4.46 | 8.7% | 10/31/2034 | 3 x 5 year | Y |
| Cummins, Inc. | NR/A2/A+ | 603,586 | 7.4% | $2,334,949 | $3.87 | 7.1% | 10/31/2021 | 2 x 5 year | N |
| SKF USA | BBB+/Baa1/NR | 430,986 | 5.3% | $3,782,146 | $8.78 | 11.4% | 4/30/2039 | 2 x 10 year | N |
| Siemens Corporation | A/NR/A+ | 320,070 | 3.9% | $1,154,836 | $3.61 | 3.5% | 9/30/2028 | 3 x 5 year | N |
| La-Z-Boy Incorporated | NR/NR/NR | 220,800 | 2.7% | $1,364,544 | $6.18 | 4.1% | 1/31/2031 | 2 x 5 year | N |
| Transamerica Auto Parts | NR/NR/NR | 205,090 | 2.5% | $990,585 | $4.83 | 3.0% | 3/31/2025 | 2 x 5 year | N |
| M D Logistics, Inc.(5) | NR/NR/NR | 173,430 | 2.1% | $563,648 | $3.25 | 1.7% | 6/30/2027 | 1 x 5 year | Y |
| Subtotal/Wtd. Avg. | 8,209,036 | 100.0% | $33,103,501 | $4.03 | 100.0% | ||||
| Other Tenants | 0 | 0.0% | $0 | $0.00 | 0.0% | ||||
| Vacant Space | 0 | 0.0% | $0 | $0.00 | 0.0% | ||||
| Total/Wtd. Avg. | 8,209,036 | 100.0% | $33,103,501 | $4.03 | 100.0% | ||||
| (1) | Information is based on the underwritten rent roll. |
| (2) | Certain ratings are those of the parent company, whether or not the parent guarantees the lease. |
| (3) | Amazon is a tenant at the 5000 Commerce Way property (1,016,065 SF; expiring September 30, 2027; four, five-year renewal options) and the 4237-4255 Anson Boulevard property (1,036,573 SF; expiring April 30, 2021; five, five-year renewal options). |
| (4) | The Toro Company is currently in the process of expanding into an additional 194,000 SF. The tenant has the right to terminate its lease if the expansion date has not occurred within 270 days after November 1, 2019. The tenant may exercise its right to terminate its lease by giving notice no later than 30 days after the expiration of such 270 day period. At closing, the lender reserved $6,134,904 into a Toro Expansion Reserve, which will be used to pay the remaining project costs associated with the expansion. |
| (5) | M D Logistics, Inc. has the one-time right to terminate its lease effective June 30, 2022, upon providing notice by September 30, 2021 and paying a termination fee of $546,399. |
The following table presents certain information relating to the lease rollover schedule at the ILPT Industrial Portfolio Properties:
| Lease Rollover Schedule(1)(2) | ||||||||
| Year | # of Leases Rolling | SF Rolling | UW Base Rent PSF Rolling | Approx. % of Total SF Rolling | Approx. Cumulative % of SF Rolling | Total UW Base Rent Rolling | Approx. % of Base Rent Rolling | Approx. Cumulative % of Total Rent Rolling |
| 2019 | 0 | 0 | $0.00 | 0.0% | 0.0% | $0 | 0.0% | 0.0% |
| 2020 | 0 | 0 | $0.00 | 0.0% | 0.0% | $0 | 0.0% | 0.0% |
| 2021 | 2 | 1,640,159 | $4.01 | 20.0% | 20.0% | $6,579,367 | 19.9% | 19.9% |
| 2022 | 0 | 0 | $0.00 | 0.0% | 20.0% | $0 | 0.0% | 19.9% |
| 2023 | 0 | 0 | $0.00 | 0.0% | 20.0% | $0 | 0.0% | 19.9% |
| 2024 | 3 | 3,558,332 | $3.35 | 43.3% | 63.3% | $11,916,546 | 36.0% | 55.9% |
| 2025 | 1 | 205,090 | $4.83 | 2.5% | 65.8% | $990,585 | 3.0% | 58.9% |
| 2026 | 0 | 0 | $0.00 | 0.0% | 65.8% | $0 | 0.0% | 58.9% |
| 2027 | 2 | 1,189,495 | $3.73 | 14.5% | 80.3% | $4,441,664 | 13.4% | 72.3% |
| 2028 | 1 | 320,070 | $3.61 | 3.9% | 84.2% | $1,154,836 | 3.5% | 75.8% |
| 2029 | 0 | 0 | $0.00 | 0.0% | 84.2% | $0 | 0.0% | 75.8% |
| 2030 & Beyond | 3 | 1,295,890 | $6.19 | 15.8% | 100.0% | $8,020,503 | 24.2% | 100.0% |
| Vacant | 0 | 0 | $0.00 | 0.0% | 100.0% | $0 | 0.0% | 100.0% |
| Total/Wtd. Avg. | 12 | 8,209,036 | $4.03 | 100.0% | $33,103,501 | 100.0% | ||
| (1) | Information is based on the underwritten rent roll. |
| (2) | Certain tenants may have lease termination options that are exercisable prior to the originally stated expiration date of the related lease and that are not considered in the lease rollover schedule. |
| This is not a research report and was not prepared by any Underwriter’s research department. It was prepared by the Underwriters’ sales, trading, banking or other non-research personnel. Please see additional important information and qualifications at the end of this Term Sheet. |
75
| Industrial – Warehouse Distribution | Loan #5 | Cut-off Date Balance: | $50,000,000 | |
| Various | ILPT Industrial Portfolio | Cut-off Date LTV: | 39.2% | |
| Various | U/W NCF DSCR: | 5.05x | ||
| U/W NOI Debt Yield: | 14.8% |
The Markets. The ILPT Industrial Portfolio Properties are located across eight states. The ILPT Industrial Portfolio Properties are located in Indiana (four properties, 40.2% of NRA), Ohio (one property, 21.8% of NRA), and Virginia (one property, 12.4% of NRA), with the five remaining ILPT Industrial Portfolio Properties located in Missouri, Iowa, Kentucky, Maryland and Pennsylvania.
The following table presents the geographical distribution of the ILPT Industrial Portfolio Properties:
| ILPT Industrial Portfolio Summary(1) | ||||||||
State | Total GLA (SF) | Cut-off Date | % of ALA(2) | 9/1/2019 Occupancy | Annual UW Base Rent | Annual UW Base Rent PSF | % of Total Annual UW Base Rent | Appraised Value |
| Indiana | 3,297,159 | $77,372,139 | 36.1% | 100.0% | $11,422,873 | $3.46 | 34.5% | $197,400,000 |
| Ohio | 1,791,246 | $37,039,854 | 17.3% | 100.0% | $6,456,575 | $3.60 | 19.5% | $94,500,000 |
| Virginia | 1,016,065 | $27,319,342 | 12.7% | 100.0% | $3,878,016 | $3.82 | 11.7% | $69,700,000 |
| Missouri | 430,986 | $24,183,693 | 11.3% | 100.0% | $3,782,146 | $8.78 | 11.4% | $61,700,000 |
| Iowa | 644,104 | $12,738,574 | 5.9% | 100.0% | $2,873,813 | $4.46 | 8.7% | $32,500,000 |
| Kentucky | 603,586 | $16,109,397 | 7.5% | 100.0% | $2,334,949 | $3.87 | 7.1% | $41,100,000 |
| Maryland | 220,800 | $11,562,706 | 5.4% | 100.0% | $1,364,544 | $6.18 | 4.1% | $29,500,000 |
| Pennsylvania | 205,090 | $8,074,296 | 3.8% | 100.0% | $990,585 | $4.83 | 3.0% | $20,600,000 |
| Total/Wtd. Avg. | 8,209,036 | $214,400,000 | 100.0% | 100.0% | $33,103,501 | $4.03 | 100.0% | $547,000,000 |
| (1) | Based on the underwritten rent roll. |
| (2) | Based on the Senior Notes. |
The following table presents submarket information for the ILPT Industrial Portfolio Properties:
| ILPT Industrial Portfolio Properties Market Statistics | ||||||
| Property | State | Submarket | Available Space (SF) | Vacancy Rate | Wtd. Avg. Asking Rent PSF (Monthly) | Under Construction (SF) |
| 1800 Union Airpark Boulevard | OH | Northwest | 113,345,685 | 4.3% | $4.48 | 2,536,131 |
| 4237-4255 Anson Boulevard | IN | Indianapolis Far Boone County Industrial | 23,211,042 | 5.3% | $4.42 | 3,397,082 |
| 5000 Commerce Way | VA | Dinwiddie County Industrial | 4,251,769 | 2.3% | $5.39 | 0 |
| 5142 & 5148 North Hanley Road | MO | North St. Louis County – Airport Industrial | 306,000,000 | 5.1% | $5.44 | 3,300,000 |
| 945 Monument Drive | IN | Indianapolis Far Boone County Industrial | 23,211,042 | 5.3% | $4.42 | 3,397,082 |
| 2801 Airwest Boulevard | IN | Indianapolis Plainfield Industrial | 42,994,858 | 4.5% | $4.59 | 1,897,965 |
| 20 Logistics Boulevard | KY | Northern Kentucky | 73,085,428 | 2.9% | $4.59 | 6,356,231 |
| 5500 Southeast Delaware Avenue | IA | Des Moines Northwest Industrial | 10,744,905 | 1.9% | $6.11 | 185,900 |
| 2150 Stanley Road | IN | Indianapolis Plainfield Industrial | 42,994,858 | 4.5% | $4.59 | 1,897,965 |
| 16101 Queens Court | MD | Bowie Industrial | 5,500,000 | 6.9% | $8.90 | 0 |
| 5 Logistics Drive | PA | Central PA | 130,626,700 | 7.0% | $4.64 | 7,244,588 |
Source: Appraisals.
| This is not a research report and was not prepared by any Underwriter’s research department. It was prepared by the Underwriters’ sales, trading, banking or other non-research personnel. Please see additional important information and qualifications at the end of this Term Sheet. |
76
| Industrial – Warehouse Distribution | Loan #5 | Cut-off Date Balance: | $50,000,000 | |
| Various | ILPT Industrial Portfolio | Cut-off Date LTV: | 39.2% | |
| Various | U/W NCF DSCR: | 5.05x | ||
| U/W NOI Debt Yield: | 14.8% |
Operating History and Underwritten Net Cash Flow.The following table presents certain information relating to the historical operating performance and the Underwritten Net Cash Flow of the ILPT Industrial Portfolio:
| Cash Flow Analysis | |||||
| 2016 | 2017 | 2018 | UW | UW PSF | |
| Total Rental Income | $16,490,561 | $27,070,602 | $28,111,926 | $33,103,501 | $4.03 |
| Total Recoveries | $4,184,720 | $6,235,383 | $6,901,354 | $7,400,766 | $0.90 |
| Total Other Income | $162,138 | $322,484 | 322,484 | 331,034 | $0.04 |
| Vacancy | $0 | $0 | $0 | ($1,012,607) | ($0.12) |
| Effective Gross Income | $20,837,420 | $33,628,469 | $35,335,764 | $39,822,695 | $4.85 |
| Real Estate Taxes(1) | $3,755,367 | $5,009,001 | $4,817,082 | $5,410,051 | $0.66 |
| Insurance | $24,168 | $088,147 | $94,578 | $192,515 | $0.02 |
| Other Expenses | $738,627 | $1,271,465 | $1,533,954 | $2,383,213 | $0.29 |
| Total Expenses | $4,518,161 | $6,368,613 | $6,445,614 | $7,985,779 | $0.97 |
| Net Operating Income(2) | $16,319,258 | $27,259,856 | $28,890,150 | $31,836,916 | $3.88 |
| Capital Expenditures | $584,669 | $509,338 | $0 | $656,723 | $0.08 |
| TI/LC | $0 | $0 | $0 | $2,038,736 | $0.25 |
| Net Cash Flow | $15,734,589 | $26,750,518 | $28,890,150 | $29,141,457 | $3.55 |
| Occupancy %(3) | NAV | NAV | NAV | 97.5% | |
| NOI DSCR(4) | 2.83x | 4.73x | 5.01x | 5.52x | |
| NCF DSCR(4) | 2.73x | 4.64x | 5.01x | 5.05x | |
| NOI Debt Yield(4) | 7.6% | 12.7% | 13.5% | 14.8% | |
| NCF Debt Yield(4) | 7.3% | 12.5% | 13.5% | 13.6% | |
| (1) | Certain of the ILPT Industrial Portfolio Properties benefit from tax abatements or incentives. See“Description of the Mortgage Pool—Real Estate and Other Tax Considerations”in the Preliminary Prospectus. |
| (2) | The increase in UW Net Operating Income from 2018 Net Operating Income is primarily attributed to (i) $442,662 of rent steps through August 30, 2020, (ii) $955,208 in straight line rent taken through the earlier of the loan term or the lease term for seven tenants including Procter & Gamble, Amazon, SKF USA, The Toro Company, Whirlpool Corporation, Cummins, Inc. and Siemens Corporation, and (iii) recent leasing, including Transamerica Auto Parts ($966,999 in UW rent) and SKF USA ($709,343 in UW rent). |
| (3) | Historical occupancy was not provided by the borrower sponsor. Based on the underwritten rent roll dated September 1, 2019, the ILPT Industrial Portfolio is 100.0% occupied. |
| (4) | Debt service coverage ratios and debt yields are based on the ILPT Industrial Portfolio Senior Loan and exclude the ILPT Industrial Portfolio Subordinate Companion Loan. |
Escrows and Reserves.
Real Estate Taxes - Solely during the continuance of a Cash Management Sweep Period (as defined below), the ILPT Industrial Portfolio Borrowers are required to escrow monthly 1/12 of the annual estimated real estate taxes, provided that the ILPT Industrial Portfolio Borrowers will not be required to reserve amounts with the lender that are paid directly by a tenant under a lease that is in full force and effect and as to which no event of default by the tenant is continuing.
Insurance- Solely during the continuance of a Cash Management Sweep Period, the ILPT Industrial Portfolio Borrowers are required to escrow monthly 1/12 of the annual estimated insurance premiums (unless the ILPT Industrial Portfolio Borrowers maintain acceptable blanket insurance policies, which comply with the requirements under the ILPT Industrial Portfolio Whole Loan documents, and the insurance premiums payable in connection therewith have been prepaid for not less than one year in advance, or, for the period of coverage under the insurance policies as to which certificates are delivered at loan origination, if less than one year).
Toro Expansion Reserve- The ILPT Industrial Portfolio Borrowers were required to escrow the amount of $6,134,903.93 with the lender for the payment of capital expenditures to be incurred in connection with the expansion of the premises demised pursuant to The Toro Company lease.
Lockbox and Cash Management.The ILPT Industrial Portfolio Whole Loan is structured with a hard lockbox and springing cash management. The ILPT Industrial Portfolio Borrowers are required to direct each tenant at the ILPT Industrial Portfolio to deposit funds directly into the lockbox account, and to deposit any funds received by the ILPT Industrial Portfolio Borrowers and property manager, notwithstanding such direction, into the lockbox account within two business days of receipt. If no Cash Management Sweep Period exists, amounts on deposit in the lockbox account are required to be disbursed to the ILPT Industrial Portfolio Borrowers’ operating account on each business day. Upon the first occurrence of a Cash Management Sweep Period, the lender is required to establish, and the ILPT Industrial Portfolio Borrowers are required to cooperate to establish, a lender-controlled cash management account. If a Cash Management Sweep Period exists, funds on deposit in the lockbox account are required to be transferred to such cash management account, and applied to make monthly deposits to the tax reserve and insurance reserve as described above under “Escrows and Reserves,” to pay debt service on the ILPT Industrial Portfolio Whole Loan, to pay approved operating expenses in accordance with the annual budget (which is required to be reasonably approved by the lender during the continuance of a Cash Management Sweep Period) and extraordinary expenses approved by the lender, and to pay any remainder (i) during a Cash Management Sweep Period caused by a Partial Debt Yield Event (as defined below), 50% into the cash trap account, and 50% to the ILPT Industrial Portfolio Borrowers or (ii) during any Cash Management Sweep Period not caused solely by a Partial Debt Yield Event, 100% into the cash trap account. In each case, the amounts deposited in the cash trap account (such amounts, the “Cash Trap Funds”) are required to be held as additional collateral for the ILPT Industrial Portfolio Whole Loan during the continuance of the Cash Management Sweep Period; provided that, so long as no event of default is continuing under the ILPT Industrial Portfolio Whole Loan, funds in the cash trap account are required to be applied to pay any shortfalls in debt service and to make deposits into the tax and insurance reserves to the
| This is not a research report and was not prepared by any Underwriter’s research department. It was prepared by the Underwriters’ sales, trading, banking or other non-research personnel. Please see additional important information and qualifications at the end of this Term Sheet. |
77
| Industrial – Warehouse Distribution | Loan #5 | Cut-off Date Balance: | $50,000,000 | |
| Various | ILPT Industrial Portfolio | Cut-off Date LTV: | 39.2% | |
| Various | U/W NCF DSCR: | 5.05x | ||
| U/W NOI Debt Yield: | 14.8% |
extent amounts on deposit in the cash management account are insufficient, and, if requested by the ILPT Industrial Portfolio Borrowers, to pay tenant improvements costs and allowances and leasing commissions for leases approved or deemed approved by the lender, capital expenditures set forth in the approved annual budget, management fees not to exceed 3.0% of operating income for the ILPT Industrial Portfolio Properties, and (subject to an annual cap of $100,000) REIT distributions to owners of the ILPT Industrial Portfolio Borrowers.
A “Cash Management Sweep Period” will commence (a) upon the occurrence of an event of default under the loan documents, (b) upon the occurrence of a Debt Yield Event or (c) upon the occurrence of a Partial Debt Yield Event and will terminate upon (x) with respect to clause (a), the cure of such event of default, (y) with respect to clause (b), the termination of such Debt Yield Event, or (z) with respect to clause (c), the termination of such Partial Debt Yield Event.
A “Debt Yield Event” will commence if the debt yield for the ILPT Industrial Portfolio Whole Loan is less than 6.75% at the end of two consecutive calendar quarters and will end if (i) the debt yield for the ILPT Industrial Portfolio Whole Loan is equal to or greater than 6.75% for two consecutive calendar quarters, or (ii) the ILPT Industrial Portfolio Borrowers have delivered to the lender a letter of credit in accordance with the loan documents in a face amount such that, if applied to reduce the principal balance of the ILPT Industrial Portfolio Whole Loan, would result in a debt yield of at least 6.75%.
A “Partial Debt Yield Event” will occur if the debt yield for the ILPT Industrial Portfolio Whole Loan is less than 7.25% at the end of two consecutive calendar quarters (and a Debt Yield Event does not exist) and will end if (i) the debt yield for the ILPT Industrial Portfolio Whole Loan is equal to or greater than 7.25% for two consecutive calendar quarters, (ii) the ILPT Industrial Portfolio Borrowers have delivered to the lender a letter of credit in accordance with the loan documents in a face amount such that, if applied to reduce the principal balance of the ILPT Industrial Portfolio Whole Loan, would result in a debt yield of at least 7.25%, or (iii) the amount of funds on deposit in the Cash Trap Funds are equal to, or in excess of, an amount equal to (x) $2.50 times (y) the rentable square footage of all vacant space at the ILPT Industrial Portfolio Properties.
Additional Secured Indebtedness (not including trade debts).In addition to the ILPT Industrial Portfolio Mortgage Loan, the ILPT Industrial Portfolio also secures the ILPT Industrial Portfolio ServicedPari Passu Companion Loans, which have an aggregate Cut-off Date principal balance of $164,400,000, and the ILPT Industrial Portfolio Subordinate Companion Loans which have an aggregate Cut-off Date principal balance of $135,600,000. The ILPT Industrial Portfolio ServicedPari Passu Companion Loans accrue interest at the same rate as the ILPT Industrial Portfolio Mortgage Loan. The ILPT Industrial Portfolio Subordinate Companion Loans accrue interest at the rate of 4.40%per annum. The ILPT Industrial Portfolio Senior Loan is generally senior in right of payment to the ILPT Industrial Portfolio Subordinate Companion Loan. The holders of the ILPT Industrial Portfolio Mortgage Loan, the ILPT Industrial Portfolio ServicedPari Passu Companion Loans and the ILPT Industrial Portfolio Subordinate Companion Loans have entered into a co-lender agreement which sets forth the allocation of collections on the ILPT Industrial Portfolio Whole Loan. See “Description of the Mortgage Pool—The Whole Loans—The Serviced Pari Passu-A/B Whole Loan—The ILPT Industrial Portfolio Whole Loan” in the Preliminary Prospectus.
Mezzanine Loan and Preferred Equity.Not permitted.
Release of Property.The ILPT Industrial Portfolio Borrowers may obtain the release of an ILPT Industrial Portfolio Property (without payment of a yield maintenance premium) solely in connection with a casualty or condemnation, as follows. In the event that no event of default exists and a casualty or condemnation occurs as to which either (i) (a) the net proceeds of such casualty or condemnation are greater than 25% of the Casualty Release Value (as defined below) of the affected ILPT Industrial Portfolio Property (the “Affected Property”), and (b) the ILPT Industrial Portfolio Borrowers, after using commercially reasonable efforts are unable to satisfy conditions to restoration requiring that restoration be commenced as soon as reasonably practicable but no later than 90 days after net proceeds are made available to the ILPT Industrial Portfolio Borrowers, and the Affected Property and use thereof after restoration will be in compliance with legal requirements, the Bond Lease (as defined below), if applicable, any major lease at the Affected Property and other documents applicable to the Affected Property, and (c) the lender does not make net proceeds available to the ILPT Industrial Portfolio Borrowers for restoration or (ii) the net proceeds of such casualty or condemnation are greater than 60% of the Casualty Release Value, then the ILPT Industrial Portfolio Borrowers may, on or prior to the second monthly payment date following the application of said net proceeds, prepay the ILPT Industrial Portfolio Whole Loan and obtain the release of the Affected Property. Such prepayment is subject to certain conditions set forth in the ILPT Industrial Portfolio Whole Loan documents, including, among others: (i) payment of an amount equal to (1) the greater of (A) the Casualty Release Value applicable to the Affected Property, and (B) the amount required to be paid under the REMIC Payment Requirement (as defined below), less (2) the portion of the net proceeds applied to the principal amount of the ILPT Industrial Portfolio Whole Loan applicable to such Affected Property (or zero if the amount in clause (2) is equal to or greater than the amount in clause (1)), (ii) transfer and conveyance of the Affected Property to a person other than the ILPT Industrial Portfolio Borrowers or any other loan party and (iii) payment of any additional amount required in order to satisfy the REMIC Payment Requirement.
The “Casualty Release Value” for each of the ILPT Industrial Portfolio Properties, as set forth in the ILPT Industrial Portfolio Whole Loan documents is as follows: 945 Monument Drive – $32,760,512; 16101 Queens Court – $18,875,686; 4237-4255 Anson Boulevard – $46,709,324; 5500 Southeast Delaware Avenue – $20,795,247; 5 Logistics Drive – $13,180,987; 1800 Union Airpark Boulevard – $60,466,179; 2150 Stanley Road –$19,323,583; 20 Logistics Boulevard – $26,297,989; 5142 & 5148 North Hanley Road – $39,478,976; 2801 Airwest Boulevard – $27,513,711; 5000 Commerce Way –$44,597,806, which in each case is approximately 100% of the related allocated loan amount.
The “REMIC Payment Requirement”: means, if immediately following a release of any Affected Property following a condemnation (but taking into account any proposed restoration on the remaining ILPT Industrial Portfolio Properties), the ratio of the unpaid principal balance of the ILPT Industrial Portfolio Whole Loan to the value of the remaining ILPT Industrial Portfolio Properties (including only real property) is greater than 125%, the principal balance of the ILPT Industrial Portfolio Whole Loan must be paid down by an amount equal to the least of the following amounts: (i) the net proceeds paid in connection with the related condemnation, (ii) the fair market value of the released Affected Property at the time of the release, or (iii) an amount such that the loan-to-value ratio of the ILPT Industrial Portfolio Whole Loan does not increase after the release, unless the ILPT Industrial Portfolio Borrowers deliver to the lender an opinion of counsel that if such amount is not paid, the securitization will not fail to maintain its status as a REMIC trust.
Right of First Offer/Right of First Refusal.With respect to each of the ILPT Industrial Portfolio Properties leased to Amazon, Amazon has both a right of first offer (“ROFO”) and a right of first refusal (“ROFR”) in connection with any offer for sale either of any such property or of a portfolio comprised solely of properties leased by the borrower to Amazon. The ROFO and ROFR do not apply to transfers to any affiliates of the ILPT Industrial Portfolio Borrowers, transfers to any joint venture or partnership with the ILPT Industrial Portfolio Borrowers, or transfers in connection with any debt or equity financing, pursuant to a foreclosure or deed in lieu thereof.
| This is not a research report and was not prepared by any Underwriter’s research department. It was prepared by the Underwriters’ sales, trading, banking or other non-research personnel. Please see additional important information and qualifications at the end of this Term Sheet. |
78
| Industrial – Warehouse Distribution | Loan #5 | Cut-off Date Balance: | $50,000,000 | |
| Various | ILPT Industrial Portfolio | Cut-off Date LTV: | 39.2% | |
| Various | U/W NCF DSCR: | 5.05x | ||
| U/W NOI Debt Yield: | 14.8% |
Additionally, The Toro Company has a ROFO with respect to the ILPT Industrial Portfolio Property leased by it. Such ROFO is personal to The Toro Company and terminates automatically if the tenant transfers the lease. The ROFO does not apply to (i) any portfolio sale where the total sale price is over $500,000,000, (ii) any transfer in connection with any financing (or a foreclosure sale or deed in lieu thereof), (iii) a transfer to any entity that is a successor to the ILPT Industrial Portfolio Borrowers by merger or to a party whose property is managed by the ILPT Industrial Portfolio Borrowers’ property manager or (iv) a simultaneous tax-free exchange.
Ground Lease and Tax Abatement. With respect to the 5142 & 5148 North Hanley Road property (the “North Hanley Property”), in connection with the development of the North Hanley Property and in order to incentivize the sole tenant, SKF USA (“SKF”), to locate at the property, a fee interest in the property was obtained by St. Louis County, St. Louis County ground leased the North Hanley Property to a predecessor (the “Predecessor Entity”) of the ILPT Industrial Portfolio Borrowers (the “Bond Lease”), bonds were issued by St. Louis County (the “County Bonds”) to the Predecessor Entity as payment for its costs in constructing the property, and the Predecessor Entity, SKF, and St. Louis County entered into a performance agreement (the “Performance Agreement”). The applicable ILPT Industrial Portfolio Borrower has succeeded to the rights of the Predecessor Entity under the County Bonds, the Bond Lease and the Performance Agreement. The rent payable by the ILPT Industrial Portfolio Borrowers to the County under the Bond Lease is equal to the principal and interest payments due to the ILPT Industrial Portfolio Borrowers under the County Bonds and, therefore the rental payments to be made by the applicable ILPT Industrial Portfolio Borrower and bond payments owed to such ILPT Industrial Portfolio Borrower offset each other. During the term of the Bond Lease, the ILPT Industrial Portfolio Borrowers are entitled to purchase all or any portion of the North Hanley Property back from the County and terminate the Bond Lease, in return for tender and cancellation of all outstanding County Bonds. The ILPT Industrial Portfolio Borrowers are also required to repurchase the North Hanley Property and terminate the Bond Lease, upon expiration of the Bond Lease or completion of the final bond payment, in each case in return for tender and cancellation of all outstanding County Bonds. The Bond Lease expires on the earlier of (i) the date the SKF lease is terminated and (ii) December 31 of the 10th calendar year following the completion date (as defined in the Bond Lease, provided that it is deemed to be not later than December 31, 2016). According to the appraisal, the improvements at the property were completed in 2015, which would result in a final expiration date of December 31, 2025 for the Bond Lease.
In connection with the above arrangements, the related ILPT Industrial Portfolio Borrower is exempt from payment of real property taxes during the term of the Bond Lease. Under the Performance Agreement, in lieu of real property taxes, the related ILPT Industrial Portfolio Borrower and SKF are jointly liable to make contributions to a special allocation fund in St. Louis, Missouri. The contributions amount is dependent on the number of jobs offered by SKF during each annual test period (a 90 day period ending on September 30 of each year), and said amount begins increasing once SKF employs less than 388 full time employees. If SKF offers less than 350 jobs, (i) the contributions amount increases to equal 100% of the unabated real property taxes that would have otherwise been paid and (ii) the County Bonds structure and Bond Lease are effectively terminated as SKF is required to purchase the fee interest in the North Hanley Property (in return for tender and cancellation of the County Bonds) by December 31 of such year. SKF is obligated under its lease to pay both the unabated taxes (when due) and the contribution payments, as applicable. Accordingly, no real estate taxes or contribution payments were underwritten. According to the appraisal, estimated unabated taxes following the expiration of the tax abatement, which is assumed to occur on December 31, 2025, are expected to be $754,225 in 2026.
The County Bonds have been pledged to the lender to secure the ILPT Industrial Portfolio Whole Loan.
Letter of Credit.The ILPT Industrial Portfolio Borrowers have the right to deliver a letter of credit meeting the requirements of the ILPT Industrial Portfolio Whole Loan documents in lieu of deposits previously made to the Toro Expansion Reserve. In addition, a letter of credit may be delivered to cure a Debt Yield Event or Partial Debt Yield Event as described above under “Lockbox and Cash Management”.
Terrorism Insurance.The ILPT Industrial Portfolio Whole Loan documents require that the “all risk” insurance policy required to be maintained by the ILPT Industrial Portfolio Borrowers provide coverage for terrorism in an amount equal to the full replacement cost of the ILPT Industrial Portfolio and 18 months of business interruption insurance; provided that for so long as the Terrorism Risk Insurance Act of 2002, as extended and modified by the Terrorism Risk Insurance Program Reauthorization Act of 2015 (“TRIPRA”) (including any extensions thereof or if another federal governmental program is in effect relating to “acts of terrorism” which provides substantially similar protections as TRIPRA), is in effect and continues to cover both foreign and domestic acts of terrorism, the lender is required to accept terrorism insurance with coverage against “covered acts” within the meaning of TRIPRA (or such other program).
| This is not a research report and was not prepared by any Underwriter’s research department. It was prepared by the Underwriters’ sales, trading, banking or other non-research personnel. Please see additional important information and qualifications at the end of this Term Sheet. |
79
| Mixed Use - Multifamily, Retail & Office | Loan #6 | Cut-off Date Balance: | $50,000,000 | |
| 194 Southeast 1st Avenue | Royal Palm Place | Cut-off Date LTV: | 62.9% | |
| Boca Raton, FL 33432 | U/W NCF DSCR: | 2.16x | ||
| U/W NOI Debt Yield: | 8.5% |

| This is not a research report and was not prepared by any Underwriter’s research department. It was prepared by the Underwriters’ sales, trading, banking or other non-research personnel. Please see additional important information and qualifications at the end of this Term Sheet. |
80
| Mixed Use - Multifamily, Retail & Office | Loan #6 | Cut-off Date Balance: | $50,000,000 | |
| 194 Southeast 1st Avenue | Royal Palm Place | Cut-off Date LTV: | 62.9% | |
| Boca Raton, FL 33432 | U/W NCF DSCR: | 2.16x | ||
| U/W NOI Debt Yield: | 8.5% |

| This is not a research report and was not prepared by any Underwriter’s research department. It was prepared by the Underwriters’ sales, trading, banking or other non-research personnel. Please see additional important information and qualifications at the end of this Term Sheet. |
81
| Mortgage Loan No. 6 – Royal Palm Place |
| Mortgage Loan Information | Property Information | |||||
| Mortgage Loan Seller: | AREF | Single Asset/Portfolio: | Single Asset | |||
| Credit Assessment (KBRA/Fitch/S&P): | NR/NR/NR | Location: | Boca Raton, FL 33432 | |||
| Original Balance(1): | $50,000,000 | General Property Type: | Mixed Use | |||
| Cut-off Date Balance(1): | $50,000,000 | Detailed Property Type(6): | Multifamily/Retail/Office | |||
| % of Initial Pool Balance: | 4.9% | Title Vesting: | Fee | |||
| Loan Purpose: | Refinance | Year Built/Renovated: | 1967, 2005/N/A | |||
| Sponsors: | James H. Batmasian; Marta T. | Size(6): | 462,695 SF | |||
| Batmasian | Cut-off Date Balance per SF(1): | $238 | ||||
| Guarantors(2): | James H. Batmasian; Marta T. | Maturity Date Balance per SF(1): | $238 | |||
| Batmasian | Property Manager: | Investments Management I, LLC | ||||
| Mortgage Rate: | 3.8100% | (borrower-related) | ||||
| Note Date: | 10/25/2019 | Underwriting and Financial Information | ||||
| First Payment Date: | 12/6/2019 | UW NOI: | $9,365,453 | |||
| Maturity Date: | 11/6/2029 | UW NOI Debt Yield(1): | 8.5% | |||
| Original Term to Maturity: | 120 months | UW NOI Debt Yield at Maturity(1): | 8.5% | |||
| Original Amortization Term: | 0 months | UW NCF DSCR(1): | 2.16x | |||
| IO Period: | 120 months | Most Recent NOI: | $9,861,145 (6/30/2019 TTM) | |||
| Seasoning: | 0 months | 2nd Most Recent NOI: | $9,562,222 (12/31/2018) | |||
| Prepayment Provisions: | LO (37); YM1 (79); O (4) | 3rd Most Recent NOI: | $8,740,834 (12/31/2017) | |||
| Lockbox/Cash Mgmt Status(3): | Soft/Springing | Most Recent Occupancy: | 97.6% (10/15/2019) | |||
| Additional Debt Type(1)(4): | Pari Passu | 2nd Most Recent Occupancy: | 97.5% (12/31/2018) | |||
| Additional Debt Balance(1)(4): | $60,000,000 | 3rd Most Recent Occupancy: | 96.3% (12/31/2017) | |||
| Future Debt Permitted (Type): | No (N/A) | Appraised Value (as of)(7): | $175,000,000 (9/13/2019) | |||
| Reserves(5) | Appraised Value per SF: | $378 | ||||
| Type | Initial | Monthly | Cap | Cut-off Date LTV Ratio(1): | 62.9% | |
| RE Tax: | $0 | Springing | N/A | Maturity Date LTV Ratio(1): | 62.9% | |
| Insurance: | $0 | Springing | N/A | |||
| Recurring Replacements: | $0 | Springing | N/A | |||
| TI/LC: | $0 | Springing | N/A | |||
| Sources and Uses | ||||||
| Sources | Proceeds | % of Total | Uses | Proceeds | % of Total | |
| Whole Loan Amount(1): | $110,000,000 | 100.0% | Loan Payoff: | $58,967,648 | 53.6% | |
| Return of Equity: | $50,115,426 | 45.6% | ||||
| Closing Costs: | $916,926 | 0.8% | ||||
| Total Sources: | $110,000,000 | 100.0% | Total Uses: | $110,000,000 | 100.0% | |
| (1) | The Royal Palm Place Mortgage Loan (as defined below) is part of the Royal Palm Place Whole Loan (as defined below), which is comprised of fourpari passunotes with an aggregate principal balance of $110,000,000. The Cut-off Date Balance per SF, Maturity Date Balance per SF, UW NOI Debt Yield, UW NOI Debt Yield at Maturity, UW NCF DSCR, Cut-off Date LTV Ratio and Maturity Date LTV Ratio numbers presented above are based on the aggregate principal balance of the promissory notes comprising the Royal Palm Place Whole Loan. |
| (2) | The Royal Palm Place Mortgage Loan is full recourse to the guarantors. |
| (3) | The Royal Palm Place Mortgage Loan is structured with a soft lockbox that springs to a hard lockbox for non-residential tenants during the occurrence and continuance of a Cash Management Period (as defined below). |
| (4) | See “The Mortgage Loan”and“Additional Secured Indebtedness (not including trade debts)” below for further discussion of additional debt. |
| (5) | See“Escrows and Reserves” below for further discussion of reserve requirements. |
| (6) | The Royal Palm Place Property (as defined below) consists of 256,453 SF of multifamily space (185 units), 160,058 SF of retail space and 46,184 SF of office space. |
| (7) | The appraiser concluded to “as-is” values of $80,000,000 for the multifamily component and $95,000,000 for the commercial component for the Royal Palm Place Property. |
The Mortgage Loan. The sixth largest mortgage loan (the “Royal Palm Place Mortgage Loan”) is part of a whole loan (the “Royal Palm Place Whole Loan”) evidenced by fourpari passupromissory notes in the aggregate original principal amount of $110,000,000, all of which are secured by a first priority fee mortgage encumbering a mixed-use property located in Boca Raton, Florida (the “Royal Palm Place Property”). Notes A-2 and A-3 in the original principal balance of $40,000,000 and $10,000,000, respectively, represent the non-controlling interest in the Royal Palm Place Mortgage Loan and will be included in the MSC 2019-L3 securitization transaction. Notes A-1 and A-4 in the original principal balance of $50,000,000 and $10,000,000, respectively, (the “Royal Palm PlacePari Passu Companion Loan”) represent the controlling interest in the Royal Palm Place Whole Loan and are expected to be contributed to one or more future securitization transactions. The Royal Palm Place Whole Loan will initially be serviced pursuant to the pooling and servicing agreement for the MSC 2019-L3 transaction until the controllingpari passu promissory note A-1 is securitized, whereupon the Royal Palm Place Whole Loan will be serviced pursuant to the pooling and servicing agreement for such future securitization. See “Description of the Mortgage Pool—The Whole Loans—The Serviced Pari Passu Whole Loans”and “The Non-Serviced Pari Passu Whole Loans” and “Pooling and Servicing Agreement,” and “Pooling and Servicing Agreement—Servicing of the Non-Serviced Mortgage Loans” in the Preliminary Prospectus.
| This is not a research report and was not prepared by any Underwriter’s research department. It was prepared by the Underwriters’ sales, trading, banking or other non-research personnel. Please see additional important information and qualifications at the end of this Term Sheet. |
82
| Mixed Use - Multifamily, Retail & Office | Loan #6 | Cut-off Date Balance: | $50,000,000 | |
| 194 Southeast 1st Avenue | Royal Palm Place | Cut-off Date LTV: | 62.9% | |
| Boca Raton, FL 33432 | U/W NCF DSCR: | 2.16x | ||
| U/W NOI Debt Yield: | 8.5% |
| Royal Palm Place Whole Loan Summary | ||||
| Notes | Original Balance | Cut-off Date Balance | Anticipated Note Holder | Controlling Piece |
| A-1 | $50,000,000 | $50,000,000 | AREF(1) | Yes |
| A-2 | $40,000,000 | $40,000,000 | MSC 2019-L3 | No |
| A-3 | $10,000,000 | $10,000,000 | MSC 2019-L3 | No |
| A-4 | $10,000,000 | $10,000,000 | AREF(1) | No |
| Total | $110,000,000 | $110,000,000 | ||
| (1) | Anticipated to be contributed to one or more future securitization transactions. |
The Borrower and the Borrower Sponsors.The borrower is Royal Palm Place Investments, LLC (the “Royal Palm Place Borrower”), a single-purpose Florida limited liability company whose sole member is a single member Delaware limited liability company with two independent directors. The borrower sponsors and guarantors are James H. Batmasian and Marta T. Batmasian, the co-founders of Investments Limited, a privately-owned real estate investment, development, operations management, and leasing organization. The company’s portfolio consists of over 100 residential properties as well as over 170 commercial properties. Investments Limited is headquartered in Boca Raton, Florida, and currently operates six satellite offices. The Royal Palm Place Borrower is indirectly owned by James H. Batmasian (50.0%) and Marta T. Batmasian (50.0%). The Royal Palm Place Whole Loan is full recourse to the borrower sponsors. The non-consolidation opinion of counsel to the borrower delivered at origination provided no opinion regarding the substantive consolidation of the assets and liabilities of the Royal Palm Place Borrower or its managing member with those of any one or more related parties to the extent the existence of the potential obligations of the guarantor under the related full recourse guaranty results in or has a material effect on any such substantive consolidation. See “Description of the Mortgage Pool—Non-Recourse Carveout Limitations” in the Preliminary Prospectus.
In 2008, James H. Batmasian was sentenced to eight months of prison, two years of supervised release and ordered to pay a fine of $30,000 after he pled guilty for the willful failure to withhold and pay Federal Insurance Contributions Act (“FICA”) taxes for certain employees in the sum of $11,175 between 2001 and 2003. James H Batmasian also agreed to pay back the federal government $253,513 in owed FICA taxes in connection with this case. Separately, Susan Haynie, the former mayor of Boca Raton, Florida who is unrelated to the financing of the Royal Palm Place Whole Loan, was charged in April 2018 and arrested in April 2019 for allegedly failing to disclose certain business and financial relationships with and the receipt of more than $335,000 of income from several third parties and the borrower sponsors while voting in favor of certain projects related to the borrower sponsors on four occasions between 2016 and 2017. According to a media article, these projects include requests to allow signages that deviated from legal standards in terms of size and/or color, usage of three additional city-owned parking spaces, and expansion of uses allowed – all of which were related to retail properties owned by the borrower sponsors. To date, no charges have been filed against the third parties or the borrower sponsors related to this matter. However, there is no assurance that charges will not be filed against the borrower sponsors in connection with this matter in the future or that this matter will not have a materially adverse impact on the Royal Palm Place Mortgage Loan. Also, the Royal Palm Place Property previously secured a mortgage loan that went into technical maturity default in September 2019 and was subject to a forbearance agreement in which the previous lender agreed to extend the maturity day until November 5, 2019. At origination, the Royal Palm Place Whole Loan paid off the monies due under the prior loan in full. See “Description of the Mortgage Pool—Litigation and Other Considerations” and“—Loan Purpose; Default History, Bankruptcy Issues and Other Proceedings” in the Preliminary Prospectus.
The Property.The Royal Palm Place Property is a 462,695 SF mixed-use development located in Boca Raton, Florida, approximately a 15-minute walk from various beaches. The Royal Palm Place Property contains 256,453 SF of multifamily space (the “Multifamily Component”) and 206,242 SF of retail/office space (the “Commercial Component”) situated on a 13.75-acre site across 15 buildings. As of October 15, 2019, the total occupancy rate for both components of the Royal Palm Place Property was 97.6%.
The Multifamily Component consists of 185 residential units within a nine-story tower and a three-story building. The Multifamily Component consists of 256,453 SF (55.4% of NRA) and contributes 51.3% of the underwritten base rent for the Royal Palm Place Property. The improvements were built in 2005. Project amenities include a pool, hot tub, clubhouse, putting green, fitness center, dry sauna, business center, and covered parking. Unit amenities include in-unit washer/dryer, balcony patio, garage parking, and a Whirlpool stainless steel appliance package including electric oven/range combination, dishwasher, microwave, and refrigerator/freezer. The unit mix consists of 42 one-bedroom units, 122 two-bedroom units, and 21 three-bedroom units with an average unit size of 1,385 SF. As of October 15, 2019, the Multifamily Component was 98.4% occupied by unit count. Historical occupancy for the Multifamily Component ranged between 97.1% and 98.8% since 2016.
The following table presents certain information relating to the unit mix of the Multifamily Component at the Royal Palm Place Property:
| Unit Mix(1) | ||||||||||||||||||||||||||||
| Unit Mix / Type | Units | Occupied Units | % Occupied | Average SF per Unit | Total SF | Monthly Average Rent per Unit | Concluded Average Market Rent per Unit(2) | |||||||||||||||||||||
| 1 Bedroom / 1 Bath | 32 | 29 | 90.6 | % | 956 | 30,601 | $ | 1,938 | $1,800 - $2,150 | |||||||||||||||||||
| 1 Bedroom - Penthouse | 10 | 10 | 100.0 | % | 1,176 | 11,762 | $ | 2,440 | $2,475 | |||||||||||||||||||
| 2 Bedroom / 2 Bath | 104 | 104 | 100.0 | % | 1,354 | 140,798 | $ | 2,642 | $2,600 - $3,150 | |||||||||||||||||||
| 2 Bedroom - Penthouse | 18 | 18 | 100.0 | % | 1,909 | 34,362 | $ | 3,580 | $3,150 - $3,900 | |||||||||||||||||||
| 3 Bed / 2 Bath | 17 | 17 | 100.0 | % | 1,749 | 29,741 | $ | 3,387 | $3,000 - $4,000 | |||||||||||||||||||
| 3 Bed Penthouse | 4 | 4 | 100.0 | % | 2,247 | 8,989 | $ | 3,888 | $4,200 | |||||||||||||||||||
| Total/Wtd. Avg. | 185 | 182 | 98.4 | % | 1,385 | 256,253 | $ | 2,708 | N/A | |||||||||||||||||||
| (1) | Information is based on the underwritten rent roll as of October 15, 2019. |
| (2) | Based on information obtained from the appraisal. |
| This is not a research report and was not prepared by any Underwriter’s research department. It was prepared by the Underwriters’ sales, trading, banking or other non-research personnel. Please see additional important information and qualifications at the end of this Term Sheet. |
83
| Mixed Use - Multifamily, Retail & Office | Loan #6 | Cut-off Date Balance: | $50,000,000 | |
| 194 Southeast 1st Avenue | Royal Palm Place | Cut-off Date LTV: | 62.9% | |
| Boca Raton, FL 33432 | U/W NCF DSCR: | 2.16x | ||
| U/W NOI Debt Yield: | 8.5% |
The Commercial Component consists of 206,242 SF (44.6% of NRA) and contributes to 48.7% of the underwritten base rent. The Commercial Component is located throughout 13, one- and two-story buildings, in addition to the lower floors of the two multifamily buildings. Within the Commercial Component, there are 160,058 SF of retail space (inclusive of 1,700 SF of warehouse space leased to a retail tenant) and 46,184 SF of office space. The retail space is leased to a mixture of restaurants, salons and spas, boutiques, and specialty stores. Royal Palm Place has become a culinary venue comprised of restaurants serving a variety of international cuisines. Notable restaurants at the Royal Palm Place Property include Domus Italian Restaurant, The Funky Biscuit, Gary Rack’s Farmhouse Kitchen, and Biergarten. Office tenants are made up of a number of law firms, financial companies, media firms, and healthcare/insurance companies. As of October 15, 2019, the Commercial Component is 95.8% occupied pursuant to 115 leases.
The Royal Palm Place Property has asphalt paved open parking located throughout the site, as well as a five-story parking garage that is attached to the main apartment building. There are 823 surface and garage parking spaces or 1.78 per 1,000 SF of NRA onsite, which is shared between the Multifamily and Commercial Component.
Major Tenants.
Buckhead Life Restaurant (10,427 SF, 2.3% of total NRA, 3.5% of total underwritten rent).Buckhead Life Restaurant Group (“BLRG”) was founded by Pano Karatassos and is headquartered in Atlanta, Georgia. Mr. Karatassos opened his first restaurant in Atlanta in 1979 and currently operates nine restaurants in Atlanta, two in Boca Raton and one in Miami Beach, all under the BLRG banner. The company operates Chops Lobster Bar at the Royal Palm Place Property. BLRG has been a tenant at the Royal Palm Place Property since 2006 when it commenced an initial 10 year lease. BLRG commenced a five-year renewal term in January 2017 and has two, five-year renewal options available. The current lease has an expiration date of December 31, 2021 with no early termination options.
James King, Inc. (6,000 SF, 1.3% of total NRA, 1.3% of total underwritten rent). James King, Inc. dba Ichiyami Buffet & Sushi, is a contemporary all-you-can-eat buffet with sushi, a hibachi grill and Pan-Asian selections. The tenant has occupied the space at the Royal Palm Place Property since 2013 when it commenced its original lease for a period of five years. The tenant most recently renewed its lease for a period of five years commencing in 2018, and has two, five-year renewal options available. The current lease has an expiration date of April 30, 2023 with no early termination options.
Grand Interiors International (4,300 SF, 0.9% of total NRA, 0.6% of total underwritten rent).Grand Interiors International is a boutique showcasing high-end customizable furniture, European bed linens, luxurious bath décor, and exceptional home accessories. Grand Interiors International has been a tenant at the Royal Palm Place Property since 2015 when it commenced a three year lease encumbering 2,800 SF. The tenant exercised its first of two, two-year renewal options in 2018. The current lease has an expiration date of March 31, 2020 with no early termination options.
| This is not a research report and was not prepared by any Underwriter’s research department. It was prepared by the Underwriters’ sales, trading, banking or other non-research personnel. Please see additional important information and qualifications at the end of this Term Sheet. |
84
| Mixed Use - Multifamily, Retail & Office | Loan #6 | Cut-off Date Balance: | $50,000,000 | |
| 194 Southeast 1st Avenue | Royal Palm Place | Cut-off Date LTV: | 62.9% | |
| Boca Raton, FL 33432 | U/W NCF DSCR: | 2.16x | ||
| U/W NOI Debt Yield: | 8.5% |
The following table presents certain information relating to the major tenants at the Royal Palm Place Property:
| Tenant Summary(1) | ||||||||
| Tenant Name | Credit Rating (Fitch/Moody's/S&P)(2) | Tenant SF | Approx. % of Total SF(3) | Annual UW Rent | % of Total Annual UW Rent(3) | Annual UW Rent PSF(4) | Lease Expiration | Termination Option (Y/N) |
| Retail Tenants | ||||||||
| Buckhead Life Restaurant Group | NR/NR/NR | 10,427 | 2.3% | $403,733 | 3.5% | $38.72 | 12/31/2021 | N |
| James King, Inc. | NR/NR/NR | 6,000 | 1.3% | $146,351 | 1.3% | $24.39 | 4/30/2023 | N |
| Showtime Boca, Inc. and Marily(5) | NR/NR/NR | 4,480 | 1.0% | $96,000 | 0.8% | $21.43 | 8/31/2020 | N |
| Grand Interiors International | NR/NR/NR | 4,300 | 0.9% | $70,403 | 0.6% | $16.37 | 3/31/2020 | N |
| Funky Biscuit Enterprises, Inc. | NR/NR/NR | 4,100 | 0.9% | $96,000 | 0.8% | $23.41 | 3/31/2020 | N |
| Retail Subtotal/Wtd. Avg. | 29,307 | 6.3% | $812,487 | 7.0% | $27.72 | |||
| Other Retail Tenants | 123,106 | 26.6% | $3,933,302 | 34.1% | $31.95 | |||
| Vacant | 7,645 | 1.7% | $0 | 0.0% | $0.00 | |||
| Retail Total/Wtd. Avg. | 160,058 | 34.6% | $4,745,789 | 41.1% | $31.14 | |||
| Office Tenants | ||||||||
| Nationwide Interpreter | NR/NR/NR | 3,000 | 0.6% | $45,395 | 0.4% | $15.13 | 8/31/2020 | N |
| Elite Home Health Group, Inc. | NR/NR/NR | 2,790 | 0.6% | $52,285 | 0.5% | $18.74 | 10/31/2020 | N |
| Retail Property Group, Inc. | NR/NR/NR | 2,779 | 0.6% | $87,033 | 0.8% | $31.32 | 12/31/2020 | N |
| Debt Defense Lawyers, P.A. | NR/NR/NR | 2,730 | 0.6% | $59,098 | 0.5% | $21.65 | 6/30/2021 | N |
| Delarentis Imports | NR/NR/NR | 2,700 | 0.6% | $43,200 | 0.4% | $16.00 | 10/31/2020 | N |
| Office Subtotal/Wtd. Avg. | 13,999 | 3.0% | $287,011 | 2.5% | $20.50 | |||
| Other Office Tenants | 31,256 | 6.8% | $591,328 | 5.1% | $18.92 | |||
| Vacant Space | 929 | 0.2% | $0 | 0.0% | $0 | |||
| Office Total/Wtd. Avg. | 46,184 | 10.0% | $878,338 | 7.6% | $19.41 | |||
| Multifamily Total/Wtd. Avg. | 256,453 | 55.4% | $5,926,392 | 51.3% | $23.11 | |||
| Total/Wtd. Avg. | 462,695 | 100.0% | $11,550,519 | 100.0% | $24.96 | |||
| (1) | Information is based on the underwritten rent roll as of October 15, 2019. |
| (2) | Certain ratings are those of the parent company, whether or not the parent guarantees the lease. |
| (3) | Calculated based on total square footage and total underwritten base rent of both Multifamily and Commercial Components. |
| (4) | Total/Wtd. Avg. Annual UW Rent PSF excludes vacant space. |
| (5) | Showtime Boca, Inc. and Marily leased 1,700 square feet of warehouse space. |
| This is not a research report and was not prepared by any Underwriter’s research department. It was prepared by the Underwriters’ sales, trading, banking or other non-research personnel. Please see additional important information and qualifications at the end of this Term Sheet. |
85
| Mixed Use - Multifamily, Retail & Office | Loan #6 | Cut-off Date Balance: | $50,000,000 | |
| 194 Southeast 1st Avenue | Royal Palm Place | Cut-off Date LTV: | 62.9% | |
| Boca Raton, FL 33432 | U/W NCF DSCR: | 2.16x | ||
| U/W NOI Debt Yield: | 8.5% |
The following table presents certain information relating to the lease rollover schedule at the Royal Palm Place Property:
| Lease Rollover Schedule(1)(2) | |||||||||
| Year | # of Leases Rolling | SF Rolling | UW Rent PSF Rolling(3) | Approx. % of Total SF Rolling | Approx. Cumulative % of SF Rolling | Total UW Rent Rolling | Approx. % of Total Rent Rolling | Approx. Cumulative % of Total Rent Rolling | |
| MTM | 2 | 2,167 | $31.51 | 0.5% | 0.5% | $68,275 | 0.6% | 0.6% | |
| 2019 | 2 | 2,910 | $20.44 | 0.6% | 1.1% | $59,480 | 0.5% | 1.1% | |
| 2020 | 45 | 75,540 | $23.94 | 16.3% | 17.4% | $1,808,227 | 15.7% | 16.8% | |
| 2021 | 26 | 50,308 | $30.88 | 10.9% | 28.3% | $1,553,411 | 13.4% | 30.2% | |
| 2022 | 13 | 19,461 | $30.24 | 4.2% | 32.5% | $588,562 | 5.1% | 35.3% | |
| 2023 | 15 | 25,262 | $30.56 | 5.5% | 38.0% | $771,996 | 6.7% | 42.0% | |
| 2024 | 10 | 17,800 | $32.34 | 3.8% | 41.8% | $575,618 | 5.0% | 47.0% | |
| 2025 | 1 | 1,120 | $33.26 | 0.2% | 42.1% | $37,254 | 0.3% | 47.3% | |
| 2026 | 0 | 0 | $0.00 | 0.0% | 42.1% | $0 | 0.0% | 47.3% | |
| 2027 | 1 | 3,100 | $52.03 | 0.7% | 42.7% | $161,304 | 1.4% | 48.7% | |
| 2028 | 0 | 0 | $0.00 | 0.0% | 42.7% | $0 | 0.0% | 48.7% | |
| 2029 | 0 | 0 | $0.00 | 0.0% | 42.7% | $0 | 0.0% | 48.7% | |
| 2030 & Beyond | 0 | 0 | $0.00 | 0.0% | 42.7% | $0 | 0.0% | 48.7% | |
| Vacant Space | 0 | 8,574 | $0.00 | 1.9% | 44.6% | $0 | 0.0% | 48.7% | |
| Subtotal/Wtd. Avg. | 115 | 206,242 | $28.45 | 44.6% | $5,624,127 | 48.7% | |||
| Multifamily Space | N/A | 256,453 | N/A | 55.4% | $5,926,392 | 51.3% | |||
| Total/Wtd. Avg. | 115 | 462,695 | N/A | 100.0% | $11,550,519 | 100.0% | |||
| (1) | Information is based on the underwritten rent roll as of October 15, 2019. |
| (2) | Certain tenants may have lease termination options that are exercisable prior to the stated expiration date of the subject lease or leases which are not considered in the lease rollover schedule. |
| (3) | Subtotal/Wtd. Avg. UW Rent PSF Rolling excludes vacant space. |
The Market. The Royal Palm Place Property is located in the city of Boca Raton, Florida, within Palm Beach County, and forms part of the Miami-Fort Lauderdale-West Palm Beach metropolitan statistical area (“MSA”). The MSA’s principal cities include Miami, Fort Lauderdale, Pompano Beach, West Palm Beach, and Boca Raton. Boca Raton features a selection of beaches along the Atlantic Ocean including Spanish River Park, Red Reef Park, and South Beach Park. These are each less than a 15-minute walk from the Royal Palm Place Property between Spanish River Boulevard and Palmetto Park Road. The Royal Palm Place is approximately two miles east of Interstate 95 and is positioned along South Federal Highway, just south of West Palmetto Park Road, which provides direct access to the interstate.
The Royal Palm Place Property neighborhood provides access to Boca Raton's largest employers, including Sun Capital Partners, Office Depot, ADT, Tyco, Florida Atlantic University, and NCC I. Major developments within the neighborhood include The Park at Broken Sound, a 850-acre business park with 5.0 million SF of commercial space; Downtown Boca, which provides 17.0 million SF of office space employing over 120,000 people and is one of South Florida’s largest employment centers; Boca Raton Regional Hospital, a 400-bed medical center with over 2,800 employees; Boca Raton Innovation Campus, a 1.7 million SF office park, which is home to corporate tenants, including Verizon and Transunion; the Congress Avenue Corridor, a 4.1-mile stretch of Congress Avenue bounded by Lake Ida to the north and Boca Raton to the south, which includes a mix of office, commercial, retail and residential developments; and Downtown Delray Beach, located approximately 15 minutes from the Royal Palm Place Property, which exhibits a combination of antique shops, clothing boutiques, art galleries, restaurants and nightlife entertainment venues.
According to the appraisal, the 2018 population within a one-, three- and five-mile radius of the Royal Palm Place Property was 6,710, 16,217 and 78,643, respectively. The 2018 average household income within the same one-, three- and five-mile radius was $120,752, $120,123 and $100,991, respectively.
According to the appraisal, the Royal Palm Place Property is a part of the Boca Raton Apartment submarket, which contains 22,045 units with a vacancy rate of 5.2% and 1,234 units under construction as of the second quarter of 2019. The Royal Palm Place Property is a part of the Boca Raton East retail submarket, which contains 4,035,848 SF with a vacancy rate of 2.5%, average asking rent of $30.50 per SF and one project with total square footage of 21,726 under construction as of third quarter of 2019. Based on the lease comparables, the appraiser concluded to $30 per SF triple net for the retail space and a range of $20 to $25 per SF triple net for the office space at the Royal Palm Place Property.
| This is not a research report and was not prepared by any Underwriter’s research department. It was prepared by the Underwriters’ sales, trading, banking or other non-research personnel. Please see additional important information and qualifications at the end of this Term Sheet. |
86
| Mixed Use - Multifamily, Retail & Office | Loan #6 | Cut-off Date Balance: | $50,000,000 | |
| 194 Southeast 1st Avenue | Royal Palm Place | Cut-off Date LTV: | 62.9% | |
| Boca Raton, FL 33432 | U/W NCF DSCR: | 2.16x | ||
| U/W NOI Debt Yield: | 8.5% |
The following table presents certain information relating to the rent comparables for the multifamily component of the Royal Palm Place Property:
| Multifamily Rental Comparables | |||||||
| Property/Location | Year Built | Number of Units | SF | Average SF/Unit | Occupancy | Average Monthly Rent per Unit | Average Monthly Rent per SF |
Royal Palm Place Property(1) 194 Southeast 1st Avenue Boca Raton, FL 33432 | 1967,2005 | 185 | 256,453 | 1,385 | 98.4% | $2,708 | $1.95 |
The Heritage at Boca Raton 300 West Palmetto Park Road Boca Raton, FL 33432 | 2011 | 248 | 283,373 | 1,143 | 92.0% | $2,250 | $1.97 |
Camden Boca Raton 131 South Federal Highway Boca Raton, FL 33432 | 2014 | 261 | 263,053 | 1,008 | 93.1% | $1,645 | $1.63 |
Mizner Park Apartments 407 Northeast Mizner Blvd Boca Raton, FL 33432 | 1992 | 272 | 294,508 | 1,083 | 91.0% | $2,243 | $2.07 |
Palmetto Promenade 333 East Palmetto Park Road Boca Raton, FL 33432 | 2016 | 353 | 366,376 | 1,038 | 94.0% | $3,221 | $3.10 |
The Mark at Cityscape 120 East Palmetto Park Road Boca Raton, FL 33432 | 2015 | 208 | 242,107 | 1,164 | 93.0% | $3,281 | $2.82 |
Source: Appraisal
| (1) | Information shown for the Royal Palm Place Property is based on the underwritten rent roll as of October 15, 2019. |
The following table presents certain information relating to the rent comparables for the retail space at the Royal Palm Place Property:
| Retail Lease Comparable Summary | |||||||
| Property/Location | Year Built | Tenant | Lease Area (SF) | Lease Date | Base Rent PSF | Lease Term (Yrs.) | Lease Type |
Royal Palm Place Property(1) 194 Southeast 1st Avenue Boca Raton, FL 33432 | 1967, 2005 | N/A | N/A | N/A | $31.14(1) | N/A | NNN |
Retail Strip 415 South Federal Boca Raton, FL 33432 | 1996 | MedSpa | 1,560 | Jul 2019 | $42.92 | 2.0 | NNN |
South Federal Mixed 150 South Federal Boca Raton, FL 33432 | 1959 | Actual | 1,253 | Jun 2018 | $22.50 | 2.0 | NNN |
Storefront Retail 98 South Federal Boca Raton, FL 33432 | 1966 | AAA Sales | 1,086 | Jul 2019 | $20.18 | 3.0 | NNN |
Old Town 20 North Federal Boca Raton, FL 33432 | 1952 | Chadwick Hair | 879 | Feb 2019 | $30.00 | 5.0 | NNN |
Palmetto Park 201 East Palmetto Boca Raton, FL 33432 | 1970 | Dirty Blond Hair | 1,226 | Jul 2018 | $32.50 | 3.0 | NNN |
Source: Appraisal
| (1) | Information shown for the Royal Palm Place Property is based on the underwritten rent roll as of October 15, 2019. |
| This is not a research report and was not prepared by any Underwriter’s research department. It was prepared by the Underwriters’ sales, trading, banking or other non-research personnel. Please see additional important information and qualifications at the end of this Term Sheet. |
87
| Mixed Use - Multifamily, Retail & Office | Loan #6 | Cut-off Date Balance: | $50,000,000 | |
| 194 Southeast 1st Avenue | Royal Palm Place | Cut-off Date LTV: | 62.9% | |
| Boca Raton, FL 33432 | U/W NCF DSCR: | 2.16x | ||
| U/W NOI Debt Yield: | 8.5% |
The following table presents certain information relating to the rent comparables for the office space at the Royal Palm Place Property:
| Office Lease Comparable Summary(1) | |||||||
| Property/Location | Year Built | Occupancy | Lease Area | Lease Date | Base Rent PSF | Lease Term (Yrs.) | Lease Type |
Royal Palm Place Property(1) 194 Southeast 1st Avenue Boca Raton, FL 33432 | 1967, 2005 | N/A | N/A | N/A | $19.41(1) | N/A | NNN |
Mizner Park Mixed Use Development 327 Plaza Retail Boca Raton, FL 33432 | 1990 | 90% | 2,000 | Oct 2019 | $25.00 | 3.0 | NNN |
Barry Plaza 40 Southeast 5th Street Boca Raton, FL 33432 | 1987 | 77% | 2,255 | Sep 2017 | $17.00 | 3.0 | NNN |
South Federal Mixed Use 150 South Federal, Suite 153 Boca Raton, FL 33432 | 1960 | 100% | 1,253 | Jan 2018 | $25.00 | 3.0 | NNN |
South Federal Highway Office 197 South Federal Highway, Suite 300 Boca Raton, FL 33432 | 2003 | 100% | 2,995 | Sep 2017 | $15.65 | 3.0 | NNN |
Source; Appraisal
| (1) | Average base rent for the office tenants based on the underwritten rent roll as of October 15, 2019. |
Operating History and Underwritten Net Cash Flow. The following table presents certain information relating to the historical operating performance and Underwritten Net Cash Flow at the Royal Palm Place Property:
| Cash Flow Analysis | ||||||
| 2016 | 2017 | 2018 | TTM 6/30/2019 | UW(1) | UW PSF | |
| Multifamily Gross Potential Rent | $5,716,077 | $5,881,688 | $5,835,596 | $5,834,395 | $5,995,392 | $12.96 |
| Retail Base Rent | $4,962,410 | $5,152,622 | $5,313,692 | $5,356,858 | $5,624,127 | $12.16 |
| Retail Gross Up | $211,542 | $208,380 | $218,836 | $208,459 | 335,602 | $0.73 |
| Total Recoveries | $2,489,116 | $2,541,054 | $3,065,222 | $3,157,249 | $2,621,697 | $5.67 |
| Other Income(2) | $587,180 | $510,395 | $462,159 | $367,234 | $367,234 | $0.79 |
| Less Vacancy & Credit Loss | ($1,292,357) | ($1,110,435) | ($1,046,298) | ($942,341) | ($943,377) | ($2.04) |
| Effective Gross Income | $12,673,968 | $13,183,704 | $13,849,207 | $13,981,854 | $14,000,676 | $30.26 |
| Real Estate Taxes | $1,703,394 | $1,809,495 | $1,874,069 | $1,874,069 | $1,926,744 | $4.16 |
| Insurance | $127,318 | $102,092 | $120,462 | $100,108 | $141,926 | $0.31 |
| Other Expenses | $1,981,815 | $2,531,283 | $2,292,454 | $2,146,532 | $2,566,552 | $5.55 |
| Total Expenses | $3,812,527 | $4,442,870 | $4,286,985 | $4,120,709 | $4,635,222 | $10.02 |
| Net Operating Income | $8,861,441 | $8,740,834 | $9,562,222 | $9,861,145 | $9,365,453 | $20.24 |
| Capital Expenditures | $0 | $0 | $0 | $0 | $115,835 | $0.25 |
| TI/LC | $94,579 | $12,140 | $35,028 | $36,370 | $68,932 | $0.15 |
| Net Cash Flow | $8,766,862 | $8,728,694 | $9,527,194 | $9,824,775 | $9,180,686 | $19.84 |
| Occupancy %(3) | 97.2% | 96.3% | 97.5% | 97.3% | 93.5% | |
| NOI DSCR | 2.09x | 2.06x | 2.25x | 2.32x | 2.20x | |
| NCF DSCR | 2.06x | 2.05x | 2.24x | 2.31x | 2.16x | |
| NOI Debt Yield | 8.1% | 7.9% | 8.7% | 9.0% | 8.5% | |
| NCF Debt Yield | 8.0% | 7.9% | 8.7% | 8.9% | 8.3% | |
| (1) | UW Retail Base Rent is based on the underwritten rent roll dated October 15, 2019. Retail Base Rent includes rent steps through September 2020 totaling $85,639. |
| (2) | UW Other Income includes RUBS/Utility Reimbursement ($90,931) and miscellaneous income ($276,303). |
| (3) | Underwritten to 93.5% economic occupancy. Physical occupancy as of October 15, 2018 is 97.6%. |
| This is not a research report and was not prepared by any Underwriter’s research department. It was prepared by the Underwriters’ sales, trading, banking or other non-research personnel. Please see additional important information and qualifications at the end of this Term Sheet. |
88
| Mixed Use - Multifamily, Retail & Office | Loan #6 | Cut-off Date Balance: | $50,000,000 | |
| 194 Southeast 1st Avenue | Royal Palm Place | Cut-off Date LTV: | 62.9% | |
| Boca Raton, FL 33432 | U/W NCF DSCR: | 2.16x | ||
| U/W NOI Debt Yield: | 8.5% |
Escrows and Reserves.
Real Estate Taxes – Upon the occurrence and during the continuance of a Cash Management Period (as defined below), the Royal Palm Place Borrower is required to escrow monthly 1/12 of the annual estimated real estate taxes (initially, $154,633 per month).
Insurance – Upon the occurrence and during the continuance of a Cash Management Period, the Royal Palm Place Borrower is required to escrow monthly 1/12 of the annual estimated insurance premiums that the lender estimates will be payable for the renewal of coverage afforded by the policies upon the expiration thereof in order to accumulate with the lender sufficient funds to pay all such insurance premiums at least 30 days prior to the expiration of the policies.
Recurring Replacements – Upon the occurrence and during the continuance of a Cash Management Period, the Royal Palm Place Borrower is required to deposit on each payment date an amount initially equal to 1/12 of the product obtained by multiplying $0.25 by the aggregate number of rentable SF of space in the Royal Palm Place Property (initially $9,653 per month) into the recurring replacements reserve.
TI/LC Reserve – Upon the occurrence and during the continuance of a Cash Management Period, the Royal Palm Place Borrower is required to deposit on each payment date an amount initially equal to 1/12 of the product obtained by multiplying $0.34 by the aggregate number of rentable SF of space in the Royal Palm Place Property (initially $13,110 per month) into the TI/LC reserve.
Lockbox and Cash Management. The Royal Palm Place Whole Loan is structured with a soft lockbox that springs to a hard lockbox for the Commercial Component upon the occurrence and during the continuance of a Cash Management Period and springing cash management. The lender escrowed tenant direction letters on the origination date and upon the first occurrence of a Cash Management Period, the Royal Palm Place Borrower is required to send tenant direction letters to direct non-residential tenants to pay rents directly into the lockbox account, and, if notwithstanding such direction, the Royal Palm Place Borrower or property manager receives any rents, to deposit or to cause to be deposited such rents into the lockbox account within one business day of receipt. Upon the first occurrence of a Cash Management Period, the lender is required to establish, and the Royal Palm Place Borrower is required to cooperate with a cash management bank chosen by the lender to establish, a lender-controlled cash management account, into which all funds in the lockbox account will be required to be deposited periodically so long as a Cash Management Period is continuing. So long as a Cash Management Period is continuing, and provided no event of default is continuing, funds in the cash management account are required to be applied (i) to make deposits into the tax and insurance escrows (if any are then required), as described above under “Escrows and Reserves”, (ii) to pay debt service on the Royal Palm Place Whole Loan, (iii) to make deposits into the capital expenditure reserve and (if then required) TI/LC reserve, as described above under “Escrows and Reserves,” (iv) to pay operating expenses set forth in the annual budget (which is required to be approved by the lender during a Cash Management Period) and extraordinary operating or capital expenses reasonably approved by the lender, and (v) to pay any remainder into an excess cash flow account to be held by the lender as additional security for the Royal Palm Place Whole Loan during the continuance of the Cash Management Period. If no Cash Management Period is continuing, all funds in the lockbox account are required to be disbursed to an account designated by the Royal Palm Place Borrower.
A “Cash Management Period” will commence (a) upon the stated maturity date until the Royal Palm Place Whole Loan is repaid in full, (b) upon the occurrence of an event of default under the Royal Palm Place Whole Loan documents, (c) if, as of the last day of each calendar quarter, the debt service coverage ratio (assuming amortization on a 30 year schedule) is less than 1.15x, or (d) if the Royal Palm Place Property is less than 85% occupied. A Cash Management Period will terminate if (i) the Royal Palm Place Whole Loan and all other obligations under the Royal Palm Place Whole Loan documents have been repaid in full or (ii) the stated maturity date has not occurred and (A) with respect to the matters described in clause (b) above, such event of default has been cured (or has been otherwise waived in writing) and no other event of default is continuing, (B) with respect to the matter described in clause (c) above, the Royal Palm Place Property has achieved a debt service coverage ratio (assuming amortization on a 30 year schedule) of at least 1.20x for two consecutive calendar quarters or, (C) with respect to the matter described in clause (d) above, the Royal Palm Place Property is at least 88% occupied at the end of two consecutive calendar quarters.
Additional Secured Indebtedness (not including trade debts). In addition to the Royal Palm Place Mortgage Loan, the Royal Palm Place Property also secures the Royal Palm PlacePari Passu Companion Loan, which has a Cut-off Date principal balance of $60,000,000. The Royal Palm PlacePari Passu Companion Loan accrues interest at the same rate as the Royal Palm Place Mortgage Loan. The Royal Palm Place Mortgage Loan is entitled to payments of interest and principal on apro rata andpari passu basis with the Royal Palm PlacePari Passu Companion Loan. The holders of the Royal Palm Place Mortgage Loan and the Royal Palm PlacePari Passu Companion Loan have entered into a co-lender agreement which sets forth the allocation of collections on the Royal Palm Place Whole Loan. See “Description of the Mortgage Pool—The Whole Loans”in the Preliminary Prospectus.
Mezzanine Loan and Preferred Equity.Not permitted.
Release of Property.Not permitted.
Right of First Offer/Right of First Refusal.None.
Ground Lease. None.
Letter of Credit.None.
Terrorism Insurance. The Royal Palm Place Whole Loan documents require that the “all risk” insurance policy required to be maintained by the Royal Palm Place Borrower provide coverage for terrorism in an amount equal to the full replacement cost of the Royal Palm Place Property. The Royal Palm Place Whole Loan documents also require business interruption insurance covering no less than the 18-month period following the occurrence of a casualty event, together with a six-month extended period of indemnity. See “Risk Factors—Risks Relating to the Mortgage Loans—Terrorism Insurance May Not Be Available for All Mortgaged Properties”in the Preliminary Prospectus.
| This is not a research report and was not prepared by any Underwriter’s research department. It was prepared by the Underwriters’ sales, trading, banking or other non-research personnel. Please see additional important information and qualifications at the end of this Term Sheet. |
89
| Multifamily – Garden | Loan #7 | Cut-off Date Balance: | $45,600,000 | |
| 1759 West Campbell Road | The Hendry | Cut-off Date LTV: | 59.0% | |
| Garland, Texas 75044 | U/W NCF DSCR: | 1.45x | ||
| U/W NOI Debt Yield: | 8.2% |
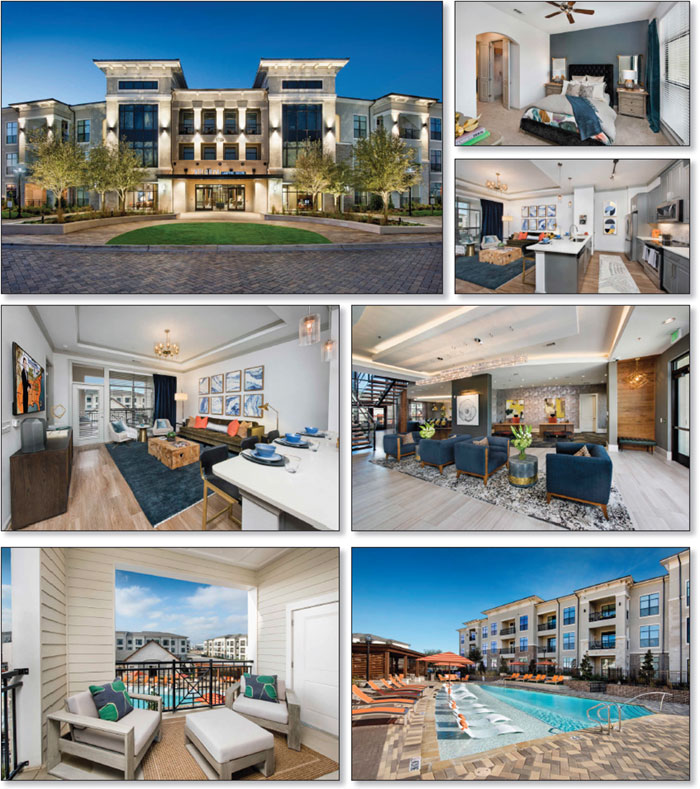
| This is not a research report and was not prepared by any Underwriter’s research department. It was prepared by the Underwriters’ sales, trading, banking or other non-research personnel. Please see additional important information and qualifications at the end of this Term Sheet. |
90
| Multifamily – Garden | Loan #7 | Cut-off Date Balance: | $45,600,000 | |
| 1759 West Campbell Road | The Hendry | Cut-off Date LTV: | 59.0% | |
| Garland, Texas 75044 | U/W NCF DSCR: | 1.45x | ||
| U/W NOI Debt Yield: | 8.2% |

| This is not a research report and was not prepared by any Underwriter’s research department. It was prepared by the Underwriters’ sales, trading, banking or other non-research personnel. Please see additional important information and qualifications at the end of this Term Sheet. |
91
| Mortgage Loan No. 7 – The Hendry |
| Mortgage Loan Information | Mortgaged Property Information | |||||
| Mortgage Loan Seller: | CCRE | Single Asset/Portfolio: | Single Asset | |||
| Credit Assessment (KBRA/Fitch/S&P): | NR/NR/NR | Location: | Garland, TX 75044 | |||
| Original Balance: | $45,600,000 | General Property Type: | Multifamily | |||
| Cut-off Date Balance: | $45,600,000 | Detailed Property Type: | Garden | |||
| % of Initial Pool Balance: | 4.5% | Title Vesting: | Fee | |||
| Loan Purpose: | Acquisition | Year Built/Renovated: | 2017/N/A | |||
| Sponsor(1): | CFCAF Hendry, LLC | Size: | 399 Units | |||
| Guarantor(1): | CF Real Estate Holdings, LLC | Cut-off Date Balance per Unit: | $114,286 | |||
| Mortgage Rate: | 3.6835% | Maturity Date Balance per Unit: | $103,344 | |||
| Note Date: | 10/11/2019 | Property Manager: | CAF Management, LLC | |||
| First Payment Date: | 12/6/2019 | |||||
| Maturity Date: | 11/6/2029 | Underwriting and Financial Information | ||||
| Original Term to Maturity: | 120 months | UW NOI: | $3,751,236 | |||
| Original Amortization Term: | 360 months | UW NOI Debt Yield: | 8.2% | |||
| IO Period: | 60 months | UW NOI Debt Yield at Maturity: | 9.1% | |||
| Seasoning: | 0 months | UW NCF DSCR: | 2.14x (IO); 1.45x (P&I) | |||
| Prepayment Provisions: | LO (24); DEF (92); O (4) | Most Recent NOI: | $3,118,834 (7/31/2019 TTM) | |||
| Lockbox/Cash Mgmt Status: | Soft/Springing | 2nd Most Recent NOI(3): | N/A | |||
| Additional Debt Type: | N/A | 3rd Most Recent NOI(3): | N/A | |||
| Additional Debt Balance: | N/A | Most Recent Occupancy: | 93.7% (9/30/2019) | |||
| Future Debt Permitted (Type): | No (N/A) | 2nd Most Recent Occupancy(3): | 59.7% (12/31/2018) | |||
| Reserves(2) | 3rd Most Recent Occupancy(3): | N/A | ||||
| Type | Initial | Monthly | Cap | Appraised Value (as of): | $77,250,000 (8/8/2019) | |
| RE Tax: | $1,540,000 | $140,000 | N/A | Appraised Value per Unit: | $193,609 | |
| Insurance: | $138,839 | $11,570 | N/A | Cut-off Date LTV Ratio: | 59.0% | |
| Recurring Replacements: | $0 | $8,313 | N/A | Maturity Date LTV Ratio: | 53.4% | |
| Sources and Uses | ||||||
| Sources | Proceeds | % of Total | Uses | Proceeds | % of Total | |
| Whole Loan Amount: | $45,600,000 | 59.1% | Purchase Price: | $75,012,000 | 97.3% | |
| Sponsor Equity: | $31,503,064 | 40.9% | Reserves: | $1,678,839 | 2.2% | |
| Closing Costs: | $412,225 | 0.5% | ||||
| Total Sources: | $77,103,064 | 100.0% | Total Uses: | $77,103,064 | 100.0% | |
| (1) | CF Real Estate Holdings, LLC is an affiliate of CCRE. See “The Borrower and the Borrower Sponsor” below. The borrower sponsor is also the borrower sponsor for the mortgage loan included in the MSC 2019-L3 securitization transaction that is identified as Tribeca Apartments, which has an original principal balance of $24,200,000. |
| (2) | See “Escrows and Reserves” below for further discussion of reserve requirements. |
| (3) | The Hendry Property (as defined below) was constructed in 2017. As such, historical financial information prior to 7/31/2019 TTM and occupancy information prior to 12/31/2018 is not applicable due to The Hendry Property being in its initial lease-up phase. |
The Mortgage Loan.The seventh largest mortgage loan (“The Hendry Mortgage Loan”) is evidenced by a promissory note in the original principal amount of $45,600,000 secured by a first priority fee mortgage encumbering a garden multifamily property located in Garland, Texas (“The Hendry Property”). The proceeds of The Hendry Mortgage Loan along with equity from the borrower sponsor were used to acquire The Hendry Property, fund reserves and pay closing costs.
The Borrower and the Borrower Sponsor. The borrower, CF Hendry Multifamily DST (“The Hendry Borrower”), is a newly formed Delaware statutory trust (“DST”), structured to be bankruptcy-remote. The signatory trustee and trust manager of The Hendry Borrower is CF Hendry Manager, LLC (“Signatory Trustee”), a newly formed single member Delaware limited liability company with one springing member and one independent director. The Hendry Borrower is a joint venture between CF Hendry, LLC (90%), an affiliate of The Hendry Guarantor (as defined below) and CCRE, and CAF Campfire Investors, LLC (“CAF”) (10%). The master tenant under the master lease is CF Hendry Master Tenant, LLC (the “Master Tenant”), an affiliate of CCRE. See “Delaware Statutory Trust Master Lease” below.
The non-recourse carve-out guarantor and borrower sponsor for The Hendry Mortgage Loan is CF Real Estate Holdings, LLC (“The Hendry Guarantor”), which is owned directly by Cantor Fitzgerald Investors, LLC (“Cantor Investors”). The Hendry Guarantor and Cantor Investors are each an affiliate of Cantor Commercial Real Estate Lending, L.P. (“CCRE”), the loan originator and a mortgage loan seller into the MSC 2019-L3 securitization transaction, Cantor Fitzgerald & Co., one of the securitization underwriters, and Newmark Knight Frank dba Berkeley Point Capital LLC, a primary servicer or limited sub-servicer for certain loans included in the MSC 2019-L3 securitization transaction. Cantor Investors is indirectly wholly owned by Cantor Fitzgerald, L.P. (“Cantor Fitzgerald”). Cantor Fitzgerald was founded in 1945 as an investment bank and brokerage business. Along with its subsidiaries and affiliates, Cantor Fitzgerald operates with 10,000 employees in 42 offices worldwide.
| This is not a research report and was not prepared by any Underwriter’s research department. It was prepared by the Underwriters’ sales, trading, banking or other non-research personnel. Please see additional important information and qualifications at the end of this Term Sheet. |
92
| Multifamily – Garden | Loan #7 | Cut-off Date Balance: | $45,600,000 | |
| 1759 West Campbell Road | The Hendry | Cut-off Date LTV: | 59.0% | |
| Garland, Texas 75044 | U/W NCF DSCR: | 1.45x | ||
| U/W NOI Debt Yield: | 8.2% |
CAF is a privately held, national real estate investment and management company headquartered in Frisco, Texas. Founded in 2010, CAF manages over 10,000 units and 34 multifamily communities. CAF, the property manager, also provides third party property management. CAF is not affiliated with The Hendry Guarantor.
The Property.The Hendry Property is a recently developed Class A multifamily apartment complex located on a 17.3 acre parcel in Garland, Texas, which is approximately 23 miles northeast of Dallas. Construction on The Hendry Property was completed in August 2017 and consists of 14 three-story buildings totaling 399 units. As of September 30, 2019, The Hendry Property was 93.7% occupied.
The Hendry Property includes a mix of townhomes and one, two, and three-bedroom units. The units feature gourmet kitchens with granite and quartz countertops, stainless steel whirlpool appliances, kitchen islands, double crown moldings, and in-unit washers and dryers. Amenities at The Hendry Property include a clubhouse with free Wi-Fi, two swimming pools with cabanas, a jogging trail, an entertainment area with grilling stations, a fitness center, a cyber-lounge with Mac computers, 24/7 parking concierge, a self-service car wash and valet trash/recycling. The Hendry Property features 16 attached two-car garages, 72 breezeway garages and 266 carports, for a total of 682 parking spaces resulting in a parking ratio of 1.7 spaces per unit.
The following table presents certain information relating to the unit mix at The Hendry Property:
| Unit Mix | |||||||
| Type | Units | Occupied Units | % Occupied | Average SF per Unit | Total SF | Monthly Average Rent per Unit(1) | Monthly Market Rent per Unit(1) |
| One-Bedroom | 198 | 189 | 95.5% | 800 | 158,303 | $1,286 | $1,276 |
| Two-Bedroom | 165 | 152 | 92.1% | 1,180 | 194,646 | $1,599 | $1,714 |
| Three-Bedroom (2-BA) | 20 | 19 | 95.0% | 1,541 | 30,822 | $2,238 | $2,114 |
| Three-Bedroom (3.5-BA) | 16 | 14 | 87.5% | 2,137 | 34,184 | $2,826 | $2,650 |
| Total/Wtd. Avg. | 399 | 374 | 93.7% | 1,048 | 417,955 | $1,519 | $1,554 |
Source: Underwritten rent roll dated September 30, 2019 and appraisal.
| (1) | Monthly Average Rent per Unit is the average in-place rent for each unit type and Monthly Market Rent per Unit is the concluded market rent for each unit type. |
The Market.The Hendry Property is located in Garland, Texas, a suburban community within Dallas County, which is approximately 23 miles northeast of the Dallas CBD. The Hendry Property benefits from its proximity to major thoroughfares such as U.S. 75 and the President George Bush Turnpike as well as the Dallas/Fort Worth International Airport, which is approximately a 30-minute drive. Garland benefits from its location within the Richardson Telecom Corridor, with many high tech and telecommunications firms such as AT&T, Alcatel, Verizon, Hewlett Packard, Samsung, Cisco, Texas Instruments, Fujitsu and Siemens having locations in the area. The Hendry Property is approximately 5.2 miles away from the Firewheel Town Center, which is an open-air, mixed-use development with department stores, specialty retail, restaurants, and an AMC theatre. The Firewheel Town Center contains over 1 million SF of retail space, over 75,000 SF of office space, a large park with a pond and fountain, a children’s play area, and other public spaces. Additionally, The Hendry Property is approximately 4.0 miles away from the Cityline project, which is a $1.5 billion master-planned project in Richardson adjacent to the Dallas Area Rapid Transit (“DART”) Bush Turnpike Station, which was completed in May 2019. The Cityline project includes approximately 6 million SF of office space, 300,000 SF of retail space, 3,925 multifamily units and two hotels. Phase I, which was completed in early 2015, included State Farm Insurance’s new 1.5 million SF regional headquarters. Phase II, which was completed in May 2017, included Raytheon’s new 1,700 employee regional headquarters.
The Hendry Property is part of the Garland submarket within the metropolitan Dallas apartment market. As of the second quarter of 2019, the Garland submarket had a vacancy rate of 4.3%. The estimated 2019 population within a one-, three- and five-mile radius of The Hendry Property is 8,255, 103,756 and 310,934, respectively, according to the appraisal. The estimated 2019 average household income within a one-, three- and five-mile radius of The Hendry Property is $119,137, $106,560, and $97,080, respectively, according to the appraisal.
The appraiser concluded that The Hendry Property has in-place rent that is approximately 1.6% below the concluded market rent. The following table presents certain information relating to the appraisal’s market rent conclusion for The Hendry Property:
| Market Rent Summary | ||||||||
| Unit Type | Total Units | Average Size | Contract Rent/SF | Avg Monthly Contract Rent per Unit | Market Rent/SF | Avg Monthly Market Rent per Unit | ||
| One-Bedroom | 198 | 800 | $1.61 | $1,286 | $1.60 | $1,276 | ||
| Two-Bedroom | 165 | 1,180 | $1.36 | $1,599 | $1.46 | $1,714 | ||
| Three-Bedroom (2-BA) | 20 | 1,541 | $1.45 | $2,238 | $1.38 | $2,114 | ||
| Three-Bedroom (3.5-BA) | 16 | 2,137 | $1.32 | $2,826 | $1.24 | $2,650 | ||
Source: Underwritten rent roll and appraisal
| This is not a research report and was not prepared by any Underwriter’s research department. It was prepared by the Underwriters’ sales, trading, banking or other non-research personnel. Please see additional important information and qualifications at the end of this Term Sheet. |
93
| Multifamily – Garden | Loan #7 | Cut-off Date Balance: | $45,600,000 | |
| 1759 West Campbell Road | The Hendry | Cut-off Date LTV: | 59.0% | |
| Garland, Texas 75044 | U/W NCF DSCR: | 1.45x | ||
| U/W NOI Debt Yield: | 8.2% |
The following table presents certain information relating to comparable rental properties to The Hendry Property:
| Comparable Rental Properties | |||||||
| The Hendry | Gateway Crossing | One90 Firewheel | Mansions at Spring Creek | Towers at Spring Creek | Park at Gateway | Carriage Homes on the Lake | |
| Year Built | 2017 | 2014 | 2017 | 2017 | 2017 | 2017 | 2014 |
| Number of units | 399 | 316 | 483 | 560 | 376 | 255 | 147 |
| Unit size (SF)(1): | |||||||
| - 1-BR | 800 | 693 | 782 | 693 | 728 | 781 | 832 |
| - 2-BR | 1,180 | 1,146 | 1,124 | 1,117 | 1,161 | 1,225 | 1,173 |
| - 3-BR, 2-BA | 1,541 | 1,372 | 1,374 | 1,408 | N/A | N/A | N/A |
| - 3-BR, 3.5-BA | 2,137 | 1,841 | N/A | 1,754 | 1,710 | 1,628 | N/A |
| Monthly Rent per Unit(1): | |||||||
| - 1-BR | $1,286 | $1,055 | $1,253 | $1,174 | $1,198 | $1,231 | $1,327 |
| - 2-BR | $1,599 | $1,555 | $1,595 | $1,655 | $1,694 | $1,755 | $1,596 |
| - 3-BR, 2-BA | $2,238 | $1,780 | $1,900 | $2,008 | N/A | N/A | N/A |
| - 3-BR, 3.5-BA | $2,826 | $2,125 | N/A | $2,296 | $2,371 | $2,263 | N/A |
| Monthly Rent per SF(1): | |||||||
| - 1-BR | $1.61 | $1.53 | $1.61 | $1.70 | $1.65 | $1.58 | $1.60 |
| - 2-BR | $1.36 | $1.36 | $1.42 | $1.49 | $1.47 | $1.44 | $1.37 |
| - 3-BR, 2-BA | $1.45 | $1.30 | $1.38 | $1.43 | N/A | N/A | N/A |
| - 3-BR, 3.5-BA | $1.32 | $1.16 | N/A | $1.31 | $1.39 | $1.39 | N/A |
Source: Appraisal and underwritten rent roll
| (1) | Represents the average for each unit size at The Hendry Property. |
Operating History and Underwritten Net Cash Flow. The following table presents certain information relating to the historical operating performance and Underwritten Net Cash Flow at The Hendry Property:
| Cash Flow Analysis(1) | |||
| 7/31/2019 TTM | UW | UW per unit | |
| Gross Potential Rent | $7,045,829 | $7,311,936 | $18,326 |
| Other Income(2) | $369,108 | $411,590 | $1,032 |
| Parking Income | $163,765 | $177,685 | $445 |
| Concessions(3) | ($385,560) | ($156,189) | ($391) |
| Less Vacancy & Credit Loss(4) | ($774,052) | ($495,780) | ($1,243) |
| Effective Gross Income | $6,419,091 | $7,249,242 | $18,169 |
| Real Estate Taxes | $1,417,328 | $1,669,867 | $4,185 |
| Insurance | $139,896 | $156,765 | $393 |
| Other Expenses | $1,743,033 | $1,671,374 | $4,189 |
| Total Expenses | $3,300,256 | $3,498,006 | $8,767 |
| Net Operating Income(4) | $3,118,834 | $3,751,236 | $9,402 |
| Capital Expenditures | $0 | $99,750 | $250 |
| Net Cash Flow(4) | $3,118,834 | $3,651,486 | $9,152 |
| Occupancy %(5) | 93.7% | 93.7% | |
| NOI DSCR (IO) | 1.83x | 2.20x | |
| NOI DSCR (P&I) | 1.24x | 1.49x | |
| NCF DSCR (IO) | 1.83x | 2.14x | |
| NCF DSCR (P&I) | 1.24x | 1.45x | |
| NOI Debt Yield | 6.8% | 8.2% | |
| NCF Debt Yield | 6.8% | 8.0% | |
| (1) | The Hendry Property was constructed in 2017. As such, historical financial information prior to 7/31/2019 TTM is not applicable due to The Hendry Property being in its initial lease-up phase. |
| (2) | Other Income consists of water charges, garbage collection income and amenity fees. |
| (3) | UW Concessions were underwritten based on the trailing six months as a percentage of revenue. |
| (4) | The increase in UW Net Operating Income and UW Net Cash Flow from 7/31/2018 TTM is primarily due to new leases being executed at market rents and a reduction in concessions as the property stabilized. |
| (5) | UW Vacancy & Credit Loss represent an economic vacancy of 6.8% of Gross Potential Rent. The Hendry Property is currently 93.7% physically occupied as of September 30, 2019. |
| This is not a research report and was not prepared by any Underwriter’s research department. It was prepared by the Underwriters’ sales, trading, banking or other non-research personnel. Please see additional important information and qualifications at the end of this Term Sheet. |
94
| Multifamily – Garden | Loan #7 | Cut-off Date Balance: | $45,600,000 | |
| 1759 West Campbell Road | The Hendry | Cut-off Date LTV: | 59.0% | |
| Garland, Texas 75044 | U/W NCF DSCR: | 1.45x | ||
| U/W NOI Debt Yield: | 8.2% |
Escrows and Reserves.
Real Estate Taxes – The Hendry Mortgage Loan documents provide for an upfront real estate tax reserve of $1,540,000 and an ongoing monthly real estate tax reserve in an amount equal to 1/12 of the annual estimated real estate taxes (initially $140,000).
Insurance– The Hendry Mortgage Loan documents provide for an upfront insurance reserve of $138,839 and an ongoing monthly insurance reserve in an amount equal to 1/12 of the annual estimated insurance premiums (initially $11,570).
Replacement Reserve - The Hendry Mortgage Loan documents provide for a monthly capital expenditure reserve of $8,313 ($250 per unit annually).
Lockbox and Cash Management. The Hendry Mortgage Loan is structured with a soft lockbox and springing cash management upon the occurrence and during the continuance of a Cash Management Period (as defined below). The Hendry Mortgage Loan documents require The Hendry Borrower and the property manager to deposit or cause to be deposited all rent from The Hendry Property into the lockbox account within one business day after they are received. During the continuance of a Cash Management Period all funds in the lockbox account are required to be swept each business day to a lender-controlled cash management account and disbursed in accordance with The Hendry Mortgage Loan documents, and provided no event of default is continuing on The Hendry Mortgage Loan, to pay taxes and insurance, debt service on The Hendry Mortgage Loan, reserves and operating expenses, among other things. During the continuance of a Cash Management Period, all excess cash flow will be required to be held as additional security for The Hendry Mortgage Loan until the discontinuance of the Cash Management Period. If no Cash Management Period is continuing, funds in the lockbox account are required to be disbursed to a borrower operating account.
A “Cash Management Period” will commence upon the occurrence of (i) an event of default under The Hendry Mortgage Loan documents, (ii) the bankruptcy of The Hendry Borrower, the Master Tenant, the Signatory Trustee, or any affiliated property manager or (iii) the failure by The Hendry Borrower, at the end of two consecutive calendar quarters, to maintain a DSCR of (a) at least 1.40x (during the interest only period through and including November 6, 2024) or (b) at least 1.20x at any time thereafter. The Cash Management Period will end if (1) in the case of the foregoing clause (i), the lender accepts a cure of such event of default and no other event of default has occurred and is continuing, (2) in the case of the bankruptcy of the property manager only, if The Hendry Borrower or Master Tenant (as the case may be) replaces such property manager in accordance with the requirements of the loan documents or if such bankruptcy event is discharged, stayed or dismissed within 90 days, or (3) in the case of the foregoing clause (iii) (a), if the DSCR is at least 1.40x for two consecutive calendar quarters or in the case of the foregoing clause (iii) (b), if the DSCR is at least 1.20x for two consecutive calendar quarters;providedthat, (A) no event of default has occurred and is continuing (B) no event that would trigger another Cash Management Period has occurred and is continuing. During a Cash Management Period, all excess cash is deposited into the excess cash reserve and is held by the lender as additional security for The Hendry Mortgage Loan. Upon termination of the Cash Management Period,providedthat no other Cash Management Period has occurred and is continuing, the lender will disburse the excess cash to The Hendry Borrower.
Additional Secured Indebtedness (not including trade debts). Not permitted.
Mezzanine Loan and Preferred Equity.Not permitted.
Release of Property. Not permitted.
Right of First Refusal.None.
Letter of Credit. None.
Terrorism Insurance. The Hendry Borrower is required to obtain insurance against acts of terrorism for loss resulting from perils and acts of terrorism in amounts and with terms and conditions applicable to commercial property, general liability, business income and umbrella liability insurance required pursuant to The Hendry Mortgage Loan documents.
Delaware Statutory Trust Master Lease.The Hendry Borrower is a DST. The Signatory Trustee, pursuant to The Hendry Borrower’s related trust agreement has the full power and authority to manage The Hendry Property and the activities and affairs of The Hendry Borrower, subject to certain DST restrictions related to the operation of The Hendry Property.
In order to accommodate the DST structure (and address the DST restrictions), The Hendry Borrower entered into a master lease (the “Master Lease”) with the Master Tenant, which entity is indirectly owned and controlled by the parent entity of The Hendry Guarantor. Under the Master Lease, the entire The Hendry Property is leased to the Master Tenant who subleases the residential units at The Hendry Property to the residential tenants. The lender may terminate the Master Lease upon, among things, a foreclosure. Rent under the Master Lease consists of: (x) base rent (equal to the debt service and other amounts owed monthly pursuant to The Hendry Mortgage Loan documents plus a portion of the targeted equity return and (y) percentage rent in an amount equal to 90% of the gross rent (which includes all rent or other revenues received by the Master Tenant from the operation of The Hendry Property), in excess of a baseline amount set forth in the Master Lease. The Master Lease expires after the maturity date of The Hendry Mortgage Loan. The Hendry Mortgage Loan documents permit The Hendry Borrower to convert from a DST to a Delaware limited liability company if, among other things, (A) the Master Tenant has failed to timely pay rent due under the Master Lease after the expiration of any applicable notice and cure provisions or (B) the Signatory Trustee and independent manager determine that it is in the best interest of The Hendry Borrower to take an action that is in violation of the DST restrictions. See “Risk Factors—Risks Relating to Delaware Statutory Trusts” and “Description of the Mortgage Pool—Delaware Statutory Trusts” in the Preliminary Prospectus.
| This is not a research report and was not prepared by any Underwriter’s research department. It was prepared by the Underwriters’ sales, trading, banking or other non-research personnel. Please see additional important information and qualifications at the end of this Term Sheet. |
95
| Office – CBD | Loan #8 | Cut-off Date Balance: | $40,000,000 | |
| 30 7th Street East | Wells Fargo Place | Cut-off Date LTV: | 64.0% | |
| St. Paul, MN 55101 | U/W NCF DSCR: | 2.92x | ||
| U/W NOI Debt Yield: | 10.8% |

| This is not a research report and was not prepared by any Underwriter’s research department. It was prepared by the Underwriters’ sales, trading, banking or other non-research personnel. Please see additional important information and qualifications at the end of this Term Sheet. |
96
| Office – CBD | Loan #8 | Cut-off Date Balance: | $40,000,000 | |
| 30 7th Street East | Wells Fargo Place | Cut-off Date LTV: | 64.0% | |
| St. Paul, MN 55101 | U/W NCF DSCR: | 2.92x | ||
| U/W NOI Debt Yield: | 10.8% |
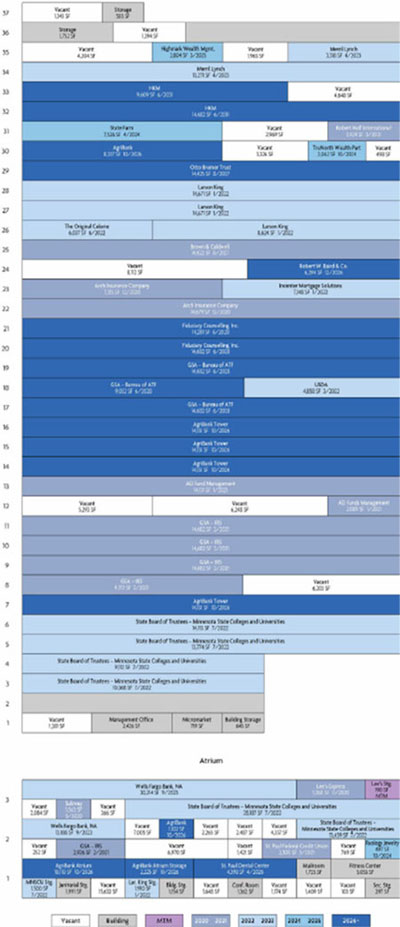
| This is not a research report and was not prepared by any Underwriter’s research department. It was prepared by the Underwriters’ sales, trading, banking or other non-research personnel. Please see additional important information and qualifications at the end of this Term Sheet. |
97
| Office – CBD | Loan #8 | Cut-off Date Balance: | $40,000,000 | |
| 30 7th Street East | Wells Fargo Place | Cut-off Date LTV: | 64.0% | |
| St. Paul, MN 55101 | U/W NCF DSCR: | 2.92x | ||
| U/W NOI Debt Yield: | 10.8% |

| This is not a research report and was not prepared by any Underwriter’s research department. It was prepared by the Underwriters’ sales, trading, banking or other non-research personnel. Please see additional important information and qualifications at the end of this Term Sheet. |
98
| Mortgage Loan No. 8 – Wells Fargo Place |
| Mortgage Loan Information | Property Information | ||||||
| Mortgage Loan Seller: | SMC | Single Asset/Portfolio: | Single Asset | ||||
| Credit Assessment (KBRA/Fitch/S&P): | NR/NR/NR | Location: | St. Paul, MN 55101 | ||||
| Original Balance(1): | $40,000,000 | General Property Type: | Office | ||||
| Cut-off Date Balance(1): | $40,000,000 | Detailed Property Type: | CBD | ||||
| % of Initial Pool Balance: | 3.9% | Title Vesting: | Fee | ||||
| Loan Purpose: | Refinance | Year Built/Renovated: | 1986/N/A | ||||
| Sponsors: | H. Bradford Inglesby; Tyler J. Duncan | Size: | 646,459 SF | ||||
| Guarantors: | H. Bradford Inglesby; Tyler J. Duncan | Cut-off Date Balance per SF(1): | $124 | ||||
| Mortgage Rate: | 3.4000% | Maturity Date Balance per SF(1): | $124 | ||||
| Note Date: | 10/25/2019 | Property Manager: | Unilev Management Corp. | ||||
| First Payment Date: | 12/6/2019 | (borrower-affiliate) | |||||
| Maturity Date: | 11/6/2029 | Underwriting and Financial Information | |||||
| Original Term to Maturity: | 120 months | UW NOI(6): | $8,675,297 | ||||
| Original Amortization Term: | 0 months | UW NOI Debt Yield(1): | 10.8% | ||||
| IO Period: | 120 months | UW NOI Debt Yield at Maturity(1): | 10.8% | ||||
| Seasoning: | 0 months | UW NCF DSCR(1): | 2.92x | ||||
| Prepayment Provisions(2): | LO (24); DEF (92); O (4) | Most Recent NOI(6): | $7,970,426 (8/31/2019 TTM) | ||||
| Lockbox/Cash Mgmt Status: | Hard/In Place | 2nd Most Recent NOI(6): | $7,673,134 (12/31/2018) | ||||
| Additional Debt Type(1)(3): | Pari Passu | 3rd Most Recent NOI(6): | $6,267,110 (12/31/2017) | ||||
| Additional Debt Balance(1)(3): | $40,000,000 | Most Recent Occupancy: | 85.0% (10/21/2019) | ||||
| Future Debt Permitted (Type)(4): | Yes (Mezzanine) | 2nd Most Recent Occupancy: | 85.9% (12/31/2018) | ||||
| Reserves(5) | 3rd Most Recent Occupancy: | 86.2% (12/31/2017) | |||||
| Type | Initial | Monthly | Cap | Appraised Value (as of): | $125,000,000 (9/19/2019) | ||
| RE Tax: | $544,053 | $272,026 | N/A | Appraised Value per SF: | $193 | ||
| Insurance: | $0 | Springing | N/A | Cut-off Date LTV Ratio(1): | 64.0% | ||
| Recurring Replacements: | $0 | $13,468 | N/A | Maturity Date LTV Ratio(1): | 64.0% | ||
| TI/LC: | $4,000,000 | Springing | $3,000,000 | ||||
| Existing Tenant TI/LC: | $1,648,010 | $0 | N/A | ||||
| Existing Tenant Rent Concessions: | $1,364,950 | $0 | N/A | ||||
| Escalator Reserve: | $158,161 | $0 | N/A | ||||
| Sources and Uses | ||||||
| Sources | Proceeds | % of Total | Uses | Proceeds | % of Total | |
| Whole Loan Amount(1): | $80,000,000 | 100.0% | Loan Payoff: | $70,081,296 | 87.6% | |
| Reserves: | $7,715,174 | 9.6% | ||||
| Return of Equity: | $1,180,059 | 1.5% | ||||
| Closing Costs: | $1,023,471 | 1.3% | ||||
| Total Sources: | $80,000,000 | 100.0% | Total Uses: | $80,000,000 | 100.0% | |
| (1) | The Wells Fargo Place Mortgage Loan (as defined below) is part of the Wells Fargo Place Whole Loan (as defined below), which is evidenced by sevenpari passupromissory notes with an aggregate principal balance of $80,000,000. The Cut-off Date Balance per SF, Maturity Date Balance per SF, UW NOI Debt Yield, UW NOI Debt Yield at Maturity, UW NCF DSCR, Cut-off Date LTV Ratio and Maturity Date LTV Ratio numbers presented above are based on the aggregate principal balance of the promissory notes comprising the Wells Fargo Place Whole Loan. |
| (2) | Defeasance of the Wells Fargo Place Whole Loan is permitted at any time after the earlier to occur of (i) the end of the two-year period commencing on the closing date of the securitization of the last portion of the Wells Fargo Place Whole Loan to be securitized and (ii) October 25, 2022. The assumed defeasance lockout period of 24 payments is based on the closing date of this transaction in November 2019. |
| (3) | See “The Mortgage Loan” and “Additional Secured Indebtedness (not including trade debts)” for further discussion of additional debt. |
| (4) | See “Mezzanine Loan and Preferred Equity” for further discussion of permitted mezzanine debt. |
| (5) | See “Escrows and Reserves” below for further discussion of reserve requirements. |
| (6) | The Wells Fargo Place Property (as defined below) previously secured a loan securitized in the CSMC 2007-C1 securitization transaction. Due to internal issues with the previous loan sponsor, the previous loan was transferred to special servicing in May 2016 with a number of month-to-month leases and near-term lease expirations, and subsequently went into maturity default in November 2016. While the previous loan was in special servicing, the borrower sponsors of the Wells Fargo Place Whole Loan took ownership of the Wells Fargo Place Property via an equity recapitalization. The previous loan had an original balance of $90,000,000 and was paid off in full using a combination of the equity recapitalization and a bridge loan. Since taking a controlling interest in the Wells Fargo Place Property in January 2018, the borrower sponsors have completed more than 165,000 SF of new and renewal leasing, increasing NOI growth. |
The Mortgage Loan.The eighth largest mortgage loan (the “Wells Fargo Place Mortgage Loan”) is part of a whole loan (the “Wells Fargo Place Whole Loan”) evidenced by sevenpari passu promissory notes in the aggregate original principal balance of $80,000,000, all of which are secured by a first priority fee mortgage encumbering a Class A CBD office property located in St. Paul, Minnesota (the “Wells Fargo Place Property”). The controlling Note A-1, along with the non-controlling Note A-2, in the aggregate original principal balance of $40,000,000, evidence the Wells Fargo Place Mortgage Loan and will be contributed to the MSC 2019-L3 transaction. The non-controlling Note A-3, Note A-4, Note A-5, Note A-6 and Note A-7, in the aggregate original principal balance of $40,000,000 (together, the “Wells Fargo Place ServicedPari Passu Companion Loans”) are expected to be contributed to one or more future securitization transactions or otherwise transferred at any time. The Wells Fargo Place Whole Loan will be serviced pursuant to the pooling and servicing agreement for the MSC 2019-L3 transaction. The proceeds of the Wells Fargo Place Whole Loan were primarily used to pay off a prior loan, fund reserves, return equity to the borrower sponsors and pay closing costs. See “Description of the Mortgage Pool—The Whole Loans—The
| This is not a research report and was not prepared by any Underwriter’s research department. It was prepared by the Underwriters’ sales, trading, banking or other non-research personnel. Please see additional important information and qualifications at the end of this Term Sheet. |
99
| Office – CBD | Loan #8 | Cut-off Date Balance: | $40,000,000 | |
| 30 7th Street East | Wells Fargo Place | Cut-off Date LTV: | 64.0% | |
| St. Paul, MN 55101 | U/W NCF DSCR: | 2.92x | ||
| U/W NOI Debt Yield: | 10.8% |
Serviced Pari Passu Whole Loans” and “Pooling and Servicing Agreement” in the Preliminary Prospectus.
| Wells Fargo Place Whole Loan Summary | ||||
Notes | Original Balance | Cut-off Date Balance | Note Holder | Controlling Note |
| A-1 | $20,000,000 | $20,000,000 | MSC 2019-L3 | Yes |
| A-2 | $20,000,000 | $20,000,000 | MSC 2019-L3 | No |
| A-3 | $10,000,000 | $10,000,000 | Starwood Mortgage Funding III LLC | No |
| A-4 | $10,000,000 | $10,000,000 | Starwood Mortgage Funding III LLC | No |
| A-5 | $10,000,000 | $10,000,000 | Starwood Mortgage Funding III LLC | No |
| A-6 | $5,000,000 | $5,000,000 | Starwood Mortgage Funding III LLC | No |
| A-7 | $5,000,000 | $5,000,000 | Starwood Mortgage Funding III LLC | No |
| Total | $80,000,000 | $80,000,000 | ||
The Borrowers and the Borrower Sponsors. The borrowers are St. Paul Tower, L.P., Overland W.F.P.-1, L.P., Overland W.F.P.-2, L.P. and WF Tower Holdings, LP (collectively, the “Wells Fargo Place Borrowers”), each a Minnesota limited partnership with a Delaware single-member general partner, structured to be bankruptcy-remote with at least two independent directors at the general partner level. The Wells Fargo Place Borrowers are tenants-in-common, each jointly and severally liable for the Wells Fargo Place Whole Loan and subject to customary tenant-in-common requirements. The borrower sponsors and non-recourse carveout guarantors of the Wells Fargo Place Mortgage Loan are H. Bradford Inglesby and Tyler J. Duncan, partners at Crescent Investment Group.
Crescent Investment Group is a commercial real estate investment firm specializing in real estate investments throughout the United States. The firm was formed in 2012. The firm is managed by senior partners with combined portfolio investment experience that includes the acquisition of 10.0 million SF of property. The firm’s portfolio is comprised of institutional office properties that are geographically dispersed in MSA’s throughout the United States.
H. Bradford Inglesby is a partner and founder of Crescent Investment Group and is responsible for directing the strategy and investment activities of the firm. Mr. Inglesby has more than 15 years of experience in the commercial real estate industry. Tyler J. Duncan is a partner in Crescent Investment Group and is responsible for directing the strategy and investment activities of the firm.
The Property. The Wells Fargo Place Property is a 649,459 SF Class A office property located at 30 7th Street East in St. Paul, Minnesota. The Wells Fargo Place Property is a 37-story building, built in 1986 and located in the St. Paul CBD. The Wells Fargo Place Property has a 156-space underground parking garage with valet parking. Additionally, there is a garage, which is available to building tenants via a skywalk across Cedar Street, which is owned by the City of St. Paul and pursuant to which parking spaces are leased to the Wells Fargo Place Borrowers on a 20-year lease entered into on January 1, 2019. The lease stipulates 540 unassigned parking stalls within the 1,170-space garage.
Situated in the St. Paul CBD, the Wells Fargo Place Property encompasses half of a city block. The Wells Fargo Place Property is the tallest office building in St. Paul and offers tenants a fitness center, locker rooms, underground parking, skyway connectivity, multiple food service options and a training center. The Wells Fargo Place Property’s “Main & Main” location offers tenants access to restaurants, sporting venues and other urban amenities. A short walk from the Wells Fargo Place Property is the Xcel Energy Center, home to St. Paul’s NHL team, the Minnesota Wild, and also nearby is the Minnesota State Capitol, Minnesota Children’s Museum, Ecolab’s new corporate headquarters and the Saint Paul Hotel. The Wells Fargo Place Property also benefits from its skyway connectivity from four directions, providing tenants with transit throughout the St. Paul CBD.
The Wells Fargo Place Property is 85.0% leased as of October 21, 2019. The Wells Fargo Place Property has maintained an average occupancy of 88.7% since 2009.
Major Tenants.
Minnesota State Colleges and Universities (90,513 SF, 14.0% of NRA, 11.2% of underwritten base rent). Minnesota State Colleges and Universities (“MSCU”) is the fifth largest system of public colleges and universities in the US. The organization is comprised of 31 institutions with 54 campuses across the state of Minnesota. MCSU uses its space at the Wells Fargo Place Property for administrative purposes. MSCU has occupied space at the Wells Fargo Place Property since 2005 and most recently extended its lease in August 2015. The current MSCU lease contains a termination option, which can be exercised in the event that MSCU relocates to a state or MSCU-owned facility.
AgriBank (86,298 SF, 13.3% of NRA, 12.2% of underwritten base rent).AgriBank is a wholesale bank that is owned by and supports 17 Farm Credit Associations. AgriBank provides loans and financial services to farmers, ranchers, rural businesses and homeowners throughout a 15-state district that includes nearly 40% of all US farmland. AgriBank is one of the largest banks within the Farm Credit System. AgriBank moved into the Wells Fargo Place Property in 2011 and expanded in 2014. The AgriBank lease expires in October 2026 and has two five-year renewal options. AgriBank may surrender 5,000 to 8,000 SF between November 2021 and December 2023 with nine months’ notice and payment of the Wells Fargo Place Borrowers’ unamortized transaction costs. Additionally, AgriBank subleases 8,337 SF to an affiliate.
IRS (56,144 SF, 8.7% of NRA, 19.0% of underwritten base rent). General Services Administration (GSA) is the administrative department of the United States Government and acts as master lessor for the individual agencies of the federal governments. Three federal agencies, the Internal Revenue Service (IRS), Bureau of Alcohol, Tobacco, Firearms and Explosives (5.9% of NRA) and United States Department of Agriculture (0.8% of NRA) occupy space at the Wells Fargo Place Property. The IRS has its regional administrative offices and a taxpayer assistance office at the Wells Fargo Place Property. The IRS consolidated offices from its Minneapolis location to Wells Fargo Place Property in 2018 and renewed its lease for three years. The IRS spent approximately $600,000 on its space, including re-carpeting, painting, IT and office configuration. IRS has been a tenant at the Wells Fargo Place Property since 2005. The IRS lease expires in February 2021 and has no renewal options. IRS does not have any termination options.
Wells Fargo Bank (43,402 SF, 6.7% of NRA, 6.9% of underwritten base rent). Wells Fargo Bank is a diversified, community-based financial services company. Headquartered in San Francisco, Wells Fargo was founded in 1852 and was ranked 30th on Fortune’s 2015 rankings of America’s largest corporations. St. Paul and Minneapolis represent a major hub for Wells Fargo Bank. Wells Fargo Bank has been at the Wells Fargo Place Property since
| This is not a research report and was not prepared by any Underwriter’s research department. It was prepared by the Underwriters’ sales, trading, banking or other non-research personnel. Please see additional important information and qualifications at the end of this Term Sheet. |
100
| Office – CBD | Loan #8 | Cut-off Date Balance: | $40,000,000 | |
| 30 7th Street East | Wells Fargo Place | Cut-off Date LTV: | 64.0% | |
| St. Paul, MN 55101 | U/W NCF DSCR: | 2.92x | ||
| U/W NOI Debt Yield: | 10.8% |
2001. The Wells Fargo Bank lease was renewed in June 2016, expires in September 2023 and has two five-year renewal options. Wells Fargo Bank does not have any termination options.
Larson King (39,876 SF, 6.2% of NRA, 6.5% of underwritten base rent). Larson King is a law firm that specializes in a variety of services, including agriculture, appellate, business, construction, mass tort, class action, personal injury, health, insurance, intellectual property, labor, employment, reinsurance, immigration and product liability. Larson King has been a tenant at the Wells Fargo Place Property since 2002. Larson King’s lease expires in January 2022 and has one five-year renewal option. Larson King does not have any termination options, except with regard to 1,910 SF of storage space. Additionally, Larson King subleases 2,858 SF to The Cakerie, an adjacent tenant.
The following table presents certain information relating to the tenants at the Wells Fargo Place Property:
| Tenant Summary(1) | |||||||||
| Tenant Name | Credit Rating (Fitch/Moody's/S&P)(2) | Tenant SF | Approx. % of Total SF | Annual UW Rent | % of Total Annual UW Rent | Annual UW Rent PSF | Lease Expiration | Renewal Options | Termination Options |
| MSCU(3) | NR /Aa3/AA- | 90,513 | 14.0% | $1,219,676 | 11.2% | $13.48 | 7/31/2022 | 2 x 5 Yrs | Y |
| AgriBank(4)(5)(6) | NR/Aa3/AA- | 86,298 | 13.3% | $1,335,246 | 12.2% | $15.47 | 10/31/2026 | 2 x 5 Yrs | Y |
| IRS(7) | AAA/Aaa/AA+ | 56,144 | 8.7% | $2,081,198 | 19.0% | $37.07 | 2/28/2021 | N/A | N |
| Wells Fargo Bank(5) | A+/A2/A- | 43,402 | 6.7% | $754,327 | 6.9% | $17.38 | 9/30/2023 | 2 x 5 Yrs | N |
| Larson King(8) | NR/NR/NR | 39,876 | 6.2% | $715,823 | 6.5% | $17.95 | 1/31/2022 | 1 x 5 Yrs | N |
| Subtotal/Wtd. Avg. | 316,233 | 48.9% | $6,106,270 | 55.8% | $19.31 | ||||
| Other Tenants | 232,962 | 36.0% | $4,830,303 | 44.2% | $20.73 | ||||
| Vacant Space | 97,264 | 15.0% | $0 | 0.0% | $0.00 | ||||
| Total/Wtd. Avg. | 646,459 | 100.0% | $10,936,573 | 100.0% | $19.91 | ||||
| (1) | Information is based on the underwritten rent roll dated October 21, 2019. |
| (2) | Certain ratings are those of the parent company, whether or not the parent guarantees the lease. |
| (3) | MSCU has an ongoing right to terminate its lease in the event that MSCU relocates to a state or MSCU-owned facility. |
| (4) | AgriBank may surrender 5,000 to 8,000 SF between November 2021 and December 2023 with nine months’ notice. |
| (5) | Underwritten to tenant’s average rent over remaining lease term. |
| (6) | AgriBank subleases 8,337 SF to an affiliate. The terms of the sublease were not available and the prime lease was underwritten. |
| (7) | IRS is on a lease that pays rent on a gross basis. |
| (8) | Larson King subleases 2,858 SF to The Cakerie, an adjacent tenant. The terms of the sublease were not available and the prime lease was underwritten. |
The following table presents certain information relating to the lease rollover schedule at the Wells Fargo Place Property:
| Lease Rollover Schedule(1)(2) | ||||||||
| Year | # of Leases Rolling | SF Rolling | UW Rent PSF Rolling | Approx. % of Total SF Rolling | Approx. Cumulative % of SF Rolling | Total UW Rent Rolling | Approx. % of Total Rent Rolling | Approx. Cumulative % of Total Rent Rolling |
| MTM | 4 | 1,062 | $16.23 | 0.2% | 0.2% | $17,240 | 0.2% | 0.2% |
| 2019 | 0 | 0 | $0.0 | 0.0% | 0.2% | $0 | 0.0% | 0.2% |
| 2020 | 4 | 25,059 | $19.86 | 3.9% | 4.0% | $497,556 | 4.5% | 4.7% |
| 2021 | 5 | 93,210 | $28.86 | 14.4% | 18.5% | $2,690,284 | 24.6% | 29.3% |
| 2022 | 7 | 148,432 | $15.79 | 23.0% | 41.4% | $2,343,053 | 21.4% | 50.7% |
| 2023 | 2 | 59,991 | $17.69 | 9.3% | 50.7% | $1,061,223 | 9.7% | 60.4% |
| 2024 | 3 | 10,085 | $18.25 | 1.6% | 52.3% | $184,004 | 1.7% | 62.1% |
| 2025 | 1 | 2,804 | $17.75 | 0.4% | 52.7% | $49,771 | 0.5% | 62.6% |
| 2026 | 6 | 92,592 | $15.56 | 14.3% | 67.0% | $1,440,867 | 13.2% | 75.7% |
| 2027 | 2 | 14,425 | $16.48 | 2.2% | 69.2% | $237,687 | 2.2% | 77.9% |
| 2028 | 4 | 72,553 | $27.67 | 11.2% | 80.5% | $2,007,482 | 18.4% | 96.3% |
| 2029 | 1 | 2,265 | $8.28 | 0.4% | 80.8% | $18,750 | 0.2% | 96.4% |
| 2030 & Beyond | 1 | 24,291 | $16.00 | 3.8% | 84.6% | $388,656 | 3.6% | 100.0% |
| Management Office | 1 | 2,426 | $0.00 | 0.4% | 85.0% | $0 | 0.0% | 100.0% |
| Vacant | 0 | 97,264 | $0.00 | 15.0% | 100.0% | $0 | 0.0% | 100.0% |
| Total/Wtd. Avg. | 41 | 646,459 | $19.91 | 100.0% | $10,936,573 | 100.0% | ||
| (1) | Information is based on the underwritten rent roll dated October 21, 2019. |
| (2) | Certain tenants may have lease termination options that are exercisable prior to the stated expiration date of the subject lease or leases which are not considered in the lease rollover schedule. |
| This is not a research report and was not prepared by any Underwriter’s research department. It was prepared by the Underwriters’ sales, trading, banking or other non-research personnel. Please see additional important information and qualifications at the end of this Term Sheet. |
101
| Office – CBD | Loan #8 | Cut-off Date Balance: | $40,000,000 | |
| 30 7th Street East | Wells Fargo Place | Cut-off Date LTV: | 64.0% | |
| St. Paul, MN 55101 | U/W NCF DSCR: | 2.92x | ||
| U/W NOI Debt Yield: | 10.8% |
The Market. The Wells Fargo Place Property is located in the St. Paul CBD. St. Paul, located approximately seven miles east of Minneapolis, is Minnesota’s second largest city. Together, St. Paul and Minneapolis are known as the Twin Cities and form the 16th largest MSA in the U.S., accounting for more than 3.6 million residents. On its own, the St. Paul CBD is home to approximately 300,000 residents. Since 2014, in the St. Paul CBD, there has been more than $700 million of capital spent on light rail transit stations, corporate headquarters acquisitions, conversions, hotel renovations, concert hall construction and development and retail expansions. The majority of this investment has been spent in and around areas adjacent to the Wells Fargo Place Property. Most notable among the recent developments is that housing units in St. Paul CBD have risen by more than 20% in the past five years. Attractions in the St. Paul CBD include Xcel Energy Center, Ordway Centre for Performing Arts, Science Museum of Minnesota, CHS Field and the Minnesota Children’s Museum as well as events like the St. Paul Winter Carnival, which has been a tradition in Downtown St. Paul for more than 125 years. Demand for downtown St. Paul apartments is anchored by public and private sector employment growth, all within the St. Paul CBD. The public sector employs approximately 19,000 workers, while more than 1,200 private companies have approximately 72,000 employees. The area’s largest private sector employers include Ecolab, Traveler’s Companies, Century Link and St. Joseph’s Hospital. Reverse commuting among the region’s workers is a growing trend as St. Paul, via the Green Line, offers residents access to north of 280,000 jobs in other nearby employment centers.
According to the appraisal, the Wells Fargo Place Property is located in the Minneapolis office market. As of the second quarter of 2019, average asking rent was $21.95 PSF, vacancy was 7.2%, and inventory totaled 196.2 million SF. The Wells Fargo Place Property is located in the St. Paul CBD office submarket of the Minneapolis office market. For the second quarter 2019, the St. Paul CBD office submarket had total inventory of approximately 12.1 million SF with a vacancy rate of 8.9% and average asking rents of $22.52 PSF.
According to the appraisal, the estimated 2019 population within a one-, three- and five-mile radius of the Wells Fargo Place Property was 19,959, 173,750 and 367,772, respectively. The 2019 median household income within the same radii was $40,873, $50,707 and $57,003, respectively.
The following table presents the appraiser’s market rent conclusions:
| Market Rent Summary | ||||
| Retail | Office; <10,000 SF | Office; >10,000 SF | GSA | |
| Property SF | 5,593 | 146,073 | 378,280 | 99,398 |
| Market Rent (PSF) | $20.00 | $17.50 | $17.50 | $35.00 |
| Lease Term (Years) | 5 | 5 | 10 | 10 |
| Lease Type (Reimbursements) | NNN | NNN | NNN | Gross + Taxes |
| Rent Increase Projection | $0.25 per annum | $0.25 per annum | $0.25 per annum | $0.25 per annum |
| Tenant Improvements (New Tenant) (PSF) | $25.00 | $25.00 | $25.00 | $25.00 |
| Tenant Improvements (Renewal) (PSF) | $5.00 | $5.00 | $5.00 | $5.00 |
Source:Appraisal
The following table presents certain information relating to comparable office leases for the Wells Fargo Place Property:
| Comparable Leases Summary | |||||||||
| Property Name/Location | Year Built/ Renovated | Total GLA (SF) | Occ. % | Distance from Subject | Tenant Name | Lease Date/Term (Mos.) | Lease Area (SF) | Annual Base Rent PSF | Lease Type |
Wells Fargo Place 30 7th Street East St. Paul, Minnesota | 1986/N/A | 646,459(1) | 85.0%(1) | - | - | - | - | - | - |
UBS Plaza 444 Cedar Street St. Paul, Minnesota | 1980/1997 | 275,520 | N/A | 0.1 miles | PolyMet Mining Optiv Security
| Mar. 2020 / 63
Oct. 2019 / 39
| 5,809
5,609
| $12.50
$12.00
| NNN
NNN
|
Northwestern Building St. Paul 275 4th Street East St. Paul, Minnesota | 1916/1980 | 81,322 | N/A | 0.5 miles | Aki Shibataa | Jun. 2019 / 36 | 345 | $17.00 | Gross |
Lawson Commons 380-388 Saint Peter Street St. Paul, Minnesota | 1999/N/A | 436,478 | N/A | 0.2 miles | Synchrony | Mar. 2018 / 84 | 16,000 | $15.50 | NNN |
401 Building 401 Robert Street North St. Paul, Minnesota | 2000/N/A | 635,000 | N/A | 0.1 miles | Charles Schwab | Feb. 2018 / 36 | 4,877 | $17.71 | NNN |
The Great Northern Building 180 East Fifth Street St. Paul, Minnesota | 1910/2014 | 668,321 | N/A | 0.3 miles | BNSF | Aug. 2017 / 60 | 8,254 | $10.00 | NNN |
Source:Appraisal
| (1) | Information is based on the underwritten rent roll dated October 21, 2019. |
| This is not a research report and was not prepared by any Underwriter’s research department. It was prepared by the Underwriters’ sales, trading, banking or other non-research personnel. Please see additional important information and qualifications at the end of this Term Sheet. |
102
| Office – CBD | Loan #8 | Cut-off Date Balance: | $40,000,000 | |
| 30 7th Street East | Wells Fargo Place | Cut-off Date LTV: | 64.0% | |
| St. Paul, MN 55101 | U/W NCF DSCR: | 2.92x | ||
| U/W NOI Debt Yield: | 10.8% |
Operating History and Underwritten Net Cash Flow.The following table presents certain information relating to the historical operating performance and Underwritten Net Cash Flow at the Wells Fargo Place Property:
| Cash Flow Analysis | ||||||
| 2016 | 2017(1) | 2018 | 8/31/2019 TTM | UW | UW PSF | |
| Gross Potential Rent(2) | $9,173,131 | $8,458,416 | $9,931,701 | $10,154,250 | $12,607,006 | $19.50 |
| Reimbursements | $6,077,632 | $6,147,729 | $6,637,926 | $6,707,414 | $6,705,305 | $10.37 |
| Other Income | $341,422 | $474,331 | $385,887 | $211,353 | $288,186 | $0.4 |
| Vacancy and Concessions | $0 | $0 | $0 | $0 | ($1,670,433) | ($2.58) |
| Effective Gross Income | $15,592,185 | $15,080,476 | $16,955,514 | $17,073,017 | $17,930,064 | $27.74 |
| Taxes | $3,181,556 | $3,233,988 | $3,204,410 | $3,100,771 | $3,209,026 | $4.96 |
| Insurance | $186,167 | $125,477 | $186,594 | $194,830 | $244,254 | $0.38 |
| Other Operating Expenses | $5,541,699 | $5,453,901 | $5,891,376 | $5,806,990 | $5,801,487 | $8.97 |
| Total Operating Expenses | $8,909,422 | $8,813,366 | $9,282,380 | $9,102,591 | $9,254,767 | $14.32 |
| Net Operating Income(3) | $6,682,763 | $6,267,110 | $7,673,134 | $7,970,426 | $8,675,297 | $13.42 |
| TI/LC | $0 | $0 | $0 | $0 | $468,054 | $0.72 |
| Capital Expenditures | $0 | $0 | $0 | $0 | $161,615 | $0.25 |
| Net Cash Flow | $6,682,763 | $6,267,110 | $7,673,134 | $7,970,426 | $8,045,628 | $12.45 |
| Occupancy %(4) | 85.0% | 86.2% | 85.9% | 85.0% | 91.4% | |
| NOI DSCR | 2.42x | 2.27x | 2.78x | 2.89x | 3.15x | |
| NCF DSCR | 2.42x | 2.27x | 2.78x | 2.89x | 2.92x | |
| NOI Debt Yield | 8.4% | 7.8% | 9.6% | 10.0% | 10.8% | |
| NCF Debt Yield | 8.4% | 7.8% | 9.6% | 10.0% | 10.1% | |
| (1) | The full year 2017 operating statement was not available, as the Wells Fargo Place Property was in receivership during the fourth quarter of 2017. As such, 2017 figures are based on a September 2017 year-to-date operating statement along with the general ledger for fourth quarter of 2017. |
| (2) | UW Gross Potential Rent is based on the October 21, 2019 rent roll, with rent steps taken through May 2020 of $30,183 and averaged rent through remaining lease terms for investment grade tenants equal to $192,756. |
| (3) | UW Net Operating Income is higher than 8/31/2019 TTM Net Operating Income due to (i) rent steps totaling approximately $30,183, (ii) rent averaging totaling $192,756, (iii) burn-off of free rent totaling approximately $360,000 and (iv) three new leases executed in the second half of 2019 totaling approximately $267,987 of underwritten rent and reimbursements. |
| (4) | Occupancy is shown as of December 31 of the corresponding year. 8/31/2019 TTM Occupancy is as of October 21, 2019. UW Occupancy represents underwritten economic occupancy. |
Escrows and Reserves.
Taxes and Insurance Reserves- The Wells Fargo Place Borrowers deposited $544,053 for property taxes. The Wells Fargo Place Borrowers are required to reserve monthly 1/12 of the estimated annual property taxes (currently $272,026) and 1/12 of the estimated annual insurance premiums (unless waived due to a blanket policy, which is currently in place).
Recurring Replacements Reserve- The Wells Fargo Place Borrowers will be required to reserve $13,468 monthly for replacements.
TI/LC Reserve- The Wells Fargo Place Borrowers deposited $4,000,000 for future tenant improvements and leasing commissions. Ongoing deposits into the TI/LC Reserve will be required in the amount of $80,807 per month commencing once the balance of the TI/LC Reserve is less than $1,000,000. Notwithstanding the foregoing, provided that no event of default then exists, monthly deposits into the TI/LC Reserve will be suspended at any time that the balance of the reserve is at least $3,000,000; provided, however, if a Major Tenant Trigger Event Period (as defined below) then exists, the cap will be increased to $5,500,000 (or $6,500,000 if the NOI debt yield is less than 8.5%), and upon a cure of the Major Tenant Trigger Event Period, the cap will be reduced back to $3,000,000 and funds on deposit in the TI/LC Reserve in excess of $3,000,000 will be disbursed to Wells Fargo Place Borrowers.
Existing Tenant TI/LC Reserve- The Wells Fargo Place Borrowers reserved at closing $1,648,010 for outstanding tenant improvements and leasing commissions obligations.
Existing Tenant Rent Concession Reserve- The Wells Fargo Place Borrowers reserved at closing $1,364,950 for rent concessions.
Escalator Reserve- The Wells Fargo Place Borrowers reserved at closing approximately $158,161 for escalator work.
Lockbox and Cash Management. The Wells Fargo Place Whole Loan is structured with a hard lockbox and in place cash management. The Wells Fargo Place Borrowers or property manager, as applicable, (i) delivered tenant direction letters to each tenant at the Wells Fargo Place Property directing them to pay all rents directly into the lockbox account, and, (ii) to the extent the Wells Fargo Place Borrowers or property manager receives any rents or other revenues of any kind, deposit such amounts into the lockbox account within three business days of receipt of the same. All funds in the lockbox account are required to be swept daily to a cash management account under the control of the lender to be applied and disbursed in accordance with the Wells Fargo Place Whole Loan documents and all excess cash flow funds remaining in the cash management account after the application of such funds in accordance with the Wells Fargo Place Whole Loan documents are required to be held by the lender in an excess cash flow reserve account as additional collateral for the Wells Fargo Place Whole Loan (unless the Sweep Event Period is caused by a Major Tenant Trigger Event
| This is not a research report and was not prepared by any Underwriter’s research department. It was prepared by the Underwriters’ sales, trading, banking or other non-research personnel. Please see additional important information and qualifications at the end of this Term Sheet. |
103
| Office – CBD | Loan #8 | Cut-off Date Balance: | $40,000,000 | |
| 30 7th Street East | Wells Fargo Place | Cut-off Date LTV: | 64.0% | |
| St. Paul, MN 55101 | U/W NCF DSCR: | 2.92x | ||
| U/W NOI Debt Yield: | 10.8% |
Period, in which case all excess cash flow up to an amount equal to $5,500,000 (or, so long as the NOI debt yield is below 8.5%, in which case up to an amount equal to $6,500,000) (the “Major Tenant Space Reserve Cap”) and will be available to the Wells Fargo Place Borrowers to pay tenant improvements and leasing commissions). Once funds on deposit in the related reserve equal the Major Tenant Space Reserve Cap, then (x) provided no other Sweep Event Period then exists, all excess cash flow is required to be released to Wells Fargo Place Borrowers or (y) if another Sweep Event Period then exists, all excess cash flow be transferred to an excess cash flow reserve. To the extent that no Sweep Event Period is continuing, all excess cash flow funds are required to be disbursed to the Wells Fargo Place Borrowers.
A “Sweep Event Period” will commence upon the earliest of the following: (i) the occurrence and continuance of an event of default, (ii) the date on which the debt service coverage ratio based on the trailing 12-month period is less than 1.30x (based on amortizing debt service payments), (iii) the occurrence and continuance of a Major Tenant Trigger Event Period and (iv) if on November 6, 2028, the debt yield is less than 8.5%.
A Sweep Event Period will end: with regard to clause (i), upon the cure of such event of default, with regard to clause (ii), when the debt service coverage ratio based on the trailing 12-month period is at least 1.40x for two consecutive calendar quarters and with regard to clause (iii), when the related Major Tenant Trigger Event Period is cured, as further described below. There is no cure for a Sweep Event Period described in clause (iv).
A “Major Tenant Trigger Event Period” commences if either (i) MCSU, AgriBank, IRS or a replacement tenant (each, a “Major Tenant”) defaults under its lease, (ii) (x) any one Major Tenant goes dark with respect to 30% or more of its space or otherwise fails to occupy at least 70% of its leased space or gives notice of its intention to do the foregoing, (y) any two Major Tenants go dark with respect to 20% or more of their respective spaces or otherwise fail to occupy at least 80% of their respective spaces or give notice of their intention to do the foregoing or (z) any three Major Tenants go dark with respect to 15% or more of their respective spaces or otherwise fail to occupy at least 85% of their respective spaces or give notice of their intention to do the foregoing, (iii) (x) any Major Tenant gives notice to vacate or vacates 30% or more of its leased space, (y) two Major Tenants give notice to vacate or vacate 20% or more of each of their leased spaces or (z) three Major Tenants give notice to vacate or vacate 15% or more of each of their leased spaces, (iv) any Major Tenant becomes a debtor in any bankruptcy or other insolvency proceeding, (v) (x) any Major Tenant sublets 40% or more of its leased space, (y) any two Major Tenants sublet 30% or more of their respective leased spaces or (z) any three Major Tenants sublet 25% or more if their respective leased spaces, (vi) any Major Tenant terminates its lease or gives notice to terminate its lease, or (vii) any Major Tenant fails to renew or extend the term of its lease for a period of five years, either (a) on terms and conditions stated in its respective lease or (b) on terms reasonably satisfactory to the lender at least 12 months prior to its lease expiration.
Such Major Tenant Trigger Event Period will terminate: (a) with regard to clause (i), upon the Major Tenant curing such default; (b) with regard to clauses (ii), (iii), (v) and (vi), upon the Major Tenant or Major Tenants, as applicable, having rescinded such notice and/or resumed their customary business operations in their respective leased spaces for at least one calendar quarter; (c) with regard to clause (iv), for the Major Tenant is affirmed in such proceeding and the related tenant is discharged from bankruptcy such that no proceedings are ongoing and pays rent for two consecutive calendar quarters; (d) with regard to clause (vi), the related tenant exercises the applicable extension option or enters into a new lease on terms and conditions satisfactory to the lender; and (e) with regard to clauses (i) through (vii), a Major Tenant Re-Tenanting Event (as defined below) has occurred.
A "Major Tenant Re-Tenanting Event" means that: (i) the related Major Tenant space is leased pursuant to a replacement lease having a term of at least five years for the related space, as applicable, (ii) such replacement tenant has taken occupancy of the leased premises, is paying full unabated rent and is open for business and all tenant improvements costs and leasing commissions have been paid and (iii) such replacement tenant has delivered a signed estoppel certificate reasonably satisfactory to the lender.
Additional Secured Indebtedness (not including trade debts). The Wells Fargo Place Property also secures the Wells Fargo Place ServicedPari Passu Companion Loans, which have an aggregate Cut-off Date principal balance of $40,000,000. The Wells Fargo Place ServicedPari Passu Companion Loans accrue interest at the same rate as the Wells Fargo Place Mortgage Loan. The Wells Fargo Place Whole Loan is entitled to payments of interest and principal on apro rata andpari passu basis with the Wells Fargo Place ServicedPari Passu Companion Loans. The holders of the Wells Fargo Place Mortgage Loan and the Wells Fargo Place ServicedPari Passu Companion Loans have entered into a co-lender agreement which sets forth the allocation of collections on the Wells Fargo Place Whole Loan. See “Description of the Mortgage Pool—The Whole Loans—The Serviced Pari Passu Whole Loans” in the Preliminary Prospectus.
Mezzanine Loan and Preferred Equity.Certain direct or indirect constituent owners of Wells Fargo Place Borrowers (other than the SPE general partner/managing member of Wells Fargo Place Borrowers) (whether one or more, collectively the “Wells Fargo Place Mezzanine Borrower”) may incur debt (the “Mezzanine Financing”) during the Wells Fargo Place Whole Loan term from a mezzanine lender acceptable to the lender (a “Qualified Mezzanine Lender”), secured by a pledge of 100% of the equity interest held by the Wells Fargo Place Mezzanine Borrower in the Wells Fargo Place Borrowers, provided the following conditions, among others, are met: (i) the aggregate loan-to-value (based on the Wells Fargo Place Whole Loan amount and the Mezzanine Financing) does not exceed 75.0%, (ii) the aggregate debt yield (based on the Wells Fargo Place Whole Loan amount and the Mezzanine Financing) is not less than 9.5%, (iii) the Wells Fargo Place Whole Loan and the Mezzanine Financing are co-terminus, (iv) the Qualified Mezzanine Lender executes an intercreditor agreement acceptable to the lender, (v) hard cash management is in place and (vi) the terms and documentation of the Mezzanine Financing are acceptable to the lender.
Release of Property.None.
Ground Lease.None.
Letter of Credit.None.
Right of First Offer/Right of First Refusal.None.
Terrorism Insurance.The Wells Fargo Place Borrower is required to obtain and maintain property insurance that covers perils of terrorism and acts of terrorism in an amount equal to the full replacement cost of the Wells Fargo Place Property and business interruption insurance for 18 months with a 180 day extended period of indemnity. See “Risk Factors—Risks Relating to the Mortgage Loans—Terrorism Insurance May Not Be Available for All Mortgaged Properties” in the Preliminary Prospectus.
| This is not a research report and was not prepared by any Underwriter’s research department. It was prepared by the Underwriters’ sales, trading, banking or other non-research personnel. Please see additional important information and qualifications at the end of this Term Sheet. |
104
(THIS PAGE INTENTIONALLY LEFT BLANK)
105
| Various | Loan #9 | Cut-off Date Balance: | $40,000,000 | |
| 340 Evergreen Avenue, 871 & 889 | Bushwick Avenue Portfolio | Cut-off Date LTV: | 65.0% | |
| Bushwick Avenue | U/W NCF DSCR: | 1.81x | ||
| Brooklyn, New York 11221 | U/W NOI Debt Yield: | 6.8% |
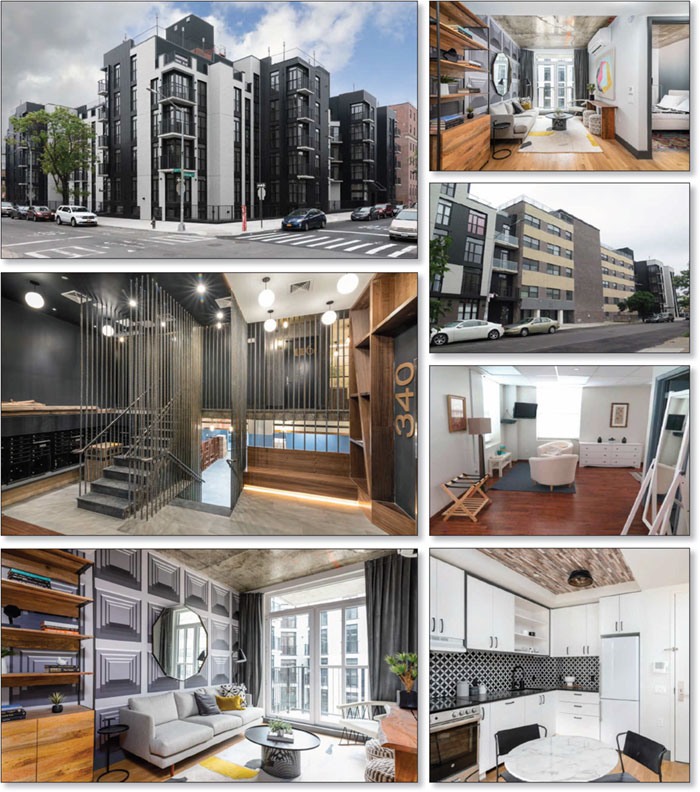
| This is not a research report and was not prepared by any Underwriter’s research department. It was prepared by the Underwriters’ sales, trading, banking or other non-research personnel. Please see additional important information and qualifications at the end of this Term Sheet. |
106
| Various | Loan #9 | Cut-off Date Balance: | $40,000,000 | |
| 340 Evergreen Avenue, 871 & 889 | Bushwick Avenue Portfolio | Cut-off Date LTV: | 65.0% | |
| Bushwick Avenue | U/W NCF DSCR: | 1.81x | ||
| Brooklyn, New York 11221 | U/W NOI Debt Yield: | 6.8% |
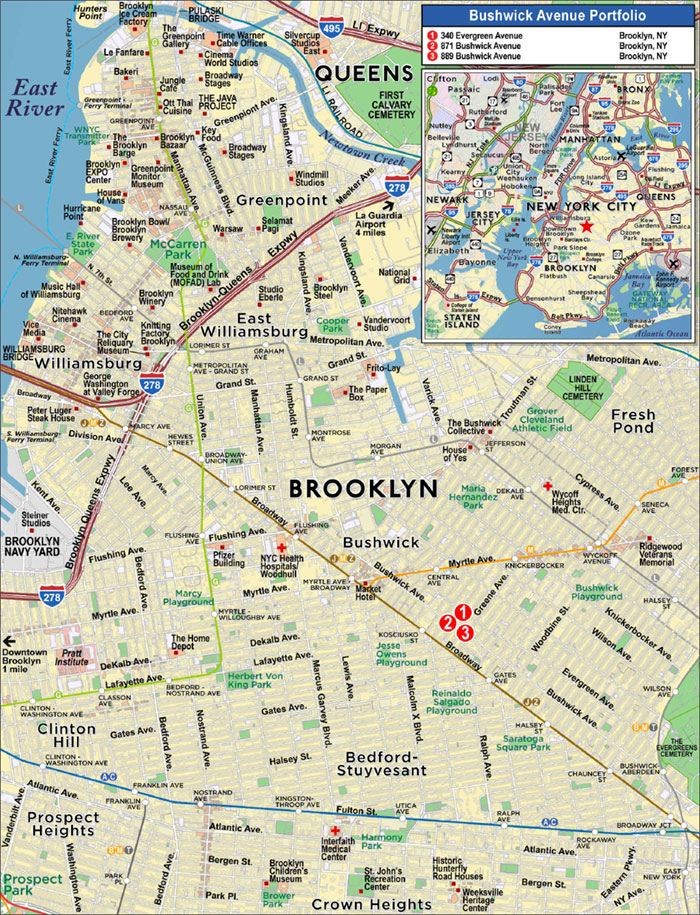
| This is not a research report and was not prepared by any Underwriter’s research department. It was prepared by the Underwriters’ sales, trading, banking or other non-research personnel. Please see additional important information and qualifications at the end of this Term Sheet. |
107
| Mortgage Loan No. 9 – Bushwick Avenue Portfolio |
| Mortgage Loan Information | Mortgaged Property Information | |||||
| Mortgage Loan Seller: | SMC | Single Asset/Portfolio: | Portfolio | |||
| Credit Assessment (KBRA/Fitch/S&P): | NR/NR/NR | Location: | Brooklyn, NY 11221 | |||
| Original Balance(1): | $40,000,000 | General Property Type: | Various | |||
| Cut-off Date Balance(1): | $40,000,000 | Detailed Property Type: | Various | |||
| % of Initial Pool Balance: | 3.9% | Title Vesting: | Fee | |||
| Loan Purpose: | Refinance | Year Built/Renovated: | Various/Various | |||
| Sponsors: | Joseph Brunner; Toby Mandel | Size: | 347,203 SF | |||
| Guarantors: | Joseph Brunner; Toby Mandel | Cut-off Date Balance per SF(1)(5): | $374 | |||
| Mortgage Rate: | 3.7100% | Maturity Date Balance per SF(1)(5): | $374 | |||
| Note Date: | 8/9/2019 | Property Manager: | Bruman Realty, LLC | |||
| First Payment Date: | 10/6/2019 | (borrower-related) | ||||
| Maturity Date: | 9/6/2029 | Underwriting and Financial Information | ||||
| Original Term to Maturity: | 120 months | UW NOI: | $8,879,285 | |||
| Original Amortization Term: | 0 months | UW NOI Debt Yield(1): | 6.8% | |||
| IO Period: | 120 months | UW NOI Debt Yield at Maturity(1): | 6.8% | |||
| Seasoning: | 2 months | UW NCF DSCR(1): | 1.81x | |||
| Prepayment Provisions(2): | LO (26); DEF (88); O (6) | Most Recent NOI(6): | N/A | |||
| Lockbox/Cash Mgmt Status: | Springing/Springing | 2nd Most Recent NOI(6): | N/A | |||
| Additional Debt Type(1)(3): | Pari Passu | 3rd Most Recent NOI(6): | N/A | |||
| Additional Debt Balance(1)(3): | $90,000,000 | Most Recent Occupancy: | 94.6% (8/2/2019) | |||
| Future Debt Permitted (Type): | No (N/A) | 2nd Most Recent Occupancy(6): | N/A | |||
| Reserves(4) | 3rd Most Recent Occupancy(6): | N/A | ||||
| Type | Initial | Monthly | Cap | Appraised Value (as of)(7): | $200,000,000 (7/18/2019) | |
| RE Tax: | $437,001 | $145,667 | N/A | Appraised Value per SF: | $576 | |
| Insurance: | $56,977 | $8,719 | N/A | Cut-off Date LTV Ratio(1): | 65.0% | |
| Recurring Replacements: | $0 | $3,717 | $223,000 | Maturity Date LTV Ratio(1): | 65.0% | |
| Sources and Uses | ||||||
| Sources | Proceeds | % of Total | Uses | Proceeds | % of Total | |
| Whole Loan Amount: | $130,000,000 | 100.0% | Loan Payoff: | $111,462,375 | 85.7% | |
| Return of Equity: | $15,862,178 | 12.2% | ||||
| Closing Costs: | $2,181,469 | 1.7% | ||||
| Reserves: | $493,978 | 0.4% | ||||
| Total Sources: | $130,000,000 | 100.0% | Total Uses: | $130,000,000 | 100.0% | |
| (1) | The Bushwick Avenue Portfolio Mortgage Loan (as defined below) is part of the Bushwick Avenue Portfolio Whole Loan (as defined below), which is evidenced by fivepari passupromissory notes with an aggregate original principal balance of $130,000,000. The Cut-off Date Balance per SF, Maturity Date Balance per SF, UW NOI Debt Yield, UW NOI Debt Yield at Maturity, UW NCF DSCR, Cut-off Date LTV Ratio and Maturity Date LTV Ratio numbers presented above are based on the aggregate principal balance of the promissory notes comprising the Bushwick Avenue Portfolio Whole Loan. |
| (2) | Defeasance of the Bushwick Avenue Portfolio Whole Loan is permitted at any time after the earlier to occur of (i) the end of the two-year period commencing on the closing date of the securitization of the last portion of the Bushwick Avenue Portfolio Whole Loan to be securitized and (ii) August 9, 2022. The assumed defeasance lockout period of 26 payments is based on the closing date of this transaction in November 2019. |
| (3) | See “The Mortgage Loan” and “Additional Secured Indebtedness (not including trade debts)” for further discussion of additional debt. |
| (4) | See “Escrows and Reserves” below for further discussion of reserve requirements. |
| (5) | The Bushwick Avenue Portfolio Properties (as defined below) are comprised of two multifamily properties and one mixed-use property. The 871 Bushwick Avenue property is comprised of 140,510 SF. The 340 Evergreen Avenue property is comprised of 157,037 SF or 168 units. The 889 Bushwick Avenue property is comprised of 49,656 SF or 54 units. Based on the loan amounts allocated to the multifamily properties (the 340 Evergreen Avenue property and the 889 Bushwick Avenue property), the Cut-off Date Balance per Unit and Maturity Date Balance per Unit for the multifamily collateral is approximately $406,982. Based on the loan amount allocated to the mixed use property (the 871 Bushwick Avenue property), the Cut-off Date Balance per SF and Maturity Date Balance per SF for the mixed use collateral is approximately $282. |
| (6) | The 871 Bushwick Avenue property was renovated in 2017 and is ground leased to Metro International Church, Inc., an affiliate of Metro World Child (“Metro”). The Bushwick Avenue Portfolio Properties were purchased from a subsidiary of Metro in April 2014 and fully renovated, and as such, the 871 Bushwick Avenue property is a sale lease back. The 889 Bushwick Avenue property was completed in July 2018 and the 340 Evergreen Avenue property was completed in 2019. As such, historical NOI and historical occupancy are not available. |
| (7) | The Appraised Value includes approximately $23,180,000 attributable to the net present value of a 421-a tax abatement expected to be applicable to the Bushwick Avenue Portfolio Properties. |
The Mortgage Loan.The ninth largest mortgage loan (the “Bushwick Avenue Portfolio Mortgage Loan”) is part of a whole loan (the “Bushwick Avenue Portfolio Whole Loan”) evidenced by fivepari passu promissory notes in the aggregate original principal balance of $130,000,000, all of which are secured by a first priority fee mortgage encumbering two multifamily properties and one mixed-use property located in Brooklyn, New York (the “Bushwick Avenue Portfolio Properties”). The non-controlling Note A-3 and Note A-4, in the aggregate original principal balance of $40,000,000, evidence the Bushwick Avenue Portfolio Mortgage Loan and will be contributed to the MSC 2019-L3 transaction. The controlling Note A-1 in the original principal balance of $36,000,000 was contributed to the CF 2019-CF2 securitization transaction, the non-controlling Note A-2 in the original principal balance of $35,000,000 is expected to be contributed to the GSMS 2019-GSA1 securitization transaction and the non- controlling Note A-5 in the original
| This is not a research report and was not prepared by any Underwriter’s research department. It was prepared by the Underwriters’ sales, trading, banking or other non-research personnel. Please see additional important information and qualifications at the end of this Term Sheet. |
108
| Various | Loan #9 | Cut-off Date Balance: | $40,000,000 | |
| 340 Evergreen Avenue, 871 & 889 | Bushwick Avenue Portfolio | Cut-off Date LTV: | 65.0% | |
| Bushwick Avenue | U/W NCF DSCR: | 1.81x | ||
| Brooklyn, New York 11221 | U/W NOI Debt Yield: | 6.8% |
principal balance of $19,000,000 (Note A-1, Note A-2 and Note A-5, together the “Bushwick Avenue Portfolio Non-ServicedPari Passu Companion Loans”) is expected to be contributed to one or more future securitization transactions or otherwise transferred at any time. The Bushwick Avenue Portfolio Whole Loan is serviced pursuant to the pooling and servicing agreement for the CF 2019-CF2 transaction. The proceeds of the Bushwick Avenue Portfolio Whole Loan were primarily used to pay off a prior loan, pay closing costs, fund reserves and return equity to the borrower sponsors. See “Description of the Mortgage Pool—The Whole Loans—The Non-Serviced Pari Passu Whole Loans” and “Pooling and Servicing Agreement—Servicing of the Non-Serviced Mortgage Loans” in the Preliminary Prospectus.
| Bushwick Avenue Portfolio Whole Loan Summary | ||||
| Notes | Original Balance | Cut-off Date Balance | Note Holder | Controlling Piece |
| A-1 | $36,000,000 | $36,000,000 | CF 2019-CF2 | Yes |
| A-2 | $35,000,000 | $35,000,000 | GSMS 2019-GSA1(1) | No |
| A-3 | $20,000,000 | $20,000,000 | MSC 2019-L3 | No |
| A-4 | $20,000,000 | $20,000,000 | MSC 2019-L3 | No |
| A-5 | $19,000,000 | $19,000,000 | Starwood Mortgage Funding II LLC | No |
| Total | $130,000,000 | $130,000,000 | ||
| (1) | Anticipated to be contributed to the GSMS 2019-GSA1 securitization transaction upon the closing of such transaction. |
The Borrower and the Borrower Sponsors. The borrower is Bushwick Realty Holdings LLC (the “Bushwick Avenue Portfolio Borrower”), a New York limited liability company and single purpose entity with two independent directors in its organizational structure. The borrower sponsors and non-recourse carveout guarantors of the Bushwick Avenue Portfolio Whole Loan are Joseph Brunner and Toby Mandel. The borrower sponsors have significant real estate experience within the Brooklyn submarket, and collectively own economic interests in over 110 properties. The borrower sponsors developed the Bushwick Avenue Portfolio Properties in three phases and have a total cost basis of approximately $144.8 million.
The Properties.The Bushwick Avenue Portfolio Properties are comprised of two multifamily properties and one mixed use property located in Brooklyn, New York, collectively totaling 347,203 SF. The 871 Bushwick Avenue property, which is owned in fee by the Bushwick Avenue Portfolio Borrower, is ground leased to Metro. The ground lease (the “Metro Ground Lease”) is scheduled to expire on June 30, 2049. Pursuant to the terms of the Metro Ground Lease, Metro is responsible for all expenses under a triple-net lease structure (inclusive of real estate taxes, utilities, common area maintenance and operating expenses).
The 340 Evergreen Avenue and the 889 Bushwick Avenue properties are expected to benefit from a 421-a tax incentive program granted by the New York City Department of Housing Preservation and Development (“HPD”). The 340 Evergreen Avenue property and the 889 Bushwick Avenue property are expected to benefit from a 100% tax exemption for 25 years, followed by a 25-30% tax exemption for years 26-35. The Bushwick Avenue Portfolio Whole Loan is full recourse to the Bushwick Avenue Portfolio Borrower and the borrower sponsors until such time as HPD issues a Final Certificate of Eligibility for each of the 340 Evergreen Avenue and 889 Bushwick Avenue properties. Further, if the 421-a tax exemptions are not maintained for either the 340 Evergreen Avenue property or the 889 Bushwick Avenue property after the issuance of the Final Certificate of Eligibility, the Bushwick Avenue Portfolio Whole Loan becomes full recourse to the Bushwick Avenue Portfolio Borrower and the borrower sponsors. Current estimated unabated taxes for the 340 Evergreen Avenue and 889 Bushwick Avenue properties are equal to approximately $1,368,333 compared to underwritten abated taxes of $523,598. The Appraised Value includes approximately $23,180,000 attributable to the net present value of the 421-a tax abatement.
The following table presents detailed information with respect to each of the Bushwick Avenue Portfolio Properties.
| Bushwick Avenue Portfolio Properties Summary | |||||||||
| Property Name / Location | Property Type | Year Built/ Renovated | SF | Units | Allocated Whole Loan Amount (“ALA”) | % of ALA | Appraised Value | UW NOI | % of UW NOI |
| 340 Evergreen Avenue 340 Evergreen Avenue Brooklyn, NY | Multifamily | 2019 / N/A | 157,037 | 168 | $66,950,000 | 51.5% | $103,000,000 | $4,045,776 | 45.6% |
| 871 Bushwick Avenue 871 Bushwick Avenue Brooklyn, NY | Mixed Use | 1954 / 2017 | 140,510 | N/A | $39,650,000 | 30.5% | $61,000,000 | $3,317,400 | 37.4% |
| 889 Bushwick Avenue 889 Bushwick Avenue Brooklyn, NY | Multifamily | 2018 / N/A | 49,656 | 54 | $23,400,000 | 18.0% | $36,000,000 | $1,516,109 | 17.1% |
| Total | 347,203 | 222 | $130,000,000 | 100.0% | $200,000,000 | $8,879,285 | 100.0% | ||
340 Evergreen Avenue (168 Units, 51.5% ALA). The 340 Evergreen Avenue property is comprised of 168 units (31 studio, 68 one-bedroom, 48 two-bedroom and 21 three-bedroom units) across 157,037 SF. The 340 Evergreen Avenue property has three entrances with frontage on Evergreen Avenue, Harmon Street and Himrod Street. Units include hardwood and ceramic flooring throughout, wood cabinetry, granite countertops, stainless steel appliances and dishwashers. A majority of the units have balcony or terrace space. Building amenities include a fitness center, yoga room, kids’ room, pet spa, laundry room, lounge/screening room, business center, parking, landscaped roof and bike storage.
In connection with the 340 Evergreen Avenue property’s applied-for 35-year 421-a tax abatement, there are 60 units in the building set aside for low-income tenants earning between 100-110% of the area median income (“AMI”), subject to certain rental restrictions. A temporary certificate of occupancy (“TCO”) has been issued for the 340 Evergreen Avenue Property, and the 340 Evergreen Avenue property is 100% pre-leased (100% of the market rate units are currently occupied, while there are 18 vacant low-income units, which may be occupied after approvals have been completed for prospective tenants from the housing lottery).
| This is not a research report and was not prepared by any Underwriter’s research department. It was prepared by the Underwriters’ sales, trading, banking or other non-research personnel. Please see additional important information and qualifications at the end of this Term Sheet. |
109
| Various | Loan #9 | Cut-off Date Balance: | $40,000,000 | |
| 340 Evergreen Avenue, 871 & 889 | Bushwick Avenue Portfolio | Cut-off Date LTV: | 65.0% | |
| Bushwick Avenue | U/W NCF DSCR: | 1.81x | ||
| Brooklyn, New York 11221 | U/W NOI Debt Yield: | 6.8% |
The following table presents detailed information with respect to the units at the 340 Evergreen Avenue property:
| 340 Evergreen Avenue Summary | |||||||||
| Unit Type | No. of Units | % of Total | Occupied Units | Occupancy | Average Unit Size (SF) | Average Monthly Rental Rate | Average Monthly Rental Rate per SF | Average Monthly Market Rental Rate | Average Monthly Market Rental Rate per SF |
| Studio | 31 | 18.5% | 30 | 96.8% | 421 | $2,042 | $4.85 | $2,313 | $5.49 |
| One Bedroom | 68 | 40.5% | 67 | 98.5% | 520 | $2,494 | $4.80 | $2,616 | $5.03 |
| Two Bedroom | 48 | 28.6% | 32 | 66.7% | 762 | $2,566 | $3.37 | $2,970 | $3.90 |
| Three Bedroom | 21 | 12.5% | 21 | 100.0% | 925 | $3,837 | $4.15 | $3,850 | $4.16 |
| Total/Wtd. Avg. | 168 | 100.0% | 150 | 89.3% | 622 | $2,599 | $4.18 | $2,815 | $4.53 |
Source: Appraisal
871 Bushwick Avenue (140,510 SF, 30.5% ALA). The 871 Bushwick Avenue property is a 140,510 SF mixed use office and multifamily building, which was completed in October 2015. The 871 Bushwick Avenue property is ground leased to Metro, and the location serves as Metro’s global headquarters for use as offices, training facilities and apartments for volunteers and staff. Metro was founded in 1980 and is a faith-based humanitarian organization committed to serving the underprivileged inner-city children of the world. Metro currently operates Metro Sunday Schools in more than 13 countries around the world and has over 200 locations throughout New York City. Metro also coordinates the direct financial sponsorship of a number of impoverished children, providing them not only with Sunday school services, but with basic necessities. Metro funds its operations through donations. The Bushwick Avenue Portfolio Properties were purchased from a subsidiary of Metro for $15.0 million in April 2014, and as such, the 871 Bushwick Avenue property was a sale-leaseback.
The Metro Ground Lease is dated as of and commenced on July 1, 2019. The expiration date of the Metro Ground Lease is June 30, 2049, with no renewal options. In the event that Metro files a declaration for a leasehold condominium (the “Declaration”) within the first year of the Metro Ground Lease, the expiration date of the Metro Ground Lease will be extended to the date that is 30 years from the filing of the Declaration. Metro is required to deliver notice of the filing of the Declaration to the Bushwick Avenue Portfolio Borrower simultaneously with the recording of the Declaration. Annual ground rent is equal to $3.6 million, which escalates each year by 2.5% over the prior year during the term of the ground lease, except for in year 15, when the ground rent increases by 10.0% over the prior year. In the event Metro ceases paying rent under the Metro Ground Lease and/or terminates the Metro Ground Lease, the Bushwick Avenue Portfolio Loan will be recourse to the borrower sponsors in an amount equal to Metro’s rent under the Metro Ground Lease until the Bushwick Avenue Portfolio Borrower enters into a satisfactory replacement ground lease with a satisfactory replacement ground tenant for the 871 Bushwick Avenue property.
889 Bushwick Avenue (54 Units, 18.0% ALA). The 889 Bushwick Avenue property is comprised of 54 units (1 studio, 29 one-bedroom, 17 two-bedroom and 7 three-bedroom units) and one superintendent studio unit across 49,656 SF. The 889 Bushwick Avenue property has one entrance with frontage on Harmon Street and Bushwick Avenue. Units include hardwood and ceramic flooring throughout, wood cabinetry, granite countertops, stainless steel appliances and dishwashers. Some units have duplexed living spaces and the majority of units have balcony or terrace space. Building amenities include a fitness center, pet spa, laundry room, recreational area and roof access.
In connection with the 889 Bushwick Avenue property’s applied-for 35-year 421-a tax abatement, there are six units in the building set aside for low-income tenants earning between 100-110% of the AMI, subject to certain rental restrictions.
The following table presents detailed information with respect to the units at the 889 Bushwick Avenue property:
| 889 Bushwick Avenue Summary | |||||||||
| Unit Type | No. of Units | % of Total | Occupied Units | Occupancy | Average Unit Size (SF) | Average Monthly Rental Rate | Average Monthly Rental Rate per SF | Average Monthly Market Rental Rate | Average Monthly Market Rental Rate per SF |
| Studio | 1 | 1.9% | 1 | 100.0% | 803 | $2,750 | $3.42 | $2,750 | $3.42 |
| One Bedroom | 29 | 53.7% | 27 | 93.1% | 485 | $2,588 | $5.34 | $2,730 | $5.63 |
| Two Bedroom | 17 | 31.5% | 17 | 100.0% | 693 | $2,931 | $4.23 | $2,931 | $4.23 |
| Three Bedroom | 7 | 13.0% | 7 | 100.0% | 1,023 | $3,807 | $3.72 | $3,807 | $3.72 |
| Total/Wtd. Avg. | 54 | 100.0% | 52 | 96.3% | 626 | $2,857 | $4.56 | $2,933 | $4.68 |
Source: Appraisal
The Market.The Bushwick Avenue Portfolio Properties are located in Brooklyn, New York, within the Bushwick neighborhood. Low-rise residential buildings dominate the southern portion of the neighborhood while, further north, land use is more industrial. Multifamily walkups account for a majority of land use in the area, while one- and two-family buildings and open recreational space account for the second and third largest uses of land use respectively. Bushwick is connected to the broader New York City metropolitan area. The area is served by the L, J and Z subway trains, and the median commuting time to Manhattan is estimated at 40 minutes. The Bushwick Avenue Portfolio Properties are less than a six minute walk to the J and M subway trains.
According to the appraisal, the Bushwick apartment submarket contained approximately 36,111 units with a submarket occupancy rate of 97.0% as of the first quarter of 2019. Since 2010, the Bushwick apartment submarket has maintained an occupancy level of at least 95.8%. There are a total of 2,871 units currently under construction. As of the first quarter of 2019, quoted rental rates per unit are equal to $2,330 per month.
According to the appraisal, the North Brooklyn office market contained approximately 14.3 million SF of inventory with a market occupancy rate of 89.2% as of the first quarter of 2019. Since 2010, the North Brooklyn office market has maintained an occupancy level of at least 86.8%. Approximately
| This is not a research report and was not prepared by any Underwriter’s research department. It was prepared by the Underwriters’ sales, trading, banking or other non-research personnel. Please see additional important information and qualifications at the end of this Term Sheet. |
110
| Various | Loan #9 | Cut-off Date Balance: | $40,000,000 | |
| 340 Evergreen Avenue, 871 & 889 | Bushwick Avenue Portfolio | Cut-off Date LTV: | 65.0% | |
| Bushwick Avenue | U/W NCF DSCR: | 1.81x | ||
| Brooklyn, New York 11221 | U/W NOI Debt Yield: | 6.8% |
2,854,159 SF is currently under construction. As of the first quarter of 2019, quoted rental rates per SF are equal to $41.11. Within the zip code of the Bushwick Avenue Portfolio Properties, the estimated 2019 population and average household income are estimated at approximately 88,330 individuals and $72,965, respectively.
The following table presents certain information relating to comparable multifamily rental properties to the Bushwick Avenue Portfolio Properties:
| Comparable Rental Summary(1) | |||||||
| Property Address | Year Built | Type | # Units | Unit Mix | Average SF per Unit | Market Rent per SF(1) | Average Market Rent per Unit(1) |
| 340 Evergreen Avenue | 2019 | Mid Rise | 168 | Studio 1BR 2BR 3BR | 421 520 762 925 | $5.49 $5.03 $3.90 $4.16 | $2,313 $2,616 $2,970 $3,850 |
| 889 Bushwick Avenue | 2018 | Mid Rise | 54 | Studio 1BR 2BR 3BR | 803 485 693 1,023 | $3.42 $5.63 $4.23 $3.72 | $2,750 $2,730 $2,931 $3,807 |
| 30 Belvidere Street | 2018 | Mid Rise | 7 | 1BR 2BR 3BR | 600 1,100 1,200 | $4.33 $3.64 $3.75 | $2,600 $4,000 $4,500 |
| 785 Dekalb Avenue – The Atrium | 2015 | Mid Rise | 70 | Studio 1BR 2BR 3BR | 500 650 900 1,100 | $4.20 $4.00 $3.56 $3.18 | $2,100 $2,600 $3,200 $3,500 |
| 24 Starr Street | 2016 | Mid Rise | 24 | Studio 1BR 2BR 3BR | 800 850 1,000 1,200 | $3.63 $3.12 $3.30 $3.50 | $2,900 $2,650 $3,300 $4,200 |
| 774 Bushwick Avenue | 2015 | Mid Rise | 14 | 1BR 2BR 3BR | 600 700 900 | $4.33 $3.86 $3.67 | $2,600 $2,700 $3,300 |
| 689-691 Marcy Avenue – Marci | 2016 | Mid Rise | 41 | 1BR 2BR | 725 900 | $3.86 $3.44 | $2,800 $3,100 |
| 1255 Bushwick Avenue | 2017 | Mid Rise | 32 | Studio 1BR 2BR | 412 540 797 | $4.85 $4.44 $3.64 | $2,000 $2,400 $2,900 |
Source: Appraisal
| (1) | The Bushwick Avenue Portfolio Properties and the comparables vary to some degree in terms of physical characteristics, project amenities, unit amenities, parking, laundry and utilities. As such, the appraisal made adjustments to the comparables contract rents to better compare to the Bushwick Avenue Portfolio Properties. Market Rent per SF and Average Market Rent per Unit represent the adjusted market rents. |
| This is not a research report and was not prepared by any Underwriter’s research department. It was prepared by the Underwriters’ sales, trading, banking or other non-research personnel. Please see additional important information and qualifications at the end of this Term Sheet. |
111
| Various | Loan #9 | Cut-off Date Balance: | $40,000,000 | |
| 340 Evergreen Avenue, 871 & 889 | Bushwick Avenue Portfolio | Cut-off Date LTV: | 65.0% | |
| Bushwick Avenue | U/W NCF DSCR: | 1.81x | ||
| Brooklyn, New York 11221 | U/W NOI Debt Yield: | 6.8% |
Underwritten Net Cash Flow. The following table presents certain information relating to the Underwritten Net Cash Flow at the Bushwick Avenue Portfolio Properties.
| Cash Flow Analysis(1) | ||
| UW | UW per SF | |
| Gross Potential Rent | $10,690,464 | $30.79 |
| Other Income | $360,660 | $1.04 |
| Less Vacancy & Credit Loss | ($733,872) | ($2.11) |
| Effective Gross Income | $10,317,252 | $29.72 |
| Real Estate Taxes(2) | $523,598 | $1.51 |
| Insurance | $104,623 | $0.30 |
| Other Expenses | $809,747 | $2.33 |
| Total Expenses | $1,437,967 | $4.14 |
| Net Operating Income | $8,879,285 | $25.57 |
| Capital Expenditures | $44,600 | $0.13 |
| Net Cash Flow | $8,834,685 | $25.45 |
| Occupancy %(3) | 93.1% | |
| NOI DSCR(4) | 1.82x | |
| NCF DSCR(4) | 1.81x | |
| NOI Debt Yield(4) | 6.8% | |
| NCF Debt Yield(4) | 6.8% | |
| (1) | The 871 Bushwick Avenue property was renovated in 2017 and is ground leased to Metro. The Bushwick Avenue Portfolio Properties were purchased from a subsidiary of Metro in April 2014, and as such, the 871 Bushwick Avenue property is a sale lease back. The 889 Bushwick Avenue property was completed in July 2018 and the 340 Evergreen Avenue property was completed in 2019. As such, historical financials are not available. |
| (2) | The 340 Evergreen Avenue property and the 889 Bushwick Avenue property are anticipated to benefit from a 421-a tax incentive program by the HPD. There is expected to be a 100% tax abatement for 25 years followed by a 25-30% tax abatement for years 26-35. Current unabated taxes are equal to approximately $1,368,333 compared to underwritten abated taxes of $523,598. |
| (3) | UW Occupancy % is equal to underwritten economic occupancy. |
| (4) | The debt service coverage ratios and debt yields are based on the Bushwick Avenue Portfolio Whole Loan. |
Escrows and Reserves.
Real Estate Taxes – The Bushwick Avenue Portfolio Whole Loan documents provide for an upfront real estate tax reserve of $437,001 and an ongoing monthly real estate tax reserve in an amount equal to 1/12 of the annual estimated real estate taxes (initially $145,667). Upon commencement of the 421-a tax abatement, the tax reserve will be adjusted to the billed tax amount.
Insurance – The Bushwick Avenue Portfolio Whole Loan documents provide for an upfront insurance reserve of $56,977 and an ongoing monthly insurance reserve in an amount equal to 1/12 of the annual estimated insurance premiums (initially $8,719).
Replacement Reserve – The Bushwick Avenue Portfolio Whole Loan documents provide for a monthly capital expenditure reserve of $3,717, capped at $223,000.
Lockbox and Cash Management. The Bushwick Avenue Portfolio Whole Loan documents require a springing lockbox with springing cash management upon the occurrence of a Trigger Event (as defined below). After the occurrence of a Trigger Event, the Bushwick Avenue Portfolio Borrower must establish a lockbox account and the Bushwick Avenue Portfolio Borrower or property manager, as applicable, is required to direct tenants to pay all rents directly into the lockbox account. Upon the occurrence and during the continuance of a Trigger Event, all funds in the lockbox account are required to be swept daily to a cash management account under the control of the lender to be applied and disbursed in accordance with the Bushwick Avenue Portfolio Whole Loan documents (i) to make deposits into the tax and insurance escrows, if required, (ii) to pay debt service, (iii) to make deposits into the replacement reserves, if required and (iv) to pay for monthly operating expenses in accordance with the annual budget approved by the lender and extraordinary expenses approved by the lender and all excess cash flow funds remaining in the cash management account after the application of such funds in accordance with the Bushwick Avenue Portfolio Whole Loan documents are required to be held by the lender in an excess cash flow reserve account as additional collateral for the Bushwick Avenue Portfolio Whole Loan.
A “Trigger Event” will commence upon the earliest of the following: (i) the occurrence and continuance of an event of default and (ii) the date on which the debt service coverage ratio based on the trailing 12-month period is less than 1.20x.
A Trigger Event will end: with regard to clause (i), upon the cure of such event of default and with regard to clause (ii), when the debt service coverage ratio based on the trailing 12-month period is at least 1.30x for two consecutive calendar quarters.
| This is not a research report and was not prepared by any Underwriter’s research department. It was prepared by the Underwriters’ sales, trading, banking or other non-research personnel. Please see additional important information and qualifications at the end of this Term Sheet. |
112
| Various | Loan #9 | Cut-off Date Balance: | $40,000,000 | |
| 340 Evergreen Avenue, 871 & 889 | Bushwick Avenue Portfolio | Cut-off Date LTV: | 65.0% | |
| Bushwick Avenue | U/W NCF DSCR: | 1.81x | ||
| Brooklyn, New York 11221 | U/W NOI Debt Yield: | 6.8% |
Additional Secured Indebtedness (not including trade debts). The Bushwick Avenue Portfolio Properties also secure the Bushwick Avenue Portfolio Non-ServicedPari Passu Companion Loans, which have an aggregate Cut-off Date principal balance of $90,000,000. The Bushwick Avenue Portfolio Non-ServicedPari Passu Companion Loans accrue interest at the same rate as the Bushwick Avenue Portfolio Mortgage Loan. The Bushwick Avenue Portfolio Whole Loan is entitled to payments of interest and principal on a pro rata andpari passu basis with the Bushwick Avenue Portfolio Non-ServicedPari Passu Companion Loans. The holders of the Bushwick Avenue Portfolio Mortgage Loan and the Bushwick Avenue Portfolio Non-ServicedPari Passu Companion Loans have entered into a co-lender agreement which sets forth the allocation of collections on the Bushwick Avenue Portfolio Whole Loan. See “Description of the Mortgage Pool—The Whole Loans—The Non-Serviced Pari Passu Whole Loans” in the Preliminary Prospectus.
Mezzanine Loan and Preferred Equity.None.
Release of Property. At any time following the expiration of the lockout period, the Bushwick Avenue Portfolio Borrower may obtain the release of the 871 Bushwick Avenue property by defeasing an amount equal to the greatest of (i) 115% of the ALA ($45,597,500), (ii) an amount which would result in the debt service coverage ratio as calculated under the Bushwick Avenue Portfolio Whole Loan documents on the then-remaining properties being greater than or equal to 1.60x after giving effect to such release, (iii) an amount which would result in the loan-to-value ratio as calculated under the Bushwick Avenue Portfolio Whole Loan documents on the then-remaining properties being less than or equal to 65.0% after giving effect to such release, (iv) an amount which would result in the debt yield as calculated under the Bushwick Avenue Portfolio Whole Loan documents on the then-remaining properties being greater than or equal to 7.0% after giving effect to such release or (v) an amount as may be required such that the release will not cause the related securitization trust to fail to qualify as a REMIC after giving effect to such release.
Right of First Refusal/Purchase Option.Metro has the right to purchase the Bushwick Avenue Portfolio Borrower’s fee interest in the 871 Bushwick Avenue property at any time after July 1, 2028 and prior to January 1, 2029, for an amount equal to $95,000,000, subject to certain additional requirements as provided in the Metro Ground Lease.
Ground Lease. None.
Letter of Credit. None.
Terrorism Insurance. The Bushwick Avenue Portfolio Borrower is required to obtain and maintain property insurance that covers perils of terrorism and acts of terrorism in an amount equal to the full replacement cost of the Bushwick Avenue Portfolio Properties and business interruption insurance for 18 months. See“Risk Factors—Risks Relating to the Mortgage Loans—Terrorism Insurance May Not Be Available for All Mortgaged Properties”in the Preliminary Prospectus.
| This is not a research report and was not prepared by any Underwriter’s research department. It was prepared by the Underwriters’ sales, trading, banking or other non-research personnel. Please see additional important information and qualifications at the end of this Term Sheet. |
113
| Hospitality – Extended Stay | Loan #10 | Cut-off Date Balance: | $32,500,000 | |
| 40 Westbury Avenue | AVR Homewood Suites Carle Place | Cut-off Date LTV: | 65.0% | |
| Carle Place, NY 11514 | U/W NCF DSCR: | 3.12x | ||
| U/W NOI Debt Yield: | 12.8% |
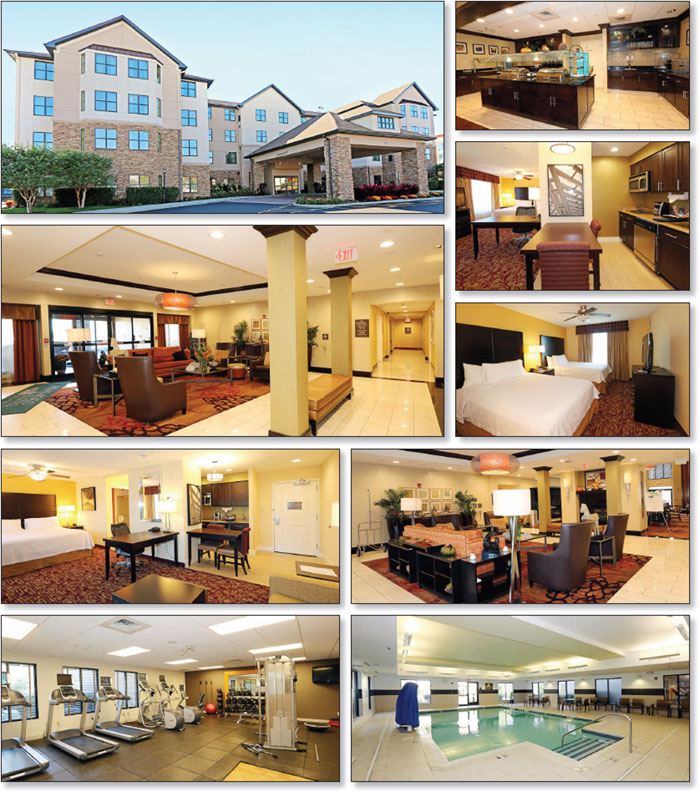
| This is not a research report and was not prepared by any Underwriter’s research department. It was prepared by the Underwriters’ sales, trading, banking or other non-research personnel. Please see additional important information and qualifications at the end of this Term Sheet. |
114
| Hospitality – Extended Stay | Loan #10 | Cut-off Date Balance: | $32,500,000 | |
| 40 Westbury Avenue | AVR Homewood Suites Carle Place | Cut-off Date LTV: | 65.0% | |
| Carle Place, NY 11514 | U/W NCF DSCR: | 3.12x | ||
| U/W NOI Debt Yield: | 12.8% |

| This is not a research report and was not prepared by any Underwriter’s research department. It was prepared by the Underwriters’ sales, trading, banking or other non-research personnel. Please see additional important information and qualifications at the end of this Term Sheet. |
115
| Mortgage Loan No. 10 – AVR Homewood Suites Carle Place |
| Mortgage Loan Information | Property Information | |||||
| Mortgage Loan Seller: | CCRE | Single Asset/Portfolio: | Single Asset | |||
| Credit Assessment (KBRA/Fitch/S&P): | NR/NR/NR | Location: | Carle Place, NY 11514 | |||
| Original Balance: | $32,500,000 | General Property Type: | Hospitality | |||
| Cut-off Date Balance: | $32,500,000 | Detailed Property Type: | Extended Stay | |||
| % of Initial Pool Balance: | 3.2% | Title Vesting(2): | Fee | |||
| Loan Purpose: | Refinance | Year Built/Renovated: | 2013/N/A | |||
| Sponsor: | Allan V. Rose | Size: | 150 Rooms | |||
| Guarantor: | Allan V. Rose | Cut-off Date Balance per Room: | $216,667 | |||
| Mortgage Rate: | 3.6700% | Maturity Date Balance per Room: | $216,667 | |||
| Note Date: | 10/22/2019 | Property Manager: | Dimension Development | |||
| First Payment Date: | 12/1/2019 | Two, LLC | ||||
| Maturity Date: | 11/1/2029 | Underwriting and Financial Information | ||||
| Original Term to Maturity: | 120 months | UW NOI: | $4,172,991 | |||
| Original Amortization Term: | 0 months | UW NOI Debt Yield: | 12.8% | |||
| IO Period: | 120 months | UW NOI Debt Yield at Maturity: | 12.8% | |||
| Seasoning: | 0 months | UW NCF DSCR: | 3.12x | |||
| Prepayment Provisions: | LO (24); DEF (92); O (4) | Most Recent NOI: | $4,432,701 (8/31/2019 TTM) | |||
| Lockbox/Cash Mgmt Status: | Hard/Springing | 2nd Most Recent NOI: | $4,274,701 (12/31/2018) | |||
| Additional Debt Type: | N/A | 3rd Most Recent NOI: | $3,859,789 (12/31/2017) | |||
| Additional Debt Balance: | N/A | Most Recent Occupancy: | 92.9% (8/31/2019) | |||
| Future Debt Permitted (Type): | No (N/A) | 2nd Most Recent Occupancy: | 93.4% (12/31/2018) | |||
| Reserves(1) | 3rd Most Recent Occupancy: | 90.1% (12/31/2017) | ||||
| Type | Initial | Monthly | Cap | Appraised Value (as of)(3): | $50,000,000 (10/1/2019) | |
| RE Tax: | $0 | Springing | N/A | Appraised Value per Room(3): | $333,333 | |
| Insurance: | $0 | Springing | N/A | Cut-off Date LTV Ratio: | 65.0% | |
| FF&E: | $2,932,000 | 1/12 of 4.0% of gross income from prior year | N/A | Maturity Date LTV Ratio: | 65.0% | |
| Sources and Uses | ||||||
| Sources | Proceeds | % of Total | Uses | Proceeds | % of Total | |
| Loan Amount: | $32,500,000 | 100.0% | Loan Payoff: | $28,888,258 | 88.9% | |
| Reserves: | $2,932,000 | 9.0% | ||||
| Closing Costs: | $407,793 | 1.3% | ||||
| Return of Equity: | $271,948 | 0.8% | ||||
| Total Sources: | $32,500,000 | 100.0% | Total Uses: | $32,500,000 | 100.0% | |
| (1) | See “Escrows and Reserves” below for further discussion of reserve requirements. |
| (2) | In connection with a PILOT Agreement, the AVR Homewood Suites Carle Place Borrower (as defined below) leased its fee interest to Nassau County Industrial Development Agency. See “The Property—The PILOT Agreement” below. |
| (3) | The Appraised Value of $50,000,000 assumes that the cost of the planned renovations (the soft goods renovation and the “Take Flight” renovation) have been reserved with the lender. At origination, the AVR Homewood Suites Carle Place Borrower reserved $2,932,000 with lender, which is 100% of the budgeted amount for the planned soft goods renovation. The remaining costs of the “Take Flight” renovation (estimated to be $530,530), which is in progress and is required by the franchisor to be completed by December 31, 2019, was not reserved at origination. The AVR Homewood Suites Carle Place Sponsor (as defined below) provided a completion guarantee and in the event the “Take Flight” renovation has not been completed by January 31, 2020, the AVR Homewood Suites Carle Place Mortgage Loan (as defined below) documents provide for the commencement of an excess cash flow sweep. |
The Mortgage Loan. The tenth largest mortgage loan (the “AVR Homewood Suites Carle Place Mortgage Loan”) is evidenced by a promissory note in the original principal amount of $32,500,000, which is secured by a fee mortgage encumbering a 150-room, extended stay hotel located in Carle Place, New York (the “AVR Homewood Suites Carle Place Property”). The proceeds of the AVR Homewood Suites Carle Place Mortgage Loan were used to repay existing debt, fund reserves, pay closing costs and return equity to the AVR Homewood Suites Carle Place Borrower.
The Borrower and the Borrower Sponsor.The borrower for the AVR Homewood Suites Carle Place Mortgage Loan is AVR Carle Place Hotel 1 LLC (the “AVR Homewood Suites Carle Place Borrower”), a single purpose Delaware limited liability company structured to be bankruptcy remote with one independent director. Allan V. Rose is the borrower sponsor and non-recourse carveout guarantor (the “AVR Homewood Suites Carle Place Sponsor”) of certain nonrecourse carve-outs under the AVR Homewood Suites Carle Place Mortgage Loan and a completion guarantee regarding certain remaining renovation costs of the “Take Flight” renovation. See “The Property” below.
Allan V. Rose is the owner and chief executive officer of AVR Realty (“AVR”), a privately held real estate development and management company. AVR was founded over 45 years ago and has built, acquired and developed more than 30 million SF of commercial and residential space. AVR’s portfolio includes office complexes, shopping centers, corporate and industrial parks, apartment complexes, residential communities and hotels. AVR currently owns a portfolio of 23 hospitality properties totaling over 5,000 rooms.
The Property. The AVR Homewood Suites Carle Place Property is a four-story, 150-room extended stay hotel located in Carle Place, New York, which is located on Long Island approximately 27 miles east of Manhattan. The AVR Homewood Suites Carle Place Property is situated on a 3.00-acre site and includes 165 surface parking spaces. The AVR Homewood Suites Carle Place Sponsor completed development of the AVR Homewood Suites
| This is not a research report and was not prepared by any Underwriter’s research department. It was prepared by the Underwriters’ sales, trading, banking or other non-research personnel. Please see additional important information and qualifications at the end of this Term Sheet. |
116
| Hospitality – Extended Stay | Loan #10 | Cut-off Date Balance: | $32,500,000 | |
| 40 Westbury Avenue | AVR Homewood Suites Carle Place | Cut-off Date LTV: | 65.0% | |
| Carle Place, NY 11514 | U/W NCF DSCR: | 3.12x | ||
| U/W NOI Debt Yield: | 12.8% |
Carle Place Property in March 2013 for $22.84 million and has invested an additional $237,451 ($1,583 per room) since. The AVR Homewood Suites Carle Place Property operates under a franchise agreement with Homewood Suites Franchise LLC that expires on January 31, 2033 with no renewal options remaining.
The AVR Homewood Suites Carle Place Property features 150 guestrooms and is comprised of 59 studio suites, 82 one-bedroom suites and nine two-bedroom suites. All of the guest rooms at the AVR Homewood Suites Carle Place Property feature one king or two queen beds, a work desk, a sleeper sofa, a dresser, a 32-inch television, an iPod docking station and a granite bathroom. The suites also offer a kitchen with a microwave, a full-size refrigerator, a coffee maker, a two-burner stove, cooking and dining utensils, and a dishwasher. Amenities at the AVR Homewood Suites Carle Place Property include approximately 4,140 SF of meeting space, an indoor swimming pool with a whirlpool, a fitness facility, a sundry shop, guest laundry, a business center, and a breakfast and dinner area.
The AVR Homewood Suites Carle Place Property is currently undergoing an approximately $1.236 million ($8,238 per room) Hilton “Take Flight” renovation, which began in July 2018 and, is required by the franchisor to be completed by December 31, 2019. The “Take Flight” renovation includes upgrades to the lobby, public space, complimentary breakfast and evening reception area, meeting space and corridors. According to the AVR Homewood Suites Carle Place Sponsor, $705,240 of the total $1.236 million budget has already been used. The remaining amounts estimated to complete the “Take Flight” renovation have not been reserved with the lender. The “Take Flight” renovation is required under the franchise agreement and the AVR Homewood Suites Carle Place Sponsor provided a completion guarantee related to the completion of the “Take Flight” renovation. In the event the “Take Flight” renovation has not been completed by January 31, 2020, the Mortgage Loan documents provide for the commencement of an excess cash flow sweep. In addition to the “Take Flight” renovation, the AVR Homewood Suites Carle Place Property is expected to undergo a soft goods renovation in 2020, which is budgeted to cost $2.93 million ($19,547 per key). The AVR Homewood Suites Carle Place Borrower reserved $2,932,000 at origination for such soft goods renovation.
Per a third party industry report, the AVR Homewood Suites Carle Place Property’s occupancy, ADR, and RevPAR were 92.8%, $189.73 and $175.99 respectively, during the trailing twelve months ending August 31, 2019, resulting in penetration rates of 107.9%, 123.5% and 133.3% respectively against its competitive set.
More specific information about the AVR Homewood Suites Carle Place Property and the related competitive set is set forth in the following table:
| Historical Occupancy, ADR, RevPAR(1)(2) | |||||||||
| Competitive Set | AVR Homewood Suites Carle Place | Penetration Factor | |||||||
| Year | Occupancy | ADR | RevPAR | Occupancy | ADR | RevPAR | Occupancy | ADR | RevPAR |
| 12/31/2017 | 82.6% | $150.06 | $123.88 | 88.1% | $179.70 | $158.29 | 106.7% | 119.8% | 127.8% |
| 12/31/2018 | 84.7% | $150.99 | $127.90 | 93.3% | $179.04 | $166.99 | 110.1% | 118.6% | 130.6% |
| 8/31/2019 TTM | 85.9% | $153.58 | $131.98 | 92.8% | $189.73 | $175.99 | 107.9% | 123.5% | 133.3% |
Source: Industry Report
| (1) | The competitive set includes the Holiday Inn Westbury Long Island, La Quinta Inn & Suites Garden City, Holiday Inn Express Roslyn Long Island, Hilton Garden Inn Westbury, Hampton Inn Garden City, Hyatt Place Garden City, and Courtyard Westbury Long Island. |
| (2) | The variances between the underwriting, the appraisal and the industry report data with respect to Occupancy, ADR and RevPAR at the AVR Homewood Suites Carle Place Property are attributable to variances in reporting methodologies and/or timing differences. |
The PILOT Agreement. The AVR Homewood Suites Carle Place Property is subject to a 20-year Payment in Lieu of Taxes Agreement (the “PILOT Agreement”) with the Nassau County Industrial Development Agency (the “Agency”) that commenced on November 3, 2011. Under the PILOT Agreement, the AVR Homewood Suites Carle Place Borrower received a temporary sales tax exemption (which expired in April 2013) and is exempt from paying real estate taxes on the AVR Homewood Suites Carle Place Property through the fiscal tax year commencing in 2031. In lieu of real estate taxes, the AVR Homewood Suites Borrower is required to make payments to the Agency in the amounts set forth below. In the event the AVR Homewood Suites Borrower fails to make payments under the PILOT Agreement or (among other things) is otherwise in default under the PILOT Agreement, the Agency has the right to recapture all or a portion of any tax benefits (including any sales tax exemptions) that have accrued to the AVR Homewood Suites Carle Place Borrower prior to the occurrence of such default (the “Recaptured Benefits”), which Recaptured Benefits are subject to the Agency’s senior lien on the AVR Homewood Suites Carle Place Property. The percentage amount of the Recaptured Benefits will decline as the PILOT Agreement term progresses pursuant to a schedule set forth in the PILOT Agreement. During the term of the PILOT Agreement, the AVR Homewood Suites Carle Place Borrower is prohibited from significant modifications to the AVR Homewood Suites Carle Place Property or from changing the franchisor without consent of the Agency. Pursuant to the PILOT Agreement, the AVR Homewood Suites Carle Place Borrower ground leased the AVR Homewood Suites Carle Place Property to the Agency and the Agency subleased the AVR Homewood Suites Carle Place Property back to the AVR Homewood Suites Carle Place Borrower. Upon the expiration of the PILOT Agreement (set to expire on December 31, 2032) and satisfaction of all sums due under the PILOT Agreement, the Agency’s ground leasehold interest in the AVR Homewood Suites Carle Place Property is required to be transferred to the AVR Homewood Suites Carle Place Borrower and the AVR Homewood Suites Carle Place Borrower will be required to pay full unabated taxes. CCRE underwrote taxes based on the 10-year average of payments due under the PILOT Agreement.
| This is not a research report and was not prepared by any Underwriter’s research department. It was prepared by the Underwriters’ sales, trading, banking or other non-research personnel. Please see additional important information and qualifications at the end of this Term Sheet. |
117
| Hospitality – Extended Stay | Loan #10 | Cut-off Date Balance: | $32,500,000 | |
| 40 Westbury Avenue | AVR Homewood Suites Carle Place | Cut-off Date LTV: | 65.0% | |
| Carle Place, NY 11514 | U/W NCF DSCR: | 3.12x | ||
| U/W NOI Debt Yield: | 12.8% |
| PILOT Agreement Payment Schedule | ||
| Fiscal Year: | Payment Amount | |
| 2018 | $384,387 | |
| 2019 | $414,965 | |
| 2020 | $447,206 | |
| 2021 | $487,559 | |
| 2022 | $529,929 | |
| 2023 | $574,392 | |
| 2024 | $621,060 | |
| 2025 | $670,029 | |
| 2026 | $721,333 | |
| 2027 | $775,149 | |
| 2028 | $831,539 | |
| 2029 | $890,602 | |
| 2030 | $952,447 | |
The Market.The AVR Homewood Suites Carle Place Property is located in Carle Place, Nassau County, New York, approximately 27 miles east of New York City. Primary access to the AVR Homewood Suites Carle Place Property is provided by Long Island Expressway, the Northern State Parkway and Jericho Turnpike, as well as the Long Island Rail Road, which provides service to New York City via the Mineola Station. Additionally, the John F. Kennedy International Airport and LaGuardia Airport are within 20 miles of the AVR Homewood Suites Carle Place Property.
Demand at the AVR Homewood Suites Carle Place Property is primarily driven by the commercial, educational, and leisure segments of the market. The Crossways Office Park and Gateway Office Park, which are located within one mile of the AVR Homewood Suites Carle Place Property, house regional offices for a number of major corporations, including Geico, Wells Fargo, CIT Southeast, Weight Watchers, Olympus America, Cablevision, and Transamerica Insurance. Additionally, the Agency has actively increased commercial activity in the area by bringing in new and retaining companies within Nassau County, reporting creation or retention of over 32,917 direct and indirect jobs in Nassau County from 2010 through 2017. Universities near the AVR Homewood Suites Carle Place Property include New York Institute of Technology, Hofstra University, Long Island University Post, Farmingdale State College, Nassau Community College and Molloy College. Demand from these universities is driven by traveling athletic teams and students’ families visiting throughout the term, as well as special events including graduation. Finally, the AVR Homewood Suites Carle Place Property is located near the Roosevelt Field Mall in Garden City, the Tanger Outlets in Deer Park, and the Lesso Mall. Additionally, the AVR Homewood Suites Carle Place Property is located approximately 18 miles from Jones Beach on the Atlantic Coast of Long Island. Jones Beach offers concerts and performances at the Nikon Theater, a major performance venue with a 15,000-seat capacity.
According to the appraisal, in 2018 the Homewood Suites by Hilton Carle Place Property generated approximately 50% of its room nights from commercial demand, 40% from leisure demand, and 10% from meeting and group demand. The top five corporate accounts as of August 2019 at the AVR Homewood Suites Carle Place Property are Ale Solutions, Hotels.com Direct Connect, CRS Temporary House, Independence Anesthesia Service and Ferguson Enterprises, which account for approximately 9.8% of room revenue.
The following table presents certain information relating to the primary competitive properties to the AVR Homewood Suites Carle Place Property:
| Property Competitive Summary(1) | |||||||||
| Property Name | No. of Rooms | Year Built | Meeting Space (SF) | Commercial | Meeting & Group | Leisure | Estimated | Estimated | Estimated |
| 2018 Occupancy(2) | 2018 ADR(2) | 2018 RevPAR(2) | |||||||
| AVR Homewood Suites Carle Place | 150 | 2013 | 4,140 | 50% | 10% | 40% | 93.40% | $182.00 | $169.93 |
| Holiday Inn Westbury-Long Island | 152 | 1973 | 2,000 | 40% | 20% | 40% | 85%-90% | $155-$160 | $135 - $140 |
| La Quinta Inn & Suites Garden City | 129 | 1999 | 3,100 | 40% | 15% | 45% | 80%-85% | $125-$130 | $100 - $105 |
| Holiday Inn Express Roslyn Manhasset | 60 | 1963 | - | 40% | 10% | 50% | 80%-85% | $135-$140 | $110 - $115 |
| Hilton Garden Inn Westbury | 140 | 2003 | 1,380 | 60% | 15% | 25% | 85%-90% | $150 - $155 | $130 - $135 |
| Hampton Inn Garden City | 143 | 2006 | 900 | 60% | 10% | 30% | 85%-90% | $145 - $150 | $125 - $130 |
| Hyatt Place Garden City | 122 | 2010 | 1,147 | 60% | 15% | 25% | 85%-90% | $160 - $165 | $135 - $140 |
| Courtyard Westbury Long Island | 145 | 2016 | 2,208 | 60% | 15% | 25% | 85%-90% | $165 - $170 | $140 - $145 |
Source:Appraisal
| (1) | The variances between the underwriting, the appraisal and the industry report data with respect to Estimated 2018 Occupancy, ADR and RevPAR at the AVR Homewood Suites Carle Place Property are attributable to variances in reporting methodologies and/or timing differences. |
| (2) | Estimated 2018 Occupancy, Estimated 2018 ADR and Estimated 2018 RevPAR are based on the appraisal’s estimated 2018 year-end figures. |
According to the appraisal, a 120-key SpringHill Suites Carle Place Garden City (100% competitive), which is directly adjacent to the AVR Homewood Suites Carle Place Property, recently opened. The SpringHill Suites Carle Place Garden City is owned by an affiliate of the AVR Homewood Suites Carle Place Sponsor. Additionally, a 163-key extended stay Residence Inn Long Island Garden City (100% competitive) is under construction and is expected to be completed in January 2020.
| This is not a research report and was not prepared by any Underwriter’s research department. It was prepared by the Underwriters’ sales, trading, banking or other non-research personnel. Please see additional important information and qualifications at the end of this Term Sheet. |
118
| Hospitality – Extended Stay | Loan #10 | Cut-off Date Balance: | $32,500,000 | |
| 40 Westbury Avenue | AVR Homewood Suites Carle Place | Cut-off Date LTV: | 65.0% | |
| Carle Place, NY 11514 | U/W NCF DSCR: | 3.12x | ||
| U/W NOI Debt Yield: | 12.8% |
Operating History and Underwritten Net Cash Flow. The following table presents certain information relating to the historical operating performance and Underwritten Net Cash Flow at the AVR Homewood Suites Carle Place Property:
| Cash Flow Analysis | |||||||
| 2015 | 2016 | 2017 | 2018 | 8/31/2019 TTM | UW | UW per Room | |
| Occupancy | 87.8% | 88.8% | 90.1% | 93.4% | 92.9% | 92.9% | |
| ADR | $179.96 | $183.36 | $177.62 | $182.60 | $189.97 | $189.97 | |
| RevPAR | $158.07 | $162.88 | $160.04 | $170.48 | $176.46 | $176.46 | |
| Room Revenue | $8,654,113 | $8,941,856 | $8,762,384 | $9,333,957 | $9,661,245 | $9,661,245 | $64,408 |
| Other Departmental Revenue | $241,096 | $288,632 | $232,514 | $206,680 | $219,569 | $219,569 | $1,464 |
| Total Revenue | $8,895,208 | $9,230,488 | $8,994,897 | $9,540,637 | $9,880,813 | $9,880,813 | $65,872 |
| Rooms Expense | $1,668,574 | $1,807,893 | $1,865,004 | $1,970,664 | $2,057,184 | $2,057,184 | $13,715 |
| Other Departmental Expense | $85,223 | $86,884 | $82,427 | $73,842 | $55,369 | $55,369 | $369 |
| Real Estate Taxes(1) | $246,822 | $238,644 | $373,343 | $333,732 | $353,867 | $607,316 | $4,049 |
| Insurance | $23,151 | $58,738 | $63,646 | $67,147 | $69,843 | $76,096 | $507 |
| Other Expenses | $2,688,830 | $2,736,144 | $2,750,688 | $2,820,550 | $2,911,849 | $2,911,857 | $19,412 |
| Total Expenses | $4,712,601 | $4,928,304 | $5,135,108 | $5,265,936 | $5,448,112 | $5,707,822 | $38,052 |
| Net Operating Income | $4,182,608 | $4,302,185 | $3,859,789 | $4,274,701 | $4,432,701 | $4,172,991 | $27,820 |
| FF&E | $0 | $0 | $0 | $0 | $0 | $395,233 | $2,635 |
| Net Cash Flow | $4,182,608 | $4,302,185 | $3,859,789 | $4,274,701 | $4,432,701 | $3,777,759 | $25,185 |
| NOI DSCR | 3.46x | 3.56x | 3.19x | 3.53x | 3.67x | 3.45x | |
| NCF DSCR | 3.46x | 3.56x | 3.19x | 3.53x | 3.67x | 3.12x | |
| NOI Debt Yield | 12.9% | 13.2% | 11.9% | 13.2% | 13.6% | 12.8% | |
| NCF Debt Yield | 12.9% | 13.2% | 11.9% | 13.2% | 13.6% | 11.6% | |
| (1) | The AVR Homewood Suites Carle Place Property is subject to a PILOT Agreement. Real estate taxes are based on the 10-year average of PILOT payments due. See “The Property—The PILOT Agreement.” |
Escrows and Reserves.
Real Estate Taxes - The AVR Homewood Suites Carle Place Mortgage Loan documents provide for an ongoing monthly reserve for real estate taxes in an amount equal to 1/12 of the real estate taxes that the lender estimates will be payable during the next twelve months. In the event the AVR Homewood Suites Carle Place Borrower provides evidence reasonably satisfactory to the lender that all taxes and other charges have been paid prior to the related due date and there is no event of default and/or Cash Trap Period (as defined below) continuing, the requirement for monthly deposits into the tax reserve will be waived.
Insurance - The AVR Homewood Suites Carle Place Mortgage Loan documents provide for an ongoing monthly reserve for insurance in an amount equal to 1/12 of the insurance premiums that the lender estimates will be payable during the next twelve months. In the event the AVR Homewood Suites Carle Place Borrower maintains a blanket insurance policy acceptable to the lender and there is no event of default and/or Cash Trap Period continuing, the requirement for monthly deposits into the insurance reserve will be waived. The AVR Homewood Suites Carle Place Borrower currently maintains an acceptable blanket insurance policy. As such, initial and monthly insurance reserves are currently waived.
FF&E Reserve -The AVR Homewood Suites Carle Place Mortgage Loan documents provide for an upfront reserve of $2,932,000 for a planned soft good renovation. Additionally, the AVR Homewood Suites Carle Place Borrower is required to deposit into an FF&E reserve, on a monthly basis, 1/12 of 4% of gross income for the prior calendar year (initially $32,936).
Lockbox and Cash Management. The AVR Homewood Suites Carle Place Property is structured with a hard lockbox and springing cash management. The AVR Homewood Suites Carle Place Borrower is required to direct credit card companies to deposit credit card receipts with respect to the AVR Homewood Suites Carle Place Property directly into the lender controlled lockbox account. Any other amounts received by the AVR Homewood Suites Carle Place Borrower or property manager with respect to the AVR Homewood Suites Carle Place Property are required to be deposited into the lockbox account within two business days of receipt. In the absence of a Cash Trap Period, amounts in the lockbox account will be transferred to a borrower controlled account. In place cash management and a full excess cash flow sweep are required upon the commencement of a Cash Trap Period during which time, all amounts will remain in a lender controlled account and be applied to pay debt service and reserves as required under the AVR Homewood Suites Carle Place Mortgage Loan documents and any excess cash will be retained in a lender controlled account during the continuation of such Cash Trap Period.
A “Cash Trap Period” will commence upon:
| (a) | the occurrence of an event of default and will continue until no event of default is continuing; or |
| (b) | the bankruptcy of the AVR Homewood Suites Carle Place Borrower, AVR Homewood Suites Carle Place Sponsor, or the property manager and continue until, in the case of the bankruptcy of the property manager only, the AVR Homewood Suites Carle Place Borrower replaces such property manager in accordance with the requirements of the loan documents; or |
| This is not a research report and was not prepared by any Underwriter’s research department. It was prepared by the Underwriters’ sales, trading, banking or other non-research personnel. Please see additional important information and qualifications at the end of this Term Sheet. |
119
| Hospitality – Extended Stay | Loan #10 | Cut-off Date Balance: | $32,500,000 | |
| 40 Westbury Avenue | AVR Homewood Suites Carle Place | Cut-off Date LTV: | 65.0% | |
| Carle Place, NY 11514 | U/W NCF DSCR: | 3.12x | ||
| U/W NOI Debt Yield: | 12.8% |
| (c) | absent the continuance of a PIP Period (as defined below), the failure of the AVR Homewood Suites Carle Place Borrower to maintain a debt service coverage ratio of at least 2.40x for two consecutive calendar quarters and will continue until, absent the continuance of a PIP Period, the debt service coverage ratio is at least 2.45x for two consecutive calendar quarters; or |
| (d) | during the continuance of a PIP Period, the failure of the AVR Homewood Suites Carle Place Borrower to maintain a debt service coverage ratio of at least 2.30x for two consecutive calendar quarters and will continue until, during the continuance of a PIP Period, the debt service coverage ratio is at least 2.35x for two consecutive calendar quarters; or |
| (e) | the earlier of (A) twelve months prior to the expiration of the franchise agreement or (B) such time as the AVR Homewood Suites Carle Place Borrower receives notice from the franchisor of termination of the franchise agreement and will continue until the AVR Homewood Suites Carle Place Borrower has (a) either (x) entered into a replacement franchise agreement satisfactory to the lender or (y) has delivered reasonably satisfactory evidence to the lender that the franchise agreement has been renewed or extended for a term of not less than three years past the maturity date of the AVR Homewood Suites Carle Place Mortgage Loan or (b) delivered to the lender an estoppel certificate from the franchisor (or a qualified franchisor under the replacement franchise agreement) stating that (i) the franchise agreement or replacement franchise agreement is in full force and effect, (ii) the AVR Homewood Suites Carle Place Borrower is not in default of the franchise agreement or replacement franchise agreement, and (iii) all sums due to the franchisor under the franchise agreement or replacement franchise agreement have been paid in full, and (c) if either the (x) replacement franchise agreement or (y) the renewal or extension of the existing franchise agreement requires the AVR Homewood Suites Carle Place Borrower to enter into a PIP, the total cost of the PIP has been deposited into a reserve with the lender; or |
| (f) | the failure of the AVR Homewood Suites Carle Place Borrower to complete the “Take Flight” renovation plan on or prior to January 31, 2020 and will continue until the completion of the “Take Flight” renovation plan and the AVR Homewood Suites Carle Place Borrower provides the lender with written confirmation from the franchisor that the AVR Homewood Suites Carle Place Borrower is not in default under the franchise agreement (and no other Cash Trap Period is then continuing). |
A “PIP Period” will commence on the date that the AVR Homewood Suites Carle Place Borrower provides evidence reasonably satisfactory to the lender that the AVR Homewood Suites Carle Place Borrower has commenced PIP Work (as defined below) and will continue until the earlier to occur of (i) the date the AVR Homewood Suites Carle Place Borrower is required to complete the PIP Work pursuant to any PIP (as may be extended subject to the franchisor’s written approval) or (ii) the date that the AVR Homewood Suites Carle Place Borrower completes the PIP Work.
“PIP Work” means either (x) all of the renovations, replacements, alterations, repair and replacement of the furniture, fixtures and equipment at, in or used in the operation of the AVR Homewood Suites Carle Place Property required pursuant to any property improvement plan (“PIP”) or (y) all of the renovations, replacements, alterations, repair and replacement of the furniture, fixtures and equipment at, in or used in the operation of the AVR Homewood Suites Carle Place Property that requires at least 20 hotel rooms at the AVR Homewood Suites Carle Place Property to be kept offline at the same time during any given period during such work. For the avoidance of doubt, the “Take Flight” renovation work does not constitute PIP Work.
Additional Secured Indebtedness (not including trade debts). None.
Mezzanine Loan and Preferred Equity.Not permitted.
Release of Property. Not permitted.
Ground Lease. None, except see “The Property—The PILOT Agreement” for a description of the ground lease/sublease structure.
Letter of Credit.None.
Terrorism Insurance. The AVR Homewood Suites Carle Place Borrower is required to obtain insurance against acts of terrorism for loss resulting from perils and acts of terrorism in amounts and with terms and conditions applicable to commercial property, general liability, business income and umbrella liability insurance required pursuant to the AVR Homewood Suites Carle Place Mortgage Loan documents.
| This is not a research report and was not prepared by any Underwriter’s research department. It was prepared by the Underwriters’ sales, trading, banking or other non-research personnel. Please see additional important information and qualifications at the end of this Term Sheet. |
120
(THIS PAGE INTENTIONALLY LEFT BLANK)
121
| Mortgage Loan No. 11 – 801 South Chevy Chase Drive |
| Mortgage Loan Information | Property Information | ||||||
| Mortgage Loan Seller: | SMC | Single Asset/Portfolio: | Single Asset | ||||
| Credit Assessment (KBRA/Fitch/S&P): | NR/NR/NR | Location: | Glendale, CA 91205 | ||||
| Original Balance: | $32,000,000 | General Property Type: | Office | ||||
| Cut-off Date Balance: | $32,000,000 | Detailed Property Type: | Medical | ||||
| % of Initial Pool Balance: | 3.1% | Title Vesting: | Fee | ||||
| Loan Purpose: | Refinance | Year Built/Renovated: | 1976/N/A | ||||
| Sponsors: | Ara Tavitian; Tavitian Family Trust | Size: | 98,999 SF | ||||
| U/A/D 7/27/99 | Cut-off Date Balance per SF: | $323 | |||||
| Guarantors: | Ara Tavitian; Tavitian Family Trust | Maturity Date Balance per SF: | $323 | ||||
| U/A/D 7/27/99 | Property Manager: | Elite Property Management, LLC | |||||
| Mortgage Rate: | 3.3100% | ||||||
| Note Date: | 10/8/2019 | ||||||
| First Payment Date: | 12/6/2019 | ||||||
| Maturity Date: | 11/6/2029 | ||||||
| Original Term to Maturity: | 120 months | ||||||
| Original Amortization Term: | 0 months | Underwriting and Financial Information | |||||
| IO Period: | 120 months | UW NOI: | $3,236,435 | ||||
| Seasoning: | 0 months | UW NOI Debt Yield: | 10.1% | ||||
| Prepayment Provisions: | LO (24); DEF (92); O (4) | UW NOI Debt Yield at Maturity: | 10.1% | ||||
| Lockbox/Cash Mgmt Status: | Springing/Springing | UW NCF DSCR: | 2.86x | ||||
| Additional Debt Type: | N/A | Most Recent NOI: | $3,302,855 (7/31/2019 TTM) | ||||
| Additional Debt Balance: | N/A | 2nd Most Recent NOI: | $2,940,084 (12/31/2018) | ||||
| Future Debt Permitted (Type): | No (N/A) | 3rd Most Recent NOI(3): | $3,776,210 (12/31/2017) | ||||
| Reserves | Most Recent Occupancy: | 87.7% (9/1/2019) | |||||
| Type | Initial | Monthly | Cap | 2nd Most Recent Occupancy: | 87.5% (11/30/2018) | ||
| RE Tax: | $50,751 | $12,688 | N/A | 3rd Most Recent Occupancy(3): | 96.8% (11/30/2017) | ||
| Insurance(1): | $0 | Springing | N/A | Appraised Value (as of): | $55,000,000 (9/12/2019) | ||
| Recurring Replacements: | $0 | $1,650 | N/A | Appraised Value per SF: | $556 | ||
| TI/LC: | $0 | $12,375 | $446,000 | Cut-off Date LTV Ratio: | 58.2% | ||
| Deferred Maintenance: | $285,935 | $0 | N/A | Maturity Date LTV Ratio: | 58.2% | ||
| Major Tenant Reserve(2): | $0 | Springing | (2) | ||||
| Sources and Uses | |||||||
| Sources | Proceeds | % of Total | Uses | Proceeds | % of Total | ||
| Loan Amount: | $32,000,000 | 100.0% | Loan Payoff: | $27,472,074 | 85.9 | % | |
| Return of Equity: | $3,753,670 | 11.7 | % | ||||
| Closing Costs: | $437,571 | 1.4 | % | ||||
| Reserves: | $336,686 | 1.1 | % | ||||
| Total Sources: | $32,000,000 | 100.0% | Total Uses: | $32,000,000 | 100.0 | % | |
| (1) | The 801 South Chevy Chase Drive Borrower (as defined below) is required to reserve monthly 1/12 of the estimated annual insurance premiums (unless waived due to a blanket policy, which is currently in place). |
| (2) | Following the occurrence of a Major Tenant Trigger Event Period (as defined below), all excess cash flow up to an amount equal to the product of (i) $70 multiplied by (ii) the square footage of the applicable lease(s) of the applicable Major Tenant (as defined below) (the “Major Tenant Space Reserve Cap”) is required to be transferred to a tenant improvement and leasing commissions reserve (the “Major Tenant Space Reserve”) and will be available to the 801 South Chevy Chase Drive Borrower to pay tenant improvements and leasing commissions related to extending the lease(s) of the Major Tenant or signing a satisfactory replacement tenant. Once funds on deposit in the Major Tenant Space Reserve equal the Major Tenant Space Reserve Cap, then (x) provided no other sweep event period then exists, all excess cash flow is required to be released to the 801 South Chevy Chase Drive Borrower or (y) if another sweep event period then exists, all excess cash flow is required to be transferred to an excess cash flow reserve. To the extent that no sweep event period is continuing, all excess cash flow funds are required to be disbursed to the 801 South Chevy Chase Drive Borrower. A “Major Tenant Trigger Event Period” means that CCHC (as defined below) or a replacement tenant that leases at least 10,000 SF at the 801 South Chevy Chase Drive Property (as defined below) (a “Major Tenant”) (i) defaults under its lease(s) that covers in the aggregate at least 10,000 SF at the 801 South Chevy Chase Drive Property, (ii) goes dark or otherwise fails to occupy at least 10,000 SF at the 801 South Chevy Chase Drive Property or gives notice of its intention to do the foregoing, (iii) gives notice to vacate or vacates at least 10,000 SF at the 801 South Chevy Chase Drive Property, (iv) becomes a debtor in any bankruptcy or other insolvency proceeding, (v) terminates its lease which in the aggregate covers at least 10,000 SF at the 801 South Chevy Chase Drive Property or (vi) fails to renew or extend the term of its lease or leases, which in the aggregate covers at least 10,000 SF, for a period of five years, either (a) on terms and conditions stated in its respective lease or (b) on terms reasonably satisfactory to the lender at least 12 months prior to its lease expiration. Such Major Tenant Trigger Event Period will terminate: (a) with regard to clause (i), upon the Major Tenant curing such default and no other default has occurred under such lease for two consecutive quarters; (b) with regard to clauses (ii), (iii) and (v), the Major Tenant has rescinded such notice and/or resumed its customary business operations in at least 10,000 SF of its leased space for at least two calendar quarters; (c) with regard to clause (iv), the lease for the Major Tenant is affirmed in such proceeding and the related tenant is discharged from bankruptcy such that no proceedings are ongoing; (d) with regard to clause (vi), the related tenant exercises the applicable extension option or enters into a new lease on terms and conditions satisfactory to the lender; and (e) with regard to clauses (i) through (vi), a Major Tenant Re-Tenanting Event (as defined below) has occurred. A "Major Tenant Re-Tenanting Event" means that: (i) the CCHC space is leased pursuant to a replacement lease having a term of at least five years for the related space, as applicable, (ii) such replacement tenant has taken occupancy of the leased premises, is paying full unabated rent and is open for business and all tenant improvements costs and leasing commissions have been paid and (iii) such replacement tenant has delivered a signed estoppel certificate reasonably satisfactory to the lender. |
| (3) | In late 2017, Adventist Health Physicians (16.5% of the NRA) opted to vacate its space at the 801 South Chevy Chase Drive Property after purchasing its own building. A majority of the Adventist Health Physicians space has since been leased to new tenants. |
| This is not a research report and was not prepared by any Underwriter’s research department. It was prepared by the Underwriters’ sales, trading, banking or other non-research personnel. Please see additional important information and qualifications at the end of this Term Sheet. |
122
| Office – Medical | Loan #11 | Cut-off Date Balance: | $32,000,000 | |
| 801 South Chevy Chase Drive | 801 South Chevy Chase Drive | Cut-off Date LTV: | 58.2% | |
| Glendale, CA 91205 | U/W NCF DSCR: | 2.86x | ||
| U/W NOI Debt Yield: | 10.1% |
The Mortgage Loan. The eleventh largest mortgage loan (the “801 South Chevy Chase Drive Mortgage Loan”) is evidenced by a promissory note in the original principal balance of $32,000,000 and secured by a first priority fee mortgage on a 98,999 SF medical office building located in Glendale, California (the “801 South Chevy Chase Drive Property”). The proceeds of the 801 South Chevy Chase Drive Mortgage Loan were used to pay off a prior loan, return equity to the borrower sponsors, pay closing costs and fund reserves.
The Borrower and the Borrower Sponsors. The borrower is CCMP-DE, LLC, a Delaware limited liability company, structured to be bankruptcy-remote with at least one independent director (the “801 South Chevy Chase Drive Borrower”). The borrower sponsors and non-recourse carveout guarantors of the 801 South Chevy Chase Drive Mortgage Loan are Ara Tavitian and the Tavitian Family Trust U/A/D 7/27/99. Ara Tavitian, along with his wife, collectively own approximately 51% of the 801 South Chevy Chase Borrower. Ara Tavitian purchased the 801 South Chevy Chase Drive Property in 2004. Ara Tavitian owns 32 buildings totaling approximately 2.6 million SF of creative and medical office space throughout the Los Angeles market.
The Property. The 801 South Chevy Chase Drive Property is comprised of a two-story medical office building containing 98,999 SF of office space and 351 surface parking spaces resulting in a parking ratio of 3.5 spaces per 1,000 SF. The 801 South Chevy Chase Drive Property is located on a full city block bound by Windsor Road, South Chevy Chase Drive, East Garfield Avenue and South Adams Street. The 801 South Chevy Chase Drive Property is located within five miles from four hospitals: Dignity Health - Glendale Memorial Hospital, Kaiser Permanente, Prohealth - Glendale Occupational Medical Group and Adventist Health Glendale.
The 801 South Chevy Chase Drive Property is currently 87.7% occupied. The 801 South Chevy Chase Drive Property has maintained an average occupancy of 94.1% since 2014. In late 2017, Adventist Health Physicians (16.5% of the NRA) opted to vacate as the tenant was purchasing its own building, and the majority of the tenant’s prior premises have since been leased to new tenants.
Major Tenants.
Comprehensive Community Health Centers Inc. (41,493 SF, 41.9% of NRA, 52.4% of underwritten base rent). Comprehensive Community Health Centers Inc. (“CCHC”)leases seven suites at the 801 South Chevy Chase Drive Property, under three separate leases with expiration dates in October 2023 (17,656 SF), April 2026 (16,608 SF) and September 2026 (7,229 SF). CCHC is a Federally Qualified Health Center (a community-based health care provider that receives funds from the Health Resources & Services Administration Center Program to provide preliminary care services in underserved areas) and a California Non-Profit Public Benefit Corporation (which means it distinguishes itself from a mutual benefit corporation by being organized for the general public benefit, rather than for the interests of its members). CCHC has grown in health service visits from 45,000 in 2004 to over 127,000 in 2016. CCHC operates five community health centers in metropolitan Los Angeles and the San Fernando Valley with locations in Glendale, Eagle Rock, Highland Park, North Hollywood, and Sunland. CCHC provides the following services: primary care, behavioral health, dental services, optometry, pediatric care, prenatal care and family planning. CCHC has occupied space at the 801 South Chevy Chase Drive Property since 2006, expanded in 2013 and 2016, and most recently extended two of its three leases in 2018 and 2019. The third lease is in year six of its original 10 year term and has one 10-year renewal option remaining. CCHC’s additional leased spaces have no renewal options remaining.
Family Practice of Glendale, Inc. (13,655 SF, 13.8% of NRA, 12.3% of underwritten base rent).Family Practice of Glendale, Inc. is a healthcare provider that caters to all ages including newborns, children, adolescents, pregnant women and the elderly. Family Practice of Glendale, Inc. has been a tenant at the 801 South Chevy Chase Drive Property since 2014. The Family Practice of Glendale, Inc. lease was renewed in April 2019, expires in April 2024 and has one five-year renewal option.
Chevy Chase Ambulatory Center (9,265 SF, 9.4% of NRA, 11.9% of underwritten base rent). Chevy Chase Ambulatory Center is a surgical center. Chevy Chase Ambulatory Center has been a tenant at the 801 South Chevy Chase Drive Property since 2011. The Chevy Chase Ambulatory Center lease was renewed in October 2019, expires in September 2029 and has one five-year renewal option. Chevy Chase Ambulatory Center is affiliated with the borrower sponsors.
The following table presents certain information relating to the tenants at the 801 South Chevy Chase Drive Property:
| Tenant Summary(1) | |||||||||||||
| Tenant Name | Credit Rating (S&P/Moody’s/Fitch) | Tenant SF | Approx. % of Total SF | Annual UW Rent | % of Total Annual UW Rent | Annual UW Rent PSF | Lease Expiration | Renewal Options | Termination Options | ||||
| CCHC(2) | NR/NR/NR | 41,493 | 41.9% | $2,086,590 | 52.4% | $50.29 | Various | (3) | N | ||||
| Family Practice of Glendale, Inc. | NR/NR/NR | 13,655 | 13.8% | $491,580 | 12.3% | $36.00 | 4/30/2024 | 1 x 5 Yrs | N | ||||
| Chevy Chase Ambulatory Center(4) | NR/NR/NR | 9,265 | 9.4% | $472,515 | 11.9% | $51.00 | 9/30/2029 | 1 x 5 Yrs | N | ||||
| Subtotal/Wtd. Avg. | 64,413 | 65.1% | $3,050,685 | 76.6% | $47.36 | ||||||||
| Other Tenants | 22,391 | 22.6% | $929,904 | 23.4% | $41.53 | ||||||||
| Vacant Space | 12,195 | 12.3% | $0 | 0.0% | $0.00 | ||||||||
| Total/Wtd. Avg. | 98,999 | 100.0% | $3,980,589 | 100.0% | $45.86 | ||||||||
| (1) | Information is based on the underwritten rent roll dated September 1, 2019. |
| (2) | CCHC leases seven suites under three separate leases (41,493 SF at a blended Annual UW Rent PSF of $50.29) which expire in October 2023 (17,656 SF; $48.90 PSF), April 2026 (16,608 SF; $64.78 PSF) and September 2026 (7,229 SF; $39.72 PSF). |
| (3) | CCHC leases 17,656 SF with a lease expiration date in October 2023 and has one 10-year renewal option remaining for that space. CCHC’s additional leased space has no renewal options remaining. |
| (4) | Chevy Chase Ambulatory Center is affiliated with the borrower sponsors. |
| This is not a research report and was not prepared by any Underwriter’s research department. It was prepared by the Underwriters’ sales, trading, banking or other non-research personnel. Please see additional important information and qualifications at the end of this Term Sheet. |
123
| Office – Medical | Loan #11 | Cut-off Date Balance: | $32,000,000 | |
| 801 South Chevy Chase Drive | 801 South Chevy Chase Drive | Cut-off Date LTV: | 58.2% | |
| Glendale, CA 91205 | U/W NCF DSCR: | 2.86x | ||
| U/W NOI Debt Yield: | 10.1% |
The following table presents certain information relating to the lease rollover schedule at the 801 South Chevy Chase Drive Property:
| Lease Rollover Schedule(1)(2) | ||||||||
| Year | # of Leases Rolling | SF Rolling | UW Rent PSF Rolling | Approx. % of Total SF Rolling | Approx. Cumulative % of SF Rolling | Total UW Rent Rolling | Approx. % of Total Rent Rolling | Approx. Cumulative % of Total Rent Rolling |
| MTM | 0 | 0 | $0.00 | 0.0% | 0.0% | $0 | 0.0% | 0.0% |
| 2019 | 1 | 351 | $25.88 | 0.4% | 0.4% | $9,085 | 0.2% | 0.2% |
| 2020 | 4 | 5,717 | $36.79 | 5.8% | 6.1% | $210,320 | 5.3% | 5.5% |
| 2021 | 2 | 5,110 | $34.05 | 5.2% | 11.3% | $174,000 | 4.4% | 9.9% |
| 2022 | 0 | 0 | $0.00 | 0.0% | 11.3% | $0 | 0.0% | 9.9% |
| 2023 | 2 | 18,645 | $42.57 | 18.8% | 30.1% | $793,751 | 19.9% | 29.8% |
| 2024 | 3 | 17,935 | $38.49 | 18.1% | 48.2% | $690,389 | 17.3% | 47.2% |
| 2025 | 0 | 0 | $0.00 | 0.0% | 48.2% | $0 | 0.0% | 47.2% |
| 2026 | 4 | 29,781 | $54.75 | 30.1% | 78.3% | $1,630,530 | 41.0% | 88.1% |
| 2027 | 0 | 0 | $0.00 | 0.0% | 78.3% | $0 | 0.0% | 88.1% |
| 2028 | 0 | 0 | $0.00 | 0.0% | 78.3% | $0 | 0.0% | 88.1% |
| 2029 | 1 | 9,265 | $51.00 | 9.4% | 87.7% | $472,515 | 11.9% | 100.0% |
| 2030 & Beyond | 0 | 0 | $0.00 | 0.0% | 87.7% | $0 | 0.0% | 100.0% |
| Vacant | 0 | 12,195 | $0.00 | 12.3% | 100.0% | $0 | 0.0% | 100.0% |
| Total/Wtd. Avg. | 17 | 98,999 | $45.86 | 100.0% | $3,980,589 | 100.0% | ||
| (1) | Information is based on the underwritten rent roll dated September 1, 2019. |
| (2) | Certain tenants may have lease termination options that are exercisable prior to the stated expiration date of the subject lease or leases which are not considered in the lease rollover schedule. |
The Market. The 801 South Chevy Chase Drive Property is located in the southern portion of Glendale, approximately 1.1 miles west of Glendale Freeway. The city of Glendale is located approximately 7.5 miles north of downtown Los Angeles. The 801 South Chevy Chase Drive Property is located in a dense infill area. Residential development is the largest component of land use in the city of Glendale. Glendale has a high percentage of multifamily residential housing, with a significant portion of the housing stock constructed in the 1980s. The employment base within the city of Glendale is strongly influenced by the entertainment industry. According to the appraisal, the Media District within the neighboring city of Burbank includes Warner Bros. Studio and Warner Bros. Ranch, Walt Disney Studios and NBC Studios. These studios are three of the largest motion picture/television companies in the Los Angeles area. In addition to employment at the actual studios, there are numerous sound studios, production offices, and supporting services in and around Burbank and Glendale.
According to the appraisal, the 801 South Chevy Chase Drive Property is located in the Los Angeles County office market. As of the second quarter of 2019, average asking rent was $42.72 PSF, vacancy was 14.3%, and year-to-date leasing activity totaled 477,138 SF.
The 801 South Chevy Chase Drive Property is located in the Glendale office submarket of the Los Angeles County office market. For the second quarter 2019, the submarket had total inventory of approximately 6.6 million SF with a vacancy rate of 16.1% and average asking rents of $37.80 PSF.
According to the appraisal, the estimated 2019 population within a one-, three- and five-mile radius of the 801 South Chevy Chase Drive Property was 57,561, 262,648 and 626,449, respectively. The 2019 average household income within the same radii was $67,147, $92,535 and $94,420, respectively.
The following table presents the appraiser’s market rent conclusions:
| Market Rent Summary | |||||
| Above Average Build Out; <2,500 SF | Average Build Out; >5,000 SF | Average Build Out; <5,000 SF | Below Average Build Out; <2,500 SF | Med/SurgiCenter | |
| Property SF | 5,086 | 55,148 | 28,349 | 1,151 | 9,265 |
| Market Rent (PSF) | $60.00 | $54.00 | $45.00 | $36.00 | $51.00 |
| Lease Term (Years) | 5 | 5 | 5 | 5 | 5 |
| Lease Type (Reimbursements) | Gross | Gross | Gross | Gross | NNN |
| Rent Increase Projection | 3.0% per annum | 3.0% per annum | 3.0% per annum | 3.0% per annum | 3.0% per annum |
| Tenant Improvements (New Tenant) (PSF) | $15.00 | $15.00 | $15.00 | $15.00 | $15.00 |
| Tenant Improvements (Renewal) (PSF) | $5.00 | $5.00 | $5.00 | $5.00 | $5.00 |
Source:Appraisal
| This is not a research report and was not prepared by any Underwriter’s research department. It was prepared by the Underwriters’ sales, trading, banking or other non-research personnel. Please see additional important information and qualifications at the end of this Term Sheet. |
124
| Office – Medical | Loan #11 | Cut-off Date Balance: | $32,000,000 | |
| 801 South Chevy Chase Drive | 801 South Chevy Chase Drive | Cut-off Date LTV: | 58.2% | |
| Glendale, CA 91205 | U/W NCF DSCR: | 2.86x | ||
| U/W NOI Debt Yield: | 10.1% |
The following table presents certain information relating to comparable office leases for the 801 South Chevy Chase Drive Property:
| Comparable Leases Summary | |||||||||
| Property Name/Location | Year Built/ Renovated | Total GLA (SF) | Occ. % | Distance from Subject | Tenant Name | Lease Date/Term (Mos.) | Lease Area (SF) | Annual Base Rent PSF | Lease Type |
801 South Chevy Chase Drive 801 South Chevy Chase Drive Glendale, California | 1976/N/A | 98,999(1) | 87.7%(1) | - | - | - | - | - | - |
Glendale Memorial Medical Pavilion 222 West Eulalia Street Glendale, California | 2002/N/A | 57,600 | 97% | 1.6 miles | Asking USC | Dec. 2018 / 36 Mar. 2017 / 60 | 1,782 3,535 | $35.40 $35.40 | MG MG |
1100-1104 East Broadway 1100-1104 East Broadway Glendale, California | 1990/N/A | 14,290 | 100.0% | 0.8 miles | Medical Tenant Medical Tenant Hospice of Contra Costa | Aug. 2019 / 60 Feb. 2019 / 60 Sep. 2018 / 36 | 1,450 1,350 1,100 | $35.40 $34.00 $33.84 | MG MG MG |
Chevy Chase Medical Center 1577 East Chevy Chase Drive Glendale, California | 1976/2013 | 33,284 | 93% | 1.5 miles | Asking (Medical) Medical Tenant | Sep. 2019 / 60 Apr. 2019 / 60 | 2,100 980 | $42.00 $35.40 | MG MG |
California Medical Building 55 East California Boulevard Pasadena, California | 1983/N/A | 33,638 | 73% | 7.0 miles | Asking (Medical) | Dec. 2018 / 36 | 3,731 | $41.40 | Full Service |
Pasadena Medical Office Building 1017-1035 South Fair Oaks Avenue Pasadena, California | 1924/1984 | 23,687 | 100% | 7.3 miles | Confidential | May 2019 / 180 | 23,687 | $33.00 | NNN |
Arcadia Medical Office 612 West Duarte Road Arcadia, California | 1965/N/A | 57,653 | 91% | 13.8 miles | Listing Medical Office | Feb. 2019 / N/A Dec. 2018 / 60 | 932 848 | $34.80 $34.80 | MG Full Service |
Tarzana Medical Atrium 5411 Etiwanda Avenue Tarzana, California | 2017/N/A | 90,000 | 63% | 18.8 miles | Provident Health | Oct. 2017 / 120 | 30,000 | $46.80 | Full Service |
Source:Appraisal
| (1) | Information is based on the underwritten rent roll dated September 1, 2019. |
Operating History and Underwritten Net Cash Flow.The following table presents certain information relating to the historical operating performance and Underwritten Net Cash Flow at the 801 South Chevy Chase Drive Property:
| Cash Flow Analysis | ||||||
| 2016 | 2017(1) | 2018 | 7/31/2019 TTM | UW | UW PSF | |
| Gross Potential Rent(2) | $4,008,578 | $3,582,004 | $3,608,425 | $3,987,814 | $4,529,364 | $45.75 |
| Reimbursements | $577,865 | $562,220 | $505,891 | $499,691 | $658,611 | $6.65 |
| Other Income | $4,083 | $2,036,308 | $50,927 | $40,171 | $40,171 | $0.41 |
| Vacancy and Concessions | $0 | $0 | $0 | $0 | ($548,775) | ($5.54) |
| Effective Gross Income | $4,590,526 | $6,180,532 | $4,165,243 | $4,527,676 | $4,679,371 | $47.27 |
| Taxes | $137,701 | $141,793 | $145,569 | $146,805 | $355,810 | $3.59 |
| Insurance | $21,692 | $21,833 | $21,840 | $23,991 | $28,531 | $0.29 |
| Other Operating Expenses | $999,922 | $2,240,695 | $1,057,750 | $1,054,025 | $1,058,595 | $10.69 |
| Total Operating Expenses | $1,159,314 | $2,404,322 | $1,225,158 | $1,224,821 | $1,442,936 | $14.58 |
| Net Operating Income | $3,431,213 | $3,776,210 | $2,940,084 | $3,302,855 | $3,236,435 | $32.69 |
| TI/LC | $0 | $0 | $0 | $0 | $148,499 | $1.50 |
| Capital Expenditures | $0 | $0 | $0 | $0 | $19,800 | $0.20 |
| Net Cash Flow | $3,431,213 | $3,776,210 | $2,940,084 | $3,302,855 | $3,068,137 | $30.99 |
| Occupancy %(3) | 91.5% | 96.8% | 87.5% | 87.7% | 89.4% | |
| NOI DSCR | 3.20x | 3.52x | 2.74x | 3.08x | 3.01x | |
| NCF DSCR | 3.20x | 3.52x | 2.74x | 3.08x | 2.86x | |
| NOI Debt Yield | 10.7% | 11.8% | 9.2% | 10.3% | 10.1% | |
| NCF Debt Yield | 10.7% | 11.8% | 9.2% | 10.3% | 9.6% | |
| (1) | The increase in Other Income and Other Operating Expenses in 2017 was related to a one-time insurance proceeds and repairs costs related to a pipe bursting. Additionally, in late 2017 Adventist Health Physicians (16.5% of the NRA) opted to vacate its space at the 801 South Chevy Chase Drive Property after purchasing its own building. A majority of Adventist Health Physicians’ space has since been leased to new tenants. |
| (2) | UW Gross Potential Rent is based on the September 1, 2019 rent roll, with rent steps taken through April 2020 of $29,164. |
| (3) | Occupancy is shown as of November 30 of the corresponding year. 7/31/2019 TTM Occupancy is as of September 1, 2019. UW Occupancy represents underwritten economic occupancy. |
| This is not a research report and was not prepared by any Underwriter’s research department. It was prepared by the Underwriters’ sales, trading, banking or other non-research personnel. Please see additional important information and qualifications at the end of this Term Sheet. |
125
| Office – Medical | Loan #11 | Cut-off Date Balance: | $32,000,000 | |
| 801 South Chevy Chase Drive | 801 South Chevy Chase Drive | Cut-off Date LTV: | 58.2% | |
| Glendale, CA 91205 | U/W NCF DSCR: | 2.86x | ||
| U/W NOI Debt Yield: | 10.1% |
Release of Property. At any time following the expiration of the lockout period so long as no event of default or Sweep Event Period (as defined in the loan documents) is occurring, the 801 South Chevy Chase Drive Borrower may obtain the release of an improved parcel of land that is currently part of the 801 South Chevy Chase Drive Property (the “Parcel”). The Parcel is not included in the 801 South Chevy Chase Drive Property’s appraised value or underwritten income. As a condition to the release of the Parcel, the lender must receive satisfactory evidence that: (i) a parking agreement has been recorded against the 801 South Chevy Chase Drive Property and the Parcel which provides for access by and the use of the tenants and guests of the 801 South Chevy Chase Drive Property to the parking on the Parcel, which agreement is required to be perpetual and run with the land and must not require the 801 South Chevy Chase Drive Property's tenants or guests to pay for the use of such parking, nor the 801 South Chevy Chase Drive Borrower to pay any costs towards the construction or maintenance thereof; (ii) if the Parcel is to be transferred to an affiliate of the 801 South Chevy Chase Drive Borrower, such affiliate's plans for the development of the Parcel will not include the construction of improvements to be used for medical office, and will include structured parking with sufficient spaces to allow the 801 South Chevy Chase Drive Property's tenants to utilize at least the same number of spaces as are on the Parcel; and (iii) the 801 South Chevy Chase Drive Borrower has a reasonably acceptable and feasible plan for substitute parking arrangements for the 801 South Chevy Chase Drive Property's tenants during the construction of the improvements on the Parcel for which such tenants must not be required to pay any fee, and the tenants are provided the use of such substitute parking.
| This is not a research report and was not prepared by any Underwriter’s research department. It was prepared by the Underwriters’ sales, trading, banking or other non-research personnel. Please see additional important information and qualifications at the end of this Term Sheet. |
126
(THIS PAGE INTENTIONALLY LEFT BLANK)
127
| Mortgage Loan No. 12 – Mosby Poinsett |
| Mortgage Loan Information | Property Information | |||||||
| Mortgage Loan Seller: | MSMCH | Single Asset/Portfolio: | Single Asset | |||||
| Credit Assessment (KBRA/Fitch/S&P): | NR/NR/NR | Location: | Greenville, SC 29609 | |||||
| Original Balance: | $29,950,000 | General Property Type: | Multifamily | |||||
| Cut-off Date Balance: | $29,950,000 | Detailed Property Type: | Garden | |||||
| % of Initial Pool Balance: | 2.9% | Title Vesting: | Fee | |||||
| Loan Purpose: | Refinance | Year Built/Renovated: | 2017/N/A | |||||
| Sponsor: | Middleburg Real Estate Partners LLC | Size: | 288 Units | |||||
| Guarantor: | Thistle Investments, LLC | Cut-off Date Balance per Unit: | $103,993 | |||||
| Mortgage Rate: | 3.8250% | Maturity Date Balance per Unit: | $103,993 | |||||
| Note Date: | 9/30/2019 | Property Manager: | Middleburg Management, LLC | |||||
| First Payment Date: | 11/1/2019 | (borrower-related) | ||||||
| Maturity Date: | 10/1/2029 | |||||||
| Original Term to Maturity: | 120 months | Underwriting and Financial Information | ||||||
| Original Amortization Term: | 0 months | UW NOI: | $2,282,913 | |||||
| IO Period: | 120 months | UW NOI Debt Yield: | 7.6% | |||||
| Seasoning: | 1 month | UW NOI Debt Yield at Maturity: | 7.6% | |||||
| Prepayment Provisions: | LO (25); DEF (91); O (4) | UW NCF DSCR: | 1.92x | |||||
| Lockbox/Cash Mgmt Status: | Springing/Springing | Most Recent NOI: | $1,808,527 (8/31/2019 TTM) | |||||
| Additional Debt Type: | N/A | 2nd Most Recent NOI: | $755,938 (12/31/2018) | |||||
| Additional Debt Balance: | N/A | 3rd Most Recent NOI: | ($22,799) (12/31/2017) | |||||
| Future Debt Permitted (Type): | No (N/A) | Most Recent Occupancy: | 96.9% (9/9/2019) | |||||
| Reserves | 2nd Most Recent Occupancy: | 95.1% (12/31/2018) | ||||||
| Type | Initial | Monthly | Cap | 3rd Most Recent Occupancy: | 39.6% (12/31/2017) | |||
| RE Tax: | $580,620 | $58,062 | N/A | Appraised Value (as of): | $43,700,000 (8/28/2019) | |||
| Insurance: | $43,280 | $5,410 | N/A | Appraised Value per Unit: | $151,736 | |||
| Capital Expenditures: | $0 | $6,000 | N/A | Cut-off Date LTV Ratio: | 68.5% | |||
| Radon Reserve: | $5,000 | $0 | N/A | Maturity Date LTV Ratio: | 68.5% | |||
| Sources and Uses | ||||||
| Sources | Proceeds | % of Total | Uses | Proceeds | % of Total | |
| Senior Loan Amount: | $29,950,000 | 64.0% | Loan Payoff: | $39,155,860 | 83.6% | |
| Borrower Equity: | $16,868,875 | 36.0% | Closing Costs: | $7,034,114 | 15.0% | |
| Reserves: | $628,900 | 1.3% | ||||
| Total Sources: | $46,818,875 | 100.0% | Total Uses: | $46,818,875 | 100.0% | |
The Mortgage Loan. The twelfth largest mortgage loan (the “Mosby Poinsett Mortgage Loan”) is evidenced by a promissory note in the original principal amount of $29,950,000, and secured by a first priority fee mortgage encumbering a multifamily property totaling 288 units located in Greenville, South Carolina (the “Mosby Poinsett Property”). The proceeds of the Mosby Poinsett Mortgage Loan, together with borrower equity, were used primarily to refinance previous debt of approximately $39.2 million, fund reserves, and pay closing costs.
The Borrower and the Borrower Sponsor.The borrower is Mosby Poinsett, LLC (the “Mosby Poinsett Borrower”), a single purpose Virginia limited liability company with two independent directors. The borrower sponsor is Middleburg Real Estate Partners LLC and the non-recourse carve-out guarantor is Thistle Investments, LLC, which wholly owns Middleburg Real Estate Partners LLC. Middleburg Real Estate Partners LLC is a fully-integrated real estate investment, management, construction and development firm specializing in multifamily apartments throughout the Mid-Atlantic and Southeast. Thistle Investments, LLC currently holds ownership interest in six stabilized multifamily properties totaling 1,755 units (including the Mosby Poinsett Property) and nine multifamily properties that are either under construction or in their initial lease up totaling 2,862 units. Its aggregate portfolio consists of 4,617 units.
The Property.The Mosby Poinsett Property is comprised of 16 two, three and four story buildings, five garages and one clubhouse. The multifamily buildings total 288 units located in Greenville, South Carolina. As of September 9, 2019, the Mosby Poinsett Property was 96.9% leased. Construction of the Mosby Poinsett Property was completed in 2017 and the leasing of units commenced in April 2017 and within 19 months 280 units had been absorbed with an average absorption rate of almost 15 units per month.Amenities at the Mosby Poinsett Propertyinclude a clubhouse, salt water swimming pool, pool cabana with fireplaces and televisions, on-site bicycle storage and repair shop, fitness center with yoga studio, outdoor fire pits, outdoor kitchens, dog park, conference room, and a pet spa.In-unit amenities include afull appliance package including a range/oven, vent-hood, refrigerator with icemaker, microwave oven, garbage disposal, and dishwasher. Additionally, each unit features wood cabinets with granite countertops and vinyl plank wood flooring in the kitchen area. There are 499 surface parking spaces available atthe Mosby Poinsett Property, resulting in a parking ratio of 1.7 spaces per unit.
| This is not a research report and was not prepared by any Underwriter’s research department. It was prepared by the Underwriters’ sales, trading, banking or other non-research personnel. Please see additional important information and qualifications at the end of this Term Sheet. |
128
| Multifamily – Garden | Loan #12 | Cut-off Date Balance: | $29,950,000 | |
| Various | Mosby Poinsett | Cut-off Date LTV: | 68.5% | |
| Greenville, SC 29609 | U/W NCF DSCR: | 1.92x | ||
| U/W NOI Debt Yield: | 7.6% |
The following table presents certain information relating to the unit mix at the Mosby Poinsett Property:
| Unit Mix | |||||||
| Unit Mix / Type | Units | Occupied Units | % Occupied | Average SF per Unit | Total SF | Monthly Average Rent per Unit | Market Rent per Unit |
| One-Bedroom | 150 | 145 | 96.7% | 844 | 126,650 | $1,013 | $1,019 |
| Two-Bedroom | 110 | 108 | 98.2% | 1,103 | 121,380 | $1,291 | $1,297 |
| Three-Bedroom | 28 | 26 | 92.9% | 1,357 | 37,996 | $1,416 | $1,410 |
| Total/Wtd. Avg. | 288 | 279 | 96.9% | 993 | 286,026 | $1,158 | $1,163 |
Source:Borrower rent roll dated September 9, 2019 and appraisal.
The Market. The Mosby Poinsett Property is located in Greenville, South Carolina. The land uses within the area consist primarily of commercial and residential developments. Furman University is located less than one mile from the Mosby Poinsett Property. Furman University is a private liberal arts college with a 750-acre campus and enrolls approximately 2,900 undergraduate students. University Square, a Publix anchored shopping center, is located approximately one mile southwest of the Mosby Poinsett Property. Other regional demand generators or anticipated demand generators in the area include Millennium Campus, a 350-acre master planned corporate community in southeast Greenville, and the Clemson University International Center for Automotive Research, a 250-acre master-planned research campus encompassing five “technology neighborhoods” that is under construction. Primary access to the Mosby Poinsett Property is provided by Interstate Highway 85 and Interstate Highway 385. The Mosby Poinsett Property is located approximately 19 miles from the Greenville-Spartanburg International Airport.
The Mosby Poinsett Property is located in the Greenville Northwest submarket of the Greenville-Spartanburg market. According to the appraisal, as of the second quarter of 2019, the vacancy rate in the Greenville Northwest submarket was approximately 3.6%, with average asking rents of $903 and inventory of 2,735 units. According to the appraisal, as of the second quarter of 2019, the vacancy rate in the Greenville-Spartanburg market was approximately 5.4%, with average asking rents of $1,020 and inventory of 41,083 units. According to the appraisal, the estimated 2019 population within a one-, three- and five-mile radius of the Mosby Poinsett Property was 5,385, 40,097 and 106,973, respectively. The estimated 2019 average household income within a one-, three- and five-mile radius was $72,053, $60,195 and $67,281, respectively.
The following table presents certain information relating to comparable rental properties to the Mosby Poinsett Property:
| Comparable Rental Properties | |||||||
| Mosby Poinsett Property(1) | Aventine of Greenville | Velo at Verdae | Haywood Reserve | Tapestry at Hollingsworth Park | Abberly Pointe | Avanta Carolina Point | |
| Year Built | 2017 | 2013 | 2016 | 2016 | 2013 | 2016 | 2009 |
| Number of units | 288 | 346 | 262 | 292 | 242 | 246 | 346 |
| Occupancy | 96.9% | 95.0% | 95.0% | 91.0% | 94.0% | 97.0% | 92.0% |
| Unit size (SF)(2): | |||||||
| - Studio | N/A | N/A | N/A | N/A | N/A | N/A | 498 |
| - 1-BR | 844 | 776 | 765 | 734 | 888 | 774 | 882 |
| - 2-BR | 1,103 | 1,054 | 1,145 | 1,165 | 1,124 | 1,079 | 1,149 |
| - 3-BR | 1,357 | 1,292 | 1,364 | 1,364 | 1,516 | 1,344 | 1,384 |
| Monthly Rent per Unit(2): | |||||||
| - Studio | N/A | N/A | N/A | N/A | N/A | N/A | $889 |
| - 1-BR | $1,013 | $1,024 | $1,109 | $1,061 | $1,112 | $1,190 | $1,015 |
| - 2-BR | $1,291 | $1,246 | $1,454 | $1,186 | $1,247 | $1,363 | $1,243 |
| - 3-BR | $1,416 | $1,428 | $1,592 | $1,556 | $1,658 | $1,524 | $1,508 |
| Monthly Rent per SF(2): | |||||||
| - Studio | N/A | N/A | N/A | N/A | N/A | N/A | $1.92 |
| - 1-BR | $1.20 | $1.32 | $1.45 | $1.64 | $1.30 | $1.54 | $1.21 |
| - 2-BR | $1.17 | $1.18 | $1.27 | $1.24 | $1.14 | $1.26 | $1.15 |
| - 3-BR | $1.04 | $1.11 | $1.17 | $1.32 | $1.09 | $1.13 | $1.20 |
Source:Appraisal
| (1) | As of the borrower rent roll dated September 9, 2019. |
| (2) | Represents the weighted average for each unit size at the Mosby Poinsett Property. |
| This is not a research report and was not prepared by any Underwriter’s research department. It was prepared by the Underwriters’ sales, trading, banking or other non-research personnel. Please see additional important information and qualifications at the end of this Term Sheet. |
129
| Multifamily – Garden | Loan #12 | Cut-off Date Balance: | $29,950,000 | |
| Various | Mosby Poinsett | Cut-off Date LTV: | 68.5% | |
| Greenville, SC 29609 | U/W NCF DSCR: | 1.92x | ||
| U/W NOI Debt Yield: | 7.6% |
Operating History and Underwritten Net Cash Flow. The following table presents certain information relating to the historical operating performance and Underwritten Net Cash Flow at the Mosby Poinsett Property:
| Cash Flow Analysis(1) | |||||
| 12/31/2017 | 12/31/2018 | 8/31/2019 TTM | UW(2) | UW per unit | |
| Gross Potential Rent | $3,189,779 | $4,118,833 | $4,041,104 | $4,003,476 | $13,900.96 |
| Other Income(3) | $80,195 | $327,466 | $418,277 | $412,046 | $1,430.72 |
| Concessions | ($184,160) | ($409,024) | ($181,113) | ($81,062) | ($281.47) |
| Less Vacancy & Credit Loss | ($2,570,989) | ($1,229,661) | ($201,588) | ($200,174) | ($695.05) |
| Effective Gross Income | $514,825 | $2,807,614 | $4,076,680 | $4,134,286 | $14,355.16 |
| Real Estate Taxes | $0 | $841,662 | $1,053,650 | $663,569 | $2,304.06 |
| Insurance | $0 | $64,672 | $63,055 | $61,690 | $214.20 |
| Other Expenses | $537,624 | $1,145,342 | $1,151,448 | $1,126,115 | $3,910.12 |
| Total Expenses | $537,624 | $2,051,676 | $2,268,153 | $1,851,374 | $6,428.38 |
| Net Operating Income | ($22,799) | $755,938 | $1,808,527 | $2,282,913 | $7,926.78 |
| Capital Expenditures | $0 | $0 | $0 | $57,600 | $200.00 |
| Net Cash Flow | ($22,799) | $755,938 | $1,808,527 | $2,225,313 | $7,726.78 |
| Occupancy % | 39.6% | 95.1% | 96.9%(4) | 95.0%(4) | |
| NOI DSCR | (0.02x) | 0.65x | 1.56x | 1.97x | |
| NCF DSCR | (0.02x) | 0.65x | 1.56x | 1.92x | |
| NOI Debt Yield | (0.1%) | 2.5% | 6.0% | 7.6% | |
| NCF Debt Yield | (0.1%) | 2.5% | 6.0% | 7.4% | |
| (1) | Financial information and occupancy for the years ending on December 31, 2017 and December 31, 2018 do not represent stabilized operations because the Mosby Poinsett Property was constructed in 2017 and exited its lease-up period in or about September 2018. |
| (2) | The increase from 8/31/2019 TTM Net Operating Income to UW Net Operating Income is primarily due to a projected decrease in real estate taxes. The real estate taxes were successfully appealed for the 2018 tax year. Prior to the appeal the assessed value was $39,877,650. The appeal was approved, and the new assessed value is $31,280,510. |
| (3) | Other Income is comprised of miscellaneous fees and reimbursements. |
| (2) | 8/31/2019 TTM Occupancy is as of the borrower rent roll dated September 9, 2019. UW Occupancy represents economic occupancy. |
| This is not a research report and was not prepared by any Underwriter’s research department. It was prepared by the Underwriters’ sales, trading, banking or other non-research personnel. Please see additional important information and qualifications at the end of this Term Sheet. |
130
(THIS PAGE INTENTIONALLY LEFT BLANK)
131
| Mortgage Loan No. 13 – Vio Tustin Apartments |
| Mortgage Loan Information | Property Information | ||||||
| Mortgage Loan Seller: | AREF | Single Asset/Portfolio: | Single Asset | ||||
| Credit Assessment (KBRA/Fitch/S&P): | NR/NR/NR | Location: | Tustin, CA 92780 | ||||
| Original Balance: | $28,000,000 | General Property Type: | Multifamily | ||||
| Cut-off Date Balance: | $28,000,000 | Detailed Property Type: | Garden | ||||
| % of Initial Pool Balance: | 2.7% | Title Vesting: | Fee | ||||
| Loan Purpose: | Refinance | Year Built/Renovated: | 1968/2016-2019 | ||||
| Sponsors: | Gerald J. Marcil; Carol L. Marcil | Size: | 165 Units | ||||
| Guarantors: | Gerald J. Marcil; Carol L. Marcil | Cut-off Date Balance per Unit: | $169,697 | ||||
| Mortgage Rate: | 3.4900% | Maturity Date Balance per Unit: | $169,697 | ||||
| Note Date: | 10/9/2019 | Property Manager: | Palos Verdes Management Co., LP | ||||
| First Payment Date: | 12/6/2019 | (borrower related) | |||||
| Maturity Date: | 11/6/2029 | Underwriting and Financial Information | |||||
| Original Term to Maturity: | 120 months | UW NOI: | $2,355,501 | ||||
| Original Amortization Term: | 0 months | UW NOI Debt Yield: | 8.4% | ||||
| IO Period: | 120 months | UW NOI Debt Yield at Maturity: | 8.4% | ||||
| Seasoning: | 0 months | UW NCF DSCR: | 2.34x | ||||
| Prepayment Provisions: | LO (24); DEF (92); O (4) | Most Recent NOI: | $2,349,554 (7/31/2019 TTM) | ||||
| Lockbox/Cash Mgmt Status: | Soft/Springing | 2nd Most Recent NOI: | $2,202,175 (12/31/2018) | ||||
| Additional Debt Type: | N/A | 3rd Most Recent NOI: | $1,817,439 (12/31/2017) | ||||
| Additional Debt Balance: | N/A | Most Recent Occupancy: | 97.6% (8/31/2019) | ||||
| Future Debt Permitted (Type): | No (N/A) | 2nd Most Recent Occupancy: | 98.3% (12/31/2018) | ||||
| Reserves | 3rd Most Recent Occupancy: | 97.3% (12/31/2017) | |||||
| Type | Initial | Monthly | Cap | Appraised Value (as of): | $51,000,000 (8/30/2019) | ||
| RE Tax: | $212,348 | $42,470 | N/A | Appraised Value per Unit: | $309,091 | ||
| Insurance: | $25,584 | $3,655 | N/A | Cut-off Date LTV Ratio: | 54.9% | ||
| Recurring Replacements: | $0 | $3,438 | N/A | Maturity Date LTV Ratio: | 54.9% | ||
| Sources and Uses | ||||||
| Sources | Proceeds | % of Total | Uses | Proceeds | % of Total | |
| Loan Amount: | $28,000,000 | 98.6% | Loan Payoff: | $27,597,158 | 97.2% | |
| Borrower Equity | $402,130 | 1.4% | Closing Costs: | $567,040 | 2.0% | |
| Reserves: | $237,932 | 0.8% | ||||
| Total Sources: | $28,402,130 | 100.0% | Total Uses: | $28,402,130 | 100.0% | |
The Mortgage Loan. The thirteenth largest mortgage loan (the “Vio Tustin Apartments Mortgage Loan”) is evidenced by a promissory note in the original principal amount of $28,000,000 secured by a first priority fee mortgage encumbering a 165-unit garden-style apartment community in Tustin, California known as Vio Tustin Apartments (the “Vio Tustin Apartments Property”). The proceeds of the Vio Tustin Apartments Mortgage Loan, together with borrower equity, were primarily used to refinance a previous loan of approximately $27.6 million, fund reserves, and pay closing costs.
The Borrower and Borrower Sponsors. The borrower under the Vio Tustin Apartments Mortgage Loan is Vio Tustin Apartments I, LLC, a single purpose Delaware limited liability company, with one independent director. Gerald J. Marcil and Carol L. Marcil, who are husband and wife, are the nonrecourse carve-out guarantors and the borrower sponsors of the Vio Tustin Apartments Mortgage Loan.
Gerald J. Marcil has over 35 years of experience managing and operating various properties for himself and other investors in California and the Pacific Northwest. Gerald J. Marcil is also the president of Palos Verdes Investments, Inc., a development corporation specializing in the development and management of residential properties for sale and for investment. Palos Verdes Investments, Inc. has built or remodeled over 5,000 units in over 100 projects. In addition, the company has won awards for energy efficiency and architectural design.
The Property.The Vio Tustin Apartments Property encompasses 165 Class B, garden-style apartment units built in 1968 and located in Tustin, California. The Vio Tustin Apartments Property consists of four, two-story apartment buildings and one clubhouse situated on a 5.59-acre site. Since acquiring the Vio Tustin Apartments Property in 2016, the borrower has spent approximately $941,000 on capital expenditures. The Vio Tustin Apartments Property has undergone renovations from 2016-2019, with 110 units (67% by number of units) being renovated to date with new appliances, wood plank floors, doors, cabinets, lighting and fixtures. Property amenities include a fitness center, clubhouse, game room, pool and barbecue area. Each unit includes a private patio or balcony area as well as a kitchen that features a dishwasher, gas range stove/oven, and garbage disposal. The renovated units feature stainless steel appliances, wood plank flooring, and white cabinetry with new hardware. The Vio Tustin Apartments Property also includes 250 total parking spaces comprised of surface, tuck-under, and carport parking spaces (1.5 parking spaces per unit). As of August 31, 2019, the Vio Tustin Apartments Property is 97.6% occupied.
| This is not a research report and was not prepared by any Underwriter’s research department. It was prepared by the Underwriters’ sales, trading, banking or other non-research personnel. Please see additional important information and qualifications at the end of this Term Sheet. |
132
| Multifamily - Garden | Loan #13 | Cut-off Date Balance: | $28,000,000 | |
| 15742 Williams Street | Vio Tustin Apartments | Cut-off Date LTV: | 54.9% | |
| Tustin, CA 92780 | U/W NCF DSCR: | 2.34x | ||
| U/W NOI Debt Yield: | 8.4% |
The table below shows the apartment unit mix at the Vio Tustin Apartments Property:
| Vio Tustin Apartments Property Unit Mix Summary | ||||||
| Floor Plan | No. of Units | % of Total Units | Average Unit Size (SF) | Total SF | Monthly Asking Rent Per Unit | Market Rent Per Unit |
| 1 Bed / 1 Bath | 29 | 17.6% | 707 | 20,498 | $1,459 | $1,450 |
| 1 Bed / 1 Bath Renovated | 61 | 37.0% | 706 | 43,084 | $1,491 | $1,650 |
| 2 Bed / 2 Bath | 26 | 15.8% | 1,100 | 28,600 | $1,836 | $1,850 |
| 2 Bed / 2 Bath Renovated | 49 | 29.7% | 1,100 | 53,900 | $1,937 | $2,050 |
| Total/Wtd. Avg. | 165 | 100.0% | 885 | 146,082 | $1,672 | $1,765 |
Source: Underwritten rent roll and appraisal
The Market.According to the appraisal, the Vio Tustin Apartments Property is located in the southeast area of Orange County. Primary access to the Vio Tustin Apartments Property is provided by the Interstate 5 Freeway, which extends southeast into San Diego County and northwest toward Downtown Los Angeles and the 55 Freeway, which extends south into Newport Beach and north into Anaheim. The Vio Tustin Apartments Property is located within the Tustin/West Santa Ana apartment submarket of the Orange County Metro apartment market. According to the appraisal, as of the second quarter of 2019, the Tustin/West Santa Ana apartment submarket contains 13,231 inventory units, had an average vacancy of 3.2% and had asking rents of $1,954 per month.
According to the appraisal, the estimated 2019 population within a one-, three- and five-mile radius of the Vio Tustin Apartments Property is 36,009, 264,143 and 690,429, respectively. According to the appraisal, the estimated 2019 median household income within a one-, three- and five-mile radius of the Vio Tustin Apartments Property is $50,765, $65,790 and $80,603, respectively.
| Vio Tustin Apartments Comparable Property Summary | |||
| Floor Plan | Size (SF) | Rent per Month | Rent per SF |
| Vio Tustin Apartments Property – 1 Bed / 1 Bath (Subject) | 709 | $1,450 | $2.05 |
| Vio Tustin Apartments Property – 2 Bed / 2 Bath (Subject) | 1,100 | $1,850 | $1.68 |
| Stonebrook Apartments – 1 Bed / 1 Bath | 787 | $1,640 | $2.08 |
| Stonebrook Apartments – 2 Bed / 2 Bath | 934 | $1,920 | $2.06 |
| Monterey Pines – 1 Bed / 1 Bath | 716 | $1,625 | $2.27 |
| Monterey Pines – 2 Bed / 2 Bath | 910 | $1,910 | $2.10 |
| El Paseo – 1 Bed / 1 Bath | 695 | $1,870 | $2.69 |
| El Paseo – 2 Bed / 2 Bath | 902 | $2,200 | $2.44 |
| Total/Wtd. Avg. – 1 Bed / 1 Bath | N/A | $1,625-$1,935 | $2.08-$2.75 |
| Total/Wtd. Avg. – 2 Bed / 2 Bath | N/A | $1,650-$2,301 | $1.82-$2.52 |
Source: Appraisal
| This is not a research report and was not prepared by any Underwriter’s research department. It was prepared by the Underwriters’ sales, trading, banking or other non-research personnel. Please see additional important information and qualifications at the end of this Term Sheet. |
133
| Multifamily - Garden | Loan #13 | Cut-off Date Balance: | $28,000,000 | |
| 15742 Williams Street | Vio Tustin Apartments | Cut-off Date LTV: | 54.9% | |
| Tustin, CA 92780 | U/W NCF DSCR: | 2.34x | ||
| U/W NOI Debt Yield: | 8.4% |
Operating History and Underwritten Net Cash Flow.The following table presents certain information relating to the historical operating performance and the Underwritten Net Cash Flow at the Vio Tustin Apartments Property:
| Cash Flow Analysis | |||||
| 2017 | 2018 | 7/31/2019 TTM | UW | UW per Unit | |
| Gross Potential Rent | $2,914,841 | $3,046,621 | $3,187,053 | $3,405,500 | $20,639.39 |
| Reimbursement Income | $102,733 | $89,160 | $85,694 | $85,694 | 519.36 |
| Other Income(1) | $97,249 | $107,359 | $88,022 | $88,022 | $533.47 |
| Less Vacancy & Credit Loss | $0 | $0 | $0 | ($174,750) | ($1,059.09) |
| Effective Gross Income | $3,114,823 | $3,243,140 | $3,360,769 | $3,404,466 | $20,633.13 |
| Real Estate Taxes | $748,532 | $501,500 | $501,500 | $501,500 | $3,039.39 |
| Insurance | $27,977 | $30,540 | $39,203 | $43,858 | $265.81 |
| Other Expenses | $520,875 | $508,926 | $470,512 | $503,607 | $3,052.16 |
| Total Expenses | $1,297,384 | $1,040,965 | $1,011,215 | $1,048,965 | $6,357.37 |
| Net Operating Income | $1,817,439 | $2,202,175 | $2,349,554 | $2,355,501 | $14,275.76 |
| Capital Expenditures | $41,250 | $41,250 | $41,250 | $41,250 | $250.00 |
| Net Cash Flow | $1,776,189 | $2,160,925 | $2,308,304 | $2,314,251 | $14,025.76 |
| Occupancy % | 97.3% | 98.3% | 98.3% | 97.6%(2) | |
| NOI DSCR | 1.83x | 2.22x | 2.37x | 2.38x | |
| NCF DSCR | 1.79x | 2.18x | 2.33x | 2.34x | |
| NOI Debt Yield | 6.5% | 7.9% | 8.4% | 8.4% | |
| NCF Debt Yield | 6.3% | 7.7% | 8.2% | 8.3% | |
| (1) | Other Income is comprised of residential reimbursements, laundry and parking. |
| (2) | UW Occupancy % as of August 31, 2019. |
| This is not a research report and was not prepared by any Underwriter’s research department. It was prepared by the Underwriters’ sales, trading, banking or other non-research personnel. Please see additional important information and qualifications at the end of this Term Sheet. |
134
(THIS PAGE INTENTIONALLY LEFT BLANK)
135
| Mortgage Loan No. 14 – Key West Hotel Portfolio |
| Mortgage Loan Information | Property Information | |||||
| Mortgage Loan Seller: | MSMCH | Single Asset/Portfolio: | Portfolio | |||
| Credit Assessment (KBRA/Fitch/S&P): | NR/NR/NR | Location: | Key West, FL 33040 | |||
| Original Balance: | $28,000,000 | General Property Type: | Hospitality | |||
| Cut-off Date Balance: | $28,000,000 | Detailed Property Type: | Resort | |||
| % of Initial Pool Balance: | 2.7% | Title Vesting: | Fee | |||
| Loan Purpose: | Refinance | Year Built/Renovated: | Various / Various | |||
| Sponsors: | Jesper Arnoldsson; Gustaf Arnoldsson | Size: | 115 Rooms | |||
| Guarantors: | Jesper Arnoldsson; Gustaf Arnoldsson | Cut-off Date Balance per Room: | $243,478 | |||
| Mortgage Rate: | 4.9500% | Maturity Date Balance per Room: | $200,306 | |||
| Note Date: | 10/18/2019 | Property Manager: | Self-managed | |||
| First Payment Date: | 12/1/2019 | (borrower-related) | ||||
| Maturity Date: | 11/1/2029 | |||||
| Original Term to Maturity: | 120 months | Underwriting and Financial Information | ||||
| Original Amortization Term: | 360 months | UW NOI: | $3,913,901 | |||
| IO Period: | 0 months | UW NOI Debt Yield: | 14.0% | |||
| Seasoning: | 0 months | UW NOI Debt Yield at Maturity: | 17.0% | |||
| Prepayment Provisions: | LO (24); DEF (91); O (5) | UW NCF DSCR: | 1.89x | |||
| Lockbox/Cash Mgmt Status: | Springing/Springing | Most Recent NOI: | $4,142,486 (7/31/2019 TTM) | |||
| Additional Debt Type: | N/A | 2nd Most Recent NOI: | $3,873,607 (12/31/2018) | |||
| Additional Debt Balance: | N/A | 3rd Most Recent NOI: | $3,695,276 (12/31/2017) | |||
| Future Debt Permitted (Type): | No (N/A) | Most Recent Occupancy: | 92.7% (7/31/2019) | |||
| Reserves | 2nd Most Recent Occupancy: | 95.1% (12/31/2018) | ||||
| Type | Initial | Monthly | Cap | 3rd Most Recent Occupancy: | 95.9% (12/31/2017) | |
| RE Tax: | $23,289 | $23,289 | N/A | Appraised Value (as of): | $47,900,000 (6/21/2019) | |
| Insurance: | $327,221 | $54,537 | N/A | Appraised Value per Room: | $416,522 | |
| Deferred Maintenance: | $27,425 | $0 | N/A | Cut-off Date LTV Ratio: | 58.5% | |
| Capital Expenditures: | $0 | $44,212 | N/A | Maturity Date LTV Ratio: | 48.1% | |
| PIP: | $0 | Springing | N/A | |||
| Sources and Uses | ||||||
| Sources | Proceeds | % of Total | Uses | Proceeds | % of Total | |
| Loan Amount: | $28,000,000 | 100.0% | Loan Payoff: | $20,061,994 | 71.6% | |
| Return of Equity: | $6,234,777 | 22.3% | ||||
| Closing Costs: | $1,325,294 | 4.7% | ||||
| Reserves: | $377,935 | 1.3% | ||||
| Total Sources: | $28,000,000 | 100.0% | Total Uses: | $28,000,000 | 100.0% | |
The Mortgage Loan. The fourteenth largest mortgage loan (the “Key West Hotel Portfolio Mortgage Loan”) is evidenced by one promissory note in the aggregate original principal balance of $28,000,000, which is secured by first priority fee mortgages encumbering four resort hotels located throughout Key West, Florida (the “Key West Hotel Portfolio Properties” or “Property” when discussed individually). The proceeds of the Key West Hotel Portfolio Mortgage Loan were used to refinance a previous loan, pay closing costs, fund reserves, and return equity to the borrower sponsor.
The Borrowers and the Borrower Sponsors.The borrowers are Whitehead Trust LLC, NYAH Key West LLC, Paradise Inn Hostel LLC and United Street Trust LLC (together, the“Key West Hotel Portfolio Borrower”), each a single-purpose Florida limited liability company with a special purpose entity managing member with one independent director. The borrower sponsors and non-recourse carve-out guarantors are Jesper Arnoldsson and Gustaf Arnoldsson. Jesper Arnoldsson and Gustaf Arnoldsson both have partial ownership interests in the Key West Hotel Portfolio Borrower. Jesper Arnoldsson and Gustaf Arnoldssonare the Chief Executive Officer and Chief Financial Officer, respectively, and co-founders of SMS Lodging.Founded in 2010, SMS Lodging currently owns nine properties located in Florida and the Caribbean.
The Properties. The Key West Hotel Portfolio Properties are comprised of four resort hotels offering a range of amenities including meeting space, fitness centers, swimming pools, landscaped grounds and complimentary services. The hotels range in size from 18 to 38 rooms, with an average count of 29 rooms. The Key West Hotel Portfolio Properties were built between 1913 and 1999. Since 2011, the borrower sponsor spent approximately $6.0 million on capital improvements and repairs including pool repair, landscaping, floor covering, ice machine repairs, painting and decorating, plumbing, vehicle repair and more.
Southernmost Inn
The Southernmost Inn Property is a boutique hotel consisting of five, one- and two-story structures, located in Key West, Florida. The Southernmost Inn Property contains 38 rooms. Amenities include two pools, a jacuzzi, an outdoor bar, landscaped grounds, continental breakfast, Wi-Fi, business center, fitness center, and 24-hour complimentary Starbucks coffee. The Southernmost Inn Property was built in 1928 (three structures) and 1938 (two
| This is not a research report and was not prepared by any Underwriter’s research department. It was prepared by the Underwriters’ sales, trading, banking or other non-research personnel. Please see additional important information and qualifications at the end of this Term Sheet. |
136
| Hospitality – Resort | Loan #14 | Cut-off Date Balance: | $28,000,000 | |
| Various | Key West Hotel Portfolio | Cut-off Date LTV: | 58.5% | |
| Key West, FL 33040 | U/W NCF DSCR: | 1.89x | ||
| U/W NOI Debt Yield: | 14.0% |
structures) and underwent its last major upgrade in 2014. Since 2014, the Southernmost Inn Property has undergone approximately $1.0 million in renovations. The Southernmost Inn Property does not operate under a franchise agreement.
NYAH Key West
The NYAH Key West Property is a boutique hotel consisting of six, two- and three-story structures, located in Key West, Florida. The NYAH Key West Property contains 35 rooms. Amenities include three pools, two jacuzzis, onsite bar/lounge, landscaped grounds, continental breakfast, complimentary Wi-Fi, bicycle rentals, and 24-hour complimentary Starbucks coffee. The NYAH brand, which stands for Not Your Average Hotel, features a unique concept in which the guest units have flexible bedding arrangements via modern “Murphy-style” type bedding systems. These flexible units typically consist of a bunk bed configuration and/or trundle that can be configured into single bunk beds, larger single beds or various combinations thereof, including sofas/seating areas. There is also a 3-bedroom, 2-bath single family home at the NYAH Key West Property, which is currently being used for storage. The NYAH Key West Property was built between 1925 and 1999 and underwent its last major upgrade in 2013. Since 2013, the NYAH Key West Property has undergone approximately $3.5 million in renovations. The NYAH Key West Property does not operate under a franchise agreement.
Cabana Inn
The Cabana Inn Property is a boutique hotel consisting of six one, two and three-story structures, located in Key West, Florida. The Cabana Inn Property contains 24 rooms, which are made up of typical guestrooms, a cabana loft, a cabin cottage, the cabana junior suite and a presidential suite. Amenities include a lagoon-style pool, jacuzzi, wine and cheese happy hour, lushly landscaped grounds, continental breakfast, Wi-Fi, and 24-hour Starbucks coffee. The Cabana Inn Property was built between 1924 and 1993 and underwent its last major upgrade in 2016. Since 2013, the Cabana Inn Property has undergone $684,246 in renovations. The Cabana Inn Property does not operate under a franchise agreement.
Paradise Inn
The Paradise Inn Property is a boutique hotel consisting of six, one-, two- and three-story structures, located in Key West, Florida. The Paradise Inn Property contains 18 rooms, which are made up of typical guestrooms, a king mini suite, a queen mini suite, a royal poinciana cottage and a gumbo limbo cottage. The Paradise Inn Property also includes a two-story concrete block construction commercial/retail structure (817 Simonton Street) which currently houses a massage/wellness center on the ground level and a 2-bedroom residential apartment on the second level. Amenities include an outdoor fountain-fed pool, a jacuzzi, lushly landscaped grounds, continental breakfast, Wi-Fi, and a daily wine and cheese happy hour. The Paradise Inn Property was built between 1913 and 1995 and underwent its last major upgrade in 2013. Since 2011, the Paradise Inn Property has undergone $876,252 in renovations. The Paradise Inn Property does not operate under a franchise agreement.
A summary of the individual Key West Hotel Portfolio Properties is provided below:
| Key West Hotel Portfolio Properties Summary | |||||||||
| Property Name | City / State | Rooms | Year Built | Allocated Loan Amount (“ALA”) | % of ALA | Appraised Value | UW NCF | % of UW NCF | TTM Occupancy(1) |
| Southernmost Inn | Key West, FL | 38 | 1928, 1938 | $9,002,100 | 32.2% | $15,400,000 | $1,058,001 | 31.3% | 91.8% |
| NYAH Key West | Key West, FL | 35 | 1925, 1930, 1933, 1999 | $6,897,700 | 24.6% | $11,800,000 | $759,101 | 22.4% | 93.2% |
| Cabana Inn | Key West, FL | 24 | 1924, 1949, 1977, 1993 | $6,488,500 | 23.2% | $11,100,000 | $835,067 | 24.7% | 91.1% |
| Paradise Inn | Key West, FL | 18 | 1913, 1953, 1995 | $5,611,700 | 20.0% | $9,600,000 | $731,188 | 21.6% | 95.3% |
| Total / Wtd. Avg. | 115 | $28,000,000 | 100.0% | $47,900,000 | $3,383,357 | 100.0% | 92.7% | ||
| (1) | TTM Occupancy is based on the trailing 12 months ending July 31, 2019 as provided by the Key West Hotel Portfolio Borrower. |
More specific information about the Key West Hotel Portfolio Properties and the related competitive set is set forth in the following table:
| Historical Occupancy, ADR, RevPAR(1) | |||||||||
| Competitive Set(2) | Key West Hotel Portfolio Properties(3) | Penetration Factor | |||||||
| Year | Occupancy | ADR | RevPAR | Occupancy | ADR | RevPAR | Occupancy | ADR | RevPAR(4) |
| 12/31/2016 | 85.1% | $243.51 | $207.40 | 96.1% | $247.23 | $237.69 | 113.0% | 101.5% | 114.6% |
| 12/31/2017 | 76.5% | $242.82 | $185.72 | 95.9% | $242.26 | $232.36 | 125.3% | 99.8% | 125.1% |
| 12/31/2018 | 85.1% | $241.29 | $205.49 | 95.1% | $238.32 | $226.71 | 111.8% | 98.8% | 110.3% |
| (1) | Variances between the underwriting, the appraisal, and the Historical Occupancy, ADR, RevPAR table with respect to Occupancy, ADR and RevPAR at the Key West Hotel Portfolio Properties are attributable to variances in reporting methodologies and/or timing differences. |
| (2) | Competitive Set data for each individual property is based on the appraisal and presented on a weighted average basis based on individual property room count. The Competitive Set includes Albury Court Hotel, Chelsea House Hotel, Key Lime Inn, Cypress House Hotel, Lighthouse Court Hotel and Merlin Guest House. |
| (3) | Based on the operating statements provided by the borrower sponsor. |
| (4) | The 2016 RevPAR Penetration Factor for Southernmost Inn, NYAH Key West, Cabana Inn and Paradise Inn were 100.2%, 96.3%, 121.0% and 144.5%, respectively. The 2017 RevPAR Penetration Factor for Southernmost Inn, NYAH Key West, Cabana Inn and Paradise Inn were 106.7%, 106.2%, 124.3% and 148.0%, respectively. The 2018 RevPAR Penetration Factor for Southernmost Inn, NYAH Key West, Cabana Inn and Paradise Inn were 94.5%, 100.0%%, 115.2% and 137.4%, respectively. |
The Market.The Key West Hotel Portfolio Properties are located in Key West, Florida, within a few blocks of Duval Street, the main commercial road in Key West. Key West is part of the Florida Keys, a chain of islands most of which are about a half mile wide, stretching from the southeastern tip of the state in a southwesterly direction for approximately 120 miles. The Key West Hotel Portfolio Properties are located on Key West, the last island in the chain. According to the appraisal, approximately two of every three jobs in the Florida Keys were in either the retail trade or service sectors. Almost half of all retail trade positions were in eating and drinking establishments, while the professional and related category accounted for half of all service positions. The largest employers include the U.S. Armed Services, Monroe County Schools and the Ocean Reef Club. Tourism is the primary economic driver in Monroe County, with approximately 18,000 tourist/visitors per day. During special events, the population can swell above the typical 76,000.
| This is not a research report and was not prepared by any Underwriter’s research department. It was prepared by the Underwriters’ sales, trading, banking or other non-research personnel. Please see additional important information and qualifications at the end of this Term Sheet. |
137
| Hospitality – Resort | Loan #14 | Cut-off Date Balance: | $28,000,000 | |
| Various | Key West Hotel Portfolio | Cut-off Date LTV: | 58.5% | |
| Key West, FL 33040 | U/W NCF DSCR: | 1.89x | ||
| U/W NOI Debt Yield: | 14.0% |
Overnight visitors constitute the vast majority of visitors to the Florida Keys, particularly to Key West. Primary access to the Key West Hotel Portfolio Properties is provided by U.S. Highway 1 / Truman Avenue which travels parallel to the Atlantic Ocean and/or the Intracoastal Waterway through Florida and up the eastern seaboard of the United States. The Key West Hotel Portfolio Properties are serviced by the Key West International Airport, which recently underwent a $31.6 million construction and renovation project, more than doubling its size. According to the appraisal, no proposed hotels or properties that are currently under development would be directly competitive with any of the Key West Hotel Portfolio Properties.
The following table presents certain information relating to the primary competitive properties to the Key West Hotel Portfolio Properties:
| Property Competitive Summary(1) | ||||||||
| Property Name | No. of Rooms | Year Built | Estimated 2017 Occupancy | Estimated 2017 ADR | Estimated 2017 RevPAR | Estimated 2018 Occupancy | Estimated 2018 ADR | Estimated 2018 RevPAR |
| Southernmost Inn(2)(3) | 38 | 1928, 1938 | 95.2% | $224.35 | $213.64 | 95.7% | $212.13 | $203.03 |
| NYAH Key West(2)(3) | 35 | 1925, 1930, 1933, 1999 | 97.2% | $219.00 | $212.90 | 93.3% | $228.42 | $213.13 |
| Cabana Inn(2)(3) | 24 | 1924, 1949, 1977, 1993 | 95.2% | $258.91 | $246.47 | 95.9% | $253.17 | $242.82 |
| Paradise Inn(2)(3) | 18 | 1913, 1953, 1995 | 95.8% | $303.66 | $290.95 | 96.4% | $290.84 | $280.24 |
| Albury Court Hotel | 43 | 1965 | 78.0% | $211.00 | $164.58 | 84.0% | $213.00 | $178.92 |
| Chelsea House Hotel | 48 | Various | 73.0% | $238.00 | $173.74 | 85.0% | $235.00 | $199.75 |
| Key Lime Inn | 37 | Various | 79.0% | $236.00 | $186.44 | 85.0% | $239.00 | $203.15 |
| Cypress House Hotel | 23 | 1933 | 73.0% | $280.00 | $204.40 | 86.0% | $270.00 | $232.20 |
| Lighthouse Court Hotel | 45 | Various | 79.0% | $259.00 | $204.61 | 86.0% | $257.00 | $221.02 |
| Merlin Guest House | 22 | Various | 76.0% | $255.00 | $193.80 | 85.0% | $252.00 | $214.20 |
Source:Appraisal.
| (1) | Variances between the underwriting, the appraisal and the Historical Occupancy, ADR, RevPAR table with respect to Occupancy, ADR and RevPAR at the Key West Hotel Portfolio Properties are attributable to variances in reporting methodologies and/or timing differences. |
| (2) | Based on the operating statements provided by the borrower sponsor. |
| (3) | The Key West Hotel Portfolio Properties are within the same competitive set and therefore also compete with each other. |
Operating History and Underwritten Net Cash Flow.The following table presents certain information relating to the historical operating performance and Underwritten Net Cash Flow at the Key West Hotel Portfolio Properties:
| Cash Flow Analysis | ||||||
| 2016(1) | 2017 | 2018 | 7/31/2019 TTM | UW | UW per Room | |
| Occupancy | 96.1% | 95.9% | 95.1% | 92.7% | 92.7% | |
| ADR | $247.23 | $242.26 | $238.32 | $243.96 | $243.96 | |
| RevPAR | $237.69 | $232.36 | $226.71 | $226.05 | $226.05 | |
| Room Revenue | $10,004,497 | $9,753,516 | $9,543,947 | $9,488,262 | $9,488,262 | $82,507 |
| Food & Beverage Revenue | $115,277 | $149,771 | $152,897 | $144,327 | $144,327 | $1,255 |
| Other Income | $462,591 | $344,273 | $553,068 | $978,274 | $978,274 | $8,507 |
| Total Revenue | $10,582,365 | $10,247,560 | $10,249,912 | $10,610,863 | $10,610,863 | $92,268 |
| Real Estate Taxes | $240,289 | $313,560 | $301,815 | $286,908 | $301,596 | $2,623 |
| Insurance | $311,508 | $339,174 | $438,817 | $458,566 | $635,379 | $5,525 |
| Other Expenses | $5,680,273 | $5,899,550 | $5,635,673 | $5,722,903 | $5,759,987 | $50,087 |
| Total Expenses | $6,232,070 | $6,552,284 | $6,376,305 | $6,468,377 | $6,696,962 | $58,234 |
| Net Operating Income | $4,350,295 | $3,695,276 | $3,873,607 | $4,142,486 | $3,913,901 | $34,034 |
| FF&E | $423,294 | $409,901 | $409,997 | $424,434 | $530,544 | $4,613 |
| Net Cash Flow | $3,927,001 | $3,285,375 | $3,463,610 | $3,718,052 | $3,383,357 | $29,420 |
| NOI DSCR | 2.43x | 2.06x | 2.16x | 2.31x | 2.18x | |
| NCF DSCR | 2.19x | 1.83x | 1.93x | 2.07x | 1.89x | |
| NOI Debt Yield | 15.5% | 13.2% | 13.8% | 14.8% | 14.0% | |
| NCF Debt Yield | 14.0% | 11.7% | 12.4% | 13.3% | 12.1% | |
Release of Property. Provided no event of default has occurred and is continuing, the Key West Hotel Portfolio Borrowers may obtain the release of no more than two Key West Portfolio Properties in the aggregate, subject to the following conditions, among others (i) defeasance in an amount equal to the applicable Release Amount (as defined below) (ii) after giving effect to the partial defeasance of the applicable Key West Hotel Portfolio Property or Properties, (A) the loan-to-value ratio with respect to the remaining Key West Hotel Portfolio Properties is no greater than the lesser of (1) 65.0% or (2) the loan-to-value ratio with respect to all of the Key West Hotel Portfolio Properties immediately prior to the partial defeasance, (B) the debt service coverage ratio with respect to the remaining Key West Hotel Portfolio Properties is greater than the greater of (1) the debt service coverage ratio of all
| This is not a research report and was not prepared by any Underwriter’s research department. It was prepared by the Underwriters’ sales, trading, banking or other non-research personnel. Please see additional important information and qualifications at the end of this Term Sheet. |
138
| Hospitality – Resort | Loan #14 | Cut-off Date Balance: | $28,000,000 | |
| Various | Key West Hotel Portfolio | Cut-off Date LTV: | 58.5% | |
| Key West, FL 33040 | U/W NCF DSCR: | 1.89x | ||
| U/W NOI Debt Yield: | 14.0% |
Key West Hotel Portfolio Properties immediately prior to the partial defeasance and (2) 1.60x and (C) the debt yield with respect to the remaining Key West Hotel Portfolio Properties is greater than the greater of (1) the debt yield of all Key West Hotel Portfolio Properties immediately prior to the consummation of the partial defeasance and (2) 11.0% and (iii) if following the said release, the ratio of the unpaid principal balance of the Key West Hotel Portfolio Mortgage Loan to the value of the real property relating to the remaining Key West Hotel Portfolio Properties is greater than 125%, the principal balance of the Key West Hotel Portfolio Mortgage Loan is required be paid down by the Key West Hotel Portfolio Borrowers by an amount sufficient to satisfy REMIC requirements. “Release Amount” means $10,802,520 for the Southernmost Inn property, $8,277,240 for the NYAH Key West property, $7,786,200 for The Cabana Inn property and $6,734,040 for the Paradise Inn property, each of which is equal to 120% of the related allocated loan amount.
| This is not a research report and was not prepared by any Underwriter’s research department. It was prepared by the Underwriters’ sales, trading, banking or other non-research personnel. Please see additional important information and qualifications at the end of this Term Sheet. |
139
| Mortgage Loan No. 15 – 4-5 Sentry |
| Mortgage Loan Information | Property Information | ||||||
| Mortgage Loan Seller: | CCRE | Single Asset/Portfolio: | Single Asset | ||||
| Credit Assessment (KBRA/Fitch/S&P): | NR/NR/NR | Location: | Blue Bell, PA 19422 | ||||
| Original Balance: | $26,500,000 | General Property Type: | Office | ||||
| Cut-off Date Balance: | $26,500,000 | Detailed Property Type: | Suburban | ||||
| % of Initial Pool Balance: | 2.6% | Title Vesting: | Fee | ||||
| Loan Purpose: | Acquisition | Year Built/Renovated: | 1984/2016 | ||||
| Sponsor: | Ephraim Hasenfeld | Size: | 203,705 SF | ||||
| Guarantor: | Ephraim Hasenfeld | Cut-off Date Balance per SF: | $130 | ||||
| Mortgage Rate: | 4.1000% | Maturity Date Balance per SF: | $113 | ||||
| Note Date: | 10/24/2019 | Property Manager: | HEMC Management, Inc. | ||||
| First Payment Date: | 12/6/2019 | (borrower-related) | |||||
| Maturity Date: | 11/6/2029 | Underwriting and Financial Information | |||||
| Original Term to Maturity: | 120 months | UW NOI: | $2,797,364 | ||||
| Original Amortization Term: | 360 months | UW NOI Debt Yield: | 10.6% | ||||
| IO Period: | 36 months | UW NOI Debt Yield at Maturity: | 12.1% | ||||
| Seasoning: | 0 months | UW NCF DSCR: | 2.42x (IO); 1.73x (P&I) | ||||
| Prepayment Provisions: | LO(24); DEF(92); O(4) | Most Recent NOI: | $3,082,125 (7/31/2019 TTM) | ||||
| Lockbox/Cash Mgmt Status: | Soft/Springing | 2nd Most Recent NOI: | $3,037,001 (12/31/2018) | ||||
| Additional Debt Type: | N/A | 3rd Most Recent NOI: | $2,264,494 (12/31/2017) | ||||
| Additional Debt Balance: | N/A | Most Recent Occupancy: | 93.1% (9/1/2019) | ||||
| Future Debt Permitted (Type): | No (N/A) | 2nd Most Recent Occupancy: | 93.6% (12/31/2018) | ||||
| Reserves | 3rd Most Recent Occupancy: | 91.2% (12/31/2017) | |||||
| Type | Initial | Monthly | Cap | Appraised Value (as of)(2): | $37,210,000 (10/10/2019) | ||
| RE Tax: | $106,500 | $27,167 | N/A | Appraised Value per SF: | $183 | ||
| Insurance: | $8,300 | $3,873 | N/A | Cut-off Date LTV Ratio: | 71.2% | ||
| Deferred Maintenance: | $8,625 | $0 | N/A | Maturity Date LTV Ratio: | 61.9% | ||
| Recurring Replacements: | $0 | $2,546 | N/A | ||||
| TI/LC: | $1,000,000 | Springing | $1,000,000 | ||||
| Other(1): | $107,454 | $0 | N/A | ||||
| Sources and Uses | ||||||
| Sources | Proceeds | % of Total | Uses | Proceeds | % of Total | |
| Loan Amount: | $26,500,000 | 73.3% | Purchase Price: | $34,000,000 | 94.1% | |
| Sponsor Equity: | $9,633,824 | 26.7% | Reserves: | $1,230,879 | 3.4% | |
| Closing Costs: | $902,945 | 2.5% | ||||
| Total Sources: | $36,133,824 | 100.0% | Total Uses: | $36,133,824 | 100.0% | |
| (1) | Other reserves consist of $99,270 for owed tenant improvements to Bank of America and $8,184 of owed tenant improvements to Anexinet. Each amount will be released to the 4-5 Sentry Borrower (as defined below) within 10 business days after a written request from the 4-5 Sentry Borrower, provided that all conditions under each respective lease have been met. |
| (2) | The Appraised Value assumes that certain roof repair and tenant work has been completed by the prior owner of the 4-5 Sentry Property (as defined below) at the prior owner’s expense prior to October 1, 2019. The roof repair has been completed, but the tenant work has not been completed. At origination, the 4-5 Sentry Borrower reserved $107,454 with lender to cover such tenant work as described above in footnote (1). |
The Mortgage Loan. The fifteenth largest mortgage loan (the “4-5 Sentry Mortgage Loan”) is evidenced by a promissory note in the original principal amount of $26,500,000 secured by a first priority fee mortgage encumbering a three-building, 203,705 SF Class A office building located in Blue Bell, Pennsylvania (the “4-5 Sentry Property”). The proceeds of the 4-5 Sentry Mortgage Loan along with sponsor equity were used to acquire the 4-5 Sentry Property, fund reserves, and pay closing costs.
The Borrower and the Borrower Sponsor. The borrower is Hudson Sentry LLC (the “4-5 Sentry Borrower”), a Delaware limited liability company structured to be bankruptcy-remote, with one independent director.
The borrower sponsor and non-recourse carveout guarantor is Ephraim Hasenfeld (the “Guarantor”), the founder of Hudson Equities Management Corporation. Hudson Equities Management Corporation manages apartment buildings, office buildings, and shopping centers throughout New Jersey, Pennsylvania, Florida, and Nebraska, totaling over 1 million SF of office and retail space as well as over 800 apartment units.
The Property. The 4-5 Sentry Property consists of three buildings known as 5 Sentry Parkway East, 5 Sentry Parkway West, and 4 Sentry Parkway. The 4-5 Sentry Property was developed in 1984 and renovated in 2016 by the Keystone Property Group, the seller of the 4-5 Sentry Property. Since 2014, the Keystone Property Group invested over $4.3 million of capital expenditures into the three buildings. New amenities at the 5 Sentry East building include a new coffee bar and grab n’ go deli counter, a new tenant lounge, a brand-new fitness center with lake views that includes men’s and women’s locker rooms and a rooftop deck. The upgrades to the 4-5 Sentry Property also include an expanded lobby with new flooring, wall coverings, new signage, hardscaping, landscaping, new glass doors, new carpeting and modern lighting and furniture. The 4-5 Sentry Property also includes an outdoor courtyard with a fire pit and picnic tables located between the 5 Sentry Parkway East building and the 5 Sentry Parkway West building.
| This is not a research report and was not prepared by any Underwriter’s research department. It was prepared by the Underwriters’ sales, trading, banking or other non-research personnel. Please see additional important information and qualifications at the end of this Term Sheet. |
140
| Office – Suburban | Loan #15 | Cut-off Date Balance: | $26,500,000 | |
| 325 & 400 Sentry Parkway | 4-5 Sentry | Cut-off Date LTV: | 71.2% | |
| Blue Bell, PA 19422 | UW NCF DSCR: | 1.73x | ||
| UW NOI Debt Yield: | 10.6% |
As of September 1, 2019, the 4-5 Sentry Property was 93.1% leased to 22 tenants with no tenant representing more than 16.7% of the net rentable area. The largest tenants (based on NRA) are as follows:
Major Tenants.
Linde Engineering North America(“Linde Engineering”)(34,046 SF; 16.7% of NRA; 20.7% of UW Base Rent):Linde Engineering is a wholly-owned subsidiary of the multinational parent company Linde plc. Linde Engineering focuses on market segments such as plants for the production of hydrogen and synthesis gas, oxygen and olefins as well as plants for natural gas treatment. The parent company, Linde plc, is a global Irish-domiciled industrial gas company, which employs approximately 80,000 in more than 100 countries and is publicly traded as part of the DAX 30 & S&P 500.
In June 2016, Linde Engineering executed a lease for 33,246 SF, plus an additional 800 SF of storage space, for a total of 34,046 SF, which expires in November 2024. The tenant’s suite has a newly renovated entrance and the leased space includes private outdoor space. Linde Engineering has one, five-year renewal option and a termination option effective on November 30, 2022, provided that the tenant provides at least 12 months’ prior notice and pays a termination penalty equal to three months’ rent plus any unamortized leasing costs. The income from the 800 SF of storage space demised under the lease was included in other income.
Anexinet Corp and Virtus (“Anexinet”) (25,696 SF; 12.6% of NRA; 14.0% of UW Base Rent): Anexinet specializes in technology consultancy and reselling, assisting clients by providing a digital experience for employees, customers, and users. The company’s main offerings include customer engagement, enterprise mobility, cloud & hybrid IT, and analytics & insights. Anexinet has been a tenant at the 4-5 Sentry Property since September 2009 and has a lease expiration in December 2021 with no renewal or termination options.
WESCO Distribution Inc. (“WESCO”) (15,792 SF; 7.8% of NRA; 8.8% of UW Base Rent): WESCO is wholly owned by WESCO International, a holding company specializing in multinational electronics distribution and services. Founded in 1922, the holding company employs over 9,000 people. WESCO International is publicly listed on the New York Stock Exchange. WESCO executed its lease in April 2019 and has a lease expiration in October 2024 with no renewal or termination options.
Physician Rec Nutruceuticals (“PRN”) (15,772 SF; 7.7% of NRA; 8.6% of UW Base Rent): PRN specializes in the advancement of specialty Omega-3 products and nutritional supplements. PRN partners with ophthalmologists and optometrists who recommend nutruceuticals in order to enhance the long-term ocular health of their patients. PRN’s product lines include supplements and solutions for individuals’ heart health and wellness, joint health, as well as eye treatments for macula and retina treatment, among others. PRN operates its headquarters at the 4-5 Sentry Property. PRN commenced its lease in January 2017 and its lease expires on September 30, 2027 with no renewal or termination options.
RGN (14,112 SF; 6.9% of NRA; 4.7% of UW Base Rent): RGN is a wholly owned subsidiary of IWG plc, a multinational company that offers premium shared workspaces across the country, as well as internationally. Headquartered in Luxembourg, the parent company is traded publicly as part of the FTSE 250 Index on the London Stock Exchange. RGN executed its lease in June 2016 and has a lease expiration in November 2024. RGN has no remaining termination or renewal options under its lease. Pursuant to its lease, RGN is required to pay minimum base rent, as well as additional percentage rent that is calculated as a percentage of its revenue. RGN operates its space at the Mortgaged Property as shared workspace.
The following table presents certain information relating to the tenants at the 4-5 Sentry Property:
| Tenant Summary(1) | |||||||||
| Tenant Name | Credit Ratings (Fitch/Moody’s/S&P) | Tenant SF | Approx. % of SF | Annual UW Rent | Annual UW Rent PSF | App. % of Total Annual UW Rent | Lease Expiration | Termination Option (Y/N) | |
| Linde Engineering North America(2) | NR/NR/NR | 34,046 | 16.7% | $856,085 | $25.14 | 20.7% | 11/30/2024 | Y | |
| Anexinet Corp and Virtus | NR/NR/NR | 25,696 | 12.6% | $578,160 | $22.50 | 14.0% | 12/31/2021 | N | |
| WESCO Distribution Inc. | NR/NR/NR | 15,792 | 7.8% | $366,136 | $23.18 | 8.8% | 10/31/2024 | N | |
| Physician Rec Nutruceuticals | NR/NR/NR | 15,772 | 7.7% | $356,605 | $22.61 | 8.6% | 9/30/2027 | N | |
| RGN | NR/NR/NR | 14,112 | 6.9% | $194,746 | $13.80 | 4.7% | 11/30/2024 | N | |
| Total Major Tenants | 105,418 | 51.8% | $2,351,731 | $22.31 | 56.8% | ||||
| Other Tenants(3) | 84,212 | 41.3% | $1,790,474 | $21.26 | 43.2% | ||||
| Vacant Space | 14,075 | 6.9% | $0 | $0.00 | |||||
| Total / Wtd. Avg. Occupied | 203,705 | 100.0% | 4,142,206 | $21.84 | 100.0% | ||||
| (1) | Based on the underwritten rent roll dated September 1, 2019. |
| (2) | Linde Engineering North America occupies 33,246 SF of office space and 800 SF of storage space, both expiring in November 2024. Linde Engineering North America has one, five-year renewal option and one termination option, which are applicable to all 34,046 SF of space. |
| (3) | Other Tenants include Linton’s Managed Services and Veterinarian Rec Solutions, which were underwritten as 100% and 50% vacant, respectively. |
| This is not a research report and was not prepared by any Underwriter’s research department. It was prepared by the Underwriters’ sales, trading, banking or other non-research personnel. Please see additional important information and qualifications at the end of this Term Sheet. |
141
| Office – Suburban | Loan #15 | Cut-off Date Balance: | $26,500,000 | |
| 325 & 400 Sentry Parkway | 4-5 Sentry | Cut-off Date LTV: | 71.2% | |
| Blue Bell, PA 19422 | UW NCF DSCR: | 1.73x | ||
| UW NOI Debt Yield: | 10.6% |
The following table presents the lease rollover schedule with respect to the 4-5 Sentry Property:
| Lease Rollover Schedule(1)(2) | |||||||||
| Year | # of Leases Rolling | SF Rolling | Annual UW Rent PSF Rolling | % of Total SF Rolling | Cumulative % of SF Rolling | Annual UW Rent Rolling | % of Annual UW Rent Rolling | Cumulative % of Annual UW Rent Rolling | |
| MTM | 0 | 0 | $0.00 | 0.0% | 0.0% | $0 | 0.0% | 0.0% | |
| 2019 | 0 | 0 | $0.00 | 0.0% | 0.0% | $0 | 0.0% | 0.0% | |
| 2020 | 1 | 6,173 | $21.75 | 3.0% | 3.0% | $134,263 | 3.2% | 3.2% | |
| 2021 | 2 | 29,683 | $22.77 | 14.6% | 17.6% | $675,762 | 16.3% | 19.6% | |
| 2022 | 2 | 4,827 | $25.68 | 2.4% | 20.0% | $123,957 | 3.0% | 22.5% | |
| 2023 | 2 | 7,420 | $23.22 | 3.6% | 23.6% | $172,309 | 4.2% | 26.7% | |
| 2024 | 12 | 107,467 | $22.44 | 52.8% | 76.4% | $2,411,183 | 58.2% | 84.9% | |
| 2025 | 1 | 3,399 | $24.50 | 1.7% | 78.0% | $83,276 | 2.0% | 86.9% | |
| 2026 | 2 | 7,423 | $24.90 | 3.6% | 81.7% | $184,852 | 4.5% | 91.4% | |
| 2027 | 1 | 15,772 | $22.61 | 7.7% | 89.4% | $356,605 | 8.6% | 100.0% | |
| 2028 | 0 | 0 | $0.00 | 0.0% | 89.4% | $0 | 0.0% | 100.0% | |
| 2029 | 0 | 0 | $0.00 | 0.0% | 89.4% | $0 | 0.0% | 100.0% | |
| 2030 & Beyond | 2 | 7,466 | $0.00 | 3.7% | 93.1% | $0 | 0.0% | 100.0% | |
| Vacant | 0 | 14,075 | $0.00 | 6.9% | 100.0% | $0 | 0.0% | 100.0% | |
| Total / Wtd. Avg. | 25 | 203,705 | $21.84 | 100.0% | $4,142,206 | 100.0% | |||
| (1) | Based on the underwritten rent roll dated September 1, 2019. |
| (2) | Certain tenants may have termination or contraction options (which may become exercisable prior to the originally stated expiration date of the tenant lease) that are not considered in the above Lease Rollover Schedule. |
The Market. The 4-5 Sentry Property is located in Blue Bell, Pennsylvania, within Montgomery County. It is located approximately 35 minutes from Philadelphia, bounded by Lehigh County to the north, Philadelphia and Bucks Counties to the east, Delaware County to the south, and Chester County to the west. The 4-5 Sentry Property is located in a suburban office park setting. Blue Bell is accessible to commuters as it is just 3.8 miles from the intersection of the PA Turnpike (I-276) and Blue Route (I-476). The Pennsylvania Turnpike and the Pike’s Extension provide access to Philadelphia. Retail presence consists of restaurants, shopping centers, convenience stores, and locally owned businesses. There are multiple multi-family developments of approximately 2.8 million SF in the area. Blue Bell also has 147 retail developments with shopping centers such as Plymouth Meeting Mall, Metroplex Shopping Center, and Northtowne Plaza within a three-mile radius. It is also the home to the corporate headquarters of U.S. Maintenance and U.S. Roofing Corporation.
According to the appraisal, the 2018 population within a one-, three- and five-mile radius of the 4-5 Sentry Property was 3,178, 46,384 and 175,499, respectively. The 2018 median household income within the same one-, three- and five-mile radius was $119,111, $95,212 and $80,569, respectively.
The following table presents certain information regarding comparable office leases with respect to the 4-5 Sentry Property:
| Comparable Office Lease Summary | ||||||||
| Property/Location | Year Built | SF | Tenant Name | Size (SF) | Lease Start Date | Lease Term (Yrs.) | Adjusted Rent PSF | |
| Harvest Point Blue Bell, PA | 1991 | 121,835 | Company Voice | 34,559 | 8/1/2019 | 3 | $22.00 | |
| 518 Township Line Road Plymouth Meeting, PA | 1970 | 112,692 | Skanksa USA | 10,839 | 8/1/2019 | 5 | $25.50 | |
| VEVA 14 Blue Bell, PA | 1973 | 87,887 | Achillion Pharmaceuticals | 12,298 | 1/1/2019 | 4 | $23.03 | |
| 518 Township Line Road Plymouth Meeting, PA | 1970 | 123,440 | Ostroff Injury Law | 9,612 | 8/1/2018 | 13 | $25.50 | |
| 1787 Sentry Parkway West Blue Bell, PA | 1988 | 192,631 | Communication Graphics, Inc. | 4,692 | 7/1/2018 | 3 | $26.01 | |
Source:Appraisal.
| This is not a research report and was not prepared by any Underwriter’s research department. It was prepared by the Underwriters’ sales, trading, banking or other non-research personnel. Please see additional important information and qualifications at the end of this Term Sheet. |
142
| Office – Suburban | Loan #15 | Cut-off Date Balance: | $26,500,000 | |
| 325 & 400 Sentry Parkway | 4-5 Sentry | Cut-off Date LTV: | 71.2% | |
| Blue Bell, PA 19422 | UW NCF DSCR: | 1.73x | ||
| UW NOI Debt Yield: | 10.6% |
Operating History and Underwritten Net Cash Flow.The following table presents certain information relating to the historical operating performance and Underwritten Net Cash Flow at the 4-5 Sentry Property:
| Cash Flow Analysis | |||||
| 2017 | 2018 | 7/31/2019 TTM | UW | UW PSF | |
| Gross Potential Rent(1) | $3,312,564 | $3,995,601 | $4,092,429 | $4,462,830 | $21.91 |
| Total Recoveries | $189,755 | 308,158 | 248,803 | $171,932 | $0.84 |
| % Rents | $115,109 | 157,540 | 107,112 | $110,000 | $0.54 |
| Other Income(2) | $14,913 | $19,485 | $17,818 | $17,818 | $0.09 |
| Vacancy(3) | $0 | $0 | $0 | ($525,618) | ($2.58) |
| Effective Gross Income | $3,632,341 | $4,480,783 | $4,466,161 | $4,236,962 | $20.80 |
| Real Estate Taxes | $338,468 | $346,048 | $350,373 | $360,579 | $1.77 |
| Insurance | $44,006 | $36,996 | $38,841 | $38,841 | $0.19 |
| Other Operating Expenses | $985,372 | $1,060,738 | $994,823 | $1,040,178 | $5.11 |
| Total Operating Expenses | $1,367,847 | $1,443,782 | $1,384,037 | $1,439,597 | $7.07 |
| Net Operating Income | $2,264,494 | $3,037,001 | $3,082,125 | $2,797,364 | $13.73 |
| TI/LC | $0 | $0 | $0 | $101,853 | $0.50 |
| Capital Expenditures | $0 | $0 | $0 | $30,556 | $0.15 |
| Net Cash Flow | $2,264,494 | $3,037,001 | $3,082,125 | $2,664,956 | $13.08 |
| Occupancy % | 91.2% | 93.6% | 93.1% | 88.9% | |
| NOI DSCR (IO) | 2.06x | 2.76x | 2.80x | 2.54x | |
| NOI DSCR (P&I) | 1.47x | 1.98x | 2.01x | 1.82x | |
| NCF DSCR (IO) | 2.06x | 2.76x | 2.80x | 2.42x | |
| NCF DSCR (P&I) | 1.47x | 1.98x | 2.01x | 1.73x | |
| NOI Debt Yield | 8.5% | 11.5% | 11.6% | 10.6% | |
| NCF Debt Yield | 8.5% | 11.5% | 11.6% | 10.1% | |
| (1) | UW Gross Potential Rent is based on the contractual rental income per the leases, with the vacant units grossed up to the appraiser’s market rent assumption. Rent escalations were incorporated for tenants with steps through October 1, 2020, totaling $78,000. |
| (2) | Other Income includes revenue from storage space and miscellaneous income. |
| (3) | UW Vacancy represents an economic vacancy of 11.1%. The 4-5 Sentry Property has a physical vacancy of 6.9% as of September 1, 2019. Linton’s Managed Services (6,173 SF, 3.0% of NRA) was underwritten as 100% vacant because the tenant did not exercise its renewal option and Veterinarian Rec Solutions (5,663 SF, 2.8% of NRA) was underwritten as 50% vacant because the tenant is currently looking to sublet its suite. |
| This is not a research report and was not prepared by any Underwriter’s research department. It was prepared by the Underwriters’ sales, trading, banking or other non-research personnel. Please see additional important information and qualifications at the end of this Term Sheet. |
143
| MSC 2019 L3 |
This material was prepared by sales, trading, banking or other non-research personnel of one of the following: Morgan Stanley & Co. LLC, Morgan Stanley & Co. International Limited, Morgan Stanley Japan Limited and/or Morgan Stanley Dean Witter Asia Limited (together with their affiliates, hereinafter “Morgan Stanley”), KeyBanc Capital Markets Inc. (together with its affiliates, “KeyBanc”), Cantor Fitzgerald & Co. (together with its affiliates, “Cantor”) and The Williams Capital Group, L.P. (together with its affiliates, “WCG” and, collectively with Morgan Stanley, KeyBanc and Cantor, the “Underwriters”). This material was not produced by an Underwriter’s research analyst, although it may refer to an Underwriter’s research analyst or research report. Unless otherwise indicated, these views (if any) are the author’s and may differ from those of the fixed income or equity research departments of the Underwriters or others in those firms.
This material may have been prepared by or in conjunction with the respective trading desks of the Underwriters that may deal as principal in or own or act as market maker or liquidity provider for the securities/instruments (or related derivatives) mentioned herein. The trading desk may have accumulated a position in the subject securities/instruments based on the information contained herein. Trading desk materials are not independent of the proprietary interests of the Underwriters, which may conflict with your interests. Each of the Underwriters may also perform or seek to perform investment banking services for the issuers of the securities and instruments mentioned herein.
The information contained in this material is subject to change, completion or amendment from time to time, and the information in this material supersedes information in any other communication relating to the securities referred to in this material. This material is not a solicitation to participate in any trading strategy, and is not an offer to sell any security or instrument or a solicitation of an offer to buy or sell any security or instrument in any jurisdiction where an offer, solicitation or sale is not permitted. Unless otherwise set forth in this material, any securities referred to in this material may not have been registered under the U.S. Securities Act of 1933, as amended, and, if not, may not be offered or sold absent an exemption therefrom. Recipients are required to comply with any legal or contractual restrictions on their purchase, holding, sale, exercise of rights or performance of obligations under any securities/instruments transaction.
The securities/instruments discussed in this material may not be suitable for all investors. This material has been prepared and issued by the Underwriters for intended distribution to market professionals and institutional investor clients. Other recipients should seek independent investment advice prior to making any investment decision based on this material. This material does not provide individually tailored investment advice or offer tax, regulatory, accounting or legal advice. Prior to entering into any proposed transaction, recipients should determine, in consultation with their own investment, legal, tax, regulatory and accounting advisors, the economic risks and merits, as well as the legal, tax, regulatory and accounting characteristics and consequences, of the transaction. You should consider this material as only a single factor in making an investment decision.
The value of and income from investments may vary because of changes in interest rates, foreign exchange rates, default rates, prepayment rates, securities/instruments prices, market indexes, operational or financial conditions of companies or other factors. There may be time limitations on the exercise of options or other rights in securities/instruments transactions. Past performance is not necessarily a guide to future performance. Estimates of future performance are based on assumptions that may not be realized. Actual events may differ from those assumed and changes to any assumptions may have a material impact on any projections or estimates. Other events not taken into account may occur and may significantly affect the projections or estimates. Certain assumptions may have been made for modeling purposes only to simplify the presentation and/or calculation of any projections or estimates, and the Underwriters do not represent that any such assumptions will reflect actual future events. Accordingly, there can be no assurance that estimated returns or projections will be realized or that actual returns or performance results will not materially differ from those estimated herein. Some of the information contained in this document may be aggregated data of transactions in securities or other financial instruments executed by an Underwriter that has been compiled so as not to identify the underlying transactions of any particular customer.
Notwithstanding anything herein to the contrary, the Underwriters and each recipient hereof (and their employees, representatives, and other agents) may disclose to any and all persons, without limitation of any kind from the commencement of discussions, the U.S. federal and state income tax treatment and tax structure of the transaction and all materials of any kind (including opinions or other tax analyses) that are provided to it relating to the tax treatment and tax structure (as such terms are defined in Treasury Regulation 1.6011-4). For this purpose, "tax structure" is limited to facts relevant to the U.S. federal and state income tax treatment of the transaction and does not include information relating to the identity of the parties, their affiliates, agents or advisors. This authorization of tax disclosure is retroactively effective to the commencement of discussions with prospective investors regarding the transactions contemplated herein.
THE DISTRIBUTION OF THIS MATERIAL (A) IF MADE BY A PERSON WHO IS NOT AN AUTHORIZED PERSON UNDER THE FINANCIAL SERVICES AND MARKETS ACT 2000 (“FSMA”), IS BEING MADE ONLY TO, OR DIRECTED ONLY AT, PERSONS WHO (I) ARE OUTSIDE THE UNITED KINGDOM, (II) HAVE PROFESSIONAL EXPERIENCE IN MATTERS RELATING TO INVESTMENTS AND QUALIFY AS INVESTMENT PROFESSIONALS IN ACCORDANCE WITH ARTICLE 19(5) OF THE FINANCIAL SERVICES AND MARKETS ACT 2000 (FINANCIAL PROMOTION) ORDER 2005 (AS AMENDED, THE “FINANCIAL PROMOTION ORDER”), OR (III) ARE PERSONS FALLING WITHIN ARTICLE 49(2)(A) THROUGH (D) (“HIGH NET WORTH COMPANIES, UNINCORPORATED ASSOCIATIONS, ETC.”) OF THE FINANCIAL PROMOTION ORDER; AND (B) IF MADE BY A PERSON WHO IS AN AUTHORIZED PERSON UNDER THE FSMA, IS BEING MADE ONLY TO, OR DIRECTED ONLY AT, PERSONS WHO (I) ARE OUTSIDE THE UNITED KINGDOM, (II) HAVE PROFESSIONAL EXPERIENCE OF PARTICIPATING IN UNREGULATED SCHEMES (AS DEFINED FOR PURPOSES OF THE FINANCIAL SERVICES AND MARKETS ACT 2000 (PROMOTION OF COLLECTIVE INVESTMENT SCHEMES) (EXEMPTIONS) ORDER 2001 (AS AMENDED, THE “PROMOTION OF COLLECTIVE INVESTMENT SCHEMES EXEMPTIONS ORDER”)) AND QUALIFY AS INVESTMENT PROFESSIONALS IN ACCORDANCE WITH ARTICLE 14(5) OF THE PROMOTION OF COLLECTIVE INVESTMENT SCHEMES EXEMPTIONS ORDER, (III) ARE PERSONS FALLING WITHIN ARTICLE 22(2)(A) THROUGH (D) (“HIGH NET WORTH COMPANIES, UNINCORPORATED ASSOCIATIONS, ETC.”) OF THE PROMOTION OF COLLECTIVE INVESTMENT SCHEMES EXEMPTIONS ORDER, OR (IV) ARE PERSONS TO WHOM THE ISSUING ENTITY MAY LAWFULLY BE PROMOTED IN ACCORDANCE WITH SECTION 4.12 OF THE UK FINANCIAL CONDUCT AUTHORITY’S CONDUCT OF BUSINESS SOURCEBOOK.
THE OFFERED CERTIFICATES HAVE NOT BEEN AND WILL NOT BE REGISTERED UNDER THE FINANCIAL INSTRUMENTS AND EXCHANGE LAW OF JAPAN, AS AMENDED (THE “FIEL”), AND DISCLOSURE UNDER THE FIEL HAS NOT BEEN AND WILL NOT BE MADE WITH RESPECT TO THE OFFERED CERTIFICATES. ACCORDINGLY, EACH OF MORGAN STANLEY & CO. LLC, KEYBANC CAPITAL MARKETS INC., CANTOR FITZGERALD & CO. AND THE WILLIAMS CAPITAL GROUP, L.P. HAS REPRESENTED AND AGREED THAT IT HAS NOT, DIRECTLY OR INDIRECTLY, OFFERED OR SOLD AND WILL NOT, DIRECTLY OR INDIRECTLY, OFFER OR SELL ANY OFFERED CERTIFICATES IN JAPAN OR TO, OR FOR THE BENEFIT OF, ANY RESIDENT OF JAPAN (WHICH TERM AS USED IN THIS MATERIAL MEANS ANY PERSON RESIDENT IN JAPAN, INCLUDING ANY CORPORATION OR OTHER ENTITY ORGANIZED UNDER THE LAWS OF JAPAN) OR TO OTHERS FOR REOFFERING OR RE SALE, DIRECTLY OR INDIRECTLY, IN JAPAN OR TO, OR FOR THE BENEFIT OF, ANY RESIDENT OF JAPAN EXCEPT PURSUANT TO AN EXEMPTION FROM THE REGISTRATION REQUIREMENTS OF, AND OTHERWISE IN COMPLIANCE WITH, THE FIEL AND OTHER RELEVANT LAWS, REGULATIONS AND MINISTERIAL GUIDELINES OF JAPAN. AS PART OF THIS OFFERING OF THE OFFERED CERTIFICATES, THE UNDERWRITERS MAY OFFER THE OFFERED CERTIFICATES IN JAPAN TO UP TO 49 OFFEREES IN ACCORDANCE WITH THE ABOVE PROVISIONS.
© 2019 Morgan Stanley