| FREE WRITING PROSPECTUS | ||
| FILED PURSUANT TO RULE 433 | ||
| REGISTRATION FILE NO.: 333-227446-08 | ||
|
|
|


BANK 2019-BNK23
Free Writing Prospectus
Structural and Collateral Term Sheet
$1,287,022,414
(Approximate Total Mortgage Pool Balance)
$1,094,290,000
(Approximate Offered Certificates)
Morgan Stanley Capital I Inc.
as Depositor
Wells Fargo Bank, National Association
Bank of America, National Association
Morgan Stanley Mortgage Capital Holdings LLC
as Sponsors and Mortgage Loan Sellers
Commercial Mortgage Pass-Through Certificates
Series 2019-BNK23
November 18, 2019
MORGAN STANLEY Co-Lead Bookrunner Manager | BofA SECURITIES Co-Lead Bookrunner Manager | WELLS FARGO SECURITIES Co-Lead Bookrunner Manager |
|
|
|
Academy Securities, Inc. Co-Manager |
| Drexel Hamilton Co-Manager |
| ||
STATEMENT REGARDING THIS FREE WRITING PROSPECTUS
The depositor has filed a registration statement (including a prospectus) with the SEC (File No. 333-227446) for the offering to which this communication relates. Before you invest, you should read the prospectus in that registration statement and other documents the depositor has filed with the SEC for more complete information about the depositor, the issuing entity and this offering. You may get these documents for free by visiting EDGAR on the SEC web site at www.sec.gov. Alternatively, the depositor or any underwriter or any dealer participating in the offering will arrange to send you the prospectus if you request it by calling toll free 1-866-718-1649 or by email to prospectus@ms.com.
| This is not a research report and was not prepared by any Underwriter’s research department. Please see additional important information and qualifications at the end of this Term Sheet. |
BANK 2019-BNK23 | Structural Overview |
Neither this Term Sheet nor anything contained herein shall form the basis for any contract or commitment whatsoever. The information contained herein is preliminary as of the date hereof. This Term Sheet is subject to change, completion or amendment from time to time. The information contained herein supersedes information in any other communication relating to the securities described herein; provided, that the information contained herein will be superseded by similar information delivered to you as part of the Preliminary Prospectus. The information contained herein should be reviewed only in conjunction with the entire Preliminary Prospectus. All of the information contained herein is subject to the same limitations and qualifications contained in the Preliminary Prospectus. The information contained herein does not contain all relevant information relating to the underlying mortgage loans or mortgaged properties. Such information is described in the Preliminary Prospectus. The information contained herein will be more fully described in the Preliminary Prospectus. The information contained herein should not be viewed as projections, forecasts, predictions or opinions with respect to value. Prior to making any investment decision, prospective investors are strongly urged to read the Preliminary Prospectus in its entirety. Neither the Securities and Exchange Commission nor any state securities commission has approved or disapproved of these securities or determined if this Term Sheet is truthful or complete. Any representation to the contrary is a criminal offense.
IMPORTANT NOTICE RELATING TO AUTOMATICALLY GENERATED EMAIL DISCLAIMERS
Any legends, disclaimers or other notices that may appear at the bottom of, or attached to, the email communication to which this Term Sheet may have been attached are not applicable to this Term Sheet and should be disregarded. Such legends, disclaimers or other notices have been automatically generated as a result of this Term Sheet having been sent via Bloomberg or another email system.
IMPORTANT NOTICE REGARDING THE CONDITIONS FOR THIS OFFERING OF ASSET-BACKED SECURITIES
THE ASSET-BACKED SECURITIES REFERRED TO IN THIS TERM SHEET ARE BEING OFFERED WHEN, AS AND IF ISSUED. IN PARTICULAR, YOU ARE ADVISED THAT THE ASSET-BACKED SECURITIES, AND THE ASSET POOL BACKING THEM, ARE SUBJECT TO MODIFICATION OR REVISION (INCLUDING, AMONG OTHER THINGS, THE POSSIBILITY THAT ONE OR MORE CLASSES OF SECURITIES MAY BE SPLIT, COMBINED OR ELIMINATED), AT ANY TIME PRIOR TO ISSUANCE OR AVAILABILITY OF A FINAL PROSPECTUS. AS A RESULT, YOU MAY COMMIT TO PURCHASE SECURITIES THAT HAVE CHARACTERISTICS THAT MAY CHANGE, AND YOU ARE ADVISED THAT ALL OR A PORTION OF THE SECURITIES MAY NOT BE ISSUED THAT HAVE THE CHARACTERISTICS DESCRIBED IN THIS TERM SHEET. OUR OBLIGATION TO SELL SECURITIES TO YOU IS CONDITIONED ON THE SECURITIES AND THE UNDERLYING TRANSACTION HAVING THE CHARACTERISTICS DESCRIBED IN THIS TERM SHEET. IF WE DETERMINE THAT THE FOREGOING CONDITION IS NOT SATISFIED IN ANY MATERIAL RESPECT, WE WILL NOTIFY YOU, AND NEITHER THE ISSUING ENTITY NOR ANY UNDERWRITER WILL HAVE ANY OBLIGATION TO YOU TO DELIVER ALL OR ANY PORTION OF THE SECURITIES WHICH YOU HAVE COMMITTED TO PURCHASE, AND THERE WILL BE NO LIABILITY BETWEEN US AS A CONSEQUENCE OF THE NON-DELIVERY.
| This is not a research report and was not prepared by any Underwriter’s research department. Please see additional important information and qualifications at the end of this Term Sheet. |
T-2
BANK 2019-BNK23 | Structural Overview |
Offered Certificates
|
|
|
|
|
|
|
|
|
Class | Expected Ratings | Approximate Initial Certificate Balance or Notional Amount(2) | Approximate Initial Credit Support(3) | Pass-Through Rate Description | Expected Weighted Average Life (Years)(4) | Expected Principal | Certificate Principal UW NOI Debt | Certificate |
Class A-1 | AAAsf/AAA(sf)/AAA(sf) | $14,000,000 | 30.000% | (7) | 2.76 | 1-60 | 15.1% | 39.3% |
Class A-SB | AAAsf/AAA(sf)/AAA(sf) | $27,500,000 | 30.000% | (7) | 7.45 | 60-116 | 15.1% | 39.3% |
Class A-2 | AAAsf/AAA(sf)/AAA(sf) | (8) | 30.000% | (7) | (8) | (8) | 15.1% | 39.3% |
Class A-3 | AAAsf/AAA(sf)/AAA(sf) | (8) | 30.000% | (7) | (8) | (8) | 15.1% | 39.3% |
Class X-A | AAAsf/AAA(sf)/AAA(sf) | $855,869,000(9) | N/A | Variable IO(10) | N/A | N/A | N/A | N/A |
Class X-B | A-sf/NR/AAA(sf) | $238,421,000(9) | N/A | Variable IO(10) | N/A | N/A | N/A | N/A |
Class A-S | AAAsf/AA+(sf)/AAA(sf) | $128,381,000 | 19.500% | (7) | 9.93 | 119-119 | 13.2% | 45.2% |
Class B | AA-sf/NR/AA(sf) | $56,548,000 | 14.875% | (7) | 9.93 | 119-119 | 12.5% | 47.8% |
Class C | A-sf/NR/A(sf) | $53,492,000 | 10.500% | (7) | 10.01 | 119-120 | 11.8% | 50.2% |
Privately Offered Certificates(11)
|
|
|
|
|
|
|
|
|
Class | Expected Ratings | Approximate Initial Certificate Balance or Notional Amount(2) | Approximate | Pass-Through Rate Description | Expected Weighted Average Life (Years)(4) | Expected Principal | Certificate | Certificate |
Class X-D | BBB-sf/NR/BBB-(sf) | $55,021,000(9) | N/A | Variable IO(10) | N/A | N/A | N/A | N/A |
Class X-F | BB-sf/NR/BB-(sf) | $22,925,000(9) | N/A | Variable IO(10) | N/A | N/A | N/A | N/A |
Class X-G | B-sf/NR/B-(sf) | $12,226,000(9) | N/A | Variable IO(10) | N/A | N/A | N/A | N/A |
Class X-H | NR/NR/NR | $38,209,293(9) | N/A | Variable IO(10) | N/A | N/A | N/A | N/A |
Class D | BBBsf/NR/BBB+(sf) | $32,095,000 | 7.875% | (7) | 10.01 | 120-120 | 11.5% | 51.7% |
Class E | BBB-sf/NR/BBB-(sf) | $22,926,000 | 6.000% | (7) | 10.01 | 120-120 | 11.3% | 52.7% |
Class F | BB-sf/NR/BB-(sf) | $22,925,000 | 4.125% | (7) | 10.01 | 120-120 | 11.1% | 53.8% |
Class G | B-sf/NR/B-(sf) | $12,226,000 | 3.125% | (7) | 10.01 | 120-120 | 10.9% | 54.3% |
Class H | NR/NR/NR | $38,209,293 | 0.000% | (7) | 10.01 | 120-120 | 10.6% | 56.1% |
Non-Offered Eligible Vertical Interest(11)
Class | Expected Ratings | Approximate Initial Certificate Balance or Notional Amount(2) | Approximate | Pass-Through Rate Description | Expected Weighted Average Life (Years)(4) | Expected Principal | Certificate Principal UW NOI Debt Yield | Certificate Principal to Value Ratio |
RR Interest | NR/NR/NR | $64,351,120.72 | N/A | (12) | 9.76 | 1-120 | N/A | N/A |
(1) | Ratings shown are those of Fitch Ratings, Inc. (“Fitch”), S&P Global Ratings, acting through Standard & Poor’s Financial Services LLC (“S&P”), and Kroll Bond Rating Agency, Inc. (“KBRA”). Certain nationally recognized statistical rating organizations that were not hired by the depositor may use information they receive pursuant to Rule 17g-5 under the Securities Exchange Act of 1934, as amended, or otherwise to rate the certificates. There can be no assurance as to what ratings a non-hired nationally recognized statistical rating organization would assign. See “Risk Factors—Other Risks Relating to the Certificates—Nationally Recognized Statistical Rating Organizations May Assign Different Ratings to the Certificates; Ratings of the Certificates Reflect Only the Views of the Applicable Rating Agencies as of the Dates Such Ratings Were Issued; Ratings May Affect ERISA Eligibility; Ratings May Be Downgraded” and “Ratings” in the Preliminary Prospectus to be dated on or about the date hereof (the “Preliminary Prospectus”). Capitalized terms used but not defined herein have the meanings assigned to such terms in the Preliminary Prospectus. |
(2) | Approximate, subject to a permitted variance of plus or minus 5% and further subject to the discussion in footnote (8) below. In addition, the notional amounts of the Class X-A, Class X-B, Class X-D, Class X-F, Class X-G and Class X-H certificates may vary depending upon the final pricing of the classes of principal balance certificates whose certificate balances comprise such notional amounts, and, if as a result of such pricing the pass-through rate of any class of the Class X-A, Class X-B, Class X-D, Class X-F, Class X-G or Class X-H certificates, as applicable, would be equal to zero at all times, such class of certificates will not be issued on the closing date of this securitization. |
(3) | The approximate initial credit support percentages set forth for the certificates are approximate and, for the Class A-1, Class A-SB, Class A-2 and Class A-3 certificates, are represented in the aggregate. The RR Interest provides credit support only to the limited extent that it is allocated a portion of any losses incurred on the underlying mortgage loans, which such losses are allocated between it, on the one hand, and to the Non-Retained Certificates, on the other hand, pro rata in accordance with their respective Percentage Allocation Entitlements (as defined below). See “Credit Risk Retention” in the Preliminary Prospectus. |
(4) | The Expected Weighted Average Life and Expected Principal Window during which distributions of principal would be received as set forth in the foregoing table with respect to each class of certificates having a certificate balance are based on the assumptions set forth under “Yield and Maturity Considerations—Weighted Average Life” in the Preliminary Prospectus and on the assumptions that there are no prepayments, modifications or losses in respect of the mortgage loans and that there are no extensions or forbearances of maturity dates or anticipated repayment dates of the mortgage loans. |
| This is not a research report and was not prepared by any Underwriter’s research department. Please see additional important information and qualifications at the end of this Term Sheet. |
T-3
BANK 2019-BNK23 | Structural Overview |
(5) | Certificate Principal UW NOI Debt Yield for any class of principal balance certificates (other than the RR Interest) is calculated as the product of (a) the weighted average UW NOI Debt Yield for the mortgage pool, multiplied by (b) a fraction, the numerator of which is the total initial certificate balance of all the principal balance certificates, and the denominator of which is the sum of (x) the total initial certificate balance of the subject class of principal balance certificates and all other classes of principal balance certificates (other than the RR Interest), if any, that are senior to such class and (y) the outstanding certificate balance of the RR Interest, multiplied by the applicable RR Interest Computation Percentage. The Certificate Principal UW NOI Debt Yields of the Class A-1, Class A-SB, Class A-2 and Class A-3 certificates are calculated in the aggregate for those classes as if they were a single class. With respect to any class of principal balance certificates, the “RR Interest Computation Percentage” is equal to a fraction, expressed as a percentage, the numerator of which is the total initial certificate balance of the subject class of principal balance certificates and all other classes of principal balance certificates (other than the RR Interest), if any, that are senior to such class, and the denominator of which is the sum of the total initial certificate balance of all the principal balance certificates (other than the RR Interest). |
(6) | Certificate Principal to Value Ratio for any class of principal balance certificates (other than the RR Interest) is calculated as the product of (a) the weighted average Cut-off Date LTV Ratio of the mortgage pool, multiplied by (b) a fraction, the numerator of which is the sum of (x) the total initial certificate balance of the subject class of principal balance certificates and all other classes of principal balance certificates (other than the RR Interest), if any, that are senior to such class and (y) the outstanding certificate balance of the RR Interest, multiplied by the applicable RR Interest Computation Percentage, and the denominator of which is the total initial certificate balance of all the principal balance certificates. The Certificate Principal to Value Ratios of the Class A-1, Class A-SB, Class A-2 and Class A-3 certificates are calculated in the aggregate for those classes as if they were a single class. |
(7) | The pass-through rate for each class of the Class A-1, Class A-SB, Class A-2, Class A-3, Class A-S, Class B, Class C, Class D, Class E, Class F, Class G and Class H certificates (which, together with the RR Interest, are referred to as the “principal balance certificates”) will be one of the following: (i) a fixed rate per annum, (ii) a variable rate per annum equal to the weighted average of the net mortgage interest rates on the mortgage loans for the related distribution date, (iii) a variable rate per annum equal to the lesser of (a) a fixed rate and (b) the weighted average of the net mortgage interest rates on the mortgage loans for the related distribution date or (iv) a variable rate per annum equal to the weighted average of the net mortgage interest rates on the mortgage loans for the related distribution date minus a specified percentage. For purposes of the calculation of the weighted average of the net mortgage interest rates on the mortgage loans for each distribution date, the net mortgage interest rates will be adjusted as necessary to a 30/360 basis. |
(8) | The exact initial certificate balances of the Class A-2 and Class A-3 certificates are unknown and will be determined based on the final pricing of those classes of certificates. However, the initial certificate balances, weighted average lives and principal windows of the Class A-2 and Class A-3 certificates are expected to be within the applicable ranges reflected in the following chart. The aggregate initial certificate balance of the Class A-2 and Class A-3 certificates is expected to be approximately $814,369,000, subject to a variance of plus or minus 5%. |
Class of Certificates | Expected Range of Initial Certificate Balance | Expected Range of Weighted Average Life (Years) | Expected Range of Principal Window (Months) |
Class A-2 | $200,000,000 - $375,000,000 | 9.74 – 9.79 | 116 – 118 / 116 – 118 |
Class A-3 | $439,369,000 - $614,369,000 | 9.91 – 9.93 | 118 – 119 / 118 – 119 |
(9) | The Class X-A, Class X-B, Class X-D, Class X-F, Class X-G and Class X-H certificates (collectively referred to as the “Class X certificates”) are notional amount certificates and will not be entitled to distributions of principal. The notional amount of the Class X-A certificates will be equal to the aggregate certificate balance of the Class A-1, Class A-SB, Class A-2 and Class A-3 certificates. The notional amount of the Class X-B certificates will be equal to the aggregate certificate balance of the Class A-S, Class B and Class C certificates. The notional amount of the Class X-D certificates will be equal to the aggregate certificate balance of the Class D and Class E certificates. The notional amount of each class of the Class X-F, Class X-G and Class X-H certificates will be equal to the certificate balance of the class of principal balance certificates that, with the addition of “X-,” has the same alphabetical designation as the subject class of Class X certificates. |
(10) | The pass-through rate for the Class X-A certificates for any distribution date will be a per annum rate equal to the excess, if any, of (a) the weighted average of the net mortgage interest rates on the mortgage loans for the related distribution date, over (b) the weighted average of the pass-through rates on the Class A-1, Class A-SB, Class A-2 and Class A-3 certificates for the related distribution date, weighted on the basis of their respective certificate balances outstanding immediately prior to that distribution date. The pass-through rate for the Class X-B certificates for any distribution date will be a per annum rate equal to the excess, if any, of (a) the weighted average of the net mortgage interest rates on the mortgage loans for the related distribution date, over (b) the weighted average of the pass-through rates on the Class A-S, Class B and Class C certificates for the related distribution date, weighted on the basis of their respective certificate balances outstanding immediately prior to that distribution date. The pass-through rate for the Class X-D certificates for any distribution date will be a per annum rate equal to the excess, if any, of (a) the weighted average of the net mortgage interest rates on the mortgage loans for the related distribution date, over (b) the weighted average of the pass-through rates on the Class D and Class E certificates for the related distribution date, weighted on the basis of their respective certificate balances outstanding immediately prior to that distribution date. The pass-through rate for each class of the Class X-F, Class X-G and Class X-H certificates for any distribution date will be a per annum rate equal to the excess, if any, of (a) the weighted average of the net mortgage interest rates on the mortgage loans for the related distribution date, over (b) the pass-through rate for the related distribution date on the class of principal balance certificates that, with the addition of “X-,” has the same alphabetical designation as the subject class of Class X certificates. For purposes of the calculation of the weighted average of the net mortgage interest rates on the mortgage loans for each distribution date, the net mortgage interest rates will be adjusted as necessary to a 30/360 basis. |
(11) | Not offered pursuant to the Preliminary Prospectus or this Term Sheet. Information provided in this Term Sheet regarding the characteristics of these certificates is provided only to enhance your understanding of the offered certificates. The privately offered certificates also include the Class V and Class R certificates, which do not have a certificate balance, notional amount, credit support, pass-through rate, rating, assumed final distribution date or rated final distribution date, and which are not shown in the chart. The Class V certificates represent a beneficial ownership interest held through the grantor trust in a specified percentage of certain excess interest in respect of mortgage loans having anticipated repayment dates, if any. The Class R certificates represent the beneficial ownership of the residual interest in each of the real estate mortgage investment conduits, as further described in the Preliminary Prospectus. |
(12) | Although it does not have a specified pass-through rate (other than for tax reporting purposes), the effective pass-through rate for the RR Interest will be a variable rate per annum equal to the weighted average of the net mortgage interest rates on the mortgage loans for the related distribution date (in each case adjusted, if necessary, to accrue on the basis of a 360-day year consisting of twelve 30-day months). |
| This is not a research report and was not prepared by any Underwriter’s research department. Please see additional important information and qualifications at the end of this Term Sheet. |
T-4
BANK 2019-BNK23 | Structural Overview |
Issue Characteristics
Offered Certificates: | $1,094,290,000 (approximate) monthly pay, multi-class, commercial mortgage pass-through certificates, consisting of seven principal balance classes (Class A-1, Class A-SB, Class A-2, Class A-3, Class A-S, Class B and Class C) and two interest-only classes (Class X-A and Class X-B) |
Co-Lead Managers and Joint Bookrunners: | Morgan Stanley & Co. LLC, Wells Fargo Securities, LLC and BofA Securities, Inc. |
Co-Managers: | Academy Securities, Inc. and Drexel Hamilton, LLC |
Mortgage Loan Sellers: | Wells Fargo Bank, National Association, Bank of America, National Association and Morgan Stanley Mortgage Capital Holdings LLC |
Rating Agencies: | Fitch, S&P and KBRA |
Master Servicer: | Wells Fargo Bank, National Association |
Special Servicer: | KeyBank National Association |
Certificate Administrator/ | Wells Fargo Bank, National Association |
Trustee: | Wilmington Trust, National Association |
Operating Advisor: | Park Bridge Lender Services LLC |
Asset Representations Reviewer: | Park Bridge Lender Services LLC |
Initial Directing Certificateholder: | LD II Holdco IX LLC |
Risk Retention Consultation Party: | Morgan Stanley Mortgage Capital Holdings LLC |
U.S. Credit Risk Retention: | For a discussion on the manner in which the U.S. credit risk retention requirements will be addressed by Morgan Stanley Mortgage Capital Holdings LLC, as the retaining sponsor, see “Credit Risk Retention” in the Preliminary Prospectus. |
EU Risk Retention: | For a summary of the covenants and representations that the originators will make for the benefit of the issuing entity, the depositor and the trustee with respect to retaining a material net economic interest in this securitization for the purposes of the EU Risk Retention and Due Diligence Requirements, see “EU Credit Risk Retention Agreement” in the Preliminary Prospectus. None of the depositor, the issuing entity, the sponsors or any other person expects to comply or will be required to comply with Article 7 of the EU Securitization Regulation. |
Cut-off Date: | The mortgage loans will be considered part of the trust fund as of their respective cut-off dates. The cut-off date with respect to each mortgage loan is the respective due date for the monthly debt service payment that is due in December 2019 (or, in the case of any mortgage loan that has its first due date after December 2019, the date that would have been its due date in December 2019 under the terms of that mortgage loan if a monthly debt service payment were scheduled to be due in that month). |
Expected Pricing Date: | Week of November 18, 2019 |
Expected Closing Date: | December 10, 2019 |
Determination Dates: | The 11th day of each month or, if the 11th day is not a business day, then the business day immediately following such 11th day. |
Distribution Dates: | The 4th business day following each determination date. The first distribution date will be in January 2020. |
Rated Final Distribution Date: | The distribution date in December 2052 |
Interest Accrual Period: | Preceding calendar month |
Payment Structure: | Sequential pay |
Tax Treatment: | REMIC |
Optional Termination: | 1.00% clean-up call |
Minimum Denominations: | $10,000 for each class of Offered Certificates (other than Class X-A and Class X-B certificates); $1,000,000 for the Class X-A and Class X-B certificates |
Settlement Terms: | DTC, Euroclear and Clearstream |
Legal/Regulatory Status: | Each class of Offered Certificates is expected to be eligible for exemptive relief under ERISA. No class of Offered Certificates is SMMEA eligible. |
Analytics: | The certificate administrator is expected to make available all distribution date statements, CREFC® reports and supplemental notices received by it to certain modeling financial services as described in the Preliminary Prospectus. |
Bloomberg Ticker: | BANK 2019-BN23<MTGE><GO> |
Risk Factors: | THE CERTIFICATES INVOLVE CERTAIN RISKS AND MAY NOT BE SUITABLE FOR ALL INVESTORS. SEE THE “RISK FACTORS” SECTION OF THE PRELIMINARY PROSPECTUS. |
| This is not a research report and was not prepared by any Underwriter’s research department. Please see additional important information and qualifications at the end of this Term Sheet. |
T-5
BANK 2019-BNK23 | Structural Overview |
Structural Overview
Allocation Between the RR Interest and the Non-Retained Certificates: |
The aggregate amount available for distributions to the holders of the Certificates (including the RR Interest) on each distribution date (net of specified expenses of the issuing entity, including fees payable to, and costs and expenses reimbursable to, each applicable master servicer, any primary servicers, each applicable special servicer, the certificate administrator, the trustee, the operating advisor, the asset representations reviewer and CREFC®) will be allocated between amounts available for distribution to the holders of the RR Interest, on the one hand, and to all other Certificates (other than the Class R Certificates), referred to herein as the “Non-Retained Certificates”, on the other hand. The portion of such amount allocable to (a) the RR Interest will at all times be the product of such amount multiplied by 5% and (b) the Non-Retained Certificates will at all times be the product of such amount multiplied by the difference between 100% and the percentage set forth in clause (a) (each, the respective “Percentage Allocation Entitlement”). |
|
|
Accrual: | Each class of Offered Certificates will accrue interest on a 30/360 basis. |
|
|
Amount and Order of Distributions: | On each distribution date, the Non-Retained Certificates’ Percentage Allocation Entitlement of funds available for distribution from the mortgage loans, net of (i) any yield maintenance charges and prepayment premiums and (ii) any excess interest, will be distributed in the following amounts and order of priority:
First, to the Class A-1, Class A-SB, Class A-2, Class A-3, Class X-A, Class X-B, Class X-D, Class X-F, Class X-G and Class X-H certificates, in respect of interest, up to an amount equal to, and pro rata in accordance with, the interest entitlements for those classes;
Second, to the Class A-1, Class A-SB, Class A-2 and Class A-3 certificates as follows, to the extent of applicable available funds allocated to principal: either (i)(a) first, to principal on the Class A-SB certificates, until the certificate balance of the Class A-SB certificates is reduced to the planned principal balance for the related distribution date set forth in Annex E to the Preliminary Prospectus, and (b) second, to principal on each class of the Class A-1, Class A-2, Class A-3 and Class A-SB certificates, in that order, in each case until the certificate balance of such class of certificates has been reduced to zero, or (ii) if the certificate balance of each class of principal balance certificates other than the Class A-1, Class A-SB, Class A-2 and Class A-3 certificates and the RR Interest has been reduced to zero as a result of the allocation of losses on the mortgage loans to those certificates, to principal on the Class A-1, Class A-SB, Class A-2 and Class A-3 certificates, pro rata, without regard to the distribution priorities described above or the planned principal balance of the Class A-SB certificates;
Third, to the Class A-1, Class A-SB, Class A-2 and Class A-3 certificates, first, up to an amount equal to, and pro rata based on, any previously unreimbursed losses on the mortgage loans allocable to principal that were previously borne by each such class and then in the amount of interest thereon;
Fourth, to each class of the Class A-S, Class B and Class C certificates, in that order, in each case as follows: (a) to interest on such class of certificates in the amount of its interest entitlement; (b) to the extent of applicable available funds allocable to principal remaining after distributions in respect of principal to each class with a higher priority (as set forth in this clause or prior enumerated clauses set forth above), to principal on such class of certificates until its certificate balance has been reduced to zero; and (c) to reimburse such class of certificates, first, in the amount of any previously unreimbursed losses on the mortgage loans that were previously allocated to those certificates, then in the amount of interest thereon;
Fifth, to the principal balance certificates (other than the Class A-1, Class A-SB, Class A-2, Class A-3, Class A-S, Class B and Class C certificates and the RR Interest) in the amounts and order of priority described in “Description of the Certificates—Distributions” in the Preliminary Prospectus; and
Sixth, to the Class R certificates, any remaining amounts. |
Interest and Principal Entitlements: | The interest entitlement of each class of Offered Certificates on each distribution date generally will be the interest accrued during the related interest accrual period on the related certificate balance or notional amount at the related pass-through rate, net of any prepayment interest shortfalls allocated to that class for such distribution date as described below. If prepayment interest shortfalls arise from voluntary prepayments on serviced mortgage loans during any collection period, the applicable master servicer is required to make a limited compensating interest payment to offset those shortfalls. See “Description of the Certificates—Prepayment Interest Shortfalls” in the Preliminary Prospectus. The remaining amount of prepayment interest shortfalls will be allocated between the RR Interest, on one hand, and the Non-Retained Certificates, on the other hand, in accordance with their respective Percentage Allocation Entitlements. The prepayment interest shortfalls allocated to the Non-Retained Certificates (other than the Class V Certificates) will be allocated among such classes of certificates entitled to interest, on a pro rata basis, based on their respective amounts of accrued interest for the related distribution date, to reduce the interest entitlement on each such class of certificates. If a class receives less than the entirety of its interest entitlement on any distribution date, then the shortfall (excluding any shortfall due to prepayment interest shortfalls), together with interest thereon, will be added to its interest entitlement for the next succeeding distribution date.
The aggregate principal distribution amount for each distribution date generally will be the aggregate amount of principal received or advanced in respect of the mortgage loans, net of any non-recoverable advances and interest thereon and any workout-delayed reimbursement amounts that are reimbursed to the applicable master servicer or the trustee during the related collection period. Non-recoverable advances and interest thereon are reimbursable from principal collections before reimbursement from other amounts. Workout- |
| This is not a research report and was not prepared by any Underwriter’s research department. Please see additional important information and qualifications at the end of this Term Sheet. |
T-6
BANK 2019-BNK23 | Structural Overview |
| delayed reimbursement amounts will be reimbursable from principal collections. The Non-Retained Certificates and the RR Interest will be entitled to their respective Percentage Allocation Entitlements of the aggregate principal distribution amount. |
Special Servicer Compensation: | The principal compensation to be paid to a special servicer in respect of its special servicing activities will be the special servicing fee, the workout fee and the liquidation fee.
The special servicing fee for each distribution date is calculated based on the outstanding principal balance of each serviced mortgage loan that is a specially serviced mortgage loan (and any related serviced companion loan) or as to which the related mortgaged property has become an REO property at the special servicing fee rate, which will be a rate equal to the greater of (a) 0.25000% per annum and (b) the per annum rate that would result in a special servicing fee for the related month of $3,500. The special servicing fee will be payable monthly, first, from liquidation proceeds, insurance and condemnation proceeds, and other collections in respect of the related specially serviced mortgage loan or REO property and, then, from general collections on all the mortgage loans and any REO properties.
Each applicable special servicer will also be entitled to (i) liquidation fees generally equal to 1.0% (or, if such rate would result in an aggregate liquidation fee less than $25,000, then the liquidation fee rate will be equal to the lesser of (i) 3.0% and (ii) such lower rate as would result in an aggregate liquidation fee equal to $25,000) of liquidation proceeds and certain other collections in respect of a specially serviced mortgage loan (and any related serviced companion loan) or related REO property and of amounts received in respect of mortgage loan repurchases by the related mortgage loan sellers and (ii) workout fees generally equal to 1.0% of interest (other than post-ARD excess interest on mortgage loans with anticipated repayment dates and other than default interest) and principal payments made in respect of a rehabilitated mortgage loan (and any related serviced companion loan), subject to a floor of $25,000 with respect to any mortgage loan, whole loan or related REO property, and in the case of each of clause (i) and (ii), subject to certain adjustments and exceptions as described in the Preliminary Prospectus under “Pooling and Servicing Agreement—Servicing and Other Compensation and Payment of Expenses—Special Servicing Compensation”.
With respect to any non-serviced mortgage loan, the related special servicer under the related other pooling and servicing agreement pursuant to which such mortgage loan is being serviced will be entitled to similar compensation as that described above with respect to such non-serviced mortgage loan under such other pooling and servicing agreement as further described in the Preliminary Prospectus, although any related fees may accrue at a different rate and there may be a higher (or no) cap on liquidation and workout fees. |
|
|
Prepayment Premiums/Yield Maintenance Charges: |
If any yield maintenance charge or prepayment premium is collected during any collection period with respect to any mortgage loan, then on the immediately succeeding distribution date, the certificate administrator will pay: (i)(a) to the holders of each class of the Class A-1, Class A-SB, Class A-2, Class A-3, Class A-S, Class B, Class C, Class D and Class E certificates, the product of (x) the Non-Retained Certificates’ Percentage Allocation Entitlement of such yield maintenance charge or prepayment premium, (y) the related Base Interest Fraction for such class and the applicable principal prepayment, and (z) a fraction, the numerator of which is equal to the amount of principal distributed to such class for that distribution date, and the denominator of which is the total amount of principal distributed to the Class A-1, Class A-SB, Class A-2, Class A-3, Class A-S, Class B, Class C, Class D and Class E certificates for that distribution date, (b) to the holders of the Class X-A certificates, the excess, if any, of (x) the product of (1) the Non-Retained Certificates’ Percentage Allocation Entitlement of such yield maintenance charge or prepayment premium and (2) a fraction, the numerator of which is equal to the amount of principal distributed to the Class A-1, Class A-SB, Class A-2 and Class A-3 certificates for that distribution date, and the denominator of which is the total amount of principal distributed to the Class A-1, Class A-SB, Class A-2, Class A-3, Class A-S, Class B, Class C, Class D and Class E certificates for that distribution date, over (y) the amount of such yield maintenance charge or prepayment premium distributed to the Class A-1, Class A-SB, Class A-2 and Class A-3 certificates as described above, (c) to the holders of the Class X-B certificates, the excess, if any, of (x) the product of (1) the Non-Retained Certificates’ Percentage Allocation Entitlement of such yield maintenance charge or prepayment premium and (2) a fraction, the numerator of which is equal to the amount of principal distributed to the Class A-S, Class B and Class C certificates for that distribution date, and the denominator of which is the total amount of principal distributed to the Class A-1, Class A-SB, Class A-2, Class A-3, Class A-S, Class B, Class C, Class D and Class E certificates for that distribution date, over (y) the amount of such yield maintenance charge or prepayment premium distributed to the Class A-S, Class B and Class C certificates as described above, and (d) to the holders of the Class X-D certificates, any remaining portion of the Non-Retained Certificates’ Percentage Allocation Entitlement of such yield maintenance charge or prepayment premium not distributed as described above, and (ii) to the RR Interest, its Percentage Allocation Entitlement of such yield maintenance charge or prepayment premium. All yield maintenance charges and prepayment premiums referred to above will be net of any liquidation fees payable therefrom.
No prepayment premiums or yield maintenance charges will be distributed to the holders of the Class X-F, Class X-G, Class X-H, Class F, Class G, Class H, Class V or Class R Certificates.
“Base Interest Fraction” means, with respect to any principal prepayment of any mortgage loan that provides for the payment of a yield maintenance charge or prepayment premium, and with respect to any class of principal balance certificates (other than the RR Interest), a fraction (A) the numerator of which is the greater of (x) zero and (y) the difference between (i) the pass-through rate on that class, and (ii) the applicable discount rate and (B) the denominator of which is the difference between (i) the mortgage interest rate on the |
| This is not a research report and was not prepared by any Underwriter’s research department. Please see additional important information and qualifications at the end of this Term Sheet. |
T-7
BANK 2019-BNK23 | Structural Overview |
| related mortgage loan and (ii) the applicable discount rate; provided, that: under no circumstances will the Base Interest Fraction be greater than one; if the discount rate referred to above is greater than or equal to both the mortgage interest rate on the related mortgage loan and the pass-through rate on that class, then the Base Interest Fraction will equal zero; and if the discount rate referred to above is greater than or equal to the mortgage interest rate on the related mortgage loan and is less than the pass-through rate on that class, then the Base Interest Fraction will be equal to 1.0.
Consistent with the foregoing, the Base Interest Fraction is equal to:
(Pass-Through Rate – Discount Rate) (Mortgage Rate – Discount Rate) |
Realized Losses: | On each distribution date, immediately following the distributions to be made to the certificateholders on that date, the certificate administrator is required to calculate the amount, if any, by which (i) the aggregate stated principal balance of the mortgage loans, including any successor REO loans, expected to be outstanding immediately following that distribution date is less than (ii) the then aggregate certificate balance of the principal balance certificates after giving effect to distributions of principal on that distribution date. The Non-Retained Certificates’ Percentage Allocation Entitlement of such amount will be applied to the Class H, Class G, Class F, Class E, Class D, Class C, Class B and Class A-S certificates, in that order, in each case until the related certificate balance has been reduced to zero, and then to the Class A-1, Class A-SB, Class A-2 and Class A-3 certificates, pro rata based upon their respective certificate balances, until their respective certificate balances have been reduced to zero. The RR Interest’s Percentage Allocation Entitlement of such amount will be applied to the RR Interest until the related RR Interest balance has been reduced to zero. |
|
|
Serviced Whole Loans: | Each of the following mortgaged properties or portfolio of mortgaged properties secures a mortgage loan and one or more pari passu promissory notes and, in some cases, one or more generally subordinate promissory notes (each, a “serviced companion loan”) that will be serviced pursuant to the related intercreditor agreement and the pooling and servicing agreement for this transaction: 360 North Crescent Drive and Sacramento Office Portfolio. With respect to each such mortgaged property or portfolio of mortgaged properties, the related mortgage loan, together with the related serviced companion loan(s), is referred to herein (for so long as it is serviced under the pooling and servicing agreement for this transaction) as a “serviced whole loan.” Each serviced companion loan is not part of the mortgage pool and may be contributed to one or more future securitization transactions (if not already securitized) or may be otherwise transferred at any time, subject to compliance with the related intercreditor agreement. See the table below entitled “Mortgage Loans with Pari Passu Companion Loans,” as well as “Description of the Mortgage Pool—The Whole Loans” in the Preliminary Prospectus, for additional information regarding each such whole loan.
With respect to each “servicing shift whole loan”, the pooling and servicing agreement for this transaction will govern servicing of such whole loan until the securitization of the related control note; however, servicing of such whole loan will generally be directed by the holder of the related control note (which is not included in this securitization), and such holder will have the right to replace the special servicer with respect to the related whole loan with or without cause. After the securitization of such promissory note, such loan will cease to be a serviced whole loan and will be serviced pursuant to the pooling and servicing agreement for another securitization transaction (see “—Non-Serviced Whole Loans” below). There will be no servicing shift mortgage loans related to the trust as of the Closing Date. |
|
|
Non-Serviced Whole Loans: | Each of the following mortgaged properties or portfolio of mortgaged properties secures a mortgage loan (each, a “non-serviced mortgage loan”), one or more pari passu promissory notes and, in some cases, one or more generally subordinate promissory notes (each such promissory note, a “non-serviced companion loan”) that will be serviced pursuant to the related intercreditor agreement and the pooling and servicing agreement or trust and servicing agreement (referred to herein as a related “pooling and servicing agreement”) for another securitization transaction: Century Plaza Towers, Jackson Park, Park Tower at Transbay, ILPT Industrial Portfolio and National Anchored Retail Portfolio. With respect to each such mortgaged property or portfolio of mortgaged properties, the related mortgage loan, together with the related non-serviced companion loan(s), is referred to herein (for so long as it is serviced under the pooling and servicing agreement for another securitization transaction) as a “non-serviced whole loan.” Each non-serviced companion loan is not part of the mortgage pool and may be contributed to one or more future securitization transactions (if not already securitized) or may be otherwise transferred at any time, subject to compliance with the related intercreditor agreement. Servicing of each non-serviced whole loan will generally be directed by the holder of the related control note (or, if such control note is included in a securitization, the directing certificateholder thereunder (or other party designated thereunder to exercise the rights of such control note)), and such holder will have the right to replace the special servicer with respect to the related whole loan with or without cause. See the tables below entitled “Mortgage Loans with Pari Passu Companion Loans” and “Mortgage Loans with Subordinate Debt,” as well as “Description of the Mortgage Pool—The Whole Loans” in the Preliminary Prospectus, for additional information regarding each such whole loan. |
Directing Certificateholder/ Controlling Class: |
The “Directing Certificateholder” will be (i) with respect to a servicing shift mortgage loan, the related Loan-Specific Directing Certificateholder, and (ii) with respect to each other mortgage loan, the Controlling Class Certificateholder (or its representative) selected by more than 50% (by certificate balance) of the Controlling Class Certificateholders; provided, that (1) absent that selection, (2) until a Directing Certificateholder is so selected or (3) upon receipt of a notice from a majority of the Controlling Class Certificateholders (by certificate balance) that a Directing Certificateholder is no longer designated, the Controlling Class Certificateholder that owns the largest aggregate certificate balance of the Controlling Class (or its |
| This is not a research report and was not prepared by any Underwriter’s research department. Please see additional important information and qualifications at the end of this Term Sheet. |
T-8
BANK 2019-BNK23 | Structural Overview |
| representative) will be the Directing Certificateholder; provided, that (a) in the case of clause (3), if no one holder owns the largest aggregate certificate balance of the Controlling Class, then there will be no Directing Certificateholder until appointed in accordance with the terms of the pooling and servicing agreement, and (b) the certificate administrator and the other parties to the pooling and servicing agreement will be entitled to assume that the identity of the Directing Certificateholder has not changed until such parties receive written notice of a replacement of the Directing Certificateholder from a party holding the requisite interest in the Controlling Class (as confirmed by the certificate registrar), or the resignation of the then current Directing Certificateholder.
As used herein, the term “Directing Certificateholder,” unless used in relation to a Servicing Shift Mortgage Loan, means the entity determined pursuant to clause (ii) of the definition of such term.
The “Loan-Specific Directing Certificateholder” with respect to a servicing shift mortgage loan is the “controlling holder”, the “directing certificateholder”, the “directing holder”, “directing lender” or any analogous concept under the related intercreditor agreement. Prior to the securitization of the related control note, the Loan-Specific Directing Certificateholder with respect to a servicing shift mortgage loan will be the holder of the related control note. On and after the securitization of the related control note, there will be no Loan-Specific Directing Certificateholder under the PSA with respect to such servicing shift mortgage loan.
The “Controlling Class” will be, as of any time of determination, the most subordinate class of Control Eligible Certificates then outstanding that has an aggregate certificate balance (as notionally reduced by any Cumulative Appraisal Reduction Amounts (as defined below) allocable to such class) at least equal to 25% of the initial certificate balance of that class; provided, that if at any time the certificate balances of the certificates other than the Control Eligible Certificates and the RR Interest have been reduced to zero as a result of principal payments on the mortgage loans, then the Controlling Class will be the most subordinate class of Control Eligible Certificates that has a certificate balance greater than zero without regard to any Cumulative Appraisal Reduction Amounts. The Controlling Class as of the Closing Date will be the Class H certificates.
The “Control Eligible Certificates” will be any of the Class F, Class G and Class H certificates. |
Control Rights: | Prior to a Control Termination Event, the Directing Certificateholder will have certain consent and consultation rights under the pooling and servicing agreement with respect to certain major decisions and other matters. A “Control Termination Event” will occur when (i) the Class F certificates have a certificate balance (taking into account the application of the allocable portion of any Cumulative Appraisal Reduction Amounts to notionally reduce the certificate balance thereof) of less than 25% of the initial certificate balance of that class; or (ii) a holder of the Class F certificates is the majority controlling class certificateholder and has irrevocably waived its right, in writing, to exercise any of the rights of the controlling class certificateholder and such rights have not been reinstated to a successor controlling class certificateholder; provided that no Control Termination Event may occur with respect to the Loan-Specific Directing Certificateholder, and the term “Control Termination Event” will not be applicable to the Loan-Specific Directing Certificateholder; provided, further, that a Control Termination Event will be deemed not continuing in the event that the certificate balances of the principal balance certificates other than the Control Eligible Certificates and the RR Interest have been reduced to zero as a result of principal payments on the mortgage loans.
After the occurrence of a Control Termination Event but prior to the occurrence of a Consultation Termination Event, the Directing Certificateholder will not have any consent rights, but the Directing Certificateholder will have certain non-binding consultation rights under the pooling and servicing agreement with respect to certain major decisions and other matters. A “Consultation Termination Event” will occur when (i) no class of Control Eligible Certificates has a certificate balance (without regard to the application of the allocable portion of any Cumulative Appraisal Reduction Amounts) at least equal to 25% of the initial certificate balance of that class; or (ii) a holder of a majority of the Class F certificates is the majority controlling class certificateholder and has irrevocably waived its right, in writing, to exercise any of the rights of the controlling class certificateholder and such rights have not been reinstated to a successor controlling class certificateholder (provided that no Consultation Termination Event resulting solely from the operation of clause (ii) will be deemed to have existed or be in continuance with respect to a successor holder of the Class F certificates that has not irrevocably waived its right to exercise any of the rights of the controlling class certificateholder); provided that no Consultation Termination Event may occur with respect to the Loan-Specific Directing Certificateholder, and the term “Consultation Termination Event” will not be applicable to the Loan-Specific Directing Certificateholder; provided, further, that a Consultation Termination Event will be deemed not continuing in the event that the certificate balances of the principal balance certificates other than the Control Eligible Certificates and the RR Interest have been reduced to zero as a result of principal payments on the mortgage loans.
After the occurrence of a Consultation Termination Event, the Directing Certificateholder will not have any consent or consultation rights, except with respect to any rights expressly set forth in the pooling and servicing agreement, and the operating advisor will retain certain non-binding consultation rights under the pooling and servicing agreement with respect to certain major decisions and other matters.
Notwithstanding the proviso to the definitions of “Control Termination Event” and “Consultation Termination Event”, a Control Termination Event and a Consultation Termination Event will each be deemed to have occurred with respect to any Excluded Loan with respect to the Directing Certificateholder or the holder of the majority of the Controlling Class, and neither the Directing Certificateholder nor any Controlling Class Certificateholder will have any consent or consultation rights with respect to the servicing of such Excluded Loan.
An “Excluded Loan” means (a) with respect to the Directing Certificateholder or the holder of the majority of the Controlling Class, a mortgage loan or whole loan with respect to which, as of any date of determination, the Directing Certificateholder or the holder of the majority of the Controlling Class is a Borrower Party or (b) with respect to the Risk Retention Consultation Party or the holder of the majority of the RR Interest, a mortgage loan or whole loan with respect to which, as of any date of determination, the Risk Retention |
| This is not a research report and was not prepared by any Underwriter’s research department. Please see additional important information and qualifications at the end of this Term Sheet. |
T-9
BANK 2019-BNK23 | Structural Overview |
| Consultation Party or the holder of the majority of the RR Interest is a Borrower Party. It is expected that there will be no Excluded Loans with respect to this securitization on the Closing Date.
“Borrower Party” means a borrower, a mortgagor, a manager of a mortgaged property, the holder of a mezzanine loan that has been accelerated or as to which foreclosure or enforcement proceedings have been commenced against the equity collateral pledged to secure the related mezzanine loan, or any Borrower Party Affiliate.
“Borrower Party Affiliate” means, with respect to a borrower, a mortgagor, a manager of a mortgaged property or the holder of a mezzanine loan that has been accelerated or as to which foreclosure or enforcement proceedings have been commenced against the equity collateral pledged to secure the related mezzanine loan, (a) any other person controlling or controlled by or under common control with such borrower, mortgagor, manager or mezzanine lender, as applicable, or (b) any other person owning, directly or indirectly, 25% or more of the beneficial interests in such borrower, mortgagor, manager or mezzanine lender, as applicable. For the purposes of this definition, “control” when used with respect to any specified person means the power to direct the management and policies of such person, directly or indirectly, whether through the ownership of voting securities, by contract or otherwise and the terms “controlling” and “controlled” have meanings correlative to the foregoing.
Notwithstanding any of the foregoing to the contrary, if any mortgage loan is part of a whole loan, the Directing Certificateholder’s consent and/or consultation rights with respect thereto may be limited as described in the Preliminary Prospectus. In particular, with respect to each non-serviced whole loan and each servicing shift whole loan, the Directing Certificateholder (other than a Loan-Specific Directing Certificateholder) will only have certain consultation rights with respect to certain major decisions and other matters related to such whole loan, in each case only prior to a Control Termination Event or Consultation Termination Event, as applicable, and the Loan-Specific Directing Certificateholder will be entitled to similar consent and/or consultation rights with respect to such whole loan. In addition, with respect to any serviced A/B whole loan, for so long as the holder of the related subordinate companion loan is the controlling note holder, the holder of such subordinate companion loan (rather than the Directing Certificateholder) will be entitled to exercise such consent and consultation rights with respect to such whole loan. |
Appraisal Reduction Amounts and Collateral Deficiency Amounts: |
An “Appraisal Reduction Amount” generally will be created in the amount, if any, by which the principal balance of a required appraisal loan (which is a mortgage loan with respect to which certain defaults, modifications or insolvency events have occurred as further described in the Preliminary Prospectus) plus other amounts overdue or advanced in connection with such mortgage loan exceeds 90% of the appraised value of the related mortgaged property plus certain escrows and reserves (including letters of credit) held with respect to the mortgage loan.
A mortgage loan will cease to be subject to an Appraisal Reduction Amount when it has been brought current for at least three consecutive months, no additional event of default is foreseeable in the reasonable judgment of the applicable special servicer and no other circumstances exist that would cause such mortgage loan or any related companion loan to be a specially serviced loan; however, a “Collateral Deficiency Amount” may exist with respect to any mortgage loan that is modified into an AB loan structure (an “AB Modified Loan”) and remains a corrected mortgage loan and, if so, will generally equal the excess of (i) the stated principal balance of such AB Modified Loan (taking into account the related junior note(s) and any pari passu notes included therein), over (ii) the sum of (in the case of a whole loan, solely to the extent allocable to the subject mortgage loan) (x) the most recent appraised value for the related mortgaged property or mortgaged properties, plus (y) solely to the extent not reflected or taken into account in such appraised value (or in the calculation of any related Appraisal Reduction Amount) and to the extent on deposit with, or otherwise under the control of, the lender as of the date of such determination, any capital or additional collateral contributed by the related borrower at the time the mortgage loan became (and as part of the modification related thereto) such AB Modified Loan for the benefit of the related mortgaged property or mortgaged properties (provided that in the case of an non-serviced mortgage loan, the amounts set forth in this clause (y) will be taken into account solely to the extent relevant information is received by the applicable master servicer), plus (z) any other escrows or reserves (in addition to any amounts set forth in the immediately preceding clause (y) and solely to the extent not reflected or taken into account in the calculation of any related Appraisal Reduction Amount) held by the lender in respect of such AB Modified Loan as of the date of such determination, which such excess, for the avoidance of doubt, will be determined separately from and exclude any related Appraisal Reduction Amounts.
As used herein, a “Cumulative Appraisal Reduction Amount” will be the sum of any Appraisal Reduction Amounts and any Collateral Deficiency Amounts.
Any Appraisal Reduction Amount in respect of any non-serviced mortgage loan generally will be calculated in accordance with the other servicing agreement pursuant to which such mortgage loan is being serviced, which calculations are expected to be generally similar to those provided for in the pooling and servicing agreement for this transaction.
If any mortgage loan is part of a whole loan, any Appraisal Reduction Amount or Collateral Deficiency Amount will (or effectively will) be calculated in respect of such whole loan taken as a whole and allocated, to the extent provided in the related intercreditor agreement and the related pooling and servicing agreement, first, to any related subordinate companion loan, and second, to the related mortgage loan and any pari passu companion loan on a pro rata basis by unpaid principal balance. |
| This is not a research report and was not prepared by any Underwriter’s research department. Please see additional important information and qualifications at the end of this Term Sheet. |
T-10
BANK 2019-BNK23 | Structural Overview |
| Appraisal Reduction Amounts will proportionately reduce the interest portion of debt service advances required to be made in respect of the related mortgage loan. Appraisal Reduction Amounts and Collateral Deficiency Amounts (in each case, to the extent of the Non-Retained Certificates’ Percentage Allocation Entitlement thereof) will be taken into account in determining the identity of the controlling class entitled to appoint the Directing Certificateholder, the existence of a Control Termination Event and the allocation and/or exercise of voting rights for certain purposes (see “Directing Certificateholder/Controlling Class” above). |
Appraised-Out Class: | An “Appraised-Out Class” is any class of Control Eligible Certificates, the certificate balance of which (taking into account the application of the Non-Retained Certificates’ Percentage Allocation Entitlement of any Appraisal Reduction Amounts or Collateral Deficiency Amounts to notionally reduce the certificate balance of such class) has been reduced to less than 25% of its initial certificate balance. Any Appraised-Out Class may not exercise any direction, control, consent and/or similar rights of the Controlling Class until such time, if any, as such class is reinstated as the Controlling Class, and the rights of the Controlling Class will be exercised by the next most senior class of Control Eligible Certificates that is not an Appraised-Out Class, if any, during such period. |
|
|
Appraisal Remedy: | The holders of the majority (by certificate balance) of an Appraised-Out Class (such holders, the “Requesting Holders”) will have the right, at their sole expense, to require the applicable special servicer to order (or, with respect to a non-serviced mortgage loan, require the applicable master servicer to request from the applicable non-serviced special servicer) a second appraisal of any mortgage loan (or serviced whole loan) for which an appraisal reduction event has occurred or as to which there exists a Collateral Deficiency Amount. With respect to any serviced mortgage loan, the applicable special servicer will be required to use its reasonable efforts to ensure that such appraisal is delivered within 30 days from receipt of the Requesting Holders’ written request and will be required to cause such appraisal to be prepared on an “as-is” basis by an MAI appraiser. With respect to any non-serviced mortgage loan, the applicable master servicer will be required to use commercially reasonable efforts to obtain such second appraisal from the applicable non-serviced special servicer and to forward such second appraisal to the applicable special servicer. Upon receipt of such supplemental appraisal, the applicable master servicer (for Collateral Deficiency Amounts on non-serviced mortgage loans), the non-serviced special servicer (for Appraisal Reduction Amounts on non-serviced mortgage loans to the extent provided for in the related pooling and servicing agreement and applicable intercreditor agreement) and the applicable special servicer (for any serviced mortgage loan) will be required to determine, in accordance with the Servicing Standard, whether, based on its assessment of such supplemental appraisal, any recalculation of the applicable Appraisal Reduction Amount or Collateral Deficiency Amount is warranted and, if so warranted, such person will be required to recalculate such Appraisal Reduction Amount or Collateral Deficiency Amount, as applicable, based upon such supplemental appraisal and (for any serviced mortgage loan) receipt of information from the applicable master servicer as described above. If required by any such recalculation, the applicable Appraised-Out Class will be reinstated as the Controlling Class and each Appraised-Out Class will, if applicable, have its related certificate balance notionally restored to the extent required by such recalculation of the Appraisal Reduction Amount or Collateral Deficiency Amount, if applicable.
In addition, the Requesting Holders of any Appraised-Out Class will have the right to challenge the Appraisal Reduction Amount and to require the applicable special servicer to order an additional appraisal of any serviced mortgage loan as to which there exists a Collateral Deficiency Amount if an event has occurred at, or with respect to, the related mortgaged property or mortgaged properties that would have a material effect on its or their appraised value, and such special servicer is required to use reasonable efforts to obtain an appraisal from an MAI appraiser reasonably acceptable to such special servicer within 30 days from receipt of the Requesting Holders’ written request. |
|
|
Sale of Defaulted Loans: | Under certain circumstances the applicable special servicer may be required to use reasonable efforts to solicit offers for a defaulted serviced mortgage loan (and any related companion loan (to the extent provided under the related intercreditor agreement) and/or related REO properties).
The Directing Certificateholder will not have a right of first refusal to purchase a defaulted loan.
If the applicable special servicer does not receive an offer at least equal to the outstanding principal balance plus all accrued and unpaid interest and outstanding costs and expenses and certain other amounts specified in the pooling and servicing agreement (the “Par Purchase Price”), the applicable special servicer may purchase the defaulted loan or REO property at the Par Purchase Price or may accept the first cash offer received from any person that is determined to be a fair price for such defaulted loan or REO property. If multiple offers are received during the period designated by the applicable special servicer for receipt of offers, such special servicer is generally required to select the highest offer. The applicable special servicer will be required to determine whether any cash offer constitutes a fair price for any defaulted loan or REO property if the highest offeror is a person other than a party to the pooling and servicing agreement for this transaction (the “PSA”), the Directing Certificateholder, the Risk Retention Consultation Party, any sponsor, any Borrower Party, any independent contractor engaged by a special servicer, the trustee for the securitization of a related companion loan (with respect to a whole loan if it is a defaulted loan), any related companion loan holder or its representative, any holder of a related mezzanine loan or any known affiliate of any of the preceding entities (each, an “Interested Person”). If an offer is made by an Interested Person, the trustee will be required to determine (based upon the most recent appraisal conducted in accordance with the terms of the PSA) whether the offer constitutes a fair price for the defaulted loan or REO property unless (i) the offer is equal to or greater than the applicable Par Purchase Price and (ii) the offer is the highest offer received. Absent an offer at least equal to the Par Purchase Price, no offer from an Interested Person will constitute a fair price unless (x) it is the highest offer received and (y) at least two other offers are received from independent third parties. Neither the trustee nor any of its affiliates may make an offer for or purchase any specially serviced loan or REO property. |
| This is not a research report and was not prepared by any Underwriter’s research department. Please see additional important information and qualifications at the end of this Term Sheet. |
T-11
BANK 2019-BNK23 | Structural Overview |
| Notwithstanding any of the foregoing to the contrary, the applicable special servicer is not required to accept the highest offer and may accept a lower offer for a defaulted loan or REO property if such special servicer determines, in accordance with the Servicing Standard (and subject to the requirements of any related intercreditor agreement), that a rejection of such offer would be in the best interests of the certificateholders and any related companion loan holders as a collective whole as if they constituted a single lender (and with respect to a serviced A/B whole loan, taking into account the subordinate nature of any related subordinate companion loan), so long as such lower offer was not made by such special servicer or any of its affiliates.
If title to any mortgaged property is acquired by the trust fund, the applicable special servicer will generally be required to sell such mortgaged property prior to the close of the third calendar year beginning after the year of acquisition.
The foregoing applies to mortgage loans serviced under the PSA. With respect to any non-serviced whole loan, if the special servicer under the applicable pooling and servicing agreement determines to sell the related controlling companion loan if it becomes a defaulted loan, then the applicable special servicer will be required to sell the related whole loan, including the related mortgage loan included in the BANK 2019-BNK23 securitization trust and the related pari passu companion loan(s) and, under certain circumstances, any subordinate companion loan(s), as a single loan. In connection with any such sale, the special servicer under the applicable pooling and servicing agreement will be required to follow procedures substantially similar to those set forth above. |
Risk Retention Consultation Party: | A risk retention consultation party may be appointed by the holder or holders of more than 50% of the RR Interest, by certificate balance. The majority RR Interest holder will have a continuing right to appoint, remove or replace the risk retention consultation party in its sole discretion. This right may be exercised at any time and from time to time. Except with respect to an Excluded Loan as to such party or the holder of the majority of the RR Interest, the risk retention consultation party will be entitled to consult with the applicable special servicer, upon request of the risk retention consultation party, with respect to certain material servicing actions proposed by such special servicer; provided, that prior to the occurrence and continuance of a Consultation Termination Event, such mortgage loan must also be a specially serviced mortgage loan. |
Appointment and Replacement of each Special Servicer: |
The Directing Certificateholder will appoint each initial special servicer as of the Closing Date. Prior to the occurrence and continuance of a Control Termination Event, any special servicer may generally be replaced by the Directing Certificateholder with or without cause at any time.
After the occurrence and during the continuance of a Control Termination Event and upon (a) the written direction of holders of principal balance certificates evidencing not less than 25% of the voting rights of all classes of certificates (other than the RR Interest) entitled to principal (taking into account the application of Cumulative Appraisal Reduction Amounts to notionally reduce the certificate balances of classes to which such Cumulative Appraisal Reduction Amounts are allocable) requesting a vote to replace the applicable special servicer with a replacement special servicer, (b) payment by such requesting holders to the certificate administrator of all reasonable fees and expenses to be incurred by the certificate administrator in connection with administering such vote and (c) delivery by such holders of a rating agency confirmation from each applicable rating agency, the certificate administrator will be required to promptly post such notice on its internet website and by mail and conduct the solicitation of votes of all certificates in such regard, which requisite affirmative votes must be received within 180 days of the posting of such notice. Upon the written direction of holders of at least 66 2/3% of a Certificateholder Quorum, the trustee will be required to immediately replace the applicable special servicer with a qualified replacement special servicer designated by such holders of certificates.
After the occurrence and during the continuance of a Consultation Termination Event, if the operating advisor determines that the applicable special servicer is not performing its duties as required under the pooling and servicing agreement or is otherwise not acting in accordance with the Servicing Standard, the operating advisor may also recommend the replacement of such special servicer. The operating advisor’s recommendation to replace such special servicer must be confirmed by an affirmative vote of holders of principal balance certificates evidencing at least a majority of the aggregate voting rights (taking into account the application of any Cumulative Appraisal Reduction Amounts to notionally reduce the respective certificate balances) of all principal balance certificates on an aggregate basis (which requisite affirmative vote must be received within 180 days of posting of the notice of the operating advisor’s recommendation to the certificate administrator’s website).
A “Certificateholder Quorum” means, in connection with any solicitation of votes in connection with the replacement of a special servicer or the asset representations reviewer, the holders of certificates evidencing at least 50% of the aggregate voting rights (taking into account the application of realized losses and, other than with respect to the termination of the asset representations reviewer, any Cumulative Appraisal Reduction Amounts to notionally reduce the certificate balance of the certificates) of all classes of certificates entitled to principal (other than the RR Interest) on an aggregate basis.
With respect to each serviced whole loan, any holder of a related pari passu companion loan, following a servicer termination event with respect to the applicable special servicer that affects such holder, will be entitled to direct the trustee (and the trustee will be required) to terminate such special servicer solely with respect to such serviced whole loan. A replacement special servicer will be selected by the trustee or, prior to a Control Termination Event, by the Directing Certificateholder; provided, that any successor special servicer appointed to replace the special servicer with respect to such whole loan cannot be the entity (or its affiliate) that was terminated at the direction of the holder of the related pari passu companion loan.
Notwithstanding any of the foregoing to the contrary, with respect to each servicing shift whole loan and any serviced A/B whole loans as to which a subordinate companion loan holder is the related controlling note holder, the holder of the related control note will be entitled to replace the applicable special servicer with |
| This is not a research report and was not prepared by any Underwriter’s research department. Please see additional important information and qualifications at the end of this Term Sheet. |
T-12
BANK 2019-BNK23 | Structural Overview |
| respect to such whole loan at any time, with or without cause, and while it is a serviced whole loan, no other party may replace the applicable special servicer for such whole loan unless there is a servicer termination event with respect thereto.
With respect to any non-serviced whole loan, subject to conditions or restrictions in the applicable intercreditor agreement, the BANK 2019-BNK23 trust, as holder of the related mortgage loan, has the right to terminate the applicable special servicer under the related pooling and servicing agreement if a servicer termination event occurs, with respect to such special servicer that affects the trust in its capacity as such holder. Such rights may be exercised by the Directing Certificateholder prior to a Consultation Termination Event (or the applicable special servicer, following the occurrence and during the continuance of a Consultation Termination Event). The successor special servicer will be selected pursuant to the applicable pooling and servicing agreement by the related directing holder prior to a control termination event under such pooling and servicing agreement. |
Servicing Standard: | Each applicable master servicer and each applicable special servicer is obligated to service and administer the mortgage loans (and, if applicable, the serviced companion loans) in accordance with the definition of the “Servicing Standard” described in the Preliminary Prospectus and the terms of the pooling and servicing agreement, provided that each non-serviced mortgage loan, if any, will be serviced by another master servicer or special servicer under the pooling and servicing agreement with respect to the securitization of a related companion loan, which entities will be obligated to service and administer such non-serviced mortgage loan pursuant to a similar standard set forth in the related pooling and servicing agreement. |
|
|
Excluded Special Servicer: | If a special servicer obtains knowledge that it has become a Borrower Party with respect to any mortgage loan (an “Excluded Special Servicer Loan”), such special servicer will be required to resign as special servicer of that Excluded Special Servicer Loan. Prior to the occurrence of a Control Termination Event, the Directing Certificateholder will be required to appoint (and may remove and replace with or without cause) a separate special servicer that is not a Borrower Party (an “Excluded Special Servicer”) with respect to any Excluded Special Servicer Loan, unless such Excluded Special Servicer Loan is also an Excluded Loan with respect to the Directing Certificateholder or the holder of the majority of the Controlling Class. After the occurrence and during the continuance of a Control Termination Event, if at any time the applicable Excluded Special Servicer Loan is also an Excluded Loan with respect to the Directing Certificateholder or the holder of the majority of the Controlling Class or if the Directing Certificateholder is entitled to appoint the Excluded Special Servicer but does not so appoint within 30 days of notice of such resignation, the resigning special servicer will be required to use reasonable efforts to select the related Excluded Special Servicer. Any Excluded Special Servicer will be required to perform all of the obligations of the applicable special servicer and will be entitled to all special servicing compensation with respect to such Excluded Special Servicer Loan earned while the related mortgage loan is an Excluded Special Servicer Loan. |
|
|
Liquidated |
On liquidation of any mortgage loan, all net liquidation proceeds related to the mortgage loan (but not any related companion loan) will be applied so that amounts allocated as a recovery of accrued and unpaid interest will not, in the first instance, include any delinquent interest that was not advanced as a result of Appraisal Reduction Amounts (or would not have been advanced in the absence of a non-recoverability determination) or accrued on the portion of the stated principal balance thereof equal to any related Collateral Deficiency Amount in effect from time to time and as to which no advance was made (collectively, the “Subordinated Interest Amount”). After the adjusted interest amount is so allocated, any remaining liquidation proceeds will be allocated to pay principal on the mortgage loan until the unpaid principal amount of the mortgage loan has been reduced to zero. Any remaining liquidation proceeds will then be allocated to pay the Subordinated Interest Amount. |
|
|
Operating Advisor: | The operating advisor will be required to perform certain review duties if a Control Termination Event has occurred and is continuing, which will generally include a limited annual review of, and the preparation of a report regarding, certain actions of the applicable special servicer with respect to the resolution and/or liquidation of specially serviced loans. The review and report generally will be based on any asset status reports and additional information delivered to the operating advisor by such special servicer. In addition, if a Control Termination Event has occurred and is continuing, the applicable special servicer must consult with the operating advisor (in addition to the Directing Certificateholder if no Consultation Termination Event has occurred and is continuing) in connection with major decisions with respect to mortgage loans. Furthermore, under certain circumstances, but only if a Consultation Termination Event has occurred and is continuing, the operating advisor may recommend the replacement of the applicable special servicer as described above under “—Appointment and Replacement of each Special Servicer”; however, the operating advisor will not have any rights or obligations with respect to a non-serviced whole loan.
If a Consultation Termination Event has occurred and is continuing, the operating advisor may be removed and replaced without cause upon the affirmative direction of certificates owners holding not less than 75% of the voting rights of all certificates (taking into account the application of Cumulative Appraisal Reduction Amounts), following a proposal from certificate owners holding not less than 25% of the voting rights of all certificates (taking into account the application of Cumulative Appraisal Reduction Amounts). The certificateholders who initiate a vote on a termination and replacement of the operating advisor without cause must cause the payment of the fees and expenses incurred in the replacement. In addition, in the event there are no classes of certificates outstanding other than the Control Eligible Certificates, the RR Interest and the Class X-F, Class X-G, Class X-H, Class V and Class R certificates, then all of the rights and obligations of the operating advisor under the PSA will terminate without payment of any penalty or termination fee (other than |
| This is not a research report and was not prepared by any Underwriter’s research department. Please see additional important information and qualifications at the end of this Term Sheet. |
T-13
BANK 2019-BNK23 | Structural Overview |
| any rights or obligations that accrued prior to the date of such termination (including accrued and unpaid compensation) and other than indemnification rights arising out of events occurring prior to such termination). See “Pooling and Servicing Agreement—The Operating Advisor—Termination of the Operating Advisor Without Cause” in the Preliminary Prospectus. |
Asset Representations Reviewer: | The asset representations reviewer will be required to review certain delinquent mortgage loans after a specified delinquency threshold has been met and the required percentage of certificateholders vote to direct a review as described below. The asset representations reviewer will be entitled to the Asset Representations Reviewer Fee with respect to such review. See “Pooling and Servicing Agreement—The Asset Representations Reviewer” in the Preliminary Prospectus.
The certificate administrator will be required to notify certificateholders if the specified delinquency threshold has been met as described in the Preliminary Prospectus under “—The Asset Representations Reviewer”.
If certificateholders evidencing not less than 5.0% of the voting rights request a vote to commence an asset review, and if subsequently (i) a majority of those certificateholders who cast votes and (ii) a majority of an Asset Review Quorum authorizes an asset review within 150 days of the request for a vote, the asset representations reviewer will be required to conduct an asset review of delinquent loans.
The asset representations reviewer may be terminated and replaced without cause. Upon (i) the written direction of certificateholders evidencing not less than 25% of the voting rights (without regard to the application of any Cumulative Appraisal Reduction Amounts) requesting a vote to terminate and replace the asset representations reviewer with a proposed successor asset representations reviewer that is an eligible asset representations reviewer, and (ii) payment by such holders to the certificate administrator of the reasonable fees and expenses to be incurred by the certificate administrator in connection with administering such vote, the certificate administrator will be required to promptly provide notice to all certificateholders and the asset representations reviewer of such request by posting such notice on its internet website, and by mailing such notice to all certificateholders and the asset representations reviewer. Upon the written direction of certificateholders evidencing at least 75% of a Certificateholder Quorum (without regard to the application of any Cumulative Appraisal Reduction Amounts), the trustee will be required to terminate all of the rights and obligations of the asset representations reviewer under the pooling and servicing agreement (other than any rights or obligations that accrued prior to the date of such termination and other than indemnification rights arising out of events occurring prior to such termination) by written notice to the asset representations reviewer, and the proposed successor asset representations reviewer will be appointed. See “Pooling and Servicing Agreement—The Asset Representations Reviewer” in the Preliminary Prospectus.
An “Asset Review Quorum” means, in connection with any solicitation of votes to authorize an Asset Review as described above, the holders of certificates evidencing at least 5.0% of the aggregate voting rights represented by all certificates that have voting rights. |
|
|
Dispute Resolution Provisions: | The mortgage loan sellers will be subject to the dispute resolution provisions set forth in the PSA to the extent those provisions are triggered with respect to any mortgage loan sold to the depositor by a mortgage loan seller, and such mortgage loan seller will be obligated under the related mortgage loan purchase agreement to comply with all applicable provisions and to take part in any mediation or arbitration proceedings that may result. Generally, in the event that a Repurchase Request is not “Resolved” within 180 days after the related mortgage loan seller receives such Repurchase Request, then the enforcing servicer will be required to send a notice to the first certificateholder (or beneficial owner) to deliver a certificateholder repurchase request with respect to the mortgage loan (the “Initial Requesting Certificateholder”) (if any) and to the certificate administrator (which will be required to make such notice available to certificateholders via the certificate administrator’s website) indicating the enforcing servicer’s intended course of action with respect to the Repurchase Request. If (a) the enforcing servicer’s intended course of action with respect to the Repurchase Request does not involve pursuing further action to exercise rights against the related mortgage loan seller with respect to the Repurchase Request and the Initial Requesting Certificateholder, if any, or any other certificateholder or certificate owner wishes to exercise its right to refer the matter to mediation (including nonbinding arbitration) or arbitration, or (b) the enforcing servicer’s intended course of action is to pursue further action to exercise rights against the related mortgage loan seller with respect to the Repurchase Request but the Initial Requesting Certificateholder, if any, or any other certificateholder or certificate owner does not agree with the dispute resolution method selected by the enforcing servicer, then the Initial Requesting Certificateholder, if any, or such other certificateholder or certificate owner may deliver a written notice to the enforcing servicer indicating its intent to exercise its right to refer the matter to either mediation or arbitration.
“Resolved” means, with respect to a Repurchase Request, (i) that the related material defect or breach has been cured, (ii) the related mortgage loan has been repurchased in accordance with the related mortgage loan purchase agreement, (iii) a mortgage loan has been substituted for the related mortgage loan in accordance with the related mortgage loan purchase agreement, (iv) the applicable mortgage loan seller has made a loss of value payment, (v) a contractually binding agreement has been entered into between the enforcing servicer, on behalf of the issuing entity, and the related mortgage loan seller that settles the related mortgage loan seller’s obligations under the related mortgage loan purchase agreement, or (vi) the related mortgage loan is no longer property of the issuing entity as a result of a sale or other disposition in accordance with the pooling and servicing agreement. See “Pooling and Servicing Agreement—Dispute Resolution Provisions” in the Preliminary Prospectus. |
|
|
Investor Communications: | The certificate administrator is required to include on any Form 10-D any request received from a certificateholder to communicate with other certificateholders related to certificateholders exercising their rights under the terms of the PSA. Any certificateholder wishing to communicate with other certificateholders regarding the exercise of its rights under the terms of the PSA will be able to deliver a written request signed by an authorized representative of the requesting investor to the certificate administrator. |
| This is not a research report and was not prepared by any Underwriter’s research department. Please see additional important information and qualifications at the end of this Term Sheet. |
T-14
BANK 2019-BNK23 | Structural Overview |
Deal Website: | The certificate administrator will be required to maintain a deal website which will include, among other items: (a) summaries of asset status reports prepared by a special servicer, (b) inspection reports, (c) appraisals, (d) various “special notices” described in the Preliminary Prospectus, (e) the “Investor Q&A Forum” and (f) a voluntary “Investor Registry”. Investors may access the deal website following execution of a certification and confidentiality agreement. |
| This is not a research report and was not prepared by any Underwriter’s research department. Please see additional important information and qualifications at the end of this Term Sheet. |
T-15
BANK 2019-BNK23 | Collateral Overview |
Mortgage Loan Sellers | No. of Mortgage | No. of Mortgaged Properties | Aggregate | % of |
Wells Fargo Bank, National Association | 15 | 23 | $364,878,601 | 28.4% |
Bank of America, National Association | 14 | 36 | $358,938,813 | 27.9% |
Morgan Stanley Mortgage Capital Holdings LLC | 15 | 28 | $283,205,000 | 22.0% |
Morgan Stanley Mortgage Capital Holdings LLC; Wells Fargo Bank, National Association(2) | 1 | 1 | $105,000,000 | 8.2% |
Bank of America, National Association; Wells Fargo Bank, National Association(3) | 1 | 1 | $100,000,000 | 7.8% |
Morgan Stanley Mortgage Capital Holdings LLC; Bank of America, National Association(4) | 1 | 11 | $75,000,000 | 5.8% |
Total: | 47 | 100 | $1,287,022,414 | 100.0% |
Pool Statistics
|
|
Aggregate Cut-off Date Balance: | $1,287,022,414 |
Number of Mortgage Loans: | 47 |
Average Cut-off Date Balance per Mortgage Loan: | $27,383,456 |
Number of Mortgaged Properties: | 100 |
Average Cut-off Date Balance per Mortgaged Property: | $12,870,224 |
Weighted Average Mortgage Rate: | 3.52396% |
% of Pool Secured by 5 Largest Mortgage Loans: | 35.2% |
% of Pool Secured by 10 Largest Mortgage Loans: | 57.3% |
% of Pool Secured by ARD Loans(5): | 7.8% |
Weighted Average Original Term to Maturity (months)(5): | 120 |
Weighted Average Remaining Term to Maturity (months)(5): | 119 |
Weighted Average Seasoning (months): | 1 |
% of Pool Secured by Single Tenant Mortgaged Properties: | 26.4% |
% of Pool Secured by Refinance Loans: | 62.9% |
% of Pool Secured by Acquisition Loans: | 25.4% |
% of Pool Secured by Recapitalization Loans: | 11.7% |
Additional Debt
|
|
% of Pool with Pari Passu Mortgage Debt: | 39.9% |
% of Pool with Subordinate Mortgage Debt: | 24.2% |
Credit Statistics(6)
|
|
Weighted Average UW NOI DSCR: | 2.87x |
Weighted Average UW NOI Debt Yield(7): | 10.6% |
Weighted Average UW NCF DSCR: | 2.73x |
Weighted Average UW NCF Debt Yield(7): | 10.1% |
Weighted Average Cut-off Date LTV Ratio(7)(8): | 56.1% |
Weighted Average Maturity Date LTV Ratio(5)(8): | 53.7% |
Footnotes are set forth on the following page.
| This is not a research report and was not prepared by any Underwriter’s research department. Please see additional important information and qualifications at the end of this Term Sheet. |
T-16
BANK 2019-BNK23 | Collateral Overview |
Amortization
Weighted Average Original Amortization Term (months)(9): | 357 |
Weighted Average Remaining Amortization Term (months)(9): | 356 |
% of Pool Interest Only through Maturity: | 69.6% |
% of Pool Interest Only followed by Amortizing Balloon: | 12.2% |
% of Pool Amortizing Balloon: | 10.5% |
% of Pool Full IO ARD: | 7.8% |
Lockboxes
|
|
% of Pool with Hard Lockboxes: | 49.9% |
% of Pool with Springing Lockboxes: | 38.6% |
% of Pool with Soft Lockboxes: | 8.9% |
% of Pool with No Lockboxes: | 2.6% |
Reserves
|
|
% of Pool Requiring Tax Reserves: | 66.7% |
% of Pool Requiring Insurance Reserves: | 21.1% |
% of Pool Requiring Replacement Reserves: | 62.3% |
% of Pool Requiring TI/LC Reserves(10): | 62.3% |
Call Protection
|
|
% of Pool with lockout period, followed by defeasance until open period: | 67.4% |
% of Pool with no lockout period. The greater of a prepayment premium and yield maintenance, followed by defeasance or the greater of a prepayment premium and yield maintenance until open period: | 10.6% |
% of Pool with lockout period, followed by yield maintenance until open period: | 7.8% |
% of Pool with lockout period, followed by defeasance or the greater of a prepayment premium and yield maintenance until open period: | 6.6% |
% of Pool with lockout period, followed by the greater of a prepayment premium and yield maintenance, followed by defeasance or the greater of a prepayment premium and yield maintenance until open period: | 5.7% |
% of Pool with lockout period, followed by the greater of a prepayment premium and yield maintenance until open period: | 2.0% |
(1) | Unless otherwise indicated, all references to “% of Pool” in this Term Sheet reflect a percentage of the aggregate principal balance of the mortgage pool as of the Cut-off Date, after application of all payments of principal due during or prior to December 2019. |
(2) | The Century Plaza Towers mortgage loan was co-originated by Morgan Stanley Bank, N.A., and Wells Fargo Bank, National Association. Such mortgage loan is evidenced by six promissory notes: (i) notes A-2-C2, A-2-C5, A-2-C6, and A-2-C7, with an aggregate outstanding principal balance of $62,500,000 as of the Cut-off Date, as to which Morgan Stanley Mortgage Capital Holdings LLC is acting as mortgage loan seller; and (ii) notes A-3-C2 and A-3-C5, with an aggregate outstanding principal balance of $42,500,000 as of the Cut-off Date, as to which Wells Fargo Bank, National Association is acting as mortgage loan seller. |
(3) | The Jackson Park mortgage loan was co-originated by Bank of America, N.A. and Wells Fargo Bank, National Association. Such mortgage loan is evidenced by two promissory notes: (i) note A-5, with an outstanding principal balance of $50,000,000 as of the Cut-off Date, as to which Bank of America, N.A. is acting as mortgage loan seller; and (ii) note A-6, with an outstanding principal balance of $50,000,000 as of the Cut-off Date, as to which Wells Fargo Bank, National Association is acting as mortgage loan seller. |
(4) | The ILPT Industrial Portfolio mortgage loan was co-originated by Morgan Stanley Bank, N.A., and Bank of America, N.A. Such mortgage loan is evidenced by two promissory notes: (i) note A-2, with an outstanding principal balance of $35,760,000 as of the Cut-off Date, as to which Morgan Stanley Mortgage Capital Holdings LLC is acting as mortgage loan seller; and (ii) note A-3, with an outstanding principal balance of $39,240,000 as of the Cut-off Date, as to which Bank of America, N.A. is acting as mortgage loan seller. |
(5) | With respect to any ARD Loan, unless otherwise indicated, references in this Term Sheet to the applicable “maturity date” or “maturity” refer to the applicable anticipated repayment date with respect to such ARD Loan, and such applicable anticipated repayment date is treated as its maturity date for all purposes hereof. |
(6) | With respect to any mortgage loan that is part of a whole loan, unless otherwise indicated, all LTV, DSCR and Debt Yield calculations in this Term Sheet include any related pari passu companion loans and exclude any subordinate companion loans, as applicable. Additionally, LTV, DSCR and Debt Yield figures in this Term Sheet are calculated for mortgage loans without regard to any additional indebtedness that may be incurred at a future date. |
(7) | With respect to certain mortgage loans, debt yields and LTVs (such as, for example, UW NOI Debt Yield, UW NCF Debt Yield or Cut-off Date LTV Ratio) have been calculated based on a principal balance that is net of a holdback or earnout reserve. Such mortgage loans are identified under the definitions of “Underwritten NOI Debt Yield”, “Underwritten NCF Debt Yield” and “Cut-off Date LTV Ratio” set forth under “Description of the Mortgage Pool—Certain Calculations and Definitions” in the Preliminary Prospectus. |
(8) | The LTV ratios set forth in this Term Sheet are generally based on the “as-is” values of the related mortgaged properties; provided that the “as-is” value for a portfolio of mortgaged properties may include a premium relating to the valuation of the mortgaged properties as a whole rather than as the sum of individually valued mortgaged properties; provided, further, that such LTV ratios may be based on “as-stabilized”, “as complete” or other contingent values in certain cases in which reserves have been established at origination for the applicable condition or circumstance that is expected to result in stabilization provided, further, that such LTV ratios may have been calculated based on a principal balance that is net of a holdback or earnout reserve. See the definition of “Appraised Value” under “Description of the Mortgage Pool—Certain Calculations and Definitions” in the Preliminary Prospectus. |
(9) | Excludes mortgage loans that provide for payments of interest only through the related maturity date or anticipated repayment date, as applicable. |
(10) | Excludes hospitality, multifamily, manufactured housing and self storage properties. |
| This is not a research report and was not prepared by any Underwriter’s research department. Please see additional important information and qualifications at the end of this Term Sheet. |
T-17
BANK 2019-BNK23 | Characteristics of the Mortgage Loans |
| Top 10 Mortgage Loans or Groups of Cross-Collateralized Mortgage Loans(1) | |||||||||||||
| Loan No. | Mortgage Loan Seller | Property Name | City | State | Property Type | Cut-off Date Balance | % of Pool | SF/Units | Cut-off Date Balance per SF/Unit | UW NCF DSCR | UW NOI Debt Yield | Cut-off Date LTV | Maturity Date LTV |
| 1 | MSMCH/WFB | Century Plaza Towers | Los Angeles | CA | Office | $105,000,000 | 8.2% | 2,401,641 | $374.74 | 4.09x | 13.5% | 39.1% | 39.1% |
| 2 | BANA/WFB | Jackson Park | Long Island City | NY | Multifamily | $100,000,000 | 7.8% | 1,871 | $293,960.45 | 3.92x | 13.0% | 34.4% | 34.4% |
| 3 | BANA | Park Tower at Transbay | San Francisco | CA | Office | $100,000,000 | 7.8% | 764,659 | $719.27 | 2.93x | 10.2% | 49.1% | 49.1% |
| 4 | MSMCH/BANA | ILPT Industrial Portfolio | Various | Various | Industrial | $75,000,000 | 5.8% | 8,209,036 | $26.12 | 5.05x | 14.8% | 39.2% | 39.2% |
| 5 | WFB | 360 North Crescent Drive | Beverly Hills | CA | Office | $73,600,000 | 5.7% | 123,848 | $1,038.37 | 2.31x | 8.3% | 52.2% | 52.2% |
| 6 | WFB | Norwalk Government Center | Norwalk | CA | Office | $66,300,000 | 5.2% | 451,455 | $146.86 | 2.10x | 8.5% | 63.5% | 63.5% |
| 7 | BANA | ExchangeRight Net Leased Portfolio #30 | Various | Various | Various | $61,342,800 | 4.8% | 375,560 | $163.34 | 2.46x | 9.4% | 61.6% | 61.6% |
| 8 | WFB | 1000 South Broadway Apartments | Denver | CO | Multifamily | $54,500,000 | 4.2% | 260 | $209,615.38 | 1.94x | 7.2% | 60.2% | 60.2% |
| 9 | MSMCH | Oklahoma Multifamily Portfolio | Various | OK | Multifamily | $51,715,000 | 4.0% | 827 | $62,533.25 | 1.55x | 9.6% | 72.7% | 66.4% |
| 10 | MSMCH | FTERE Bronx Multifamily Portfolio | Bronx | NY | Multifamily | $50,400,000 | 3.9% | 355 | $141,971.83 | 2.00x | 7.8% | 67.6% | 67.6% |
| Total/Wtd. Avg. | $737,857,800 | 57.3% | 3.04x | 10.7% | 51.1% | 50.6% | |||||||
(1) | With respect to any mortgage loan that is part of a whole loan, unless otherwise indicated, all LTV, DSCR, Debt Yield and Balance per SF/Unit calculations in this Term Sheet include any related pari passu companion loans and exclude any subordinate companion loans, as applicable. Additionally, LTV, DSCR, Debt Yield and Balance per SF/Unit figures in this Term Sheet are calculated for mortgage loans without regard to any additional indebtedness that may be incurred at a future date. With respect to any leased fee loans, the SF/Units and Balance per SF/Unit figures in this Term Sheet are based on the size of the non-collateral improvements. |
| This is not a research report and was not prepared by any Underwriter’s research department. Please see additional important information and qualifications at the end of this Term Sheet. |
T-18
BANK 2019-BNK23 | Characteristics of the Mortgage Loans |
| Mortgage Loans with Pari Passu Companion Loans | ||||||||||||
| Loan No. | Mortgage Loan Seller | Property Name | Mortgage Loan Cut-off Date Balance | Aggregate Pari Passu Companion Loan Cut-off Date Balance | Combined Cut-off Date Balance | Lead Servicing Agreement | Master Servicer | Special Servicer | Control Rights | Combined UW NCF DSCR(1) | Combined UW NOI Debt Yield(1) | Combined Cut-off Date LTV(1) |
| 1 | MSMCH/WFB | Century Plaza Towers | $105,000,000 | $795,000,000 | $900,000,000 | CPTS 2019-CPT | Wells Fargo | CWCapital | CPTS 2019-CPT | 4.09x | 13.5% | 39.1% |
| 2 | BANA/WFB | Jackson Park | $100,000,000 | $450,000,000 | $550,000,000 | JAX 2019-LIC | Wells Fargo | Aegon | JAX 2019-LIC | 3.92x | 13.0% | 34.4% |
| 3 | BANA | Park Tower at Transbay | $100,000,000 | $450,000,000 | $550,000,000 | BANK 2019-BNK21 | Wells Fargo | Rialto | BANK 2019-BNK21 | 2.93x | 10.2% | 49.1% |
| 4 | MSMCH/BANA | ILPT Industrial Portfolio | $75,000,000 | $139,400,000 | $214,400,000 | MSC 2019-L3 | Wells Fargo | LNR | (2) | 5.05x | 14.8% | 39.2% |
| 5 | WFB | 360 North Crescent Drive | $73,600,000 | $55,000,000 | $128,600,000 | BANK 2019-BNK23 | Wells Fargo | KeyBank | BANK 2019-BNK23 | 2.31x | 8.3% | 52.2% |
| 13 | BANA | Sacramento Office Portfolio | $35,000,000 | $14,400,000 | $49,400,000 | BANK 2019-BNK23 | Wells Fargo | KeyBank | BANK 2019-BNK23 | 2.98x | 11.2% | 67.1% |
| 17 | MSMCH | National Anchored Retail Portfolio | $25,000,000 | $92,000,000 | $117,000,000 | BANK 2019-BNK21 | Wells Fargo | Rialto | BANK 2019-BNK21 | 2.96x | 11.6% | 62.8% |
(1) | DSCR, Debt Yield and LTV calculations include any related pari passu companion loans and exclude any subordinate companion loans, as applicable. |
(2) | The initial directing holder is the holder of the related Note B-1 until the occurrence of a control appraisal event under the related intercreditor agreement, at which time the directing holder will be the directing certificateholder (or other designated party) under the related lead servicing agreement. See “Description of the Mortgage Pool—The Whole Loans” in the Prospectus. |
| Mortgage Loans with Subordinate Debt | |||||||||||
| Loan No. | Mortgage Loan Seller | Property Name | Mortgage Loan Cut-off Date Balance | Cut-off Date Balance per Unit/SF | Subordinate Debt Cut-off Date Balance | UW NCF DSCR | UW NOI Debt Yield | Cut-off Date LTV | Whole Loan UW NCF DSCR(1) | Whole Loan UW NOI Debt Yield(1) | Whole Loan Cut-off Date LTV(1) |
| 1 | MSMCH/WFB | Century Plaza Towers | $105,000,000 | $374.74 | $300,000,000 | 4.09x | 13.5% | 39.1% | 3.07x | 10.1% | 52.1% |
| 2 | BANA/WFB | Jackson Park | $100,000,000 | $293,960.45 | $450,000,000 | 3.92x | 13.0% | 34.4% | 2.15x | 7.1% | 62.5% |
| 4 | MSMCH/BANA | ILPT Industrial Portfolio | $75,000,000 | $26.12 | $135,600,000 | 5.05x | 14.8% | 39.2% | 2.47x | 9.1% | 64.0% |
| 14 | WFB | Plaza Pacoima | $31,200,000 | $153.13 | $4,735,000 | 2.72x | 9.9% | 60.8% | 1.75x | 8.6% | 70.0% |
| (1) | Whole Loan UW NCF DSCR, Whole Loan UW NOI Debt Yield and Whole Loan Cut-off Date LTV figures shown above are calculated based on any related pari passu notes and any related subordinate note(s). |
| This is not a research report and was not prepared by any Underwriter’s research department. Please see additional important information and qualifications at the end of this Term Sheet. |
T-19
BANK 2019-BNK23 | Characteristics of the Mortgage Loans |
| Prior Securitization History(1) | ||||||||||||||
| Loan No. | Mortgage Loan Seller | Property Name | City | State | Property Type | Cut-off Date Balance | % of Pool | SF/Units/ Pad | Cut-off Date Balance per SF/Unit/Pad | UW NCF DSCR(2) | UW NOI Debt Yield(2) | Cut-off Date LTV(2) | Maturity Date LTV(2) | Prior Securitization |
| 1 | MSMCH/WFB | Century Plaza Towers | Los Angeles | CA | Office | $105,000,000 | 8.2% | 2,401,641 | $374.74 | 4.09x | 13.5% | 39.1% | 39.1% | MSC 2014-CPT |
| 5 | WFB | 360 North Crescent Drive | Beverly Hills | CA | Office | $73,600,000 | 5.7% | 123,848 | $1,038.37 | 2.31x | 8.3% | 52.2% | 52.2% | JPMCC 2012-LC9 |
| 6 | WFB | Norwalk Government Center | Norwalk | CA | Office | $66,300,000 | 5.2% | 451,455 | $146.86 | 2.10x | 8.5% | 63.5% | 63.5% | GMACC 2004-C3 |
| 11 | WFB | Metro 8 Self Storage Portfolio | Various | GA | Self Storage | $39,650,000 | 3.1% | 572,065 | $69.31 | 3.22x | 10.6% | 51.5% | 51.5% | COMM 2013-CR11 |
| 15 | MSMCH | El Mercado Shopping Center | Union City | CA | Retail | $28,000,000 | 2.2% | 109,168 | $256.49 | 1.50x | 9.0% | 63.9% | 57.9% | WFRBS 2012-C6 |
| 23 | WFB | American Airlines | Winston-Salem | NC | Office | $15,470,113 | 1.2% | 101,555 | $152.33 | 1.34x | 9.4% | 68.5% | 49.7% | COMM 2015-CCRE25 |
| 25 | BANA | Cedar Village MHC | Bloomington | CA | Manufactured Housing | $15,125,000 | 1.2% | 239 | $63,284.52 | 2.42x | 8.4% | 66.0% | 66.0% | WFRBS 2011-C3 |
| 26 | BANA | Arabian Gardens MHC | Indio | CA | Manufactured Housing | $15,000,000 | 1.2% | 248 | $60,483.87 | 2.46x | 8.6% | 64.1% | 64.1% | WFRBS 2011-C3 |
| Total | $358,145,113 | 27.8% | ||||||||||||
| (1) | Includes mortgage loans for which all or a portion of the previously existing debt was most recently securitized in conduit securitizations, based on information provided by the related borrower or obtained through searches of a third-party database. The information has not otherwise been confirmed by the mortgage loan sellers. With respect to any mortgage loan that is part of a whole loan, unless otherwise indicated, all LTV, DSCR, Debt Yield and Cut-off Date Balance per SF/Unit/Pad calculations include any related pari passu companion loans and exclude any related subordinate companion loans, as applicable. |
| (2) | For properties that are part of a portfolio, the Cut-off Date Balance Per SF/Unit/Pad, UW NCF DSCR, UW NOI Debt Yield, Cut-off Date LTV and Maturity Date LTV calculations reflect the values of the portfolio as a whole. |
| This is not a research report and was not prepared by any Underwriter’s research department. Please see additional important information and qualifications at the end of this Term Sheet. |
T-20
BANK 2019-BNK23 | Characteristics of the Mortgage Loans |

Property Type Distribution(1) | ||||||||
Property Type | Number of Mortgaged Properties | Aggregate Cut-off Date Balance | % of Pool | Wtd. Avg. Mortgage Rate | Wtd. Avg. UW NCF DSCR | Wtd. Avg. UW NOI Debt Yield | Wtd. Avg. Cut-off Date LTV | Wtd. Avg. Maturity |
Office | 13 | $457,643,223 | 35.6% | 3.4448% | 2.79x | 10.6% | 53.9% | 51.8% |
Suburban | 10 | $249,047,223 | 19.4% | 3.6253% | 2.18x | 9.6% | 61.9% | 58.2% |
CBD | 2 | $205,000,000 | 15.9% | 3.2218% | 3.52x | 11.9% | 44.0% | 44.0% |
Medical | 1 | $3,596,000 | 0.3% | 3.6580% | 2.46x | 9.4% | 61.6% | 61.6% |
Multifamily | 17 | $327,165,000 | 25.4% | 3.6577% | 2.51x | 9.7% | 56.7% | 55.5% |
Mid Rise | 7 | $115,300,000 | 9.0% | 3.7310% | 1.92x | 7.6% | 64.2% | 63.7% |
Garden | 9 | $111,865,000 | 8.7% | 3.9465% | 1.86x | 8.9% | 68.8% | 65.9% |
High Rise | 1 | $100,000,000 | 7.8% | 3.2500% | 3.92x | 13.0% | 34.4% | 34.4% |
Retail | 38 | $264,809,864 | 20.6% | 3.6876% | 2.30x | 10.2% | 61.4% | 57.4% |
Anchored | 13 | $180,075,252 | 14.0% | 3.6748% | 2.24x | 10.2% | 61.6% | 56.7% |
Single Tenant | 22 | $64,096,800 | 5.0% | 3.6697% | 2.57x | 9.9% | 59.9% | 59.9% |
Unanchored | 2 | $15,102,813 | 1.2% | 3.8809% | 1.80x | 10.8% | 68.6% | 56.6% |
Free-Standing | 1 | $5,535,000 | 0.4% | 3.7850% | 2.67x | 11.0% | 50.8% | 50.8% |
Industrial | 12 | $81,278,027 | 6.3% | 2.7081% | 4.89x | 14.5% | 41.4% | 41.4% |
Warehouse Distribution | 11 | $75,000,000 | 5.8% | 2.6533% | 5.05x | 14.8% | 39.2% | 39.2% |
Flex | 1 | $6,278,027 | 0.5% | 3.3630% | 2.98x | 11.2% | 67.1% | 67.1% |
Hospitality | 4 | $61,412,982 | 4.8% | 3.8668% | 2.61x | 13.8% | 60.5% | 51.8% |
Full Service | 2 | $42,909,577 | 3.3% | 3.8000% | 2.87x | 14.2% | 57.7% | 51.1% |
Limited Service | 2 | $18,503,404 | 1.4% | 4.0216% | 2.00x | 12.7% | 67.1% | 53.5% |
Self Storage | 13 | $58,338,318 | 4.5% | 3.4268% | 2.85x | 10.3% | 55.7% | 53.9% |
Self Storage | 13 | $58,338,318 | 4.5% | 3.4268% | 2.85x | 10.3% | 55.7% | 53.9% |
Manufactured Housing | 2 | $30,125,000 | 2.3% | 3.4090% | 2.44x | 8.5% | 65.1% | 65.1% |
Manufactured Housing | 2 | $30,125,000 | 2.3% | 3.4090% | 2.44x | 8.5% | 65.1% | 65.1% |
Mixed Use | 1 | $6,250,000 | 0.5% | 4.0900% | 1.87x | 8.3% | 65.1% | 65.1% |
Retail/Office | 1 | $6,250,000 | 0.5% | 4.0900% | 1.87x | 8.3% | 65.1% | 65.1% |
Total/Wtd. Avg. | 100 | $1,287,022,414 | 100.0% | 3.5240% | 2.73x | 10.6% | 56.1% | 53.7% |
(1) | All numerical information concerning the mortgage loans is approximate and, in the case of mortgage loans secured by multiple properties, is based on allocated loan amounts with respect to such properties. All weighted average information regarding the mortgage loans reflects the weighting of the mortgage loans based on their outstanding principal balances as of the Cut-off Date or, in the case of mortgage loans secured by multiple properties, allocated loan amounts. The sum of numbers and percentages in columns may not match the “Total” due to rounding. With respect to any mortgage loan that is part of a whole loan, unless otherwise indicated, all LTV, DSCR and Debt Yield calculations include any related pari passu companion loans and exclude any related subordinate companion loans, as applicable. |
| This is not a research report and was not prepared by any Underwriter’s research department. Please see additional important information and qualifications at the end of this Term Sheet. |
T-21
BANK 2019-BNK23 | Characteristics of the Mortgage Loans |

Geographic Distribution(1) | ||||||||
State or Other Jurisdiction | Number of Mortgaged Properties | Aggregate Cut-off Date Balance | % of Pool | Wtd. Avg. Mortgage Rate | Wtd. Avg. UW NCF DSCR | Wtd. Avg. UW NOI Debt Yield | Wtd. Avg. Cut-off Date LTV | Wtd. Avg. Maturity Date LTV |
California | 17 | $537,134,290 | 41.7% | 3.4372% | 2.79x | 10.3% | 53.8% | 52.9% |
California – Southern(2) | 10 | $349,406,000 | 27.1% | 3.3960% | 2.92x | 10.4% | 52.2% | 52.2% |
California – Northern(2) | 7 | $187,728,290 | 14.6% | 3.5138% | 2.55x | 10.2% | 56.8% | 54.1% |
New York | 8 | $164,731,836 | 12.8% | 3.4319% | 3.24x | 11.5% | 45.1% | 44.5% |
Georgia | 12 | $59,912,049 | 4.7% | 3.4264% | 2.85x | 10.8% | 56.6% | 53.7% |
Colorado | 1 | $54,500,000 | 4.2% | 3.5980% | 1.94x | 7.2% | 60.2% | 60.2% |
Oklahoma | 5 | $51,715,000 | 4.0% | 4.1900% | 1.55x | 9.6% | 72.7% | 66.4% |
North Carolina | 5 | $45,571,045 | 3.5% | 3.9927% | 1.77x | 11.5% | 66.6% | 52.0% |
Texas | 7 | $41,592,995 | 3.2% | 3.7905% | 2.28x | 10.5% | 63.9% | 61.2% |
Virginia | 3 | $36,671,673 | 2.8% | 3.4295% | 3.99x | 15.1% | 47.6% | 47.6% |
South Carolina | 1 | $36,000,000 | 2.8% | 3.8250% | 1.95x | 7.7% | 67.3% | 67.3% |
Illinois | 5 | $34,747,732 | 2.7% | 3.6662% | 2.46x | 12.4% | 67.0% | 61.7% |
Wisconsin | 6 | $34,677,800 | 2.7% | 3.8770% | 2.13x | 9.3% | 64.1% | 62.2% |
Michigan | 3 | $29,865,821 | 2.3% | 3.9005% | 1.67x | 8.9% | 71.1% | 59.4% |
Indiana | 5 | $29,320,087 | 2.3% | 2.7314% | 4.89x | 14.6% | 41.0% | 41.0% |
New Jersey | 1 | $24,750,000 | 1.9% | 3.4500% | 1.89x | 11.5% | 73.4% | 62.8% |
Pennsylvania | 4 | $18,705,797 | 1.5% | 3.5063% | 2.85x | 10.2% | 58.2% | 58.2% |
New Mexico | 2 | $13,936,754 | 1.1% | 4.1730% | 1.48x | 9.6% | 67.3% | 54.0% |
Ohio | 1 | $12,957,038 | 1.0% | 2.6533% | 5.05x | 14.8% | 39.2% | 39.2% |
Florida | 2 | $12,807,318 | 1.0% | 4.1258% | 1.75x | 9.0% | 66.8% | 59.9% |
Arizona | 1 | $11,150,000 | 0.9% | 3.3610% | 2.37x | 8.3% | 63.7% | 63.7% |
Louisiana | 6 | $10,329,200 | 0.8% | 3.6580% | 2.46x | 9.4% | 61.6% | 61.6% |
Missouri | 1 | $8,459,781 | 0.7% | 2.6533% | 5.05x | 14.8% | 39.2% | 39.2% |
Kentucky | 1 | $5,635,283 | 0.4% | 2.6533% | 5.05x | 14.8% | 39.2% | 39.2% |
Iowa | 1 | $4,456,124 | 0.3% | 2.6533% | 5.05x | 14.8% | 39.2% | 39.2% |
Maryland | 1 | $4,044,790 | 0.3% | 2.6533% | 5.05x | 14.8% | 39.2% | 39.2% |
Utah | 1 | $3,350,000 | 0.3% | 3.8000% | 2.60x | 10.1% | 59.8% | 59.8% |
Total/Wtd. Avg. | 100 | $1,287,022,414 | 100.0% | 3.5240% | 2.73x | 10.6% | 56.1% | 53.7% |
(1) | All numerical information concerning the mortgage loans is approximate and, in the case of mortgage loans secured by multiple properties, is based on allocated loan amounts with respect to such properties. All weighted average information regarding the mortgage loans reflects the weighting of the mortgage loans based on their outstanding principal balances as of the Cut-off Date or, in the case of mortgage loans secured by multiple properties, allocated loan amounts. The sum of numbers and percentages in columns may not match the “Total” due to rounding. With respect to any mortgage loan that is part of a whole loan, unless otherwise indicated, all LTV, DSCR and Debt Yield calculations include any related pari passu companion loans and exclude any related subordinate companion loans, as applicable. |
(2) | “California – Northern” includes zip codes above 93600, and “California – Southern” includes zip codes at or below 93600. |
| This is not a research report and was not prepared by any Underwriter’s research department. Please see additional important information and qualifications at the end of this Term Sheet. |
T-22
BANK 2019-BNK23 | Collateral Statistics |
Collateral Statistics(1)
Cut-off Date Balance ($)
| No. of | Aggregate | % of |
3,000,000 - 10,000,000 | 15 | $88,731,768 | 6.9 |
10,000,001 - 20,000,000 | 11 | $149,456,947 | 11.6 |
20,000,001 - 30,000,000 | 7 | $169,125,899 | 13.1 |
30,000,001 - 40,000,000 | 4 | $141,850,000 | 11.0 |
40,000,001 - 60,000,000 | 3 | $156,615,000 | 12.2 |
60,000,001 - 70,000,000 | 2 | $127,642,800 | 9.9 |
70,000,001 - 80,000,000 | 2 | $148,600,000 | 11.5 |
80,000,001 - 105,000,000 | 3 | $305,000,000 | 23.7 |
Total: | 47 | $1,287,022,414 | 100.0% |
Min: $3,000,000 Max: $105,000,000 Avg: $27,383,456 | |||
State or Other Jurisdiction(2)
| No. of | Aggregate | % of Pool |
California | 17 | 537,134,290 | 41.7 |
California – Southern(3) | 10 | 349,406,000 | 27.1 |
California – Northern(3) | 7 | 187,728,290 | 14.6 |
New York | 8 | 164,731,836 | 12.8 |
Georgia | 12 | 59,912,049 | 4.7 |
Colorado | 1 | 54,500,000 | 4.2 |
Oklahoma | 5 | 51,715,000 | 4.0 |
North Carolina | 5 | 45,571,045 | 3.5 |
Texas | 7 | 41,592,995 | 3.2 |
Virginia | 3 | 36,671,673 | 2.8 |
South Carolina | 1 | 36,000,000 | 2.8 |
Illinois | 5 | 34,747,732 | 2.7 |
Wisconsin | 6 | 34,677,800 | 2.7 |
Michigan | 3 | 29,865,821 | 2.3 |
Indiana | 5 | 29,320,087 | 2.3 |
New Jersey | 1 | 24,750,000 | 1.9 |
Pennsylvania | 4 | 18,705,797 | 1.5 |
New Mexico | 2 | 13,936,754 | 1.1 |
Ohio | 1 | 12,957,038 | 1.0 |
Florida | 2 | 12,807,318 | 1.0 |
Arizona | 1 | 11,150,000 | 0.9 |
Louisiana | 6 | 10,329,200 | 0.8 |
Missouri | 1 | 8,459,781 | 0.7 |
Kentucky | 1 | 5,635,283 | 0.4 |
Iowa | 1 | 4,456,124 | 0.3 |
Maryland | 1 | 4,044,790 | 0.3 |
Utah | 1 | 3,350,000 | 0.3 |
Total: | 100 | $1,287,022,414 | 100.0% |
Property Type(2)
| No. of | Aggregate | % of |
Office | 13 | 457,643,223 | 35.6 |
Suburban | 10 | 249,047,223 | 19.4 |
CBD | 2 | 205,000,000 | 15.9 |
Medical | 1 | 3,596,000 | 0.3 |
Multifamily | 17 | 327,165,000 | 25.4 |
Mid Rise | 7 | 115,300,000 | 9.0 |
Garden | 9 | 111,865,000 | 8.7 |
High Rise | 1 | 100,000,000 | 7.8 |
Retail | 38 | 264,809,864 | 20.6 |
Anchored | 13 | 180,075,252 | 14.0 |
Single Tenant | 22 | 64,096,800 | 5.0 |
Unanchored | 2 | 15,102,813 | 1.2 |
Free-Standing | 1 | 5,535,000 | 0.4 |
Industrial | 12 | 81,278,027 | 6.3 |
Warehouse Distribution | 11 | 75,000,000 | 5.8 |
Flex | 1 | 6,278,027 | 0.5 |
Hospitality | 4 | 61,412,982 | 4.8 |
Full Service | 2 | 42,909,577 | 3.3 |
Limited Service | 2 | 18,503,404 | 1.4 |
Self Storage | 13 | 58,338,318 | 4.5 |
Self Storage | 13 | 58,338,318 | 4.5 |
Manufactured Housing | 2 | 30,125,000 | 2.3 |
Manufactured Housing | 2 | 30,125,000 | 2.3 |
Mixed Use | 1 | 6,250,000 | 0.5 |
Retail/Office | 1 | 6,250,000 | 0.5 |
Total: | 100 | $1,287,022,414 | 100.0% |
|
|
|
|
Mortgage Rate (%)
| No. of | Aggregate | % of |
2.65326 - 3.24900 | 3 | 219,650,000 | 17.1 |
3.25000 - 3.49900 | 10 | 411,206,836 | 32.0 |
3.50000 - 3.99900 | 25 | 530,132,989 | 41.2 |
4.00000 - 4.26000 | 9 | 126,032,589 | 9.8 |
Total: | 47 | $1,287,022,414 | 100.0% |
Min: 2.65326% Max: 4.26000% Wtd Avg: 3.52396% | |||
Original Term to Maturity or ARD (mos.)
| No. of | Aggregate | % of |
120 | 47 | 1,287,022,414 | 100.0 |
Total: | 47 | $1,287,022,414 | 100.0% |
Min: 120 mos. Max: 120 mos. Wtd Avg: 120 mos. | |||
Remaining Term to Maturity or ARD (mos.)
| No. of | Aggregate | % of |
116 - 119 | 37 | 1,088,782,414 | 84.6 |
120 | 10 | 198,240,000 | 15.4 |
Total: | 47 | $1,287,022,414 | 100.0% |
Min: 116 mos. Max: 120 mos. Wtd Avg: 119 mos. | |||
Original Amortization Term (mos.)
| No. of | Aggregate | % of |
Interest Only | 29 | 995,698,800 | 77.4 |
300 | 1 | 15,470,113 | 1.2 |
360 | 17 | 275,853,501 | 21.4 |
Total: | 47 | $1,287,022,414 | 100.0% |
Min: 300 mos. Max: 360 mos. Wtd Avg: 357 mos. | |||
Remaining Amortization Term (mos.)
| No. of | Aggregate | % of |
Interest Only | 29 | 995,698,800 | 77.4 |
299 | 1 | 15,470,113 | 1.2 |
357 - 360 | 17 | 275,853,501 | 21.4 |
Total: | 47 | $1,287,022,414 | 100.0% |
Min: 299 mos. Max: 360 mos. Wtd Avg: 356 mos. | |||
Mortgage Loan Sellers
| No. of | Aggregate | % of |
WFB | 15 | 364,878,601 | 28.4 |
BANA | 14 | 358,938,813 | 27.9 |
MSMCH | 15 | 283,205,000 | 22.0 |
MSMCH/WFB | 1 | 105,000,000 | 8.2 |
BANA/WFB | 1 | 100,000,000 | 7.8 |
MSMCH/BANA | 1 | 75,000,000 | 5.8 |
Total: | 47 | $1,287,022,414 | 100.0% |
Amortization Type
| No. of | Aggregate | % of |
Interest Only | 28 | 895,698,800 | 69.6 |
Partial Interest Only | 8 | 156,670,000 | 12.2 |
Amortizing Balloon | 10 | 134,653,614 | 10.5 |
Interest Only, ARD | 1 | 100,000,000 | 7.8 |
Total: | 47 | $1,287,022,414 | 100.0% |
Cut-off Date LTV Ratio (%)
| No. of | Aggregate | % of |
27.3 - 55.0 | 11 | 560,366,836 | 43.5 |
55.1 - 60.0 | 4 | 27,172,195 | 2.1 |
60.1 - 65.0 | 12 | 316,884,155 | 24.6 |
65.1 - 70.0 | 16 | 273,365,812 | 21.2 |
70.1 - 73.9 | 4 | 109,233,416 | 8.5 |
Total: | 47 | $1,287,022,414 | 100.0% |
Min: 27.3% | Max: 73.9% | Wtd Avg: 56.1% |
|
Maturity Date or ARD LTV Ratio (%)
| No. of Loans | Aggregate | % of |
27.3 - 40.0 | 5 | 294,331,836 | 22.9 |
40.1 - 50.0 | 6 | 183,887,663 | 14.3 |
50.1 - 55.0 | 6 | 160,188,650 | 12.4 |
55.1 - 60.0 | 8 | 94,526,465 | 7.3 |
60.1 - 65.0 | 15 | 350,597,800 | 27.2 |
65.1 - 67.6 | 7 | 203,490,000 | 15.8 |
Total: | 47 | $1,287,022,414 | 100.0% |
Min: 27.3% | Max: 67.6% | Wtd Avg: 53.7% |
|
UW NCF DSCR (x)
| No. of | Aggregate | % of |
1.34 - 1.60 | 7 | 152,290,283 | 11.8 |
1.61 - 1.80 | 4 | 42,458,513 | 3.3 |
1.81 - 2.00 | 8 | 214,571,627 | 16.7 |
2.01 - 2.20 | 3 | 75,822,355 | 5.9 |
2.21 - 2.40 | 5 | 116,911,836 | 9.1 |
2.41 - 5.05 | 20 | 684,967,800 | 53.2 |
Total: | 47 | $1,287,022,414 | 100.0% |
Min: 1.34x | Max: 5.05x | Wtd Avg: 2.73x |
|
UW NOI Debt Yield (%)
| No. of | Aggregate | % of |
7.2 - 9.0 | 14 | 403,024,416 | 31.3 |
9.1 - 10.0 | 10 | 205,421,985 | 16.0 |
10.1 - 12.0 | 12 | 305,886,195 | 23.8 |
12.1 - 14.0 | 7 | 260,859,818 | 20.3 |
14.1 - 16.0 | 3 | 108,830,000 | 8.5 |
16.1 - 18.4 | 1 | 3,000,000 | 0.2 |
Total: | 47 | $1,287,022,414 | 100.0% |
Min: 7.2% | Max: 18.4% | Wtd Avg: 10.6% |
|
(1) | All numerical information concerning the mortgage loans is approximate. All weighted average information regarding the mortgage loans reflects the weighting of the mortgage loans based on their outstanding principal balances as of the Cut-off Date. The sum of numbers and percentages in columns may not match the “Total” due to rounding. With respect to any mortgage loan that is part of a whole loan, unless otherwise indicated, all LTV, DSCR and Debt Yield calculations include any related pari passu companion loans and exclude any related subordinate companion loans, as applicable. |
(2) | In the case of mortgage loans secured by multiple properties, cut-off date balance information is based on allocated loan amounts with respect to such properties. |
(3) | “California – Northern” includes zip codes above 93600, and “California – Southern” includes zip codes at or below 93600. |
| This is not a research report and was not prepared by any Underwriter’s research department. Please see additional important information and qualifications at the end of this Term Sheet. |
T-23
Office - CBD | Loan #1 | Cut-off Date Balance: |
| $105,000,000 |
2029 & 2049 Century Park East | Century Plaza Towers | Cut-off Date LTV: |
| 39.1% |
Los Angeles, CA 90067 |
| UW NCF DSCR: |
| 4.09x |
|
| UW NOI Debt Yield: |
| 13.5% |
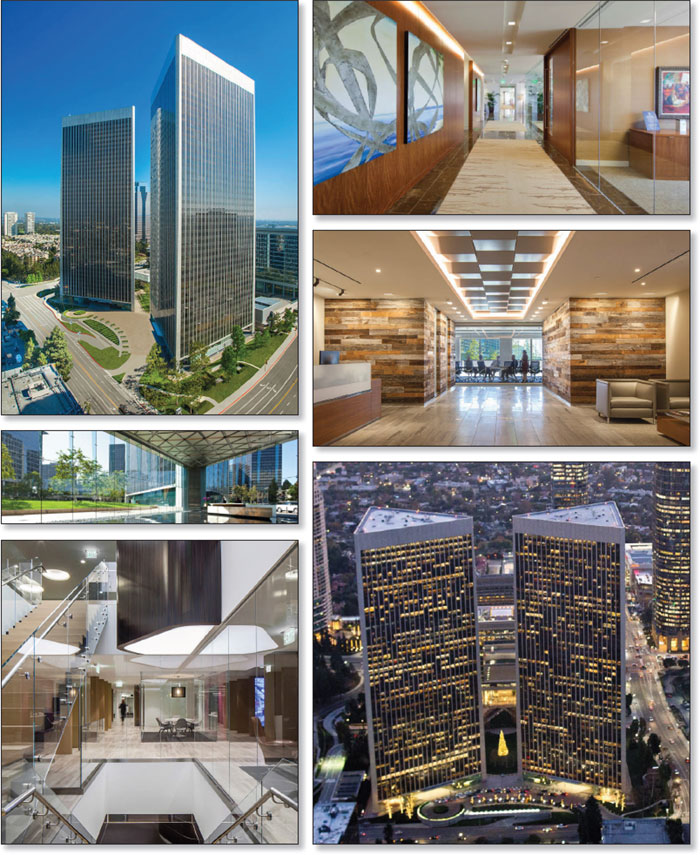
| This is not a research report and was not prepared by any Underwriter’s research department. Please see additional important information and qualifications at the end of this Term Sheet. |
T-24
Office - CBD | Loan #1 | Cut-off Date Balance: |
| $105,000,000 |
2029 & 2049 Century Park East | Century Plaza Towers | Cut-off Date LTV: |
| 39.1% |
Los Angeles, CA 90067 |
| UW NCF DSCR: |
| 4.09x |
|
| UW NOI Debt Yield: |
| 13.5% |
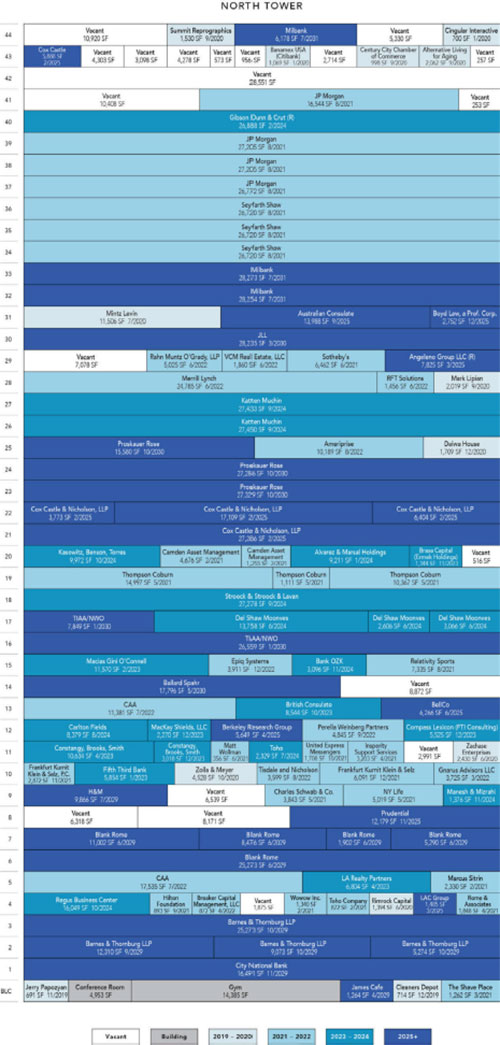
| This is not a research report and was not prepared by any Underwriter’s research department. Please see additional important information and qualifications at the end of this Term Sheet. |
T-25
Office - CBD | Loan #1 | Cut-off Date Balance: |
| $105,000,000 |
2029 & 2049 Century Park East | Century Plaza Towers | Cut-off Date LTV: |
| 39.1% |
Los Angeles, CA 90067 |
| UW NCF DSCR: |
| 4.09x |
|
| UW NOI Debt Yield: |
| 13.5% |
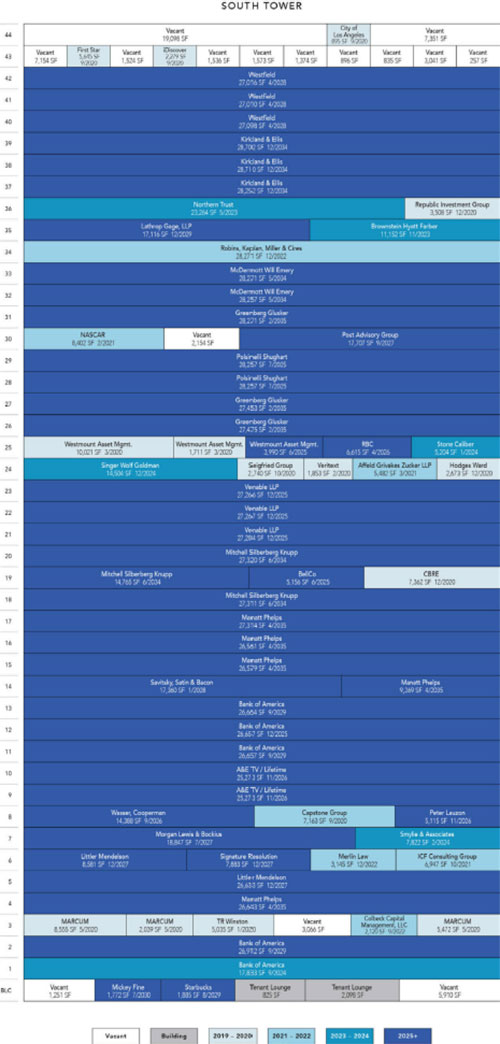
| This is not a research report and was not prepared by any Underwriter’s research department. Please see additional important information and qualifications at the end of this Term Sheet. |
T-26
Office - CBD | Loan #1 | Cut-off Date Balance: |
| $105,000,000 |
2029 & 2049 Century Park East | Century Plaza Towers | Cut-off Date LTV: |
| 39.1% |
Los Angeles, CA 90067 |
| UW NCF DSCR: |
| 4.09x |
|
| UW NOI Debt Yield: |
| 13.5% |
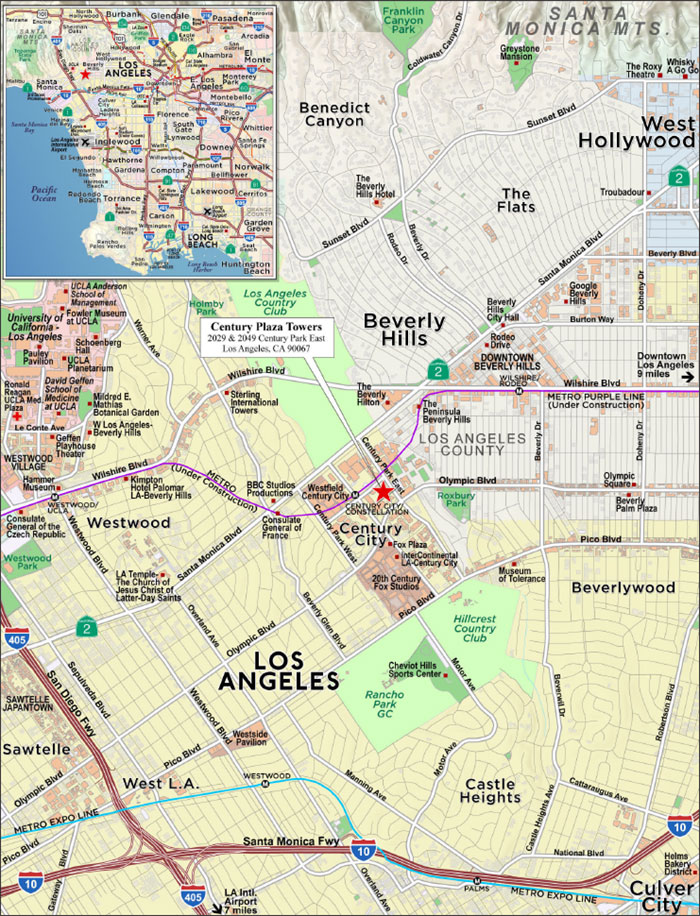
| This is not a research report and was not prepared by any Underwriter’s research department. Please see additional important information and qualifications at the end of this Term Sheet. |
T-27
Mortgage Loan No. 1 – Century Plaza Towers |
Mortgage Loan Information |
| Property Information | ||||
Mortgage Loan Seller(1): | MSMCH/WFB |
| Single Asset/Portfolio: | Single Asset | ||
Credit Assessment (KBRA/Fitch/S&P): | A+(sf)/BBB-sf/NR |
| Location: | Los Angeles, CA 90067 | ||
Original Balance(1): | $105,000,000 |
| General Property Type: | Office | ||
Cut-off Date Balance(1): | $105,000,000 |
| Detailed Property Type: | CBD | ||
% of Initial Pool Balance: | 8.2% |
| Title Vesting: | Fee | ||
Loan Purpose: | Refinance |
| Year Built/Renovated: | 1975 / 2015 | ||
Borrower Sponsors: | SPF JVP LLC; Luminance |
| Size: | 2,401,641 SF | ||
| Acquisition Venture LLC | Cut-off Date Balance per SF(1): | $375 | |||
Guarantor(2): | N/A | Maturity Date Balance per SF(1): | $375 | |||
Mortgage Rate: | 3.0045% | Property Manager: | CBRE, Inc. | |||
Note Date: | 10/21/2019 |
|
|
| ||
First Payment Date: | 12/9/2019 |
| Underwriting and Financial Information | |||
Maturity Date: | 11/9/2029 |
| UW NOI: | $121,145,756 | ||
Original Term to Maturity: | 120 months |
| UW NOI Debt Yield(1): | 13.5% | ||
Original Amortization Term: | 0 months |
| UW NOI Debt Yield at Maturity(1): | 13.5% | ||
IO Period: | 120 months |
| UW NCF DSCR(1): | 4.09x | ||
Seasoning: | 1 month |
| Most Recent NOI: | $83,342,918 (9/30/2019 TTM) | ||
Prepayment Provisions: | YM1 (25); DEF/YM1 (90); O (5) |
| 2nd Most Recent NOI: | $89,024,555 (12/31/2018) | ||
Lockbox/Cash Mgmt Status: | Hard/Springing |
| 3rd Most Recent NOI: | $83,200,132 (12/31/2017) | ||
Additional Debt Type(1)(3): | Pari Passu / Subordinate |
| Most Recent Occupancy: | 92.9% (10/1/2019) | ||
Additional Debt Balance(1)(3): | $795,000,000 / $300,000,000 |
| 2nd Most Recent Occupancy: | 83.5% (12/31/2018) | ||
Future Debt Permitted (Type)(4): | Yes (Mezzanine) |
| 3rd Most Recent Occupancy: | 84.6% (12/31/2017) | ||
Reserves(5) |
| Appraised Value (as of): | $2,302,000,000 (9/24/2019) | |||
Type | Initial | Monthly | Cap |
| Appraised Value per SF: | $959 |
RE Tax: | $0 | Springing | N/A |
| Cut-off Date LTV Ratio(1): | 39.1% |
Insurance: | $0 | Springing | N/A |
| Maturity Date LTV Ratio(1): | 39.1% |
Outstanding TI/LC: | $71,223,945 | $0 | N/A |
|
|
|
Free Rent Funds: | $29,545,735 | $0 | N/A |
|
|
|
Sources and Uses | ||||||
Sources | Proceeds | % of Total |
| Uses | Proceeds | % of Total |
Senior Loan Amount(1): | $900,000,000 | 75.0% |
| Refinance Existing Debt: | $823,449,563 | 68.6% |
Subordinate Companion Loan(1): | $300,000,000 | 25.0% |
| Upfront Reserves: | $100,769,680 | 8.4% |
|
|
|
| Closing Costs: | $2,834,724 | 0.2% |
|
|
|
| Return of Equity: | $272,946,032 | 22.7% |
Total Sources: | $1,200,000,000 | 100.0% |
| Total Uses: | $1,200,000,000 | 100.0% |
(1) | The Century Plaza Towers Mortgage Loan (as defined below) is part of the Century Plaza Towers Whole Loan (as defined below), which is comprised of 29 pari passu senior promissory notes with an aggregate original principal balance of $900,000,000 (the “Century Plaza Senior Notes,” and collectively, the “Century Plaza Towers Senior Loan”) and three pari passu subordinate promissory notes with an aggregate original principal balance of $300,000,000 (collectively, the “Century Plaza Towers Subordinate Companion Loan,” and together with the Century Plaza Towers Senior Loan, the “Century Plaza Towers Whole Loan”). The Cut-off Date Balance per SF, Maturity Date Balance per SF, UW NOI Debt Yield, UW NOI Debt Yield at Maturity, UW NCF DSCR, Cut-off Date LTV Ratio and Maturity Date LTV Ratio numbers presented above are based on the Century Plaza Towers Senior Loan. The Cut-off Date Balance per SF, Maturity Date Balance per SF, UW NOI Debt Yield, UW NOI Debt Yield at Maturity, UW NCF DSCR, Cut-off Date LTV Ratio and Maturity Date LTV Ratio numbers based on the Century Plaza Towers Whole Loan are $500, $500, 10.1%, 10.1%, 3.07x, 52.1% and 52.1%, respectively. The Century Plaza Towers Whole Loan was co-originated by WFB, DBNY, and MSBNA (all as defined below). |
(2) | There is no non-recourse carveout guarantor or separate environmental indemnitor with respect to the Century Plaza Towers Whole Loan. |
(3) | See “The Mortgage Loan” and “Additional Secured Indebtedness (not including trade debts)” below for further discussion of additional debt. |
(4) | See “Mezzanine Loan and Preferred Equity” below for further discussion of future mezzanine debt. |
(5) | See “Escrows and Reserves” below for further discussion of reserve requirements. |
The Mortgage Loan. The largest mortgage loan (the “Century Plaza Towers Mortgage Loan”) is part of the Century Plaza Towers Whole Loan in the original principal balance of $1,200,000,000. The Century Plaza Towers Whole Loan is secured by a first priority fee mortgage encumbering an office property in Los Angeles, California (the “Century Plaza Towers Property”). The Century Plaza Towers Whole Loan was co-originated by Deutsche Bank AG, New York Branch (“DBNY”), Wells Fargo Bank, National Association (“WFB”) and Morgan Stanley Bank, N.A. (“MSBNA”). Following origination, DBNY transferred its notes to DBR Investments Co. Limited (“DBRI”). The Century Plaza Towers Whole Loan is comprised of (i) the Century Plaza Towers Senior Loan, comprised of the 29 Century Plaza Senior Notes, that are pari passu with each other, with an aggregate original principal balance of $900,000,000 and (ii) the Century Plaza Towers Subordinate Companion Loan, comprised of three subordinate notes that are pari passu with each other and subordinate to the Century Plaza Towers Senior Loan, with an aggregate original principal balance of $300,000,000, each as described below. Promissory Notes A-2-C2, A-2-C5, A-2-C6, and A-2-C7, in the original principal balance of $62,500,000, which are being contributed by Morgan Stanley Mortgage Capital Holdings LLC (“MSMCH”) and promissory Notes A-3-C2, A-3-C5, in the original principal balance of $42,500,000, which are being contributed by WFB represent the Century Plaza Towers Mortgage Loan and will be included in the BANK 2019-BNK23 securitization trust. Of the remaining Century Plaza Senior Notes (collectively, the “Century Plaza Towers Non-Serviced Pari Passu Companion Loans”), the Century Plaza Towers Non-Serviced Pari Passu Companion Loans evidenced by promissory Notes A-1-S1, A-1-S2, A-1-S3, A-2-S1, A-2-S2, A-2-S3, A-3-S1, A-3-S2, A-3-S3, A-2-C1, A-2-C3, A-2-C4, A-3-C1, and A-3-C3, in the aggregate original principal balance of $525,000,000 and the entire Century Plaza Towers Subordinate Companion Loan is expected to be contributed to the CPTS 2019-CPT securitization trust. The Century Plaza Towers Whole Loan will be
| This is not a research report and was not prepared by any Underwriter’s research department. Please see additional important information and qualifications at the end of this Term Sheet. |
T-28
Office - CBD | Loan #1 | Cut-off Date Balance: |
| $105,000,000 |
2029 & 2049 Century Park East | Century Plaza Towers | Cut-off Date LTV: |
| 39.1% |
Los Angeles, CA 90067 |
| UW NCF DSCR: |
| 4.09x |
|
| UW NOI Debt Yield: |
| 13.5% |
serviced pursuant to the trust and servicing agreement for the CPTS 2019-CPT securitization trust. The remaining Century Plaza Towers Non-Serviced Pari Passu Companion Loans, which had an aggregate original principal balance of $270,000,000, are expected to be contributed to future securitization trusts or may be otherwise transferred at any time. See “Description of the Mortgage Pool—The Whole Loans—The Century Plaza Towers Pari Passu A/B Whole Loan” and “Pooling and Servicing Agreement—Servicing of the Non-Serviced Mortgage Loans” in the Preliminary Prospectus.
Century Plaza Towers Whole Loan Summary | ||||
Notes | Original Balance | Cut-off Date Balance | Note Holder | Controlling Piece |
Century Plaza Towers Mortgage Loan |
|
|
|
|
A-2-C2, A-2-C5, A-2-C6, A-2-C7, A-3-C2, A-3-C5 | $105,000,000 | $105,000,000 | BANK 2019-BNK23(1) | No |
Century Plaza Towers Non-Serviced Pari Passu Companion Loans |
|
|
|
|
A-1-S1, A-1-S2, A-1-S3, A-2-S1, A-2-S2, A-2-S3, A-3-S1, A-3-S2, A-3-S3, A-2-C1, A-2-C3, A-2-C4, A-3-C1, A-3-C3 | $525,000,000 | $525,000,000 | CPTS 2019-CPT | Yes(2) |
A-1-C1, A-1-C2, A-1-C3, A-1-C4, A-1-C5, A-1-C6, A-1-C7, A-1-C8 | $250,000,000 | $250,000,000 | DBRI | No |
A-3-C4 | $20,000,000 | $20,000,000 | WFB | No |
Century Plaza Towers Subordinate Companion Loan |
|
|
|
|
B-1, B-2, B-3 | $300,000,000 | $300,000,000 | CPTS 2019-CPT | Yes(2)(3) |
Total | $1,200,000,000 | $1,200,000,000 |
|
|
(1) | Promissory Notes A-2-C2, A-2-C5, A-2-C6, A-2-C7, in the original principal balance of $62,500,000, contributed by MSMCH, and promissory Notes A-3-C2, A-3-C5, in the original principal balance of $42,500,000, contributed by WFB, which together have an aggregate original principal balance of $105,000,000, represent the Century Plaza Towers Mortgage Loan. |
(2) | No single promissory note comprising a part of the Century Plaza Towers Whole Loan is the related control note; however, the CPTS 2019-CPT securitization trust is the related controlling note holder, and a party designated under the related trust and servicing agreement is entitled to exercise the rights thereof. |
(3) | The Century Plaza Towers Subordinate Companion Loan is subordinate to the Century Plaza Towers Senior Loan. |
The Borrower and the Borrower Sponsors. The borrower is One Hundred Towers L.L.C. (the “Century Plaza Towers Borrower”), a Delaware limited liability company with two independent directors. SPF JVP LLC (“SPF”) and Luminance Acquisition Venture LLC are the borrower sponsors. There is no non-recourse carveout guarantor or separate environmental indemnitor with respect to the Century Plaza Towers Whole Loan. The Century Plaza Towers Borrower is a joint venture between (i) the Commingled Pension Trust Fund (Strategic Property) of JPMorgan Chase Bank, N.A. and (ii) a joint venture between an institutional account managed by both Hines and Hines Investment Management Holdings Limited Partnership (together with Hines, “Hines JV”). Hines JV is a privately owned global real estate investment, development and management firm, founded in 1957, with a presence in 219 cities in 23 countries and assets under management for which Hines provides both fiduciary investment management services and third party property-level services.
The Property. The Century Plaza Towers Property consists of two Class A, 44-story office towers which contain 2,401,641 SF of office space and a lower level retail concourse. In addition, the Century Plaza Towers Property has an underground garage containing a total of 6,566 parking spaces (of which 5,907 spaces are part of the collateral for the Century Plaza Towers Whole Loan). The Century Plaza Towers Property was originally developed in 1975 for Aluminum Company of America (Alcoa) and was designed by Minoru Yamasaki.
The Century Plaza Towers Property includes 26,000 SF column-free flexible floor plates. The Century Plaza Towers Property underwent an $80.0 million renovation in 2008 and has had approximately $48.0 million of capital expenditures invested since 2014, including a multi-year program currently underway to fully renovate all restrooms, multi-tenant corridors, and elevator lobbies; nearly $28.0 million has been invested since 2015. Together with the property located at 2000 Avenue of the Stars (which is also owned by the borrower sponsor), the Century Plaza Towers Property is part of Century Park, a 14-acre campus that includes a four-acre park, restaurants, cafes, and other amenity retail. The Century Plaza Towers Property is 92.9% leased as of October 1, 2019 to 122 tenants across approximately 1.2 million SF of office space in the North Tower, approximately 1.2 million SF of office space in the South Tower and approximately 39,500 SF of ground floor retail and amenity space. The largest tenants include Bank of America (6.2% of NRA / 6.5% of GPR / $56.98 gross rent PSF, rated A2/A-/A+ by Moody’s/S&P/Fitch), Manatt Phelps (4.8% of NRA / 5.5% of GPR / $62.26 gross rent PSF, #105 in a 2019 magazine ranking of law firms based on gross revenue), JPMorgan (4.1% of NRA / 4.2% of GPR / $57.00 gross rent PSF, rated A2/A-/AA- by Moody’s/S&P/Fitch), Kirkland & Ellis (3.6% of NRA / 4.5% of GPR / $68.79 gross rent PSF, #1 in a 2019 magazine ranking of law firms based on gross revenue), Greenberg Glusker (3.5% of NRA / 4.2% of GPR / $66.00 gross rent PSF).
The Century Plaza Towers Property benefits from tenant diversity, with 122 distinct tenants, none of which account for more than 6.2% of NRA or 6.5% of the total underwritten base rent. As of October 1, 2019, the weighted average original lease term for all tenants collectively at the Century Plaza Towers Property was 10.8 years, and the weighted average remaining lease term is 7.7 years. The five largest tenants at the Century Plaza Towers Property comprise 532,463 SF, representing approximately 22.2% of NRA and approximately 24.9% of underwritten base rent. The ten largest tenants comprise 915,155 SF, representing approximately 38.1% of NRA and approximately 42.6% of underwritten base rent. As of October 1, 2019, the weighted average remaining lease term for the five largest tenants is 10.9 years.
Major Tenants.
Bank of America (149,508 SF / 6.2% of NRA / 6.5% of underwritten base rent). Bank of America (NYSE: BAC) is an investment and retail banking institution and financial services company based in Charlotte, North Carolina. It is the second largest banking institution in the United States by total assets. The institution’s corporate and investment banking division operates under the name Bank of America Merrill Lynch. Bank of America occupies four suites in the South Tower on the 1st, 2nd, 11th and 12th floors totaling 98,059 SF. Bank of America has signed a lease for an additional 26,664 SF on the 13th floor of the South Tower and is expected to begin paying rent and take occupancy in January 2020. Merrill Lynch occupies one suite in the North Tower totaling 24,785 SF. The firm pays approximately $54.42 to $60.57 of gross rent PSF across the North Tower and South Tower. Bank of America has been at the Century Plaza Towers Property since 1994. With respect to the additional space on the 13th floor of the South Tower, we cannot assure you that Bank of America will begin paying rent or take occupancy as expected or at all. Bank of America has the right to terminate its lease as of September 30, 2026 upon written notice prior to September 30, 2025 and payment of a termination fee.
| This is not a research report and was not prepared by any Underwriter’s research department. Please see additional important information and qualifications at the end of this Term Sheet. |
T-29
Office - CBD | Loan #1 | Cut-off Date Balance: |
| $105,000,000 |
2029 & 2049 Century Park East | Century Plaza Towers | Cut-off Date LTV: |
| 39.1% |
Los Angeles, CA 90067 |
| UW NCF DSCR: |
| 4.09x |
|
| UW NOI Debt Yield: |
| 13.5% |
Manatt Phelps (116,366 SF / 4.8% of NRA / 5.5% of underwritten base rent). Manatt, Phelps & Phillips LLC (“Manatt Phelps”) is a Los Angeles-based law firm that has practices focused on banking, entertainment, media, technology, retail and consumer products, and real estate and energy. Founded in 1965, Manatt Phelps employs over 450 attorneys across Los Angeles, New York, Palo Alto, San Francisco, Orange County, Chicago, Washington, D.C. and Boston. The firm is ranked #105 in a 2019 magazine ranking of law firms based on gross revenue. Manatt Phelps has signed a lease for five suites in the South Tower on the 4th, 14th, 15th, 16th and 17th floors totaling 116,366 SF and is expected to begin paying rent and take occupancy in stages starting in March 2020, with full occupancy of the space expected by May 2020. Manatt Phelps’s contractual rent under its leases is approximately $62.26 gross rent PSF. We cannot assure you that Manatt Phelps will begin paying rent or take occupancy as expected or at all. Manatt Phelps has the right to terminate its lease on the 4th floor on the last day of the 5th year or 10th year of its lease term.
JPMorgan (97,726 SF / 4.1% of NRA / 4.2% of underwritten base rent). Founded in 1871, JPMorgan (NYSE: JPM) is a commercial, investment and retail banking institution founded by J.P. Morgan. Headquartered in New York City, JPMorgan is the largest bank in the United States. JPMorgan occupies four suites in the North Tower on the 37th, 38th, 39th and 41st floors totaling 97,726 SF and pays $57.00 gross rent PSF. JPMorgan has been at the Century Plaza Towers Property since 2011. JPMorgan is an affiliate of the borrower.
Kirkland & Ellis (85,664 SF / 3.6% of NRA / 4.5% of underwritten base rent). Founded in 1909 in Chicago, Kirkland & Ellis, LLP (“Kirkland & Ellis”) is an international law firm that employs over 2,300 attorneys in 15 offices throughout Asia, Europe, and the United States. Kirkland & Ellis focuses on private equity, M&A, and other corporate transactions, litigation, white collar and government disputes, restructuring and intellectual property matters. Kirkland & Ellis is ranked #1 in a 2019 magazine ranking of law firms by gross revenue. Kirkland & Ellis has not yet taken occupancy and is expected to occupy three suites in the South Tower on the 37th, 38th, and 39th floors totaling 85,664 SF starting in January 2020. Kirkland & Ellis is expected to pay $68.79 gross rent PSF starting in January 2020. We cannot assure you that Kirkland & Ellis will begin paying rent or take occupancy as expected or at all. Kirkland & Ellis has a one-time right to terminate its lease as of January 1, 2032 upon written notice on or before January 1, 2031 and the payment of a termination fee.
Greenberg Glusker (83,199 SF / 3.5% of NRA / 4.2% of underwritten base rent). With nearly 100 attorneys, Greenberg Glusker is one of the largest single-office, full-service law firms in California with offices only in Century City. Greenberg Glusker focuses on bankruptcy, reorganization & capital recovery, corporate, finance & securities, digital media and technology, entertainment, environment, real estate, litigation, and taxation. Greenberg Glusker has signed a lease for three suites in the South Tower on the 26th, 27th and 31st floors totaling 83,199 SF and is expected to being paying rent and take occupancy in March 2020. The firm is expected to pay $66.00 gross rent PSF starting in March 2020. We cannot assure you Greenberg Glusker will begin paying rent or take occupancy as expected or at all. Greenberg Glusker has a one-time right to terminate its lease as of March 1, 2032 upon written notice on or before March 1, 2031 and the payment of a termination fee.
The following table presents certain information relating to the leases at the Century Plaza Towers Properties:
Tenant Summary(1) | |||||||||
Tenant Name | Credit Rating (Moody’s/S&P/Fitch)(2) | Tenant SF | Approx. % of SF | Annual UW Base Rent | Annual UW Base Rent PSF | % of Total Annual | Lease Expiration | Renewal Options | TerminationOption |
Bank of America(3) | A2 / A- / A+ | 149,508 | 6.2% | $8,518,731 | $56.98 | 6.5% | Various | 2 x 5 year | Y |
Manatt Phelps(4) | NR/NR/NR | 116,366 | 4.8% | $7,245,253 | $62.26 | 5.5% | 4/30/2035 | 2 x 5 year | Y |
JPMorgan | A2 / A- / AA- | 97,726 | 4.1% | $5,570,382 | $57.00 | 4.2% | 8/31/2021 | 2 x 5 year | N |
Kirkland & Ellis(5) | NR/NR/NR | 85,664 | 3.6% | $5,892,759 | $68.79 | 4.5% | 12/31/2034 | 2 x 5 year | Y |
Greenberg Glusker(6) | NR/NR/NR | 83,199 | 3.5% | $5,491,134 | $66.00 | 4.2% | 2/28/2035 | 2 x 5 year | Y |
Venable LLP | NR/NR/NR | 81,817 | 3.4% | $4,720,841 | $57.70 | 3.6% | 12/31/2025 | 1 x 5 year | N |
Westfield(7) | NR/NR/NR | 81,124 | 3.4% | $4,242,785 | $52.30 | 3.2% | 4/30/2028 | 2 x 5 year | Y |
Seyfarth Shaw | NR/NR/NR | 80,160 | 3.3% | $6,293,362 | $78.51 | 4.8% | 8/31/2021 | 2 x 5 year | N |
Proskauer Rose(8) | NR/NR/NR | 70,195 | 2.9% | $4,019,709 | $57.26 | 3.1% | 10/31/2030 | 2 x 5 year | Y |
Mitchell Silberberg Knupp(9) | NR/NR/NR | 69,396 | 2.9% | $3,913,934 | $56.40 | 3.0% | 6/30/2034 | 2 x 5 year | Y |
Subtotal/Wtd. Avg. |
| 915,155 | 38.1% | $55,908,890 | $61.09 | 42.6% |
|
|
|
|
|
|
|
|
|
|
|
|
|
Other Tenants |
| 1,315,465 | 54.8% | $75,260,840 | $57.21 | 57.4% |
|
|
|
Vacant Space |
| 171,021 | 7.1% | $0 | $0.00 | 0.0% |
|
|
|
Total/Wtd. Avg.(10) |
| 2,401,641 | 100.0% | $131,169,730 | $58.80 | 100.0% |
|
|
|
(1) | Information is based on the underwritten rent roll dated October 1, 2019. |
(2) | Certain ratings are those of the parent company, whether or not the parent guarantees the lease. |
(3) | The NRA of Bank of America includes 124,723 SF occupied by Bank or America on floors 1 through 14 and 24,785 SF occupied by Merrill Lynch on floors 25 through 33. In addition, the NRA for Bank of America includes 26,664 SF, as to which Bank of America is expected to begin paying rent and taking occupancy in January 2020. With respect to the additional space on the 13th floor of the South Tower, we cannot assure you that Bank of America will begin paying rent or take occupancy as expected or at all. Bank of America has various lease expiration dates: (i) 106,890 SF with a lease expiration date of September 30, 2029, (ii) 17,833 SF with a lease expiration date of September 30, 2024 and (iii) 24,785 SF related to the Merrill Lynch space, with a lease expiration date of June 30, 2022. Bank of America has the right to terminate its lease as of September 30, 2026 upon written notice on or before September 30, 2025 and the payment of a termination fee in the amount of $1,908,666. |
(4) | Manatt Phelps is expected to begin paying rent and take occupancy in stages in March 2020, with full occupancy of the space expected in May 2020. We cannot assure you that Manatt Phelps will begin paying rent or take occupancy as expected or at all. |
(5) | Kirkland & Ellis is expected to begin paying rent and take occupancy in January 2020. We cannot assure you that Kirkland & Ellis will begin paying rent or take occupancy as expected or at all. Kirkland & Ellis has a one-time right to terminate its lease as of January 1, 2032 upon written notice on or before 1 January 1, 2031 and the payment of a termination fee. |
(6) | Greenberg Glusker has signed a lease for three suites in the South Tower on the 26th, 27th and 31st floors totaling 83,199 SF and is expected to being paying rent and take occupancy in March 2020. The firm is expected to pay $66.00 gross rent PSF starting in March 2020. We cannot assure you Greenberg Glusker will begin paying rent or take occupancy as expected or at all. Greenberg Glusker has a one-time right to terminate its lease as of March 1, 2032 upon written notice on or before March 1, 2031 and the payment of a termination fee. |
(7) | Westfield has a one-time right to terminate its lease on April 30, 2025, with 15 months’ prior notice and the payment of a termination fee. |
(8) | Proskauer Rose has a one-time right to terminate its lease on October 31, 2025, upon written notice on or before October 31, 2024 and the payment of a termination fee. |
(9) | Mitchell Silberberg Knupp has a one-time right to terminate its lease on June 30, 2029, upon written notice on or before June 30, 2028 and the payment of a termination fee. |
(10) | Wtd. Avg. Annual UW Base Rent PSF excludes vacant space. |
| This is not a research report and was not prepared by any Underwriter’s research department. Please see additional important information and qualifications at the end of this Term Sheet. |
T-30
Office - CBD | Loan #1 | Cut-off Date Balance: |
| $105,000,000 |
2029 & 2049 Century Park East | Century Plaza Towers | Cut-off Date LTV: |
| 39.1% |
Los Angeles, CA 90067 |
| UW NCF DSCR: |
| 4.09x |
|
| UW NOI Debt Yield: |
| 13.5% |
The following table presents certain information relating to the lease rollover schedule at the Century Plaza Towers Property:
Lease Rollover Schedule(1)(2) | ||||||||
Year | # of Leases Rolling | SF Rolling | UW Base Rent PSF Rolling | Approx. % of Total SF Rolling | Approx. Cumulative % of SF Rolling | Total UW Base Rent Rolling | Approx. % of Base Rent Rolling | Approx. Cumulative % of Total Rent Rolling |
MTM | 1 | 691 | $27.01 | 0.0% | 0.0% | $18,664 | 0.0% | 0.0% |
2019 | 1 | 714 | $37.80 | 0.0% | 0.1% | $26,989 | 0.0% | 0.0% |
2020 | 23 | 96,896 | $50.13 | 4.0% | 4.1% | $4,857,092 | 3.7% | 3.7% |
2021 | 22 | 276,557 | $63.47 | 11.5% | 15.6% | $17,553,318 | 13.4% | 17.1% |
2022 | 14 | 122,719 | $58.72 | 5.1% | 20.7% | $7,206,505 | 5.5% | 22.6% |
2023 | 11 | 89,979 | $56.38 | 3.7% | 24.5% | $5,073,213 | 3.9% | 26.5% |
2024 | 15 | 224,254 | $60.00 | 9.3% | 33.8% | $13,455,101 | 10.3% | 36.7% |
2025 | 11 | 258,081 | $57.45 | 10.7% | 44.5% | $14,826,378 | 11.3% | 48.0% |
2026 | 4 | 76,664 | $59.56 | 3.2% | 47.7% | $4,565,856 | 3.5% | 51.5% |
2027 | 4 | 79,651 | $58.43 | 3.3% | 51.1% | $4,654,199 | 3.5% | 55.1% |
2028 | 2 | 98,484 | $53.30 | 4.1% | 55.2% | $5,249,665 | 4.0% | 59.1% |
2029 | 9 | 257,405 | $56.29 | 10.7% | 65.9% | $14,489,056 | 11.0% | 70.1% |
2030 | 5 | 152,406 | $61.99 | 6.3% | 72.2% | $9,448,208 | 7.2% | 77.3% |
Beyond(3) | 6 | 496,119 | $59.96 | 20.7% | 92.9% | $29,745,487 | 22.7% | 100.0% |
Vacant | 0 | 171,021 | $0.00 | 7.1% | 100.0% | $0 | 0.0% | NAP |
Total/Wtd. Avg.(4) | 128 | 2,401,641 | $58.80 | 100.0% |
| $131,169,730 | 100.0% |
|
(1) | Information is based on the underwritten rent roll dated October 1, 2019. |
(2) | Certain tenants may have lease termination options that are exercisable prior to the originally stated expiration date of the related lease and that are not considered in the lease rollover schedule. |
(3) | Includes amenity space. |
(4) | Wtd. Avg. UW Base Rent PSF Rolling excludes vacant space. |
The Markets. The Century Plaza Towers Property is located in the Century City district of the city of Los Angeles. Century City is an urban center in Los Angeles, and is considered the “CBD” of the Westside Los Angeles market. Century City contains in excess of 10 million SF of office space in addition to a “super” regional mall (Century City Shopping Center), major hotels and condominium developments. The southern portion of Century City includes 20th Century Fox Studios. Century City is a part of the West Los Angeles area, and the Century Plaza Towers Property is situated at the east corner of Santa Monica Boulevard and Century Park East. The location is approximately 10 miles west of downtown Los Angeles, five miles east of Santa Monica and the Pacific Ocean, and seven miles north of the Los Angeles International Airport. West Los Angeles is generally within the boundaries north of Venice Boulevard, east of Bundy Drive/Centinela Avenue, south of Sunset Boulevard, and west of La Cienega Boulevard. West Los Angeles includes other affluent neighborhoods and residential communities of Bel Air, Beverly Hills, Brentwood, and West Hollywood.
The Century Plaza Towers Property is located in the Century City submarket of West Los Angeles, California. Situated between Beverly Hills to the east, Westwood, Brentwood, and Santa Monica to the west, and the residential neighborhoods of Bel Air, Holmby Hills, and Hollywood Hills to the north, Century City is located near the Westside’s amenities and housing communities. The Century Plaza Towers Property has access to the Santa Monica (I-10) and San Diego (I-405) Freeways and several additional east-west thoroughfares including Santa Monica Boulevard and Olympic Boulevard. Century City is the largest office submarket in terms of total inventory within the larger West Los Angeles market area. The Century City office market contains approximately 10.4 million SF of office inventory as of the second quarter of 2019. Approximately 20 professional office buildings with an average age of 42 years comprise the Century City office market. The micro-submarket generally appeals to more traditional, high-rise occupants, many of which have ties to the entertainment industry. The Century City office submarket has experienced an average annual net absorption of approximately 119,000 SF over the past five years. Over the past decade, net absorption was approximately 6,200 SF annually, which corresponds to the significant losses which occurred as a result of the “great recession”. The submarket achieved positive absorption of more than 1.8 million SF during the five-year period from 2003 to 2007. As of year-end 2018, positive absorption totaled 71,900 SF and is currently positive through the first half of 2019 at 112,611 SF.
| This is not a research report and was not prepared by any Underwriter’s research department. Please see additional important information and qualifications at the end of this Term Sheet. |
T-31
Office - CBD | Loan #1 | Cut-off Date Balance: |
| $105,000,000 |
2029 & 2049 Century Park East | Century Plaza Towers | Cut-off Date LTV: |
| 39.1% |
Los Angeles, CA 90067 |
| UW NCF DSCR: |
| 4.09x |
|
| UW NOI Debt Yield: |
| 13.5% |
The following chart provides a statistical overview of the overall West Los Angeles office market as of second quarter 2019:
West Los Angeles - Market Statistics | |||||
Category | Total Inventory (SF) | Overall Vacancy | Direct Vacancy | YTD Direct Net Absorption | Weighted Average Rental Rate |
Century City | 10,383,273 | 6.9% | 6.1% | 112,611 | $52.72 |
Beverly Hills | 6,477,694 | 10.8% | 10.2% | 38,654 | $64.62 |
Brentwood | 3,329,333 | 10.6% | 9.7% | 3,206 | $48.78 |
Culver City | 4,845,469 | 21.8% | 21.0% | 137,290 | $49.37 |
Hollywood | 3,504,226 | 12.9% | 10.4% | -62,987 | $53.87 |
Marina del Rey/Venice | 1,342,454 | 12.1% | 11.7% | 97,740 | $61.09 |
Miracle Mile | 4,390,712 | 17.9% | 17.3% | -15,601 | $48.92 |
Olympic Corridor | 2,535,449 | 13.9% | 12.1% | -164,243 | $64.73 |
Playa Vista | 3,606,568 | 13.3% | 10.6% | 291,186 | $62.58 |
Santa Monica | 8,939,166 | 11.5% | 9.6% | 297,996 | $74.38 |
West Hollywood | 2,669,054 | 9.1% | 6.9% | 59,386 | $54.28 |
Westside Other | 3,386,487 | 10.2% | 10.0% | -53,075 | $46.55 |
Westwood | 3,147,809 | 14.5% | 13.0% | 13,268 | $59.58 |
Total West Los Angeles Market | 58,557,694 | 12.2% | 10.9% | 755,431 | $57.03 |
Source: Appraisal.
Operating History and Underwritten Net Cash Flow. The following table presents certain information relating to the historical operating performance and the Underwritten Net Cash Flow of the Century Plaza Towers Property:
Cash Flow Analysis | ||||||||||||
|
| 2016 |
| 2017 |
| 2018 |
| 9/30/2019 TTM |
| UW |
| UW PSF |
Gross Potential Rent |
| $93,728,374 |
| $96,736,098 |
| $101,042,428 |
| $97,138,295 |
| $145,509,506 |
| $60.59 |
Total Recoveries |
| $2,366,196 |
| $3,084,229 |
| $4,320,460 |
| $4,341,561 |
| $3,618,229 |
| $1.51 |
Total Other Income |
| $17,845,028 |
| $17,558,759 |
| $19,954,557 |
| $19,410,804 |
| $18,203,977 |
| $7.58 |
Vacancy |
| $0 |
| $0 |
| $0 |
| $0 |
| (8,715,744) |
| ($3.63) |
Effective Gross Income |
| 113,939,597 |
| 117,379,087 |
| 125,317,446 |
| 120,890,660 |
| 158,615,968 |
| $66.04 |
|
|
|
|
|
|
|
|
|
|
|
|
|
Real Estate Taxes |
| $7,612,013 |
| $7,958,382 |
| $8,149,815 |
| $8,306,243 |
| $8,272,735 |
| $3.44 |
Insurance |
| $2,985,305 |
| $2,788,578 |
| $2,735,450 |
| $2,685,527 |
| $2,678,997 |
| $1.12 |
Other Expenses |
| $22,558,934 |
| $23,431,996 |
| $25,407,626 |
| $26,555,972 |
| $26,518,479 |
| $11.04 |
Total Expenses |
| $33,156,253 |
| $34,178,955 |
| $36,292,891 |
| $37,547,742 |
| $37,470,212 |
| $15.60 |
|
|
|
|
|
|
|
|
|
|
|
|
|
Net Operating Income(1) |
| 80,783,345 |
| 83,200,132 |
| 89,024,555 |
| 83,342,918 |
| 121,145,756 |
| $50.44 |
Capital Expenditures |
| $0 |
| $0 |
| $0 |
| $0 |
| $480,328 |
| $0.20 |
TI/LC |
| $0 |
| $0 |
| $0 |
| $0 |
| $8,415,062 |
| $3.50 |
Net Cash Flow |
| $80,783,345 |
| $83,200,132 |
| $89,024,555 |
| $83,342,918 |
| $112,250,366 |
| $46.74 |
|
|
|
|
|
|
|
|
|
|
|
|
|
Occupancy %(2) |
| 87.0% |
| 84.6% |
| 83.5% |
| 92.9% |
| 94.8% |
|
|
NOI DSCR(3) |
| 2.95x |
| 3.03x |
| 3.25x |
| 3.04x |
| 4.42x |
|
|
NCF DSCR(3) |
| 2.95x |
| 3.03x |
| 3.25x |
| 3.04x |
| 4.09x |
|
|
NOI Debt Yield(3) |
| 9.0% |
| 9.2% |
| 9.9% |
| 9.3% |
| 13.5% |
|
|
NCF Debt Yield(3) |
| 9.0% |
| 9.2% |
| 9.9% |
| 9.3% |
| 12.5% |
|
|
(1) | The increase in UW Net Operating Income from 9/30/2019 TTM to UW Net Operating Income is primarily attributed to (i) $2,354,778 in straight line rent taken through the earlier of the loan term or the lease term for 13 tenants, (ii) $3,269,254 of rent steps taken through October 2020 and (iii) new leasing that has been executed in 2019, accounting for 20.6% of NRA and 24.6% of UW Gross Potential Rent. |
(2) | Based on the underwritten rent roll dated October 1, 2019, the Century Plaza Towers is 92.9% occupied. |
(3) | Debt service coverage ratios and debt yields are based on the Century Plaza Towers Senior Loan and exclude the Century Plaza Towers Subordinate Companion Loan. |
Escrows and Reserves.
Real Estate Taxes - During a Trigger Period (as defined below), the Century Plaza Towers Whole Loan documents require ongoing monthly real estate tax reserves in an amount equal to 1/12 of the real estate taxes that the lender estimates will be payable during the next 12 months.
| This is not a research report and was not prepared by any Underwriter’s research department. Please see additional important information and qualifications at the end of this Term Sheet. |
T-32
Office - CBD | Loan #1 | Cut-off Date Balance: |
| $105,000,000 |
2029 & 2049 Century Park East | Century Plaza Towers | Cut-off Date LTV: |
| 39.1% |
Los Angeles, CA 90067 |
| UW NCF DSCR: |
| 4.09x |
|
| UW NOI Debt Yield: |
| 13.5% |
Insurance - During a Trigger Period, the Century Plaza Towers Whole Loan documents require ongoing monthly insurance reserves in an amount equal to 1/12 of the insurance premiums that the lender estimates will be payable for the renewal of the coverage during the next 12 months, provided, that so long as insurance is maintained by The Century Plaza Towers Borrower under one or more blanket policies approved by the lender, the Century Plaza Towers Borrower is not required to make ongoing monthly insurance reserve deposits applicable to such blanket policy.
Outstanding TI/LC Reserve – At origination, the Century Plaza Towers Borrower deposited approximately $71,223,945 into a TI/LC reserve for approved leasing expenses.
Free Rent Reserve – At origination, the Century Plaza Towers Borrower deposited approximately $29,545,735 into a free rent reserve for any outstanding free rent, abated rent and bridge rent.
Lockbox and Cash Management. The Century Plaza Towers Whole Loan is structured with a hard lockbox and springing cash management upon a Trigger Period. At origination, a clearing account controlled by the lender was established by the Century Plaza Towers Borrower, into which all rents, revenues and receipts from the Century Plaza Towers Property are required to be deposited directly by the tenants (with respect to rents). The Century Plaza Towers Borrower and property manager are required to direct each tenant of the Century Plaza Towers Property to deposit funds directly into the clearing account, and to deposit any funds received by the Century Plaza Towers Borrower or property manager, notwithstanding such direction, into the clearing account within two business days of receipt. If no Trigger Period exists, the funds in the clearing account are required to be swept on a daily basis into the Century Plaza Towers Borrower’s operating account and, if a Trigger Period exists, such funds are required to be swept on a daily basis into a cash management account controlled by the lender at a financial institution selected by the lender. During a Trigger Period, all amounts on deposit in the cash management account are required to be applied to the payment of all monthly amounts due under the Century Plaza Towers Whole Loan documents (including, without limitation, monthly deposits for reserves for taxes and insurance (unless an acceptable blanket policy is in place with regard to insurance) as described above under “Escrows and Reserves,” debt service and all other required reserves) and all property costs and expenses set forth in the lender-approved budget. Any funds remaining thereafter are required to be transferred to a cash collateral account, as additional collateral for the Century Plaza Towers Whole Loan and, upon termination of the Trigger Period, will be disbursed to Century Plaza Towers Borrower. Under certain circumstances and for limited purposes described in the Century Plaza Towers Whole Loan documents, the Century Plaza Towers Borrower may request disbursements of such excess cash flow during the continuance of a Trigger Period.
A “Trigger Period” will be continuing during any period when there exists (i) an uncured event of default under the Century Plaza Towers Whole Loan or under a mezzanine loan (if one is incurred as described further below) or (ii) a Low Debt Yield Period (as defined below).
A “Low Debt Yield Period” will commence if the aggregate debt yield on the Century Plaza Towers Whole Loan and any related mezzanine loan is less than 5.0% at the end of two consecutive calendar quarters and will end if such combined debt yield exceeds 5.0% for two consecutive calendar quarters.
Additional Secured Indebtedness (not including trade debts). In addition to the Century Plaza Towers Mortgage Loan, the Century Plaza Towers Whole Loan also secures the Century Plaza Towers Non-Serviced Pari Passu Companion Loans, which have an aggregate Cut-off Date principal balance of $795,000,000, and the Century Plaza Towers Subordinate Companion Loan, which has an aggregate Cut-off Date principal balance of $300,000,000. The Century Plaza Towers Non-Serviced Pari Passu Companion Loans accrue interest at the same rate as the Century Plaza Towers Mortgage Loan. The Century Plaza Towers Subordinate Companion Loan accrues interest at a fixed rate of 3.0045% per annum, has a 120-month term, and is interest only for the full term. The Century Plaza Towers Senior Loan is generally senior in right of payment to the Century Plaza Towers Subordinate Companion Loan. The holders of the Century Plaza Towers Mortgage Loan the Century Plaza Towers Non-Serviced Pari Passu Companion Loans and the Century Plaza Towers Subordinate Companion Loan have entered into a co-lender agreement which sets forth the allocation of collections on the Century Plaza Towers Whole Loan. See “Description of the Mortgage Pool—The Whole Loans—The Century Plaza Towers Pari Passu A/B Whole Loan” in the Preliminary Prospectus.
Mezzanine Loan and Preferred Equity. The holders of 100% of the equity interests in the Century Plaza Towers Borrower have the one-time right to obtain a single mezzanine loan, subordinate to the Century Plaza Towers Whole Loan and secured by a pledge of 100% of the ownership interests in the Century Plaza Towers Borrower, provided, among other conditions: (i) the aggregate loan-to-value ratio of the Century Plaza Towers Whole Loan and the mezzanine loan is equal to or less than 52.1% (or if a Century Plaza Tower Conversion and Transfer (as defined below) has occurred, 51.5%), (ii) the aggregate debt service coverage ratio of the Century Plaza Towers Whole Loan and the mezzanine loan is equal to or greater than 3.12x (or if a Century Plaza Tower Conversion and Transfer has occurred, 3.18x), (iii) the aggregate debt yield of the Century Plaza Towers Whole Loan and the mezzanine loan is equal to or greater than 9.50% (or if a Century Plaza Tower Conversion and Transfer has occurred, 9.70%), (iv) the mezzanine loan is coterminous with the Century Plaza Towers Whole Loan and (v) entry into a customary intercreditor agreement acceptable to the lender and each rating agency rating securities backed by a portion of the Century Plaza Towers Whole Loan.
Release of Property. Not permitted.
Transfer of Development Credits. If no event of default has occurred and is continuing under the Century Plaza Towers Whole Loan documents, the Century Plaza Towers Borrower has the right to convert the windowless top two floors (43rd and 44th floors) of each of the two towers comprising the Century Plaza Towers Property (the “Conversion Space”) into non-occupiable space and to transfer the development credits associated with the Conversion Space in connection with the anticipated commencement of the construction of an additional building at the adjacent 2000 Avenue of the Stars parcel owned by an affiliate of the Century Plaza Towers Borrower or to a third party in connection with a sale of the 2000 Avenue of the Stars parcel to a third party (the “Century Plaza Towers Conversion and Transfer”), provided that the Century Plaza Towers Borrower satisfies certain conditions set forth in the Century Plaza Towers Whole Loan documents, including, among others, (A) such Century Plaza Towers Conversion and Transfer is not reasonably expected to have a material adverse effect on the Century Plaza Towers Property and is on terms and conditions that are commercially reasonable and at arm’s length, (B) the Century Plaza Towers Borrower either (1) prepays the Century Plaza Towers Whole Loan in the amount of (i) $30,000,000, plus (ii) if prior to the open prepayment date, a prepayment premium (the “Prepayment Premium”) equal to the greater of 1.00% and a yield maintenance premium on the amount prepaid (the “Conversion Prepayment Amount”) or (2) if the transfer of the development rights is to an affiliate of the Century Plaza Towers Borrower, the Century Plaza Towers Borrower deposits with the lender cash or a letter of credit as collateral for the Century Plaza Towers Whole Loan in the amount of (i) $30,000,000, plus (ii) 105% of the Prepayment Premium that would be due if the prepayment were made as of such date and (C) the Century Plaza Towers Conversion and Transfer complies with any REMIC requirements. If the Century Plaza Towers Borrower transfers the development rights to an affiliate and deposits cash or a letter of credit as collateral for the Century Plaza Towers Whole Loan, the Century Plaza Towers Borrower may return the development rights to the Century Plaza Towers Borrower along with the
| This is not a research report and was not prepared by any Underwriter’s research department. Please see additional important information and qualifications at the end of this Term Sheet. |
T-33
Office - CBD | Loan #1 | Cut-off Date Balance: |
| $105,000,000 |
2029 & 2049 Century Park East | Century Plaza Towers | Cut-off Date LTV: |
| 39.1% |
Los Angeles, CA 90067 |
| UW NCF DSCR: |
| 4.09x |
|
| UW NOI Debt Yield: |
| 13.5% |
delivery of a clean date down endorsement to the lender, in which case the lender is required to return the cash or letter of credit (as applicable) to the Century Plaza Towers Borrower. If the Century Plaza Towers Borrower’s affiliate is granted a permit to begin work on the proposed project at the 2000 Avenue of the Stars parcel or if such permit is not granted within five years after transfer of the development credits and the development credits have not been transferred back to the Century Plaza Towers Borrower as described above, then the Century Plaza Towers Borrower is required to promptly prepay the outstanding principal balance of the Century Plaza Towers Whole Loan in an amount equal to the Conversion Prepayment Amount (with any cash deposit applied to such prepayment, provided that the Century Plaza Towers Borrower must promptly pay the lender any difference between such cash deposit and the Conversion Prepayment Amount).
Right of First Offer/Right of First Refusal. Not permitted.
Ground Lease. None.
Letter of Credit. None.
Terrorism Insurance. The Century Plaza Towers Whole Loan documents require that the “all risk” insurance policy required to be maintained by the Century Plaza Towers Borrower provide coverage for terrorism in an amount equal to the full replacement cost of the Century Plaza Towers Property and 24 months of business interruption/rental loss insurance; provided that for so long as the Terrorism Risk Insurance Act of 2002, as extended and modified by the Terrorism Risk Insurance Program Reauthorization Act of 2015 (“TRIPRA”) (including any extensions thereof or if another federal governmental program is in effect relating to “acts of terrorism” which provides substantially similar protections as TRIPRA), is in effect and continues to cover both foreign and domestic acts of terrorism, the lender is required to accept terrorism insurance with coverage against “covered acts” within the meaning of TRIPRA (or such other program); provided, however, that the Century Plaza Towers Borrower will not be obligated to pay terrorism insurance premiums in excess of two times the premium for the property and business interruption/rental loss insurance required under the Century Plaza Towers Whole Loan documents (excluding any earthquake and fire following earthquake insurance or terrorism insurance components of such policies) in any policy year. See “Risk Factors—Risks Relating to the Mortgage Loans—Terrorism Insurance May Not Be Available for All Mortgaged Properties” in the Preliminary Prospectus.
| This is not a research report and was not prepared by any Underwriter’s research department. Please see additional important information and qualifications at the end of this Term Sheet. |
T-34
(THIS PAGE INTENTIONALLY LEFT BLANK)
T-35
Multifamily – High Rise | Loan #2 | Cut-off Date Balance: |
| $100,000,000 |
28-10 Jackson Avenue, 28-40 Jackson | Jackson Park | Cut-off Date LTV: |
| 34.4% |
Avenue, and 28-30 Jackson Avenue |
| U/W NCF DSCR: |
| 3.92x |
Long Island City, NY 11101 |
| U/W NOI Debt Yield: |
| 13.0% |

| This is not a research report and was not prepared by any Underwriter’s research department. Please see additional important information and qualifications at the end of this Term Sheet. |
T-36
Multifamily – High Rise | Loan #2 | Cut-off Date Balance: |
| $100,000,000 |
28-10 Jackson Avenue, 28-40 Jackson | Jackson Park | Cut-off Date LTV: |
| 34.4% |
Avenue, and 28-30 Jackson Avenue |
| U/W NCF DSCR: |
| 3.92x |
Long Island City, NY 11101 |
| U/W NOI Debt Yield: |
| 13.0% |
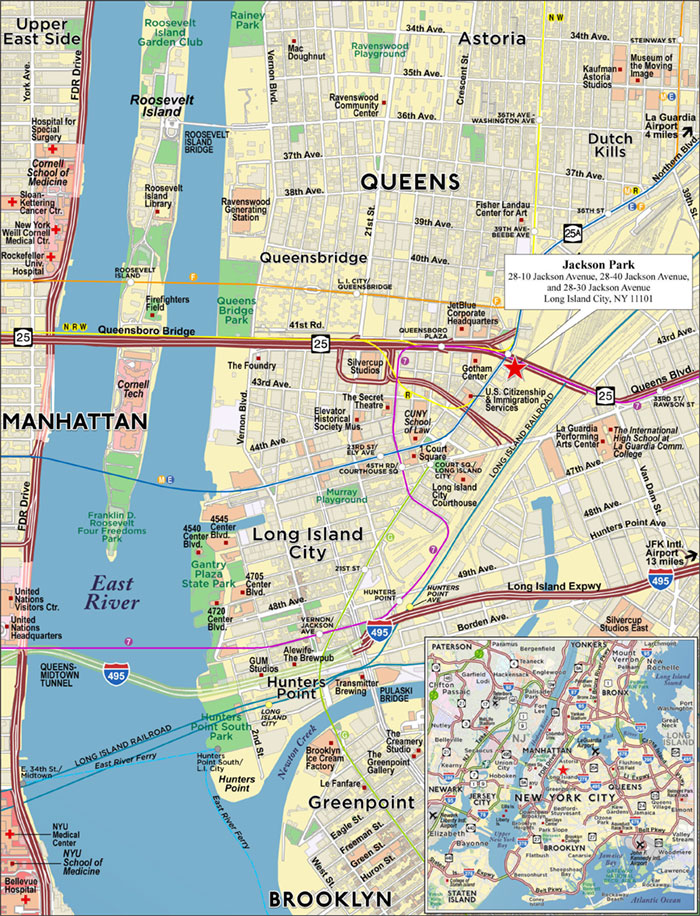
| This is not a research report and was not prepared by any Underwriter’s research department. Please see additional important information and qualifications at the end of this Term Sheet. |
T-37
Mortgage Loan No. 2 – Jackson Park |
Mortgage Loan Information |
| Property Information | |||||
Mortgage Loan Seller: | BANA/WFB |
| Single Asset/Portfolio: | Single Asset | |||
Credit Assessment (KBRA/Fitch/S&P): | AA+(sf)/Asf/AA-(sf) |
| Location: | Long Island City, NY 11101 | |||
Original Balance(1): | $100,000,000 |
| General Property Type: | Multifamily | |||
Cut-off Date Balance(1): | $100,000,000 |
| Detailed Property Type: | High Rise | |||
% of Initial Pool Balance: | 7.8% |
| Title Vesting: | Fee | |||
Loan Purpose: | Refinance |
| Year Built/Renovated: | 2018/N/A | |||
Borrower Sponsor: | Tishman Speyer Crown Equities 2007, LLC |
| Size: | 1,871 Units | |||
Guarantor: | LIC Development Owner, L.P. |
| Cut-off Date Balance per Unit(1): | $293,960 | |||
Mortgage Rate: | 3.2500% |
| Maturity Date Balance per Unit(1): | $293,960 | |||
Note Date: | 9/27/2019 |
| Property Manager: | Tishman Speyer Properties, L.P. | |||
First Payment Date: | 11/10/2019 |
|
| (borrower-related) | |||
Maturity Date: | 10/10/2029 |
| Underwriting and Financial Information | ||||
Original Term to Maturity: | 120 months |
| UW NOI: | $71,395,371 | |||
Original Amortization Term: | 0 months |
| UW NOI Debt Yield(1): | 13.0% | |||
IO Period: | 120 months |
| UW NOI Debt Yield at Maturity(1): | 13.0% | |||
Seasoning: | 2 months |
| UW NCF DSCR(1): | 3.92x | |||
Prepayment Provisions(2): | LO (26); DEF (87); O (7) |
| Most Recent NOI(5): | N/A | |||
Lockbox/Cash Mgmt Status: | Soft/Springing |
| 2nd Most Recent NOI(5): | N/A | |||
Additional Debt Type(1)(3): | Pari Passu/Subordinate |
| 3rd Most Recent NOI(5): | N/A | |||
Additional Debt Balance(1)(3): | $450,000,000/$450,000,000 |
| Most Recent Occupancy: | 96.1% (8/31/2019) | |||
Future Debt Permitted (Type)(3): | Yes (Mezzanine) |
| 2nd Most Recent Occupancy(5): | N/A | |||
|
|
| 3rd Most Recent Occupancy(5): | N/A | |||
Reserves(4) |
| Appraised Value (as of): | $1,600,000,000 (9/4/2019) | ||||
Type | Initial | Monthly | Cap |
| Appraised Value per Unit: | $855,158 | |
RE Tax: | $0 | Springing | N/A |
| Cut-off Date LTV Ratio(1): | 34.4% | |
Insurance: | $0 | Springing | N/A |
| Maturity Date LTV Ratio(1): | 34.4% | |
|
|
|
|
|
|
|
|
Sources and Uses | ||||||||
Sources | Proceeds | % of Total |
| Uses | Proceeds | % of Total | ||
Senior Loan(1): | $550,000,000 | 55.0 | % |
| Loan Payoff(6): | $641,983,355 | 64.2 | % |
Subordinate Companion Loan(1): | $450,000,000 | 45.0 | % |
| Return of Equity: | $342,576,222 | 34.3 | % |
|
|
|
|
| Closing Costs: | $15,440,423 | 1.5 | % |
Total Sources: | $1,000,000,000 | 100.0 | % |
| Total Uses: | $1,000,000,000 | 100.0 | % |
(1) | The Jackson Park Mortgage Loan (as defined below) is part of the Jackson Park Whole Loan (as defined below), which is comprised of the Jackson Park Senior Loan (as defined below) evidenced by ten senior promissory notes with an original aggregate principal balance of $550,000,000, and the Jackson Park Subordinate Companion Loan (as defined below) evidenced by two promissory notes with an original aggregate principal balance of $450,000,000. The Cut-off Date Balance per Unit, Maturity Date Balance per Unit, UW NOI Debt Yield, UW NOI Debt Yield at Maturity, UW NCF DSCR, Cut-off Date LTV Ratio and Maturity Date LTV Ratio numbers presented above are based on the Cut-off Date principal balance of the Jackson Park Senior Loan, without regard to the Jackson Park Subordinate Companion Loan. The Cut-off Date Balance per Unit, Maturity Date Balance per Unit, UW NOI Debt Yield, UW NOI Debt Yield at Maturity, UW NCF DSCR, Cut-off Date LTV Ratio and Maturity Date LTV Ratio numbers based on the entire Jackson Park Whole Loan are $534,474, $534,474, 7.1%, 7.1%, 2.15x, 62.5% and 62.5%, respectively. |
(2) | Defeasance of the Jackson Park Whole Loan is permitted in whole or in part at any time after the earlier of (i) the end of the two-year period commencing on the closing date of the securitization of the last promissory note representing a portion of the Jackson Park Whole Loan to be securitized, and (ii) November 10, 2022. The assumed defeasance and prepayment lockout period of 26 payments is based on the closing date of this transaction in December 2019. |
(3) | See “The Mortgage Loan”, “Additional Secured Indebtedness (not including trade debts)” and “Mezzanine Loan and Preferred Equity” below, for a discussion of additional debt. |
(4) | See “Escrows and Reserves” below for further discussion of reserve requirements. |
(5) | Historical financial information and occupancy are not available because the Jackson Park Property (as defined below) was constructed in 2018. |
(6) | The Jackson Park borrower sponsor’s cost of development for the Jackson Park Property was approximately $1.16 billion. The Jackson Park Whole Loan is refinancing the Jackson Park borrower sponsor’s construction debt. |
The Mortgage Loan. The second largest mortgage loan (the “Jackson Park Mortgage Loan”) is part of a whole loan (the “Jackson Park Whole Loan”) in the original principal balance of $1,000,000,000 originated by Bank of America, N.A. and Wells Fargo Bank, National Association. The Jackson Park Whole Loan is secured by a first priority fee mortgage encumbering a multifamily property located in Long Island City, New York (the “Jackson Park Property”). The Jackson Park Whole Loan is comprised of ten pari passu senior promissory notes with an original aggregate principal balance of $550,000,000 (the “Jackson Park Senior Loan”) and two pari passu subordinate promissory notes with an original aggregate principal balance of $450,000,000 (the “Jackson Park Subordinate Companion Loan”) which are subordinate to the Jackson Park Senior Loan. The Jackson Park Senior Loan is evidenced by promissory Notes A-5 and A-6 in the original aggregate principal balance of $100,000,000, which comprise the Jackson Park Mortgage Loan, and eight pari passu promissory notes (together the “Jackson Park Pari Passu Non-Serviced Companion Loans”) in the original aggregate principal balance of $450,000,000. The Jackson Park Pari Passu Non-Serviced Companion Loans are expected to be either be contributed to the JAX 2019-LIC securitization transaction along with the Jackson Park Subordinate Companion Loan, or contributed to one or more future securitization transactions or otherwise transferred at any time. The Jackson Park Whole Loan will be serviced pursuant to the trust and servicing agreement for the JAX 2019-LIC securitization transaction. See “Description of the Mortgage Pool—The Whole Loans—The Jackson Park Pari Passu-A/B Whole Loan” and “Pooling and Servicing Agreement” in the Preliminary Prospectus.
| This is not a research report and was not prepared by any Underwriter’s research department. Please see additional important information and qualifications at the end of this Term Sheet. |
T-38
Multifamily – High Rise | Loan #2 | Cut-off Date Balance: |
| $100,000,000 |
28-10 Jackson Avenue, 28-40 Jackson | Jackson Park | Cut-off Date LTV: |
| 34.4% |
Avenue, and 28-30 Jackson Avenue |
| U/W NCF DSCR: |
| 3.92x |
Long Island City, NY 11101 |
| U/W NOI Debt Yield: |
| 13.0% |
Jackson Park Whole Loan Summary | ||||
Notes | Original Balance | Cut-off Date Balance | Anticipated Note Holder | Controlling Piece(1) |
A-1 | $75,000,000 | $75,000,000 | JAX 2019-LIC | Yes(1) |
A-2 | $75,000,000 | $75,000,000 | JAX 2019-LIC | No |
A-3 | $75,000,000 | $75,000,000 | BANA | No |
A-4 | $75,000,000 | $75,000,000 | JAX 2019-LIC | No |
A-5 | $50,000,000 | $50,000,000 | BANK 2019-BNK23(2) | No |
A-6 | $50,000,000 | $50,000,000 | BANK 2019-BNK23(3) | No |
A-7 | $50,000,000 | $50,000,000 | BANA | No |
A-8 | $50,000,000 | $50,000,000 | WFB | No |
A-9 | $25,000,000 | $25,000,000 | JAX 2019-LIC | No |
A-10 | $25,000,000 | $25,000,000 | JAX 2019-LIC | No |
B-1 | $225,000,000 | $225,000,000 | JAX 2019-LIC | No |
B-2 | $225,000,000 | $225,000,000 | JAX 2019-LIC | No |
Total | $1,000,000,000 | $1,000,000,000 |
|
|
(1) | Pursuant to the terms of trust and servicing agreement for the JAX 2019-LIC securitization trust (the “JAX 2019-LIC TSA”) and during any “Subordinate Control Period”, the “Directing Holder” (each as defined in the JAX 2019-LIC TSA) will have the right to appoint the special servicer of the Jackson Park Whole Loan and to direct certain decisions with respect to the Jackson Park Whole Loan. See “Description of the Mortgage Pool—The Whole Loans—The Non-Serviced Pari Passu-A/B Whole Loans—The Jackson Park Whole Loan” and “Pooling and Servicing Agreement—Servicing of the Non-Serviced Mortgage Loans” in the Preliminary Prospectus. |
(2) | Note A-5 is being contributed to the BANK 2019-BNK23 transaction by BANA. |
(3) | Note A-6 is being contributed to the BANK 2019-BNK23 transaction by WFB. |
The Borrower and the Borrower Sponsor. The borrower is LIC Development Owner, L.P. (the “Jackson Park Borrower”), a single-purpose Delaware limited partnership with a single-purpose Delaware limited liability company as its general partner, which general partner has at least two independent directors. The borrower sponsor is an investment venture managed and controlled by one or more affiliates of Tishman Speyer Properties, L.P. (“Tishman Speyer”). Tishman Speyer is an owner, developer, operator and fund manager of real estate assets across the United States, Europe, Brazil, China and India. There is no non-recourse carveout guarantor and no separate environmental indemnitor for the Jackson Park Whole Loan.
The Property. The Jackson Park Property is a recently built, Class A, highly amenitized, luxury multifamily high rise development located on 2.877-acres in Long Island City, New York. The Jackson Park Property is comprised of (i) 1 Jackson Park, a 42-story building containing 550 apartments and 4,920 SF of ground floor retail space, (ii) 2 Jackson Park, a 53-story building containing 650 apartments and 4,545 SF of ground floor retail space, and (iii) 3 Jackson Park, a 44-story building containing 671 apartments and 934 SF of ground floor retail space. Each residential tower features a sky-deck, party lounge and a children’s playroom. Residential building services include two 24-hour attended lobbies, dry cleaning and laundry, package receipt, housekeeping, a lifestyle coordinator, a virtual concierge, covered valet parking, bike storage and building-wide Wi-Fi. The apartment units feature floor-to-ceiling windows with solar shades, in-unit washer/dryers, 9-foot ceilings, white oak floors, key card entry systems, resident-controlled heating and air conditioning, USB-port outlets and LED lighting. The apartment kitchens feature European soft-close cabinetry with integrated Blomberg and Whirlpool appliances, seamless Ceasarstone countertops and Moen fixtures.
The Jackson Park Property includes a total of 1,871 apartments offered as 451 studio units, 919 one-bedroom units, 396 two-bedroom units, 101 three-bedroom units, and 4 four-bedroom units. The Jackson Park Property began construction in 2014 and began leasing in late 2017. Since opening, the Jackson Park Property has achieved an average of nearly 100 new leases per month. As of August 31, 2019, the Jackson Park Property was 96.1% leased. Additionally, the Jackson Park Property includes a total 10,399 SF of retail space, which is 75.0% leased by four retail tenants including Sweetleaf (coffee shop), Murray’s LIC (cheese shop), a nail salon and dog day care. The remaining retail unit (2,602 SF) space is under negotiations with a potential national restaurant tenant according to the borrower sponsor.
Amenities at the Jackson Park Property include a five-story 45,796 SF amenity building known as “The Club”. The lower level of The Club contains a 140-space underground parking garage. The first level of The Club includes a tech lounge, demo kitchen, conference room and private dining room, poker and game room, golf simulator, fireside lounge, billiards and foosball tables, outdoor gaming lounge with fireplace and a garden. The second and third levels of The Club feature the fitness center, yoga and Pilates studios, and the 75’ indoor lap pool, locker rooms, meditation lounge, sauna, steam room and massage treatment rooms. The fourth level of The Club includes the squash court and full-size basketball/volleyball court. The fifth level of The Club features the outdoor heated pool, hot tub, cabanas, sun deck and wet bar. The three residential towers and the amenity building encircle a 1.6-acre private park containing a grilling and communal dining area, children’s play area, a dog park, bocce court, outdoor table tennis, and patio sitting areas.
The Jackson Park Property benefits from a 15-year, 421-a tax exemption through 2034, during which all residential units are subject to New York City rent stabilization guidelines which currently limits annual rental increases to 1.5% and 2.5% for one and two year leases, respectively. Taxes are fully abated for the first 10 years post-construction (through June 2029), then phased in 20% each year for the next five years.
| This is not a research report and was not prepared by any Underwriter’s research department. Please see additional important information and qualifications at the end of this Term Sheet. |
T-39
Multifamily – High Rise | Loan #2 | Cut-off Date Balance: |
| $100,000,000 |
28-10 Jackson Avenue, 28-40 Jackson | Jackson Park | Cut-off Date LTV: |
| 34.4% |
Avenue, and 28-30 Jackson Avenue |
| U/W NCF DSCR: |
| 3.92x |
Long Island City, NY 11101 |
| U/W NOI Debt Yield: |
| 13.0% |
The following table presents certain information relating to the unit mix at the Jackson Park Property:
Unit Mix |
| ||||||||||||||||||||||
Unit Mix / Type |
| Units |
| % Occupied |
| Average SF per Unit |
| Total SF |
| Annual Average Rent per SF |
| Monthly Average Rent per Unit |
| Annual Market Rent per SF |
| Monthly Market Rent per Unit | |||||||
Studio |
| 451 |
| 97.8% |
|
| 469 |
|
| 211,466 |
|
| $72.81 |
|
| $2,846 |
|
| $73.00 |
|
| $2,853 |
|
One-Bedroom |
| 919 |
| 95.3% |
|
| 656 |
|
| 602,522 |
|
| $65.63 |
|
| $3,590 |
|
| $66.00 |
|
| $3,608 |
|
Two-Bedroom |
| 396 |
| 96.0% |
|
| 947 |
|
| 374,983 |
|
| $65.70 |
|
| $5,194 |
|
| $66.00 |
|
| $5,209 |
|
Three-Bedroom |
| 101 |
| 96.0% |
|
| 1,254 |
|
| 126,692 |
|
| $63.29 |
|
| $6,619 |
|
| $64.00 |
|
| $6,688 |
|
Four-Bedroom |
| 4 |
| 100.0% |
|
| 1,652 |
|
| 6,608 |
|
| $58.92 |
|
| $8,111 |
|
| $59.00 |
|
| $8,122 |
|
Total/Wtd. Avg. |
| 1,871 |
| 96.1% |
|
| 707 |
|
| 1,322,271 |
|
| $66.56 |
|
| $3,920 |
|
| $66.89 |
|
| $3,941 |
|
Source: Appraisal.
The Market. The Jackson Park Property is located in Long Island City, which is located on the western tip of Queens, New York, with views of the Manhattan skyline. Long Island City is a residential and commercial neighborhood known for its arts community, with a high concentration of art galleries, art institutions and studio space. The New York City Department of Education and CUNY Law School are major employers in the area along with Brooks Brothers, Boyce Technologies Inc., DeppGlass, Doughnut Plant, J. Crew/Madewell, JetBlue Airways, Kaufman Astoria Studios, LaGuardia Community College, MANA Products, Nouveau Elevator, Silvercup Studios, and VaynerMedia. Major corporate tenants in the area include Estée Lauder, Macy’s/Bloomingdales, The New York Times and The Wirecutter. At the end of 2018, New York City announced it would invest $180 million in new funding toward Long Island City’s infrastructure including improvements to schools, transportation, parks and sewer/water systems.
Long Island City is accessible by eight subway lines, thirteen bus lines, the East River Ferry (2 stops), Citibike (13 stations) and the Long Island Railroad. The Jackson Park Property offers commuting times to Manhattan of about 10 minutes by being adjacent to the Queens Plaza subway station with service on the “E”, “M”, and “R” trains and within walking distance of the Queensboro Plaza subway station with service on the “7”, “N”, and “W” trains. The drives to LaGuardia and John F. Kennedy Airports are about 15 and 20 minutes, respectively.
According to a neighborhood development association for Long Island City, as of October 2019, Long Island City had an estimated 170,000 residents, 127,000 employees and 6,800 businesses. According to the appraisal, the estimated 2018 population within a one-, three- and five-mile radius of the Jackson Park Property was 69,225, 1,194,829 and 3,166,541, respectively. The estimated 2018 average household income within a one-, three- and five-mile radius was $94,863, $139,915 and $123,971, respectively.
According to a third party data provider, the Jackson Park Property is in the Long Island City multifamily submarket, which for 2019 in the highest (4 and 5 star) category had 14,786 units with an average rent per unit of $3,896, a vacancy rate of 4.7% and an absorption rate of 9.9%.
The following table presents certain information relating to comparable rental properties to the Jackson Park Property:
Comparable Rental Properties | ||||||
| Jackson Park Property | 1 Queens Plaza South | Tower 28 | QLIC | Alta LIC(1) | Linc Long Island City |
Year Built | 2018 | 2017 | 2017 | 2013 | 2018 | 2013 |
Number of units | 1,871 | 391 | 450 | 422 | 467 | 711 |
Occupancy(2) | 96.1% | 97.9% | 98.0% | 98.3% | 93.6% | 98.7% |
Unit size (SF)(3): |
|
|
|
|
|
|
- Studio | 469 | 468 | 428 | 400 | 516 | 503 |
- 1-BR | 656 | 691 | 667 | 500 | 723 | 700 |
- 2-BR | 947 | 979 | 936 | 800 | 1,153 | 1,038 |
- 3-BR | 1,254 | N/A | 1,305 | 950 | 1,317 | 1,400 |
Monthly Rent per Unit(4): |
|
|
|
|
|
|
- Studio | $2,846 | $2,769 | $2,308 | $2,360 | $2,715 | $3,244 |
- 1-BR | $3,590 | $3,808 | $3,361 | $3,029 | $3,324 | $3,813 |
- 2-BR | $5,194 | $5,051 | $4,900 | $3,800 | $5,187 | $5,278 |
- 3-BR | $6,619 | N/A | $6,486 | $4,999 | $6,201 | $6,329 |
Annual Rent per SF(4): |
|
|
|
|
|
|
- Studio | $72.81 | $71.00 | $64.71 | $70.80 | $63.14 | $77.39 |
- 1-BR | $65.63 | $66.13 | $60.47 | $72.70 | $55.17 | $65.37 |
- 2-BR | $65.70 | $61.91 | $62.82 | $57.00 | $53.98 | $61.02 |
- 3-BR | $63.29 | N/A | $59.64 | $63.15 | $56.50 | $54.25 |
Source: Appraisal
(1) | Alta LIC is in its initial lease-up period. |
(2) | Occupancy for the comparables is as of September 2019 and for the Jackson Park Property is as of the borrower rent roll dated August 31, 2019. |
(3) | Represents the average for each unit size at the Jackson Park Property. |
(4) | Rent for the Jackson Park Property is based on the underwritten rent roll. |
| This is not a research report and was not prepared by any Underwriter’s research department. Please see additional important information and qualifications at the end of this Term Sheet. |
T-40
Multifamily – High Rise | Loan #2 | Cut-off Date Balance: |
| $100,000,000 |
28-10 Jackson Avenue, 28-40 Jackson | Jackson Park | Cut-off Date LTV: |
| 34.4% |
Avenue, and 28-30 Jackson Avenue |
| U/W NCF DSCR: |
| 3.92x |
Long Island City, NY 11101 |
| U/W NOI Debt Yield: |
| 13.0% |
Underwritten Net Cash Flow. The following table presents certain information relating to the Underwritten Net Cash Flow at the Jackson Park Property:
Cash Flow Analysis(1) | |||||
|
| UW |
| UW per unit |
|
Gross Potential Rent(2) |
| $88,062,437 |
| $47,067.04 |
|
Less Vacancy(3) |
| $4,403,122 |
| $2,353.35 |
|
Net Rental Income |
| $83,659,316 |
| $44,713.69 |
|
Other Income(4) |
| $5,315,440 |
| $2,840.96 |
|
Effective Gross Income |
| $88,974,756 |
| $47,554.65 |
|
|
|
|
|
|
|
Real Estate Taxes(5) |
| $613,865 |
| $328.09 |
|
Insurance |
| $871,159 |
| $465.61 |
|
Other Expenses |
| $16,094,361 |
| $8,602.01 |
|
Total Expenses |
| $17,579,385 |
| $9,395.72 |
|
|
|
|
|
|
|
Net Operating Income |
| $71,395,371 |
| $38,158.94 |
|
Capital Expenditures |
| $394,276 |
| $210.73 |
|
Net Cash Flow |
| $71,001,095 |
| $37,948.21 |
|
|
|
|
|
|
|
Occupancy %(6) |
| 96.1% |
|
|
|
NOI DSCR(7) |
| 3.94x |
|
|
|
NCF DSCR(7) |
| 3.92x |
|
|
|
NOI Debt Yield(7) |
| 13.0% |
|
|
|
NCF Debt Yield(7) |
| 12.9% |
|
|
|
|
|
(1) | Historical financial information is not available because the Jackson Park Property was constructed in 2018. |
(2) | UW Gross Potential Rent is based on the in-place rent roll as of August 31, 2019 with the 73 vacant units grossed up at currently marketed rents. |
(3) | UW Vacancy is based on 5% economic vacancy. |
(4) | UW Other Income is comprised of budgeted parking income, commercial income as of February 2020, and budgeted other ancillary income. UW Other Income also includes $4,200,000 of budgeted amenity fee revenue for which there were $1,256,087 of corresponding amenity expenses underwritten. |
(5) | The Jackson Park Property benefits from a 15-year, 421-a tax abatement which extends through June 2034. Taxes are fully abated for the first 10 years post-construction (through June 2029), then phased in 20% each year for the next five years. UW Real Estate Taxes assume the full abatement. |
(6) | Occupancy is as of the borrower rent roll dated August 31, 2019. |
(7) | The debt service coverage ratios and debt yields are based on the Jackson Park Senior Loan, and exclude the Jackson Park Subordinate Companion Loan. |
Escrows and Reserves.
Taxes – During a Cash Sweep Period (as defined below), the Jackson Park Borrower is required to deposit monthly 1/12 of the annual estimated real estate taxes.
Insurance – During a Cash Sweep Period or if the Jackson Park Property is no longer covered by a blanket insurance policy, the Jackson Park Borrower is required to deposit monthly 1/12 of the annual estimated insurance premiums.
Lockbox and Cash Management. The Jackson Park Whole Loan is structured with a soft lockbox and springing cash management upon the occurrence of a Cash Sweep Period (as defined below). During the continuance of a Cash Sweep Period, all funds in the lockbox account are required to be transferred to the lender-controlled cash management account and disbursed in accordance with the Jackson Park Whole Loan documents. During the continuance of a Low DSCR Period (as defined below), all excess cash flow is required to be held by the lender as additional security for the Jackson Park Whole Loan, however, the Jackson Park Borrower is permitted to request excess cash for debt service and reserve payments, leasing and operating expenses set forth in the annual budget, to cure a Low DSCR Period, and required distributions to its REIT equity holders to avoid tax impositions (not to exceed $25,000 annually). During the continuance of an event of default under the Jackson Park Whole Loan, all excess cash flow may be applied by lender in its sole discretion.
A “Cash Sweep Period” will occur during (i) an event of default under the Jackson Park Whole Loan until the event of default is cured or (ii) a Low DSCR Period.
A “Low DSCR Period” will commence when the debt service coverage ratio is less than 1.25x for two consecutive calendar quarters and continue until (x) the debt service coverage is equal to or greater than 1.25x for two consecutive calendar quarters or (y) the Jackson Park Borrower deposits cash (which may be excess cash) or a letter of credit in an amount that if applied to the reduction of the outstanding principal balance of the Jackson Park Whole Loan would result in a debt service coverage ratio of at least 1.25x for the most recent two calendar quarters. For purposes of the Cash Sweep Period test, the debt service coverage ratio will be calculated based on the Jackson Park Whole Loan and any future mezzanine debt if applicable.
| This is not a research report and was not prepared by any Underwriter’s research department. Please see additional important information and qualifications at the end of this Term Sheet. |
T-41
Multifamily – High Rise | Loan #2 | Cut-off Date Balance: |
| $100,000,000 |
28-10 Jackson Avenue, 28-40 Jackson | Jackson Park | Cut-off Date LTV: |
| 34.4% |
Avenue, and 28-30 Jackson Avenue | U/W NCF DSCR: |
| 3.92x | |
Long Island City, NY 11101 | U/W NOI Debt Yield: |
| 13.0% |
Additional Secured Indebtedness (not including trade debts). In addition to the Jackson Park Mortgage Loan, the Jackson Park Property also secures the Jackson Park Non-Serviced Pari Passu Companion Loans which have a Cut-off Date principal balance of $450,000,000 and the Jackson Park Subordinate Companion Loan, which has a Cut-off Date principal balance of $450,000,000. The Jackson Park Non-Serviced Pari Passu Companion Loans and the Jackson Park Subordinate Companion Loan all accrue interest at the rate of 3.2500% per annum. The Jackson Park Senior Loan is generally senior in right of payment to the Jackson Park Subordinate Companion Loan. The holders of the Jackson Park promissory notes have entered into a co-lender agreement which sets forth the allocation of collections on the Jackson Park Whole Loan. See “Description of the Mortgage Pool—The Whole Loans—The Jackson Park Pari Passu-A/B Whole Loan” and “Pooling and Servicing Agreement—Servicing of the Non-Serviced Mortgage Loans” in the Preliminary Prospectus.
Mezzanine Loan and Preferred Equity. The Jackson Park Borrower has a one-time right to obtain a future mezzanine loan, co-terminous with the Jackson Park Whole Loan, not to exceed the lesser of (x) $200,000,000 and (y) the amount that when added to the outstanding principal balance of the Jackson Park Whole Loan would result in a (a) combined loan to value ratio of no more than 95% of the origination date loan to value ratio of 62.5%, (b) combined debt service coverage ratio of at least 105% of the origination date debt service coverage ratio of 2.15x and (c) a combined debt yield of at least 105% of the origination date debt yield of 7.1%, subject to (i) no event of default continuing, (ii) execution of an intercreditor agreement with the lender and (iii) receipt of rating agency confirmation.
Release of Property. After the earlier of (i) the end of the two-year period commencing on the closing date of the securitization of the last promissory note representing a portion of the Jackson Park Whole Loan to be securitized, and (ii) November 10, 2022, the Jackson Park Whole Loan documents permit the partial release of any residential tower within the Jackson Park Property (1 Jackson Park, 2 Jackson Park or 3 Jackson Park), but not including the amenity building or parking garage or any other portion of the Jackson Park Property, through (A) on or after April 10, 2029, prepayment equal to the Release Price or (B) prior to April 10, 2029, partial defeasance in an amount equal to the Release Price, provided (a) no event of default is continuing, (b) the released property is transferred on an arms-length basis, (c) rating agency confirmation is received and (d) after the partial release, the debt yield for the remaining property meets the “Debt Yield Test” of being at least the greater of (x) the debt yield immediately preceding the release and (y) 7.10% (provided, the Jackson Park Borrower may deposit as either cash or a letter of credit the amount which would cause the Jackson Park Property to meet the Debt Yield Test).
The “Release Price” is equal to 110% of the allocated loan amount for each residential building. The allocated loan amount for 1 Jackson Park is $375,000,000. The allocated loan amount for 2 Jackson Park is $359,375,000. The allocated loan amount for 3 Jackson Park is $265,625,000.
Ground Lease. None.
Letter of Credit. None.
Right of First Offer/Right of First Refusal. None.
Terrorism Insurance. The Jackson Park Borrower is required to obtain and maintain property insurance that covers acts of terrorism in an amount equal to the full replacement cost of the Jackson Park Property and business interruption insurance for actual loss sustained until the restoration is complete plus a 12-month extended period of indemnity, provided, if the Terrorism Risk Insurance Program Authorization Act of 2015 (as the same may be further modified, amended, or extended) is not in effect, the Jackson Park Borrower will not be required to pay annual premiums in excess of two times the premium then payable for the property and business interruption insurance (excluding earthquake and terrorism components) in order to obtain the terrorism coverage. See “Risk Factors—Risks Relating to the Mortgage Loans—Terrorism Insurance May Not Be Available for All Mortgaged Properties” in the Preliminary Prospectus.
| This is not a research report and was not prepared by any Underwriter’s research department. Please see additional important information and qualifications at the end of this Term Sheet. |
T-42
(THIS PAGE INTENTIONALLY LEFT BLANK)
T-43
| Office – CBD | Loan #3 | Cut-off Date Balance: | $100,000,000 | |
| 250 Howard Street | Park Tower at Transbay | Cut-off Date LTV: | 49.1% | |
| San Francisco, CA 94105 | UW NCF DSCR: | 2.93x | ||
| UW NOI Debt Yield: | 10.2% |
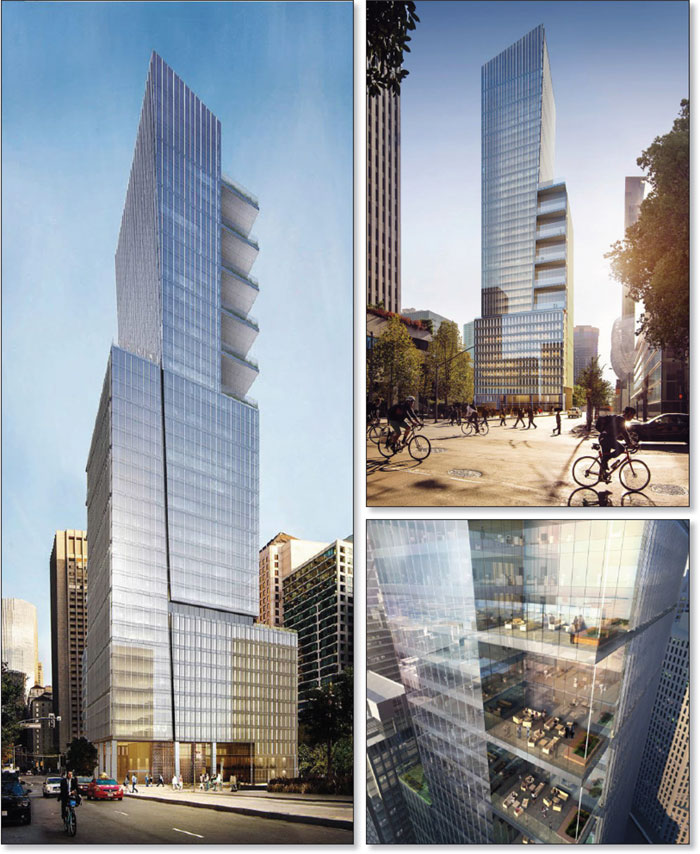
| This is not a research report and was not prepared by any Underwriter’s research department. Please see additional important information and qualifications at the end of this Term Sheet. |
T-44
| Office – CBD | Loan #3 | Cut-off Date Balance: | $100,000,000 | |
| 250 Howard Street | Park Tower at Transbay | Cut-off Date LTV: | 49.1% | |
| San Francisco, CA 94105 | UW NCF DSCR: | 2.93x | ||
| UW NOI Debt Yield: | 10.2% |

| This is not a research report and was not prepared by any Underwriter’s research department. Please see additional important information and qualifications at the end of this Term Sheet. |
T-45
| Mortgage Loan No. 3 – Park Tower at Transbay |
| Mortgage Loan Information | Property Information | ||||||
| Mortgage Loan Seller: | BANA | Single Asset/Portfolio: | Single Asset | ||||
| Credit Assessment (KBRA/Fitch/S&P): | A(sf)/BBB-sf/NR | Location: | San Francisco, CA 94105 | ||||
| Original Balance: | $100,000,000 | General Property Type: | Office | ||||
| Cut-off Date Balance(1): | $100,000,000 | Detailed Property Type: | CBD | ||||
| % of Initial Pool Balance(1): | 7.8% | Title Vesting: | Fee | ||||
| Loan Purpose: | Refinance | Year Built/Renovated: | 2018-2019/N/A | ||||
| Borrower Sponsor: | MetLife, Inc. | Size: | 764,659 SF | ||||
| Guarantor: | Park Tower Owner LLC | Cut-off Date Balance per SF(1): | $719 | ||||
| Mortgage Rate: | 3.4500% | Maturity Date/ARD Balance per SF(1): | $719 | ||||
| Note Date: | 7/23/2019 | Property Manager: | MA West Management LLC | ||||
| First Payment Date: | 9/1/2019 | (borrower-related) | |||||
| Anticipated Repayment Date (ARD)(2): | 8/1/2029 | Underwriting and Financial Information | |||||
| Maturity Date(2): | 8/1/2034 | UW NOI: | $56,350,668 | ||||
| Original Term to ARD: | 120 months | UW NOI Debt Yield(1): | 10.2% | ||||
| Original Amortization Term: | 0 months | UW NOI Debt Yield at Maturity/ARD(1): | 10.2% | ||||
| IO Period: | 120 months | UW NCF DSCR(1): | 2.93x | ||||
| Seasoning: | 4 months | Most Recent NOI(4): | N/A | ||||
| Prepayment Provisions: | LO (23); YM (90); O (7) | 2nd Most Recent NOI(4): | N/A | ||||
| Lockbox/Cash Mgmt Status: | Hard/Springing | 3rd Most Recent NOI(4): | N/A | ||||
| Additional Debt Type: | Pari Passu | Most Recent Occupancy(5): | 98.9% (10/1/2019) | ||||
| Additional Debt Balance(1): | $450,000,000 | 2nd Most Recent Occupancy(4): | N/A | ||||
| Future Debt Permitted (Type)(1): | No (N/A) | 3rd Most Recent Occupancy(4): | N/A | ||||
| Reserves(3) | Appraised Value (as of)(6): | $1,120,000,000 (10/1/2019) | |||||
| Type | Initial | Monthly | Cap | Appraised Value per SF(6): | $1,465 | ||
| RE Tax: | $0 | Springing | N/A | Cut-off Date LTV Ratio(1)(6): | 49.1% | ||
| Insurance: | $0 | Springing | N/A | Maturity Date/ARD LTV Ratio(1)(6): | 49.1% | ||
| Deferred Maintenance: | $4,412,926 | $0 | N/A | ||||
| TI/LC: | $80,198,366 | $0 | N/A | ||||
| Regulatory Fees Reserve: | $5,528,653 | $0 | N/A | ||||
| Sources and Uses | ||||||
| Sources | Proceeds | % of Total | Uses | Proceeds | % of Total | |
| Whole Loan(1): | $550,000,000 | 100.0% | Loan Payoff: | $294,460,472 | 53.5% | |
| Reserves(7): | $145,173,206 | 26.4% | ||||
| Return of Equity: | $108,543,869 | 19.7% | ||||
| Closing Costs: | $1,822,453 | 0.3% | ||||
| Total Sources: | $550,000,000 | 100.0% | Total Uses: | $550,000,000 | 100.0% | |
| (1) | The Park Tower at Transbay Mortgage Loan (as defined below) is a part of the Park Tower at Transbay Whole Loan (as defined below) with an original aggregate principal balance of $550,000,000. The Cut-off Date Balance per SF, Maturity Date/ARD Balance per SF, UW NOI Debt Yield, UW NOI Debt Yield at Maturity/ARD, UW NCF DSCR, Cut-off Date LTV Ratio and Maturity Date/ARD LTV Ratio numbers presented above are based on the Park Tower at Transbay Whole Loan. |
| (2) | The Park Tower at Transbay Whole Loan is structured with an Anticipated Repayment Date (“ARD”) and will be interest-only prior to the ARD. From and after the ARD, the Park Tower at Transbay Whole Loan will accrue additional interest at a fixed rate of 2.5000%, which will be deferred and due and payable on the Maturity Date (or earlier repayment in full of the Park Tower at Transbay Whole Loan.) The ARD automatically triggers a Cash Sweep Period (see “Lockbox and Cash Management”) whereby all excess cash flow is required to be used to pay down the principal balance of the Park Tower at Transbay Whole Loan and repay the additional accrued interest. |
| (3) | See “Escrows and Reserves” below for further discussion of reserve requirements. |
| (4) | Prior historical operating statements and occupancy are not applicable, as the Park Tower at Transbay Property (as defined below) was constructed in 2018-2019. |
| (5) | The sole office tenant, Facebook, Inc. (98.9% of NRA), is currently in the process of building out its space and, according to the borrower sponsor, is in occupancy of floors 2-12 (Phase I) and is expected to move into its remaining space by September 2020. |
| (6) | The Appraised Value shown reflects a “Prospective Market Value At Stabilization” value as of October 1, 2019, which assumes that Facebook, Inc. has commenced rent payments (which began in August 2019) and that all remaining construction project costs due by September 30, 2019 have been incurred (110% of the cost of which has been reserved by the lender). The “as-is” value as of May 30, 2019 of $959,000,000 results in both a Cut-off Date LTV Ratio and Maturity Date/ARD LTV Ratio of 57.4% for the Park Tower at Transbay Whole Loan. The appraiser also provided an “as dark” value as of May 30, 2019 of $1,004,000,000, which results in both a Cut-off Date LTV Ratio and Maturity Date/ARD LTV Ratio of 54.8% for the Park Tower at Transbay Whole Loan. The “as dark” value is greater than the “as-is” value due to the market rent being higher than the current contract rent at the Park Tower at Transbay Property. |
| (7) | Reserves include $55,033,261 paid by the Park Tower at Transbay Borrower (as defined below) at loan origination, which amount was subsequently disbursed to Facebook, Inc. by the escrow agent to buy out Facebook Inc.’s rent abatement period. |
| This is not a research report and was not prepared by any Underwriter’s research department. Please see additional important information and qualifications at the end of this Term Sheet. |
T-46
| Office – CBD | Loan #3 | Cut-off Date Balance: | $100,000,000 | |
| 250 Howard Street | Park Tower at Transbay | Cut-off Date LTV: | 49.1% | |
| San Francisco, CA 94105 | UW NCF DSCR: | 2.93x | ||
| UW NOI Debt Yield: | 10.2% |
The Mortgage Loan. The third largest mortgage loan (the “Park Tower at Transbay Mortgage Loan”) is a part of a whole loan (the “Park Tower at Transbay Whole Loan”) evidenced by tenpari passupromissory notes in the aggregate original principal amount of $550,000,000. The Park Tower at Transbay Whole Loan is secured by a first priority fee mortgage on a 764,659 SF newly constructed, Class A office tower located in San Francisco, California (the “Park Tower at Transbay Property”).
The Park Tower at Transbay Mortgage Loan is evidenced by the non-controlling promissory Note A-2 in the original principal amount of $100,000,000. The controlling promissory Note A-3 and the non-controlling promissory Notes A-1, A-4, A-5, A-6, A-7, A-8, A-9 and A-10 (together, the “Park Tower at TransbayPari Passu Companion Loans”) are in the aggregate original principal amount of $450,000,000. The Park Tower at Transbay Whole Loan will be serviced pursuant to the pooling and servicing agreement for the BANK 2019-BNK21 securitization trust. See “Description of the Mortgage Pool—The Whole Loans—The Non-Serviced Pari Passu Whole Loans” and “Pooling and Servicing Agreement” in the Preliminary Prospectus.
| Park Tower at Transbay Whole Loan Summary | ||||
| Note | Original Balance | Cut-off Date Balance | Anticipated Note Holder | Controlling Piece |
| A-1 | $100,000,000 | $100,000,000 | BANK 2019-BNK20 | No |
| A-2 | $100,000,000 | $100,000,000 | BANK 2019-BNK23 | No |
| A-3 | $100,000,000 | $100,000,000 | BANK 2019-BNK21 | Yes |
| A-4 | $80,000,000 | $80,000,000 | BANK 2019-BNK22 | No |
| A-5 | $50,000,000 | $50,000,000 | Bank of America, N.A. | No |
| A-6 | $50,000,000 | $50,000,000 | Bank of America, N.A. | No |
| A-7 | $25,000,000 | $25,000,000 | BANK 2019-BNK22 | No |
| A-8 | $20,000,000 | $20,000,000 | BANK 2019-BNK20 | No |
| A-9 | $15,000,000 | $15,000,000 | BANK 2019-BNK21 | No |
| A-10 | $10,000,000 | $10,000,000 | BANK 2019-BNK22 | No |
| Total | $550,000,000 | $550,000,000 | ||
The Borrower and the Borrower Sponsor. The borrower is Park Tower Owner LLC, a Delaware limited liability company, structured to be bankruptcy-remote with at least two independent directors (the “Park Tower at Transbay Borrower”).
The borrower sponsor is MetLife, Inc. (NYSE: MET), a Fortune 500 financial services company, providing insurance, annuities, employee benefits and asset management. The borrower sponsor was the original developer of the Park Tower at Transbay Property. There is no non-recourse carveout guarantor and no separate environmental indemnitor for the Park Tower at Transbay Whole Loan.
The Property. The Park Tower at Transbay Property is comprised of a newly constructed, Class A, pre-certified LEED Gold, 43-story high-rise office building located on the northeast corner of Beale Street and Howard Street in the Transbay Transit District in the South Financial District of downtown San Francisco, California. The Park Tower at Transbay Property contains a total of 764,659 SF. All of the office space (755,914 SF) and the two-level subterranean parking are leased to Facebook, Inc. (“Facebook”). Facebook’s space includes a mix of open and private offices, various common areas, a cafeteria, fitness/wellness center and a child care center. There is 50,000 SF of outdoor space including fourteen sky decks: large rooftop terraces on floors 12 and 28, and outside terraces on every third floor starting on floor 13 and ending on the top floor, 43. 70% of the floors have San Francisco Bay views.
The remaining rentable area is comprised of three retail spaces (8,745 SF) on the ground floor. One of the retail spaces was leased to Blue Bottle after loan origination and the other spaces are presently in lease negotiations with prospective tenants, according to the borrower sponsor. Building amenities include bike parking, an open plaza on the ground level, and two non-collateral adjacent public park spaces which are required to be maintained by the Park Tower at Transbay borrower sponsor.
The Park Tower at Transbay Property is located adjacent to the recently completed multi-billion-dollar Salesforce (f/k/a Transbay) Transit Center and City Park, providing immediate proximity to all forms of public transportation. The Park Tower at Transbay Property is within walking distance to the Ferry Building, waterfront AT&T Park, Moscone Center, Westfield Shopping Centre, SF MoMA, Union Square and South Park.
Major Tenant.
Facebook leases all of the office space (755,914 SF) on a long term, triple-net lease which commenced on March 1, 2019. Facebook’s lease is divided into three phases: Phase I includes floors 2-12, Phase II includes floors 13-25 and Phase III includes floors 26-43. The initial rent for Phase I, Phase II and Phase III is $60.00 PSF, $66.00 PSF and $72.00 PSF, respectively, resulting in a current weighted average rent of $65.82 PSF. The Facebook office lease requires annual rental increases of 3.0%. Facebook also leases the subterranean parking (110 spaces with capacity for 140 spaces with valet operations) based on an annual rent of $594,000 ($450/space per month), with increases to market rent every five years.
Facebook is currently in the process of building out its space and, according to the borrower sponsor, is in occupancy of Phase I and is expected to move into its remaining space by September 2020. The Park Tower at Transbay Borrower provided Facebook with a tenant improvement allowance of $110 PSF (of which $80,198,366 ($106 PSF) was outstanding as of the loan origination date and has been fully reserved by the lender) and estimates that Facebook will be spending an additional $300-$350 PSF on its build-out. Pursuant to its lease, Facebook was entitled to rent abatements, which have been bought out by the Park Tower at Transbay Borrower as of July 25, 2019. Facebook is now paying full unabated rent.
Facebook’s lease expiration for Phase I is February 28, 2033 and for Phases II and III are February 28, 2034. Each phase has two eight-year renewal options at fair market rent. In order to exercise the renewal option for Phase II, Facebook must exercise its option for Phase I. In order to exercise the renewal option for Phase III, Facebook must exercise both options for Phase I and II.
Facebook has a right of first offer to purchase the Park Tower at Transbay Property, as discussed in “Right of First Offer”below.
| This is not a research report and was not prepared by any Underwriter’s research department. Please see additional important information and qualifications at the end of this Term Sheet. |
T-47
| Office – CBD | Loan #3 | Cut-off Date Balance: | $100,000,000 | |
| 250 Howard Street | Park Tower at Transbay | Cut-off Date LTV: | 49.1% | |
| San Francisco, CA 94105 | UW NCF DSCR: | 2.93x | ||
| UW NOI Debt Yield: | 10.2% |
Facebook (NYSE: FB) provides various products to connect and share “online”. The company’s products include Facebook, which enables people to connect, share and discover through mobile devices and personal computers; Instagram, a community for sharing photos, videos, and messages; and Messenger and WhatsApp, both messaging applications. Facebook also provides Oculus, a hardware, software and developer platform, which allows people to connect through its virtual reality products. As of December 31, 2018, Facebook had approximately 1.52 billion daily active users. The company was founded in 2004 and is headquartered in Menlo Park, California. Facebook also has large block leases at 181 Fremont and 215 Fremont, in downtown San Francisco, both within one block of the Park Tower at Transbay Property. For the fiscal year ending December 31, 2018, Facebook reported total revenue of $55.8 billion, up from $40.7 billion in the prior year and $27.6 billion in 2016. Facebook has a current market capitalization of $478 billion.
The following table presents certain information relating to the tenant at the Park Tower at Transbay Property:
| Tenant Summary | |||||||||
| Tenant Name | Credit Rating (Fitch/Moody’s/S&P) | Tenant SF | Approx. % of Total SF | Annual UW Rent | % of Total Annual UW Rent | Annual UW Rent PSF | Lease Expiration | Renewal Options | Termination Options |
| Facebook, Inc. – Phase I | NR/NR/NR | 269,814 | 35.3% | $16,188,822 | 32.5% | $60.00 | 2/28/2033 | 2 x 8 Yrs | N |
| Facebook, Inc. – Phase II(1) | NR/NR/NR | 238,962 | 31.3% | $15,771,464 | 31.7% | $66.00 | 2/28/2034 | 2 x 8 Yrs | N |
| Facebook, Inc. – Phase III(1) | NR/NR/NR | 247,138 | 32.3% | $17,793,967 | 35.8% | $72.00 | 2/28/2034 | 2 x 8 Yrs | N |
| Office Total/Wtd. Avg. | 755,914 | 98.9% | $49,754,253 | 100.0% | $65.82 | ||||
| Vacant Space (Retail) | 8,745 | 1.1% | $0 | 0.0% | |||||
| Total/Wtd. Avg. | 764,659 | 100.0% | $49,754,253 | 100.0% | |||||
Information is based on the underwritten rent roll.
| (1) | Facebook is currently in the process of building out its space, is in occupancy of Phase I, and is expected to move into its remaining space by September 2020. |
The following table presents certain information relating to the lease rollover schedule at the Park Tower at Transbay Property:
| Lease Rollover Schedule | ||||||||
| Year | # of Leases Rolling | SF Rolling | UW Rent PSF Rolling | Approx. % of Total SF Rolling | Approx. Cumulative % of SF Rolling | Total UW Rent Rolling | Approx. % of Total Rent Rolling | Approx. Cumulative % of Total Rent Rolling |
| 2019 | 0 | 0 | $0.00 | 0.0% | 0.0% | $0 | 0.0% | 0.0% |
| 2020 | 0 | 0 | $0.00 | 0.0% | 0.0% | $0 | 0.0% | 0.0% |
| 2021 | 0 | 0 | $0.00 | 0.0% | 0.0% | $0 | 0.0% | 0.0% |
| 2022 | 0 | 0 | $0.00 | 0.0% | 0.0% | $0 | 0.0% | 0.0% |
| 2023 | 0 | 0 | $0.00 | 0.0% | 0.0% | $0 | 0.0% | 0.0% |
| 2024 | 0 | 0 | $0.00 | 0.0% | 0.0% | $0 | 0.0% | 0.0% |
| 2025 | 0 | 0 | $0.00 | 0.0% | 0.0% | $0 | 0.0% | 0.0% |
| 2026 | 0 | 0 | $0.00 | 0.0% | 0.0% | $0 | 0.0% | 0.0% |
| 2027 | 0 | 0 | $0.00 | 0.0% | 0.0% | $0 | 0.0% | 0.0% |
| 2028 | 0 | 0 | $0.00 | 0.0% | 0.0% | $0 | 0.0% | 0.0% |
| 2029 | 0 | 0 | $0.00 | 0.0% | 0.0% | $0 | 0.0% | 0.0% |
| 2030 & Beyond | 1 | 755,914 | $65.82 | 98.9% | 98.9% | $49,754,253 | 100.0% | 100.0% |
| Vacant | 0 | 8,745 | $0.00 | 1.1% | 100.0% | $0 | 0.0% | 100.0% |
| Total/Wtd. Avg.(1) | 1 | 764,659 | $65.82 | 100.0% | $49,754,253 | 100.0% | ||
Information is based on the underwritten rent roll.
| (1) | Wtd. Avg. UW Rent PSF Rolling excludes vacant space. |
| This is not a research report and was not prepared by any Underwriter’s research department. Please see additional important information and qualifications at the end of this Term Sheet. |
T-48
| Office – CBD | Loan #3 | Cut-off Date Balance: | $100,000,000 | |
| 250 Howard Street | Park Tower at Transbay | Cut-off Date LTV: | 49.1% | |
| San Francisco, CA 94105 | UW NCF DSCR: | 2.93x | ||
| UW NOI Debt Yield: | 10.2% |
The Market. The Park Tower at Transbay Property is located in the South Financial District of San Francisco, California, just north of the Rincon Hill/South Beach/SOMA District, which has seen a resurgence in leasing activity particularly with respect to the technology sector, and east of the Yerba Buena District, home to several major redevelopment projects including the Yerba Buena complex, Moscone convention center and Westfield Shopping Center.
A significant development in the San Francisco central business district is the redevelopment of the approximately 40-acre area surrounding the Transbay Terminal, the primary transit hub in the downtown area. Redevelopment plans include replacing the outdated Transbay Terminal (which was completed in August 2018), extending Caltrain 1.3 miles (which construction began in 2012) and developing the surrounding neighborhood by widening Folsom Street and promoting sidewalk cafes and markets, and developing approximately 2,600 new homes, 3 million SF of office and commercial space, and 100,000 SF of retail space. Recent developments of the office space include the 61-story Salesforce Tower.
Salesforce has also leased approximately 325,000 SF at Transbay Parcel F (550 Howard) and approximately 335,000 SF at 350 Mission. Other technology firms leasing large blocks of space in the area include Facebook at 181 Fremont (432,000 SF) and at 215 Fremont (300,000 SF), Adobe at 100 Hooper (280,000 SF), Stripe at 510 Townsend (269,063 SF), Blend Labs at 500 Pine Street (72,000 SF), Twitch at 350 Bush Street (185,000 SF), LinkedIn at 222 Second Street (430,650 SF) and Pinterest at 88 Bluxome Street (490,000 SF). As of the first quarter of 2019, large block demand greater than 50,000 SF has climbed 41% year over year, outpacing supply. According to the appraisal, there are currently 20 tenant requirements of 100,000 SF or more but only five contiguous space options that can offer occupancy through 2023.
According to a third party market report, the Park Tower at Transbay Property is located in the South Financial District office submarket of the San Francisco office market. For the first quarter of 2019, the submarket had total inventory of approximately 28.2 million SF with a vacancy rate of 6.7% and average asking rents of $83.02 PSF.
According to the appraisal, the estimated 2019 population within a one-half-, one- and three-mile radius of the Park Tower at Transbay Property was 16,122, 59,433 and 378,299, respectively. The 2019 median household income within the same radii was $204,917, $105,624 and $113,407, respectively.
The following table presents recent leasing data at comparable office properties with respect to the Park Tower at Transbay Property:
| Comparable Lease Summary | ||||||||||
| Property | Year Built | Distance from Subject | Property Size (SF) | Tenant | Lease Area (SF) | Lease Date | Initial Rent PSF NNN | Lease Term (Yrs.) | TI PSF | |
| Park Tower at Transbay | 2018-2019 | N/A | 764,659 | 755,914 | March-19 | $65.82 | 15 | $110 | ||
| Parcel F 546-550 Howard Street | 2023 (projected) | 0.2 miles | 1,100,000 | Salesforce | 325,000 | 4Q18 | $80.00 | 15 | $100 | |
| 88 Bluxome Street | TBD | 1.4 miles | 1,000,000 | 490,000 | 1Q19 | $78.00 | 10-15 | N/A | ||
| 181 Fremont Street | 2018 | 0.1 miles | 432,000 | 432,000 | Sep-17 | $65.00 | 10 | $100 | ||
| 45 Fremont | 1978 | 0.3 miles | 602,780 | Slack Technologies | 208,459 | Aug-19 | $69.00 | 11.3 | $100-$130 | |
| One Tehama | 1929 | 0.2 miles | 98,566 | Social Finance | 98,566 | Sep-18 | $70.00 | 11 | $105 | |
Source: Appraisal and Facebook lease.
The following table presents the appraiser’s market rent conclusions:
| Market Rent Summary | ||||
| Office – Low | Office – Mid | Office - High | Retail | |
| Market Rent | $75.00 | $80.00 | $85.00 | $65.00 |
| Lease Term (Yrs.) | 12 | 12 | 12 | 10 |
| Rental Increase Projection | 3.0%per annum | 3.0%per annum | 3.0%per annum | 3.0%per annum |
| This is not a research report and was not prepared by any Underwriter’s research department. Please see additional important information and qualifications at the end of this Term Sheet. |
T-49
| Office – CBD | Loan #3 | Cut-off Date Balance: | $100,000,000 | |
| 250 Howard Street | Park Tower at Transbay | Cut-off Date LTV: | 49.1% | |
| San Francisco, CA 94105 | UW NCF DSCR: | 2.93x | ||
| UW NOI Debt Yield: | 10.2% |
Underwritten Net Cash Flow.The following table presents certain information relating to the Underwritten Net Cash Flow at the Park Tower at Transbay Property:
| Cash Flow Analysis(1) | ||
| UW | UW PSF | |
| Base Rent(2) | $50,322,681 | $65.81 |
| Straight Line Rent | $7,996,394 | $10.46 |
| Reimbursements | $29,328,101 | $38.35 |
| Parking Income | $594,000 | $0.78 |
| Vacancy(3) | ($2,908,912) | ($3.80) |
| Effective Gross Income | $85,332,264 | $111.60 |
| Real Estate Taxes | $16,161,609 | $21.14 |
| Insurance | $1,561,863 | $2.04 |
| Other Operating Expenses | $11,258,124 | $14.72 |
| Total Operating Expenses | $28,981,596 | $37.90 |
| Net Operating Income | $56,350,668 | $73.69 |
| TI/LC | $0 | $0.00 |
| Capital Expenditures | $72,995 | $0.10 |
| Net Cash Flow | $56,277,673 | $73.60 |
| Occupancy %(3) | 96.7% | |
| NOI DSCR(4) | 2.93x | |
| NCF DSCR(4) | 2.93x | |
| NOI Debt Yield(4) | 10.2% | |
| NCF Debt Yield(4) | 10.2% | |
| (1) | Prior historical operating statements and occupancy are not applicable, as the Park Tower at Transbay Property was constructed in 2018-2019. |
| (2) | UW Base Rent includes the ground floor retail space (8,745 SF) grossed up to an estimated NNN rent of $65.00 PSF. |
| (3) | The Park Tower at Transbay Property is 98.9% leased to Facebook. UW Vacancy is 2.5% for the office floors and 100.0% for the retail space. |
| (4) | The debt service coverage ratios and debt yields shown are based on the Park Tower at Transbay Whole Loan. |
Escrows and Reserves.
Taxes and Insurance Reserves -So long as (x) no Cash Sweep Period (as defined below) exists and (y) the Park Tower at Transbay Borrower provides evidence to the lender that all property taxes and insurance premiums have been paid in full, monthly escrows for taxes and insurance will be waived.
Deferred Maintenance -The Park Tower at Transbay Borrower deposited at loan origination $4,412,926, which is equal to 110% of the estimated cost for the completion of the outstanding project costs for the construction of the Park Tower at Transbay Property.
TI/LC Reserve -The Park Tower at Transbay Borrower deposited at loan origination $80,198,366 for outstanding tenant improvement allowances owed to Facebook.
Regulatory Fees Reserve -The Park Tower at Transbay Borrower deposited at loan origination $5,528,653 which is equal to 100% of the estimated cost for the regulatory fees in connection with the development of the Park Tower at Transbay Property as required pursuant to an owner participation/disposition and development agreement between the Successor Agency to the Redevelopment Agency of the City of San Francisco and the Park Tower at Transbay Borrower and as required for Municipal Transportation Agency additional street use fees.
Lockbox and Cash Management. The Park Tower at Transbay Whole Loan documents require a hard lockbox with springing cash management upon the occurrence of a Cash Sweep Period. During the continuance of a Cash Sweep Period, all funds in the lockbox account are required to be swept each business day to a lender-controlled cash management account and disbursed in accordance with the Park Tower at Transbay Whole Loan documents. Additionally, during a Cash Sweep Period, all excess cash flow is required to be held as additional security for the Park Tower at Transbay Whole Loan until the discontinuance of the Cash Sweep Period.
A “Cash Sweep Period” will commence upon:
| (i) | an event of default under the Park Tower at Transbay Whole Loan documents beyond notice and cure periods (a “Default Trigger”), |
| (ii) | the Park Tower at Transbay Borrower seeking bankruptcy protection (a “Borrower Bankruptcy Trigger”), |
| (iii) | Facebook seeking bankruptcy protection (a “Facebook Bankruptcy Trigger”), |
| (iv) | Facebook (A) being in monetary or material non-monetary default beyond notice and cure periods or (B) terminating or giving notice to terminate its lease (each, a “Tenant Trigger”), |
| This is not a research report and was not prepared by any Underwriter’s research department. Please see additional important information and qualifications at the end of this Term Sheet. |
T-50
| Office – CBD | Loan #3 | Cut-off Date Balance: | $100,000,000 | |
| 250 Howard Street | Park Tower at Transbay | Cut-off Date LTV: | 49.1% | |
| San Francisco, CA 94105 | UW NCF DSCR: | 2.93x | ||
| UW NOI Debt Yield: | 10.2% |
| (v) | the Park Tower at Transbay Borrower failing to repay the Park Tower at Transbay Whole Loan in full on or before the ARD (an “ARD Trigger”), |
| (vi) | if a Facebook Bankruptcy Trigger or a Tenant Trigger previously occurred and was cured pursuant to clause (c) below and thereafter, the debt yield is less than 7.000% (not including any straight line rent) for two consecutive calendar quarters (a “Debt Yield Trigger”), or |
| (vii) | any replacement tenant (should the Facebook lease be terminated) subsequently going dark in more than 50% the office SF at the Park Tower at Transbay Property (a “Replacement Tenant Trigger”), unless the replacement tenant has a credit rating of at least “BBB-” by S&P or Fitch or “Baa3” by Moody’s. |
A Cash Sweep Period will end when (provided no other Cash Sweep Period is continuing):
| (a) | if triggered by a Default Trigger, the cure of the event of default under the Park Tower at Transbay Whole Loan documents, |
| (b) | if triggered by a Facebook Bankruptcy Trigger, the replacement or assumption of the Facebook lease by the bankruptcy court and the dismissal of such bankruptcy proceedings, |
| (c) | if triggered by a Tenant Trigger or a Debt Yield Trigger, the debt yield being equal to or greater than 7.00% (not including any straight line rent) for the trailing two quarters, and |
| (d) | if triggered by a Replacement Tenant Trigger (x) delivery of a replacement lease(s) for at least 50% of the office SF at the Park Tower at Transbay Property, or (y) the dark replacement tenant re-opens business in at least 50% of the office SF at the Park Tower at Transbay Property. |
A Cash Sweep Period triggered by a Borrower Bankruptcy Trigger or an ARD Trigger may not be cured and will continue until the full repayment of the Park Tower at Transbay Whole Loan. All excess cash collected after an ARD Triggerwill be applied to the reduction of principal, then to pay off additional accrued interest.
Additional Secured Indebtedness (not including trade debts). The Park Tower at Transbay Property also secures the Park Tower at TransbayPari PassuCompanion Loans which have an aggregate Cut-off Date principal balance of $450,000,000. The Park Tower at TransbayPari Passu Companion Loans accrue interest at the same rate as the Park Tower at Transbay Mortgage Loan. The Park Tower at Transbay Mortgage Loan is entitled to payments of interest on apro rata andpari passubasis with the Park Tower at TransbayPari PassuCompanion Loans. The holders of the Park Tower at Transbay Mortgage Loan and the Park Tower at TransbayPari PassuCompanion Loans have entered into a co-lender agreement which sets forth the allocation of collections on the Park Tower at Transbay Whole Loan. See “Description of the Mortgage Pool—The Whole Loans—The Non-Serviced Pari Passu Whole Loans” in the Preliminary Prospectus.
Mezzanine Loan and Preferred Equity.Not permitted.
Release of Property. Not permitted.
Right of First Offer.Facebook has a right of first offer to purchase the Park Tower at Transbay Property at the same terms as any purchase offer received by the Park Tower at Transbay Borrower. If Facebook fails to exercise its right of first offer, the Park Tower at Transbay Borrower will be free to sell the Park Tower at Transbay Property to another party other than a Facebook competitor, namely Alphabet Inc., Amazon.com, Inc., Apple Inc., Microsoft Corporation, salesforce.com, inc., Snap Inc. and Samsung Electronics, which list of competitors is subject to change by Facebook in accordance with its lease.
Letter of Credit.None.
Terrorism Insurance.The Park Tower at Transbay Borrower is required to obtain and maintain property insurance that covers perils of terrorism and acts of terrorism in an amount equal to the full replacement cost of the Park Tower at Transbay Property and business interruption insurance for 36 months with a twelve month extended period of indemnity, provided, if the Terrorism Risk Insurance Act of 2002, as extended and modified by the Terrorism Risk Insurance Program Reauthorization Act of 2015 (as the same may be further modified, amended, or extended) is not in effect, the Park Tower at Transbay Borrower will not be required to pay annual premiums in excess of two times the premium then payable for the property and business interruption/loss of rents insurance in order to obtain the terrorism coverage. See “Risk Factors—Risks Relating to the Mortgage Loans—Terrorism Insurance May Not Be Available for All Mortgaged Properties” in the Preliminary Prospectus.
| This is not a research report and was not prepared by any Underwriter’s research department. Please see additional important information and qualifications at the end of this Term Sheet. |
T-51
| Industrial – Warehouse Distribution | Loan #4 | Cut-off Date Balance: | $75,000,000 | |
| Various | ILPT Industrial Portfolio | Cut-off Date LTV: | 39.2% | |
| Various | U/W NCF DSCR: | 5.05x | ||
| U/W NOI Debt Yield: | 14.8% |
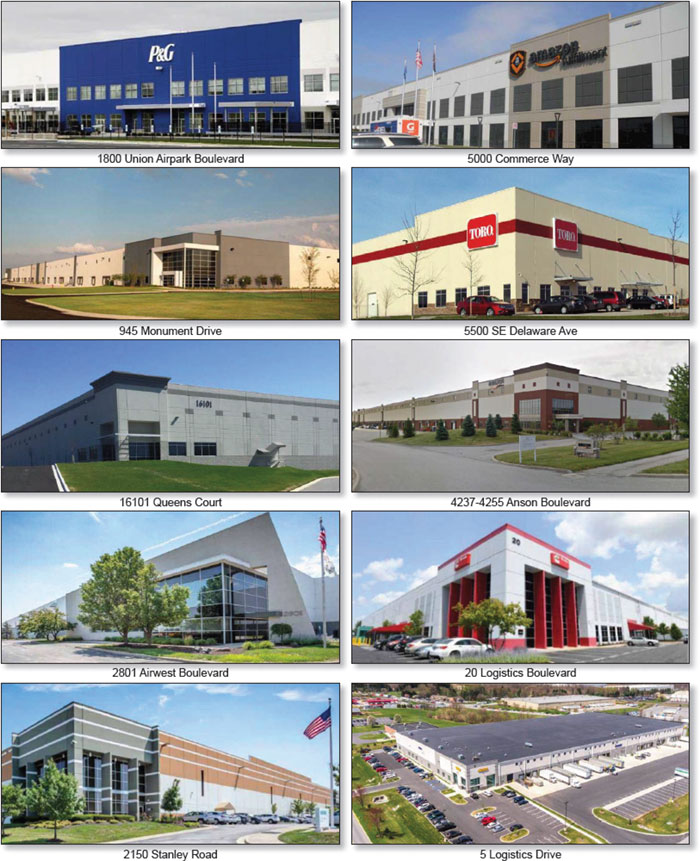
| This is not a research report and was not prepared by any Underwriter’s research department. Please see additional important information and qualifications at the end of this Term Sheet. |
T-52
| Industrial – Warehouse Distribution | Loan #4 | Cut-off Date Balance: | $75,000,000 | |
| Various | ILPT Industrial Portfolio | Cut-off Date LTV: | 39.2% | |
| Various | U/W NCF DSCR: | 5.05x | ||
| U/W NOI Debt Yield: | 14.8% |
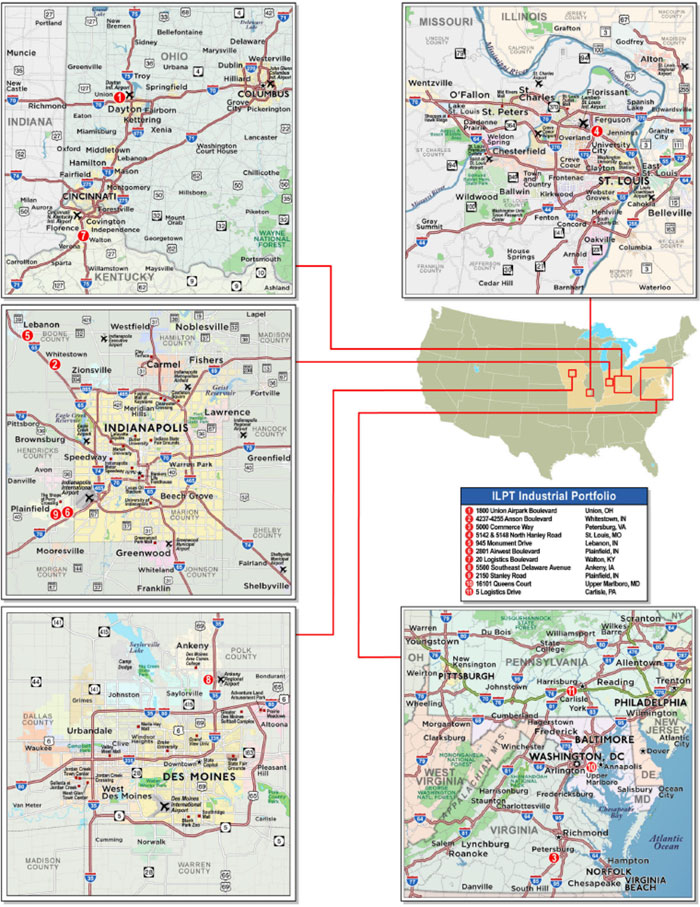
| This is not a research report and was not prepared by any Underwriter’s research department. Please see additional important information and qualifications at the end of this Term Sheet. |
T-53
| Mortgage Loan No. 4 – ILPT Industrial Portfolio |
| Mortgage Loan Information | Property Information | ||||||
| Mortgage Loan Seller(1): | MSMCH/BANA | Single Asset/Portfolio: | Portfolio | ||||
| Credit Assessment (KBRA/Fitch/S&P): | BBB+(sf)/BBB-sf/NR | Location: | Various | ||||
| Original Balance(1): | $75,000,000 | General Property Type: | Industrial | ||||
| Cut-off Date Balance(1): | $75,000,000 | Detailed Property Type: | Warehouse Distribution | ||||
| % of Initial Pool Balance: | 5.8% | Title Vesting: | Fee | ||||
| Loan Purpose: | Recapitalization | Year Built/Renovated: | Various | ||||
| Borrower Sponsor: | Industrial Logistics Properties Trust | Size: | 8,209,036 SF | ||||
| Guarantor: | Industrial Logistics Properties Trust | Cut-off Date Balance per SF(1): | $26 | ||||
| Mortgage Rate(2): | 2.65326% | Maturity Date Balance per SF(1): | $26 | ||||
| Note Date: | 10/21/2019 | Property Manager: | The RMR Group LLC | ||||
| First Payment Date: | 12/7/2019 | (borrower-related) | |||||
| Maturity Date: | 11/7/2029 | Underwriting and Financial Information | |||||
| Original Term to Maturity: | 120 months | UW NOI: | $31,836,916 | ||||
| Original Amortization Term: | 0 months | UW NOI Debt Yield(1): | 14.8% | ||||
| IO Period: | 120 months | UW NOI Debt Yield at Maturity(1): | 14.8% | ||||
| Seasoning: | 1 month | UW NCF DSCR(1): | 5.05x | ||||
| Prepayment Provisions(3): | LO (25); DEF/YM1 (88); O (7) | Most Recent NOI: | $28,890,150 (12/31/2018) | ||||
| Lockbox/Cash Mgmt Status: | Hard/Springing | 2nd Most Recent NOI: | $27,259,856 (12/31/2017) | ||||
| Additional Debt Type(1)(4): | Pari Passu /Subordinate | 3rd Most Recent NOI: | $16,319,258 (12/31/2016) | ||||
| Additional Debt Balance(1)(4): | $139,400,000 / $135,600,000 | Most Recent Occupancy: | 100.0% (Various) | ||||
| Future Debt Permitted (Type): | No (N/A) | 2nd Most Recent Occupancy: | N/A | ||||
| Reserves(5) | 3rd Most Recent Occupancy: | N/A | |||||
| Type | Initial | Monthly | Cap | Appraised Value (as of): | $547,000,000 (Various) | ||
| RE Tax: | $0 | Springing | N/A | Appraised Value per SF: | $67 | ||
| Insurance: | $0 | Springing | N/A | Cut-off Date LTV Ratio(1): | 39.2% | ||
| Toro Expansion: | $6,134,904 | $0 | N/A | Maturity Date LTV Ratio(1): | 39.2% | ||
| Sources and Uses | ||||||
| Sources | Proceeds | % of Total | Uses | Proceeds | % of Total | |
| Senior Loan Amount(1): | $214,400,000 | 61.3% | Return of Equity(6): | $340,254,888 | 97.2% | |
| Subordinate Companion Loan(1): | $135,600,000 | 38.7% | Reserves: | $6,134,904 | 1.8% | |
| Closing Costs: | $3,610,208 | 1.0% | ||||
| Total Sources: | $350,000,000 | 100.0% | Total Uses: | $350,000,000 | 100.0% | |
| (1) | The ILPT Industrial Portfolio Mortgage Loan (as defined below) is part of the ILPT Industrial Portfolio Whole Loan (as defined below), which is comprised of eightpari passusenior promissory notes with an aggregate original principal balance of $214,400,000 (the “Senior Notes”, and collectively, the “ILPT Industrial Portfolio Senior Loan”) and three promissory notes that are subordinate to the Senior Notes with an original principal balance of $135,600,000 (collectively, the “ILPT Industrial Portfolio Subordinate Companion Loan”, and together with the ILPT Industrial Portfolio Senior Loan, the “ILPT Industrial Portfolio Whole Loan”). The Cut-off Date Balance per SF, Maturity Date Balance per SF, UW NOI Debt Yield, UW NOI Debt Yield at Maturity, UW NCF DSCR, Cut-off Date LTV Ratio and Maturity Date LTV Ratio numbers presented above are based on the aggregate principal balance of the promissory notes comprising the ILPT Industrial Portfolio Senior Loan, without regard to the ILPT Industrial Portfolio Subordinate Companion Loan. The Cut-off Date Balance per SF, Maturity Date Balance per SF, UW NOI Debt Yield, UW NOI Debt Yield at Maturity, UW NCF DSCR, Cut-off Date LTV Ratio and Maturity Date LTV Ratio numbers based on the combined balance of the entire ILPT Industrial Portfolio Whole Loan are $43, $43, 9.1%, 9.1%, 2.47x, 64.0% and 64.0%, respectively. The ILPT Industrial Portfolio Whole Loan was co-originated by Morgan Stanley Bank, N.A. (“MSBNA”), Bank of America, N.A. (“BANA”) and UBS AG (“UBS”) on October 21, 2019. |
| (2) | Reflects the Senior Notes only. The ILPT Industrial Portfolio Subordinate Companion Loan accrues interest at the rate of 4.40% per annum. |
| (3) | Defeasance or prepayment of the ILPT Industrial Portfolio Whole Loan is permitted at any time after the earlier to occur of (a) the end of the two-year period commencing on the closing date of the securitization of the last ILPT Industrial Portfolio Whole Loan promissory note to be securitized and (b) October 21, 2022. The assumed defeasance and prepayment lockout period of 25 payments is based on the closing date of this transaction in December 2019. |
| (4) | See “The Mortgage Loan” and “Additional Secured Indebtedness (not including trade debts)” below for further discussion of additional debt. |
| (5) | See “Escrows and Reserves” below for further discussion of reserve requirements. |
| (6) | The borrower sponsor acquired the ILPT Industrial Portfolio Properties primarily from September 2018 to April 2019 for a combined purchase price of approximately $555.0 million and expects to use the proceeds of the ILPT Industrial Portfolio Whole Loan to reduce outstanding borrowings under its $750 million unsecured revolving credit facility. |
The Mortgage Loan. The fourth largest mortgage loan (the “ILPT Industrial Portfolio Mortgage Loan”) is part of the ILPT Industrial Portfolio Whole Loan in the original principal balance of $350,000,000. The ILPT Industrial Portfolio Whole Loan is secured by a first priority fee mortgage encumbering 11 industrial properties located in eight states (the “ILPT Industrial Portfolio” or the “ILPT Industrial Portfolio Properties”). The ILPT Industrial Portfolio Whole Loan was co-originated by MSBNA, BANA and UBS on October 21, 2019. The ILPT Industrial Portfolio Whole Loan is comprised of eight senior promissory notes, which arepari passu with each other, with an aggregate original principal balance of $214,400,000, and three subordinate promissory notes, which are subordinate to the senior notes andpari passu with each other, with an aggregate original principal balance of $135,600,000. The promissory Note A-2, in the original principal balance of $35,760,000, which is being contributed by Morgan Stanley Mortgage Capital Holdings LLC (“MSMCH”), and promissory Note A-3, in the original principal balance of $39,240,000, which is being contributed by BANA, represent the ILPT Industrial Portfolio Mortgage Loan and will be included in the BANK 2019-BNK23 securitization trust. The remaining Senior Notes (collectively, the “ILPT Industrial Portfolio Non-ServicedPari PassuCompanion Loans”), which had an aggregate original principal balance of $139,400,000, have been or are expected to be contributed to one or more future securitization transactions or may be otherwise transferred at any time. The ILPT Industrial Portfolio Whole Loan will be serviced pursuant to the pooling and servicing agreement for the MSC 2019-L3 securitization trust. See “Description of the Mortgage
| This is not a research report and was not prepared by any Underwriter’s research department. Please see additional important information and qualifications at the end of this Term Sheet. |
T-54
| Industrial – Warehouse Distribution | Loan #4 | Cut-off Date Balance: | $75,000,000 | |
| Various | ILPT Industrial Portfolio | Cut-off Date LTV: | 39.2% | |
| Various | U/W NCF DSCR: | 5.05x | ||
| U/W NOI Debt Yield: | 14.8% |
Pool—The Whole Loans—The ILPT Industrial Portfolio Pari Passu A/B Whole Loan”and “Pooling and Servicing Agreement-Servicing of the Non-Serviced Mortgage Loans” in the Preliminary Prospectus.
| ILPT Industrial Portfolio Whole Loan Summary | ||||
| Notes | Original Balance | Cut-off Date Balance | Note Holder | Controlling Piece |
| ILPT Industrial Portfolio Mortgage Loan | ||||
| A-2 and A-3(1) | $75,000,000 | $75,000,000 | BANK 2019-BNK23 | No |
| ILPT Industrial Portfolio Non-ServicedPari Passu Companion Loans | ||||
| A-1 | $50,000,000 | $50,000,000 | MSC 2019-L3 | No(2) |
| A-4 | $25,080,000 | $25,080,000 | BANA | No |
| A-5 | $25,000,000 | $25,000,000 | UBS | No |
| A-6 | $20,000,000 | $20,000,000 | UBS | No |
| A-7 | $10,000,000 | $10,000,000 | UBS | No |
| A-8 | $9,320,000 | $9,320,000 | UBS | No |
| ILPT Industrial Portfolio Subordinate Companion Loan | ||||
| B-1 | $54,240,000 | $54,240,000 | Third party holder | Yes(2) |
| B-2 | $40,680,000 | $40,680,000 | Third party holder | No |
| B-3 | $40,680,000 | $40,680,000 | Third party holder | No |
| Total | $350,000,000 | $350,000,000 | ||
| (1) | Note A-2, in the original principal balance of $35,760,000, is being contributed by MSMCH and Note A-3, in the original principal balance of $39,240,000, is being contributed by BANA. |
| (2) | The holder of the ILPT Industrial Portfolio B-1 Note (which may transfer such right to the holder of the B-2 Note or B-3 Note) will have the right to appoint the special servicer of the ILPT Industrial Portfolio Whole Loan and to direct certain decisions with respect to the ILPT Industrial Portfolio Whole Loan, unless a control appraisal event exists under the related co-lender agreement (in which case Note A-1 will be the controlling note). The ILPT Industrial Portfolio Whole Loan will be serviced pursuant to the pooling and servicing agreement for the MSC 2019-L3 securitization. |
The Borrowers and the Borrower Sponsor. The borrowers are The Industrial Fund St. Louis LLC, The Industrial Fund PA LLC, The Industrial Fund MS LLC, and The Industrial Fund Ankeny LLC (collectively, the “ILPT Industrial Portfolio Borrowers”), each a Delaware limited liability company structured to be bankruptcy-remote with two independent directors. Industrial Logistics Properties Trust (“ILPT”) is the borrower sponsor and non-recourse carveout guarantor with respect to the ILPT Industrial Portfolio Whole Loan. The obligations of ILPT for any guaranteed obligations for which the ILPT Industrial Portfolio Whole Loan documents provide full recourse (consisting generally of bankruptcy related events) is capped at 15% of the outstanding principal balance of the ILPT Industrial Portfolio Whole Loan.
ILPT is a real estate investment trust (“REIT”) formed to own and lease industrial and logistics properties throughout the United States. As of June 30, 2019, ILPT owned 298 industrial and logistics properties with approximately 42.4 million rentable SF, which were approximately 99.3% leased to 265 tenants with a weighted average remaining lease term of approximately 9.8 years. Approximately 58.0% of ILPT’s annualized rental revenues as of June 30, 2019 come from 72 industrial and logistics properties with approximately 25.6 million SF located in 29 states on the U.S. mainland and approximately 42.0% of annualized rental revenues come from 226 properties (buildings, leasable land parcels and easements) with approximately 16.8 million SF located on the island of Oahu, Hawaii, most of which are long-term ground leases to tenants that have constructed buildings and operate businesses on land owned by ILPT.
The Properties. The ILPT Industrial Portfolio consists of a total of eleven industrial properties containing a total of 8,209,036 SF. The ILPT Industrial Portfolio Properties are located across eight states. The ILPT Industrial Portfolio Properties are located in Indiana (four properties, 40.2% of NRA), Ohio (one property, 21.8% of NRA), and Virginia (one property, 12.4% of NRA), with the five remaining ILPT Industrial Portfolio Properties located in Missouri, Iowa, Kentucky, Maryland and Pennsylvania. Built between 2001 and 2016, with seven of the eleven properties built between 2012 and 2016, the ILPT Industrial Portfolio Properties range in size from 205,090 SF to 1,791,246 SF. Based on the rent roll as of September 1, 2019, the ILPT Industrial Portfolio was 100.0% leased by a mix of national and local tenants. The largest tenant, Amazon, occupies approximately 25.0% of the ILPT Industrial Portfolio SF and contributes approximately 24.5% of underwritten base rent, and the second largest tenant, Procter & Gamble, occupies approximately 21.8% of the ILPT Industrial Portfolio SF and contributes approximately 19.5% of underwritten base rent. Excluding Amazon and Procter & Gamble, no single tenant accounts for more than 11.4% of underwritten rent or more than 11.7% of total SF of the ILPT Industrial Portfolio. The largest amount of rollover occurs in 2024, when leases comprising approximately 43.3% of the ILPT Industrial Portfolio SF and 36.0% of underwritten base rent expire. The weighted average remaining lease term at the ILPT Industrial Portfolio is approximately 6.5 years as of November 2019, and approximately 15.8% of the ILPT Industrial Portfolio SF and 24.2% of underwritten base rent rolls after the maturity of the ILPT Industrial Portfolio Whole Loan.
| This is not a research report and was not prepared by any Underwriter’s research department. Please see additional important information and qualifications at the end of this Term Sheet. |
T-55
| Industrial – Warehouse Distribution | Loan #4 | Cut-off Date Balance: | $75,000,000 | |
| Various | ILPT Industrial Portfolio | Cut-off Date LTV: | 39.2% | |
| Various | U/W NCF DSCR: | 5.05x | ||
| U/W NOI Debt Yield: | 14.8% |
The following table presents a summary of certain information relating to the ILPT Industrial Portfolio Properties:
| ILPT Industrial Portfolio Properties Summary(1) | ||||||||||
Property Name | City | State | Year Built | Total GLA (SF) | % of Total GLA | Occ. % | Cut-off Date Allocated Loan Amount(2) | % of ALA(2) | Appraised Value(3) | 12/31/2018 NOI |
| 1800 Union Airpark Boulevard | Union | OH | 2014 | 1,791,246 | 21.8% | 100.0% | $37,039,854 | 17.3% | $94,500,000 | $6,123,103 |
| 4237-4255 Anson Boulevard | Whitestown | IN | 2006 | 1,036,573 | 12.6% | 100.0% | $28,612,797 | 13.3% | $73,000,000 | $4,805,740 |
| 5000 Commerce Way | Petersburg | VA | 2012 | 1,016,065 | 12.4% | 100.0% | $27,319,342 | 12.7% | $69,700,000 | $3,628,743 |
| 5142 & 5148 North Hanley Road | St. Louis | MO | 2016 | 430,986 | 5.3% | 100.0% | $24,183,693 | 11.3% | $61,700,000 | $2,679,435 |
| 945 Monument Drive | Lebanon | IN | 2014 | 962,500 | 11.7% | 100.0% | $20,068,154 | 9.4% | $51,200,000 | $2,881,565 |
| 2801 Airwest Boulevard | Plainfield | IN | 2001 | 804,586 | 9.8% | 100.0% | $16,854,113 | 7.9% | $43,000,000 | $2,411,524 |
| 20 Logistics Boulevard | Walton | KY | 2006 | 603,586 | 7.4% | 100.0% | $16,109,397 | 7.5% | $41,100,000 | $2,339,909 |
| 5500 Southeast Delaware Avenue | Ankeny | IA | 2012 | 644,104 | 7.8% | 100.0% | $12,738,574 | 5.9% | $32,500,000 | $1,497,139 |
| 2150 Stanley Road | Plainfield | IN | 2007 | 493,500 | 6.0% | 100.0% | $11,837,075 | 5.5% | $30,200,000 | $1,743,981 |
| 16101 Queens Court | Upper Marlboro | MD | 2016 | 220,800 | 2.7% | 100.0% | $11,562,706 | 5.4% | $29,500,000 | $297,684 |
| 5 Logistics Drive | Carlisle | PA | 2016 | 205,090 | 2.5% | 100.0% | $8,074,296 | 3.8% | $20,600,000 | $481,327 |
| Total/Wtd. Avg. | 8,209,036 | 100.0% | 100.0% | $214,400,000 | 100.0% | $547,000,000 | $28,890,150 | |||
| (1) | Based on the underwritten rent roll dated September 1, 2019. |
| (2) | Based on the Senior Notes. |
| (3) | Based on the appraisals dated August 31, 2019 to September 5, 2019. |
The following table presents a summary of amenity information relating to the ILPT Industrial Portfolio Properties:
| ILPT Industrial Portfolio Properties Summary | |||||||
Property Name | State | Year Built | Total GLA (SF) | Tenant | Dock Doors / Drive-in Doors | Clear Height | Parking Spaces |
| 1800 Union Airpark Boulevard | OH | 2014 | 1,791,246 | Procter & Gamble | 230 / 2 | 36’ | 756 |
| 4237-4255 Anson Boulevard | IN | 2006 | 1,036,573 | Amazon | 80 / 4 | 36’ | 1,560 |
| 5000 Commerce Way | VA | 2012 | 1,016,065 | Amazon | 75 / 2 | 32’ | 952 |
| 5142 & 5148 North Hanley Road | MO | 2016 | 430,986 | SKF USA | 24 / 7 | 31’ | 385 |
| 945 Monument Drive | IN | 2014 | 962,500 | Subaru of America Distribution | 96 / 6 | 34’ | 260 |
| 2801 Airwest Boulevard | IN | 2001 | 804,586 | Whirlpool Corporation | 71 / 4 | 32’ – 34’ | 345 |
| 20 Logistics Boulevard | KY | 2006 | 603,586 | Cummins, Inc. | 70 / 3 | 32’ | 192 |
| 5500 Southeast Delaware Avenue | IA | 2012 | 644,104 | The Toro Company | 56 / 3 | 28’ | 45 |
| 2150 Stanley Road | IN | 2007 | 493,500 | Siemens Corporation; M D Logistics, Inc. | 57 / 4 | 36’ | 174 |
| 16101 Queens Court | MD | 2016 | 220,800 | La-Z-Boy Incorporated | 29 / 2 | 32’ | 171 |
| 5 Logistics Drive | PA | 2016 | 205,090 | Transamerica Auto Parts | 28 / 2 | 32’ | 141 |
| Total/Wtd. Avg. | 8,209,036 | ||||||
Source:Appraisals.
| This is not a research report and was not prepared by any Underwriter’s research department. Please see additional important information and qualifications at the end of this Term Sheet. |
T-56
| Industrial – Warehouse Distribution | Loan #4 | Cut-off Date Balance: | $75,000,000 | |
| Various | ILPT Industrial Portfolio | Cut-off Date LTV: | 39.2% | |
| Various | U/W NCF DSCR: | 5.05x | ||
| U/W NOI Debt Yield: | 14.8% |
The following table presents certain information relating to the leases at the ILPT Industrial Portfolio Properties:
| Tenant Summary(1) | |||||||||
| Tenant Name | Credit Rating (Fitch/Moody’s/S&P)(2) | Tenant SF | Approx. % of SF | Annual UW Base Rent | Annual UW Base Rent PSF | % of Total Annual UW Base Rent | Lease Expiration | Renewal Options | Term. Option |
| Amazon | A+/A3/AA- | 2,052,638 | 25.0% | $8,122,434 | $3.96 | 24.5% | Various(3) | Various(3) | N |
| Procter & Gamble | NR/Aa3/AA- | 1,791,246 | 21.8% | $6,456,575 | $3.60 | 19.5% | 10/31/2024 | 3 x 5 year | N |
| Subaru of America Distribution | NR/NR/NR | 962,500 | 11.7% | $2,994,750 | $3.11 | 9.0% | 5/31/2024 | 2 x 5 year | N |
| Whirlpool Corporation | BBB/Baa1/BBB | 804,586 | 9.8% | $2,465,221 | $3.06 | 7.4% | 1/31/2024 | 3 x 2 year | N |
| The Toro Company(4) | NR/Baa3/BBB | 644,104 | 7.8% | $2,873,813 | $4.46 | 8.7% | 10/31/2034 | 3 x 5 year | Y |
| Cummins, Inc. | NR/A2/A+ | 603,586 | 7.4% | $2,334,949 | $3.87 | 7.1% | 10/31/2021 | 2 x 5 year | N |
| SKF USA | BBB+/Baa1/NR | 430,986 | 5.3% | $3,782,146 | $8.78 | 11.4% | 10/31/2038 | 2 x 10 year | N |
| Siemens Corporation | A/NR/A+ | 320,070 | 3.9% | $1,154,836 | $3.61 | 3.5% | 9/30/2028 | 3 x 5 year | N |
| La-Z-Boy Incorporated | NR/NR/NR | 220,800 | 2.7% | $1,364,544 | $6.18 | 4.1% | 1/31/2031 | 2 x 5 year | N |
| Transamerica Auto Parts | NR/NR/NR | 205,090 | 2.5% | $990,585 | $4.83 | 3.0% | 3/31/2025 | 2 x 5 year | N |
| M D Logistics, Inc.(5) | NR/NR/NR | 173,430 | 2.1% | $563,648 | $3.25 | 1.7% | 6/30/2027 | 1 x 5 year | Y |
| Subtotal/Wtd. Avg. | 8,209,036 | 100.0% | $33,103,501 | $4.03 | 100.0% | ||||
| Other Tenants | 0 | 0.0% | $0 | $0.00 | 0.0% | ||||
| Vacant Space | 0 | 0.0% | $0 | $0.00 | 0.0% | ||||
| Total/Wtd. Avg. | 8,209,036 | 100.0% | $33,103,501 | $4.03 | 100.0% | ||||
| (1) | Information is based on the underwritten rent roll. |
| (2) | Certain ratings are those of the parent company, whether or not the parent guarantees the lease. |
| (3) | Amazon is a tenant at the 5000 Commerce Way property (1,016,065 SF; expiring September 30, 2027; four, five-year renewal options) and the 4237-4255 Anson Boulevard property (1,036,573 SF; expiring April 30, 2021; five, five-year renewal options). |
| (4) | The Toro Company is currently in the process of expanding into an additional 194,000 SF. The tenant has the right to terminate its lease if the expansion date has not occurred within 270 days after November 1, 2019. The tenant may exercise its right to terminate its lease by giving notice no later than 30 days after the expiration of such 270 day period. At closing, the lender reserved $6,134,904 into a Toro Expansion Reserve, which will be used to pay the remaining project costs associated with the expansion. The table above gives effect to the expansion. |
| (5) | M D Logistics, Inc. has the one-time right to terminate its lease effective June 30, 2022, upon providing notice by September 30, 2021 and paying a termination fee of $546,399. |
The following table presents certain information relating to the lease rollover schedule at the ILPT Industrial Portfolio Properties:
| Lease Rollover Schedule(1)(2) | ||||||||
| Year | # of Leases Rolling | SF Rolling | UW Base Rent PSF Rolling | Approx. % of Total SF Rolling | Approx. Cumulative % of SF Rolling | Total UW Base Rent Rolling | Approx. % of Base Rent Rolling | Approx. Cumulative % of Total Rent Rolling |
| 2019 | 0 | 0 | $0.00 | 0.0% | 0.0% | $0 | 0.0% | 0.0% |
| 2020 | 0 | 0 | $0.00 | 0.0% | 0.0% | $0 | 0.0% | 0.0% |
| 2021 | 2 | 1,640,159 | $4.01 | 20.0% | 20.0% | $6,579,367 | 19.9% | 19.9% |
| 2022 | 0 | 0 | $0.00 | 0.0% | 20.0% | $0 | 0.0% | 19.9% |
| 2023 | 0 | 0 | $0.00 | 0.0% | 20.0% | $0 | 0.0% | 19.9% |
| 2024 | 3 | 3,558,332 | $3.35 | 43.3% | 63.3% | $11,916,546 | 36.0% | 55.9% |
| 2025 | 1 | 205,090 | $4.83 | 2.5% | 65.8% | $990,585 | 3.0% | 58.9% |
| 2026 | 0 | 0 | $0.00 | 0.0% | 65.8% | $0 | 0.0% | 58.9% |
| 2027 | 2 | 1,189,495 | $3.73 | 14.5% | 80.3% | $4,441,664 | 13.4% | 72.3% |
| 2028 | 1 | 320,070 | $3.61 | 3.9% | 84.2% | $1,154,836 | 3.5% | 75.8% |
| 2029 | 0 | 0 | $0.00 | 0.0% | 84.2% | $0 | 0.0% | 75.8% |
| 2030 & Beyond | 3 | 1,295,890 | $6.19 | 15.8% | 100.0% | $8,020,503 | 24.2% | 100.0% |
| Vacant | 0 | 0 | $0.00 | 0.0% | 100.0% | $0 | 0.0% | 100.0% |
| Total/Wtd. Avg. | 12 | 8,209,036 | $4.03 | 100.0% | $33,103,501 | 100.0% | ||
| (1) | Information is based on the underwritten rent roll. |
| (2) | Certain tenants may have lease termination options that are exercisable prior to the originally stated expiration date of the related lease and that are not considered in the lease rollover schedule. |
| This is not a research report and was not prepared by any Underwriter’s research department. Please see additional important information and qualifications at the end of this Term Sheet. |
T-57
| Industrial – Warehouse Distribution | Loan #4 | Cut-off Date Balance: | $75,000,000 | |
| Various | ILPT Industrial Portfolio | Cut-off Date LTV: | 39.2% | |
| Various | U/W NCF DSCR: | 5.05x | ||
| U/W NOI Debt Yield: | 14.8% |
The Markets. The ILPT Industrial Portfolio Properties are located across eight states. The ILPT Industrial Portfolio Properties are located in Indiana (four properties, 40.2% of NRA), Ohio (one property, 21.8% of NRA), and Virginia (one property, 12.4% of NRA), with the five remaining ILPT Industrial Portfolio Properties located in Missouri, Iowa, Kentucky, Maryland and Pennsylvania.
The following table presents the geographical distribution of the ILPT Industrial Portfolio Properties:
| ILPT Industrial Portfolio Summary(1) | ||||||||
State | Total GLA (SF) | Cut-off Date Allocated Loan Amount(2) | % of ALA(2) | 9/1/2019 Occupancy | Annual UW Base Rent | Annual UW Base Rent PSF | % of Total Annual UW Base Rent | Appraised Value |
| Indiana | 3,297,159 | $77,372,139 | 36.1% | 100.0% | $11,422,873 | $3.46 | 34.5% | $197,400,000 |
| Ohio | 1,791,246 | $37,039,854 | 17.3% | 100.0% | $6,456,575 | $3.60 | 19.5% | $94,500,000 |
| Virginia | 1,016,065 | $27,319,342 | 12.7% | 100.0% | $3,878,016 | $3.82 | 11.7% | $69,700,000 |
| Missouri | 430,986 | $24,183,693 | 11.3% | 100.0% | $3,782,146 | $8.78 | 11.4% | $61,700,000 |
| Iowa | 644,104 | $12,738,574 | 5.9% | 100.0% | $2,873,813 | $4.46 | 8.7% | $32,500,000 |
| Kentucky | 603,586 | $16,109,397 | 7.5% | 100.0% | $2,334,949 | $3.87 | 7.1% | $41,100,000 |
| Maryland | 220,800 | $11,562,706 | 5.4% | 100.0% | $1,364,544 | $6.18 | 4.1% | $29,500,000 |
| Pennsylvania | 205,090 | $8,074,296 | 3.8% | 100.0% | $990,585 | $4.83 | 3.0% | $20,600,000 |
| Total/Wtd. Avg. | 8,209,036 | $214,400,000 | 100.0% | 100.0% | $33,103,501 | $4.03 | 100.0% | $547,000,000 |
| (1) | Based on the underwritten rent roll. |
| (2) | Based on the Senior Notes. |
The following table presents submarket information for the ILPT Industrial Portfolio Properties:
| ILPT Industrial Portfolio Properties Market Statistics | ||||||
| Property | State | Submarket | Available Space (SF) | Vacancy Rate | Wtd. Avg. Asking Rent PSF (Monthly) | Under Construction (SF) |
| 1800 Union Airpark Boulevard | OH | Northwest | 113,345,685 | 4.3% | $4.48 | 2,536,131 |
| 4237-4255 Anson Boulevard | IN | Indianapolis Far Boone County Industrial | 23,211,042 | 5.3% | $4.42 | 3,397,082 |
| 5000 Commerce Way | VA | Dinwiddie County Industrial | 4,251,769 | 2.3% | $5.39 | 0 |
| 5142 & 5148 North Hanley Road | MO | North St. Louis County – Airport Industrial | 306,000,000 | 5.1% | $5.44 | 3,300,000 |
| 945 Monument Drive | IN | Indianapolis Far Boone County Industrial | 23,211,042 | 5.3% | $4.42 | 3,397,082 |
| 2801 Airwest Boulevard | IN | Indianapolis Plainfield Industrial | 42,994,858 | 4.5% | $4.59 | 1,897,965 |
| 20 Logistics Boulevard | KY | Northern Kentucky | 73,085,428 | 2.9% | $4.59 | 6,356,231 |
| 5500 Southeast Delaware Avenue | IA | Des Moines Northwest Industrial | 10,744,905 | 1.9% | $6.11 | 185,900 |
| 2150 Stanley Road | IN | Indianapolis Plainfield Industrial | 42,994,858 | 4.5% | $4.59 | 1,897,965 |
| 16101 Queens Court | MD | Bowie Industrial | 5,500,000 | 6.9% | $8.90 | 0 |
| 5 Logistics Drive | PA | Central PA | 130,626,700 | 7.0% | $4.64 | 7,244,588 |
Source: Appraisals.
| This is not a research report and was not prepared by any Underwriter’s research department. Please see additional important information and qualifications at the end of this Term Sheet. |
T-58
| Industrial – Warehouse Distribution | Loan #4 | Cut-off Date Balance: | $75,000,000 | |
| Various | ILPT Industrial Portfolio | Cut-off Date LTV: | 39.2% | |
| Various | U/W NCF DSCR: | 5.05x | ||
| U/W NOI Debt Yield: | 14.8% |
Operating History and Underwritten Net Cash Flow.The following table presents certain information relating to the historical operating performance and the Underwritten Net Cash Flow of the ILPT Industrial Portfolio:
| Cash Flow Analysis | |||||
| 2016 | 2017 | 2018 | UW | UW PSF | |
| Total Rental Income | $16,490,561 | $27,070,602 | $28,111,926 | $33,103,501 | $4.03 |
| Total Recoveries | $4,184,720 | $6,235,383 | $6,901,354 | $7,400,766 | $0.90 |
| Total Other Income | $162,138 | $322,484 | 322,484 | 331,034 | $0.04 |
| Vacancy | $0 | $0 | $0 | ($1,012,607) | ($0.12) |
| Effective Gross Income | $20,837,420 | $33,628,469 | $35,335,764 | $39,822,695 | $4.85 |
| Real Estate Taxes(1) | $3,755,367 | $5,009,001 | $4,817,082 | $5,410,051 | $0.66 |
| Insurance | $24,168 | $88,147 | $94,578 | $192,515 | $0.02 |
| Other Expenses | $738,627 | $1,271,465 | $1,533,954 | $2,383,213 | $0.29 |
| Total Expenses | $4,518,161 | $6,368,613 | $6,445,614 | $7,985,779 | $0.97 |
| Net Operating Income(2) | $16,319,258 | $27,259,856 | $28,890,150 | $31,836,916 | $3.88 |
| Capital Expenditures | $584,669 | $509,338 | $0 | $656,723 | $0.08 |
| TI/LC | $0 | $0 | $0 | $2,038,736 | $0.25 |
| Net Cash Flow | $15,734,589 | $26,750,518 | $28,890,150 | $29,141,457 | $3.55 |
| Occupancy %(3) | NAV | NAV | NAV | 97.5% | |
| NOI DSCR(4) | 2.83x | 4.73x | 5.01x | 5.52x | |
| NCF DSCR(4) | 2.73x | 4.64x | 5.01x | 5.05x | |
| NOI Debt Yield(4) | 7.6% | 12.7% | 13.5% | 14.8% | |
| NCF Debt Yield(4) | 7.3% | 12.5% | 13.5% | 13.6% | |
| (1) | Certain of the ILPT Industrial Portfolio Properties benefit from tax abatements or incentives. See“Description of the Mortgage Pool—Real Estate and Other Tax Considerations”in the Preliminary Prospectus. |
| (2) | The increase in UW Net Operating Income from 2018 Net Operating Income is primarily attributed to (i) $442,662 of rent steps through August 30, 2020, (ii) $955,208 in straight line rent taken through the earlier of the loan term or the lease term for seven tenants including Procter & Gamble, Amazon, SKF USA, The Toro Company, Whirlpool Corporation, Cummins, Inc. and Siemens Corporation, and (iii) recent leasing, including Transamerica Auto Parts ($966,999 in UW base rent) and SKF USA ($709,343 in UW base rent). |
| (3) | Historical occupancy was not provided by the borrower sponsor. Based on the underwritten rent roll dated September 1, 2019, the ILPT Industrial Portfolio is 100.0% occupied. |
| (4) | Debt service coverage ratios and debt yields are based on the ILPT Industrial Portfolio Senior Loan and exclude the ILPT Industrial Portfolio Subordinate Companion Loan. |
Escrows and Reserves.
Real Estate Taxes - Solely during the continuance of a Cash Management Sweep Period (as defined below), the ILPT Industrial Portfolio Borrowers are required to escrow monthly 1/12 of the annual estimated real estate taxes, provided that the ILPT Industrial Portfolio Borrowers will not be required to reserve amounts with the lender that are paid directly by a tenant under a lease that is in full force and effect and as to which no event of default by the tenant is continuing.
Insurance- Solely during the continuance of a Cash Management Sweep Period, the ILPT Industrial Portfolio Borrowers are required to escrow monthly 1/12 of the annual estimated insurance premiums (unless the ILPT Industrial Portfolio Borrowers maintain acceptable blanket insurance policies, which comply with the requirements under the ILPT Industrial Portfolio Whole Loan documents, and the insurance premiums payable in connection therewith have been prepaid for not less than one year in advance, or, for the period of coverage under the insurance policies as to which certificates are delivered at loan origination, if less than one year).
Toro Expansion Reserve- The ILPT Industrial Portfolio Borrowers were required to escrow the amount of $6,134,904 with the lender for the payment of capital expenditures to be incurred in connection with the expansion of the premises demised pursuant to The Toro Company lease.
Lockbox and Cash Management.The ILPT Industrial Portfolio Whole Loan is structured with a hard lockbox and springing cash management. The ILPT Industrial Portfolio Borrowers are required to direct each tenant at the ILPT Industrial Portfolio to deposit funds directly into the lockbox account, and to deposit any funds received by the ILPT Industrial Portfolio Borrowers and property manager, notwithstanding such direction, into the lockbox account within two business days of receipt. If no Cash Management Sweep Period exists, amounts on deposit in the lockbox account are required to be disbursed to the ILPT Industrial Portfolio Borrowers’ operating account on each business day. Upon the first occurrence of a Cash Management Sweep Period, the lender is required to establish, and the ILPT Industrial Portfolio Borrowers are required to cooperate to establish, a lender-controlled cash management account. If a Cash Management Sweep Period exists, funds on deposit in the lockbox account are required to be transferred to such cash management account, and applied to make monthly deposits to the tax reserve and insurance reserve as described above under “Escrows and Reserves,” to pay debt service on the ILPT Industrial Portfolio Whole Loan, to pay approved operating expenses in accordance with the annual budget (which is required to be reasonably approved by the lender during the continuance of a Cash Management Sweep Period) and extraordinary expenses approved by the lender, and to pay any remainder (i) during a Cash Management Sweep Period caused by a Partial Debt Yield Event (as defined below), 50% into the cash trap account, and 50% to the ILPT Industrial Portfolio Borrowers or (ii) during any Cash Management Sweep Period not caused solely by a Partial Debt Yield Event, 100% into the cash trap account. In each case, the amounts deposited in the cash trap account (such amounts, the “Cash Trap Funds”) are required to be held as additional collateral for the ILPT Industrial Portfolio Whole Loan during the continuance of the Cash Management Sweep Period; provided that, so long as no event of default is continuing under the ILPT Industrial Portfolio Whole Loan, funds in the cash trap account are required to be applied to pay any shortfalls in debt service and to make deposits into the tax and insurance reserves to the
| This is not a research report and was not prepared by any Underwriter’s research department. Please see additional important information and qualifications at the end of this Term Sheet. |
T-59
| Industrial – Warehouse Distribution | Loan #4 | Cut-off Date Balance: | $75,000,000 | |
| Various | ILPT Industrial Portfolio | Cut-off Date LTV: | 39.2% | |
| Various | U/W NCF DSCR: | 5.05x | ||
| U/W NOI Debt Yield: | 14.8% |
extent amounts on deposit in the cash management account are insufficient, and, if requested by the ILPT Industrial Portfolio Borrowers, to pay tenant improvements costs and allowances and leasing commissions for leases approved or deemed approved by the lender, capital expenditures set forth in the approved annual budget, management fees not to exceed 3.0% of operating income for the ILPT Industrial Portfolio Properties, and (subject to an annual cap of $100,000) REIT distributions to owners of the ILPT Industrial Portfolio Borrowers.
A “Cash Management Sweep Period” will commence (a) upon the occurrence of an event of default under the loan documents, (b) upon the occurrence of a Debt Yield Event (as defined below) or (c) upon the occurrence of a Partial Debt Yield Event and will terminate upon (x) with respect to clause (a), the cure of such event of default, (y) with respect to clause (b), the termination of such Debt Yield Event, or (z) with respect to clause (c), the termination of such Partial Debt Yield Event.
A “Debt Yield Event” will commence if the debt yield for the ILPT Industrial Portfolio Whole Loan is less than 6.75% at the end of two consecutive calendar quarters and will end if (i) the debt yield for the ILPT Industrial Portfolio Whole Loan is equal to or greater than 6.75% for two consecutive calendar quarters, or (ii) the ILPT Industrial Portfolio Borrowers have delivered to the lender a letter of credit in accordance with the loan documents in a face amount such that, if applied to reduce the principal balance of the ILPT Industrial Portfolio Whole Loan, would result in a debt yield of at least 6.75%.
A “Partial Debt Yield Event” will occur if the debt yield for the ILPT Industrial Portfolio Whole Loan is less than 7.25% at the end of two consecutive calendar quarters (and a Debt Yield Event does not exist) and will end if (i) the debt yield for the ILPT Industrial Portfolio Whole Loan is equal to or greater than 7.25% for two consecutive calendar quarters, (ii) the ILPT Industrial Portfolio Borrowers have delivered to the lender a letter of credit in accordance with the loan documents in a face amount such that, if applied to reduce the principal balance of the ILPT Industrial Portfolio Whole Loan, would result in a debt yield of at least 7.25%, or (iii) the amount of funds on deposit in the cash trap account are equal to, or in excess of, an amount equal to (x) $2.50 times (y) the rentable square footage of all vacant space at the ILPT Industrial Portfolio Properties.
Additional Secured Indebtedness (not including trade debts).In addition to the ILPT Industrial Portfolio Mortgage Loan, the ILPT Industrial Portfolio also secures the ILPT Industrial Portfolio Non-ServicedPari Passu Companion Loans, which have an aggregate Cut-off Date principal balance of $139,400,000, and the ILPT Industrial Portfolio Subordinate Companion Loan, which has a Cut-off Date principal balance of $135,600,000. The ILPT Industrial Portfolio Non-ServicedPari Passu Companion Loans accrue interest at the same rate as the ILPT Industrial Portfolio Mortgage Loan. The ILPT Industrial Portfolio Subordinate Companion Loan accrues interest at the rate of 4.40%per annum. The ILPT Industrial Portfolio Senior Loan is generally senior in right of payment to the ILPT Industrial Portfolio Subordinate Companion Loan. The holders of the ILPT Industrial Portfolio Mortgage Loan, the ILPT Industrial Portfolio Non-ServicedPari Passu Companion Loans and the ILPT Industrial Portfolio Subordinate Companion Loan have entered into a co-lender agreement which sets forth the allocation of collections on the ILPT Industrial Portfolio Whole Loan. See “Description of the Mortgage Pool—The Whole Loans—The ILPT Industrial Portfolio Pari Passu A/B Whole Loan” in the Preliminary Prospectus.
Mezzanine Loan and Preferred Equity.Not permitted.
Release of Property.The ILPT Industrial Portfolio Borrowers may obtain the release of an ILPT Industrial Portfolio Property (without payment of a yield maintenance premium) solely in connection with a casualty or condemnation, as follows. In the event that no event of default exists and a casualty or condemnation occurs as to which either (i) (a) the net proceeds of such casualty or condemnation are greater than 25% of the Casualty Release Value (as defined below) of the affected ILPT Industrial Portfolio Property (the “Affected Property”), and (b) the ILPT Industrial Portfolio Borrowers, after using commercially reasonable efforts are unable to satisfy conditions to restoration requiring that restoration be commenced as soon as reasonably practicable but no later than 90 days after net proceeds are made available to the ILPT Industrial Portfolio Borrowers, and the Affected Property and use thereof after restoration will be in compliance with legal requirements, any major lease at the Affected Property and other documents applicable to the Affected Property, and, with respect to the North Hanley Property (as defined below), the Bond Lease (as defined below), and (c) the lender does not make net proceeds available to the ILPT Industrial Portfolio Borrowers for restoration or (ii) the net proceeds of such casualty or condemnation are greater than 60% of the Casualty Release Value, then the ILPT Industrial Portfolio Borrowers may, on or prior to the second monthly payment date following the application of said net proceeds, prepay the ILPT Industrial Portfolio Whole Loan and obtain the release of the Affected Property. Such prepayment is subject to certain conditions set forth in the ILPT Industrial Portfolio Whole Loan documents, including, among others: (i) payment of an amount equal to (1) the greater of (A) the Casualty Release Value applicable to the Affected Property, and (B) the amount required to be paid under the REMIC Payment Requirement (as defined below), less (2) the portion of the net proceeds applied to the principal amount of the ILPT Industrial Portfolio Whole Loan applicable to such Affected Property (or zero if the amount in clause (2) is equal to or greater than the amount in clause (1)), (ii) transfer and conveyance of the Affected Property to a person other than the ILPT Industrial Portfolio Borrowers or any other loan party and (iii) payment of any additional amount required in order to satisfy the REMIC Payment Requirement.
The “Casualty Release Value” for each of the ILPT Industrial Portfolio Properties, as set forth in the ILPT Industrial Portfolio Whole Loan documents is as follows: 945 Monument Drive – $32,760,512; 16101 Queens Court – $18,875,686; 4237-4255 Anson Boulevard – $46,709,324; 5500 Southeast Delaware Avenue – $20,795,247; 5 Logistics Drive – $13,180,987; 1800 Union Airpark Boulevard – $60,466,179; 2150 Stanley Road –$19,323,583; 20 Logistics Boulevard – $26,297,989; 5142 & 5148 North Hanley Road – $39,478,976; 2801 Airwest Boulevard – $27,513,711; 5000 Commerce Way –$44,597,806, which in each case is 100% of the related allocated loan amount.
The “REMIC Payment Requirement” means, if immediately following a release of any Affected Property following a condemnation (but taking into account any proposed restoration on the remaining ILPT Industrial Portfolio Properties), the ratio of the unpaid principal balance of the ILPT Industrial Portfolio Whole Loan to the value of the remaining ILPT Industrial Portfolio Properties (including only real property) is greater than 125%, the principal balance of the ILPT Industrial Portfolio Whole Loan must be paid down by an amount equal to the least of the following amounts: (i) the net proceeds paid in connection with the related condemnation, (ii) the fair market value of the released Affected Property at the time of the release, or (iii) an amount such that the loan-to-value ratio of the ILPT Industrial Portfolio Whole Loan does not increase after the release, unless the ILPT Industrial Portfolio Borrowers deliver to the lender an opinion of counsel that if such amount is not paid, the securitization will not fail to maintain its status as a REMIC trust.
Right of First Offer/Right of First Refusal.With respect to each of the ILPT Industrial Portfolio Properties leased to Amazon, Amazon has both a right of first offer (“ROFO”) and a right of first refusal (“ROFR”) in connection with any offer for sale either of any such property or of a portfolio comprised solely of properties leased by the borrower to Amazon. The ROFO and ROFR do not apply to transfers to any affiliates of the ILPT Industrial Portfolio Borrowers, transfers to any joint venture or partnership with the ILPT Industrial Portfolio Borrowers, or transfers in connection with any debt or equity financing, pursuant to a foreclosure or deed in lieu thereof.
| This is not a research report and was not prepared by any Underwriter’s research department. Please see additional important information and qualifications at the end of this Term Sheet. |
T-60
| Industrial – Warehouse Distribution | Loan #4 | Cut-off Date Balance: | $75,000,000 | |
| Various | ILPT Industrial Portfolio | Cut-off Date LTV: | 39.2% | |
| Various | U/W NCF DSCR: | 5.05x | ||
| U/W NOI Debt Yield: | 14.8% |
Additionally, The Toro Company has a ROFO with respect to the ILPT Industrial Portfolio Property leased by it. Such ROFO is personal to The Toro Company and terminates automatically if the tenant transfers the lease. The ROFO does not apply to (i) any portfolio sale where the total sale price is over $500,000,000, (ii) any transfer in connection with any financing (or a foreclosure sale or deed in lieu thereof), (iii) a transfer to any entity that is a successor to the ILPT Industrial Portfolio Borrowers by merger or to a party whose property is managed by the ILPT Industrial Portfolio Borrowers’ property manager or (iv) a simultaneous tax-free exchange.
Ground Lease and Tax Abatement. With respect to the 5142 & 5148 North Hanley Road property (the “North Hanley Property”), in connection with the development of the North Hanley Property and in order to incentivize the sole tenant, SKF USA (“SKF”), to locate at the property, a fee interest in the North Hanley Property was obtained by St. Louis County, St. Louis County ground leased the North Hanley Property to a predecessor (the “Predecessor Entity”) of the ILPT Industrial Portfolio Borrowers (the “Bond Lease”), bonds were issued by St. Louis County (the “County Bonds”) to the Predecessor Entity as payment for its costs in constructing the property, and the Predecessor Entity, SKF, and St. Louis County entered into a performance agreement (the “Performance Agreement”). The applicable ILPT Industrial Portfolio Borrower has succeeded to the rights of the Predecessor Entity under the County Bonds, the Bond Lease and the Performance Agreement. The rent payable by the ILPT Industrial Portfolio Borrowers to the County under the Bond Lease is equal to the principal and interest payments due to the ILPT Industrial Portfolio Borrowers under the County Bonds and, therefore the rental payments to be made by the applicable ILPT Industrial Portfolio Borrower and bond payments owed to such ILPT Industrial Portfolio Borrower offset each other. During the term of the Bond Lease, the ILPT Industrial Portfolio Borrowers are entitled to purchase all or any portion of the North Hanley Property back from the County and terminate the Bond Lease, in return for tender and cancellation of all outstanding County Bonds. The ILPT Industrial Portfolio Borrowers are also required to repurchase the North Hanley Property and terminate the Bond Lease, upon expiration of the Bond Lease or completion of the final bond payment, in each case in return for tender and cancellation of all outstanding County Bonds. The Bond Lease expires on the earlier of (i) the date the SKF lease is terminated and (ii) December 31 of the 10th calendar year following the completion date (as defined in the Bond Lease, provided that it is deemed to be not later than December 31, 2016). According to the appraisal, the improvements at the North Hanley Property were completed in 2015, which would result in a final expiration date of December 31, 2025 for the Bond Lease.
In connection with the above arrangements, the related ILPT Industrial Portfolio Borrower is exempt from payment of real property taxes during the term of the Bond Lease. Under the Performance Agreement, in lieu of real property taxes, the related ILPT Industrial Portfolio Borrower and SKF are jointly liable to make contributions to a special allocation fund in St. Louis, Missouri. The contributions amount is dependent on the number of jobs offered by SKF during each annual test period (a 90 day period ending on September 30 of each year), and said amount begins increasing once SKF employs less than 388 full time employees. If SKF offers less than 350 jobs, (i) the contributions amount increases to equal 100% of the unabated real property taxes that would have otherwise been paid and (ii) the County Bonds structure and Bond Lease are effectively terminated as the related ILPT Industrial Portfolio Borrower is required to purchase the fee interest in the North Hanley Property (in return for tender and cancellation of the County Bonds) by December 31 of such year. SKF is obligated under its lease to pay both the unabated taxes (when due) and the contribution payments, as applicable. Accordingly, no real estate taxes or contribution payments were underwritten. According to the appraisal, estimated unabated taxes following the expiration of the tax abatement, which is assumed to occur on December 31, 2025, are expected to be $754,225 in 2026.
The County Bonds have been pledged to the lender to secure the ILPT Industrial Portfolio Whole Loan.
Letter of Credit.The ILPT Industrial Portfolio Borrowers have the right to deliver a letter of credit meeting the requirements of the ILPT Industrial Portfolio Whole Loan documents in lieu of deposits previously made to the Toro Expansion Reserve. In addition, a letter of credit may be delivered to cure a Debt Yield Event or Partial Debt Yield Event as described above under “Lockbox and Cash Management”.
Terrorism Insurance.The ILPT Industrial Portfolio Whole Loan documents require that the “all risk” insurance policy required to be maintained by the ILPT Industrial Portfolio Borrowers provide coverage for terrorism in an amount equal to the full replacement cost of the ILPT Industrial Portfolio and 18 months of business interruption insurance; provided that for so long as the Terrorism Risk Insurance Act of 2002, as extended and modified by the Terrorism Risk Insurance Program Reauthorization Act of 2015 (“TRIPRA”) (including any extensions thereof or if another federal governmental program is in effect relating to “acts of terrorism” which provides substantially similar protections as TRIPRA), is in effect and continues to cover both foreign and domestic acts of terrorism, the lender is required to accept terrorism insurance with coverage against “covered acts” within the meaning of TRIPRA (or such other program).
| This is not a research report and was not prepared by any Underwriter’s research department. Please see additional important information and qualifications at the end of this Term Sheet. |
T-61
| Office – Suburban | Loan #5 | Cut-off Date Balance: | $73,600,000 | |
| Various | 360 North Crescent Drive | Cut-off Date LTV: | 52.2% | |
| Beverly Hills, CA 90210 | UW NCF DSCR: | 2.31x | ||
| UW NOI Debt Yield: | 8.3% |
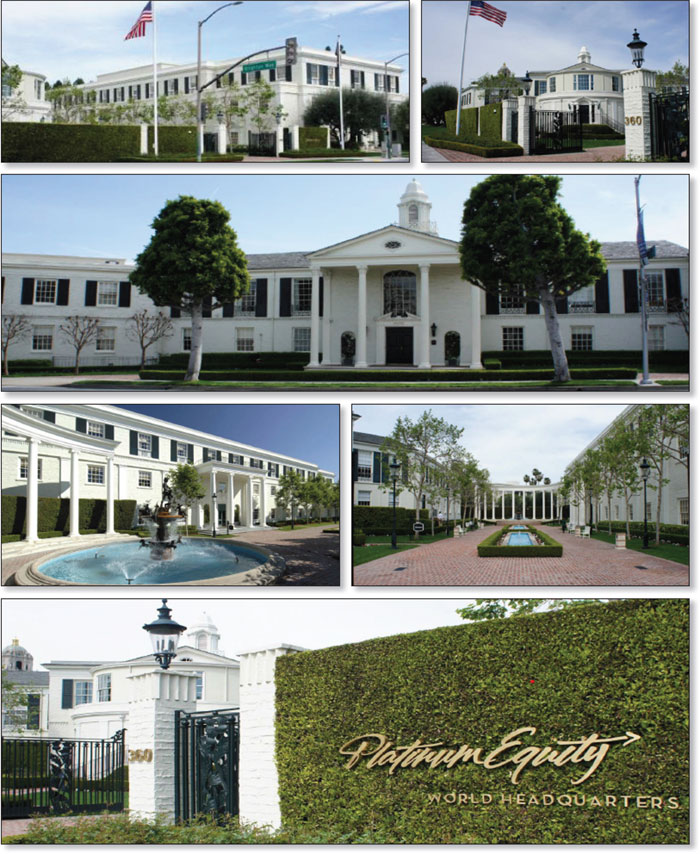
| This is not a research report and was not prepared by any Underwriter’s research department. Please see additional important information and qualifications at the end of this Term Sheet. |
T-62
| Office – Suburban | Loan #5 | Cut-off Date Balance: | $73,600,000 | |
| Various | 360 North Crescent Drive | Cut-off Date LTV: | 52.2% | |
| Beverly Hills, CA 90210 | UW NCF DSCR: | 2.31x | ||
| UW NOI Debt Yield: | 8.3% |
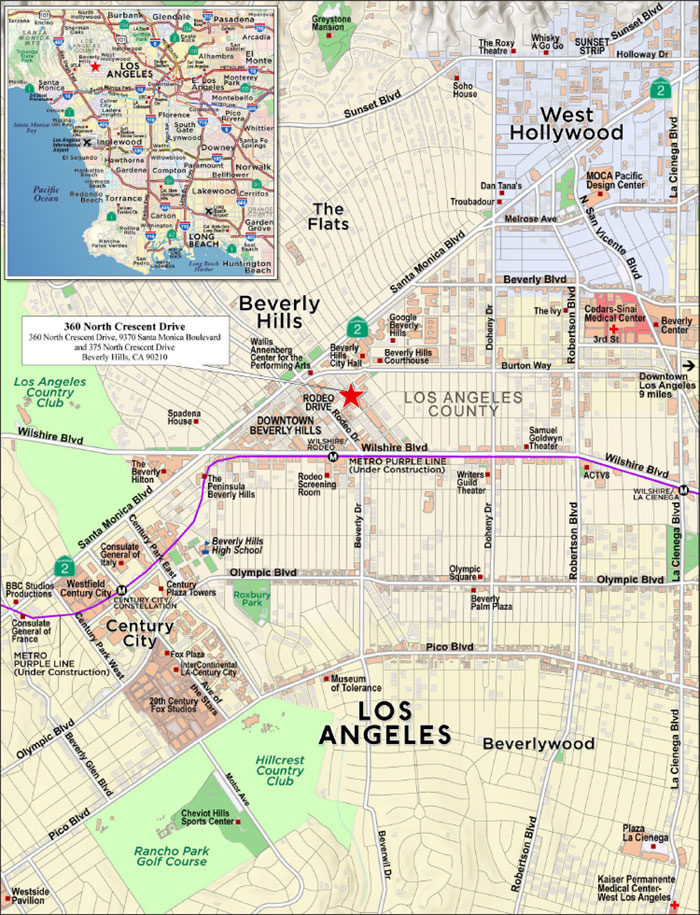
| This is not a research report and was not prepared by any Underwriter’s research department. Please see additional important information and qualifications at the end of this Term Sheet. |
T-63
| Mortgage Loan No. 5 – 360 North Crescent Drive |
| Mortgage Loan Information | Property Information | |||||
| Mortgage Loan Seller: | WFB | Single Asset/Portfolio: | Single Asset | |||
| Credit Assessment (KBRA /Fitch/S&P): | NR/NR/NR | Location: | Beverly Hills, CA 90210 | |||
| Original Balance(1): | $73,600,000 | General Property Type: | Office | |||
| Cut-off Date Balance(1): | $73,600,000 | Detailed Property Type: | Suburban | |||
| % of Initial Pool Balance: | 5.7% | Title Vesting: | Fee | |||
| Loan Purpose: | Refinance | Year Built/Renovated: | 1938/2003 | |||
| Borrower Sponsor: | Tom Gores; The Gores Trust | Size: | 123,848 SF | |||
| Guarantor: | Tom Gores; The Gores Trust | Cut-off Date Balance per SF(1): | $1,038 | |||
| Mortgage Rate: | 3.4500% | Maturity Balance per SF(1): | $1,038 | |||
| Note Date: | 9/30/2019 | Property Manager: | Tenant-managed | |||
| First Payment Date: | 11/11/2019 | Underwriting and Financial Information | ||||
| Maturity Date: | 10/11/2029 | UW NOI(4): | $10,663,140 | |||
| Original Term to Maturity: | 120 months | UW NOI Debt Yield(1): | 8.3% | |||
| Original Amortization Term: | 0 months | UW NOI Debt Yield at Maturity(1): | 8.3% | |||
| IO Period: | 120 months | UW NCF DSCR(1): | 2.31x | |||
| Seasoning: | 2 months | Most Recent NOI(4): | $8,488,260 (12/31/2018) | |||
| Prepayment Provisions(2): | LO(24); YM1(2); DEF/YM1(87); O(7) | 2nd Most Recent NOI: | $7,922,910 (12/31/2017) | |||
| Lockbox/Cash Mgmt Status: | Hard/In Place | 3rd Most Recent NOI: | $7,769,225 (12/31/2016) | |||
| Additional Debt Type(1): | Pari Passu | Most Recent Occupancy: | 100.0% (12/1/2019) | |||
| Additional Debt Balance(1): | $55,000,000 | 2nd Most Recent Occupancy: | 100.0% (12/31/2018) | |||
| Future Debt Permitted (Type): | No (N/A) | 3rd Most Recent Occupancy: | 100.0% (12/31/2017) | |||
| Reserves(3) | Appraised Value (as of)(5): | $246,500,000 (8/29/2019) | ||||
| Type | Initial | Monthly | Cap | Appraised Value per SF: | $1,990 | |
| Real Estate Taxes: | $69,628 | $69,628 | N/A | Cut-off Date LTV Ratio(1): | 52.2% | |
| Insurance: | $0 | Springing | N/A | Maturity Date LTV Ratio(1): | 52.2% | |
| Recurring Replacements: | $600,000 | Springing | N/A | |||
| TI/LC: | $0 | Springing | N/A | |||
| Sources and Uses | ||||||
| Sources | Proceeds | % of Total | Uses | Proceeds | % of Total | |
| Whole Loan Amount(1): | $128,600,000 | 100.0% | Loan Payoff Amount(6): | $77,437,345 | 60.2% | |
| Upfront Reserves: | $669,628 | 0.5% | ||||
| Closing Costs: | $1,489,975 | 1.2% | ||||
| Return of Equity: | $49,003,051 | 38.1% | ||||
| Total Sources: | $128,600,000 | 100.0% | Total Uses: | $128,600,000 | 100.0% | |
| (1) | The 360 North Crescent Drive Mortgage Loan (as defined below) is part of the 350 North Crescent Drive Whole Loan (as defined below). The Cut-off Date Balance Per SF, Maturity Date Balance Per SF, UW DSCR based on NOI/NCF, UW Debt Yield based on NOI/NCF, UW Debt Yield at Maturity based on NOI/NCF, Cut-off Date LTV Ratio and Maturity Date LTV Ratio numbers presented above are based on the 360 North Crescent Drive Whole Loan. |
| (2) | Defeasance of the 360 North Crescent Drive Whole Loan is permitted at any time after the earlier to occur of (a) September 30, 2022 and (b) two years from the closing date of the securitization of the last note of the 360 North Crescent Drive Whole Loan to be securitized (“Defeasance Lockout Release Date”), and prior to April 11, 2029. The assumed defeasance lockout period of 26 payments is based on the closing date of this transaction in December 2019. In addition, prepayment of the 360 North Crescent Drive Whole Loan (along with any applicable yield maintenance premiums) is permitted on any date on or after November 11, 2021 (“Prepayment Lockout Release Date”) |
| (3) | See “Escrows” section. |
| (4) | See “Operating History and Underwritten Net Cash Flow” below for a discussion of the increase from most recent NOI to UW NOI. |
| (5) | The appraiser also concluded to a Hypothetical Market Value “As Dark” of $177,000,000 as of August 29, 2019 and a Land Value of $109,000,000. The appraiser provided a separate allocation of value for the Parking Parcel of $29,000,000. The “as-is” and “As Dark” values each include the Parking Parcel allocated value and the Land Value includes a $21,000,000 allocated land value for the Parking Parcel. |
| (6) | The previous loan included a $65,000,000 A-Note and an $8,000,000 subordinate B-Note. The loan payoff includes approximately $6,301,169 in prepayment premiums related to both the A and B notes. |
The Mortgage Loan. The fifth largest mortgage loan (the “360 North Crescent Drive Mortgage Loan”) is part of a whole loan (the “360 North Crescent Drive Whole Loan”) that is evidenced by twopari passu promissory notes in the aggregate original principal amount of $128,600,000. The 360 North Crescent Drive Whole Loan is secured by a first priority fee mortgage encumbering two adjacent office buildings and a parking garage located in Beverly Hills, California (the “360 North Crescent Drive Property”). The 360 North Crescent Drive Mortgage Loan is evidenced by the controlling promissory note A-1 in the original principal amount of $73,600,000. The non-controlling A-2 Note is being contributed to the BANK 2019-BNK22 securitization trust. The 360 North Crescent Drive Whole Loan will be serviced pursuant to the pooling and servicing agreement for the BANK 2019-BNK23 securitization trust. See “Description of the Mortgage Pool—The Whole Loans—The Serviced Pari Passu Whole Loans” and “Pooling and Servicing Agreement” in the Preliminary Prospectus. The proceeds of the 360 North Crescent Drive Whole Loan were primarily used pay off existing debt, fund upfront reserves, pay closing costs and return equity to the borrower sponsor.
| This is not a research report and was not prepared by any Underwriter’s research department. Please see additional important information and qualifications at the end of this Term Sheet. |
T-64
| Office – Suburban | Loan #5 | Cut-off Date Balance: | $73,600,000 | |
| Various | 360 North Crescent Drive | Cut-off Date LTV: | 52.2% | |
| Beverly Hills, CA 90210 | UW NCF DSCR: | 2.31x | ||
| UW NOI Debt Yield: | 8.3% |
| 360 North Crescent Drive | ||||
| Note | Original Balance | Cut-off Date Balance | Anticipated Note Holder | Controlling Piece |
| A-1 | $73,600,000 | $73,600,000 | BANK 2019-BNK23 | Yes |
| A-2 | $55,000,000 | $55,000,000 | BANK 2019-BNK22 | No |
| Total | $128,600,000 | $128,600,000 | ||
The Borrower and the Borrower Sponsor. The borrower is 360 N. Crescent, LLC (the “360 North Crescent Drive Borrower”), a Delaware limited liability company and single purpose entity with two independent directors. Legal counsel to the 360 North Crescent Drive Borrower delivered a non-consolidation opinion in connection with the origination of the 360 North Crescent Drive Whole Loan.
The borrower sponsors and non-recourse carve-out guarantors are Tom Gores and The Gores Trust (collectively, the “360 North Crescent Drive Guarantor”). Tom Gores is the founder, CEO and Chairman of Platinum Equity, the sole tenant at the 360 North Crescent Drive Property. Mr. Gores oversees more than 25 companies and is also the owner of the NBA Detroit Pistons basketball team.
The 360 North Crescent Drive Whole Loan documents provide a cap on the 360 North Crescent Drive Guarantor’s liability, with respect to environmental liabilities, of $40,000,000. The limit will not apply to any successor or substitute guarantor unless the successor or substitute is (i) a sibling, parent, spouse, child, grandchild or other lineal descendant (“Immediate Family Member”) of Tom Gores, or (ii) wholly owned (directly or indirectly) and controlled by Tom Gores or an Immediate Family Member.
Various affiliates of Tom Gores were involved in a Chapter 11 bankruptcy filing related to an auto parts casting company in 2015 (see “Description of the Mortgage Pool – Loan Purpose; Default History, Bankruptcy Issues and Other Proceedings” in the Preliminary Prospectus).
The Property. The 360 North Crescent Drive Property consists of two adjacent office buildings (the “Office Parcel”) and a parking garage, which is located on a separate parcel (the “Parking Parcel”). The Office Parcel, totaling 123,848 SF, features a campus-like setting and has served as the headquarters for several companies including Litton Industries, Global Crossing, Music Corporation of America and currently Platinum Equity. As of December 1, 2019, the 360 North Crescent Drive Property was 100.0% leased to Platinum Equity.
The Office Parcel consists of two adjacent office buildings, the “South Building” and the “North Building”:
| ● | The South Building, containing 100,395 SF (81.1% of net rentable area), is a three-story office building completed in 1968 and extensively renovated in 1999 and 2003. The South Building includes two levels of subterranean parking with 104 spaces. The South Building has high-quality features and amenities, including a bar/restaurant, two kitchen facilities, two gyms, high quality office finishes, an executive parking area with polished floors, and extensive landscaping. |
| ● | The North Building is a two-story office building completed in 1938, containing 23,453 SF (18.9% of net rentable area). While fully leased to Platinum Equity, the North Building is currently vacant and was reportedly previously subleased to Paradigm Talent Agency, a national talent agency controlled by the brother of the borrower sponsor for the 360 North Crescent Drive Whole Loan. |
The Parking Parcel is situated directly west of the Office Parcel (across Crescent Drive) with pedestrian access provided via a signalized crosswalk. The Parking Parcel comprises a four-story, 432-space parking structure, which, together with the 104 parking spaces at the South Building, equates to a parking ratio of approximately 4.3 spaces per 1,000 SF of rentable area. Per the terms of its lease, Platinum Equity is entitled to 436 of the 536 total parking spaces, consisting of 104 spaces within the South building subterranean parking and an additional 332 spaces in the Parking Parcel, which are leased at a monthly rental rate of $200 per space; and the remaining 100 spaces are designated for public use. The Parking Parcel is managed by LAZ Parking and generates additional income from transient parking, validation, and monthly reserved and unreserved parking. The 360 North Crescent Drive Borrower has the right to release the Parking Parcel from the collateral of the 360 North Crescent Drive Whole Loan (see “Partial Release” section).
Major Tenant.
Platinum Equity (123,848 SF, 100.0% of net rentable area; 100.0% of underwritten base rent).Platinum Equity is a global investment firm which specializes in mergers, acquisitions and operations of companies that provide services and solutions in diverse industries. Founded in 1995, the company has completed over 250 acquisitions. Currently, the company has a portfolio of approximately 40 operating companies. Tom Gores, the CEO and Chairman of Platinum Equity (and also the borrower sponsor of the 360 North Crescent Drive Whole Loan) acquired the 360 North Crescent Drive Property in 2003 and the company has been headquartered at the property since. Platinum Equity executed a new 15-year lease in September 2019 at an initial rental rate of $78.00 per square foot, triple net, with 3% annual increases, and three, five-year renewal options at the fair market rental rate following its lease expiration in September 2034. The entity on the lease is Platinum Equity, LLC.
| This is not a research report and was not prepared by any Underwriter’s research department. Please see additional important information and qualifications at the end of this Term Sheet. |
T-65
| Office – Suburban | Loan #5 | Cut-off Date Balance: | $73,600,000 | |
| Various | 360 North Crescent Drive | Cut-off Date LTV: | 52.2% | |
| Beverly Hills, CA 90210 | UW NCF DSCR: | 2.31x | ||
| UW NOI Debt Yield: | 8.3% |
The following table presents certain information relating to the tenancy at the 360 North Crescent Drive Property:
| Tenant Summary | ||||||||
| Tenant Name | Credit Rating (Fitch/Moody’s/S&P) | Tenant SF(2) | Approx. % of Total SF | Annual UW Rent(3) | % of Total Annual UW Rent | Annual UW Rent PSF(3) | Lease Expiration(4) | Termination Option (Y/N) |
| Platinum Equity(1) | NR/NR/NR | 123,848 | 100.0% | $9,949,948 | 100.0% | $80.34 | 9/30/2034 | N |
| Subtotal/Wtd. Avg. | 123,848 | 100.0% | $9,949,948 | 100.0% | $80.34 | |||
| Vacant Space | 0 | 0.0% | $0 | 0.0% | $0.0 | |||
| Total/Wtd. Avg. | 123,848 | 100.0% | $9,949,948 | 100.0% | $80.34 | |||
| (1) | Platinum Equity is affiliated with Tom Gores, the borrower sponsor of the 360 North Crescent Drive Whole Loan. |
| (2) | Platinum Equity is not currently utilizing the North Building (23,453 SF). |
| (3) | The Annual UW Rent and Annual UW Base Rent PSF shown above give credit for the rent bump occurring in October 2020. Platinum Equity currently pays a base rental rate of $78.00 per square foot. |
| (4) | Platinum Equity has three, 5-year renewal options remaining with 12 months’ notice, at fair market rental rate. |
The following table presents certain information relating to the lease rollover schedule at the 360 North Crescent Drive Property:
| Lease Rollover Schedule(1) | ||||||||
| Year | # of Leases Rolling | SF Rolling | Annual UW Rent PSF Rolling | Approx. % of Total SF Rolling | Approx. Cumulative % of SF Rolling | Total UW Rent Rolling | Approx. % of Total Rent Rolling | Approx. Cumulative % of Total Rent Rolling |
| MTM | 0 | 0 | $0.00 | 0.0% | 0.0% | $0 | 0.0% | 0.0% |
| 2019 | 0 | 0 | $0.00 | 0.0% | 0.0% | $0 | 0.0% | 0.0% |
| 2020 | 0 | 0 | $0.00 | 0.0% | 0.0% | $0 | 0.0% | 0.0% |
| 2021 | 0 | 0 | $0.00 | 0.0% | 0.0% | $0 | 0.0% | 0.0% |
| 2022 | 0 | 0 | $0.00 | 0.0% | 0.0% | $0 | 0.0% | 0.0% |
| 2023 | 0 | 0 | $0.00 | 0.0% | 0.0% | $0 | 0.0% | 0.0% |
| 2024 | 0 | 0 | $0.00 | 0.0% | 0.0% | $0 | 0.0% | 0.0% |
| 2025 | 0 | 0 | $0.00 | 0.0% | 0.0% | $0 | 0.0% | 0.0% |
| 2026 | 0 | 0 | $0.00 | 0.0% | 0.0% | $0 | 0.0% | 0.0% |
| 2027 | 0 | 0 | $0.00 | 0.0% | 0.0% | $0 | 0.0% | 0.0% |
| 2028 | 0 | 0 | $0.00 | 0.0% | 0.0% | $0 | 0.0% | 0.0% |
| 2029 | 0 | 0 | $0.00 | 0.0% | 0.0% | $0 | 0.0% | 0.0% |
| 2030 & Beyond | 1 | 123,848 | $80.34 | 100.0% | 100.0% | $9,949,948 | 100.0% | 100.0% |
| Vacant | 0 | 0 | $0.00 | 0.0% | 100.0% | $0 | 0.0% | 100.0% |
| Total/Wtd. Avg. | 1 | 123,848 | $80.34 | 100.0% | $9,949,948 | 100.0% | ||
| (1) | Information is based on the underwritten rent roll. |
The Market. The 360 North Crescent Drive Property is located on the south side of Santa Monica Boulevard in Beverly Hills, California. The asset is located approximately 0.3 miles from the retail shops and restaurants along Rodeo Drive and approximately 1.0 mile from luxury hotels including The Waldorf Astoria Beverly Hills, The Beverly Hilton and the Peninsula Beverly Hills. The 360 North Crescent Drive Property is situated approximately 10.8 miles north of the Los Angeles International Airport and 5.7 miles northeast of the Santa Monica Airport. The asset is proximate to several major interstates including Interstate 405 (approximately 3.3 miles west) and Interstate 10 (2.0 miles south).
According to a third-party market research report, the estimated 2019 population within a one-, three- and five-mile radius of the 360 North Crescent Drive Property was approximately 30,826, 258,925 and 712,299, respectively; and the estimated 2019 average household income within the same radii was approximately $132,173, $121,839 and $107,145, respectively.
According to a third-party market research report, the 360 North Crescent Drive Property is situated within the Beverly Hills Office submarket of the Los Angeles Office Market. As of October 4, 2019, the Beverly Hills Office submarket reported a total inventory of approximately 11.2 million SF with a 9.4% vacancy rate and average asking rent of $66.19 per square foot, triple net. The submarket vacancy rate has averaged 8.6% from 2015 through the third quarter of 2019. The appraiser identified a submarket subset of “Top Tier” buildings on the Westside of Los Angeles. This subset consisted of 19 premier, class A buildings, totaling approximately 8.3 million SF with a weighted average vacancy rate of 9.7% and asking rental rates ranging from $71.40 to $96.00 per square foot, full service gross.
| This is not a research report and was not prepared by any Underwriter’s research department. Please see additional important information and qualifications at the end of this Term Sheet. |
T-66
| Office – Suburban | Loan #5 | Cut-off Date Balance: | $73,600,000 | |
| Various | 360 North Crescent Drive | Cut-off Date LTV: | 52.2% | |
| Beverly Hills, CA 90210 | UW NCF DSCR: | 2.31x | ||
| UW NOI Debt Yield: | 8.3% |
The following table presents certain information relating to the appraisal’s market rent conclusion for the 360 North Crescent Drive Property:
| Market Rent Summary | |
| Office – Floor 1 | |
| Market Rent (PSF) | $78.00 |
| Lease Term (Years) | 7 |
| Lease Type (Reimbursements) | NNN |
| Rent Increase Projection | 3.0%per annum |
| Source: | Appraisal. |
The following table presents information relating to comparable office property sales for the 360 North Crescent Drive Property:
| Property Name/Location | Sale Date | Year Built/ Renovated | Total NRA (SF) | Occupancy | Sale Price | Adjusted Sale Price(1) | Sale Price PSF | Appraiser’s Adjusted Sale Price PSF(1) |
3003 & 3301 Exposition Blvd Santa Monica, CA | Jul. 2019 | 2000/N/A | 201,922 | 100% | $220,000,000 | $313,584,866 | $1,090 | $1,553 |
11975-12015 Bluff Creek Dr. Los Angeles, CA | May. 2019 | 2015/N/A | 205,130 | 100% | $235,000,000 | $334,977,290 | $1,146 | $1,633 |
8942 Wilshire Blvd Beverly Hills, CA | Apr. 2019 | 1989/N/A | 82,886 | 100% | $107,500,000 | $153,173,328 | $1,297 | $1,848 |
2900 & 3000 Olympic Blvd Santa Monica, CA | Mar. 2019 | 1959/N/A | 275,968 | 95% | $346,000,000 | $545,036,800 | $1,254 | $1,975 |
9336-9348 Civic Center Dr. Beverly Hills, CA | Dec. 2018 | 1925/N/A | 234,361 | 100% | $244,200,000 | $366,306,243 | $1,042 | $1,563 |
9460 Wilshire Blvd Beverly Hills, CA | Jan. 2018 | 1959/N/A | 97,035 | 91% | $132,000,000 | $188,733,075 | $1,360 | $1,945 |
9665 Wilshire Blvd Beverly Hills, CA | Jul. 2017 | 1972/N/A | 171,114 | 85% | $184,700,000 | $279,086,934 | $1,079 | $1,631 |
1299 Ocean Ave Santa Monica, CA | Apr. 2017 | 1980/N/A | 205,713 | 79% | $285,000,000 | $454,831,443 | $1,385 | $2,211 |
100 N Crescent Dr Beverly Hills, CA | Jul. 2015 | 1989/N/A | 116,207 | 97% | $130,000,000 | $180,004,643 | $1,119 | $1,549 |
Source: Appraisal.
| (1) | Adjusted sale price for all cash equivalency, lease-up and/or deferred maintenance (as applicable). Information obtained from the appraisal. |
| This is not a research report and was not prepared by any Underwriter’s research department. Please see additional important information and qualifications at the end of this Term Sheet. |
T-67
| Office – Suburban | Loan #5 | Cut-off Date Balance: | $73,600,000 | |
| Various | 360 North Crescent Drive | Cut-off Date LTV: | 52.2% | |
| Beverly Hills, CA 90210 | UW NCF DSCR: | 2.31x | ||
| UW NOI Debt Yield: | 8.3% |
Operating History and Underwritten Net Cash Flow.The following table presents certain information relating to the historical operating performance and Underwritten Net Cash Flow at 360 North Crescent Drive Property:
| Cash Flow Analysis | ||||||
| 2015 | 2016 | 2017 | 2018(1) | UW(1) | UW $ per SF | |
| Gross Potential Base Rent | $12,617,693(2) | $11,891,734(2) | $12,269,360(2) | $12,908,457(2) | $9,949,948(3) | $80.34 |
| Rent Average Benefit | $0 | $0 | $0 | $0 | $0 | $0.00 |
| Grossed Up Vacant Space | $0 | $0 | $0 | $0 | $0 | $0.00 |
| Total Recoveries | $0(2) | $0(2) | $0(2) | $0(2) | $3,306,703 | $26.70 |
| Parking/Other Income | $240,100(2) | $286,399(2) | $478,708(2) | $392,414(2) | $1,384,726(4) | $11.18 |
| Less Vacancy & Credit Loss | $0 | $0 | $0 | $0 | ($497,497)(5) | ($4.02) |
| Effective Gross Income | $12,857,793 | $12,178,133 | $12,748,068 | $13,300,871 | $14,143,880 | $114.20 |
| Real Estate Taxes | $694,873 | $720,607 | $744,156 | $759,863 | $1,516,411 | $12.24 |
| Insurance(6) | $571,085 | $504,548 | $486,959 | $457,388 | $104,819 | $0.85 |
| Other Operating Expenses(7) | $2,896,466 | $3,183,753 | $3,594,043 | $3,595,360 | $1,859,509 | $15.01 |
| Total Expenses | $4,162,424 | $4,408,908 | $4,825,158 | $4,812,611 | $3,480,740 | $28.10 |
| Net Operating Income | $8,695,369 | $7,769,225 | $7,922,910 | $8,488,260 | $10,663,140 | $86.10 |
| Capital Expenditures | $0 | $0 | $0 | $0 | $83,692 | $0.68 |
| TI/LC | $0 | $0 | $0 | $0 | $155,530 | $1.26 |
| Net Cash Flow | $8,695,369 | $7,769,225 | $7,922,910 | $8,488,260 | $10,423,919 | $84.17 |
| Occupancy % | 100.0% | 100.0% | 100.0% | 100.0% | 100.0% | |
| NOI DSCR(8) | 1.93x | 1.72x | 1.76x | 1.88x | 2.36x | |
| NCF DSCR(8) | 1.93x | 1.72x | 1.76x | 1.88x | 2.31x | |
| NOI Debt Yield(8) | 6.8% | 6.0% | 6.2% | 6.6% | 8.3% | |
| NCF Debt Yield(8) | 6.8% | 6.0% | 6.2% | 6.6% | 8.1% | |
| (1) | Increase in UW net operating income is primarily due to Platinum Equity executing a new lease on September 30, 2019 at a base rental rate of $78.00 per square foot. |
| (2) | Historical Base Rent numbers shown include base rent, expense reimbursements, and parking income related to the Platinum Equity lease. |
| (3) | Base rent includes credit for Platinum Equity’s October 2020 rent bump totaling $289,804. |
| (4) | The UW Parking/Other line item includes parking income related to the Platinum Equity lease and public users (see “The Property” section above). |
| (5) | The UW economic vacancy is 5.0%. The 360 North Crescent Drive Property was 100.0% leased as of December 1, 2019. |
| (6) | Underwritten Insurance is based on the actual premiums in place, excluding earthquake insurance premium as it is not required by the 360 North Crescent Drive Whole Loan documents. Historical Insurance included earthquake insurance premiums. |
| (7) | The 360 North Crescent Drive Property is occupied by an affiliate of the borrower sponsor, and the historical operating statements include certain business and capital expenses, which were not considered relevant for the lender’s underwriting. The UW Other Operating Expenses line item is based on appraisal assumptions. |
| (8) | The debt service coverage ratios and debt yields are based on the 360 North Crescent Drive Whole Loan. |
Escrows and Reserves.
Real Estate Taxes - The 360 North Crescent Drive Borrower is required to deposit an upfront real estate tax reserve of $69,628 and ongoing monthly escrows in an amount equal to one-twelfth of the real estate taxes that the lender estimates will be payable during the next 12 months (initially $69,628).
Insurance- The 360 North Crescent Drive Whole Loan documents require ongoing monthly insurance reserves in an amount equal to one-twelfth of the insurance premiums that the lender estimates will be payable for the renewal of the coverage during the next 12 months. Notwithstanding the foregoing, the 360 North Crescent Drive Whole Loan documents do not require ongoing monthly escrows for insurance so long as (i) no event of default has occurred and is continuing, (ii) the 360 North Crescent Drive Borrower provides lender with evidence that the 360 North Crescent Drive Property is insured pursuant to a blanket policy and such policy is in full force and effect, and (iii) the 360 North Crescent Drive Borrower provides lender with evidence of timely payment of insurance premiums and renewals.
Replacement Reserve – The 360 North Crescent Drive Borrower is required to deposit an upfront replacement reserve of $600,000. Upon the occurrence of a Cash Sweep Event Period (as defined below), or if the 360 North Crescent Drive Borrower fails to maintain the property in good and safe condition and make all repairs required by the annual budget, the 360 North Crescent Drive Whole Loan documents require ongoing monthly replacement reserves of $2,580.
Rollover Reserve – Upon the occurrence and continuance of a Cash Sweep Event Period, or if the 360 North Crescent Drive Borrower fails to pay leasing expenses when due and payable, the 360 North Crescent Drive Whole Loan documents require ongoing monthly leasing reserves of $20,641.
Lockbox and Cash Management. The 360 North Crescent Drive Whole Loan documents require that the 360 North Crescent Drive Borrower establish and maintain a lender-controlled lockbox account, which is already in-place, and that the 360 North Crescent Drive Borrower direct all tenants to pay rent directly into such lockbox account. The 360 North Crescent Drive Whole Loan documents also require that all rents received by the 360 North Crescent Drive Borrower or the property manager be deposited into the lockbox account within one business day of receipt. All funds in the lockbox account are required to be swept each business day into the cash management account controlled by the lender and, on each payment date, all funds in the cash management account are required to be applied in accordance with the 360 North Crescent Drive Whole Loan documents. Prior to the occurrence of a
| This is not a research report and was not prepared by any Underwriter’s research department. Please see additional important information and qualifications at the end of this Term Sheet. |
T-68
| Office – Suburban | Loan #5 | Cut-off Date Balance: | $73,600,000 | |
| Various | 360 North Crescent Drive | Cut-off Date LTV: | 52.2% | |
| Beverly Hills, CA 90210 | UW NCF DSCR: | 2.31x | ||
| UW NOI Debt Yield: | 8.3% |
Cash Sweep Event Period, any excess cash flow will be disbursed to the 360 North Crescent Drive Borrower. During a Cash Sweep Event Period, any excess cash flow remaining after satisfaction of the waterfall items are required to be swept to an excess cash flow subaccount to be held by the lender as additional security for the 360 North Crescent Drive Loan during the continuance of the Cash Sweep Event Period.
A “Cash Sweep Event Period” will commence upon the earlier of the following:
| (i) | the occurrence of an event of default under the 360 North Crescent Drive Whole Loan documents; |
| (ii) | the debt service coverage ratio based on a hypothetical 30-year amortization schedule (“Amortizing DSCR”) being less than 1.10x based on the trailing twelve month period; or |
| (iii) | the occurrence of a Platinum Trigger Event (as defined below) |
A Cash Sweep Event Period will end upon the occurrence of the following:
| ● | with regard to clause (i), the cure of such event of default; |
| ● | with regard to clause (ii), the Amortizing DSCR for the 360 North Crescent Drive Whole Loan being equal to or greater than 1.15x for two consecutive quarters; |
| ● | with regard to clause (iii), a Platinum Trigger Event Cure (as defined below). |
A “Platinum Trigger Event” will commence upon either of the following:
| (i) | Platinum Equity ceasing to operate, vacating or abandoning 25% or more of its space, provided that a closing for a commercially reasonable period in connection with restoration in connection with casualty or condemnation, required repairs or replacements, will not be considered a cessation of operation; or |
| (ii) | the commencement of any bankruptcy action with respect to Platinum Equity, any successor tenant or any Acceptable Replacement Tenant (as defined below). |
A “Platinum Trigger Event Cure” will occur upon the following:
| ● | with regard to clause (i), (A) Platinum Equity occupying and re-commencing operations at all or a portion of the applicable space for a period of two consecutive calendar quarters, and/or all or a portion of the applicable space being leased to one or more Acceptable Replacement Tenants and (B) at least 76% of the space leased to Platinum Equity being leased and occupied; and |
| ● | with regard to clause (ii), either (a) the applicable bankruptcy action having been terminated and the applicable Platinum Lease having been affirmed, assumed or assigned in a manner satisfactory to the lender or (b) the Platinum Equity lease having been assumed and assigned to a third party approved by the lender. |
“Acceptable Replacement Tenants” means tenants (i) that are reasonably acceptable to the lender, (ii) that have executed a replacement lease reasonably acceptable to lender, (iii) that have delivered an acceptable estoppel confirming that such tenant is open for business and paying full contractual rent with no abatement, and that no default exists under the lease and all borrower obligations have been complied with in full, and (iv) with respect to which, the 360 North Crescent Drive Borrower has paid for all outstanding tenant improvement and leasing commission costs and expenses under the related replacement lease, or such costs have been escrowed with lender.
Mezzanine Loan and Preferred Equity. Not permitted.
Release of Property.Following the Defeasance Lockout Release Date or the Prepayment Lockout Release Date but prior to April 11, 2019, as applicable, the 360 North Crescent Drive Borrower may obtain the release of the Parking Parcel, provided that, among other things, and in accordance with the 360 North Crescent Drive Whole Loan Documents,
| (i) | the Parking Parcel will be conveyed to an unaffiliated third party; |
| (ii) | following the release, the Amortizing DSCR is greater than the greater of (a) the Amortizing DSCR immediately prior to the release and (b) 1.51x; |
| (iii) | following the release, the NCF Debt Yield is greater than the greater of (a) the NCF Debt Yield immediately prior to the release and (b) 8.1%; |
| (iv) | following the release, the Loan to Value Ratio (“LTV”) is not greater than the lesser of (a) the LTV immediately prior to the release and (b) 52.2%; |
| (v) | either (a) defeasance of the 360 North Crescent Drive Whole Loan in the amount equal to the Release Price (as defined below) or (b) prepayment of the 360 North Crescent Drive Whole Loan in the amount equal to the Release Price, along with any yield maintenance premiums, as applicable; |
| (vi) | the lender has received reasonably satisfactory evidence that, following the release of the Parking Parcel, the 360 North Crescent Drive Property complies with all applicable zoning and parking requirements and that the release will not have an adverse impact on the property or any tenant at the property and will not violate any lease; |
| (vii) | a legal opinion covering compliance in all respects with all laws, rules and regulations governing REMICs has been delivered; and |
| (viii) | rating agency confirmation is received. |
| This is not a research report and was not prepared by any Underwriter’s research department. Please see additional important information and qualifications at the end of this Term Sheet. |
T-69
| Office – Suburban | Loan #5 | Cut-off Date Balance: | $73,600,000 | |
| Various | 360 North Crescent Drive | Cut-off Date LTV: | 52.2% | |
| Beverly Hills, CA 90210 | UW NCF DSCR: | 2.31x | ||
| UW NOI Debt Yield: | 8.3% |
“Release Price” means 110% of the Parking Parcel allocated loan amount of $15,130,000.
The 360 North Crescent Drive Borrower may satisfy the conditions in clauses (ii), (iii), and (iv) above by partially prepaying the 360 North Crescent Drive Whole Loan in an amount that would be necessary to satisfy those conditions along with any applicable yield maintenance fees.
Ground Lease. None.
Right of First Refusal/Right of First Offer.None.
Letter of Credit. None.
Terrorism Insurance.The 360 North Crescent Drive Whole Loan documents require that the “all risk” insurance policy required to be maintained by the 360 North Crescent Drive Borrower provide coverage for terrorism in an amount equal to the full replacement cost of the 360 North Crescent Drive Property, as well as business interruption insurance covering no less than the 18-month period following the occurrence of a casualty event, together with a 6-month extended period of indemnity.
| This is not a research report and was not prepared by any Underwriter’s research department. Please see additional important information and qualifications at the end of this Term Sheet. |
T-70
(THIS PAGE INTENTIONALLY LEFT BLANK)
T-71
| Office – Suburban | Loan #6 | Cut-off Date Balance: | $66,300,000 | |
| 12440 Imperial Highway | Norwalk Government Center | Cut-off Date LTV: | 63.5% | |
| Norwalk, CA 90650 | UW NCF DSCR: | 2.10x | ||
| UW NOI Debt Yield: | 8.5% |

| This is not a research report and was not prepared by any Underwriter’s research department. Please see additional important information and qualifications at the end of this Term Sheet. |
T-72
| Office – Suburban | Loan #6 | Cut-off Date Balance: | $66,300,000 | |
| 12440 Imperial Highway | Norwalk Government Center | Cut-off Date LTV: | 63.5% | |
| Norwalk, CA 90650 | UW NCF DSCR: | 2.10x | ||
| UW NOI Debt Yield: | 8.5% |
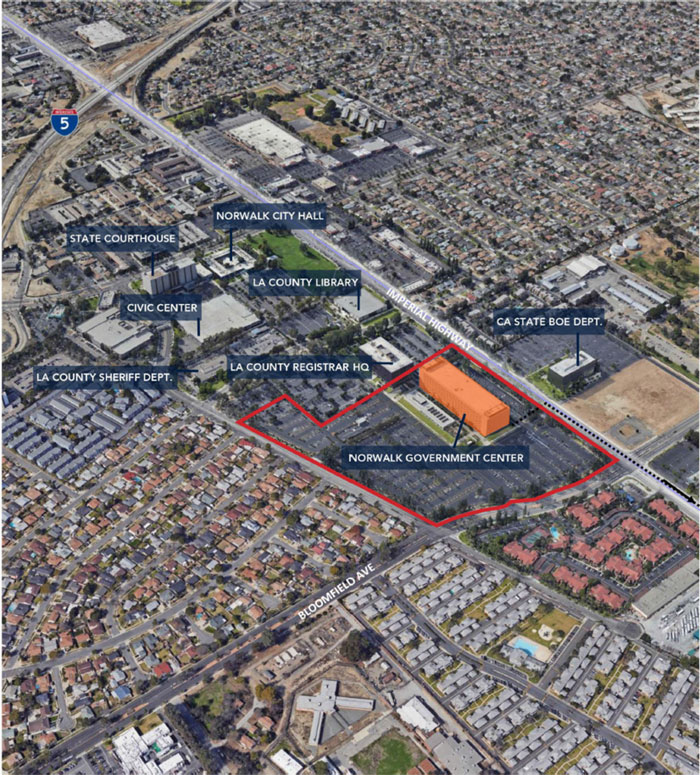
| This is not a research report and was not prepared by any Underwriter’s research department. Please see additional important information and qualifications at the end of this Term Sheet. |
T-73
| Office – Suburban | Loan #6 | Cut-off Date Balance: | $66,300,000 | |
| 12440 Imperial Highway | Norwalk Government Center | Cut-off Date LTV: | 63.5% | |
| Norwalk, CA 90650 | UW NCF DSCR: | 2.10x | ||
| UW NOI Debt Yield: | 8.5% |

| This is not a research report and was not prepared by any Underwriter’s research department. Please see additional important information and qualifications at the end of this Term Sheet. |
T-74
| Mortgage Loan No. 6 – Norwalk Government Center |
| Mortgage Loan Information | Property Information | |||||
| Mortgage Loan Seller: | WFB | Single Asset/Portfolio: | Single Asset | |||
| Credit Assessment (KBRA/Fitch/S&P): | NR/NR/NR | Location: | Norwalk, CA 90650 | |||
| Original Balance: | $66,300,000 | General Property Type: | Office | |||
| Cut-off Date Balance: | $66,300,000 | Detailed Property Type: | Suburban | |||
| % of Initial Pool Balance: | 5.2% | Title Vesting: | Fee | |||
| Loan Purpose: | Recapitalization | Year Built/Renovated: | 1982/2005 | |||
| Borrower Sponsors: | Robert Sonnenblick; Nelson Del Rio | Size: | 451,455 SF | |||
| Guarantors: | Robert Sonnenblick; Nelson Del Rio | Cut-off Date Balance per SF: | $147 | |||
| Mortgage Rate: | 3.8450% | Maturity Date Balance per SF: | $147 | |||
| Note Date: | 10/31/2019 | Property Manager: | CBRE, Inc. | |||
| First Payment Date: | 12/11/2019 | Underwriting and Financial Information | ||||
| Maturity Date: | 11/11/2029 | UW NOI(2): | $5,652,036 | |||
| Original Term to Maturity: | 120 months | UW NOI Debt Yield: | 8.5% | |||
| Original Amortization Term: | 0 months | UW NOI Debt Yield at Maturity: | 8.5% | |||
| IO Period: | 120 months | UW NCF DSCR: | 2.10x | |||
| Seasoning: | 1 month | Most Recent NOI(2): | $4,697,543 (9/30/2019 TTM) | |||
| Prepayment Provisions: | LO (25); DEF (91); O (4) | 2nd Most Recent NOI: | $4,612,584 (12/31/2018) | |||
| Lockbox/Cash Mgmt Status: | Hard/In Place | 3rd Most Recent NOI: | $5,280,956 (12/31/2017) | |||
| Additional Debt Type: | N/A | Most Recent Occupancy: | 82.7% (11/1/2019) | |||
| Additional Debt Balance: | N/A | 2nd Most Recent Occupancy: | 81.2% (12/31/2018) | |||
| Future Debt Permitted (Type): | No (N/A) | 3rd Most Recent Occupancy: | 83.2% (12/31/2017) | |||
| Reserves(1) | Appraised Value (as of): | $104,400,000 (8/12/2019) | ||||
| Type | Initial | Monthly | Cap | Appraised Value per SF: | $231 | |
| RE Taxes: | $164,570 | $82,885 | N/A | Cut-off Date LTV Ratio: | 63.5% | |
| Insurance: | $104,588 | $9,508 | N/A | Maturity Date LTV Ratio: | 63.5% | |
| Recurring Replacements: | $0 | $13,163(1) | (1) | |||
| TI/LC: | $4,000,000 | $47,027 | $2,750,000(1) | |||
| Energy Retrofit Reserve: | $4,305,000 | $0 | N/A | |||
| Economic Holdback Reserve: | $4,525,000 | $0 | N/A | |||
| Existing TI/LC Obligations Reserve: | $1,787,104 | $0 | N/A | |||
| Springing Parking Reserve: | $0 | Springing | N/A | |||
| Sources and Uses | ||||||
| Sources | Proceeds | % of Total | Uses | Proceeds | % of Total | |
| Net Mortgage Loan Amount: | $61,775,000 | 93.2% | LoanPayoff Amount: | $37,597,047 | 56.7% | |
| Economic Holdback | $4,525,000 | 6.8% | Partner Buyout: | $10,500,000 | 15.8% | |
| Upfront Reserves: | $14,886,262 | 22.5% | ||||
| Closing Costs: | $921,470 | 1.4% | ||||
| Return of Equity: | $2,395,221 | 3.6% | ||||
| Total Sources: | $66,300,000 | 100.0% | Total Uses: | $66,300,000 | 100.0% | |
| (1) | See“Escrows and Reserves” below for further discussion of reserve requirements. |
| (2) | See “Operating History and Underwritten Net Cash Flow” below for a discussion of the increase from the Most Recent NOI to the UW NOI. |
The Mortgage Loan. The sixth largest mortgage loan (the “Norwalk Government Center Mortgage Loan”) is evidenced by a promissory note in the original principal amount of $66,300,000 which is secured by a first priority fee mortgage encumbering an office building located in Norwalk, California (the “Norwalk Government Center Property”).
The Borrower and the Borrower Sponsors. The borrower is Sonnenblick Del Rio Norwalk LLC (the “Norwalk Government Center Borrower”), a Delaware limited liability company and single purpose entity with two independent directors.
The borrower sponsors and non-recourse carveout guarantors are Robert Sonnenblick and Nelson Del Rio. Mr. Sonnenblick has over 30 years of real estate and real estate finance experience and is currently the principal of Sonnenblick, LLC, a real estate development firm that focuses on office facilities for state, county and municipal public agencies. The firm’s projects include offices for the County of Los Angeles, a New Jersey mall, retail shopping center in Los Angeles and hotels in California and Florida. Mr. Del Rio is the Chairman and CEO of Sonnenblick – Del Rio Development, Inc., a Los Angeles-based real estate development firm focused on office properties for government tenants.
| This is not a research report and was not prepared by any Underwriter’s research department. Please see additional important information and qualifications at the end of this Term Sheet. |
T-75
| Office – Suburban | Loan #6 | Cut-off Date Balance: | $66,300,000 | |
| 12440 Imperial Highway | Norwalk Government Center | Cut-off Date LTV: | 63.5% | |
| Norwalk, CA 90650 | UW NCF DSCR: | 2.10x | ||
| UW NOI Debt Yield: | 8.5% |
The Property. The Norwalk Government Center Property is a 451,455 SF, seven-story, Class A office building located in Norwalk, California, approximately 15.4 miles southeast of the Los Angeles central business district. Constructed in 1982, renovated in 2005 and situated on a 20.1-acre site, the Norwalk Government Center Property contains 1,728 onsite surface parking spaces (resulting in a parking ratio of approximately 3.8 spaces per 1,000 SF of net rentable area; see “Release of Property” section for a discussion of the release option for a portion of the parking lot space). According to the appraisal, the Norwalk Government Center Borrower plans to complete various energy efficiency upgrades to reduce the quantity of electricity being consumed (see “Escrows and Reserves” below for a further discussion of the retrofit work).
As of November 1, 2019, the Norwalk Government Center Property was 82.7% leased to 18 tenants, and the property averaged approximately 89.9% occupancy from 2005 to 2018. Approximately 79.9% of the net rentable area and 97.1% of underwritten base rent is attributed to 11 investment grade tenants; and 9 tenants accounting for approximately 63.0% of the net rentable area and 82.3% of underwritten base rent have been at the Norwalk Government Center Property since at least January 2007.
According to the appraisal, the Norwalk Government Center Borrower has provided a conceptual plan to construct an additional 600,000 SF of office space within two seven-story buildings on a release parcel at the northeast corner of the Norwalk Government Center Property (see “Release of Property” below for further information). According to the appraisal, any specific development plan would require further review and study, including traffic impact. The lender provides no assurances as to whether or not any such development will ever be effectuated (see the “Release of Property”section below for certain anti-poaching provisions set forth in the Norwalk Government Center Mortgage Loan documents).
Major Tenants.
County of LA Sheriff’s Dept. (98,840 SF, 21.9% of NRA; 30.2% of underwritten base rent). Los Angeles County (rated AA/Aa2/AA by Fitch/Moody’s/S&P) is one of the nation’s largest counties with 4,084 square miles, and has the largest population of any county in the nation, with nearly 10 million residents who account for approximately 27% of California’s population. As a subdivision of the state, the county is charged with providing numerous services including law enforcement, tax collection, public health protection, public social services, elections and flood control. The County of LA Sheriff’s Department employs over 10,000 sworn deputies, and over 8,000 civilian staff. The Norwalk Government Center Property includes the Records and Identification Bureau for the County of LA Sheriff’s Department, which provides correctional programs, disaster services, environmental services, holiday assistance, law enforcement services, substance abuse services and youth services for the unincorporated areas of Los Angeles County and contracting cities. The entity on the lease is County of Los Angeles, the tenant has been at the Norwalk Government Center Property since February 2001, recently renewed its lease for seven years and has no renewal options remaining following its October 2026 lease expiration.
Accenture, LLP (59,396 SF, 13.2% of NRA; 10.4% of underwritten base rent). Accenture, LLP (“Accenture”; rated A+/Aa3/A+ by Fitch/Moody’s/S&P) is a global professional services company, providing a broad range of services and solutions in strategy, consulting, digital, technology and operations. In the event that Accenture’s contract with the County of Los Angeles is terminated by the County of Los Angeles, Accenture has the option to terminate its lease at any time by providing 9 months prior notice a termination fee of two months current base rent and operating expenses. The entity on the lease is Accenture LLP, which has one, 1-year renewal option remaining following its April 2024 lease expiration.
County of LA DPSS (58,642 SF, 13.0% of NRA; 17.9% of underwritten base rent). The Los Angeles County (rated AA/Aa2/AA by Fitch/Moody’s/S&P) Department of Public Social Services (“County of LA DPSS”) is the second largest County department in Los Angeles County and the largest social service agency in the United States. The County of LA DPSS has an annual budget of over $3.9 billion and provides services to one out of every three residents in Los Angeles County via a workforce of nearly 14,000 employees with the capacity to serve residents in 19 languages. The entity on the lease is County of Los Angeles, the tenant has been at the Norwalk Government Center Property since February 2001, recently renewed its lease for seven years and has no renewal options remaining following its October 2026 lease expiration.
| This is not a research report and was not prepared by any Underwriter’s research department. Please see additional important information and qualifications at the end of this Term Sheet. |
T-76
| Office – Suburban | Loan #6 | Cut-off Date Balance: | $66,300,000 | |
| 12440 Imperial Highway | Norwalk Government Center | Cut-off Date LTV: | 63.5% | |
| Norwalk, CA 90650 | UW NCF DSCR: | 2.10x | ||
| UW NOI Debt Yield: | 8.5% |
The following table presents certain information relating to the tenancy at the Norwalk Government Center Property:
| Tenant Summary(1) | |||||||||
| Tenant Name | Credit Rating (Fitch/Moody’s/S&P)(2) | Tenant SF | Approx. % of Total SF | Annual UW Rent(3) | % of Total Annual UW Rent | Annual UW Rent PSF(3) | Lease Expiration | Extension Options | Term. Option (Y/N) |
| County of LA Sheriff’s Dept. | AA/Aa2/AA | 98,840 | 21.9% | $2,406,971 | 30.2% | $24.35 | 10/31/2026 | N | N |
| Accenture, LLP(4) | A+/Aa3/A+ | 59,396 | 13.2% | $826,817(4) | 10.4% | $13.92(4) | 4/30/2024 | 1, 1-year | Y(5) |
| County of LA DPSS | AA/Aa2/AA | 58,642 | 13.0% | $1,428,061 | 17.9% | $24.35 | 10/31/2026 | N | N |
| USA – GSA/FBI | AAA/Aaa/AA+ | 42,803 | 9.5% | $785,310 | 9.9% | $18.35 | 1/19/2028 | N | Y(6) |
| County of LA Children’s & Family | AA/Aa2/AA | 40,795 | 9.0% | $948,201 | 11.9% | $23.24 | 4/30/2020 | N | Y(7) |
| Subtotal/Wtd. Avg. | 300,476 | 66.6% | $6,395,361 | 80.3% | $21.28 | Termination Option | |||
| Other Tenants | 72,736 | 16.1% | $1,567,241 | 19.7% | $21.55 | ||||
| Vacant Space | 78,243 | 17.3% | $0 | 0.0% | $0.0 | ||||
| Total/Wtd. Avg. | 451,455 | 100.0% | $7,962,601 | 100.0% | $21.34(8) | ||||
| (1) | Information obtained from the underwritten rent roll. |
| (2) | Certain ratings are those of the parent company or government whether or not the parent or government guarantees the lease. |
| (3) | Annual UW Rent and Annual UW Rent PSF includes straight line rent averaging for investment grade tenants through their respective lease terms totaling $518,466. The current contractual base rental rates for the tenants shown on the table above are as follows: County of LA Sheriff’s Dept.: $22.20 PSF; Accenture: $12.99 PSF; County of LA DPSS: $22.20 PSF; USA – GSA/FBI: $18.35 PSF; and County of LA Children’s & Family: $23.24 PSF. |
| (4) | Accenture’s lease is a triple net lease, while the majority of leases at the Norwalk Government Center Property (including all other leases shown on the table above) are gross leases. |
| (5) | In the event that Accenture’s contract with the County of Los Angeles is terminated by the County of Los Angeles, Accenture will have the option to terminate its lease at any time by providing 9 months prior notice and a termination fee of two months current base rent and operating expenses. |
| (6) | USA – GSA/FBI may terminate its lease at any time beginning on December 1, 2023 by giving the Norwalk Government Center Borrower 120 days’ notice. |
| (7) | County of LA Children’s & Family may terminate its lease at any time by giving the Norwalk Government Center Borrower 90 days’ notice. |
| (8) | Total/Wtd. Avg. Annual UW Rent PSF excludes vacant space. |
The following table presents certain information relating to the lease rollover schedule at the Norwalk Government Center Property:
| Lease Rollover Schedule(1)(2) | ||||||||
| Year | # of Leases Rolling | SF Rolling | Annual UW Rent PSF Rolling | Approx. % of Total SF Rolling | Approx. Cumulative % of SF Rolling | Total UW Rent Rolling | Approx. % of Total Rent Rolling | Approx. Cumulative % of Total Rent Rolling |
| MTM | 5 | 7,141 | $8.74 | 1.6% | 1.6% | $62,388 | 0.8% | 0.8% |
| 2019 | 0 | 0 | $0.00 | 0.0% | 1.6% | $0 | 0.0% | 0.8% |
| 2020 | 4 | 71,302 | $22.65 | 15.8% | 17.4% | $1,614,967 | 20.3% | 21.1% |
| 2021 | 1 | 2,064 | $21.55 | 0.5% | 17.8% | $44,478 | 0.6% | 21.6% |
| 2022 | 0 | 0 | $0.00 | 0.0% | 17.8% | $0 | 0.0% | 21.6% |
| 2023 | 1 | 3,428 | $18.74 | 0.8% | 18.6% | $64,232 | 0.8% | 22.4% |
| 2024 | 2 | 65,135 | $14.64 | 14.4% | 33.0% | $953,537 | 12.0% | 34.4% |
| 2025 | 0 | 0 | $0.00 | 0.0% | 33.0% | $0 | 0.0% | 34.4% |
| 2026 | 2 | 157,482 | $24.35 | 34.9% | 67.9% | $3,835,032 | 48.2% | 82.6% |
| 2027 | 1 | 13,276 | $21.58 | 2.9% | 70.8% | $286,453 | 3.6% | 86.2% |
| 2028 | 1 | 42,803 | $18.35 | 9.5% | 80.3% | $785,310 | 9.9% | 96.0% |
| 2029 | 0 | 0 | $0.00 | 0.0% | 80.3% | $0 | 0.0% | 96.0% |
| 2030 & Beyond | 1 | 10,581 | $29.88 | 2.3% | 82.7% | $316,203 | 4.0% | 100.0% |
| Vacant | 0 | 78,243 | $0.00 | 17.3% | 100.0% | $0 | 0.0% | 100.0% |
| Total/Wtd. Avg.(3) | 18 | 451,455 | $21.34 | 100.0% | $7,962,601 | 100.0% | ||
| (1) | Information is based on the underwritten rent roll. |
| (2) | Certain tenants may have lease termination options that are exercisable prior to the originally stated expiration date of the subject lease and that are not considered in the Lease Rollover Schedule. |
| (3) | Total/Wtd. Avg. Annual UW Rent PSF Rolling excludes vacant space. |
The Market. The Norwalk Government Center Property is located at the intersection of Imperial Highway and Bloomfield Avenue in Norwalk, California. The Norwalk Government Center Property is situated approximately 0.4 miles west of the Norwalk/Santa Fe Springs Transportation Center (which provides Metrolink train access southbound to San Diego County via the Orange County line and access southeast bound to Riverside County via the 91/Perris Valley line) 0.8 miles northeast of Interstate 5 (provides access northbound to Los Angeles and southbound to San Diego) and 20.8 miles east of the Los Angeles International Airport. The Norwalk Government Center Property is situated approximately 0.2 miles southeast of the intersection of
| This is not a research report and was not prepared by any Underwriter’s research department. Please see additional important information and qualifications at the end of this Term Sheet. |
T-77
| Office – Suburban | Loan #6 | Cut-off Date Balance: | $66,300,000 | |
| 12440 Imperial Highway | Norwalk Government Center | Cut-off Date LTV: | 63.5% | |
| Norwalk, CA 90650 | UW NCF DSCR: | 2.10x | ||
| UW NOI Debt Yield: | 8.5% |
Imperial Highway and Balsam Street, which, according to a third party market research provider, had a daily traffic count of approximately 35,095 vehicles as of 2018.
The Norwalk Civic Center is situated approximately 0.4 miles west of the Norwalk Government Center Property and includes city hall, a library and the Los Angeles County Southeast District’s Superior Court. According to the appraisal, the new Metrolink Green Line Station (which will provide access to Los Angeles International Airport) will be under construction in 2020 and is planned to be approximately 400 yards from the Norwalk Government Center.
According to a third party market research provider, the estimated 2019 population within a three- and five-mile radius of the Norwalk Government Center Property was approximately 209,421 and 634,675, respectively; and the estimated 2019 average household income within the same radii was approximately $83,433 and $87,458, respectively.
Submarket Information – According to a third-party market research report, the Norwalk Government Center Property is situated within the Southeast Los Angeles submarket of the Los Angeles – CA office market. As of October 30, 2019, the Southeast Los Angeles submarket reported a total inventory of approximately 9.7 million SF with a 5.5% vacancy rate and average asking rent of $27.81 PSF, gross. The submarket vacancy rate has decreased from 7.5% in 2012 and averaged 5.9% from 2012 through 2018. According to a third-party market research report, over half of tenants that occupy more than 50,000 SF of office space within the Southeast Los Angeles submarket are government-related tenants.
The following table presents certain information relating to the appraisal’s market rent conclusion for the Norwalk Government Center Property:
| Market Rent Summary | |||
| Office | Basement | Loading Dock | |
| Market Rent (PSF) | $24.00 - $30.00 | $18.00 - $21.00 | N/A |
| Lease Term (Years) | 7 | 5 | 5 |
| Lease Type (Reimbursements) | FSG | FSG | Gross |
| Rent Increase Projection | 3.0%per annum | 3.0%per annum | 3.0%per annum |
| Tenant Improvements (New Tenant) (PSF) | $25.00 | $15.00 | $0.00 |
| Tenant Improvements (Renewal) (PSF) | $10.00 | $7.50 | $0.00 |
Source:Appraisal
The following table presents certain information relating to comparable office properties to the Norwalk Government Center Property:
| Comparable Leases Summary | ||||||||
| Property Name/Location | Year Built/ Renovated | Total GLA (SF) | Occupancy | Distance from Subject | Lease Date/Term | Lease Area (SF) | Annual Base Rent PSF | Lease Type |
Norwalk Corporate Plaza 12501 Imperial Highway Norwalk, CA | 1977/1994 | 112,813 | 100% | 0.4 Miles | Oct. 2017 /11.0 Yrs | 20,000 | $27.12 | FSG |
Heritage Corporate Center 10350 Heritage Park Drive Santa Fe Springs, CA | 1986/N/A | 40,046 | 83% | 2.3 Miles | Jul. 2019 /2.1 Yrs | 7,042 | $26.40 | FSG |
Cerritos Office Center III 17785 Center Court Drive Cerritos, CA | 1991/N/A | 142,618 | 92% | 3.6 Miles | May 2019 /4.4 Yrs Jan. 2019 / 5.9 Yrs | 6,664 5,122 | $34.20 $34.20 | FSG FSG |
Cerritos Towne Center 17777 Center Court Drive Cerritos, CA | 2002/N/A | 165,678 | 94% | 3.5 Miles | Jun. 2019 / 7.7 Yrs Oct. 2018 / 5.3 Yrs | 6,360 3,339 | $34.80 $34.80 | FSG FSG |
Plaza Tower 18000 Studebaker Road Cerritos, CA | 1987/N/A | 187,105 | 86% | 5.4 Miles | Apr. 2018 / 7.7 Yrs | 21,914 | $28.44 | FSG |
Centerpointe La Palma 4 Centerpointe Drive La Palma, CA | 1988/N/A | 82,662 | 100% | 5.6 Miles | Feb. 2019 / 6.7 Yrs | 6,114 | $35.40 | FSG |
4000 Metro 4000 Metropolitan Drive Orange, CA | 1985/2007 | 182,935 | 100% | 15.4 Miles | Jul. 2018 / 15.0 Yrs | 59,927 | $30.48 | FSG |
SGV Valley Corporate Campus 4910 Rivergrade Road – Bldg 3 Irwindale, CA | 1988/N/A | 287,930 | 55% | 16.3 Miles | May 2019 / 10.0 Yrs | 31,282 | $27.00 | FSG |
Source:Appraisal
| This is not a research report and was not prepared by any Underwriter’s research department. Please see additional important information and qualifications at the end of this Term Sheet. |
T-78
| Office – Suburban | Loan #6 | Cut-off Date Balance: | $66,300,000 | |
| 12440 Imperial Highway | Norwalk Government Center | Cut-off Date LTV: | 63.5% | |
| Norwalk, CA 90650 | UW NCF DSCR: | 2.10x | ||
| UW NOI Debt Yield: | 8.5% |
The following table presents information relating to comparable office property sales for the Norwalk Government Center Property:
| Comparable Sales Summary | ||||||
| Property Name/Location | Sale Date | Year Built/ Renovated | Total NRA (SF) | Occupancy | Sale Price | Sale Price PSF |
Norwalk Government Center (subject) Norwalk, CA | N/A | 1982/2005 | 451,455(1) | 82.7%(1) | ||
Norwalk Corporate Plaza 12501 Imperial Highway Norwalk, CA | Feb. 2018 | 1977/1994 | 112,813 | 93% | $26,000,000 | $230.47 |
The Airflyte 2200, 2222, & 2230 East Imperial Highway El Segundo, CA | May 2018 | 1976/N/A | 549,222 | 100% | $167,500,000 | $304.98 |
Encino Office Park 6345 Balboa Boulevard Encino, CA | Mar. 2019 | 1988/N/A | 213,459 | 89% | $47,850,000 | $224.16 |
AXIS Anaheim 2390 Orangewood Avenue 2121, 2150, 2170, 2190 Towne Center Drive Anaheim, CA | Dec. 2018 | 1982/2015 | 292,311 | 77% | $83,100,000 | $284.29 |
Dupont Centre I and II 2201 and 2301 Dupont Drive Irvine, CA | Sep. 2018 | 1986/N/A | 251,108 | 73% | $87,888,000 | $350.00 |
1 MacArthur Place 1 MacArthur Place Santa Ana, CA | Apr. 2019 | 2001/N/A | 210,025 | 94% | $54,000,000 | $257.11 |
4 Hutton Centre 4 Hutton Centre Drive Santa Ana, CA | Jul. 2019 | 1988/2012 | 216,864 | 80% | $54,755,000 | $252.49 |
Source:Appraisal.
| (1) | Information is based on the underwritten rent roll. |
Operating History and Underwritten Net Cash Flow.The following table presents certain information relating to the historical operating performance and Underwritten Net Cash Flow at the Norwalk Government Center Property:
| Cash Flow Analysis | ||||||||||||
| 2016 | 2017 | 2018 | TTM (9/30/2019)(1) | UW(1) | UW PSF | |||||||
| Base Rent | $7,807,036 | $7,984,532 | $7,286,583 | $7,405,499 | $7,444,135 | $16.49 | ||||||
| IG Rent Average Benefit | $0 | $0 | $0 | $0 | $518,466 | $1.15 | ||||||
| Grossed Up Vacant Space | $0 | $0 | $0 | $0 | $2,077,617 | $4.60 | ||||||
| Total Recoveries | $1,732,278 | $1,739,453 | $1,573,983 | $1,657,848 | $1,758,105 | $3.89 | ||||||
| Parking/Garage/Other Income(2) | $281,497 | $201,365 | $227,047 | $236,934 | $187,098 | $0.41 | ||||||
| Less Vacancy & Credit Loss | $0 | $0 | $0 | $0 | ($2,077,617)(3) | ($4.60) | ||||||
| Effective Gross Income | $9,820,811 | $9,925,350 | $9,087,612 | $9,300,281 | $9,907,804 | $21.95 | ||||||
| Real Estate Taxes | $908,590 | $906,451 | $900,181 | $921,070 | $958,659 | $2.12 | ||||||
| Insurance | $68,067 | $92,368 | $106,205 | $110,506 | $108,659 | $0.24 | ||||||
| Other Operating Expenses | $3,485,327 | $3,645,576 | $3,468,643 | $3,571,162 | $3,188,451(4) | $7.06 | ||||||
| Total Expenses | $4,461,984 | $4,644,394 | $4,475,029 | $4,602,738 | $4,255,768 | $9.43 | ||||||
| Net Operating Income | $5,358,827 | $5,280,956 | $4,612,584 | $4,697,543 | $5,652,036 | $12.52 | ||||||
| Capital Expenditures | $0 | $0 | $0 | $0 | $157,958 | $0.35 | ||||||
| TI/LC | $0 | $0 | $0 | $0 | $51,455 | $0.11 | ||||||
| Net Cash Flow | $5,358,827 | $5,280,956 | $4,612,584 | $4,697,543 | $5,442,623 | $12.06 | ||||||
| Occupancy % | 92.4% | 83.2% | 81.2% | 82.7% | 82.7%(3) | |||||||
| NOI DSCR | 2.07x | 2.04x | 1.78x | 1.81x | 2.18x | |||||||
| NCF DSCR | 2.07x | 2.04x | 1.78x | 1.81x | 2.10x | |||||||
| NOI Debt Yield | 8.1% | 8.0% | 7.0% | 7.1% | 8.5% | |||||||
| NCF Debt Yield | 8.1% | 8.0% | 7.0% | 7.1% | 8.2% | |||||||
| (1) | The increase in Effective Gross Income from TTM (9/30/2019) to UW was primarily driven by the inclusion of straight line rent averaging for investment grade tenants through their respective lease terms totaling $518,466. |
| (2) | Includes parking, storage and income derived from the loading dock license agreement. |
| (3) | The underwritten economic vacancy is 20.7%. The Norwalk Government Center Property was 82.7% occupied as of November 1, 2019. |
| (4) | The decrease in Other Operating Expenses from TTM (9/30/2019) to UW is driven by an estimated $440,000 in expected savings after completion of the planned energy retrofit alterations (see “Escrows and Reserves” section below). |
| This is not a research report and was not prepared by any Underwriter’s research department. Please see additional important information and qualifications at the end of this Term Sheet. |
T-79
| Office – Suburban | Loan #6 | Cut-off Date Balance: | $66,300,000 | |
| 12440 Imperial Highway | Norwalk Government Center | Cut-off Date LTV: | 63.5% | |
| Norwalk, CA 90650 | UW NCF DSCR: | 2.10x | ||
| UW NOI Debt Yield: | 8.5% |
Escrows and Reserves.
Real Estate Taxes - The Norwalk Government Center Borrower is required to deposit an upfront real estate tax reserve of $164,570 and ongoing monthly escrows in an amount equal to 1/12 of the real estate taxes that the lender estimates will be payable during the next 12 months (initially $82,885).
Insurance- The Norwalk Government Center Borrower is required to deposit an upfront insurance reserve of $104,588 and ongoing monthly escrows in an amount equal to 1/12 of the insurance premiums that the lender estimates will be payable for the renewal of the coverage during the next 12 months (initially $9,508).
Replacement Reserve- The Norwalk Government Center Mortgage Loan documents require ongoing monthly replacement reserves of $13,163, which the lender may require the Norwalk Government Center Borrower to increase (not more than once per year) if the lender reasonably determines such increase is necessary to maintain the proper operation of the Norwalk Government Center Property. From and after the date of the completion of the elevator modernization conditions, as recommended in the property condition report obtained at the time of origination of the Norwalk Government Center Mortgage Loan (as described in the Norwalk Government Center Mortgage Loan documents), provided that if (x) no event of default has occurred or is continuing and (y) the Norwalk Government Center Property is being adequately maintained (as determined by the lender based on annual site inspections), the ongoing monthly replacement reserve deposit will be reduced to $7,524 and will be subject to a cap of $595,490.
Leasing Reserve - The Norwalk Government Center Mortgage Loan documents require an upfront deposit of $4,000,000 and ongoing general TI/LC reserves of $47,027, subject to a cap of $2,750,000 provided that no event of default has occurred or is continuing.
Energy Retrofit Reserve – The Norwalk Government Center Mortgage Loan documents require an upfront deposit of $4,305,000 for proposed energy retrofit alterations to the Norwalk Government Center Property improvements together with such other non-structural work that the energy retrofit contractor reasonably deems necessary to achieve the performance specification sought with respect to such energy retrofit. The Norwalk Government Center Borrower is required to complete the retrofit work on or before October 31, 2021 (provided that such deadline may be extended by the lender so long as the Norwalk Government Center Borrower is diligently pursing the completion of such retrofit work).
Economic Holdback Reserve– The Norwalk Government Center Mortgage Loan documents require an upfront deposit of $4,525,000 as additional collateral for the performance of the Norwalk Government Center Borrower’s obligations under the Norwalk Government Center Mortgage Loan documents. So long as no event of default has occurred or is continuing, upon receipt of satisfactory evidence that the net cash flow debt yield (“NCF DY”) is greater than or equal to 8.0%, the lender is required to disburse the economic holdback reserve funds to a general reserve account (which may be used for disbursements of Replacement Reserves, Leasing Reserves, monthly debt service or payment of other funding requirement reasonably related to the Norwalk Government Center Property) (the “General Reserve”). So long as no event of default has occurred or is continuing, in the event that the economic holdback reserve funds have not been fully disbursed before October 31, 2021, the lender is required to (i) first, apply the funds to the prepayment of the Norwalk Government Center Mortgage Loan in an amount equal to the lesser of (A) all of the remaining economic holdback reserve funds and (B) the amount that, after giving effect to such prepayment, will result in a NCF DY of 8.0% (calculated as if the principal balance of the Norwalk Government Center Mortgage Loan were equal to the initial principal amount less any economic holdback reserve funds being held by the lender at the time of calculation) (and, in either case, the Norwalk Government Center Borrower is required to pay the accompanying yield maintenance premium and interest shortfall due in connection with such prepayment), (ii) second, apply the economic holdback reserve funds, if any, towards the payment of the applicable yield maintenance premium and interest shortfall (and for clarity, if there are no economic holdback reserve funds remaining, the Norwalk Government Center Borrower is required to pay the applicable yield maintenance premium and interest shortfall) and (iii) third, disburse any remaining economic holdback reserve funds, if any, to the General Reserve.
Existing TI/LC Obligations Reserve – The Norwalk Government Center Borrower deposited an upfront reserve of $1,787,104 for outstanding tenant improvements and leasing commissions related to LA County Department of Public Social Services ($703,704), County of LA Sheriff’s Dept. ($988,400) and OurHome Catering, Inc. ($95,000).
Springing Parking Reserve – Thirty days prior to commencement of construction of any improvements on the Release Parcel that could reasonably be expected to result in a displacement of parking, the Norwalk Government Center Mortgage Loan documents require a springing deposit of an amount equal to the cost of temporary off-site parking spaces and bus service between off-site parking and the property for a period of no less than 18 months (see “Release of Property” below for further discussion on a future parcel release).
Lockbox and Cash Management. The Norwalk Government Center Whole Loan is structured with a hard lockbox, which is already in place, and in place cash management. The Norwalk Government Center Borrower is required to direct tenants to pay rent directly into such lockbox account and all rents received directly by the Norwalk Government Center Borrower or the property manager are required to be deposited into the lockbox account within one business day of receipt. Funds in the lockbox account are required to be swept on each business day to a lender-controlled cash management account. Prior to the occurrence of a Cash Trap Event Period (as defined below), any excess funds in the lockbox account after satisfaction of the waterfall items are required to be distributed to the Norwalk Government Center Borrower. During the continuance of the Cash Trap Event Period, any excess cash flow remaining after satisfaction of the waterfall items outlined in the loan documents is required to be swept to an excess cash flow subaccount controlled by the lender as additional security for the Norwalk Government Center Whole Loan (provided, however, a separate excess cash flow subaccount will be required solely with respect to a Cash Trap Event Period caused by a Major Tenant Non-Renewal Event (as defined below)).
A “Cash Trap Event Period” will commence upon the earlier of the following:
| (i) | the occurrence of an event of default under the Norwalk Government Center Mortgage Loan documents; |
| (ii) | the net cash flow debt service coverage ratio (based on a hypothetical 30-year amortization schedule; “Amortizing NCF DSCR”) falling below 1.15x at the end of any calendar quarter; or |
| (iii) | the occurrence and continuation of a Major Tenant Event Period (as defined below). |
| This is not a research report and was not prepared by any Underwriter’s research department. Please see additional important information and qualifications at the end of this Term Sheet. |
T-80
| Office – Suburban | Loan #6 | Cut-off Date Balance: | $66,300,000 | |
| 12440 Imperial Highway | Norwalk Government Center | Cut-off Date LTV: | 63.5% | |
| Norwalk, CA 90650 | UW NCF DSCR: | 2.10x | ||
| UW NOI Debt Yield: | 8.5% |
A Cash Trap Event Period will end upon the occurrence of the following:
| ● | with regard to clause (i), the cure of such event of default; or |
| ● | with regard to clause (ii), the Amortizing NCF DSCR being equal to or greater than 1.20x for two consecutive calendar quarters; or |
| ● | with regard to clause (iii), a Major Tenant Event Period Cure (as defined below). |
A “Major Tenant Event Period” will commence upon the earliest to occur of the following:
| (i) | County of LA Sheriff’s Dept. (references to such tenant include its successors and assigns and any replacement tenant for any portion of its leased premises) failing to renew or extend the term of its lease, pursuant to the terms and conditions set forth in such lease or on terms and conditions acceptable to the lender and in accordance with the Norwalk Government Center Mortgage Loan documents, on or prior to the date that is 12 months prior to such lease’s expiration date (as of the loan origination date, the lease is scheduled to expire on October 31, 2026); provided, however, that if the County of LA Sheriff’s Dept. has (1) been occupying its space at the Norwalk Government Center Property for a minimum of seven years as of such lease’s expiration date and (2) the Norwalk Government Center Borrower certifies that (a) such tenant is currently engaged in renewal conversations with the Norwalk Government Center Borrower at the Norwalk Government Center Property and (b) such tenant has not expressed its intention to vacate at the end of its lease term (collectively, the “Government-Related Tenant Timing Conditions”) are satisfied as of the 12-month deadline, the renewal trigger date will instead be the date that is the earlier of (x) six months prior to the scheduled lease expiration date or (y) the date on which the Government-Related Tenant Timing Conditions are no longer satisfied (collectively, a “Major Tenant Non-Renewal Event”); |
| (ii) | County of LA Sheriff’s Dept. giving a termination notice under its lease for all or any portion of its space; |
| (iii) | County of LA Sheriff’s Dept. “going dark”, vacating or otherwise failing to occupy its space, or failing to be open for business at the Norwalk Government Center Property during customary hours, or giving notice of its intent to commence any of the foregoing; or |
| (iv) | County of LA Sheriff’s Dept. filing, as a debtor, a bankruptcy or similar insolvency proceeding, or otherwise becoming involved, as a debtor, in a bankruptcy or any similar insolvency proceeding. |
A “Major Tenant Event Period Cure” will occur upon:
| ● | with regard to clause (i) above, upon the occurrence of (x) the aggregate of the amount of the excess cash flow subaccount pertaining solely to a Major Tenant Non-Renewal Event and the Rollover Reserve (see “Escrows and Reserves” above) on deposit with the lender being greater than or equal to $4,724,000, (y) a Major Tenant Re-Tenanting Event (as defined below) or (z) the lender having received reasonably satisfactory evidence that the County of LA Sheriff’s Dept. has renewed or extended the term of its lease pursuant to the terms set forth therein or otherwise on terms and conditions acceptable to the lender and, in either case, in accordance with the Norwalk Government Center Mortgage Loan documents; |
| ● | with regard to clause (ii) above, (x) a Major Tenant Re-Tenanting Event having occurred or (y) the County of LA Sheriff’s Dept. having rescinded its termination notice and being open during customary hours for a period of two consecutive calendar quarters; |
| ● | with regard to clause (iii) above, (x) a Major Tenant Re-Tenanting Event having occurred or (y) the County of LA Sheriff’s Dept. having resumed its normal business operations in its space and being open during customary hours for a period of two consecutive calendar quarters; or |
| ● | with regard to clause (iv) above, (x) a Major Tenant Re-Tenanting Event having occurred or (y) the bankruptcy or insolvency proceeding having been terminated in a manner satisfactory to the lender, the related lease having been affirmed, and the terms of such lease, as affirmed, being satisfactory to the lender. |
A “Major Tenant Re-Tenanting Event” will occur upon the lender receiving satisfactory evidence, including, without limitation, a satisfactory estoppel certificate from each such replacement tenant affirming, that: (i) the County of LA Sheriff’s Dept. space has been leased to one or more satisfactory replacement tenants pursuant to a satisfactory replacement lease, (ii) each such tenant is in occupancy of its premises, is open for business and is paying full, unabated rent pursuant to the terms of its lease and (iii) all tenant improvement costs and leasing commissions provided in each such replacement lease have been paid.
Additional Secured Indebtedness (not including trade debts).Not permitted.
Mezzanine Loan and Preferred Equity. Not permitted.
Release of Property.The Norwalk Government Center Borrower may obtain the release of a portion of parking lot space (not to exceed seven acres in the aggregate; the “Release Parcel”) located at the Norwalk Government Center Property (for which no value was attributed in the appraisal obtained as of loan origination) in connection with a sale to a third party (which may be an affiliate of the Norwalk Government Center Borrower or guarantor), provided that, among other things, and in accordance with the Norwalk Government Center Whole Loan documents, (i) no event of default has occurred and is continuing; (ii) after effectuating the release, the Norwalk Government Center Borrower has access on the Norwalk Government Center Property or pursuant to permanent easements to parking spaces totaling not less than the greater of (x) 1,728 parking spaces and (y) an amount equal to any minimum parking ratio or minimum number of parking spaces (whether on-site or off-site) required by the leases, each reciprocal easement agreement and all applicable zoning laws and ordinances or any other applicable law; (iii) compliance with all applicable REMIC requirements; and (iv) rating agency confirmation that such release will not result in a downgrade, withdrawal or qualification of the respective ratings assigned to the BANK 2019-BNK23 certificates. The Norwalk Government Center Mortgage Loan documents prohibit the Norwalk Government Center Borrower, any of its affiliates or agents, the guarantor or the borrower sponsor from (a) soliciting existing tenants at the Norwalk Government Center Property to relocate to any space developed on the Release Parcel, (b) in bad faith steering or directing any prospective tenant to any space developed on the Release Parcel or (c) leasing any space developed on the Release Parcel to any tenant whose use or occupancy would violate the terms of any lease of the remaining portion of the Norwalk Government Center Property. See “The Property” section above for additional information regarding a conceptual plan for the Release Parcel.
| This is not a research report and was not prepared by any Underwriter’s research department. Please see additional important information and qualifications at the end of this Term Sheet. |
T-81
| Office – Suburban | Loan #6 | Cut-off Date Balance: | $66,300,000 | |
| 12440 Imperial Highway | Norwalk Government Center | Cut-off Date LTV: | 63.5% | |
| Norwalk, CA 90650 | UW NCF DSCR: | 2.10x | ||
| UW NOI Debt Yield: | 8.5% |
Ground Lease. None.
Right of First Refusal/Right of First Offer.None.
Letter of Credit. None.
Terrorism Insurance.The Norwalk Government Center Mortgage Loan documents require that the “all risk” insurance policy required to be maintained by the Norwalk Government Center Borrower provides coverage for terrorism in an amount equal to the full replacement cost of the Norwalk Government Center Property, as well as business interruption insurance covering no less than the 24-month period following the occurrence of a casualty event, together with a 6-month extended period of indemnity.
| This is not a research report and was not prepared by any Underwriter’s research department. Please see additional important information and qualifications at the end of this Term Sheet. |
T-82
(THIS PAGE INTENTIONALLY LEFT BLANK)
T-83
| Various | Loan #7 | Cut-off Date Balance: | $61,342,800 | |
| Various | ExchangeRight Net Leased Portfolio #30 | Cut-off Date LTV: | 61.6% | |
| UW NCF DSCR: | 2.46x | |||
| UW NOI Debt Yield: | 9.4% |

| This is not a research report and was not prepared by any Underwriter’s research department. Please see additional important information and qualifications at the end of this Term Sheet. |
T-84
| Various | Loan #7 | Cut-off Date Balance: | $61,342,800 | |
| Various | ExchangeRight Net Leased Portfolio #30 | Cut-off Date LTV: | 61.6% | |
| UW NCF DSCR: | 2.46x | |||
| UW NOI Debt Yield: | 9.4% |
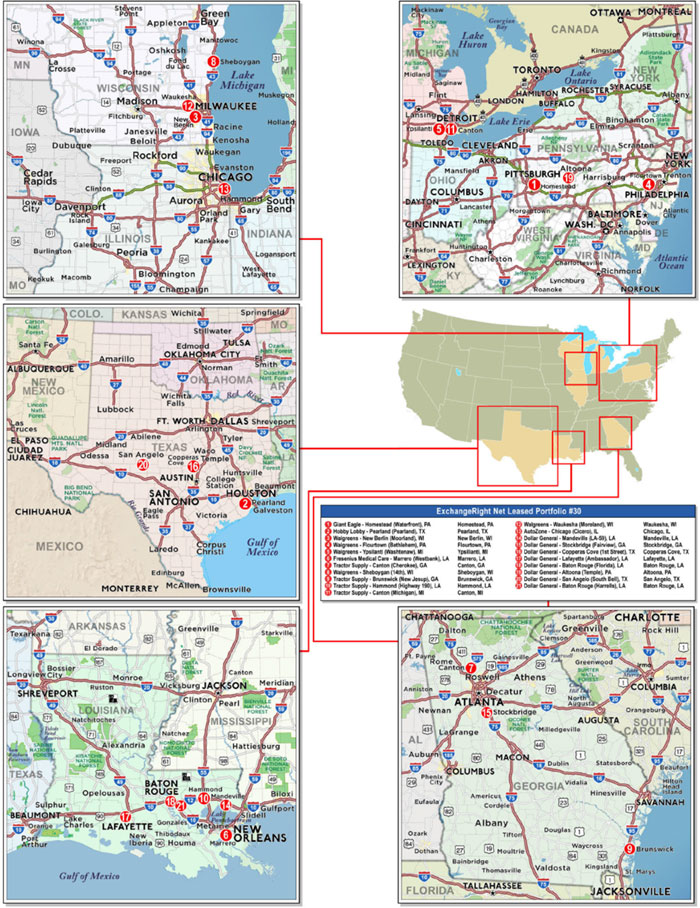
| This is not a research report and was not prepared by any Underwriter’s research department. Please see additional important information and qualifications at the end of this Term Sheet. |
T-85
| Mortgage Loan No. 7 – ExchangeRight Net Leased Portfolio #30 |
| Mortgage Loan Information | Property Information | |||||||
| Mortgage Loan Seller: | BANA | Single Asset/Portfolio: | Portfolio | |||||
| Credit Assessment (KBRA/ Fitch/S&P): | NR/NR/NR | Location(1): | Various – See Table | |||||
| Original Balance: | $61,342,800 | General Property Type(1): | Various | |||||
| Cut-off Date Balance: | $61,342,800 | Detailed Property Type(1): | Various | |||||
| % of Initial Pool Balance: | 4.8% | Title Vesting: | Fee | |||||
| Loan Purpose: | Acquisition | Year Built/Renovated(1): | Various/Various | |||||
| Borrower Sponsor: | ExchangeRight Real Estate, LLC | Size: | 375,560 SF | |||||
| Guarantors: | David Fisher; Joshua Ungerecht; | Cut-off Date Balance per SF: | $163 | |||||
| Warren Thomas | Maturity/ARD Date Balance per SF: | $163 | ||||||
| Mortgage Rate: | 3.6580% | Property Manager: | NLP Management, LLC | |||||
| Note Date: | 10/23/2019 | (borrower-related) | ||||||
| First Payment Date: | 12/1/2019 | Underwriting and Financial Information | ||||||
| Maturity Date: | 11/1/2029 | UW NOI: | $5,775,724 | |||||
| Original Term: | 120 months | UW NOI Debt Yield: | 9.4% | |||||
| Original Amortization Term: | 0 months | UW NOI Debt Yield at Maturity: | 9.4% | |||||
| IO Period: | 120 months | UW NCF DSCR: | 2.46x | |||||
| Seasoning: | 1 month | Most Recent NOI(2): | N/A | |||||
| Prepayment Provisions: | LO(25); DEF(91); O(4) | 2nd Most Recent NOI(2): | N/A | |||||
| Lockbox/Cash Mgmt Status: | Hard / Springing | 3rd Most Recent NOI(2): | N/A | |||||
| Additional Debt Type: | N/A | Most Recent Occupancy: | 100.0% (12/1/2019) | |||||
| Additional Debt Balance: | N/A | 2nd Most Recent Occupancy(2): | N/A | |||||
| Future Debt Permitted (Type): | No (N/A) | 3rd Most Recent Occupancy(2): | N/A | |||||
| Reserves(3) | Appraised Value (as of)(4): | $99,640,000 (Various) | ||||||
| Type | Initial | Monthly | Cap | Appraised Value per SF: | $265 | |||
| RE Tax: | $486,679 | $40,557 | N/A | Cut-off Date LTV Ratio: | 61.6% | |||
| Insurance: | $0 | Springing | N/A | Maturity Date LTV Ratio: | 61.6% | |||
| Recurring Replacements: | $440,000 | $1,733 | N/A | |||||
| Immediate Repairs: | $119,183 | $0 | N/A | |||||
| TI/LC: | $500,000 | Springing | N/A | |||||
| Environmental Remediation: | $264,651 | $0 | N/A | |||||
| Sources and Uses | ||||||
| Sources | Proceeds | % of Total | Uses | Proceeds | % of Total | |
| Loan Amount: | $61,342,800 | 60.2% | Purchase Price(5): | $99,079,632 | 97.3% | |
| Cash equity contribution: | $40,530,818 | 39.8% | Reserves: | $1,810,513 | 1.8% | |
| Closing Costs: | $983,473 | 1.0% | ||||
| Total Sources: | $101,873,618 | 100.0% | Total Uses: | $101,873,618 | 100.0% | |
| (1) | See “The Properties” section. |
| (2) | Historical occupancy and NOI are unavailable as the ExchangeRight Properties (as defined below) were acquired by the borrower sponsor between July 1, 2019 and September 30, 2019. |
| (3) | See “Escrows and Reserves” below. |
| (4) | The individual appraisal values are dated from September 23, 2019 to October 2, 2019. |
| (5) | The borrower sponsor purchased the ExchangeRight Properties in separate transactions between July 1, 2019 and September 30, 2019. Closing Costs do not include costs incurred in connection with the closings of the acquisitions prior to the closing of the ExchangeRight Mortgage Loan (as defined below). |
The Mortgage Loan. The seventh largest mortgage loan (the “ExchangeRight Mortgage Loan”) is evidenced by a single promissory note secured by the fee interests in twenty one cross-collateralized, net leased, single-tenant retail and medical office properties located across seven states (the “ExchangeRight Properties”).
The Borrower and the Borrower Sponsor. The borrower is ExchangeRight Net Leased Portfolio 30 DST, a Delaware statutory trust (the “ExchangeRight Borrower”) structured to be a bankruptcy-remote entity with one trustee which is an independent director. Legal counsel to the ExchangeRight Borrower delivered a non-consolidation opinion in connection with the origination of the ExchangeRight Mortgage Loan. The borrower sponsor is ExchangeRight Real Estate, LLC. ExchangeRight Real Estate, LLC has more than $2.3 billion of assets and more than 14 million SF under management. ExchangeRight Real Estate, LLC has more than 600 investment-grade retail and Class B/B+ multifamily properties located across 38 states. David Fisher, Joshua Ungerecht and Warren Thomas, the owners of ExchangeRight Real Estate, LLC, are the guarantors of certain nonrecourse carveouts under the ExchangeRight Mortgage Loan.
| This is not a research report and was not prepared by any Underwriter’s research department. Please see additional important information and qualifications at the end of this Term Sheet. |
T-86
| Various | Loan #7 | Cut-off Date Balance: | $61,342,800 | |
| Various | ExchangeRight Net Leased Portfolio #30 | Cut-off Date LTV: | 61.6% | |
| UW NCF DSCR: | 2.46x | |||
| UW NOI Debt Yield: | 9.4% |
The ExchangeRight Borrower has master leased the ExchangeRight Properties to a master tenant owned by ExchangeRight Real Estate, LLC, which is owned by the ExchangeRight Mortgage Loan non-recourse carveout guarantors. The master tenant is a Delaware limited liability company structured to bankruptcy-remote and has one independent director. The master lease obligates the master tenant to operate the ExchangeRight Properties and make decisions on behalf of the ExchangeRight Borrower and to make all repairs other than capital expenses (however replacement reserves under the ExchangeRight Mortgage Loan may be made available to the master tenant). The master tenant’s interest in all subtenant rents was assigned to the ExchangeRight Borrower, which in turn assigned its interest to the lender. The master lease is subordinate to the ExchangeRight Mortgage Loan and the lender has the right to cause the ExchangeRight Borrower to terminate the master lease. A default under the master lease is an event of default under the ExchangeRight Mortgage Loan and gives rise to recourse liability to the non-recourse guarantors for losses unless such default arises solely in connection with the failure of the master tenant to pay rent as a result of the ExchangeRight Properties not generating sufficient cash flow for the payment of such rent.
The lender has the right to require the ExchangeRight Borrower to convert from a Delaware statutory trust to a limited liability company upon (i) an event of default or the lender’s determination of imminent default, (ii) the lender’s determination that the ExchangeRight Borrower will be unable to make a material decision or take a material action required in connection with the operation and maintenance of any individual property, and (iii) 90 days prior to the stated maturity date of the ExchangeRight Mortgage Loan if an executed commitment from an institutional lender to refinance the ExchangeRight Mortgage Loan is not delivered to the lender.
Any time after October 23, 2020 the borrower sponsor has the right to a “qualified transfer” of all of its ownership interests in the ExchangeRight Borrower to an Approved Transferee (as defined below) and to replace the non-recourse carveout guarantors with an affiliate of the Approved Transferee (as defined below) acceptable to the lender,provided that certain conditions are satisfied, including among others: (i) no event of default has occurred and is continuing, (ii) the Approved Transferee owns at least 51% of the beneficial ownership interests in the ExchangeRight Borrower and master tenant, (iii) the delivery of a REMIC opinion, an insolvency opinion and other opinions required by the lender and (iv) the receipt of rating agency confirmation that such assumption will not result in a downgrade of the respective ratings assigned to the BANK 2019-BNK23 certificates. Should the ExchangeRight Borrower fail to make such qualified transfer by November 1, 2026 (36 months prior to the stated maturity date of the ExchangeRight Mortgage Loan), a Cash Sweep Period will be triggered (see “Lockbox and Cash Management” below).
“Approved Transferee” means (A) an eligible institution wholly-owned and controlled by a bank, savings and loan association, investment bank, insurance company, trust company, real estate investment trust, commercial credit corporation, pension plan, pension fund or pension advisory firm, mutual fund, government entity or plan or institution similar to any of the foregoing or (B) any person that (1)(i) has never been indicted or convicted of, or plead guilty or no contest to a felony, (ii) has never been indicted or convicted of, or pled guilty or no contest to a Patriot Act offense and is not on any government watch list, (iii) has never been the subject of a voluntary or involuntary bankruptcy proceeding and (iv) has no material outstanding judgments against it, (2) is regularly engaged in the business of owning or operating commercial properties, or interests therein, which are similar to the ExchangeRight Properties, (3) owns interests in, or operates, at least five properties with a minimum of 750,000 SF and (4) has either (a) total assets of at least $100,000,000 or (b) an investment grade rating.
The Properties. The ExchangeRight Properties are comprised of twenty single-tenant retail and one single-tenant medical office properties totaling 375,560 SF and located across seven states. The ExchangeRight Properties are located in Pennsylvania (three properties, 28.4% of NRA), Texas (three properties, 19.9% of NRA), Louisiana (six properties, 16.6% of NRA), Georgia (three properties, 13.8% of NRA), Wisconsin (three properties, 11.6% of NRA), Michigan (two properties, 8.0% of NRA) and Illinois (one property, 1.8% of NRA). Built between 1967 and 2019, with ten of the twenty one properties built within the last four years, the individual ExchangeRight Properties range in size from 6,786 SF to 82,639 SF.
The ExchangeRight Properties are leased to nationally recognized tenants in diverse retail segments including Giant Eagle, Tractor Supply, Walgreens, Dollar General, Hobby Lobby, Fresenius Medical Care and Auto Zone. Four of the seven tenants are investment grade-rated (occupying fifteen of the twenty one properties, 42.9% of NRA and 54.4% of underwritten base rent). The ExchangeRight Properties have a weighted average remaining lease term of approximately 11.8 years. Leases representing 86.6% of the net rentable area and 79.2% of the underwritten base rent expire after the stated maturity date of the ExchangeRight Mortgage Loan.
| This is not a research report and was not prepared by any Underwriter’s research department. Please see additional important information and qualifications at the end of this Term Sheet. |
T-87
| Various | Loan #7 | Cut-off Date Balance: | $61,342,800 | |
| Various | ExchangeRight Net Leased Portfolio #30 | Cut-off Date LTV: | 61.6% | |
| UW NCF DSCR: | 2.46x | |||
| UW NOI Debt Yield: | 9.4% |
The following table presents certain information relating to the ExchangeRight Properties:
| Property Summary | ||||||||||
| Tenant | Year Built/ Renovated | Tenant SF | Approx. % of Portfolio SF | Lease Expiration | Appraised Value | 1.2
% of Appraised Value | Annual UW Rent | Annual UW Rent PSF | % of Annual UW Rent | Renewal Options |
| Giant Eagle - Homestead (Waterfront), PA | 1999 / N/A | 82,639 | 22.0% | 5/31/2030 | $17,000,000 | 17.1% | $1,059,432 | $12.82 | 17.4% | 4 x 5 yrs |
| Hobby Lobby - Pearland (Pearland), TX | 2019 / N/A | 55,000 | 14.6% | 5/31/2034 | $9,650,000 | 9.7% | $577,500 | $10.50 | 9.5% | 3 x 5 yrs |
| Walgreens - New Berlin (Moorland), WI(1) | 2002 / N/A | 14,490 | 3.9% | 9/30/2029 | $8,460,000 | 8.5% | $529,030 | $36.51 | 8.7% | 10 x 5 yrs(2) |
| Walgreens - Flourtown (Bethlehem), PA(1) | 2004 / N/A | 14,820 | 3.9% | 2/28/2030 | $7,800,000 | 7.8% | $485,059 | $32.73 | 8.0% | 10 x 5 yrs(2) |
| Walgreens - Ypsilianti (Washetenaw), MI(1) | 1999 / N/A | 15,120 | 4.0% | 12/31/2029 | $6,440,000 | 6.5% | $350,028 | $23.15 | 5.7% | 5 x 5; 1 x 7 yrs(2) |
| Fresenius Medical Care - Marrero (Westbank), LA | 2016 / N/A | 8,497 | 2.3% | 11/30/2031 | $5,800,000 | 5.8% | $348,207 | $40.98 | 5.7% | 3 x 5 yrs |
| Tractor Supply - Canton (Cherokee), GA | 2006 / N/A | 23,627 | 6.3% | 9/30/2034 | $5,700,000 | 5.7% | $345,190 | $14.61 | 5.7% | 4 x 5 yrs |
| Walgreens - Sheboygan (14th), WI(1) | 2001 / N/A | 15,120 | 4.0% | 9/30/2029 | $5,600,000 | 5.6% | $350,028 | $23.15 | 5.7% | 8 x 5 yrs(2) |
| Tractor Supply - Brunswick (New Jesup), GA | 2008 / N/A | 19,097 | 5.1% | 12/31/2034 | $5,050,000 | 5.1% | $269,459 | $14.11 | 4.4% | 4 x 5 yrs |
| Tractor Supply - Hammond (Highway 190), LA | 2009 / N/A | 19,097 | 5.1% | 3/31/2034 | $4,420,000 | 4.4% | $269,459 | $14.11 | 4.4% | 4 x 5 yrs |
| Tractor Supply - Canton (Michigan), MI | 1967 / 2018 | 15,000 | 4.0% | 6/28/2034 | $4,285,000 | 4.3% | $261,300 | $17.42 | 4.3% | 4 x 5 yrs |
| Walgreens - Waukesha (Moreland), WI(1) | 1996 / N/A | 13,905 | 3.7% | 9/30/2029 | $4,130,000 | 4.1% | $257,938 | $18.55 | 4.2% | 7 x 5 yrs(2) |
| AutoZone - Chicago (Cicero), IL | 2008 / N/A | 6,786 | 1.8% | 2/28/2029 | $2,490,000 | 2.5% | $149,292 | $22.00 | 2.4% | 4 x 5 yrs |
| Dollar General - Mandeville (LA-59), LA | 2016 / N/A | 10,566 | 2.8% | 4/30/2031 | $2,060,000 | 2.1% | $134,083 | $12.69 | 2.2% | 1 x 5 yrs |
| Dollar General - Stockbrige (Fairview), GA | 2019 / N/A | 9,100 | 2.4% | 10/31/2033 | $1,750,000 | 1.8% | $102,284 | $11.24 | 1.7% | 5 x 5 yrs |
| Dollar General - Copperas Cove (1st Street), TX | 2015 / N/A | 10,566 | 2.8% | 9/2/2030 | $1,660,000 | 1.7% | $134,083 | $12.69 | 2.2% | 1 x 5 yrs |
| Dollar General - Lafayette (Ambassador), LA | 2016 / N/A | 9,026 | 2.4% | 4/30/2031 | $1,530,000 | 1.5% | $99,196 | $10.99 | 1.6% | 1 x 5 yrs |
| Dollar General - Baton Rouge (Florida), LA | 2017 / N/A | 7,489 | 2.0% | 7/31/2032 | $1,525,000 | 1.5% | $86,124 | $11.50 | 1.4% | 1 x 5 yrs |
| Dollar General - Altoona (Temple), PA | 2017 / N/A | 9,100 | 2.4% | 11/30/2032 | $1,515,000 | 1.5% | $102,284 | $11.24 | 1.7% | 2 x 5; 1 x 4.9 yrs |
| Dollar General - San Angelo (South Bell), TX | 2015 / N/A | 9,026 | 2.4% | 12/31/2030 | $1,450,000 | 1.5% | $99,196 | $10.99 | 1.6% | 3 x 5 yrs |
| Dollar General - Baton Rouge (Harrells), LA | 2016 / N/A | 7,489 | 2.0% | 4/30/2031 | $1,325,000 | 1.3% | $86,124 | $11.50 | 1.4% | 1 x 5 yrs |
| Total/Weighted Average: | 375,560 | 100.0% | $99,640,000 | 100.0% | $6,095,296 | $16.23 | 100.0% | |||
| (1) | Tenants have early termination rights, which early termination rights have been assumed to be the lease maturity dates. |
| (2) | Where any termination right has been assumed to be the lease maturity date, the Renewal Options as shown reflect periods between subsequent termination rights. |
The following table presents certain information relating to the tenants at the ExchangeRight Properties:
| Tenant Summary | ||||||||
| Tenant Name | Credit Rating (Fitch/Moody’s/S&P)(1) | Number of Properties | Tenant SF | Approx. % of Total SF | Annual UW Rent | % of Total Annual UW Rent | Annual UW Rent PSF | Lease Expiration |
| Giant Eagle | NR/NR/NR | 1 | 82,639 | 22.0% | $1,059,432 | 17.2% | $12.82 | 5/31/2030 |
| Tractor Supply | NR/NR/NR | 4 | 76,821 | 20.5% | $1,181883 | 19.1% | $15.38 | Various(2) |
| Walgreens | BBB/Baa2/BBB | 5 | 73,455 | 19.6% | $2,037,099 | 33.0% | $27.73 | Various(2) |
| Dollar General | NR/Baa2/BBB | 8 | 72,362 | 19.3% | $823,514 | 13.3% | $11.38 | Various(2) |
| Hobby Lobby | NR/NR/NR | 1 | 55,000 | 14.6% | $577,500 | 9.3% | $10.50 | 5/31/2034 |
| Fresenius Medical Care | BBB-/Baa3/BBB | 1 | 8,497 | 2.3% | $348,207 | 5.6% | $40.98 | 11/30/2031 |
| AutoZone | BBB/Baa1/BBB | 1 | 6,786 | 1.8% | $149,292 | 2.4% | $22.00 | 2/28/2029 |
| Total/Wtd. Avg. | 21 | 375,560 | 100.0% | $6,176,927 | 100.0% | $16.45 | ||
| Vacant Space | 0 | 0 | 0.0% | $0 | 0.0% | |||
| Total/Wtd. Avg. | 21 | 375,560 | 100.0% | $6,176,927 | 100.0% | |||
Information is based on the underwritten rent roll.
| (1) | Certain ratings are those of the parent company whether or not the parent guarantees the lease. |
| (2) | See Property Summary above. |
| This is not a research report and was not prepared by any Underwriter’s research department. Please see additional important information and qualifications at the end of this Term Sheet. |
T-88
| Various | Loan #7 | Cut-off Date Balance: | $61,342,800 | |
| Various | ExchangeRight Net Leased Portfolio #30 | Cut-off Date LTV: | 61.6% | |
| UW NCF DSCR: | 2.46x | |||
| UW NOI Debt Yield: | 9.4% |
The following table presents certain information relating to the lease rollover at the ExchangeRight Properties:
| Lease Rollover Schedule | ||||||||
| Year | # of Leases Rolling(1) | SF Rolling | UW Rent PSF Rolling | Approx. % of Total SF Rolling | Approx. Cumulative % of SF Rolling | Total UW Rent Rolling | Approx. % of Total Rent Rolling | Approx. Cumulative % of Total Rent Rolling |
| 2019 | 0 | 0 | $0.00 | 0.0% | 0.0% | $0 | 0.0% | 0.0% |
| 2020 | 0 | 0 | $0.00 | 0.0% | 0.0% | $0 | 0.0% | 0.0% |
| 2021 | 0 | 0 | $0.00 | 0.0% | 0.0% | $0 | 0.0% | 0.0% |
| 2022 | 0 | 0 | $0.00 | 0.0% | 0.0% | $0 | 0.0% | 0.0% |
| 2023 | 0 | 0 | $0.00 | 0.0% | 0.0% | $0 | 0.0% | 0.0% |
| 2024 | 0 | 0 | $0.00 | 0.0% | 0.0% | $0 | 0.0% | 0.0% |
| 2025 | 0 | 0 | $0.00 | 0.0% | 0.0% | $0 | 0.0% | 0.0% |
| 2026 | 0 | 0 | $0.00 | 0.0% | 0.0% | $0 | 0.0% | 0.0% |
| 2027 | 0 | 0 | $0.00 | 0.0% | 0.0% | $0 | 0.0% | 0.0% |
| 2028 | 0 | 0 | $0.00 | 0.0% | 0.0% | $0 | 0.0% | 0.0% |
| 2029 | 5 | 65,421 | $26.01 | 17.4% | 17.4% | $1,701,332 | 27.5% | 27.5% |
| 2030 & Beyond | 16 | 310,139 | $14.43 | 82.6% | 100.0% | $4,475,595 | 72.5% | 100.0% |
| Vacant | 0 | 0 | $0.00 | 0.0% | 100.0% | $0 | 0.0% | 100.0% |
| Total/Wtd. Avg | 21 | 375,560 | $16.45 | 100.0% | $6,176,927 | 100.0% | ||
Information is based on the underwritten rent roll.
| (1) | Certain tenants may have early termination rights, which early termination rights have been assumed to be the lease maturity dates. |
Underwritten Net Cash Flow.The following table presents certain information relating to the Underwritten Net Cash Flow at the ExchangeRight Properties:
| Cash Flow Analysis(1) | ||
| UW | UW PSF | |
| Base Rent | $6,235,599 | $16.60 |
| (Vacancy & Credit Loss) | ($311,780) | ($0.83) |
| Effective Gross Income | $5,923,819 | $15.77 |
| Total Operating Expenses(2) | $148,095 | $0.39 |
| Net Operating Income | $5,775,724 | $15.38 |
| TI/LC | $164,947 | $0.44 |
| Capital Expenditures | $20,791 | $0.06 |
| Net Cash Flow | $5,589,986 | $14.88 |
| Occupancy %(3) | 95.0% | |
| NOI DSCR | 2.54x | |
| NCF DSCR | 2.46x | |
| NOI Debt Yield | 9.4% | |
| NCF Debt Yield | 9.1% | |
| (1) | The ExchangeRight Properties were acquired by the borrower sponsor between July 1, 2019 and September 30, 2019. Accordingly, historical operating statements are not available. |
| (2) | Total Operating Expenses consist of a 2.5% property management fee. |
| (3) | The ExchangeRight Properties are 100.0% leased as of December 1, 2019. |
Escrows and Reserves.
Tax Reserve -The ExchangeRight Mortgage Loan documents require upfront escrows in the amount of $486,679 for real estate taxes. Upon any of (i) an event of default, (ii) an event of default under a tenant lease, (iii) a tenant no longer being liable for paying property taxes directly to the taxing authority, or (iv) the ExchangeRight Borrower failing to provide evidence that such property taxes have been paid in full on or prior to the date when due, the ExchangeRight Borrower will be required to make monthly deposits for real estate taxes in an amount equal to 1/12 of the estimated annual amount due, beginning in December 2020 $40,557.
Insurance Reserve -Unless waived due to a blanket policy being in place, as currently, the ExchangeRight Mortgage Loan documents require monthly escrows of 1/12 of the estimated annual all-risk insurance premiums due.
| This is not a research report and was not prepared by any Underwriter’s research department. Please see additional important information and qualifications at the end of this Term Sheet. |
T-89
| Various | Loan #7 | Cut-off Date Balance: | $61,342,800 | |
| Various | ExchangeRight Net Leased Portfolio #30 | Cut-off Date LTV: | 61.6% | |
| UW NCF DSCR: | 2.46x | |||
| UW NOI Debt Yield: | 9.4% |
Recurring Replacements Reserve -The ExchangeRight Mortgage Loan documents require an upfront escrow in the amount of $440,000 and monthly escrows of $1,733 for replacements reserve.
TI/LC Reserve -The ExchangeRight Mortgage Loan documents require upfront escrows in the amount of $500,000 for tenant improvements and leasing commissions. Upon an event of default, the ExchangeRight Borrower will be required to deposit monthly $13,746 plus any termination fees received for tenant improvements and leasing commissions.
Immediate Repair Reserve -The ExchangeRight Mortgage Loan documents require an upfront escrow in the amount of $119,183 for specific repairs at AutoZone - Chicago (Cicero), IL, Hobby Lobby - Pearland (Pearland), TX, Tractor Supply - Brunswick (New Jesup), GA, Tractor Supply - Hammond (Highway 190), LA and Walgreens - Sheboygan (14th), WI properties.
Environmental Remediation Reserve -The ExchangeRight Mortgage Loan documents require an upfront escrow in the amount of $264,651 for environmental work at Fresenius Medical Care - Marrero (Westbank), LA, Tractor Supply - Brunswick (New Jesup), GA and Tractor Supply - Canton (Michigan), MI properties.
Lockbox and Cash Management. The ExchangeRight Mortgage Loan is structured with a hard lockbox and springing cash management. During the occurrence and continuance of a Cash Sweep Period (as defined below), all funds are required to be swept on each business day into the cash management account controlled by the lender and disbursed on each payment date in accordance with the ExchangeRight Mortgage Loan documents, with all excess cash flow to be held as additional security for the ExchangeRight Mortgage Loan until the discontinuance of the Cash Sweep Period. Notwithstanding the foregoing, if a Cash Sweep Period occurs twice during the ExchangeRight Mortgage Loan term, the Cash Sweep Period will continue for the remainder of the ExchangeRight Mortgage Loan term and the ExchangeRight Borrower will not be entitled to any disbursement of excess cash.
A “Cash Sweep Period” means a period:
| (i) | commencing if debt service coverage ratio is less than 1.50x for one quarter based on the preceding twelve months, and ends when the debt service coverage ratio is equal to or greater than 1.55x for two consecutive calendar quarters based on the preceding twelve months; |
| (ii) | commencing November 1, 2026 (36 months prior to the loan maturity date), and ending upon a Qualified Transfer Trigger Event Cure (as defined below). |
A “Qualified Transfer Trigger Event Cure” means the occurrence of a “qualified transfer” (see “The Borrower and the Borrower Sponsor” section above);provided, however, for purposes of this definition, the Approved Transferee additionally (i) at all times maintains a minimum net worth of at least $200,000,000 and total assets of at least $400,000,000, (ii) executes and delivers to the lender a full recourse guaranty for the entire outstanding principal balance of the ExchangeRight Mortgage Loan, (iii) owns 100% of the legal and beneficial ownership interests in the ExchangeRight Borrower, and (iv) is not a Delaware statutory trust.
Mezzanine Loan and Preferred Equity.Not permitted.
Release of Property. Not permitted.
Right of First Refusal. Eight tenants: five Walgreens tenanted properties (Walgreens - New Berlin (Moorland), WI; Walgreens - Flourtown (Bethlehem), PA; Walgreens - Ypsilianti (Washetenaw), MI; Walgreens - Sheboygan (14th), WI and Walgreens - Waukesha (Moreland), WI) as well as three Tractor Supply tenanted properties: (Tractor Supply - Brunswick (New Jesup); GA; Tractor Supply - Hammond (Highway 190), LA and Tractor Supply - Canton (Michigan), MI) have rights of first refusal to purchase their leased properties. See “Description of the Mortgage Pool—Tenant Leases—Purchase Options and Rights of First Refusal” in the Preliminary Prospectus.
Letter of Credit.None.
Terrorism Insurance.The ExchangeRight Mortgage Loan documents require that the property insurance policy required to be maintained by the ExchangeRight Borrower provide coverage for perils and acts of terrorism in an amount equal to 100% of the full replacement cost of the ExchangeRight Properties. The ExchangeRight Mortgage Loan documents also require business interruption insurance covering no less than the 18-month period following the occurrence of a casualty event, together with a 6-month extended period of indemnity. See“Risk Factors—Risks Relating to the Mortgage Loans—Terrorism Insurance May Not Be Available for All Mortgaged Properties” in the Preliminary Prospectus.
| This is not a research report and was not prepared by any Underwriter’s research department. Please see additional important information and qualifications at the end of this Term Sheet. |
T-90
(THIS PAGE INTENTIONALLY LEFT BLANK)
T-91
| Multifamily – Mid Rise | Loan #8 | Cut-off Date Balance: | $54,500,000 | |
| 1000 South Broadway | 1000 South Broadway Apartments | Cut-off Date LTV: | 60.2% | |
| Denver, CO 80209 | UW NCF DSCR: | 1.94x | ||
| UW NOI Debt Yield: | 7.2% |
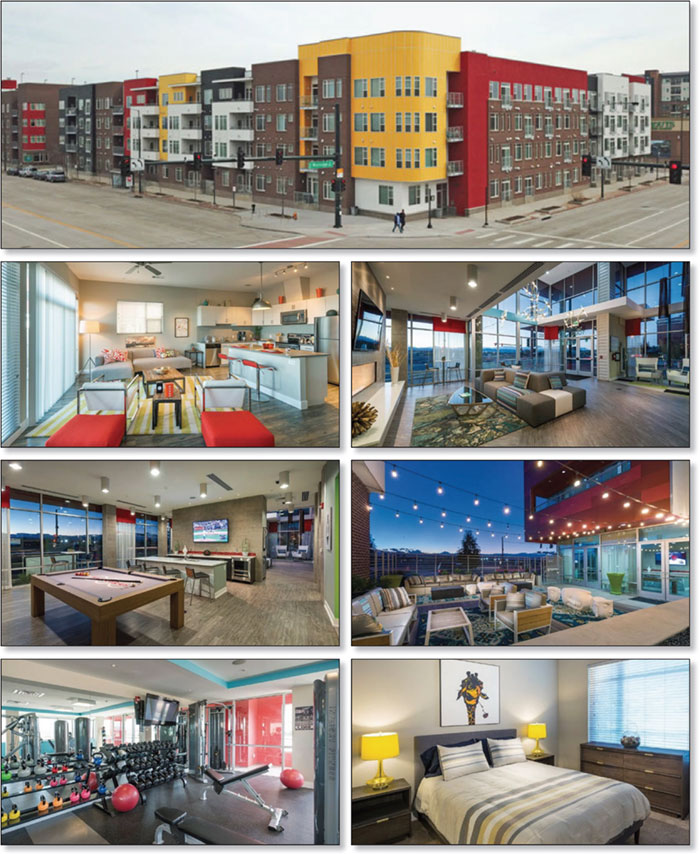
| This is not a research report and was not prepared by any Underwriter’s research department. Please see additional important information and qualifications at the end of this Term Sheet. |
T-92
| Multifamily – Mid Rise | Loan #8 | Cut-off Date Balance: | $54,500,000 | |
| 1000 South Broadway | 1000 South Broadway Apartments | Cut-off Date LTV: | 60.2% | |
| Denver, CO 80209 | UW NCF DSCR: | 1.94x | ||
| UW NOI Debt Yield: | 7.2% |

| This is not a research report and was not prepared by any Underwriter’s research department. Please see additional important information and qualifications at the end of this Term Sheet. |
T-93
| Mortgage Loan No. 8 – 1000 South Broadway Apartments |
| Mortgage Loan Information | Property Information | |||||
| Mortgage Loan Seller: | WFB | Single Asset/Portfolio: | Single Asset | |||
| Credit Assessment (KBRA/Fitch/S&P): | NR/NR/NR | Location: | Denver, CO 80209 | |||
| Original Balance: | $54,500,000 | General Property Type: | Multifamily | |||
| Cut-off Date Balance: | $54,500,000 | Detailed Property Type: | Mid Rise | |||
| % of Initial Pool Balance: | 4.2% | Title Vesting: | Fee | |||
| Loan Purpose: | Acquisition | Year Built/Renovated: | 2014/N/A | |||
| Borrower Sponsor: | Brian J. Wirtz | Size: | 260 units | |||
| Guarantor: | Brian J. Wirtz | Cut-off Date Balance per Unit: | $209,615 | |||
| Mortgage Rate: | 3.5980% | Maturity Balance per Unit: | $209,615 | |||
| Note Date: | 10/18/2019 | Property Manager: | Avenue5 Residential LLC | |||
| First Payment Date: | 12/11/2019 | Underwriting and Financial Information | ||||
| Maturity Date: | 11/11/2029 | UW NOI: | $3,921,017 | |||
| Original Term to Maturity: | 120 months | UW NOI Debt Yield: | 7.2% | |||
| Original Amortization Term: | 0 months | UW NOI Debt Yield at Maturity: | 7.2% | |||
| IO Period: | 120 months | UW NCF DSCR: | 1.94x | |||
| Seasoning: | 1 month | Most Recent NOI: | $3,965,246 (8/31/2019 TTM) | |||
| Prepayment Provisions: | LO (25); DEF (88); O (7) | 2nd Most Recent NOI: | $3,873,544 (12/31/2018) | |||
| Lockbox/Cash Mgmt Status: | Springing | 3rd Most Recent NOI: | $3,649,855 (12/31/2017) | |||
| Additional Debt Type: | N/A | Most Recent Occupancy: | 93.1% (10/15/2019) | |||
| Additional Debt Balance: | N/A | 2nd Most Recent Occupancy: | 96.6% (12/31/2018) | |||
| Future Debt Permitted (Type): | No (N/A) | 3rd Most Recent Occupancy: | 95.4% (12/31/2017) | |||
| Reserves(1) | Appraised Value (as of): | $90,500,000 (10/2/2019) | ||||
| Type | Initial | Monthly | Cap | Appraised Value per Unit: | $348,077 | |
| RE Tax: | $218,502 | $36,417 | N/A | Cut-off Date LTV Ratio: | 60.2% | |
| Insurance: | $0 | Springing | N/A | Maturity Date LTV Ratio: | 60.2% | |
| Recurring Replacements: | $0 | $5,417 | $130,000(1) | |||
| Sources and Uses | ||||||||
| Sources | Proceeds | % of Total | Uses | Proceeds | % of Total | |||
| Loan Amount: | $54,500,000 | 59.8 | % | Purchase Price: | $90,500,000 | 99.2 | % | |
| Borrower Equity: | $36,698,755 | 40.2 | % | Upfront Reserves: | $218,502 | 0.2 | % | |
| Closing Costs: | $480,253 | 0.5 | % | |||||
| Total Sources: | $91,198,755 | 100.0 | % | Total Uses: | $91,198,755 | 100.0 | % | |
| (1) | See“Escrows and Reserves” below for further discussion of reserve requirements. |
The Mortgage Loan. The eighth largest mortgage loan (the “1000 South Broadway Apartments Mortgage Loan”) is secured by a first priority fee mortgage encumbering a mid-rise multifamily building located in Denver, Colorado (the “1000 South Broadway Apartments Property”).
The Borrower and the Borrower Sponsor. The borrower is WWG SPE I, LLC (the “1000 South Broadway Apartments Borrower”), a Delaware limited liability company and single purpose entity with one independent director. Legal counsel to the 1000 South Broadway Apartments Borrower delivered a non-consolidation opinion in connection with the origination of the 1000 South Broadway Apartments Mortgage Loan. The borrower sponsor and non-recourse carveout guarantor for the 1000 South Broadway Apartments Mortgage Loan is Brian J. Wirtz.
Mr. Wirtz, a Managing Partner of The Bascom Group (“Bascom”), started his career in real estate in 1986 and has been focused in the area of multifamily real estate since 1994. Mr. Wirtz has been responsible for the purchase of over 15,000 multifamily units. Bascom is a private equity firm specializing in multifamily and commercial real estate, non-performing loans, and real estate-related investments and operating companies. Bascom has completed 614 multifamily community transactions totaling approximately 163,000 units since 1996.
The Property. The 1000 South Broadway Apartments Property is a three-building, four-story mid-rise multifamily property located in Denver, Colorado, approximately three miles south of the central business district (“CBD”). Built in 2014 and situated on a 3.1-acre site, the 1000 South Broadway Apartments Property contains 260 units, including 3 studio units, 142 one-bedroom/one-bathroom units, 111 two-bedroom/two-bathroom units and 4 three-bedroom/two-bathroom units. The 1000 South Broadway Apartments Borrower plans to spend approximately $900,000 on renovations at the 1000 South Broadway Apartments Property, including approximately $240,000 on common areas and the leasing office, $200,000 on interior unit improvements, and $255,000 on site improvements and exterior upgrades; however, such planned renovations were not reserved for at the time of origination of the 1000 South Broadway Apartments Mortgage Loan and are not required to be completed by the loan documents.
| This is not a research report and was not prepared by any Underwriter’s research department. Please see additional important information and qualifications at the end of this Term Sheet. |
T-94
| Multifamily – Mid Rise | Loan #8 | Cut-off Date Balance: | $54,500,000 | |
| 1000 South Broadway | 1000 South Broadway Apartments | Cut-off Date LTV: | 60.2% | |
| Denver, CO 80209 | UW NCF DSCR: | 1.94x | ||
| UW NOI Debt Yield: | 7.2% |
Common area amenities at the 1000 South Broadway Apartments Property include a resort-style outdoor swimming pool and lounge, commercial grade fitness center, rooftop lounge, executive business center, game lounge, cyber café with WiFi, covered bike storage and three elevators. Unit amenities include designer kitchen cabinetry, quartz countertops, stainless steel appliances, modern tiled backsplash, mixture of 9-foot, 10-foot and vaulted ceilings, walk-in closets and private balconies and patios. The 1000 South Broadway Apartments Property contains 382 garage parking spaces, resulting in a parking ratio of 1.5 spaces per unit. As of October 15, 2019, the 1000 South Broadway Apartments Property was 93.1% occupied and has averaged 94.8% occupancy since the beginning of 2016.
The following table presents certain information relating to the unit mix of the 1000 South Broadway Apartments Property:
| Unit Mix Summary(1) | |||||
| Unit Type | No. of Units | Average Size (SF) | % of Total Units | Average Monthly Underwritten Rent | Average Monthly Underwritten Rent PSF |
| Studio | 3 | 651 | 1.2% | $1,445 | $2.22 |
| 1 BR / 1 BA | 142 | 756 | 54.6% | $1,581 | $2.09 |
| 2 BR / 2 BA | 111 | 1,128 | 42.7% | $2,036 | $1.81 |
| 3 BR / 2 BA | 4 | 1,467 | 1.5% | $2,856 | $1.95 |
| Total | 260 | 924 | 100.0% | $1,794 | $1.94 |
| (1) | Information obtained from the underwritten rent roll. |
The Market. The 1000 South Broadway Apartments Property is located in south-central Denver, approximately three miles south of the CBD and just southwest of Interstate 25. According to the appraisal, Denver’s regional economy is supported by consistent population growth, a skilled labor force and employment diversity, and the unemployment rate as of April 2019 was approximately 2.7%. The 1000 South Broadway Apartments Property is situated at the southwest quadrant of Interstate 25 and South Broadway, and the local market is bordered by Alameda Avenue to the north, South Downing Street/Washington Park to the east, East Evans Avenue to the south, and the Platte River to the west. According to the appraisal, Broadway is one of the main commercial arteries in Denver and connects the CBD and Interstate 25. The section of Interstate 25 less than one mile north of the 1000 South Broadway Apartments Property reports one of the highest traffic counts in Colorado with over 210,000 cars per day, according to the appraisal. Approximately one-quarter of a mile northwest of the 1000 South Broadway Apartments Property is the I-25/Broadway Light Rail Station, which is a three-platform station that acts as a major transfer point for commuters and provides access to downtown Denver and the Denver Tech Center. In addition, the 1000 South Broadway Apartments Property is located within walking distance of multiple entertainment centers, including South Broadway Street and South Pearl Street; and within a three-mile radius, there are over 300 acres of parks lakes and hiking trails, including Washington Park, Vanderbilt Park and Overland Golf Course.
According to the appraisal, as of 2019, the estimated population within a 3- and 5-mile radius of the 1000 South Broadway Apartments Property was 205,357 and 533,667, respectively; and the average household income within the same radii was $101,274 and $97,415, respectively.
Submarket Information – According to the appraisal, the 1000 South Broadway Apartments Property is situated within the Denver-South/Glendale submarket of the Denver multifamily market. As of the second quarter of 2019, the submarket reported an inventory of 43 multifamily properties totaling 5,761 units with a 14.6% vacancy rate and average asking rent of $1,529 per unit per month. The appraiser identified seven competitive apartment properties within 2.3 miles of the 1000 South Broadway Apartments Property totaling 2,272 units, which reported an average occupancy rate of 94.9% (excluding two properties which are in lease-up and are each currently 78.0% occupied). The appraiser concluded to market rents for the 1000 South Broadway Apartments Property ranging from $1,455 to $2,825 per unit with a weighted average market rent of $1,805 per unit, or $1.95 PSF.
| This is not a research report and was not prepared by any Underwriter’s research department. Please see additional important information and qualifications at the end of this Term Sheet. |
T-95
| Multifamily – Mid Rise | Loan #8 | Cut-off Date Balance: | $54,500,000 | |
| 1000 South Broadway | 1000 South Broadway Apartments | Cut-off Date LTV: | 60.2% | |
| Denver, CO 80209 | UW NCF DSCR: | 1.94x | ||
| UW NOI Debt Yield: | 7.2% |
The following table presents certain comparable multifamily properties for the 1000 South Broadway Apartments Property:
| Property, Location(1) | Year Built | Number of Units | Occupancy | Unit Type | Average SF per Unit | Average Rent per Unit | Average Rent per SF | Distance to Subject (mi.) |
| 1000 South Broadway Apartments Property(2) | 2014 | 260 | 93.1% | Studio 1BR/1BA 2BR/2BA 3BR/2BA | 651 756 1,128 1,467 | $1,445 $1,581 $2,036 $2,856 | $2.22 $2.09 $1.81 $1.95 | - |
Mason at Alameda Station 275 South Cherokee St. | 2014 | 338 | 97.0% | Studio 1BR/1BA 2BR/1BA 2BR/2BA 3BR/2BA | 675 756 960 1,131 1,380 | $1,570 $1,491 $1,837 $2,107 $2,537 | $2.33 $1.97 $1.91 $1.86 $1.84 | 1.0 |
The Boulevard 150 West 9th Avenue | 2005 | 290 | 95.0% | Studio 1BR/1BA 2BR/2BA | 680 863 1,489 | $1,459 $1,843 $2,456 | $2.15 $2.14 $1.65 | 2.3 |
Windsor Broadway Station 1145 South Broadway | 2009 | 419 | 96.0% | Studio 1BR/1BA 2BR/2BA | 497 719 1,133 | $1,345 $1,571 $1,933 | $2.71 $2.18 $1.71 | 0.3 |
Hanover Platt Park 99 East Arizona Avenue | 2018 | 303 | 89.0% | Studio 1BR/1BA 2BR/2BA 3BR/2BA | 571 775 1,164 1,428 | $1,402 $1,668 $2,177 $3,461 | $2.46 $2.15 $1.87 $2.42 | 0.2 |
Denizen 425 South Cherokee Street | 2015 | 275 | 97.0% | Studio 1BR/1BA 2BR/2BA | 457 742 1,148 | $1,265 $1,756 $2,432 | $2.77 $2.37 $2.12 | 0.9 |
Encore Evans Station 1805 South Bannock Street | 2018 | 244 | 78.0%(3) | 1BR/1BA 2BR/2BA | 808 1,050 | $1,672 $2,006 | $2.07 $1.91 | 1.2 |
The Henry 201 East Mississippi | 2018 | 403 | 78.0%(3) | 1BR/1BA 2BR/2BA 3BR/3BA | 723 1,096 1,490 | $1,946 $2,432 $3,965 | $2.69 $2.22 $2.66 | 0.3 |
Source: Appraisal, unless otherwise noted.
| (1) | All properties on the table above are located in Denver, Colorado. |
| (2) | Occupancy and rental rate info shown for the 1000 South Broadway Apartments Property are based on the underwritten rent roll. Rental rates shown are reflective of underwritten base rents. |
| (3) | The Encore Evans Station and The Henry properties were built in 2018 and are currently in lease-up. |
| This is not a research report and was not prepared by any Underwriter’s research department. Please see additional important information and qualifications at the end of this Term Sheet. |
T-96
| Multifamily – Mid Rise | Loan #8 | Cut-off Date Balance: | $54,500,000 | |
| 1000 South Broadway | 1000 South Broadway Apartments | Cut-off Date LTV: | 60.2% | |
| Denver, CO 80209 | UW NCF DSCR: | 1.94x | ||
| UW NOI Debt Yield: | 7.2% |
The following table presents information relating to comparable multifamily property sales for the 1000 South Broadway Apartments Property:
| Comparable Property Sale Summary | |||||||
| Property Name/Location | Sale Date | Year Built | No. of Units | Occupancy | Sale Price | Sale Price per Unit | Appraiser’s Adjusted Sale Price per Unit |
| 1000 South Broadway Apartments Property | Oct. 2019 | 2014 | 260 | 93.1% | $90,500,000 | $348,077 | - |
Mason at Alameda Station 275 South Cherokee Street Denver, Colorado | May 2019 | 2014 | 338 | 95.0% | $109,600,000 | $324,260 | $347,283 |
Helios 7901 East Belleview Avenue Englewood, Colorado | March 2019 | 2015 | 258 | 94.0% | $74,323,936 | $288,077 | $340,896 |
Elevate 7338 South Havana Street Englewood, Colorado | Jan. 2019 | 2017 | 285 | 94.0% | $74,500,000 | $261,404 | $324,977 |
AMLI Cherry Creek 801 South Cherry Street Denver, Colorado | Dec. 2018 | 2015 | 341 | 93.0% | $107,821,086 | $316,191 | $327,890 |
Centric LoHi 2525 18th Street Denver, Colorado | Dec. 2018 | 2016 | 302 | 96.0% | $130,750,000 | $432,947 | $359,866 |
Modera Observatory Park 1910 South Josephine Street Denver, Colorado | May 2018 | 2017 | 275 | N/A | $92,500,000 | $336,364 | $377,551 |
Westend 3500 Rockmont Drive Denver, Colorado | March 2018 | 2014 | 390 | 94.0% | $128,700,000 | $330,000 | $355,410 |
Source:Appraisal.
Operating History and Underwritten Net Cash Flow.The following table presents certain information relating to the historical operating performance and Underwritten Net Cash Flow at 1000 South Broadway Apartments Property:
| Cash Flow Analysis | ||||||||||
| 2017 | 2018 | TTM 8/31/2019 | UW | UW per Unit | ||||||
| Base Rent | $4,873,965 | $5,043,436 | $5,174,155 | $5,210,352 | $20,040 | |||||
| Grossed Up Vacant Space | $0 | $0 | $0 | $343,308 | 1,320 | |||||
| Other Income(1) | $439,914 | $498,232 | $478,448 | $478,449 | 1,840 | |||||
| Less Concessions & Collection Loss | ($35,344) | ($19,018) | ($9,503) | ($35,884) | ($138) | |||||
| Less Vacancy | $0 | $0 | $0 | ($343,308) | ($1,320) | |||||
| Effective Gross Income | $5,278,534 | $5,522,651 | $5,643,099 | $5,652,917 | $21,742 | |||||
| Real Estate Taxes | $414,364 | $413,970 | $416,934 | $460,391 | $1,771 | |||||
| Insurance | $47,019 | $63,026 | $69,659 | $93,136 | $358 | |||||
| Other Operating Expenses | $1,167,296 | $1,172,111 | $1,191,260 | $1,178,373 | $4,532 | |||||
| Total Expenses | $1,628,679 | $1,649,107 | $1,677,853 | $1,731,900 | $6,661 | |||||
| Net Operating Income | $3,649,855 | $3,873,544 | $3,965,246 | $3,921,017 | $15,081 | |||||
| Capital Expenditures | $0 | $0 | $0 | $57,200 | $220 | |||||
| Net Cash Flow | $3,649,855 | $3,873,544 | $3,965,246 | $3,863,817 | $14,861 | |||||
| Occupancy % | 95.4% | 96.6% | 94.7% | 93.1%(2) | ||||||
| NOI DSCR | 1.83x | 1.94x | 1.99x | 1.97x | ||||||
| NCF DSCR | 1.83x | 1.94x | 1.99x | 1.94x | ||||||
| NOI Debt Yield | 6.7% | 7.1% | 7.3% | 7.2% | ||||||
| NCF Debt Yield | 6.7% | 7.1% | 7.3% | 7.1% | ||||||
| (1) | Other Income includes RUBS, parking, storage, pet fees and other miscellaneous items. |
| (2) | The underwritten economic vacancy is 6.2%. The 1000 South Broadway Apartments Property was 93.1% occupied as of October 15, 2019. |
Escrows and Reserves.
Real Estate Taxes – The 1000 South Broadway Apartments Mortgage Loan documents provide for an upfront reserve of $218,502 for real estate taxes and ongoing monthly reserves in an amount equal to 1/12 of the real estate taxes that the lender estimates will be payable during the next 12 months (initially $36,417).
| This is not a research report and was not prepared by any Underwriter’s research department. Please see additional important information and qualifications at the end of this Term Sheet. |
T-97
| Multifamily – Mid Rise | Loan #8 | Cut-off Date Balance: | $54,500,000 | |
| 1000 South Broadway | 1000 South Broadway Apartments | Cut-off Date LTV: | 60.2% | |
| Denver, CO 80209 | UW NCF DSCR: | 1.94x | ||
| UW NOI Debt Yield: | 7.2% |
Insurance– Ongoing monthly reserves for insurance are not required as long as (i) no event of default has occurred and is continuing, (ii) the 1000 South Broadway Apartments Borrower provides the lender with evidence that the 1000 South Broadway Apartments Property’s insurance coverage is included in a blanket policy and such policy is in full force and effect, and (iii) the 1000 South Broadway Apartments Borrower provides the lender with evidence of timely payment of the insurance premiums and renewals (and in no event later than 10 business days prior to expiration).
Replacement Reserve – Ongoing monthly replacement reserves are required in an amount equal to $5,417 (subject to a cap of $130,000, as long as (i) no event of default is continuing, and (ii) the 1000 South Broadway Apartments Property is being adequately maintained, as determined by the lender).
Lockbox and Cash Management. The 1000 South Broadway Apartments Mortgage Loan is structured with a springing lockbox and springing cash management. Upon the occurrence of a Cash Trap Event Period (as defined below), the 1000 South Broadway Apartments Borrower is required to establish a lockbox account, into which the 1000 South Broadway Apartments Borrower and property manager are required to cause all rents received by them to be deposited. During a Cash Trap Event Period, funds in the lockbox account are required to be swept on each business day to a lender-controlled cash management account. Any excess cash flow remaining after satisfaction of the waterfall items outlined in the loan documents is required to be swept to an excess cash flow subaccount controlled by the lender as additional security for the 1000 South Broadway Apartments Mortgage Loan during the continuance of the Cash Trap Event Period.
A “Cash Trap Event Period” will commence upon the earlier of the following:
| (i) | the occurrence of an event of default under the 1000 South Broadway Apartments Mortgage Loan documents; or |
| (ii) | the net cash flow debt service coverage ratio (based on a hypothetical 30-year amortization period; “Amortizing NCF DSCR”) falling below 1.15x for two consecutive calendar quarters (tested quarterly). |
A Cash Trap Event Period will end upon the occurrence of the following:
| ● | with regard to clause (i), the cure of such event of default; and |
| ● | with regard to clause (ii), the Amortizing NCF DSCR being greater than or equal to 1.20x for two consecutive calendar quarters (tested quarterly). |
Additional Secured Indebtedness (not including trade debts).None.
Mezzanine Loan and Preferred Equity. Not permitted.
Release of Property.Not permitted.
Ground Lease. None.
Letter of Credit. None.
Terrorism Insurance.The 1000 South Broadway Apartments Whole Loan documents require that the “all risk” insurance policy required to be maintained by 1000 South Broadway Apartments Borrower provide coverage for terrorism in an amount equal to the full replacement cost of the 1000 South Broadway Apartments Property, as well as business interruption insurance covering no less than the 18-month period following the occurrence of a casualty event, together with a 6-month extended period of indemnity.
| This is not a research report and was not prepared by any Underwriter’s research department. Please see additional important information and qualifications at the end of this Term Sheet. |
T-98
(THIS PAGE INTENTIONALLY LEFT BLANK)
T-99
| Multifamily - Garden | Loan #9 | Cut-off Date Balance: | $51,715,000 | |
| Various | Oklahoma Multifamily Portfolio | Cut-off Date LTV: | 72.7% | |
| Various, OK | U/W NCF DSCR: | 1.55x | ||
| U/W NOI Debt Yield: | 9.6% |
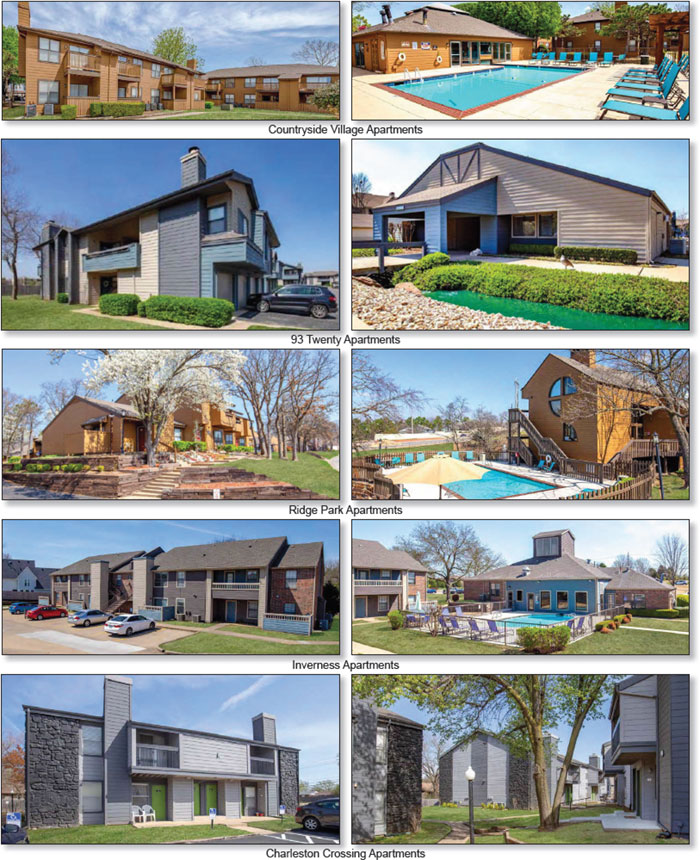
| This is not a research report and was not prepared by any Underwriter’s research department. Please see additional important information and qualifications at the end of this Term Sheet. |
T-100
| Multifamily - Garden | Loan #9 | Cut-off Date Balance: | $51,715,000 | |
| Various | Oklahoma Multifamily Portfolio | Cut-off Date LTV: | 72.7% | |
| Various, OK | U/W NCF DSCR: | 1.55x | ||
| U/W NOI Debt Yield: | 9.6% |

| This is not a research report and was not prepared by any Underwriter’s research department. Please see additional important information and qualifications at the end of this Term Sheet. |
T-101
| Mortgage Loan No. 9 – Oklahoma Multifamily Portfolio |
| Mortgage Loan Information | Property Information | ||||||
| Mortgage Loan Seller: | MSMCH | Single Asset/Portfolio: | Portfolio | ||||
| Credit Assessment (KBRA/Fitch/S&P): | NR/NR/NR | Location: | Various, OK | ||||
| Original Balance: | $51,715,000 | General Property Type: | Multifamily | ||||
| Cut-off Date Balance: | $51,715,000 | Detailed Property Type: | Garden | ||||
| % of Initial Pool Balance: | 4.0% | Title Vesting: | Fee | ||||
| Loan Purpose: | Acquisition | Year Built/Renovated: | Various/N/A | ||||
| Borrower Sponsor: | Alon Yonatan | Size: | 827 Units | ||||
| Guarantor: | Alon Yonatan | Cut-off Date Balance per Unit: | $62,533 | ||||
| Mortgage Rate: | 4.1900% | Maturity Date Balance per Unit: | $57,038 | ||||
| Note Date: | 11/7/2019 | Property Manager: | The Ferndale Management Group, | ||||
| First Payment Date: | 1/1/2020 | LLC (borrower related) | |||||
| Maturity Date: | 12/1/2029 | Underwriting and Financial Information | |||||
| Original Term to Maturity: | 120 months | UW NOI: | $4,952,375 | ||||
| Original Amortization Term: | 360 months | UW NOI Debt Yield: | 9.6% | ||||
| IO Period: | 60 months | UW NOI Debt Yield at Maturity: | 10.5% | ||||
| Seasoning: | 0 months | UW NCF DSCR: | 1.55x (P&I) 2.14x (IO) | ||||
| Prepayment Provisions(1): | LO (24); DEF (89); O (7) | Most Recent NOI: | $4,887,064 (8/31/2019 TTM) | ||||
| Lockbox/Cash Mgmt Status: | Springing/Springing | 2nd Most Recent NOI: | $4,578,027 (12/31/2018) | ||||
| Additional Debt Type: | N/A | 3rd Most Recent NOI: | $4,046,846 (12/31/2017) | ||||
| Additional Debt Balance: | N/A | Most Recent Occupancy: | 94.1% (10/4/2019) | ||||
| Future Debt Permitted (Type): | No (N/A) | 2nd Most Recent Occupancy: | 92.5% (12/31/2018) | ||||
| Reserves(2) | 3rd Most Recent Occupancy: | 87.6% (12/31/2017) | |||||
| Type | Initial | Monthly | Cap | Appraised Value (as of): | $71,090,000 (9/10/2019) | ||
| RE Tax: | $502,532 | $41,878 | N/A | Appraised Value per Unit: | $85,961 | ||
| Insurance: | $0 | Springing | N/A | Cut-off Date LTV Ratio: | 72.7% | ||
| Capital Expenditures: | $1,000,000 | $20,626 | N/A | Maturity Date LTV Ratio: | 66.4% | ||
| Required Repairs: | $82,283 | $0 | N/A | ||||
| Sources and Uses | ||||||
| Sources | Proceeds | % of Total | Uses | Proceeds | % of Total | |
| Loan Amount: | $51,715,000 | 71.2% | Purchase Price: | $69,000,000 | 95.0% | |
| Borrower Equity: | $20,948,047 | 28.8% | Closing Costs: | $2,078,232 | 2.9% | |
| Reserves: | $1,584,815 | 2.2% | ||||
| Total Sources: | $72,663,047 | 100.0% | Total Uses: | $72,663,047 | 100.0% | |
| (1) | Partial prepayment, with yield maintenance if prior to the open period, is also permitted after the date that is two years following the Closing Date, in connection with a partial release, as described under “Release of Property” below. |
| (2) | See “Escrows and Reserves” below for further discussion of reserve requirements. |
The Mortgage Loan. The ninth largest mortgage loan (the “Oklahoma Multifamily Portfolio Mortgage Loan”) is evidenced by one promissory note in the original principal balance of $51,715,000. The Oklahoma Multifamily Portfolio Mortgage Loan is secured by a first priority fee mortgage encumbering five multifamily properties located in Oklahoma (the “Oklahoma Multifamily Portfolio” or “Oklahoma Multifamily Portfolio Properties”).
The Borrowers and the Borrower Sponsor. The borrowers are 93 Twenty Apartment Ventures, LLC; Charleston Crossing Apartment Ventures, LLC; Countryside Village Apartment Ventures, LLC; Inverness Apartment Ventures, LLC; Ridge Park Apartment Ventures, LLC (collectively, the “Oklahoma Multifamily Portfolio Borrowers”), each a Delaware limited liability company structured to be bankruptcy-remote with one independent director. Alon Yonatan is the non-recourse carveout guarantor and the borrower sponsor with respect to the Oklahoma Multifamily Portfolio Mortgage Loan. Alon Yonatan is the founder, chairman and chief executive officer of The Ferndale Realty Group, a real estate investment company focused on the acquisition and ongoing operations of apartment communities throughout the United States. The Ferndale Realty Group’s real estate portfolio is comprised of 15 properties across five states, in addition to the Oklahoma Multifamily Portfolio Properties.
The Properties. The Oklahoma Multifamily Portfolio is comprised of five multifamily properties totaling 827 units located across Oklahoma. The Oklahoma Multifamily Portfolio Properties were constructed between 1982 and 1987. The Oklahoma Multifamily Portfolio Properties range in size from 91 to 360 units, with an average count of 165 units. As of October 4, 2019, the Oklahoma Multifamily Portfolio was 94.1% occupied. According to the borrower sponsor, since 2015, the seller has invested approximately $5.8 million ($7,029 per unit) in capital improvements across the Oklahoma Multifamily Portfolio Properties in the aggregate.
Countryside Village Apartments
The “Countryside Village Property” is a 360-unit garden style apartment complex that is located in Moore, Oklahoma. The Countryside Village Property was built in 1985 and is comprised of 37 two-story residential buildings, which include the clubhouse and leasing office, and two non-residential buildings. Additional amenities include an indoor/outdoor swimming pool, courtyard seating areas with fire pits, children’s playground, dog park, fitness
| This is not a research report and was not prepared by any Underwriter’s research department. Please see additional important information and qualifications at the end of this Term Sheet. |
T-102
| Multifamily - Garden | Loan #9 | Cut-off Date Balance: | $51,715,000 | |
| Various | Oklahoma Multifamily Portfolio | Cut-off Date LTV: | 72.7% | |
| Various, OK | U/W NCF DSCR: | 1.55x | ||
| U/W NOI Debt Yield: | 9.6% |
center, tennis court and laundry facilities. The Countryside Village Property has 653 surface parking spaces (1.8 parking spaces per unit). The unit mix consists of 162 one bedroom units, 62 two bedroom/one bathroom units, and 136 two bedroom/two bathroom units. All units feature washer/dryer connections and either a balcony or patio. Select units include a wood-burning fireplace, breakfast counter, full-size pantry, and washer/dryer set. As of October 4, 2019, the Countryside Village Property was 93.3% occupied. According to the borrower sponsor, since 2015, the seller has invested approximately $2.5 million ($7,013 per unit) in capital improvements at the Countryside Village Property. Of the total amount, approximately $1.4 million was invested in exterior and amenity upgrades and approximately $1.1 million was invested in the upgrade of 278 units.
93 Twenty Apartments
The “93 Twenty Apartments Property” is a 152-unit garden style apartment complex that is located in Tulsa, Oklahoma. The 93 Twenty Apartments Property was built in 1985 and is comprised of 22 two-story residential buildings, which include the clubhouse and leasing office, and one non-residential building. Additional amenities include a fitness center, a swimming pool, a dog park, landscaped ponds with fountains and a barbecue/picnic area. The 93 Twenty Apartments Property has 236 surface and garage parking spaces (1.6 parking spaces per unit). The unit mix consists of 38 one bedroom units, 76 two bedroom/ 2 bathroom units, and 38 two bedroom/2.5 bathroom units. All units feature wood-burning fireplaces, washer/dryer and either a balcony or patio. Select units have vaulted ceilings, track lighting and additional storage space in the form of a full pantry and/or separate linen closet. As of October 4, 2019, the 93 Twenty Apartments Property was 97.4% occupied. According to the borrower sponsor, since 2015, the seller has invested $846,546 ($5,569 per unit) in capital improvements at the 93 Twenty Apartments Property. Of the total amount, $530,222 was invested in exterior and amenity upgrades and $316,324 was invested in the upgrade of 122 units.
Charleston Crossing Apartments
The “Charleston Crossing Apartments Property” is a 124-unit garden style apartment complex that is located in Broken Arrow, Oklahoma. The Charleston Crossing Apartments Property was built in 1984 and is comprised of 16 two-story residential buildings, which include the clubhouse and leasing office, and one non-residential building. Additional amenities include a swimming pool, a dog park and a common laundry area. The Charleston Crossing Apartments Property has 248 surface parking spaces (2.0 parking spaces per unit). The unit mix consists of 61 one bedroom units, and 63 two bedroom units. All units feature either a balcony or patio. Select units include wood-burning fireplaces, pass through kitchens with espresso cabinetry, stainless steel kitchen sink with garbage disposal, and full size washer dryer sets and/or washer dryer hookups. As of October 4, 2019, the Charleston Crossing Apartments Property was 92.7% occupied. According to the borrower sponsor, since 2015, the seller has invested approximately $1.0 million ($8,457 per unit) in capital improvements at the Charleston Crossing Apartments Property. Of the total amount, $424,260 was invested in exterior and amenity upgrades and $624,465 was invested in the upgrade of 102 units.
Ridge Park Apartments
The “Ridge Park Apartments Property” is a 100-unit garden style apartment complex that is located in Tulsa, Oklahoma. The Ridge Park Apartments Property was built in 1982 and is comprised of 10 two-story residential buildings, which include the clubhouse and leasing office, and one non-residential building. Additional amenities include a fitness center, business center, an indoor/outdoor swimming pool and a common laundry facility. The Ridge Park Apartments Property has 186 surface parking spaces (1.9 parking spaces per unit). The unit mix consists of 52 one bedroom units, 44 two bedroom/two bathroom units, and four, two bedroom/1.5 bathroom units. All units have washer/dryer connections, wood-burning fireplaces, stainless steel double sink, ample storage space and either a patio or balcony. Select units feature vaulted ceilings, additional closet space, full pantry, built-in lighting and/or high quality appliances. As of October 4, 2019, the Ridge Park Apartments Property was 93.0% occupied. According to the borrower sponsor, since 2015, the seller has invested $668,423 ($6,684 per unit) in capital improvements at the Ridge Park Apartments Property. Of the total amount, $276,422 was invested in exterior and amenity upgrades and $392,002 was invested in the upgrade of 80 units.
Inverness Apartments
The “Inverness Apartments Property” is a 91-unit garden style apartment complex that is located in Broken Arrow, Oklahoma. The Inverness Apartments Property was built in 1987 and is comprised of nine two-story residential buildings, which include the clubhouse and leasing office, and one non-residential building. Additional amenities include an indoor/outdoor swimming pool, a common laundry facility and a fitness center. The Inverness Apartments Property has 183 surface parking spaces (2.0 parking spaces per unit). The unit mix consists of 16 one bedroom/1 bathroom units, 26 one bedroom/1.5 bathroom units, 17 two bedroom/two bathroom units, and 32 two bedroom/2.5 bathroom units. Select units feature wood-burning fireplaces, vaulted ceilings, balcony/patio, stainless steel kitchen sinks with garbage disposal, high quality appliances, full size washer dryer sets and/or washer dryer hookups. As of October 4, 2019, the Inverness Apartments Property was 94.5% occupied. According to the borrower sponsor, since 2015, the seller has invested $724,964 ($7,967 per unit) in capital improvements at the Inverness Apartments Property. Of the total amount, $316,203 was invested in exterior and amenity upgrades and $408,761 was invested in the upgrade of 80 units.
The following table presents detailed information with respect to each of the Oklahoma Multifamily Portfolio Properties included in the Oklahoma Multifamily Portfolio:
| Oklahoma Multifamily Portfolio Properties Summary | ||||||||
| Building | Occ. %(1) | Units(1) | % of Total Units | Appraised Value | Allocated Loan Amount (“ALA”) | % of ALA | UW NOI | % of UW NOI |
| Countryside Village Apartments | 93.3% | 360 | 43.5% | $29,200,000 | $21,240,000 | 41.1% | $2,071,417 | 41.8% |
| 93 Twenty Apartments | 97.4% | 152 | 18.4% | $14,890,000 | $10,830,000 | 20.9% | $1,041,265 | 21.0% |
| Charleston Crossing Apartments | 92.7% | 124 | 15.0% | $10,290,000 | $7,490,000 | 14.5% | $671,904 | 13.6% |
| Ridge Park Apartments | 93.0% | 100 | 12.1% | $8,910,000 | $6,480,000 | 12.5% | $618,536 | 12.5% |
| Inverness Apartments | 94.5% | 91 | 11.0% | $7,800,000 | $5,675,000 | 11.0% | $549,253 | 11.1% |
| Total/Wtd. Avg. | 94.1% | 827 | 100.0% | $71,090,000 | $51,715,000 | 100.0% | $4,952,375 | 100.0% |
| (1) | Based on the Oklahoma Multifamily Portfolio Borrowers’ rent roll dated October 4, 2019. |
| This is not a research report and was not prepared by any Underwriter’s research department. Please see additional important information and qualifications at the end of this Term Sheet. |
T-103
| Multifamily - Garden | Loan #9 | Cut-off Date Balance: | $51,715,000 | |
| Various | Oklahoma Multifamily Portfolio | Cut-off Date LTV: | 72.7% | |
| Various, OK | U/W NCF DSCR: | 1.55x | ||
| U/W NOI Debt Yield: | 9.6% |
The Market. The Countryside Village Apartments Property is located within the Norman-Moore submarket of the Oklahoma City multifamily market. According to the appraisal, as of the second quarter of 2019, the vacancy rate in the Oklahoma City multifamily market was approximately 6.0%, with average asking rents of $768 per unit and inventory of approximately 99,373 units. According to the appraisal, as of the second quarter of 2019, the vacancy rate in the Norman-Moore submarket was approximately 5.9%, with average asking rents of $745 per unit and inventory of approximately 19,500 units. According to the appraisal, the 2018 population within a one-, three- and five-mile radius of the Countryside Village Apartments Property was 8,293, 83,990 and 221,153, respectively. The 2018 average household income within the same one-, three- and five-mile radius was $59,730, $66,600 and $66,314, respectively.
The 93 Twenty Apartments Property, Charleston Crossing Apartments Property, Ridge Park Apartments Property and Inverness Apartments Property are located within the South Tulsa-Broken Arrow submarket of the Tulsa multifamily market. According to the appraisal, as of the second quarter of 2019, the vacancy rate in the Tulsa multifamily market was approximately 5.7%, with average asking rents of $725 per unit and inventory of approximately 69,055 units. According to the appraisal, as of the second quarter of 2019, the vacancy rate in the South Tulsa-Broken Arrow submarket was approximately 5.6%, with average asking rents of $780 per unit and inventory of approximately 19,895 units. According to the appraisal, the 2018 population within a one-, three- and five-mile radius of the 93 Twenty Apartments Property was 8,488, 67,324 and 174,020, respectively. The 2018 average household income within the same one-, three- and five-mile radius was $91,193, $101,548 and $91,593, respectively. According to the appraisal, the 2018 population within a one-, three- and five-mile radius of the Charleston Crossing Apartments Property was 12,201, 53,864 and 114,566, respectively. The 2018 average household income within the same one-, three- and five-mile radius was $74,391, $85,106 and $90,168, respectively. According to the appraisal, the 2018 population within a one-, three- and five-mile radius of the Ridge Park Apartments Property was 11,731, 96,609 and 205,874, respectively. The 2018 average household income within the same one-, three- and five-mile radius was $93,499, $86,173 and $88,307, respectively. According to the appraisal, the 2018 population within a one-, three- and five-mile radius of the Inverness Apartments Property was 12,201, 53,864 and 114,566, respectively. The 2018 average household income within the same one-, three- and five-mile radius was $74,391, $85,106 and $90,168, respectively.
The following table presents certain information relating to the appraiser’s market rent conclusion for the Oklahoma Multifamily Portfolio Properties:
| Market Rent Summary | ||||||
| Building | Units | Avg. Size | Avg. Monthly In Place Rent per Unit | Avg. Monthly In Place Rent PSF | Avg. Monthly Market Rent per Unit | Avg. Monthly Market Rent PSF |
| Countryside Village Apartments | 360 | 842 | $729 | $0.87 | $746 | $0.89 |
| 93 Twenty Apartments | 152 | 1,035 | $910 | $0.88 | $914 | $0.88 |
| Charleston Crossing Apartments | 124 | 776 | $743 | $0.96 | $748 | $0.96 |
| Ridge Park Apartments | 100 | 950 | $821 | $0.86 | $828 | $0.87 |
| Inverness Apartments | 91 | 857 | $753 | $0.88 | $756 | $0.88 |
Source:Appraisal
The following table presents certain information relating to comparable rental properties to the Countryside Village Property:
| Comparable Rental Properties (Countryside Village Property) | ||||||
| Property | Year Built | # Units | Unit Mix | Average SF per Unit | Average Rent per Unit | Average Monthly Rent PSF |
| Countryside Village Property | 1985 | 360 | 1BR 2BR | 708 951 | $675 $774 | $0.95 $0.81 |
Hayden’s Landing Moore, OK | 1974 | 85 | 1BR 2BR 3BR | 697 874 1,070 | $610 $773 $897 | $0.88 $0.88 $0.84 |
Cape Cod Oklahoma City, OK | 1985 | 79 | Studio 1BR 2BR 3BR | 550 700 958 1,200 | $629 $679 $845 $969 | $1.14 $0.97 $0.88 $0.81 |
Country Creek Oklahoma City, OK | 1985 | 320 | Studio 1BR 2BR | 500 600 800 | $569 $654 $824 | $1.14 $1.09 $1.03 |
Eastlake Village Oklahoma City, OK | 1984 | 176 | 1BR 2BR | 600 730 | $666 $761 | $1.11 $1.04 |
| This is not a research report and was not prepared by any Underwriter’s research department. Please see additional important information and qualifications at the end of this Term Sheet. |
T-104
| Multifamily - Garden | Loan #9 | Cut-off Date Balance: | $51,715,000 | |
| Various | Oklahoma Multifamily Portfolio | Cut-off Date LTV: | 72.7% | |
| Various, OK | U/W NCF DSCR: | 1.55x | ||
| U/W NOI Debt Yield: | 9.6% |
The following table presents certain information relating to comparable rental properties to the Charleston Crossing Apartments and the Inverness Apartments Properties (which are located within a half mile of each other):
| Comparable Rental Properties (Charleston Crossing Apartments and Inverness Apartments) | ||||||
| Property | Year Built | # Units | Unit Mix | Average SF per Unit | Average Rent per Unit | Average Monthly Rent PSF |
| Charleston Crossing Apartments | 1984 | 124 | 1BR 2BR | 648 900 | $677 $811 | $1.04 $0.90 |
| Inverness Apartments | 1987 | 91 | 1BR 2BR | 655 1,031 | $664 $835 | $1.01 $0.81 |
Hickory Grove Apartments Broken Arrow, OK | 1984 | 160 | 1BR 2BR | 700 900 | $656 $772 | $0.94 $0.86 |
Aspen Village Broken Arrow, OK | 1995 | 176 | 1BR 2BR 3BR | 706 955 1,116 | $736 $840 $1,120 | $1.04 $0.88 $1.00 |
Carlyle Broken Arrow, OK | 1979 | 116 | 1BR 2BR 3BR | 693 925 1,174 | $685 $831 $980 | $0.99 $0.90 $0.83 |
The following table presents certain information relating to comparable rental properties to the 93 Twenty Apartments and the Ridge Park Apartments Properties (which are located within three miles of each other):
| Comparable Rental Properties (93 Twenty Apartments and Ridge Park Apartments Properties) | ||||||
| Property | Year Built | # Units | Unit Mix | Average SF per Unit | Average Rent per Unit | Average Monthly Rent PSF |
| 93 Twenty Apartments | 1985 | 152 | 1BR 2BR | 715 1,142 | $771 $958 | $1.08 $0.84 |
| Ridge Park Apartments | 1982 | 100 | 1BR 2BR | 819 1,092 | $748 $897 | $0.91 $0.82 |
Sheridan Pond Tulsa, OK | 1984 | 240 | 1BR 2BR 3BR | 727 1,169 1,500 | $768 $1,027 $1,239 | $1.06 $0.88 $0.83 |
The Courtyards Tulsa, OK | 1986 | 272 | 1BR 2BR | 639 963 | $712 $874 | $1.12 $0.91 |
Ridgemont Apartments Tulsa, OK | 1980 | 168 | 1BR 2BR | 638 925 | $563 $750 | $0.88 $0.81 |
Crown Chase Tulsa, OK | 1996 | 287 | 1BR 2BR | 837 1,098 | $709 $853 | $0.85 $0.78 |
Pepper Tree Tulsa, OK | 1983 | 97 | 1BR 2BR | 850 1,000 | $642 $870 | $0.76 $0.87 |
| This is not a research report and was not prepared by any Underwriter’s research department. Please see additional important information and qualifications at the end of this Term Sheet. |
T-105
| Multifamily - Garden | Loan #9 | Cut-off Date Balance: | $51,715,000 | |
| Various | Oklahoma Multifamily Portfolio | Cut-off Date LTV: | 72.7% | |
| Various, OK | U/W NCF DSCR: | 1.55x | ||
| U/W NOI Debt Yield: | 9.6% |
Operating History and Underwritten Net Cash Flow.The following table presents certain information relating to the historical operating performance and the Underwritten Net Cash Flow of the Oklahoma Multifamily Portfolio:
| Cash Flow Analysis | ||||||
| 2016 | 2017 | 2018 | 8/31/2019 TTM | UW | UW PSF | |
| Gross Potential Rent | $7,602,764 | $7,673,532 | $7,578,288 | $7,645,402 | $7,772,904 | $9,398.92 |
| Concessions | ($115,596) | ($205,712) | ($49,711) | ($9,077) | ($16,153) | ($19.53) |
| Other Income | $690,102 | $729,726 | $799,735 | $798,716 | $798,716 | $965.80 |
| Vacancy | ($1,248,549) | ($1,102,580) | ($568,746) | ($461,914) | ($496,558) | ($600.43) |
| Effective Gross Income | $6,928,720 | $7,094,966 | $7,759,566 | $7,973,128 | $8,058,910 | $9,744.75 |
| Real Estate Taxes | $461,061 | $464,439 | $484,688 | $502,262 | $502,539 | $607.67 |
| Insurance | $126,046 | $120,983 | $127,643 | $140,772 | $138,785 | $167.82 |
| Other Expenses | $2,496,435 | $2,462,698 | $2,569,208 | $2,443,030 | $2,465,210 | $2,980.91 |
| Total Expenses | $3,083,542 | $3,048,120 | $3,181,539 | $3,086,064 | $3,106,534 | $3,756.39 |
| Net Operating Income(1) | $3,845,178 | $4,046,846 | $4,578,027 | $4,887,064 | $4,952,375 | $5,988.36 |
| Capital Expenditures | $0 | $0 | $0 | $0 | $247,511 | $299.29 |
| Net Cash Flow | $3,845,178 | $4,046,846 | $4,578,027 | $4,887,064 | $4,704,864 | $5,689.07 |
| Occupancy % | 85.8% | 87.6% | 92.5% | 94.1%(1) | 93.6% | |
| NOI DSCR (IO) | 1.75x | 1.84x | 2.08x | 2.22x | 2.25x | |
| NOI DSCR (P&I) | 1.27x | 1.34x | 1.51x | 1.61x | 1.63x | |
| NCF DSCR (IO) | 1.75x | 1.84x | 2.08x | 2.22x | 2.14x | |
| NOI DSCR (P&I) | 1.27x | 1.34x | 1.51x | 1.61x | 1.55x | |
| NOI Debt Yield | 7.4% | 7.8% | 8.9% | 9.4% | 9.6% | |
| NCF Debt Yield | 7.4% | 7.8% | 8.9% | 9.4% | 9.1% | |
(1) As of the underwritten rent roll dated October 4, 2019, the Oklahoma Multifamily Portfolio is 94.1% occupied.
Escrows and Reserves.
Tax Funds – The Oklahoma Multifamily Portfolio Mortgage Loan documents provide for an upfront reserve of $502,532 for real estate taxes and ongoing monthly reserves for real estate taxes in an amount equal to 1/12 of the real estate taxes that the lender estimates will be payable during the next twelve months (initially, $41,878).
Insurance– The Oklahoma Multifamily Portfolio Mortgage Loan documents provide for monthly reserves for insurance premiums in an amount equal to 1/12 of the insurance premiums that the lender estimates will be payable for the renewal of coverage upon the expiration of the insurance policies; provided that such monthly reserves are not required so long as (i) no event of default has occurred and is continuing, (ii) the insurance coverage for each Oklahoma Multifamily Portfolio Property is included in a blanket policy approved by the lender in its reasonable discretion, and (iii) the Oklahoma Multifamily Portfolio Borrowers provide the lender with evidence of payment of the insurance premiums and renewals of the insurance policies, no later than ten days prior to the expiration of the current policy.
Capital Expenditure Reserves – The Oklahoma Multifamily Portfolio Mortgage Loan documents provide for an upfront reserve of $1,000,000 for capital expenditures and ongoing reserves of $250 per unit per year at the improvements for capital expenditures.
Required Repairs Funds – The Oklahoma Multifamily Portfolio Mortgage Loan documents provide for an upfront reserve of $82,283 for required repairs.
Lockbox and Cash Management.The Oklahoma Multifamily Portfolio Mortgage Loan is structured with a springing lockbox and springing cash management. Upon the occurrence of an event of default under the Oklahoma Multifamily Portfolio Mortgage Loan, the cash management agreement requires the borrower to establish a lockbox account (established as a collection of accounts each relating to one Oklahoma Multifamily Portfolio Property) and permits the lender, in its discretion, to establish a cash management account for each Oklahoma Multifamily Portfolio Property and entitles the lender to deliver written notice to the lockbox banks directing them to disburse all available funds then and thereafter on deposit in each lockbox accounts during the continuance of an event of default to the related cash management account in accordance with the terms of the lockbox agreements. The lender is required to terminate the direction if the event of default is cured (if applicable).
During the continuance of an event of default, all funds in the cash management account are required to be applied on each monthly payment date: (i) to make the monthly deposit into the real estate tax and insurance reserve as described above under “Escrows and Reserves,” (ii) to pay debt service on the Oklahoma Multifamily Portfolio Mortgage Loan, (iii) to make the monthly deposit into the capital expenditure reserve, as described above under “Escrows and Reserves,” (iv) to pay operating expenses set forth in the annual budget (which is not required to be approved by the lender) and other expenses approved by the lender, and (v) to deposit any remainder (A) during the continuance of an event of default, into an excess cash subaccount and (B) if an event of default has occurred but has thereafter been cured, to the Oklahoma Multifamily Portfolio Borrowers. Notwithstanding the foregoing, during the continuation of an event of default the lender has the right to withdraw and apply funds in the lockbox and cash management accounts to payment of any and all debts, liabilities and obligations of the Oklahoma Multifamily Portfolio Borrowers pursuant to or in connection with the Oklahoma Multifamily Portfolio Mortgage Loan documents.
| This is not a research report and was not prepared by any Underwriter’s research department. Please see additional important information and qualifications at the end of this Term Sheet. |
T-106
| Multifamily - Garden | Loan #9 | Cut-off Date Balance: | $51,715,000 | |
| Various | Oklahoma Multifamily Portfolio | Cut-off Date LTV: | 72.7% | |
| Various, OK | U/W NCF DSCR: | 1.55x | ||
| U/W NOI Debt Yield: | 9.6% |
Additional Secured Indebtedness (not including trade debts).None.
Mezzanine Loan and Preferred Equity.Not permitted.
Release of Property.The Oklahoma Multifamily Portfolio Borrowers have the right, at any time after the date that is two years following the Closing Date, and provided no event of default under the Oklahoma Multifamily Portfolio Mortgage Loan documents exists, to obtain the release of any of the individual Oklahoma Multifamily Portfolio Properties, provided certain conditions are satisfied, including payment of a release price equal to 110% of the allocated loan amount of the related individual property, together with, if then-applicable, a prepayment premium equal to the greater of 1.00% of the amount prepaid and a yield maintenance premium; (ii) the aggregate debt yield of the Oklahoma Multifamily Portfolio Mortgage Loan after giving effect to the release is not less than the greater of (x) the aggregate debt yield immediately prior to the release and (y) 8.80%; (iii) the aggregate debt service coverage ratio of the Oklahoma Multifamily Portfolio Mortgage Loan after giving effect to the release is not less than the greater of (x) the aggregate debt service coverage ratio immediately prior to the release and (y) 1.45x; and (iv) satisfaction of REMIC-related requirements.
Ground Lease.None.
Letter of Credit.None.
Right of First Refusal/Right of First Offer. None.
Terrorism Insurance. The Oklahoma Multifamily Portfolio Borrowers are required to obtain and maintain an “all risk” property insurance policy that covers perils of terrorism and acts of terrorism in an amount equal to the “full replacement cost” of the Oklahoma Multifamily Portfolio Properties together with business income insurance covering not less than the 18-month period commencing at the time of loss, together with an extended period of indemnity endorsement of not less than six months. Notwithstanding the foregoing, for so long as the Terrorism Risk Insurance Act of 2002, as extended and modified by the Terrorism Risk Insurance Program Reauthorization Act of 2015 (“TRIPRA”) is in effect (including any extensions thereof or if another federal governmental program is in effect relating to “acts of terrorism” which provides substantially similar protections as TRIPRA), and covers both domestic and foreign acts of terrorism, the lender is required to accept terrorism insurance which insures against “covered acts” as defined by TRIPRA (or such other program). See“Risk Factors—Risks Relating to the Mortgage Loans—Terrorism Insurance May Not Be Available for All Mortgaged Properties”in the Preliminary Prospectus.
| This is not a research report and was not prepared by any Underwriter’s research department. Please see additional important information and qualifications at the end of this Term Sheet. |
T-107
| Multifamily – Mid Rise | Loan #10 | Cut-off Date Balance: | $50,400,000 | |
| Various | FTERE Bronx Multifamily Portfolio | Cut-off Date LTV: | 67.6% | |
| Bronx, NY | U/W NCF DSCR: | 2.00x | ||
| U/W NOI Debt Yield: | 7.8% |
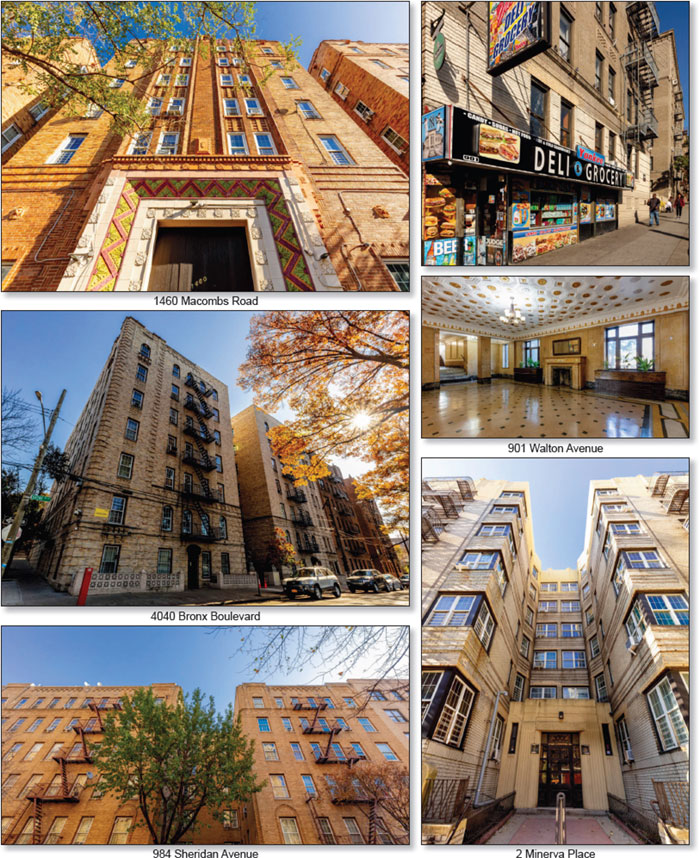
| This is not a research report and was not prepared by any Underwriter’s research department. Please see additional important information and qualifications at the end of this Term Sheet. |
T-108
| Multifamily – Mid Rise | Loan #10 | Cut-off Date Balance: | $50,400,000 | |
| Various | FTERE Bronx Multifamily Portfolio | Cut-off Date LTV: | 67.6% | |
| Bronx, NY | U/W NCF DSCR: | 2.00x | ||
| U/W NOI Debt Yield: | 7.8% |
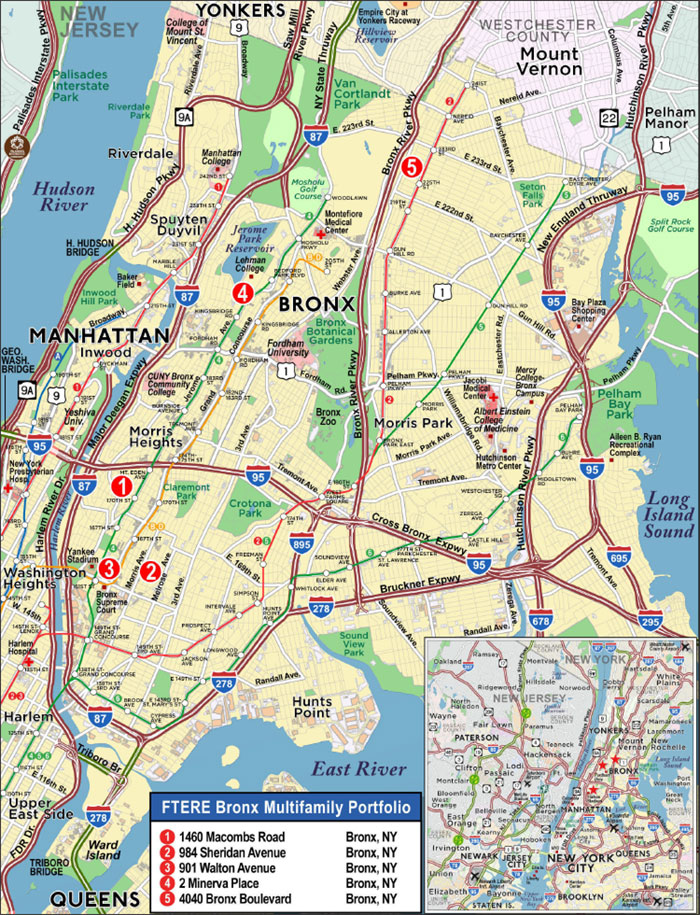
| This is not a research report and was not prepared by any Underwriter’s research department. Please see additional important information and qualifications at the end of this Term Sheet. |
T-109
| Mortgage Loan No. 10 – FTERE Bronx Multifamily Portfolio |
| Mortgage Loan Information | Property Information | ||||||
| Mortgage Loan Seller: | MSMCH | Single Asset/Portfolio: | Portfolio | ||||
| Credit Assessment (KBRA/Fitch/S&P): | NR/NR/NR | Location: | Bronx, NY | ||||
| Original Balance: | $50,400,000 | General Property Type: | Multifamily | ||||
| Cut-off Date Balance: | $50,400,000 | Detailed Property Type: | Mid Rise | ||||
| % of Initial Pool Balance: | 3.9% | Title Vesting: | Fee | ||||
| Loan Purpose: | Refinance | Year Built/Renovated: | Various/N/A | ||||
| Borrower Sponsor: | Finkelstein Timberger East Real Estate | Size: | 355 Units | ||||
| Guarantor: | Richard Timberger | Cut-off Date Balance per Unit: | $141,972 | ||||
| Mortgage Rate: | 3.7800% | Maturity Date Balance per Unit: | $141,972 | ||||
| Note Date: | 11/5/2019 | Property Manager: | Finkelstein Timberger LLC | ||||
| First Payment Date: | 1/1/2020 | (borrower-related) | |||||
| Maturity Date: | 12/1/2029 | ||||||
| Original Term to Maturity: | 120 months | ||||||
| Original Amortization Term: | 0 months | Underwriting and Financial Information | |||||
| IO Period: | 120 months | UW NOI: | $3,950,116 | ||||
| Seasoning: | 0 months | UW NOI Debt Yield: | 7.8% | ||||
| Prepayment Provisions: | LO (24); DEF (89); O (7) | UW NOI Debt Yield at Maturity: | 7.8% | ||||
| Lockbox/Cash Mgmt Status: | Springing/Springing | UW NCF DSCR: | 2.00x | ||||
| Additional Debt Type: | N/A | Most Recent NOI: | $3,633,329 (Various) | ||||
| Additional Debt Balance: | N/A | 2nd Most Recent NOI: | $3,598,986 (12/31/2018) | ||||
| Future Debt Permitted (Type): | No (N/A) | 3rd Most Recent NOI: | $3,434,921 (12/31/2017) | ||||
| Reserves(1) | Most Recent Occupancy: | 99.2% (10/1/2019) | |||||
| Type | Initial | Monthly | Cap | 2nd Most Recent Occupancy: | 99.7% (12/31/2018) | ||
| RE Tax: | $116,223 | $58,112 | N/A | 3rd Most Recent Occupancy: | 99.7% (12/31/2017) | ||
| Insurance: | $0 | Springing | N/A | Appraised Value (as of): | $74,600,000 (Various) | ||
| Recurring Replacements: | $0 | $7,834 | N/A | Appraised Value per Unit: | $210,141 | ||
| Deferred Maintenance: | $69,384 | $0 | N/A | Cut-off Date LTV Ratio: | 67.6% | ||
| J-51 Exemption: | $3,400,000 | $0 | N/A | Maturity Date LTV Ratio: | 67.6% | ||
| Sources and Uses | ||||||
| Sources | Proceeds | % of Total | Uses | Proceeds | % of Total | |
| Loan Amount: | $50,400,000 | 99.8% | Loan Payoff: | $46,021,533 | 91.2% | |
| Borrower Equity: | $79,308 | 0.2% | Reserves: | $3,585,607 | 7.1% | |
| Closing Costs: | $872,168 | 1.7% | ||||
| Total Sources: | $50,479,308 | 100.0% | Total Uses: | $50,479,308 | 100.0% | |
| (1) | See “Escrows and Reserves” below for further discussion of reserve requirements. |
The Mortgage Loan. The tenth largest mortgage loan (the “FTERE Bronx Multifamily Portfolio Mortgage Loan”) is evidenced by one promissory note in the original principal balance of $50,400,000. The FTERE Bronx Multifamily Portfolio Mortgage Loan is secured by a first priority fee mortgage encumbering five multifamily properties located in The Bronx, New York (the “FTERE Bronx Multifamily Portfolio” or “FTERE Bronx Multifamily Portfolio Properties”).
The Borrowers and the Borrower Sponsor. The borrowers are HAF Associates LLC D, 901 Walton Avenue Realty LLC D, N.J.Z. Company LLC D, Buddy Associates LLC D and 4040 BA LLC D (collectively, the “FTERE Bronx Multifamily Portfolio Borrowers”), each a Delaware limited liability company structured to be bankruptcy-remote with one independent director. Richard Timberger is the non-recourse carveout guarantor and Finkelstein Timberger East Real Estate is the borrower sponsor with respect to the FTERE Bronx Multifamily Portfolio Mortgage Loan. Finkelstein Timberger East Real Estate is a real estate company that owns and manages residential apartment buildings located throughout various parts of Bronx County, New York. Finkelstein Timberger East Real Estate is run by Steven Finkelstein, Richard Timberger and Tony East.
The Properties. The FTERE Bronx Multifamily Portfolio is comprised of five rent stabilized multifamily properties totaling 355 units located in The Bronx, New York. The FTERE Bronx Multifamily Portfolio Properties were constructed between 1927 and 1938. As of October 1, 2019, the multifamily space at the FTERE Bronx Multifamily Portfolio was 99.2% occupied. In addition, certain of the FTERE Bronx Multifamily Portfolio Properties have commercial space, which was 100.0% occupied as of October 1, 2019. Occupancy at the FTERE Bronx Multifamily Portfolio has been in excess of 99.0% since 2014. The borrower sponsor has invested approximately $8.2 million ($23,130 per unit) in capital improvements across the Properties in the aggregate. All of the FTERE Bronx Multifamily Portfolio Properties either benefit from a J-51 exemption and abatement program or a major capital improvement program (“MCI”) or are awaiting approval of an application for a J-51 exemption and abatement program or an application to increase rent under the MCI program. Under the J-51 program, the tax exemption benefit temporarily exempts a property from the increase in assessed value which would otherwise occur as a result of significant renovation work. The abatement portion of the program reduces the existing taxes by a percentage of the certified reasonable costs of the work performed as determined by the Department of Finance. The MCI program allows landlords to increase rents (subject to
| This is not a research report and was not prepared by any Underwriter’s research department. Please see additional important information and qualifications at the end of this Term Sheet. |
T-110
| Multifamily – Mid Rise | Loan #10 | Cut-off Date Balance: | $50,400,000 | |
| Various | FTERE Bronx Multifamily Portfolio | Cut-off Date LTV: | 67.6% | |
| Bronx, NY | U/W NCF DSCR: | 2.00x | ||
| U/W NOI Debt Yield: | 7.8% |
certain limits) paid by rent stabilized tenants to recoup renovation and rehabilitation costs. For the FTERE Bronx Multifamily Portfolio Properties at which benefits have not been approved, there is a $3.4 million holdback in place.
The following table presents detailed information with respect to each of the properties included in the FTERE Bronx Multifamily Portfolio:
| FTERE Bronx Multifamily Portfolio Properties Summary | ||||||||
| Building | Occ. %(1) | Units(1) | % of Total Units | Appraised Value | Allocated Loan Amount (“ALA”) | % of ALA | UW NOI | % of UW NOI |
| 1460 Macombs Road | 100.0% | 109 | 30.7% | $21,600,000 | $14,600,000 | 29.0% | $1,121,792 | 28.4% |
| 984 Sheridan Avenue | 100.0% | 78 | 22.0% | $15,600,000 | $10,500,000 | 20.8% | $835,086 | 21.1% |
| 901 Walton Avenue | 96.8% | 63 | 17.7% | $13,800,000 | $9,300,000 | 18.5% | $814,765 | 20.6% |
| 2 Minerva Place | 98.0% | 48 | 13.5% | $11,800,000 | $8,000,000 | 15.9% | $636,417 | 16.1% |
| 4040 Bronx Boulevard | 100.0% | 57 | 16.1% | $11,800,000 | $8,000,000 | 15.9% | $542,057 | 13.7% |
| Total/Wtd. Avg. | 99.2% | 355 | 100.0% | $74,600,000 | $50,400,000 | 100.0% | $3,950,116 | 100.0% |
| (1) | Based on the borrower rent roll dated October 1, 2019. |
The Properties.
1460 Macombs Road
The “1460 Macombs Road Property” is a six story, rent-stabilized, 109-unit mid rise apartment complex located in The Bronx, New York. The 1460 Macombs Road Property was built in 1930. The unit mix comprises studio, one-, two-, and three-bedroom floorplans, an NRA of 58,600 SF and an average unit size of 538 SF. As of October 1, 2019, the 1460 Macombs Road Property was 100.0% occupied, with average in place rent of $1,274/unit. Twelve units are leased to tenants who pay a portion of their rent with a Section 8 voucher. The borrower sponsor has invested approximately $2.5 million ($23,000 per unit) in capital improvements on the 1460 Macombs Road Property. The 1460 Macombs Road Property contains seven commercial tenants, which are 100% occupied and generate $246,240 in annual rent. The appraised value includes $3,400,000 attributable to the net present value of a J-51 tax abatement and exemption for the 1460 Macombs Road Property. The borrower filed for a J-51 exemption at the 1460 Macombs Road Property. As of the origination date, approval documentation for the J-51 exemption had not been received. As of the origination date, the 1460 Macombs Road Property benefits from two, 20-year J-51 tax abatements expiring in 2026 and 2020, respectively, under New York State’s J-51 tax abatement program. Real estate taxes were underwritten based on the applied for J-51 exemption and one in place J-51 abatement at the 1460 Macombs Road Property. The other abatement was not underwritten because it has a small remaining benefit of $1,624 and will expire in 2020. The abated taxes are $263,552 per annum, compared to estimated unabated taxes for the 2019 tax year of $415,428.
984 Sheridan Avenue
The “984 Sheridan Avenue Property” is a six story, rent-stabilized, 78-unit mid rise apartment complex located in The Bronx, New York. The 984 Sheridan Avenue Property was built in 1928. The unit mix comprises studio, one-, two-, three- and four-bedroom floorplans, an NRA of 73,200 SF and an average unit size of 938 SF. As of October 1, 2019, the 984 Sheridan Avenue Property was 100.0% occupied, with average in place rent of $1,347/unit. Eight units are leased to tenants who pay a portion of their rent with a Section 8 voucher. The borrower sponsor has invested approximately $1.8 million ($23,000 per unit) in capital improvements on the 984 Sheridan Avenue Property. The 984 Sheridan Avenue Property contains no commercial tenants. The appraised value includes $2,100,000 attributable to the net present value of a J-51 tax abatement and exemption for the 984 Sheridan Avenue Property. As of the origination date, the 984 Sheridan Avenue Property benefits from one, 20-year tax abatement under New York State’s J-51 tax abatement program expiring in 2026 and a 34-year J-51 exemption expiring 2037. Real estate taxes were underwritten based on the J-51 exemption and the J-51 abatement at the 984 Sheridan Avenue Property. The abated taxes are $80,776 per annum, compared to estimated unabated taxes for the 2019 tax year of $229,945.
901 Walton Avenue
The “901 Walton Avenue Property” is a six story, rent-stabilized, 63-unit mid rise apartment complex located in The Bronx, New York. The 901 Walton Avenue Property was built in 1927. The unit mix comprises studio, one-, two-, three- and four-bedroom floorplans, an NRA of 89,400 SF and an average unit size of 1,442 SF. As of October 1, 2019, the 901 Walton Avenue Property was 96.8% occupied, with average in place rent of $1,386/unit. Eleven units are leased to tenants who pay a portion of their rent with a Section 8 voucher. The borrower sponsor has invested approximately $1.5 million ($23,000 per unit) in capital improvements on the 901 Walton Avenue Property. The 901 Walton Avenue Property contains two commercial spaces, which are 100% occupied and generate $92,400 in annual rent. The appraised value includes $2,000,000 attributable to the net present value of a J-51 tax abatement and exemption for the 901 Walton Avenue Property and $800,000 attributable to an MCI program. As of the origination date, the 901 Walton Avenue Property benefits from three, 20-year tax abatements under New York State’s J-51 tax abatement program expiring in 2027 and 2028, a 34-year J-51 exemption expiring in 2050 and an MCI program rent increase. The borrower filed for an additional MCI program rent increase at the 901 Walton Avenue Property. As of the origination date, approval documentation had not been received for this additional rent increase. Real estate taxes were underwritten based on the J-51 exemption and all three of the J-51 abatements at the 984 Sheridan Avenue Property. The abated taxes are $58,326 per annum, compared to estimated unabated taxes for the 2019 tax year of $167,220.
2 Minerva Place
The “2 Minerva Place Property” is a six story, rent-stabilized, 48-unit mid rise apartment complex located in The Bronx, New York. The 2 Minerva Place Property was built in 1938. The unit mix comprises studio, one- and two-bedroom floorplans, an NRA of 48,600 SF and an average unit size of 1,013 SF. As of October 1, 2019, the 2 Minerva Place Property was 98.0% occupied, with average in place rent of $1,528/unit. One unit is leased to a tenant who pays a portion of their rent with a Section 8 voucher. The borrower sponsor has invested approximately $1.1 million ($23,479 per unit) in capital improvements on the 2 Minerva Place Property. The 2 Minerva Place Property contains no commercial tenants. The appraised value includes $1,200,000 attributable to the net present value of a J-51 tax abatement and exemption for the 2 Minerva Place Property. As of the origination date, the 2 Minerva Place Property benefits from five, 20-year tax abatements under New York State’s J-51 tax abatement program expiring in 2021, 2023, 2027 and 2028, a 34-year J-51 exemption expiring in 2050 and an MCI program rent increase. Real estate taxes were underwritten based on the J-51
| This is not a research report and was not prepared by any Underwriter’s research department. Please see additional important information and qualifications at the end of this Term Sheet. |
T-111
| Multifamily – Mid Rise | Loan #10 | Cut-off Date Balance: | $50,400,000 | |
| Various | FTERE Bronx Multifamily Portfolio | Cut-off Date LTV: | 67.6% | |
| Bronx, NY | U/W NCF DSCR: | 2.00x | ||
| U/W NOI Debt Yield: | 7.8% |
exemption and four of the five J-51 abatements at the 2 Minerva Place Property. The abated taxes are $47,978 per annum, compared to estimated unabated taxes for the 2019 tax year of $130,023.
4040 Bronx Boulevard
The “4040 Bronx Boulevard Property” is a six story, rent-stabilized, 57-unit mid rise apartment complex located in The Bronx, New York. The 4040 Bronx Boulevard Property was built in 1929. The unit mix comprises studio, one-, two- and three-bedroom floorplans, an NRA of 44,500 SF and an average unit size of 781 SF. As of October 1, 2019, the 4040 Bronx Boulevard Property was 100.0% occupied, with average in place rent of $1,245/unit. Four units are leased to tenants who pay a portion of their rent with a Section 8 voucher. The borrower sponsor has invested approximately $1.3 million ($23,404 per unit) in capital improvements on the 4040 Bronx Boulevard Property. The 4040 Bronx Boulevard Property contains no commercial tenants. The appraised value includes $1,300,000 attributable to the net present value of a J-51 tax abatement and exemption for the 4040 Bronx Boulevard Property and $2,200,000 attributable to an MCI program. The borrower filed for a J-51 tax abatement and exemption and MCI program rent increase at the 4040 Bronx Boulevard Property. As of the origination date, approval documentation had not been received. Real estate taxes were underwritten based on the pending J-51 exemption and J-51 abatement at the 4040 Bronx Boulevard Property. The abated taxes are $64,206 per annum, compared to estimated unabated taxes for the 2019 tax year of $162,861.
The Market. The FTERE Bronx Multifamily Portfolio is located in The Bronx, New York within the Bronx County submarket of the New York City residential market. According to the appraisal, as of the first quarter of 2019, the vacancy rate in the New York City residential market was approximately 4.5%, with average asking rents of $3,783 per unit and inventory of approximately 219,294 units. According to the appraisal, as of the first quarter of 2019, the vacancy rate in the Bronx County submarket was approximately 3.8%, with average asking rents of $1,384 per unit and inventory of approximately 149 units. Primary access to the FTERE Bronx Multifamily Portfolio Properties is provided by a number of major thoroughfares, bus lines through the MTA and numerous subway lines that connect the FTERE Bronx Multifamily Portfolio Properties to Manhattan. The FTERE Bronx Multifamily Portfolio neighborhood is located in a mixed-use area that supports residential, office, commercial, and retail uses.
The following table presents certain information relating to the appraiser’s market rent conclusion for the FTERE Bronx Multifamily Portfolio Properties:
| Market Rent Summary | ||||||
| Building | Units | Avg. Size | Avg. Monthly In Place Rent per Unit(1) | Avg. Monthly In Place Rent PSF(1) | Avg. Monthly Market Rent per Unit | Avg. Monthly Market Rent PSF |
| 1460 Macombs Road | 109 | 538 | $1,274 | $2.37 | $1,746 | $3.25 |
| 984 Sheridan Avenue | 78 | 938 | $1,347 | $1.44 | $1,792 | $1.91 |
| 901 Walton Avenue | 63 | 1,442 | $1,386 | $0.96 | $1,984 | $1.38 |
| 2 Minerva Place | 48 | 1,013 | $1,528 | $1.51 | $1,888 | $1.86 |
| 4040 Bronx Boulevard | 57 | 781 | $1,245 | $1.59 | $1,721 | $2.20 |
Source:Appraisal
| (1) | Based on the borrower rent roll dated October 1, 2019. |
The following table presents certain information relating to comparable rental properties to the 1460 Macombs Road, the 984 Sheridan Avenue and the 901 Walton Avenue Properties:
| Comparable Rental Properties (1460 Macombs Road, 984 Sheridan Avenue and 901 Walton Avenue Properties) | |||||||
| Property | Year Built | # of Stories | # Units | Unit Mix | Average SF per Unit | Average Rent per Unit(1) | Average Annual Rent PSF |
| 1460 Macombs Road | 1930 | 6 | 109 | Studio 1BR 2BR 3BR | 400 500 600 700 | $1,013 $1,169 $1,462 $1,487 | $30.39 $28.06 $29.25 $25.49 |
| 984 Sheridan Avenue | 1928 | 6 | 78 | Studio 1BR 2BR 3BR 4BR | 500 800 1,100 1,400 1,700 | $1,128 $1,250 $1,440 $1,601 $2,253 | $27.08 $15.71 $13.72 $15.90 |
| 901 Walton Avenue | 1927 | 6 | 63 | Studio 1BR 2BR 3BR 4BR | 500 900 1,300 1,700 2,100 | $1,172 $1,166 $1,367 $1,553 $1,369 | $28.14 $15.55 $12.62 $10.96 $7.83 |
Sherman Court 1240 Sherman Avenue Bronx, NY | 1927 | 7 | 58 | 1BR 2BR | 550 650 | $1,515 $1,701 | $33.05 $31.40 |
1540 Walton Avenue Bronx, NY | 1923 | 5 | 59 | 1BR 2BR | 642 906 | $1,701 $2,031 | $31.79 $26.90 |
888 Grand Concourse Bronx, NY | 1931 | 6 | 76 | Studio 1BR 2BR 3BR | 600 800 1,000 1,200 | $1,800 $2,200 $2,550 $3,200 | $36.00 $33.00 $30.60 $32.00 |
930 Sheridan Avenue Bronx, NY | 1951 | 7 | 83 | Studio 1BR | 542 669 | $1,699 $1,845 | $37.62 $33.09 |
Source:Appraisal
| (1) | Based on the borrower rent roll dated October 1, 2019. |
| This is not a research report and was not prepared by any Underwriter’s research department. Please see additional important information and qualifications at the end of this Term Sheet. |
T-112
| Multifamily – Mid Rise | Loan #10 | Cut-off Date Balance: | $50,400,000 | |
| Various | FTERE Bronx Multifamily Portfolio | Cut-off Date LTV: | 67.6% | |
| Bronx, NY | U/W NCF DSCR: | 2.00x | ||
| U/W NOI Debt Yield: | 7.8% |
The following table presents certain information relating to comparable rental properties to the 2 Minerva Place and the 4040 Bronx Boulevard Properties:
| Comparable Rental Properties (2 Minerva Place and the 4040 Bronx Boulevard Properties) | |||||||
| Property | Year Built | # of Stories | # Units | Unit Mix | Average SF per Unit | Average Rent per Unit(1) | Average Annual Rent PSF |
| 2 Minerva Place | 1938 | 6 | 48 | Studio 1BR 2BR | 600 900 1,300 | $1,169 $1,393 $1,822 | $23.37 $18.57 $16.82 |
| 4040 Bronx Boulevard | 1929 | 6 | 57 | Studio 1BR 2BR 3BR | 500 700 900 1,100 | $1,020 $1,271 $1,272 $1,314 | $24.49 $21.78 $16.96 $14.33 |
2839 Bainbridge Avenue Bronx | 1922 | 5 | 30 | 1BR | 600 | $2,084 | $41.68 |
2605 Marion Avenue Bronx | 1925 | 5 | 25 | 1BR 2BR | 650 800 | $1,675 $1,925 | $30.92 $28.88 |
7 East Gun Hill Road Bronx | 1923 | 5 | 38 | 1BR 2BR 3BR | 500 800 1,100 | $1,526 $2,012 $2,473 | $36.62 $30.18 $26.98 |
308 East 209th Street Bronx | 1929 | 6 | 25 | Studio 1BR | 354 560 | $1,077 $1,236 | $36.51 $26.49 |
3339 Hull Ave Bronx | 1940 | 6 | 50 | Studio 1BR 2BR 3BR | 400 675 950 1,500 | $1,354 $1,666 $1,839 $3,218 | $40.62 $29.62 $23.23 $25.74 |
Source:Appraisal
| (1) | Based on the borrower rent roll dated October 1, 2019. |
Operating History and Underwritten Net Cash Flow.The following table presents certain information relating to the historical operating performance and the Underwritten Net Cash Flow of the FTERE Bronx Multifamily Portfolio:
| Cash Flow Analysis(1) | ||||||
| 2016 | 2017 | 2018 | 8/31/2019 TTM | UW | UW Per Unit | |
| Gross Potential Rent | $4,636,843 | $5,421,615 | $5,756,311 | $5,868,744 | $5,710,800 | $16,086.76 |
| Other Income(2) | $0 | $0 | $0 | $0 | $418,552 | $1,179.02 |
| Vacancy | $0 | $0 | $0 | $0 | ($133,100) | ($374.93) |
| Effective Gross Income | $4,636,843 | $5,421,615 | $5,756,311 | $5,868,744 | $5,996,252 | $16,890.85 |
| Real Estate Taxes | $424,639 | $511,079 | $590,676 | $659,328 | $514,838 | $1,450.25 |
| Insurance | $152,267 | $212,619 | $283,025 | $285,853 | $271,500 | $764.79 |
| Other Expenses | $1,059,204 | $1,262,996 | $1,283,624 | $1,290,234 | $1,259,798 | $3,548.73 |
| Total Expenses | $1,636,110 | $1,986,694 | $2,157,325 | $2,235,415 | $2,046,135 | $5,763.76 |
| Net Operating Income(3) | $3,000,733 | $3,434,921 | $3,598,986 | $3,633,329 | $3,950,116 | $11,127.09 |
| Capital Expenditures | $0 | $0 | $0 | $0 | $94,002 | $264.79 |
| Net Cash Flow | $3,000,733 | $3,434,921 | $3,598,986 | $3,633,329 | $3,856,115 | $10,862.30 |
| Occupancy % | NAV | 99.7% | 99.7% | 99.2%(1) | 98.0% | |
| NOI DSCR | 1.55x | 1.78x | 1.86x | 1.88x | 2.05x | |
| NCF DSCR | 1.55x | 1.78x | 1.86x | 1.88x | 2.00x | |
| NOI Debt Yield | 6.0% | 6.8% | 7.1% | 7.2% | 7.8% | |
| NCF Debt Yield | 6.0% | 6.8% | 7.1% | 7.2% | 7.7% | |
| (1) | As of the borrower rent roll dated October 1, 2019, the multifamily space at the FTERE Bronx Multifamily Portfolio is 99.2% occupied. |
| (2) | Other Income is comprised entirely of (i) rent from retail tenants ($348,300); (ii) in-place MCI rent increases ($14,031) and (iii) any applied for MCI rent increases that are expected to be approved prior to securitization closing ($56,221). We cannot assure you that such increases will be approved either prior to securitization closing or at all. |
| (3) | The increase in UW NOI from 8/31/2019 TTM NOI is due to (i) a decrease in expenses, which includes the tax abatements and exemptions and (ii) the increase in Other Income, which is due to the both the actual and anticipated MCI program adjustments. |
Escrows and Reserves.
Tax Funds – The FTERE Bronx Multifamily Portfolio Mortgage Loan documents provide for an upfront reserve of $116,223 for real estate taxes and ongoing monthly reserves for real estate taxes in an amount equal to 1/12 of the real estate taxes that the lender estimates will be payable during the next twelve months (initially, $58,112).
Insurance– The FTERE Bronx Multifamily Portfolio Mortgage Loan documents provide for monthly reserves for insurance premiums in an amount equal to 1/12 of the insurance premiums that the lender estimates will be payable for the renewal of coverage upon the expiration of the insurance policies; provided that such monthly reserves are not required so long as (i) no event of default has occurred and is continuing, (ii) the liability and casualty
| This is not a research report and was not prepared by any Underwriter’s research department. Please see additional important information and qualifications at the end of this Term Sheet. |
T-113
| Multifamily – Mid Rise | Loan #10 | Cut-off Date Balance: | $50,400,000 | |
| Various | FTERE Bronx Multifamily Portfolio | Cut-off Date LTV: | 67.6% | |
| Bronx, NY | U/W NCF DSCR: | 2.00x | ||
| U/W NOI Debt Yield: | 7.8% |
insurance coverage for each of the FTERE Bronx Multifamily Portfolio Properties is included in a blanket policy approved by the lender in its reasonable discretion, and (iii) the FTERE Bronx Multifamily Portfolio Borrowers provide the lender with evidence of payment of the insurance premiums and renewals of the insurance policies, no later than ten days prior to the expiration of the current policy.
Recurring Replacements Reserve – The FTERE Bronx Multifamily Portfolio Mortgage Loan documents provide for monthly deposits of $7,834 for approved annual capital expenditures.
Deferred Maintenance Reserve – The FTERE Bronx Multifamily Portfolio Mortgage Loan documents provide for an upfront reserve of $69,384 for required repairs.
J-51 Exemption Reserve – The FTERE Bronx Multifamily Portfolio Mortgage Loan documents provide for an upfront reserve of $3,400,000 with respect to the pending J-51 tax exemption, J-51 tax abatement and material capital improvement rent increase applications, as applicable for the 1460 Macombs Road ($900,000), 901 Walton Avenue ($450,000) and 4040 Bronx Boulevard ($2,050,000) Properties. The funds allocable to each such Property are required to be released to the related FTERE Bronx Multifamily Portfolio Borrower upon satisfaction of the J-51 Exemption Funds Release Conditions (as defined below) with respect to the applicable FTERE Bronx Multifamily Portfolio Property. Any funds in such reserve not disbursed to the FTERE Bronx Multifamily Portfolio Borrowers on or prior to November 5, 2020 may at the lender’s discretion be retained and applied by the lender to the prepayment of the FTERE Bronx Multifamily Portfolio Mortgage Loan. Such prepayment is subject to payment of a prepayment premium equal to 3% of the amount prepaid.
Lockbox and Cash Management.The FTERE Bronx Multifamily Portfolio Mortgage Loan is structured with a springing lockbox and springing cash management. Upon the first occurrence of a Cash Sweep Event Period (as defined below), the FTERE Bronx Multifamily Portfolio Borrowers are required to establish and maintain a lockbox account for the benefit of the lender, to direct all commercial tenants of the FTERE Bronx Multifamily Portfolio Properties to deposit rent directly into such lockbox account, and to deposit, or cause to be deposited, all rents from residential tenants of the FTERE Bronx Multifamily Portfolio Properties into such lockbox account within one business day of receipt. Upon the first occurrence of a Cash Sweep Event Period, the lender is required to establish, and the FTERE Bronx Multifamily Portfolio Borrowers are required to cooperate with the cash management bank to establish, a lender-controlled cash management account, into which all funds in the lockbox account will be required to be deposited, so long as a Cash Sweep Event Period is continuing. During the continuance of a Cash Sweep Event Period, provided no event of default under the FTERE Bronx Multifamily Portfolio Mortgage Loan documents is continuing, all funds in the cash management account are required to be applied on each monthly payment date: (i) to make the monthly deposits into the real estate tax and insurance reserves as described above under “Escrows and Reserves,” (ii) to pay debt service on the FTERE Bronx Multifamily Portfolio Mortgage Loan, (iii) to make the monthly deposit into the Recurring Replacements reserve as described above under “Escrows and Reserves,” (iv) to pay operating expenses set forth in the annual budget (which is required to be approved by the lender) and lender-approved extraordinary expenses, and (v) to deposit any remainder into an excess cash flow subaccount to be held as additional security for the FTERE Bronx Multifamily Portfolio Mortgage Loan during the continuance of such Cash Sweep Event Period. If no Cash Sweep Event Period is continuing, all funds in the excess cash flow subaccount are required to be disbursed to the FTERE Bronx Multifamily Portfolio Borrowers. Notwithstanding the foregoing, any amounts on deposit in the excess cash flow subaccount as a result of a Cash Sweep Event Period triggered by clause (ii) of the definition of Cash Sweep Event Period, are required to be held as additional collateral for the FTERE Bronx Multifamily Portfolio Mortgage Loan until the FTERE Bronx Multifamily Portfolio Borrowers provide evidence reasonably satisfactory to the lender that the loan-to-value ratio (without taking into account the funds held in the excess cash flow subaccount) is not more than 67.6%.
A “Cash Sweep Event Period” means a period:
| (i) | commencing upon an event of default under the FTERE Bronx Multifamily Portfolio Mortgage Loan documents and ending upon the cure, if applicable, of such event of default, or |
| (ii) | commencing upon, if the J-51 Exemption Funds Release Conditions have not been satisfied, November 5, 2020 and ending upon the date that the loan-to-value ratio (based upon a loan amount of $47,000,000) is 67.6%. Notwithstanding the foregoing, the FTERE Bronx Multifamily Portfolio Borrowers have the right to end such Cash Sweep Event Period by depositing with the lender (1) a cash deposit in the minimum amount required to cause the loan-to-value ratio to be 67.6% or (2) a letter of credit in a minimum face amount which would cause the loan-to-value ratio to be 67.6%. Such cash deposit or letter of credit is required to be held as additional collateral for the FTERE Bronx Multifamily Portfolio Mortgage Loan until the FTERE Bronx Multifamily Portfolio Borrowers provide evidence reasonably satisfactory to the lender that the loan-to-value ratio (without taking into account the cash deposit or letter of credit, as applicable) is not more than 67.6%. |
The “J-51 Exemption Funds Release Conditions” mean, collectively, (a) the lender’s receipt of a written request for such release from the applicable Bronx Multifamily Portfolio Borrower not later than November 5, 2020, (b) the New York City Department of Finance has approved (1) the FTERE Bronx Multifamily Portfolio Borrowers’ J-51 exemption application for the 1460 Macombs Road and 4040 Bronx Boulevard Properties and (2) the FTERE Bronx Multifamily Portfolio Borrowers’ J-51 Abatement application for the 4040 Bronx Boulevard Property, (c) the lender’s receipt of reasonably satisfactory evidence that the State of New York Division of Housing and Community Renewal has approved the FTERE Bronx Multifamily Portfolio Borrowers’ application for a major capital improvement program rent increase for the 4040 Bronx Boulevard and 901 Walton Avenue Properties and (d) the lender has determined in its sole reasonable discretion that the underwritten NOI divided by the outstanding principal balance of the FTERE Bronx Multifamily Portfolio Mortgage Loan after giving effect to the disbursement is equal to or greater than 7.70%.
Additional Secured Indebtedness (not including trade debts).None.
Mezzanine Loan and Preferred Equity.Not permitted.
Release of Property.After the expiration of the defeasance lockout period and prior to the monthly payment date occurring in June, 2029, the FTERE Bronx Multifamily Portfolio Borrowers have the right to obtain a release of any one or more FTERE Bronx Multifamily Portfolio Properties, provided no event of default is continuing and subject to the conditions set forth in the FTERE Bronx Multifamily Portfolio Mortgage Loan documents, including, among others, (1) partial defeasance of the FTERE Bronx Multifamily Portfolio Mortgage Loan in a principal amount equal to 110% of the allocated loan amount for any individual FTERE Bronx Multifamily Portfolio Property being released, as the case may be, provided, however, that upon the written request of the FTERE Bronx Multifamily Portfolio Borrowers and subject to the lender’s receipt of an updated appraisal, the applicable release amount may be 100% of such allocated loan amount so long as (i) the loan-to-value ratio with respect to all remaining FTERE Bronx Multifamily Portfolio
| This is not a research report and was not prepared by any Underwriter’s research department. Please see additional important information and qualifications at the end of this Term Sheet. |
T-114
| Multifamily – Mid Rise | Loan #10 | Cut-off Date Balance: | $50,400,000 | |
| Various | FTERE Bronx Multifamily Portfolio | Cut-off Date LTV: | 67.6% | |
| Bronx, NY | U/W NCF DSCR: | 2.00x | ||
| U/W NOI Debt Yield: | 7.8% |
Properties is not greater than 55.0% and (ii) the debt yield with respect to all remaining FTERE Bronx Multifamily Portfolio Properties is not less than 8.5%, (2) after giving effect to the partial defeasance the debt yield of the remaining FTERE Bronx Multifamily Portfolio Properties is not less than the greater of the debt yield immediately prior to the partial defeasance and 7.65%, and (3) customary REMIC requirements are satisfied.
Letter of Credit.The FTERE Bronx Multifamily Portfolio Borrowers have the right to deliver a letter of credit meeting the requirements of the FTERE Bronx Multifamily Portfolio Mortgage Loan documents to cure certain Cash Sweep Event Periods as described above under “Lockbox and Cash Management”.
Right of First Refusal/Right of First Offer. None.
Ground Lease.None.
Terrorism Insurance. The FTERE Bronx Multifamily Portfolio Borrowers are required to obtain and maintain an “all risk” property insurance policy that covers perils of terrorism and acts of terrorism in an amount equal to the “full replacement cost” of the FTERE Bronx Multifamily Portfolio Properties together with business income insurance covering not less than the 18-month period commencing at the time of loss, together with an extended period of indemnity endorsement of up to six months. Notwithstanding the foregoing, for so long as the Terrorism Risk Insurance Act of 2002, as extended and modified by the Terrorism Risk Insurance Program Reauthorization Act of 2015 (“TRIPRA”) is in effect (including any extensions thereof or if another federal governmental program is in effect relating to “acts of terrorism” which provides substantially similar protections as TRIPRA), and covers both domestic and foreign acts of terrorism, the lender is required to accept terrorism insurance which insures against “covered acts” as defined by TRIPRA (or such other program). See“Risk Factors—Risks Relating to the Mortgage Loans—Terrorism Insurance May Not Be Available for All Mortgaged Properties”in the Preliminary Prospectus.
| This is not a research report and was not prepared by any Underwriter’s research department. Please see additional important information and qualifications at the end of this Term Sheet. |
T-115
| Mortgage Loan No. 11 – Metro 8 Self Storage Portfolio |
| Mortgage Loan Information | Mortgaged Property Information | ||||||
| Mortgage Loan Seller: | WFB | Single Asset/Portfolio: | Portfolio | ||||
| Credit Assessment (KBRA/Fitch/S&P): | NR/NR/NR | Location: | Various, GA | ||||
| Original Balance: | $39,650,000 | General Property Type: | Self Storage | ||||
| Cut-off Date Balance: | $39,650,000 | Detailed Property Type: | Self Storage | ||||
| % of Initial Pool Balance: | 3.1% | Title Vesting: | Fee | ||||
| Loan Purpose: | Refinance | Year Built/Renovated: | Various | ||||
| Borrower Sponsor: | Matthew M. Nagel; K. Blair Nagel | Size: | 572,065 SF | ||||
| Guarantors: | Matthew M. Nagel; K. Blair Nagel | Cut-off Date Balance per SF: | $69 | ||||
| Mortgage Rate: | 3.1900% | Maturity Date Balance per SF: | $69 | ||||
| Note Date: | 9/4/2019 | Property Manager: | Metro Storage LLC (borrower affiliated) | ||||
| First Payment Date: | 10/11/2019 | Underwriting and Financial Information | |||||
| Maturity Date: | 9/11/2029 | UW NOI: | $4,221,840 | ||||
| Original Term to Maturity: | 120 months | UW NOI Debt Yield: | 10.6% | ||||
| Original Amortization Term: | 0 months | UW NOI Debt Yield at Maturity: | 10.6% | ||||
| IO Period: | 120 months | UW NCF DSCR: | 3.22x | ||||
| Seasoning: | 3 months | Most Recent NOI: | $3,913,699 (9/30/2019 TTM) | ||||
| Prepayment Provisions: | LO (27); DEF (88); O (5) | 2nd Most Recent NOI: | $3,942,136 (12/31/2018) | ||||
| Lockbox/Cash Mgmt Status: | Springing/Springing | 3rd Most Recent NOI: | $3,852,048 (12/31/2017) | ||||
| Additional Debt Type: | N/A | Most Recent Occupancy(3): | 91.2% (9/30/2019) | ||||
| Additional Debt Balance: | N/A | 2nd Most Recent Occupancy(3): | 89.7% (12/31/2018) | ||||
| Future Debt Permitted (Type): | No (N/A) | 3rd Most Recent Occupancy(3): | 88.9% (12/31/2017) | ||||
| Reserves | Appraised Value (as of)(4): | $77,000,000 (7/30/2019) | |||||
| Type | Initial | Monthly | Cap | Appraised Value per SF(4): | $135 | ||
| RE Tax: | $497,520 | $46,135 | N/A | Cut-off Date LTV Ratio(4): | 51.5% | ||
| Insurance: | $0 | Springing(1) | N/A | Maturity Date LTV Ratio(4): | 51.5% | ||
| Replacement Reserve: | $0 | $4,767 | 114,404(2) | ||||
| Sources and Uses | ||||||
| Sources | Proceeds | % of Total | Uses | Proceeds | % of Total | |
| Loan Amount: | $39,650,000 | 100.0% | Loan Payoff(5): | $29,023,309 | 73.2% | |
| Reserves: | $497,520 | 1.3% | ||||
| Closing Costs: | $427,686 | 1.1% | ||||
| Return of Equity: | $9,701,485 | 24.5% | ||||
| Total Sources: | $39,650,000 | 100.0% | Total Uses: | $39,650,000 | 100.0% | |
| (1) | Springing upon any of the following: (i) an event of default; (ii) blanket policy unacceptable to lender; or (iii) borrower does not provide lender with evidence of renewal and payment within 15 days. |
| (2) | Springing monthly deposit beyond the cap upon (i) an event of default, (ii) the debt service coverage ratio falling below 1.10x for two consecutive calendar quarters (tested quarterly) has occurred or (iii) property is not being maintained as determined by the lender. |
| (3) | Represents the average occupancy rate over the course of each year. |
| (4) | The aggregate individual property level appraised values equal $68,000,000, which would equate to a Cut-off Date LTV Ratio and LTV Ratio at Maturity of 58.3% and 58.3%, respectively; however, the appraiser concluded to a portfolio value of $77,000,000 based on the assumption that the individual properties would be sold as part of a multi-property portfolio. |
| (5) | The Metro 8 Self Storage Portfolio Properties (as defined below) were previously securitized in the COMM 2013-CR11 securitization trust. The loan payoff amount shown includes approximately $4.0 million of defeasance fees related to the prior CMBS loan. |
The Mortgage Loan.The eleventh largest mortgage loan (the “Metro 8 Self Storage Portfolio Mortgage Loan”) is evidenced by a single promissory note secured by a first mortgage encumbering the fee interest in 8 self storage properties in Georgia (the “Metro 8 Self Storage Portfolio Properties”).
The Borrower and the Borrower Sponsors. The borrower comprises three entities, each a Delaware limited liability company and single purpose entity with one independent director (collectively, the “Metro 8 Self Storage Portfolio Borrower”). Legal counsel to the Metro 8 Self Storage Portfolio Borrower delivered a non-consolidation opinion in connection with the origination of the Metro 8 Self Storage Portfolio Mortgage Loan. The non-recourse carve-out guarantors and borrower sponsors of the Metro 8 Self Storage Portfolio Mortgage Loan are Matthew M. Nagel and K. Blair Nagel.
Matthew M. Nagel and K. Blair Nagel serve as the Chairman and Chief Executive Officer, respectively, of Metro Storage LLC (“Metro Storage”), which they also co-own. Established in 1973 and based in the Chicago area, Metro Storage is the 5th largest privately-held self storage company in the United States, currently owning or operating over 125 properties across 14 states totaling approximately 6.5 million square feet. Since joining the company in 1985, Matthew M. Nagel has also served as Director of Acquisitions, Chief Financial Officer, President and Chief Executive Officer, and has been involved in hundreds of self storage properties including financings, developments, acquisitions, dispositions and management transactions. K. Blair Nagel has served on various industry boards, including the Board of Governors of the Self Storage Association Foundation, National Board Member of the Self Storage Association (“SSA”) and President and former Secretary of the SSA’s Central Region.
The Properties.The Metro 8 Self Storage Portfolio Properties comprise 8 self storage properties located in the Atlanta-Sandy Springs-Marietta MSA of Georgia totaling 572,065 square feet of rentable area, including 4,763 traditional self storage units and 178 RV storage spaces (approximately 2.6% of the underwritten effective gross income). All of the Metro 8 Self Storage Portfolio Properties are operated under the Metro Self Storage brand. Approximately 33.3% of the traditional self storage units at the Metro 8 Self Storage Portfolio Properties are climate controlled with the percentage of climate controlled units at the individual properties ranging from 3.8% to 99.7%. Built between 1960 and 2001 (with four properties renovated between
| This is not a research report and was not prepared by any Underwriter’s research department. Please see additional important information and qualifications at the end of this Term Sheet. |
T-116
| Self Storage – Self Storage | Loan #11 | Cut-off Date Balance: | $39,650,000 | |
| Various | Metro 8 Self Storage Portfolio | Cut-off Date LTV: | 51.5% | |
| Various, GA | U/W NCF DSCR: | 3.22x | ||
| U/W NOI Debt Yield: | 10.6% |
1995 and 2003), each of the Metro 8 Self Storage Portfolio Properties is situated on a site ranging in size from 1.9 acres to 8.0 acres. As of September 30, 2019, the Metro 8 Self Storage Portfolio Properties were 91.2% occupied with individual property occupancy rates ranging from 86.4% to 96.0%. Since 2014, the Metro 8 Self Storage Portfolio Properties have averaged 90.7% occupancy, never dropping below 88.3% in the aggregate.
The following table presents certain information relating to the Metro 8 Self Storage Portfolio Properties:
| Property Name – Location | Allocated Cut-off Date Balance | % of ALA | Appraised Value(1) | Allocated LTV | UW NCF | % UW NCF |
| Stockbridge, GA | $7,800,000 | 19.7% | $13,150,000 | 59.3% | $818,358 | 19.8% |
| Lithonia, GA | $7,500,000 | 18.9% | $13,200,000 | 56.8% | $841,467 | 20.3% |
| Atlanta, GA | $5,000,000 | 12.6% | $8,150,000 | 61.3% | $467,676 | 11.3% |
| Stone Mountain, GA | $4,700,000 | 11.9% | $7,550,000 | 62.3% | $473,933 | 11.5% |
| Decatur, GA | $4,400,000 | 11.1% | $8,100,000 | 54.3% | $456,819 | 11.0% |
| Lithia Springs, GA | $3,500,000 | 8.8% | $6,300,000 | 55.6% | $379,790 | 9.2% |
| Roswell, GA | $3,500,000 | 8.8% | $5,700,000 | 61.4% | $346,563 | 8.4% |
| Norcross, GA | $3,250,000 | 8.2% | $5,850,000 | 55.6% | $351,425 | 8.5% |
| Total/Weighted Average | $39,650,000 | 100.00% | $77,000,000(1) | 51.5%(1) | $4,136,030 | 100.00% |
| (1) | The aggregate individual property level appraised values equal $68,000,000, which would equate to a Cut-off Date LTV Ratio and LTV Ratio at Maturity of 58.3% and 58.3%, respectively; however, the appraiser concluded to a portfolio value of $77,000,000 based on the assumption that the individual properties would be sold as part of a multi-property portfolio. |
The following table presents information with respect to the unit mix of the Metro 8 Self Storage Portfolio Properties:
| Property Name – Location | Year Built/ Renovated | Net Rentable Area (SF) | % GLA | Self Storage Units | % Climate Controlled | RV Parking Units | Current Occupancy (9/30/2019) |
| Stockbridge, GA | 1998/N/A | 105,290 | 18.4% | 833 | 18.4% | 32 | 89.2% |
| Lithonia, GA | 2001/N/A | 87,725 | 15.3% | 664 | 3.8% | 108 | 92.6% |
| Atlanta, GA | 1998/N/A | 59,810 | 10.5% | 613 | 99.7% | 0 | 89.9% |
| Stone Mountain, GA | 2001/2003 | 75,780 | 13.2% | 689 | 41.5% | 14 | 96.0% |
| Decatur, GA | 1960/2002 | 71,105 | 12.4% | 610 | 13.0% | 14 | 86.4% |
| Lithia Springs, GA | 1997/2002 | 60,575 | 10.6% | 499 | 4.4% | 0 | 93.6% |
| Roswell, GA | 1998/N/A | 62,265 | 10.9% | 448 | 56.5% | 7 | 90.4% |
| Norcross, GA | 1994/1995 | 49,515 | 8.7% | 407 | 38.6% | 3 | 92.2% |
| Total/Weighted Average | 572,065 | 100.00% | 4,763 | 33.3% | 178 | 91.2% |
The Market. The Metro 8 Self Storage Portfolio Properties are located within the Atlanta-Sandy Springs-Marietta, GA MSA.
The following table presents certain local demographic data related to the Metro 8 Self Storage Portfolio Properties:
| Property Name – Location | 2018 Population (within 1-mi. / 3-mi. / 5-mi. Radius) | 2018 Average Household Income (within 1-mi. / 3-mi. / 5-mi. Radius) |
| Stockbridge, GA | 7,988 / 56,304 / 124,270 | $64,796 / $66,197 / $71,949 |
| Lithonia, GA | 8,581 / 58,522 / 143,772 | $43,629 / $54,313 / $62,335 |
| Atlanta, GA | 13,932 / 81,750 / 215,198 | $98,283 / $121,437 / $136,069 |
| Stone Mountain, GA | 10,586 / 78,326 / 227,655 | $55,574 / $64,032 / $72,254 |
| Decatur, GA | 7,958 / 87,079 / 199,995 | $55,233 / $56,397 / $62,957 |
| Lithia Springs, GA | 1,841 / 34,619 / 90,721 | $61,557 / $60,015 / $65,422 |
| Roswell, GA | 5,199 / 69,245 / 179,800 | $95,392 / $120,082 / $135,781 |
| Norcross, GA | 15,268 / 105,272 / 252,646 | $47,956 / $55,857 / $64,679 |
| This is not a research report and was not prepared by any Underwriter’s research department. Please see additional important information and qualifications at the end of this Term Sheet. |
T-117
| Self Storage – Self Storage | Loan #11 | Cut-off Date Balance: | $39,650,000 | |
| Various | Metro 8 Self Storage Portfolio | Cut-off Date LTV: | 51.5% | |
| Various, GA | U/W NCF DSCR: | 3.22x | ||
| U/W NOI Debt Yield: | 10.6% |
The following table presents certain information relating to certain self storage lease comparables provided in the appraisals for the Metro 8 Self Storage Portfolio Properties:
| Property Name – Location | Current Occupancy (9/30/2019) | Competitive Set Average Occupancy Rate | Monthly Underwritten Rent/Unit | Appraiser’s Monthly Market Rent/Unit |
| Stockbridge, GA | 89.2% | 83.5% | $123 | $132 |
| Lithonia, GA | 92.6% | 86.5% | $144 | $153 |
| Atlanta, GA | 89.9% | 78.3% | $116 | $125 |
| Stone Mountain, GA | 96.0% | 81.2% | $107 | $116 |
| Decatur, GA | 86.4% | 78.2% | $114 | $121 |
| Lithia Springs, GA | 93.6% | 87.9% | $101 | $113 |
| Roswell, GA | 90.4% | 81.8% | $128 | $148 |
| Norcross, GA | 92.2% | 89.1% | $124 | $134 |
Operating History and Underwritten Net Cash Flow. The following table presents certain information relating to the historic operating performance and Underwritten Net Cash Flow at the Metro 8 Self Storage Portfolio Properties:
| Cash Flow Analysis | ||||||
| 2016 | 2017 | 2018 | 9/30/2019 TTM | UW | UW PSF | |
| Gross Potential Rent | $5,964,814 | $6,053,155 | $6,193,746 | $6,311,810 | $7,137,784 | $12.48 |
| Other Income | $780,774 | $730,727 | $730,841 | $721,265 | $721,265 | $1.26 |
| Less Vacancy | $0 | $0 | $0 | $0 | ($712,860) | ($1.25) |
| Less Concessions & Credit Loss | ($617,982) | ($629,871) | ($603,658) | ($658,277) | ($658,277)(1) | ($1.15) |
| Effective Gross Income | $6,127,606 | $6,154,011 | $6,320,929 | $6,374,798 | $6,487,912 | $11.34 |
| Real Estate Taxes | $487,666 | $525,649 | $525,078 | $533,994 | $533,994 | $0.93 |
| Insurance | $78,008 | $64,058 | $59,020 | $61,062 | $57,174 | $0.10 |
| Management Fee | $377,081 | $377,166 | $383,907 | $385,776 | $194,637 | $0.34 |
| Other Operating Expenses | $1,338,161 | $1,335,090 | $1,410,788 | $1,480,267 | $1,480,267 | $2.59 |
| Total Expenses | $2,280,916 | $2,301,963 | $2,378,793 | $2,461,099 | $2,266,072 | $3.96 |
| Net Operating Income | $3,846,690 | $3,852,048 | $3,942,136 | $3,913,699 | $4,221,840 | $7.38 |
| Capital Expenditures | $0 | $0 | $0 | $0 | $85,810 | $0.15 |
| TI/LC | $0 | $0 | $0 | $0 | $0 | $0.00 |
| Net Cash Flow | $3,846,690 | $3,852,048 | $3,942,136 | $3,913,699 | $4,136,030 | $7.23 |
| Occupancy % | 92.6% | 88.9% | 89.7% | 91.2% | 90.0%(1) | |
| NOI DSCR | 2.99x | 3.00x | 3.07x | 3.04x | 3.28x | |
| NCF DSCR | 2.99x | 3.00x | 3.07x | 3.04x | 3.22x | |
| NOI Debt Yield | 9.7% | 9.7% | 9.9% | 9.9% | 10.6% | |
| NCF Debt Yield | 9.7% | 9.7% | 9.9% | 9.9% | 10.4% | |
| (1) | The underwritten economic vacancy is 10.0%. The Metro 8 Self Storage Portfolio Properties were 91.2% physically occupied as of September 30, 2019. |
Partial Release: Provided no event of default is continuing, the Metro 8 Self Storage Portfolio Borrower has the right, at any time after the lockout period and prior to the open period start date, to obtain the release of any of the Metro 8 Self Storage Portfolio Properties (subject to a cap of $12,000,000 of the principal balance of the Metro 8 Self Storage Portfolio Mortgage Loan) from the lien of the Metro 8 Self Storage Portfolio Mortgage Loan, provided that certain conditions are satisfied, including, but not limited to, the following:
| I. | partial defeasance in an amount equal to at least 125% of the allocated loan amount for the property being released; |
| II. | the net cash flow debt service coverage ratio immediately following the release being equal to or greater than the greater of (a) 2.08x (based on a hypothetical 30-year amortization period) and (b) the net cash flow debt service coverage ratio immediate prior to the release; |
| III. | the net cash flow debt yield immediately following the release being equal to or greater than the greater of (1) 10.3% and (2) the net cash flow debt yield immediately prior to the release; |
| IV. | the loan-to-value ratio immediately following the release being less than or equal to the lesser of (x) 51.5% and (y) the loan-to-value ratio immediately prior to the release; |
| V. | compliance with all applicable REMIC requirements; and |
| VI. | rating agency confirmation that such release will not result in a downgrade, withdrawal or qualification of the respective ratings assigned to the BANK 2019-BNK23 certificates. |
| This is not a research report and was not prepared by any Underwriter’s research department. Please see additional important information and qualifications at the end of this Term Sheet. |
T-118
(THIS PAGE INTENTIONALLY LEFT BLANK)
T-119
| Mortgage Loan No. 12 – Mosby Ingleside |
| Mortgage Loan Information | Property Information | ||||||
| Mortgage Loan Seller: | MSMCH | Single Asset/Portfolio: | Single Asset | ||||
| Credit Assessment (KBRA/Fitch/S&P): | NR/NR/NR | Location: | North Charleston, SC 29456 | ||||
| Original Balance: | $36,000,000 | General Property Type: | Multifamily | ||||
| Cut-off Date Balance: | $36,000,000 | Detailed Property Type: | Garden | ||||
| % of Initial Pool Balance: | 2.8% | Title Vesting: | Fee | ||||
| Loan Purpose: | Refinance | Year Built/Renovated: | 2018/N/A | ||||
| Sponsor: | Middleburg Real Estate Partners LLC | Size: | 312 Units | ||||
| Guarantor: | Thistle Investments, LLC | Cut-off Date Balance per Unit: | $115,385 | ||||
| Mortgage Rate(2): | 3.8250% | Maturity Date Balance per Unit: | $115,385 | ||||
| Note Date: | 9/30/2019 | Property Manager: | Middleburg Management, LLC | ||||
| First Payment Date: | 11/1/2019 | (borrower-related) | |||||
| Maturity Date: | 10/1/2029 | Underwriting and Financial Information | |||||
| Original Term to Maturity: | 120 months | UW NOI: | $2,779,617 | ||||
| Original Amortization Term: | 0 months | UW NOI Debt Yield: | 7.7% | ||||
| IO Period: | 120 months | UW NOI Debt Yield at Maturity: | 7.7% | ||||
| Seasoning: | 2 months | UW NCF DSCR: | 1.95x | ||||
| Prepayment Provisions: | LO (26); DEF (90); O (4) | Most Recent NOI: | $2,359,322 (8/31/2019 TTM) | ||||
| Lockbox/Cash Mgmt Status: | Springing/Springing | 2nd Most Recent NOI(1): | $693,708 (12/31/2018) | ||||
| Additional Debt Type: | N/A | 3rd Most Recent NOI: | N/A | ||||
| Additional Debt Balance: | N/A | Most Recent Occupancy: | 94.9% (10/22/2019) | ||||
| Future Debt Permitted (Type): | No (N/A) | 2nd Most Recent Occupancy(1): | N/A | ||||
| Reserves | 3rd Most Recent Occupancy: | N/A | |||||
| Type | Initial | Monthly | Cap | Appraised Value (as of): | $53,500,000 (8/29/2019) | ||
| RE Tax: | $577,280 | $57,728 | N/A | Appraised Value per Unit: | $171,474 | ||
| Insurance: | $88,478 | $10,798 | N/A | Cut-off Date LTV Ratio: | 67.3% | ||
| Capital Expenditures: | $0 | $6,500 | N/A | Maturity Date LTV Ratio: | 67.3% | ||
| Sources and Uses | ||||||
| Sources | Proceeds | % of Total | Uses | Proceeds | % of Total | |
| Loan Amount: | $36,000,000 | 66.8% | Loan Payoff: | $43,041,346 | 79.9% | |
| Borrower Equity: | $17,877,190 | 33.2% | Closing Costs: | $10,170,086 | 18.9% | |
| Reserves: | $665,758 | 1.2% | ||||
| Total Sources: | $53,877,190 | 100.0% | Total Uses: | $53,877,190 | 100.0% | |
| (1) | Financial information and occupancy for the year ending on December 31, 2018 does not represent stabilized operations because the Mosby Ingleside Property (as defined below) was constructed in 2018 and has recently exited its lease-up period. |
The Mortgage Loan. The twelfth largest mortgage loan (the “Mosby Ingleside Mortgage Loan”) is evidenced by a promissory note in the original principal amount of $36,000,000, and secured by the first priority fee mortgage encumbering a multifamily property totaling 312 units located in North Charleston, South Carolina (the “Mosby Ingleside Property”). The proceeds of the Mosby Ingleside Mortgage Loan were used primarily to refinance previous debt of approximately $43.0 million, fund reserves, and pay closing costs.
The Borrower and the Borrower Sponsor.The borrower is Mosby Ingleside, LLC (the “Mosby Ingleside Borrower”), a Virginia limited liability company with two independent directors. The borrower sponsor is Middleburg Real Estate Partners LLC and the non-recourse carve-out guarantor is Thistle Investments, LLC, which wholly owns Middleburg Real Estate Partners LLC. Middleburg Real Estate Partners LLC is a fully-integrated real estate investment, management, construction and development firm specializing in multifamily apartments throughout the Mid-Atlantic and Southeast. Thistle Investments, LLC currently holds ownership interest in six stabilized multifamily properties totaling 1,755 units (including the Mosby Ingleside Property) and nine multifamily properties that are either under construction or in their initial lease up totaling 2,862 units. Its aggregate portfolio consists of 4,617 units.
The Property.The Mosby Ingleside Property is comprised of 12 three and four story buildings and one clubhouse. The multifamily buildings total 312 units located in North Charleston, South Carolina. As of October 22, 2019, the Mosby Ingleside Property was 94.9% leased. Construction of the Mosby Ingleside Property was completed in 2018 and the leasing of units commenced in December 2017 and within 14 months 295 units had been absorbed with an average absorption rate of almost 21 units per month.Amenities at the Mosby Ingleside Propertyinclude clubhouse, salt water swimming pool, fitness center with yoga studio and a dog park.In-unit amenities includefull appliance package including a range/oven, vent-hood, refrigerator with icemaker, microwave oven, garbage disposal, and dishwasher. Additionally, each unit features wood cabinets with granite countertops and vinyl plank wood flooring in the kitchen area.
| This is not a research report and was not prepared by any Underwriter’s research department. Please see additional important information and qualifications at the end of this Term Sheet. |
T-120
| Multifamily – Garden | Loan #12 | Cut-off Date Balance: | $36,000,000 | |
| 3730 Ingleside Boulevard | Mosby Ingleside | Cut-off Date LTV: | 67.3% | |
| North Charleston, SC 29456 | U/W NCF DSCR: | 1.95x | ||
| U/W NOI Debt Yield: | 7.7% |
The following table presents certain information relating to the unit mix at the Mosby Ingleside Property:
| Unit Mix(1) | ||||||
| Unit Mix / Type | Units | Occupied Units | % Occupied | Average SF per Unit | Total SF | Monthly Average Rent per Unit |
| One-Bedroom | 160 | 152 | 95.0% | 776 | 124,128 | $1,111 |
| Two-Bedroom | 128 | 120 | 93.8% | 1,109 | 141,912 | $1,356 |
| Three-Bedroom | 24 | 24 | 100.0% | 1,363 | 32,712 | $1,546 |
| Total/Wtd. Avg. | 312 | 296 | 94.9% | 958 | 298,752 | $1,246 |
(1) Based on the borrower rent roll dated October 22, 2019.
The Market. The Mosby Ingleside Property is located in North Charleston, South Carolina. The land uses within the area consist primarily of commercial and residential developments. Charleston Southern University is located less than two miles from the Mosby Ingleside Property. Charleston Southern University was founded in 1964 as Baptist College. Enrollment is currently approximately 3,700 students, and over 50 undergraduate programs are offered as well as at least 15 graduate programs and a doctoral program. In addition, the Mosby Ingleside Property is located within 9 miles from the Joint Base Charleston, and according to the Mosby Ingleside Borrower a significant number of the current tenants are affiliated with the military. Primary access to the Mosby Ingleside Property is provided by Interstate Highway 526 and Interstate 26. The Mosby Ingleside Property is located in the Summerville submarket of the Charleston market. According to the appraisal, as of the first quarter of 2019, the vacancy rate in the Summerville submarket was approximately 9.7%, with average asking rents of $1,089 and inventory of 9,269 units. According to the appraisal, as of the first quarter of 2019, the vacancy rate in the Charleston market was approximately 10.6%, with average asking rents of $1,246 and inventory of 43,074 units. According to the appraisal, new supply is forecasted to exceed demand in the market. According to the appraisal, the estimated 2019 population within a one-, three- and five-mile radius of the Mosby Ingleside Property was 4,565, 51,314 and 186,214, respectively. The estimated 2019 average household income within a one-, three- and five-mile radius was $52,256, $73,819 and $71,846, respectively.
The following table presents certain information relating to comparable rental properties to the Mosby Ingleside Property:
| Comparable Rental Properties | |||||||
| Mosby Ingleside Property(1) | Palmetto Exchange | Ashton Woods | Alta Shores | Cypress River | Ingleside Plantation | Colonial Grand at Commerce Park | |
| Year Built | 2018 | 2018 | 2008 | 2004 | 2014 | 2008 | 2007 |
| Number of units | 312 | 252 | 192 | 240 | 280 | 304 | 312 |
| Occupancy | 94.9% | 94.0% | 92.0% | 98.0% | 95.0% | 91.0% | 94.0% |
| Unit size (SF)(2): | |||||||
| - 1-BR | 776 | 775 | 632 | 785 | 581 | 767 | 806 |
| - 2-BR | 1,109 | 1,041 | 949 | 1,103 | 959 | 1,186 | 1,088 |
| - 3-BR | 1,363 | 1,300 | N/A | N/A | 1,330 | 1,471 | 1,260 |
| Monthly Rent per Unit(2): | |||||||
| - 1-BR | $1,111 | $1,113 | $942 | $938 | $983 | $1,025 | $1,080 |
| - 2-BR | $1,356 | $1,315 | $1,073 | $1,195 | $1,182 | $1,255 | $1,190 |
| - 3-BR | $1,546 | $1,620 | N/A | N/A | $1,605 | $1,530 | $1,483 |
| Monthly Rent per SF(2): | |||||||
| - 1-BR | $1.43 | $1.44 | $1.49 | $1.20 | $1.69 | $1.34 | $1.34 |
| - 2-BR | $1.22 | $1.26 | $1.13 | $1.08 | $1.23 | $1.06 | $1.09 |
| - 3-BR | $1.13 | $1.25 | N/A | N/A | $1.21 | $1.04 | $1.18 |
Source:Appraisal
| (1) | As of the borrower rent roll dated October 22, 2019. |
| (2) | Represents the weighted average for each unit size at the Mosby Ingleside Property. |
| This is not a research report and was not prepared by any Underwriter’s research department. Please see additional important information and qualifications at the end of this Term Sheet. |
T-121
| Multifamily – Garden | Loan #12 | Cut-off Date Balance: | $36,000,000 | |
| 3730 Ingleside Boulevard | Mosby Ingleside | Cut-off Date LTV: | 67.3% | |
| North Charleston, SC 29456 | U/W NCF DSCR: | 1.95x | ||
| U/W NOI Debt Yield: | 7.7% |
Operating History and Underwritten Net Cash Flow. The following table presents certain information relating to the historical operating performance and Underwritten Net Cash Flow at the Mosby Ingleside Property:
| Cash Flow Analysis(1) | ||||
| 12/31/2018 | 8/31/2019 TTM | UW(2) | UW per unit | |
| Gross Potential Rent | $4,771,992 | $4,613,321 | $4,657,248 | $14,927.08 |
| Other Income | $233,881 | $411,981 | $388,392 | $1,244.85 |
| Concessions | ($328,306) | ($130,261) | ($59,556) | ($190.88) |
| Less Vacancy & Credit Loss | ($2,894,814) | ($603,061) | ($232,862) | ($746.35) |
| Effective Gross Income | $1,782,753 | $4,291,980 | $4,753,222 | $15,234.68 |
| Real Estate Taxes | $64,076 | $547,409 | $641,650 | $2,056.57 |
| Insurance | $30,554 | $68,272 | $96,470 | $309.20 |
| Other Expenses | $994,415 | $1,316,977 | $1,235,485 | $3,959.89 |
| Total Expenses | $1,089,045 | $1,932,658 | $1,973,605 | $6,325.66 |
| Net Operating Income | $693,708 | $2,359,322 | $2,779,617 | $8,909.03 |
| Capital Expenditures | $0 | $0 | $62,400 | $200.00 |
| Net Cash Flow | $693,708 | $2,359,322 | $2,717,217 | $8,709.03 |
| Occupancy % | N/A | 94.9%(3) | 95.0%(3) | |
| NOI DSCR | 0.50x | 1.69x | 1.99x | |
| NCF DSCR | 0.50x | 1.69x | 1.95x | |
| NOI Debt Yield | 1.9% | 6.6% | 7.7% | |
| NCF Debt Yield | 1.9% | 6.6% | 7.5% | |
| (1) | Financial information and occupancy for the year ending on December 31, 2018 does not represent stabilized operations because the Mosby Ingleside Property was constructed in 2018 and exited its lease-up period in or about September 2018. |
| (2) | The increase from 8/31/2019 TTM Net Operating Income to UW Net Operating Income is primarily due to a projected decrease in concessions because the initial lease up concessions have been expiring. |
| (3) | 8/31/2019 TTM Occupancy is as of the borrower rent roll dated October 22, 2019. UW Occupancy represents economic occupancy. |
| This is not a research report and was not prepared by any Underwriter’s research department. Please see additional important information and qualifications at the end of this Term Sheet. |
T-122
(THIS PAGE INTENTIONALLY LEFT BLANK)
T-123
| Mortgage Loan No. 13 – Sacramento Office Portfolio |
| Mortgage Loan Information | Property Information | ||||||
| Mortgage Loan Seller: | BANA | Single Asset/Portfolio: | Portfolio | ||||
| Credit Assessment (KBRA/Fitch/S&P): | NR/NR/NR | Location: | Sacramento, CA Various | ||||
| Original Balance: | $35,000,000 | General Property Type(3): | Various | ||||
| Cut-off Date Balance(1): | $35,000,000 | Detailed Property Type(3): | Various | ||||
| % of Initial Pool Balance(1): | 2.7% | Title Vesting: | Fee | ||||
| Loan Purpose: | Refinance | Year Built/Renovated(3): | Various/Various | ||||
| Borrower Sponsor: | Omninet Capital, LLC | Size: | 496,693 SF | ||||
| Guarantor: | Neil Kadisha; Benjamin Nazarian | Cut-off Date Balance per SF(1): | $99 | ||||
| Mortgage Rate: | 3.3630% | Maturity Date Balance per SF(1): | $99 | ||||
| Note Date: | 10/17/2019 | Property Manager: | Cushman & Wakefield, | ||||
| First Payment Date: | 12/1/2019 | U.S., Inc. | |||||
| Maturity Date: | 11/1/2029 | Underwriting and Financial Information | |||||
| Original Term to Maturity: | 120 months | UW NOI: | $5,528,093 | ||||
| Original Amortization Term: | 0 months | UW NOI Debt Yield(1): | 11.2% | ||||
| IO Period: | 120 months | UW NOI Debt Yield at Maturity(1): | 11.2% | ||||
| Seasoning: | 1 month | UW NCF DSCR(1): | 2.98x | ||||
| Prepayment Provisions: | LO (25); DEF (90); O (5) | Most Recent NOI: | $4,846,759 (8/31/2019 TTM) | ||||
| Lockbox/Cash Mgmt Status: | Hard/Springing | 2nd Most Recent NOI: | $4,780,300 (12/31/2018) | ||||
| Additional Debt Type(1): | Pari Passu | 3rd Most Recent NOI: | $4,865,775 (12/31/2017) | ||||
| Additional Debt Balance(1): | $14,400,000 | Most Recent Occupancy: | 88.3% (9/30/2019) | ||||
| Future Debt Permitted (Type): | No (N/A) | 2nd Most Recent Occupancy: | 86.0% (12/31/2018) | ||||
| Reserves | 3rd Most Recent Occupancy: | 86.0% (12/31/2017) | |||||
| Type | Initial | Monthly | Cap | Appraised Value (as of)(8): | $73,600,000 (8/1/2019) | ||
| RE Tax: | $179,605 | $59,868 | N/A | Appraised Value per SF(8): | $148 | ||
| Insurance: | $0 | Springing(4) | N/A | Cut-off Date LTV Ratio(1)(8): | 67.1% | ||
| Deferred Maintenance: | $51,375 | $0 | N/A | Maturity Date LTV Ratio(1)(8): | 67.1% | ||
| Recurring Replacements: | $0 | $7,375 | N/A | ||||
| TI/LC: | $3,000,000 | Springing(4) | $2,500,000 | ||||
| Existing Tenant improvements(5): | $1,530,469 | $0 | N/A | ||||
| Existing Leasing commissions(6): | $347,683 | $0 | N/A | ||||
| Free Rent(7): | $99,741 | $0 | N/A | ||||
| Sources and Uses | ||||||
| Sources | Proceeds | % of Total | Uses | Proceeds | % of Total | |
| Whole Loan Amount(1): | $49,400,000 | 100.0% | Loan payoff: | $37,384,671 | 75.7% | |
| Return of Equity: | $6,136,702 | 12.4% | ||||
| Reserves: | $5,208,873 | 10.5% | ||||
| Closing Costs: | $669,754 | 1.4% | ||||
| Total Sources: | $49,400,000 | 100.0% | Total Uses: | $49,400,000 | 100.0% | |
| (1) | The Sacramento Office Portfolio Mortgage Loan (as defined below) is a part of the Sacramento Office Portfolio Whole Loan (as defined below) with an original aggregate principal balance of $49,400,000. The Cut-off Date Balance per SF, Maturity Date Balance per SF, UW NOI Debt Yield, UW NOI Debt Yield at Maturity, UW NCF DSCR, Cut-off Date LTV Ratio and Maturity Date LTV Ratio numbers presented above are based on the Sacramento Office Portfolio Whole Loan |
| (2) | The Sacramento Office Portfolio Borrowers (as defined below) have the right to defease the Sacramento Office Portfolio Whole Loan on any date beginning two years after the closing date of the securitization that includes the lastpari passu note to be securitized. The assumed defeasance lockout period of 25 payments is based on the closing date of this transaction in December 2019. |
| (3) | See “Property Summary”table below. |
| (4) | The Monthly deposits for insurance are suspended so long as (i) no event of default has occurred, (ii) the lender has received evidence of payment of insurance premiums and renewal of policies and (iii) the Sacramento Office Portfolio Properties (as defined below) are covered by a blanket insurance policy. The Sacramento Office Portfolio Borrower (as defined below) is required to deposit $41,391 monthly for a leasing deposit if the balance falls below the cap of $2,500,000. |
| (5) | Tenant improvement costs owed in connection with the 92,599 SF of renewal and expansion space of the second largest tenant at the Royal Oaks Campus property, Dept. of Consumer Affairs State of CA. |
| (6) | $341,000 of the reserved leasing commissions was owed for the second largest tenant at the Royal Oaks Campus property, Dept. of Consumer Affairs State of CA and $6,683 for the third largest tenant at the Lennane Campus property, Dept. Alcohol Beverage Control CA, respectively. |
| (7) | The lender reserved 100.0% of the free rent owed for the 3,874 SF expansion space for the second largest tenant at the Royal Oaks Campus property, Dept. of Consumer Affairs State of CA for the months of December 2019, January 2020 and February 2020. |
| (8) | The Appraised Value shown reflects a “Bulk Portfolio Value” of $73,600,000. The Cut-off Date LTV and Maturity Date LTV assuming the aggregate as-is values of the individual properties of $73,590,000 are 67.1% and 67.1% respectively. |
The Mortgage Loan. The thirteenth largest mortgage loan (the “Sacramento Office Portfolio Mortgage Loan”) is a part of a whole loan (the “Sacramento Office Portfolio Whole Loan”) evidenced by twopari passu promissory notes in the original aggregate principal amount of $49,400,000. The Sacramento Office Portfolio Whole Loan is secured by a first priority fee mortgage encumbering two office properties and one industrial property each located in Sacramento, California (the “Sacramento Office Portfolio Properties”). The Sacramento Office Portfolio Mortgage Loan is evidenced by the controlling promissory Note A-1 in the original principal amount of $35,000,000. The non-controlling promissory Note A-2, in the original principal amount of
| This is not a research report and was not prepared by any Underwriter’s research department. Please see additional important information and qualifications at the end of this Term Sheet. |
T-124
| Property Types – Various | Loan #13 | Cut-off Date Balance: | $35,000,000 | |
| Property Addresses – Various | Sacramento Office Portfolio | Cut-off Date LTV: | 67.1% | |
| Sacramento, CA Various | UW NCF DSCR: | 2.98x | ||
| UW NOI Debt Yield: | 11.2% |
$14,400,000, is expected to be contributed to a future securitization trust or may be otherwise transferred at any time. The Sacramento Office Portfolio Whole Loan will be serviced pursuant to the pooling and servicing agreement for the BANK 2019-BNK23 securitization trust. See “Description of the Mortgage Pool—The Whole Loans—The Serviced Pari Passu Whole Loans” and “Pooling and Servicing Agreement” in the Preliminary Prospectus.
| Sacramento Office Portfolio Whole Loan Summary | ||||
| Note | Original Balance | Cut-off Date Balance | Note Holder | Controlling Piece |
| A-1 | $35,000,000 | $35,000,000 | BANK 2019-BNK23 | Yes |
| A-2 | $14,400,000 | $14,400,000 | BANA | No |
| Total | $49,400,000 | $49,400,000 | ||
The Borrowers and the Borrower Sponsor. The borrower is composed of Omninet Sacramento, LLC, Omninet Sacramento Valencia, LLC, Omninet Sacramento Lecota, LLC and Omninet Sacramento Jardinette, LLC, collectively, as tenants-in-common (the “Sacramento Office Portfolio Borrower”). Omninet Capital, LLC (“Omninet”) is the borrower sponsor and its principals, Neil Kadisha and Benjamin Nazarian, are the non-recourse carveout guarantors with respect to the Sacramento Office Portfolio Whole Loan. Omninet was founded by its principals approximately 20 years ago and is a diversified investment firm composing of experienced real estate operators. Omninet currently owns over 7 million square feet of commercial space and over 13,000 residential units across the country.
The Properties. The Sacramento Office Portfolio Properties are comprised of one industrial and two office properties (six buildings) containing a total of 496,693 SF all located in Sacramento, California. The Royal Oaks Campus and the Lennane Campus are office properties while the West Sacramento Campus property is an industrial building. The Royal Oaks Campus property is a 257,812 SF suburban office property consisting of two buildings located at 2000 & 2005 Evergreen Street on a 13.86-acre site. The Royal Oaks Campus property is currently 77.5% leased by two California State tenants: Dept. Financial Info System for CA and Dept. of Consumer Affairs State of CA. The Lennane Campus property is a 160,200 SF, three-building suburban office property located at 3701 North Freeway Boulevard and 3901 and 3927 Lennane Drive on a 10.25-acre site. The Lennane Campus property is 99.9% leased to various entities belonging to the Dept. Public Health of CA and the Dept. Alcohol Beverage Control CA. The West Sacramento Campus property is a 78,681 SF industrial/flex space facility located at 3500 Industrial Boulevard on a 6.84-acre site. The West Sacramento Campus property is improved with two floors of office space that comprises 79.0% and the remainder is warehouse space with a 24-foot clear height. The West Sacramento Campus property is 100.0% leased to the Dept. of Water Resources. In aggregate the Sacramento Office Portfolio Properties are 88.3% leased as of September 30, 2019 by 8 tenants. A release of any of the Sacramento Office Portfolio Properties is not permitted.
| Property Summary | ||||||||||
| Property Name | City, State | Year Built/ Renovated | Property Type | Property Sub Type | Total SF(1) | % of Total SF | Occ. %(1) | Cut-off Date ALA | Appraised Value(2)
| 8/31/2019 TTM NOI |
| Royal Oaks Campus | Sacramento, CA | 1980/1998 | Office | Suburban | 257,812 | 51.9% | 77.5% | $17,545,183 | $36,890,000 | $2,140,111 |
| Lennane Campus | Sacramento, CA | 1989/2008 | Office | Suburban | 160,200 | 32.3% | 99.9% | $11,176,790 | $23,500,000 | $1,745,991 |
| West Sacramento Campus | Sacramento, CA | 2007/NA | Industrial | Flex | 78,681 | 15.8% | 100.0% | $6,278,027 | $13,200,000 | $960,657 |
| Total/Wtd. Avg. | 496,693 | 100.0% | 88.3% | $35,000,000 | $73,600,000 | $4,846,759 | ||||
| (1) | Based on underwritten rent roll and includes 3,874 SF of expansion space for the second largest tenant at the Royal Oaks Campus property, Dept. of Consumer Affairs State of CA, which is not in occupancy yet. The rent abatement for the first three months was fully reserved at origination. |
| (2) | The Appraised Value shown reflects a “Bulk Portfolio Value” of $73,600,000. The Cut-off Date LTV and Maturity Date LTV assuming the aggregate as-is values of the individual properties of $73,590,000 are 67.1% and 67.1% respectively. |
Major Tenants.
Dept. Financial Info System for CA (107,132 SF, 21.6% of NRA, 23.5% of underwritten rent). Dept. Financial Info System for CA (“FI$CAL”) is California’s statewide accounting, budget, cash management and procurement information technology system. The department builds and manages a system that provides the state with an integrated finance platform. FI$CAL operates its headquarters at the Royal Oaks Campus property and occupies space under three separate leases at a rent of $21.14 PSF with and varying lease expiration dates in July 31, 2020, April 30, 2021 and July 31, 2023. The lease contains an ongoing termination right exercisable upon 30 days’ prior written notice.
Dept. of Consumer Affairs State of CA (92,599 SF, 18.6% of NRA, 24.3% of underwritten rent). Dept. of Consumer Affairs State of CA, is mandated to protect California’s consumers by ensuring a standard of professionalism in key industries and promoting informed consumer practices. The Dept. of Consumer Affairs State of CA administers more than 3.9 million licenses in more than 280 license types. The tenant serves as the regulatory centers for many of the professions it regulates, including dental hygiene, physical therapy and pest control. Dept. of Consumer Affairs State of CA operates at the Royal Oaks Campus property and has been in occupancy since 2008 and recently renewed its lease through February 29, 2028 at a rent of $25.36 PSF, as well as expanded by 3,874 SF. In connection with its renewal and expansion space, Dept. of Consumer Affairs State of CA received tenant improvements and leasing commissions of $1,871,469, which have been fully reserved at closing. The lender has also reserved three months of free rent of $99,741 in connection with the tenant’s expansion space. The tenant has an ongoing termination option at any time on or after February 29, 2024 with 30 days’ notice.
Dept. of Water Resources (78,681 SF, 15.8%% of NRA, 16.8% of underwritten rent). Dept of Water Resources is the regulatory body mandated to sustainably manage the water resources of California. The department was established in 1956 and supplies water to almost 27 million Californians and 750,000 acres of farmland. The tenant is headquartered at the West Sacramento Campus property and utilizes its space for general office use, lab testing, engineering, environmental services, equipment and vehicle storage, and warehousing. Dept of Water Resources has been in occupancy since 2009 with its lease expiring on December 31, 2023 at the rent of $20.57 PSF. The tenant has an ongoing termination option with 60 days’ notice.
| This is not a research report and was not prepared by any Underwriter’s research department. Please see additional important information and qualifications at the end of this Term Sheet. |
T-125
| Property Types – Various | Loan #13 | Cut-off Date Balance: | $35,000,000 | |
| Property Addresses – Various | Sacramento Office Portfolio | Cut-off Date LTV: | 67.1% | |
| Sacramento, CA Various | UW NCF DSCR: | 2.98x | ||
| UW NOI Debt Yield: | 11.2% |
The following table presents certain information relating to the tenants at the Sacramento Office Portfolio Properties:
| Tenant Summary | |||||||||
| Tenant Name | Property Name | Credit Rating (Fitch/S&P/ Moody’s)(1) | Tenant SF | Approx. % of Total SF | Annual UW Rent | % of Total Annual UW Rent | Annual UW Rent PSF | Lease Exp. | Term. Options |
| Dept. Financial Info System for CA(2) | Royal Oaks Campus | AA/AA-/Aa2 | 107,132 | 21.6% | $2,264,923 | 23.5% | $21.14 | Various | Y |
| Dept. of Consumer Affairs State of CA(3) | Royal Oaks Campus | AA/AA-/Aa2 | 92,599 | 18.6% | $2,348,062 | 24.3% | $25.36 | 2/29/2028 | Y |
| Dept. of Water Resources(4) | West Sacramento Campus | AA/AA-/Aa2 | 78,681 | 15.8% | $1,618,491 | 16.8% | $20.57 | 12/31/2023 | Y |
| Dept. Public Health - WIC, State of CA(5) | Lennane Campus | AA/AA-/Aa2 | 59,224 | 11.9% | $1,220,111 | 12.6% | $20.60 | 10/31/2023 | Y |
| Dept. Public Health Vital Records CA(6) | Lennane Campus | AA/AA-/Aa2 | 42,293 | 8.5% | $955,595 | 9.9% | $22.59 | 3/31/2024 | Y |
| Subtotal/Wtd. Avg. | 379,929 | 76.5% | $8,407,182 | 87.1% | $22.13 | ||||
| Other Tenants | 58,478 | 11.8% | $1,243,585 | 12.9% | $21.27 | ||||
| Vacant Space | 58,286 | 11.7% | $0 | 0.0% | $0.00 | ||||
| Total/Wtd. Avg.(7) | 496,693 | 100.0% | $9,650,767 | 100.0% | $22.01 | ||||
Information is based on the underwritten rent roll.
| (1) | Tenant Ratings are for the State of California whether or not the State guarantees the lease. |
| (2) | Dept. Financial Info System for CA is subject to three leases: 8,150 SF expiring in July 31, 2020, 77,987 SF expiring in April 30, 2021 and 20,995 expiring in July 31, 2023 which have an ongoing termination right exercisable upon 30 days’ prior written notice. |
| (3) | Dept. of Consumer Affairs State of CA has a termination right effective February 29, 2024, upon 30 days’ prior written notice. |
| (4) | Dept. of Water Resources has an ongoing termination right exercisable upon 60 days’ prior written notice. |
| (5) | Dept. Public Health - WIC, State of CA has a termination right effective February 28, 2020, upon 30 days’ prior written notice. |
| (6) | Dept. Public Health Vital Records CA has a termination right effective July 31, 2020, upon 60 days’ prior written notice. |
| (7) | Wtd. Avg. Annual UW Rent PSF excludes vacant space. |
The following table presents certain information relating to the lease rollover schedule at the Sacramento Office Portfolio Properties:
| Lease Rollover Schedule | |||||||||
| Year | # of Leases Rolling | SF Rolling | UW Rent PSF Rolling | Approx. % of Total SF Rolling | Approx. Cumulative % of SF Rolling | Total UW Rent Rolling | Approx. % of Total Rent Rolling | Approx. Cumulative % of Total Rent Rolling | |
| 2019 | 0 | 0 | $0.00 | 0.0% | 0.0% | $0 | 0.0% | 0.0% | |
| 2020 | 1 | 8,150 | $22.02 | 1.6% | 1.6% | $179,460 | 1.9% | 1.9% | |
| 2021 | 1 | 77,987 | $21.54 | 15.7% | 17.3% | $1,679,840 | 17.4% | 19.3% | |
| 2022 | 0 | 0 | $0.00 | 0.0% | 17.3% | $0 | 0.0% | 19.3% | |
| 2023 | 4 | 159,765 | $20.37 | 32.2% | 49.5% | $3,254,605 | 33.7% | 53.0% | |
| 2024 | 2 | 47,200 | $22.43 | 9.5% | 59.0% | $1,058,642 | 11.0% | 64.0% | |
| 2025 | 1 | 13,040 | $20.40 | 2.6% | 61.6% | $266,016 | 2.8% | 66.7% | |
| 2026 | 0 | 0 | $0.00 | 0.0% | 61.6% | $0 | 0.0% | 66.7% | |
| 2027 | 0 | 0 | $0.00 | 0.0% | 61.6% | $0 | 0.0% | 66.7% | |
| 2028 | 2 | 92,599 | $25.36 | 18.6% | 80.3% | $2,348,062 | 24.3% | 91.0% | |
| 2029 | 0 | 0 | $0.00 | 0.0% | 80.3% | $0 | 0.0% | 91.0% | |
| 2030 & Beyond | 2 | 39,666 | $21.79 | 8.0% | 88.3% | $864,142 | 9.0% | 100.0% | |
| Vacant | 0 | 58,286 | $0.00 | 11.7% | 100.0% | $0 | 0.0% | 100.0% | |
| Total/Wtd. Avg.(1) | 13 | 496,693 | $22.01 | 100.0% | $9,650,767 | 100.0% | |||
Information is based on the underwritten rent roll.
| (1) | Wtd. Avg. UW Rent PSF Rolling excludes vacant space. |
The Market. The Sacramento Office Portfolio Properties are located in Sacramento, California. The City of Sacramento is the State capital and is the economic and demographic center of the metropolitan statistical area. The Sacramento area has an advantage due to its central location to transportation systems. The city of Sacramento is located at the nucleus of several major freeways, including US Highway 50, State Highway 99 and Interstates 5 and 80. These highways provide access to the San Francisco Bay area to the west, Southern California to the south, Oregon and Washington to the north and Nevada to the east. As the State capital, the City of Sacramento is the center of state government and has the highest concentration of government jobs per capita in California. It is the largest city in a six county region, serving a population close to 500,000 in the city and nearly 2.5 million people in the region. There are eight higher education institutions located in the Sacramento area, including Sacramento State University (30,661 students), University of California, Davis (39,000 students) and American River Junior College (30,000 students). These institutions provide more than 160 vocational and training programs and a well-educated work force for the Sacramento metropolitan statistical area, with University of California, Davis being ranked as one of the top 10 public universities in the nation.
| This is not a research report and was not prepared by any Underwriter’s research department. Please see additional important information and qualifications at the end of this Term Sheet. |
T-126
| Property Types – Various | Loan #13 | Cut-off Date Balance: | $35,000,000 | |
| Property Addresses – Various | Sacramento Office Portfolio | Cut-off Date LTV: | 67.1% | |
| Sacramento, CA Various | UW NCF DSCR: | 2.98x | ||
| UW NOI Debt Yield: | 11.2% |
The Royal Oaks Campus property is located approximately 4.2 miles from Downtown Sacramento within the Point West office submarket. According to the appraisal, as of the second quarter of 2019, the vacancy rate in the Point West office submarket was approximately 13.7%, with average asking rents of $23.40 PSF and inventory of approximately 2.4 million SF. According to the appraisal, the 2019 population within a one-, three- and five-mile radius of the Royal Oaks Campus property is 12,971, 154,784 and 362,923, respectively. The 2019 average household income within the same one-, three- and five-mile radius was $50,480, $71,324 and $79,902, respectively.
The Lennane Campus property is located approximately 6.0 miles from Downtown Sacramento within the Northgate/Natomas office submarket. According to the appraisal, as of the second quarter of 2019, the vacancy rate in the Northgate/Natomas office submarket was approximately 17.1%, with average asking rents of $18.84 PSF and inventory of approximately 2.3 million SF. According to the appraisal, the 2019 population within a one-, three- and five-mile radius of the Lennane Campus property was 43, 51,625 and 152,925 respectively. The 2019 average household income within the same one-, three- and five-mile radius was $83,887, $84,447 and $83,377, respectively.
The West Sacramento Campus property is located approximately 4.3 miles from Downtown Sacramento within the West Sacramento industrial submarket. According to the appraisal, as of the second quarter of 2019, the vacancy rate in the West Sacramento industrial submarket was approximately 3.2%, with average asking rents of $6.84 PSF and inventory of approximately 21.7 million SF. According to the appraisal, the 2019 population within a one-, three- and five-mile radius of the West Sacramento Campus property was 2,044, 53,656 and 163,943, respectively. The 2019 average household income within the same one-, three- and five-mile radius was $53,977, $81,390 and $85,889, respectively.
Operating History and Underwritten Net Cash Flow.The following table presents certain information relating to the historical operating performance and Underwritten Net Cash Flow at the Sacramento Office Portfolio Properties:
| Cash Flow Analysis | |||||||
| 2016(1) | 2017 | 2018 | 8/31/2019 TTM | UW | UW PSF | ||
| Gross Potential Rent(1) | N/A | $8,626,952 | $8,789,822 | $8,897,524 | $10,874,650 | $21.89 | |
| Vacancy | N/A | $0 | $0 | $0 | ($1,273,000) | ($2.56) | |
| Effective Gross Income | N/A | $8,626,952 | $8,789,822 | $8,897,524 | $9,601,650 | $19.33 | |
| Taxes | N/A | $680,691 | $667,421 | $662,749 | $661,477 | $1.33 | |
| Insurance | N/A | $105,835 | $124,992 | $134,866 | $141,590 | $0.29 | |
| Other Operating Expenses | N/A | $2,974,651 | $3,217,109 | $3,253,150 | $3,270,490 | $6.58 | |
| Total Operating Expenses | N/A | $3,761,177 | $4,009,522 | $4,050,765 | $4,073,557 | $8.20 | |
| Net Operating Income | N/A | $4,865,775 | $4,780,300 | $4,846,759 | $5,528,093 | $11.13 | |
| TI/LC | N/A | $2 | $0 | $0 | $411,943 | $0.83 | |
| Capital Expenditures | N/A | $0 | $0 | $0 | $97,420 | $0.20 | |
| Net Cash Flow | N/A | $4,865,773 | $4,780,300 | $4,846,759 | $5,018,730 | $10.10 | |
| Occupancy%(3) | N/A | 86.0% | 86.0% | 86.0% | 88.3% | ||
| NOI DSCR(4) | N/A | 2.89x | 2.84x | 2.88x | 3.28x | ||
| NCF DSCR(4) | N/A | 2.89x | 2.84x | 2.88x | 2.98x | ||
| NOI Debt Yield(4) | N/A | 9.8% | 9.7% | 9.8% | 11.2% | ||
| NCF Debt Yield(4) | N/A | 9.8% | 9.7% | 9.8% | 10.2% | ||
| (1) | Financial information prior to 2017 is not available as the Sponsor acquired the Sacramento Office Portfolio Properties in 2016. |
| (2) | UW Gross Potential Rent is based on the September 30, 2019 rent roll, include first 12 months of rent steps, $99,762 of straight-lined rent for two tenants (Dept. of Consumer Affairs State of CA and Dept. Alcohol Beverage Control CA) and rent from 3,874 SF expansion space of Dept. of Consumer Affairs State of CA at the Royal Oaks Campus property and 7,692 SF expansion space of Dept. Alcohol Beverage Control CA at the Lennane Campus property. |
| (3) | UW Vacancy is based on in-place economic vacancy. |
| (4) | Debt service coverage ratios and debt yields are based on the Sacramento Office Portfolio Whole Loan. |
| This is not a research report and was not prepared by any Underwriter’s research department. Please see additional important information and qualifications at the end of this Term Sheet. |
T-127
| Mortgage Loan No. 14 – Plaza Pacoima |
| Mortgage Loan Information | Property Information | ||||||
| Mortgage Loan Seller: | WFB | Single Asset/Portfolio: | Single Asset | ||||
| Credit Assessment (KBRA/Fitch/S&P): | NR/NR/NR | Location: | Pacoima, CA 91331 | ||||
| Original Balance: | $31,200,000 | General Property Type: | Retail | ||||
| Cut-off Date Balance: | $31,200,000 | Detailed Property Type: | Anchored | ||||
| % of Initial Pool Balance: | 2.4% | Title Vesting: | Fee | ||||
| Loan Purpose: | Acquisition | Year Built/Renovated: | 2010/N/A | ||||
| Sponsor: | Breit Operating Partnership L.P. | Size: | 203,743 SF | ||||
| Guarantor: | Breit Operating Partnership L.P. | Cut-off Date Balance per SF: | $153 | ||||
| Mortgage Rate: | 3.5020% | Maturity Balance per SF: | $153 | ||||
| Note Date: | 10/11/2019 | Property Manager: | ShopCore Properties TRS | ||||
| First Payment Date: | 12/1/2019 | Management LLC | |||||
| Maturity Date: | 11/1/2029 | Underwriting and Financial Information | |||||
| Original Term to Maturity: | 120 months | UW NOI: | $3,090,259 | ||||
| Original Amortization Term: | 0 months | UW NOI Debt Yield: | 9.9% | ||||
| IO Period: | 120 months | UW NOI Debt Yield at Maturity: | 9.9% | ||||
| Seasoning: | 1 month | UW NCF DSCR: | 2.72x | ||||
| Prepayment Provisions: | YM0.5 (25); DEF/YM0.5 (88);O (7) | Most Recent NOI: | $3,137,609 (8/31/2019 TTM) | ||||
| Lockbox/Cash Mgmt Status: | Hard/Springing Cash Management | 2nd Most Recent NOI: | $3,087,669 (12/31/2018) | ||||
| Additional Debt Type(1): | Subordinate Secured | 3rd Most Recent NOI: | $3,087,073 (12/31/2017) | ||||
| Additional Debt Balance(1): | $4,735,000 | Most Recent Occupancy: | 100.0% (10/11/2019) | ||||
| Future Debt Permitted (Type): | No (N/A) | 2nd Most Recent Occupancy: | 99.5% (12/31/2018) | ||||
| Reserves | 3rd Most Recent Occupancy: | 99.5% (12/31/2017) | |||||
| Type | Initial | Monthly | Cap | Appraised Value (as of): | $51,300,000 (7/6/2019) | ||
| Real Estate Taxes(2): | $0 | Springing | N/A | Appraised Value per SF: | $252 | ||
| Insurance(3): | $0 | Springing | N/A | Cut-off Date LTV Ratio: | 60.8% | ||
| Recurring Replacements(4): | $0 | Springing | $19,600 | Maturity Date LTV Ratio: | 60.8% | ||
| TI/LC(5): | $0 | Springing | $407,486 | ||||
| Unfunded Obligations Reserve(6): | $41,862 | $0 | N/A | ||||
| Sources and Uses | ||||||
| Sources | Proceeds | % of Total | Uses | Proceeds | % of Total | |
| Loan Amount: | $31,200,000 | 59.8% | Purchase Price: | $51,300,000 | 98.3% | |
| Borrower Equity: | $21,000,174 | 40.2% | Upfront Reserves: | $41,862 | 0.1% | |
| Closing Costs: | $858,312 | 1.6% | ||||
| Total Sources: | $52,200,174 | 100.0% | Total Uses: | $52,200,174 | 100.0% | |
| (1) | See “Additional Secured Indebtedness (not including trade debts)” section for a discussion on the subordinate secured debt, including total debt metrics. |
| (2) | The Plaza Pacoima Mortgage Loan (as defined below) documents do not require monthly escrows for taxes as long as (i) no event of default has occurred and is continuing, (ii) there has been no bankruptcy action by or against the borrower; and (iii) the net operating income debt service coverage ratio is greater than or equal to 1.20x for two consecutive calendar quarters based on the trailing four-calendar-quarter period. |
| (3) | The Plaza Pacoima Mortgage Loan documents do not require ongoing monthly escrows for insurance premiums as long as (i) no event of default has occurred and is continuing, (ii) the Plaza Pacoima Property is covered under a blanket policy acceptable to lender, (iii) there has been no bankruptcy action by or against the borrower, and (iv) the net operating income debt service coverage ratio is greater than or equal to 1.20x for two consecutive calendar quarters based on the trailing four-calendar-quarter period. |
| (4) | The Plaza Pacoima Mortgage Loan documents do not require ongoing monthly escrows for recurring replacements in the amount of $817 as long as (i) no event of default has occurred and is continuing, (ii) there has been no bankruptcy action by or against the borrower; and (iii) the net operating income debt service coverage ratio is greater than or equal to 1.20x for two consecutive calendar quarters based on the trailing four-calendar-quarter period. The recurring replacements reserve is subject to a cap of $19,600. |
| (5) | The Plaza Pacoima Mortgage Loan documents do not require ongoing monthly escrows for recurring tenant improvements and leasing commissions (“TI/LC”) in the amount of $16,979 as long as (i) no event of default has occurred and is continuing, (ii) there has been no bankruptcy action by or against the borrower; and (iii) the net operating income debt service coverage ratio is greater than or equal to 1.20x for two consecutive calendar quarters based on the trailing four-calendar-quarter period. The TI/LC reserve is subject to a cap of $407,486. |
| (6) | The Plaza Pacoima Mortgage Loan documents require an upfront deposit equal to $41,862 for tenant improvement costs owed to RPM Juice, Inc. |
The Mortgage Loan. The fourteenth largest mortgage loan (the “Plaza Pacoima Mortgage Loan”) is evidenced by a single promissory note in the original principal amount of $31,200,000 and secured by a first priority fee mortgage encumbering a 203,743 SF anchored retail center (the “Plaza Pacoima Property”) located in Pacoima, California.
The Borrower and the Borrower Sponsor. The borrower is BCORE Retail Pacoima Owner LLC (the “Plaza Pacoima Borrower”), a Delaware limited liability company and single purpose entity with one independent director. Legal counsel to the Plaza Pacoima Borrower delivered a non-consolidation opinion in connection with the origination of the Plaza Pacoima Mortgage Loan.
The borrower sponsor and non-recourse carve-out guarantor is Breit Operating Partnership L.P. (the “Guarantor”), a limited partnership that is 100% owned by Blackstone Real Estate Income Trust, Inc. (“BREIT”), Blackstone’s non-traded REIT focuses on investing in primarily stabilized commercial real estate properties diversified by sector. BREIT’s portfolio comprises approximately 103,000 multifamily units, 200 million SF of industrial space, 115,000 hotel rooms and 33 million SF of retail space.
| This is not a research report and was not prepared by any Underwriter’s research department. Please see additional important information and qualifications at the end of this Term Sheet. |
T-128
| Retail – Anchored | Loan #14 | Cut-off Date Balance: | $31,200,000 | |
| 13510, 13520, 13530, and 13550 | Plaza Pacoima | Cut-off Date LTV: | 60.8% | |
| Paxton Street | UW NCF DSCR: | 2.72x | ||
| Pacoima, CA 91331 | UW NOI Debt Yield: | 9.9% |
The loan documents provide that the aggregate liability of the Guarantor for various losses carve-outs (including fraud, misappropriation of rents or proceeds, failure to maintain the environmental insurance policy or waste) and springing recourse events (including voluntary or collusive involuntary bankruptcy filings involving the borrower, guarantor or any guarantor affiliate, or such parties’ consenting to the appointment of a receiver or examiner for such entity or the mortgaged property) is subject to a cap equal to 20% of the loan amount. The Plaza Pacoima Mortgage Loan documents also provide for, among other losses carveouts, a losses carveout (instead of springing recourse) for voluntary transfers of the Plaza Pacoima Property or controlling equity interest in the Plaza Pacoima Borrower made in violation of the Plaza Pacoima Mortgage Loan documents. In lieu of environmental non-recourse carve-out liability, the loan documents require an environmental liability insurance policy covering the Plaza Pacoima Property for a term extending 2 years past the maturity date with a coverage limit of $15 million per occurrence with a deductible not exceeding $50,000; provided that the borrower may obtain such policies for an initial policy term of 4 years so long as they are renewed for the required policy period. At closing, the borrower provided an excess environmental liability-type insurance policy issued by Great American E & S Insurance Company in the amount of $15 million per occurrence and $25 million in the aggregate (and $50 million in excess liability), with an initial term of 5 years and having a deductible of $50,000. The Phase I environmental assessment report dated August 2, 2019 indicated a recognized environmental condition at the Plaza Pacoima Property related to the historical use of the site and adjacent parcels as a Price Pfister facility that manufactured plumbing fixtures. See“Description of the Mortgage Pool–Non-Recourse Carveout Limitations” and “—Environmental Considerations” in the Preliminary Prospectus.
The Property. The Plaza Pacoima Property is a 203,743 SF, anchored retail center located in Pacoima, California. Built in 2010 and situated on a 17.5-acre site, the Plaza Pacoima Property is anchored by Costco and Best Buy and is shadow-anchored by Lowe’s Home Improvement (the shadow anchor is not part of the collateral). Costco owns its improvements and leases the related land pursuant to a 20-year ground lease through March 2030, with four, 10-year renewal options. The Plaza Pacoima Property includes 888 surface parking spaces, resulting in a parking ratio of 4.4 spaces per 1,000 SF of rentable area.
As of October 11, 2019, the Plaza Pacoima Property was 100.0% occupied by 5 national retailers, including Subway, Panda Express, and Jamba Juice in addition to Costco and Best Buy. The Plaza Pacoima Property has averaged approximately 99.7% occupancy since 2010. Four tenants representing approximately 99.5% of NRA and 98.4% of underwritten base rent (all tenants except for Jamba Juice) have been in place at the Plaza Pacoima Property since 2011.
Major Tenants.
Costco (154,743 SF, 76.0% of NRA, 60.2% of underwritten rent, lease expires 3/31/2030).Costco is a membership warehouse club with hundreds of locations worldwide providing a selection of merchandise and specialty departments with exclusive member services. Costco owns its improvements, including a gas station, at the Plaza Pacoima Property, which were developed in March 2010. Costco has four, 10-year renewal options remaining, each with 9 months’ notice at rental rates as specified in the lease. Costco is not required to report sales at the Plaza Pacoima Property. The entity on the Costco lease is Costco Wholesale Corporation.
Best Buy (45,000 SF, 22.1% of NRA, 32.9% of underwritten rent, lease expires 1/31/2021). Best Buy is a provider of technology products, services and solutions. As of April 2019, Best Buy had more than 1,200 stores throughout the United States, Canada and Mexico. Best Buy has been at the Plaza Pacoima Property since May 2010. Best Buy has four, 5-year renewal options remaining, each with 180 days’ notice at rental rates as specified in the lease. Best Buy is not required to report sales at the Plaza Pacoima Property. The entity on the Best Buy lease is Best Buy Stores, L.P.
Other than Costco and Best Buy, no tenant accounts for more than 0.7% of the net rentable area or 2.7% of underwritten base rent at the Plaza Pacoima Property.
The following table presents certain information relating to the tenancy at the Plaza Pacoima Property:
| Tenant Summary(1) | |||||||||||
| Tenant Name | Credit Rating (Fitch/ Moody’s/ S&P)(2) | Tenant SF | Approx. % of SF | Annual UW Rent | % of Total Annual UW Rent | Annual UW Rent PSF | Lease Expiration | 2018 Sales PSF(3) | Occ. Cost %(3) | Term. Option (Y/N) | Remaining Extension Options |
| Major Tenants | |||||||||||
| Costco (Ground Lease) | NR/Aa3/A+ | 154,743 | 76.0% | $1,870,000(4) | 60.2% | $12.08(4) | 3/31/2030 | N/A | N/A | N | 4, 10-year |
| Best Buy | NR/Baa1/BBB | 45,000 | 22.1% | $1,022,850 | 32.9% | $22.73 | 1/31/2021 | N/A | N/A | N | 4, 5-year(5) |
| Subway | NR/NR/NR | 1,500 | 0.7% | $82,843 | 2.7% | $55.23 | 2/29/2020 | N/A | N/A | N | 2, 5-year |
| Panda Express | NR/NR/NR | 1,500 | 0.7% | $78,210 | 2.5% | $52.14 | 3/31/2021 | N/A | N/A | N | 4, 5-year |
| Jamba Juice | NR/NR/NR | 1,000 | 0.5% | $51,000 | 1.6% | $51.00 | 7/31/2029 | N/A | N/A | N | 1, 5-year |
| Subtotal/Wtd. Avg. | 203,743 | 100.0% | $3,104,903 | 100.0% | $15.24 | ||||||
| Vacant Space | 0 | 0.0% | $0 | 0.0% | $0.0 | ||||||
| Total/Wtd. Avg. | 203,743 | 100.0% | $3,104,903 | 100.0% | $15.24 | ||||||
| (1) | Information is based on the underwritten rent roll. |
| (2) | Certain ratings are those of the parent company whether or not the parent guarantees the lease. |
| (3) | No tenants at the Plaza Pacoima Property are required to report sales. |
| (4) | Annual UW Rent and Annual UW Rent PSF include Costco’s contractual rent step occurring in April 2020 totaling $170,000. Costco currently pays a base rental rate of $10.99 PSF. |
| (5) | Best Buy has four, 5-year renewal options remaining, each with 180 days’ notice at rental rates as specified in the lease. |
| This is not a research report and was not prepared by any Underwriter’s research department. Please see additional important information and qualifications at the end of this Term Sheet. |
T-129
| Retail – Anchored | Loan #14 | Cut-off Date Balance: | $31,200,000 | |
| 13510, 13520, 13530, and 13550 | Plaza Pacoima | Cut-off Date LTV: | 60.8% | |
| Paxton Street | UW NCF DSCR: | 2.72x | ||
| Pacoima, CA 91331 | UW NOI Debt Yield: | 9.9% |
The following table presents certain information relating to the lease rollover schedule at the Plaza Pacoima Property:
| Lease Rollover Schedule(1) | ||||||||
| Year | # of Leases Rolling | SF Rolling | Annual UW Rent PSF Rolling | Approx. % of Total SF Rolling | Approx. Cumulative % of SF Rolling | Total UW Rent Rolling | Approx. % of Total Rent Rolling | Approx. Cumulative % of Total Rent Rolling |
| MTM | 0 | 0 | $0.00 | 0.0% | 0.0% | $0 | 0.0% | 0.0% |
| 2019 | 0 | 0 | $0.00 | 0.0% | 0.0% | $0 | 0.0% | 0.0% |
| 2020 | 1 | 1,500 | $55.23 | 0.7% | 0.7% | $82,843 | 2.7% | 2.7% |
| 2021 | 2 | 46,500 | $23.68 | 22.8% | 23.6% | $1,101,060 | 35.5% | 38.1% |
| 2022 | 0 | 0 | $0.00 | 0.0% | 23.6% | $0 | 0.0% | 38.1% |
| 2023 | 0 | 0 | $0.00 | 0.0% | 23.6% | $0 | 0.0% | 38.1% |
| 2024 | 0 | 0 | $0.00 | 0.0% | 23.6% | $0 | 0.0% | 38.1% |
| 2025 | 0 | 0 | $0.00 | 0.0% | 23.6% | $0 | 0.0% | 38.1% |
| 2026 | 0 | 0 | $0.00 | 0.0% | 23.6% | $0 | 0.0% | 38.1% |
| 2027 | 0 | 0 | $0.00 | 0.0% | 23.6% | $0 | 0.0% | 38.1% |
| 2028 | 0 | 0 | $0.00 | 0.0% | 23.6% | $0 | 0.0% | 38.1% |
| 2029 | 1 | 1,000 | $51.00 | 0.5% | 24.0% | $51,000 | 1.6% | 39.8% |
| 2030 & Beyond | 1 | 154,743 | $12.08 | 76.0% | 100.0% | $1,870,000 | 60.2% | 100.0% |
| Vacant | 0 | 0 | $0.00 | 0.0% | 100.0% | $0 | 0.0% | 100.0% |
| Total/Wtd. Avg. | 5 | 203,743 | $15.24 | 100.0% | $3,104,903 | 100.0% | ||
| (1) | Information is based on the underwritten rent roll. |
The Market. The Plaza Pacoima Property is located in the city of Pacoima, within the southeastern portion of San Fernando Valley, Los Angeles, California. The area around the Plaza Pacoima Property is fully developed with limited vacant land available. The Plaza Pacoima Property is situated at the intersection of Paxton Street and San Fernando Road, a major north/south arterial connecting to Highway 118 (the Ronald Reagan Freeway). The Plaza Pacoima Property is located adjacent to the Ronald Reagan Freeway, which connects to Interstate 5 (approximately 1.1 mile southwest) (which provides access southbound to Los Angeles) and Interstate 210 (approximately 1.7 miles northeast), approximately 20.6 miles northwest of the Los Angeles central business district and 27.4 miles north of the Los Angeles International Airport.
According to a third-party market research report, the estimated 2018 population within a one- three- and five-mile radius of the Plaza Pacoima Property was approximately 35,496, 240,654, and 510,078, respectively; while the 2018 estimated average household income within the same radii was $61,175, $72,777, and $76,797, respectively.
According to a third-party market research report, the Plaza Pacoima Property is situated within the San Fernando Valley-East submarket of the Los Angeles retail market. As of the first quarter of 2019, the San Fernando Valley-East retail submarket reported a total inventory of approximately 4.0 million SF of retail space with a 7.2% vacancy rate and average asking rent of $37.41 PSF, triple net.
The following table presents certain information relating to the appraisal’s market rent conclusion for the Plaza Pacoima Property:
| Market Rent Summary | |||
| Costco | Best Buy | In-line Tenants | |
| Market Rent (PSF) | $11.00 | $23.00 | $51.00 |
| Lease Term (Years) | 10 | 10 | 10 |
| Lease Type (Reimbursements) | Net | Net | Net |
| Rent Increase Projection | 12.0% every 5 years | 12.0% every 5 years | 3.0%per annum |
Source:Appraisal
| This is not a research report and was not prepared by any Underwriter’s research department. Please see additional important information and qualifications at the end of this Term Sheet. |
T-130
| Retail – Anchored | Loan #14 | Cut-off Date Balance: | $31,200,000 | |
| 13510, 13520, 13530, and 13550 | Plaza Pacoima | Cut-off Date LTV: | 60.8% | |
| Paxton Street | UW NCF DSCR: | 2.72x | ||
| Pacoima, CA 91331 | UW NOI Debt Yield: | 9.9% |
The following table presents recent leasing data related to junior anchor spaces at comparable retail properties with respect to the Plaza Pacoima Property:
| Comparable Lease Summary | ||||||||||
| Property Name/Address | Year Built/ Renovated | Size (SF) | Occ. % | Distance from Subject | Tenant Name | Lease Size (SF) | Lease Date | Lease Term (Yrs.) | Initial Rent/SF | Lease Type |
Plaza Pacoima Property 13510, 13520, 13530, and 13550 Paxton Street Pacoima, CA | 2010/N/A | 203,743(1) | 100.0%(1) | – | Best Buy(1) | 45,000(1) | ||||
Del Amo Crossing 21515 Hawthorne Blvd Torrance, CA | 2019/N/A | 44,671 | 100.0% | 34.8 miles | 24 Hour Fitness | 44,671 | April 2019 | 15.0 | $29.28 | Net |
LA Fitness 8400 Balboa Blvd Northridge, CA | 2018/N/A | 37,000 | 100.0% | 7.3 miles | LA Fitness | 37,000 | July 2018 | 15.0 | $29.00 | Net |
Gelson’s Plaza 22277 Mulholland Hwy Calabasas, CA | 1996/N/A | 63,789 | 98.5% | 18.0 miles | Gelson’s | 46,077 | June 2019 | 20.0 | $25.38 | Net |
The Ontario Marketplace 4195 Inland Empire Blvd Ontario, CA | 2008/N/A | 233,045 | 93.5% | 57.1 miles | Sam’s Furniture | 30,000 | Jan 2018 | 10.0 | $20.04 | Modified Gross |
La Canada Flintridge Town Center 895 to 985 Foothill Blvd La Canada Flintridge, CA | 2008/N/A | 116,950 | 98.6% | 15.5 miles | Target | 45,865 | Jan 2018 | 10.0 | $19.50 | Net |
The Plant 7888 Van Nuys Blvd Panorama City, CA | 1999/N/A | 451,788 | 98.5% | 5.1 miles | PetSmart | 11,636 | Jan 2016 | 10.0 | $26.00 | Net |
Source:Appraisal
| (1) | Information is based on the underwritten rent roll. |
Operating History and Underwritten Net Cash Flow.The following table presents certain information relating to the historical operating performance and Underwritten Net Cash Flow at Plaza Pacoima Property:
| Cash Flow Analysis | ||||||
| 2016 | 2017 | 2018 | TTM 8/31/2019 | UW(1) | UW $ per SF | |
| Base Rent | $2,916,259 | $2,912,026 | $2,912,611 | $2,911,864 | $3,104,903(1) | $15.24 |
| Total Recoveries | $260,570 | $267,217 | $312,227 | $351,188 | $322,225 | $1.58 |
| Other Income(2) | $8,650 | $8,400 | $7,200 | $7,200 | $41,700 | $0.20 |
| CRA/LA Acquisition Assistance(3) | $255,938 | $255,938 | $255,936 | $255,938 | $255,938 | $1.26 |
| Less Vacancy & Credit Loss | $0 | $0 | $0 | $0 | ($155,245)(4) | ($0.76) |
| Effective Gross Income | $3,441,416 | $3,443,581 | $3,487,975 | $3,526,190 | $3,569,520 | $17.52 |
| Real Estate Taxes | $239,930 | $241,680 | $273,541 | $283,338 | $266,538 | $1.31 |
| Insurance | $28,997 | $28,688 | $28,321 | $27,125 | $27,519 | $0.14 |
| Other Operating Expenses | $36,006 | $86,140 | $98,443 | $78,118(5) | $185,204(5) | $0.91 |
| Total Expenses | $304,934 | $356,508 | $400,305 | $388,581 | $479,261 | $2.35 |
| Net Operating Income | $3,136,483 | $3,087,073 | $3,087,669 | $3,137,609 | $3,090,259 | $15.17 |
| Capital Expenditures | $0 | $0 | $0 | $0 | $9,800 | $0.05 |
| TI/LC | $0 | $0 | $0 | $0 | $60,798 | $0.30 |
| Net Cash Flow | $3,136,483 | $3,087,073 | $3,087,669 | $3,137,609 | $3,019,662 | $14.82 |
| Occupancy % | 100.0% | 99.5% | 99.5% | 100.0% | 100.0%(4) | |
| NOI DSCR | 2.82x | 2.78x | 2.78x | 2.82x | 2.78x | |
| NCF DSCR | 2.82x | 2.78x | 2.78x | 2.82x | 2.72x | |
| NOI Debt Yield | 10.1% | 9.9% | 9.9% | 10.1% | 9.9% | |
| NCF Debt Yield | 10.1% | 9.9% | 9.9% | 10.1% | 9.7% | |
| (1) | UW Base Rent includes Costco’s contractual rent step occurring in April 2020 totaling $170,000. |
| (2) | Other Income includes income related to signage and an ATM lease. Other Income increased from TTM 8/31/2019 to UW based on a $34,500 annual ATM lease, which the seller historically recognized under Base Rent. |
| (3) | The Plaza Pacoima Property benefits from partial reimbursement payments from the Community Redevelopment Agency of the City of Los Angeles which are related to the Plaza Pacoima Property acquisition costs. See “Description of the Mortgage Pool–Real Estate and Other Tax Considerations” section in the Preliminary Prospectus. |
| (4) | The UW economic vacancy is 5.0%. The Plaza Pacoima Property was 100.0% leased as of October 11, 2019. |
| (5) | The increase in Other Operating Expenses from TTM 8/31/2019 to UW was due to an underwritten 3.0% management fee. Historical operating statements did not include a management fee. |
| This is not a research report and was not prepared by any Underwriter’s research department. Please see additional important information and qualifications at the end of this Term Sheet. |
T-131
| Retail – Anchored | Loan #14 | Cut-off Date Balance: | $31,200,000 | |
| 13510, 13520, 13530, and 13550 | Plaza Pacoima | Cut-off Date LTV: | 60.8% | |
| Paxton Street | UW NCF DSCR: | 2.72x | ||
| Pacoima, CA 91331 | UW NOI Debt Yield: | 9.9% |
Additional Secured Indebtedness (not including trade debts). The Plaza Pacoima Property is encumbered by a 20-year, fully amortizing loan (the “City Loan”) from the City of Los Angeles (the “City”), which had an original principal balance of $7,400,000, has an outstanding principal balance as of the Cut-off Date of $4,735,000, and has a maturity date of September 30, 2028. The City Loan requires semi-annual payments of interest (February and August of each year) and annual payments of principal (August of each year) based on a set repayment schedule. The total scheduled principal and interest payments for the City Loan in 2020 are approximately $559,269, and annual scheduled principal and interest payments gradually increase to a maximum of approximately $666,737 in 2028. Debt service is paid by applying 49% of the City’s portion of the sales/utility use/business taxes (“City Taxes”) otherwise paid regarding the Plaza Pacoima Property and the adjacent Lowe’s parcel (not part of the collateral). If the City Taxes do not cover the debt service payments of the City Loan, the Plaza Pacoima Property Borrower is required to make the necessary payments. The City of Los Angeles has entered into a subordination and standstill agreement with the Plaza Pacoima Mortgage Loan lender.
In connection with the City Loan, the Plaza Pacoima Borrower entered into a ground lease with the Costco Wholesale Corporation (“Costco Guarantor”) providing for the development of the Costco store and the lease of the site by the Costco Guarantor. In the event that the Costco store ceases operations at the Plaza Pacoima for a period over 6 months for any reason unrelated to the normal course of business, the Costco Guarantor will pay to the City an amount equal to 77% of the amount due under the City Loan. The purpose of the Costco Guaranty is to provide assurances to the City that there is an alternative source of payment for part of the City Loan in the event sales tax revenue is not generated from the Costco site.
The following table presents certain information relating to the City Loan:
| Subordinate Note Summary(1) | ||||||||
Subordinate Note Original Principal Balance | Subordinate Note Cut-off Date Balance | Subordinate Note Maturity Date | Total Debt UW NCF DSCR | Total Debt UW NOI Debt Yield | Total Debt Cutoff Date LTV | |||
| City Loan | $7,400,000 | $4,735,000 | September 30, 2018 | 1.75x | 8.6% | 70.0% | ||
| (1) | Payments of principal and interest on the City Loan are based on a set repayment schedule. The Total Debt UW NCF DSCR shown above is based on the average scheduled principal and interest payments over the remaining term of the City Loan. |
Right of First Offer. Costco has a right of first offer (“ROFO”) to purchase the Plaza Pacoima Property if the Plaza Pacoima Borrower markets the Plaza Pacoima Property for sale. The ROFO is not extinguished by foreclosure; however, the ROFO does not apply to foreclosure or deed-in-lieu thereof.
| This is not a research report and was not prepared by any Underwriter’s research department. Please see additional important information and qualifications at the end of this Term Sheet. |
T-132
(THIS PAGE INTENTIONALLY LEFT BLANK)
T-133
| Mortgage Loan No. 15 – El Mercado Shopping Center |
| Mortgage Loan Information | Property Information | ||||||
| Mortgage Loan Seller: | MSMCH | Single Asset/Portfolio: | Single Asset | ||||
| Credit Assessment (KBRA/Fitch/S&P): | NR/NR/NR | Location: | Union City, CA 94587 | ||||
| Original Balance: | $28,000,000 | General Property Type: | Retail | ||||
| Cut-off Date Balance: | $28,000,000 | Detailed Property Type: | Anchored | ||||
| % of Initial Pool Balance: | 2.2% | Title Vesting: | Fee | ||||
| Loan Purpose: | Refinance | Year Built/Renovated: | 1981/N/A | ||||
| Borrower Sponsor: | Albert J. Wang | Size: | 109,168 SF | ||||
| Guarantors: | Albert J. Wang | Cut-off Date Balance Per SF: | $256 | ||||
| Mortgage Rate: | 3.8250% | Maturity Date Balance Per SF: | $232 | ||||
| Note Date: | 11/1/2019 | Property Manager: | Alpha Investments & Property | ||||
| First Payment Date: | 12/1/2019 | Management Company | |||||
| Maturity Date: | 11/1/2029 | (borrower related) | |||||
| Original Term to Maturity: | 120 months | Underwriting and Financial Information | |||||
| Original Amortization Term: | 360 months | UW NOI: | $2,523,953 | ||||
| IO Period: | 60 months | UW NOI Debt Yield: | 9.0% | ||||
| Seasoning: | 1 month | UW NOI Debt Yield at Maturity: | 9.9% | ||||
| Prepayment Provisions: | LO (25); DEF (91); O (4) | UW NCF DSCR: | 1.50x (P&I) 2.18x (IO) | ||||
| Lockbox/Cash Mgmt Status: | Springing/Springing | Most Recent NOI: | $2,524,765 (8/31/2019 TTM) | ||||
| Additional Debt Type: | N/A | 2nd Most Recent NOI: | $2,395,660 (12/31/2018) | ||||
| Additional Debt Balance: | N/A | 3rd Most Recent NOI: | $2,261,291 (12/31/2017) | ||||
| Future Debt Permitted (Type): | No (N/A) | Most Recent Occupancy: | 100.0% (10/1/2019) | ||||
| Reserves | 2nd Most Recent Occupancy: | 100.0% (12/31/2018) | |||||
| Type | Initial | Monthly | Cap | 3rd Most Recent Occupancy: | 97.6% (12/31/2017) | ||
| RE Tax: | $167,891 | $41,973 | N/A | Appraised Value (as of): | $43,800,000 (9/6/2019) | ||
| Insurance(1): | $0 | Springing | N/A | Appraised Value per SF: | $401 | ||
| Capital Expenditure: | $0 | $2,729 | $65,501 | Cut-off Date LTV Ratio: | 63.9% | ||
| TI/LC: | $0 | $13,191 | $474,881 | Maturity Date LTV Ratio: | 57.9% | ||
| Sources and Uses | ||||||
| Sources | Proceeds | % of Total | Uses | Proceeds | % of Total | |
| Whole Loan Amount: | $28,000,000 | 100.0% | Loan Payoff: | $19,409,410 | 69.3% | |
| Return of Equity: | $7,696,202 | 27.5% | ||||
| Closing Costs: | $726,497 | 2.6% | ||||
| Reserves: | $167,891 | 0.6% | ||||
| Total Sources: | $28,000,000 | 100.0% | Total Uses: | $28,000,000 | 100.0% | |
| (1) | Monthly deposits for insurance are springing upon (i) an event of default occurring, (ii) the El Mercado Shopping Center Borrower (as defined below) failing to maintain an approved blanket policy or (iii) the El Mercado Shopping Center Borrower failing to provide evidence of renewal and paid receipts of insurance premiums. |
The Mortgage Loan.The fifteenth largest mortgage loan (the “El Mercado Shopping Center Mortgage Loan”) is evidenced by a promissory note in the original principal amount of $28,000,000 and secured by a first priority fee mortgage encumbering a 109,168 SF anchored retail shopping center located in Union City, California (the “El Mercado Shopping Center Property”). The proceeds of the El Mercado Shopping Center Mortgage Loan were primarily used to refinance existing debt, return equity to the El Mercado Shopping Center Borrower and fund reserves.
The Borrower and the Borrower Sponsor.The borrower for the El Mercado Shopping Center Mortgage Loan is El Mercado SPE, LLC (the “El Mercado Shopping Center Borrower”), a single-purpose Delaware limited liability company with an independent director. The non-recourse carevout guarantor and the sponsor is Albert J. Wang. Albert J. Wang is the managing director of the El Mercado Shopping Center Borrower and has a 6.0% ownership interest in the El Mercado Shopping Center Borrower. Albert J. Wang is the president of Altos Enterprises, Inc. Altos Enterprises, Inc. has developed over ten shopping centers and residential properties and currently manages over 550,000 SF of retail and commercial properties.
The Property.The El Mercado Shopping Center Property is an anchored retail shopping center, totaling 109,168 SF, on an approximately 10.99-acre site in Union City, California. The El Mercado Shopping Center Property was built in 1981. The El Mercado Shopping Center Property is anchored by Marina Grocery and includes two ground leased parcels totaling 1.10 acres which are leased to Wells Fargo and Burger King totaling 8,970 SF. As of October 1, 2019, the El Mercado Shopping Center Property was 100.0% leased to 27 tenants. The El Mercado Shopping Center Property contains 560 parking spaces (5.1 spaces per 1,000 square feet).
Major Tenants.
Marina Grocery (30,000 SF, 27.5% of NRA, 12.9% of underwritten rent). Marina Grocery has been a tenant at the El Mercado Shopping Center Property since 2001 and expanded and extended its lease term in October 2019, for an additional 5 years through 2031. Marina Grocery offers an in-store hot deli and Asian bakery as well as a large selection of Asian foods and groceries. Marina Grocery has a lease expiration of September 30, 2031 with two, five-year renewal options. Marina Grocery is an affiliate of the El Mercado Shopping Center Borrower.
| This is not a research report and was not prepared by any Underwriter’s research department. Please see additional important information and qualifications at the end of this Term Sheet. |
T-134
| Retail - Anchored | Loan #15 | Cut-off Date Balance: | $28,000,000 | |
| 34300-34396 Alvarado-Niles Road and | El Mercado Shopping Center | Cut-off Date LTV: | 63.9% | |
| 1601-1801 Decoto Road | U/W NCF DSCR: | 1.50x | ||
| Union City, CA 94587 | U/W NOI Debt Yield: | 9.0% |
Daiso Japan (17,700 SF, 16.2% of NRA, 10.0% of underwritten rent). Daiso Japan has been a tenant at the El Mercado Shopping Center Property since 2012, has a lease expiration of April 30, 2022 with one, five-year renewal option. Daiso Japan offers a wide variety of products including stationery, cosmetics, and home goods as well as Japanese culture items including origami paper, calligraphy tools, obento products, sensu fans, and other traditional Japanese items. Daiso Japan opened its first store in the United States in 2005 and now has over 60 stores across Washington, California, and Texas.
Mayflower Seafood (7,353 SF, 6.7% of NRA, 10.4% of underwritten rent). Mayflower Seafood became a tenant at the El Mercado Shopping Center Property in 2019, has a lease expiration of May 31, 2024 and has one, five-year renewal option. MayFlower Seafood is a locally owned restaurant that serves Cantonese food featuring a large selection of seafood.
O’Reily Auto Parts (6,748 SF, 6.2% of NRA, 5.2% of underwritten rent). O’Reily Auto Parts has been a tenant at the El Mercado Shopping Center Property since 1980 and has extended its lease three times since. O’Reily Auto Parts has a lease expiration of April 30, 2021 with two, five-year renewal options. O’Reily Auto Parts is a large specialty retailer of automotive aftermarket parts, tools, supplies, equipment and accessories in the United States, selling to both do-it-yourself and professional service provider customers. Founded in 1957 in Springfield, Missouri, O’Reily Auto Parts operated 5,219 stores in 47 states as of December 31, 2018.
Wells Fargo Bank (5,470 SF, 5.0% of NRA, 4.7% of underwritten rent). Wells Fargo Bank has been a tenant at the El Mercado Shopping Center Property since 1980 and has extended its lease three times since. Wells Fargo Bank has a lease expiration of April 30, 2025 with two, five-year renewal options. Founded in 1852 and headquartered in San Francisco, Wells Fargo provides banking, investment and mortgage products and services, as well as consumer and commercial finance, through 7,500 locations, more than 13,000 ATMs, the internet and mobile banking, and has offices in 32 countries and territories to support customers who conduct business in the global economy.
The following table presents a summary regarding the major tenants at the El Mercado Shopping Center Property:
| Tenant Summary(1) | ||||||||||||
| Tenant Name | Credit Rating (Fitch/ /Moody’s/S&P)(2) | Tenant SF | Approx.% of SF | Annual UW Rent | Annual UW Rent PSF(3) | Most Recent Sales | ||||||
| App. % of Total Annual UW Rent | $ | PSF | Occ. Cost % | Term. Option | Renewal Options | Lease Expiration | ||||||
| Marina Grocery(4) | NR/NR/NR | 30,000 | 27.5% | $432,000 | $14.40 | 12.9% | $16,846,137 | $562 | 2.6% | N | 2 x 5 year | 9/30/2031 |
| Daiso Japan | NR/NR/NR | 17,700 | 16.2% | $332,400 | $18.78 | 10.0% | NAV | NAV | NAV | N | 1 x 5 year | 4/30/2022 |
| Mayflower Seafood | NR/NR/NR | 7,353 | 6.7% | $346,080 | $47.07 | 10.4% | NAV | NAV | NAV | N | 1 x 5 year | 5/31/2024 |
| O’Reily Auto Parts | NR/Baa1/BBB | 6,748 | 6.2% | $173,340 | $25.69 | 5.2% | NAV | NAV | NAV | N | 2 x 5 year | 4/30/2021 |
| Wells Fargo Bank | A+/A2/A- | 5,470 | 5.0% | $156,191 | $28.55 | 4.7% | NAV | NAV | NAV | N | 2 x 5 year | 4/30/2025 |
| Subtotal/Wtd. Avg. | 67,271 | 61.6% | $1,440,011 | $21.41 | 43.1% | |||||||
| Other Tenants | 41,897 | 38.4% | $1,897,386 | $45.29 | 56.9% | |||||||
| Vacant Space | 0 | 0.0% | $0 | $0.00 | 0.0% | |||||||
| Total/Wtd. Avg. | 109,168 | 100.0% | $3,337,397 | $30.57 | 100.0% | |||||||
| (1) | Information is based on the underwritten rent roll as of October 1, 2019. |
| (2) | Certain ratings are those of the parent company whether or not the parent guarantees the lease. |
| (3) | Wtd. Avg. Annual UW Rent PSF excludes Vacant Space. |
| (4) | Marina Grocery is an affiliate of the El Mercado Shopping Center Borrower. |
| This is not a research report and was not prepared by any Underwriter’s research department. Please see additional important information and qualifications at the end of this Term Sheet. |
T-135
| Retail - Anchored | Loan #15 | Cut-off Date Balance: | $28,000,000 | |
| 34300-34396 Alvarado-Niles Road and | El Mercado Shopping Center | Cut-off Date LTV: | 63.9% | |
| 1601-1801 Decoto Road | U/W NCF DSCR: | 1.50x | ||
| Union City, CA 94587 | U/W NOI Debt Yield: | 9.0% |
The following table presents certain information relating to the lease rollover at the El Mercado Shopping Center Property:
| Lease Rollover Schedule(1)(2) | ||||||||
| Year | # of Leases Rolling | SF Rolling | Annual UW Rent PSF Rolling(3) | Approx. % of Total SF Rolling | Approx. Cumulative % of SF Rolling | Total UW Rent Rolling | Approx. % of Total Rent Rolling | Approx. Cumulative % of Total Rent Rolling |
| MTM | 1 | 720 | $46.87 | 0.7% | 0.7% | $33,744 | 1.0% | 1.0% |
| 2019 | 0 | 0 | $0.00 | 0.0% | 0.7% | $0 | 0.0% | 1.0% |
| 2020 | 3 | 4,785 | $49.09 | 4.4% | 5.0% | $234,919 | 7.0% | 8.1% |
| 2021 | 5 | 15,401 | $36.35 | 14.1% | 19.2% | $559,803 | 16.8% | 24.8% |
| 2022 | 7 | 31,000 | $29.70 | 28.4% | 47.5% | $920,695 | 27.6% | 52.4% |
| 2023 | 4 | 4,472 | $49.83 | 4.1% | 51.6% | $222,840 | 6.7% | 59.1% |
| 2024 | 4 | 11,553 | $49.09 | 10.6% | 62.2% | $567,164 | 17.0% | 76.1% |
| 2025 | 1 | 5,470 | $28.55 | 5.0% | 67.2% | $156,191 | 4.7% | 80.8% |
| 2026 | 0 | 0 | $0.00 | 0.0% | 67.2% | $0 | 0.0% | 80.8% |
| 2027 | 0 | 0 | $0.00 | 0.0% | 67.2% | $0 | 0.0% | 80.8% |
| 2028 | 1 | 2,267 | $41.70 | 2.1% | 69.3% | $94,542 | 2.8% | 83.6% |
| 2029 | 0 | 0 | $0.00 | 0.0% | 69.3% | $0 | 0.0% | 83.6% |
| 2030 & Beyond | 2 | 33,500 | $16.34 | 30.7% | 100.0% | $547,500 | 16.4% | 100.0% |
| Vacant | 0 | 0 | $0.00 | 0.0% | 100.0% | $0 | 0.0% | 100.0% |
| Total/Wtd. Avg. | 28 | 109,168 | $30.57 | 100.0% | $3,337,397 | 100.0% | ||
| (1) | Information is based on the underwritten rent roll as of October 1, 2019. |
| (2) | Certain tenants may have lease termination options that are exercisable prior to the stated expiration date of the subject lease or leases which are not considered in the lease rollover schedule. |
| (3) | Wtd. Avg. Annual UW Rent PSF Rolling excludes Vacant Space. |
The Market. The El Mercado Shopping Center Property is located in Union City, California within the East Bay - CA retail market and the Union City retail submarket. According to the appraisal, as of the first quarter of 2019, the East Bay - CA retail market had approximately 124.3 million SF of retail space inventory, overall vacancy in the market was approximately 3.5% and asking rent was $30.24 PSF. According to the appraisal, as of the first quarter of 2019, the Union City retail submarket had approximately 1.5 million SF of retail space inventory, overall vacancy in the submarket was approximately 7.2% and asking rent was $33.28 PSF. Primary access to the El Mercado Shopping Center Property is provided by Interstate 880 and State Highway 84. There are public bus transit stops in many locations in the neighborhood, with a stop near the El Mercado Shopping Center Property. Additionally, there is a BART rail station located approximately one-quarter of a mile east of the El Mercado Shopping Center Property. BART provides commuter rail service to downtown Oakland and San Francisco, in addition to northern San Mateo County, including the San Francisco International Airport.
According to the appraisal, the 2019 estimated population within a one-, three- and five-mile radius of El Mercado Shopping Center Property is 27,380, 168,763 and 352,524, respectively. The 2019 estimated median household income within a one-, three- and five-mile radius of the El Mercado Shopping Center Property is $110,126, $117,299 and $112,344, respectively.
The following table presents recent leasing data at comparable retail properties with respect to the El Mercado Shopping Center Property:
| Comparable Retail Property Summary (Anchor Tenants) | |||||||
Property Name/ City, State | Built | GLA | Tenant Name | Lease Area (SF) | Lease Date | Lease Term (Yrs) | Rent PSF |
El Mercado Shopping Center 34300-34396 Alvarado-Niles Road and 1601-1801 Decoto Road Union City , CA | 1981 | 109,168 | Marina Grocery | 30,000 | Oct. 2001 | 30.0 | $14.40 |
McCarthy Ranch Shopping Center 15-251 Ranch Drive Milpitas, CA | 1994 | 266,108 | Big Al’s Sportsman’s Warehouse Michael’s | 46,000 31,610 23,781 | Dec. 2018 Jul. 2018 Apr. 2018 | 15.0 10.0 10.0 | $18.00 $15.00 $16.50 |
Santa Clara Square Marketplace Shopping Center 2685 Augustine Drive Santa Clara, CA | 2016 | 117,435 | Whole Foods Market | 50,000 | Jul. 2016 | 20.0 | $22.50 |
Fallon Gateway I 580 & Fallon Road Dublin, CA | 2011 | 34,821 | Lucky Supermarket | 49,657 | Mar. 2018 | 20.0 | $23.00 |
Fairway Park Shopping Center 31117 Mission Boulevard Hayward, CA | 1954 | 126,876 | Grocery Outlet | 14,456 | Sep. 2018 | 10.0 | $11.00 |
Source: Appraisal and underwritten rent roll.
| This is not a research report and was not prepared by any Underwriter’s research department. Please see additional important information and qualifications at the end of this Term Sheet. |
T-136
| Retail - Anchored | Loan #15 | Cut-off Date Balance: | $28,000,000 | |
| 34300-34396 Alvarado-Niles Road and | El Mercado Shopping Center | Cut-off Date LTV: | 63.9% | |
| 1601-1801 Decoto Road | U/W NCF DSCR: | 1.50x | ||
| Union City, CA 94587 | U/W NOI Debt Yield: | 9.0% |
The following table presents certain information relating to the appraiser’s market rent conclusion for the El Mercado Shopping Center Property:
| Market Rent Summary | ||||
| Market Rent PSF | Lease Term (Years) | Rent Increase Projection | Lease Type | |
| Under 1,000 SF | $45.00 | 5 | CPI | NNN |
| 1,000 to 3,000 SF | $42.00 | 5 | CPI | NNN |
| Over 3,000 SF | $39.00 | 5 | CPI | NNN |
| Ground Leased | $30.00 | 10 | None | NNN |
| Junior Anchor | $16.20 | 10 | CPI | NNN |
| Anchor | $15.00 | 10 | CPI | NNN |
Source:Appraisal
Operating History and Underwritten Net Cash Flow. The following table presents certain information relating to the historical operating performance and the Underwritten Net Cash Flow at the El Mercado Shopping Center Property:
| Cash Flow Analysis | ||||||
| 2016 | 2017 | 2018 | 8/31/2019 TTM | UW | UW PSF | |
| Gross Potential Rent(1) | $3,014,342 | $2,918,122 | $3,054,174 | $3,154,134 | $3,337,397 | $30.57 |
| Total Recoveries | $628,325 | $594,451 | $686,521 | $748,250 | $764,465 | $7.00 |
| Less Vacancy & Credit Loss | $0 | $0 | $0 | $0 | ($166,870) | ($1.53) |
| Effective Gross Income | $3,642,667 | $3,512,573 | $3,740,694 | $3,902,384 | $3,934,992 | $36.05 |
| Real Estate Taxes | $494,375 | $513,824 | $533,618 | $536,650 | $562,278 | $5.15 |
| Insurance | $28,404 | $27,243 | $24,361 | $26,273 | $32,750 | $0.30 |
| Other Expenses | $710,973 | $710,214 | $787,055 | $814,696 | $816,011 | $7.47 |
| Total Expenses | $1,233,752 | $1,251,281 | $1,345,034 | $1,377,619 | $1,411,039 | $12.93 |
| Net Operating Income | $2,408,915 | $2,261,291 | $2,395,660 | $2,524,765 | $2,523,953 | $23.12 |
| Capital Expenditures | $0 | $0 | $0 | $0 | $32,750 | $0.30 |
| TI/LC | $0 | $0 | $0 | $0 | $128,818 | $1.18 |
| Net Cash Flow | $2,408,915 | $2,261,291 | $2,395,660 | $2,524,765 | $2,362,384 | $21.64 |
| Occupancy % | 100.0% | 97.6% | 100.0% | 100.0% | 95.0% | |
| NOI DSCR (IO) | 2.22x | 2.08x | 2.21x | 2.33x | 2.32x | |
| NOI DSCR (P&I) | 1.53x | 1.44x | 1.53x | 1.61x | 1.61x | |
| NCF DSCR (IO) | 2.22x | 2.08x | 2.21x | 2.33x | 2.18x | |
| NCF DSCR (P&I) | 1.53x | 1.44x | 1.53x | 1.61x | 1.50x | |
| NOI Debt Yield | 8.6% | 8.1% | 8.6% | 9.0% | 9.0% | |
| NCF Debt Yield | 8.6% | 8.1% | 8.6% | 9.0% | 8.4% | |
| (1) | UW Gross Potential Rent is based on the underwritten rent roll dated October 1, 2019 and includes rent steps through December 2020 totaling $72,393. |
| This is not a research report and was not prepared by any Underwriter’s research department. Please see additional important information and qualifications at the end of this Term Sheet. |
T-137
| BANK 2019-BNK23 |
This material was prepared by sales, trading, banking or other non-research personnel of one of the following: Morgan Stanley & Co. LLC, Morgan Stanley & Co. International Limited, Morgan Stanley Japan Limited and/or Morgan Stanley Dean Witter Asia Limited (together with their affiliates, hereinafter “Morgan Stanley”), Wells Fargo Securities, LLC (together with its affiliates, “Wells Fargo”), BofA Securities, Inc. (together with its affiliates, “BofA Securities”), Academy Securities, Inc. (together with its affiliates, “Academy”) and Drexel Hamilton, LLC (together with its affiliates, “Drexel”, and collectively with Morgan Stanley, Wells Fargo, BofA Securities and Academy, the “Underwriters”). This material was not produced by an Underwriter’s research analyst, although it may refer to an Underwriter’s research analyst or research report. Unless otherwise indicated, these views (if any) are the author’s and may differ from those of the fixed income or equity research departments of the Underwriters or others in those firms.
This material may have been prepared by or in conjunction with the respective trading desks of the Underwriters that may deal as principal in or own or act as market maker or liquidity provider for the securities/instruments (or related derivatives) mentioned herein. The trading desk may have accumulated a position in the subject securities/instruments based on the information contained herein. Trading desk materials are not independent of the proprietary interests of the Underwriters, which may conflict with your interests. Each of the Underwriters may also perform or seek to perform investment banking services for the issuers of the securities and instruments mentioned herein.
The information contained in this material is subject to change, completion or amendment from time to time, and the information in this material supersedes information in any other communication relating to the securities referred to in this material. This material is not a solicitation to participate in any trading strategy, and is not an offer to sell any security or instrument or a solicitation of an offer to buy or sell any security or instrument in any jurisdiction where an offer, solicitation or sale is not permitted. Unless otherwise set forth in this material, any securities referred to in this material may not have been registered under the U.S. Securities Act of 1933, as amended, and, if not, may not be offered or sold absent an exemption therefrom. Recipients are required to comply with any legal or contractual restrictions on their purchase, holding, sale, exercise of rights or performance of obligations under any securities/instruments transaction.
The securities/instruments discussed in this material may not be suitable for all investors. This material has been prepared and issued by the Underwriters for intended distribution to market professionals and institutional investor clients. Other recipients should seek independent investment advice prior to making any investment decision based on this material. This material does not provide individually tailored investment advice or offer tax, regulatory, accounting or legal advice. Prior to entering into any proposed transaction, recipients should determine, in consultation with their own investment, legal, tax, regulatory and accounting advisors, the economic risks and merits, as well as the legal, tax, regulatory and accounting characteristics and consequences, of the transaction. You should consider this material as only a single factor in making an investment decision.
The value of and income from investments may vary because of changes in interest rates, foreign exchange rates, default rates, prepayment rates, securities/instruments prices, market indexes, operational or financial conditions of companies or other factors. There may be time limitations on the exercise of options or other rights in securities/instruments transactions. Past performance is not necessarily a guide to future performance. Estimates of future performance are based on assumptions that may not be realized. Actual events may differ from those assumed and changes to any assumptions may have a material impact on any projections or estimates. Other events not taken into account may occur and may significantly affect the projections or estimates. Certain assumptions may have been made for modeling purposes only to simplify the presentation and/or calculation of any projections or estimates, and the Underwriters do not represent that any such assumptions will reflect actual future events. Accordingly, there can be no assurance that estimated returns or projections will be realized or that actual returns or performance results will not materially differ from those estimated herein. Some of the information contained in this document may be aggregated data of transactions in securities or other financial instruments executed by an Underwriter that has been compiled so as not to identify the underlying transactions of any particular customer.
Notwithstanding anything herein to the contrary, the Underwriters and each recipient hereof (and their employees, representatives, and other agents) may disclose to any and all persons, without limitation of any kind from the commencement of discussions, the U.S. federal and state income tax treatment and tax structure of the transaction and all materials of any kind (including opinions or other tax analyses) that are provided to it relating to the tax treatment and tax structure (as such terms are defined in Treasury Regulation 1.6011-4). For this purpose, “tax structure” is limited to facts relevant to the U.S. federal and state income tax treatment of the transaction and does not include information relating to the identity of the parties, their affiliates, agents or advisors. This authorization of tax disclosure is retroactively effective to the commencement of discussions with prospective investors regarding the transactions contemplated herein.
THE DISTRIBUTION OF THIS MATERIAL (A) IF MADE BY A PERSON WHO IS NOT AN AUTHORIZED PERSON UNDER THE FINANCIAL SERVICES AND MARKETS ACT 2000 (“FSMA”), IS BEING MADE ONLY TO, OR DIRECTED ONLY AT, PERSONS WHO (I) ARE OUTSIDE THE UNITED KINGDOM, (II) HAVE PROFESSIONAL EXPERIENCE IN MATTERS RELATING TO INVESTMENTS AND QUALIFY AS INVESTMENT PROFESSIONALS IN ACCORDANCE WITH ARTICLE 19(5) OF THE FINANCIAL SERVICES AND MARKETS ACT 2000 (FINANCIAL PROMOTION) ORDER 2005 (AS AMENDED, THE “FINANCIAL PROMOTION ORDER”), (III) ARE PERSONS FALLING WITHIN ARTICLE 49(2)(A) THROUGH (D) (“HIGH NET WORTH COMPANIES, UNINCORPORATED ASSOCIATIONS, ETC.”) OF THE FINANCIAL PROMOTION ORDER OR (IV) ARE PERSONS TO WHICH THIS MATERIAL MAY OTHERWISE LAWFULLY BE COMMUNICATED OR DIRECTED; AND (B) IF MADE BY A PERSON WHO IS AN AUTHORIZED PERSON UNDER THE FSMA, IS BEING MADE ONLY TO, OR DIRECTED ONLY AT, PERSONS WHO (I) ARE OUTSIDE THE UNITED KINGDOM, (II) HAVE PROFESSIONAL EXPERIENCE OF PARTICIPATING IN UNREGULATED SCHEMES (AS DEFINED FOR PURPOSES OF THE FINANCIAL SERVICES AND MARKETS ACT 2000 (PROMOTION OF COLLECTIVE INVESTMENT SCHEMES) (EXEMPTIONS) ORDER 2001 (AS AMENDED, THE “PROMOTION OF COLLECTIVE INVESTMENT SCHEMES EXEMPTIONS ORDER”)) AND QUALIFY AS INVESTMENT PROFESSIONALS IN ACCORDANCE WITH ARTICLE 14(5) OF THE PROMOTION OF COLLECTIVE INVESTMENT SCHEMES EXEMPTIONS ORDER, (III) ARE PERSONS FALLING WITHIN ARTICLE 22(2)(A) THROUGH (D) (“HIGH NET WORTH COMPANIES,UNINCORPORATED ASSOCIATIONS, ETC.”) OF THE PROMOTION OF COLLECTIVE INVESTMENT SCHEMES EXEMPTIONS ORDER, OR (IV) ARE PERSONS TO WHOM THE ISSUING ENTITY MAY LAWFULLY BE PROMOTED IN ACCORDANCE WITH SECTION 4.12 OF THE UK FINANCIAL CONDUCT AUTHORITY’S CONDUCT OF BUSINESS SOURCEBOOK.
THE OFFERED CERTIFICATES HAVE NOT BEEN AND WILL NOT BE REGISTERED UNDER THE FINANCIAL INSTRUMENTS AND EXCHANGE LAW OF JAPAN, AS AMENDED (THE “FIEL”), AND DISCLOSURE UNDER THE FIEL HAS NOT BEEN AND WILL NOT BE MADE WITH RESPECT TO THE OFFERED CERTIFICATES. ACCORDINGLY, EACH OF MORGAN STANLEY & CO. LLC, WELLS FARGO SECURITIES, LLC, BOFA SECURITIES, INC., ACADEMY SECURITIES, INC. AND DREXEL HAMILTON, LLC HAS REPRESENTED AND AGREED THAT IT HAS NOT, DIRECTLY OR INDIRECTLY, OFFERED OR SOLD AND WILL NOT, DIRECTLY OR INDIRECTLY, OFFER OR SELL ANY OFFERED CERTIFICATES IN JAPAN OR TO, OR FOR THE BENEFIT OF, ANY RESIDENT OF JAPAN (WHICH TERM AS USED IN THIS MATERIAL MEANS ANY PERSON RESIDENT IN JAPAN, INCLUDING ANY CORPORATION OR OTHER ENTITY ORGANIZED UNDER THE LAWS OF JAPAN) OR TO OTHERS FOR REOFFERING OR RE SALE, DIRECTLY OR INDIRECTLY, IN JAPAN OR TO, OR FOR THE BENEFIT OF, ANY RESIDENT OF JAPAN EXCEPT PURSUANT TO AN EXEMPTION FROM THE REGISTRATION REQUIREMENTS OF, AND OTHERWISE IN COMPLIANCE WITH, THE FIEL AND OTHER RELEVANT LAWS, REGULATIONS AND MINISTERIAL GUIDELINES OF JAPAN. AS PART OF THIS OFFERING OF THE OFFERED CERTIFICATES, THE UNDERWRITERS MAY OFFER THE OFFERED CERTIFICATES IN JAPAN TO UP TO 49 OFFEREES IN ACCORDANCE WITH THE ABOVE PROVISIONS.
© 2019 Morgan Stanley