| FREE WRITING PROSPECTUS | ||
| FILED PURSUANT TO RULE 433 | ||
| REGISTRATION FILE NO.: 333-227446-10 | ||
 |  |  |
BANK 2020-BNK26
Free Writing Prospectus
Structural and Collateral Term Sheet
$1,200,097,104
(Approximate Total Mortgage Pool Balance)
$1,024,657,000
(Approximate Offered Certificates)
Morgan Stanley Capital I Inc.
as Depositor
Morgan Stanley Mortgage Capital Holdings LLC
Bank of America, National Association
Wells Fargo Bank, National Association
National Cooperative Bank, N.A.
as Sponsors and Mortgage Loan Sellers
Commercial Mortgage Pass-Through Certificates
Series 2020-BNK26
February 26, 2020
| MORGAN STANLEY | WELLS FARGO SECURITIES | BofA SECURITIES |
| Co-Lead Bookrunner Manager | Co-Lead Bookrunner Manager | Co-Lead Bookrunner Manager |
| Academy Securities, Inc. | Drexel Hamilton | |
| Co-Manager | Co-Manager |
STATEMENT REGARDING THIS FREE WRITING PROSPECTUS
The depositor has filed a registration statement (including a prospectus) with the SEC (File No. 333-227446) for the offering to which this communication relates. Before you invest, you should read the prospectus in that registration statement and other documents the depositor has filed with the SEC for more complete information about the depositor, the issuing entity and this offering. You may get these documents for free by visiting EDGAR on the SEC web site atwww.sec.gov. Alternatively, the depositor or any underwriter or any dealer participating in the offering will arrange to send you the prospectus if you request it by calling toll free 1-866-718-1649 or by email toprospectus@ms.com.
| This is not a research report and was not prepared by any Underwriter’s research department. Please see additional important information and qualifications at the end of this Term Sheet. |
BANK 2020-BNK26
Neither this Term Sheet nor anything contained herein shall form the basis for any contract or commitment whatsoever.The information contained herein is preliminary as of the date hereof.This Term Sheet is subject to change, completion or amendment from time to time.The information contained herein supersedes information in any other communication relating to the securities described herein; provided, that the information contained herein will be superseded by similar information delivered to you as part of the Preliminary Prospectus.The information contained herein should be reviewed only in conjunction with the entire Preliminary Prospectus.All of the information contained herein is subject to the same limitations and qualifications contained in the Preliminary Prospectus.The information contained herein does not contain all relevant information relating to the underlying mortgage loans or mortgaged properties.Such information is described in the Preliminary Prospectus.The information contained herein will be more fully described in the Preliminary Prospectus.The information contained herein should not be viewed as projections, forecasts, predictions or opinions with respect to value.Prior to making any investment decision, prospective investors are strongly urged to read the Preliminary Prospectus in its entirety.Neither the Securities and Exchange Commission nor any state securities commission has approved or disapproved of these securities or determined if this Term Sheet is truthful or complete.Any representation to the contrary is a criminal offense.
IMPORTANT NOTICE RELATING TO AUTOMATICALLY GENERATED EMAIL DISCLAIMERS
Any legends, disclaimers or other notices that may appear at the bottom of, or attached to, the email communication to which this Term Sheet may have been attached are not applicable to this Term Sheet and should be disregarded. Such legends, disclaimers or other notices have been automatically generated as a result of this Term Sheet having been sent via Bloomberg or another email system.
IMPORTANT NOTICE REGARDING THE CONDITIONS FOR THIS OFFERING OF ASSET-BACKED SECURITIES
THE ASSET-BACKED SECURITIES REFERRED TO IN THIS TERM SHEET ARE BEING OFFERED WHEN, AS AND IF ISSUED. IN PARTICULAR, YOU ARE ADVISED THAT THE ASSET-BACKED SECURITIES, AND THE ASSET POOL BACKING THEM, ARE SUBJECT TO MODIFICATION OR REVISION (INCLUDING, AMONG OTHER THINGS, THE POSSIBILITY THAT ONE OR MORE CLASSES OF SECURITIES MAY BE SPLIT, COMBINED OR ELIMINATED), AT ANY TIME PRIOR TO ISSUANCE OR AVAILABILITY OF A FINAL PROSPECTUS. AS A RESULT, YOU MAY COMMIT TO PURCHASE SECURITIES THAT HAVE CHARACTERISTICS THAT MAY CHANGE, AND YOU ARE ADVISED THAT ALL OR A PORTION OF THE SECURITIES MAY NOT BE ISSUED THAT HAVE THE CHARACTERISTICS DESCRIBED IN THIS TERM SHEET. OUR OBLIGATION TO SELL SECURITIES TO YOU IS CONDITIONED ON THE SECURITIES AND THE UNDERLYING TRANSACTION HAVING THE CHARACTERISTICS DESCRIBED IN THIS TERM SHEET. IF WE DETERMINE THAT THE FOREGOING CONDITION IS NOT SATISFIED IN ANY MATERIAL RESPECT, WE WILL NOTIFY YOU, AND NEITHER THE ISSUING ENTITY NOR ANY UNDERWRITER WILL HAVE ANY OBLIGATION TO YOU TO DELIVER ALL OR ANY PORTION OF THE SECURITIES WHICH YOU HAVE COMMITTED TO PURCHASE, AND THERE WILL BE NO LIABILITY BETWEEN US AS A CONSEQUENCE OF THE NON-DELIVERY.
| This is not a research report and was not prepared by any Underwriter’s research department. Please see additional important information and qualifications at the end of this Term Sheet. |
T-2
| BANK 2020-BNK26 | Structural Overview |
Offered Certificates
| Class | Expected Ratings (Fitch/S&P/DBRS Morningstar)(1) | Approximate Initial Certificate Balance or Notional Amount(2) | Approximate Initial Credit Support(3) | Pass-Through Rate Description | Expected Weighted Average Life (Years)(4) | Expected Principal Window (Months)(4) | Certificate Principal UW NOI Debt Yield(5) | Certificate Principal to Value Ratio(6) |
| Class A-1 | AAAsf/AAA(sf)/AAA(sf) | $27,400,000 | 30.000% | (7) | 2.82 | 1-60 | 18.4% | 38.6% |
| Class A-2 | AAAsf/AAA(sf)/AAA(sf) | $95,000,000 | 30.000% | (7) | 6.86 | 82-83 | 18.4% | 38.6% |
| Class A-SB | AAAsf/AAA(sf)/AAA(sf) | $38,600,000 | 30.000% | (7) | 7.45 | 60-116 | 18.4% | 38.6% |
| Class A-3(8) | AAAsf/AAA(sf)/AAA(sf) | (8)(9) | 30.000% | (7)(8) | (9) | (9) | 18.4% | 38.6% |
| Class A-4(8) | AAAsf/AAA(sf)/AAA(sf) | (8)(9) | 30.000% | (7)(8) | (9) | (9) | 18.4% | 38.6% |
| Class X-A | AAAsf/AAA(sf)/AAA(sf) | $798,064,000(10) | N/A | Variable IO(11) | N/A | N/A | N/A | N/A |
| Class X-B | A-sf/A-(sf)/A(high)(sf) | $226,593,000(10) | N/A | Variable IO(11) | N/A | N/A | N/A | N/A |
| Class A-S(8) | AAAsf/AAA(sf)/AAA(sf) | $131,111,000(8) | 18.500% | (7)(8) | 9.93 | 119-120 | 15.8% | 45.0% |
| Class B | AA-sf/AA(sf)/AA(high)(sf) | $49,879,000 | 14.125% | (7) | 10.01 | 120-120 | 15.0% | 47.4% |
| Class C | A-sf/A-(sf)/A(sf) | $45,603,000 | 10.125% | (7) | 10.01 | 120-120 | 14.4% | 49.6% |
Privately Offered Certificates(12)
| Class | Expected Ratings (Fitch/S&P/DBRS Morningstar)(1) | Approximate Initial Certificate Balance or Notional Amount(2) | Approximate Initial Credit Support(3) | Pass-Through Rate Description | Expected Weighted Average Life (Years)(4) | Expected Principal Window (Months)(4) | Certificate Principal UW NOI Debt Yield(5) | Certificate Principal to Value Ratio(6) |
| Class X-D | BBB-sf/NR/BBB(high)(sf) | $48,454,000(10) | N/A | Variable IO(11) | N/A | N/A | N/A | N/A |
| Class X-F | BB-sf/NR/BBB(low)(sf) | $19,952,000(10) | N/A | Variable IO(11) | N/A | N/A | N/A | N/A |
| Class X-G | B-sf/NR/BB(low)(sf) | $11,401,000(10) | N/A | Variable IO(11) | N/A | N/A | N/A | N/A |
| Class X-H | NR/NR/NR | $35,628,248(10) | N/A | Variable IO(11) | N/A | N/A | N/A | N/A |
| Class D | BBBsf/NR/BBB(high)(sf) | $27,078,000 | 7.750% | (7) | 10.01 | 120-120 | 14.0% | 50.9% |
| Class E | BBB-sf/NR/BBB(sf) | $21,376,000 | 5.875% | (7) | 10.01 | 120-120 | 13.7% | 52.0% |
| Class F | BB-sf/NR/BB(high)(sf) | $19,952,000 | 4.125% | (7) | 10.01 | 120-120 | 13.5% | 52.9% |
| Class G | B-sf/NR/B(high)(sf) | $11,401,000 | 3.125% | (7) | 10.01 | 120-120 | 13.3% | 53.5% |
| Class H | NR/NR/NR | $35,628,248 | 0.000% | (7) | 10.01 | 120-120 | 12.9% | 55.2% |
Non-Offered Eligible Vertical Interest(12)
| Class | Expected Ratings (Fitch/S&P/DBRS Morningstar)(1) | Approximate Initial Certificate Balance or Notional Amount(2) | Approximate Initial Credit Support(3) | Pass-Through Rate Description | Expected Weighted Average Life (Years)(4) | Expected Principal Window (Months)(4) | Certificate Principal UW NOI Debt Yield | Certificate Principal to Value Ratio |
| RR Interest | NR/NR/NR | $60,004,855.18 | N/A | (13) | 9.38 | 1-120 | N/A | N/A |
| (1) | Ratings shown are those of Fitch Ratings, Inc. (“Fitch”), S&P Global Ratings, acting through Standard & Poor’s Financial Services LLC (“S&P”), and DBRS, Inc. (“DBRS Morningstar”). Certain nationally recognized statistical rating organizations that were not hired by the depositor may use information they receive pursuant to Rule 17g-5 under the Securities Exchange Act of 1934, as amended, or otherwise to rate the certificates. There can be no assurance as to what ratings a non-hired nationally recognized statistical rating organization would assign. See “Risk Factors—Other Risks Relating to the Certificates—Nationally Recognized Statistical Rating Organizations May Assign Different Ratings to the Certificates; Ratings of the Certificates Reflect Only the Views of the Applicable Rating Agencies as of the Dates Such Ratings Were Issued; Ratings May Affect ERISA Eligibility; Ratings May Be Downgraded” and “Ratings” in the Preliminary Prospectus to be dated on or about the date hereof (the “Preliminary Prospectus”). Capitalized terms used but not defined herein have the meanings assigned to such terms in the Preliminary Prospectus. |
| (2) | Approximate, subject to a permitted variance of plus or minus 5% and further subject to the discussion in footnote (9) below. In addition, the notional amounts of the Class X-A, Class X-B, Class X-D, Class X-F, Class X-G and Class X-H certificates may vary depending upon the final pricing of the classes of principal balance certificates or trust components whose certificate or principal balances comprise such notional amounts, and, if as a result of such pricing the pass-through rate of any class of the Class X-A, Class X-B, Class X-D, Class X-F, Class X-G or Class X-H certificates, as applicable, would be equal to zero at all times, such class of certificates will not be issued on the closing date of this securitization. |
| (3) | The approximate initial credit support percentages set forth for the certificates are approximate and, for the Class A-1, Class A-2, Class A-SB, Class A-3 and Class A-4 certificates, are presented in the aggregate, taking into account the principal balances of the Class A-3 and Class A-4 trust components. The approximate initial credit support percentage set forth for the Class A-S certificates represents the approximate credit support for the underlying Class A-S trust component. The RR Interest provides credit support only to the limited extent that it is allocated a portion of any losses incurred on the underlying mortgage loans, which such losses are allocated between it, on the one hand, and to the Non-Retained Certificates, on the other hand,pro rata in accordance with their respective Percentage Allocation Entitlements (as defined below). See “Credit Risk Retention” in the Preliminary Prospectus. |
| This is not a research report and was not prepared by any Underwriter’s research department. Please see additional important information and qualifications at the end of this Term Sheet. |
T-3
| BANK 2020-BNK26 | Structural Overview |
| (4) | The Expected Weighted Average Life and Expected Principal Window during which distributions of principal would be received as set forth in the foregoing table with respect to each class of certificates having a certificate balance are based on the assumptions set forth under “Yield and Maturity Considerations—Weighted Average Life” in the Preliminary Prospectus and on the assumptions that there are no prepayments, modifications or losses in respect of the mortgage loans and that there are no extensions or forbearances of maturity dates or anticipated repayment dates of the mortgage loans. |
| (5) | Certificate Principal UW NOI Debt Yield for any class of principal balance certificates shown in the table above (other than the RR Interest) is calculated as the product of (a) the weighted average UW NOI Debt Yield for the mortgage pool, multiplied by (b) a fraction, the numerator of which is the aggregate initial certificate or principal balance of all the principal balance certificates, and the denominator of which is the sum of (x) the aggregate initial certificate or principal balance of the subject class of principal balance certificates (or, with respect to the Class A-3, Class A-4 or Class A-S certificates, the trust component with the same alphanumeric designation) and all other classes of principal balance certificates (other than the RR Interest), if any, that are senior to such class and (y) the outstanding certificate balance of the RR Interest, multiplied by the applicable RR Interest Computation Percentage. The Certificate Principal UW NOI Debt Yields of the Class A-1, Class A-2, Class A-SB, Class A-3 and Class A-4 certificates are calculated in the aggregate for those classes as if they were a single class. With respect to any class of principal balance certificates, the “RR Interest Computation Percentage” is equal to a fraction, expressed as a percentage, the numerator of which is the total initial certificate or principal balance of the subject class of principal balance certificates (or, with respect to the Class A-3, Class A-4 or Class A-S certificates, the trust component with the same alphanumeric designation) and all other classes of principal balance certificates (other than the RR Interest), if any, that are senior to such class, and the denominator of which is the sum of the aggregate initial certificate or principal balance of all the principal balance certificates (other than the RR Interest). |
| (6) | Certificate Principal to Value Ratio for any class of principal balance certificates shown in the table above (other than the RR Interest) is calculated as the product of (a) the weighted average Cut-off Date LTV Ratio of the mortgage pool, multiplied by (b) a fraction, the numerator of which is the sum of (x) the aggregate initial certificate or principal balance of the subject class of principal balance certificates (or, with respect to the Class A-3, Class A-4 or Class A-S certificates, the trust component with the same alphanumeric designation) and all other classes of principal balance certificates (other than the RR Interest), if any, that are senior to such class and (y) the outstanding certificate balance of the RR Interest, multiplied by the applicable RR Interest Computation Percentage, and the denominator of which is aggregate initial certificate or principal balance of all the principal balance certificates. The Certificate Principal to Value Ratios of the Class A-1, Class A-2, Class A-SB, Class A-3 and Class A-4 certificates are calculated in the aggregate for those classes as if they were a single class. |
| (7) | The pass-through rate for each class of the Class A-1, Class A-2, Class A-SB, Class A-3, Class A-4, Class A-S, Class B, Class C, Class D, Class E, Class F, Class G and Class H certificates will be one of the following: (i) a fixed rateper annum, (ii) a variable rateper annum equal to the weighted average of the net mortgage interest rates on the mortgage loans for the related distribution date, (iii) a variable rateper annum equal to the lesser of (a) a fixed rate and (b) the weighted average of the net mortgage interest rates on the mortgage loans for the related distribution date or (iv) a variable rateper annum equal to the weighted average of the net mortgage interest rates on the mortgage loans for the related distribution date minus a specified percentage. For purposes of the calculation of the weighted average of the net mortgage interest rates on the mortgage loans for each distribution date, the net mortgage interest rates will be adjusted as necessary to a 30/360 basis. |
| (8) | The Class A-3-1, Class A-3-2, Class A-3-X1, Class A-3-X2, Class A-4-1, Class A-4-2, Class A-4-X1, Class A-4-X2, Class A-S-1, Class A-S-2, Class A-S-X1 and Class A-S-X2 certificates are also offered certificates. Such classes of certificates, together with the Class A-3, Class A-4 and Class A-S certificates, constitute the “Exchangeable Certificates”. The Class A-1, Class A-2, Class A-SB, Class B, Class C, Class D, Class E, Class F, Class G and Class H certificates, together with the RR Interest and the Exchangeable Certificates with a certificate balance, are referred to as the “principal balance certificates.” Each class of Exchangeable Certificates will have the certificate balance or notional amount and pass-through rate described below under “Exchangeable Certificates.” |
| (9) | The exact initial principal balances or notional amounts of the Class A-3, Class A-3-X1, Class A-3-X2, Class A-4, Class A-4-X1 and Class A-4-X2 trust components (and consequently, the exact aggregate initial certificate balances or notional amounts of the Exchangeable Certificates with an “A-3” or “A-4” designation) are unknown and will be determined based on the final pricing of the certificates. However, the initial principal balances, weighted average lives and principal windows of the Class A-3 and Class A-4 trust components are expected to be within the applicable ranges reflected in the following chart. The aggregate initial principal balance of the Class A-3 and Class A-4 trust components is expected to be approximately $637,064,000, subject to a variance of plus or minus 5%. The Class A-3-X1 and Class A-3-X2 trust components will have initial notional amounts equal to the initial principal balance of the Class A-3 trust component. The Class A-4-X1 and Class A-4-X2 trust components will have initial notional amounts equal to the initial principal balance of the Class A-4 trust component. |
| Trust Components | Expected Range of Initial Principal Balance | Expected Range of Weighted Average Life (Years) | Expected Range of Principal Window (Months) |
| Class A-3 | $150,000,000 - $295,000,000 | 9.76 - 9.78 | 116 - 117 / 116 - 118 |
| Class A-4 | $342,064,000 - $487,064,000 | 9.86 - 9.88 | 117 - 119 / 118 - 119 |
| (10) | The Class X-A, Class X-B, Class X-D, Class X-F, Class X-G and Class X-H certificates (collectively referred to as the “Class X certificates”) are notional amount certificates and will not be entitled to distributions of principal. The notional amount of the Class X-A certificates will be equal to the aggregate certificate or principal balance of the Class A-1, Class A-2 and Class A-SB certificates and the Class A-3 and Class A-4 trust components. The notional amount of the Class X-B certificates will be equal to the aggregate certificate or principal balance of the Class A-S trust component and the Class B and Class C certificates. The notional amount of the Class X-D certificates will be equal to the aggregate certificate balance of the Class D and Class E certificates. The notional amount of each class of the Class X-F, Class X-G and Class X-H certificates will be equal to the certificate balance of the class of principal balance certificates that, with the addition of “X-,” has the same alphabetical designation as the subject class of Class X certificates. |
| (11) | The pass-through rate for the Class X-A certificates for any distribution date will be aper annum rate equal to the excess, if any, of (a) the weighted average of the net mortgage interest rates on the mortgage loans for the related distribution date, over (b) the weighted average of the pass-through rates on the Class A-1, Class A-2 and Class A-SB certificates and the Class A-3, Class A-3-X1, Class A-3-X2, Class A-4, Class A-4-X1 and Class A-4-X2 trust components for the related distribution date, weighted on the basis of their respective certificate or principal balances or notional amounts outstanding immediately prior to that distribution date (but excluding trust components with a notional amount in the denominator of such weighted average calculation). The pass-through rate for the Class X-B certificates for any distribution date will be aper annum rate equal to the excess, if any, of (a) the weighted average of the net mortgage interest rates on the mortgage loans for the related distribution date, over (b) the weighted average of the pass-through rates on the Class A-S, Class A-S-X1 and Class A-S-X2 trust components and Class B and Class C certificates for the related distribution date, weighted on the basis of their respective certificate or principal balances or notional amounts outstanding immediately prior to that distribution date (but excluding trust components with a notional amount in the denominator of such weighted average calculation). The pass-through rate for the Class X-D certificates for any distribution date will be aper annum rate equal to the excess, if any, of (a) the weighted average of the net mortgage interest rates on the mortgage loans for the related distribution date, over (b) the weighted average of the pass-through rates on the Class D and Class E certificates for the related distribution date, weighted on the basis of their respective certificate balances outstanding immediately prior to that distribution date. The pass-through rate for each class of the Class X-F, Class X-G and Class X-H certificates for any distribution date will be a per annum rate equal to the excess, if any, of (a) the weighted average of the net mortgage interest rates on the mortgage loans for the related distribution date, over (b) the pass-through rate for the related distribution date on the class of |
| This is not a research report and was not prepared by any Underwriter’s research department. Please see additional important information and qualifications at the end of this Term Sheet. |
T-4
| BANK 2020-BNK26 | Structural Overview |
principal balance certificates that, with the addition of “X-,” has the same alphabetical designation as the subject class of Class X certificates. For purposes of the calculation of the weighted average of the net mortgage interest rates on the mortgage loans for each distribution date, the net mortgage interest rates will be adjusted as necessary to a 30/360 basis.
| (12) | Not offered pursuant to the Preliminary Prospectus or this Term Sheet. Information provided in this Term Sheet regarding the characteristics of these certificates is provided only to enhance your understanding of the offered certificates. The privately offered certificates also include the Class V and Class R certificates, which do not have a certificate balance, notional amount, credit support, pass-through rate, rating, assumed final distribution date or rated final distribution date, and which are not shown in the chart. The Class V certificates represent a beneficial ownership interest held through the grantor trust in a specified percentage of certain excess interest in respect of mortgage loans having anticipated repayment dates, if any. The Class R certificates represent the beneficial ownership of the residual interest in each of the real estate mortgage investment conduits, as further described in the Preliminary Prospectus. |
| (13) | Although it does not have a specified pass-through rate (other than for tax reporting purposes), the effective pass-through rate for the RR Interest will be a variable rateper annumequal to the weighted average of the net mortgage interest rates on the mortgage loans for the related distribution date (in each case adjusted, if necessary, to accrue on the basis of a 360-day year consisting of twelve 30-day months). |
| This is not a research report and was not prepared by any Underwriter’s research department. Please see additional important information and qualifications at the end of this Term Sheet. |
T-5
BANK 2020-BNK26 | Structural Overview |
Issue Characteristics
Offered Certificates: | $1,024,657,000 (approximate) monthly pay, multi-class, commercial mortgage pass-through certificates, consisting of 14 principal balance classes (Class A-1, Class A-2, Class A-SB, Class A-3, Class A-3-1, Class A-3-2, Class A-4, Class A-4-1, Class A-4-2, Class A-S, Class A-S-1, Class A-S-2, Class B and Class C) and 8 interest-only classes (Class A-3-X1, Class A-3-X2, Class A-4-X1, Class A-4-X2, Class X-A, Class X-B, Class A-S-X1 and Class A-S-X2) |
Co-Lead Managers and Joint Bookrunners: | Morgan Stanley & Co. LLC, BofA Securities, Inc. and Wells Fargo Securities, LLC |
Co-Managers: | Academy Securities, Inc. and Drexel Hamilton, LLC |
Mortgage Loan Sellers: | Morgan Stanley Mortgage Capital Holdings LLC, Bank of America, National Association, Wells Fargo Bank, National Association and National Cooperative Bank, N.A. |
Rating Agencies: | Fitch, S&P and DBRS Morningstar |
Master Servicers: | Wells Fargo Bank, National Association and National Cooperative Bank, N.A. |
Special Servicers: | LNR Partners, LLC and National Cooperative Bank, N.A. |
Certificate Administrator/ Certificate Registrar/Custodian: | Wells Fargo Bank, National Association |
Trustee: | Wilmington Trust, National Association |
Operating Advisor: | Park Bridge Lender Services LLC |
Asset Representations Reviewer: | Park Bridge Lender Services LLC |
Initial Directing Certificateholder: | Seer Capital Commercial Real Estate Debt Fund II, LTD. |
Risk Retention Consultation Party: | Morgan Stanley Mortgage Capital Holdings LLC |
U.S. Credit Risk Retention: | For a discussion on the manner in which the U.S. credit risk retention requirements will be addressed by Morgan Stanley Mortgage Capital Holdings LLC, as the retaining sponsor, see “Credit Risk Retention” in the Preliminary Prospectus. |
EU Risk Retention: | None of the sponsors or any other party to this transaction intends to retain a material net economic interest in the securitization constituted by the issue of the Certificates in a manner prescribed by Article 6 of European Union Regulation (EU) 2017/2402. In addition, no such person undertakes to take any action which may be required by any investor for the purposes of its compliance with any applicable requirement under such regulation. |
Cut-off Date: | The mortgage loans will be considered part of the trust fund as of their respective cut-off dates. The cut-off date with respect to each mortgage loan is the respective due date for the monthly debt service payment that is due in March 2020 (or, in the case of any mortgage loan that has its first due date after March 2020, the date that would have been its due date in March 2020 under the terms of that mortgage loan if a monthly debt service payment were scheduled to be due in that month). |
Expected Pricing Date: | Week of March 2, 2020 |
Expected Closing Date: | March 12, 2020 |
Determination Dates: | The 11th day of each month or, if the 11th day is not a business day, then the business day immediately following such 11th day. |
Distribution Dates: | The 4th business day following each determination date. The first distribution date will be in April 2020. |
Rated Final Distribution Date: | The distribution date in March 2063 |
Interest Accrual Period: | Preceding calendar month |
Payment Structure: | Sequential pay |
Tax Treatment: | REMIC, except that the Exchangeable Certificates will evidence interests in a grantor trust |
Optional Termination: | 1.00% clean-up call |
Minimum Denominations: | $10,000 for each class of Offered Certificates (other than Class X-A and Class X-B certificates); $1,000,000 for the Class X-A and Class X-B certificates |
Settlement Terms: | DTC, Euroclear and Clearstream |
Legal/Regulatory Status: | Each class of Offered Certificates is expected to be eligible for exemptive relief under ERISA. No class of Offered Certificates is SMMEA eligible. |
Analytics: | The certificate administrator is expected to make available all distribution date statements, CREFC® reports and supplemental notices received by it to certain modeling financial services as described in the Preliminary Prospectus. |
Bloomberg Ticker: | BANK 2020-BN26<MTGE><GO> |
Risk Factors: | THE CERTIFICATES INVOLVE CERTAIN RISKS AND MAY NOT BE SUITABLE FOR ALL INVESTORS. SEE THE “RISK FACTORS” SECTION OF THE PRELIMINARY PROSPECTUS. |
| This is not a research report and was not prepared by any Underwriter’s research department. Please see additional important information and qualifications at the end of this Term Sheet. |
T-6
BANK 2020-BNK26 | Structural Overview |
Structural Overview
Allocation Between the RR Interest and the Non-Retained Certificates: |
The aggregate amount available for distributions to the holders of the Certificates (including the RR Interest) on each distribution date (net of specified expenses of the issuing entity, including fees payable to, and costs and expenses reimbursable to, each applicable master servicer, primary servicer and special servicer, the certificate administrator, the trustee, the operating advisor, the asset representations reviewer and CREFC®) will be allocated between amounts available for distribution to the holders of the RR Interest, on the one hand, and to all other Certificates (other than the Class V and Class R Certificates), referred to herein as the “Non-Retained Certificates”, on the other hand. The portion of such amount allocable to (a) the RR Interest will at all times be the product of such amount multiplied by 5% and (b) the Non-Retained Certificates will at all times be the product of such amount multiplied by the difference between 100% and the percentage set forth in clause (a) (each, the respective “Percentage Allocation Entitlement”). |
Accrual: | Each class of Offered Certificates will accrue interest on a 30/360 basis. |
Amount and Order of Distributions: |
On each distribution date, the Non-Retained Certificates’ Percentage Allocation Entitlement of funds available for distribution from the mortgage loans, net of (i) any yield maintenance charges and prepayment premiums and (ii) any excess interest, will be distributed in the following amounts and order of priority: First, to the Class A-1, Class A-2, Class A-SB, Class X-A, Class X-B, Class X-D, Class X-F, Class X-G and Class X-H certificates and the Class A-3, Class A-3-X1, Class A-3-X2, Class A-4, Class A-4-X1 and Class A-4-X2 trust components, in respect of interest, up to an amount equal to, and pro rata in accordance with, the interest entitlements for those classes of certificates and trust components; Second, to the Class A-1, Class A-2 and Class A-SB certificates and the Class A-3 and Class A-4 trust components as follows, to the extent of applicable available funds allocated to principal: either (i)(a) first, to principal on the Class A-SB certificates, until the certificate balance of the Class A-SB certificates is reduced to the planned principal balance for the related distribution date set forth in Annex E to the Preliminary Prospectus, and (b) second, to principal on the Class A-1 certificates, the Class A-2 certificates, the Class A-3 trust component, the Class A-4 trust component and the Class A-SB certificates, in that order, in each case until the certificate or principal balance of such class of certificates or trust component has been reduced to zero, or (ii) if the certificate or principal balance of each class of principal balance certificates and trust components other than the Class A-1, Class A-2 and Class A-SB certificates, the Class A-3 and Class A-4 trust components and the RR Interest has been reduced to zero as a result of the allocation of losses on the mortgage loans to those certificates, to principal on the Class A-1, Class A-2 and Class A-SB certificates and the Class A-3 and Class A-4 trust components, pro rata, without regard to the distribution priorities described above or the planned principal balance of the Class A-SB certificates; Third, to the Class A-1, Class A-2 and Class A-SB certificates and the Class A-3 and Class A-4 trust components, first, up to an amount equal to, and pro rata based on, any previously unreimbursed losses on the mortgage loans allocable to principal that were previously borne by each such class or trust component and then in the amount of interest thereon; Fourth, to the Class A-S, Class A-S-X1 and Class A-S-X2 trust components, as follows: (a) to each such trust component in respect of interest, up to an amount equal to, and pro rata in accordance with, the interest entitlements for those trust components; (b) to the extent of applicable available funds allocable to principal remaining after distributions in respect of principal to each class of certificates or trust component with a higher priority (as set forth in this clause or prior enumerated clauses set forth above), to principal on the Class A-S trust component until its principal balance has been reduced to zero; and (c) to reimburse the Class A-S trust component, first, in the amount of any previously unreimbursed losses on the mortgage loans that were previously allocated thereto, then in the amount of interest thereon; Fifth, to the Class B and Class C certificates, in that order, in each case as follows: (a) to interest on such class of certificates in the amount of its interest entitlement; (b) to the extent of applicable available funds allocable to principal remaining after distributions in respect of principal to each class of certificates or trust component with a higher priority (as set forth in this clause or prior enumerated clauses set forth above), to principal on such class of certificates until its certificate balance has been reduced to zero; and (c) to reimburse such class of certificates, first, in the amount of any previously unreimbursed losses on the mortgage loans that were previously allocated thereto, then in the amount of interest thereon; Sixth, to the Class D, Class E, Class F, Class G and Class H certificates in the amounts and order of priority described in “Description of the Certificates—Distributions” in the Preliminary Prospectus; and Seventh, to the Class R certificates, any remaining amounts. Principal and interest payable on the Class A-3, Class A-3-X1, Class A-3-X2, Class A-4, Class A-4-X1, Class A-4-X2, Class A-S, Class A-S-X1 and Class A-S-X2 trust components will be distributed pro rata to the corresponding classes of Exchangeable Certificates representing interests therein in accordance with their Class Percentage Interests therein as described below under “Exchangeable Certificates.” |
Interest and Principal Entitlements: |
The interest entitlement of each class of Offered Certificates on each distribution date generally will be the interest accrued during the related interest accrual period on the related certificate balance or notional amount at the related pass-through rate, net of any prepayment interest shortfalls allocated to that class for such distribution date as described below. If prepayment interest shortfalls arise from voluntary prepayments on serviced mortgage loans during any collection period, the applicable master servicer is required to make a
|
| This is not a research report and was not prepared by any Underwriter’s research department. Please see additional important information and qualifications at the end of this Term Sheet. |
T-7
BANK 2020-BNK26 | Structural Overview |
| limited compensating interest payment to offset those shortfalls. See “Description of the Certificates—Prepayment Interest Shortfalls” in the Preliminary Prospectus. The remaining amount of prepayment interest shortfalls will be allocated between the RR Interest, on one hand, and the Non-Retained Certificates, on the other hand, in accordance with their respective Percentage Allocation Entitlements. The prepayment interest shortfalls allocated to the Non-Retained Certificates will be allocated among such classes of certificates (other than the Exchangeable Certificates) and trust components that are entitled to interest, on a pro rata basis, based on their respective amounts of accrued interest for the related distribution date, to reduce the interest entitlement on each such class of certificates and trust components. For any distribution date, prepayment interest shortfalls allocated to a trust component will be allocated among the related classes of Exchangeable Certificates, pro rata, in accordance with their respective interest accrual amounts for that distribution date. If a class of certificates or trust component receives less than the entirety of its interest entitlement on any distribution date, then the shortfall (excluding any shortfall due to prepayment interest shortfalls), together with interest thereon, will be added to its interest entitlement for the next succeeding distribution date. The aggregate principal distribution amount for each distribution date generally will be the aggregate amount of principal received or advanced in respect of the mortgage loans, net of any non-recoverable advances and interest thereon and any workout-delayed reimbursement amounts that are reimbursed to the applicable master servicer or the trustee during the related collection period. Non-recoverable advances and interest thereon are reimbursable from principal collections before reimbursement from other amounts. Workout-delayed reimbursement amounts will be reimbursable from principal collections. The Non-Retained Certificates and the RR Interest will be entitled to their respective Percentage Allocation Entitlements of the aggregate principal distribution amount. |
Exchangeable Certificates: | Each class of Exchangeable Certificates may be exchanged for the corresponding classes of Exchangeable Certificates set forth next to such class in the table below, and vice versa. Following any exchange of one or more classes of Exchangeable Certificates (the applicable “Surrendered Classes”) for one or more classes of other Exchangeable Certificates (the applicable “Received Classes”), the Class Percentage Interests (as defined below) of the outstanding principal balances or notional amounts of the Corresponding Trust Components that are represented by the Surrendered Classes (and consequently their related certificate balances or notional amounts) will be decreased, and those of the Received Classes (and consequently their related certificate balances or notional amounts) will be increased. The dollar denomination of each of the Received Classes of certificates must be equal to the dollar denomination of each of the Surrendered Classes of certificates. No fee will be required with respect to any exchange of Exchangeable Certificates. |
| Surrendered Classes (or Received Classes) of Certificates | Received Classes (or Surrendered Classes) of Certificates |
| Class A-3 | Class A-3-1, Class A-3-X1 |
| Class A-3 | Class A-3-2, Class A-3-X2 |
| Class A-4 | Class A-4-1, Class A-4-X1 |
| Class A-4 | Class A-4-2, Class A-4-X2 |
| Class A-S | Class A-S-1, Class A-S-X1 |
| Class A-S | Class A-S-2, Class A-S-X2 |
| On the closing date, the issuing entity will issue the following “trust components,” each with the initial principal balance (or, if such trust component has an “X” suffix, notional amount) and pass-through rate set forth next to it in the table below. Each trust component with an “X” suffix will not be entitled to distributions of principal. |
| Trust Component | Initial Principal Balance | Pass-Through Rate |
| Class A-3 | See footnote (9) to the first table above under “Structural Overview” | Class A-3 certificate pass-through rate minus 1.00% |
| Class A-3-X1 | Equal to Class A-3 trust component principal balance | 0.50% |
| Class A-3-X2 | Equal to Class A-3 trust component principal balance | 0.50% |
| Class A-4 | See footnote (9) to the first table above under “Structural Overview” | Class A-4 certificate pass-through rate minus 1.00% |
| Class A-4-X1 | Equal to Class A-4 trust component principal balance | 0.50% |
| Class A-4-X2 | Equal to Class A-4 trust component principal balance | 0.50% |
| Class A-S | $131,111,000 | Class A-S certificate pass-through rate minus 1.00% |
| Class A-S-X1 | Equal to Class A-S trust component principal balance | 0.50% |
| Class A-S-X2 | Equal to Class A-S trust component principal balance | 0.50% |
| Each class of Exchangeable Certificates represents an undivided beneficial ownership interest in the trust components set forth next to it in the table below (the “Corresponding Trust Components”). Each class of Exchangeable Certificates has a pass-through rate equal to the sum of the pass-through rates of the Corresponding Trust Components and represents a percentage interest (the related “Class Percentage Interest���) in each Corresponding Trust Component, including principal and interest payable thereon, equal to (x) the certificate balance (or, if such class has an “X” suffix, notional amount) of such class of certificates, |
| This is not a research report and was not prepared by any Underwriter’s research department. Please see additional important information and qualifications at the end of this Term Sheet. |
T-8
BANK 2020-BNK26 | Structural Overview |
| divided by (y) the principal balance of the Class A-3 trust component (if such class of Exchangeable Certificates has an “A-3” designation), the Class A-4 trust component (if such class of Exchangeable Certificates has an “A-4” designation) or the Class A-S trust component (if such class of Exchangeable Certificates has an “A-S” designation). |
| Group of Exchangeable Certificates | Class of Exchangeable Certificates | Corresponding Trust Components |
| “Class A-3 Exchangeable Certificates” | Class A-3 | Class A-3, Class A-3-X1, Class A-3-X2 |
| Class A-3-1 | Class A-3, Class A-3-X2 | |
| Class A-3-2 | Class A-3 | |
| Class A-3-X1 | Class A-3-X1 | |
| Class A-3-X2 | Class A-3-X1, Class A-3-X2 | |
| “Class A-4 Exchangeable Certificates” | Class A-4 | Class A-4, Class A-4-X1, Class A-4-X2 |
| Class A-4-1 | Class A-4, Class A-4-X2 | |
| Class A-4-2 | Class A-4 | |
| Class A-4-X1 | Class A-4-X1 | |
| Class A-4-X2 | Class A-4-X1, Class A-4-X2 | |
| “Class A-S Exchangeable Certificates” | Class A-S | Class A-S, Class A-S-X1, Class A-S-X2 |
| Class A-S-1 | Class A-S, Class A-S-X2 | |
| Class A-S-2 | Class A-S | |
| Class A-S-X1 | Class A-S-X1 | |
| Class A-S-X2 | Class A-S-X1, Class A-S-X2 |
| The maximum certificate balance or notional amount of each class of Class A-3 Exchangeable Certificates that could be issued in an exchange is equal to the certificate balance of the Class A-3 trust component, the maximum certificate balance or notional amount of each class of Class A-4 Exchangeable Certificates that could be issued in an exchange is equal to the certificate balance of the Class A-4 trust component, and the maximum certificate balance or notional amount of each class of Class A-S Exchangeable Certificates that could be issued in an exchange is equal to the certificate balance of the Class A-S trust component. The maximum certificate balances of Class A-3, Class A-4 and Class A-S certificates (subject to the constraint on the aggregate initial principal balance of the Class A-3 and Class A-4 trust components discussed in footnote (9) to the first table above under “Structural Overview”) will be issued on the closing date, and the certificate balance or notional amount of each other class of Exchangeable Certificates will be equal to zero on the Closing Date. Each class of Class A-3 Exchangeable Certificates, Class A-4 Exchangeable Certificates and Class A-S Exchangeable Certificates will have a certificate balance or notional amount equal to its Class Percentage Interest multiplied by the principal balance of the Class A-3 Trust Component, Class A-4 Trust Component or Class A-S Trust Component, respectively. Each class of Class A-3 Exchangeable Certificates, Class A-4 Exchangeable Certificates and Class A-S Exchangeable Certificates with a certificate balance will have the same approximate initial credit support percentage, Expected Weighted Average Life, Expected Principal Window, Certificate Principal UW NOI Debt Yield and Certificate Principal to Value Ratio as the Class A-3 Certificates, Class A-4 Certificates or Class A-S Certificates, respectively, shown above. |
Special Servicer Compensation: | The principal compensation to be paid to a special servicer in respect of its special servicing activities will be the special servicing fee, the workout fee and the liquidation fee. The special servicing fee for each distribution date is calculated based on the outstanding principal balance of each serviced mortgage loan that is a specially serviced mortgage loan (and any related serviced companion loan) or as to which the related mortgaged property has become an REO property at the special servicing fee rate, which will be a rate equal to (a) with respect to LNR Partners, LLC, the greater of (i) 0.25000% per annum and (ii) the per annum rate that would result in a special servicing fee for the related month of (i) $3,500 or (ii) with respect to any mortgage loan with respect to which the risk retention consultation party is entitled to consult with the special servicer, for so long as the related mortgage loan is a specially serviced loan during the occurrence and continuance of a consultation termination event, $5,000, and (b) with respect to National Cooperative Bank, N.A., the greater of 0.25000% per annum and the per annum rate that would result in a special servicing fee of $1,000 for the related month. The special servicing fee will be payable monthly, first, from liquidation proceeds, insurance and condemnation proceeds, and other collections in respect of the related specially serviced mortgage loan or REO property and, then, from general collections on all the mortgage loans and any REO properties. Each applicable special servicer will also be entitled to (i) liquidation fees generally equal to 1.0% (or, if such rate would result in an aggregate liquidation fee less than $25,000, then the liquidation fee rate will be equal to such rate as would result in an aggregate liquidation fee equal to $25,000) of liquidation proceeds and certain other collections in respect of a specially serviced mortgage loan (and any related serviced companion loan) or related REO property and of amounts received in respect of mortgage loan repurchases by the related mortgage loan sellers and (ii) workout fees generally equal to 1.0% of interest (other than post-ARD excess interest on mortgage loans with anticipated repayment dates and other than default interest) and principal payments made in respect of a rehabilitated mortgage loan (and any related serviced companion loan), subject to a floor of $25,000 with respect to any mortgage loan, whole loan or related REO property, and in the case of each of clause (i) and (ii), subject to certain adjustments and exceptions as described in the Preliminary Prospectus under “Pooling and Servicing Agreement—Servicing and Other Compensation and Payment of Expenses—Special Servicing Compensation”. |
| This is not a research report and was not prepared by any Underwriter’s research department. Please see additional important information and qualifications at the end of this Term Sheet. |
T-9
BANK 2020-BNK26 | Structural Overview |
| With respect to any non-serviced mortgage loan, the related special servicer under the related other pooling and servicing agreement pursuant to which such mortgage loan is being serviced will be entitled to similar compensation as that described above with respect to such non-serviced mortgage loan under such other pooling and servicing agreement as further described in the Preliminary Prospectus, although any related fees may accrue at a different rate and there may be a higher (or no) cap on liquidation and workout fees. |
Prepayment Premiums/Yield Maintenance Charges: |
If any yield maintenance charge or prepayment premium is collected during any collection period with respect to any mortgage loan, then on the immediately succeeding distribution date, the certificate administrator will pay: (i) to the Non-Retained Certificates, in the following amounts: (a) to the holders of each class of the Class A-1, Class A-2, Class A-SB, Class A-3, Class A-3-1, Class A-3-2, Class A-4, Class A-4-1, Class A-4-2, Class A-S, Class A-S-1, Class A-S-2, Class B, Class C, Class D and Class E certificates, the product of (x) the Non-Retained Certificates’ Percentage Allocation Entitlement of such yield maintenance charge or prepayment premium, (y) the related Base Interest Fraction for such class and the applicable principal prepayment, and (z) a fraction, the numerator of which is equal to the amount of principal distributed to such class for that distribution date, and the denominator of which is the total amount of principal distributed to the Class A-1, Class A-2, Class A-SB, Class B, Class C, Class D and Class E certificates and the Class A-3 Exchangeable Certificates (collectively), the Class A-4 Exchangeable Certificates (collectively) and the Class A-S Exchangeable Certificates (collectively) for that distribution date, (b) to the holders of the Class A-3-X1 certificates, the product of (x) the Non-Retained Certificates’ Percentage Allocation Entitlement of such yield maintenance charge or prepayment premium, (y) a fraction, the numerator of which is equal to the amount of principal distributed to the Class A-3-1 certificates, and the denominator of which is the total amount of principal distributed to the Class A-1, Class A-2, Class A-SB, Class B, Class C, Class D and Class E certificates and the Class A-3 Exchangeable Certificates (collectively), the Class A-4 Exchangeable Certificates (collectively) and the Class A-S Exchangeable Certificates (collectively) for that distribution date, and (z) the difference between (1) the Base Interest Fraction for the Class A-3 certificates and the applicable principal prepayment and (2) the Base Interest Fraction for the Class A-3-1 certificates and the applicable principal prepayment, (c) to the holders of the Class A-3-X2 certificates, the product of (x) the Non-Retained Certificates’ Percentage Allocation Entitlement of such yield maintenance charge or prepayment premium, (y) a fraction, the numerator of which is equal to the amount of principal distributed to the Class A-3-2 certificates, and the denominator of which is the total amount of principal distributed to the Class A-1, Class A-2, Class A-SB, Class B, Class C, Class D and Class E certificates and the Class A-3 Exchangeable Certificates (collectively), the Class A-4 Exchangeable Certificates (collectively) and the Class A-S Exchangeable Certificates (collectively) for that distribution date, and (z) the difference between (1) the Base Interest Fraction for the Class A-3 certificates and the applicable principal prepayment and (2) the Base Interest Fraction for the Class A-3-2 certificates and the applicable principal prepayment, (d) to the holders of the Class A-4-X1 certificates, the product of (x) the Non-Retained Certificates’ Percentage Allocation Entitlement of such yield maintenance charge or prepayment premium, (y) a fraction, the numerator of which is equal to the amount of principal distributed to the Class A-4-1 certificates, and the denominator of which is the total amount of principal distributed to the Class A-1, Class A-2, Class A-SB, Class B, Class C, Class D and Class E certificates and the Class A-3 Exchangeable Certificates (collectively), the Class A-4 Exchangeable Certificates (collectively) and the Class A-S Exchangeable Certificates (collectively) for that distribution date, and (z) the difference between (1) the Base Interest Fraction for the Class A-4 certificates and the applicable principal prepayment and (2) the Base Interest Fraction for the Class A-4-1 certificates and the applicable principal prepayment, (e) to the holders of the Class A-4-X2 certificates, the product of (x) the Non-Retained Certificates’ Percentage Allocation Entitlement of such yield maintenance charge or prepayment premium, (y) a fraction, the numerator of which is equal to the amount of principal distributed to the Class A-4-2 certificates, and the denominator of which is the total amount of principal distributed to the Class A-1, Class A-2, Class A-SB, Class B, Class C, Class D and Class E certificates and the Class A-3 Exchangeable Certificates (collectively), the Class A-4 Exchangeable Certificates (collectively) and the Class A-S Exchangeable Certificates (collectively) for that distribution date, and (z) the difference between (1) the Base Interest Fraction for the Class A-4 certificates and the applicable principal prepayment and (2) the Base Interest Fraction for the Class A-4-2 certificates and the applicable principal prepayment, (f) to the holders of the Class A-S-X1 certificates, the product of (x) the Non-Retained Certificates’ Percentage Allocation Entitlement of such yield maintenance charge or prepayment premium, (y) a fraction, the numerator of which is equal to the amount of principal distributed to the Class A-S-1 certificates, and the denominator of which is the total amount of principal distributed to the Class A-1, Class A-2, Class A-SB, Class B, Class C, Class D and Class E certificates and the Class A-3 Exchangeable Certificates (collectively), the Class A-4 Exchangeable Certificates (collectively) and the Class A-S Exchangeable Certificates (collectively) for that distribution date, and (z) the difference |
| This is not a research report and was not prepared by any Underwriter’s research department. Please see additional important information and qualifications at the end of this Term Sheet. |
T-10
BANK 2020-BNK26 | Structural Overview |
| between (1) the Base Interest Fraction for the Class A-S certificates and the applicable principal prepayment and (2) the Base Interest Fraction for the Class A-S-1 certificates and the applicable principal prepayment, (g) to the holders of the Class A-S-X2 certificates, the product of (x) the Non-Retained Certificates’ Percentage Allocation Entitlement of such yield maintenance charge or prepayment premium, (y) a fraction, the numerator of which is equal to the amount of principal distributed to the Class A-S-2 certificates, and the denominator of which is the total amount of principal distributed to the Class A-1, Class A-2, Class A-SB, Class B, Class C, Class D and Class E certificates and the Class A-3 Exchangeable Certificates (collectively), the Class A-4 Exchangeable Certificates (collectively) and the Class A-S Exchangeable Certificates (collectively) for that distribution date, and (z) the difference between (1) the Base Interest Fraction for the Class A-S certificates and the applicable principal prepayment and (2) the Base Interest Fraction for the Class A-S-2 certificates and the applicable principal prepayment, (h) to the holders of the Class X-A certificates, the excess, if any, of (x) the product of (1) the Non-Retained Certificates’ Percentage Allocation Entitlement of such yield maintenance charge or prepayment premium and (2) a fraction, the numerator of which is equal to the amount of principal distributed to the Class A-1, Class A-2 and Class A-SB certificates and the Class A-3 Exchangeable Certificates (collectively) and the Class A-4 Exchangeable Certificates (collectively) for that distribution date, and the denominator of which is the total amount of principal distributed to the Class A-1, Class A-2, Class A-SB, Class B, Class C, Class D and Class E certificates and the Class A-3 Exchangeable Certificates (collectively), the Class A-4 Exchangeable Certificates (collectively) and the Class A-S Exchangeable Certificates (collectively) for that distribution date, over (y) the amount of such yield maintenance charge or prepayment premium distributed to the Class A-1, Class A-2 and Class A-SB certificates and the Class A-3 Exchangeable Certificates (collectively) and the Class A-4 Exchangeable Certificates (collectively) as described above, (i) to the holders of the Class X-B certificates, the excess, if any, of (x) the product of (1) the Non-Retained Certificates’ Percentage Allocation Entitlement of such yield maintenance charge or prepayment premium and (2) a fraction, the numerator of which is equal to the amount of principal distributed to the Class A-S Exchangeable Certificates (collectively) and the Class B and Class C certificates for that distribution date, and the denominator of which is the total amount of principal distributed to the Class A-1, Class A-2, Class A-SB, Class B, Class C, Class D and Class E certificates and the Class A-3 Exchangeable Certificates (collectively), the Class A-4 Exchangeable Certificates (collectively) and the Class A-S Exchangeable Certificates (collectively) for that distribution date, over (y) the amount of such yield maintenance charge or prepayment premium distributed to the Class A-S Exchangeable Certificates (collectively) and the Class B and Class C certificates as described above, and (j) to the holders of the Class X-D certificates, any remaining portion of the Non-Retained Certificates’ Percentage Allocation Entitlement of such yield maintenance charge or prepayment premium not distributed as described above, and (ii) to the RR Interest, its Percentage Allocation Entitlement of such yield maintenance charge or prepayment premium. All yield maintenance charges and prepayment premiums referred to above will be net of any liquidation fees payable therefrom. “Base Interest Fraction” means, with respect to any principal prepayment of any mortgage loan that provides for the payment of a yield maintenance charge or prepayment premium, and with respect to any class of principal balance certificates (other than the RR Interest), a fraction (A) the numerator of which is the greater of (x) zero and (y) the difference between (i) the pass-through rate on that class, and (ii) the applicable discount rate and (B) the denominator of which is the difference between (i) the mortgage interest rate on the related mortgage loan and (ii) the applicable discount rate; provided, that: under no circumstances will the Base Interest Fraction be greater than one; if the discount rate referred to above is greater than or equal to both the mortgage interest rate on the related mortgage loan and the pass-through rate on that class, then the Base Interest Fraction will equal zero; and if the discount rate referred to above is greater than or equal to the mortgage interest rate on the related mortgage loan and is less than the pass-through rate on that class, then the Base Interest Fraction will be equal to 1.0. Consistent with the foregoing, the Base Interest Fraction is equal to: |
| (Pass-Through Rate – Discount Rate) |
|
| (Mortgage Rate – Discount Rate) |
|
Realized Losses: | On each distribution date, immediately following the distributions to be made to the certificateholders on that date, the certificate administrator is required to calculate the amount, if any, by which (i) the aggregate stated principal balance of the mortgage loans, including any successor REO loans, expected to be outstanding immediately following that distribution date is less than (ii) the then aggregate certificate balance of the principal balance certificates after giving effect to distributions of principal on that distribution date. The Non-Retained Certificates’ Percentage Allocation Entitlement of such amount will be applied to the Class H, Class G, Class F, Class E, Class D, Class C and Class B certificates and the Class A-S trust component, in that order, in each case until the related certificate or principal balance has been reduced to zero, and then to the Class A-1, Class A-2 and Class A-SB certificates and the Class A-3 and Class A-4 trust components, pro rata based upon their respective certificate or principal balances, until their respective certificate or principal |
| This is not a research report and was not prepared by any Underwriter’s research department. Please see additional important information and qualifications at the end of this Term Sheet. |
T-11
BANK 2020-BNK26 | Structural Overview |
| balances have been reduced to zero. The RR Interest’s Percentage Allocation Entitlement of such amount will be applied to the RR Interest until the related RR Interest balance has been reduced to zero. Any portion of such amount applied to the Class A-3, Class A-4 or Class A-S trust component will reduce the certificate balance or notional amount of each class of certificates in the related group of Exchangeable Certificates by an amount equal to the product of (x) its certificate balance or notional amount, divided by the principal balance of such trust component prior to the applicable reduction, and (y) the amount applied to such trust component. |
Serviced Whole Loans: | Each of the following mortgaged properties or portfolio of mortgaged properties secures a mortgage loan and one or more pari passu promissory notes and, in some cases, one or more generally subordinate promissory notes (each, a “serviced companion loan”) that will be serviced pursuant to the related intercreditor agreement and the pooling and servicing agreement for this transaction: 200 West 57th Street. With respect to each such mortgaged property or portfolio of mortgaged properties, the related mortgage loan, together with the related serviced companion loan(s), is referred to herein (for so long as it is serviced under the pooling and servicing agreement for this transaction) as a “serviced whole loan.” Each serviced companion loan is not part of the mortgage pool and may be contributed to one or more future securitization transactions (if not already securitized) or may be otherwise transferred at any time, subject to compliance with the related intercreditor agreement. See the table below entitled “Mortgage Loans with Pari Passu Companion Loans,” as well as “Description of the Mortgage Pool—The Whole Loans” in the Preliminary Prospectus, for additional information regarding each such whole loan. With respect to each “servicing shift whole loan”, the pooling and servicing agreement for this transaction will govern servicing of such whole loan until the securitization of the related control note; however, servicing of such whole loan will generally be directed by the holder of the related control note (which is not included in this securitization), and such holder will have the right to replace the special servicer with respect to the related whole loan with or without cause. After the securitization of such promissory note, such loan will cease to be a serviced whole loan and will be serviced pursuant to the pooling and servicing agreement for another securitization transaction (see “—Non-Serviced Whole Loans” below). There will be no servicing shift mortgage loans related to the trust as of the Closing Date. |
Non-Serviced Whole Loans: | Each of the following mortgaged properties or portfolio of mortgaged properties secures a mortgage loan (each, a “non-serviced mortgage loan”), one or more pari passu promissory notes and, in some cases, one or more generally subordinate promissory notes (each such promissory note, a “non-serviced companion loan”) that will be serviced pursuant to the related intercreditor agreement and the pooling and servicing agreement or trust and servicing agreement (referred to herein as a related “pooling and servicing agreement”) for another securitization transaction: Bravern Office Commons, 560 Mission Street, 545 Washington Boulevard, 55 Hudson Yards, 1633 Broadway, Bellagio Hotel and Casino and Giant Anchored Portfolio. With respect to each such mortgaged property or portfolio of mortgaged properties, the related mortgage loan, together with the related non-serviced companion loan(s), is referred to herein (for so long as it is serviced under the pooling and servicing agreement for another securitization transaction) as a “non-serviced whole loan.” Each non-serviced companion loan is not part of the mortgage pool and may be contributed to one or more future securitization transactions (if not already securitized) or may be otherwise transferred at any time, subject to compliance with the related intercreditor agreement. Servicing of each non-serviced whole loan will generally be directed by the holder of the related control note (or, if such control note is included in a securitization, the directing certificateholder thereunder (or other party designated thereunder to exercise the rights of such control note)), and such holder will have the right to replace the special servicer with respect to the related whole loan with or without cause. See the tables below entitled “Mortgage Loans with Pari Passu Companion Loans” and “Mortgage Loans with Subordinate Debt,” as well as “Description of the Mortgage Pool—The Whole Loans” in the Preliminary Prospectus, for additional information regarding each such whole loan. |
Directing Certificateholder/ Controlling Class: |
The “Directing Certificateholder” will be (i) with respect to a servicing shift mortgage loan, the related Loan-Specific Directing Certificateholder, and (ii) with respect to each other mortgage loan, the Controlling Class Certificateholder (or its representative) selected by more than 50% (by certificate balance) of the Controlling Class Certificateholders; provided, that (1) absent that selection, (2) until a Directing Certificateholder is so selected or (3) upon receipt of a notice from a majority of the Controlling Class Certificateholders (by certificate balance) that a Directing Certificateholder is no longer designated, the Controlling Class Certificateholder that owns the largest aggregate certificate balance of the Controlling Class (or its representative) will be the Directing Certificateholder; provided, that (a) in the case of clause (3), if no one holder owns the largest aggregate certificate balance of the Controlling Class, then there will be no Directing Certificateholder until appointed in accordance with the terms of the pooling and servicing agreement, and (b) the certificate administrator and the other parties to the pooling and servicing agreement will be entitled to assume that the identity of the Directing Certificateholder has not changed until such parties receive written notice of a replacement of the Directing Certificateholder from a party holding the requisite interest in the Controlling Class (as confirmed by the certificate registrar), or the resignation of the then current Directing Certificateholder. As used herein, the term “Directing Certificateholder,” unless used in relation to a Servicing Shift Mortgage Loan, means the entity determined pursuant to clause (ii) of the definition of such term. The “Loan-Specific Directing Certificateholder” with respect to a servicing shift mortgage loan is the “controlling holder”, the “directing certificateholder”, the “directing holder”, “directing lender” or any analogous concept under the related intercreditor agreement. Prior to the securitization of the related control note, the Loan-Specific Directing Certificateholder with respect to a servicing shift mortgage loan will be the holder of |
| This is not a research report and was not prepared by any Underwriter’s research department. Please see additional important information and qualifications at the end of this Term Sheet. |
T-12
BANK 2020-BNK26 | Structural Overview |
| the related control note. On and after the securitization of the related control note, there will be no Loan-Specific Directing Certificateholder under the PSA with respect to such servicing shift mortgage loan. The “Controlling Class” will be, as of any time of determination, the most subordinate class of Control Eligible Certificates then outstanding that has an aggregate certificate balance (as notionally reduced by any Cumulative Appraisal Reduction Amounts (as defined below) allocable to such class) at least equal to 25% of the initial certificate balance of that class; provided, that if at any time the certificate balances of the certificates other than the Control Eligible Certificates and the RR Interest have been reduced to zero as a result of principal payments on the mortgage loans, then the Controlling Class will be the most subordinate class of Control Eligible Certificates that has a certificate balance greater than zero without regard to any Cumulative Appraisal Reduction Amounts. The Controlling Class as of the Closing Date will be the Class H certificates. The “Control Eligible Certificates” will be any of the Class F, Class G and Class H certificates. |
Control Rights: | Prior to a Control Termination Event, the Directing Certificateholder will have certain consent and consultation rights under the pooling and servicing agreement with respect to certain major decisions and other matters. A “Control Termination Event” will occur when the Class F certificates have a certificate balance (taking into account the application of the allocable portion of any Cumulative Appraisal Reduction Amounts to notionally reduce the certificate balance thereof) of less than 25% of the initial certificate balance of that class; provided that no Control Termination Event may occur with respect to the Loan-Specific Directing Certificateholder, and the term “Control Termination Event” will not be applicable to the Loan-Specific Directing Certificateholder; provided, further, that a Control Termination Event will be deemed not continuing in the event that the certificate balances of the principal balance certificates other than the Control Eligible Certificates and the RR Interest have been reduced to zero as a result of principal payments on the mortgage loans. After the occurrence of a Control Termination Event but prior to the occurrence of a Consultation Termination Event, the Directing Certificateholder will not have any consent rights, but the Directing Certificateholder will have certain non-binding consultation rights under the pooling and servicing agreement with respect to certain major decisions and other matters. A “Consultation Termination Event” will occur when no class of Control Eligible Certificates has a certificate balance (without regard to the application of the allocable portion of any Cumulative Appraisal Reduction Amounts) at least equal to 25% of the initial certificate balance of that class; provided that no Consultation Termination Event may occur with respect to the Loan-Specific Directing Certificateholder, and the term “Consultation Termination Event” will not be applicable to the Loan-Specific Directing Certificateholder; provided, further, that a Consultation Termination Event will be deemed not continuing in the event that the certificate balances of the principal balance certificates other than the Control Eligible Certificates and the RR Interest have been reduced to zero as a result of principal payments on the mortgage loans. After the occurrence of a Consultation Termination Event, the Directing Certificateholder will not have any consent or consultation rights, except with respect to any rights expressly set forth in the pooling and servicing agreement, and the operating advisor will retain certain non-binding consultation rights under the pooling and servicing agreement with respect to certain major decisions and other matters. Notwithstanding the proviso to the definitions of “Control Termination Event” and “Consultation Termination Event”, a Control Termination Event and a Consultation Termination Event will each be deemed to have occurred with respect to any Excluded Loan with respect to the Directing Certificateholder or the holder of the majority of the Controlling Class, and neither the Directing Certificateholder nor any Controlling Class Certificateholder will have any consent or consultation rights with respect to the servicing of such Excluded Loan. An “Excluded Loan” means (a) with respect to the Directing Certificateholder or the holder of the majority of the Controlling Class, a mortgage loan or whole loan with respect to which, as of any date of determination, the Directing Certificateholder or the holder of the majority of the Controlling Class is a Borrower Party or (b) with respect to the Risk Retention Consultation Party or the holder of the majority of the RR Interest, a mortgage loan or whole loan with respect to which, as of any date of determination, the Risk Retention Consultation Party or the holder of the majority of the RR Interest is a Borrower Party. It is expected that there will be no Excluded Loans with respect to this securitization on the Closing Date. “Borrower Party” means a borrower, a mortgagor, a manager of a mortgaged property, the holder of a mezzanine loan that has been accelerated or as to which foreclosure or enforcement proceedings have been commenced against the equity collateral pledged to secure the related mezzanine loan, or any Borrower Party Affiliate. With respect to a mortgage loan secured by a residential cooperative property, a person will not be considered a “Borrower Party” solely by reason of such person holding one or more cooperative unit loans that are secured by direct equity interests in the related borrower or owning one or more residential cooperative units comprising the related mortgaged property as a result of any foreclosure, transfer in lieu of foreclosure or other exercise of remedies with respect to any such unit loan(s). “Borrower Party Affiliate” means, with respect to a borrower, a mortgagor, a manager of a mortgaged property or the holder of a mezzanine loan that has been accelerated or as to which foreclosure or enforcement proceedings have been commenced against the equity collateral pledged to secure the related mezzanine loan, (a) any other person controlling or controlled by or under common control with such borrower, mortgagor, manager or mezzanine lender, as applicable, or (b) any other person owning, directly or indirectly, 25% or more of the beneficial interests in such borrower, mortgagor, manager or mezzanine lender, as applicable. For the purposes of this definition, “control” when used with respect to any specified person means the power to direct the management and policies of such person, directly or indirectly, whether through the ownership of voting securities, by contract or otherwise and the terms “controlling” and “controlled” have meanings correlative to the foregoing. Notwithstanding any of the foregoing to the contrary, if any mortgage loan is part of a whole loan, the Directing |
| This is not a research report and was not prepared by any Underwriter’s research department. Please see additional important information and qualifications at the end of this Term Sheet. |
T-13
BANK 2020-BNK26 | Structural Overview |
| Certificateholder’s consent and/or consultation rights with respect thereto may be limited as described in the Preliminary Prospectus. In particular, with respect to each non-serviced whole loan and each servicing shift whole loan, the Directing Certificateholder (other than a Loan-Specific Directing Certificateholder) will only have certain consultation rights with respect to certain major decisions and other matters related to such whole loan, in each case only prior to a Control Termination Event or Consultation Termination Event, as applicable, and the Loan-Specific Directing Certificateholder will be entitled to similar consent and/or consultation rights with respect to such whole loan. In addition, with respect to any serviced A/B whole loan, for so long as the holder of the related subordinate companion loan is the controlling note holder, the holder of such subordinate companion loan (rather than the Directing Certificateholder) will be entitled to exercise such consent and consultation rights with respect to such whole loan. |
Appraisal Reduction Amounts and Collateral Deficiency Amounts: |
An “Appraisal Reduction Amount” generally will be created in the amount, if any, by which the principal balance of a required appraisal loan (which is a mortgage loan with respect to which certain defaults, modifications or insolvency events have occurred as further described in the Preliminary Prospectus) plus other amounts overdue or advanced in connection with such mortgage loan exceeds 90% of the appraised value of the related mortgaged property plus certain escrows and reserves (including letters of credit) held with respect to the mortgage loan. A mortgage loan will cease to be subject to an Appraisal Reduction Amount when it has been brought current for at least three consecutive months, no additional event of default is foreseeable in the reasonable judgment of the applicable special servicer and no other circumstances exist that would cause such mortgage loan or any related companion loan to be a specially serviced loan; however, a “Collateral Deficiency Amount” may exist with respect to any mortgage loan that is modified into an AB loan structure (an “AB Modified Loan”) and remains a corrected mortgage loan and, if so, will generally equal the excess of (i) the stated principal balance of such AB Modified Loan (taking into account the related junior note(s) and any pari passu notes included therein), over (ii) the sum of (in the case of a whole loan, solely to the extent allocable to the subject mortgage loan) (x) the most recent appraised value for the related mortgaged property or mortgaged properties, plus (y) solely to the extent not reflected or taken into account in such appraised value (or in the calculation of any related Appraisal Reduction Amount) and to the extent on deposit with, or otherwise under the control of, the lender as of the date of such determination, any capital or additional collateral contributed by the related borrower at the time the mortgage loan became (and as part of the modification related thereto) such AB Modified Loan for the benefit of the related mortgaged property or mortgaged properties (provided that in the case of an non-serviced mortgage loan, the amounts set forth in this clause (y) will be taken into account solely to the extent relevant information is received by the applicable master servicer), plus (z) any other escrows or reserves (in addition to any amounts set forth in the immediately preceding clause (y) and solely to the extent not reflected or taken into account in the calculation of any related Appraisal Reduction Amount) held by the lender in respect of such AB Modified Loan as of the date of such determination, which such excess, for the avoidance of doubt, will be determined separately from and exclude any related Appraisal Reduction Amounts. As used herein, a “Cumulative Appraisal Reduction Amount” will be the sum of any Appraisal Reduction Amounts and any Collateral Deficiency Amounts. Any Appraisal Reduction Amount in respect of any non-serviced mortgage loan generally will be calculated in accordance with the other servicing agreement pursuant to which such mortgage loan is being serviced, which calculations are expected to be generally similar to those provided for in the pooling and servicing agreement for this transaction. If any mortgage loan is part of a whole loan, any Appraisal Reduction Amount or Collateral Deficiency Amount will (or effectively will) be calculated in respect of such whole loan taken as a whole and allocated, to the extent provided in the related intercreditor agreement and the related pooling and servicing agreement, first, to any related subordinate companion loan, and second, to the related mortgage loan and any pari passu companion loan on a pro rata basis by unpaid principal balance. Appraisal Reduction Amounts will proportionately reduce the interest portion of debt service advances required to be made in respect of the related mortgage loan. Appraisal Reduction Amounts and Collateral Deficiency Amounts (in each case, to the extent of the Non-Retained Certificates’ Percentage Allocation Entitlement thereof) will be (i) taken into account in determining the identity of the controlling class entitled to appoint the Directing Certificateholder, the existence of a Control Termination Event and the allocation and/or exercise of voting rights for certain purposes (see “Directing Certificateholder/Controlling Class” above) and (ii) allocated to the following classes of certificates and trust components, in each case to notionally reduce their certificate balances or principal balances until the certificate balance or principal balance of each such class or trust component is notionally reduced to zero: the Class H, Class G, Class F, Class E, Class D, Class C and Class B certificates and the Class A-S trust component, in that order, and then pro rata to the Class A-1, Class A-2 and Class A-SB certificates and the Class A-3 and Class A-4 trust components. Appraisal Reduction Amounts and Collateral Deficiency Amounts allocated to each of the Class A-3, Class A-4 or Class A-S trust component will be allocated to the corresponding classes of Exchangeable Certificates with certificate balances pro rata to notionally reduce their certificate balances in accordance with their Class Percentage Interests therein. |
Appraised-Out Class: | An “Appraised-Out Class” is any class of Control Eligible Certificates, the certificate balance of which (taking into account the application of the Non-Retained Certificates’ Percentage Allocation Entitlement of any Appraisal Reduction Amounts or Collateral Deficiency Amounts to notionally reduce the certificate balance of such class) has been reduced to less than 25% of its initial certificate balance. Any Appraised-Out Class may not exercise |
| This is not a research report and was not prepared by any Underwriter’s research department. Please see additional important information and qualifications at the end of this Term Sheet. |
T-14
BANK 2020-BNK26 | Structural Overview |
| any direction, control, consent and/or similar rights of the Controlling Class until such time, if any, as such class is reinstated as the Controlling Class, and the rights of the Controlling Class will be exercised by the next most senior class of Control Eligible Certificates that is not an Appraised-Out Class, if any, during such period. |
Appraisal Remedy: | The holders of the majority (by certificate balance) of an Appraised-Out Class (such holders, the “Requesting Holders”) will have the right, at their sole expense, to require the applicable special servicer to order (or, with respect to a non-serviced mortgage loan, require the applicable master servicer to request from the applicable non-serviced special servicer) a second appraisal of any mortgage loan (or serviced whole loan) for which an appraisal reduction event has occurred or as to which there exists a Collateral Deficiency Amount. With respect to any serviced mortgage loan, the applicable special servicer will be required to use its reasonable efforts to ensure that such appraisal is delivered within 30 days from receipt of the Requesting Holders’ written request and will be required to cause such appraisal to be prepared on an “as-is” basis by an MAI appraiser. With respect to any non-serviced mortgage loan, the applicable master servicer will be required to use commercially reasonable efforts to obtain such second appraisal from the applicable non-serviced special servicer and to forward such second appraisal to the applicable special servicer. Upon receipt of such supplemental appraisal, the applicable master servicer (for Collateral Deficiency Amounts on non-serviced mortgage loans), the non-serviced special servicer (for Appraisal Reduction Amounts on non-serviced mortgage loans to the extent provided for in the related pooling and servicing agreement and applicable intercreditor agreement) and the applicable special servicer (for any serviced mortgage loan) will be required to determine, in accordance with the Servicing Standard, whether, based on its assessment of such supplemental appraisal, any recalculation of the applicable Appraisal Reduction Amount or Collateral Deficiency Amount is warranted and, if so warranted, such person will be required to recalculate such Appraisal Reduction Amount or Collateral Deficiency Amount, as applicable, based upon such supplemental appraisal and (for any serviced mortgage loan) receipt of information from the applicable master servicer as described above. If required by any such recalculation, the applicable Appraised-Out Class will be reinstated as the Controlling Class and each Appraised-Out Class will, if applicable, have its related certificate balance notionally restored to the extent required by such recalculation of the Appraisal Reduction Amount or Collateral Deficiency Amount, if applicable. In addition, the Requesting Holders of any Appraised-Out Class will have the right to challenge the Appraisal Reduction Amount and to require the applicable special servicer to order an additional appraisal of any serviced mortgage loan as to which there exists a Collateral Deficiency Amount if an event has occurred at, or with respect to, the related mortgaged property or mortgaged properties that would have a material effect on its or their appraised value, and such special servicer is required to use reasonable efforts to obtain an appraisal from an MAI appraiser reasonably acceptable to such special servicer within 30 days from receipt of the Requesting Holders’ written request. |
Sale of Defaulted Loans: | Under certain circumstances the applicable special servicer may be required to use reasonable efforts to solicit offers for a defaulted serviced mortgage loan (and any related companion loan (to the extent provided under the related intercreditor agreement) and/or related REO properties).
The Directing Certificateholder will not have a right of first refusal to purchase a defaulted loan. If the applicable special servicer does not receive an offer at least equal to the outstanding principal balance plus all accrued and unpaid interest and outstanding costs and expenses and certain other amounts specified in the pooling and servicing agreement (the “Par Purchase Price”), the applicable special servicer may purchase the defaulted loan or REO property at the Par Purchase Price or may accept the first cash offer received from any person that is determined to be a fair price for such defaulted loan or REO property. If multiple offers are received during the period designated by the applicable special servicer for receipt of offers, such special servicer is generally required to select the highest offer. The applicable special servicer will be required to determine whether any cash offer constitutes a fair price for any defaulted loan or REO property if the highest offeror is a person other than a party to the pooling and servicing agreement for this transaction (the “PSA”), the Directing Certificateholder, the Risk Retention Consultation Party, any sponsor, any Borrower Party, any independent contractor engaged by a special servicer, the trustee for the securitization of a related companion loan (with respect to a whole loan if it is a defaulted loan), any related companion loan holder or its representative, any holder of a related mezzanine loan or any known affiliate of any of the preceding entities (each, an “Interested Person”). If an offer is made by an Interested Person, the trustee will be required to determine (based upon the most recent appraisal conducted in accordance with the terms of the PSA) whether the offer constitutes a fair price for the defaulted loan or REO property unless (i) the offer is equal to or greater than the applicable Par Purchase Price and (ii) the offer is the highest offer received. Absent an offer at least equal to the Par Purchase Price, no offer from an Interested Person will constitute a fair price unless (x) it is the highest offer received and (y) at least two other offers are received from independent third parties. Neither the trustee nor any of its affiliates may make an offer for or purchase any specially serviced loan or REO property. Notwithstanding any of the foregoing to the contrary, the applicable special servicer is not required to accept the highest offer and may accept a lower offer for a defaulted loan or REO property if such special servicer determines, in accordance with the Servicing Standard (and subject to the requirements of any related intercreditor agreement), that a rejection of such offer would be in the best interests of the certificateholders and any related companion loan holders as a collective whole as if they constituted a single lender (and with respect to a serviced A/B whole loan, taking into account the subordinate nature of any related subordinate companion loan), so long as such lower offer was not made by such special servicer or any of its affiliates. If title to any mortgaged property is acquired by the trust fund, the applicable special servicer will generally be required to sell such mortgaged property prior to the close of the third calendar year beginning after the year of acquisition. |
| This is not a research report and was not prepared by any Underwriter’s research department. Please see additional important information and qualifications at the end of this Term Sheet. |
T-15
BANK 2020-BNK26 | Structural Overview |
| The foregoing applies to mortgage loans serviced under the PSA. With respect to any non-serviced whole loan, if the special servicer under the applicable pooling and servicing agreement determines to sell the related controlling companion loan if it becomes a defaulted loan, then the applicable special servicer will be required to sell the related whole loan, including the related mortgage loan included in the BANK 2020-BNK26 securitization trust and the related pari passu companion loan(s) and, under certain circumstances, any subordinate companion loan(s), as a single loan. In connection with any such sale, the special servicer under the applicable pooling and servicing agreement will be required to follow procedures substantially similar to those set forth above. |
Risk Retention Consultation Party: | A risk retention consultation party may be appointed by the holder or holders of more than 50% of the RR Interest, by certificate balance. The majority RR Interest holder will have a continuing right to appoint, remove or replace the risk retention consultation party in its sole discretion. This right may be exercised at any time and from time to time. Except with respect to an Excluded Loan as to such party or the holder of the majority of the RR Interest, the risk retention consultation party will be entitled to consult with the applicable special servicer, upon request of the risk retention consultation party, with respect to certain material servicing actions proposed by such special servicer; provided, that prior to the occurrence and continuance of a Consultation Termination Event, such mortgage loan must also be a specially serviced mortgage loan. |
Appointment and Replacement of each Special Servicer: |
The Directing Certificateholder will appoint each initial special servicer as of the Closing Date. Prior to the occurrence and continuance of a Control Termination Event, any special servicer may generally be replaced by the Directing Certificateholder (a) for cause at any time and (b) without cause if (i) LNR Partners, LLC or its affiliate is not the special servicer that will be replaced or (ii) LNR Securities Holdings, LLC or its affiliate owns less than 15% of the then controlling class of certificates. After the occurrence and during the continuance of a Control Termination Event and upon (a) the written direction of holders of principal balance certificates evidencing not less than 25% of the voting rights of all classes of certificates (other than the RR Interest) entitled to principal (taking into account the application of Cumulative Appraisal Reduction Amounts to notionally reduce the certificate balances of classes to which such Cumulative Appraisal Reduction Amounts are allocable) requesting a vote to replace the applicable special servicer with a replacement special servicer, (b) payment by such requesting holders to the certificate administrator of all reasonable fees and expenses to be incurred by the certificate administrator in connection with administering such vote and (c) delivery by such holders of a rating agency confirmation from each applicable rating agency, the certificate administrator will be required to promptly post such notice on its internet website and by mail and conduct the solicitation of votes of all certificates in such regard, which requisite affirmative votes must be received within 180 days of the posting of such notice. Upon the written direction of holders of at least 66 2/3% of a Certificateholder Quorum, the trustee will be required to immediately replace the applicable special servicer with a qualified replacement special servicer designated by such holders of certificates. After the occurrence and during the continuance of a Consultation Termination Event, if the operating advisor determines that the applicable special servicer is not performing its duties as required under the pooling and servicing agreement or is otherwise not acting in accordance with the Servicing Standard, the operating advisor may also recommend the replacement of such special servicer. The operating advisor’s recommendation to replace such special servicer must be confirmed by an affirmative vote of holders of principal balance certificates evidencing at least a majority of the aggregate voting rights (taking into account the application of any Cumulative Appraisal Reduction Amounts to notionally reduce the respective certificate balances) of all principal balance certificates on an aggregate basis (which requisite affirmative vote must be received within 180 days of posting of the notice of the operating advisor’s recommendation to the certificate administrator’s website). A “Certificateholder Quorum” means, in connection with any solicitation of votes in connection with the replacement of a special servicer or the asset representations reviewer, the holders of certificates evidencing at least 50% of the aggregate voting rights (taking into account the application of realized losses and, other than with respect to the termination of the asset representations reviewer, any Cumulative Appraisal Reduction Amounts to notionally reduce the certificate balance of the certificates) of all classes of certificates entitled to principal (other than the RR Interest) on an aggregate basis. With respect to each serviced whole loan, any holder of a related pari passu companion loan, following a servicer termination event with respect to the applicable special servicer that affects such holder, will be entitled to direct the trustee (and the trustee will be required) to terminate such special servicer solely with respect to such serviced whole loan. A replacement special servicer will be selected by the trustee or, prior to a Control Termination Event, by the Directing Certificateholder; provided, that any successor special servicer appointed to replace the special servicer with respect to such whole loan cannot be the entity (or its affiliate) that was terminated at the direction of the holder of the related pari passu companion loan. Notwithstanding any of the foregoing to the contrary, with respect to each servicing shift whole loan and any serviced A/B whole loans as to which a subordinate companion loan holder is the related controlling note holder, the holder of the related control note will be entitled to replace the applicable special servicer with respect to such whole loan at any time, with or without cause, and while it is a serviced whole loan, no other party may replace the applicable special servicer for such whole loan unless there is a servicer termination event with respect thereto. With respect to any non-serviced whole loan, subject to conditions or restrictions in the applicable intercreditor agreement, the BANK 2020-BNK26 trust, as holder of the related mortgage loan, has the right to terminate the applicable special servicer under the related pooling and servicing agreement if a servicer termination event occurs, with respect to such special servicer that affects the trust in its capacity as such holder. Such rights |
| This is not a research report and was not prepared by any Underwriter’s research department. Please see additional important information and qualifications at the end of this Term Sheet. |
T-16
BANK 2020-BNK26 | Structural Overview |
| may be exercised by the Directing Certificateholder prior to a Consultation Termination Event (or the applicable special servicer, following the occurrence and during the continuance of a Consultation Termination Event). The successor special servicer will be selected pursuant to the applicable pooling and servicing agreement by the related directing holder prior to a control termination event under such pooling and servicing agreement. |
Servicing Standard: | Each applicable master servicer and each applicable special servicer is obligated to service and administer the mortgage loans (and, if applicable, the serviced companion loans) in accordance with the definition of the “Servicing Standard” described in the Preliminary Prospectus and the terms of the pooling and servicing agreement, provided that each non-serviced mortgage loan, if any, will be serviced by another master servicer or special servicer under the pooling and servicing agreement with respect to the securitization of a related companion loan, which entities will be obligated to service and administer such non-serviced mortgage loan pursuant to a similar standard set forth in the related pooling and servicing agreement. |
Excluded Special Servicer: | If a special servicer obtains knowledge that it has become a Borrower Party with respect to any mortgage loan (an “Excluded Special Servicer Loan”), such special servicer will be required to resign as special servicer of that Excluded Special Servicer Loan. Prior to the occurrence and continuance of a Control Termination Event, the Directing Certificateholder will be required to use reasonable efforts to appoint (and may remove and replace with or without cause) a separate special servicer that is not a Borrower Party (an “Excluded Special Servicer”) with respect to any Excluded Special Servicer Loan, unless such Excluded Special Servicer Loan is also an Excluded Loan with respect to the Directing Certificateholder or the holder of the majority of the Controlling Class. After the occurrence and during the continuance of a Control Termination Event, if at any time the applicable Excluded Special Servicer Loan is also an Excluded Loan with respect to the Directing Certificateholder or the holder of the majority of the Controlling Class or if the Directing Certificateholder is entitled to appoint the Excluded Special Servicer but does not so appoint within 30 days of notice of such resignation, the resigning special servicer will be required to use reasonable efforts to select the related Excluded Special Servicer. Any Excluded Special Servicer will be required to perform all of the obligations of the applicable special servicer and will be entitled to all special servicing compensation with respect to such Excluded Special Servicer Loan earned while the related mortgage loan is an Excluded Special Servicer Loan. |
Liquidated |
On liquidation of any mortgage loan, all net liquidation proceeds related to the mortgage loan (but not any related companion loan) will be applied so that amounts allocated as a recovery of accrued and unpaid interest will not, in the first instance, include any delinquent interest that was not advanced as a result of Appraisal Reduction Amounts (or would not have been advanced in the absence of a non-recoverability determination) or accrued on the portion of the stated principal balance thereof equal to any related Collateral Deficiency Amount in effect from time to time and as to which no advance was made (collectively, the “Subordinated Interest Amount”). After the adjusted interest amount is so allocated, any remaining liquidation proceeds will be allocated to pay principal on the mortgage loan until the unpaid principal amount of the mortgage loan has been reduced to zero. Any remaining liquidation proceeds will then be allocated to pay the Subordinated Interest Amount. |
Operating Advisor: | The operating advisor will be required to perform certain review duties if a Control Termination Event has occurred and is continuing, which will generally include a limited annual review of, and the preparation of a report regarding, certain actions of the applicable special servicer with respect to the resolution and/or liquidation of specially serviced loans. The review and report generally will be based on any asset status reports and additional information delivered to the operating advisor by such special servicer. In addition, if a Control Termination Event has occurred and is continuing, the applicable special servicer must consult with the operating advisor (in addition to the Directing Certificateholder if no Consultation Termination Event has occurred and is continuing) in connection with major decisions with respect to mortgage loans. Furthermore, under certain circumstances, but only if a Consultation Termination Event has occurred and is continuing, the operating advisor may recommend the replacement of the applicable special servicer as described above under “—Appointment and Replacement of each Special Servicer”; however, the operating advisor will not have any rights or obligations with respect to a non-serviced whole loan. If a Consultation Termination Event has occurred and is continuing, the operating advisor may be removed and replaced without cause upon the affirmative direction of certificates owners holding not less than 75% of the voting rights of all certificates (taking into account the application of Cumulative Appraisal Reduction Amounts), following a proposal from certificate owners holding not less than 25% of the voting rights of all certificates (taking into account the application of Cumulative Appraisal Reduction Amounts). The certificateholders who initiate a vote on a termination and replacement of the operating advisor without cause must cause the payment of the fees and expenses incurred in the replacement. In addition, in the event there are no classes of certificates outstanding other than the Control Eligible Certificates, the RR Interest and the Class X-F, Class X-G, Class X-H, Class V and Class R certificates, then all of the rights and obligations of the operating advisor under the PSA will terminate without payment of any penalty or termination fee (other than any rights or obligations that accrued prior to the date of such termination (including accrued and unpaid compensation) and other than indemnification rights arising out of events occurring prior to such termination). See “Pooling and Servicing Agreement—The Operating Advisor—Termination of the Operating Advisor Without Cause” in the Preliminary Prospectus. |
Asset Representations Reviewer: | The asset representations reviewer will be required to review certain delinquent mortgage loans after a specified delinquency threshold has been met and the required percentage of certificateholders vote to direct a review as described below. The asset representations reviewer will be entitled to the Asset Representations |
| This is not a research report and was not prepared by any Underwriter’s research department. Please see additional important information and qualifications at the end of this Term Sheet. |
T-17
BANK 2020-BNK26 | Structural Overview |
| Reviewer Fee with respect to such review. See “Pooling and Servicing Agreement—The Asset Representations Reviewer” in the Preliminary Prospectus. The certificate administrator will be required to notify certificateholders if the specified delinquency threshold has been met as described in the Preliminary Prospectus under “—The Asset Representations Reviewer”. If certificateholders evidencing not less than 5.0% of the voting rights request a vote to commence an asset review, and if subsequently (i) a majority of those certificateholders who cast votes and (ii) a majority of an Asset Review Quorum authorizes an asset review within 150 days of the request for a vote, the asset representations reviewer will be required to conduct an asset review of delinquent loans. The asset representations reviewer may be terminated and replaced without cause. Upon (i) the written direction of certificateholders evidencing not less than 25% of the voting rights (without regard to the application of any Cumulative Appraisal Reduction Amounts) requesting a vote to terminate and replace the asset representations reviewer with a proposed successor asset representations reviewer that is an eligible asset representations reviewer, and (ii) payment by such holders to the certificate administrator of the reasonable fees and expenses to be incurred by the certificate administrator in connection with administering such vote, the certificate administrator will be required to promptly provide notice to all certificateholders and the asset representations reviewer of such request by posting such notice on its internet website, and by mailing such notice to all certificateholders and the asset representations reviewer. Upon the written direction of certificateholders evidencing at least 75% of a Certificateholder Quorum (without regard to the application of any Cumulative Appraisal Reduction Amounts), the trustee will be required to terminate all of the rights and obligations of the asset representations reviewer under the pooling and servicing agreement (other than any rights or obligations that accrued prior to the date of such termination and other than indemnification rights arising out of events occurring prior to such termination) by written notice to the asset representations reviewer, and the proposed successor asset representations reviewer will be appointed. See “Pooling and Servicing Agreement—The Asset Representations Reviewer” in the Preliminary Prospectus. An “Asset Review Quorum” means, in connection with any solicitation of votes to authorize an Asset Review as described above, the holders of certificates evidencing at least 5.0% of the aggregate voting rights represented by all certificates that have voting rights. |
Dispute Resolution Provisions: | The mortgage loan sellers will be subject to the dispute resolution provisions set forth in the PSA to the extent those provisions are triggered with respect to any mortgage loan sold to the depositor by a mortgage loan seller, and such mortgage loan seller will be obligated under the related mortgage loan purchase agreement to comply with all applicable provisions and to take part in any mediation or arbitration proceedings that may result. Generally, in the event that a Repurchase Request is not “Resolved” within 180 days after the related mortgage loan seller receives such Repurchase Request, then the enforcing servicer will be required to send a notice to the first certificateholder (or beneficial owner) to deliver a certificateholder repurchase request with respect to the mortgage loan (the “Initial Requesting Certificateholder”) (if any) and to the certificate administrator (which will be required to make such notice available to certificateholders via the certificate administrator’s website) indicating the enforcing servicer’s intended course of action with respect to the Repurchase Request. If (a) the enforcing servicer’s intended course of action with respect to the Repurchase Request does not involve pursuing further action to exercise rights against the related mortgage loan seller with respect to the Repurchase Request and the Initial Requesting Certificateholder, if any, or any other certificateholder or certificate owner wishes to exercise its right to refer the matter to mediation (including nonbinding arbitration) or arbitration, or (b) the enforcing servicer’s intended course of action is to pursue further action to exercise rights against the related mortgage loan seller with respect to the Repurchase Request but the Initial Requesting Certificateholder, if any, or any other certificateholder or certificate owner does not agree with the dispute resolution method selected by the enforcing servicer, then the Initial Requesting Certificateholder, if any, or such other certificateholder or certificate owner may deliver a written notice to the enforcing servicer indicating its intent to exercise its right to refer the matter to either mediation or arbitration. “Resolved” means, with respect to a Repurchase Request, (i) that the related material defect or breach has been cured, (ii) the related mortgage loan has been repurchased in accordance with the related mortgage loan purchase agreement, (iii) a mortgage loan has been substituted for the related mortgage loan in accordance with the related mortgage loan purchase agreement, (iv) the applicable mortgage loan seller has made a loss of value payment, (v) a contractually binding agreement has been entered into between the enforcing servicer, on behalf of the issuing entity, and the related mortgage loan seller that settles the related mortgage loan seller’s obligations under the related mortgage loan purchase agreement, or (vi) the related mortgage loan is no longer property of the issuing entity as a result of a sale or other disposition in accordance with the pooling and servicing agreement. See “Pooling and Servicing Agreement—Dispute Resolution Provisions” in the Preliminary Prospectus. |
Investor Communications: | The certificate administrator is required to include on any Form 10-D any request received from a certificateholder to communicate with other certificateholders related to certificateholders exercising their rights under the terms of the PSA. Any certificateholder wishing to communicate with other certificateholders regarding the exercise of its rights under the terms of the PSA will be able to deliver a written request signed by an authorized representative of the requesting investor to the certificate administrator. |
Deal Website: | The certificate administrator will be required to maintain a deal website which will include, among other items: (a) summaries of asset status reports prepared by a special servicer, (b) inspection reports, (c) appraisals, (d) various “special notices” described in the Preliminary Prospectus, (e) the “Investor Q&A Forum” and (f) a voluntary “Investor Registry”. Investors may access the deal website following execution of a certification and confidentiality agreement. |
| This is not a research report and was not prepared by any Underwriter’s research department. Please see additional important information and qualifications at the end of this Term Sheet. |
T-18
| BANK 2020-BNK26 | Collateral Overview |
| Mortgage Loan Sellers | No. of Mortgage Loans | No. of Mortgaged Properties | Aggregate Cut-off Date Balance | % of Pool(1) |
| Morgan Stanley Mortgage Capital Holdings LLC | 23 | 32 | $469,267,051 | 39.1% |
| Bank of America, National Association | 19 | 26 | $433,725,293 | 36.1% |
| Wells Fargo Bank, National Association | 19 | 29 | $244,915,189 | 20.4% |
| National Cooperative Bank, N.A. | 14 | 14 | $52,189,571 | 4.3% |
| Total: | 75 | 101 | $1,200,097,104 | 100.0% |
Pool Statistics
| Aggregate Cut-off Date Balance: | $1,200,097,104 |
| Number of Mortgage Loans: | 75 |
| Average Cut-off Date Balance per Mortgage Loan: | $16,001,295 |
| Number of Mortgaged Properties: | 101 |
| Average Cut-off Date Balance per Mortgaged Property: | $11,882,150 |
| Weighted Average Mortgage Rate: | 3.5017% |
| % of Pool Secured by 5 Largest Mortgage Loans: | 29.3% |
| % of Pool Secured by 10 Largest Mortgage Loans: | 46.9% |
| % of Pool Secured by ARD Loans(3): | 0.0% |
| Weighted Average Original Term to Maturity (months)(3): | 117 |
| Weighted Average Remaining Term to Maturity (months)(3): | 116 |
| Weighted Average Seasoning (months): | 1 |
| % of Pool Secured by Single Tenant Mortgaged Properties: | 7.8% |
| % of Pool Secured by Refinance Loans: | 38.9% |
| % of Pool Secured by Acquisition Loans: | 34.0% |
| % of Pool Secured by Recapitalization Loans: | 23.1% |
| % of Pool Secured by Refinance/Acquisition Loans: | 4.0% |
Additional Debt
| % of Pool withPari Passu Mortgage Debt: | 35.4% |
| % of Pool with Subordinate Mortgage Debt(4): | 17.2% |
Credit Statistics(5)(6)
| Weighted Average UW NOI DSCR: | 3.33x |
| Weighted Average UW NOI Debt Yield(7): | 12.9% |
| Weighted Average UW NCF DSCR: | 3.14x |
| Weighted Average UW NCF Debt Yield(7): | 12.2% |
| Weighted Average Cut-off Date LTV Ratio(7)(8): | 55.2% |
| Weighted Average Maturity Date LTV Ratio(3)(8): | 51.8% |
Footnotes are set forth on the following page.
| This is not a research report and was not prepared by any Underwriter’s research department. Please see additional important information and qualifications at the end of this Term Sheet. |
T-19
| BANK 2020-BNK26 | Collateral Overview |
Amortization
| Weighted Average Original Amortization Term (months)(9): | 358 |
| Weighted Average Remaining Amortization Term (months)(9): | 358 |
| % of Pool Interest Only through Maturity: | 67.8% |
| % of Pool Amortizing Balloon: | 18.2% |
| % of Pool Interest Only followed by Amortizing Balloon: | 14.0% |
Lockboxes
| % of Pool with Springing Lockboxes: | 52.4% |
| % of Pool with Hard Lockboxes: | 40.1% |
| % of Pool with No Lockboxes: | 6.1% |
| % of Pool with Soft Lockboxes: | 1.4% |
Reserves
| % of Pool Requiring Tax Reserves: | 68.1% |
| % of Pool Requiring Insurance Reserves: | 24.7% |
| % of Pool Requiring Replacement Reserves: | 68.1% |
| % of Pool Requiring TI/LC Reserves(10): | 79.0% |
Call Protection
| % of Pool with lockout period, followed by defeasance until open period: | 64.3% |
| % of Pool with lockout period, followed by the greater of a prepayment premium and yield maintenance until open period: | 17.9% |
| % of Pool with lockout period, followed by defeasance or the greater of a prepayment premium and yield maintenance until open period: | 10.6% |
| % of Pool with no lockout period. Greater of a prepayment premium and yield maintenance followed by prepayment premium until open period: | 4.3% |
| % of Pool with no lockout period. The greater of a prepayment premium and yield maintenance, followed by defeasance or the greater of a prepayment premium and yield maintenance until open period: | 2.9% |
| (1) | Unless otherwise indicated, all references to “% of Pool” in this Term Sheet reflect a percentage of the aggregate principal balance of the mortgage pool as of the Cut-off Date, after application of all payments of principal due during or prior to March 2020. |
| (2) | Eight (8) of the fourteen (14) mortgage loans for which National Cooperative Bank, N.A. is the mortgage loan seller were originated by its parent company, National Consumer Cooperative Bank, and transferred to National Cooperative Bank, N.A. Each such mortgage loan originated by National Consumer Cooperative Bank was underwritten pursuant to National Cooperative Bank, N.A.’s underwriting guidelines. |
| (3) | With respect to any ARD Loan, unless otherwise indicated, references in this Term Sheet to the applicable “maturity date” or “maturity” refer to the applicable anticipated repayment date with respect to such ARD Loan, and such applicable anticipated repayment date is treated as its maturity date for all purposes hereof. |
| (4) | Twelve (12) of the mortgage loans, each of which is secured by a residential cooperative property, currently have in place subordinate secured lines of credit to the related mortgage borrowers that permit future advances (such loans, collectively, the “Subordinate Coop LOCs”). The percentage figure expressed as “% of Pool with Subordinate Mortgage Debt” is determined as a percentage of the initial pool balance and does not take into account any Subordinate Coop LOCs and future subordinate debt (whether or not secured by the mortgaged property), if any, that may be permitted under the terms of any mortgage loan or the pooling and servicing agreement. See “Description of the Mortgage Pool—Additional Indebtedness—Other Secured Indebtedness”and“Description of the Mortgage Pool—Additional Debt Financing for Mortgage Loans Secured by Residential Cooperatives” in the Preliminary Prospectus. |
| (5) | With respect to any mortgage loan that is part of a whole loan, unless otherwise indicated, all LTV, DSCR and Debt Yield calculations in this Term Sheet include any relatedpari passu companion loans and exclude any subordinate companion loans, as applicable. Additionally, LTV, DSCR and Debt Yield figures in this Term Sheet are calculated for mortgage loans without regard to any additional indebtedness that may be incurred at a future date. For mortgaged properties securing residential cooperative mortgage loans all LTV, DSCR and Debt Yield calculations do not take into account any subordinate debt (whether or not secured by the related mortgaged property), that currently exists or is allowed under the terms of any mortgage loan. With respect to any leased fee loans, the SF/Units and Balance per SF/Unit figures in this Term Sheet are based on the size of the non-collateral improvements. |
| (6) | For mortgaged properties securing residential cooperative mortgage loans, all DSCR and Debt Yield calculations for each such mortgaged property is calculated using underwritten net operating Income or underwritten net cash flow, as applicable, for the related residential cooperative property which is the projected net operating income or net cash flow, as applicable, reflected in the most recent appraisal obtained by or otherwise in the possession of the related mortgage loan seller as of the Cut-off Date. All LTV ratio calculations are based upon the appraised value of the residential cooperative property determined as if such residential cooperative property is operated as a residential cooperative, inclusive of the amount of the underlying debt encumbering such residential cooperative property. |
| (7) | With respect to certain mortgage loans, debt yields and LTVs (such as, for example, UW NOI Debt Yield, UW NCF Debt Yield or Cut-off Date LTV Ratio) have been calculated based on a principal balance that is net of a holdback or earnout reserve. Such mortgage loans are identified under the definitions of “Underwritten NOI Debt Yield”, “Underwritten NCF Debt Yield” and “Cut-off Date LTV Ratio” set forth under “Description of the Mortgage Pool—Certain Calculations and Definitions” in the Preliminary Prospectus. |
| (8) | The LTV ratios set forth in this Term Sheet are generally based on the “as-is” values of the related mortgaged properties; provided that the “as-is” value for a portfolio of mortgaged properties may include a premium relating to the valuation of the mortgaged properties as a whole rather than as the sum of individually valued mortgaged properties; provided, further, that such LTV ratios may be based on “as-stabilized”, “as complete” or other contingent values in certain cases in which reserves have been established at origination for the applicable condition or circumstance that is expected to result in stabilization provided, further, that such LTV ratios may have been calculated based on a principal balance that is net of a holdback or earnout reserve. See the definition of “Appraised Value” under“Description of the Mortgage Pool—Certain Calculations and Definitions”in the Preliminary Prospectus. |
| (9) | Excludes mortgage loans that provide for payments of interest only through the related maturity date or anticipated repayment date, as applicable. |
| (10) | Excludes hospitality, multifamily, manufactured housing, leased fee and self storage properties. |
| This is not a research report and was not prepared by any Underwriter’s research department. Please see additional important information and qualifications at the end of this Term Sheet. |
T-20
| BANK 2020-BNK26 | Characteristics of the Mortgage Loans |
| Top 10 Mortgage Loans or Groups of Cross-Collateralized Mortgage Loans(1) | |||||||||||||
| Loan No. | Mortgage Loan Seller | Property Name | City | State | Property Type | Cut-off Date Balance | % of Pool | SF/Units/ Rooms | Cut-off Date Balance per SF/Unit/Room | UW NCF DSCR | UW NOI Debt Yield | Cut-off Date LTV | Maturity Date LTV |
| 1 | MSMCH | FTERE Bronx Portfolio 3 | Bronx | NY | Multifamily | $76,680,000 | 6.4% | 526 | $145,779.47 | 2.06x | 7.8% | 67.3% | 67.3% |
| 2 | BANA | Bravern Office Commons | Bellevue | WA | Office | $75,000,000 | 6.2% | 749,694 | $304.12 | 4.53x | 15.3% | 37.7% | 37.7% |
| 3 | BANA | 560 Mission Street | San Francisco | CA | Office | $70,000,000 | 5.8% | 668,149 | $449.00 | 5.23x | 14.2% | 35.6% | 35.6% |
| 4 | MSMCH | 200 West 57th Street | New York | NY | Office | $70,000,000 | 5.8% | 171,395 | $670.96 | 1.93x | 7.5% | 62.2% | 62.2% |
| 5 | MSMCH | 545 Washington Boulevard | Jersey City | NJ | Office | $60,000,000 | 5.0% | 866,706 | $290.30 | 2.50x | 8.8% | 61.4% | 61.4% |
| 6 | WFB | 55 Hudson Yards | New York | NY | Office | $56,700,000 | 4.7% | 1,431,212 | $660.28 | 3.54x | 11.0% | 39.4% | 39.4% |
| 7 | BANA | AD1 Hotel Portfolio | Various | Various | Hospitality | $48,000,000 | 4.0% | 708 | $67,796.61 | 1.89x | 13.0% | 64.4% | 52.5% |
| 8 | WFB | 1633 Broadway | New York | NY | Office | $40,000,000 | 3.3% | 2,561,512 | $390.78 | 3.84x | 11.9% | 41.7% | 41.7% |
| 9 | MSMCH | Bellagio Hotel and Casino | Las Vegas | NV | Hospitality | $35,000,000 | 2.9% | 3,933 | $426,188.66 | 8.42x | 28.3% | 39.3% | 39.3% |
| 10 | BANA | F Street and K Street Office Portfolio | Washington | DC | Office | $31,200,000 | 2.6% | 124,667 | $250.27 | 2.08x | 8.3% | 63.4% | 63.4% |
| Total/Wtd. Avg. | $562,580,000 | 46.9% | 3.47x | 12.0% | 51.3% | 50.3% | |||||||
| (1) | With respect to any mortgage loan that is part of a whole loan, unless otherwise indicated, all LTV, DSCR, Debt Yield and Cut-off Date Balance per SF/Unit/Room calculations in this Term Sheet include any relatedpari passu companion loans and exclude any subordinate companion loans, as applicable. Additionally, LTV, DSCR, Debt Yield and Cut-off Date Balance per SF/Unit/Room figures in this Term Sheet are calculated for mortgage loans without regard to any additional indebtedness that may be incurred at a future date. With respect to any leased fee loans, the SF/Units/Rooms and Balance per SF/Unit/Rooms figures in this Term Sheet are based on the size of the non-collateral improvements. |
| This is not a research report and was not prepared by any Underwriter’s research department. Please see additional important information and qualifications at the end of this Term Sheet. |
T-21
| BANK 2020-BNK26 | Characteristics of the Mortgage Loans |
| Mortgage Loans with Pari Passu Companion Loans | ||||||||||||
| Loan No. | Mortgage Loan Seller | Property Name | Mortgage Loan Cut-off Date Balance | Aggregate Pari Passu Companion Loan Cut-off Date Balance | Combined Cut-off Date Balance | Lead Servicing Agreement | Master Servicer | Special Servicer | Control Rights | Combined UW NCF DSCR(1) | Combined UW NOI Debt Yield(1) | Combined Cut-off Date LTV(1) |
| 2 | BANA | Bravern Office Commons | $75,000,000 | $153,000,000 | $228,000,000 | BAML 2020-BOC | Wells Fargo | Wells Fargo | BAML 2020-BOC | 4.53x | 15.3% | 37.7% |
| 3 | BANA | 560 Mission Street | $70,000,000 | $230,000,000 | $300,000,000 | BMARK 2020-B16 | Midland | KeyBank | BMARK 2020-B16 | 5.23x | 14.2% | 35.6% |
| 4 | MSMCH | 200 West 57th Street | $70,000,000 | $45,000,000 | $115,000,000 | BANK 2020-BNK26 | Wells Fargo | LNR | BANK 2020-BNK26 | 1.93x | 7.5% | 62.2% |
| 5 | MSMCH | 545 Washington Boulevard | $60,000,000 | $191,606,250 | $251,606,250 | BANK 2020-BNK25 | Wells Fargo | KeyBank | BANK 2020-BNK25 | 2.50x | 8.8% | 61.4% |
| 6 | WFB | 55 Hudson Yards | $56,700,000 | $888,300,000 | $945,000,000 | HY 2019-55HY | Wells Fargo | CWCapital | HY 2019-55HY | 3.54x | 11.0% | 39.4% |
| 8 | WFB | 1633 Broadway | $40,000,000 | $961,000,000 | $1,001,000,000 | BWAY 2019-1633 | KeyBank | Situs | BWAY 2019-1633(2) | 3.84x | 11.9% | 41.7% |
| 9 | MSMCH | Bellagio Hotel and Casino | $35,000,000 | $1,641,200,000 | $1,676,200,000 | BX 2019-OC11 | KeyBank | Situs | BX 2019-OC11 | 8.42x | 28.3% | 39.3% |
| 21 | WFB | Giant Anchored Portfolio | $18,500,000 | $78,500,000 | $97,000,000 | CGCMT 2019-C7 | Wells Fargo | Midland | CGCMT 2019-C7 | 1.52x | 9.1% | 74.3% |
| (1) | DSCR, Debt Yield and LTV calculations include any relatedpari passu companion loans and exclude any subordinate companion loans, as applicable. |
| (2) | During the continuance of a control shift event relating to the BWAY 2019-1633 securitization transaction, Note A-1-C-1 will be the controlling note and the holder thereof (or the directing certificateholder (or other designated party) of a securitization of Note A-1-C-1) will have the applicable control rights. |
| This is not a research report and was not prepared by any Underwriter’s research department. Please see additional important information and qualifications at the end of this Term Sheet. |
T-22
| BANK 2020-BNK26 | Characteristics of the Mortgage Loans |
| Mortgage Loans with Subordinate Debt(1) | |||||||||||
| Loan No. | Mortgage Loan Seller | Property Name | Mortgage Loan Cut-off Date Balance | Cut-off Date Balance per Unit/SF | Subordinate Debt Cut-off Date Balance | UW NCF DSCR | UW NOI Debt Yield | Cut-off Date LTV | Whole Loan UW NCF DSCR(2) | Whole Loan UW NOI Debt Yield(2) | Whole Loan Cut-off Date LTV(2) |
| 2 | BANA | Bravern Office Commons | $75,000,000 | $304.12 | $76,000,000 | 4.53x | 15.3% | 37.7% | 3.40x | 11.5% | 50.2% |
| 6 | WFB | 55 Hudson Yards | $56,700,000 | $660.28 | $300,000,000 | 3.54x | 11.0% | 39.4% | 2.69x | 8.3% | 51.9% |
| 8 | WFB | 1633 Broadway | $40,000,000 | $390.78 | $249,000,000 | 3.84x | 11.9% | 41.7% | 3.08x | 9.5% | 52.1% |
| 9 | MSMCH | Bellagio Hotel and Casino | $35,000,000 | $426,188.66 | $1,333,800,000 | 8.42x | 28.3% | 39.3% | 4.06x | 15.7% | 70.7% |
| (1) | In addition, twelve (12) of the mortgage loans, each of which is secured by a residential cooperative property, currently have in place Subordinate Coop LOCs that permit future advances. See “Description of the Mortgage Pool—Additional Indebtedness—Other Secured Indebtedness” and “Description of the Mortgage Pool—Additional Debt Financing for Mortgage Loans Secured by Residential Cooperatives” in the Preliminary Prospectus. |
| (2) | Whole Loan UW NCF DSCR, Whole Loan UW NOI Debt Yield and Whole Loan Cut-off Date LTV figures shown above are calculated based on any relatedpari passunotes and any related subordinate note(s). |
| This is not a research report and was not prepared by any Underwriter’s research department. Please see additional important information and qualifications at the end of this Term Sheet. |
T-23
| BANK 2020-BNK26 | Characteristics of the Mortgage Loans |
Mortgage Loans with Scheduled Balloon Payments and Related Classes(1)
| Class A-2 ($95,000,000) | ||||||||||||||||
| Loan No. | Mortgage Loan Seller | Property Name | State | Property Type | Cut-off Date Balance | % of Pool | Maturity Date Balance | % of Class A-2 Certificate Principal Balance | SF | Cut-off Date Balance per SF | UW NCF DSCR | UW NOI Debt Yield | Cut-off Date LTV | Maturity Date LTV | Rem. IO Period (mos.) | Rem. Term to Maturity (mos.) |
| 2 | BANA | Bravern Office Commons | WA | Office | $75,000,000 | 6.2% | $75,000,000 | 78.9% | 749,694 | $304.12 | 4.53x | 15.3% | 37.7% | 37.7% | 82 | 82 |
| 15 | MSMCH | Prince William Square | VA | Retail | $25,000,000 | 2.1% | $25,000,000 | 26.3% | 232,957 | $107.32 | 3.07x | 11.8% | 64.8% | 64.8% | 83 | 83 |
| Total/Wtd. Avg. | $100,000,000 | 8.3% | $100,000,000 | 105.3% | 4.17x | 14.4% | 44.5% | 44.5% | 82 | 82 | ||||||
| (1) | The table above reflects the mortgage loans whose balloon payments will be applied to pay down the Class A-2 certificates, assuming (i) that none of the mortgage loans experience prepayments, defaults or losses; (ii) there are no extensions of maturity dates; and (iii) each mortgage loan is paid in full on its stated maturity date or, in the case of any mortgage loan with an anticipated repayment date, on such anticipated repayment date. The table above is otherwise based on the Structuring Assumptions set forth under “Yield and Maturity Considerations—Weighted Average Life” in the Preliminary Prospectus. |
| This is not a research report and was not prepared by any Underwriter’s research department. Please see additional important information and qualifications at the end of this Term Sheet. |
T-24
| BANK 2020-BNK26 | Characteristics of the Mortgage Loans |
| Prior Securitization History(1) | ||||||||||||||
| Loan No. | Mortgage Loan Seller | Property Name | City | State | Property Type | Cut-off Date Balance | % of Pool | SF/Units/ Rooms | Cut-off Date Balance per SF/Unit/Room(3) | UW NCF DSCR(2)(3) | UW NOI Debt Yield(2)(3) | Cut-off Date LTV(2)(3) | Maturity Date LTV(2)(3) | Prior Securitization |
| 7.05 | BANA | Wyndham Garden Tallahassee Capitol | Tallahassee | FL | Hospitality | $7,672,000 | 0.6% | 148 | $67,796.61 | 1.89x | 13.0% | 64.4% | 52.5% | S2H 2012-LV1 |
| 16 | BANA | Pacific Plaza Tacoma | Tacoma | WA | Office | $23,250,000 | 1.9% | 104,871 | $221.70 | 2.62x | 10.1% | 63.4% | 63.4% | MSC 2011-C2 |
| 23 | MSMCH | University Marketplace | Pembroke Pines | FL | Retail | $16,550,000 | 1.4% | 125,604 | $131.76 | 1.79x | 10.8% | 68.1% | 57.2% | CGCMT 2014-GC21 |
| 27 | WFB | Southeast Retail Portfolio | Various | Various | Retail | $11,981,189 | 1.0% | 236,766 | $50.60 | 1.85x | 11.7% | 73.1% | 58.1% | COMM 2015-CCRE22 |
| 32 | WFB | Bradenton Cascade Office Portfolio | Various | OH | Office | $10,256,602 | 0.9% | 207,917 | $49.33 | 1.74x | 11.6% | 71.1% | 56.9% | WFCM 2014-LC18 |
| 68 | NCB | 214 Clinton St./147 Pacific St. Owners Corp. | Brooklyn | NY | Multifamily | $2,800,000 | 0.2% | 34 | $82,352.94 | 6.66x | 23.2% | 14.0% | 14.0% | WFCM 2014-LC18 |
| Total | $72,509,791 | 6.0% | ||||||||||||
| (1) | Includes mortgage loans for which all or a portion of the previously existing debt was most recently securitized in conduit securitizations, based on information provided by the related borrower or obtained through searches of a third-party database. The information has not otherwise been confirmed by the mortgage loan sellers. With respect to any mortgage loan that is part of a whole loan, unless otherwise indicated, all LTV, DSCR, Debt Yield and Cut-off Date Balance per SF/Unit/Room calculations include any relatedpari passucompanion loans and exclude any related subordinate companion loans, as applicable. |
| (2) | For mortgaged properties securing residential cooperative mortgage loans, the UW NCF DSCR and UW NOI Debt Yield for each such mortgaged property is calculated using underwritten net operating income or underwritten net cash flow, as applicable, for the related residential cooperative property which is the projected net operating income or net cash flow, as applicable, reflected in the most recent appraisal obtained by or otherwise in the possession of the related mortgage loan seller as of the Cut-off Date. LTV calculations are based upon the appraised value of the residential cooperative property determined as if such residential cooperative property is operated as a residential cooperative, inclusive of the amount of the underlying debt encumbering such residential cooperative property. |
| (3) | For properties that are part of a portfolio, the Cut-off Date Balance Per SF/Unit/Room, UW NCF DSCR, UW NOI Debt Yield, Cut-off Date LTV and Maturity Date LTV calculations reflect the values of the portfolio as a whole. |
| This is not a research report and was not prepared by any Underwriter’s research department. Please see additional important information and qualifications at the end of this Term Sheet. |
T-25
| BANK 2020-BNK26 | Collateral Overview |
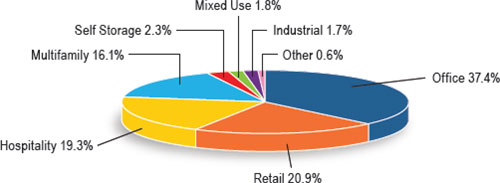
| Property Type Distribution(1) | ||||||||
| Property Type | Number of Mortgaged Properties | Aggregate Cut-off Date Balance | % of Pool | Wtd. Avg. Mortgage Rate | Wtd. Avg. UW NCF DSCR | Wtd. Avg. UW NOI Debt Yield | Wtd. Avg. Cut-off Date LTV | Wtd. Avg. Maturity Date LTV |
| Office | 15 | $448,281,602 | 37.4% | 3.2113% | 3.41x | 11.3% | 49.4% | 49.1% |
| CBD | 9 | $426,150,000 | 35.5% | 3.1782% | 3.45x | 11.2% | 48.6% | 48.6% |
| Suburban | 6 | $22,131,602 | 1.8% | 3.8482% | 2.63x | 12.5% | 64.9% | 58.3% |
| Retail | 30 | $250,631,605 | 20.9% | 3.7573% | 2.15x | 10.8% | 66.9% | 60.4% |
| Anchored | 16 | $148,665,805 | 12.4% | 3.6339% | 2.34x | 11.2% | 66.0% | 61.1% |
| Unanchored | 9 | $58,717,636 | 4.9% | 4.0286% | 1.89x | 10.2% | 67.1% | 59.1% |
| Shadow Anchored | 4 | $38,058,164 | 3.2% | 3.7767% | 1.83x | 10.5% | 70.7% | 60.0% |
| Single Tenant | 1 | $5,190,000 | 0.4% | 4.0800% | 1.90x | 8.1% | 61.5% | 61.5% |
| Hospitality | 17 | $231,201,181 | 19.3% | 3.6086% | 3.79x | 17.7% | 55.1% | 46.9% |
| Full Service | 4 | $72,967,000 | 6.1% | 3.3971% | 6.10x | 22.6% | 46.3% | 44.3% |
| Select Service | 5 | $72,450,000 | 6.0% | 3.3863% | 3.56x | 18.1% | 51.2% | 42.1% |
| Extended Stay | 4 | $51,989,122 | 4.3% | 4.0195% | 1.97x | 12.9% | 66.8% | 53.8% |
| Limited Service | 4 | $33,795,059 | 2.8% | 3.9093% | 2.13x | 13.9% | 64.6% | 52.1% |
| Multifamily | 27 | $193,169,571 | 16.1% | 3.5902% | 3.35x | 14.4% | 52.9% | 52.3% |
| Mid Rise | 12 | $112,680,000 | 9.4% | 3.6458% | 1.99x | 7.5% | 66.4% | 66.4% |
| Cooperative | 14 | $52,189,571 | 4.3% | 3.3077% | 7.11x | 32.7% | 14.5% | 12.3% |
| Garden | 1 | $28,300,000 | 2.4% | 3.8900% | 1.85x | 7.7% | 69.7% | 69.7% |
| Self Storage | 4 | $27,136,000 | 2.3% | 3.8707% | 2.01x | 9.0% | 64.5% | 62.1% |
| Self Storage | 4 | $27,136,000 | 2.3% | 3.8707% | 2.01x | 9.0% | 64.5% | 62.1% |
| Mixed Use | 3 | $21,890,252 | 1.8% | 3.8819% | 2.07x | 9.3% | 61.9% | 59.0% |
| Office/Industrial | 1 | $10,900,000 | 0.9% | 3.9080% | 2.19x | 8.8% | 68.1% | 68.1% |
| Office/Retail/Residential | 1 | $5,990,252 | 0.5% | 3.6900% | 1.71x | 10.1% | 49.3% | 38.9% |
| Self Storage/Office | 1 | $5,000,000 | 0.4% | 4.0550% | 2.24x | 9.3% | 63.3% | 63.3% |
| Industrial | 4 | $20,298,781 | 1.7% | 3.6628% | 2.98x | 17.7% | 46.5% | 40.2% |
| Flex | 4 | $20,298,781 | 1.7% | 3.6628% | 2.98x | 17.7% | 46.5% | 40.2% |
| Other | 1 | $7,488,112 | 0.6% | 3.8570% | 1.57x | 8.8% | 49.9% | 39.6% |
| Leased Fee | 1 | $7,488,112 | 0.6% | 3.8570% | 1.57x | 8.8% | 49.9% | 39.6% |
| Total/Wtd. Avg. | 101 | $1,200,097,104 | 100.0% | 3.5017% | 3.14x | 12.9% | 55.2% | 51.8% |
| (1) | All numerical information concerning the mortgage loans is approximate and, in the case of mortgage loans secured by multiple properties, is based on allocated loan amounts with respect to such properties. All weighted average information regarding the mortgage loans reflects the weighting of the mortgage loans based on their outstanding principal balances as of the Cut-off Date or, in the case of mortgage loans secured by multiple properties, allocated loan amounts. The sum of numbers and percentages in columns may not match the “Total” due to rounding. With respect to any mortgage loan that is part of a whole loan, unless otherwise indicated, all LTV, DSCR and Debt Yield calculations include any relatedpari passu companion loans and exclude any related subordinate companion loans, as applicable. For mortgaged properties securing residential cooperative mortgage loans, the UW NCF DSCR and UW NOI Debt Yield for each such mortgaged property is calculated using underwritten net operating income or underwritten net cash flow, as applicable, for the related residential cooperative property which is the projected net operating income or net cash flow, as applicable, reflected in the most recent appraisal obtained by or otherwise in the possession of the related mortgage loan seller as of the Cut-off Date. LTV calculations are based upon the appraised value of the residential cooperative property determined as if such residential cooperative property is operated as a residential cooperative, inclusive of the amount of the underlying debt encumbering such residential cooperative property. |
| This is not a research report and was not prepared by any Underwriter’s research department. Please see additional important information and qualifications at the end of this Term Sheet. |
T-26
| BANK 2020-BNK26 | Collateral Overview |
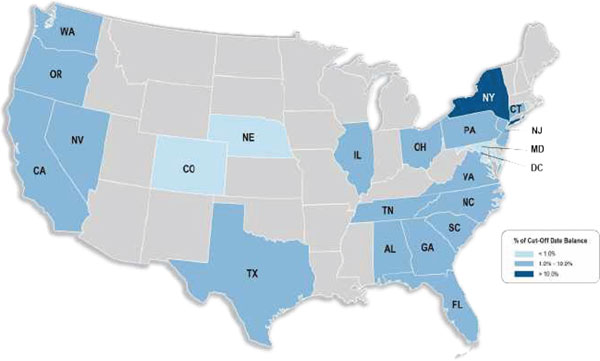
| Geographic Distribution(1) | ||||||||
| State or Other Jurisdiction | Number of Mortgaged Properties | Aggregate Cut-off Date Balance | % of Pool | Wtd. Avg. Mortgage Rate | Wtd. Avg. UW NCF DSCR | Wtd. Avg. UW NOI Debt Yield | Wtd. Avg. Cut-off Date LTV | Wtd. Avg. Maturity Date LTV |
| New York | 28 | $319,443,683 | 26.6% | 3.3577% | 3.28x | 12.5% | 49.4% | 48.9% |
| Washington | 4 | $117,240,000 | 9.8% | 3.3512% | 3.77x | 13.1% | 47.0% | 47.0% |
| Florida | 8 | $102,888,076 | 8.6% | 3.9167% | 2.00x | 11.6% | 66.1% | 57.1% |
| California | 5 | $99,125,000 | 8.3% | 2.8715% | 4.48x | 14.7% | 41.8% | 38.7% |
| California – Northern(2) | 2 | $74,575,000 | 6.2% | 2.6746% | 5.04x | 13.9% | 37.5% | 37.5% |
| California – Southern(2) | 3 | $24,550,000 | 2.0% | 3.4697% | 2.80x | 17.2% | 54.8% | 42.3% |
| Texas | 8 | $83,757,099 | 7.0% | 3.9697% | 1.88x | 9.2% | 68.8% | 63.4% |
| Virginia | 4 | $66,960,000 | 5.6% | 3.4665% | 2.94x | 14.0% | 59.1% | 53.3% |
| North Carolina | 5 | $60,721,234 | 5.1% | 3.5657% | 3.72x | 16.8% | 52.2% | 48.5% |
| New Jersey | 1 | $60,000,000 | 5.0% | 3.4050% | 2.50x | 8.8% | 61.4% | 61.4% |
| Nevada | 2 | $38,900,000 | 3.2% | 3.2794% | 7.74x | 26.5% | 42.3% | 41.3% |
| Ohio | 7 | $37,869,674 | 3.2% | 3.8312% | 2.23x | 13.2% | 66.9% | 54.8% |
| District of Columbia | 2 | $31,200,000 | 2.6% | 3.6220% | 2.08x | 8.3% | 63.4% | 63.4% |
| Oregon | 2 | $28,900,000 | 2.4% | 3.6626% | 1.95x | 10.1% | 70.7% | 66.3% |
| Pennsylvania | 8 | $28,359,616 | 2.4% | 3.9062% | 1.56x | 9.5% | 73.3% | 63.7% |
| Connecticut | 3 | $21,217,281 | 1.8% | 3.7160% | 2.66x | 18.0% | 47.5% | 37.0% |
| Illinois | 2 | $21,017,000 | 1.8% | 3.7500% | 2.02x | 8.0% | 61.0% | 61.0% |
| Georgia | 4 | $19,507,125 | 1.6% | 3.8809% | 2.55x | 16.5% | 62.0% | 50.7% |
| South Carolina | 1 | $15,000,000 | 1.2% | 3.4250% | 5.64x | 21.7% | 44.1% | 44.1% |
| Alabama | 2 | $14,150,000 | 1.2% | 3.7978% | 2.15x | 9.8% | 63.9% | 61.9% |
| Tennessee | 2 | $11,526,064 | 1.0% | 3.9646% | 1.70x | 10.7% | 73.0% | 60.3% |
| Maryland | 1 | $10,100,000 | 0.8% | 3.2300% | 3.69x | 12.7% | 53.4% | 53.4% |
| Nebraska | 1 | $6,225,000 | 0.5% | 3.6350% | 1.88x | 11.9% | 75.0% | 64.4% |
| Colorado | 1 | $5,990,252 | 0.5% | 3.6900% | 1.71x | 10.1% | 49.3% | 38.9% |
| Total/Wtd. Avg. | 101 | $1,200,097,104 | 100.0% | 3.5017% | 3.14x | 12.9% | 55.2% | 51.8% |
| (1) | All numerical information concerning the mortgage loans is approximate and, in the case of mortgage loans secured by multiple properties, is based on allocated loan amounts with respect to such properties. All weighted average information regarding the mortgage loans reflects the weighting of the mortgage loans based on their outstanding principal balances as of the Cut-off Date or, in the case of mortgage loans secured by multiple properties, allocated loan amounts. The sum of numbers and percentages in columns may not match the “Total” due to rounding. With respect to any mortgage loan that is part of a whole loan, unless otherwise indicated, all LTV, DSCR and Debt Yield calculations include any relatedpari passu companion loans and exclude any related subordinate companion loans, as applicable. For mortgaged properties securing residential cooperative mortgage loans, the UW NCF DSCR and UW NOI Debt Yield for each such mortgaged property is calculated using underwritten net operating income or underwritten net cash flow, as applicable, for the related residential cooperative property which is the projected net operating income or net cash flow, as applicable, reflected in the most recent appraisal obtained by or otherwise in the possession of the related mortgage loan seller as of the Cut-off Date. LTV calculations are based upon the appraised value of the residential cooperative property determined as if such residential cooperative property is operated as a residential cooperative, inclusive of the amount of the underlying debt encumbering such residential cooperative property. |
| (2) | “California – Northern” includes zip codes above 93600, and “California – Southern” includes zip codes at or below 93600. |
| This is not a research report and was not prepared by any Underwriter’s research department. Please see additional important information and qualifications at the end of this Term Sheet. |
T-27
| BANK 2020-BNK26 | Collateral Statistics |
Collateral Statistics(1)
Cut-off Date Balance ($)
| No. of Mortgage Loans | Aggregate Cut-off Date Balance ($) | % of Pool | |
| 1,497,494 - 10,000,000 | 42 | 219,683,266 | 18.3 |
| 10,000,001 - 20,000,000 | 15 | 214,728,890 | 17.9 |
| 20,000,001 - 30,000,000 | 8 | 203,104,947 | 16.9 |
| 30,000,001 - 40,000,000 | 3 | 106,200,000 | 8.8 |
| 40,000,001 - 60,000,000 | 3 | 164,700,000 | 13.7 |
| 60,000,001 - 70,000,000 | 2 | 140,000,000 | 11.7 |
| 70,000,001 - 76,680,000 | 2 | 151,680,000 | 12.6 |
| Total: | 75 | $1,200,097,104 | 100.0% |
Min: $1,497,494 Max: $76,680,000 Avg: $16,001,295 | |||
State or Other Jurisdiction(2)
| No. of Mortgaged Properties | Aggregate Cut-off Date Balance ($) | % of Pool | |
| New York | 28 | 319,443,683 | 26.6 |
| Washington | 4 | 117,240,000 | 9.8 |
| Florida | 8 | 102,888,076 | 8.6 |
| California | 5 | 99,125,000 | 8.3 |
| California – Northern(3) | 2 | 74,575,000 | 6.2 |
| California – Southern(3) | 3 | 24,550,000 | 2.0 |
| Texas | 8 | 83,757,099 | 7.0 |
| Virginia | 4 | 66,960,000 | 5.6 |
| North Carolina | 5 | 60,721,234 | 5.1 |
| New Jersey | 1 | 60,000,000 | 5.0 |
| Nevada | 2 | 38,900,000 | 3.2 |
| Ohio | 7 | 37,869,674 | 3.2 |
| District of Columbia | 2 | 31,200,000 | 2.6 |
| Oregon | 2 | 28,900,000 | 2.4 |
| Pennsylvania | 8 | 28,359,616 | 2.4 |
| Connecticut | 3 | 21,217,281 | 1.8 |
| Illinois | 2 | 21,017,000 | 1.8 |
| Georgia | 4 | 19,507,125 | 1.6 |
| South Carolina | 1 | 15,000,000 | 1.2 |
| Alabama | 2 | 14,150,000 | 1.2 |
| Tennessee | 2 | 11,526,064 | 1.0 |
| Maryland | 1 | 10,100,000 | 0.8 |
| Nebraska | 1 | 6,225,000 | 0.5 |
| Colorado | 1 | 5,990,252 | 0.5 |
| Total: | 101 | $1,200,097,104 | 100.0% |
Property Type(2)
| No. of Mortgaged Properties | Aggregate Cut-off Date Balance ($) | % of Pool | |
| Office | 15 | 448,281,602 | 37.4 |
| CBD | 9 | 426,150,000 | 35.5 |
| Suburban | 6 | 22,131,602 | 1.8 |
| Retail | 30 | 250,631,605 | 20.9 |
| Anchored | 16 | 148,665,805 | 12.4 |
| Unanchored | 9 | 58,717,636 | 4.9 |
| Shadow Anchored | 4 | 38,058,164 | 3.2 |
| Single Tenant | 1 | 5,190,000 | 0.4 |
| Hospitality | 17 | 231,201,181 | 19.3 |
| Full Service | 4 | 72,967,000 | 6.1 |
| Select Service | 5 | 72,450,000 | 6.0 |
| Extended Stay | 4 | 51,989,122 | 4.3 |
| Limited Service | 4 | 33,795,059 | 2.8 |
| Multifamily | 27 | 193,169,571 | 16.1 |
| Mid Rise | 12 | 112,680,000 | 9.4 |
| Cooperative | 14 | 52,189,571 | 4.3 |
| Garden | 1 | 28,300,000 | 2.4 |
| Self Storage | 4 | 27,136,000 | 2.3 |
| Self Storage | 4 | 27,136,000 | 2.3 |
| Mixed Use | 3 | 21,890,252 | 1.8 |
| Office/Industrial | 1 | 10,900,000 | 0.9 |
| Office/Retail/Residential | 1 | 5,990,252 | 0.5 |
| Self Storage/Office | 1 | 5,000,000 | 0.4 |
| Industrial | 4 | 20,298,781 | 1.7 |
| Flex | 4 | 20,298,781 | 1.7 |
| Other | 1 | 7,488,112 | 0.6 |
| Leased Fee | 1 | 7,488,112 | 0.6 |
| Total: | 101 | $1,200,097,104 | 100.0% |
Mortgage Rate (%)
| No. of Mortgage Loans | Aggregate Cut-off Date Balance ($) | % of Pool | |
| 2.5890 - 3.2499 | 8 | 297,538,086 | 24.8 |
| 3.2500 - 3.4999 | 18 | 219,789,991 | 18.3 |
| 3.5000 - 3.9999 | 36 | 584,462,880 | 48.7 |
| 4.0000 - 4.3180 | 13 | 98,306,146 | 8.2 |
| Total: | 75 | $1,200,097,104 | 100.0% |
| Min: 2.5890% Max: 4.3180% Wtd Avg: 3.5017% | |||
Original Term to Maturity or ARD (mos.)
| No. of Mortgage Loans | Aggregate Cut-off Date Balance ($) | % of Pool | |
| 84 | 2 | 100,000,000 | 8.3 |
| 120 | 73 | 1,100,097,104 | 91.7 |
| Total: | 75 | $1,200,097,104 | 100.0% |
| Min: 84 mos. Max: 120 mos. Wtd Avg: 117 mos. | |||
Remaining Term to Maturity or ARD (mos.)
| No. of Mortgage Loans | Aggregate Cut-off Date Balance ($) | % of Pool | |
| 82 - 83 | 2 | 100,000,000 | 8.3 |
| 116 - 119 | 55 | 851,786,104 | 71.0 |
| 120 | 18 | 248,311,000 | 20.7 |
| Total: | 75 | $1,200,097,104 | 100.0% |
| Min: 82 mos. Max: 120 mos. Wtd Avg: 116 mos. | |||
Original Amortization Term (mos.)
| No. of Mortgage Loans | Aggregate Cut-off Date Balance ($) | % of Pool | |
| Interest Only | 35 | 813,968,000 | 67.8 |
| 300 | 5 | 33,830,281 | 2.8 |
| 360 | 32 | 340,798,823 | 28.4 |
| 480 | 3 | 11,500,000 | 1.0 |
| Total: | 75 | $1,200,097,104 | 100.0% |
| Min: 300 mos. Max: 480 mos. Wtd Avg: 358 mos. | |||
Remaining Amortization Term (mos.)
| No. of Mortgage Loans | Aggregate Cut-off Date Balance ($) | % of Pool | |
| Interest Only | 35 | 813,968,000 | 67.8 |
| 298 - 300 | 5 | 33,830,281 | 2.8 |
| 356 - 480 | 35 | 352,298,823 | 29.4 |
| Total: | 75 | $1,200,097,104 | 100.0% |
| Min: 298 mos. Max: 480 mos. Wtd Avg: 358 mos. | |||
Mortgage Loan Sellers
| No. of Mortgage Loans | Aggregate Cut-off Date Balance ($) | % of Pool | |
| MSMCH | 23 | 469,267,051 | 39.1 |
| BANA | 19 | 433,725,293 | 36.1 |
| WFB | 19 | 244,915,189 | 20.4 |
| NCB | 14 | 52,189,571 | 4.3 |
| Total: | 75 | $1,200,097,104 | 100.0% |
Amortization Type
| No. of Mortgage Loans | Aggregate Cut-off Date Balance ($) | % of Pool | |
| Interest Only | 35 | 813,968,000 | 67.8 |
| Amortizing Balloon | 27 | 218,215,104 | 18.2 |
| Partial Interest Only | 13 | 167,914,000 | 14.0 |
| Total: | 75 | 1,200,097,104 | 100.0% |
Cut-off Date LTV Ratio (%)
| No. of Mortgage Loans | Aggregate Cut-off Date Balance ($) | % of Pool | |
| 5.8 - 55.0 | 32 | 485,634,215 | 40.5 |
| 55.1 - 60.0 | 3 | 14,842,201 | 1.2 |
| 60.1 - 65.0 | 18 | 343,378,234 | 28.6 |
| 65.1 - 70.0 | 12 | 247,345,947 | 20.6 |
| 70.1 - 75.0 | 10 | 108,896,506 | 9.1 |
| Total: | 75 | $1,200,097,104 | 100.0% |
| Min: 5.8% | Max: 75.0% | Wtd Avg: 55.2% |
Maturity Date or ARD LTV Ratio (%)
| No. of Mortgage Loans | Aggregate Cut-off Date Balance ($) | % of Pool | |
| 4.5 - 40.0 | 23 | 325,234,215 | 27.1 |
| 40.1 - 50.0 | 7 | 143,242,201 | 11.9 |
| 50.1 - 55.0 | 7 | 106,184,306 | 8.8 |
| 55.1 - 60.0 | 11 | 105,567,446 | 8.8 |
| 60.1 - 65.0 | 19 | 317,288,935 | 26.4 |
| 65.1 - 69.7 | 8 | 202,580,000 | 16.9 |
| Total: | 75 | $1,200,097,104 | 100.0% |
| Min: 4.5% | Max: 69.7% | Wtd Avg: 51.8% |
UW NCF DSCR (x)
| No. of Mortgage Loans | Aggregate Cut-off Date Balance ($) | % of Pool | |
| 1.46 - 1.60 | 6 | 63,715,211 | 5.3 |
| 1.61 - 1.80 | 9 | 68,731,671 | 5.7 |
| 1.81 - 2.00 | 10 | 245,763,064 | 20.5 |
| 2.01 - 2.20 | 5 | 127,125,000 | 10.6 |
| 2.21 - 2.40 | 7 | 65,851,806 | 5.5 |
| 2.41 - 11.88 | 38 | 628,910,351 | 52.4 |
| Total: | 75 | $1,200,097,104 | 100.0% |
| Min: 1.46x | Max: 11.88x | Wtd Avg: 3.14x |
UW NOI Debt Yield (%)
| No. of Mortgage Loans | Aggregate Cut-off Date Balance ($) | % of Pool | |
| 6.7 - 9.0 | 13 | 350,419,112 | 29.2 |
| 9.1 - 10.0 | 9 | 81,218,599 | 6.8 |
| 10.1 - 12.0 | 20 | 305,199,235 | 25.4 |
| 12.1 - 14.0 | 4 | 66,470,000 | 5.5 |
| 14.1 - 16.0 | 6 | 223,084,306 | 18.6 |
| 16.1 - 54.4 | 23 | 173,705,851 | 14.5 |
| Total: | 75 | $1,200,097,104 | 100.0% |
| Min: 6.7% | Max: 54.4% | Wtd Avg: 12.9% |
| (1) | All numerical information concerning the mortgage loans is approximate. All weighted average information regarding the mortgage loans reflects the weighting of the mortgage loans based on their outstanding principal balances as of the Cut-off Date. The sum of numbers and percentages in columns may not match the “Total” due to rounding. With respect to any mortgage loan that is part of a whole loan, unless otherwise indicated, all LTV, DSCR and Debt Yield calculations include any relatedpari passu companion loans and exclude any related subordinate companion loans, as applicable. For mortgaged properties securing residential cooperative mortgage loans, the UW DSCR and UW NOI Debt Yield for each such mortgaged property is calculated using underwritten net operating income or underwritten net cash flow, as applicable, for the related residential cooperative property which is the projected net operating income or net cash flow, as applicable, reflected in the most recent appraisal obtained by or otherwise in the possession of the related mortgage loan seller as of the Cut-off Date. LTV calculations are based upon the appraised value of the residential cooperative property determined as if such residential cooperative property is operated as a residential cooperative, inclusive of the amount of the underlying debt encumbering such residential cooperative property. |
| (2) | In the case of mortgage loans secured by multiple properties, cut-off date balance information is based on allocated loan amounts with respect to such properties. |
| (3) | “California – Northern” includes zip codes above 93600, and “California – Southern” includes zip codes at or below 93600. |
| This is not a research report and was not prepared by any Underwriter’s research department. Please see additional important information and qualifications at the end of this Term Sheet. |
T-28
(THIS PAGE INTENTIONALLY LEFT BLANK)
T-29
| Multifamily – Mid Rise | Loan #1 | Cut-off Date Balance: | $76,680,000 | |
| Various | FTERE Bronx Portfolio 3 | Cut-off Date LTV: | 67.3% | |
| Bronx, NY | UW NCF DSCR: | 2.06x | ||
| UW NOI Debt Yield: | 7.8% |

| This is not a research report and was not prepared by any Underwriter’s research department. Please see additional important information and qualifications at the end of this Term Sheet. |
T-30
| Multifamily – Mid Rise | Loan #1 | Cut-off Date Balance: | $76,680,000 | |
| Various | FTERE Bronx Portfolio 3 | Cut-off Date LTV: | 67.3% | |
| Bronx, NY | UW NCF DSCR: | 2.06x | ||
| UW NOI Debt Yield: | 7.8% |

| This is not a research report and was not prepared by any Underwriter’s research department. Please see additional important information and qualifications at the end of this Term Sheet. |
T-31
Mortgage Loan No. 1 – FTERE Bronx Portfolio 3 |
| Mortgage Loan Information | Property Information | ||||||
| Mortgage Loan Seller: | MSMCH | Single Asset/Portfolio: | Portfolio | ||||
| Credit Assessment (DBRS/Fitch/S&P): | NR/NR/NR | Location: | Bronx, NY | ||||
| Original Balance: | $76,680,000 | General Property Type: | Multifamily | ||||
| Cut-off Date Balance: | $76,680,000 | Detailed Property Type: | Mid Rise | ||||
| % of Initial Pool Balance: | 6.4% | Title Vesting: | Fee | ||||
| Loan Purpose: | Refinance | Year Built/Renovated: | Various/N/A | ||||
| Borrower Sponsor: | Finkelstein Timberger East Real Estate | Size: | 526 Units | ||||
| Guarantor: | Richard Timberger | Cut-off Date Balance per Unit: | $145,779 | ||||
| Mortgage Rate: | 3.6350% | Maturity Date Balance per Unit: | $145,779 | ||||
| Note Date: | 2/7/2020 | Property Manager: | Finkelstein Timberger LLC | ||||
| First Payment Date: | 4/1/2020 | (borrower related) | |||||
| Maturity Date: | 3/1/2030 | ||||||
| Original Term to Maturity: | 120 months | Underwriting and Financial Information | |||||
| Original Amortization Term: | 0 months | UW NOI: | $5,986,954 | ||||
| IO Period: | 120 months | UW NOI Debt Yield: | 7.8% | ||||
| Seasoning: | 0 months | UW NOI Debt Yield at Maturity: | 7.8% | ||||
| Prepayment Provisions: | LO (24); DEF (89); O (7) | UW NCF DSCR: | 2.06x | ||||
| Lockbox/Cash Mgmt Status: | Springing/Springing | Most Recent NOI: | $5,950,622 (12/31/2019) | ||||
| Additional Debt Type: | N/A | 2nd Most Recent NOI: | $5,760,058 (12/31/2018) | ||||
| Additional Debt Balance: | N/A | 3rd Most Recent NOI: | $5,564,236 (12/31/2017) | ||||
| Future Debt Permitted (Type): | No (N/A) | Most Recent Occupancy: | 99.4% (1/1/2020) | ||||
| Reserves(1) | 2nd Most Recent Occupancy: | 99.8% (12/31/2018) | |||||
| Type | Initial | Monthly | Cap | 3rd Most Recent Occupancy: | 99.4% (12/31/2017) | ||
| RE Tax: | $76,846 | $76,846 | N/A | Appraised Value (as of): | $114,000,000 (Various) | ||
| Insurance: | $0 | Springing | N/A | Appraised Value per Unit: | $216,730 | ||
| Recurring Replacements: | $0 | $12,706 | N/A | Cut-off Date LTV Ratio: | 67.3% | ||
| Deferred Maintenance: | $20,578 | $0 | N/A | Maturity Date LTV Ratio: | 67.3% | ||
| J-51 Exemption Reserve: | $2,500,000 | $0 | N/A | ||||
| Sources and Uses | ||||||
| Sources | Proceeds | % of Total | Uses | Proceeds | % of Total | |
| Loan Amount: | $76,680,000 | 99.3% | Loan Payoff: | $73,449,815 | 95.1% | |
| Borrower Equity: | $517,940 | 0.7% | Reserves: | $2,597,424 | 3.4% | |
| Closing Costs: | $1,150,701 | 1.5% | ||||
| Total Sources: | $77,197,940 | 100.0% | Total Uses: | $77,197,940 | 100.0% | |
| (1) | See “Escrows and Reserves” below for further discussion of reserve requirements. |
The Mortgage Loan. The largest mortgage loan (the “FTERE Bronx Portfolio 3 Mortgage Loan”) is evidenced by a promissory note in the original principal amount of $76,680,000. The FTERE Bronx Portfolio 3 Mortgage Loan is secured by a first priority fee mortgage encumbering eight multifamily properties located in the Bronx, New York (collectively, the “FTERE Bronx Portfolio 3” or “FTERE Bronx Portfolio 3 Properties”).
The Borrowers and the Borrower Sponsor. The borrowers are 1299 The Bear LLC D, Smoosh Bros LLC D, Max T LLC D, Chase America LLC D, Far Out LLC D, La Verdad LLC D, North State Realty Associates LLC D, and Andrew Associates LLC D (collectively, the “FTERE Bronx Portfolio 3 Borrowers”), each a Delaware limited liability company that is structured to be bankruptcy-remote with one independent director. Richard Timberger is the non-recourse carveout guarantor and Finkelstein Timberger East Real Estate is the borrower sponsor with respect to the FTERE Bronx Portfolio 3 Mortgage Loan. Finkelstein Timberger East Real Estate is a real estate company that owns and manages residential apartment buildings located throughout various parts of Bronx County, New York. Finkelstein Timberger East Real Estate is run by Steven Finkelstein, Richard Timberger and Tony East.
The Properties. The FTERE Bronx Portfolio 3 is comprised of eight rent stabilized multifamily properties totaling 526 units located in the Bronx, New York. All units are rent stabilized, other than three units that are rent controlled. The FTERE Bronx Portfolio 3 Properties were constructed between 1922 and 1929. As of January 1, 2020, the multifamily space at the FTERE Bronx Portfolio 3 was 99.4% occupied. In addition, certain of the FTERE Bronx Portfolio 3 Properties have commercial space, which was 100.0% occupied as of January 1, 2020. Occupancy at the FTERE Bronx Portfolio 3 has been in excess of 99.0% since 2014. According to the borrower sponsor, since acquiring the FTERE Bronx Portfolio 3, the borrower sponsor has invested approximately $12.7 million ($24,114 per unit) in capital improvements across the FTERE Bronx Portfolio 3 Properties in the aggregate. All of the FTERE Bronx Portfolio 3 Properties benefit from either a tax exemption and/or abatement under New York State’s J-51 program. In addition, all of the FTERE Bronx Portfolio 3 Properties are awaiting approval of (or, in some cases, the FTERE Bronx Portfolio Borrowers have informed the lender they plan to file) an application for a J-51 tax exemption or abatement or an application to increase rent under a major capital improvement (“MCI”) program. Under the J-51 program, the tax exemption benefit temporarily exempts a property from the increase in assessed value which would otherwise occur as a result of significant renovation work. The abatement portion of the program reduces the existing taxes by a percentage of the certified reasonable
| This is not a research report and was not prepared by any Underwriter’s research department. Please see additional important information and qualifications at the end of this Term Sheet. |
T-32
| Multifamily – Mid Rise | Loan #1 | Cut-off Date Balance: | $76,680,000 | |
| Various | FTERE Bronx Portfolio 3 | Cut-off Date LTV: | 67.3% | |
| Bronx, NY | UW NCF DSCR: | 2.06x | ||
| UW NOI Debt Yield: | 7.8% |
costs of the work performed as determined by the New York City Department of Finance. The MCI program allows landlords to increase rents (subject to certain limits) paid by rent stabilized tenants to recoup renovation and rehabilitation costs. For the FTERE Bronx Portfolio 3 Properties at which J-51 and/or MCI benefits have been applied for (or an application is planned) and have not been approved, there is an approximately $2.5 million holdback in place. See “Escrows and Reserves” below. The FTERE Bronx Portfolio 3 Properties have an aggregate of 73 units with tenants who pay a portion of their rent with a Section 8 voucher.
The following table presents detailed information with respect to each of the FTERE Bronx Portfolio 3 Properties:
| FTERE Bronx Portfolio 3 Properties Summary | ||||||||
| Building | Occ. %(1) | Units(1) | % of Total Units | Appraised Value | Allocated Loan Amount (“ALA”) | % of ALA | UW NOI | % of UW NOI |
| 1264-1270 Gerard Avenue(2) | 99.1% | 108 | 20.5% | $22,600,000 | $15,200,000 | 19.8% | $1,177,682 | 19.7% |
| 3018 Heath Avenue(3) | 100.0% | 86 | 16.3% | $16,200,000 | $10,900,000 | 14.2% | $899,397 | 15.0% |
| 1576 Taylor Avenue(4) | 100.0% | 71 | 13.5% | $16,000,000 | $10,760,000 | 14.0% | $819,243 | 13.7% |
| 1299 Grand Concourse(5) | 100.0% | 66 | 12.5% | $15,400,000 | $10,360,000 | 13.5% | $818,760 | 13.7% |
| 2500 University Avenue(6) | 100.0% | 57 | 10.8% | $12,800,000 | $8,610,000 | 11.2% | $646,921 | 10.8% |
| 2505 Aqueduct Avenue(7) | 97.9% | 48 | 9.1% | $12,700,000 | $8,540,000 | 11.1% | $674,056 | 11.3% |
| 2785-2791 Sedgwick Avenue(8) | 97.9% | 48 | 9.1% | $9,800,000 | $6,590,000 | 8.6% | $529,296 | 8.8% |
| 1945 Loring Place South(9) | 100.0% | 42 | 8.0% | $8,500,000 | $5,720,000 | 7.5% | $421,599 | 7.0% |
| Total | 99.4% | 526 | 100.0% | $114,000,000 | $76,680,000 | 100.0% | $5,986,954 | 100.0% |
| (1) | Based on the borrower rent roll dated January 1, 2020. |
| (2) | The appraised value of the 1264-1270 Gerard Avenue property includes $550,000 attributable to the net present value of four in place J-51 tax abatements, three applied for or intended to be applied for J-51 tax abatements ($150,000 of appraised value), two of which the FTERE Bronx Portfolio 3 Borrowers have informed the lender that they intend to apply for (and one of which has been applied for), and one applied for J-51 tax exemption ($2,200,000 of appraised value), and $1,200,000 attributable to an MCI program rent increase, which the FTERE Bronx Portfolio 3 Borrowers have informed the lender that they intend to apply for. As of the origination date, the 1264-1270 Gerard Avenue property benefits from four, 20-year tax abatements under New York State’s J-51 tax abatement program, expiring in 2023, 2024, 2026 and 2028. The FTERE Bronx Portfolio 3 Borrowers applied or intend to apply for three additional J-51 tax abatements, have applied for a J-51 tax exemption and intend to apply for an MCI program rent increase at the 1264-1270 Gerard Avenue property. As of the origination date, approval documentation had not been received. Real estate taxes were underwritten based on the applied for J-51 tax exemption, the three applied for or intended to be applied for J-51 tax abatements and one of the in place J-51 tax abatements. The underwritten abated taxes are $189,272per annum, compared to estimated unabated taxes for the 2020/2021 tax year of $355,237. |
| (3) | The appraised value of the 3018 Heath Avenue property includes $2,200,000 attributable to the net present value of an in place J-51 tax exemption, $300,000 attributable to two in place J-51 tax abatements and $100,000 attributable to one applied for J-51 tax abatement, and $200,000 attributable to an applied for MCI program rent increase. As of the origination date, the 3018 Heath Avenue property benefits from two, 20-year tax abatements under New York State’s J-51 tax abatement program expiring in 2027 and a 34-year J-51 tax exemption expiring in 2051. The FTERE Bronx Portfolio 3 Borrowers applied for an additional J-51 tax abatement and an MCI program rent increase at the 3018 Heath Avenue property. As of the origination date, approval documentation had not been received. Real estate taxes were underwritten based on the in place J-51 tax exemption, the in place J-51 tax abatements and the applied for J-51 tax abatement at the 3018 Heath Avenue property. The underwritten abated taxes are $63,104per annum, compared to estimated unabated taxes for the 2020/2021 tax year of $246,314. |
| (4) | The appraised value of the 1576 Taylor Avenue property includes $4,000,000 attributable to the net present value of two in place J-51 tax abatements, one in place J-51 tax exemption and one applied for J-51 tax abatement, and $300,000 attributable to an applied for MCI program rent increase. As of the origination date, the 1576 Taylor Avenue property benefits from two, 20-year tax abatements under New York State’s J-51 tax abatement program expiring in 2027 and 2029 and a 34-year J-51 tax exemption expiring in 2050. The FTERE Bronx Portfolio 3 Borrowers applied for an additional J-51 tax abatement and an MCI program rent increase at the 1576 Taylor Avenue property. As of the origination date, approval documentation had not been received. Real estate taxes were underwritten based on the in place J-51 tax exemption, the in place J-51 tax abatements and the one applied for J-51 tax abatement at the 1576 Taylor Avenue property. The underwritten abated taxes are $23,309per annum, compared to estimated unabated taxes for the 2020/2021 tax year of $229,655. |
| (5) | The appraised value of the 1299 Grand Concourse property includes $2,500,000 attributable to the net present value of an in place J-51 tax exemption, $270,000 attributable to two in place J-51 tax abatements, $30,000 attributable to an applied for J-51 tax abatement, and $100,000 attributable to an in place MCI program rent increase. As of the origination date, the 1299 Grand Concourse property benefits from two, 20-year tax abatements under New York State’s J-51 tax abatement program expiring in 2027 and 2029 and a 34-year J-51 tax exemption expiring in 2050. The FTERE Bronx Portfolio 3 Borrowers applied for an additional J-51 tax abatement at the 1299 Grand Concourse property. As of the origination date, approval documentation had not been received. Real estate taxes were underwritten based on the in place J-51 tax exemption, the in place J-51 tax abatements and the applied for J-51 tax abatement at the 1299 Grand Concourse property. The underwritten abated taxes are $53,303per annum, compared to estimated unabated taxes for the 2020/2021 tax year of $226,580. |
| (6) | The appraised value of the 2500 University Avenue property includes $2,350,000 attributable to the net present value of an in place J-51 tax exemption, $250,000 attributable to two in place J-51 tax abatements, $100,000 attributable to two J-51 tax abatements that the FTERE Bronx Portfolio 3 Borrowers have informed the lender that they intend to apply for, $550,000 attributable to two MCI program rent increases that the FTERE Bronx Portfolio 3 Borrowers have applied for and $100,000 attributable to an in place MCI program rent increase. As of the origination date, the 2500 University Avenue property benefits from two, 20-year tax abatements under New York State’s J-51 tax abatement program expiring in 2025 and 2027 and a 34-year J-51 tax exemption expiring in 2051. The FTERE Bronx Portfolio 3 Borrowers intend to apply for two additional J-51 tax abatements and have applied for two additional MCI program rent increases at the 2500 University Avenue property. As of the origination date, approval documentation had not been received. Real estate taxes were underwritten based on the in place J-51 tax exemption, the in place J-51 tax abatements and the two intended to be applied for J-51 tax abatements at the 2500 University Avenue property. The underwritten abated taxes are $5,060per annum, compared to estimated unabated taxes for the 2020/2021 tax year of $176,928. |
| (7) | The appraised value of the 2505 Aqueduct Avenue property includes $1,900,000 attributable to the net present value of an in place J-51 tax exemption, $250,000 attributable to four in place J-51 tax abatements, and $50,000 attributable to three J-51 tax abatements and $600,000 attributable to two MCI program rent increases, all of which the FTERE Bronx Portfolio 3 Borrowers have informed the lender that they intend to apply for. As of the origination date, the 2505 Aqueduct Avenue property benefits from four, 20-year tax abatements under New York State’s J-51 tax abatement program expiring in 2026, 2027 and 2028 and a 34-year J-51 tax exemption expiring in 2051. The FTERE Bronx Portfolio 3 Borrowers intend to apply for three additional J-51 tax abatements and two MCI program rent increases at the 2505 Aqueduct Avenue property. Real estate taxes were underwritten based on the in place J-51 tax exemption, the in place J-51 tax abatements and the three intended to be applied for J-51 tax abatements at the 2505 Aqueduct Avenue property. The underwritten abated taxes are $30,593per annum, compared to estimated unabated taxes for the 2020/2021 tax year of $180,981. |
| (8) | The appraised value of the 2785-2791 Sedgwick Avenue property includes $1,100,000 attributable to the net present value of an in place J-51 tax exemption and $200,000 attributable to three in place J-51 tax abatements. As of the origination date, the 2785-2791 Sedgwick Avenue property benefits from three, 20-year tax abatements under New York State’s J-51 tax abatement program expiring in 2025 and 2028 and a 34-year J-51 tax exemption expiring in 2052. Real estate taxes were underwritten based on the in place J-51 tax exemption and the in place J-51 tax abatements at the 2785-2791 Sedgwick Avenue property. The underwritten abated taxes are $26,310per annum, compared to estimated unabated taxes for the 2020/2021 tax year of $121,934. |
| (9) | The appraised value of the 1945 Loring Place South property includes $30,000 attributable to the net present value of two in place J-51 tax abatements and $970,000 attributable to one applied for J-51 tax exemption. As of the origination date, the 1945 Loring Place South property benefits from two, 20-year tax abatements under New York State’s J-51 tax abatement program, expiring in 2024 and 2026. The FTERE Bronx Portfolio 3 Borrowers applied for a J-51 tax exemption at the 1945 Loring Place South property. As of the origination date, approval documentation had not been received. Real estate taxes were underwritten based on the applied for J-51 tax exemption and one of the in place J-51 tax abatements at the 1945 Loring Place South property. The underwritten abated taxes are $89,273per annum, compared to estimated unabated taxes for the 2020/2021 tax year of $128,085. |
| This is not a research report and was not prepared by any Underwriter’s research department. Please see additional important information and qualifications at the end of this Term Sheet. |
T-33
| Multifamily – Mid Rise | Loan #1 | Cut-off Date Balance: | $76,680,000 | |
| Various | FTERE Bronx Portfolio 3 | Cut-off Date LTV: | 67.3% | |
| Bronx, NY | UW NCF DSCR: | 2.06x | ||
| UW NOI Debt Yield: | 7.8% |
The following table presents detailed information with respect to each of the FTERE Bronx Portfolio 3 Properties:
| FTERE Bronx Portfolio 3 Properties Summary | |||||||||
| Building | Units(1) | Property Subtype | NRA (SF) | Section 8 Tenants | Avg. Unit Size (SF) | Historical Capex | Historical Capex per Unit | # of Commercial Tenants | Annual Commercial Tenant Rent |
| 1264-1270 Gerard Avenue | 108 | Mid rise | 95,000 | 5 | 880 | $1,359,000 | $12,583.33 | 6 | $154,272 |
| 3018 Heath Avenue | 86 | Mid rise | 52,700 | 8 | 613 | $2,432,000 | $28,279.07 | 0 | $0 |
| 1576 Taylor Avenue | 71 | Mid rise | 64,260 | 9 | 905 | $2,118,000 | $29,830.99 | 0 | $0 |
| 1299 Grand Concourse | 66 | Mid rise | 47,250 | 13 | 716 | $1,717,000 | $26,015.15 | 0 | $0 |
| 2500 University Avenue | 57 | Mid rise | 45,400 | 12 | 796 | $1,926,000 | $33,789.47 | 0 | $0 |
| 2505 Aqueduct Avenue | 48 | Mid rise | 57,300 | 10 | 1,194 | $1,413,000 | $29,437.50 | 1 | $93,600 |
| 2785-2791 Sedgwick Avenue | 48 | Mid rise | 45,200 | 13 | 942 | $1,289,000 | $26,854.17 | 0 | $0 |
| 1945 Loring Place South | 42 | Mid rise | 40,700 | 3 | 969 | $430,000 | $10,238.10 | 0 | $0 |
| Total | 526 | 447,810 | 73 | $12,684,000 | $24,114.07 | 7 | $247,872 | ||
Source:Appraisal, unless otherwise indicated.
| (1) | Based on the borrower rent roll dated January 1, 2020. |
The Market. The FTERE Bronx Portfolio 3 Properties are located in the Bronx, New York within the Bronx County submarket of the New York City residential market. According to the appraisal, as of the third quarter of 2019, the vacancy rate in the New York City residential market was approximately 4.0%, with average asking rents of $3,740 per unit and inventory of approximately 221,105 units. According to the appraisal, as of the third quarter of 2019, the vacancy rate in the Bronx County submarket was approximately 3.8%, with average asking rents of $1,401 per unit and inventory of approximately 13,168 units. Primary access to the FTERE Bronx Portfolio 3 Properties is provided by a number of major thoroughfares, public bus lines and numerous subway lines that connect the FTERE Bronx Portfolio 3 Properties to Manhattan. The FTERE Bronx Portfolio 3 neighborhood is located in a mixed-use area that supports residential, office, commercial and retail uses.
The following table presents certain information relating to the appraisal’s market rent conclusion for the FTERE Bronx Portfolio 3 Properties:
| Market Rent Summary | ||||||
| Building | Units(1) | Avg. Size (SF) | Avg. Monthly In Place Rent per Unit(1) | Avg. Monthly In Place Rent PSF(1) | Avg. Monthly Market Rent per Unit | Avg. Monthly Market Rent PSF |
| 1264-1270 Gerard Avenue | 108 | 880 | $1,285 | $1.46 | $1,724 | $1.96 |
| 3018 Heath Avenue | 86 | 613 | $1,282 | $2.09 | $1,614 | $2.63 |
| 1576 Taylor Avenue | 71 | 905 | $1,360 | $1.54 | $1,835 | $2.03 |
| 1299 Grand Concourse | 66 | 716 | $1,455 | $2.03 | $1,750 | $2.44 |
| 2500 University Avenue | 57 | 796 | $1,312 | $1.65 | $1,664 | $2.09 |
| 2505 Aqueduct Avenue | 48 | 1,194 | $1,488 | $1.25 | $1,942 | $1.63 |
| 2785-2791 Sedgwick Avenue | 48 | 942 | $1,340 | $1.42 | $1,961 | $2.08 |
| 1945 Loring Place South | 42 | 969 | $1,407 | $1.45 | $1,656 | $1.71 |
Source:Appraisal, unless otherwise indicated.
| (1) | Based on the borrower rent roll dated January 1, 2020. |
| This is not a research report and was not prepared by any Underwriter’s research department. Please see additional important information and qualifications at the end of this Term Sheet. |
T-34
| Multifamily – Mid Rise | Loan #1 | Cut-off Date Balance: | $76,680,000 | |
| Various | FTERE Bronx Portfolio 3 | Cut-off Date LTV: | 67.3% | |
| Bronx, NY | UW NCF DSCR: | 2.06x | ||
| UW NOI Debt Yield: | 7.8% |
The following table presents certain information relating to comparable rental properties to the 1264-1270 Gerard Avenue, the 3018 Heath Avenue, the 1299 Grand Concourse, the 2500 University Avenue, the 2505 Aqueduct Avenue and the 2785-2791 Sedgwick Avenue properties:
| Comparable Rental Properties (1264-1270 Gerard Avenue, 3018 Heath Avenue, 1299 Grand Concourse, 2500 University Avenue, 2505 Aqueduct Avenue and 2785-2791 Sedgewick Avenue) | |||||||
| Property | Year Built | # of Stories | # Units | Unit Mix | Average SF per Unit | Average Rent per Unit(1) | Average Annual Rent PSF |
| 1264-1270 Gerard Avenue | 1927 | 7 | 108 | Studio 1BR 2BR 3BR | 600 850 1,000 1,100 | $988 $1,211 $1,528 $1,769 | $19.76 $17.09 $18.33 $19.30 |
| 3018 Heath Avenue | 1927 | 5 | 86 | 1BR 2BR 3BR | 550 700 850 | $1,217 $1,346 $1,938 | $26.55 $23.07 $27.35 |
| 1299 Grand Concourse | 1922 | 5 | 66 | Studio 1BR 2BR 3BR 4BR | 500 650 800 900 1,100 | $1,208 $1,379 $1,620 $1,625 $1,762 | $29.00 $25.45 $24.30 $21.66 $19.22 |
| 2500 University Avenue | 1922 | 5 | 57 | Studio 1BR 2BR 3BR | 450 700 950 1,200 | $1,073 $1,203 $1,567 $1,493 | $28.62 $20.62 $19.80 $14.93 |
| 2505 Aqueduct Avenue | 1928 | 6 | 48 | 1BR 2BR 3BR | 900 1,200 1,600 | $1,226 $1,345 $1,877 | $16.35 $13.45 $14.08 |
| 2785-2791 Sedgwick Avenue | 1928 | 6 | 48 | 1BR 2BR | 750 1,150 | $1,218 $1,479 | $19.49 $15.43 |
2839 Bainbridge Avenue Bronx, NY | 1922 | 5 | 30 | 1BR | 600 | $2,084 | $41.68 |
2605 Marion Avenue Bronx, NY | 1925 | 5 | 25 | 1BR 2BR | 650 800 | $1,675 $1,925 | $30.92 $28.88 |
7 East Gun Hill Road Bronx, NY | 1923 | 5 | 38 | 1BR 2BR 3BR | 500 800 1,100 | $1,526 $2,012 $2,473 | $36.62 $30.18 $26.98 |
308 East 209th Street Bronx, NY | 1929 | 6 | 25 | Studio 1BR | 354 560 | $1,077 $1,236 | $36.51 $26.49 |
3339 Hull Avenue Bronx, NY | 1940 | 6 | 50 | Studio 1BR 2BR 3BR | 400 675 950 1,500 | $1,354 $1,666 $1,839 $3,218 | $40.62 $29.62 $23.23 $25.74 |
Source:Appraisal, unless otherwise indicated.
| (1) | Based on the borrower rent roll dated January 1, 2020. |
The following table presents certain information relating to comparable rental properties to the 1576 Taylor Avenue property:
| Comparable Rental Properties (1576 Taylor Avenue) | |||||||
| Property | Year Built | # of Stories | # Units(1) | Unit Mix | Average SF per Unit | Average Rent per Unit(1) | Average Annual Rent PSF |
| 1576 Taylor Avenue | 1929 | 6 | 71 | Studio 1BR 2BR 4BR | 540 810 1,080 1,620 | $1,260 $1,262 $1,570 $849 | $27.99 $18.69 $17.45 $6.29 |
1400 Noble Avenue Bronx, NY | 1928 | 6 | 59 | 1BR | 600 | $1,425 | $28.50 |
1551 Unionport Road/1996 McGraw Avenue Bronx, NY | 1939 | 8 | 87 | 1BR 2BR | 649 833 | $1,413 $1,615 | $26.13 $23.27 |
2010 Powell Avenue Bronx, NY | 1929 | 6 | 91 | 1BR 2BR | 600 768 | $1,542 $1,850 | $30.84 $28.91 |
1100 Elder Avenue Bronx, NY | 1928 | 6 | 61 | 1BR | 750 | $1,750 | $28.00 |
820-880 Colgate Avenue Bronx, NY | 1969 | 19 | 484 | 1BR 2BR 3BR | 733 933 1,200 | $1,602 $1,990 $2,260 | $26.23 $25.59 $22.60 |
Source:Appraisal, unless otherwise indicated.
| (1) | Based on the borrower rent roll dated January 1, 2020. |
| This is not a research report and was not prepared by any Underwriter’s research department. Please see additional important information and qualifications at the end of this Term Sheet. |
T-35
| Multifamily – Mid Rise | Loan #1 | Cut-off Date Balance: | $76,680,000 | |
| Various | FTERE Bronx Portfolio 3 | Cut-off Date LTV: | 67.3% | |
| Bronx, NY | UW NCF DSCR: | 2.06x | ||
| UW NOI Debt Yield: | 7.8% |
The following table presents certain information relating to comparable rental properties to the 1945 Loring Place South property:
| Comparable Rental Properties (1945 Loring Place South) | |||||||
| Property | Year Built | # of Stories | # Units(1) | Unit Mix | Average SF per Unit | Average Rent per Unit(1) | Average Annual Rent PSF |
| 1945 Loring Place South | 1927 | 6 | 42 | Studio 1BR 2BR 3BR | 700 800 1,100 1,400 | $1,430 $1,225 $1,585 $1,773 | $24.52 $18.37 $17.29 $15.19 |
Sherman Court 1240 Sherman Avenue Bronx, NY | 1927 | 7 | 58 | 1BR 2BR | 550 650 | $1,515 $1,701 | $33.05 $31.40 |
1540 Walton Avenue Bronx, NY | 1923 | 5 | 59 | 1BR 2BR | 642 906 | $1,701 $2,031 | $31.79 $26.90 |
888 Grand Concourse Bronx, NY | 1931 | 6 | 76 | Studio 1BR 2BR 3BR | 600 800 1,000 1,200 | $1,800 $2,200 $2,550 $3,200 | $36.00 $33.00 $30.60 $32.00 |
930 Sheridan Avenue Bronx, NY | 1951 | 7 | 83 | Studio 1BR | 542 669 | $1,699 $1,845 | $37.62 $33.09 |
Source:Appraisal, unless otherwise indicated.
| (1) | Based on the borrower rent roll dated January 1, 2020. |
Operating History and Underwritten Net Cash Flow.The following table presents certain information relating to the historical operating performance and the Underwritten Net Cash Flow of the FTERE Bronx Portfolio 3:
| Cash Flow Analysis | ||||||
| 2016 | 2017 | 2018 | 2019 | UW | UW Per Unit | |
| Gross Potential Rent | $7,658,015 | $7,882,604 | $8,366,018 | $8,628,632 | $8,570,065 | $16,292.90 |
| Other Income(1) | $0 | $0 | $0 | $0 | $337,609 | $641.84 |
| Vacancy | $0 | $0 | $0 | $0 | ($187,274) | ($356.03) |
| Effective Gross Income | $7,658,015 | $7,882,604 | $8,366,018 | $8,628,632 | $8,720,400 | $16,578.71 |
| Real Estate Taxes(2) | $492,676 | $318,786 | $476,513 | $530,924 | $480,224 | $912.97 |
| Insurance | $284,942 | $332,068 | $423,348 | $425,254 | $423,900 | $805.89 |
| Other Expenses | $1,635,161 | $1,667,514 | $1,706,099 | $1,721,832 | $1,829,322 | $3,477.80 |
| Total Expenses | $2,412,779 | $2,318,368 | $2,605,960 | $2,678,010 | $2,733,446 | $5,196.67 |
| Net Operating Income | $5,245,236 | $5,564,236 | $5,760,058 | $5,950,622 | $5,986,954 | $11,382.04 |
| Capital Expenditures | $0 | $0 | $0 | $0 | $152,466 | $289.86 |
| Net Cash Flow | $5,245,236 | $5,564,236 | $5,760,058 | $5,950,622 | $5,834,488 | $11,092.18 |
| Occupancy %(3) | 99.7% | 99.4% | 99.8% | 99.4% | 98.0% | |
| NOI DSCR | 1.86x | 1.97x | 2.04x | 2.11x | 2.12x | |
| NCF DSCR | 1.86x | 1.97x | 2.04x | 2.11x | 2.06x | |
| NOI Debt Yield | 6.8% | 7.3% | 7.5% | 7.8% | 7.8% | |
| NCF Debt Yield | 6.8% | 7.3% | 7.5% | 7.8% | 7.6% | |
| (1) | Other Income is comprised of (i) rent paid by retail tenants ($247,873), which includes rent bumps through October 2020 totaling $6,048 and (ii) $83,689 associated with in place, applied for and intended to be applied for MCI program rent increases. |
| (2) | Real Estate Taxes decreased from 2019 to UW due to new J-51 tax abatements being put in place at the 1299 Grand Concourse and 2505 Aqueduct Avenue properties in 2019 and all applied for and intended to be applied for J-51 tax abatements and exemptions. |
| (3) | UW Occupancy % represents economic occupancy. As of the borrower rent roll dated January 1, 2020, the multifamily space at the FTERE Bronx Portfolio 3 Properties was 99.4% occupied. |
Escrows and Reserves.
Taxes– The FTERE Bronx Portfolio 3 Mortgage Loan documents provide for an upfront reserve of approximately $76,846 for real estate taxes and ongoing monthly deposits into a reserve for real estate taxes in an amount equal to 1/12 of the real estate taxes that the lender estimates will be payable during the next twelve months (initially, $76,846).
Insurance– The FTERE Bronx Portfolio 3 Mortgage Loan documents provide for monthly deposits into a reserve for insurance premiums in an amount equal to 1/12 of the insurance premiums that the lender estimates will be payable for the renewal of coverage upon the expiration of the insurance policies;provided that such monthly deposits are not required so long as (i) no event of default has occurred and is continuing, (ii) the liability and casualty insurance coverage for each of the FTERE Bronx Portfolio 3 Properties is included in a blanket policy approved by the lender in its reasonable discretion, and (iii) the FTERE Bronx Portfolio 3 Borrowers provide the lender with evidence of payment of the insurance premiums and renewals of the insurance policies, no later than ten days prior to the expiration of the current policy.
| This is not a research report and was not prepared by any Underwriter’s research department. Please see additional important information and qualifications at the end of this Term Sheet. |
T-36
| Multifamily – Mid Rise | Loan #1 | Cut-off Date Balance: | $76,680,000 | |
| Various | FTERE Bronx Portfolio 3 | Cut-off Date LTV: | 67.3% | |
| Bronx, NY | UW NCF DSCR: | 2.06x | ||
| UW NOI Debt Yield: | 7.8% |
Recurring Replacements Reserve – The FTERE Bronx Portfolio 3 Mortgage Loan documents provide for monthly deposits of approximately $12,706 into a reserve for lender approved capital expenditures.
Deferred Maintenance Reserve – The FTERE Bronx Portfolio 3 Mortgage Loan documents provide for an upfront reserve of $20,578 for fire and safety required repairs. Additional required repairs (including but not limited to replacing fuse panels, roof repairs, boiler replacement, façade repairs and retaining wall evaluation and/or repair) and open violations, with an estimated cost of $101,450, were not reserved for, but are required to be completed within 180 days of the loan origination date.
J-51 Exemption Reserve – The FTERE Bronx Portfolio 3 Mortgage Loan documents provide for an upfront reserve of $2,500,000 (the “J-51 Exemption Funds”) with respect to the pending, applied for or intended to be applied for J-51 tax exemptions, J-51 tax abatements and/or MCI program rent increases, as applicable, for each FTERE Bronx Portfolio 3 Property. The J-51 Exemption Funds are required to be released to the FTERE Bronx Portfolio 3 Borrowers upon satisfaction by the FTERE Bronx Portfolio 3 Borrowers of each of the following conditions: (a) the lender's receipt of not more than two written requests from the FTERE Bronx Portfolio 3 Borrowers, to be received on or before August 7, 2021, to release all or a portion of the J-51 Exemption Funds, and (b) satisfaction of the J-51 Exemption Funds Release Conditions;provided, however, that: (i) the first request must be in a minimum amount of $1,250,000, and (ii) the second request will have no minimum draw requirement. Any J-51 Exemption Funds not disbursed to the FTERE Bronx Portfolio 3 Borrowers on or prior to August 7, 2021 may, at the lender’s discretion, be retained and applied by the lender to the prepayment of the FTERE Bronx Portfolio 3 Mortgage Loan. Such prepayment is subject to payment of a prepayment premium equal to 3% of the amount prepaid. In the event any funds have not been released on or before August 7, 2021, the FTERE Bronx Portfolio 3 Borrowers will have one 6-month extension to satisfy the J-51 Exemption Funds Release Conditions, so long as, prior to August 7, 2021, the FTERE Bronx Portfolio 3 Borrowers provide the lender with credit enhancement in the form of cash or a letter of credit in an amount equal to the remaining undisbursed amount of the J-51 Exemption Funds.
“J-51 Exemption Funds Release Conditions” means (with respect to the release of all or a portion of the J-51 Exemption Funds), (a)(i) the New York City Department of Finance has approved the FTERE Bronx Portfolio 3 Borrowers’ J-51 exemption and/or abatement application and/or (ii) the lender is in receipt of reasonably satisfactory evidence that the State of New York Division of Housing and Community Renewal has approved the FTERE Bronx Portfolio 3 Borrowers’ application for an MCI Program rent increase; and (b) with respect to a release of all or a portion of the J-51 Exemption Funds under either or both of (i) and (ii) above, the lender has determined in its sole reasonable discretion that the underwritten net operating income (as calculated pursuant to the loan documents) divided by the outstanding principal balance of the FTERE Bronx Portfolio 3 Mortgage Loan, after giving effect to the disbursement, is equal to or greater than 7.6%.
Lockbox and Cash Management.The FTERE Bronx Portfolio 3 Mortgage Loan is structured with a springing lockbox and springing cash management. Upon the first occurrence of a Cash Sweep Event Period (as defined below), the FTERE Bronx Portfolio 3 Borrowers are required to establish and maintain a lockbox account for the benefit of the lender, to direct all commercial tenants of the FTERE Bronx Portfolio 3 Properties to deposit rent directly into such lockbox account, and to deposit, or cause to be deposited, all rents from residential tenants of the FTERE Bronx Portfolio 3 Properties into such lockbox account within one business day of receipt. Upon the first occurrence of a Cash Sweep Event Period, the lender is required to establish, and the FTERE Bronx Portfolio 3 Borrowers are required to cooperate with the cash management bank to establish, a lender-controlled cash management account, into which all funds in the lockbox account will be required to be deposited, so long as the Cash Sweep Event Period is continuing. During the continuance of a Cash Sweep Event Period, provided no event of default under the FTERE Bronx Portfolio 3 Mortgage Loan documents is continuing, all funds in the cash management account are required to be applied on each monthly payment date: (i) to make the monthly deposits into the real estate tax and insurance reserves as described above under “Escrows and Reserves,” (ii) to pay debt service on the FTERE Bronx Portfolio 3 Mortgage Loan, (iii) to make the monthly deposit into the Recurring Replacements reserve as described above under “Escrows and Reserves,” (iv) to pay operating expenses set forth in the annual budget (which is required to be approved by the lender) and lender-approved extraordinary expenses, and (v) to deposit any remainder into an excess cash flow subaccount to be held as additional security for the FTERE Bronx Portfolio 3 Mortgage Loan during the continuance of such Cash Sweep Event Period. If no Cash Sweep Event Period is continuing, all funds in the excess cash flow subaccount are required to be disbursed to the FTERE Bronx Portfolio 3 Borrowers. Notwithstanding the foregoing, any amounts on deposit in the excess cash flow subaccount as a result of a Cash Sweep Event Period triggered by clause (ii) of the definition of Cash Sweep Event Period are required to be held as additional collateral for the FTERE Bronx Portfolio 3 Mortgage Loan until the FTERE Bronx Portfolio 3 Borrowers provide evidence reasonably satisfactory to the lender that the loan-to-value ratio (without taking into account the funds held in the excess cash flow subaccount) is not more than 67.3%.
“Cash Sweep Event Period” means a period:
| (i) | Commencing upon an event of default under the FTERE Bronx Portfolio 3 Mortgage Loan documents and ending upon the cure, if applicable, of such event of default, or |
| (ii) | Commencing upon, if the J-51 Exemption Funds Release Conditions have not been satisfied, August 7, 2021 and ending on the date that the loan-to-value ratio (based upon $76,680,000 as the loan amount) is not more than 67.3%. Notwithstanding the foregoing, the FTERE Bronx Portfolio 3 Borrowers will have the right, but not the obligation, to end a Cash Sweep Event Period commenced in connection with this clause (ii) by depositing with the lender a cash deposit or a letter of credit in an amount equal to the remaining undisbursed amount of the J-51 Exemption Reserve. Such cash deposit or letter of credit will continue to be held as additional collateral for the loan until the FTERE Bronx Portfolio 3 Borrowers provide evidence reasonably satisfactory to the lender that the loan-to-value ratio (without taking into account such cash deposit or letter of credit) is not more than 67.3%. |
Additional Secured Indebtedness (not including trade debts).None.
Mezzanine Loan and Preferred Equity.Not permitted.
Release of Property.After the expiration of the defeasance lockout period and prior to the monthly payment date occurring in September 2029, the FTERE Bronx Portfolio 3 Borrowers have the right to obtain a release of any one or more individual FTERE Bronx Portfolio 3 Properties, provided no event of default is continuing and subject to the conditions set forth in the FTERE Bronx Portfolio 3 Mortgage Loan documents, including, among others, (1) partial defeasance of the FTERE Bronx Portfolio 3 Mortgage Loan in a principal amount equal to 110% of the allocated loan amount for the individual FTERE Bronx Portfolio 3 Property being released, provided, however, that upon the written request of the FTERE Bronx Portfolio 3 Borrowers and
| This is not a research report and was not prepared by any Underwriter’s research department. Please see additional important information and qualifications at the end of this Term Sheet. |
T-37
| Multifamily – Mid Rise | Loan #1 | Cut-off Date Balance: | $76,680,000 | |
| Various | FTERE Bronx Portfolio 3 | Cut-off Date LTV: | 67.3% | |
| Bronx, NY | UW NCF DSCR: | 2.06x | ||
| UW NOI Debt Yield: | 7.8% |
subject to the lender’s receipt of an updated appraisal, the applicable release amount may be 100% of such allocated loan amount so long as (x) the loan-to-value ratio with respect to all remaining FTERE Bronx Portfolio 3 Properties is not greater than 55.0% and (y) the debt yield with respect to all remaining FTERE Bronx Portfolio 3 Properties is not less than 8.5%, (2) after giving effect to the partial defeasance, the debt yield of the remaining FTERE Bronx Portfolio 3 Properties is greater than the greater of the debt yield immediately prior to the partial defeasance and 7.6%, and (3) certain REMIC-related conditions are satisfied.
Letter of Credit.The FTERE Bronx Portfolio 3 Borrowers have the right, but not the obligation, (x) to end a Cash Sweep Event Period commenced in connection with clause (ii) of the definition of Cash Sweep Event Period by depositing with the lender a letter of credit in an amount equal to the remaining undisbursed amount of the J-51 Exemption Reserve, as described above and (y) to post a letter of credit in connection with an extension of the deadline for satisfaction of the J-51 Exemption Funds Release Conditions.
Right of First Offer / Right of First Refusal.None.
Ground Lease.None.
Terrorism Insurance.The FTERE Bronx Portfolio 3 Borrowers are required to obtain and maintain an “all risk” property insurance policy that covers perils of terrorism and acts of terrorism in an amount equal to the “full replacement cost” of the FTERE Bronx Portfolio 3 Properties together with business income insurance covering not less than the 18-month period commencing at the time of loss, together with an extended period of indemnity endorsement of up to six months. Notwithstanding the foregoing, for so long as the Terrorism Risk Insurance Act of 2002, as extended and modified by the Terrorism Risk Insurance Program Reauthorization Act of 2015 (“TRIPRA”), is in effect (including any extensions thereof or if another federal governmental program is in effect relating to “acts of terrorism” which provides substantially similar protections as TRIPRA), the lender is required to accept terrorism insurance which covers against “covered acts” as defined by TRIPRA (or such other program) but only in the event that TRIPRA (or such other program) continues to cover both domestic and foreign acts of terrorism. See “Risk Factors—Risks Relating to the Mortgage Loans—Terrorism Insurance May Not Be Available for All Mortgaged Properties” in the Preliminary Prospectus.
| This is not a research report and was not prepared by any Underwriter’s research department. Please see additional important information and qualifications at the end of this Term Sheet. |
T-38
(THIS PAGE INTENTIONALLY LEFT BLANK)
T-39
| Office – CBD | Loan #2 | Cut-off Date Balance: | $75,000,000 | |
| 11025, 11065 and11155 Northeast | Bravern Office Commons | Cut-off Date LTV: | 37.7% | |
| 8th Street | U/W NCF DSCR: | 4.53x | ||
| Bellevue, WA 98004 | U/W NOI Debt Yield: | 15.3% |

| This is not a research report and was not prepared by any Underwriter’s research department. Please see additional important information and qualifications at the end of this Term Sheet. |
T-40
| Office – CBD | Loan #2 | Cut-off Date Balance: | $75,000,000 | |
| 11025, 11065 and11155 Northeast | Bravern Office Commons | Cut-off Date LTV: | 37.7% | |
| 8th Street | U/W NCF DSCR: | 4.53x | ||
| Bellevue, WA 98004 | U/W NOI Debt Yield: | 15.3% |
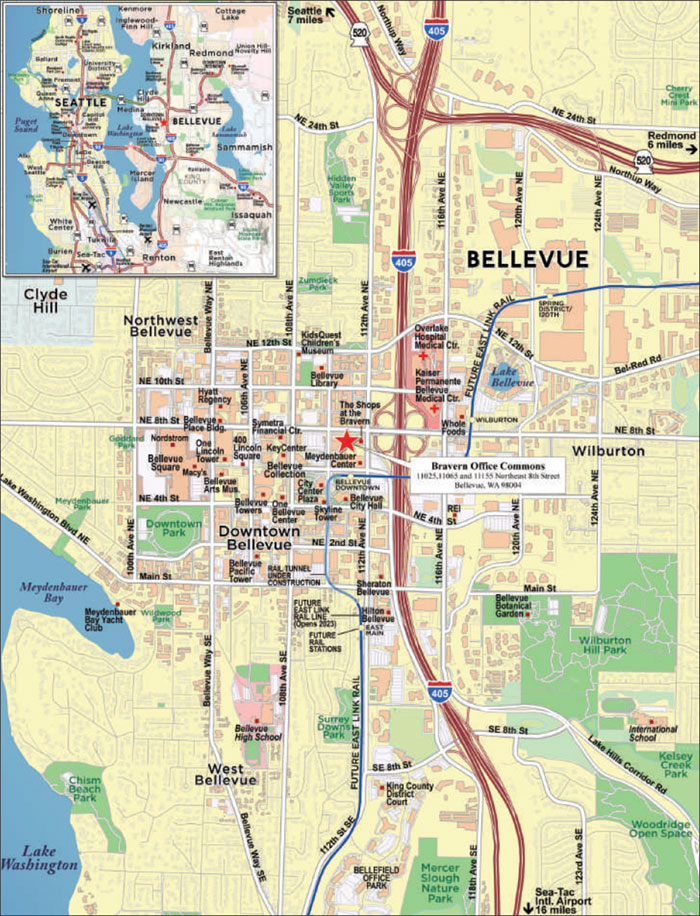
| This is not a research report and was not prepared by any Underwriter’s research department. Please see additional important information and qualifications at the end of this Term Sheet. |
T-41
| Mortgage Loan No. 2 – Bravern Office Commons |
| Mortgage Loan Information | Property Information | ||||||
| Mortgage Loan Seller: | BANA | Single Asset/Portfolio: | Single Asset | ||||
| Credit Assessment (DBRS/Fitch/S&P): | AA(high)(sf)/AA-sf/NR | Location: | Bellevue, WA 98004 | ||||
| Original Balance(1): | $75,000,000 | General Property Type: | Office | ||||
| Cut-off Date Balance(1): | $75,000,000 | Detailed Property Type: | CBD | ||||
| % of Initial Pool Balance: | 6.2% | Title Vesting: | Fee | ||||
| Loan Purpose: | Acquisition | Year Built/Renovated: | 2009/N/A | ||||
| Borrower Sponsor: | QSuper Board as trustee for QSuper | Size: | 749,694 SF | ||||
| Guarantor(2): | Bravern Office Owner, LLC | Cut-off Date Balance per SF(1): | $304 | ||||
| Mortgage Rate: | 3.2033% | Maturity Date Balance per SF(1): | $304 | ||||
| Note Date: | 12/19/2019 | Property Manager: | KG Investment Properties, LLC | ||||
| First Payment Date: | 2/11/2020 | ||||||
| Maturity Date: | 1/11/2027 | ||||||
| Original Term to Maturity: | 84 months | ||||||
| Original Amortization Term: | 0 months | ||||||
| IO Period: | 84 months | Underwriting and Financial Information | |||||
| Seasoning: | 2 months | UW NOI: | $34,858,740 | ||||
| Prepayment Provisions: | LO (26); YM1 (53); O (5) | UW NOI Debt Yield(1): | 15.3% | ||||
| Lockbox/Cash Mgmt Status: | Hard/In Place | UW NOI Debt Yield at Maturity(1): | 15.3% | ||||
| Additional Debt Type(1)(3): | Pari Passu/Subordinate Debt | UW NCF DSCR(1): | 4.53x | ||||
| Additional Debt Balance(1)(3): | $153,000,000/$76,000,000 | Most Recent NOI(5): | N/A | ||||
| Future Debt Permitted (Type): | No (N/A) | 2nd Most Recent NOI(5): | N/A | ||||
| Reserves(3) | 3rd Most Recent NOI(5): | N/A | |||||
| Type | Initial | Monthly | Cap | Most Recent Occupancy: | 100.0% (3/1/2020) | ||
| RE Tax: | $0 | Springing | N/A | 2nd Most Recent Occupancy(6): | 100.0% (12/31/2018) | ||
| Insurance: | $0 | Springing | N/A | 3rd Most Recent Occupancy(6): | 100.0% (12/31/2017) | ||
| Deferred Maintenance: | $452,250 | $0 | N/A | Appraised Value (as of)(7): | $605,000,000 (11/18/2019) | ||
| TI/LC: | $5,943,828 | $0 | N/A | Appraised Value per SF: | $807 | ||
| Microsoft Bridge Rent Reserve: | $1,297,834 | $0 | N/A | Cut-off Date LTV Ratio(1): | 37.7% | ||
| Microsoft Reserve: | $0 | Springing | $30,000,000 | Maturity Date LTV Ratio(1): | 37.7% | ||
| Sources and Uses | ||||||
| Sources | Proceeds | % of Total | Uses | Proceeds | % of Total | |
| Whole Loan(1): | $304,000,000 | 50.2% | Purchase Price(8): | $595,663,103 | 98.3% | |
| Borrower Equity: | $301,872,608 | 49.8% | Reserves: | $7,693,912 | 1.3% | |
| Closing Costs: | $2,515,593 | 0.4% | ||||
| Total Sources: | $605,872,608 | 100.0% | Total Uses: | $605,872,608 | 100.0% | |
| (1) | The Bravern Office Commons Mortgage Loan (as defined below) is part of the Bravern Office Commons Whole Loan (as defined below), which is comprised of threepari passusenior promissory notes (the “Bravern Office Commons Senior Loan”) and one subordinate promissory note with an aggregate original principal amount of $304,000,000. The Cut-off Date Balance per SF, Maturity Date Balance per SF, UW NOI Debt Yield, UW NOI Debt Yield at Maturity, UW NCF DSCR, Cut-off Date LTV Ratio, and Maturity Date LTV Ratio numbers presented above are based on the aggregate principal balance of the promissory notes comprising the Bravern Office Commons Senior Loan. The Cut-off Date Balance per SF, Maturity Date Balance per SF, UW NOI Debt Yield, UW NOI Debt Yield at Maturity, UW NCF DSCR, Cut-off Date LTV Ratio, and Maturity Date LTV Ratio based on the Bravern Office Commons Whole Loan are $406, $406, 11.5%, 11.5%, 3.40x, 50.2% and 50.2%, respectively. |
| (2) | Bravern Office Owner LLC is the single purpose entity borrower. There is no separate non-recourse carveout guarantor or environmental indemnitor for the Bravern Office Commons Whole Loan. |
| (3) | See “The Mortgage Loan” and “Additional Secured Indebtedness (not including trade debts)”below for further discussion of additional debt. |
| (4) | See “Escrows and Reserves”below for further discussion of reserve information. |
| (5) | Historical operating information is not available because the Bravern Office Commons Property (as defined below) was acquired in December 2019. |
| (6) | Historical occupancy is based on the tenant leases, which have been in place since 2009. |
| (7) | The appraiser also provided a “Hypothetical - Go Dark” value of $436,300,000, which results in a Cut-off Date LTV Ratio and a Maturity Date LTV Ratio of 52.3% based on the Bravern Office Commons Senior Loan and 69.7% based on the Bravern Office Commons Whole Loan. |
| (8) | The Purchase Price shown is inclusive of a seller credit of $5,095,235 for free rent outstanding. |
The Mortgage Loan. The second largest mortgage loan (the “Bravern Office Commons Mortgage Loan”) is part of a whole loan (the “Bravern Office Commons Whole Loan”) evidenced by threepari passu senior promissory notes with an aggregate original principal amount of $228,000,000 and one subordinate promissory note with an original principal amount of $76,000,000, all secured by a first priority fee mortgage encumbering condominium units comprising a Class A office property located in Bellevue, Washington (the “Bravern Office Commons Property”). The non-controlling Note A-3, with an original principal amount of $75,000,000, represents the Bravern Office Commons Mortgage Loan. The two otherpari passu senior promissory notes (the “Bravern Office Commons Non-ServicedPari Passu Companion Loans”) and the subordinate promissory note (the “Bravern Office Commons Subordinate Companion Loan”) were included in the BAMLL 2020-BOC securitization transaction. The Bravern Office Commons Whole Loan is being serviced pursuant to the trust and servicing agreement for the BAMLL 2020-BOC securitization transaction. See “Description of the Mortgage Pool—The Whole Loans—The Bravern Office Commons Pari Passu-A/B Whole Loan” and “Pooling and Servicing Agreement—Servicing of the Non-Serviced Mortgage Loans” in the Preliminary Prospectus.
| This is not a research report and was not prepared by any Underwriter’s research department. Please see additional important information and qualifications at the end of this Term Sheet. |
T-42
| Office – CBD | Loan #2 | Cut-off Date Balance: | $75,000,000 | |
| 11025, 11065 and11155 Northeast | Bravern Office Commons | Cut-off Date LTV: | 37.7% | |
| 8th Street | U/W NCF DSCR: | 4.53x | ||
| Bellevue, WA 98004 | U/W NOI Debt Yield: | 15.3% |
| Bravern Office Commons Whole Loan Summary | ||||
| Notes | Original Balance | Cut-off Date Balance | Note Holder | Controlling Piece |
| A-1 | $50,000,000 | $50,000,000 | BAMLL 2020-BOC | No |
| A-2 | $103,000,000 | $103,000,000 | BAMLL 2020-BOC | No |
| A-3 | $75,000,000 | $75,000,000 | BANK 2020-BNK26 | No |
| B | $76,000,000 | $76,000,000 | BAMLL 2020-BOC | Yes |
| Total | $304,000,000 | $304,000,000 | ||
The Borrower and the Borrower Sponsor. The borrower is Bravern Office Owner, LLC (the “Bravern Office Commons Borrower”), a single-purpose Delaware limited liability company with two independent directors. The borrower sponsor is QSuper Board, an Australian statutory corporation established under the Superannuation (State Public Sector) Act 1990 (Queensland Australia), as trustee for QSuper (“QSuper”). QSuper was founded in 1912 and is a superannuation benefits fund in Queensland, Australia, with approximately AUD $113 billion in assets under management as of June 30, 2019. QSuper invests in public equity, fixed income markets, cash and properties in Australia and internationally. QSuper’s investment advisor for the Bravern Office Commons Property is Invesco Advisors, Inc., an affiliate of Invesco, Ltd. (NYSE:IVZ). Invesco, Ltd. is a publicly traded independent investment management firm that as of year-end 2019 managed approximately $1.2 trillion in assets worldwide. There is no non-recourse carveout guarantor or separate environmental indemnitor with respect to the Bravern Office Commons Whole Loan.
The Property. The Bravern Office Commons Property was built in 2009 and consists of two Class A office buildings totaling 749,694 SF that are entirely net-leased to the Microsoft Corporation (“Microsoft”). Building 1 (“Building 1”) is a 12-story building located at the southeast corner of NE 8th Street and 112th Avenue NE that includes 255,171 SF. Building 2 (“Building 2”) is a 23-story building located at the southeast corner of NE 8th Street and 110th Avenue NE that includes 494,523 SF. The Bravern Office Commons Property also includes a seven-level subterranean parking garage that includes 3,130 stalls (1,660 allocated to Microsoft).
The Bravern Office Commons Property is part of larger mixed use development (the “Bravern Development”) that also includes 305,542 SF of high-end retail space (non-collateral) featuring tenants such as Neiman Marcus, Hermes and Louis Vuitton, a Lifetime Fitness (non-collateral) and two luxury residential towers containing 455 units (non-collateral). The Bravern Development is divided into six condominium units: Building 1, Building 2, the parking garage (together, the Bravern Office Commons Property), the retail space, and each of the residential towers. The condominium units are together governed by The Bravern Condominium Association, which is controlled by the Bravern Office Commons Borrower through its voting power (54 of 100 votes) and representation on the board of directors (5 of 9 directors). In general, board decisions are determined by the vote of at least five directors, with each director allocated one vote. Any decision to terminate the condominium or materially and adversely amend the condominium declaration or bylaws requires the approval of (i) eight directors, (ii) all owners other than the owner of the parking garage unit, (iii) the holder of any mortgage on any portion of the Bravern Development and (iv) those mortgagees that represent at least 51% of the vote of the condominium units subject to mortgages. Provided Microsoft is in full occupancy of Building 2, the condominium declaration prohibits the leasing or subleasing for a retail use and trade name to such competitors as Google, Linux/Windows, Apple, Sun Microsystems, IBM, AOL or Red Hat.
The Bravern Office Commons Property is located in downtown Bellevue, Washington adjacent to I-405 at NE 8th Street and 112th Avenue NE, adjacent to the Bellevue Transit Center, and one block from the future East Link Light Rail extension’s Downtown Link station. The East Link Light Rail extension is currently under construction, expected to be completed in 2023, and is expected to provide access to Seattle’s Westlake Station in 24 minutes.
The Tenant. Founded in 1975, Microsoft is one of the world’s largest computer technology companies. It develops and markets software, services and hardware devices for individual consumers and businesses. It generates revenue by developing and licensing software products, designing and selling hardware devices, delivering online advertising globally and selling suites of products and services. In June 2016, Microsoft acquired LinkedIn for $26.2 billion, representing a continuation of the company’s expansion from a software company to a major online business providing Microsoft with the data necessary to support its service-oriented platforms. In April 2019, Microsoft reached a trillion-dollar market capitalization, becoming the third American public company to be valued over $1 trillion, after Apple and Amazon, respectively. Microsoft’s revenue increased by $15.5 billion, or 14%, over the 2019 fiscal year, driven by growth across each of Microsoft’s segments: “Intelligent Cloud” (including server products and cloud services), “Productivity and Business Processes” (including Office and LinkedIn) and “More Personal Computing” (including Surface, Gaming and Windows).
The Bravern Office Commons Property is Microsoft’s single largest lease in the Puget Sound region and Microsoft has been the sole tenant since the Bravern Office Property was delivered in 2009. Microsoft has demonstrated a commitment to the Bravern Office Commons Property, as evidenced by its recent lease renewals and its approximate $181 million investment ($241 PSF) into the build-out of its space, which included increasing the HVAC capacity to nearly twice that of market standards and increasing electrical service capacity to nearly double the original design with upgraded electrical infrastructure equipment and fully redundant permanent power. Microsoft also invested in a comprehensive security system with card readers and cameras at all entry vestibules to the office floors, security cameras and a monitored panic communication alarm system and a secured access system with card readers in the parking garage. Microsoft currently uses the Bravern Office Commons Property for software engineers staffed on artificial intelligence projects, Microsoft’s United States sales and marketing teams and Bing employees. Microsoft leases 29 other buildings in the Eastside Submarket of the Puget Sound region and is expected to benefit from the completion of the East Link Light Rail extension, which is expected to provide direct access to Microsoft’s world headquarters in Redmond, Washington in approximately 10 minutes.
Microsoft’s lease for Building 1 expires on June 30, 2025; Microsoft has two remaining five-year extension options, which require at least one year’s notice. The lease for Building 1 requires an annual base rent (effective July 1, 2020) of $8,548,229 ($33.50 PSF) with 3.0% annual increases. Microsoft’s lease for Building 2 expires on August 31, 2025; Microsoft has one five-year extension option remaining, which requires at least one year’s notice. The lease for Building 2 requires an annual base rent (as of June 1, 2020) of $19,780,920 ($40.00 PSF) with 3.0% annual increases. The Building 1 and Building 2 leases were extended in February 2017 and July 2019, respectively. Neither lease contains any termination or contraction option. Microsoft is required to take 1,660 allocated parking stalls (3.25 stalls per 1,000 SF) in the subterranean parking garage at an annual base rent as of June 1, 2020 of $4,588,948 ($6.12 PSF), with 3.0% annual rent increases and has rights to an additional 730 stalls for transient use.
| This is not a research report and was not prepared by any Underwriter’s research department. Please see additional important information and qualifications at the end of this Term Sheet. |
T-43
| Office – CBD | Loan #2 | Cut-off Date Balance: | $75,000,000 | |
| 11025, 11065 and11155 Northeast | Bravern Office Commons | Cut-off Date LTV: | 37.7% | |
| 8th Street | U/W NCF DSCR: | 4.53x | ||
| Bellevue, WA 98004 | U/W NOI Debt Yield: | 15.3% |
In connection with its recent lease extension, Microsoft is entitled to free rent at Building 2 for June 2020, June 2021 and June 2022 totaling $5,095,235, which amount was credited against the purchase price for the Bravern Office Commons Property by the seller at acquisition and has not been reserved for. Additionally, Microsoft is entitled to (i) a $7,655,130 tenant improvement allowance that may be disbursed upon request prior to January 31, 2021, of which $998,598 remained outstanding as of the loan origination date and (ii) a $4,945,230 second tenant improvement allowance that may be disbursed upon request prior to March 31, 2022.
The following table presents certain information relating to the sole tenant at the Bravern Office Commons Property:
| Tenant Summary(1) | ||||||||
| Tenant Name | Credit Rating (Fitch/Moody’s/S&P) | Tenant SF | Approx. % of SF | Annual UW Rent | % of Total Annual UW Rent | Annual UW Rent PSF | Lease Expiration | Term. Options (Y/N) |
| Microsoft Corporation (Building 1) | AA+/Aaa/AAA | 255,171 | 34.0% | $8,978,592 | 30.2% | $35.19 | 6/30/2025 | N |
| Microsoft Corporation (Building 2 Low)(2) | AA+/Aaa/AAA | 249,719 | 33.3% | $10,482,226 | 35.3% | $41.98 | 8/31/2025 | N |
| Microsoft Corporation (Building 2 High)(2) | AA+/Aaa/AAA | 244,804 | 32.7% | $10,275,914 | 34.6% | $41.98 | 8/31/2025 | N |
| Subtotal/Wtd. Avg. | 749,694 | 100.0% | $29,736,732 | 100.0% | $39.67 | |||
| Vacant | 0 | 0.0% | $0 | 0.0% | $0.00 | |||
| Total/Wtd. Avg. | 749,694 | 100.0% | $29,736,732 | 100.0% | $39.67 | |||
| (1) | Information obtained from the underwritten rent roll. |
| (2) | Microsoft is entitled to free rent at Building 2 for June 2020, June 2021 and June 2022 totaling $5,095,235 (which amount was credited against the purchase price for the Bravern Office Commons Property by the seller at acquisition and has not been reserved for). |
The following table presents certain information relating to the lease rollover schedule at the Bravern Office Commons Property:
| Lease Rollover Schedule(1) | ||||||||
| Year | # of Leases Rolling | SF Rolling | Annual UW Rent PSF Rolling | Approx. % of Total SF Rolling | Approx. Cumulative % of SF Rolling | Total UW Rent Rolling | Approx. % of Total Rent Rolling | Approx. Cumulative % of Total Rent Rolling |
| MTM | 0 | 0 | $0.00 | 0.0% | 0.0% | $0 | 0.0% | 0.0% |
| 2020 | 0 | 0 | $0.00 | 0.0% | 0.0% | $0 | 0.0% | 0.0% |
| 2021 | 0 | 0 | $0.00 | 0.0% | 0.0% | $0 | 0.0% | 0.0% |
| 2022 | 0 | 0 | $0.00 | 0.0% | 0.0% | $0 | 0.0% | 0.0% |
| 2023 | 0 | 0 | $0.00 | 0.0% | 0.0% | $0 | 0.0% | 0.0% |
| 2024 | 0 | 0 | $0.00 | 0.0% | 0.0% | $0 | 0.0% | 0.0% |
| 2025 | 2 | 749,694 | $39.67 | 100.0% | 100.0% | $29,736,732 | 100.0% | 100.0% |
| 2026 | 0 | 0 | $0.00 | 0.0% | 100.0% | $0 | 0.0% | 100.0% |
| 2027 | 0 | 0 | $0.00 | 0.0% | 100.0% | $0 | 0.0% | 100.0% |
| 2028 | 0 | 0 | $0.00 | 0.0% | 100.0% | $0 | 0.0% | 100.0% |
| 2029 | 0 | 0 | $0.00 | 0.0% | 100.0% | $0 | 0.0% | 100.0% |
| 2030 | 0 | 0 | $0.00 | 0.0% | 100.0% | $0 | 0.0% | 100.0% |
| 2031 & Beyond | 0 | 0 | $0.00 | 0.0% | 100.0% | $0 | 0.0% | 100.0% |
| Vacant | 0 | 0 | $0.00 | 0.0% | 100.0% | $0 | 0.0% | 100.0% |
| Total/Wtd. Avg. | 2 | 749,694 | $39.67 | 100.0% | $29,736,732 | 100.0% | ||
| (1) | Information obtained from the underwritten rent roll. |
The Market. The Bravern Office Commons Property is located in the center of downtown Bellevue, approximately ten miles east of the Seattle, Washington central business district. Bellevue is the fifth largest city in Washington with a resident population of 130,000 and is considered an economic and cultural hub of the Seattle-area’s Eastside.
Bellevue is a metropolitan hub for high-tech companies encompassing such sectors as software development, internet and network services, multi and digital media and biotech. Microsoft Corporation and the University of Washington are within close proximity. Bellevue is home to five of the 25 largest public companies in Washington including Puget Sound Energy, PACCAR, Western Wireless, T-Mobile USA and Esterline Technologies, and is also home to seven of the 25 fastest-growing private companies in Washington. Amazon, which is currently headquartered in Seattle, has leased over 1.0 million SF in Bellevue and is expected to have 4,500 employees in Bellevue by the end of 2020. Additionally, Facebook/Oculus, Google and Salesforce, among others, have significant footprints within the market.
To complement the nearly 6.9 million SF of office space in downtown Bellevue, there is approximately 5.0 million SF of retail and entertainment space in downtown Bellevue, notably including the Bellevue Collection, which contains 250 destination retail stores, 18 restaurants, a 16-screen premier cinema, 700 luxury hotel rooms and 10,000 free retail parking spaces.
| This is not a research report and was not prepared by any Underwriter’s research department. Please see additional important information and qualifications at the end of this Term Sheet. |
T-44
| Office – CBD | Loan #2 | Cut-off Date Balance: | $75,000,000 | |
| 11025, 11065 and11155 Northeast | Bravern Office Commons | Cut-off Date LTV: | 37.7% | |
| 8th Street | U/W NCF DSCR: | 4.53x | ||
| Bellevue, WA 98004 | U/W NOI Debt Yield: | 15.3% |
According to the appraisal, the Bravern Office Commons Property is located in the Eastside Puget Sound office market which has a limited supply of large block office space and has seen positive absorption every quarter since 2014. The Bravern Office Commons Property is located in the Bellevue CBD submarket, which as of the third quarter of 2019, had approximately 8.2 million SF of Class A space with a 3.8% vacancy rate, and an average annual direct asking rent of $58.30 PSF. The Bellevue CBD submarket’s demand is driven by its high-quality office inventory, retail and amenity base, short commute times from Puget Sound’s residential neighborhoods, and the growth of the technology and software industry.
According to the appraisal, the estimated 2019 population within a one-, three- and five-mile radius of the Bravern Office Commons Property was 23,887, 100,443 and 243,345, respectively. Over the period 2010-2019, the population within a one-mile radius grew at an annual rate of over 4.3%. The 2019 average household income within the same radii was $155,886, $165,545 and $173,927, respectively.
The following table presents recent leasing data at comparable office properties with respect to the Bravern Office Commons Property:
| Comparable Lease Summary | |||||||||
Property Location | Distance from Subject (miles) | Property Size (SF) | Tenant | Lease Area (SF) | Lease Date | Initial Rent PSF | Lease Term (yrs.) | TI’s PSF / Annual Escalations (% or $PSF) / Free Rent (mos) | Lease Type |
| Bravern Office Commons 11025, 11065 and11155 Northeast 8th Street Bellevue, WA 98004 | N/A | 749,694 | Microsoft Corporation | 749,694 | Jan/May-09 | $33.50-$40.00(1) | 16.0 | $16.81 / 3.0% / 3 | NNN |
| Summit Complex 10885 N.E. Fourth Street Bellevue, WA 98004 | 0.4 | 524,130 | Amazon WeWork TEKsystems, Inc WeWork | 374,224 14,503 10,655 118,556 | Jan-21 Aug-19 Jul-19 Mar-19 | $34.00 $43.80 $33.50 $35.50 | 15.0 12.0 2.8 12.9 | $110.00 / NAV / NAV NAV / $1 / NAV $10.00 / $1 / 0 $100.00 / $1 / 0 | NNN |
| One Twelfth @ Twelfth 1100, 1110 & 1120 112th Avenue NE Bellevue, WA 98004 | 0.2 | 480,389 | Foundation Bank Naficy Plastic Surgery Jacobs Engineering | 13,361 6,057 135,779 96,441 | Oct-20 Apr-20 Apr-20 Apr-20 | $36.50 $40.00 $40.00 $33.00 | 5.3 7.0 7.0 10.0 | $6.00 / $1 / 3 $0.00 / 3% / 0 $35.00 / 3% / 0 $45.00 / $1 / 3 | NNN |
| 929 Office Tower 929 108th Ave NE Bellevue, WA 98004 | 0.3 | 462,000 | SCGD Capital Davis Wright Tremaine | 1,576 18,000 | Oct-19 Apr-19 | $44.00 $40.50 | 5.1 10.0 | $80.00 / 3% / 1 $85.00 / 3% / 1 | NNN |
| Symetra Financial Center 777 108th Avenue NE Bellevue, WA 98004 | 0.3 | 445,089 | Unify Square Grab Technology | 5,557 18,943 | Jul-19 Sep-18 | $52.00 $46.00 | 6.1 3.6 | $30.00 / 2.5% / 1 $15.00 / $1 / 1 | BYS |
| Civica Office Commons 205-225 108th Ave NE Bellevue, WA 98004 | 0.6 | 319,608 | Confidential UBS Waggener | 47,985 23,222 46,801 47,398 | Dec-20 Sep-20 Jan-20 Mar-19 | $45.00 $42.00 $35.00 $37.00 | 10.3 7.0 10.0 5.3 | $65.00 / 3% / 3 $70.00 / 3% / 0 $41.77 / $1 / 3 $56.67 / 3% / 3 | NNN |
| Skyline Tower 10900 NE 4th Street Bellevue, WA 98004 | 0.5 | 416,755 | Financial Resources Group UIPath Eagle View Technologies | 3,232 22,795 37,000 55,585 | Mar-20 Jul-19 Mar-19 Jun-18 | $37.00 $34.00 $43.50 $35.00 | 5.2 5.2 10.0 10.8 | $55.00 / 3% / 2 $45.00 / $1 / 25 NAV / 3% / NAV $90.00 / 3% / 10 | NNN |
| 400 Lincoln Square 400 Bellevue Way Bellevue, WA 98004 | 0.7 | 712,002 | Bank of America Pokemon | 76,740 102,112 | Jan-18 Nov-17 | $43.50 $42.00 | 11.0 12.5 | $68.00 / 3% / 0 $110.00 / 3% / 0 | NNN |
| Tower 333 333 108th Avenue NE Bellevue, WA 98004 | 0.5 | 414,964 | Amazon | 392,977 | Mar-19 | $34.00 | 16.0 | $110.00 / $1 / 0 | NNN |
Source: Appraisal.
| (1) | Initial Rent PSF is the effective rent as of the most recent renewal terms. |
The following table presents the appraisal’s market rent conclusions:
| Market Rent Summary | |
| Office | |
| Market Rent | $42.00 |
| Lease Term (Yrs.) | 10 |
| Rental Increase Projection | 3.0%per annum |
| This is not a research report and was not prepared by any Underwriter’s research department. Please see additional important information and qualifications at the end of this Term Sheet. |
T-45
| Office – CBD | Loan #2 | Cut-off Date Balance: | $75,000,000 | |
| 11025, 11065 and11155 Northeast | Bravern Office Commons | Cut-off Date LTV: | 37.7% | |
| 8th Street | U/W NCF DSCR: | 4.53x | ||
| Bellevue, WA 98004 | U/W NOI Debt Yield: | 15.3% |
The following table presents recent office sales comparables with respect to the Bravern Office Commons Property:
| Sales Comparables | |||||||||
| Property, Address | Sale Date | Year Built/ Renovated | Distance from | NRA (SF) | Sale Price | Sale Price PSF | Occ. | NOI PSF | Cap Rate |
| Bravern Office Commons 11025, 11065 and11155 Northeast 8th Street Bellevue, WA 98004 | Dec 2019(1) | 2009 | N/A | 749,694 | $608,000,000(1) | $811(1) | 100% | $47 | 5.8% |
| Amazon VIII 325 9th Avenue N. Seattle, WA 98109 | Nov 2019 (under contract) | 2015 | 9.9 Miles | 317,804 | $270,000,000 | $850 | 100% | $38 | 4.5% |
| Sunset North 3120, 3150 & 3180 139th Avenue SE Bellevue, WA 98005 | Sep 2019 | 1999 / 2019 | 4.0 Miles | 464,062 | $227,000,000 | $489 | 99% | $30 | 6.0% |
Newport Corporate Center Bellevue, WA 98006 | Apr 2019 | 1988 | 4.0 Miles | 996,816 | $467,500,000 | $469 | 100% | $29 | 6.1% |
| Troy Laundry Block 300 Boren Ave N Seattle, WA 98109 | Mar 2019 | 2016 | 9.8 Miles | 811,463 | $740,000,000 | $912 | 100% | $40 | 4.4% |
| Redmond Town Centre Office 7332 - 166th Avenue S.E. and 7277 - 164th Avenue S.E. Redmond, WA 98052 | Jun 2018 | 1997 / 2000 | 6.1 Miles | 610,230 | $268,400,000 | $440 | 100% | $26 | 5.9% |
| 202 Westlake 202 Westlake Avenue North Seattle, WA 98109 | May 2018 | 2013 | 10.1 Miles | 130,528 | $129,500,000 | $992 | 100% | $43 | 4.4% |
| Tilt 49 1812 Boren Seattle, WA 98101 | Dec 2017 | 2017 | 10.2 Miles | 290,573 | $268,500,000 | $924 | 100% | $40 | 4.4% |
| Center 425 425 106th Avenue N.E. Bellevue, WA 98004 | Oct 2017 | 2017 | 0.6 Miles | 356,909 | $313,000,000 | $877 | 100% | $41 | 4.7% |
Source: Appraisal.
| (1) | Information based on purchase agreement. |
| This is not a research report and was not prepared by any Underwriter’s research department. Please see additional important information and qualifications at the end of this Term Sheet. |
T-46
| Office – CBD | Loan #2 | Cut-off Date Balance: | $75,000,000 | |
| 11025, 11065 and11155 Northeast | Bravern Office Commons | Cut-off Date LTV: | 37.7% | |
| 8th Street | U/W NCF DSCR: | 4.53x | ||
| Bellevue, WA 98004 | U/W NOI Debt Yield: | 15.3% |
Underwritten Net Cash Flow.The following table presents certain information relating to the Underwritten Net Cash Flow of the Bravern Office Commons Property:
| Cash Flow Analysis(1) | ||
| UW | UW PSF | |
| Gross Potential Rent(2) | $29,736,732 | $39.67 |
| Total Recoveries | $10,445,629 | $13.93 |
| Parking Income(3) | $7,205,699 | $9.61 |
| Vacancy | ($2,009,118) | ($2.68) |
| Effective Gross Income | $45,378,942 | $60.53 |
| Real Estate Taxes | $4,774,948 | $6.37 |
| Insurance | $357,670 | $0.48 |
| Other Operating Expenses | $5,387,584 | $7.19 |
| Total Expenses | $10,520,202 | $14.03 |
| Net Operating Income | $34,858,740 | $46.50 |
| Capital Expenditures | $187,424 | $0.25 |
| TI/LC | $1,122,150 | $1.50 |
| Net Cash Flow | $33,549,166 | $44.75 |
| Occupancy % | 95.0% | |
| NOI DSCR(4) | 4.71x | |
| NCF DSCR(4) | 4.53x | |
| NOI Debt Yield(4) | 15.3% | |
| NCF Debt Yield(4) | 14.7% | |
| (1) | Historical operating figures are not available because the Bravern Office Commons Property was acquired in December 2019. | |
| (2) | Gross Potential Rent is based on the average rent over the loan term pursuant to Microsoft’s leases. |
| (3) | Parking Income includes the average rent over the loan term pursuant to Microsoft’s lease for parking ($4,906,134) and budgeted transient parking, inclusive of a 5% vacancy assumption. |
| (4) | Debt service coverage ratios and debt yields are based on the Bravern Office Commons Senior Loan and exclude the Bravern Office Commons Subordinate Companion Loan. |
Escrows and Reserves.
Real Estate Taxes– So long as no event of default is continuing and real estate taxes are paid prior to incurring late payment penalties or becoming delinquent, monthly reserves for real estate taxes are waived.
Insurance- So long as no event of default is continuing and the Bravern Office Commons Property is covered by a blanket insurance policy for which its premiums are timely paid, monthly reserves for insurance are waived.
Deferred Maintenance- The Bravern Office Commons Borrower deposited $452,250 for deferred maintenance at loan origination, representing 100% of the cost for completion of garage repairs and 105% of the estimated costs for other immediate repairs.
TI/LC Reserve -The Bravern Office Commons Borrower deposited $5,943,828 at loan origination for outstanding tenant improvements and leasing commissions outstanding to Microsoft.
Microsoft Bridge Rent Reserve - The Bravern Office Commons Borrower deposited $1,297,834 at loan origination for the aggregate rent differential between (a) Microsoft’s base rent as of loan origination and (b) Microsoft’s base rent commencing June 1, 2020 for Building 2 and Microsoft’s base rent commencing July 1, 2020 for the remainder of its leased space. Funds in the Microsoft Bridge Rent Reserve are required to be released to the Bravern Office Commons Borrower on July 1, 2020, provided no event of default exists.
Microsoft Reserve –During a Microsoft Trigger Period (as defined below), all excess cash, after payment of debt service, other loan reserves, condominium charges, cash management bank fees and operating expenses, is required to be deposited to the Microsoft Reserve until such time as the amount on deposit in the Microsoft Reserve equals the Microsoft Reserve Cap (as defined below). Funds in the Microsoft Reserve may be withdrawn by the Bravern Office Commons Borrower for tenant improvement and leasing commissions. In lieu of the excess cash deposits to the Microsoft Reserve, the Bravern Office Commons Borrower is permitted to deliver a letter of credit in the amount of the Microsoft Reserve Cap, or such lesser amount which when added to the then-current amount of the Microsoft Reserve equals the Microsoft Reserve Cap. At the time Microsoft’s lease expires, if the Microsoft Reserve Cap is not met, the Bravern Office Commons Borrower is required to deposit the amount of such shortfall as either a letter of credit or cash deposit.
A “Microsoft Trigger Period” will commence upon any of: (i) Microsoft ceasing to be in occupancy of more than 375,000 SF of its leased space for more than 30 consecutive days, (ii) Microsoft seeing bankruptcy protection, (iii) Microsoft being in default under its lease beyond any notice and cure periods or giving notice of its intention to terminate its lease, (iv) Microsoft being downgraded below an investment-grade rating by at least two rating agencies or
| This is not a research report and was not prepared by any Underwriter’s research department. Please see additional important information and qualifications at the end of this Term Sheet. |
T-47
| Office – CBD | Loan #2 | Cut-off Date Balance: | $75,000,000 | |
| 11025, 11065 and11155 Northeast | Bravern Office Commons | Cut-off Date LTV: | 37.7% | |
| 8th Street | U/W NCF DSCR: | 4.53x | ||
| Bellevue, WA 98004 | U/W NOI Debt Yield: | 15.3% |
(v) if Microsoft has not already extended its lease, upon the earlier of (A) Microsoft giving notice not to renew and (B) the date that is 12 months prior to the current expiration of the Microsoft lease. A Microsoft Trigger Period will end when (a) the Microsoft space is re-leased or extended to Microsoft (or partially re-leased to Microsoft for a minimum of five years so that the debt yield is at least 8.0%), (b) the Microsoft space is leased to a replacement tenant that is acceptable to the lender and such tenant has taken occupancy, commenced paying rent, and all landlord obligations required for such tenant have been satisfied, or (c) the amount in the Microsoft Reserve has reached the Microsoft Reserve Cap. Notwithstanding the foregoing, a Microsoft Trigger Event will not occur upon (1) a sublease of the Microsoft space, (2) Microsoft vacating 50% or less of its leased space or (3) an early amendment of the Microsoft lease, provided that, in each case, the debt yield is at least 8.0%.
The “Microsoft Reserve Cap” means $30,000,000, or, if triggered by clause (i) of the definition of Microsoft Trigger Period, $40 PSF with respect to the vacated portion of the Microsoft space.
Lockbox and Cash Management. The Bravern Office Commons Whole Loan is structured with a hard lockbox and in-place cash management. Revenues from the Bravern Office Commons Property are required to be deposited directly into the lockbox account and transferred daily into the lender-controlled cash management account to be applied and disbursed in accordance with the Bravern Office Commons Whole Loan documents. During the occurrence and continuance of a Trigger Period, all excess cash is required to be held as additional collateral for the Bravern Office Commons Whole Loan.
A “Trigger Period” means the period during which any of (a) a Microsoft Trigger Period is continuing (b) an event of default is continuing, (c) the property manager (unless replaced with a qualified manager) has sought bankruptcy protection, until the action is dismissed or discharged without any adverse consequences to the Bravern Office Commons Property or to the Bravern Office Commons Whole Loan or (d) the Bravern Office Commons Borrower has sought bankruptcy protection. If triggered by clause (d) above, the Trigger Period will not be cured.
Additional Secured Indebtedness (not including trade debts). The Bravern Office Commons Property also secures the Bravern Office Commons Non-ServicedPari Passu Companion Loans, which have an aggregate Cut-off Date principal balance of $153,000,000 and the Bravern Office Commons Subordinate Companion Loan, which has a Cut-off Date principal balance of $76,000,000, which all accrue interest at the same interest rate as the Bravern Office Commons Mortgage Loan. The Bravern Office Commons Mortgage Loan and the Bravern Office Commons Non-ServicedPari Passu Companion Loans are senior in payment rights to the Bravern Office Commons Subordinate Companion Loan. The holders of the Bravern Office Commons Mortgage Loan, the Bravern Office Commons Non-ServicedPari Passu Companion Loans and the Bravern Office Commons Subordinate Companion Loan have entered into a co-lender agreement which sets forth the allocation of collections on the Bravern Office Commons Whole Loan. See “Description of the Mortgage Pool—The Whole Loans—The Bravern Office Commons Pari Passu-A/B Whole Loan” in the Preliminary Prospectus.
| Bravern Office Commons Subordinate Companion Loan Summary | ||||||||
| Original Principal Balance | Interest Rate | Original Term (mos) | Original Amortization Term (mos) | Original IO Term (mos) | Total Debt UW NCF DSCR | Total Debt UW NOI Debt Yield | Total Debt Cutoff Date LTV | |
| Bravern Office Commons Subordinate Companion Loan | $76,000,000 | 3.2033% | 84 | 0 | 84 | 3.40x | 11.5% | 50.2% |
Mezzanine Loan and Preferred Equity.Not permitted.
Release of Property.Not permitted.
Right of First Offer/Right of First Refusal.None.
Ground Lease. None.
Letter of Credit.None.
Terrorism Insurance.The Bravern Office Commons Borrower is required to obtain and maintain “all risk” property insurance that covers perils and acts of terrorism in an amount equal to the full replacement cost of the Bravern Office Commons Property and business interruption insurance for 24 months with a 365-day extended period of indemnity. If such insurance policy excludes acts of terrorism, the Bravern Office Commons Borrower is required to obtain and maintain a stand-alone policy that provides for the same coverage,provided the Bravern Office Commons Borrower will not be required to pay annual premiums in excess of two times the then-current premiums for the Bravern Office Commons Property on a stand-alone basis (excluding the terrorism component of such insurance) for such terrorism coverage. See “Risk Factors—Risks Relating to the Mortgage Loans—Terrorism Insurance May Not Be Available for All Mortgaged Properties” in the Preliminary Prospectus.
| This is not a research report and was not prepared by any Underwriter’s research department. Please see additional important information and qualifications at the end of this Term Sheet. |
T-48
(THIS PAGE INTENTIONALLY LEFT BLANK)
T-49
| Office - CBD | Loan #3 | Cut-off Date Balance: | $70,000,000 | |
| 560 Mission Street | 560 Mission Street | Cut-off Date LTV: | 35.6% | |
| San Francisco, CA 94105 | U/W NCF DSCR: | 5.23x | ||
| U/W NOI Debt Yield: | 14.2% |

| This is not a research report and was not prepared by any Underwriter’s research department. Please see additional important information and qualifications at the end of this Term Sheet. |
T-50
| Office - CBD | Loan #3 | Cut-off Date Balance: | $70,000,000 | |
| 560 Mission Street | 560 Mission Street | Cut-off Date LTV: | 35.6% | |
| San Francisco, CA 94105 | U/W NCF DSCR: | 5.23x | ||
| U/W NOI Debt Yield: | 14.2% |
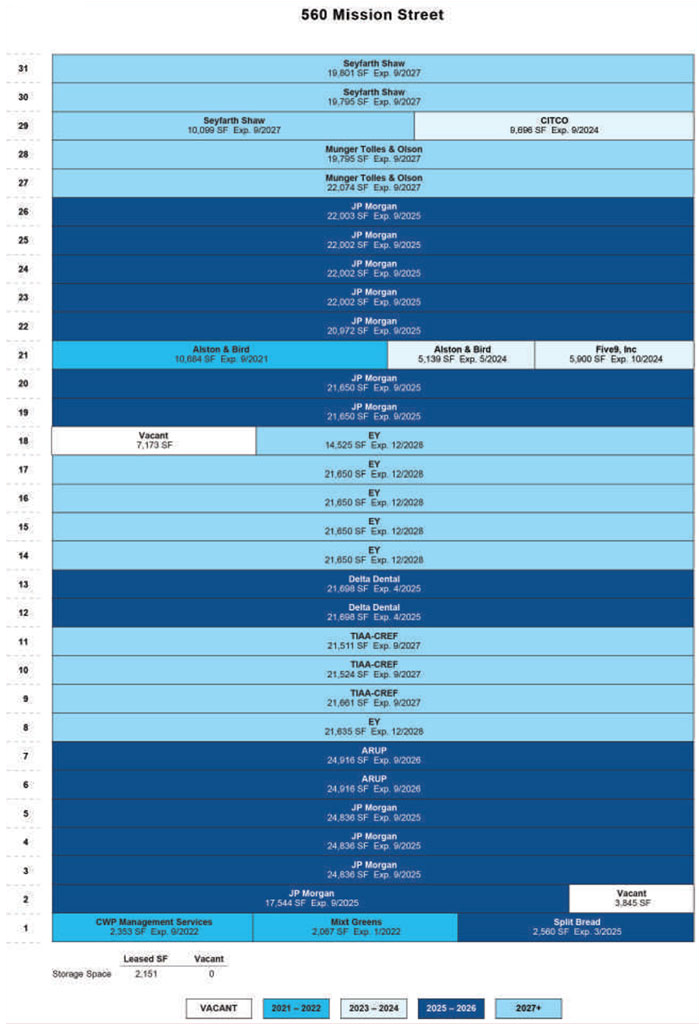
| This is not a research report and was not prepared by any Underwriter’s research department. Please see additional important information and qualifications at the end of this Term Sheet. |
T-51
| Office - CBD | Loan #3 | Cut-off Date Balance: | $70,000,000 | |
| 560 Mission Street | 560 Mission Street | Cut-off Date LTV: | 35.6% | |
| San Francisco, CA 94105 | U/W NCF DSCR: | 5.23x | ||
| U/W NOI Debt Yield: | 14.2% |

| This is not a research report and was not prepared by any Underwriter’s research department. Please see additional important information and qualifications at the end of this Term Sheet. |
T-52
| Mortgage Loan No. 3 – 560 Mission Street |
| Mortgage Loan Information | Property Information | ||||||
| Mortgage Loan Seller: | BANA | Single Asset/Portfolio: | Single Asset | ||||
| Credit Assessment (DBRS/Fitch/S&P): | AA(sf)/AAsf/NR | Location: | San Francisco, CA 94105 | ||||
| Original Balance(1): | $70,000,000 | General Property Type: | Office | ||||
| Cut-off Date Balance(1): | $70,000,000 | Detailed Property Type: | CBD | ||||
| % of Initial Pool Balance: | 5.8% | Title Vesting: | Fee | ||||
| Loan Purpose: | Recapitalization | Year Built/Renovated: | 2002/N/A | ||||
| Borrower Sponsor: | National Office Partners LLC | Size: | 668,149 SF | ||||
| Guarantor(2): | NOP 560 Mission, LLC | Cut-off Date Balance per SF(1): | $449 | ||||
| Mortgage Rate: | 2.5890% | Maturity Date Balance per SF(1): | $449 | ||||
| Note Date: | 12/5/2019 | Property Manager: | Commonwealth Partners | ||||
| First Payment Date: | 1/6/2020 | Management Services, L.P. | |||||
| Maturity Date: | 12/6/2029 | (borrower-related) | |||||
| Original Term to Maturity: | 120 months | Underwriting and Financial Information | |||||
| Original Amortization Term: | 0 months | UW NOI: | $42,674,098 | ||||
| IO Period: | 120 months | UW NOI Debt Yield(1): | 14.2% | ||||
| Seasoning: | 3 months | UW NOI Debt Yield at Maturity(1): | 14.2% | ||||
| Prepayment Provisions(3): | LO (27) ;DEF/YM1 (86); O (7) | UW NCF DSCR(1): | 5.23x | ||||
| Lockbox/Cash Mgmt Status: | Hard/Springing | Most Recent NOI: | $38,313,473 (9/30/2019 TTM) | ||||
| Additional Debt Type(1)(4): | Pari Passu | 2nd Most Recent NOI: | $37,869,525 (12/31/2018) | ||||
| Additional Debt Balance(1)(4): | $230,000,000 | 3rd Most Recent NOI: | $30,771,436 (12/31/2017) | ||||
| Future Debt Permitted (Type)(5): | Yes (Mezzanine) | Most Recent Occupancy: | 98.4% (10/31/2019) | ||||
| Reserves(6) | 2nd Most Recent Occupancy: | 97.3% (12/31/2018) | |||||
| Type | Initial | Monthly | Cap | 3rd Most Recent Occupancy: | 97.8% (12/31/2017) | ||
| RE Tax: | $0 | Springing | N/A | Appraised Value (as of): | $842,000,000 (10/31/2019) | ||
| Insurance: | $0 | Springing | N/A | Appraised Value per SF: | $1,260 | ||
| Replacement Reserve: | $0 | Springing | $267,260 | Cut-off Date LTV Ratio(1): | 35.6% | ||
| TI/LC Reserve: | $2,152,612 | Springing | $2,004,447 | Maturity Date LTV Ratio(1): | 35.6% | ||
| Sources and Uses | ||||||
| Sources | Proceeds | % of Total | Uses | Proceeds | % of Total | |
| Whole Loan(1): | $300,000,000 | 100.0% | Return of Equity(7): | $295,451,251 | 98.5% | |
| Closing Costs: | $2,396,137 | 0.8% | ||||
| Reserves: | $2,152,612 | 0.7% | ||||
| Total Sources: | $300,000,000 | 100.0% | Total Uses: | $300,000,000 | 100.0% | |
| (1) | The 560 Mission Street Mortgage Loan (as defined below) is part of the 560 Mission Street Whole Loan (as defined below), which is comprised of eightpari passupromissory notes in the aggregate original principal amount of $300,000,000. The Cut-off Date Balance per SF, Maturity Date Balance per SF, UW NOI Debt Yield, UW NOI Debt Yield at Maturity, UW NCF DSCR, Cut-off Date LTV Ratio and Maturity Date LTV Ratio numbers presented above are based on the aggregate principal balance of the promissory notes comprising the 560 Mission Street Whole Loan. |
| (2) | NOP 560 Mission, LLC is the single purpose entity borrower. There is no separate non-recourse carveout guarantor or environmental indemnitor for the 560 Mission Street Whole Loan. |
| (3) | Defeasance of the 560 Mission Street Whole Loan is permitted at any time after the earlier to occur of (a) the end of the two-year period commencing on the closing date of the securitization of the last portion of the 560 Mission Street Whole Loan to be securitized and (b) December 5, 2022. The assumed prepayment lockout period of 27 payments is based on the closing date of this transaction in March 2020. |
| (4) | See “Additional Secured Indebtedness (not including trade debts)”below for further discussion of additional debt. |
| (5) | See “Mezzanine Loan and Preferred Equity”below for further discussion of the permitted future mezzanine loan. |
| (6) | See “Escrows and Reserves”below for further discussion of reserve information. |
| (7) | The 560 Mission Street Property (as defined below) was previously unencumbered. The borrower sponsor constructed the 560 Mission Street Property in 2002. |
The Mortgage Loan. The third largest mortgage loan (the “560 Mission Street Mortgage Loan”) is part of a whole loan (the “560 Mission Street Whole Loan”) co-originated by Bank of America, National Association and DBR Investments Co. Limited and evidenced by eightpari passu promissory notes in the aggregate original principal amount of $300,000,000. The 560 Mission Street Whole Loan is secured by a first priority fee mortgage encumbering a 668,149 SF office building located in San Francisco, California (the “560 Mission Street Property”). The 560 Mission Street Mortgage Loan is evidenced by the non-controlling Note A-2-A-1 with an original principal amount of $70,000,000. The remaining promissory notes comprising the 560 Mission Street Whole Loan (the “560 Mission Street Non-ServicedPari Passu Companion Loans”) are summarized in the below table and either have been or are expected to be contributed to a securitization transaction. The 560 Mission Street Whole Loan is being serviced pursuant to the pooling and servicing agreement for the BMARK 2020-B16 securitization trust. See “Description of the Mortgage Pool—The Whole Loans—The Non-Serviced Pari Passu Whole Loans” and “Pooling and Servicing Agreement—Servicing of the Non-Serviced Mortgage Loans” in the Preliminary Prospectus.
| This is not a research report and was not prepared by any Underwriter’s research department. Please see additional important information and qualifications at the end of this Term Sheet. |
T-53
| Office - CBD | Loan #3 | Cut-off Date Balance: | $70,000,000 | |
| 560 Mission Street | 560 Mission Street | Cut-off Date LTV: | 35.6% | |
| San Francisco, CA 94105 | U/W NCF DSCR: | 5.23x | ||
| U/W NOI Debt Yield: | 14.2% |
| 560 Mission Street Whole Loan Summary | ||||
Notes | Original Balance | Cut-off Date Balance | Anticipated Note Holder | Controlling Piece |
| A-1-1 | $60,000,000 | $60,000,000 | GSMS 2020-GC45 | No |
| A-1-2-A | $30,000,000 | $30,000,000 | Benchmark 2020-B16 | Yes |
| A-1-2-B | $20,000,000 | $20,000,000 | Benchmark 2020-IG1(1) | No |
| A-1-3 | $25,000,000 | $25,000,000 | Benchmark 2020-IG1(1) | No |
| A-1-4 | $15,000,000 | $15,000,000 | Benchmark 2020-B16 | No |
| A-2-A-1 | $70,000,000 | $70,000,000 | BANK 2020-BNK26 | No |
| A-2-A-2 | $30,000,000 | $30,000,000 | Bank of America, N.A. | No |
| A-2-B | $50,000,000 | $50,000,000 | BANK 2020-BNK25 | No |
| Total | $300,000,000 | $300,000,000 | ||
| (1) | Anticipated to be contributed on the closing date of such transaction. |
The Borrower and the Borrower Sponsor. The borrower is NOP 560 Mission Street, LLC, (the “560 Mission Street Borrower”), a Delaware limited liability company structured to be bankruptcy-remote with at least two independent directors.
The borrower is owned by a joint venture between California Public Employees’ Retirement System (“CalPERS”) and CommonWealth Partners, LLC. CalPERS is the nation’s largest public pension fund. The CalPERS retirement system serves more than 1.9 million members and the CalPERS health program administers benefits for 1.4 million members and their families. CommonWealth Partners, LLC is a privately held, vertically integrated real estate investment, development and management firm based in Los Angeles, with offices across the United States. There is no non-recourse carveout guarantor or separate environmental indemnitor with respect to the 560 Mission Street Whole Loan.
The Property. The 560 Mission Street Property is a 31-story, Class A, LEED Platinum office building totaling 668,149 SF located in San Francisco, California. The 560 Mission Street Property is 98.4% leased, as of October 31, 2019, to 13 tenants from industries including technology, financial services, consulting services, insurance and law. No tenant comprises more than 36.9% of NRA or 36.6% of underwritten base rent.
The 560 Mission Street Property has floor-to-ceiling glass windows and column-free space throughout the building, allowing for 360-degree access to light and air. The glass and metal curtain wall design, enhanced by the building’s setbacks and cornice, was inspired by the composition of the Hallidie Building, which is San Francisco’s first curtain wall building. The 560 Mission Street Property has held the LEED Platinum designation since 2010. The 560 Mission Street Property includes a two-level, below-grade parking garage that has 117 parking spaces including seven handicapped parking spaces.
The borrower sponsor built the 560 Mission Street Property in 2002 and has invested approximately $2.5 million in capital improvements since 2014. Since 2018, 90,621 SF of new and renewal leases have been signed, including new leases with Delta Dental (43,396 SF) and expansion leases with TIAA-CREF (21,661 SF) and EY (14,525 SF). The borrower sponsor has made investments in both the common areas and back-of-house infrastructure including a new lobby, plaza furniture, an elevator lobby upgrade, a garage enhancement with bike area, and restroom and shower room upgrades. The bike area is able to house 70 bicycles on a first-come, first-served basis.
Major Tenants.
JP Morgan (246,384 SF, 36.9% of NRA; 36.6% of underwritten base rent). JPMorgan Chase Bank, N.A. (“JP Morgan”) is the consumer and commercial banking subsidiary of JPMorgan Chase & Co., an American multinational investment bank and financial services holding company headquartered in New York City. JP Morgan’s lease expires on September 30, 2025 and JP Morgan has two 5-year options to renew at least 50% of its leased space with 17 - 20 months’ notice. The first option is at 95% of base rent and the second option is at market rent. JP Morgan has an option to terminate one full floor effective until September 30, 2021 with 12 months’ notice and a payment between $137,136 and $210,495 (depending on the floor terminated, along with any other costs stated in the lease) plus the unamortized leasing costs at 8% interest.
EY (122,760 SF, 18.4% of NRA; 16.9% of underwritten base rent). Ernst & Young (“EY”) is a multinational professional services firm headquartered in London, England, United Kingdom. EY is one of the largest professional services firms in the world. Along with Deloitte, KPMG and PricewaterhouseCoopers, EY is considered one of the Big Four accounting firms. EY’s lease expires on December 31, 2028 and EY has two 5-year options to renew its entire premises at market rent with 12 - 15 months’ notice. The tenant also has an option to expand and occupy 50%-100% of any additional full floor with notice by October 1, 2021 and a delivery date between April 1, 2022 and October 1, 2024.
TIAA-CREF (64,696 SF, 9.7% of NRA; 9.8% of underwritten base rent). The Teachers Insurance and Annuity Association of America-College Retirement Equities Fund (“TIAA-CREF”) is a Fortune 100 financial services organization that provides financial services in the academic, research, medical, cultural and governmental fields. TIAA-CREF’s lease expires on September 30, 2027 and TIAA-CREF has a 5-year option to renew at least two contiguous floors at market rent with 15 - 18 months’ notice and a one-time option to terminate any or all of the premises, effective on March 31, 2023 with 12 months’ notice and upon payment of the unamortized leasing costs at 8% interest.
| This is not a research report and was not prepared by any Underwriter’s research department. Please see additional important information and qualifications at the end of this Term Sheet. |
T-54
| Office - CBD | Loan #3 | Cut-off Date Balance: | $70,000,000 | |
| 560 Mission Street | 560 Mission Street | Cut-off Date LTV: | 35.6% | |
| San Francisco, CA 94105 | U/W NCF DSCR: | 5.23x | ||
| U/W NOI Debt Yield: | 14.2% |
The following table presents certain information relating to the tenants at the 560 Mission Street Property:
| Tenant Summary | ||||||||
| Tenant Name | Credit Rating (Fitch/Moody’s/S&P)(1) | Tenant SF | Approx. % of SF | Annual UW Rent | % of Total Annual UW Rent | Annual UW Rent PSF | Lease Expiration | Term. Options (Y/N) |
| Major Tenants | ||||||||
| JP Morgan | AA-/A2/A- | 246,384 | 36.9% | $18,489,301 | 36.6% | $75.04 | 9/30/2025 | Y(2) |
| EY | NR/NR/NR | 122,760 | 18.4% | $8,553,330 | 16.9% | $69.68 | 12/31/2028 | N |
| TIAA-CREF | AA+/Aa2/AA+ | 64,696 | 9.7% | $4,942,127 | 9.8% | $76.39 | 9/30/2027 | Y(3) |
| Seyfarth Shaw | NR/NR/NR | 49,695 | 7.4% | $4,639,525 | 9.2% | $93.36 | 9/30/2027 | Y(4) |
| Munger Tolles & Olson | NR/NR/NR | 41,869 | 6.3% | $3,820,128 | 7.6% | $91.24 | 9/30/2027 | N |
| Major Tenant Subtotal/Wtd. Avg. | 525,404 | 78.6% | $40,444,411 | 80.1% | $76.98 | |||
| Other Tenants | 131,727 | 19.7% | $10,032,182 | 19.9% | $76.16 | |||
| Vacant | 11,018 | 1.6% | $0 | 0.0% | $0.00 | |||
| Total/Wtd. Avg. | 668,149 | 100.0% | $50,476,593 | 100.0% | $76.81(5) | |||
| (1) | Certain ratings are those of the parent company whether or not the parent guarantees the lease. |
| (2) | JP Morgan has the right at any time through September 30, 2021 to terminate its lease with respect to one full floor of its leased premises upon 12 months’ prior notice and payment of a termination fee. |
| (3) | TIAA-CREF has the one-time right to terminate its lease or any portion thereof effective as of March 31, 2023 upon written notice on or before March 31, 2022 and payment of a termination fee. |
| (4) | Seyfarth Shaw has the one-time right to terminate its lease with respect to the 29th floor effective as of September 30, 2022 upon written notice on or before September 30, 2021 and payment of a termination fee. |
| (5) | Total/Wtd. Avg. Annual UW Rent PSF excludes vacant space. |
The following table presents certain information relating to the lease rollover schedule at the 560 Mission Street Property:
| Lease Rollover Schedule(1)(2) | ||||||||
| Year | # of Leases Rolling | SF Rolling | Annual UW Rent PSF Rolling | Approx. % of Total SF Rolling | Approx. Cumulative % of SF Rolling | Total UW Rent Rolling | Approx. % of Total Rent Rolling | Approx. Cumulative % of Total Rent Rolling |
| MTM | 0 | 0 | $0.00 | 0.0% | 0.0% | $0 | 0.0% | 0.0% |
| 2020 | 0 | 0 | $0.00 | 0.0% | 0.0% | $0 | 0.0% | 0.0% |
| 2021 | 2 | 10,784 | $83.22 | 1.6% | 1.6% | $897,426 | 1.8% | 1.8% |
| 2022 | 2 | 4,420 | $59.19 | 0.7% | 2.3% | $261,610 | 0.5% | 2.3% |
| 2023 | 0 | 0 | $0.00 | 0.0% | 2.3% | $0 | 0.0% | 2.3% |
| 2024 | 3 | 20,735 | $89.55 | 3.1% | 5.4% | $1,856,856 | 3.7% | 6.0% |
| 2025 | 15 | 292,340 | $74.95 | 43.8% | 49.1% | $21,910,710 | 43.4% | 49.4% |
| 2026 | 2 | 49,832 | $72.14 | 7.5% | 56.6% | $3,594,880 | 7.1% | 56.5% |
| 2027 | 8 | 156,260 | $85.77 | 23.4% | 80.0% | $13,401,780 | 26.6% | 83.1% |
| 2028 | 6 | 122,760 | $69.68 | 18.4% | 98.4% | $8,553,330 | 16.9% | 100.0% |
| 2029 | 0 | 0 | $0.00 | 0.0% | 98.4% | $0 | 0.0% | 100.0% |
| 2030 | 0 | 0 | $0.00 | 0.0% | 98.4% | $0 | 0.0% | 100.0% |
| 2031 & Beyond | 0 | 0 | $0.00 | 0.0% | 98.4% | $0 | 0.0% | 100.0% |
| Vacant | 0 | 11,018 | $0.00 | 1.6% | 100.0% | $0 | 0.0% | 100.0% |
| Total/Wtd. Avg. | 38 | 668,149 | $76.81(3) | 100.0% | $50,476,593 | 100.0% | ||
| (1) | Information obtained from the underwritten rent roll. |
| (2) | Certain tenants may have lease termination options that are exercisable prior to the originally stated expiration date of the subject lease and that are not considered in this Lease Rollover Schedule. |
| (3) | Total/Wtd. Avg. Annual UW Rent PSF Rolling excludes vacant space. |
The Market. The 560 Mission Street Property is located in San Francisco, in the South Financial District submarket.
The South Financial District submarket is the historic center of business activity in San Francisco. The submarket represents half of San Francisco’s central business district, with the other half represented by the North Financial District. The Financial District contains well-known buildings, including the Transamerica Pyramid, 555 California Street (formerly Bank of America Center), 101 California Street and Embarcadero Center. These skyscrapers are heavily tenanted by financial institutions, and house many Fortune 500 firms, including Wells Fargo, Citigroup, Amazon’s Twitch division, and PricewaterhouseCoopers. According to a third party market research report, the South Financial District office submarket has a total inventory of 30,506,228 SF as of October 1, 2019.
| This is not a research report and was not prepared by any Underwriter’s research department. Please see additional important information and qualifications at the end of this Term Sheet. |
T-55
| Office - CBD | Loan #3 | Cut-off Date Balance: | $70,000,000 | |
| 560 Mission Street | 560 Mission Street | Cut-off Date LTV: | 35.6% | |
| San Francisco, CA 94105 | U/W NCF DSCR: | 5.23x | ||
| U/W NOI Debt Yield: | 14.2% |
The following table presents recent leasing data at comparable office properties with respect to the 560 Mission Street Property:
| Comparable Lease Summary | ||||||||
Property Location | Year Built/ Renovated | Distance from Subject | Property Size (SF) | Tenant | Lease Date / Term | Initial Rent PSF | Lease Type | |
560 Mission Street Property 560 Mission Street San Francisco, CA | 2002/N/A | N/A | 668,149(1) | Various | Various / Various | $76.81(1) | Modified | |
Blue Shield California Building 50 Beale Street San Francisco, CA | 1969/2012 | 0.3 miles | 639,450 | Glassdoor | June 2019 / 10.3 yrs | $87.96 | Modified | |
140 New Montgomery Street San Francisco, CA | 1925/2013 | 0.2 miles | 285,100 | Benchmark Capital Partners | June 2019 / 10 yrs | $114.96 | Modified | |
303 Second Street San Francisco, CA | 1988/N/A | 0.4 miles | 700,945 | Sony (PlayStation) | June 2019 / 10.3 yrs | $90.00 | Modified | |
101 California Street San Francisco, CA | 1982/2002 | 0.5 miles | 1,203,065 | The Blackstone Group | June 2019 / 10.0 yrs | $114.96 | Modified | |
201 Mission Street San Francisco, CA | 1981/N/A | 0.3 miles | 483,289 | Silicon Legal Strategy | July 2019 / 5.1 yrs | $81.96 | Modified | |
Pine Street Center 100 Pine Street San Francisco, CA | 1972/N/A | 0.4 miles | 365,808 | Bank of the Orient | October 2019 / 6.2 yrs | $84.00 | Modified | |
Source: Appraisal.
| (1) | Information obtained from the underwritten rent roll. |
The following table presents the appraisal’s market rent conclusions:
| Market Rent Summary | ||||
| Low Office | Mid Office | High Office | Top Floors | |
| Market Rent | $88 | $92 | $96 | $105 |
| Lease Term (Yrs.) | 7 | 7 | 7 | 7 |
| Rental Increase Projection | 3.0%per annum | 3.0%per annum | 3.0%per annum | 3.0%per annum |
| This is not a research report and was not prepared by any Underwriter’s research department. Please see additional important information and qualifications at the end of this Term Sheet. |
T-56
| Office - CBD | Loan #3 | Cut-off Date Balance: | $70,000,000 | |
| 560 Mission Street | 560 Mission Street | Cut-off Date LTV: | 35.6% | |
| San Francisco, CA 94105 | U/W NCF DSCR: | 5.23x | ||
| U/W NOI Debt Yield: | 14.2% |
Operating History and Underwritten Net Cash Flow.The following table presents certain information relating to the historical operating performance and Underwritten Net Cash Flow of the 560 Mission Street Property:
| Cash Flow Analysis | ||||||
| 2016 | 2017 | 2018(1) | 9/30/2019 TTM | UW | UW PSF | |
| Base Rent(2) | $36,190,949 | $31,345,165 | $47,586,908 | $48,362,119 | $54,686,071 | $81.85 |
| Other Income(3) | $2,886,498 | $2,749,759 | $1,944,237 | $2,008,255 | $2,008,255 | $3.01 |
| Recoveries | $11,308,135 | $8,261,973 | $40,660 | $422,347 | $229,001 | $0.34 |
| Vacancy | $0 | $0 | $0 | $0 | $(2,185,140) | $(3.27) |
| Effective Gross Income | $50,385,582 | $42,356,897 | $49,571,805 | $50,792,721 | $54,738,187 | $81.93 |
| Real Estate Taxes | $2,901,633 | $3,060,589 | 42,988,259 | $2,930,953 | $3,085,825 | $4.62 |
| Insurance | $648,379 | $607,821 | $669,313 | $858,742 | $1,042,282 | $1.56 |
| Other Operating Expenses | $8,990,804 | $7,917,051 | $8,044,708 | $8,689,554 | $7,935,981 | $11.88 |
| Total Expenses | $12,540,816 | $11,585,462 | $11,702,280 | $12,479,248 | $12,064,089 | $18.06 |
| Net Operating Income | $37,844,766 | $30,771,436 | $37,869,525 | $38,313,473 | $42,674,098 | $63.87 |
| Capital Expenditures | $0 | $0 | $0 | $0 | $133,630 | $0.20 |
| TI/LC | $0 | $0 | $0 | $0 | $1,336,298 | $2.00 |
| Net Cash Flow | $37,844,766 | $30,771,436 | $37,869,525 | $38,313,473 | $41,204,170 | $61.67 |
| Occupancy % | 100.0% | 97.8% | 97.3% | 98.4%(4) | 96.0% | |
| NOI DSCR(5) | 4.81x | 3.91x | 4.81x | 4.87x | 5.42x | |
| NCF DSCR(5) | 4.81x | 3.91x | 4.81x | 4.87x | 5.23x | |
| NOI Debt Yield(5) | 12.6% | 10.3% | 12.6% | 12.8% | 14.2% | |
| NCF Debt Yield(5) | 12.6% | 10.3% | 12.6% | 12.8% | 13.7% | |
| (1) | The increase in 2018 Base Rent is due to 90,621 SF of new and renewed direct leases signed. |
| (2) | UW Base Rent includes (i) vacant space at market rent ($946,514), (ii) contractual rent steps through November 2020 ($2,163,939) and (iii) straight-line rent averaging for TIAA-CREF, JP Morgan, Seyfarth Shaw and Munger Tolles & Olson ($1,099,025). |
| (3) | UW Other Income consists of parking income ($1,491,645), net tenant service revenue ($191,861) and miscellaneous income ($324,748). |
| (4) | Occupancy as of the October 31, 2019 borrower rent roll. |
| (5) | Debt service coverage ratios and debt yields are based on the 560 Mission Street Whole Loan. |
Escrows and Reserves.
Real Estate Taxes and Insurance– During a Trigger Period (as defined below), the 560 Mission Street Borrower is required to deposit monthly (i) 1/12 of the annual estimated real estate taxes and (ii) 1/12 of the annual estimated insurance premiums (unless the 560 Mission Street Property is covered by a blanket policy).
Replacement Reserves– During a Trigger Period, the 560 Mission Street Borrower is required to deposit monthly $11,136, capped unless a Cash Trap Period (as defined below) exists at $267,260 (approximately 24 times the monthly required deposit);provided that the 560 Mission Street Borrower is permitted to deposit cash or a letter of credit in an amount equal to the funds then required in lieu of a monthly deposit.
TI/LC Reserves– The 560 Mission Street Borrower deposited at loan origination $2,152,612 as TI/LC reserves. During a Trigger Period, the 560 Mission Street Borrower is required to deposit monthly $83,519, capped unless a Cash Trap Period exists at $2,004,447 (approximately 24 times the monthly required deposit);provided that the 560 Mission Street Borrower is permitted to deposit cash or a letter of credit in an amount equal to the funds then required in lieu of a monthly deposit.
A “Trigger Period” will
| (i) | commence upon an event of default under the 560 Mission Street Whole Loan or, if a mezzanine loan is then outstanding under such mezzanine loan, and end when the event of default has been cured; or |
| (ii) | commence when the debt yield is less than 7.0% for two consecutive calendar quarters, and end when the debt yield is at least 7.0% for two consecutive calendar quarters,provided at any time after the lockout expiration date, the 560 Mission Street Borrower is permitted to prepay with yield maintenance the 560 Mission Street Whole Loan (or deliver cash or a letter of credit) in an amount which would increase the debt yield to at least 7.0% to avoid a Trigger Period under this clause (ii). |
A “Cash Trap Period” will commence when the debt yield is less than 6.50% for two consecutive calendar quarters, and end when the debt yield is at least 6.50% for two consecutive calendar quarters,provided at any time after the lockout expiration date, the 560 Mission Street Borrower is permitted to prepay with yield maintenance the 560 Mission Street Whole Loan (or deliver cash or a letter of credit) in an amount which would increase the debt yield to at least 6.50% to avoid a Cash Trap Period.
| This is not a research report and was not prepared by any Underwriter’s research department. Please see additional important information and qualifications at the end of this Term Sheet. |
T-57
| Office - CBD | Loan #3 | Cut-off Date Balance: | $70,000,000 | |
| 560 Mission Street | 560 Mission Street | Cut-off Date LTV: | 35.6% | |
| San Francisco, CA 94105 | U/W NCF DSCR: | 5.23x | ||
| U/W NOI Debt Yield: | 14.2% |
Lockbox and Cash Management. The 560 Mission Street Whole Loan is structured with a hard lockbox and springing cash management. Revenues from the 560 Mission Street Property are required to be deposited directly into the lockbox account or, if received by the 560 Mission Street Borrower or the property manager, deposited within two business days of receipt. During the occurrence and continuance of a Trigger Period, funds in the lockbox account are required to be swept on each business day to the lender-controlled cash management account and disbursed according to the 560 Mission Street Whole Loan documents. Also during the continuance of a Cash Trap Period, all excess cash is required to be held by the lender as additional collateral for the 560 Mission Street Whole Loan.
Additional Secured Indebtedness (not including trade debts). The 560 Mission Street Property also secures the 560 Mission Street Non-ServicedPari Passu Companion Loans, which have an aggregate Cut-off Date principal balance of $230,000,000. The 560 Mission Street Non-ServicedPari Passu Companion Loans accrue interest at the same rate as the 560 Mission Street Mortgage Loan. The 560 Mission Street Mortgage Loan is entitled to payments of interest and principal on apro rata andpari passu basis with the 560 Mission Street Non-ServicedPari Passu Companion Loans. The holders of the 560 Mission Street Mortgage Loan and the 560 Mission Street Non-ServicedPari Passu Companion Loans have entered into a co-lender agreement which sets forth the allocation of collections on the 560 Mission Street Whole Loan. See “Description of the Mortgage Pool—The Whole Loans— The Non-Serviced Pari Passu Whole Loans” in the Preliminary Prospectus.
Mezzanine Loan and Preferred Equity.The direct or indirect equity owners of the 560 Mission Street Borrower are permitted to incur future mezzanine debt (secured by a pledge of direct or indirect equity interests in the 560 Mission Street Borrower), provided that among other conditions: (i) the principal amount of the mezzanine loan may not exceed $180,000,000; (ii) for the combined 560 Mission Street Whole loan and the mezzanine loan, (a) the loan-to-value ratio is no greater than 60.0%, (b) the debt service coverage ratio is at least 2.00x, and (c) the debt yield is at least 8.0%; (iii) the mezzanine loan is co-terminous with, or has a loan maturity later than the 560 Mission Whole Loan, and has either a fixed rate or a hedged floating rate, (iv) an intercreditor agreement is executed that is acceptable to the lender and the rating agencies; and (v) rating agency confirmation is delivered.
Release of Property.Not permitted.
Right of First Offer/Right of First Refusal.None.
Ground Lease. None.
Letter of Credit.None.
Terrorism Insurance.The 560 Mission Street Borrower is required to obtain and maintain “all risk” property insurance that covers perils of terrorism and acts of terrorism in an amount equal to the full replacement cost of the 560 Mission Street Property and business interruption insurance for 24 months with a 12-month extended period of indemnity;provided that if the Terrorism Risk Insurance Program Reauthorization Act is no longer in effect, the 560 Mission Street Borrower will not be obligated to pay insurance premiums for terrorism coverage in excess of two times the insurance premiums that would then be payable under policies obtained at then current market rates for all risk and business interruption insurance (excluding the terrorism component of such insurance). See “Risk Factors—Risks Relating to the Mortgage Loans—Terrorism Insurance May Not Be Available for All Mortgaged Properties” in the Preliminary Prospectus.
| This is not a research report and was not prepared by any Underwriter’s research department. Please see additional important information and qualifications at the end of this Term Sheet. |
T-58
(THIS PAGE INTENTIONALLY LEFT BLANK)
T-59
| Office – CBD | Loan #4 | Cut-off Date Balance: | $70,000,000 | |
| 200 West 57th Street | 200 West 57th Street | Cut-off Date LTV: | 62.2% | |
| New York, NY 10019 | UW NCF DSCR: | 1.93x | ||
| UW NOI Debt Yield: | 7.5% |
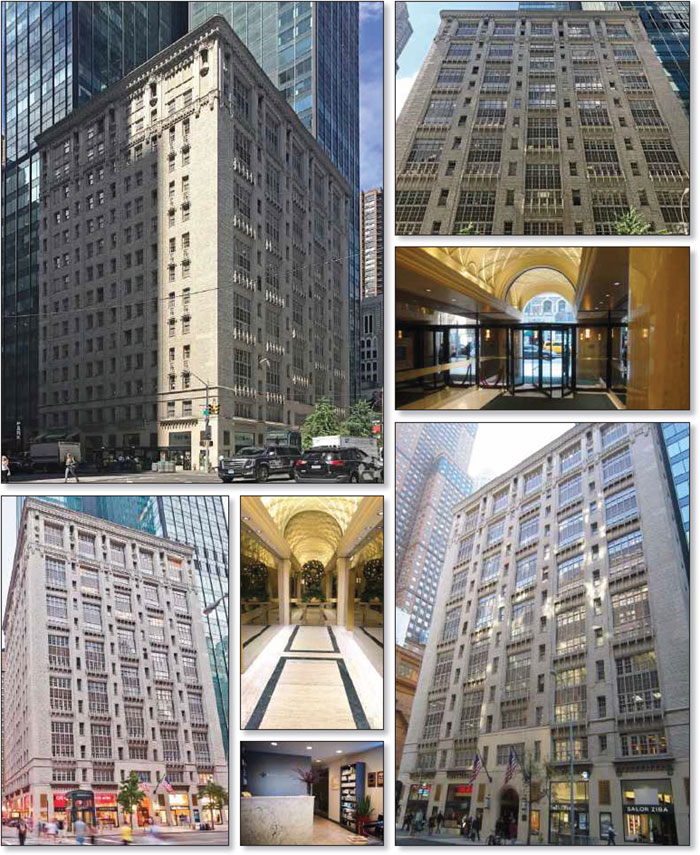
| This is not a research report and was not prepared by any Underwriter’s research department. Please see additional important information and qualifications at the end of this Term Sheet. |
T-60
| Office – CBD | Loan #4 | Cut-off Date Balance: | $70,000,000 | |
| 200 West 57th Street | 200 West 57th Street | Cut-off Date LTV: | 62.2% | |
| New York, NY 10019 | UW NCF DSCR: | 1.93x | ||
| UW NOI Debt Yield: | 7.5% |
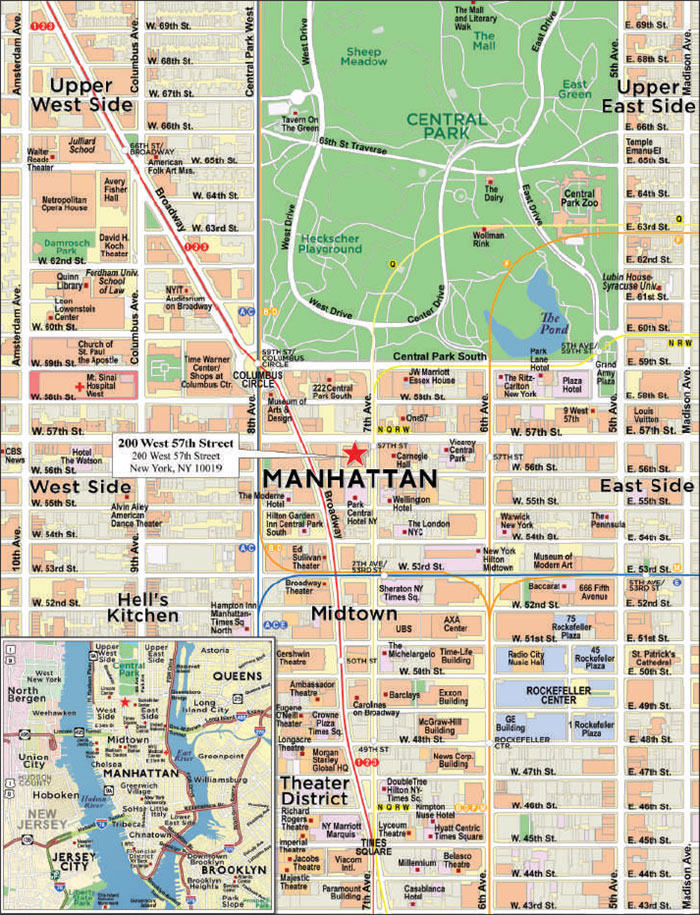
| This is not a research report and was not prepared by any Underwriter’s research department. Please see additional important information and qualifications at the end of this Term Sheet. |
T-61
| Mortgage Loan No. 4 – 200 West 57th Street |
| Mortgage Loan Information | Property Information | ||||||
| Mortgage Loan Seller: | MSMCH | Single Asset/Portfolio: | Single Asset | ||||
| Credit Assessment (DBRS/Fitch/S&P): | NR/NR/NR | Location: | New York, NY 10019 | ||||
| Original Balance(1): | $70,000,000 | General Property Type: | Office | ||||
| Cut-off Date Balance(1): | $70,000,000 | Detailed Property Type: | CBD | ||||
| % of Initial Pool Balance: | 5.8% | Title Vesting: | Fee | ||||
| Loan Purpose(2): | Recapitalization | Year Built/Renovated: | 1917/2007-2008 | ||||
| Borrower Sponsor: | Feil Organization | Size: | 171,395 SF | ||||
| Guarantor: | Jeffrey J. Feil | Cut-off Date Balance per SF(1): | $671 | ||||
| Mortgage Rate: | 3.5200% | Maturity Date Balance per SF(1): | $671 | ||||
| Note Date: | 12/30/2019 | Property Manager: | Jeffrey Management Corp. | ||||
| First Payment Date: | 2/1/2020 | (borrower-related) | |||||
| Maturity Date: | 1/1/2030 | ||||||
| Original Term to Maturity: | 120 months | ||||||
| Original Amortization Term: | 0 months | Underwriting and Financial Information | |||||
| IO Period: | 120 months | UW NOI: | $8,653,037 | ||||
| Seasoning: | 2 months | UW NOI Debt Yield(1): | 7.5% | ||||
| Prepayment Provisions(3): | LO (26); DEF (89); O (5) | UW NOI Debt Yield at Maturity(1): | 7.5% | ||||
| Lockbox/Cash Mgmt Status: | Hard/Springing | UW NCF DSCR(1): | 1.93x | ||||
| Additional Debt Type(1)(4): | Pari Passu | Most Recent NOI: | $7,480,084 (9/30/2019 TTM) | ||||
| Additional Debt Balance(1)(4): | $45,000,000 | 2nd Most Recent NOI: | $7,816,277 (12/31/2018) | ||||
| Future Debt Permitted (Type): | No (N/A) | 3rd Most Recent NOI: | $7,858,797 (12/31/2017) | ||||
| Reserves(5) | Most Recent Occupancy(6): | 95.1% (11/27/2019) | |||||
| Type | Initial | Monthly | Cap | 2nd Most Recent Occupancy: | 94.2% (12/31/2018) | ||
| RE Tax: | $143,187 | $143,187 | N/A | 3rd Most Recent Occupancy: | 91.7% (12/31/2017) | ||
| Insurance: | $0 | Springing | N/A | Appraised Value (as of): | $185,000,000 (12/4/2019) | ||
| Recurring Replacements: | $0 | $3,866 | $92,775 | Appraised Value per SF: | $1,079 | ||
| Rollover: | $0 | $21,424 | $514,185 | Cut-off Date LTV Ratio(1): | 62.2% | ||
| Other: | $2,069,759 | $0 | N/A | Maturity Date LTV Ratio(1): | 62.2% | ||
| Sources and Uses | ||||||
| Sources | Proceeds | % of Total | Uses | Proceeds | % of Total | |
| Whole Loan Amount(1): | $115,000,000 | 76.5% | Loan Payoff(2): | $110,592,014 | 73.6% | |
| Borrower Equity: | $35,319,679 | 23.5% | Purchase Price(2): | $35,229,400 | 23.4% | |
| Reserves: | $2,212,946 | 1.5% | ||||
| Closing Costs: | $2,285,319 | 1.5% | ||||
| Total Sources: | $150,319,679 | 100.0% | Total Uses: | $150,319,679 | 100.0% | |
| (1) | The 200 West 57th Street Mortgage Loan (as defined below) is a part of the 200 West 57th Street Whole Loan (as defined below) with an original aggregate principal balance of $115,000,000. The Cut-off Date Balance per SF, Maturity Date Balance per SF, UW NOI Debt Yield, UW NOI Debt Yield at Maturity, UW NCF DSCR, Cut-off Date LTV Ratio and Maturity Date LTV Ratio numbers presented above are based on the aggregate principal balance of the promissory notes comprising the 200 West 57th Street Whole Loan. |
| (2) | Loan proceeds, together with borrower equity, were used to repay a prior loan and to buy out the 49.9% joint venture interest held by RP L.L.C. for $35,229,400. |
| (3) | Defeasance of the 200 West 57th Street Whole Loan is permitted at any time after the earlier of (i) December 30, 2022, or (ii) two years from the closing date of the securitization that includes the lastpari passunote of the 200 West 57th Street Whole Loan to be securitized. The assumed defeasance lockout period of 26 payments is based on the closing date of this transaction in March 2020. |
| (4) | See “The Mortgage Loan”and“Additional Secured Indebtedness (not including trade debts)” below for further discussion of additional debt. |
| (5) | See “Escrows and Reserves” below for further discussion of reserve requirements. |
| (6) | Most Recent Occupancy includes three tenants (4,609 SF) that are expected to vacate the 200 West 57th Street Property (as defined below) in 2020. Rent from these tenants was not underwritten. Without such tenants, occupancy is 92.4%. |
The Mortgage Loan. The fourth largest mortgage loan (the “200 West 57th Street Mortgage Loan”) is part of a whole loan (the “200 West 57th Street Whole Loan”) evidenced by twopari passupromissory notes in the aggregate original principal amount of $115,000,000, both of which are secured by a first priority fee mortgage encumbering an office property located in New York, New York (the “200 West 57th Street Property”). The controlling Note A-1, in the original principal amount of $70,000,000, represents the 200 West 57th Street Mortgage Loan and will be included in the BANK 2020-BNK26 securitization trust. The non-controlling Note A-2, in the original principal amount of $45,000,000 (the “200 West 57th Street ServicedPari Passu Companion Loan”), is expected to be contributed to a future securitization transaction. The 200 West 57th Street Whole Loan will be serviced pursuant to the pooling and servicing agreement for the BANK 2020-BNK26 securitization trust. See “Description of the Mortgage Pool—The Whole Loans—The Serviced Pari Passu Whole Loans” and “Pooling and Servicing Agreement” in the Preliminary Prospectus.
| This is not a research report and was not prepared by any Underwriter’s research department. Please see additional important information and qualifications at the end of this Term Sheet. |
T-62
| Office – CBD | Loan #4 | Cut-off Date Balance: | $70,000,000 | |
| 200 West 57th Street | 200 West 57th Street | Cut-off Date LTV: | 62.2% | |
| New York, NY 10019 | UW NCF DSCR: | 1.93x | ||
| UW NOI Debt Yield: | 7.5% |
| 200 West 57th Street Whole Loan Summary | ||||
| Note | Original Balance | Cut-off Date Balance | Note Holder | Controlling Piece |
| A-1 | $70,000,000 | $70,000,000 | BANK 2020-BNK26 | Yes |
| A-2 | $45,000,000 | $45,000,000 | MSBNA | No |
| Total | $115,000,000 | $115,000,000 | ||
The Borrower and the Borrower Sponsor.The borrower is RP/FEIL 57 LLC (the “200 West 57th Street Borrower”), a Delaware limited liability company structured with two independent directors. The Feil Organization (“Feil”) is the borrower sponsor, and the non-recourse carveout guarantor is Jeffrey J. Feil.Feil is a family-owned, New York City based real estate investment, development and management firm. Feil owns, develops and manages over 24 million SF of retail, commercial and industrial properties, over 5,000 residential rental units, as well as hundreds of net leased properties and thousands of acres of undeveloped land across the country. Jeffrey J. Feil is president and CEO of Feil and has worked for the company since 1978.
The Property.The 200 West 57th Street Property is a Class B, 16-story office property totaling 171,395 SF, including 7,338 SF of retail space, located in New York City. The 200 West 57th Street Property was built in 1917 and renovated in 2007 and 2008. In addition, the 200 West 57th Street Property façade is landmarked along West 57th Street and Seventh Avenue.Since purchasing the200 West 57th Street Propertyin 2007, ownership has invested over $10 million in capital expenditures, including a full façade restoration, expansion of the 15th floor and the addition of the 16th floor in 2008.The 200 West 57th Street Property was 95.1% leased as of November 27, 2019 to 65 tenants.The200 West 57th Street Propertyhas historically been well-occupied, with occupancy of at least 91.7% over the last 10 years and an average of 94.6%. The200 West 57th Street Propertyis leased to a granular rent roll of 65 tenants, primarily consisting of healthcare/medical office tenants. Aside from The St. Luke’s Roosevelt Hospital, which is the largest tenant and accounts for 15.6% of total rent, no other tenant accounts for more than 6.2% of underwritten rent or 5.8% of total SF. The St. Luke’s Roosevelt Hospital has been a tenant at the200 West 57th Street Property since 2010, has a lease expiration of January 31, 2026 as to 21,549 SF, October 31, 2023 as to 8,743 SF and February 28, 2022 as to 5,258 SF, and has two, five-year renewal options remaining. The 200 West 57th Street Property also contains a retail component (4.3% of SF; 14.0% of underwritten gross potential rent). There are four retail tenants, the largest of which is a restaurant tenant, Cieli Partners L.P. d/b/a Trattoria Dell' Arte (4,000 SF). In addition, the owner of the Brooklyn Diner located adjacent to the 200 West 57th Street Property recently leased retail space at the 200 West 57th Street Property (Ebbets Field Venture LLC) for a 15-year term.
The following table presents certain information relating to the major tenants at the 200 West 57th Street Property:
| Tenant Summary(1) | |||||||||
| Tenant Name | Credit Rating (Fitch/Moody's/ S&P) | Tenant SF | Approx. % of SF | Annual UW Rent | % of Total Annual UW Rent | Annual UW Rent PSF(2) | Lease Expiration | Renewal Options | Termination Option (Y/N) |
| Office Tenants | |||||||||
| The St. Luke’s Roosevelt Hospital(3) | NR/NR/NR | 35,550 | 20.7% | $2,664,954 | 20.3% | $74.96 | Various | 2 x 5-year | N |
| Extended Fertility LLC(4) | NR/NR/NR | 10,019 | 5.8% | $811,248 | 6.2% | $80.97 | Various | None | N |
| Orthology Inc.(5) | NR/NR/NR | 7,030 | 4.1% | $489,991 | 3.7% | $69.70 | Various | None | N |
| Reproductive Medicine Assoc. | NR/NR/NR | 5,242 | 3.1% | $376,795 | 2.9% | $71.88 | 8/31/2025 | None | N |
| Office Subtotal/Wtd. Avg. | 57,841 | 33.7% | $4,342,988 | 33.2% | $75.08 | ||||
| Retail Tenants | |||||||||
| Cieli Partners L.P. | NR/NR/NR | 4,000 | 2.3% | $795,969 | 6.1% | $198.99 | 8/31/2028 | None | N |
| Ebbets Field Venture LLC. | NR/NR/NR | 1,514 | 0.9% | $401,210 | 3.1% | $265.00 | 11/30/2034 | 1 x 5-year | N |
| 57thBakery LLC | NR/NR/NR | 1,121 | 0.7% | $549,873 | 4.2% | $490.52 | 12/31/2028 | None | N |
| FedEx Office & Print Services | NR/NR/NR | 703 | 0.4% | $220,100 | 1.7% | $313.09 | 11/30/2020 | None | N |
| Retail Subtotal/Wtd. Avg. | 7,338 | 4.3% | $1,967,152 | 15.0% | $268.08 | ||||
| Other Tenants | 93,230 | 54.4% | $6,789,946 | 51.8% | $72.83 | ||||
| Vacant Space | 12,986 | 7.6% | $0 | 0.0% | $0.00 | ||||
| Total/Wtd. Avg. | 171,395 | 100.0% | $13,100,086 | 100.0% | $82.70 | ||||
| (1) | Information is based on the underwritten rent roll as of November 27, 2019. |
| (2) | Total/Wtd. Avg. Annual UW Rent PSF excludes vacant space. |
| (3) | The St. Luke’s Roosevelt Hospital has 21,549 SF expiring on January 31, 2026, 8,743 expiring on October 31, 2023 and 5,258 SF expiring on February 28, 2022. The tenant is entitled to a rent credit of $1,305.45 from February 2020 through February 2022 for Suite 1001B and to free rent in February and December 2020, February and December 2023, and February 2024 for Suite 1600A. |
| (4) | Extended Fertility LLC has 7,074 SF expiring on January 31, 2029 and 2,945 SF expiring on August 31, 2029. The tenant is entitled to free rent in July 2020 and July 2021. |
| (5) | Orthology Inc. has 5,286 SF expiring on December 31, 2029 and 1,744 SF expiring on February 28, 2030. The tenant is entitled to free rent in February and March 2020. |
| This is not a research report and was not prepared by any Underwriter’s research department. Please see additional important information and qualifications at the end of this Term Sheet. |
T-63
| Office – CBD | Loan #4 | Cut-off Date Balance: | $70,000,000 | |
| 200 West 57th Street | 200 West 57th Street | Cut-off Date LTV: | 62.2% | |
| New York, NY 10019 | UW NCF DSCR: | 1.93x | ||
| UW NOI Debt Yield: | 7.5% |
The following table presents certain information relating to the lease rollover schedule at the 200 West 57th Street Property:
| Lease Rollover Schedule(1)(2) | ||||||||
| Year | # of Leases Rolling | SF Rolling | UW Rent PSF Rolling | Approx. % of Total SF Rolling | Approx. Cumulative % of SF Rolling | Total UW Rent Rolling | Approx. % of Total Rent Rolling | Approx. Cumulative % of Total Rent Rolling |
| MTM | 0 | 0 | $0.00 | 0.0% | 0.0% | $0 | 0.0% | 0.0% |
| 2020 | 10 | 13,293 | $81.42 | 7.8% | 7.8% | $1,082,323 | 8.3% | 8.3% |
| 2021 | 7 | 10,229 | $74.41 | 6.0% | 13.7% | $761,190 | 5.8% | 14.1% |
| 2022 | 3 | 7,956 | $90.64 | 4.6% | 18.4% | $721,111 | 5.5% | 19.6% |
| 2023 | 7 | 18,053 | $72.37 | 10.5% | 28.9% | $1,306,554 | 10.0% | 29.6% |
| 2024 | 7 | 11,049 | $72.80 | 6.4% | 35.3% | $804,406 | 6.1% | 35.7% |
| 2025 | 8 | 18,423 | $72.76 | 10.7% | 46.1% | $1,340,502 | 10.2% | 45.9% |
| 2026 | 6 | 28,804 | $76.39 | 16.8% | 62.9% | $2,200,470 | 16.8% | 62.7% |
| 2027 | 1 | 1,318 | $76.49 | 0.8% | 63.7% | $100,814 | 0.8% | 63.5% |
| 2028 | 4 | 8,459 | $189.52 | 4.9% | 68.6% | $1,603,135 | 12.2% | 75.7% |
| 2029 | 7 | 25,876 | $73.83 | 15.1% | 83.7% | $1,910,358 | 14.6% | 90.3% |
| 2030 | 5 | 7,603 | $56.40 | 4.4% | 88.1% | $428,835 | 3.3% | 93.6% |
| 2031 & Beyond | 4 | 7,346 | $114.40 | 4.3% | 92.4% | $840,389 | 6.4% | 100.0% |
| Vacant Space | 0 | 12,986 | $0.00 | 7.6% | 100.0% | $0 | 0.0% | 100.0% |
| Total/Wtd. Avg.(3) | 69 | 171,395 | $82.70 | 100.0% | $13,100,086 | 100.0% | ||
| (1) | Information is based on the underwritten rent roll as of November 27, 2019. |
| (2) | Certain tenants may have lease termination options that are exercisable prior to the stated expiration date of the subject lease or leases that are not considered in the lease rollover schedule. |
| (3) | Total/Wtd. Avg. UW Rent PSF Rolling excludes vacant space. |
The Market. The 200 West 57th Street Property is located in New York, New York along the southwest corner of Seventh Avenue and West 57th Street. The 200 West 57th Street Property has frontage along both such commercial corridors and is in close proximity to Central Park. The 200 West 57th Street Property is located immediately west of Carnegie Hall along Seventh Avenue, immediately south of the new Nordstrom flagship department store along West 57th Street, and near multiple subway stations, as well as Columbus Circle and the Fifth Avenue retail corridor. The 200 West 57th Street Property is located in the Midtown West office submarket of the Midtown office market. According to the appraisal, as of the third quarter of 2019, the vacancy rate in the Midtown West office submarket was approximately 10.3%, with average asking rents of $76.95 PSF and inventory of approximately 31.0 million SF. According to the appraisal, as of the third quarter of 2019, the vacancy rate in the Midtown office market was approximately 11.1%, with average asking rents of $80.93 PSF and inventory of approximately 243.3 million SF.
The following table presents certain information relating to the appraisal’s market rent conclusion for the 200 West 57th Street Property:
| Market Rent Summary | ||||||
| Office 2nd-14th Floor Space | Office 15th -16th Floor Space | Retail (57th Street) | Retail (Corner) | Retail (7th Avenue) | Retail (Mezz) | |
| Market Rent (PSF) | $73.00 | $92.00 | $350.00 | $475.00 | $275.00 | $50.00 |
| Lease Term (Years) | 10 or 15 | 10 or 15 | 10 | 10 | 10 | 10 |
| Lease Type (Reimbursements) | Modified Gross | Modified Gross | Modified Gross | Modified Gross | Modified Gross | Modified Gross |
| Rent Increase Projection | 2.75%per annum | 2.75%per annum | 3.0%per annum | 3.0%per annum | 3.0%per annum | 3.0%per annum |
The following table presents recent leasing data with respect to comparable office properties with respect to the 200 West 57th Street Property:
| Comparable Office Lease Summary | |||||||
| Property/Location | Year Built | SF | Tenant Name | Size (SF) | Lease Date | Rent PSF | Lease Type |
521 West 57th Street New York, NY | 1916 | 360,000 | Laboratory Corporation of America | 14,036 | 7/1/2019 | $52.85 | Gross |
145 East 57th Street New York, NY | 1921 | 48,000 | The Browning School | 4,758 | 6/1/2019 | $65.00 | Gross |
645 Madison Avenue New York, NY | 1971 | 135,000 | The Rothman Institute | 21,461 | 3/1/2019 | $82.00 | Gross |
4 Columbus Circle New York, NY | 1989 | 123,000 | New Hope Fertility | 74,080 | 2/1/2019 | $65.00 | Gross |
130 East 59th Street New York, NY | 1954 | 206,678 | RRE Ventures | 8,626 | 6/1/2018 | $62.00 | Gross |
30 East 60th Street New York, NY | 1922 | 101,024 | Dr. Elena Maria Buruiana, MD | 2,379 | 3/1/2018 | $69.00 | Gross |
Source:Appraisal.
| This is not a research report and was not prepared by any Underwriter’s research department. Please see additional important information and qualifications at the end of this Term Sheet. |
T-64
| Office – CBD | Loan #4 | Cut-off Date Balance: | $70,000,000 | |
| 200 West 57th Street | 200 West 57th Street | Cut-off Date LTV: | 62.2% | |
| New York, NY 10019 | UW NCF DSCR: | 1.93x | ||
| UW NOI Debt Yield: | 7.5% |
Operating History and Underwritten Net Cash Flow. The following table presents certain information relating to the operating history and Underwritten Net Cash Flow at the 200 West 57th Street Property:
| Cash Flow Analysis | ||||||
| 2016 | 2017 | 2018 | 9/30/2019 TTM | UW | UW PSF | |
| Gross Potential Rent(1) | $10,654,328 | $11,412,312 | $11,534,673 | $11,292,460 | $14,023,003 | $81.82 |
| Total Recoveries | $1,785,928 | $1,846,001 | $2,011,963 | $2,011,195 | $2,072,069 | $12.09 |
| Other Income | $175,084 | $31,217 | $28,646 | $27,266 | $14,400 | $0.08 |
| Less Vacancy & Credit Loss | $0 | $0 | $0 | $0 | ($961,478) | ($5.61) |
| Effective Gross Income | $12,615,340 | $13,289,530 | $13,575,282 | $13,330,921 | $15,147,994 | $88.38 |
| Real Estate Taxes | $2,934,691 | $3,072,244 | $3,206,728 | $3,314,252 | $3,561,349 | $20.78 |
| Insurance | $115,338 | $97,583 | $93,632 | $100,650 | $95,345 | $0.56 |
| Other Expenses | $2,309,968 | $2,260,906 | $2,458,645 | $2,435,935 | $2,838,263 | $16.56 |
| Total Expenses | $5,359,997 | $5,430,733 | $5,759,005 | $5,850,837 | $6,494,957 | $37.89 |
| Net Operating Income(1) | $7,255,343 | $7,858,797 | $7,816,277 | $7,480,084 | $8,653,037 | $50.49 |
| Capital Expenditures | $0 | $0 | $0 | $0 | $46,388 | $0.27 |
| TI/LC | $0 | $0 | $0 | $0 | $671,802 | $3.92 |
| Net Cash Flow | $7,255,343 | $7,858,797 | $7,816,277 | $7,480,084 | $7,934,848 | $46.30 |
| Occupancy % | 92.9% | 91.7% | 94.2% | 95.1%(2) | 92.4% | |
| NOI DSCR(3) | 1.77x | 1.91x | 1.90x | 1.82x | 2.11x | |
| NCF DSCR(3) | 1.77x | 1.91x | 1.90x | 1.82x | 1.93x | |
| NOI Debt Yield(3) | 6.3% | 6.8% | 6.8% | 6.5% | 7.5% | |
| NCF Debt Yield(3) | 6.3% | 6.8% | 6.8% | 6.5% | 6.9% | |
| (1) | UW Gross Potential Rent is based on the underwritten rent roll dated November 27, 2019. The increase in Gross Potential Rent and Net Operating Income from 9/30/2019 TTM to UW is due to (i) rent steps through January 1, 2021 totaling $273,320 and (ii) new leasing at the end of 2019 and beginning of 2020 ($925,622 of UW Gross Potential Rent). |
| (2) | 9/30/2019 TTM Occupancy % is as of November 27, 2019 and includes three tenants (4,609 SF) that are expected to vacate the 200 West 57th Street Property in 2020. Rent from these tenants was not underwritten. Without such tenants, occupancy is 92.4%. |
| (3) | Debt service coverage ratios and debt yields are based on the 200 West 57th Street Whole Loan. |
Escrows and Reserves.
Taxes– The 200 West 57th Street Borrower deposited at loan origination approximately $143,187 into a reserve for real estate taxes. The 200 West 57th Street Whole Loan documents provide for monthly deposits into a reserve for real estate taxes in an amount equal to 1/12 of the real estate taxes that the lender estimates will be payable during the next twelve months (currently $143,187), provided that such deposits are not required if such deposits would cause the amount then on deposit in such reserve to exceed the amount needed to pay taxes for the next 24 months.
Insurance – The 200 West 57th Street Whole Loan documents provide for monthly deposits into a reserve for insurance premiums in an amount equal to 1/12 of the insurance premiums that the lender estimates will be payable for the renewal of coverage upon the expiration of the insurance policies;provided that such monthly deposits are not required (A) so long as (i) no event of default has occurred and is continuing, and (ii) the liability and casualty insurance coverage is included in a blanket policy approved by the lender in its reasonable discretion, or (B) if such deposits would cause the amount then on deposit in such reserve to exceed the amount needed to pay the insurance premiums for the next 24 months.
Recurring Replacements Reserve – The 200 West 57th Street Whole Loan documents provide for monthly deposits of approximately $3,866 into a reserve for approved capital expenditures;provided that such deposits are not required if they would cause the amount then on deposit in such reserve to exceed approximately $92,775.
Rollover Reserve– The 200 West 57th Street Whole Loan documents provide for monthly deposits of approximately $21,424 into a reserve for future tenant improvements and leasing commissions;provided that such deposits are not required if they would cause the amount then on deposit in such reserve to exceed approximately $514,185.
TI/LC Reserve – The 200 West 57th Street Whole Loan documents provide for an upfront reserve of approximately $1,373,534 for outstanding tenant improvement and leasing commission costs under the leases for 13 tenants.
Rent Concession Reserve – The 200 West 57th Street Whole Loan documents provide for an upfront reserve of approximately $696,225 for 17 tenants, including among others, the St. Luke’s Roosevelt Hospital, Extended Fertility LLC and Orthology Inc., for outstanding rent credits, concessions and/or abatements.
| This is not a research report and was not prepared by any Underwriter’s research department. Please see additional important information and qualifications at the end of this Term Sheet. |
T-65
| Office – CBD | Loan #4 | Cut-off Date Balance: | $70,000,000 | |
| 200 West 57th Street | 200 West 57th Street | Cut-off Date LTV: | 62.2% | |
| New York, NY 10019 | UW NCF DSCR: | 1.93x | ||
| UW NOI Debt Yield: | 7.5% |
Lockbox and Cash Management.The 200 West 57th Street Whole Loan is structured with a hard lockbox and springing cash management. The 200 West 57th Street Borrower is required to direct each tenant of the 200 West 57th Street Property to deposit rent directly into a lender-controlled lockbox account, and to deposit any funds received by the 200 West 57th Street Borrower and property manager, notwithstanding such direction, into the lockbox account within one business day of receipt. Upon the first occurrence of a Trigger Period (as defined below), the lender is required to establish a lender-controlled cash management account, into which all funds in the lockbox account will be required to be deposited, so long as the Trigger Period is continuing. During the continuance of a Trigger Period, provided no event of default under the 200 West 57th Street Whole Loan documents is continuing, all funds in the cash management account are required to be applied on each monthly payment date: (i) to make the monthly deposits into the real estate tax and insurance reserves as described above under “Escrows and Reserves”, (ii) to pay the monthly interest payment for the next calendar month, (iii) to pay monthly operating expenses for the calendar month in which such monthly payment date occurs as set forth in the annual budget (which during a Trigger Period is required to be reasonably approved by the lender), (iv) to make the monthly deposit into the recurring replacements reserve and the rollover funds reserve as described under “Escrows and Reserves”, and (v) to deposit any remainder into an excess cash flow subaccount to be held as additional security for the 200 West 57th Street Whole Loan during the continuance of such Trigger Period. If no Trigger Period is continuing, all funds in the excess cash flow subaccount are required to be disbursed to the 200 West 57th Street Borrower.
“Trigger Period” means a period:
| (i) | commencing upon an event of default under the 200 West 57th Street Whole Loan, and ending upon the cure, if applicable, of such event of default, or |
| (ii) | commencing upon the debt yield on the 200 West 57th Street Whole Loan falling below 5.7% for two consecutive calendar quarters, and ending on the date the debt yield on the 200 West 57th Street Whole Loan equals or exceeds 6.0% for two consecutive calendar quarters. |
Notwithstanding the foregoing, a Trigger Period will not commence in connection with clause (ii) of the definition of Trigger Period if, within ten business days following the 200 West 57th Street Borrower’s receipt of written notice of the failure to satisfy a debt yield of 5.7% for two consecutive calendar quarters, the 200 West 57th Street Borrower deposits with the lender a letter of credit in an amount equal to the amount which, if applied as a partial prepayment of the 200 West 57th Street Whole Loan, would cause the debt yield to be greater than or equal to 5.7%.
Additional Secured Indebtedness (not including trade debts).The 200 West 57th Street Property also secures the 200 West 57th Street ServicedPari PassuCompanion Loan, which has a Cut-off Date principal balance of $45,000,000. The 200 West 57th Street ServicedPari Passu Companion Loan accrues interest at the same rate as the 200 West 57th Street Mortgage Loan. The 200 West 57th Street Mortgage Loan is entitled to payments of interest on apro rata andpari passubasis with the 200 West 57th Street ServicedPari PassuCompanion Loan. The holders of the 200 West 57th Street Mortgage Loan and the 200 West 57th Street ServicedPari PassuCompanion Loan have entered into a co-lender agreement which sets forth the allocation of collections on the 200 West 57th Street Whole Loan. See “Description of the Mortgage Pool—The Whole Loans—The Serviced Pari Passu Whole Loans” in the Preliminary Prospectus.
Mezzanine Loan and Preferred Equity.Not permitted.
Release of Property.Not permitted.
Letter of Credit.The 200 West 57th Street Borrower has the right to deliver a letter of credit to end a Trigger Period as described above under “Lockbox and Cash Management.”
Right of First Offer / Right of First Refusal.None.
Ground Lease.None.
Terrorism Insurance.
The 200 West 57th Street Borrower is required to obtain and maintain an “all risk” property insurance policy that covers perils of terrorism and acts of terrorism in an amount equal to the “full replacement cost” of the 200 West 57th Street Property, together with business income insurance covering not less than the 18-month period commencing at the time of loss and an extended period of indemnity endorsement of up to 12 months. Notwithstanding the foregoing, for so long as the Terrorism Risk Insurance Act of 2002, as extended and modified by the Terrorism Risk Insurance Program Reauthorization Act of 2015 (“TRIPRA”) is in effect (including any extensions thereof or if another federal governmental program is in effect relating to “acts of terrorism” which provides substantially similar protections as TRIPRA), and covers both domestic and foreign acts of terrorism, the lender is required to accept terrorism insurance which insures against acts that are “certified” as defined by TRIPRA (or such other program). If TRIPRA or a similar or subsequent statute is not in effect, then the 200 West 57th Street Borrower will not be required to spend on terrorism insurance more than 1.5 times the amount of the insurance premiums that are payable at such time in respect of the property and business income insurance required under the loan documents (without giving effect to the cost of the terrorism components of such insurance). See“Risk Factors—Risks Relating to the Mortgage Loans—Terrorism Insurance May Not Be Available for All Mortgaged Properties”in the Preliminary Prospectus.
| This is not a research report and was not prepared by any Underwriter’s research department. Please see additional important information and qualifications at the end of this Term Sheet. |
T-66
(THIS PAGE INTENTIONALLY LEFT BLANK)
T-67
| Office – CBD | Loan #5 | Cut-off Date Balance: | $60,000,000 | |
| 545 Washington Boulevard | 545 Washington Boulevard | Cut-off Date LTV: | 61.4% | |
| Jersey City, NJ 07310 | U/W NCF DSCR: | 2.50x | ||
| U/W NOI Debt Yield: | 8.8% |
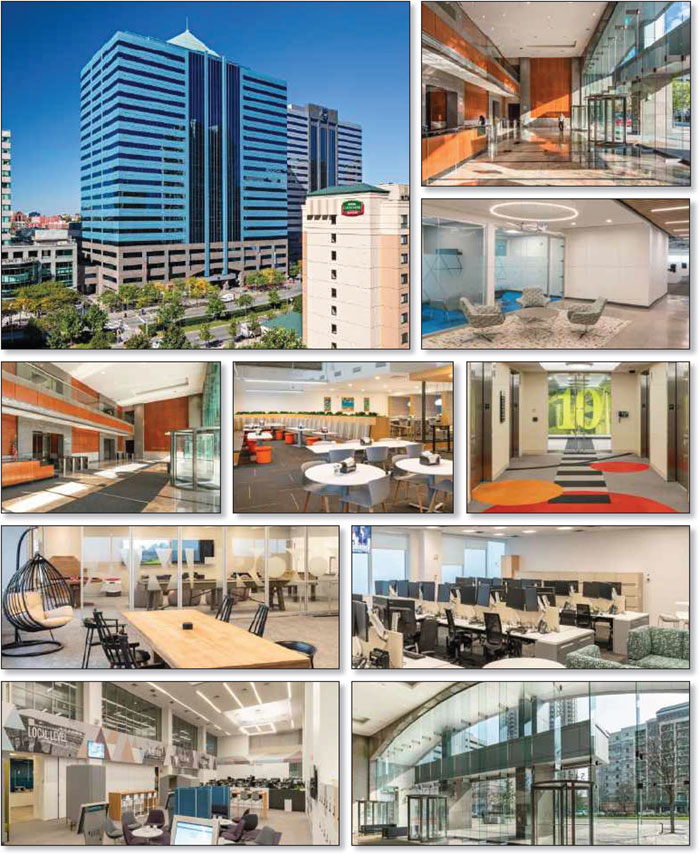
| This is not a research report and was not prepared by any Underwriter’s research department. Please see additional important information and qualifications at the end of this Term Sheet. |
T-68
| Office – CBD | Loan #5 | Cut-off Date Balance: | $60,000,000 | |
| 545 Washington Boulevard | 545 Washington Boulevard | Cut-off Date LTV: | 61.4% | |
| Jersey City, NJ 07310 | U/W NCF DSCR: | 2.50x | ||
| U/W NOI Debt Yield: | 8.8% |
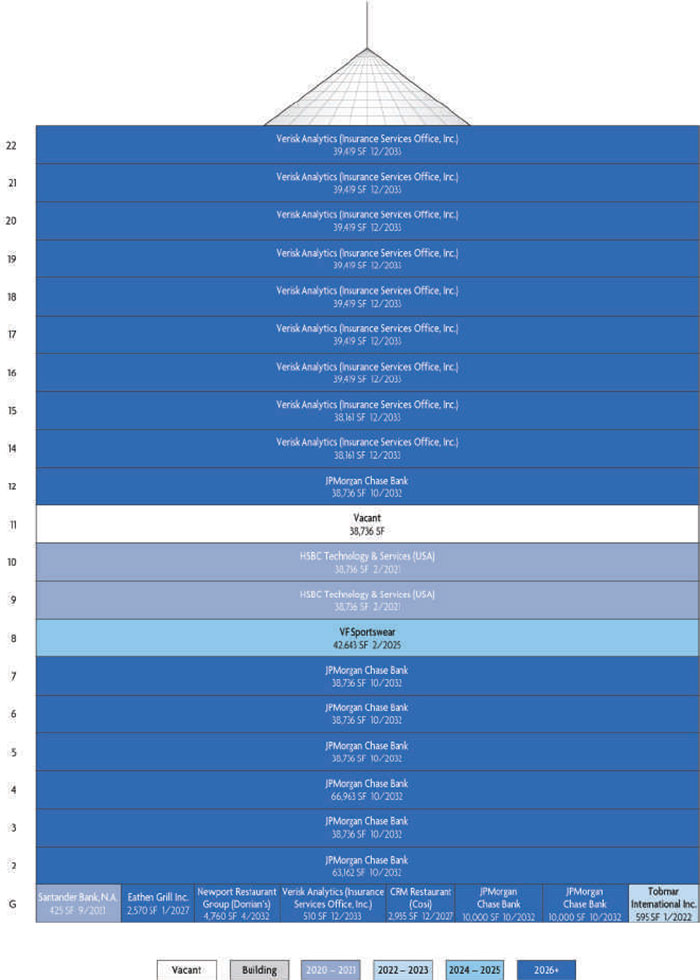
| This is not a research report and was not prepared by any Underwriter’s research department. Please see additional important information and qualifications at the end of this Term Sheet. |
T-69
| Office – CBD | Loan #5 | Cut-off Date Balance: | $60,000,000 | |
| 545 Washington Boulevard | 545 Washington Boulevard | Cut-off Date LTV: | 61.4% | |
| Jersey City, NJ 07310 | U/W NCF DSCR: | 2.50x | ||
| U/W NOI Debt Yield: | 8.8% |
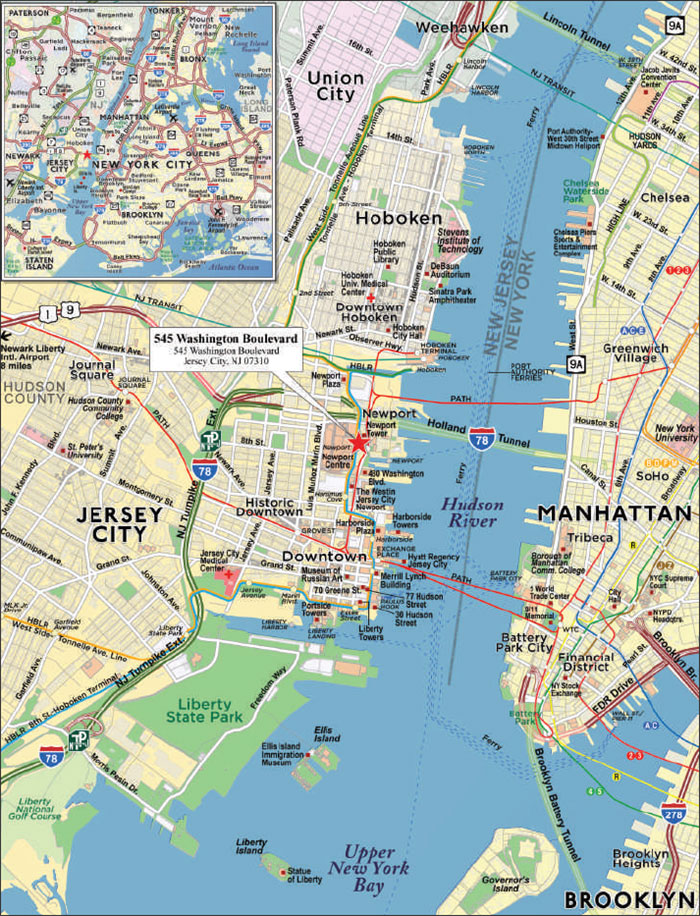
| This is not a research report and was not prepared by any Underwriter’s research department. Please see additional important information and qualifications at the end of this Term Sheet. |
T-70
| Mortgage Loan No. 5 – 545 Washington Boulevard |
| Mortgage Loan Information | Property Information | ||||||
| Mortgage Loan Seller: | MSMCH | Single Asset/Portfolio: | Single Asset | ||||
| Credit Assessment (DBRS/Fitch/S&P): | NR/NR/NR | Location: | Jersey City, NJ 07310 | ||||
| Original Balance(1): | $60,000,000 | General Property Type: | Office | ||||
| Cut-off Date Balance(1): | $60,000,000 | Detailed Property Type: | CBD | ||||
| % of Initial Pool Balance: | 5.0% | Title Vesting: | Fee | ||||
| Loan Purpose: | Acquisition | Year Built/Renovated: | 2001/N/A | ||||
| Borrower Sponsors: | HGI Opportunity Fund XIII, LP; HGGP | Size: | 866,706 SF | ||||
| Capital XIV, LP | Cut-off Date Balance Per SF(1): | $290 | |||||
| Guarantors(2): | Various | Maturity Date Balance Per SF(1): | $290 | ||||
| Mortgage Rate: | 3.4050% | Property Manager: | Harbor Group Management Co., | ||||
| Note Date: | 1/6/2020 | LLC (borrower-related) | |||||
| First Payment Date: | 3/5/2020 | ||||||
| Maturity Date: | 2/5/2030 | ||||||
| Original Term to Maturity: | 120 months | Underwriting and Financial Information | |||||
| Original Amortization Term: | 0 months | UW NOI: | $22,265,395 | ||||
| IO Period: | 120 months | UW NOI Debt Yield(1): | 8.8% | ||||
| Seasoning: | 1 month | UW NOI Debt Yield at Maturity(1): | 8.8% | ||||
| Prepayment Provisions: | LO (25); DEF (88); O (7) | UW NCF DSCR(1): | 2.50x | ||||
| Lockbox/Cash Mgmt Status: | Springing/Springing | Most Recent NOI: | $20,411,841 (11/30/2019 TTM) | ||||
| Additional Debt Type(1)(3): | Pari Passu | 2nd Most Recent NOI: | $21,825,858 (12/31/2018) | ||||
| Additional Debt Balance(1)(3): | $191,606,250 | 3rd Most Recent NOI: | $19,827,872 (12/31/2017) | ||||
| Future Debt Permitted (Type)(4): | Yes (Mezzanine) | Most Recent Occupancy: | 95.5% (8/1/2019) | ||||
| Reserves(5) | 2nd Most Recent Occupancy: | 95.5% (12/31/2018) | |||||
| Type | Initial | Monthly | Cap | 3rd Most Recent Occupancy: | 95.5% (12/31/2017) | ||
| RE Tax: | $881,651 | Springing | N/A | Appraised Value (as of): | $410,000,000 (10/16/2019) | ||
| Insurance: | $0 | Springing | N/A | Appraised Value per SF: | $473 | ||
| Replacement Reserve: | $0 | $10,834 | N/A | Cut-off Date LTV Ratio(1): | 61.4% | ||
| TI/LC: | $0 | $72,226 | $1,500,000 | Maturity Date LTV Ratio(1): | 61.4% | ||
| Existing TI/LC Obligations Reserve: | $4,840,935 | $0 | N/A | ||||
| Rent Concession Reserve: | $21,201,910 | $0 | N/A | ||||
| Major Tenant Rollover Reserve: | $0 | Springing | N/A | ||||
| Sources and Uses | ||||||
| Sources | Proceeds | % of Total | Uses | Proceeds | % of Total | |
| Whole Loan Amount(1): | $251,606,250 | 62.1% | Purchase Price: | $372,750,000 | 92.0% | |
| Borrower Equity: | $153,568,618 | 37.9% | Reserves: | $26,924,496 | 6.6% | |
| Closing Costs: | $5,500,372 | 1.4% | ||||
| Total Sources: | $405,174,868 | 100.0% | Total Uses: | $405,174,868 | 100.0% | |
| (1) | The 545 Washington Boulevard Mortgage Loan (as defined below) is a part of the 545 Washington Boulevard Whole Loan (as defined below) with an original aggregate principal balance of $251,606,250. The Cut-off Date Balance Per SF, Maturity Date Balance Per SF, UW NOI Debt Yield, UW NOI Debt Yield at Maturity, UW NCF DSCR, Cut-off Date LTV Ratio and Maturity Date LTV Ratio numbers presented above are based on the 545 Washington Boulevard Whole Loan. The 545 Washington Boulevard Whole Loan was co-originated by Morgan Stanley Bank, N.A. (“MSBNA”), an affiliate of MSMCH, and Barclays Capital Real Estate Inc. (“Barclays”) on January 6, 2020. |
| (2) | See “The Borrowers and the Borrower Sponsors” below for further discussion. |
| (3) | See “The Mortgage Loan” and “Additional Secured Indebtedness (not including trade debts)” for further discussion of additional debt. |
| (4) | See “Subordinate and Mezzanine Indebtedness” for further discussion of permitted mezzanine debt. |
| (5) | See “Escrows and Reserves” below for further discussion of reserve requirements. |
The Mortgage Loan.The fifth largest mortgage loan (the “545 Washington Boulevard Mortgage Loan”) is part of a whole loan (the “545 Washington Boulevard Whole Loan”) evidenced by fourpari passu promissory notes in the aggregate original principal amount of $251,606,250. The 545 Washington Boulevard Whole Loan is secured by a first priority fee and leasehold mortgage on an 866,706 SF office tower located in Jersey City, New Jersey (the “545 Washington Boulevard Property”). The 545 Washington Boulevard Whole Loan was co-originated by MSBNA and Barclays. The 545 Washington Boulevard Mortgage Loan is evidenced by the non-controlling Note A-3 in the original principal amount of $60,000,000. The controlling Note A-1, in the original principal amount of $81,285,000, was contributed to the BANK 2020-BNK25 securitization transaction, and the non-controlling Notes A-2 and A-4, in the aggregate original principal amount of $110,321,250 (together with Note A-1, the “545 Washington Boulevard Non-ServicedPari Passu Companion Loans”), were contributed to the securitization transactions set forth in the table below. The 545 Washington Boulevard Whole Loan is serviced pursuant to the pooling and servicing agreement for the BANK 2020-BNK25 securitization trust. See “Description of the Mortgage Pool—The Whole Loans—The Non-Serviced Pari Passu Whole Loans” and “Pooling and Servicing Agreement—Servicing of the Non-Serviced Mortgage Loans” in the Preliminary Prospectus.
| This is not a research report and was not prepared by any Underwriter’s research department. Please see additional important information and qualifications at the end of this Term Sheet. |
T-71
| Office – CBD | Loan #5 | Cut-off Date Balance: | $60,000,000 | |
| 545 Washington Boulevard | 545 Washington Boulevard | Cut-off Date LTV: | 61.4% | |
| Jersey City, NJ 07310 | U/W NCF DSCR: | 2.50x | ||
| U/W NOI Debt Yield: | 8.8% |
| Note Summary | ||||
| Notes | Original Principal Balance | Cut-off Date Balance | Anticipated Note Holder | Controlling Interest |
| A-1 | $81,285,000 | $81,285,000 | BANK 2020-BNK25 | Yes |
| A-2 | $60,000,000 | $60,000,000 | MSC 2020-L4 | No |
| A-3 | $60,000,000 | $60,000,000 | BANK 2020-BNK26 | No |
| A-4 | $50,321,250 | $50,321,250 | BBCMS 2020-C6 | No |
| Total | $251,606,250 | $251,606,250 | ||
The Borrowers and the Borrower Sponsors.The borrower for the 545 Washington Boulevard Whole Loan is comprised of 18 tenant-in-common co-borrowers which collectively own both fee and leasehold interests in the 545 Washington Boulevard Property with (a) one such borrower owning approximately 75% of the fee interests, another owning approximately 12% of the fee interests and no other borrower owning more than approximately 5% of the fee interests (collectively, the “Fee Borrowers”), and (b) one such borrower owning approximately 75% of the leasehold interests, another owning approximately 12% of the leasehold interests, and no other borrower owning more than approximately 5% of the leasehold interests (collectively, the “Leasehold Borrowers”, and together with the Fee Borrowers, the “545 Washington Boulevard Borrowers”), each either a single purpose Delaware limited liability company or limited partnership and each with one independent director in its organizational structure. Legal counsel to the 545 Washington Boulevard Borrowers delivered a non-consolidation opinion in connection with the origination of the 545 Washington Boulevard Whole Loan. The borrower sponsors are HGI Opportunity Fund XIII, LP and HGGP Capital XIV, LP, each of which is controlled by principals of Harbor Group International (“HGI”), a global real estate investment and management firm. HGI invests in and manages diversified property portfolios including office, retail, and multifamily properties. Currently, HGI owns and manages 33,000 multifamily units, and 3.6 million SF of commercial real estate. HGI has over 34 years of experience in the industry and over 750 employees worldwide. The non-recourse carveout guarantors are HGGP Capital VIII, LLC, HGGP Capital IX, LLC, HGGP Capital X, LLC, HGGP Capital XI, LLC, HGGP Capital XII, LLC, HGGP Capital XIII, LLC, each a Virginia limited liability company, and HGGP Capital XIV, LP, a Delaware limited partnership. The non-recourse carveout guarantors are affiliates of the borrower sponsors.
The Property. The 545 Washington Boulevard Property consists of a 22-story office building, totaling 866,706 SF, on an approximately 2.7-acre site in Jersey City, New Jersey. Of the total 866,706 SF rentable area, 11,285 SF is ground floor retail space leased to Santander Bank, N.A., Eathen Grill Inc., Dorrian's, Cosi and Tobmar International Inc. The 545 Washington Boulevard Property was originally built in 2001. The 545 Washington Boulevard Property was 95.5% leased as of August 1, 2019 to nine tenants. The two largest tenants, Insurance Services Office, Inc. (a subsidiary of Verisk Analytics) (“ISO”) (40.7% of net rentable area) and JPMorgan Chase Bank (39.7% of net rentable area), comprise 80.4% of net rentable area and 82.8% of base rent and have leases extending through 2032 or beyond.
The 545 Washington Boulevard Property has a surface parking lot at the rear of the property that can accommodate up to 15 cars and is reserved for ISO executive parking. There is an irrevocable, perpetual parking easement in place pursuant to which the 545 Washington Boulevard Borrowers and all future owners of the improvements have the right to use 739 parking spaces in the parking garage located at 561 Washington Boulevard (the “North Garage”). Pursuant to a partnership (the “Garage Partnership”) between, among other parties, the owner of the North Garage and 545 Washington Parking Garage, LP, an affiliate of the 545 Washington Boulevard Borrowers (the “Garage Affiliate”), certain additional income generated from transient parking operations at the North Garage is additional collateral for the 545 Washington Boulevard Whole Loan. The Garage Affiliate’s 26.7752% interest in the Garage Partnership has been pledged as collateral for the 545 Washington Boulevard Whole Loan. Income from the parking garage represents only 5.5% of underwritten effective gross income. JPMorgan Chase Bank is entitled to use 343 spaces at the North Garage pursuant to its lease, ISO is entitled to use at least 348 spaces at the North Garage pursuant to its lease, and various other tenants are also entitled to use spaces at the North Garage, in each case, subject to the terms of each respective lease, for a total of 765 parking spaces at the North Garage (i.e., an overage of 26 spaces). There is an additional parking easement in place pursuant to which the 545 Washington Boulevard Borrowers and all future owners of the improvements have the right, for a period of 25 years from the origination date, to park up to 128 cars, on a non-exclusive basis, in an adjacent garage at 90 Town Square Place.
Major Tenants.
ISO (352,765 SF, 40.7% of NRA, 42.0% of underwritten base rent). ISO has been a tenant at the 545 Washington Boulevard Property since the building was constructed and extended its lease in 2014. ISO has a lease expiration of December 31, 2033 with one, 10-year renewal option followed by two, 5-year renewal options remaining. ISO is a subsidiary of Verisk Analytics. Verisk Analytics provides data analytics solutions in the United States and internationally, offering predictive analytics and decision support solutions to customers in rating, underwriting, claims, catastrophe and weather risk, natural resources intelligence, economic forecasting, and various other fields. ISO serves insurers, reinsurers, agents and brokers, insurance regulators, risk managers, and other participants in the property and casualty insurance marketplace. ISO has the option to lease: (i) an entire floor containing 38,736 rentable SF and located between the 3rd and 11th floors by notice at least 18 months in advance of the 10th anniversary of the rent commencement date, (ii) one additional floor containing 38,736 rentable SF and located between the 3rd and 11th floors by notice at least 13 months in advance of the 15th anniversary of the rent commencement date and (iii) one additional floor containing 38,736 rentable SF and located between the 3rd and 11th floors by notice at least 13 months in advance of the 20th anniversary of the rent commencement date. Provided that ISO waives its option on the third option space, ISO has the option to terminate the lease as to a full floor of the building, which must be either the top or the bottom floor, exercisable at least 15 months before the second giveback date (a date specified by ISO between January 2, 2025 and December 31, 2025). In the event that ISO exercises its option to terminate a floor, it is required to make a payment equal to the unamortized portion of the leasing commissions, free rent, landlord’s second contribution ($14,110,600), test-fit allowance ($52,915) and bathroom allowance ($80,000) allocable to the giveback space.
JPMorgan Chase Bank (343,805 SF, 39.7% of NRA, 40.9% of underwritten base rent). JPMorgan Chase Bank has been a tenant at the 545 Washington Boulevard Property since 2016 and has a lease expiration of October 31, 2032 with two, 5-year renewal options remaining. At origination, $21,201,910 was reserved for 27 months of free rent for JPMorgan Chase Bank, beginning on and including the payment date occurring in November 2021 at a rate of (i) $916,813 for the period from and including November 2021 through and including July 2022, (ii) $876,828 for August 2022 and (iii) $710,221 for the period from and including September 2022 through and including January 2024. JPMorgan Chase & Co. operates as a financial services company worldwide. It operates through four segments: Consumer & Community Banking (CCB), Corporate & Investment Bank (CIB), Commercial Banking (CB),
| This is not a research report and was not prepared by any Underwriter’s research department. Please see additional important information and qualifications at the end of this Term Sheet. |
T-72
| Office – CBD | Loan #5 | Cut-off Date Balance: | $60,000,000 | |
| 545 Washington Boulevard | 545 Washington Boulevard | Cut-off Date LTV: | 61.4% | |
| Jersey City, NJ 07310 | U/W NCF DSCR: | 2.50x | ||
| U/W NOI Debt Yield: | 8.8% |
and Asset & Wealth Management (AWM). The company also provides ATMs, digital covering online and mobile, and telephone banking services. JPMorgan Chase & Co. was founded in 1799 and is headquartered in New York, New York.
HSBC Technology & Services (USA) (77,472 SF, 8.9% of NRA, 11.2% of underwritten base rent). HSBC Technology & Services (USA) (“HSBC”) has been a tenant at the 545 Washington Boulevard Property since 2009 and has a lease expiration of February 28, 2021 with one 5-year renewal option remaining. HSBC serves small enterprises, government, and corporate and institutional clients, as well as high net worth individuals and families. The company was founded in 1865 and is headquartered in London, England with 30,437 employees.
The following table presents a summary regarding the major tenants at the 545 Washington Boulevard Property:
| Tenant Summary(1) | |||||||||
| Tenant Name | Credit Rating (Fitch/ /Moody’s/S&P)(2) | Tenant SF | Approx.% of SF | Annual UW Rent | Annual UW Rent PSF | ||||
| App. % of Total Annual UW Rent | Lease Expiration | Renewal Options | Term. Option | ||||||
| ISO(3) | BBB+/Baa2/BBB | 352,765 | 40.7% | $11,288,480 | $32.00 | 42.0% | 12/31/2033 | Various | Y |
| JPMorgan Chase Bank(4) | AA-/A2/A- | 343,805 | 39.7% | $11,001,760 | $32.00 | 40.9% | 10/31/2032 | 2 x 5 year | N |
| HSBC | A+/A2/A | 77,472 | 8.9% | $3,021,408 | $39.00 | 11.2% | 2/28/2021 | 1 x 5 year | N |
| Subtotal/Wtd. Avg. | 774,042 | 89.3% | $25,311,648 | $32.70 | 94.1% | ||||
| Other Tenants | 53,928 | 6.2% | $1,594,829 | $29.57 | 5.9% | ||||
| Vacant Space | 38,736 | 4.5% | $0 | $0.00 | 0.0% | ||||
| Total/Wtd. Avg. | 866,706 | 100.0% | $26,906,477 | $32.50 | 100.0% | ||||
| (1) | Information is based on the underwritten rent roll as of August 1, 2019. |
| (2) | Certain ratings are those of the parent company whether or not the parent guarantees the lease. |
| (3) | ISO has the option to lease: (i) an entire floor containing 38,736 rentable SF and located between the 3rd and 11th floors by notice at least 18 months in advance of the 10th anniversary of the rent commencement date, (ii) one additional floor containing 38,736 rentable SF and located between the 3rd and 11thfloors by notice at least 13 months in advance of the 15th anniversary of the rent commencement date and (iii) one additional floor containing 38,736 rentable SF and located between the 3rd and 11th floors by notice at least 13 months in advance of the 20th anniversary of the rent commencement date.Provided that ISO waives its option on the third option space, ISO has the option to terminate the lease as to a full floor of the building, which must be either the top or the bottom floor, exercisable at least 15 months before the second giveback date (a date specified by Verisk Analytics between January 2, 2025 and December 31, 2025). ISO is required to make a payment equal to the unamortized portion of the leasing commissions, free rent, landlord’s second contribution ($14,110,600), test-fit allowance ($52,915) and bathroom allowance ($80,000) allocable to the giveback space. ISO has one, 10-year renewal option followed by two, 5-year renewal options remaining. |
| (4) | At origination, $21,201,910 was reserved for 27 months of free rent for JPMorgan Chase Bank, beginning on and including the monthly payment date occurring in November 2021 at a rate of (i) $916,813 for the period from and including November 2021 through and including July 2022, (ii) $876,828 for August 2022 and (iii) $710,221 for the period from and including September 2022 through and including January 2024. |
The following table presents certain information relating to the lease rollover at the 545 Washington Boulevard Property:
| Lease Rollover Schedule(1)(2) | ||||||||
| Year | # of Leases Rolling | SF Rolling | Annual UW Rent PSF Rolling(3) | Approx. % of Total SF Rolling | Approx. Cumulative % of SF Rolling | Total UW Rent Rolling | Approx. % of Total Rent Rolling | Approx. Cumulative % of Total Rent Rolling |
| MTM | 0 | 0 | $0.00 | 0.0% | 0.0% | $0 | 0.0% | 0.0% |
| 2020 | 0 | 0 | $0.00 | 0.0% | 0.0% | $0 | 0.0% | 0.0% |
| 2021 | 2 | 77,897 | $39.20 | 9.0% | 9.0% | $3,053,542 | 11.3% | 11.3% |
| 2022 | 1 | 595 | $60.00 | 0.1% | 9.1% | $35,700 | 0.1% | 11.5% |
| 2023 | 0 | 0 | $0.00 | 0.0% | 9.1% | $0 | 0.0% | 11.5% |
| 2024 | 0 | 0 | $0.00 | 0.0% | 9.1% | $0 | 0.0% | 11.5% |
| 2025 | 1 | 42,643 | $25.00 | 4.9% | 14.0% | $1,066,075 | 4.0% | 15.4% |
| 2026 | 0 | 0 | $0.00 | 0.0% | 14.0% | $0 | 0.0% | 15.4% |
| 2027 | 2 | 5,505 | $48.33 | 0.6% | 14.6% | $266,046 | 1.0% | 16.4% |
| 2028 | 0 | 0 | $0.00 | 0.0% | 14.6% | $0 | 0.0% | 16.4% |
| 2029 | 0 | 0 | $0.00 | 0.0% | 14.6% | $0 | 0.0% | 16.4% |
| 2030 | 0 | 0 | $0.00 | 0.0% | 14.6% | $0 | 0.0% | 16.4% |
| 2031 & Beyond | 3 | 701,330 | $32.06 | 80.9% | 95.5% | $22,485,114 | 83.6% | 100.0% |
| Vacant | 0 | 38,736 | $0.00 | 4.5% | 100.0% | $0 | 0.0% | 100.0% |
| Total/Wtd. Avg. | 9 | 866,706 | $32.50 | 100.0% | $26,906,477 | 100.0% | ||
| (1) | Information is based on the underwritten rent roll as of August 1, 2019. |
| (2) | Certain tenants may have lease termination options that are exercisable prior to the stated expiration date of the subject lease or leases which are not considered in the lease rollover schedule. |
| (3) | Wtd. Avg. Annual UW Rent PSF Rolling excludes Vacant Space. |
| This is not a research report and was not prepared by any Underwriter’s research department. Please see additional important information and qualifications at the end of this Term Sheet. |
T-73
| Office – CBD | Loan #5 | Cut-off Date Balance: | $60,000,000 | |
| 545 Washington Boulevard | 545 Washington Boulevard | Cut-off Date LTV: | 61.4% | |
| Jersey City, NJ 07310 | U/W NCF DSCR: | 2.50x | ||
| U/W NOI Debt Yield: | 8.8% |
The Market. The 545 Washington Boulevard Property is located within Jersey City, New Jersey. The 545 Washington Boulevard Property is located along the Hudson River waterfront. Jersey City is the largest city in Hudson County and the second largest in the state, containing approximately 19.2-square miles. The major driver of demand for office space for this immediate area is its accessibility to the highway system, as well as its proximity to New York City, Jersey City waterfront, and access to public transportation. Primary access to the 545 Washington Boulevard Property is provided by the ferry, bus, PATH and light rail, as well as via major highways. The area is within a maximum 20-minute commute (depending on mode of transportation) from Manhattan, and within a maximum 5 to 15 minutes of New Jersey’s main employment centers of Jersey City and Newark. Primary employers/employment centers consist of numerous office tenants which include financial service and service-oriented firms, such as Goldman Sachs, First Chicago and Tullet Prebon. Local businesses, Newark International Airport, and the ports of Newark and Elizabeth are also major employers in the area. Major retail employers include 1.16 million SF Newport Centre and 300,000 SF Hudson Mall. According to the appraisal, as of the second quarter of 2019, the Northern New Jersey market had an inventory of approximately 105.5 million SF, overall vacancy in the market of approximately 21.3% and direct asking rent of $30.02. The estimated 2018 population within a 0.5-, one- and three- mile radius is 27,478, 84,973 and 745,146, respectively. According to the appraisal, the estimated 2018 median household income within a 0.5-, one- and three- mile radius is $152,575, $129,094 and $96,836, respectively. According to the appraisal, as of the second quarter of 2019, the Hudson Waterfront submarket had an inventory of approximately 17.8 million SF, overall vacancy in the submarket of approximately 13.1% and direct asking rent of $45.45 PSF.
The following table presents certain information relating to the appraisal’s market rent conclusion for the 545 Washington Boulevard Property:
| Market Rent Summary(1) | ||||
| Market Rent (PSF) | Lease Term (Mos.) | Lease Type (Reimbursements) | Rent Increase Projection | |
| Office | $40.00 | 120 | Gross + Tenant Electric (“Gross + TE”) | 2.5% per annum |
| Retail | $50.00 | 120 | Pro rata of Real Estate Taxes | 2.5% per annum |
| (1) | Information obtained from the appraisal. |
The table below presents certain information relating to comparable sales for the 545 Washington Boulevard Property identified by the appraisal:
| Comparable Sales(1) | |||||
| Property Name/Location | Sale Date | Total NRA (SF) | Total Occupancy | Sale Price | Sale Price PSF |
545 Washington Boulevard Jersey City, NJ | Sept-2019 | 866,706(2) | 95.5%(2) | $372,750,000 | $430.08 |
Newport Office Center VI Jersey City, NJ | Mar-2019 | 395,050 | 99.0% | $170,000,000 | $430.33 |
One Newark Center Newark, NJ | Nov-2017 | 423,028 | 91.0% | $93,900,000 | $221.97 |
Landmark III Secaucus, NJ | Jul-2017 | 445,060 | 99.0% | $115,000,000 | $258.39 |
Two Riverfront Center Newark, NJ | Dec-2016 | 337,543 | 100.0% | $165,000,000 | $488.83 |
Waterfront Corporate Center I Hoboken, NJ | Jun-2016 | 521,215 | 100.0% | $235,000,000 | $450.87 |
| (1) | Information obtained from the appraisal, unless otherwise indicated. |
| (2) | Based on the underwritten rent roll. |
The following table presents certain information relating to seven comparable leases to those at the 545 Washington Boulevard Property:
| Comparable Leases(1) | |||||||
| Property Name/Address | Year Built | Total GLA (SF) | Tenant Name | Lease Size (SF) | Lease Date | Initial Rent/SF | Reimbursements |
70 Hudson Street 70 Hudson Street Jersey City, NJ | 2001 | 431,438 | Gucci Federal Home Loan Fidessa Corporation | 51,824 51,824 78,000 | Mar. 2019 Jan. 2018 Mar. 2017 | $46.00 $43.00 $41.00 | Gross + TE Gross + TE Gross + TE |
200 Hudson Street 200 Hudson Street Jersey City, NJ | 1930 | 900,000 | E*Trade | 132,000 | Dec. 2018 | $40.00 | Gross + TE |
Newport Tower 525 Washington Boulevard Jersey City, NJ | 1990 | 1,091,469 | Pearl Capital Partners | 13,250 | Jul. 2018 | $38.50 | Gross + TE |
Exchange Place 10 Exchange Place Jersey City, NJ | 1988 | 731,445 | NYSA ILA Pension Trust Appleagle, Inc. | 17,840 12,960 | Nov. 2017 Mar. 2017 | $39.50 $39.00 | Gross + TE Gross + TE |
| (1) | Information obtained from the appraisal. |
| This is not a research report and was not prepared by any Underwriter’s research department. Please see additional important information and qualifications at the end of this Term Sheet. |
T-74
| Office – CBD | Loan #5 | Cut-off Date Balance: | $60,000,000 | |
| 545 Washington Boulevard | 545 Washington Boulevard | Cut-off Date LTV: | 61.4% | |
| Jersey City, NJ 07310 | U/W NCF DSCR: | 2.50x | ||
| U/W NOI Debt Yield: | 8.8% |
Operating History and Underwritten Net Cash Flow. The following table presents certain information relating to the historical operating performance and the Underwritten Net Cash Flow at the 545 Washington Boulevard Property:
| Cash Flow Analysis | |||||
| 2017 | 2018 | 11/30/2019 TTM | UW | UW PSF | |
| Gross Potential Rent(1) | $25,997,762 | $25,521,204 | $26,044,146 | $28,227,253 | $32.57 |
| Total Recoveries | $3,207,532 | $2,532,145 | $2,502,662 | $2,467,803 | $2.85 |
| Other Income(2) | $5,818,330 | $8,294,434 | $5,571,786 | $3,854,453 | $4.45 |
| Less Vacancy & Credit Loss | $0 | $0 | $0 | $0 | $0.00 |
| Effective Gross Income | $35,023,625 | $36,347,783 | $34,118,594 | $34,549,509 | $39.86 |
| Real Estate Taxes | $3,674,396 | $3,359,991 | $3,202,185 | $3,096,752 | $3.57 |
| Insurance | $623,840 | $617,352 | $685,946 | $666,023 | $0.77 |
| Other Expenses | $10,897,517 | $10,544,581 | $9,818,623 | $8,521,339 | $9.83 |
| Total Expenses(3) | $15,195,753 | $14,521,925 | $13,706,753 | $12,284,114 | $14.17 |
| Net Operating Income | $19,827,872 | $21,825,858 | $20,411,841 | $22,265,395 | $25.69 |
| Capital Expenditures | $0 | $0 | $0 | $173,341 | $0.20 |
| TI/LC | $0 | $0 | $0 | $408,579 | $0.47 |
| Net Cash Flow | $19,827,872 | $21,825,858 | $20,411,841 | $ 21,683,475 | $25.02 |
| Occupancy %(4) | 95.5% | 95.5% | 95.5% | 100.0% | |
| NOI DSCR(5) | 2.28x | 2.51x | 2.35x | 2.56x | |
| NCF DSCR(5) | 2.28x | 2.51x | 2.35x | 2.50x | |
| NOI Debt Yield(5) | 7.9% | 8.7% | 8.1% | 8.8% | |
| NCF Debt Yield(5) | 7.9% | 8.7% | 8.1% | 8.6% | |
| (1) | UW Gross Potential Rent includes rent steps of $128,894 through December 31, 2020 and investment grade rent steps of $1,191,882, which represents the average rent payable during the loan term for the investment grade tenants, which include JPMorgan Chase Bank, ISO, Santander Bank and VF Sportswear. |
| (2) | Other Income is comprised of commercial revenue, sundry income, parking and telecom. |
| (3) | The decrease from 11/30/2019 TTM to UW Total Expenses is due to the ground lease expenses being excluded from the underwriting as the 545 Washington Boulevard Borrowers are pledging both fee and leasehold interest as collateral, both of which are owned by the 545 Washington Boulevard Borrowers. |
| (4) | The underwritten economic vacancy is 0.0%. The 545 Washington Boulevard Property is 95.5% occupied as of August 1, 2019. |
| (5) | The debt service coverage ratios and debt yields shown are based on the 545 Washington Boulevard Whole Loan. |
Escrows and Reserves.
Real Estate Taxes – The 545 Washington Boulevard Whole Loan documents provide for an upfront reserve of approximately $881,651 for real estate taxes and ongoing monthly reserves for real estate taxes in an amount equal to 1/12 of the annual real estate taxes that the lender estimates will be payable during the next 12 months. However, such monthly deposits are waived if (a) no Cash Sweep Event Period (as defined below) has occurred and is continuing and (b) the 545 Washington Boulevard Borrowers provide to the lender reasonably acceptable evidence that all taxes then due and payable have been paid in full on or prior to their due date (which evidence must be provided within 30 days after their due date).
Insurance – The 545 Washington Boulevard Whole Loan documents provide for monthly deposits to an insurance reserve in an amount equal to 1/12 of the annual estimated insurance premiums. However, such monthly deposits are waived if either: (a) (i) the 545 Washington Boulevard Borrowers maintain a blanket or umbrella policy approved by the lender in its reasonable discretion and (ii) the 545 Washington Boulevard Borrowers provide the lender with evidence of renewal of such policies at least 10 days prior to the expiration dates of the policies and provide paid receipts for the payment of the insurance premiums by no later than 30 days after such insurance premiums are due and payable or (b) (i) no Cash Sweep Event Period has occurred and is continuing and (ii) the 545 Washington Boulevard Borrowers provide to the lender reasonably acceptable evidence that all insurance premiums then due and payable have been paid in full on or prior to their due date (which evidence must be provided within 30 days after the date such insurance premiums are due and payable).
Replacement Reserve – The 545 Washington Boulevard Whole Loan documents provide for monthly deposits to a capital expenditure reserve of approximately $10,834.
TI/LC Reserve – The 545 Washington Boulevard Whole Loan documents provide for monthly deposits to a rollover reserve of approximately $72,226 for tenant improvements and leasing commissions,provided that the 545 Washington Boulevard Borrowers are not required to make such monthly deposits as long as the funds on deposit in the rollover reserve are equal to or greater than $1,500,000.
Existing TI/LC Obligations – The 545 Washington Boulevard Whole Loan documents provide for an upfront reserve of approximately $4,840,935 for outstanding unfunded tenant improvements and/or leasing commissions, including approximately $3,030,603 for ISO and $1,810,332 for JPMorgan Chase Bank.
Rent Concession Reserve – The 545 Washington Boulevard Whole Loan documents provide for an upfront reserve of approximately $21,201,910 for free rent under the JPMorgan Chase Bank lease.
| This is not a research report and was not prepared by any Underwriter’s research department. Please see additional important information and qualifications at the end of this Term Sheet. |
T-75
| Office – CBD | Loan #5 | Cut-off Date Balance: | $60,000,000 | |
| 545 Washington Boulevard | 545 Washington Boulevard | Cut-off Date LTV: | 61.4% | |
| Jersey City, NJ 07310 | U/W NCF DSCR: | 2.50x | ||
| U/W NOI Debt Yield: | 8.8% |
Major Tenant Rollover Reserve – The 545 Washington Boulevard Whole Loan documents provide for springing monthly deposits of approximately $144,451 following the occurrence of a Major Tenant Rollover Reserve Trigger (as defined below). “Major Tenant Rollover Reserve Trigger” means the earlier to occur of the following: (i) JPMorgan Chase Bank failing to satisfy the Credit Rating Condition (as defined below), (ii) Verisk Analytics failing to satisfy the Credit Rating Condition or (iii) ISO failing to be a wholly-owned subsidiary of Verisk Analytics or a successor parent to ISO which satisfies the Credit Rating Condition and wholly owns ISO. “Credit Rating Condition” means, as to any entity, a condition which is satisfied to the extent that, as of the applicable determination, such entity maintains a long-term unsecured debt rating of at least “BBB-” from S&P and an equivalent rating from each of the other rating agencies which rate such entity.
Lockbox and Cash Management. The 545 Washington Boulevard Whole Loan is structured with a springing lockbox and springing cash management. Upon the first occurrence of a Cash Sweep Event Period, the 545 Washington Boulevard Borrowers are required to direct tenants to deposit all rents directly into the lockbox account. If, notwithstanding such direction, any of the 545 Washington Boulevard Borrowers or property manager receive any rents, it is required to deposit such rents into the lockbox account within two business days of receipt. Upon the first occurrence of a Cash Sweep Event Period, the lender is required to establish, and the 545 Washington Boulevard Borrowers are required to cooperate with a cash management bank designated by the lender to establish, a lender-controlled cash management account, into which all funds in the lockbox account will be required to be deposited periodically so long as a Cash Sweep Event Period is continuing. So long as a Cash Sweep Event Period is continuing, andprovided no event of default is continuing, funds in the cash management account are required to be applied (i) to make deposits into the tax and insurance escrows (if any are then required), as described above under“Escrows and Reserves”, (ii) to pay debt service on the 545 Washington Boulevard Whole Loan, (iii) to make deposits into the replacement, TI/LC and major tenant rollover reserves (if any are then required), as described above under“Escrows and Reserves”, (iv) to pay operating expenses set forth in the annual budget (which is required to be approved by the lender during the continuance of a Cash Sweep Event Period) and extraordinary operating or capital expenses approved by the lender, (v) if Mezzanine Debt (as defined below) is then outstanding, to pay Mezzanine Debt debt service, and (vi) to pay any remainder into an excess cash flow account to be held by the lender as additional security for the 545 Washington Boulevard Whole Loan during the continuance of the Cash Sweep Event Period (from which operating expenses may be disbursed, if permitted by the lender in its sole discretion). If no Cash Sweep Event Period is continuing, all funds in the lockbox account are required to be disbursed to an account designated by the 545 Washington Boulevard Borrowers.
A “Cash Sweep Event Period” means a period:
(a) commencing upon an event of default under the 545 Washington Boulevard Whole Loan and ending upon the cure (if applicable) of the event of default;
(b) commencing upon the debt service coverage ratio (assuming a 30 year amortization schedule) falling below 1.20x for two consecutive calendar quarters (a “DSCR Event”) and ending upon the debt service coverage ratio (assuming a 30 year amortization schedule) being at least 1.25x for the immediately preceding two consecutive calendar quarters (a “DSCR Cure”);
(c) commencing upon a bankruptcy or similar insolvency of a Major Tenant (as defined below) and ending upon receipt by the lender of reasonably acceptable evidence (including, without limitation, a reasonably acceptable tenant estoppel certificate (an “Acceptable Tenant Estoppel Certificate”)) that one of the following has occurred: (i) the Major Tenant is no longer subject to any bankruptcy or insolvency proceedings and has affirmed its lease pursuant to a final non-appealable order of a court of competent jurisdiction and/or is in actual physical occupancy of its space, operating during customary business hours and paying full rent, or (ii) at least 50% of the Major Tenant’s space has been re-let to one or more replacement tenant(s) pursuant to replacement lease(s), which leases are reasonably acceptable to the lender and which tenants are in occupancy, open for business during customary hours and paying full rent (a “Major Tenant Space Re-Let”); or
(d) commencing upon a Major Tenant has, for 50% or more of such Major Tenant’s space, “gone dark”, vacated its space, or not opened for business during customary hours in its space (excluding temporary closures in connection with renovations in accordance with the 545 Washington Boulevard Whole Loan documents not exceeding 12 months or certain permitted transitions in occupancy of administrative employees) and ending upon receipt by the lender of reasonably acceptable evidence (including, without limitation, an Acceptable Tenant Estoppel Certificate), that either (i) such Major Tenant is in occupancy of, and open for business during customary hours in its space and paying full rent, or (ii) a Major Tenant Space Re-Let has occurred.
A “Major Tenant” means each of (i) JPMorgan Chase Bank, (ii) ISO and (iii) any other lessee(s) under a lease which (together with any other leases for such tenant or its affiliates) exceeds 135,000 SF and any guarantors of such leases.
The 545 Washington Boulevard Borrowers may avoid a Cash Sweep Event Period based on a DSCR Event by prepaying a portion of the 545 Washington Boulevard Whole Loan, without payment of any prepayment fee or yield maintenance premium, in an amount sufficient to achieve a DSCR Cure or by depositing with the lender a letter of credit meeting the requirements of the 545 Washington Boulevard Whole Loan documents in an amount that, if applied to reduce the outstanding principal balance of the 545 Washington Boulevard Whole Loan, would cause the debt service coverage ratio to be equal to or greater than required to achieve a DSCR Cure.
Release of Property. Not permitted.
Additional Secured Indebtedness (not including trade debts).The 545 Washington Boulevard Property also secures the 545 Washington Boulevard Non-ServicedPari PassuCompanion Loans which have an aggregate Cut-off Date principal balance of $191,606,250. The 545 Washington Boulevard Non-ServicedPari Passu Companion Loans accrue interest at the same rate as the 545 Washington Boulevard Mortgage Loan. The 545 Washington Boulevard Mortgage Loan is entitled to payments of interest on apro rata andpari passubasis with the 545 Washington Boulevard Non-ServicedPari PassuCompanion Loans. The holders of the 545 Washington Boulevard Mortgage Loan and the 545 Washington Boulevard Non-ServicedPari PassuCompanion Loans have entered into a co-lender agreement which sets forth the allocation of collections on the 545 Washington Boulevard Whole Loan. See “Description of the Mortgage Pool—The Whole Loans—The Non-Serviced Pari Passu Whole Loans” in the Preliminary Prospectus.
Subordinate and Mezzanine Indebtedness. The holder of 100% of the equity interests in the 545 Washington Boulevard Borrowers (the “Mezzanine Borrower”) has a one-time right to obtain (i) a mezzanine loan from a third-party lender secured by a pledge of 100% of such Mezzanine Borrower’s direct or indirect equity interests in the 545 Washington Boulevard Borrowers, or (ii) a preferred equity investment (direct or indirect) in the 545
| This is not a research report and was not prepared by any Underwriter’s research department. Please see additional important information and qualifications at the end of this Term Sheet. |
T-76
| Office – CBD | Loan #5 | Cut-off Date Balance: | $60,000,000 | |
| 545 Washington Boulevard | 545 Washington Boulevard | Cut-off Date LTV: | 61.4% | |
| Jersey City, NJ 07310 | U/W NCF DSCR: | 2.50x | ||
| U/W NOI Debt Yield: | 8.8% |
Washington Boulevard Borrowers (in the case of either (i) or (ii), the “Mezzanine Debt”),provided certain conditions are satisfied, including (a) no event of default is continuing, (b) the aggregate loan-to-value ratio of the 545 Washington Boulevard Whole Loan and the Mezzanine Debt is equal to or less than 61.4% (based on an updated appraisal acceptable to the lender), (c) the aggregate debt service coverage ratio of the 545 Washington Boulevard Whole Loan and the Mezzanine Debt is equal to or greater than 2.50x, (d) the aggregate debt yield of the 545 Washington Boulevard Whole Loan and the Mezzanine Debt is equal to or greater than 8.6%, (e) the lender and the mezzanine lender enter into an intercreditor agreement in form and substance reasonably acceptable to the lender, (f) if the lender requests, the lender has received a rating agency confirmation as to the implementation of the Mezzanine Debt, (g) the Mezzanine Debt is at least co-terminous with the 545 Washington Boulevard Whole Loan and (h) if the Mezzanine Debt has a floating rate, the Mezzanine Borrower must purchase a cap with a strike price such that as of the origination date of the Mezzanine Loan, the debt service coverage ratio is not less than 2.50x.
Ground Lease. The 545 Washington Boulevard Property is comprised of both a fee interest and a leasehold interest under a 99-year ground lease expiring June 30, 2097. The Fee Borrowers own the fee interest, the Leasehold Borrowers own the leasehold interest and both the fee and leasehold interest are collateral for the 545 Washington Boulevard Whole Loan. For purposes of the Preliminary Prospectus, the 545 Washington Boulevard Property has been treated as a fee interest.
Letter of Credit. None. However, a letter of credit may be posted to avoid a Cash Sweep Event Period as described under “Lockbox and Cash Management”.
Right of First Offer/Right of First Refusal. JPMorgan Chase has a right of first refusal to purchase the 545 Washington Boulevard Property pursuant to its lease. Pursuant to a subordination, non-disturbance and attornment agreement entered into at origination, such right does not apply to a foreclosure or deed-in-lieu thereof, but would apply to subsequent transfers.
Terrorism Insurance. The 545 Washington Boulevard Whole Loan documents require that the “all risk” insurance policy required to be maintained by the 545 Washington Boulevard Borrowers provide coverage for terrorism in an amount equal to the full replacement cost of the 545 Washington Boulevard Property. The loan documents also require business income/loss insurance covering no less than the 24-month period commencing at the time of loss, together with a 12 month extended period of indemnity. Notwithstanding the foregoing, for so long as the Terrorism Risk Insurance Act of 2002, as extended and modified by the Terrorism Risk Insurance Program Reauthorization Act of 2015 (“TRIPRA”) is in effect (including any extensions thereof or if another federal governmental program is in effect relating to “acts of terrorism” which provides substantially similar protections as TRIPRA), and covers both domestic and foreign acts of terrorism, the lender is required to accept terrorism insurance which insures against “covered acts” as defined by TRIPRA (or such other program). See “Risk Factors—Risks Relating to the Mortgage Loans—Terrorism Insurance May Not Be Available for All Mortgaged Properties” in the Preliminary Prospectus.
| This is not a research report and was not prepared by any Underwriter’s research department. Please see additional important information and qualifications at the end of this Term Sheet. |
T-77
| Office – CBD | Loan #6 | Cut-off Date Balance: | $56,700,000 | |
| 550 West 34th Street | 55 Hudson Yards | Cut-off Date LTV: | 39.4% | |
| New York, NY 10001 | UW NCF DSCR: | 3.54x | ||
| UW NOI Debt Yield: | 11.0% |
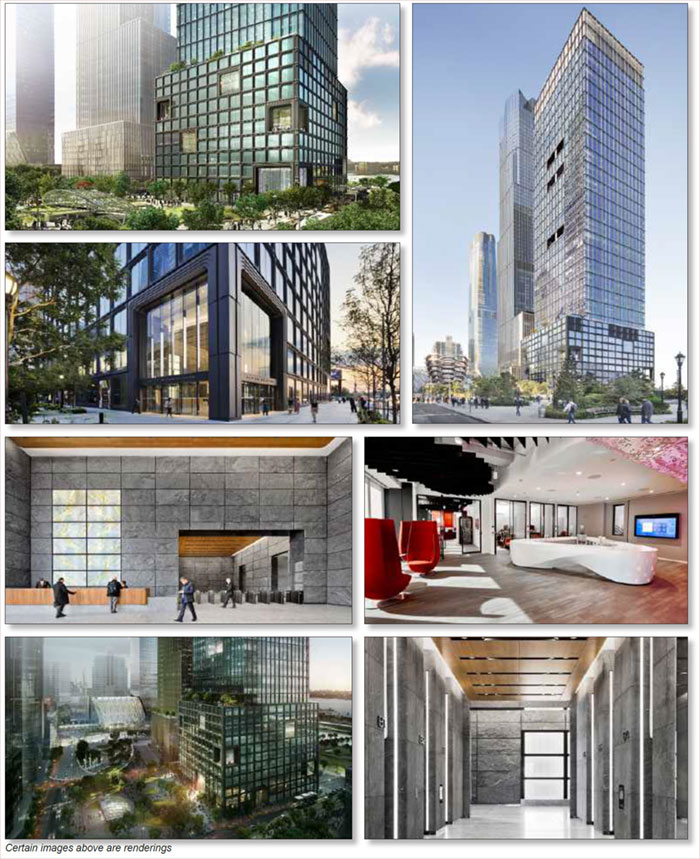
| This is not a research report and was not prepared by any Underwriter’s research department. Please see additional important information and qualifications at the end of this Term Sheet. |
T-78
| Office – CBD | Loan #6 | Cut-off Date Balance: | $56,700,000 | |
| 550 West 34th Street | 55 Hudson Yards | Cut-off Date LTV: | 39.4% | |
| New York, NY 10001 | UW NCF DSCR: | 3.54x | ||
| UW NOI Debt Yield: | 11.0% |
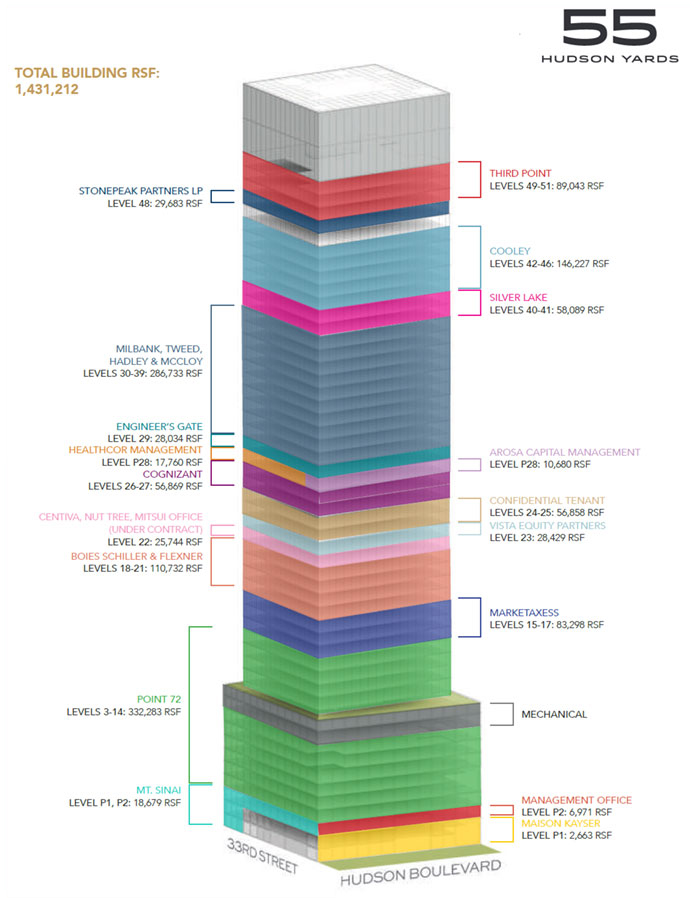
| This is not a research report and was not prepared by any Underwriter’s research department. Please see additional important information and qualifications at the end of this Term Sheet. |
T-79
| Office – CBD | Loan #6 | Cut-off Date Balance: | $56,700,000 | |
| 550 West 34th Street | 55 Hudson Yards | Cut-off Date LTV: | 39.4% | |
| New York, NY 10001 | UW NCF DSCR: | 3.54x | ||
| UW NOI Debt Yield: | 11.0% |
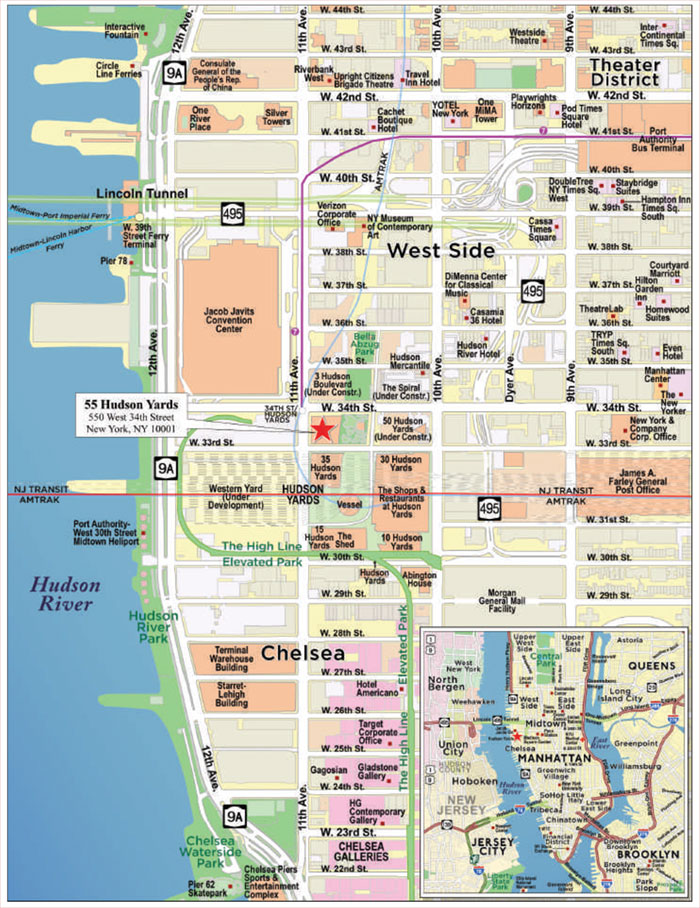
| This is not a research report and was not prepared by any Underwriter’s research department. Please see additional important information and qualifications at the end of this Term Sheet. |
T-80
| Mortgage Loan No. 6 – 55 Hudson Yards |
| Mortgage Loan Information | Property Information | ||||||
| Mortgage Loan Seller: | WFB | Single Asset/Portfolio: | Single Asset | ||||
| Credit Assessment (DBRS/Fitch/S&P): | BBB(sf)/BBB-sf/NR | Location: | New York, NY 10001 | ||||
| Original Balance(1): | $56,700,000 | General Property Type: | Office | ||||
| Cut-off Date Balance(1): | $56,700,000 | Detailed Property Type: | CBD | ||||
| % of Initial Pool Balance: | 4.7% | Title Vesting: | Fee | ||||
| Loan Purpose: | Recapitalization | Year Built/Renovated: | 2018/N/A | ||||
| Borrower Sponsors: | Mitsui Fudosan America, Inc.; The | Size: | 1,431,212 SF | ||||
| Related Companies, L.P.; OP Olympic | Cut-off Date Balance per SF(1): | $660 | |||||
| Capital Corp (US), Inc. | Maturity Balance per SF(1): | $660 | |||||
| Guarantor(2): | One Hudson Yards Owner LLC | Property Manager: | Related Hudson Yards Manager LLC | ||||
| Mortgage Rate: | 2.9500% | (borrower-related) | |||||
| Note Date: | 11/21/2019 | ||||||
| First Payment Date: | 1/6/2020 | Underwriting and Financial Information | |||||
| Maturity Date: | 12/6/2029 | UW NOI: | $103,900,331 | ||||
| Original Term to Maturity: | 120 months | UW NOI Debt Yield(1): | 11.0% | ||||
| Original Amortization Term: | 0 months | UW NOI Debt Yield at Maturity(1): | 11.0% | ||||
| IO Period: | 120 months | UW NCF DSCR(1): | 3.54x | ||||
| Seasoning: | 3 months | Most Recent NOI(6): | N/A | ||||
| Prepayment Provisions(3): | LO (27); DEF/YM1 (86); O (7) | 2nd Most Recent NOI(6): | N/A | ||||
| Lockbox/Cash Mgmt Status: | Hard/Springing | 3rd Most Recent NOI(6): | N/A | ||||
| Additional Debt Type(1)(4): | Pari Passu/Subordinate | Most Recent Occupancy: | 97.3% (11/19/2019) | ||||
| Additional Debt Balance(1)(4): | $888,300,000/$300,000,000 | 2nd Most Recent Occupancy(6): | N/A | ||||
| Future Debt Permitted (Type): | No (N/A) | 3rd Most Recent Occupancy(6): | N/A | ||||
| Reserves(5) | Appraised Value (as of): | $2,400,000,000 (10/15/2019) | |||||
| Type | Initial | Monthly | Cap | Appraised Value per SF: | $1,677 | ||
| RE Taxes: | $0 | Springing | N/A | Cut-off Date LTV Ratio(1): | 39.4% | ||
| Insurance: | $0 | Springing | N/A | Maturity Date LTV Ratio(1): | 39.4% | ||
| Replacement Reserve: | $0 | Springing | N/A | ||||
| Rollover Reserve: | $0 | Springing | N/A | ||||
| Tenant Specific TI/LC Reserve: | $34,260,641 | $0 | N/A | ||||
| Free Rent Reserve: | $11,482,346 | $0 | N/A | ||||
| Milbank Lease Landlord Delay Dispute Reserve: | $11,000,000 | $0 | N/A | ||||
| MarketAxess Lease Takeover Reserve: | $4,474,631 | $0 | N/A | ||||
Sources and Uses | ||||||
| Sources | Proceeds | % of Total | Uses | Proceeds | % of Total | |
| Whole Loan Amount(1): | $1,245,000,000 | 100.0% | Upfront Reserves: | $61,217,618 | 4.9% | |
| Closing Costs: | $46,767,347 | 3.8% | ||||
| Return of Equity(7): | $1,137,015,035 | 91.3% | ||||
| Total Sources: | $1,245,000,000 | 100.0% | Total Uses: | $1,245,000,000 | 100.0% | |
| (1) | The 55 Hudson Yards Mortgage Loan (as defined below) is part of the 55 Hudson Yards Whole Loan (as defined below) with an original aggregate principal balance of $1,245,000,000. The Cut-off Date Balance per SF, Maturity Date Balance per SF, UW NOI Debt Yield, UW NOI Debt Yield at Maturity, UW NCF DSCR, Cut-off Date LTV Ratio and Maturity Date LTV Ratio numbers presented above are based on the 55 Hudson Yards Senior Loan (as defined below). The Cut-off Date Balance per SF and Maturity Date Balance per SF, UW NOI Debt Yield, UW NOI Debt Yield at Maturity, UW NCF DSCR, Cut-off Date LTV Ratio and Maturity Date LTV Ratio based upon the 55 Hudson Yards Whole Loan are $870, $870, 8.3%, 8.3%, 2.69x, 51.9% and 51.9%, respectively. |
| (2) | One Hudson Yards Owner LLC is the single purpose entity borrower. The 55 Hudson Yards Whole Loan is recourse to the single purpose entity borrower. There is no separate non-recourse carveout guarantor or environmental indemnitor for the 55 Hudson Yards Whole Loan. |
| (3) | Defeasance or prepayment of the 55 Hudson Yards Whole Loan is permitted at any time after the earlier to occur of (a) the end of the two-year period commencing on the closing date of the securitization of the last promissory note representing a portion of the 55 Hudson Yards Whole Loan to be securitized and (b) November 21, 2022. The assumed defeasance lockout period of 27 payments is based on the closing date of this transaction in March 2020. |
| (4) | See “The Mortgage Loan” and “Additional Secured Indebtedness (not including trade debts)” below for further discussion of additional debt. |
| (5) | See“Escrows and Reserves” below for further discussion of reserve requirements. |
| (6) | Prior historical operating statements and occupancy are not applicable, as the 55 Hudson Yards Property (as defined below) was constructed in 2018 and tenants began taking occupancy in 2019. |
| (7) | Prior to the origination of the 55 Hudson Yards Whole Loan, the 55 Hudson Yards Property was unencumbered by debt. The Borrower Sponsor’s (as defined below) cost basis to date is approximately $1.31 billion. |
The Mortgage Loan. The sixth mortgage loan (the “55 Hudson Yards Mortgage Loan”) is part of a whole loan (the “55 Hudson Yards Whole Loan”) that is evidenced by 33pari passusenior promissory notes in the aggregate original principal amount of $945,000,000 (collectively, the “55 Hudson Yards Senior Loan”) and threepari passusubordinate promissory notes in the aggregate original principal amount of $300,000,000 (collectively, the “55 Hudson Yards Subordinate Companion Loan”). The 55 Hudson Yards Whole Loan was co-originated on November 21, 2019 by Wells Fargo Bank, National Association (“WFB”); DBR Investments Co. Limited (“DBRI”); and Morgan Stanley Bank, N.A. (“MSBNA”). The 55 Hudson Yards Whole Loan is secured by a first priority fee mortgage encumbering an office building located in New York, New York (the “55 Hudson Yards Property”). The 55 Hudson Yards Mortgage Loan is evidenced by the non-controlling promissory Notes A-1-C3 and A-1-C4, each being contributed by WFB, in the
| This is not a research report and was not prepared by any Underwriter’s research department. Please see additional important information and qualifications at the end of this Term Sheet. |
T-81
| Office – CBD | Loan #6 | Cut-off Date Balance: | $56,700,000 | |
| 550 West 34th Street | 55 Hudson Yards | Cut-off Date LTV: | 39.4% | |
| New York, NY 10001 | UW NCF DSCR: | 3.54x | ||
| UW NOI Debt Yield: | 11.0% |
aggregate original principal amount of $56,700,000. As shown in the “55 Hudson Yards Whole Loan Summary” table below, 21 promissory notes in the original aggregate principal amount of $810,500,000 were contributed to the Hudson Yards 2019-55HY securitization trust. The 55 Hudson Yards Whole Loan is being serviced pursuant to the trust and servicing agreement for the Hudson Yards 2019-55HY securitization trust. The 55 Hudson Yards Senior Loanpari passu notes other than those evidencing the 55 Hudson Yards Mortgage Loan are referred to herein as the “55 Hudson Yards Non-ServicedPari Passu Companion Loans”. See “Description of the Mortgage Pool—The Whole Loans—The 55 Hudson Yards Pari Passu-A/B Whole Loan” and “Pooling and Servicing Agreement—Servicing of the Non-Serviced Mortgage Loans”. The proceeds of the 55 Hudson Yards Whole Loan were primarily used to fund upfront reserves, pay closing costs and return equity to the Borrower Sponsor.
| 55 Hudson Yards Whole Loan Summary | ||||
| Notes | Original Balance | Cut-off Date Balance | Anticipated Note Holder | Controlling Piece |
| 55 Hudson Yards Senior Loan | ||||
| A-1-S1 | $28,350,000 | $28,350,000 | Hudson Yards 2019-55HY | Yes(1) |
| A-2-S2 | $9,450,000 | $9,450,000 | Hudson Yards 2019-55HY | Yes(1) |
| A-2-S3 | $56,700,000 | $56,700,000 | Hudson Yards 2019-55HY | Yes(1) |
| A-3-S1 | $9,450,000 | $9,450,000 | Hudson Yards 2019-55HY | Yes(1) |
| A-1-S2 | $28,350,000 | $28,350,000 | Hudson Yards 2019-55HY | Yes(1) |
| A-1-S3 | $170,100,000 | $170,100,000 | Hudson Yards 2019-55HY | Yes(1) |
| A-2-S1 | $9,450,000 | $9,450,000 | Hudson Yards 2019-55HY | Yes(1) |
| A-3-S2 | $9,450,000 | $9,450,000 | Hudson Yards 2019-55HY | Yes(1) |
| A-3-S3 | $56,700,000 | $56,700,000 | Hudson Yards 2019-55HY | Yes(1) |
| A-1-C1 | $28,350,000 | $28,350,000 | Hudson Yards 2019-55HY | Yes(1) |
| A-1-C2 | $28,350,000 | $28,350,000 | Hudson Yards 2019-55HY | Yes(1) |
| A-1-C3 | $28,350,000 | $28,350,000 | BANK 2020-BNK26 | No |
| A-1-C4 | $28,350,000 | $28,350,000 | BANK 2020-BNK26 | No |
| A-1-C5 | $75,000,000 | $75,000,000 | BANK 2019-BNK24 | No |
| A-1-C6 | $75,000,000 | $75,000,000 | BANK 2020-BNK25 | No |
| A-1-C7 | $54,000,000 | $54,000,000 | WFB | No |
| A-1-C8 | $22,800,000 | $22,800,000 | Hudson Yards 2019-55HY | Yes(1) |
| A-2-C1 | $9,450,000 | $9,450,000 | Hudson Yards 2019-55HY | Yes(1) |
| A-2-C2 | $9,450,000 | $9,450,000 | Hudson Yards 2019-55HY | Yes(1) |
| A-2-C3 | $9,450,000 | $9,450,000 | Benchmark 2020-IG1(2) | No |
| A-2-C4 | $9,450,000 | $9,450,000 | DBRI | No |
| A-2-C5 | $25,000,000 | $25,000,000 | Benchmark 2020-IG1(2) | No |
| A-2-C6 | $25,000,000 | $25,000,000 | DBRI | No |
| A-2-C7 | $18,000,000 | $18,000,000 | Benchmark 2020-IG1(2) | No |
| A-2-C8 | $7,600,000 | $7,600,000 | Hudson Yards 2019-55HY | Yes(1) |
| A-3-C1 | $9,450,000 | $9,450,000 | Hudson Yards 2019-55HY | Yes(1) |
| A-3-C2 | $9,450,000 | $9,450,000 | Hudson Yards 2019-55HY | Yes(1) |
| A-3-C3 | $9,450,000 | $9,450,000 | MSC 2020-L4 | No |
| A-3-C4 | $9,450,000 | $9,450,000 | MSC 2020-L4 | No |
| A-3-C5 | $25,000,000 | $25,000,000 | BANK 2019-BNK24 | No |
| A-3-C6 | $25,000,000 | $25,000,000 | BANK 2020-BNK25 | No |
| A-3-C7 | $18,000,000 | $18,000,000 | MSC 2020-L4 | No |
| A-3-C8 | $7,600,000 | $7,600,000 | Hudson Yards 2019-55HY | No |
| Total (Senior Loan) | $945,000,000 | $945,000,000 | ||
| 55 Hudson Yards Subordinate Companion Loan | ||||
| B-1 | $180,000,000 | $180,000,000 | Hudson Yards 2019-55HY | Yes(1)(3) |
| B-2 | $60,000,000 | $60,000,000 | Hudson Yards 2019-55HY | Yes(1)(3) |
| B-3 | $60,000,000 | $60,000,000 | Hudson Yards 2019-55HY | Yes(1)(3) |
| Total (Subordinate Companion Loan) | $300,000,000 | $300,000,000 | ||
| Total (Whole Loan) | $1,245,000,000 | $1,245,000,000 | ||
| (1) | No single promissory note comprising a part of the whole loan is the related control note; however, the Hudson Yards 2019-55HY securitization trust is the related controlling note holder, and a party designated under the related trust and servicing agreement is entitled to exercise the rights thereof. |
| (2) | Anticipated to be contributed on the closing date of such transaction. |
| (3) | The 55 Hudson Yards Subordinate Companion Loan is subordinate to the 55 Hudson Yards Senior Loan. |
| This is not a research report and was not prepared by any Underwriter’s research department. Please see additional important information and qualifications at the end of this Term Sheet. |
T-82
| Office – CBD | Loan #6 | Cut-off Date Balance: | $56,700,000 | |
| 550 West 34th Street | 55 Hudson Yards | Cut-off Date LTV: | 39.4% | |
| New York, NY 10001 | UW NCF DSCR: | 3.54x | ||
| UW NOI Debt Yield: | 11.0% |
The Borrower and the Borrower Sponsors.The borrower is One Hudson Yards Owner LLC (the “55 Hudson Yards Borrower”), a Delaware limited liability company and single purpose entity with two independent directors. The 55 Hudson Yards Whole Loan is recourse solely to the single purpose entity borrower. There is no separate non-recourse carveout guarantor or environmental indemnitor with respect to the 55 Hudson Yards Whole Loan.
The 55 Hudson Yards Borrower’s sole member is One Hudson Yards Holdings LLC, which is a joint venture between MFA 55 HY LLC (“Mitsui Member”) and 55 Hudson Yards Member LLC (“Hudson Yards Member”). Mitsui Member is indirectly owned by Mitsui Fudosan America, Inc. (“Mitsui”). The managing member and owner of Hudson Yards Member is Hudson Yards Gen-Par, LLC, a joint venture between Related Hudson Yards, LLC (“Related Member”) and Oxford Hudson Yards LLC (“Oxford Member”). Related Member is indirectly wholly-owned by The Related Companies L.P. (“Related”) and Oxford Member is wholly-owned by OP Olympic Capital Corp (US) Inc. (“Oxford”, and together with Mitsui and Related, the “Borrower Sponsor”).
Founded by Stephen M. Ross in 1972, Related is a privately owned, fully integrated and diversified real estate company with experience in development, acquisition, management, finance, marketing and sales. Headquartered in New York City, Related owns and manages a portfolio of assets and has offices and major developments in Boston, Chicago, Los Angeles, San Francisco, South Florida, Washington, D.C. and London. Oxford Properties Group, comprising Oxford and its affiliates, make up the real estate investment arm of OMERS, one of Canada’s largest pension plans. OMERS was established in 1962 as a pension plan for employees of municipal governments, schoolboards, libraries, police and fire services, Children's Aid Societies, and other local agencies throughout Ontario. The OMERS pension plan has approximately half a million active and retired members and 1,000 participating employers, and is funded by contributions and investment earnings. Oxford Properties Group, comprising Oxford and its affiliates, manages over $58 billion of office, retail, industrial, hotel and multifamily residential assets across the globe, including over 100 million SF in cities across four continents. Mitsui is the U.S. subsidiary of Japan’s largest real estate company, Mitsui Fudosan Co., Ltd. (“Mitsui Fudosan”). Mitsui is headquartered in New York, and is responsible for Mitsui Fudosan’s real estate investment and development activities in North America. Mitsui’s U.S. portfolio currently includes eight office buildings totaling 5.6 million SF; 4.7 million SF of office space under development; 1,300 residential apartments; 5,000 additional apartments under development; 360 condominiums and townhomes under development; and 753 hotel rooms. Mitsui has been active in the United States since the 1970s, and currently owns assets in the New York, Washington, D.C., Boston, Denver, Los Angeles, San Francisco, Seattle and Honolulu metropolitan areas.
The Property. The 55 Hudson Yards Property is a 1,431,212 SF, 51-story, Class A office building located within the Hudson Yards development of Manhattan in New York City. Constructed in 2018, the 55 Hudson Yards Property is situated on a 0.9-acre parcel of land with frontage along Eleventh Avenue and Hudson Boulevard between West 34th and West 35th Streets (adjacent to a No. 7 subway station entrance). The building was designed by Kohn Pedersen Fox and architect Kevin Roche, and features a unique façade consisting of matte metal and stepped articulation of the window frames that are defined by aluminum extrusions, castings, and built-up shapes. According to the appraisal, the 55 Hudson Yards Property is currently the shortest skyscraper within phase 1 of the Hudson Yards plan and is known for its distinct construction compared to the remainder of the development. The 55 Hudson Yards Property is LEED Gold certified and has incorporated technology for indoor air quality and a flexible workplace environment.
According to the appraisal, the 55 Hudson Yards Property offers amenities such as a dispatch elevator system, fingerprint access within the office lobby, floor-to-ceiling glass windows, column-free space allowing tenants to maximize the floor plates, terrace overlooking the new Hudson Boulevard Park that wraps around the 10th floor (podium level), and private terraces throughout the office component that were constructed for tenants upon request.
The 55 Hudson Yards Property was 97.3% leased to 20 tenants as of November 19, 2019. Three tenants (Milbank, Cooley and Boies Schiller) comprising approximately 38.0% of net rentable area and 35.9% of underwritten base rent are ranked within the top 100 law firms by gross revenue in the United States, according to a third party legal publication.
Major Tenants.
Point72(332,283 SF, 23.2% NRA, 21.9% underwritten base rent, April 30, 2034 expiration). Point72 Asset Management (“Point72”)is an American hedge fund founded by Steven A. Cohen. The firm has over 1,400 employees across 10 global offices. The 55 Hudson Yards Property serves as Point72’s New York headquarters, after consolidating from 11 floors in two buildings previously occupied at 510 and 330 Madison Avenue. Point72 currently occupies floors 3-14 at the 55 Hudson Yards Property but is not yet paying full rent on all of its space. All outstanding gap rent and free rent through March 2020, in the amount of $987,380, was reserved at the time of origination of the 55 Hudson Yards Whole Loan. Therent commencement dates are as follows: April 16, 2019 for floors 5-14; December 1, 2019 for floor 4; and May 1, 2020 for floor 3 (there is no assurance that Point72 will begin paying rent by the estimated dates noted herein). Effective as of the 10th anniversary of the initial rent commencement date (which was April 16, 2019), and upon at least 15 months’ prior notice, the tenant has a one-time option to terminate either (i) the entirety of its leased premises or (ii) any one or more contiguous floors starting at either the highest or lowest office floor of the largest contiguous block of office floors then-leased by the tenant, such termination subject to a fee of the unamortized portion of allowances, commissions and free rent with respect to the terminated premises (calculated on a straight line basis over the period commencing on the rent commencement date and ending on the expiration date of the lease and bearing a 6% interest rateper annum). Point72 has either (i) two renewal options of 5-years each or (ii) one 10-year renewal option, each with at least 15 months’ prior notice and at the fair market rental rate, following its April 2034 lease expiration. Point 72 has signed a sublease for the entire 3rd floor (31,246 SF) of its space to Elite World Group, LLC, with an expected sublease commencement date of February 2020, a 5-year term and an annual rate of $90.00 PSF. Point72 also subleases 11,844 SF of its space to Light Sky Macro LP, with a sublease expiration of August 2029 and a rate of $99.00 PSF.
Milbank, Tweed Hadley & McCloy (287,333 SF, 20.1% NRA, 17.9% underwritten base rent, March 31, 2034 expiration). Milbank,Tweed Hadley & McCloy (“Milbank”) is an international law firm ranked within the top 100 law firms by gross revenue according to a third party legal publication, and is headquartered at the 55 Hudson Yards Property. The firm also has offices in Washington, D.C., Los Angeles, London, Frankfurt, Munich, Tokyo, Hong Kong, São Paulo, Seoul, Singapore and Beijing. The firm was founded in 1866 and as of 2018 had 728 attorneys. Milbank currently occupies space on floors 30-39 along with 600 SF of storage space at the 55 Hudson Yards Property. Milbank has the one-time right to contract by up to one floor upon the tenth anniversary of the rent commencement date (which was April 1, 2019) with notice no less than 15 months prior to the contraction date. Milbank has either (i) two renewal options of 5-years each or (ii) one 10-year renewal option, each with 18 months’ prior notice and at the fair market rental rate, following its March 2034 expiration.
Cooley (146,227 SF, 10.2% NRA, 11.2% underwritten base rent, September 30, 2039 expiration). Cooley LLP (“Cooley”) is a law firm ranked within the top 100 law firms by gross revenue according to a third party legal publication and is headquartered in Palo Alto, California with 16 other offices in San
| This is not a research report and was not prepared by any Underwriter’s research department. Please see additional important information and qualifications at the end of this Term Sheet. |
T-83
| Office – CBD | Loan #6 | Cut-off Date Balance: | $56,700,000 | |
| 550 West 34th Street | 55 Hudson Yards | Cut-off Date LTV: | 39.4% | |
| New York, NY 10001 | UW NCF DSCR: | 3.54x | ||
| UW NOI Debt Yield: | 11.0% |
Francisco, Los Angeles, New York, Boston, Washington, D.C., San Diego, Seattle, Colorado, Virginia, London, Beijing and Shanghai. The firm had 946 attorneys in 2018. The firm’s major practice areas include corporate, litigation, intellectual property and regulatory law. Cooley currently occupies space on floors 42-46 of the 55 Hudson Yards Property. Effective as of the 10th anniversary of the rent commencement date (which was September 1, 2019), with 18 months’ prior notice, tenant has the one-time right to surrender either (i) the highest or lowest floor of any contiguous block or (ii) if the tenant did not exercise its initial expansion option, all of the SF leased on the lowest floor of the leased premises (if tenant leases less than all of the SF on such lowest floor), subject to a fee equal to the sum of the unamortized portion of allowances, commissions and rent concessions applicable to such space. In addition, effective as of the 15th anniversary of the rent commencement date, with 24 months’ prior notice, Cooley has the one-time right to terminate its lease subject to a fee of the sum of (i) unamortized allowances, commissions, rent concessions (each including interest at the rate of 6% per annum, compounded monthly) and (ii) four months of fixed rent and recurring additional charges at the rate immediately preceding the termination date. Cooley has either (i) two renewal options of 5-years each or (ii) one 10-year renewal option, each with 18 months’ prior notice and at the fair market rental rate, following its September 2039 expiration. Cooley subleases 12,229 SF of its space to Cinctive Capital LLC, with a sublease expiration of June 2022 and an annual rate of $110 PSF.
Boies, Schiller & Flexner (110,732 SF, 7.7% NRA, 6.8% underwritten base rent, June 30, 2035 expiration). Founded by David Boies and Jonathan D. Schiller in 1997, Boies, Schiller & Flexner (“Boies Schiller”) is a law firm ranked within the top 100 law firms by gross revenue according to a third party legal publication, specializing in litigation and headquartered at the 55 Hudson Yards Property. The firm has 10 offices with a total of 320 attorneys. Boies Schiller currently occupies space on floors 18-21 of the 55 Hudson Yards Property, but is not yet paying full rent on all of its space. All outstanding gap rent and free rent through June 2020, in the amount of $5,480,125, was reserved at the time of origination of the 55 Hudson Yards Whole Loan. Effective as of the 10th anniversary of the rent commencement date (which was July 1, 2020), with 18 months’ prior notice, the tenant has a one-time right to surrender either (i) the highest or lowest floor of any contiguous block or (ii) any partial floor, each subject to a fee of 150% of the applicable per square foot base rent and 150% of the recurring additional charges due with respect to the contracted space for the immediately preceding 12-month period. Boies Schiller has either (i) two renewal options of 5-years each or (ii) one 10-year renewal option, each with 24 months’ prior notice and at the fair market rental rate, following its June 2035 expiration. Boies Schiller subleases 18,224 SF of its space to Ashurst LLP, with a sublease expiration date of June 2026 and an annual rate of $94.00 PSF.
Third Point (89,043 SF, 6.2% NRA, 8.6% underwritten base rent, July 31, 2029 expiration). Third Point Management (“Third Point”) is a New York-based hedge fund founded by Daniel S. Loeb in 1995. The firm operates as an employee-owned and SEC-registered investment advisor. Third Point currently occupies spaces on floors 49-51 of the 55 Hudson Yards Property. Third Point has either (i) a renewal option of 5-years or (ii) a renewal option of 10-years, each with 15 months’ prior notice and at the fair market rental rate, following its July 2029 expiration.
The following table presents certain information relating to the tenancy at the 55 Hudson Yards Property:
| Tenant Summary | |||||||||
| Tenant Name | Credit Rating (Fitch/ Moody's/ S&P) | Tenant SF | Approx. % of SF | Annual UW Rent(1) | % of Total Annual UW Rent | Annual UW Rent PSF(1) | Lease Expiration | Termination Option (Y/N) | Renewal Options |
| Major Tenants | |||||||||
| Point72 | NR/NR/NR | 332,283(2)(3) | 23.2% | $29,364,626(2)(3) | 21.9% | $88.37(2)(3) | 4/30/2034 | Y(4) | 2-5 yr or 1-10 yr |
| Milbank | NR/NR/NR | 287,333 | 20.1% | $24,040,889 | 17.9% | $83.67 | 3/31/2034 | Y(5) | 2-5 yr or 1-10 yr |
| Cooley | NR/NR/NR | 146,227(6) | 10.2% | $15,061,381(6) | 11.2% | $103.00(6) | 9/30/2039 | Y(7) | 2-5 yr or 1-10 yr |
| Boies Schiller | NR/NR/NR | 110,732(8) | 7.7% | $9,135,390(8)(9) | 6.8% | $82.50(8)(9) | 6/30/2035 | Y(10) | 2-5 yr or 1-10 yr |
| Third Point | NR/NR/NR | 89,043 | 6.2% | $11,575,590 | 8.6% | $130.00 | 7/31/2029 | N | 1-5 yr or 1-10 yr |
| Subtotal/Wtd. Avg. | 965,618 | 67.5% | $89,177,876 | 66.4% | $92.35 | Termination Option (Y/N) | |||
| Other Tenants | 426,582 | 29.8% | $45,026,413 | 33.6% | $105.55 | ||||
| Vacant Space | 39,012 | 2.7% | $0 | 0.0% | $0.00 | ||||
| Total/Wtd. Avg. | 1,431,212 | 100.0% | $134,204,289 | 100.0% | $96.40(11) | ||||
| (1) | The Annual UW Rent and Annual UW Rent PSF shown above include contractual rent steps through December 2020 totaling $57,080. The lender’s underwriting gives separate credit for straight-line rent averaging for the investment grade tenant Mount Sinai through the loan term and for Milbank, Cooley and Boies Schiller through the loan term. The total implied underwritten rental rate for Milbank, Cooley and Boies Schiller, inclusive of the straight line credit, is approximately $87.72, $106.62 and $85.59 PSF, respectively. See “Underwritten Net Cash Flow” below. |
| (2) | Point 72 has signed a sublease for the entire 3rd floor (31,246 SF) of its space with Elite World Group, LLC, with an expected sublease commencement date of February 2020, a 5-year term and an annual rate of $90.00 PSF. Point72 also subleases 11,844 SF of its space to Light Sky Macro LP, with a sublease expiration of August 2029 and an annual rate of $99.00 PSF. Underwriting reflects the prime lease rent. |
| (3) | Point72 has an executed lease and has taken full occupancy of its spaces but has not yet fully commenced paying rent on all of its space (see tenant description in“Major Tenants” above for further information). |
| (4) | Point72 has a one-time termination or contraction option that is further described in the“Major Tenants”section above. |
| (5) | Milbank has a one-time contraction option that is further described in the“Major Tenants” section above. |
| (6) | Cooley subleases 12,229 SF of its space to Cinctive Capital LLC, with a sublease expiration of June 30, 2022 and an annual rate of $110 PSF. Underwriting reflects the prime lease rent. |
| (7) | Cooley has a one-time termination or contraction option that is further described in the“Major Tenants”section above. |
| (8) | Boies Schiller subleases 18,224 SF of its space to Ashurst LLP, with a sublease expiration date of June 28, 2026 and an annual rate of $94.00 PSF. Underwriting reflects the prime lease rent. |
| (9) | Boies Schiller has an executed lease and has taken full occupancy of its spaces but has not yet fully commenced paying rent on all of its space (see tenant description in“Major Tenants” above for further information). |
| (10) | Boies Schiller has a one-time contraction option that is further described in the “Major Tenants” section above. |
| (11) | Total/Wtd. Avg. Annual UW Rent PSF excludes vacant space. |
| This is not a research report and was not prepared by any Underwriter’s research department. Please see additional important information and qualifications at the end of this Term Sheet. |
T-84
| Office – CBD | Loan #6 | Cut-off Date Balance: | $56,700,000 | |
| 550 West 34th Street | 55 Hudson Yards | Cut-off Date LTV: | 39.4% | |
| New York, NY 10001 | UW NCF DSCR: | 3.54x | ||
| UW NOI Debt Yield: | 11.0% |
The following table presents certain information relating to the lease rollover schedule at the 55 Hudson Yards Property:
| Lease Rollover Schedule(1)(2) | ||||||||
| Year | # of Leases Rolling | SF Rolling | Annual UW Rent PSF Rolling | Approx. % of Total SF Rolling | Approx. Cumulative % of SF Rolling | Total UW Rent Rolling | Approx. % of Total Rent Rolling | Approx. Cumulative % of Total Rent Rolling |
| 2020 | 0 | 0 | $0.00 | 0.0% | 0.0% | $0 | 0.0% | 0.0% |
| 2021 | 0 | 0 | $0.00 | 0.0% | 0.0% | $0 | 0.0% | 0.0% |
| 2022 | 0 | 0 | $0.00 | 0.0% | 0.0% | $0 | 0.0% | 0.0% |
| 2023 | 0 | 0 | $0.00 | 0.0% | 0.0% | $0 | 0.0% | 0.0% |
| 2024 | 2 | 84,892 | $114.02 | 5.9% | 5.9% | $9,679,268 | 7.2% | 7.2% |
| 2025 | 2 | 18,765 | $109.00 | 1.3% | 7.2% | $2,045,385 | 1.5% | 8.7% |
| 2026 | 0 | 0 | $0.00 | 0.0% | 7.2% | $0 | 0.0% | 8.7% |
| 2027 | 0 | 0 | $0.00 | 0.0% | 7.2% | $0 | 0.0% | 8.7% |
| 2028 | 0 | 0 | $0.00 | 0.0% | 7.2% | $0 | 0.0% | 8.7% |
| 2029 | 6 | 149,603 | $125.92 | 10.5% | 17.7% | $18,838,620 | 14.0% | 22.8% |
| 2030 | 2 | 9,642 | $123.92 | 0.7% | 18.4% | $1,194,842 | 0.9% | 23.7% |
| 2031 & Beyond | 19 | 1,129,298 | $90.72 | 78.9% | 97.3% | $102,446,174 | 76.3% | 100.0% |
| Vacant | 0 | 39,012 | $0.00 | 2.7% | 100.0% | $0 | 0.0% | 100.0% |
| Total/Wtd. Avg. | 31 | 1,431,212 | $96.40(3) | 100.0% | $134,204,289 | 100.0% | ||
| (1) | Information is based on the underwritten rent roll. |
| (2) | Certain tenants may have lease termination options that are exercisable prior to the originally stated expiration date of the subject lease and that are not considered in the Lease Rollover Schedule. |
| (3) | Total/Wtd. Avg. Annual UW Rent PSF Rolling excludes vacant space. |
The Market. The 55 Hudson Yards Property is located at 550 West 34th Street, on the southeast corner of the intersection of 34th Street and 11th Avenue in New York, New York. The 55 Hudson Yards Property is situated within the Hudson Yards development, one of the largest private real estate development projects in the United States. Once fully developed, Hudson Yards is expected to include more than 18.0 million SF of commercial and residential space, along with more than 100 shops, a collection of restaurants, approximately 4,000 residences, affordable housing, The Shed (entertainment venue), 14 acres of open space, a 750-seat public school and an Equinox Hotel. The Hudson Yards neighborhood is traditionally bound by the Hell’s Kitchen neighborhood to the north, the Midtown, Times Square, Garment District and Penn Station neighborhoods to the east, and the West Chelsea neighborhood to the south. In September 2015, the Metropolitan Transportation Authority (MTA) completed an approximately $2.4 billion, 7,000-foot extension of the MTA’s No. 7 Flushing subway line (providing access to Queens), which was extended to include an additional subway stop at the corner of 34th Street and Eleventh Avenue (adjacent to the 50 Hudson Yards Property), from the previous last stop at 41st Street and Seventh Avenue (approximately 1.0 mile northeast of the 55 Hudson Yards Property). The 55 Hudson Yards Property is situated approximately 0.6 miles northwest of Penn Station.
The 55 Hudson Yards Property is situated approximately 0.3 miles northwest of the Shops & Restaurants at Hudson Yards, a seven-story, 676,229 SF retail center, with retailers such as Cartier, Coach, Zara, H&M, Watches of Switzerland and Fendi, as well as restaurant and food options including Hudson Yards Grill, Bouchon Bakery, Shake Shack and Jack’s Coffee. The Vessel, a 16-story structure comprising 154 interconnecting flights of stairs with approximately 2,500 individual steps and 80 landings, is located approximately 0.2 miles southwest of the 55 Hudson Yards Property.
According to the appraisal, the 55 Hudson Yards Property is situated within the Far West Side submarket of the New York Office Market. As of the third quarter of 2019, the Far West Side submarket reported a total inventory of approximately 9.1 million SF with a 1.4% vacancy rate (and a 12.2% availability rate) and average asking rents of $108.47 PSF, gross. The appraiser concluded to market rents ranging from $95.00 to $130.00 PSF, modified gross, for the various floors of office space at the 55 Hudson Yards Property (see table below).
The following table presents certain information relating to the appraisal’s market rent conclusion for the 55 Hudson Yards Property:
| Market Rent Summary | |||||||
| Office Floor 2-9 | Office Floor 10-16 | Office Floor 17-23 | Office Floor 24-30 | Office Floor 31-37 | Office Floor 38-44 | Office Floor 45-51 | |
| Market Rent (PSF) | $95.00 | $100.00 | $110.00 | $115.00 | $120.00 | $125.00 | $130.00 |
| Lease Term (Years) | 15 | 15 | 15 | 15 | 15 | 15 | 15 |
| Lease Type (Reimbursements) | MG | MG | MG | MG | MG | MG | MG |
| Rent Increase Projection | $10.00 PSF every 5 years | $10.00 PSF every 5 years | $10.00 PSF every 5 years | $10.00 PSF every 5 years | $10.00 PSF every 5 years | $10.00 PSF every 5 years | $10.00 PSF every 5 years |
Source:Appraisal.
| This is not a research report and was not prepared by any Underwriter’s research department. Please see additional important information and qualifications at the end of this Term Sheet. |
T-85
| Office – CBD | Loan #6 | Cut-off Date Balance: | $56,700,000 | |
| 550 West 34th Street | 55 Hudson Yards | Cut-off Date LTV: | 39.4% | |
| New York, NY 10001 | UW NCF DSCR: | 3.54x | ||
| UW NOI Debt Yield: | 11.0% |
The following table presents information relating to comparable office property sales for the 55 Hudson Yards Property:
| Comparable Property Sale Summary | ||||||
| Property Name/Location | Sale Date | Year Built/ Renovated | Total NRA (SF) | Occupancy | Sale Price | Sale Price PSF |
55 Hudson Yards Property New York, NY | N/A | 2018/N/A | 1,431,212(1) | 97.3%(1) | ||
711 Fifth Avenue New York, NY | Sep. 2019 | 1927/N/A | 354,361 | 76% | $955,000,000 | $2,695 |
330 Madison Avenue New York, NY | Jul. 2019 | 1963/N/A | 855,000 | 95% | $900,000,000 | $1,053 |
30 Hudson Yards(2) New York, NY | Apr. 2019 | 2019/N/A | 1,463,234 | 100% | $2,155,000,000 | $1,473 |
640 Fifth Avenue New York, NY | Apr. 2019 | 1948/2014 | 315,886 | 100% | $975,000,000 | $3,087 |
237 Park Avenue New York, NY | Jan. 2019 | 1915/2015 | 1,260,160 | 98% | $1,200,000,000 | $952 |
3 Columbus Circle New York, NY | Nov. 2018 | 1927/2011 | 753,405 | 100% | $1,035,000,000 | $1,374 |
1515 Broadway New York, NY | Nov. 2017 | 1972/2010 | 1,897,131 | 99% | $1,950,000,000 | $1,028 |
10 Hudson Yards(2) New York, NY | Aug. 2016 | 2015/N/A | 1,861,084 | 100% | $2,150,000,000 | $1,155 |
Source:Appraisal, unless otherwise indicated.
| (1) | Information obtained from the underwritten rent roll. |
| (2) | Owned by affiliates of the 55 Hudson Yards Borrower. |
The following table presents certain information relating to comparable office leases for the 55 Hudson Yards Property:
| Comparable Leases Summary | ||||||||
| Property Name/Location | Year Built/ Renovated | Total GLA (SF) | Distance from Subject | Tenant Name | Lease Date/Term | Lease Area (SF) | Annual Base Rent PSF | Lease Type |
55 Hudson Yards Property New York, NY | 2018/N/A | 1,431,212(1) | N/A | |||||
30 Hudson Yards(2) New York, NY | 2019/N/A | 1,463,234 | 0.1 Miles | Confidential Tenant Warner Media | Oct. 2019 /16.3 Yrs Jun. 2019 / 15.0 Yrs | 175,000 1,463,234 | $156.38 $120.37 | MG Net to MG adj. |
460 West 34th Street New York, NY | 1927/2021(3) | 633,530 | 0.2 Miles | First Republic Bank | Sep. 2019 /16.0 Yrs | 233,782 | $85.00 | MG |
441 Ninth Avenue New York, NY | 1962/2019 | 697,958 | 0.3 Miles | Brevert Peloton Interactive, LLC Lyft | Sep. 2019 /10.8 Yrs Nov. 2018 / 15.0 Yrs Nov. 2018 / 10.0 Yrs | 16,178 312,000 100,000 | $116.00 $106.66 $87.00 | MG MG MG |
50 Hudson Yards(2) New York, NY | 2022(3)/N/A | 2,900,000 | 0.1 Miles | Confidential | Sep. 2019 / 15.0 Yrs | 1,250,000 | $130.00 | MG |
1 Manhattan West New York, NY | 2019/N/A | 2,216,609 | 0.4 Miles | Accenture NHL McKool School Skadden, Arps, Slate, Meagher & Florn LLP | Jul. 2019 /16.1 Yrs Jun. 2019 / 22.0 Yrs Apr. 2019 / 16.0 Yrs Mar. 2019 / 21.0 Yrs | 248,673 176,007 64,120 600,867 | $119.00 $93.80 $108.00 $76.11 | MG MG MG MG |
66 Hudson Boulevard New York, NY | 2022(3)/N/A | 2,814,581 | 0.2 Miles | AllianceBernstein Pfizer Inc. | May 2019 /20.0 Yrs Apr. 2018 / 21.3 Yrs. | 186,226 790,000 | $105.00 $95.00 | MG MG |
10 Hudson Yards(2) New York, NY | 2015/N/A | 1,861,084 | 0.3 Miles | Huatai Securities | Apr. 2018 /3.6 Yrs | 5,992 | $120.00 | MG |
1 Vanderbilt Avenue New York, NY | 2020(3)/N/A | 1,730,989 | 1.6 Miles | The Carlyle Group | Jul. 2018 /15.8 Yrs | 95,367 | $166.00 | MG |
Source:Appraisal, unless otherwise indicated.
| (1) | Information obtained from the underwritten rent roll. |
| (2) | Owned by affiliates of the 55 Hudson Yards Borrower. |
| (3) | Denotes expected completion or renovation dates (as applicable) per the appraisal. |
| This is not a research report and was not prepared by any Underwriter’s research department. Please see additional important information and qualifications at the end of this Term Sheet. |
T-86
| Office – CBD | Loan #6 | Cut-off Date Balance: | $56,700,000 | |
| 550 West 34th Street | 55 Hudson Yards | Cut-off Date LTV: | 39.4% | |
| New York, NY 10001 | UW NCF DSCR: | 3.54x | ||
| UW NOI Debt Yield: | 11.0% |
Underwritten Net Cash Flow.The following table presents certain information relating to the Underwritten Net Cash Flow at the 55 Hudson Yards Property:
| Cash Flow Analysis(1) | ||
| UW | UW PSF | |
| Base Rent | $134,147,209 | $93.73 |
| Contractual Rent Steps(2) | $57,080 | $0.04 |
| Rent Average Benefit(3) | $2,242,507 | $1.57 |
| Grossed Up Vacant Space | $5,108,740 | $3.57 |
| Total Recoveries | $12,516,263 | $8.75 |
| Other Income | $147,949 | $0.10 |
| Less Vacancy & Credit Loss(4) | ($5,108,740) | ($3.57) |
| Effective Gross Income | $149,111,008 | $104.19 |
| Real Estate Taxes (PILOT)(5) | $19,160,307 | $13.39 |
| Insurance | $807,380 | $0.56 |
| Other Operating Expenses | $25,242,990 | $17.64 |
| Total Expenses | $45,210,677 | $31.59 |
| Net Operating Income | $103,900,331 | $72.60 |
| Capital Expenditures | $286,242 | $0.20 |
| TI/LC | $3,578,030 | $2.50 |
| Net Cash Flow | $100,036,059 | $69.90 |
| Occupancy%(4) | 97.3% | |
| NOI DSCR(6) | 3.68x | |
| NCF DSCR(6) | 3.54x | |
| NOI Debt Yield(6) | 11.0% | |
| NCF Debt Yield(6) | 10.6% | |
| (1) | Prior historical operating statements are not applicable, as the 55 Hudson Yards Property was constructed in 2018 and tenants began taking occupancy in 2019. | |
| (2) | Represents contractual rent steps through December 2020. |
| (3) | Represents straight-line rent averaging for the investment grade tenant Mount Sinai through the loan term and for Milbank, Cooley and Boies Schiller through the loan term (see “Tenant Summary” above for further information). |
| (4) | The underwritten economic vacancy is 3.6%. The 55 Hudson Yards Property was 97.3% leased as of November 19, 2019. |
| (5) | Represents the average of the projected PILOT payments over the loan term (see “PILOT/IDA Leases” for further details on the PILOT agreement). |
| (6) | The debt service coverage ratios and debt yields are based on the 55 Hudson Yards Senior Loan, and exclude the 55 Hudson Yards Subordinate Companion Loan. |
Escrows and Reserves.
Real Estate Taxes - Upon the occurrence and continuance of a Cash Trap Event Period (as defined below under “Lockbox and Cash Management”), the 55 Hudson Yards Whole Loan documents require ongoing monthly real estate tax reserves in an amount equal to 1/12 of the real estate taxes that the lender reasonably estimates will be payable during the next 12 months.
Insurance - Upon the occurrence and continuance of a Cash Trap Event Period, the 55 Hudson Yards Whole Loan documents require ongoing monthly insurance reserves in an amount equal to 1/12 of the insurance premiums that the lender estimates will be payable for the renewal of the coverage during the next 12 months;provided, however, notwithstanding any prior springing conditions, the reserve will not be required if the 55 Hudson Yards Borrower maintains a blanket insurance policy reasonably acceptable to the lender.
Replacement Reserve – Upon the occurrence and continuance of a Cash Trap Event Period, the 55 Hudson Yards Whole Loan documents require ongoing monthly replacement reserves of $23,854.
Rollover Reserve – Upon the occurrence and continuance of a Cash Trap Event Period, the 55 Hudson Yards Whole Loan documents require ongoing monthly general rollover reserves of $119,268.
Tenant Specific TI/LC Reserve – The 55 Hudson Yards Whole Loan documents require an upfront deposit of $34,260,641 for approved leasing expenses outstanding at the time of origination of the 55 Hudson Yards Whole Loan.
Free Rent Reserve – The 55 Hudson Yards Whole Loan documents require an upfront reserve of $11,482,346 for the free rent and gap rent outstanding for seven tenants at the time of origination of the 55 Hudson Yards Whole Loan.
| This is not a research report and was not prepared by any Underwriter’s research department. Please see additional important information and qualifications at the end of this Term Sheet. |
T-87
| Office – CBD | Loan #6 | Cut-off Date Balance: | $56,700,000 | |
| 550 West 34th Street | 55 Hudson Yards | Cut-off Date LTV: | 39.4% | |
| New York, NY 10001 | UW NCF DSCR: | 3.54x | ||
| UW NOI Debt Yield: | 11.0% |
Milbank Lease Landlord Delay Dispute Reserve – The 55 Hudson Yards Whole Loan documents require an upfront reserve of $11,000,000 relating to the potential settlement of a dispute between the 55 Hudson Yards Borrower and Milbank relating to a delay in the delivery of such tenant’s leased premises.
MarketAxess Lease Takeover Reserve – The 55 Hudson Yards Whole Loan documents require an upfront reserve of $4,474,631 relating to the rental expenses to be incurred by MarketAxess Holdings Inc., a tenant at the 55 Hudson Yards Property, under a prior sublease at an unrelated property which the 55 Hudson Yards Borrower agreed to pay as an inducement to such tenant’s new lease at the 55 Hudson Yards Property.
Lockbox and Cash Management. The 55 Hudson Yards Whole Loan documents require that the 55 Hudson Yards Borrower establish and maintain a lender-controlled lockbox account, which is already in-place, and direct all tenants to pay rent directly into such lockbox account. The 55 Hudson Yards Whole Loan documents also require that all rents received by the 55 Hudson Yards Borrower be deposited into the lockbox account within two business days of receipt. Prior to the occurrence of a Cash Trap Event Period, all funds on deposit in the lockbox account will be disbursed to the 55 Hudson Yards Borrower’s operating account. During a Cash Trap Event Period, all funds in the lockbox account are required to be swept each business day into the cash management account controlled by the lender and, on each payment date, all funds in the cash management account are required to be applied in accordance with the 55 Hudson Yards Whole Loan documents. During a Cash Trap Event Period, any excess cash flow remaining after satisfaction of the waterfall items is required to be swept to an excess cash flow subaccount to be held by the lender as additional security for the 55 Hudson Yards Whole Loan;provided, however, so long as no event of default exists under the 55 Hudson Yards Whole Loan, if amounts on deposit in the Rollover Reserve are not sufficient to pay approved leasing expenses, then upon request of the 55 Hudson Yards Borrower, funds in the excess cash flow subaccount are required to be disbursed for approved leasing expenses.
A “Cash Trap Event Period” will commence upon the earlier of the following:
| (i) | the occurrence and continuance of an event of default; or |
| (ii) | the net cash flow debt yield (“NCF DY”) for the 55 Hudson Yards Whole Loan falling below 6.0% at the end of any calendar quarter. |
A Cash Trap Event Period will end upon the occurrence of the following:
| ● | with regard to clause (i) above, the cure of such event of default; or |
| ● | with regard to clause (ii) above: |
| (a) | the NCF DY for the 55 Hudson Yards Whole Loan being greater than or equal to 6.0% for two consecutive calendar quarters; or |
| (b) | the 55 Hudson Yards Borrower delivering to the lender as additional collateral and security for the payment of the debt, immediately available funds or one or more letters of credits (not to exceed, in the aggregate, 10.0% of the outstanding principal balance of the 55 Hudson Yards Whole Loan) having an aggregate notional amount, that, if applied as a prepayment of the outstanding principal balance of the 55 Hudson Yards Whole Loan, would cause the NCF DY to equal or exceed 6.0%. |
Additional Secured Indebtedness (not including trade debts).The 55 Hudson Yards Property also secures the 55 Hudson Yards Non-ServicedPari Passu Companion Loans, which have an aggregate Cut-off Date principal balance of $888,300,000 and the 55 Hudson Yards Subordinate Companion Loan, which has an aggregate Cut-off Date principal balance of $300,000,000. The 55 Hudson Yards Non-ServicedPari PassuCompanion Loans and the 55 Hudson Yards Subordinate Companion Loan are coterminous with the 55 Hudson Yards Mortgage Loan. The 55 Hudson Yards Non-ServicedPari PassuCompanion Loans accrue interest at the same rate as the 55 Hudson Yards Mortgage Loan, and the 55 Hudson Yards Subordinate Companion Loan accrues interest at an interest rate of 2.9500%. The 55 Hudson Yards Mortgage Loan and the 55 Hudson Yards Non-ServicedPari PassuCompanion Loans are eachpari passuin right of payment and together are senior in right of payment to the 55 Hudson Yards Subordinate Companion Loan. The holders of the 55 Hudson Yards Mortgage Loan, the 55 Hudson Yards Non-ServicedPari PassuCompanion Loans and the 55 Hudson Yards Subordinate Companion Loan have entered into a co-lender agreement which sets forth the allocation of collections on the 55 Hudson Yards Whole Loan. See “Description of the Mortgage Pool—The Whole Loans—The 55 Hudson Yards Pari Passu-A/B Whole Loan”.
The following table presents certain information relating to the 55 Hudson Yards Subordinate Companion Loan:
| B-Note Summary | |||||||||
| B-Note Original Principal Balance | B-Note Interest Rate | Original Term (mos.) | Original Amort. Term (mos.) | Original IO Term (mos.) | Total Debt UW NCF DSCR | Total Debt UW NOI Debt Yield | Total Debt Cutoff Date LTV | ||
| 55 Hudson Yards Subordinate Companion Loan | $300,000,000 | 2.9500% | 120 | 0 | 120 | 2.69x | 8.3% | 51.9% | |
Mezzanine Loan and Preferred Equity. Not permitted.
Release of Property.Not permitted.
Right of First Offer/Right of First Refusal.None.
Ground Lease. None.
Letter of Credit. None.
PILOT/IDA Leases. The 55 Hudson Yards Borrower leases the 55 Hudson Yards Property to the New York City Industrial Development Agency (the “Agency”) (such lease, the “Company Lease”), and the Agency subleases the 55 Hudson Yards Property back to the 55 Hudson Yards Borrower (the “Agency Lease”) (the Company Lease and Agency Lease, collectively, the “IDA Leases”). The benefits of this lease structure to the 55 Hudson Yards Borrower are a mortgage recording tax exemption and real property tax abatements. As such, the 55 Hudson Yards Borrower pays installment payments in lieu of real estate taxes as the rent under the Agency Lease (the “PILOT Payments”). In order for the PILOT Payments to achieve the same priority as would real estate tax payments (i.e., ahead of any mortgage or other lien), the 55 Hudson Yards Borrower (with the Agency as holder of the leasehold
| This is not a research report and was not prepared by any Underwriter’s research department. Please see additional important information and qualifications at the end of this Term Sheet. |
T-88
| Office – CBD | Loan #6 | Cut-off Date Balance: | $56,700,000 | |
| 550 West 34th Street | 55 Hudson Yards | Cut-off Date LTV: | 39.4% | |
| New York, NY 10001 | UW NCF DSCR: | 3.54x | ||
| UW NOI Debt Yield: | 11.0% |
under the Company Lease) provided mortgages in favor of the Hudson Yards Infrastructure Corporation, a not-for-profit local development corporation (“HYIC”), to secure the PILOT Payments (collectively, the “PILOT Mortgage”). The HYIC has issued revenue bonds for which the PILOT Payments are used to repay the bondholders. The term of the IDA Leases runs to June 30, 2044 (such period, the “Initial Term”), with annual automatic one-year extensions thereafter, unless within 60 days preceding the expiration of the current term the Agency provides written notice of termination to the 55 Hudson Yards Borrower (such date, the “Expiration Date”);provided that, after the Initial Term, the IDA Leases will automatically terminate within 60 days after the repayment in full or defeasance of all revenue bonds issued by HYIC for which an assignment of the PILOT Amount payable under the Agency Lease is used to repay the bondholders.
The 55 Hudson Yards Property is subject to tax abatements in the following amounts through 2038:
| ● | 29.7% tax abatement through 2023; |
| ● | 2024 through 2034: taxes are due in amount equal to 103% of the preceding year’s PILOT payment; |
| ● | 2035: taxes due in amount equal to the greater of (a) 76.3% of unabated taxes and (b) 103% of the preceding year’s PILOT payment; |
| ● | 2036: taxes due in amount equal to the greater of (a) 82.2% of unabated taxes and (b) 103% of the preceding year’s PILOT payment; |
| ● | 2037: taxes due in amount equal to the greater of (a) 88.1% of unabated taxes and (b) 103% of the preceding year’s PILOT payment; and |
| ● | 2038: taxes due in amount equal to the greater of (a) 94.1% of unabated taxes and (b) 103% of the preceding year’s PILOT payment. |
For additional information with respect to the IDA Leases and PILOT Payments, see“Description of the Mortgage Pool—Real Estate and Other Tax Considerations” in the Preliminary Prospectus.
Terrorism Insurance.The 55 Hudson Yards Whole Loan documents require that the “all risk” insurance policy required to be maintained by the 55 Hudson Yards Borrower, in an amount equal to the full replacement cost of the 55 Hudson Yards Property, contain no exclusion for damage or destruction caused by acts of terrorism, as well as business interruption insurance covering a period of restoration of 24 months and a 6-month extended period of indemnity (provided that if TRIPRA or a similar statute is not in effect, the 55 Hudson Yards Borrower will not be obligated to pay terrorism insurance premiums in excess of two times the annual premium for the casualty and business interruption coverage (without giving effect to the cost of terrorism, flood and earthquake and business interruption components of such coverage)).
The 55 Hudson Yards Whole Loan documents provide that required terrorism insurance may be written by a non-rated captive insurer subject to certain conditions, including, among other things: (i) TRIPRA is in full force and effect; (ii) the terrorism policy issued by such captive insurer, together with any other qualified terrorism policies in-place, provide per occurrence limit in an amount not less than replacement cost and rent loss coverage as otherwise required; (iii) covered losses that are not reinsured by the federal government under TRIPRA and paid to the captive insurer are reinsured with a cut-through endorsement by an insurance company rated S&P “A”/ Moody’s “A2” or better; (iv) all reinsurance agreements between the captive insurer and other reinsurance providers are reasonably acceptable to the lender; (v) such captive insurer is licensed in the State of New York or other jurisdiction to the extent reasonably approved by the lender and qualified to issue the terrorism policy in accordance with applicable legal requirements; and (vi) the related policy will not contain a provision that terrorism coverage will expire or be excluded or limited in the event TRIPRA expires or is no longer in effect, so long as an insurance policy that does not contain such a provision is commercially available.
| This is not a research report and was not prepared by any Underwriter’s research department. Please see additional important information and qualifications at the end of this Term Sheet. |
T-89
| Hospitality – Various | Loan #7 | Cut-off Date Balance: | $48,000,000 | |
| Various | AD1 Hotel Portfolio | Cut-off Date LTV: | 64.4% | |
| Various | U/W NCF DSCR: | 1.89x | ||
| U/W NOI Debt Yield: | 13.0% |
| This is not a research report and was not prepared by any Underwriter’s research department. Please see additional important information and qualifications at the end of this Term Sheet. |
T-90
| Hospitality – Various | Loan #7 | Cut-off Date Balance: | $48,000,000 | |
| Various | AD1 Hotel Portfolio | Cut-off Date LTV: | 64.4% | |
| Various | U/W NCF DSCR: | 1.89x | ||
| U/W NOI Debt Yield: | 13.0% |
| This is not a research report and was not prepared by any Underwriter’s research department. Please see additional important information and qualifications at the end of this Term Sheet. |
T-91
| Mortgage Loan No. 7 – AD1 Hotel Portfolio |
| Mortgage Loan Information | Property Information | ||||||
| Mortgage Loan Seller: | BANA | Single Asset/Portfolio: | Portfolio | ||||
| Credit Assessment (DBRS/Fitch/S&P): | NR/NR/NR | Location(4): | Various | ||||
| Original Balance: | $48,000,000 | General Property Type: | Hospitality | ||||
| Cut-off Date Balance: | $48,000,000 | Detailed Property Type(4): | Various | ||||
| % of Initial Pool Balance: | 4.0% | Title Vesting: | Fee/Leasehold | ||||
| Loan Purpose(1): | Refinance/Acquisition | Year Built/Renovated(4): | Various | ||||
| Borrower Sponsor: | AD1 Global | Size(4): | 708 Rooms | ||||
| Guarantors: | Alex Fridzon; Arie Fridzon; Jose Daniel | Cut-off Date Balance per Room: | $67,797 | ||||
| Berman | Maturity Date Balance per Room: | $55,494 | |||||
| Mortgage Rate: | 3.9160% | Property Manager: | AD1 Management, Inc. | ||||
| Note Date: | 12/4/2019 | (borrower-related) | |||||
| First Payment Date: | 2/1/2020 | ||||||
| Maturity Date: | 1/1/2030 | ||||||
| Original Term to Maturity: | 120 months | ||||||
| Original Amortization Term: | 360 months | ||||||
| IO Period: | 12 months | ||||||
| Seasoning: | 2 months | Underwriting and Financial Information | |||||
| Prepayment Provisions: | LO (26); DEF (90); O (4) | UW NOI: | $6,094,904 | ||||
| Lockbox/Cash Mgmt Status: | Hard/Springing | UW NOI Debt Yield(3): | 13.0% | ||||
| Additional Debt Type: | N/A | UW NOI Debt Yield at Maturity: | 15.5% | ||||
| Additional Debt Balance: | N/A | UW NCF DSCR: | 2.70x (IO) 1.89x (P&I) | ||||
| Future Debt Permitted (Type): | No (N/A) | Most Recent NOI: | $6,260,438 (9/30/2019 TTM) | ||||
| Reserves(2) | 2nd Most Recent NOI: | $5,599,202 (12/31/2018) | |||||
| Type | Initial | Monthly | Cap | 3rd Most Recent NOI(5): | N/A | ||
| RE Tax: | $75,000 | $75,000 | N/A | Most Recent Occupancy: | 72.6% (9/30/2019) | ||
| Insurance: | $0 | Springing | N/A | 2nd Most Recent Occupancy: | 69.1% (12/31/2018) | ||
| Deferred Maintenance: | $61,063 | $0 | N/A | 3rd Most Recent Occupancy(5): | N/A | ||
| FF&E: | $0 | $69,993 | N/A | Appraised Value (as of)(6): | $73,000,000 (10/1/2019) | ||
| PIP: | $800,000 | $0 | N/A | Appraised Value per Room(6): | $103,107 | ||
| Capitalized Holdback(3): | $1,000,000 | $0 | N/A | Cut-off Date LTV Ratio(3)(6): | 64.4% | ||
| Ground Rent: | $16,554 | Springing | N/A | Maturity Date LTV Ratio(3)(6): | 52.5% | ||
| Sources and Uses | ||||||
| Sources | Proceeds | % of Total | Uses | Proceeds | % of Total | |
| Loan Amount: | $48,000,000 | 87.7% | Loan Payoff(1): | $36,831,198 | 67.3% | |
| Borrower Equity: | $6,738,314 | 12.3% | Purchase Price(1): | $14,100,000 | 25.8% | |
| Reserves: | $1,952,617 | 3.6% | ||||
| Closing Costs: | $1,854,498 | 3.4% | ||||
| Total Sources: | $54,738,314 | 100.0% | Total Uses: | $54,738,314 | 100.0% | |
| (1) | Proceeds from the AD1 Hotel Portfolio Mortgage Loan (as defined below) were used to acquire the Residence Inn Avon Property (as defined below) for $14,100,000 plus closing costs, and to refinance the remainder of the individual properties comprising the AD1 Hotel Portfolio Properties (as defined below). |
| (2) | See “Escrows and Reserves”below for further discussion of reserve information. |
| (3) | UW NOI Debt Yield, Cut-off Date LTV Ratio and Maturity Date LTV Ratio are shown based on a loan amount of $47,000,000, which is the AD1 Hotel Portfolio Mortgage Loan amount net of the $1,000,000 Capitalized Holdback Reserve held by the lender, which will be released to the AD1 Hotel Portfolio Borrower (as defined below) upon the trailing twelve month debt yield reaching 11.0% (See“Escrows and Reserves” below). The UW NOI Debt Yield, Cut-off Date LTV Ratio and Maturity Date LTV Ratio based on the AD1 Hotel Portfolio Mortgage Loan amount of $48,000,000 are 12.7%, 65.8% and 53.8%, respectively. |
| (4) | See the“AD1 Hotel Portfolio Property Schedule” table below for details regarding the individual properties. |
| (5) | Prior historical information is not available because the AD1 Hotel Portfolio Properties were acquired separately between 2016 and 2019. |
| (6) | The Appraised Value represents the value for the individual properties as a portfolio as of October 1, 2019 and includes a 5.0% value premium. The aggregate of the “As Is” values for the AD1 Hotel Portfolio Properties is $69,500,000, which results in an Appraised Value per Room of $98,164, a Cut-off Date LTV Ratio and Maturity Date LTV Ratio of 67.6% and 55.1%, respectively, based on the AD1 Hotel Portfolio Mortgage Loan amount net of the $1,000,000 Capitalized Holdback Reserve, and a Cut-off Date LTV Ratio and Maturity Date LTV of 69.1% and 56.5%, respectively, based on the AD1 Hotel Portfolio Mortgage Loan amount. |
The Mortgage Loan. The seventh largest mortgage loan (the “AD1 Hotel Portfolio Mortgage Loan”) is evidenced by a promissory note in the original principal amount of $48,000,000 secured by fee mortgages encumbering five hospitality properties and a leasehold mortgage encumbering a sixth hospitality property (collectively, the “AD1 Hotel Portfolio Properties”).
The Borrowers and the Borrower Sponsor. The borrowers are AD1 Avon Hotels, LLC, a Delaware limited liability company, and AD1 Viera Hotels, LLC, AD1 Fort Myers Hotels, LLC, AD1 Orlando Hotels 2, LLC, AD1 Tally Hotels, LLC and AD1 Savannah Hotels, LLC, each a Florida limited liability company (together, the “AD1 Hotel Portfolio Borrower”). Each individual borrower is a single-purpose entity with two independent directors.
| This is not a research report and was not prepared by any Underwriter’s research department. Please see additional important information and qualifications at the end of this Term Sheet. |
T-92
| Hospitality – Various | Loan #7 | Cut-off Date Balance: | $48,000,000 | |
| Various | AD1 Hotel Portfolio | Cut-off Date LTV: | 64.4% | |
| Various | U/W NCF DSCR: | 1.89x | ||
| U/W NOI Debt Yield: | 13.0% |
The sponsor is AD1 Global, a privately-held hotel acquisition, development and management company based in Hollywood, Florida. AD1 Global’s current hotel portfolio, inclusive of the AD1 Hotel Portfolio Properties, consists of 21 hotels (3,246 rooms) across Florida, Georgia, North Carolina, South Carolina and Connecticut. AD1 Global additionally has three Florida hospitality projects (407 rooms) under construction and three other commercial real estate assets in its portfolio. Jose Daniel Berman, Arie Fridzon and Alex Fridzon are the President and CEO, Executive Vice President, and CFO and Treasurer, respectively, of AD1 Global and serve as the non-recourse carveout guarantors for the AD1 Hotel Portfolio Mortgage Loan.
The Properties.The AD1 Hotel Portfolio Properties are comprised of six hotels located across Florida, Connecticut and Georgia totaling 708 rooms: the Residence Inn Hartford Avon (the “Residence Inn Avon Property”), Holiday Inn Melbourne-Viera Conference Center (the “Holiday Inn Melbourne Property”), Candlewood Suites Fort Myers Sanibel Gateway (the “Candlewood Fort Myers Property”), Comfort Inn International Drive (the “Comfort Inn Orlando Property”), Wyndham Garden Tallahassee Capitol (the “Wyndham Tallahassee Property”) and Holiday Inn Savannah South - I-95 Gateway (the “Holiday Inn Savannah Property”). The AD1 Hotel Portfolio Properties represent five different brands, offering a range of full service, limited service and extended stay accommodations for corporate, leisure and group guests. The AD1 Hotel Portfolio Mortgage Loan is full recourse to the AD1 Hotel Portfolio Mortgage Loan guarantor if any franchise agreement is terminated, surrendered, expires or is otherwise cancelled, in each case without the lender’s prior written consent, until such time as the AD1 Hotel Portfolio Borrower has entered into a replacement franchise agreement.
The following table presents certain information relating to the AD1 Hotel Portfolio Properties:
| AD1 Hotel Portfolio Property Schedule | |||||||
Property Name Address | Property Sub-Type | Allocated Cut-Off Date Balance |
% of Portfolio Cut-Off Date Balance | Year Built/ Renovated | Rooms | Appraised Value | Allocated LTV |
Residence Inn Hartford Avon 55 Simsbury Road Avon, CT 06001 | Extended Stay | $10,051,000 | 20.9% | 2004/2018 | 100 | $14,700,000(1) | 20.3% |
Holiday Inn Melbourne-Viera Conference Center 8298 North Wickham Road Melbourne, FL 32940 | Limited Service | $9,247,500 | 19.3% | 1987/2018 | 128 | $13,500,000 | 19.4% |
Candlewood Suites Fort Myers Sanibel Gateway 9740 Commerce Center Court Fort Myers, FL 33908 | Extended Stay | $8,357,000 | 17.4% | 2009/2019 | 120 | $12,200,000 | 17.6% |
Comfort Inn International Drive 8134 International Drive Orlando, FL 32817 | Limited Service | $7,877,500 | 16.4% | 1999/2016 | 112 | $11,500,000 | 16.5% |
Wyndham Garden Tallahassee Capitol 1355 Apalachee Parkway Tallahassee, FL 32301 | Full Service | $7,672,000 | 16.0% | 1969/2000 | 148 | $11,200,000 | 16.1% |
Holiday Inn Savannah South - I-95 Gateway 11 Gateway Boulevard East Savannah, GA 31419 | Full Service | $4,795,000 | 10.0% | 1999/2016 | 100 | $7,000,000 | 10.1% |
| Total/Weighted Average: | $48,000,000 | 708 | $73,000,000(2) | ||||
| (1) | The Appraised Value for the Residence Inn Hartford Avon property represents the “Upon Completion” value as of October 1, 2020, which assumes completion of $150,000 of anticipated capital improvements, which amount was fully reserved by the lender. The “As-is” Appraised Value for the Residence Inn Hartford Avon property as of October 1, 2019 was $14,100,000. |
| (2) | The Total Appraised Value represents the value for the individual properties as a portfolio as of October 1, 2019 and includes a 5.0% value premium. The aggregate of the “As Is” values for the AD1 Hotel Portfolio Properties is $69,500,000, |
Residence Inn Avon Property.
The Residence Inn Avon Property is a three-story, 100-room, extended stay hotel built on a 5.12-acre site along Simsbury Road, proximate to US 202 in Avon, Connecticut. The Residence Inn Avon Property was constructed in 2004 and features an outdoor pool, fitness center, complimentary hot breakfast area, complimentary evening reception area, guest laundry facilities, business center, sundry shop, approximately 270 SF of dedicated meeting space, complimentary high-speed internet in guestrooms and public spaces, and 107 surface parking spaces.
The guestroom mix at the Residence Inn Avon Property is comprised of 19 two-bedroom suites, 44 one-bedroom suites and 37 studio rooms. The standard studios and suites average 482 SF, larger than a typical hotel room, and feature a work desk and chair, one or two nightstands, a dresser, flat screen televisions, sleeper sofa, and kitchen including a full-sized refrigerator, microwave, two-burner stovetop, dishwasher, coffee/tea maker, and standard cookware. The suites have a separate living area with a pull-out sofa.
According to the borrower sponsor, the last major renovation occurred in 2018, at which time approximately $2,500,000 was spent to replace the soft goods in all guestrooms, completely renovate the registration building and remove one meeting room to enlarge the complimentary breakfast area. $150,000 was budgeted for minor capital improvements relating to a franchisor-required change of ownership property improvement plan, which amount has been fully reserved by the lender.
The property segmentation at the Residence Inn Avon Property is estimated at 60% commercial, 15% group and 25% leisure.
The Residence Inn Avon Property is subject to a franchise agreement with Marriott International, Inc. through December 4, 2034.
Holiday Inn Melbourne Property.
The Holiday Inn Melbourne Property is a five-story, 128-room, limited service hotel built on a 7.15-acre site along North Wickham Road directly off of Interstate 95 in Melbourne, Florida. The Holiday Inn Melbourne Property features a 60-seat restaurant and lounge serving breakfast and dinner, outdoor
| This is not a research report and was not prepared by any Underwriter’s research department. Please see additional important information and qualifications at the end of this Term Sheet. |
T-93
| Hospitality – Various | Loan #7 | Cut-off Date Balance: | $48,000,000 | |
| Various | AD1 Hotel Portfolio | Cut-off Date LTV: | 64.4% | |
| Various | U/W NCF DSCR: | 1.89x | ||
| U/W NOI Debt Yield: | 13.0% |
pool, fitness center, guest laundry facility, business center, sundry shop, approximately 7,800 SF of meeting space including a ballroom, complimentary high-speed internet in the guestrooms and public spaces, and 290 surface parking spaces.
The guestroom mix at the Holiday Inn Melbourne Property is comprised of 48 king rooms, 72 queen/queen rooms, one suite and seven ADA rooms. The guestrooms average approximately 350 SF in size. Standard amenities include a work area with chair, nightstand, dresser, sofa chair, LCD flat screen television, iron and ironing board, microwave, mini-refrigerator, and coffee maker. The suites feature additional living space and a pull-out sofa.
The Holiday Inn Melbourne Property was originally constructed in 1987 and was purchased by the borrower sponsor in August 2016. Following the acquisition, the borrower sponsor completed a major renovation from 2016 to 2018 at a reported cost of approximately $2,550,000, which included the guestrooms and public spaces.
The property segmentation at the Holiday Inn Melbourne Property is estimated at 40% commercial, 25% group and 35% leisure.
The Holiday Inn Melbourne Property is subject to a license agreement with Holiday Hospitality Franchising, LLC through March 14, 2026. The AD1 Hotel Portfolio Mortgage Loan is structured with a PIP Reserve requirement commencing March 1, 2025 unless the license agreement is extended or renewed acceptably to the lender (see“Escrows and Reserves” below).
Candlewood Fort Myers Property.
The Candlewood Fort Myers Property is a four-story, 120-room, extended stay hotel built on a 2.55-acre site along Commerce Center Court on the south side of Summerlin Road, in central Fort Myers, Florida. The Candlewood Fort Myers Property is immediately surrounded by Universal Vacations-vacation homes, Barrington Terrace of Ft Myers Assisted Living Facility and Lee Memorial's HealthPark Medical Center. The Candlewood Fort Myers Property was built in 2009 and features an outdoor pool, fitness center, 24-hour sundry shop, guest laundry facilities, business center, 1,054 SF of meeting space, complimentary high-speed internet access in the guestrooms and public spaces, and 150 surface parking spaces.
The guestroom mix at the Candlewood Fort Myers Property is comprised of 21 one-bedrooms, 60 queen rooms, 32 double rooms and seven ADA rooms. Standard amenities include a work area with an office chair, an armchair, a three-drawer dresser, LCD flat screen television, iron and ironing board, and coffee maker. There is also a kitchen with a refrigerator, microwave, stovetop, and dishwasher. The one-bedroom suites also feature a pull-out sofa.
The borrower sponsor purchased the Candlewood Fort Myers Property in January 2017 and in March 2019, completed a 10-year PIP at a reported cost of approximately $1,950,000, which included updating the guestroom FF&E including cabinetry, bathroom vanities, case goods and lighting, and included renovation of the front desk, replacement of the lobby tile flooring and replacing all televisions.
The property segmentation at the Candlewood Fort Myers Property is estimated at 40% commercial, 40% group and 20% leisure.
The Candlewood Fort Myers Property is subject to a license agreement with Holiday Hospitality Franchising, LLC through March 22, 2032.
Comfort Inn Orlando Property.
The Comfort Inn Orlando Property is a six-story, 112-room, limited service hotel built on a 1.74-acre site along International Drive proximate to Interstate 4 in Orlando, Florida. Immediately east of the Comfort Inn Orlando Property is Orlando’s Official Visitor Center. The Comfort Inn Orlando Property was built in 1999 and features an outdoor pool, complimentary 35-seat breakfast area, guest laundry facility, business center, complimentary high-speed internet access in the guestrooms and public spaces, and 77 surface parking spaces.
The guestroom mix at the Comfort Inn Orlando Property is comprised of 13 king rooms, 43 queen/queen rooms and 56 double/double rooms. Standard amenities include a work area with chair, nightstand, dresser, sofa chair, LCD flat screen television, iron and ironing board, microwave, mini-refrigerator, and coffee maker. The suites feature additional living space and a pull-out sofa.
The Comfort Inn Orlando Property completed a major renovation in 2016 to the guestrooms and public spaces. The borrower sponsor purchased the Comfort Inn Orlando Property in August 2016, and since acquisition has spent approximately $150,000 to renovate the lobby area and build out the sundry shop.
The property segmentation at the Comfort Inn Orlando Property is estimated at 5% commercial, 15% group and 80% leisure.
The Comfort Inn Orlando Property is subject to a franchise agreement with Choice Hotels International, Inc. through August 2, 2036. Both the franchisor and franchisee have a right to terminate the agreement with at least 12 months’ notice on the fifth anniversary (August 2, 2021), tenth anniversary (August 2, 2026) and fifteenth anniversary (August 2, 2031) of the opening date of the Comfort Inn Orlando Property. The AD1 Hotel Portfolio Mortgage Loan is structured with a PIP Reserve requirement commencing on August 1, 2020 and, if applicable, on August 1, 2025 should the franchisor or franchisee exercise its termination right (see“Escrows and Reserves” below).
Wyndham Tallahassee Property.
The Wyndham Tallahassee Property is a four-story, 148-room, full service hotel built on a 3.85-acre site along Apalachee Parkway in Tallahassee, Florida. The Wyndham Tallahassee Property features an Applebee’s (which is leased to the operator), a breakfast restaurant, outdoor pool, fitness center, business center, sundry shop, 2,090 SF of meeting space, complimentary high-speed internet access in the guestrooms and public spaces, and 175 surface parking spaces. The Wyndham Tallahassee Property is comprised of a leasehold interest under a long-term ground lease with Smith Interests General Partnership L.L.P., as ground lessor, that expires December 31, 2115 (see“Ground Lease” below).
| This is not a research report and was not prepared by any Underwriter’s research department. Please see additional important information and qualifications at the end of this Term Sheet. |
T-94
| Hospitality – Various | Loan #7 | Cut-off Date Balance: | $48,000,000 | |
| Various | AD1 Hotel Portfolio | Cut-off Date LTV: | 64.4% | |
| Various | U/W NCF DSCR: | 1.89x | ||
| U/W NOI Debt Yield: | 13.0% |
The guestroom mix at the Wyndham Tallahassee Property is comprised of 48 king rooms, 93 queen/queen rooms and 7 ADA rooms. All standard guestrooms and suites feature a work desk and chair, one or two nightstands, a dresser, flat screen televisions, sofa chair, mini refrigerator, microwave, iron and ironing board and in-room coffee/tea maker.
The AD1 Hotel Portfolio Borrower acquired the Wyndham Tallahassee Property in June 2017 and subsequently completed an approximately $2,350,000 ($15,878/key) franchisor-required major renovation in 2018, which included renovations to all guestrooms and public spaces. $150,000 has been fully reserved by the lender for remaining lobby furnishings.
The property segmentation at the Wyndham Tallahassee Property is estimated at 30% commercial, 10% group and 60% leisure.
The Wyndham Tallahassee Property is subject to a franchise agreement with Wyndham Hotels and Resorts, LLC through September 20, 2032. Both the franchisor and franchisee have a right to terminate the agreement with at least 6 months’ notice on the tenth anniversary (September 20, 2027) of the opening date of the Wyndham Tallahassee Property. The AD1 Hotel Portfolio Mortgage Loan is structured with a PIP Reserve requirement commencing September 1, 2026 should the franchisor or franchisee exercise its termination right (see“Escrows and Reserves” below).
Holiday Inn Savannah Property.
The Holiday Inn Savannah Property is a four-story, 100-room, full service hotel built on a 3.79-acre site along Gateway Boulevard East off of Interstate 95 in Savannah, Georgia. The Holiday Inn Savannah Property is located proximate to the Coastal Georgia Botanical Gardens, Chatham County Wetlands Preserve, Hunter Army Airfield, Armstrong State University and the Savannah Historic District. The Holiday Inn Savannah Property was built in 1999 and features a restaurant and lounge serving breakfast, dinner and drinks, an outdoor pool, fitness center, guest laundry facilities, business center, sundry shop, 1,000 SF of meeting space, complimentary high-speed internet access in the guestrooms and public spaces, and 120 surface parking spaces.
The guestroom mix at the Holiday Inn Savannah Property is comprised of 3 two-bedroom suites, 34 king rooms, 54 queen/queen rooms and 9 ADA rooms. All standard guestrooms and suites feature a work desk and chair, one or two nightstands, a dresser, flat screen televisions, sofa chair, mini refrigerator, microwave, iron and ironing board, and in-room coffee/tea maker. The suites have a separate living area with a pull-out sofa.
The Holiday Inn Savannah Property was last renovated in 2015 and 2016, which included the guestrooms and public areas. The AD1 Hotel Portfolio Borrower acquired the Holiday Inn Savannah Property in March 2017 and is expected to complete a franchisor–required property improvement plan renovation of the corridors, restriping of the parking lot, replacement of the fitness center equipment, and replacement of some guestroom windows at a total budgeted cost of $470,000. $500,000 was reserved by the lender for such renovation work.
The property segmentation at the Holiday Inn Savannah Property is estimated at 20% commercial, 15% group and 65% leisure.
The Holiday Inn Savannah Property is subject to a license agreement with Holiday Hospitality Franchising, LLC through March 6, 2027. The AD1 Hotel Portfolio Mortgage Loan is structured with a PIP Reserve requirement commencing March 1, 2026 unless the license agreement is extended or renewed acceptably to the lender (see“Escrows and Reserves” below).
The Markets.
Avon, CT
The Residence Inn Avon Property is located in the town of Avon, Hartford County, Connecticut, centrally located between Boston, Massachusetts and New York, New York. Primary access to the area is provided by Interstate-84, Interstate-91 and US Route 44. The area is also accessible by Connecticut Transit bus service, Amtrak (Hartford’s Union Station) and Bradley International Airport. Avon is located in the Greater Hartford area, which is home to headquarters and regional offices of various national and international companies such as The Hartford Financial Services Group, Connecticut Children’s Medical Center, Saint Francis Hospital & Medical Center, Travelers, Aetna, The Institute of Living, Lincoln Waste Solutions, Mount Sinai Hospital and Lincoln National Life Insurance Company. Major employers in Hartford County include United Technologies, Otis Elevator, Stanley Black and Decker, Aetna and Carrier.
Demand generators in the area include the Connecticut Convention Center, XL Center, Xfinity Theatre and the University of Connecticut. The Avon Village Center Project, a $200 million mixed-use development, is planned immediately west of the Residence Inn Avon Property and is expected to include 170,000 SF of retail space, 17,000 SF of office space and 114,000 SF of residential space when complete.
According to the appraisal, the estimated 2019 population within a one-, three- and five-mile radius of the Residence Inn Avon Property was 1,433, 18,238 and 64,819, respectively, and the estimated 2019 average household income within the same radii was $98,972, $159,663 and $143,743, respectively.
| This is not a research report and was not prepared by any Underwriter’s research department. Please see additional important information and qualifications at the end of this Term Sheet. |
T-95
| Hospitality – Various | Loan #7 | Cut-off Date Balance: | $48,000,000 | |
| Various | AD1 Hotel Portfolio | Cut-off Date LTV: | 64.4% | |
| Various | U/W NCF DSCR: | 1.89x | ||
| U/W NOI Debt Yield: | 13.0% |
The following table presents the primary competitive properties to the Residence Inn Avon Property:
| Competitive Property Summary(1) | ||||||||
| Property | Year Built | Rooms | Commercial | Group | Leisure | 2018 Occupancy | 2018 ADR | 2018 RevPAR |
| Residence Inn Avon Property | 2004 | 100 | 60% | 15% | 25% | 66.4% | $153.80 | $102.18 |
| Avon Old Farms Hotel | 1956 | 160 | 20% | 30% | 50% | 50-55% | $120-125 | $60-65 |
| Homewood Suites Hartford - Farmington | 1999 | 121 | 60% | 15% | 25% | 65-70% | $145-150 | $95-100 |
| Hartford Marriott Farmington | 1982 | 381 | 40% | 40% | 20% | 60-65% | $140-145 | $85-90 |
| Hampton Inn & Suites Hartford/Farmington | 2009 | 124 | 55% | 20% | 25% | 65-70% | $130-135 | $85-90 |
| Extended Stay America – Hartford – Farmington | 1998 | 91 | 55% | 5% | 40% | 60-65% | $105-110 | $60-65 |
| Courtyard Hartford Farmington | 2005 | 119 | 55% | 20% | 25% | 65-70% | $130-135 | $85-90 |
| Subtotal/Average | 1,096 | 46% | 26% | 28% | 62.26% | $136.57 | $85.02 | |
Source: Appraisal.
| (1) | The variances between the underwriting, the appraisal and industry report data with respect to occupancy, ADR and RevPAR are attributable to variances in reporting methodologies and/or timing differences. |
The following table presents certain information relating to the Occupancy, ADR and RevPar of the Residence Inn Avon Property and its competitive set:
| Historical Occupancy, ADR, RevPAR(1) | |||||||||
| Competitive Set(2) | Residence Inn Avon Property | Penetration Factor | |||||||
| Year | Occupancy | ADR | RevPAR | Occupancy | ADR | RevPAR | Occupancy | ADR | RevPAR |
| 2016 | 60.5% | $129.66 | $78.50 | 69.5% | $150.49 | $104.54 | 114.7% | 116.1% | 133.2% |
| 2017 | 61.9% | $131.34 | $81.30 | 68.8% | $147.94 | $101.82 | 111.2% | 112.6% | 125.2% |
| 2018 | 61.8% | $134.66 | $83.19 | 66.4% | $154.59 | $102.71 | 107.5% | 114.8% | 123.5% |
| 1/31/2020 TTM | 63.9% | $133.12 | $85.10 | 75.9% | $157.52 | $119.59 | 118.8% | 118.3% | 140.5% |
Source: Third party hospitality research reports.
| (1) | The variances between the underwriting, the appraisal and industry report data with respect to occupancy, ADR and RevPAR are attributable to variances in reporting methodologies and/or timing differences. |
| (2) | The 1/31/2020 TTM Competitive Set included Marriott Hartford Farmington, Avon Old Farms Hotel, Extended Stay America Hartford Farmington, Homewood Suites by Hilton Farmington, Courtyard Hartford Farmington and Hampton Inn Hartford Farmington. |
Melbourne, FL
The Holiday Inn Melbourne Property is located in a master planned community called Viera, adjacent to Melbourne, Brevard County, Florida. Melbourne is located in southeastern Florida, approximately 57 miles southeast of Orlando. Primary access to the area is provided by Interstate-95. The area is also accessible by the Florida East Coast Railway Line and Orlando Melbourne International Airport. The area is home to headquarters and regional offices of various national and international companies such as Lockheed Martin Corp., Northrop Grumman Corporation, U.S. Department of Defense, NASA, Health First, Inc., and Harris Corporation. Major employers in Brevard County include Brevard County School Board, Health First, Inc., Harris Corporation, Publix Supermarkets, Inc. and Wal-Mart Associations, Inc.
Demand generators in the area include the Florida Institute of Technology, Eastern Florida State College, Florida Tech Research Park, Patrick Air Force Base, The Kennedy Space Center Visitor Complex at Cape Canaveral and Space Coast Stadium. There is also tourism demand driven by nearby Orlando and Port Canaveral.
According to the appraisal, the estimated 2019 population within a one-, three- and five-mile radius of the Holiday Inn Melbourne Property was 10,228, 32,333 and 63,104, respectively, and the estimated 2019 average household income within the same radii was $85,028, $88,509 and $90,122, respectively.
The appraisal identified one proposed hotel, a 118-room Home2Suites by Hilton in Viera, that upon opening (estimated in April 2020) would be directly competitive with the Holiday Inn Melbourne Property.
| This is not a research report and was not prepared by any Underwriter’s research department. Please see additional important information and qualifications at the end of this Term Sheet. |
T-96
| Hospitality – Various | Loan #7 | Cut-off Date Balance: | $48,000,000 | |
| Various | AD1 Hotel Portfolio | Cut-off Date LTV: | 64.4% | |
| Various | U/W NCF DSCR: | 1.89x | ||
| U/W NOI Debt Yield: | 13.0% |
The following table presents the primary competitive properties to the Holiday Inn Melbourne Property:
| Competitive Property Summary(1) | |||||||||
| Property | Year Built | Rooms | Commercial | Group | Leisure | 2018 Occupancy | 2018 ADR | 2018 RevPAR | |
| Holiday Inn Melbourne Property | 1987 | 128 | 40% | 25% | 35% | 71.5% | $116.42 | $83.20 | |
| Holiday Inn Express & Suites West Melbourne(2) | 2018 | 100 | 40% | 25% | 35% | 70-75% | $120-125 | $80-85 | |
| Holiday Inn Express & Suites Cocoa | 2003 | 75 | 40% | 15% | 45% | 75-80% | $125-130 | $95-100 | |
| Fairfield Inn & Suites by Marriott Melbourne Viera Town Center(2) | 2018 | 116 | 50% | 15% | 35% | 75-80% | $125-130 | $95-100 | |
| Hampton In Melbourne-Viera | 2007 | 88 | 40% | 15% | 45% | 75-80% | $125-130 | $95-100 | |
| La Quinta Inn & Suites by Wyndham Melbourne Viera | 1995 | 106 | 35% | 10% | 55% | 75-80% | $90-95 | $70-75 | |
| Subtotal/Average | 613 | 41% | 18% | 41% | 74.88% | $116.03 | $86.88 | ||
Source: Appraisal.
| (1) | The variances between the underwriting, the appraisal and industry report data with respect to occupancy, ADR and RevPAR are attributable to variances in reporting methodologies and/or timing differences. |
| (2) | The Holiday Inn Express & Suites West Melbourne opened in January 2018 and the Fairfield Inn & Suites by Marriott Melbourne Viera Town Center opened in May 2018. |
The following table presents certain information relating to the Occupancy, ADR and RevPar of the Holiday Inn Melbourne Property and its competitive set:
| Historical Occupancy, ADR, RevPAR(1) | |||||||||
| Competitive Set(2) | Holiday Inn Melbourne Property | Penetration Factor | |||||||
| Year | Occupancy | ADR | RevPAR | Occupancy | ADR | RevPAR | Occupancy | ADR | RevPAR |
| 2016 | 80.4% | $104.49 | $83.99 | 64.4% | $94.13 | $60.62 | 80.1% | 90.1% | 72.2% |
| 2017 | 79.9% | $109.36 | $87.34 | 73.5% | $104.85 | $77.01 | 92.0% | 95.9% | 88.2% |
| 2018 | 76.4% | $117.60 | $89.81 | 71.3% | $116.10 | $82.76 | 93.3% | 98.7% | 92.1% |
| 1/31/2020 TTM | 83.3% | $118.50 | $98.67 | 77.7% | $115.32 | $89.65 | 93.4% | 97.3% | 90.9% |
Source: Third party hospitality research reports.
| (1) | The variances between the underwriting, the appraisal and industry report data with respect to occupancy, ADR and RevPAR are attributable to variances in reporting methodologies and/or timing differences. |
| (2) | The 1/31/2020 TTM Competitive Set included La Quinta Inns & Suites Melbourne Viera, Holiday Inn Express & Suites Cocoa, Hampton Inn Melbourne Viera, Holiday Inn Express & Suites West Melbourne and Fairfield Inn & Suites Melbourne Viera Town Center. |
Fort Myers, FL
The Candlewood Fort Myers Property is located in Fort Myers, Lee County, Florida, within the Cape Coral-Fort Myers, FL metropolitan statistical area (“MSA”). Primary access to the area is provided by Interstate-75 and U.S. Highway 41. The area is also accessible by the Southwest Florida International Airport. Major local industries for Lee County include healthcare and tourism. Major employers in the MSA include Lee Memorial Health System, Publix Super Markets, Inc. and Wal-Mart Stores Inc. In 2015, Hertz Global Holdings relocated its headquarters to nearby Estero, Florida, building a $70 million campus.
Demand generators in the area include Downtown Fort Myers, Fort Myers Beach, Sanibel and Captiva Islands, Pine Island, Bonita Springs, Estero, Major League Baseball Spring Training and Golisano Children’s Hospital of Southwest Florida. There are also several universities in the area, including Barry University, Florida SouthWestern State College and Florida Gulf Coast University, among others.
The appraisal identified one proposed hotel, a 120-room Holiday Inn Express that is under construction on Summerlin Road, that would be directly competitive with the Candlewood Fort Myers Property.
The following table presents the primary competitive properties to the Candlewood Fort Myers Property:
| Competitive Property Summary(1) | ||||||||
| Property | Year Built | Rooms | Commercial | Group | Leisure | 2018 Occupancy | 2018 ADR | 2018 RevPAR |
| Candlewood Fort Myers Property | 2009 | 120 | 40% | 40% | 20% | 70.1% | $83.90 | $58.82 |
| Fairfield Inn & Suites Fort Myers Cape Coral | 1998 | 100 | 40% | 25% | 35% | 75-80% | $130-135 | $95-100 |
| La Quinta Inn & Suites Ft. Myers – Sanibel Gateway | 1986 | 158 | 30% | 40% | 30% | N/A | N/A | N/A |
| Best Western Fort Myers Inn & Suites | 1990 | 103 | 30% | 30% | 40% | 60-65% | $90-95 | $55-60 |
| Hampton Inn & Suites Fort Myers Beach/Sanibel Gateway | 2001 | 120 | 40% | 25% | 35% | 70-75% | $135-140 | $95-100 |
| Subtotal/Average | 601 | 36% | 33% | 32% | 69.84% | $110.60 | $77.25 | |
Source: Appraisal.
| (1) | The variances between the underwriting, the appraisal and industry report data with respect to occupancy, ADR and RevPAR are attributable to variances in reporting methodologies and/or timing differences. |
| This is not a research report and was not prepared by any Underwriter’s research department. Please see additional important information and qualifications at the end of this Term Sheet. |
T-97
| Hospitality – Various | Loan #7 | Cut-off Date Balance: | $48,000,000 | |
| Various | AD1 Hotel Portfolio | Cut-off Date LTV: | 64.4% | |
| Various | U/W NCF DSCR: | 1.89x | ||
| U/W NOI Debt Yield: | 13.0% |
The following table presents certain information relating to the Occupancy, ADR and RevPar of the Candlewood Fort Myers Property and its competitive set:
| Historical Occupancy, ADR, RevPAR(1) | |||||||||
| Competitive Set(2) | Candlewood Fort Myers Property | Penetration Factor | |||||||
| Year | Occupancy | ADR | RevPAR | Occupancy | ADR | RevPAR | Occupancy | ADR | RevPAR |
| 2016 | 66.2% | $99.27 | $65.75 | 79.0% | $81.64 | $64.45 | 119.2% | 82.2% | 98.0% |
| 2017 | 71.3% | $101.83 | $72.62 | 73.9% | $87.26 | $64.49 | 103.6% | 85.7% | 88.8% |
| 2018 | 71.1% | $107.37 | $76.31 | 70.1% | $83.90 | $58.82 | 98.7% | 78.1% | 77.1% |
| 1/31/2020 TTM | 61.0% | $109.57 | $66.79 | 74.5% | $83.92 | $62.49 | 122.2% | 76.6% | 93.6% |
Source: Third party hospitality research reports.
| (1) | The variances between the underwriting, the appraisal and industry report data with respect to occupancy, ADR and RevPAR are attributable to variances in reporting methodologies and/or timing differences. |
| (2) | The 1/31/2020 TTM Competitive Set included Best Western Fort Myers Inn & Suites, La Quinta Inns & Suites Fort Myers Sanibel Gateway, Hampton by Hilton Inn & Suites Fort Myers Beach/Sanibel Gateway and Suburban Extended Stay Hotel Fort Myers. |
Orlando, FL
The Comfort Inn Orlando Property is located in Orlando, Orange County, Florida. Primary access to the area is provided by Interstate-4, Florida’s Turnpike and U.S. Route 441. The area is also accessible by SunRail commuter rail, Orlando International Airport, Orlando Sanford International Airport and Orlando Executive Airport. The surrounding area is home to headquarters and regional offices of various national and international companies and major employers, such as Walt Disney World Resort, Universal Orlando (Comcast), Adventist Health Systems/Florida Hospital and Lockheed Martin.
Demand generators in the area include the Orange County Convention Center, Disney World, Universal Studios, SeaWorld, International Drive, Skyplex and two large outlet malls.
According to the appraisal, the estimated 2019 population within a one-, three- and five-mile radius of the Comfort Inn Orlando Property was 4,303, 58,188, and 159,179, respectively, and the estimated 2019 average household income within the same radii was $76,227, $92,439 and $73,033, respectively.
The following table presents the primary competitive properties to the Comfort Inn Orlando Property:
| Competitive Property Summary(1) | ||||||||
| Property | Year Built | Rooms | Commercial | Group | Leisure | 2018 Occupancy | 2018 ADR | 2018 RevPAR |
| Comfort Inn Orlando Property | 1999 | 112 | 5% | 15% | 80% | 91.5% | $81.26 | $74.35 |
| Best Western Plus Universal Inn | 1998 | 70 | 5% | 15% | 80% | 90-95% | $85-90 | $75-80 |
| Country Inn & Suites by Radisson, Orlando Universal | 2000 | 170 | 5% | 20% | 75% | 75-80% | $80-85 | $60-65 |
| Fairfield Inn & Suites Orlando International Drive | 2001 | 160 | 15% | 20% | 65% | 90-95% | $120-125 | $110-115 |
| Comfort Inn & Suites Universal Convention Center | 2001 | 200 | 10% | 20% | 70% | 75-80% | $80-85 | $60-65 |
| Holiday Inn Express & Suites Orlando – International Drive | 2009 | 156 | 15% | 20% | 65% | 85-90% | $110-115 | $95-100 |
| Subtotal/Average | 868 | 10% | 19% | 71% | 83.47% | $94.86 | $79.17 | |
Source: Appraisal.
| (1) | The variances between the underwriting, the appraisal and industry report data with respect to occupancy, ADR and RevPAR are attributable to variances in reporting methodologies and/or timing differences. |
The following table presents certain information relating to the Occupancy, ADR and RevPar of the Comfort Inn Orlando Property and its competitive set:
| Historical Occupancy, ADR, RevPAR(1) | |||||||||
| Competitive Set(2) | Comfort Inn Orlando Property | Penetration Factor | |||||||
| Year | Occupancy | ADR | RevPAR | Occupancy | ADR | RevPAR | Occupancy | ADR | RevPAR |
| 2016 | 79.3% | $92.56 | $73.36 | 76.3% | $71.38 | $54.46 | 96.3% | 77.1% | 74.2% |
| 2017 | 83.6% | $97.61 | $81.56 | 83.5% | $76.01 | $63.49 | 100.0% | 77.9% | 77.8% |
| 2018 | 82.2% | $97.20 | $79.91 | 91.5% | $81.26 | $74.31 | 111.2% | 83.6% | 93.0% |
| 1/31/2020 TTM | 80.3% | $92.59 | $74.33 | 84.3% | $85.30 | $71.89 | 105.0% | 92.1% | 96.7% |
Source: Third party hospitality research reports.
| (1) | The variances between the underwriting, the appraisal and industry report data with respect to occupancy, ADR and RevPAR are attributable to variances in reporting methodologies and/or timing differences. |
| (2) | The 1/31/2020 TTM Competitive Set included Best Western Plus Universal Inn, Country Inn & Suites Orlando, Fairfield Inn & Suites Orlando International Drive Convention Center, Comfort Inn & Suites Near Universal Orlando Resort and Holiday Inn Express & Suites Orlando International Drive. |
| This is not a research report and was not prepared by any Underwriter’s research department. Please see additional important information and qualifications at the end of this Term Sheet. |
T-98
| Hospitality – Various | Loan #7 | Cut-off Date Balance: | $48,000,000 | |
| Various | AD1 Hotel Portfolio | Cut-off Date LTV: | 64.4% | |
| Various | U/W NCF DSCR: | 1.89x | ||
| U/W NOI Debt Yield: | 13.0% |
Tallahassee, FL
The Wyndham Tallahassee Property is located two miles east of downtown Tallahassee, Florida and approximately five miles from Capital Circle Northeast, which provides access to Interstate 10. Primary access to the area is provided by Interstate-10. The area is also accessible by the Tallahassee International Airport. The City of Tallahassee is the state capitol of Florida, with government business comprising over 33% of the metropolitan area’s employment.
Demand generators in the area include downtown Tallahassee, Florida State University, Florida A&M University and the Civic Center.
According to the appraisal, the estimated 2019 population within a one-, three- and five-mile radius of the Wyndham Tallahassee Property was 6,582, 81,054, and 166,410, respectively, and the estimated 2019 average household income within the same radii was $64,013, $52,260 and $53,049, respectively.
The following table presents the primary competitive properties to the Wyndham Tallahassee Property:
| Competitive Property Summary(1) | |||||||||
| Property | Year Built | Rooms | Commercial | Group | Leisure | 2018 Occupancy | 2018 ADR | 2018 RevPAR | |
| Wyndham Tallahassee Property | 1969 | 148 | 30% | 10% | 60% | 45.4% | $92.57 | $42.03 | |
| Baymont Inn & Suites Tallahassee Central | 1986 | 134 | 35% | 10% | 55% | 65-70% | $95-100 | $60-65 | |
| Best Western Tallahassee Downtown Inn & Suites | 1989 | 74 | 35% | 15% | 50% | 70-75% | $105-110 | $75-80 | |
| Comfort Suites Tallahassee Downtown | 1999 | 64 | 40% | 10% | 50% | 65-70% | $115-120 | $75-80 | |
| SpringHill Suites Tallahasee Central | 2008 | 88 | 30% | 15% | 55% | 70-75% | $110-115 | $80-85 | |
| Holiday Inn Tallahassee E Capitol – Univ | 2018 | 103 | 30% | 15% | 55% | 70-75% | $115-120 | $80-85 | |
| Hampton Inn Tallahassee - Central | 1999 | 78 | 35% | 10% | 55% | 70-75% | $115-120 | $80-85 | |
| Subtotal/Average | 689 | 33% | 12% | 55% | 63.45% | $104.22 | $66.13 | ||
Source: Appraisal.
| (1) | The variances between the underwriting, the appraisal and industry report data with respect to occupancy, ADR and RevPAR are attributable to variances in reporting methodologies and/or timing differences. |
The following table presents certain information relating to the Occupancy, ADR and RevPar of the Wyndham Tallahassee Property and its competitive set:
| Historical Occupancy, ADR, RevPAR(1) | |||||||||
| Competitive Set(2) | Wyndham Tallahassee Property | Penetration Factor | |||||||
| Year | Occupancy | ADR | RevPAR | Occupancy | ADR | RevPAR | Occupancy | ADR | RevPAR |
| 2016 | 58.4% | $100.25 | $58.55 | 49.2% | $92.53 | $45.53 | 84.3% | 92.3% | 77.8% |
| 2017 | 63.5% | $102.82 | $65.27 | 48.6% | $93.16 | $45.28 | 76.6% | 90.6% | 69.4% |
| 2018 | 70.4% | $108.30 | $76.29 | 43.9% | $95.65 | $42.03 | 62.4% | 88.3% | 55.1% |
| 1/31/2020 TTM | 66.5% | $108.40 | $72.10 | 56.2% | $101.95 | $57.32 | 84.5% | 94.1% | 79.5% |
Source: Third party hospitality research reports.
| (1) | The variances between the underwriting, the appraisal and industry report data with respect to occupancy, ADR and RevPAR are attributable to variances in reporting methodologies and/or timing differences. |
| (2) | The 1/31/2020 TTM Competitive Set included Baymont Inn & Suites Tallahassee Central, Best Western Tallahassee Downtown Inn & Suites, Comfort Suites Tallahassee Downtown, SpringHill Suites Tallahassee Central and Holiday Inn Tallahassee E Capitol-Univ. |
Savannah, GA
The Holiday Inn Savannah Property is located In Savannah, Chatham County, Georgia. Primary access to the area is provided by Harry S Truman Parkway, Veterans Parkway, Interstate-95 and Interstate-16. The area is also accessible by the Savannah/Hilton Head International Airport. Savannah’s economy has grown due to the increased use of the Port of Savannah, an active tourism business, retail attractions, a diversified industrial base, and the nearby military complexes of Fort Stewart and Hunter Army Airfield. Major employers in Savannah include Memorial University Medical Center, St. Joseph’s/Candler Health System, Walmart, Kroger, SSA Cooper and Marine Terminals Corp.
Demand generators in the area include the Port of Savannah, Savannah International Trade and Convention Center, the Savannah Civic Center, Coastal Georgia Botanical Gardens, Chatham County Wetlands Preserve, Hunter Army Airfield, Armstrong State University, St. Joseph’s Hospital, Savannah State University, the Savannah Historic District and Savannah College of Art and Design. As of the 2018 visitor statistics, tourism spending in Savannah had increased 24.3% over a five year period.
According to the appraisal, the estimated 2019 population within a one-, three- and five-mile radius of the Holiday Inn Savannah Property was 3,194, 13,679 and 41,384, respectively, and the estimated 2019 average household income within the same radii was $66,675, $60,042 and $72,543, respectively.
| This is not a research report and was not prepared by any Underwriter’s research department. Please see additional important information and qualifications at the end of this Term Sheet. |
T-99
| Hospitality – Various | Loan #7 | Cut-off Date Balance: | $48,000,000 | |
| Various | AD1 Hotel Portfolio | Cut-off Date LTV: | 64.4% | |
| Various | U/W NCF DSCR: | 1.89x | ||
| U/W NOI Debt Yield: | 13.0% |
The following table presents the primary competitive properties to the Holiday Inn Savannah Property:
| Competitive Property Summary(1) | ||||||||||||||
| Property | Year Built | Rooms | Commercial | Group | Leisure | 2018 Occupancy | 2018 ADR | 2018 RevPAR | ||||||
| Holiday Inn Savannah Property | 1999 | 100 | 20% | 15% | 65% | 69.6% | $97.39 | $67.82 | ||||||
| Fairfield Inn & Suites Savannah I-95 South | 1999 | 80 | 30% | 20% | 50% | 70-75% | $115-120 | $80-85 | ||||||
| Clarion Suites Conference Center Near I-95 | 2000 | 95 | 30% | 25% | 45% | 65-70% | $75-80 | $45-50 | ||||||
| Holiday Inn Express Savannah South I-95 Richmond Hill | 2005 | 65 | 25% | 10% | 65% | 70-75% | $100-105 | $70-75 | ||||||
| Best Western Premier Savannah Airport Pooler | 2005 | 102 | 35% | 10% | 55% | 75-80% | $115-120 | $85-90 | ||||||
| SpringHill Suites Savannah I-95 South | 2006 | 86 | 25% | 15% | 60% | 65-70% | $105-110 | $65-70 | ||||||
| Hampton Inn & Suites Savannah I-95 South Gateway | 2006 | 92 | 25% | 20% | 55% | 70-75% | $130-135 | $90-95 | ||||||
| Comfort Suites Gateway Savannah | 2007 | 90 | 20% | 15% | 65% | 65-70% | $100-105 | $65-70 | ||||||
| Subtotal/Average | 710 | 26% | 16% | 57% | 69.36% | $105.21 | $72.97 | |||||||
Source: Appraisal.
| (1) | The variances between the underwriting, the appraisal and industry report data with respect to occupancy, ADR and RevPAR are attributable to variances in reporting methodologies and/or timing differences. |
The following table presents certain information relating to the Occupancy, ADR and RevPar of the Holiday Inn Savannah Property and its competitive set:
| Historical Occupancy, ADR, RevPAR(1) | |||||||||
| Competitive Set(2) | Holiday Inn Savannah Property | Penetration Factor | |||||||
| Year | Occupancy | ADR | RevPAR | Occupancy | ADR | RevPAR | Occupancy | ADR | RevPAR |
| 2016 | 73.8% | $103.95 | $76.73 | 65.7% | $101.27 | $66.50 | 88.9% | 97.4% | 86.7% |
| 2017 | 72.2% | $106.76 | $77.08 | 70.0% | $98.37 | $68.90 | 97.0% | 92.1% | 89.4% |
| 2018 | 69.3% | $106.42 | $73.80 | 69.6% | $97.45 | $67.85 | 100.4% | 91.6% | 91.9% |
| 1/31/2020 TTM | 64.2% | $102.18 | $65.65 | 70.5% | $92.88 | $65.48 | 109.7% | 90.9% | 99.7% |
Source: Third party hospitality research reports.
| (1) | The variances between the underwriting, the appraisal and industry report data with respect to occupancy, ADR and RevPAR are attributable to variances in reporting methodologies and/or timing differences. |
| (2) | The 1/31/2020 TTM Competitive Set included Fairfield Inn & Suites Savannah I 95 South, Clarion Suites Conference Center Near I 95, Holiday Inn Express Savannah South I 95 Richmond Hill, Pooler Inn, SpringHill Suites Savannah I-95 South, Hampton Inn Savannah I 95 South Gateway and Comfort Suites Gateway Savannah. |
| This is not a research report and was not prepared by any Underwriter’s research department. Please see additional important information and qualifications at the end of this Term Sheet. |
T-100
| Hospitality – Various | Loan #7 | Cut-off Date Balance: | $48,000,000 | |
| Various | AD1 Hotel Portfolio | Cut-off Date LTV: | 64.4% | |
| Various | U/W NCF DSCR: | 1.89x | ||
| U/W NOI Debt Yield: | 13.0% |
Operating History and Underwritten Net Cash Flow.The following table presents certain information relating to the historical operating performance and Underwritten Net Cash Flow of the AD1 Hotel Portfolio Properties:
| Cash Flow Analysis(1) | |||||||||
| 2018 | 9/30/2019 TTM | UW | UW per Room | ||||||
| Rooms Revenue | $17,968,398 | $19,398,946 | $19,398,946 | $27,399.64 | |||||
| Food & Beverage | $819,391 | $993,342 | $993,342 | $1,403.03 | |||||
| Other Income | $633,592 | $605,660 | $605,660 | $855.45 | |||||
| Total Revenue | $19,421,381 | $20,997,948 | $20,997,948 | $29,658.12 | |||||
| Real Estate Taxes | $647,725 | $706,126 | $900,917 | $1,272.48 | |||||
| Insurance | $394,638 | $416,312 | $386,000 | $545.20 | |||||
| Other Operating expenses | $12,779,816 | $13,615,072 | $13,616,127 | $19,231.82 | |||||
| Total Expenses | $13,822,179 | $14,737,510 | $14,903,044 | $21,049.50 | |||||
| Net Operating Income | $5,599,202 | $6,260,438 | $6,094,904 | $8,608.62 | |||||
| FF&E | $625,537 | $600,787 | $839,919 | $1,186.33 | |||||
| Ground Rent | $101,555 | $102,000 | $107,130 | $151.31 | |||||
| Net Cash Flow | $4,872,110 | $5,557,651 | $5,147,855 | $7,270.98 | |||||
| NOI DSCR (IO) | 2.94x | 3.28x | 3.20x | ||||||
| NOI DSCR (P&I) | 2.06x | 2.30x | 2.24x | ||||||
| NCF DSCR (IO) | 2.56x | 2.92x | 2.70x | ||||||
| NCF DSCR (P&I) | 1.79x | 2.04x | 1.89x | ||||||
| NOI Debt Yield(2) | 11.9% | 13.3% | 13.0% | ||||||
| NCF Debt Yield(2) | 10.4% | 11.8% | 11.0% | ||||||
| (1) | Prior historical information is not available because the AD1 Hotel Portfolio Properties were acquired separately between 2016 and 2019. |
| (2) | UW NOI Debt Yield and UW NCF Debt Yield are shown based on a loan amount of $47,000,000, which is the AD1 Hotel Portfolio Mortgage Loan amount net of the $1,000,000 Capitalized Holdback Reserve held by the lender. The UW NOI Debt Yield and UW NCF Debt Yield based on the AD1 Hotel Portfolio Mortgage Loan amount of $48,000,000 are 12.7% and 10.7%, respectively. |
Escrows and Reserves.
Real Estate Tax Reserve- The AD1 Hotel Portfolio Borrower deposited at loan origination $75,000 for real estate taxes and is required to deposit monthly 1/12 of the annual estimated real estate taxes (currently $75,000).
Insurance Reserve- The AD1 Hotel Portfolio Borrower is required to deposit monthly 1/12 of the annual estimated insurance premiums, unless waived (as currently) due to a blanket policy being in place.
Immediate Repair Reserve- The AD1 Hotel Portfolio Borrower deposited at loan origination $61,063, which represents 125% of the estimated cost for the completion of immediate repairs.
FF&E Reserve- The AD1 Hotel Portfolio Borrower is required to deposit monthly 1/12 of 4.0% of the greater of gross revenue or $69,993 for replacements of furniture, fixtures and equipment.
PIP Reserve –The AD1 Hotel Portfolio Borrower deposited at loan origination $800,000 to fund the scheduled PIP work at the Residence Inn Avon ($150,000), Wyndham Tallahassee Property ($150,000) and Holiday Inn Savannah Property ($500,000).
Within 30 days of any notification from any franchisor that any PIP is required for either the Residence Inn Avon Property or the Candlewood Fort Myers Property, the AD1 Hotel Portfolio Borrower will be required to deposit 120% of the estimated amount required to complete such PIP work.
Unless a Franchise Agreement Extension (as defined below) has occurred, on August 1, 2020 and, if applicable, on August 1, 2025 (the dates when notice is required for any franchisor or franchisee termination option under the Comfort Inn Orlando Property’s franchise agreement), the AD1 Hotel Portfolio Borrower is required to deposit to the PIP Reserve the amount that when added to the FF&E Reserve would equal the amountset forth in any PIP budget for the Comfort Inn Orlando Property (or if no approved budget is available, $1,120,000 ($10,000/key)) either as cash or a letter of credit, or through commencement of monthly deposits of 1/12th of theamount budgeted until the full budgeted amount has been reserved.
Unless a Franchise Agreement Extension has occurred, on March 1, 2025 (one year prior to the expiration of the Holiday Inn Melbourne Property’s license agreement), the AD1 Hotel Portfolio Borrower is required to deposit to the PIP Reserve the amount that when added to the FF&E Reserve would equal the amountset forth in any PIP budget for the Holiday Inn Melbourne Property (or if no approved budget is available, $1,280,000 ($10,000/key)) either as cash or a letter of credit, or through commencement of monthly deposits of 1/12th of theamount budgeted until the full budgeted amount has been reserved.
| This is not a research report and was not prepared by any Underwriter’s research department. Please see additional important information and qualifications at the end of this Term Sheet. |
T-101
| Hospitality – Various | Loan #7 | Cut-off Date Balance: | $48,000,000 | |
| Various | AD1 Hotel Portfolio | Cut-off Date LTV: | 64.4% | |
| Various | U/W NCF DSCR: | 1.89x | ||
| U/W NOI Debt Yield: | 13.0% |
Unless a Franchise Agreement Extension has occurred, on March 1, 2026 (one year prior to the expiration of the Holiday Inn Savannah Property’s license agreement), the AD1 Hotel Portfolio Borrower is required to deposit to the PIP Reserve the amount that when added to the FF&E Reserve would equal the amountset forth in any PIP budget for the Holiday Inn Savannah Property (or if no approved budget is available, $1,000,000 ($10,000/key)) either as cash or a letter of credit, or through commencement of monthly deposits of 1/12th of theamount budgeted until the full budgeted amount has been reserved.
Unless a Franchise Agreement Extension has occurred, on September 1, 2026 (the date when notice is required for any franchisor or franchisee termination option under the Wyndham Tallahassee Property’s franchise agreement), the AD1 Hotel Portfolio Borrower is required to deposit to the PIP Reserve the amount that when added to the FF&E Reserve would equal the amountset forth in any PIP budget for the Wyndham Tallahassee Property (or if no approved budget is available, $1,480,000 ($10,000/key)) either as cash or a letter of credit, or through commencement of monthly deposits of 1/12th of theamount budgeted until the full budgeted amount has been reserved.
A “Franchise Agreement Extension” means the franchisor has extended the term or renewed the respective license or franchise agreement in substantially the same form and acceptable to the lender, the AD1 Hotel Portfolio Borrower has satisfied all obligations and paid all costs related to such extension or renewal, and neither the franchisor nor franchisee has exercised any early termination right under the related franchise agreement.
Capitalized Holdback Reserve- The AD1 Hotel Portfolio Borrower deposited at loan origination $1,000,000 to the Capitalized Holdback Reserve. Provided no event of default is continuing, funds in the Capitalized Holdback Reserve will be disbursed to the AD1 Hotel Portfolio Borrower when the trailing twelve month debt yield reaches 11.0%. If the disbursement request is not delivered within the first two years following the securitization of the AD1 Hotel Portfolio Mortgage Loan, the funds in the Capitalized Holdback Reserve are required to be used to partially defease the AD1 Hotel Portfolio Mortgage Loan.
Ground Rent Reserve- The AD1 Hotel Portfolio Borrower deposited at loan origination $16,554 to the Ground Rent Reserve to pay ground rent relating to the Wyndham Tallahassee Property. During the continuance of a Cash Sweep Period (as defined below) the AD1 Hotel Portfolio Borrower is required to deposit monthly 1/12 of the annual ground rent due or such higher amount necessary to accumulate sufficient funds to pay all such ground rent at least 60 days prior to the date that the ground rent would become delinquent.
Lockbox and Cash Management. The AD1 Hotel Portfolio Mortgage Loan is structured with a hard lockbox and springing cash management. Revenues from the AD1 Hotel Portfolio Properties are required to be deposited directly into the lockbox account or, if received by the AD1 Hotel Portfolio Borrower or the property manager, deposited within one business day of receipt. Upon the occurrence and continuance of a Cash Sweep Period, funds in the lockbox account are required to be transferred daily to the lender-controlled cash management account and disbursed in accordance with the AD1 Hotel Portfolio Mortgage Loan documents. During the occurrence and continuance of a Cash Sweep Period, all excess cash is required to be held by the lender as additional collateral for the AD1 Hotel Portfolio Mortgage Loan.
A “Cash Sweep Period” will (i) occur during the continuance of an event of default, (ii) commence when the trailing twelve month debt service coverage ratio is less than 1.35x for one calendar quarter and last until the trailing twelve month debt service coverage ratio is at least 1.40x for two consecutive calendar quarters, and (iii) commence when any individual AD1 Hotel Portfolio Borrower terminates its franchise agreement without the lender’s consent or when any franchisor terminates its franchise agreement with such individual AD1 Hotel Portfolio Borrower, and last until such franchisor is replaced pursuant to a replacement franchise agreement for a period of time reasonably acceptable to the lender.
Additional Secured Indebtedness (not including trade debts). Not permitted.
Mezzanine Loan and Preferred Equity.Not permitted.
Release of Property.Any time after the first two years following the securitization of the AD1 Hotel Portfolio Mortgage Loan, in connection with a third party sale, the AD1 Hotel Portfolio Mortgage Loan documents permit the partial release of any one or more of the Candlewood Fort Myers Property, Wyndham Tallahassee Property and Holiday Inn Savannah Property through partial defeasance in an amount equal to the greater of (x) 125% of the allocated loan amount for such individual property and (y) the sale price for such individual property. The partial release will be subject to satisfaction of the following conditions, among other things: (i) no event of default is continuing, (ii) the lender has received rating agency confirmation or waiver of confirmation, and (iii) after giving effect to the partial release, (a) the debt service coverage ratio for the remaining properties is not less than the greater of the trailing twelve month debt service coverage ratio immediately preceding the release and 1.93x, (b) the debt yield for the remaining properties is not less than the greater of the trailing twelve month debt yield immediately preceding the release and 10.95% and (c) the loan-to-value ratio for the remaining properties is not greater than the lesser of the loan-to-value ratio immediately preceding the release and 68.5%.
Ground Lease. The Wyndham Tallahassee Property is comprised of a leasehold interest under a long-term ground lease with Smith Interests General Partnership L.L.P., as ground lessor, that expires December 31, 2115. The ground lease requires current annual base rent of $99,326.53, which will adjust on January 1, 2024 and every five years thereafter to reflect increases in the consumer price index during the immediately prior five year period (but an increase not to exceed 25%).
Letter of Credit.None.
Terrorism Insurance.The AD1 Hotel Portfolio Borrower is required to obtain and maintain property insurance that covers perils of terrorism and acts of terrorism in an amount equal to the full replacement cost of the AD1 Hotel Portfolio Properties and business interruption insurance for 18 months with a six-month extended period of indemnity. See “Risk Factors—Risks Relating to the Mortgage Loans—Terrorism Insurance May Not Be Available for All Mortgaged Properties” in the Preliminary Prospectus.
| This is not a research report and was not prepared by any Underwriter’s research department. Please see additional important information and qualifications at the end of this Term Sheet. |
T-102
(THIS PAGE INTENTIONALLY LEFT BLANK)
T-103
| Office – CBD | Loan #8 | Cut-off Date Balance: | $40,000,000 | |
| 1633 Broadway | 1633 Broadway | Cut-off Date LTV: | 41.7% | |
| New York, NY 10019 | UW NCF DSCR: | 3.84x | ||
| UW NOI Debt Yield: | 11.9% |
| This is not a research report and was not prepared by any Underwriter’s research department. Please see additional important information and qualifications at the end of this Term Sheet. |
T-104
| Office – CBD | Loan #8 | Cut-off Date Balance: | $40,000,000 | |
| 1633 Broadway | 1633 Broadway | Cut-off Date LTV: | 41.7% | |
| New York, NY 10019 | UW NCF DSCR: | 3.84x | ||
| UW NOI Debt Yield: | 11.9% |
| This is not a research report and was not prepared by any Underwriter’s research department. Please see additional important information and qualifications at the end of this Term Sheet. |
T-105
| Office – CBD | Loan #8 | Cut-off Date Balance: | $40,000,000 | |
| 1633 Broadway | 1633 Broadway | Cut-off Date LTV: | 41.7% | |
| New York, NY 10019 | UW NCF DSCR: | 3.84x | ||
| UW NOI Debt Yield: | 11.9% |
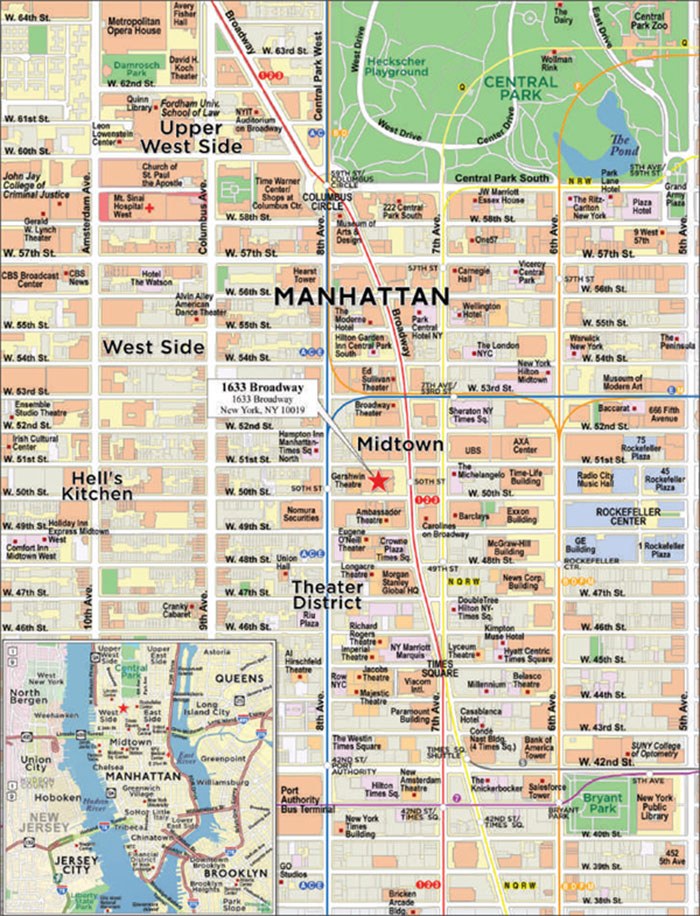
| This is not a research report and was not prepared by any Underwriter’s research department. Please see additional important information and qualifications at the end of this Term Sheet. |
T-106
| Mortgage Loan No. 8 – 1633 Broadway |
| Mortgage Loan Information | Property Information | |||||
| Mortgage Loan Seller: | WFB | Single Asset/Portfolio: | Single Asset | |||
| Credit Assessment (DBRS/Fitch/S&P): | BBB(high)(sf)/BBB-sf/NR | Location: | New York, NY 10019 | |||
| Original Balance(1): | $40,000,000 | General Property Type: | Office | |||
| Cut-off Date Balance(1): | $40,000,000 | Detailed Property Type: | CBD | |||
| % of Initial Pool Balance: | 3.3% | Title Vesting: | Fee | |||
| Loan Purpose: | Refinance | Year Built/Renovated(4): | 1972/2013 | |||
| Borrower Sponsor: | Paramount Group Operating Partnership LP | Size: | 2,561,512 SF | |||
| Guarantor: | N/A | Cut-off Date Balance per SF(1): | $391 | |||
| Mortgage Rate: | 2.9900% | Maturity Balance per SF(1): | $391 | |||
| Note Date: | 11/25/2019 | Property Manager: | Paramount Group Property- | |||
| First Payment Date: | 1/6/2020 | Asset Management LLC | ||||
| Maturity Date: | 12/6/2029 | (borrower-related) | ||||
| Original Term to Maturity: | 120 months | |||||
| Original Amortization Term: | 0 months | Underwriting and Financial Information | ||||
| IO Period: | 120 months | UW NOI: | $119,150,163 | |||
| Seasoning: | 3 months | UW NOI Debt Yield(1): | 11.9% | |||
| Prepayment Provisions(2): | LO (27); DEF (86); O (7) | UW NOI Debt Yield at Maturity(1): | 11.9% | |||
| Lockbox/Cash Mgmt Status: | Hard/Springing | UW NCF DSCR(1): | 3.84x | |||
| Additional Debt Type(1)(3): | Pari Passu/Subordinate | Most Recent NOI: | $110,809,315 (9/30/2019 TTM) | |||
| Additional Debt Balance(1)(3): | $961,000,000/$249,000,000 | 2nd Most Recent NOI: | $109,098,450 (12/31/2018) | |||
| Future Debt Permitted (Type)(4): | Yes (Mezzanine Debt/Subordinate | 3rd Most Recent NOI: | $94,190,007 (12/31/2017) | |||
| Unsecured) | Most Recent Occupancy: | 98.4% (10/31/2019) | ||||
| Reserves(5) | 2nd Most Recent Occupancy: | 95.4% (12/31/2018) | ||||
| Type | Initial | Monthly | Cap | 3rd Most Recent Occupancy: | 95.4% (12/31/2017) | |
| RE Taxes: | $0 | Springing | N/A | Appraised Value (as of): | $2,400,000,000 (10/24/2019) | |
| Insurance: | $0 | Springing | N/A | Appraised Value per SF: | $937 | |
| Replacement Reserve: | $0 | Springing | $1,024,605 | Cut-off Date LTV Ratio(1): | 41.7% | |
| Rollover Reserve: | $0 | Springing | $5,123,024 | Maturity Date LTV Ratio(1): | 41.7% | |
| Unfunded Obligations Reserve: | $36,389,727 | $0 | N/A | |||
| Sources and Uses | ||||||
| Sources | Proceeds | % of Total | Uses | Proceeds | % of Total | |
| Whole Loan Amount(1): | $1,250,000,000 | 100.0% | Loan Payoff: | $1,052,884,467 | 84.2% | |
| Closing Costs: | $20,840,154 | 1.7% | ||||
| Reserves: | $36,389,727 | 2.9% | ||||
| Return of Equity: | $139,885,652 | 11.2% | ||||
| Total Sources: | $1,250,000,000 | 100.0% | Total Uses: | $1,250,000,000 | 100.0% | |
| (1) | The 1633 Broadway Mortgage Loan (as defined below) is part of the 1633 Broadway Whole Loan (as defined below) with an original aggregate principal balance of $1,250,000,000. The Cut-off Date Balance per SF, Maturity Date Balance per SF, UW NOI Debt Yield, UW NOI Debt Yield at Maturity, UW NCF DSCR, Cut-off Date LTV Ratio and Maturity Date LTV Ratio numbers presented above are based on the 1633 Broadway Senior Loan (as defined below). The Cut-off Date Balance per SF, Maturity Date Balance per SF, UW NOI Debt Yield, UW NOI Debt Yield at Maturity, UW NCF DSCR, Cut-off Date LTV Ratio and Maturity Date LTV Ratio based upon the 1633 Broadway Whole Loan are $488, $488, 9.5%, 9.5%, 3.08x, 52.1% and 52.1%, respectively. |
| (2) | Defeasance or prepayment of the 1633 Broadway Whole Loan is permitted at any time after the earlier to occur of (a) the end of the two-year period commencing on the closing date of the securitization of the last promissory note representing a portion of the 1633 Broadway Whole Loan to be securitized and (b) November 25, 2022. The assumed defeasance lockout period of 27 payments is based on the closing date of this transaction in March 2020. |
| (3) | See “The Mortgage Loan” and “Additional Secured Indebtedness (not including trade debts)” below for further discussion of additional debt. |
| (4) | See “Mezzanine Loan and Preferred Equity” for further discussion of permitted future debt. |
| (5) | See“Escrows and Reserves” below for further discussion of reserve requirements. |
The Mortgage Loan. The eighth largest mortgage loan (the “1633 Broadway Mortgage Loan”) is part of a whole loan (the “1633 Broadway Whole Loan”) that is evidenced by 35pari passusenior promissory notes in the aggregate original principal amount of $1,001,000,000 (collectively, the “1633 Broadway Senior Loan”) and four subordinatepari passupromissory notes in the aggregate original principal amount of $249,000,000 (collectively, the“1633 Broadway Subordinate Companion Loan”). The 1633 Broadway Whole Loan was co-originated on November 25, 2019 by Goldman Sachs Bank USA, JPMorgan Chase Bank, National Association, DBR Investments Co. Limited and Wells Fargo Bank, National Association. The 1633 Broadway Whole Loan is secured by a first priority fee mortgage encumbering a 48-story office tower located in New York, New York (the “1633 Broadway Property”). The 1633 Broadway Mortgage Loan is evidenced by the non-controlling promissory notes A-4-C-6 and A-4-C-7 in the aggregate original principal amount of $40,000,000. As shown in the “1633 Broadway Whole Loan Summary” table below, four senior promissory notes in the original aggregate principal amount of $1,000,000 and the four subordinate promissory notes in the original aggregate principal amount of $249,000,000 were contributed to the BWAY 2019-1633 securitization trust. The 1633 Broadway Whole Loan is expected to be serviced pursuant to the trust and servicing agreement for the BWAY 2019-1633 securitization trust. The 1633 Broadway Senior Loanpari passu notes other than those evidencing the
| This is not a research report and was not prepared by any Underwriter’s research department. Please see additional important information and qualifications at the end of this Term Sheet. |
T-107
| Office – CBD | Loan #8 | Cut-off Date Balance: | $40,000,000 | |
| 1633 Broadway | 1633 Broadway | Cut-off Date LTV: | 41.7% | |
| New York, NY 10019 | UW NCF DSCR: | 3.84x | ||
| UW NOI Debt Yield: | 11.9% |
1633 Broadway Mortgage Loan are referred to herein as the “1633 Broadway Non-ServicedPari Passu Companion Loans”. See “Description of the Mortgage Pool—The Whole Loans—The 1633 Broadway Pari Passu-A/B Whole Loan” and “Pooling and Servicing Agreement—Servicing of the Non-Serviced Mortgage Loans”. The proceeds of the 1633 Broadway Whole Loan were primarily used to repay prior debt, fund upfront reserves, pay closing costs and return equity to the borrower sponsor.
| 1633 Broadway Whole Loan Summary | ||||
| Notes | Original Balance | Cut-off Date Balance | Anticipated Note Holder | Controlling Piece |
| 1633 Broadway Senior Loan | ||||
| A-1-S-1 | $250,000 | $250,000 | BWAY 2019-1633 | No |
| A-2-S-1 | $250,000 | $250,000 | BWAY 2019-1633 | No |
| A-3-S-1 | $250,000 | $250,000 | BWAY 2019-1633 | No |
| A-4-S-1 | $250,000 | $250,000 | BWAY 2019-1633 | No |
| A-1-C-1 | $50,000,000 | $50,000,000 | CGCMT 2020-GC46(1) | No(2) |
| A-1-C-2 | $45,000,000 | $45,000,000 | GSMS 2020-GC45 | No |
| A-1-C-3 | $45,000,000 | $45,000,000 | Goldman Sachs Bank USA | No |
| A-1-C-4 | $40,000,000 | $40,000,000 | Goldman Sachs Bank USA | No |
| A-1-C-5 | $32,500,000 | $32,500,000 | CGCMT 2020-GC46(1) | No |
| A-1-C-6 | $20,000,000 | $20,000,000 | Goldman Sachs Bank USA | No |
| A-1-C-7 | $17,500,000 | $17,500,000 | Goldman Sachs Bank USA | No |
| A-2-C-1-A | $27,500,000 | $27,500,000 | CGCMT 2020-GC46(1) | No |
| A-2-C-1-B | $22,500,000 | $22,500,000 | Benchmark 2020-B16 | No |
| A-2-C-2 | $50,000,000 | $50,000,000 | DBR Investments Co. Limited | No |
| A-2-C-3-A | $25,000,000 | $25,000,000 | DBR Investments Co. Limited | No |
| A-2-C-3-B | $15,000,000 | $15,000,000 | Benchmark 2020-IG1(1) | No |
| A-2-C-4 | $40,000,000 | $40,000,000 | DBR Investments Co. Limited | No |
| A-2-C-5 | $15,000,000 | $15,000,000 | GSMS 2020-GC45 | No |
| A-2-C-6 | $35,000,000 | $35,000,000 | DBR Investments Co. Limited | No |
| A-2-C-7 | $20,000,000 | $20,000,000 | DBR Investments Co. Limited | No |
| A-3-C-1-A | $27,850,000 | $27,850,000 | JPMorgan Chase Bank, National Association | No |
| A-3-C-1-B | $22,500,000 | $22,500,000 | Benchmark 2020-B16 | No |
| A-3-C-2 | $49,650,000 | $49,650,000 | Benchmark 2020-IG1(1) | No |
| A-3-C-3 | $40,000,000 | $40,000,000 | JPMorgan Chase Bank, National Association | No |
| A-3-C-4 | $40,000,000 | $40,000,000 | JPMorgan Chase Bank, National Association | No |
| A-3-C-5 | $30,000,000 | $30,000,000 | JPMorgan Chase Bank, National Association | No |
| A-3-C-6 | $20,000,000 | $20,000,000 | JPMorgan Chase Bank, National Association | No |
| A-3-C-7 | $20,000,000 | $20,000,000 | JPMorgan Chase Bank, National Association | No |
| A-4-C-1 | $50,000,000 | $50,000,000 | BANK 2020-BNK25 | No |
| A-4-C-2 | $50,000,000 | $50,000,000 | BANK 2020-BNK25 | No |
| A-4-C-3 | $40,000,000 | $40,000,000 | Wells Fargo Bank, National Association | No |
| A-4-C-4 | $40,000,000 | $40,000,000 | WFCM 2020-C55(1) | No |
| A-4-C-5 | $30,000,000 | $30,000,000 | WFCM 2020-C55(1) | No |
| A-4-C-6 | $20,000,000 | $20,000,000 | BANK 2020-BNK26 | No |
| A-4-C-7 | $20,000,000 | $20,000,000 | BANK 2020-BNK26 | No |
| Total (Senior Loan) | $1,001,000,000 | $1,001,000,000 | ||
| 1633 Broadway Subordinate Companion Loan | ||||
| B-1 | $62,250,000 | $62,250,000 | BWAY 2019-1633 | Yes(2)(3) |
| B-2 | $62,250,000 | $62,250,000 | BWAY 2019-1633 | Yes(2)(3) |
| B-3 | $62,250,000 | $62,250,000 | BWAY 2019-1633 | Yes(2)(3) |
| B-4 | $62,250,000 | $62,250,000 | BWAY 2019-1633 | Yes(2)(3) |
| Total (Subordinate Companion Loan) | $249,000,000 | $249,000,000 | ||
| Total (Whole Loan) | $1,250,000,000 | $1,250,000,000 | ||
| (1) | Anticipated to be contributed on the closing date of such securitization. |
| (2) | The initial controlling notes are Note B-1, Note B-2, Note B-3 and Note B-4. During the continuance of a control shift event relating to the BWAY 2019-1633 securitization transaction, Note A-1-C-1 will be the controlling note. |
| (3) | The 1633 Broadway Subordinate Companion Loan is subordinate to the 1633 Broadway Senior Loan. |
The Borrower and the Borrower Sponsors. The borrowers are PGREF I 1633 Broadway Tower, L.P. and PGREF I 1633 Broadway Land, L.P., each a Delaware limited partnership with two independent directors (together, the “1633 Broadway Borrower”). PGREF I 1633 Broadway Land, L.P. owns the
| This is not a research report and was not prepared by any Underwriter’s research department. Please see additional important information and qualifications at the end of this Term Sheet. |
T-108
| Office – CBD | Loan #8 | Cut-off Date Balance: | $40,000,000 | |
| 1633 Broadway | 1633 Broadway | Cut-off Date LTV: | 41.7% | |
| New York, NY 10019 | UW NCF DSCR: | 3.84x | ||
| UW NOI Debt Yield: | 11.9% |
1633 Broadway Property entirely in fee and also ground leases the 1633 Broadway Property to PGREF I 1633 Broadway Tower, L.P. (i.e., both landlord and tenant interests in the ground lease are pledged as collateral, in addition to the fee interest in the 1633 Broadway Property). There is no non-recourse carveout guarantor or separate environmental indemnitor with respect to the 1633 Broadway Whole Loan.
The borrower sponsor is Paramount Group Operating Partnership LP, which indirectly owns and controls the borrowers. Paramount Group, Inc. (NYSE: PGRE), an approximately 91% general partner of the borrower sponsor, is a real estate investment trust that currently owns and/or manages a 13.4 million SF portfolio of 18 Class A office and retail buildings in New York, Washington, D.C., and San Francisco. Paramount Group, Inc. has a New York portfolio that includes: 1633 Broadway, 1301 Avenue of the Americas, 1325 Avenue of the Americas, 31 West 52nd Street, 900 Third Avenue, 712 Fifth Avenue, 60 Wall Street, 745 Fifth Avenue, 718 Fifth Avenue, and 0 Bond Street.
The 1633 Broadway Borrower has presented for the lender’s consideration an elimination of the ground lease (such that collateral for the 1633 Broadway Whole Loan would consist entirely of the fee interest in the 1633 Broadway Property) and an intended transfer of the 1633 Broadway Property in accordance with the 1633 Broadway Whole Loan documents to successor borrowers that would own the 1633 Broadway Property as tenants-in-common, which could result in a change of the ultimate ownership of the 1633 Broadway Property. The lender cannot provide assurances that the management skills, quality or judgment of any successor borrower or their equityholders would be equivalent to that of the current 1633 Broadway Borrower and its equityholders or that the value of the 1633 Broadway Property will be maintained at the same level by any successor borrower.
The Property. The 1633 Broadway Property is an approximately 2.6 million SF, 48-story office tower that is situated with a full block of Broadway frontage between 50th and 51st Streets in Midtown Manhattan. The 1633 Broadway Property has views of the Hudson River, Central Park, and Midtown above the 36th floor. In addition to the office space, the 1633 Broadway Property includes retail space (anchored by Equinox), a three-level, below-grade parking garage, two theaters comprising a total of 145,192 SF (the Gershwin Theatre and Circle in the Square) and 18,384 SF of storage space.
The 1633 Broadway Property is located on a 90,400 SF parcel comprising the entire western block front of Broadway between West 50th and West 51st Streets within the Westside office submarket of Midtown. The 1633 Broadway Property was constructed in 1972 and was most recently renovated in 2013. Since 2010, the borrower sponsor has invested a total of approximately $41.6 million in lobby renovations, plaza redevelopment, and retail renovations. In addition, the borrower sponsor has invested approximately $230 million in tenant improvements and leasing commissions since 2010. The borrower sponsor provided a 10-year renovation budget which totals approximately $55.98 million; the renovation budget is anticipated to be utilized for items including a roof replacement, structural upgrades, fire alarm system upgrades, Gershwin Theatre upgrades, completion of the terrace on the 47th and 48th floors, and development of the retail space. Such renovations are not required by the 1633 Broadway Whole Loan documents, and have not been reserved for. The lender can provide no assurances that such renovation will proceed as expected or at all.
The 1633 Broadway Property comprises 2,561,512 SF and was 98.4% leased as of October 31, 2019. The office component of the 1633 Broadway Property is currently 100.0% leased to 17 tenants and represents approximately 93.4% of underwritten base rent. The retail space within the 1633 Broadway Property totals approximately 80,000 SF of NRA and is anchored by Equinox (25,458 SF) with a lease expiration date in February 2040.
The 1633 Broadway Property features two theatres that comprise 5.7% of the total net rentable area and account for 1.2% of the underwritten rental revenue. The larger of the two theatres is UT Associates (“Gershwin Theatre”), which is notable for having hosted Wicked since 2003. The Gershwin Theatre’s lease contains three, five-year renewal options that could potentially extend the term through May 2042. The 1633 Broadway Property contains an additional theatre known as the Circle in the Square, which encompasses 34,570 SF and currently hosts the show OKLAHOMA! The 1633 Broadway Property also houses the Circle in the Square Theatre School, the only accredited training conservatory associated with a Broadway theatre, which offers two, two-year training programs, in acting and musical theatre. The Circle in the Square Theatre School currently pays a total contract rent of $864,250, or $25.00 PSF, through September 2021.
The parking component within the 1633 Broadway Property consists of a 250-space parking garage across three levels below grade and comprises 64,158 SF of net rentable area. The space is currently leased to ABM Parking Services, Inc., a parking garage operator, which has a lease expiration date in July 2026. The operator is responsible for annual contract rent of approximately $2.39 million, or $10,167 per space, which will increase by at least 1.50%per annum throughout the remainder of the lease.
Major Tenants.
Largest Tenant by UW Base Rent: Allianz Asset Mgmt of America (“Allianz”; AA-/Aa3/AA by Fitch/Moody’s/S&P; 320,911 SF; 12.5% of net rentable area; 15.7% of underwritten base rent; 1/31/2031 lease expiration) – Allianz occupies six suites with leases expiring in January 2031. Allianz is an asset manager with over 800 investment professionals in 25 offices worldwide and manages assets for individuals, families and institutions. The 1633 Broadway Property serves as the United States headquarters for Allianz’s parent company.
2nd Largest Tenant by UW Base Rent: Morgan Stanley & Co. (“Morgan Stanley”; A/A3/BBB+ by Fitch/Moody’s/S&P; 260,829 SF; 10.2% of net rentable area; 11.1% of underwritten base rent; 3/31/2032 lease expiration) – Morgan Stanley occupies five suites with leases expiring in March 2032. Morgan Stanley, a financial holding company, provides various financial products and services to corporations, governments, financial institutions and individuals in the Americas, Europe, the Middle East, Africa and Asia. The company operates through three segments: Institutional Securities, Wealth Management and Investment Management.
3rd Largest Tenant by UW Base Rent: WMG Acquisition Corp. (“Warner Music Group”; 293,888 SF; 11.5% of net rentable area; 10.4% of underwritten base rent; 7/31/2029 lease expiration and month-to-month storage space) – Warner Music Group is an American multinational entertainment and record label conglomerate. It is one of the “Big Three” recording companies and the third largest in the global music industry, next to Universal Music Group and Sony Music Entertainment. Warner Music Group is headquartered at the 1633 Broadway Property.
| This is not a research report and was not prepared by any Underwriter’s research department. Please see additional important information and qualifications at the end of this Term Sheet. |
T-109
| Office – CBD | Loan #8 | Cut-off Date Balance: | $40,000,000 | |
| 1633 Broadway | 1633 Broadway | Cut-off Date LTV: | 41.7% | |
| New York, NY 10019 | UW NCF DSCR: | 3.84x | ||
| UW NOI Debt Yield: | 11.9% |
The following table presents certain information relating to the tenancy at the 1633 Broadway Property:
| Tenant Summary | |||||||||
| Tenant Name | Credit Rating (Fitch/Moody's/S&P)(1) | Tenant SF | Approx. % of SF | Annual UW Rent(2) | % of Total Annual UW Rent | Annual UW Rent PSF(2) | Term. Option (Y/N) | Extension Options | Lease Expiration |
| Major Tenants | |||||||||
| Allianz(3) | AA-/Aa3/AA | 320,911 | 12.5% | $26,527,064(3) | 15.7% | $82.66(3) | N | 5 or 10 years(4) | 1/31/2031 |
| Morgan Stanley | A/A3/BBB+ | 260,829 | 10.2% | $18,677,050 | 11.1% | $71.61 | Y(5) | 2, 5-year or 1, 10-year | 3/31/2032 |
| Warner Music Group(6) | NR/NR/NR | 293,888 | 11.5% | $17,520,179(6) | 10.4% | $59.62(6) | N | 1, 5-year or 10-year | Various(7) |
| Showtime Networks Inc | BBB/Baa2/BBB | 261,196 | 10.2% | $14,438,861 | 8.6% | $55.28 | N | 1, 5-year or 10-year | 1/31/2026 |
| Kasowitz Benson Torres(8) | NR/NR/NR | 203,394 | 7.9% | $13,830,452(8) | 8.2% | $68.00(8) | Y(9) | 2, 5-year | 3/31/2037 |
| New Mountain Capital, LLC(10) | NR/NR/NR | 108,374 | 4.2% | $9,320,164(10) | 5.5% | $86.00(10) | N | 1, 5-year | 10/15/2035 |
| Charter Communications Holding | NR/Ba2/BB+ | 106,176 | 4.1% | $8,918,784 | 5.3% | $84.00 | N | NAP | 12/15/2025 |
| MongoDB, Inc. | NR/NR/NR | 106,230 | 4.1% | $8,073,480 | 4.8% | $76.00 | N | 1, 5-year | 12/31/2029 |
| Travel Leaders Group, LLC | NR/NR/B+ | 107,205 | 4.2% | $7,994,846 | 4.7% | $74.58 | N | 1, 5-year | 12/31/2033 |
| Assured Guaranty Municipal | NR/NR/A | 103,838 | 4.1% | $7,256,550 | 4.3% | $69.88 | N | 1, 5-year | Various(11) |
| Subtotal/Wtd. Avg. | 1,872,041 | 73.1% | $132,557,430 | 78.5% | $70.81 | ||||
| Other Tenants | 649,710 | 25.4% | $36,213,171 | 21.5% | $55.74 | ||||
| VacantSpace | 39,761 | 1.6% | $0 | 0.0% | $0.00 | ||||
| Total/Wtd. Avg. | 2,561,512 | 100.0% | $168,770,601 | 100.0% | $66.93(12) | ||||
| (1) | Certain ratings are those of the parent company whether or not the parent company guarantees the lease. |
| (2) | Annual UW Rent PSF and Annual UW Rent include contractual rent steps through November 2020 totaling $1,272,795. The lender’s underwriting gives separate credit for the net present value of contractual rent step increments over the lease term using a discount rate of 7.0% (for investment grade tenants) totaling $7,558,579 (see “Operating History and Underwritten Net Cash Flow” below). The Annual UW Rent PSF and Annual UW Rent shown in the table above do not include credit given for such investment grade tenants beyond November 2020. |
| (3) | Allianz Asset Mgmt of America subleases 20,600 SF of suite 4600 (totaling 54,118 SF) to Triumph Hospitality at a base rent of $46.80 PSF through December 30, 2030. Triumph Hospitality further subleases 3,000 SF of suite 4600 to Stein Adler Dabah & Zelkowitz at a base rent of $41.33 PSF through July 31, 2022. Underwritten base rent is based on the contractual rent under the prime lease. |
| (4) | Subject to a maximum of 15 years in the aggregate. |
| (5) | Morgan Stanley has the option to terminate its lease as to all or any portion (but not less than one full floor) of its space at any time after April 1, 2027, upon 18 months’ notice and payment of a termination fee. |
| (6) | Warner Music Group subleases 3,185 SF of suite 0400 (totaling 36,854 SF) to Cooper Investment Partners LLC at a base rent of $58.37 PSF on a month-to-month basis. Underwritten base rent is based on the contractual rent under the prime lease. |
| (7) | 293,487 SF expires on July 31, 2029 and 401 SF of storage space is leased on a month-to-month basis. |
| (8) | Kasowitz Benson Torres subleases a collective 32,487 SF of Suite 2200 (totaling 50,718 SF) to three tenants. Delcath Systems, Inc. subleases 6,877 SF and pays rent of $68.50 PSF through February 28, 2021; Avalonbay Communities subleases 12,145 SF through October 31, 2026 and pays rent of $74.00 PSF; Cresa New York subleases 13,195 SF and pays rent of $65.00 PSF through April 30, 2021. Underwritten base rent is based on the contractual rent under the prime lease. |
| (9) | Kasowitz Benson Torres has the right to terminate one full floor of the premises located on the uppermost or lowermost floors, effective as of March 31, 2024, upon notice by March 31, 2023. |
| (10) | New Mountain Capital, LLC has executed a lease but has not yet taken occupancy or begun paying rent. We cannot assure you that they will take occupancy or begin paying rent as expected or at all. |
| (11) | 103,492 SF expires on February 28, 2032 and 346 SF of storage space is leased on a month-to-month basis. |
| (12) | Total/Wtd. Avg. Annual UW Rent PSF excludes vacant space. |
| This is not a research report and was not prepared by any Underwriter’s research department. Please see additional important information and qualifications at the end of this Term Sheet. |
T-110
| Office – CBD | Loan #8 | Cut-off Date Balance: | $40,000,000 | |
| 1633 Broadway | 1633 Broadway | Cut-off Date LTV: | 41.7% | |
| New York, NY 10019 | UW NCF DSCR: | 3.84x | ||
| UW NOI Debt Yield: | 11.9% |
The following table presents certain information relating to the lease rollover schedule at the 1633 Broadway Property:
| Lease Rollover Schedule(1)(2) | ||||||||
| Year | # of Leases Rolling | SF Rolling | Annual UW Rent PSF Rolling | Approx. % of Total SF Rolling | Approx. Cumulative % of SF Rolling | Total UW Rent Rolling | Approx. % of Total Rent Rolling | Approx. Cumulative % of Total Rent Rolling |
| MTM | 13 | 9,482 | $67.30 | 0.4% | 0.4% | $638,145 | 0.4% | 0.4% |
| 2020 | 2 | 960 | $30.00 | 0.0% | 0.4% | $28,800 | 0.0% | 0.4% |
| 2021 | 3 | 86,460 | $55.01 | 3.4% | 3.8% | $4,756,000 | 2.8% | 3.2% |
| 2022 | 4 | 116,337 | $24.18 | 4.5% | 8.3% | $2,813,374 | 1.7% | 4.9% |
| 2023 | 7 | 38,550 | $33.72 | 1.5% | 9.8% | $1,299,854 | 0.8% | 5.7% |
| 2024 | 1 | 51,276 | $91.00 | 2.0% | 11.8% | $4,666,116 | 2.8% | 8.4% |
| 2025 | 4 | 106,176 | $84.00 | 4.1% | 16.0% | $8,918,784 | 5.3% | 13.7% |
| 2026 | 11 | 383,584 | $53.18 | 15.0% | 31.0% | $20,397,741 | 12.1% | 25.8% |
| 2027 | 3 | 55,247 | $82.98 | 2.2% | 33.1% | $4,584,436 | 2.7% | 28.5% |
| 2028 | 4 | 90,001 | $67.15 | 3.5% | 36.6% | $6,043,229 | 3.6% | 32.1% |
| 2029 | 10 | 399,717 | $63.99 | 15.6% | 52.2% | $25,579,624 | 15.2% | 47.2% |
| 2030 | 0 | 0 | $0.00 | 0.0% | 52.2% | $0 | 0.0% | 47.2% |
| 2031 & Beyond | 28 | 1,183,961 | $75.21 | 46.2% | 98.4% | $89,044,498 | 52.8% | 100.0% |
| Vacant | 0 | 39,761 | $0.00 | 1.6% | 100.0% | $0 | 0.0% | 100.0% |
| Total/Wtd. Avg. | 90 | 2,561,512 | $66.93(3) | 100.0% | $168,770,601 | 100.0% | ||
| (1) | Information is based on the underwritten rent roll. |
| (2) | Certain tenants may have lease termination options that are exercisable prior to the originally stated expiration date of the subject lease and that are not considered in the Lease Rollover Schedule. |
| (3) | Total/Wtd. Avg. Annual UW Rent PSF Rolling excludes vacant space. |
The Market. The 1633 Broadway Property is located in the Times Square neighborhood of Midtown Manhattan, a high traffic commercial corridor that produces 15% of New York City’s economic output, per the appraisal. The neighborhood is bounded by 41st Street to the south and 52nd Street to the north between Avenue of the Americas and Eighth Avenue. The 1633 Broadway Property is located within one block of the 50th Street/Broadway, 50th Street and 49th Street subway stations, which serve the 1, 2, C, E, N, R and W lines.
According to the appraisal, the 1633 Broadway Property is located within the Westside office submarket of Midtown within the Manhattan market. Historically, the submarket has benefitted from the office space located around the boundaries of Central Park along major corridors such as West 57th Street, Broadway and Seventh Avenue, which consist primarily of Class A office product that take advantage of protected Central Park views. The area’s proximity to these locations has assisted with the historically low vacancy and availability rates exhibited by this submarket since 2010. As of the third quarter of 2019, the Westside office submarket had an existing inventory of approximately 25.7 million SF, a vacancy rate of 5.4% and an average asking rent of $66.21 PSF. As of the third quarter of 2019, the Manhattan office market had an existing inventory of approximately 456.1 million SF, a vacancy rate of 5.9% and an average asking rent of $79.25 PSF.
The following table presents certain information relating to the appraisal’s market rent conclusion for the 1633 Broadway Property:
| Market Rent Summary | ||||||
| Office Floors 2 to 9 | Office Floors 10 to 18 | Office Floors 19 to 26 | Office Floors 27 to 35 | Office Floors 36 to 43 | Office Floors 44 to 48 | |
| Market Rent (PSF) | $65.00 | $68.00 | $72.00 | $76.00 | $85.00 | $90.00 |
| Lease Term (Years) | 15 | 15 | 15 | 15 | 15 | 15 |
| Lease Type (Reimbursements) | MG | MG | MG | MG | MG | MG |
| Rent Increase Projection | 10% increase every 5 years | 10% increase every 5 years | 10% increase every 5 years | $10% increase every 5 years | 10% increase every 5 years | 10% increase every 5 years |
Source:Appraisal.
| This is not a research report and was not prepared by any Underwriter’s research department. Please see additional important information and qualifications at the end of this Term Sheet. |
T-111
| Office – CBD | Loan #8 | Cut-off Date Balance: | $40,000,000 | |
| 1633 Broadway | 1633 Broadway | Cut-off Date LTV: | 41.7% | |
| New York, NY 10019 | UW NCF DSCR: | 3.84x | ||
| UW NOI Debt Yield: | 11.9% |
The following table presents information relating to comparable office property sales for the 1633 Broadway Property:
| Comparable Property Sale Summary | |||||
| Property Name | Location | Rentable Area (SF) | Sale Date | Sale Price | Sale Price (PSF) |
| 150 East 42nd Street | New York, NY | 1,698,603 | Oct-19 | $1,300,000,000 | $765.33 |
| 330 Madison Avenue | New York, NY | 855,000 | Jul-19 | $900,000,000 | $1,052.63 |
| 30 Hudson Yards | New York, NY | 1,463,234 | Apr-19 | $2,155,000,000 | $1,472.77 |
| 237 Park Avenue | New York, NY | 1,260,160 | Jan-19 | $1,200,000,000 | $952.26 |
| 425 Lexington Avenue | New York, NY | 728,171 | Nov-18 | $701,000,000 | $962.69 |
| 666 Fifth Avenue | New York, NY | 1,437,546 | Aug-18 | $1,286,082,681 | $894.64 |
| 1515 Broadway | New York, NY | 1,897,131 | Nov-17 | $1,950,000,000 | $1,027.87 |
| 825 Eighth Avenue | New York, NY | 2,080,000 | Oct-17 | $1,700,000,000 | $817.31 |
| 245 Park Avenue | New York, NY | 1,779,515 | May-17 | $2,210,000,000 | $1,241.91 |
Source:Appraisal.
The following table presents certain information relating to comparable office leases for the 1633 Broadway Property:
| Comparable Leases Summary | ||||||||||
| Property Name/Location | Year Built/ Renovated | Total GLA (SF) | Distance from Subject | Occ. % | Tenant | Tenant Size (SF) | Lease Start Date | Lease Term (Yrs.) | Annual Base Rent PSF | Lease Type |
1155 Avenue of the Americas New York, NY | 1984/2016 | 752,996 | 1.0 mile | 74.8% | BKD, LLC | 20,899 | Sep-19 | 13.5 | $77.00 | MG |
1 Rockefeller Plaza New York, NY | 1936/NAV | 603,397 | 0.5 miles | 99.1%(1) | Veteran Advisers, Inc. | 2,552 | Sep-19 | 7.7 | $83.50 | MG |
1675 Broadway New York, NY | 1990/NAV | 878,321 | 0.4 miles | 96.9% | Davis & Gilbert LLP | 85,852 | Aug-19 | 16.0 | $72.00 | MG |
142 West 57th Street New York, NY | 1986/NAV | 255,586 | 0.7 miles | 88.2%(1) | Wedbush Securities Inc. | 15,626 | Aug-19 | 10.8 | $65.00 | MG |
1251 Avenue of the Americas New York, NY | 1971/NAV | 2,364,000 | 0.2 miles | 94.4% | IHI Americas, Inc. | 9,438 | Jul-19 | 10.3 | $70.50 | MG |
1345 Avenue of the Americas New York, NY | 1969/1988 | 1,998,994 | 0.5 miles | 94.8% | Global Infrastructure Partners | 84,856 | Jun-19 | 17.0 | $89.50 | MG |
810 Seventh Avenue New York, NY
| 1970/NAV | 765,000 | 0.5 miles | 93.3% | Colonial Consulting LLC | 17,320 | May-19 | 12.5 | $71.00 | MG |
1271 Avenue of the Americas New York, NY
| 1957/2019 | 2,100,000 | 0.2 miles | 98.0% | Greenhill & Company
AIG – American International Group, Inc. | 77,622
320,237 | May-19
Apr-19 | 15.3
16.5 | $91.00
$97.13
| MG
MG |
1700 Broadway New York, NY
| 1968/2003 | 625,000 | 0.6 miles | 81.5%(1) | Excel Sports Management, LLC
M. Arthur Gensler, Jr. & Associates, Inc. | 17,078
13,237 | Apr-19
Jan-19 | 7.6
9.9 | $79.00
$71.00 | MG
MG |
1325 Avenue of the Americas New York, NY | 1989/NAV | 808,998 | 0.5 miles | 88.3% | Dominus Capital, L.P. | 9,361 | Mar-19 | 10.5 | $75.00 | MG |
1290 Avenue of the Americas New York, NY | 1963/1996 | 2,113,000 | 0.3 miles | 100.0% | Linklaters, LLP | 90,508 | Mar-19 | 16.1 | $84.00 | MG |
1177 Avenue of the Americas New York, NY | 1992/2013 | 1,000,000 | 0.9 miles | 90.2% | Mill Point Capital | 11,644 | Jan-19 | 10.5 | $87.00 | MG |
114 West 47th Street New York, NY | 1989/NAV | 658,000 | 0.8 miles | 96.3%(1) | IFM Investments | 18,000 | Oct-18 | 15.0 | $68.00 | MG |
Source:Appraisal, unless otherwise indicated.
| (1) | Information obtained from a third party market research provider. |
| This is not a research report and was not prepared by any Underwriter’s research department. Please see additional important information and qualifications at the end of this Term Sheet. |
T-112
| Office – CBD | Loan #8 | Cut-off Date Balance: | $40,000,000 | |
| 1633 Broadway | 1633 Broadway | Cut-off Date LTV: | 41.7% | |
| New York, NY 10019 | UW NCF DSCR: | 3.84x | ||
| UW NOI Debt Yield: | 11.9% |
Operating History and Underwritten Net Cash Flow.The following table presents certain information relating to the historical operating performance and Underwritten Net Cash Flow at the 1633 Broadway Property:
| Cash Flow Analysis | ||||||
| 2016 | 2017 | 2018 | 9/30/2019 TTM | UW | UW PSF | |
| Base Rent | $141,156,682 | $143,219,431 | $160,621,035 | $161,646,240 | $167,497,806 | $65.39 |
| Contractual Rent Steps(1) | $0 | $0 | $0 | $0 | $1,272,795 | $0.50 |
| Rent Average Benefit(2) | $0 | $0 | $0 | $0 | $7,558,579 | $2.95 |
| Grossed Up Vacant Space | $0 | $0 | $0 | $0 | $2,879,875 | $1.12 |
| Total Recoveries | $9,150,315 | $11,228,307 | $13,952,510 | $16,874,074 | $15,267,588 | $5.96 |
| Other Income(3) | $5,692,549 | $5,017,065 | $4,645,691 | $4,240,034 | $4,279,853 | $1.67 |
| Less Vacancy & Credit Loss | ($309,756) | $0 | $0 | $0 | ($8,170,549)(4) | ($3.19) |
| Effective Gross Income | $155,689,790 | $159,464,803 | $179,219,236 | $182,760,348 | $190,585,947 | $74.40 |
| Real Estate Taxes | $35,413,254 | $38,391,946 | $41,366,170 | $43,693,114 | $45,478,153 | $17.75 |
| Insurance | $1,061,417 | $908,564 | $1,009,544 | $1,082,131 | $1,069,190 | $0.42 |
| Other Operating Expenses | $25,393,733 | $25,974,286 | $27,745,072 | $27,175,788 | $24,888,441 | $9.72 |
| Total Expenses | $61,868,404 | $65,274,796 | $70,120,786 | $71,951,033 | $71,435,784 | $27.89 |
| Net Operating Income | $93,821,386 | $94,190,007 | $109,098,450 | $110,809,315 | $119,150,163 | $46.52 |
| Capital Expenditures | $0 | $0 | $0 | $0 | $461,072 | $0.18 |
| TI/LC | $0 | $0 | $0 | $0 | $2,011,364 | $0.79 |
| Net Cash Flow | $93,821,386 | $94,190,007 | $109,098,450 | $110,809,315 | $116,677,727 | $45.55 |
| Occupancy% | 86.3% | 95.4% | 95.4% | 98.4%(4) | 95.4%(4) | |
| NOI DSCR(5) | 3.09x | 3.10x | 3.60x | 3.65x | 3.93x | |
| NCF DSCR(5) | 3.09x | 3.10x | 3.60x | 3.65x | 3.84x | |
| NOI Debt Yield(5) | 9.4% | 9.4% | 10.9% | 11.1% | 11.9% | |
| NCF Debt Yield(5) | 9.4% | 9.4% | 10.9% | 11.1% | 11.7% | |
| (1) | Includes contractual rent steps through November 30, 2020. |
| (2) | Reflects the net present value of contractual rent step increments over the lease term using a discount rate of 7.0% (for investment grade tenants). |
| (3) | Other Income consists of overage rent, storage income, parking income, lease termination income, tenant work order income and other miscellaneous income. |
| (4) | The underwritten economic vacancy is 4.6%. The 1633 Broadway Property was 98.4% occupied as of October 31, 2019. |
| (5) | The debt service coverage ratios and debt yields are based on the 1633 Broadway Senior Loan and excludes the 1633 Broadway Subordinate Companion Loan. |
Escrows and Reserves.
Real Estate Taxes – During a Cash Trap Event Period (see “Lockbox and Cash Management” section), the 1633 Broadway Whole Loan documents require ongoing monthly real estate tax reserves in an amount equal to 1/12 of the real estate taxes that the lender reasonably estimates will be payable during the next 12 months.
Insurance – During a Cash Trap Event Period, the 1633 Broadway Whole Loan documents require ongoing monthly insurance reserves in an amount equal to 1/12 of the insurance premiums that the lender reasonably estimates will be payable for the renewal of the required coverage during the next 12 months;provided, however, that, notwithstanding any prior springing conditions, the reserve will not be required if the 1633 Broadway Borrower maintains a blanket insurance policy reasonably acceptable to the lender and no event of default is continuing.
Replacement Reserve – During a Cash Trap Event Period, the 1633 Broadway Whole Loan documents require ongoing monthly replacement reserves of $42,692 subject to a cap of $1,024,605.
TI/LC Reserve – During a Cash Trap Event Period, the 1633 Broadway Whole Loan documents require ongoing monthly rollover reserves of $213,459 subject to a cap of $5,123,024.
Unfunded Obligations Reserve – The 1633 Broadway Whole Loan documents require an upfront deposit of $36,389,727, along with a $4,000,000 guaranty made by Paramount Group Operating Partnership LP, for outstanding tenant improvements, leasing commissions and free rent pertaining to 11 tenants at the 1633 Broadway Property at the time of origination of the 1633 Broadway Whole Loan.
Lockbox and Cash Management. The 1633 Broadway Whole Loan documents require that the 1633 Broadway Borrower establish and maintain a lender-controlled lockbox account, which is already in place, and that the borrower direct all tenants to pay rent directly into such lockbox account and the 1633 Broadway Borrower or property manager deposit any rent received within one business day. Prior to the occurrence of a Cash Trap Event Period (as defined below), all funds on deposit in the lockbox account will be disbursed to the 1633 Broadway Borrower. During a Cash Trap Event Period, all funds in the lockbox account are required to be swept each business day into the cash management account controlled by the lender and, on each payment date, all funds in the cash management account are required to be applied in accordance with the 1633 Broadway Whole Loan documents. During a Cash Trap Event Period, any excess cash flow remaining after satisfaction of the waterfall items is required to be swept to an
| This is not a research report and was not prepared by any Underwriter’s research department. Please see additional important information and qualifications at the end of this Term Sheet. |
T-113
| Office – CBD | Loan #8 | Cut-off Date Balance: | $40,000,000 | |
| 1633 Broadway | 1633 Broadway | Cut-off Date LTV: | 41.7% | |
| New York, NY 10019 | UW NCF DSCR: | 3.84x | ||
| UW NOI Debt Yield: | 11.9% |
excess cash flow subaccount to be held by the lender as additional security for the 1633 Broadway Whole Loan and, provided no event of default exists, disbursed for budgeted operating expenses, reserves or to the lender and/or the 1633 Broadway Borrower in accordance with the 1633 Broadway Whole Loan documents.
A “Cash Trap Event Period” will commence upon the earlier of the following:
| (i) | the occurrence of an event of default; |
| (ii) | the net operating income debt yield (“NOI DY”) for the 1633 Broadway Whole Loan falling below 5.75% at the end of two consecutive calendar quarters; or |
| (iii) | the failure to deliver financial reports to the lender as and when required pursuant to the 1633 Broadway Whole Loan documents. |
A Cash Trap Event Period will end upon the occurrence of the following:
| ● | with regard to clause (i) above, the cure of such event of default; |
| ● | with regard to clause (ii) above: |
| ○ | (a) the NOI DY for the 1633 Broadway Whole Loan being greater than or equal to 5.75% for two consecutive calendar quarters; |
| ○ | (b) provided no event of default is continuing, the 1633 Broadway Borrower delivering to the lender as additional collateral and security a combination of one or more of the following reasonably acceptable to the lender: (x) sponsor guarantees (not to exceed an aggregate notional amount of $4,000,000), (y) letters of credit (not to exceed a notional amount, when aggregated with any sponsor guarantees, equal to 10% of the outstanding principal balance of the 1633 Broadway Whole Loan) and/or (z) cash collateral, which, if applied to the principal balance, would cause the NOI DY to equal or exceed 5.75%; or |
| ● | with regard to clause (iii), such financial reports having been received by the lender and indicating that no Cash Trap Event Period is ongoing. |
Additional Secured Indebtedness (not including trade debts).The 1633 Broadway Property also secures the 1633 Broadway Non-ServicedPari Passu Companion Loans, which have an aggregate Cut-off Date principal balance of $961,000,000 and the 1633 Broadway Subordinate Companion Loans, which have an aggregate Cut-off Date principal balance of $249,000,000. The 1633 Broadway Non-ServicedPari PassuCompanion Loans and the 1633 Broadway Subordinate Companion Loans are coterminous with the 1633 Broadway Mortgage Loan. The 1633 Broadway Non-ServicedPari PassuCompanion Loans and the 1633 Broadway Subordinate Companion Loans accrue interest at the same rate as the 1633 Broadway Mortgage Loan, 2.9900%. The 1633 Broadway Mortgage Loan and the 1633 Broadway Non-ServicedPari PassuCompanion Loans are eachpari passuin right of payment and together are senior in right of payment to the 1633 Broadway Subordinate Companion Loans. The holders of the 1633 Broadway Mortgage Loan, the 1633 Broadway Non-ServicedPari PassuCompanion Loans and the 1633 Broadway Subordinate Companion Loans have entered into a co-lender agreement which sets forth the allocation of collections on the 1633 Broadway Whole Loan. See “Description of the Mortgage Pool—The Whole Loans—The 1633 Broadway Pari Passu-A/B Whole Loan”.
The following table presents certain information relating to the 1633 Broadway Subordinate Companion Loans:
| B-Note Summary | |||||||||
B-Note Original Principal Balance | B-Note Interest Rate | Original Term (mos.) | Original Amort. Term (mos.) | Original IO Term (mos.) | Total Debt UW NCF DSCR | Total Debt UW NOI Debt Yield | Total Debt Cutoff Date LTV | ||
| 1633 Broadway Subordinate Companion Loan | $249,000,000 | 2.9900% | 120 | 0 | 120 | 3.08x | 9.5% | 52.1% | |
Mezzanine Loan and Preferred Equity. The direct or indirect equity owners of the 1633 Broadway Borrower are permitted to incur equityholder debt from an institutional lender secured by a pledge of their direct or indirect equity interests in the 1633 Broadway Borrower or to issue debt-like preferred equity so long as, among other conditions pursuant to the 1633 Broadway Whole Loan documents: (a) the lender and such institutional lender have entered into a customary subordination and intercreditor agreement reasonably acceptable to the lender, (b) such loan is coterminous with the 1633 Broadway Whole Loan or is freely pre-payable without premium or penalty from and after the maturity date of the 1633 Broadway Whole Loan, (c) immediately after giving effect to the closing of such loan, the net operating income debt yield (as calculated in the 1633 Broadway Whole Loan documents) is not less than 9.35%, (d) immediately after giving effect to the closing of such loan, the loan-to-value ratio (as calculated in the 1633 Broadway Whole Loan documents) does not exceed 52.08%, (e) immediately after giving effect to the closing of such loan, the net operating income debt service coverage ratio (as calculated in the 1633 Broadway Whole Loan documents) is not less than 3.08x, (f) such loan is current-pay only, with no “pay-in-kind” or similar accrual feature, (g) if the permitted equityholder debt bears a floating rate of interest, the borrower acquires and maintains an interest rate cap or swap agreement from a counterparty acceptable to the lender in its reasonable discretion with a notional amount that is not less than the outstanding principal balance of the permitted equityholder debt and with a reasonable strike price; (h) rating agency confirmation is obtained; and (i) the permitted equityholder debt is not closed prior to the date that is at least one year after the closing date of the 1633 Broadway Whole Loan. See “Description of the Mortgage Pool—Additional Indebtedness—Mezzanine Indebtedness” in the Preliminary Prospectus.
Release of Property.Not permitted.
Ground Lease. None.
Terrorism Insurance.The 1633 Broadway Whole Loan documents require that the “all risk” insurance policy required to be maintained by the 1633 Broadway Borrower, in an amount equal to the full replacement cost of the 1633 Broadway Property, contain no exclusion for damage or destruction caused by acts of terrorism, as well as business interruption insurance covering a period of restoration of 24 months and a 12-month extended period of indemnity (provided that if TRIPRA or a similar statute is not in effect, the 1633 Broadway Borrower will not be obligated to pay terrorism insurance premiums in excess of two times the annual premium for the casualty and business interruption coverage).
| This is not a research report and was not prepared by any Underwriter’s research department. Please see additional important information and qualifications at the end of this Term Sheet. |
T-114
(THIS PAGE INTENTIONALLY LEFT BLANK)
T-115
| Hospitality – Full Service | Loan #9 | Cut-off Date Balance: | $35,000,000 | |
| 3600 South Las Vegas Boulevard | Bellagio Hotel and Casino | Cut-off Date LTV: | 39.3% | |
| Las Vegas, NV 89109 | UW NCF DSCR: | 8.42x | ||
| UW NOI Debt Yield: | 28.3% |

| This is not a research report and was not prepared by any Underwriter’s research department. Please see additional important information and qualifications at the end of this Term Sheet. |
T-116
| Hospitality – Full Service | Loan #9 | Cut-off Date Balance: | $35,000,000 | |
| 3600 South Las Vegas Boulevard | Bellagio Hotel and Casino | Cut-off Date LTV: | 39.3% | |
| Las Vegas, NV 89109 | UW NCF DSCR: | 8.42x | ||
| UW NOI Debt Yield: | 28.3% |
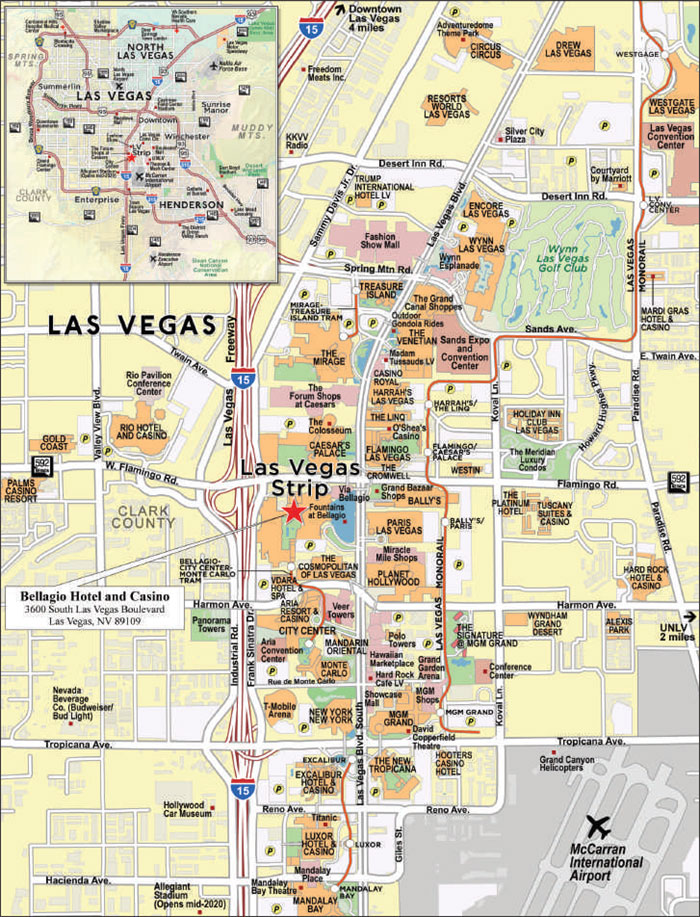
| This is not a research report and was not prepared by any Underwriter’s research department. Please see additional important information and qualifications at the end of this Term Sheet. |
T-117
| Mortgage Loan No. 9 – Bellagio Hotel and Casino |
| Mortgage Loan Information | Property Information | |||||||
| Mortgage Loan Seller: | MSMCH | Single Asset/Portfolio: | Single Asset | |||||
| Credit Assessment (DBRS/Fitch/S&P): | AAA(sf)/BBB-sf/NR | Location: | Las Vegas, NV 89109 | |||||
| Original Balance(1): | $35,000,000 | General Property Type: | Hospitality | |||||
| Cut-off Date Balance(1): | $35,000,000 | Detailed Property Type: | Full Service | |||||
| % of Initial Pool Balance: | 2.9% | Title Vesting: | Fee/Leasehold | |||||
| Loan Purpose: | Acquisition | Year Built/Renovated: | 1997/2019 | |||||
| Borrower Sponsor: | BREIT Operating Partnership L.P. | Size(5): | 3,933 rooms | |||||
| Guarantor: | BREIT Operating Partnership L.P. | Cut-off Date Balance per Room(1): | $426,189 | |||||
| Mortgage Rate(2): | 3.170153% | Maturity Date Balance per Room(1): | $426,189 | |||||
| Note Date: | 11/15/2019 | Property Manager: | Tenant-managed | |||||
| First Payment Date: | 1/5/2020 | |||||||
| Maturity Date: | 12/5/2029 | Underwriting and Financial Information(7) | ||||||
| Original Term to Maturity: | 120 months | UW NOI: | $474,065,315 | |||||
| Original Amortization Term: | 0 months | UW NOI Debt Yield(1)(7): | 28.3% | |||||
| IO Period: | 120 months | UW NOI Debt Yield at Maturity(1)(7): | 28.3% | |||||
| Seasoning: | 3 months | UW NCF DSCR(1)(7): | 8.42x | |||||
| Prepayment Provisions(3): | YM0.5 (27); DEF/YM0.5 (86); O (7) | Most Recent NOI: | $474,065,315 (9/30/2019 TTM) | |||||
| Lockbox/Cash Mgmt Status: | Hard/Springing | 2nd Most Recent NOI: | $489,866,042 (12/31/2018) | |||||
| Additional Debt Type(1): | Pari Passu/Subordinate | 3rd Most Recent NOI: | $505,736,234 (12/31/2017) | |||||
| Additional Debt Balance(1): | $1,641,200,000/$1,333,800,000 | Most Recent Occupancy(5): | 94.8% (9/30/2019) | |||||
| Future Debt Permitted (Type): | Yes (Mezzanine) | 2nd Most Recent Occupancy(5): | 94.9% (12/31/2018) | |||||
| Reserves(4) | 3rd Most Recent Occupancy(5): | 92.9% (12/31/2017) | ||||||
| Type | Initial | Monthly | Cap | Appraised Value (as of)(6): | $4,260,000,000 (10/16/2019) | |||
| RE Taxes: | $0 | Springing | N/A | Appraised Value per Room: | $1,083,143 | |||
| Insurance: | $0 | Springing | N/A | Cut-off Date LTV Ratio(1)(6): | 39.3% | |||
| Replacement Reserve: | $0 | Springing | N/A | Maturity Date LTV Ratio(1)(6): | 39.3% | |||
Sources and Uses | ||||||
| Sources | Proceeds | % of Total | Uses | Proceeds | % of Total | |
| Senior Loan Amount(1): | $1,676,200,000 | 39.3% | Purchase Price: | $4,250,000,000 | 99.8% | |
| Subordinate Loan Amount: | $1,333,800,000 | 31.3% | Closing Costs: | $10,591,035 | 0.2% | |
| Borrower Equity(8): | $1,250,591,035 | 29.4% | ||||
| Total Sources: | $4,260,591,035 | 100.0% | Total Uses: | $4,260,591,035 | 100.0% | |
| (1) | The Bellagio Hotel and Casino Mortgage Loan (as defined below) is part of the Bellagio Hotel and Casino Whole Loan (as defined below), which is comprised of 24pari passusenior promissory notes in the aggregate original principal amount of $1,676,200,000 (the “Bellagio Hotel and Casino Senior Notes,” and collectively, the “Bellagio Hotel and Casino Senior Loan”), six promissory notes in the aggregate original principal amount of $650,500,000 which arepari passu with each other and subordinate to the Bellagio Hotel and Casino Senior Notes (the “Bellagio Hotel and Casino Junior A Notes”), and three promissory notes with an aggregate principal balance of $683,300,000 which arepari passu with each other and subordinate to the Bellagio Hotel and Casino Senior Notes and the Bellagio Hotel and Casino Junior A Notes (the “Bellagio Hotel and Casino Junior B Notes” and collectively with the Bellagio Hotel and Casino Junior A Notes, the “Bellagio Hotel and Casino Subordinate Companion Loan”). The Cut-off Date Balance per Room, Maturity Date Balance per Room, UW NCF DSCR, UW NOI Debt Yield, UW NOI Debt Yield at Maturity, Cut-off Date LTV Ratio and Maturity Date LTV Ratio numbers presented above are based on the Bellagio Hotel and Casino Senior Loan. The Cut-off Date Balance per Room, Maturity Date Balance per Room, UW NCF DSCR, UW NOI Debt Yield, UW NOI Debt Yield at Maturity, Cut-off Date LTV Ratio and Maturity Date LTV Ratio based on the Bellagio Hotel and Casino Whole Loan are $765,319, $765,319, 4.24x/4.06x, 15.7%/15.1%, 15.7%/15.1%, 70.7% and 70.7%, respectively. The Bellagio Hotel and Casino Whole Loan was co-originated by MSBNA, JPMCB and CREFI (all as defined below). |
| (2) | Reflects the Bellagio Hotel and Casino Senior Notes only. The Bellagio Hotel and Casino Junior A Notes also accrue interest at the rate of 3.170153% per annum. The Bellagio Hotel and Casino Junior B Notes accrue interest at the rate of 5.350000%per annum. |
| (3) | The assumed defeasance lockout period of 27 payments is based on the closing date of this transaction in March 2020. The Bellagio Hotel and Casino Whole Loan may be prepaid in whole or in part at any time, subject to payment of the greater of 0.5% of the amount prepaid and the applicable yield maintenance premium if such prepayment occurs prior to June 5, 2029. |
| (4) | See “Escrows and Reserves” below for further discussion of reserve requirements. |
| (5) | Size and Occupancy are based solely on the hotel at the Bellagio Hotel and Casino Property (as defined below). As of the trailing twelve months ending September 30, 2019, approximately 29.6% of revenues were from gaming, 28.4% from hotel, 24.7% from food & beverage, 9.0% from entertainment and 8.3% from other sources. |
| (6) | The Appraised Value of $4,260,000,000 set forth above is the appraised value solely with respect to real property at the Bellagio Hotel and Casino Property, excluding personal property and intangible property attributable to the Bellagio Hotel and Casino Property (the “As-Is Real Property Appraised Value”). The appraisal also includes an “As Leased-Sale-Leaseback Appraised Value,” which is equal to the As-Is Real Property Appraised Value. The appraisal also included an Appraised Value of $6,500,000,000 (“As-Is Total Appraised Value”), which includes personal property and intangible property attributable to the Bellagio Hotel and Casino Property. The personal property and intangible property relating to the Bellagio Hotel and Casino Property are owned by the Bellagio Tenant (as defined below), as more particularly provided in the Bellagio Lease (as defined below). The Bellagio Tenant granted a security interest in certain property of Bellagio Tenant (with certain exclusions as more particularly described in the Bellagio Lease) in favor of the Bellagio Hotel and Casino Borrower (as defined below), and such security interest was collaterally assigned by the Bellagio Hotel and Casino Borrower to the lender. The Cut-off Date LTV Ratio and LTV Ratio at Maturity based on the As-Is Total Appraised Value are 46.3% and 46.3%, respectively, based on the Bellagio Hotel and Casino Whole Loan and 25.8% and 25.8%, respectively, based on the Bellagio Hotel and Casino Senior Loan. |
| (7) | The Bellagio Hotel and Casino Property was acquired by the Bellagio Hotel and Casino Borrower in a sale-leaseback transaction from Bellagio, LLC, an indirectly wholly owned subsidiary of MGM Resorts International, which entered into a new 30-year lease, with two 10-year extension options to operate the Bellagio Hotel and Casino Property. The Bellagio Tenant owns a 5% equity interest in the Bellagio Hotel and Casino Borrower. Financial and other information presented in this term sheet is presented on a “look through” basis, before rent due under the Bellagio Lease. For so long as the Bellagio Lease is in effect, the Bellagio Hotel and Casino Borrower will be entitled only to the rent due under the Bellagio Lease and not to the underlying rent and other income from the Bellagio Hotel and Casino Property. The initial Bellagio Lease annual rent is $245,000,000, and debt service coverage ratio, debt yield and debt yield at maturity for the Bellagio Hotel and Casino Whole Loan based on such initial annual rent are 2.19x, 8.1% and 8.1%, respectively. |
| (8) | Includes MGM’s approximately $62.4 million of retained equity interest in the Bellagio Hotel and Casino Property after the sale-leaseback. |
| This is not a research report and was not prepared by any Underwriter’s research department. Please see additional important information and qualifications at the end of this Term Sheet. |
T-118
| Hospitality – Full Service | Loan #9 | Cut-off Date Balance: | $35,000,000 | |
| 3600 South Las Vegas Boulevard | Bellagio Hotel and Casino | Cut-off Date LTV: | 39.3% | |
| Las Vegas, NV 89109 | UW NCF DSCR: | 8.42x | ||
| UW NOI Debt Yield: | 28.3% |
The Mortgage Loan. The ninth largest mortgage loan (the “Bellagio Hotel and Casino Mortgage Loan”) is part of a whole loan (the “Bellagio Hotel and Casino Whole Loan”) in the original principal amount of $3,010,000,000. The Bellagio Hotel and Casino Whole Loan is secured by a first priority fee and leasehold mortgage encumbering a hotel in Las Vegas, Nevada (the “Bellagio Hotel and Casino Property” or “Bellagio” or “Property”). The Bellagio Hotel and Casino Whole Loan was co-originated by Morgan Stanley Bank, N.A. (“MSBNA”), JPMorgan Chase Bank, National Association (“JPMCB”) and Citi Real Estate Funding Inc. (“CREFI”). The Bellagio Hotel and Casino Whole Loan is comprised of (i) the Bellagio Hotel and Casino Senior Loan, comprised of 24 senior notes in the aggregate original principal amount of $1,676,200,000, (ii) the Bellagio Hotel and Casino Junior A Notes, comprised of six subordinate notes that arepari passuwith each other and subordinate to the Bellagio Hotel and Casino Senior Notes, with an aggregate original principal amount of $650,500,000, and (iii) the Bellagio Hotel and Casino Junior B Notes, comprised of three subordinate notes that arepari passu with each other and subordinate to the Bellagio Hotel and Casino Senior Notes and the Bellagio Hotel and Casino Junior A Notes, with an aggregate original principal amount of $683,300,000, each as described in the table below. Note A-1-C5 in the original principal amount of $35,000,000, which is being contributed by Morgan Stanley Mortgage Capital Holdings LLC (“MSMCH”), represents the Bellagio Hotel and Casino Mortgage Loan and will be included in the BANK 2020-BNK26 securitization trust. Of the remaining Bellagio Hotel and Casino Senior Notes (collectively, the “Bellagio Hotel and Casino Non-ServicedPari PassuCompanion Loans”), the Bellagio Hotel and Casino Non-ServicedPari PassuCompanion Loans evidenced by Notes A-1-S1, A-1-S2, A-2-S1, A-2-S2, A-3-S1, and A-3-S2 in the aggregate original principal amount of $716,000,000, as well as $510,700,000 of the Bellagio Hotel and Casino Junior A Notes and all of the Bellagio Hotel and Casino Junior B Notes were contributed to the BX 2019-OC11 securitization trust. In addition, $360,200,000 of the Bellagio Hotel and Casino Senior Notes and $139,800,000 of the Bellagio Hotel and Casino Junior A Notes were sold in a private sale to a third party purchaser. The Bellagio Hotel and Casino Whole Loan will be serviced pursuant to the trust and servicing agreement for the BX 2019-OC11 securitization trust. The remaining Bellagio Hotel and Casino Non-ServicedPari Passu Companion Loans, which had an aggregate original principal amount of $565,000,000, have been or are expected to be contributed to future securitization trusts or may be otherwise transferred at any time. See “Description of the Mortgage Pool—The Whole Loans—Bellagio Hotel and Casino Pari Passu-A/B Whole Loan” and “Pooling and Servicing Agreement—Servicing of the Non-Serviced Mortgage Loans” in the Preliminary Prospectus.
| Bellagio Hotel and Casino Whole Loan Summary | ||||
| Notes | Original Balance | Cut-off Date Balance | Anticipated Note Holder | Controlling Piece |
| Bellagio Hotel and Casino Mortgage Loan | ||||
| A-1-C5 | $35,000,000 | $35,000,000 | BANK 2020-BNK26 | No |
| Bellagio Hotel and Casino Non-ServicedPari Passu Companion Loans | ||||
| A-1-S1, A-1-S2, A-2-S1, A-2-S2, A-3-S1, A-3-S2 | $716,000,000 | $716,000,000 | BX 2019-OC11 | Yes(1) |
| A-1-RL, A-2-RL, A-3-RL | $360,200,000 | $360,200,000 | Third party | No |
| A-1-C2, A-1-C4 | $100,000,000 | $100,000,000 | MSBNA | No |
| A-1-C1 | $100,000,000 | $100,000,000 | BANK 2020-BNK25 | No |
| A-2-C1 | $60,000,000 | $60,000,000 | GSMS 2020-GC45 | No |
| A-1-C3 | $65,000,000 | $65,000,000 | MSC 2020-L4 | No |
| A-2-C3, A-3-C5 | $55,000,000 | $55,000,000 | Benchmark 2020-IG1(2) | No |
| A-2-C2, A-3-C2 | $60,000,000 | $60,000,000 | Benchmark 2020-B16 | No |
| A-2-C4 | $20,000,000 | $20,000,000 | CREFI | No |
| A-3-C1, A-3-C6 | $61,250,000 | $61,250,000 | JPMCB | No |
| A-3-C3, A-3-C4 | $43,750,000 | $43,750,000 | BBCMS 2020-C6 | No |
| Bellagio Hotel and Casino Junior A Notes | ||||
| B-1-S, B-2-S, B-3-S | $510,700,000 | $510,700,000 | BX 2019-OC11 | No(3) |
| B-1-RL, B-2-RL, B-3-RL | $139,800,000 | $139,800,000 | Third party | No(3) |
| Bellagio Hotel and Casino Junior B Notes | ||||
| C-1-S, C-2-S, C-3-S | $683,300,000 | $683,300,000 | BX 2019-OC11 | No(3) |
| Total | $3,010,000,000 | $3,010,000,000 | ||
| (1) | Note A-1-S1 is the controlling note. |
| (2) | Anticipated to be contributed on the closing date of such securitization. |
| (3) | The Bellagio Hotel and Casino Junior A Notes are subordinate to the Bellagio Hotel and Casino Senior Notes, and the Bellagio Hotel and Casino Junior B Notes are subordinate to the Bellagio Hotel and Casino Senior Notes and the Bellagio Hotel and Casino Junior A Notes. |
The Borrower and the Borrower Sponsor. The borrower is BCORE Paradise LLC (the “Bellagio Hotel and Casino Borrower”), a Delaware limited liability company and single purpose entity with two independent directors. BREIT Operating Partnership L.P. (“BREIT OP”) is the borrower sponsor and the non-recourse carveout guarantor. BREIT OP is a subsidiary of Blackstone Real Estate Investment Trust, Inc. (“BREIT”). BREIT is a non-traded REIT focused on investing in commercial real estate properties diversified by sector with an emphasis on providing investors with access to Blackstone’s institutional real estate investment platform. BREIT seeks to directly own stabilized income-generating U.S. commercial real estate across the key property types, including multifamily, industrial, retail, hotel, healthcare and office. BREIT is managed by an external advisor, BX REIT Advisors L.L.C., which is an affiliate of The Blackstone Group Inc. (“Blackstone”). Blackstone’s real estate assets under management included 144,000 hotel rooms as of June 30, 2019, making the firm one of the largest hospitality investors in the United States. Blackstone’s experience of owning and managing hotels includes Cosmopolitan Las Vegas, Hotel Del Coronado, Grand Wailea, Arizona Biltmore, Ritz Carlton Kapalua, and Turtle Bay Resort.
The non-recourse carveout guarantor’s liability for bankruptcy related recourse events is capped at an amount equal to 10% of the outstanding principal balance of the Bellagio Hotel and Casino Whole Loan as of the date of the event. In addition, only the related single purpose entity borrower, and not the non-recourse carveout guarantor, is liable for breaches of environmental covenants, and the single purpose entity borrower is the only party liable under the environmental indemnity;provided, however, that if the Bellagio Hotel and Casino Borrower fails to maintain an environmental insurance policy required under the Bellagio Hotel and Casino Whole Loan documents, the non-recourse carveout guarantor is liable for losses other than (x) for any
| This is not a research report and was not prepared by any Underwriter’s research department. Please see additional important information and qualifications at the end of this Term Sheet. |
T-119
| Hospitality – Full Service | Loan #9 | Cut-off Date Balance: | $35,000,000 | |
| 3600 South Las Vegas Boulevard | Bellagio Hotel and Casino | Cut-off Date LTV: | 39.3% | |
| Las Vegas, NV 89109 | UW NCF DSCR: | 8.42x | ||
| UW NOI Debt Yield: | 28.3% |
amounts in excess of the applicable coverage amounts under the environmental policy had the same been renewed, replaced or extended as required under the loan agreement and (y) for any amounts recovered under the environmental policy. In addition, recourse for transfers of the Bellagio Hotel and Casino Property or controlling equity interests in the Bellagio Hotel and Casino Borrower is loss recourse, rather than full recourse.
The Property. The Bellagio Hotel and Casino Property is a full-service luxury resort and casino property located on the Las Vegas Strip, between The Cosmopolitan and Caesar’s Palace, and across from the Paris Las Vegas Hotel & Casino and Bally’s Las Vegas Hotel & Casino. The Bellagio covers approximately 77 acres and consists of 3,933 hotel rooms and suites in two hotel towers – the Main Tower and the Spa Tower. The Main Tower offers panoramic views of the Las Vegas Strip and the Fountains of Bellagio. The Property contains approximately 154,000 SF of casino space, featuring approximately 1,700 slot machines and 144 gaming tables, approximately 200,000 SF of event space, 29 food and beverage outlets, an approximately 55,000 SF spa, five swimming pools, approximately 85,000 SF of retail space featuring approximately 30 retailers, and a botanical garden. The Bellagio is also the home to Cirque du Soleil’s “O”, an aquatic, acrobatic theater production that has been in residence at the Bellagio since October 1998. Guestrooms range from one to three bedrooms. Standard room amenities include a flat-panel television, high-speed internet and 24-hour in room dining. The guest bathrooms are finished with porcelain tile flooring and tub/shower surrounds, granite vanity countertops, and wall-mounted lighting fixtures. Additional amenities include access to five outdoor swimming pools with 51 private cabanas, four whirlpools, two wedding chapels, a fitness center, a spa, a salon and barber shop, concierge services, the Fountains of Bellagio, the Bellagio Gallery of Fine Art, the Conservatory and Botanical Gardens, on-site entertainment, retail outlets, a FedEx business center and transportation services.
As of the trailing twelve months ending September 30, 2019, approximately 29.6% of revenues were from gaming, 28.4% from hotel, 24.7% from food & beverage, 9.0% from entertainment and 8.3% from other sources.
Approximately $371.9 million (approximately $94,600 per key) has been invested in the Bellagio since 2010, including approximately $165 million on rooms renovations (approximately $42,000 per key). In 2011-2012 the Property underwent a $66.6 million renovation on the Main Tower and a $39.7 million renovation on the Spa Tower. ADR increased 2.9% from 2011 to 2012 and an additional 2.8% from 2012 to 2013. In 2014 and 2015 the Property underwent a $59.1 million renovation on the suites in the Main Tower. Total hotel operating revenue increased to approximately $363.7 million in 2016, representing a 6.3% year over year increase compared to 2015. ADR increased 5.1% year over year and RevPAR increased 5.5% in the same time period. Approximately $12.8 million was spent on the renovation of Sadelle’s and Spago restaurants. Sadelle’s replaced Café Bellagio in December 2018 and Spago opened in June 2018, replacing Todd English Olives.
The Bellagio Hotel and Casino Property was acquired by the Bellagio Hotel and Casino Borrower in a sale-leaseback transaction from Bellagio, LLC (the “Bellagio Tenant”), an indirectly wholly owned subsidiary of MGM Resorts International (“MGM”), which entered into a new 30-year lease, with two 10-year extension options (the “Bellagio Lease”) to operate the Property. Under the Bellagio Lease, the Bellagio Tenant is required to pay to the Bellagio Hotel and Casino Borrower an initial lease rent of $245.0 millionper annum(the “Bellagio Lease Rent”), subject to annual increases of (i) 2.0% for the first ten years of the lease term, and (ii) thereafter, the greater of 2.0% or the United States Department of Labor, Bureau of Labor Statistics Revised Consumer Price Index for All Urban Consumers (1982-84=100), U.S. City Average (“CPI”) (capped at 3.0% in years 11-20 and 4.0% thereafter) for the remainder of the initial lease term. MGM (NYSE: MGM, rated Ba3/BB/BB- by Moody’s, Fitch and S&P) guarantees the payment and performance of all monetary obligations and certain other obligations of Bellagio Tenant under the Bellagio Lease. In connection with the sale-leaseback, the Bellagio Tenant is required under the Bellagio Lease to make capital improvements intended to ensure that the Property remains competitive with other top tier Las Vegas Strip offerings going forward. For the four year period from 2020 through 2023, under the Bellagio Lease, the Bellagio Tenant is required to spend 5.0% of net revenues (subject to a minimum of $275.0 million total) on capital expenditures, in the aggregate. During each four year period (on a rolling basis) beginning in 2024 through the end of the Bellagio Hotel and Casino Whole Loan term, the Bellagio Tenant is required to spend 3.0% of net revenues on capital expenditures. Under the terms of the Bellagio Lease, the Bellagio Tenant is also required to reserve on a monthly basis 1.5% of net revenues each year to fund capital expenditures (which are made available to the Bellagio Tenant for capital expenditures and FF&E).
The Bellagio Property includes a variety of retail tenants, including brands such as Chanel, Tiffany & Co., Gucci, Hermes, Christian Dior, Breguet and Harry Winston. The retail space totals approximately 85,000 SF and generated approximately $54.6 million in revenue as of December 31, 2018. The Bellagio Tenant is currently budgeting for the addition of a luxury retail store in the Bellagio Property lobby. We cannot assure you that this change will occur as expected or at all.
The hotel component of the Bellagio has maintained an occupancy at or above 92.3% since 2006 with an 11-year average occupancy of 93.4%. As of TTM September 2019, the Bellagio had an average of 3,933 rooms available with an occupancy of 94.8%, an ADR of $281.69 and a RevPAR of $267.18.
| Hotel Performance(1) | |||||||||||||
| 2008 | 2009 | 2010 | 2011 | 2012 | 2013 | 2014 | 2015 | 2016 | 2017 | 2018 | TTM Sept. 2019 | 11-Year Avg.(2) | |
| Occupancy | 95.0% | 94.2% | 92.5% | 93.3% | 92.9% | 92.3% | 93.1% | 93.2% | 93.5% | 92.9% | 94.9% | 94.8% | 93.4% |
| ADR | $261 | $204 | $204 | $230 | $237 | $243 | $254 | $257 | $270 | $276 | $278 | $282 | $247 |
| RevPAR | $248 | $192 | $189 | $215 | $220 | $225 | $236 | $240 | $253 | $257 | $264 | $267 | $231 |
| Room Revenue ($mm) | $349.9 | $271.2 | $271.1 | $297.3 | $311.5 | $321.7 | $337.6 | $342.2 | $363.7 | $368.1 | $378.9 | $382.8 | $328.5 |
| (1) | The financial information presented in this table is consistent with the manner in which MGM management assesses these results and allocates resources. Accordingly, the results and information presented in this table may differ, in some respects, from how such results and information would be presented in standalone financial statements. |
| (2) | Average excludes TTM September 2019. |
| This is not a research report and was not prepared by any Underwriter’s research department. Please see additional important information and qualifications at the end of this Term Sheet. |
T-120
| Hospitality – Full Service | Loan #9 | Cut-off Date Balance: | $35,000,000 | |
| 3600 South Las Vegas Boulevard | Bellagio Hotel and Casino | Cut-off Date LTV: | 39.3% | |
| Las Vegas, NV 89109 | UW NCF DSCR: | 8.42x | ||
| UW NOI Debt Yield: | 28.3% |
The Property contains approximately 154,000 SF of casino space, featuring approximately 1,700 slot machines and 144 gaming tables. The casino facilities include table games such as blackjack, craps, roulette, baccarat and poker.
| Casino Performance(1) | |||||||||||||
| 2008 | 2009 | 2010 | 2011 | 2012 | 2013 | 2014 | 2015 | 2016 | 2017 | 2018 | 5-Year Avg. | 11-Year Avg. | |
| Slot Units | 2,376 | 2,298 | 2,250 | 2,205 | 2,100 | 2,118 | 2,063 | 1,935 | 1,873 | 1,827 | 1,732 | 1,886 | 2,071 |
| Table Units | 151 | 153 | 154 | 152 | 147 | 146 | 144 | 146 | 145 | 145 | 144 | 145 | 148 |
| Gaming Revenue ($mm) | $352.75 | $306.87 | $289.51 | $319.11 | $298.61 | $335.58 | $381.50 | $369.71 | $439.66 | $435.93 | $422.86 | $409.93 | $359.28 |
| % Change in Gaming Revenue | - | -13.0% | -5.7% | 10.2% | -6.4% | 12.4% | 13.7% | -3.1% | 18.9% | -0.8% | -3.0% | N/A | N/A |
(1) Information provided by the borrower sponsor.
Market Overview. Visitor volume and airport passenger traffic into the Las Vegas region have more than doubled from 1990 to 2018. In connection with the financial downturn in 2008 and 2009, the Las Vegas Market generally experienced a contraction. During 2010, the market began to rebound and visitation has returned to or near peak levels. 2018 Year-over-Year, Airport Passenger Traffic is up 2.5% and Clark County Gaming Revenues are up 2.7%.
| Category | 1990 | 2009 | 2010 | 2011 | 2012 | 2013 | 2014 | 2015 | 2016 | 2017 | 2018 |
| Visitor Volume (thousands) | 20,954 | 36,351 | 37,335 | 38,929 | 39,727 | 39,668 | 41,127 | 42,312 | 42,936 | 42,214 | 42,117 |
| YoY % Change | NAP | -3.0% | 2.7% | 4.3% | 2.0% | -0.1% | 3.7% | 2.9% | 1.5% | -1.7% | -0.2% |
| Clark County Gaming Revenues ($mm) | $4,104 | $8,838 | $8,909 | $9,223 | $9,400 | $9,674 | $9,554 | $9,618 | $9,714 | $9,979 | $10,250 |
| YoY % Change | NAP | -9.8% | 0.8% | 3.5% | 1.9% | 2.9% | -1.2% | 0.7% | 1.0% | 2.7% | 2.7% |
| Hotel / Motel Rooms Inventory | 73,730 | 148,941 | 148,935 | 150,161 | 150,481 | 150,593 | 150,544 | 149,213 | 149,339 | 148,896 | 149,158 |
| YoY % Change | NAP | 6.0% | 0.0% | 0.8% | 0.2% | 0.1% | 0.0% | -0.9% | 0.1% | -0.3% | 0.2% |
| Airport Passenger Traffic (thousands) | 19,090 | 40,469 | 39,757 | 41,481 | 41,668 | 41,857 | 42,885 | 45,389 | 47,435 | 48,500 | 49,717 |
| YoY % Change | NAP | -8.2% | -1.8% | 4.3% | 0.5% | 0.5% | 2.5% | 5.8% | 4.5% | 2.2% | 2.5% |
| Convention Attendance (thousands) | 1,742 | 4,492 | 4,473 | 4,865 | 4,944 | 5,107 | 5,195 | 5,891 | 6,311 | 6,646 | 6,502 |
| YoY % Change | NAP | -23.9% | -0.4% | 8.8% | 1.6% | 3.3% | 1.7% | 13.4% | 7.1% | 5.3% | -2.2% |
Source: Las Vegas marketing organization website.
The Las Vegas Strip has traditionally enjoyed high occupancy rates compared to the national average. From 2014 to year to date May 2019, occupancy across the Las Vegas Strip increased from 88.8% to 90.3%. ADR for the Las Vegas Strip increased by approximately 18.3% from $126 in 2014 to $149 for year to date May 2019. Improving trends in ADR have been driven by more properties adding resort fees, improvement in the convention segment, as well as the addition of higher-quality room supply.
| Historical Occupancy, ADR, RevPAR | |||||||||
| Competitive Set | Bellagio Property | Penetration Factor | |||||||
| Year | Occupancy | ADR | RevPAR | Occupancy | ADR | RevPAR | Occupancy | ADR | RevPAR |
| 2018 | 91.1% | $281.66 | $257.01 | 94.9% | $278.28 | $264.19 | 104.2% | 98.8% | 102.8% |
Source: Appraisal.
The primary competitive set for the Bellagio Hotel and Casino Property comprises five hotels located on the Las Vegas Strip. These properties total 22,840 rooms and include the 4,004 room Aria Resort & Casino, 4,748 room Wynn/Encore Resort and Casino, 7,117 room Venetian/Palazzo Resort and Casino, 2,995 room Cosmopolitan Resort and Casino and 3,976 room Caesar's Palace.
| Property Competitive Summary | |||||||
| Property Name | No. of Rooms | Year Opened | Meeting Space (SF) | Gaming Space (SF) | Estimated 2018 Occ. | Estimated 2018 ADR | Estimated 2018 RevPAR |
| Bellagio Hotel and Casino Property | 3,933 | 1998 | 200,000 | 154,000 | 94.9% | $278.28 | $264.19 |
| Aria Resort & Casino | 4,004 | 2009 | 500,000 | 150,000 | 91.0% | $265.00 | $241.15 |
| Wynn/Encore Resort and Casino | 4,748 | 2006/2008 | 290,000 | 191,424 | 90.0% | $300.00 | $270.00 |
| Venetian/Palazzo Resort and Casino | 7,117 | 1999/2010 | 450,000 | 335,878 | 91.0% | $295.00 | $268.45 |
| Cosmopolitan Resort and Casino | 2,995 | 2010 | 152,000 | 68,981 | 95.0% | $325.00 | $308.75 |
| Caesar's Palace | 3,976 | 1966 | 300,000 | 124,200 | 90.0% | $220.00 | $198.00 |
Source: Appraisal.
| This is not a research report and was not prepared by any Underwriter’s research department. Please see additional important information and qualifications at the end of this Term Sheet. |
T-121
| Hospitality – Full Service | Loan #9 | Cut-off Date Balance: | $35,000,000 | |
| 3600 South Las Vegas Boulevard | Bellagio Hotel and Casino | Cut-off Date LTV: | 39.3% | |
| Las Vegas, NV 89109 | UW NCF DSCR: | 8.42x | ||
| UW NOI Debt Yield: | 28.3% |
Operating History and Underwritten Net Cash Flow.The following table presents certain information relating to the Underwritten Net Cash Flow at the Bellagio Hotel and Casino Property:
| Cash Flow Analysis(1) | ||||||
| 2016 | 2017 | 2018 | TTM 9/30/2019 | UW | UW per Room | |
| Occupancy | 93.5% | 92.9% | 94.9% | 94.8% | 94.8% | |
| ADR | $270.29 | $276.24 | $278.28 | $281.69 | $281.69 | |
| RevPAR | $252.78 | $256.53 | $264.19 | $267.18 | $267.18 | |
| Room Revenue | $363,677,441 | $368,058,522 | $378,860,233 | $382,839,838 | $382,839,838 | $97,340 |
| F&B Revenue | $347,665,102 | $341,830,126 | $334,447,851 | $333,149,122 | $333,149,122 | $84,706 |
| Gaming | $439,662,976 | $435,933,726 | $422,862,787 | $399,769,284 | $399,769,284 | $101,645 |
| Entertainment | $121,953,371 | $119,207,719 | $120,427,525 | $121,762,603 | $121,762,603 | $30,959 |
| Other Revenue(2) | $91,179,322 | $100,540,676 | $111,236,871 | $111,541,617 | $111,541,617 | $28,360 |
| Total Revenue | 1,364,138,212 | $1,365,570,769 | $1,367,835,267 | $1,349,062,464 | $1,349,062,464 | $343,011 |
| Room Expense | $105,289,765 | $107,330,702 | $111,385,859 | $111,344,926 | $111,344,926 | $28,310 |
| F&B Expense | $266,202,142 | $258,789,184 | $257,609,113 | $256,340,473 | $256,340,473 | $65,177 |
| Other Department Expenses(2) | $335,693,118 | $322,639,400 | $332,481,659 | $330,066,360 | $330,066,360 | $83,922 |
| Total Department Expenses | $707,185,025 | $688,759,286 | $701,476,631 | $697,751,759 | $697,751,759 | $177,410 |
| Gross Operating Inc. | $656,953,187 | $676,811,483 | $666,358,636 | $651,310,705 | $651,310,705 | $165,602 |
| Total Undistributed Expenses | $128,812,269 | $127,583,150 | $128,495,099 | $128,324,048 | $128,324,048 | $32,628 |
| Gross Operating Profit | $528,140,918 | $549,228,333 | $537,863,537 | $522,986,657 | $522,986,657 | $132,974 |
| Management Fee | $26,957,472 | $24,326,134 | $26,005,109 | $26,682,737 | $26,682,737 | $6,784 |
| Taxes | $17,112,907 | $16,070,971 | $18,230,324 | $17,763,857 | $17,763,857 | $4,517 |
| Insurance | $3,248,444 | $3,094,994 | $3,762,062 | $4,474,748 | $4,474,748 | $1,138 |
| Total Fixed Charges | $20,361,351 | $19,165,965 | $21,992,386 | $22,238,605 | $22,238,605 | $5,654 |
| Total Operating Exp. | $883,316,117 | $859,834,535 | $877,969,225 | $874,997,149 | $874,997,149 | $222,476 |
| Net Operating Income | $480,822,095 | $505,736,234 | $489,866,042 | $474,065,315 | $474,065,315 | $120,535 |
| FF&E | $0 | $0 | $0 | $0 | $20,235,937 | $5,145 |
| Net Cash Flow | $480,822,095 | $505,736,234 | $489,866,042 | $474,065,315 | $453,829,378 | $115,390 |
| NOI DSCR(3) | 8.92x | 9.39x | 9.09x | 8.80x | 8.80x | |
| NCF DSCR(1)(3) | 8.92x | 9.39x | 9.09x | 8.80x | 8.42x | |
| NOI Debt Yield(1)(3) | 28.7% | 30.2% | 29.2% | 28.3% | 28.3% | |
| NCF Debt Yield(3) | 28.7% | 30.2% | 29.2% | 28.3% | 27.1% | |
| (1) | The information above is presented on a “look through” basis, before rent due under the Bellagio Lease. For so long as the Bellagio Lease is in effect, the Bellagio Hotel and Casino Borrower will be entitled only to the rent due under the Bellagio Lease and not to the underlying rent and other income from the Bellagio Hotel and Casino Property. The initial Bellagio Lease annual rent is $245,000,000, and the debt service coverage ratio and the debt yield for the Bellagio Hotel and Casino Whole Loan based on such initial annual rent are 2.19x and 8.1%, respectively. |
| (2) | Other Revenue and Other Department Expenses include retail and other operations. |
| (3) | Based off of the Bellagio Hotel and Casino Senior Loan, and excludes the Bellagio Hotel and Casino Subordinate Companion Loan. |
Escrows and Reserves.
Real Estate Taxes – For so long as the Bellagio Hotel and Casino Property is subject to the Bellagio Lease, no reserves for real estate taxes are required under the Bellagio Hotel and Casino Whole Loan documents. If the Bellagio Hotel and Casino Property is not subject to the Bellagio Lease, solely if a Cash Trap Period (as defined below) is in effect, the Bellagio Hotel and Casino Whole Loan documents provide for ongoing monthly reserves for real estate taxes in an amount equal to 1/12 of the real estate taxes that the lender estimates will be payable during the next twelve months. Notwithstanding the foregoing, the requirement for such monthly reserves will be reduced dollar for dollar by any taxes paid or reserved for by a brand manager or casino operator pursuant to a brand management or casino management agreement relating to the Bellagio Hotel and Casino Property.
Insurance– For so long as the Bellagio Hotel and Casino Property is subject to the Bellagio Lease, no reserves for insurance premiums are required under the Bellagio Hotel and Casino Whole Loan documents. If the Bellagio Hotel and Casino Property is not subject to the Bellagio Lease, solely if a Cash Trap Period is in effect, the Bellagio Hotel and Casino Whole Loan documents provide for ongoing monthly reserves for insurance premiums in an amount equal to 1/12 of the insurance premiums that the lender estimates will be payable for the renewal of the insurance policies. Notwithstanding the foregoing, the requirement for such monthly reserves will be reduced dollar for dollar by any insurance premiums paid or reserved for by a brand manager or casino operator pursuant to a brand management or casino management agreement relating to the Bellagio Hotel and Casino Property. In
| This is not a research report and was not prepared by any Underwriter’s research department. Please see additional important information and qualifications at the end of this Term Sheet. |
T-122
| Hospitality – Full Service | Loan #9 | Cut-off Date Balance: | $35,000,000 | |
| 3600 South Las Vegas Boulevard | Bellagio Hotel and Casino | Cut-off Date LTV: | 39.3% | |
| Las Vegas, NV 89109 | UW NCF DSCR: | 8.42x | ||
| UW NOI Debt Yield: | 28.3% |
addition, such monthly reserves will not be required so long as (i) no event of default is continuing, and (ii) the insurance coverage for the Bellagio Hotel and Casino Property is included in a blanket policy reasonably acceptable to the lender.
Recurring Replacements – For so long as the Bellagio Hotel and Casino Property is subject to the Bellagio Lease, no reserves for replacements are required under the Bellagio Hotel and Casino Whole Loan documents. If the Bellagio Hotel and Casino Property is not subject to the Bellagio Lease, the Bellagio Hotel and Casino Whole Loan documents provide for monthly deposits into a replacement reserve equal to (i) on each payment date during a Cash Trap Period, the Replacement Reserve Monthly Deposit (as defined below) and (ii) if a Cash Trap Period does not exist, on the first payment date of each calendar quarter, an amount equal to the lesser of (x) the positive difference between (A) the aggregate amount of Replacement Reserve Monthly Deposits that would have been funded during the calendar year to date and (B) the sum of the aggregate amount for the calendar year to date of funds expended on replacements, property improvement plan work (“PIP Work”) and brand mandated work and any amounts actually deposited into the replacement reserve, and (y) from and after January 1, 2024, for each four year period commencing on January 1, 2020, the positive difference between (A) (i) 4.0% of net revenue from guest rooms and borrower-managed food and beverage operations and (ii) 0.5% of all other net revenue (other than non-recurring items), in each case during such four year period and (B) the sum of the aggregate amount expended on replacements, PIP Work and brand mandated work and any amounts actually deposited into the replacement reserve, in each case during such four year period. Notwithstanding the foregoing, the requirement for such reserves will be reduced dollar for dollar by any reserves for replacements, PIP Work or brand mandated work reserved for by a brand manager or casino operator pursuant to a brand management or casino management agreement relating to the Bellagio Hotel and Casino Property.
“Replacement Reserve Monthly Deposit” means an amount equal to (i) 4.0% of net revenue from guest rooms and borrower-managed food and beverage operations for the calendar month that is two calendar months prior to the calendar month in which the applicable deposit to the replacement reserve is to be made and (ii) 0.5% of all other net revenue (other than non-recurring items) for the calendar month that is two calendar months prior to the calendar month in which the applicable deposit to the replacement reserve is to be made.
A “Cash Trap Period” will commence (a) upon the occurrence of an event of default under the Bellagio Hotel and Casino Whole Loan documents, (b) upon the occurrence of a DSCR Trigger Event (as defined below) or (c) upon the occurrence of a Bellagio Tenant Bankruptcy Event (as defined below), and will terminate upon (x) with respect to clause (a), the cure of such event of default, (y) with respect to clause (b), the termination of such DSCR Trigger Event, or (z) with respect to clause (c), the occurrence of a Bellagio Tenant Bankruptcy Event Cure (as defined below).
A “Bellagio Tenant Bankruptcy Event” will occur if the Bellagio Tenant makes an assignment for the benefit of creditors or if a receiver, liquidator or trustee is appointed for the Bellagio Tenant or if the Bellagio Tenant is adjudicated a bankrupt or insolvent, or if any bankruptcy action is filed, provided that, if such bankruptcy action was involuntary and not consented to by the Bellagio Tenant, upon the same not being discharged, stayed or dismissed within 90 days.
A “Bellagio Tenant Bankruptcy Event Cure” means the occurrence of any of the following events: (i) the Bellagio Tenant, as debtor in possession, or a trustee for the Bellagio Tenant, has assumed the Bellagio Lease pursuant to the bankruptcy code, and an order authorizing the assumption of the Bellagio Lease has been granted by the applicable court and the Bellagio Tenant has satisfied its obligations under the bankruptcy code; or (ii) the Bellagio Tenant (or a qualifying replacement tenant) has entered into the Bellagio Lease (or a qualifying replacement lease) in accordance with the terms of the Bellagio Hotel and Casino Whole Loan documents, provided that, if the initial Bellagio Lease is terminated and not otherwise replaced in accordance with the terms of the Bellagio Hotel and Casino Whole Loan documents, a Bellagio Tenant Bankruptcy Event Cure will be deemed to have occurred if either (x) the debt service coverage ratio (based on the Adjusted EBITDA (as defined below) and the Bellagio Hotel and Casino Whole Loan debt service) (hereinafter, the “Whole Loan DSCR”) equals or exceeds 2.50x for two consecutive calendar quarters following the occurrence of the related Bellagio Tenant Bankruptcy Event or (y) the Bellagio Hotel and Casino Borrower makes voluntary prepayments in accordance with the terms of the Bellagio Hotel and Casino Whole Loan documents in an amount necessary to achieve a Whole Loan DSCR equal to or greater than 2.50x, in which case such Bellagio Tenant Bankruptcy Event will terminate upon such prepayment.
A “DSCR Trigger Event” will occur if the Whole Loan DSCR is less than 2.50x at the end of two consecutive calendar quarters, and will end if, provided no event of default is continuing under the Bellagio Hotel and Casino Whole Loan documents, (i) the Whole Loan DSCR is equal to or greater than 2.50x for two consecutive calendar quarters, or (ii) the Bellagio Hotel and Casino Borrower has prepaid the Bellagio Hotel and Casino Whole Loan in accordance with the terms of the Bellagio Hotel and Casino Whole Loan documents in an amount necessary to achieve a Whole Loan DSCR equal to or greater than 2.50x, provided that, in the event that a prepayment under clause (ii) occurs, the DSCR Trigger Event will terminate upon such prepayment.
“Adjusted EBITDA” means EBITDA (as defined below) plus, without duplication, any Bellagio Lease rent reflected in Net Income (as defined below), and, without duplication, in each case as determined in accordance with the Bellagio Lease and generally accepted accounting principles (“GAAP”) consistently applied using the Existing Accounting Guidelines (as defined below).
“EBITDA” means for any test period and with respect to any Person (as defined below) or facility (as applicable), the sum of (a) Net Income of such Person or facility for that period, plus or minus the following (without duplication in each case) to the extent reflected in Net Income for that period, plus (b) any extraordinary loss, and, without duplication, any loss associated with the early retirement of indebtedness and with any disposition not in the ordinary course of business, minus (c) any extraordinary gain, and, without duplication, any gains associated with the early retirement of indebtedness and with any disposition not in the ordinary course of business, plus (d) interest charges of such Person or facility for that period, less (e) interest income of such Person or facility for that period, plus (f) the aggregate amount of expense for federal, foreign, state and local taxes on or measured by income of such Person or facility for that period excluding gaming taxes (whether or not payable during that period), minus (g) the aggregate amount of benefit for federal, foreign, state and local taxes on or measured by income of such Person or facility for that period excluding gaming taxes (whether or not receivable during that period), plus (h) depreciation, amortization, plus (i) all non-recurring and/or other non-cash expenses which will be limited to third party expenses in connection with an acquisition or disposition of an asset, plus (j) loss on sale or disposal of an asset, and write downs and impairments of an asset, minus (k) all non-recurring and/or other non-cash income in connection with an acquisition or disposition, and gain on sale of an asset, plus (l) expenses classified as “pre-opening and start-up expenses” on the applicable financial statements of that Person or facility for that fiscal period which will be limited to costs related directly to the facility’s primary intended use (hospitality, entertainment, gaming and/or pari mutual use, together with ancillary or complementary uses), minus (m) non-cash reversal of an accrual or reserve not recorded in the ordinary course, plus or minus (n) the impact of any foreign currency gains or losses and related swaps, plus (o) all long-term non-cash expenses realized in connection with or resulting from equity or equity-linked compensation plans, employee benefit plans or agreements or post-employment benefit plans or agreements, stock
| This is not a research report and was not prepared by any Underwriter’s research department. Please see additional important information and qualifications at the end of this Term Sheet. |
T-123
| Hospitality – Full Service | Loan #9 | Cut-off Date Balance: | $35,000,000 | |
| 3600 South Las Vegas Boulevard | Bellagio Hotel and Casino | Cut-off Date LTV: | 39.3% | |
| Las Vegas, NV 89109 | UW NCF DSCR: | 8.42x | ||
| UW NOI Debt Yield: | 28.3% |
appreciation or similar rights, stock options, restricted stock, preferred stock, stock appreciation or other similar rights, in each case as determined in accordance with GAAP, consistently applied using the Existing Accounting Guidelines.
“Existing Accounting Guidelines” means the Bellagio Tenant’s accounting guidelines and policies in effect as of the Bellagio Lease commencement date and which are subject to change to the extent not material or to the extent needed to reflect changes in generally accepted accounting principles.
“Net Income” means, with respect to any fiscal period and with respect to any person, the net income (or net loss) of that person, determined in accordance with the Bellagio Lease and GAAP, consistently applied using the Existing Accounting Guidelines.
“Person” means any individual, corporation, partnership, joint venture, limited liability company, estate, trust, unincorporated association, any federal, state, county or municipal government or any bureau, department or agency thereof and any fiduciary acting in such capacity on behalf of any of the foregoing.
Lockbox and Cash Management. The Bellagio Hotel and Casino Whole Loan is structured with a hard lockbox solely for payments of rent made to the Bellagio Hotel and Casino Borrower by the Bellagio Tenant under the Bellagio Lease. However, if the Bellagio Hotel and Casino Property is no longer subject to the Bellagio Lease, then (i) if it is subject to a brand management agreement or casino management agreement, rents and cash receipts required to be remitted to the Bellagio Hotel and Casino Borrower pursuant to the brand management agreement and/or casino management agreement (which may be paid initially to the brand manager and/or casino manager or an account maintained by such manager, and from which such manager may have the right to deduct its fees, reserves and other funds), will be required to be remitted to the lockbox account within one business day of the date such amounts would have otherwise been transferred to the Bellagio Hotel and Casino Borrower, and (ii) if no brand management agreement is in effect, the Bellagio Hotel and Casino Borrower will be required to deposit rents from the Bellagio Hotel and Casino Property into the lockbox account within one business day of receipt.
The Bellagio Hotel and Casino Whole Loan is structured with springing cash management. If no Cash Trap Period exists, amounts on deposit in the lockbox account are required to be disbursed to the Bellagio Hotel and Casino Borrower’s operating account. During the continuance of a Cash Trap Period, funds in the lockbox account are required to be deposited into a lender controlled cash management account. During the continuance of a Cash Trap Period, funds in the cash management account are required to be applied (i) if the Bellagio Hotel and Casino Property is not subject to the Bellagio Lease, to make deposits into the tax and insurance reserves (if any), as described above under “Escrows and Reserves”, (ii) if the Bellagio Hotel and Casino Property is not subject to the Bellagio Lease, to pay hotel taxes and custodial funds (funds collected by the Bellagio Hotel and Casino Borrower on a third party’s behalf that must be paid or remitted to a third party), (iii) to pay debt service on the Bellagio Hotel and Casino Whole Loan, (iv) if the Bellagio Hotel and Casino Property is not subject to the Bellagio Lease, to pay operating expenses set forth in the annual budget (which is required to be reasonably approved by the lender during an event of default or DSCR Trigger Period, subject to certain exceptions for life, health and safety matters, or if a brand management agreement and/or casino management agreement is in effect, for items as to which the Bellagio Hotel and Casino Borrower does not have approval rights under such agreement(s)), (v) if the Bellagio Hotel and Casino Property is not subject to the Bellagio Lease, to make deposits into the recurring replacements reserve, as described above under “Escrows and Reserves,” and (vi) to pay any remainder into an excess cash flow account, (x) to be held by the lender as additional security for the Bellagio Hotel and Casino Whole Loan during the continuance of the Cash Sweep Event Period (unless the Bellagio Hotel and Casino Borrower has delivered an Excess Cash Flow Guaranty (as described below), in which event such remainder will be remitted to the Bellagio Hotel and Casino Borrower), or (y) if no Cash Sweep Event Period is continuing, to be disbursed to an account designated by the Bellagio Hotel and Casino Borrower.
Notwithstanding the existence of an event of default under the Bellagio Hotel and Casino Whole Loan, unless a Priority Payment Cessation Event (as defined below) has occurred, the lender is required to apply amounts on deposit in the cash management account to pay taxes, insurance premiums, hotel taxes and custodial funds, and then to pay protective advances, and any amounts remaining after such payments may be applied to any obligations of the Bellagio Hotel and Casino Borrower under the loan documents as the lender may determine in its sole discretion. “Priority Payment Cessation Event” means (a) the initiation of (x) judicial or non-judicial foreclosure proceedings, (y) proceedings for appointment of a receiver or (z) similar remedies permitted by the loan documents relating to all or a material portion of the Bellagio Hotel and Casino Property, and/or (b) the imposition of a stay, an injunction or a similar judicially imposed device that has the effect of preventing the lender from exercising its remedies under the loan documents.
For so long as the Bellagio Hotel and Casino Property is subject to the Bellagio Lease, funds in the excess cash flow reserve are required to be disbursed, at the Bellagio Hotel and Casino Borrower’s request, to pay (i) debt service and/or debt service under any mezzanine loan entered into pursuant to the loan documents, (ii) amounts for voluntary prepayment of the (A) Bellagio Hotel and Casino Whole Loan or mandatory prepayment in connection with a casualty or condemnation or (B) amounts for voluntary prepayment of any mezzanine loan or mandatory prepayment thereof in connection with a casualty or condemnation (provided such prepayment is madepro rata between the Bellagio Hotel and Casino Whole Loan and any such mezzanine loan), (iii) amounts for prepayments to cure a DSCR Trigger Event, (iv) costs associated with the Bellagio Lease, (v) any fees and costs payable by the Bellagio Hotel and Casino Borrower, including to the lender, subject to and in compliance with the loan documents, including without limitation costs related to a letter of credit or renewal of the required environmental insurance policy, (vi) legal, audit, tax and accounting (including actual costs incurred by BREIT OP (directly or indirectly) and its service providers for back-office accounting and for costs associated with the Bellagio Hotel and Casino Property or Bellagio Hotel and Casino Borrower);provided that excess cash flow may not be used to enforce Bellagio Hotel and Casino Borrower’s rights under the loan documents or defend any enforcement by the lender of its rights under the loan documents, (vii) distributions to maintain the status of BREIT and other affiliated real estate investment trusts (“REITs”) as REITs and avoid imposition of any entity level tax on such REITs, provided such distributions may not exceed 10% of all deposits made into the excess cash flow reserve as of the date of determination, and (viii) other items reasonably approved by the lender. If the Bellagio Hotel and Casino Property is not subject to the Bellagio Lease, in addition to the items described above, funds in the excess cash flow reserve are required to be disbursed, at the request of the Bellagio Hotel and Casino Borrower, to pay (i) operating expenses (including management fees, franchise fees and other fees, charges or costs, payable to the manager under a casino management agreement or brand management agreement or the franchisor under a franchise agreement), (ii) costs of emergency repairs and/or life safety issues, (iii) capital expenditures, replacements, alterations, PIP Work or brand-mandated work, (iv) hotel taxes and custodial funds, (v) costs incurred in connection with the purchase of any furniture, fixtures and equipment, (vi) costs of restoration in excess of available net proceeds, (vii) costs associated with any ground lease or any other leases, and (viii) payment of shortfalls in required deposits to other reserve accounts.
| This is not a research report and was not prepared by any Underwriter’s research department. Please see additional important information and qualifications at the end of this Term Sheet. |
T-124
| Hospitality – Full Service | Loan #9 | Cut-off Date Balance: | $35,000,000 | |
| 3600 South Las Vegas Boulevard | Bellagio Hotel and Casino | Cut-off Date LTV: | 39.3% | |
| Las Vegas, NV 89109 | UW NCF DSCR: | 8.42x | ||
| UW NOI Debt Yield: | 28.3% |
For so long as no event of default is continuing, the Bellagio Hotel and Casino Borrower will be permitted to deliver a guaranty of the payment of excess cash flow in a form attached to the loan agreement from BREIT, BREIT OP or another affiliate of the Bellagio Hotel and Casino Borrower which is controlled by BREIT or BREIT OP and satisfies certain net worth requirements (an “Excess Cash Flow Guaranty”) in lieu of depositing excess cash flow into the excess cash flow reserve, provided, that it is a condition to delivery of an Excess Cash Flow Guaranty that (i) if the aggregate obligations under the Excess Cash Flow Guaranty (plus any outstanding amount under any letter of credit delivered under the Bellagio Hotel and Casino Whole Loan if the applicant thereunder is BREIT OP or a subsidiary of BREIT OP that directly or indirectly owns 49% or more of the equity interests in the Bellagio Hotel and Casino Borrower) exceed 15.00%, a new non-consolidation opinion in respect of the Excess Cash Flow Guaranty reasonably satisfactory to the lender must be delivered and (ii) an enforceability opinion must be delivered. Pursuant to the Bellagio Hotel and Casino Whole Loan documents, upon the earliest to occur of (x) a monetary event of default, (y) a Priority Payment Cessation Event, and (z) the delivery of a deed in lieu of foreclosure, the Bellagio Hotel and Casino Borrower (or guarantor under the Excess Cash Flow Guaranty) is required to remit to the lender an amount equal to the amount of excess cash flow that was disbursed to the Bellagio Hotel and Casino Borrower in lieu of being deposited into the excess cash flow reserve, less the amount that the Bellagio Hotel and Casino Borrower would have been permitted to withdraw from the excess cash flow reserve, as described above, as of such date, which amount will at the lender’s option either be deposited into the excess cash flow reserve or applied as if it had been contained in the excess cash flow reserve.
Additional Secured Indebtedness (not including trade debts). In addition to the Bellagio Hotel and Casino Mortgage Loan, the Bellagio Hotel and Casino Property also secures the Bellagio Hotel and Casino Non-ServicedPari Passu Companion Loans, which have an aggregate Cut-off Date principal balance of $1,641,200,000, and the Bellagio Hotel and Casino Subordinate Companion Loans (which are comprised of the Bellagio Hotel and Casino Junior A Notes, which have an aggregate Cut-off Date principal balance of $650,500,000, and the Bellagio Hotel and Casino Junior B Notes, which have an aggregate Cut-off Date principal balance of $683,300,000). The Bellagio Hotel and Casino Non-ServicedPari Passu Companion Loans and the Bellagio Hotel and Casino Junior A Notes accrue interest at the same rate as the Bellagio Hotel and Casino Mortgage Loan. The Bellagio Hotel and Casino Junior B Notes accrue interest at the rate of 5.350000% per annum. The Bellagio Hotel and Casino Mortgage Loan is entitled to payments of interest and principal on apro rata andpari passu basis with the Bellagio Hotel and Casino Non-ServicedPari Passu Companion Loans. The Bellagio Hotel and Casino Mortgage Loan and the Bellagio Hotel and Casino Non-ServicedPari Passu Companion Loans are generally senior to the Bellagio Hotel and Casino Junior A Notes and the Bellagio Hotel and Casino Junior B Notes, and the Bellagio Hotel and Casino Junior A Notes are generally senior to the Bellagio Hotel and Casino Junior B Notes. The holders of the Bellagio Hotel and Casino Mortgage Loan, the Bellagio Hotel and Casino Non-ServicedPari Passu Companion Loans, the Bellagio Hotel and Casino Junior A Notes and the Bellagio Hotel and Casino Junior B Notes have entered into a co-lender agreement which sets forth the allocation of collections on the Bellagio Hotel and Casino Whole Loan. See “Description of the Mortgage Pool—The Whole Loans—Bellagio Hotel and Casino Pari Passu-A/B Whole Loan” in the Preliminary Prospectus.
| Subordinate Note Summary | ||||||||
B-Note Original Principal Balance | B-Note Interest Rate | Original Term (mos.) | Original Amort. Term (mos.) | Original IO Term (mos.) | Total Debt UW NCF DSCR(2) | Total Debt NOI Debt Yield(2) | Total Debt Date LTV | |
| Bellagio Hotel and Casino Subordinate Companion Loan | $1,333,800,000 | (1) | 120 | 0 | 120 | 4.06x | 15.7% | 70.7% |
| (1) | The Bellagio Hotel and Casino Subordinate Companion Loan is comprised of the Bellagio Hotel and Casino Junior A Notes, which accrue interest at the rate of 3.170153% per annum, and the Bellagio Hotel and Casino Junior B Notes, which accrue interest at the rate of 5.350000% per annum. |
| (2) | Based on the master lease annual rent of $245,000,000, Total Debt debt service coverage ratio is 2.19x and Total Debt debt yield is 8.1%. |
Mezzanine Loan and Preferred Equity.The Bellagio Hotel and Casino Whole Loan documents provide for a one time right of a parent entity of the Bellagio Hotel and Casino Borrower to obtain a mezzanine loan secured by the direct or indirect equity interests in the Bellagio Hotel and Casino Borrower, provided that certain conditions are satisfied, including but not limited to (i) the principal amount of the mezzanine loan can in no event be greater than an amount equal to the amount which will yield (x) an aggregate loan-to-value ratio that does not exceed 72%, and (y) a Whole Loan DSCR that is not less than 4.24x and (ii) the mezzanine lender enters into an intercreditor agreement reasonably acceptable to the lender and the mezzanine lender. No rating agency confirmation is required for the mezzanine loan, and the mezzanine loan is not required to be co-terminous with the Bellagio Hotel and Casino Whole Loan. The mezzanine loan documents may permit voluntary prepayment of the mezzanine loan without corresponding prepayment of the Bellagio Hotel and Casino Whole Loan (except that prepayments of the mezzanine loan to cure a DSCR Trigger Event or prepayments from the excess cash flow reserve must be made concurrently with apro rata prepayment of the Bellagio Hotel and Casino Whole Loan). In addition, the mezzanine loan documents may permit that, provided no event of default is continuing under the Bellagio Hotel and Casino Whole Loan, the mezzanine borrower may prepay the mezzanine loan at a discount pursuant to negotiated transactions with only the mezzanine lender.
Release of Property.Not permitted.
Ground Lease.A portion of the Bellagio Hotel and Casino Property, consisting of approximately 0.84 acres located at the southeast corner of the Bellagio Hotel and Casino Property, which currently houses the Bellagio’s marquee sign and a portion of the walkway leading from the sidewalk on Las Vegas Boulevard to the main entrance to the hotel, is ground leased pursuant to a ground lease from MKB Company (the “MKB Ground Lease”). The initial term of the MKB Ground Lease expires on April 27, 2033. The Bellagio Hotel and Casino Borrower, as ground lessee, has two renewal options of 20 years each, so long as the Bellagio Hotel and Casino Borrower provides at least one year prior written notice to the ground lessor and is not in default under the MKB Ground Lease both as of the date it exercises its option or on the date of commencement of the option term. The initial annual ground rent was $225,000 beginning in April 1995 and has adjusted on an annual basis based on the Consumer Price Index since that time, plus an additional $75,000 increase in annual ground rent that occurred in April 2014. The current annual ground rent for the MKB Ground Lease is $503,702.77. The ground rent is subject to annual increase (including during the extension terms) based on a formula based on the Consumer Price Index. The MKB Ground Lease lacks certain customary lender protections. See the exceptions to representations and warranties set forth in the Preliminary Prospectus.
Right of First Refusal.None.
Letter of Credit. None.
Terrorism Insurance. The Bellagio Hotel and Casino Whole Loan documents require that the “all risk” insurance policy required to be maintained by the Bellagio Hotel and Casino Borrower provide coverage for terrorism in an amount equal to the full replacement cost of the Bellagio Hotel and Casino
| This is not a research report and was not prepared by any Underwriter’s research department. Please see additional important information and qualifications at the end of this Term Sheet. |
T-125
| Hospitality – Full Service | Loan #9 | Cut-off Date Balance: | $35,000,000 | |
| 3600 South Las Vegas Boulevard | Bellagio Hotel and Casino | Cut-off Date LTV: | 39.3% | |
| Las Vegas, NV 89109 | UW NCF DSCR: | 8.42x | ||
| UW NOI Debt Yield: | 28.3% |
Property, and business interruption insurance covering no less than the 24-month period following the occurrence of a casualty event, together with a 12-month extended period of indemnity. So long as the Bellagio Hotel and Casino Property is subject to the Bellagio Lease, the Bellagio Hotel and Casino Borrower is permitted to rely on terrorism insurance provided by the Bellagio Tenant. The permitted deductible for terrorism insurance for the Bellagio Hotel and Casino Borrower under the Bellagio Hotel and Casino Whole Loan documents is $500,000 and for the Bellagio Tenant under the Bellagio Lease is $2,500,000. Notwithstanding the required amount of terrorism insurance above, if (A) the Terrorism Risk Insurance Program Reauthorization Act of 2015 or a similar or subsequent statute (“TRIPRA”) is not in effect (B) TRIPRA or a similar or subsequent statute, extension or reauthorization is modified which results in a material increase in terrorism insurance premiums, or (C) there is a disruption in the terrorism insurance marketplace as the result of a terrorism event which results in a material increase in terrorism insurance premiums, provided that terrorism insurance is commercially available, the Bellagio Hotel and Casino Borrower (or Bellagio Tenant) will be required to carry terrorism insurance coverage, but will not be required to spend on terrorism insurance coverage more than two times the amount of the insurance premium that is payable at such time in respect of the property and business interruption/rental loss insurance required under the Bellagio Hotel and Casino Whole Loan documents (without giving effect to the cost of the terrorism, flood, earthquake and windstorm components of such casualty and business interruption/rental loss insurance), and if the cost of terrorism insurance exceeds such amount, the Bellagio Hotel and Casino Borrower (or Bellagio Tenant) will be required to purchase the maximum amount of terrorism insurance available with funds equal to such amount.
In addition, terrorism insurance for the Bellagio Hotel and Casino Property may be written by a non-rated captive insurer subject to certain conditions, including, among other things: (i) TRIPRA is required to be in full force and effect; (ii) the terrorism policy issued by such captive insurer, together with any other qualified terrorism policies in-place, provide per occurrence limit in an amount not less than replacement cost and rent loss coverage as otherwise required; (iii) except with respect to deductibles permitted under the Bellagio Lease, covered losses that are not reinsured by the federal government under TRIPRA and paid to the captive insurer is required to be reinsured with a cut-through endorsement by an insurance company rated “A” by S&P and “A2” by Moody’s (to the extent Moody’s rates securities which represent an interest in the Bellagio Hotel and Casino Whole Loan and rates the applicable insurance company); (iv) all reinsurance agreements between the captive insurer and other reinsurance providers is required to be subject to the reasonable approval of the lender; and (v) such captive insurer is required to be licensed in the State of Nevada or other jurisdiction to the extent reasonably approved by the lender and qualified to issue the terrorism policy in accordance with applicable legal requirements. See “Risk Factors—Risks Relating to the Mortgage Loans—Terrorism Insurance May Not Be Available for All Mortgaged Properties”in the Preliminary Prospectus.
| This is not a research report and was not prepared by any Underwriter’s research department. Please see additional important information and qualifications at the end of this Term Sheet. |
T-126
(THIS PAGE INTENTIONALLY LEFT BLANK)
T-127
| Office – CBD | Loan #10 | Cut-off Date Balance: | $31,200,000 | |
| 1612 K Street Northwest & | F Street and K Street Office Portfolio | Cut-off Date LTV: | 63.4% | |
| 1319 F Street Northwest | U/W NCF DSCR: | 2.08x | ||
| Washington, DC 20006; 20004 | U/W NOI Debt Yield: | 8.3% |
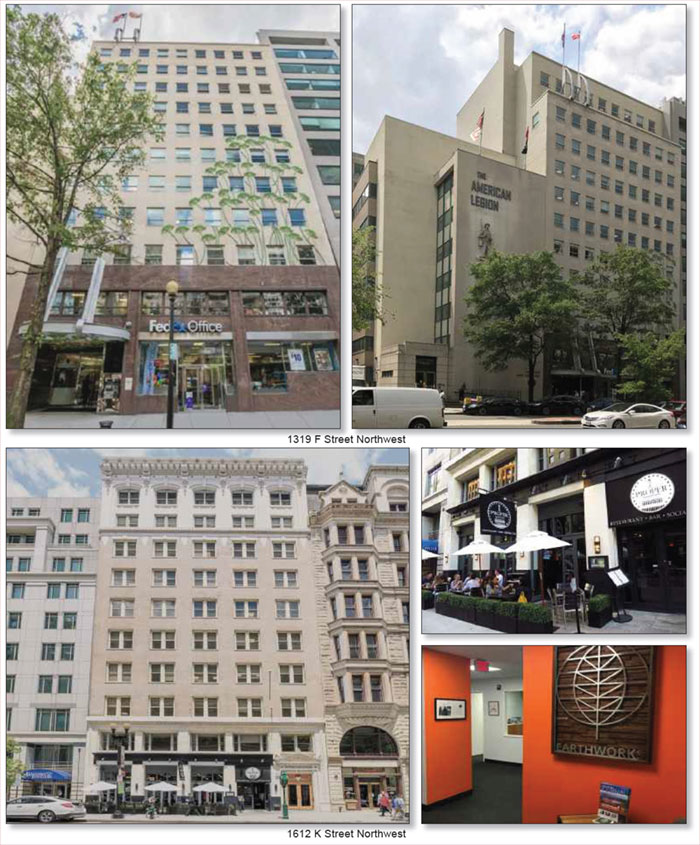
| This is not a research report and was not prepared by any Underwriter’s research department. Please see additional important information and qualifications at the end of this Term Sheet. |
T-128
| Office – CBD | Loan #10 | Cut-off Date Balance: | $31,200,000 | |
| 1612 K Street Northwest & | F Street and K Street Office Portfolio | Cut-off Date LTV: | 63.4% | |
| 1319 F Street Northwest | U/W NCF DSCR: | 2.08x | ||
| Washington, DC 20006; 20004 | U/W NOI Debt Yield: | 8.3% |
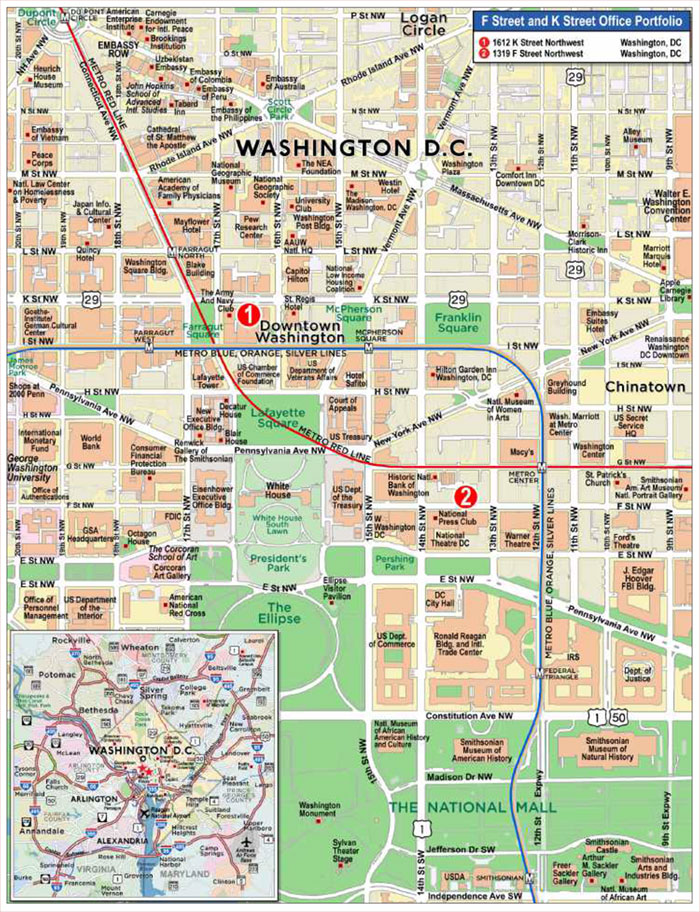
| This is not a research report and was not prepared by any Underwriter’s research department. Please see additional important information and qualifications at the end of this Term Sheet. |
T-129
| Mortgage Loan No. 10 – F Street and K Street Office Portfolio |
| Mortgage Loan Information | Property Information | ||||||
| Mortgage Loan Seller: | BANA | Single Asset/Portfolio: | Portfolio | ||||
| Credit Assessment (DBRS/Fitch/S&P): | NR/NR/NR | Location: | Washington, DC Various | ||||
| Original Balance: | $31,200,000 | General Property Type: | Office | ||||
| Cut-off Date Balance: | $31,200,000 | Detailed Property Type: | CBD | ||||
| % of Initial Pool Balance: | 2.6% | Title Vesting: | Fee | ||||
| Loan Purpose: | Recapitalization | Year Built/Renovated: | Various/Various | ||||
| Borrower Sponsor: | Mitchell B. Modell | Size: | 124,667 SF | ||||
| Guarantors: | Mitchell B. Modell; The Trust Created Under | Cut-off Date Balance per SF: | $250 | ||||
| the Will of Michael S. Modell, Paragraph 6 | Maturity Date Balance per SF: | $250 | |||||
| Mortgage Rate: | 3.6220% | Property Manager: | Northeast Equity Management, | ||||
| Note Date: | 2/4/2020 | LLC (borrower-related) | |||||
| First Payment Date: | 4/1/2020 | ||||||
| Maturity Date: | 3/1/2030 | ||||||
| Original Term to Maturity: | 120 months | Underwriting and Financial Information | |||||
| Original Amortization Term: | 0 months | UW NOI: | $2,597,698 | ||||
| IO Period: | 120 months | UW NOI Debt Yield: | 8.3% | ||||
| Seasoning: | 0 months | UW NOI Debt Yield at Maturity: | 8.3% | ||||
| Prepayment Provisions: | LO (24); DEF (92); O (4) | UW NCF DSCR: | 2.08x | ||||
| Lockbox/Cash Mgmt Status: | Hard/Springing | Most Recent NOI: | $2,516,205 (12/31/2019) | ||||
| Additional Debt Type: | N/A | 2nd Most Recent NOI(2): | N/A | ||||
| Additional Debt Balance: | N/A | 3rd Most Recent NOI(2): | N/A | ||||
| Future Debt Permitted (Type): | No (N/A) | Most Recent Occupancy: | 92.0% (1/1/2020) | ||||
| Reserves(1) | 2nd Most Recent Occupancy: | 95.8% (12/31/2018) | |||||
| Type | Initial | Monthly | Cap | 3rd Most Recent Occupancy: | 98.2% (12/31/2017) | ||
| RE Tax: | $343,131 | $49,019 | N/A | Appraised Value (as of): | $49,200,000 (12/18/2019) | ||
| Insurance: | $54,330 | $4,939 | N/A | Appraised Value per SF: | $395 | ||
| Recurring Replacements: | $0 | $2,078 | N/A | Cut-off Date LTV Ratio: | 63.4% | ||
| TI/LC: | $0 | $15,583 | $561,002 | Maturity Date LTV Ratio: | 63.4% | ||
| Sources and Uses | ||||||
| Sources | Proceeds | % of Total | Uses | Proceeds | % of Total | |
| Loan Amount: | $31,200,000 | 100.0% | Return of Equity(3): | $29,345,806 | 94.1% | |
| Closing Costs: | $1,456,733 | 4.7% | ||||
| Reserves: | $397,461 | 1.3% | ||||
| Total Sources: | $31,200,000 | 100.0% | Total Uses: | $31,200,000 | 100.0% | |
| (1) | See “Escrows and Reserves” below for further discussion of reserve information. |
| (2) | Financial information prior to 2019 is not available because the borrower sponsor acquired the F Street and K Street Office Portfolio Properties (as defined below) on May 31, 2019. |
| (3) | The F Street and K Street Office Portfolio Properties were previously acquired by the F Street and K Street Portfolio Borrower (as defined below) on May 31, 2019 for a purchase price of $48,000,000. |
The Mortgage Loan. The tenth largest mortgage loan (the “F Street and K Street Office Portfolio Mortgage Loan”) is evidenced by a promissory note in the original principal amount of $31,200,000 and secured by fee mortgages encumbering two office properties located in Washington, DC (the “F Street and K Street Office Portfolio Properties”).
The Borrowers and the Borrower Sponsor. The borrowers are M&M F Street DC, LLC and M&M K Street DC, LLC, each a District of Columbia limited liability company that is structured to be bankruptcy-remote with at least one independent director (together, the “F Street and K Street Office Portfolio Borrower”). Mitchell B. Modell and The Trust Created Under the Will of Michael S. Modell, Paragraph 6 (the “Trust Guarantor”), collectively, are the non-recourse carveout guarantors and Mitchell B. Modell is the borrower sponsor with respect to the F Street and K Street Office Portfolio Mortgage Loan. Such non-recourse carveout guarantors (who are also environmental indemnitors) have the right to elect to buy each other’s interest in one individual mortgaged property, such that Mitchell B. Modell would own the entirety of one individual property and the Trust Guarantor would own the entirety of the other individual property and each would be the sole guarantor-indemnitor with respect to the applicable individual property.
Mitchell B. Modell is the CEO of Modell's Sporting Goods. Founded in 1889 by Mitchell B. Modell's great grandfather, Morris Modell, Modell's Sporting Goods is America's oldest and largest family-owned and operated sporting goods company. Four generations of the Modell family have developed the family business into a chain of over 150 stores throughout the Northeast. The Trust Created Under the Will of Michael S. Modell, Paragraph 6 maintains a real estate portfolio with ownership interests in 18 commercial assets totaling $456.4 million in market value as of December 31, 2019.
| This is not a research report and was not prepared by any Underwriter’s research department. Please see additional important information and qualifications at the end of this Term Sheet. |
T-130
| Office – CBD | Loan #10 | Cut-off Date Balance: | $31,200,000 | |
| 1612 K Street Northwest & | F Street and K Street Office Portfolio | Cut-off Date LTV: | 63.4% | |
| 1319 F Street Northwest | U/W NCF DSCR: | 2.08x | ||
| Washington, DC 20006; 20004 | U/W NOI Debt Yield: | 8.3% |
The Properties. The F Street and K Street Office Portfolio Properties are comprised of two office properties containing a total of 124,667 SF located in Washington, DC. The 1612 K Street Northwest property is a 13-story, Class B office building containing 72,356 SF and the 1319 F Street Northwest property is a 10-story, Class B office building containing 52,311 SF. Both properties are located within 4 blocks of the White House. The borrower sponsor acquired both collateral properties on May 31, 2019 for total consideration of $48,000,000 in an all-cash transaction. The F Street and K Street Office Portfolio Properties cater to smaller tenants, particularly non-profit organizations and associations that operate on short-term leases due to the nature of their businesses. The aggregate occupancy has remained above 92% for the past six years for the F Street and K Street Office Portfolio Properties.
The 1612 K Street Northwest property was constructed in 1958, renovated in the 1990s and most recently updated in 2005. Approximately $150,000 of capital expenditures have been invested in the 1612 K Street Northwest property in the last three years including upgraded lights, HVAC, and a new chiller. The 1612 K Street Northwest property was built with stylistic touches from famed architect Arthur Cotton. The average tenure of a tenant at the 1612 K Street Northwest property is almost 15 years. As of January 1, 2020, the 1612 K Street Northwest property was 87.0% leased to 25 tenants.
The 1319 F Street Northwest property was built in 1912 and renovated in 1981. Approximately $120,000 of capital expenditures have been invested in the 1319 F Street Northwest property in the last three years, including upgraded lights, a new energy management system, and new HVAC booster pumps. The 1319 F Street Northwest property is located mid-block and is the western most of four historic buildings which create a historic focus to the street scape. As of January 1, 2020, the 1319 F Street Northwest property was 99.0% leased to 16 tenants.
| Property Summary | ||||||||||
| Property Name | City, State | Year Built/ Renovated | Total SF | % of Total SF | Occ. % 1/1/2020 | Cut-off Date ALA | % of ALA | Appraised Value | 12/31/2019 NOI | % of NOI |
| 1612 K Street Northwest | Washington, DC | 1958/2005 | 72,356 | 58.0% | 87.0% | $17,752,000 | 56.9% | $28,000,000 | $1,458,286 | 58.0% |
| 1319 F Street Northwest | Washington, DC | 1912/1981 | 52,311 | 42.0% | 99.0% | $13,448,000 | 43.1% | $21,200,000 | $1,057,919 | 42.0% |
| Total/Wtd. Avg. | 124,667 | 100.0% | 92.0% | $31,200,000 | 100.0% | $49,200,000 | $2,516,205 | 100.0% | ||
Major Tenants.
First Book (15,696 SF, 12.6% of NRA, 13.7% of underwritten rent). First Book is a non-profit social enterprise that provides new books, learning materials, and other essentials to children in need. Founded in 1992, First Book has distributed more than 185 million books and educational resources to programs and schools serving children from low-income families. First Book currently reaches an average of 5 million children every year and supports more than one in three of the estimated 1.3 million classrooms and programs serving children in need. The First Book lease commenced on May 15, 2000 and expires on July 31, 2022. The tenant has expanded several times since taking occupancy in 2000.
CAIR (8,388 SF, 6.7% of NRA, 6.8% of underwritten rent). Capital Area Immigrants’ Rights (“CAIR”) originally started as a project of the Washington Lawyer's Committee for Civil Rights and Urban Affairs, and became an independent non-profit organization in 1999. In the past decade, CAIR has more than doubled in size and has added two new programs to complement the organization's original work serving detained adult immigrants. The tenant has been at the property since 2004 and occupies three different suites (Suite 204: 4,190 SF; Suite 308: 3,173 SF; and Suite 402: 1,025 SF). The current leases commenced on February 2019, November 2016 and May 2019, respectively. All three leases expire on October 31, 2021.
Green America (5,763 SF, 4.6% of NRA, 5.1% of underwritten rent). Green America is one of the leading green economy organizations in the country. Founded in 1982, Green America is a non-profit charitable and membership organization that provides economic strategies, organization and practical tools for businesses and individuals to solve today's social and environmental problems. Green America has been a tenant at the property since 1994. The current lease commenced on September 1, 1999 and expires on August 31, 2021. Green America subleases a portion of its space to Open the Government on a month-to-month lease. Payments are made directly from Open the Government to Green America. Green America maintains its full rent payments to the landlord.
| This is not a research report and was not prepared by any Underwriter’s research department. Please see additional important information and qualifications at the end of this Term Sheet. |
T-131
| Office – CBD | Loan #10 | Cut-off Date Balance: | $31,200,000 | |
| 1612 K Street Northwest & | F Street and K Street Office Portfolio | Cut-off Date LTV: | 63.4% | |
| 1319 F Street Northwest | U/W NCF DSCR: | 2.08x | ||
| Washington, DC 20006; 20004 | U/W NOI Debt Yield: | 8.3% |
The following table presents certain information relating to the tenants at the F Street and K Street Office Portfolio Properties:
| Tenant Summary | |||||||||||
| Tenant Name | Credit Ratings (Moody’s/S&P/ Fitch) | Property Name | Tenant SF | Approx. % of Total SF | Annual UW Rent | % of Total Annual UW Rent | Annual UW Rent PSF | Lease Exp. | Renewal Options | Term. Options | |
| Major Office Tenants | |||||||||||
| First Book | NR/NR/NR | 1319 F Street Northwest | 15,696 | 12.6% | $632,772 | 13.7% | $40.31 | 7/31/2022 | N | N | |
| CAIR | NR/NR/NR | 1612 K Street Northwest | 8,388 | 6.7% | $316,440 | 6.8% | $37.73 | 10/31/2021 | N | N | |
| Green America(1) | NR/NR/NR | 1612 K Street Northwest | 5,763 | 4.6% | $237,724 | 5.1% | $41.25 | 8/31/2021 | N | N | |
| Major Office Subtotal/Wtd. Avg. | 29,847 | 23.9% | $1,186,936 | 25.7% | $39.77 | ||||||
| Retail Tenants | |||||||||||
| Proper Ventures, LLC | NR/NR/NR | 1319 F Street Northwest | 7,514 | 6.0% | $270,122 | 5.8% | $35.95 | 11/30/2026 | 1, 5 yr | N | |
| Fed Ex Office & Print | NR/NR/NR | 1612 K Street Northwest | 5,197 | 4.2% | $270,244 | 5.8% | $52.00 | 10/31/2028 | 2, 5 yr | N | |
| Subtotal/Wtd. Avg. | 42,558 | 34.1% | $1,727,302 | 37.3% | $40.59 | ||||||
| Other Office Tenants | 72,187 | 57.9% | $2,898,205 | 62.7% | $40.15 | ||||||
| Vacant Space | 9,922 | 8.0% | $0 | 0.0% | $0.00 | ||||||
| Total/Wtd. Avg.(2) | 124,667 | 100.0% | $4,625,507 | 100.0% | $40.31 | ||||||
Information is based on the underwritten rent roll.
| (1) | Green America subleases a portion of its space to Open the Government on a month-to-month lease. Payments are made directly from Open the Government to Green America. Green America maintains its full rent payments to the landlord. |
| (2) | Total/Wtd. Avg. Annual UW Rent PSF excludes vacant space. |
The following table presents certain information relating to the lease rollover schedule at the F Street and K Street Office Portfolio Properties:
| Lease Rollover Schedule(1) | ||||||||
| Year | # of Leases Rolling | SF Rolling | UW Rent PSF Rolling | Approx. % of Total SF Rolling | Approx. Cumulative % of SF Rolling | Total UW Rent Rolling | Approx. % of Total Rent Rolling | Approx. Cumulative % of Total Rent Rolling |
| MTM | 0 | 0 | $0.00 | 0.0% | 0.0% | $0 | 0.0% | 0.0% |
| 2020 | 14 | 21,909 | $38.90 | 17.6% | 17.6% | $852,309 | 18.4% | 18.4% |
| 2021 | 11 | 28,518 | $39.00 | 22.9% | 40.5% | $1,112,062 | 24.0% | 42.5% |
| 2022 | 10 | 37,598 | $40.50 | 30.2% | 70.6% | $1,522,712 | 32.9% | 75.4% |
| 2023 | 5 | 12,439 | $42.37 | 10.0% | 80.6% | $527,047 | 11.4% | 86.8% |
| 2024 | 1 | 1,570 | $45.23 | 1.3% | 81.9% | $71,011 | 1.5% | 88.3% |
| 2025 | 0 | 0 | $0.00 | 0.0% | 81.9% | $0 | 0.0% | 88.3% |
| 2026 | 1 | 7,514 | $35.95 | 6.0% | 87.9% | $270,122 | 5.8% | 94.2% |
| 2027 | 0 | 0 | $0.00 | 0.0% | 87.9% | $0 | 0.0% | 94.2% |
| 2028 | 1 | 5,197 | $52.00 | 4.2% | 92.0% | $270,244 | 5.8% | 100.0% |
| 2029 | 0 | 0 | $0.00 | 0.0% | 92.0% | $0 | 0.0% | 100.0% |
| 2030 | 0 | 0 | $0.00 | 0.0% | 92.0% | $0 | 0.0% | 100.0% |
| 2031 & Beyond | 0 | 0 | $0.00 | 0.0% | 92.0% | $0 | 0.0% | 100.0% |
| Vacant | 0 | 9,922 | $0.00 | 8.0% | 100.0% | $0 | 0.0% | 100.0% |
| Total/Wtd. Avg.(2) | 43 | 124,667 | $40.31 | 100.0% | $4,625,507 | 100.0% | ||
Information is based on the underwritten rent roll.
| (1) | Certain tenants may have lease termination options that were not taken into account in the Lease Rollover Schedule. |
| (2) | Total/Wtd. Avg. UW Rent PSF Rolling excludes vacant space. |
The Market. The F Street and K Street Office Portfolio Properties are located in Washington, DC. According to the appraisal, the Washington, DC area economy is one of the strongest in the country, with fifteen Fortune 500 companies headquartered in this region, which represent a variety of industries, including international hospitality (Hilton Worldwide and Marriott) and finance (Capitol One and Fannie Mae). In addition, 400 international associations and 1,000 internationally owned companies are located in Washington, DC. As of December 2019, the unemployment rate was 3.3% for the Washington, DC metropolitan region.
The 1612 K Street Northwest property is located within the CBD submarket. According to a third party market report, as of February 2020, the CBD submarket has inventory of 45.4 million SF with overall vacancy of 11.6% and an average asking rental rate of $54.75 PSF. According to the appraisal, the estimated 2019 population within a one-, three- and five-mile radius of the 1612 K Street Northwest property was 78,212, 409,265 and 827,736, respectively. The 2019 average household income within the same one-, three- and five-mile radius was $121,751, $126,914 and $119,923, respectively
| This is not a research report and was not prepared by any Underwriter’s research department. Please see additional important information and qualifications at the end of this Term Sheet. |
T-132
| Office – CBD | Loan #10 | Cut-off Date Balance: | $31,200,000 | |
| 1612 K Street Northwest & | F Street and K Street Office Portfolio | Cut-off Date LTV: | 63.4% | |
| 1319 F Street Northwest | U/W NCF DSCR: | 2.08x | ||
| Washington, DC 20006; 20004 | U/W NOI Debt Yield: | 8.3% |
The 1319 F Street Northwest property is located within the East End submarket. According to a third party market report, as of February 2020, the East End submarket has inventory of 53.3 million SF with overall vacancy of 16.0% and an average asking rental rate of $57.74 PSF. According to the appraisal, the estimated 2019 population within a one-, three- and five-mile radius of the 1319 F Street Northwest property was 50,246, 402,033 and 836,710 respectively. The 2019 average household income within the same one-, three- and five-mile radius was $124,070, $123,763 and $116,244, respectively.
Operating History and Underwritten Net Cash Flow.The following table presents certain information relating to the historical operating performance and Underwritten Net Cash Flow at the F Street and K Street Office Portfolio Properties:
| Cash Flow Analysis(1) | ||||
| 2019 | UW | UW PSF | ||
| Gross Potential Rent(2) | $4,638,056 | $5,145,496 | $41.27 | |
| Other Income | $17,372 | $14,498 | $0.12 | |
| Vacancy | $0 | ($415,698) | ($3.33) | |
| Effective Gross Income | $4,655,428 | $4,744,296 | $38.06 | |
| Taxes | $586,202 | $583,889 | $4.68 | |
| Insurance | $38,069 | $53,882 | $0.43 | |
| Other Operating Expenses | $1,514,952 | $1,508,827 | $12.10 | |
| Total Operating Expenses | $2,139,223 | $2,146,598 | $17.22 | |
| Net Operating Income | $2,516,205 | $2,597,698 | $20.84 | |
| TI/LC | $0 | $186,779 | $1.50 | |
| Capital Expenditures | $0 | $24,933 | $0.20 | |
| Net Cash Flow | $2,516,205 | $2,385,986 | $19.14 | |
| Occupancy% | 93.6% | 91.9%(3) | ||
| NOI DSCR | 2.20x | 2.27x | ||
| NCF DSCR | 2.20x | 2.08x | ||
| NOI Debt Yield | 8.1% | 8.3% | ||
| NCF Debt Yield | 8.1% | 7.6% | ||
| (1) | Financial information prior to 2019 is not available because the borrower sponsor acquired the F Street and K Street Office Portfolio Properties on May 31, 2019. |
| (2) | UW Gross Potential Rent is based on the January 1, 2020 rent roll and includes first 12 months of rent steps. |
| (3) | UW Occupancy is based on in-place economic vacancy. |
Escrows and Reserves.
Real Estate Taxes and Insurance– The F Street and K Street Office Portfolio Borrower deposited an upfront real estate tax and insurance reserve of $343,131 and $54,330, respectively. In addition, ongoing monthly escrows are required in an amount equal to 1/12 of the real estate taxes and insurance premiums that the lender estimates will be payable during the next 12 months (initially $49,019 and $4,939 respectively).
Replacement Reserves– The F Street and K Street Office Portfolio Borrower is required to deposit ongoing monthly replacement reserves of $2,078.
TI/LC Reserves– The F Street and K Street Office Portfolio Borrower is required to deposit monthly reserves for tenant improvements and leasing commissions of $15,583, capped at $561,002.
Lockbox and Cash Management. The F Street and K Street Office Portfolio Mortgage Loan is structured with a hard lockbox and springing cash management. Revenues from the F Street and K Street Office Portfolio Properties are required to be deposited directly into the lockbox account or, if received by the F Street and K Street Office Portfolio Borrower or the property manager, deposited within two business days of receipt. During a Cash Sweep Period, funds in the lockbox account are required to be swept on each business day to the lender-controlled cash management account and disbursed according to the F Street and K Street Office Portfolio Mortgage Loan documents. Also during the continuance of a Cash Sweep Period, all excess cash is required to be held by the lender as additional collateral for the F Street and K Street Office Portfolio Mortgage Loan.
A “Cash Sweep Period” will occur during (i) the occurrence and continuance of an event of default until the cure of such event of default or (ii) the period beginning when the debt service coverage ratio is less than 1.15x for two consecutive quarters and ending on the last day of the calendar month during which the lender notifies the F Street and K Street Office Portfolio Borrower that the debt service coverage ratio equals or exceeds 1.20x for two consecutive quarters.
Additional Secured Indebtedness (not including trade debts). None.
| This is not a research report and was not prepared by any Underwriter’s research department. Please see additional important information and qualifications at the end of this Term Sheet. |
T-133
| Office – CBD | Loan #10 | Cut-off Date Balance: | $31,200,000 | |
| 1612 K Street Northwest & | F Street and K Street Office Portfolio | Cut-off Date LTV: | 63.4% | |
| 1319 F Street Northwest | U/W NCF DSCR: | 2.08x | ||
| Washington, DC 20006; 20004 | U/W NOI Debt Yield: | 8.3% |
Mezzanine Loan and Preferred Equity.None.
Release of Property.The F Street and K Street Office Portfolio Borrower has the right, at any time after the defeasance lockout period, and provided no event of default under the F Street and K Street Office Portfolio Mortgage Loan documents exists, to obtain the release of either individual property, provided certain conditions are satisfied, including (i) partial defeasance of the F Street and K Street Office Portfolio Mortgage Loan in a principal amount equal to 125% of the allocated loan amount of the related individual property; (ii) after giving effect to the release (a) the debt yield is not less than the greater of (x) the debt yield immediately prior to the release and (y) 7.65%; (b) the debt service coverage ratio is not less than the greater of (x) the debt service coverage ratio immediately prior to the release and (y) 2.08x; and (c) the loan to value ratio is not more than the lesser of (x) the loan to value ratio immediately prior to the release and (y) 63.4%; and (iii) satisfaction of REMIC-related requirements including delivery of a REMIC opinion and rating agency confirmation.
Right of First Offer/Right of First Refusal.None.
Ground Lease. None.
Letter of Credit.None.
Terrorism Insurance.The F Street and K Street Office Portfolio Mortgage Loan documents require that the property insurance policy required to be maintained by the F Street and K Street Office Portfolio Borrower provide coverage for perils and acts of terrorism in an amount equal to 100% of the full replacement cost of the F Street and K Street Office Portfolio Properties. The F Street and K Street Office Portfolio Mortgage Loan documents also require business interruption insurance covering no less than the 12-month period following the occurrence of a casualty event, together with a 6-month extended period of indemnity. See“Risk Factors—Risks Relating to the Mortgage Loans—Terrorism Insurance May Not Be Available for All Mortgaged Properties” in the Preliminary Prospectus.
| This is not a research report and was not prepared by any Underwriter’s research department. Please see additional important information and qualifications at the end of this Term Sheet. |
T-134
(THIS PAGE INTENTIONALLY LEFT BLANK)
T-135
| Mortgage Loan No. 11 – Marriott Richmond Dual Brand |
| Mortgage Loan Information | Property Information | ||||||
| Mortgage Loan Seller: | WFB | Single Asset/Portfolio: | Single Asset | ||||
| Credit Assessment (DBRS/Fitch/S&P): | NR/NR/NR | Location: | Richmond, VA 23219 | ||||
| Original Balance: | $29,900,000 | General Property Type: | Hospitality | ||||
| Cut-off Date Balance: | $29,900,000 | Detailed Property Type: | Select Service | ||||
| % of Initial Pool Balance: | 2.5% | Title Vesting: | Fee | ||||
| Loan Purpose: | Recapitalization | Year Built/Renovated: | 2014/N/A | ||||
| Sponsor: | Apple Hospitality REIT, Inc. | Size: | 210 Rooms | ||||
| Guarantor: | Apple Hospitality REIT, Inc. | Cut-off Date Balance per Room: | $142,381 | ||||
| Mortgage Rate: | 3.4000% | Maturity Date Balance per Room: | $110,941 | ||||
| Note Date: | 2/12/2020 | Property Manager: | White Lodging Services Corporation | ||||
| First Payment Date: | 4/11/2020 | Underwriting and Financial Information | |||||
| Maturity Date: | 3/11/2030 | UW NOI: | $4,793,943 | ||||
| Original Term to Maturity: | 120 months | UW NOI Debt Yield: | 16.0% | ||||
| Original Amortization Term: | 360 months | UW NOI Debt Yield at Maturity: | 20.6% | ||||
| IO Period: | 0 months | UW NCF DSCR: | 2.73x | ||||
| Seasoning: | 0 months | Most Recent NOI: | $4,802,849 (12/31/2019) | ||||
| Prepayment Provisions: | LO (24); YM1 (89); O (7) | 2nd Most Recent NOI: | $5,049,390 (12/31/2018) | ||||
| Lockbox/Cash Mgmt Status: | Springing/Springing | 3rd Most Recent NOI: | $5,122,560 (12/31/2017) | ||||
| Additional Debt Type: | N/A | Most Recent Occupancy: | 80.3% (12/31/2019) | ||||
| Additional Debt Balance: | N/A | 2nd Most Recent Occupancy: | 79.1% (12/31/2018) | ||||
| Future Debt Permitted (Type): | No (N/A) | 3rd Most Recent Occupancy: | 81.6% (12/31/2017) | ||||
| Reserves | Appraised Value (as of): | $56,200,000 (12/2/2019) | |||||
| Type | Initial | Monthly | Cap | Appraised Value per Room: | $267,619 | ||
| RE Tax: | $0 | Springing(1) | N/A | Cut-off Date LTV Ratio: | 53.2% | ||
| Insurance: | $0 | Springing(2) | N/A | Maturity Date LTV Ratio: | 41.5% | ||
| FF&E: | $0 | $37,267 | N/A | ||||
| Sources and Uses | ||||||
| Sources | Proceeds | % of Total | Uses | Proceeds | % of Total | |
| Loan Amount: | $29,900,000 | 100.0% | Closing Costs: | $211,775 | 0.7% | |
| Return of Equity: | $29,688,225(3) | 99.3% | ||||
| Total Sources: | $29,900,000 | 100.0% | Total Uses: | $29,900,000 | 100.0% | |
| (1) | As long as the borrower sponsor maintains control of the Marriott Richmond Dual Brand Borrower (as defined below) and the Operating Lessee (as defined below), the loan documents do not require monthly escrows for taxes as long as (i) no event of default has occurred and is continuing, (ii) the Marriott Richmond Dual Brand Borrower pays all applicable taxes; and (iii) the Marriott Richmond Dual Brand Borrower delivers evidence to the lender that taxes have been paid. |
| (2) | The Marriott Richmond Dual Brand Mortgage Loan documents do not require ongoing monthly escrows for insurance premiums as long as (i) no event of default has occurred and is continuing, (ii) the Marriott Richmond Dual Brand Property (as defined below) is covered under a blanket policy acceptable to the lender, (iii) the Marriott Richmond Dual Brand Borrower delivers evidence to the lender of renewal; and (iv) the Marriott Richmond Dual Brand Borrower delivers evidence to the lender of payment within 10 business days prior to expiration. |
| (3) | Prior to the origination of the Marriott Richmond Dual Brand Mortgage Loan, the Marriott Richmond Dual Brand Property was unencumbered by debt. |
The Mortgage Loan. The eleventh largest mortgage loan (the “Marriott Richmond Dual Brand Mortgage Loan”) is evidenced by a single promissory note in the original principal amount of $29,900,000 secured by a first priority fee mortgage encumbering a select service hospitality property located in Richmond, Virginia (the “Marriott Richmond Dual Brand Property”).
The Borrower and the Borrower Sponsor.The borrower is Apple Nine SPE Richmond, Inc. (the “Marriott Richmond Dual Brand Borrower”), a single-purpose Virginia corporation with no independent directors. Two operating leases are in-place (one for each brand) with respect to the Marriott Richmond Dual Brand Property, both between the Marriott Richmond Dual Brand Borrower, as lessor, and Apple Nine Services Richmond, Inc., a Virginia corporation, as lessee (the “Operating Lessee”).
The borrower sponsor and non-recourse carveout guarantor is Apple Hospitality REIT, Inc. (“Apple REIT”; NYSE: APLE). Founded in 2007, Apple REIT is a publicly traded real estate investment trust. Apple REIT’s portfolio consists of 232 hotels with approximately 29,800 guest rooms located in 87 markets throughout 34 states. The company’s portfolio comprises 105 Marriott-branded hotels, 124 Hilton-branded hotels, one Hyatt-branded hotel and two independent hotels.
The Property.The Marriott Richmond Dual Brand Property is a 6-story, 210-key select service hotel located in Richmond, Virginia. Built in 2014, the Marriott Richmond Dual Brand Property operates as a dual-branded Residence Inn (75 rooms) and Courtyard (135 rooms) hotel with two separate lobbies. Shared amenities at the Marriott Richmond Dual Brand Property include 2,862 SF of meeting space, a fitness center, guest laundry, and two 24-hour convenience markets. Residence Inn guests at the Marriott Richmond Dual Brand Property are provided with a complimentary breakfast buffet.
The Residence Inn features 65 studio guestrooms and 10 one-bedroom suites. The Courtyard features 65 double queen guestrooms and 70 king guestrooms. The Marriott Richmond Dual Brand Property was constructed in 2014 by the borrower sponsor. The Marriott Richmond Dual Brand Property has two separate franchise agreements with Marriott International, Inc., each of which expires on December 8, 2034.
| This is not a research report and was not prepared by any Underwriter’s research department. Please see additional important information and qualifications at the end of this Term Sheet. |
T-136
| Hospitality – Select Service | Loan #11 | Cut-off Date Balance: | $29,900,000 | |
| 1320 East Cary Street | Marriott Richmond Dual Brand | Cut-off Date LTV: | 53.2% | |
| Richmond, VA 23219 | U/W NCF DSCR: | 2.73x | ||
| U/W NOI Debt Yield: | 16.0% |
The Market. The Marriott Richmond Dual Brand Property is located in Richmond, Virginia, within the historic Shockoe Slip neighborhood. The Marriott Richmond Dual Brand Property is located approximately 0.2 miles west of Interstate 95, 1.2 miles south of Interstate 64, 6.1 miles southeast of Interstate 195, 0.2 miles west of Richmond Main Street Station, and 8.2 miles west of Richmond International Airport. The Marriott Richmond Dual Brand Property is within close proximity to many of the area’s demand drivers, including the Virginia State Capitol Building (approximately 0.3 miles), VCU Medical Campus (0.7 miles), the Seigel Center (1.8 miles), the Greater Richmond Convention Center (0.9 miles) and James Center (0.3 miles).
According to the appraisal, the estimated 2019 population within a one-, three- and five- mile radius of the Marriott Richmond Dual Brand Property was 20,078, 133,650 and 256,310, respectively; and the estimated 2019 average household income within the same radii was $57,076, $55,937 and $62,315, respectively.
The appraisal did not identify any hotels that are proposed or currently under development that are expected to be directly competitive with the Marriott Richmond Dual Brand Property.
The following tables present historical occupancy, ADR, RevPAR and penetration rates relating to the Residence Inn and Courtyard brands at the Marriott Richmond Dual Brand Property:
| Residence Inn Historical Occupancy, ADR, RevPAR(1) | ||||||||||||
| Competitive Set | Residence Inn | Penetration Factor | ||||||||||
| Year | Occupancy | ADR | RevPAR | Occupancy | ADR | RevPAR | Occupancy | ADR | RevPAR | |||
| 12/31/2016 | 64.9% | $138.42 | $89.90 | 77.5% | $147.42 | $114.20 | 119.3% | 106.5% | 127.0% | |||
| 12/31/2017 | 61.3% | $148.36 | $90.92 | 84.2% | $153.16 | $128.89 | 137.3% | 103.2% | 141.8% | |||
| 12/31/2018 | 65.2% | $149.65 | $97.57 | 82.0% | $157.04 | $128.78 | 125.8% | 104.9% | 132.0% | |||
| 10/31/2019 TTM | 68.7% | $149.76 | $102.85 | 83.3% | $155.10 | $129.25 | 121.3% | 103.6% | 125.7% | |||
Source:Industry Report.
| (1) | Information obtained from third party hospitality research reports dated November 18, 2019 and January 18, 2019. The competitive set includes the following hotels: Omni Richmond Hotel, Delta Hotel Richmond Downtown, Holiday Inn Express Richmond Downtown, Hilton Richmond Downtown. Hampton Inn Richmond Downtown and Homewood Suites by Hilton Richmond Downtown. |
| Courtyard Historical Occupancy, ADR, RevPAR(1) | ||||||||||||
| Competitive Set | Courtyard | Penetration Factor | ||||||||||
| Year | Occupancy | ADR | RevPAR | Occupancy | ADR | RevPAR | Occupancy | ADR | RevPAR | |||
| 12/31/2016 | 64.9% | $138.42 | $89.90 | 76.7% | $158.32 | $121.49 | 118.2% | 114.4% | 135.1% | |||
| 12/31/2017 | 61.3% | $148.36 | $90.92 | 80.2% | $167.26 | $134.17 | 130.9% | 112.7% | 147.6% | |||
| 12/31/2018 | 65.2% | $149.65 | $97.57 | 77.5% | $165.55 | $128.32 | 118.9% | 110.6% | 131.5% | |||
| 10/31/2019 TTM | 68.7% | $149.76 | $102.85 | 76.8% | $163.96 | $125.93 | 111.8% | 109.5% | 122.4% | |||
Source:Industry Report.
| (1) | Information obtained from third party hospitality research reports dated November 18, 2019 and January 18, 2019. The competitive set includes the following hotels: Omni Richmond Hotel, Delta Hotel Richmond Downtown, Holiday Inn Express Richmond Downtown, Hilton Richmond Downtown. Hampton Inn Richmond Downtown and Homewood Suites by Hilton Richmond Downtown. |
The following table presents certain information relating to the primary competitive properties to the Marriott Richmond Dual Brand Property:
| Property Competitive Summary(1) | ||||||||
| Property Name | No. of Rooms | Commercial | Group | Leisure | Extended Stay | Estimated 2018 Occupancy | Estimated 2018 ADR | Estimated 2018 RevPAR |
| Marriott Richmond Dual Brand Property(2) | 210 | 40% | 10% | 10% | 40% | 79% | $162.52 | $128.55 |
| Homewood Suites by Hilton Richmond Downtown | 100 | 40% | 15% | 10% | 35% | 78% | $145.00 | $113.10 |
| Hampton Inn Richmond Downtown | 144 | 55% | 12% | 28% | 5% | 67% | $136.00 | $91.12 |
| Delta Hotel Richmond Downtown | 298 | 50% | 35% | 10% | 5% | 64% | $150.00 | $96.00 |
| Omni Richmond Hotel | 359 | 35% | 36% | 24% | 5% | 60% | $152.00 | $91.20 |
| Hilton Richmond Downtown | 250 | 45% | 38% | 13% | 4% | 68% | $163.00 | $110.84 |
| Holiday Inn Express Richmond Downtown | 100 | 40% | 3% | 52% | 5% | 65% | $136.00 | $88.40 |
Source:Appraisal.
| (1) | Variances between the underwriting, the appraisal and the Historical Occupancy, ADR, RevPAR table above with respect to Occupancy, ADR and RevPAR at the Marriott Richmond Dual Brand Property are attributable to variances in reporting methodologies and/or timing differences. |
| (2) | Represents both brands at the Marriott Richmond Dual Brand Property. |
| This is not a research report and was not prepared by any Underwriter’s research department. Please see additional important information and qualifications at the end of this Term Sheet. |
T-137
| Hospitality – Select Service | Loan #11 | Cut-off Date Balance: | $29,900,000 | |
| 1320 East Cary Street | Marriott Richmond Dual Brand | Cut-off Date LTV: | 53.2% | |
| Richmond, VA 23219 | U/W NCF DSCR: | 2.73x | ||
| U/W NOI Debt Yield: | 16.0% |
Operating History and Underwritten Net Cash Flow. The following table presents certain information relating to the operating history and Underwritten Net Cash Flow at the Marriott Richmond Dual Brand Property:
| Cash Flow Analysis | ||||||
| 2016 | 2017 | 2018 | 2019 | UW | UW per Room | |
| Occupancy | 77.2% | 81.6% | 79.1% | 80.3% | 80.3% | |
| ADR | $154.40 | $162.17 | $162.52 | $159.89 | $159.89 | |
| RevPAR | $119.21 | $132.37 | $128.58 | $128.42 | $128.42 | |
| Room Revenue | $9,137,660 | $10,145,880 | $9,855,610 | $9,843,590 | $9,843,590 | $46,874 |
| Food & Beverage Revenue | 494,130 | 485,740 | 538,960 | 604,376 | 604,376 | 2,878 |
| Parking Revenue | 560,773 | 474,119 | 546,279 | 521,517 | 521,517 | 2,483 |
| Other Income(1) | 95,057 | 96,961 | 212,421 | 210,570 | 210,570 | 1,003 |
| Total Revenue | $10,287,620 | $11,202,700 | $11,153,270 | $11,180,053 | $11,180,053 | $53,238 |
| Room Expense | 1,953,527 | 2,090,703 | 2,101,567 | 2,173,076 | 2,173,076 | 10,348 |
| Food & Beverage Expense | 328,660 | 357,600 | 388,800 | 402,005 | 402,005 | 1,914 |
| Other Departmental Expenses | 518,960 | 470,030 | 520,120 | 520,080 | 520,080 | 2,477 |
| Total Departmental Expenses | $2,801,147 | $2,918,333 | $3,010,487 | $3,095,161 | $3,095,161 | $14,739 |
| Gross Operating Income | $7,486,473 | $8,284,367 | $8,142,783 | $8,084,892 | $8,084,892 | $38,499 |
| Total Undistributed Expenses | 2,301,883 | 2,734,757 | 2,679,293 | 2,874,197 | 2,874,197 | 13,687 |
| Gross Operating Profit | $5,184,590 | $5,549,610 | $5,463,490 | $5,210,695 | $5,210,695 | $24,813 |
| Total Fixed Charges | 409,620 | 427,050 | 414,100 | 407,846 | 416,752 | 1,985 |
| Total Operating Expenses | $5,512,650 | $6,080,140 | $6,103,880 | $6,377,205 | $6,386,110 | $30,410 |
| Net Operating Income | $4,774,970 | $5,122,560 | $5,049,390 | $4,802,849 | $4,793,943 | $22,828 |
| FF&E | 0 |
|
| 0 | 447,202 | 2,130 |
| Net Cash Flow | $4,774,970 | $5,122,560 | $5,049,390 | $4,802,849 | $4,346,741 | $20,699 |
| NOI DSCR | 3.00x | 3.22x | 3.17x | 3.02x | 3.01x | |
| NCF DSCR | 3.00x | 3.22x | 3.17x | 3.02x | 2.73x | |
| NOI Debt Yield | 16.0% | 17.1% | 16.9% | 16.1% | 16.0% | |
| NCF Debt Yield | 16.0% | 17.1% | 16.9% | 16.1% | 14.5% | |
| (1) | Other Income consists primarily of gift shop / sundry income, but also includes telephone, valet and coin laundry, vending, meeting room, and other miscellaneous items. |
| This is not a research report and was not prepared by any Underwriter’s research department. Please see additional important information and qualifications at the end of this Term Sheet. |
T-138
(THIS PAGE INTENTIONALLY LEFT BLANK)
T-139
| Mortgage Loan No. 12 – Steeples Apartments |
| Mortgage Loan Information | Property Information | |||||||
| Mortgage Loan Seller: | MSMCH | Single Asset/Portfolio: | Single Asset | |||||
| Credit Assessment (DBRS/Fitch/S&P): | NR/NR/NR | Location: | Houston, TX 77077 | |||||
| Original Balance: | $28,300,000 | General Property Type: | Multifamily | |||||
| Cut-off Date Balance: | $28,300,000 | Detailed Property Type: | Garden | |||||
| % of Initial Pool Balance: | 2.4% | Title Vesting: | Fee | |||||
| Loan Purpose: | Refinance | Year Built/Renovated: | 1982/2017 | |||||
| Borrower Sponsor: | Nitya Capital, LLC | Size: | 409 Units | |||||
| Guarantor: | Swapnil Agarwal | Cut-off Date Balance per Unit: | $69,193 | |||||
| Mortgage Rate: | 3.8900% | Maturity Date Balance per Unit: | $69,193 | |||||
| Note Date: | 12/20/2019 | Property Manager: | Karya Property Management, | |||||
| First Payment Date: | 2/1/2020 | LLC (borrower-related) | ||||||
| Maturity Date: | 1/1/2030 | |||||||
| Original Term to Maturity: | 120 months | Underwriting and Financial Information | ||||||
| Original Amortization Term: | 0 months | UW NOI: | $2,174,062 | |||||
| IO Period: | 120 months | UW NOI Debt Yield: | 7.7% | |||||
| Seasoning: | 2 months | UW NOI Debt Yield at Maturity: | 7.7% | |||||
| Prepayment Provisions: | LO (23); YM1 (92); O (5) | UW NCF DSCR: | 1.85x | |||||
| Lockbox/Cash Mgmt Status: | Springing/Springing | Most Recent NOI: | $2,201,117 (10/31/2019 TTM) | |||||
| Additional Debt Type: | N/A | 2nd Most Recent NOI: | $2,156,658 (12/31/2018) | |||||
| Additional Debt Balance: | N/A | 3rd Most Recent NOI: | $2,279,974 (12/31/2017) | |||||
| Future Debt Permitted (Type): | Yes (Mezzanine) | Most Recent Occupancy: | 88.8% (11/30/2019) | |||||
| Reserves | 2nd Most Recent Occupancy: | 89.2% (12/31/2018) | ||||||
| Type | Initial | Monthly | Cap | 3rd Most Recent Occupancy: | 94.4% (12/31/2017) | |||
| RE Tax: | $32,136 | $32,136 | N/A | Appraised Value (as of): | $40,600,000 (11/15/2019) | |||
| Insurance: | $170,248 | $21,281 | N/A | Appraised Value per Unit: | $99,267 | |||
| Deferred Maintenance: | $484,028 | $0 | N/A | Cut-off Date LTV Ratio: | 69.7% | |||
| Recurring Replacements: | $0 | $9,100 | N/A | Maturity Date LTV Ratio: | 69.7% | |||
| Sources and Uses | ||||||
| Sources | Proceeds | % of Total | Uses | Proceeds | % of Total | |
| Loan Amount: | $28,300,000 | 100.0% | Loan Payoff: | $23,364,581 | 82.6% | |
| Return of Equity: | $3,544,935 | 12.5% | ||||
| Closing Costs: | $704,071 | 2.5% | ||||
| Reserves: | $686,412 | 2.4% | ||||
| Total Sources: | $28,300,000 | 100.0% | Total Uses: | $28,300,000 | 100.0% | |
The Mortgage Loan. The twelfth largest mortgage loan (the “Steeples Apartments Mortgage Loan”) is evidenced by a promissory note in the original principal amount of $28,300,000, which is secured by a first priority fee mortgage encumbering a multifamily property located in Houston, Texas (the “Steeples Apartments Property”).
The Borrower and the Borrower Sponsor.The borrower is Steeples Apartments, LLC, a single-purpose Delaware limited liability company with one independent director. The borrower sponsor is Nitya Capital, LLC (“Nitya Capital”) and the non-recourse carve-out guarantor is Swapnil Agarwal, the founder and managing principal of Nitya Capital. Nitya Capital is a privately held real estate investment firm that focuses on the acquisition and management of multifamily properties. Since inception in 2013, Nitya Capital has acquired over 16,300 multifamily units and over 400,000 SF of commercial office space throughout Texas.
The Property.The Steeples Apartments Property is a two-story, 409-unit garden-style apartment complex located in Houston, Texas. The Steeples Apartments Property was built in 1982 and is situated on 11.35 acres with 530 parking spaces. The unit mix comprises one- and two-bedroom floorplans, an NRA of 327,230 SF and average unit size of 800 SF. As of November 30, 2019, the Steeples Apartments Property was 88.8% occupied, with average in-place rent of $805/unit ($1.01 PSF). Common amenities at the Steeples Apartments Property include a business center, meeting rooms, fitness rooms, a swimming pool, on-site security and laundry facilities. Unit amenities include a dishwasher and disposal, stainless steel appliances, central air conditioning, walk-in closets, patios/balconies, granite/stone countertops and ceiling fans. As of October 2019, according to the borrower sponsor, it has invested approximately $3.6 million ($8,889 per unit) in capital improvements at the Steeples Apartments Property since its acquisition in April 2016, primarily on interior finishes, such as flooring, appliances, general interior improvements, resurfacing bathrooms and resurfacing kitchens. A total of 296 of the Steeples Apartments Property units (72.4%) have been fully upgraded, 36 units (8.8%) have been partially upgraded and 77 units (18.8%) have not been upgraded.
| This is not a research report and was not prepared by any Underwriter’s research department. Please see additional important information and qualifications at the end of this Term Sheet. |
T-140
| Multifamily – Garden | Loan #12 | Cut-off Date Balance: | $28,300,000 | |
| 2151 South Kirkwood | Steeples Apartments | Cut-off Date LTV: | 69.7% | |
| Houston, TX 77077 | U/W NCF DSCR: | 1.85x | ||
| U/W NOI Debt Yield: | 7.7% |
The following table presents certain information relating to the unit mix at the Steeples Apartments Property:
| Unit Mix | ||||||
| Unit Mix / Type | Units | Occupied Units | % Occupied | Average SF per Unit | Total SF | Monthly Average Rent per Unit |
| One-Bedroom | 250 | 225 | 90.0% | 654 | 163,448 | $725 |
| Two-Bedroom | 159 | 138 | 86.8% | 1,030 | 163,782 | $935 |
| Total/Wtd. Avg. | 409 | 363 | 88.8% | 800 | 327,230 | $805 |
Source:Borrower rent roll dated November 30, 2019.
The Market. The Steeples Apartments Property is located in Houston, Texas, within the Briar Forest/Ashford submarket of the Houston multifamily market. Major employers in the area include a number of energy companies, retail and service industries. The closest major commercial corridors to the Steeples Apartments Property are Westheimer Road, Eldridge Parkway and Richmond Avenue. The Westheimer Road area provides supporting retail and entertainment services to the Steeples Apartments Property. Memorial City Mall and City Centre Plaza are large retail shopping centers that are just east of the Steeples Apartments Property. Nearby are big box retail properties such as Target, Home Goods, Michaels, PetSmart, 24-Hour Fitness and Office Depot, along with smaller retail properties such as restaurants, Party City, Bath & Body Works, Starbucks and Ulta. Development activity in the immediate area has been predominantly for retail or multi-family uses. Interstate 10 and the Sam Houston Tollway provide access to the Steeples Apartments Property from the greater Houston metropolitan area. According to the appraisal, as of the second quarter of 2019, the vacancy rate in the Houston multifamily market was approximately 5.7%, with average asking rents of $1,032 per unit and inventory of approximately 574,739 units. According to the appraisal, as of the second quarter of 2019, the vacancy rate in the Briar Forest/Ashford submarket was approximately 7.5%, with average asking rents of $1,118 per unit and inventory of approximately 47,974 units. According to the appraisal, the 2019 population within a one-, three- and five-mile radius of the Steeples Apartments Property was 26,876, 190,564 and 461,796, respectively. The 2019 median household income within the same one-, three- and five-mile radius was $60,091, $60,899 and $52,626, respectively.
The following table presents certain information relating to the appraisal’s market rent conclusion for the Steeples Apartments Property:
| Market Rent Summary | |||||
| Building | Units | Average Size (SF) | Avg. Monthly Contract Rent per Unit | Avg. Monthly Asking Rent per Unit | Avg. Monthly Market Rent per Unit |
| 1BR/1BA | 53 | 646 | $685 | $701 | $722 |
| 1BR/1BA - Renovated | 197 | 656 | $736 | $745 | $768 |
| 2BR/1BA | 8 | 954 | $845 | $857 | $875 |
| 2BR/1BA - Renovated | 41 | 957 | $893 | $916 | $952 |
| 2BR/2BA | 16 | 1,063 | $901 | $942 | $975 |
| 2BR/2BA - Renovated | 94 | 1,063 | $963 | $965 | $1,026 |
The following table presents certain information relating to comparable rental properties to the Steeples Apartments Property:
| Comparable Rental Properties | ||||||
| Property | Year Built | # Units | Unit Mix | Average SF per Unit | Average Rent per Unit | Average Annual Rent PSF |
| Steeples Apartments | 1982 | 409 | 1BR 2BR | 654 1,030 | $725 $935 | $1.11 $0.91 |
| The Edison Apartment Homes | 1978 | 272 | Studio 1BR 2BR | 525 688 1,016 | $762 $884 $940 | $1.45 $1.28 $0.93 |
| Eden Pointe at Wilcrest | 1976 | 198 | 1BR 2BR 3BR 4BR | 842 1,017 1,288 1,778 | $937 $1,058 $1,230 $1,445 | $1.11 $1.04 $0.95 $0.81 |
| The Aubrey | 1977 | 436 | 1BR 2BR 3BR | 700 947 1,262 | $870 $1,070 $1,515 | $1.24 $1.13 $1.20 |
| The Abbey at Briar Forest | 1977 | 680 | 1BR 2BR 3BR | 604 833 1,115 | $750 $870 $1,178 | $1.24 $1.04 $1.06 |
Source:Appraisal.
| This is not a research report and was not prepared by any Underwriter’s research department. Please see additional important information and qualifications at the end of this Term Sheet. |
T-141
| Multifamily – Garden | Loan #12 | Cut-off Date Balance: | $28,300,000 | |
| 2151 South Kirkwood | Steeples Apartments | Cut-off Date LTV: | 69.7% | |
| Houston, TX 77077 | U/W NCF DSCR: | 1.85x | ||
| U/W NOI Debt Yield: | 7.7% |
Operating History and Underwritten Net Cash Flow. The following table presents certain information relating to the operating history and Underwritten Net Cash Flow at the Steeples Apartments Property:
| Cash Flow Analysis | |||||
| 2017 | 2018 | 10/31/2019 TTM | UW | UW Unit | |
| Gross Potential Rent(1) | $3,735,165 | $3,849,612 | $3,964,991 | $3,963,528 | $9,690.78 |
| Discounts Concessions(2) | ($33,798) | ($21,061) | ($60,024) | ($60,024) | ($146.76) |
| Other Income(3) | $460,217 | $416,503 | $434,305 | $434,305 | $1,061.87 |
| Less Vacancy & Credit Loss | ($317,551) | ($423,519) | ($560,326) | ($558,863) | ($1,366.41) |
| Effective Gross Income | $3,844,032 | $3,821,535 | $3,778,947 | $3,778,947 | $9,239.48 |
| Real Estate Taxes | $286,785 | $295,225 | $319,189 | $308,498 | $754.27 |
| Insurance | $93,026 | $150,882 | $138,612 | $214,633 | $524.78 |
| Other Expenses | $1,184,248 | $1,218,771 | $1,120,029 | $1,081,754 | $2,644.88 |
| Total Expenses | $1,564,058 | $1,664,878 | $1,577,830 | $1,604,885 | $3,923.92 |
| Net Operating Income | $2,279,974 | $2,156,658 | $2,201,117 | $2,174,062 | $5,315.55 |
| Capital Expenditures | $0 | $0 | $0 | $109,203 | $267.00 |
| Net Cash Flow | $2,279,974 | $2,156,658 | $2,201,117 | $2,064,859 | $5,048.55 |
| Occupancy % | 94.4% | 89.2% | 88.8% | 85.9% | |
| NOI DSCR | 2.04x | 1.93x | 1.97x | 1.95x | |
| NCF DSCR | 2.04x | 1.93x | 1.97x | 1.85x | |
| NOI Debt Yield | 8.1% | 7.6% | 7.8% | 7.7% | |
| NCF Debt Yield | 8.1% | 7.6% | 7.8% | 7.3% | |
| (1) | UW Gross Potential Rent and 10/31/2019 TTM Occupancy % is based on the borrower rent roll dated November 30, 2019. |
| (2) | As of origination, discounts of $199 off the first month’s rent were offered for one bedroom units and $299 for two bedroom units. |
| (3) | Other Income consists of utility reimbursements as well as other miscellaneous fees and charges. |
| This is not a research report and was not prepared by any Underwriter’s research department. Please see additional important information and qualifications at the end of this Term Sheet. |
T-142
(THIS PAGE INTENTIONALLY LEFT BLANK)
T-143
| Mortgage Loan No. 13 – Coral Sky Plaza |
| Mortgage Loan Information | Property Information | ||||||
| Mortgage Loan Seller: | MSMCH | Single Asset/Portfolio: | Single Asset | ||||
| Credit Assessment (DBRS/Fitch/S&P): | NR/NR/NR | Location: | Royal Palm Beach, FL 33411 | ||||
| Original Balance: | $26,125,000 | General Property Type: | Retail | ||||
| Cut-off Date Balance: | $26,125,000 | Detailed Property Type: | Anchored | ||||
| % of Initial Pool Balance: | 2.2% | Title Vesting: | Fee | ||||
| Loan Purpose: | Acquisition | Year Built/Renovated: | 1999-2001, N/A | ||||
| Borrower Sponsor: | Kenneth R. Silverman | Size: | 232,727 SF | ||||
| Guarantor: | Kenneth R. Silverman | Cut-off Date Balance Per SF: | $112 | ||||
| Mortgage Rate: | 3.7250% | Maturity Date Balance Per SF: | $112 | ||||
| Note Date: | 1/17/2020 | Property Manager: | Jones Lang Lasalle Americas, | ||||
| First Payment Date: | 3/1/2020 | Inc. | |||||
| Maturity Date: | 2/1/2030 | ||||||
| Original Term to Maturity: | 120 months | Underwriting and Financial Information | |||||
| Original Amortization Term: | 0 months | UW NOI: | $2,703,530 | ||||
| IO Period: | 120 months | UW NOI Debt Yield: | 10.3% | ||||
| Seasoning: | 1 month | UW NOI Debt Yield at Maturity: | 10.3% | ||||
| Prepayment Provisions: | LO (25); DEF (90); O (5) | UW NCF DSCR: | 2.47x | ||||
| Lockbox/Cash Mgmt Status: | Springing/Springing | Most Recent NOI: | $2,701,534 (10/31/2019 TTM) | ||||
| Additional Debt Type: | N/A | 2nd Most Recent NOI: | $2,758,373 (6/30/2019 TTM) | ||||
| Additional Debt Balance: | N/A | 3rd Most Recent NOI: | $2,786,088 (6/30/2018 TTM) | ||||
| Future Debt Permitted (Type): | No (N/A) | Most Recent Occupancy: | 95.6% (9/16/2019) | ||||
| Reserves | 2nd Most Recent Occupancy: | 98.8% (6/30/2019) | |||||
| Type | Initial | Monthly | Cap | 3rd Most Recent Occupancy: | 98.8% (6/30/2018) | ||
| RE Tax: | $120,656 | $30,164 | N/A | Appraised Value (as of): | $39,800,000 (12/2/2019) | ||
| Insurance: | $20,766 | $10,383 | N/A | Appraised Value per SF: | $171 | ||
| Deferred Maintenance: | $24,313 | $0 | N/A | Cut-off Date LTV Ratio: | 65.6% | ||
| Capital Expenditures: | $0 | $3,103 | N/A | Maturity Date LTV Ratio: | 65.6% | ||
| TI/LC: | $300,000 | $14,545 | $600,000 | ||||
| Sources and Uses | ||||||
| Sources | Proceeds | % of Total | Uses | Proceeds | % of Total | |
| Mortgage Loan Amount: | $26,125,000 | 63.8% | Purchase Price: | $39,500,000 | 96.4% | |
| Borrower Equity: | $14,834,911 | 36.2% | Closing Costs: | $994,176 | 2.4% | |
| Reserves | $465,735 | 1.1% | ||||
| Total Sources: | $40,959,911 | 100.0% | Total Uses: | $40,959,911 | 100.0% | |
The Mortgage Loan.The thirteenth largest mortgage loan (the “Coral Sky Plaza Mortgage Loan”) is evidenced by a promissory note in the original principal amount of $26,125,000 and secured by a first priority fee mortgage encumbering a 232,727 SF anchored retail shopping center located in Royal Palm Beach, Florida (the “Coral Sky Plaza Property”).
The Borrower and the Borrower Sponsor.The borrower for the Coral Sky Plaza Mortgage Loan is Coral Sky Retail LLC (the “Coral Sky Plaza Borrower”), a single-purpose Delaware limited liability company with one independent director. The non-recourse carevout guarantor and borrower sponsor is Kenneth R. Silverman. Kenneth R. Silverman has a 44.0% indirect ownership interest in the Coral Sky Borrower. Kenneth R. Silverman has over thirty years’ experience in senior executive positions in residential real estate management and sales, working with both luxury properties and middle income investment properties.
The Property.The Coral Sky Plaza Property is an anchored retail shopping center, totaling 232,727 SF, on an approximately 25.07-acre site in Royal Palm Beach, Florida. The Coral Sky Plaza Property was built from 1999 to 2001. The Coral Sky Plaza Property is anchored by BJ'S Wholesale Club, Ross Dress for Less, Bed Bath & Beyond and buybuy BABY (a subsidiary of Bed Bath & Beyond). As of September 16, 2019, the Coral Sky Plaza Property was 95.6% leased to 10 tenants. The Coral Sky Plaza Property contains 1,180 parking spaces (5.1 spaces per 1,000 SF).
Major Tenants.
BJ'S Wholesale Club (108,532 SF, 46.6% of NRA, 40.9% of underwritten rent). BJs Wholesale Club is a membership-only warehouse club chain operating on the east coast of the United States. The retail chain offers a wide variety of discounted products, including food, beverages, cleaning supplies, pet products, toys and electronics. BJs Wholesale Club has been a tenant at the Coral Sky Plaza Property since 1998, has a lease expiration of January 31, 2025 and has three, 5-year renewal options remaining.
Ross Dress For Less (30,187 SF, 13.0% of NRA, 12.9% of underwritten rent). Ross Dress For Less is a chain of off-price department stores that offers a selection of women’s and men’s apparel, accessories, footwear and furniture. Based in California, Ross Dress For Less has more than 88,000
| This is not a research report and was not prepared by any Underwriter’s research department. Please see additional important information and qualifications at the end of this Term Sheet. |
T-144
| Retail - Anchored | Loan #13 | Cut-off Date Balance: | $26,125,000 | |
| 500-558 State Road 7 | Coral Sky Plaza | Cut-off Date LTV: | 65.6% | |
| Royal Palm Beach, FL 33411 | U/W NCF DSCR: | 2.47x | ||
| U/W NOI Debt Yield: | 10.3% |
employees and over 1,550 stores in 38 states. Ross Dress For Less has been a tenant at the Coral Sky Plaza Property since 2001, has a lease expiration of January 31, 2022 and has two, 5-year renewal options remaining.
Bed Bath & Beyond (30,000 SF, 12.9% of NRA, 11.0% of underwritten rent). Bed Bath & Beyond is a chain of retail stores that offers a selection of domestic merchandise, home furnishings, food, giftware, health and beauty care items, and infant and toddler merchandise. Based in New Jersey, Bed Bath & Beyond has approximately 1024 stores in the United States, Puerto Rico, Canada and Mexico. Bed Bath & Beyond has been a tenant at the Coral Sky Plaza Property since 2001, has a lease expiration date of January 31, 2022 and has three, 5-year renewal options remaining.
buybuy BABY (23,034 SF, 9.9% of NRA, 8.1% of underwritten rent). buybuy BABY is a chain of baby product stores that offers a selection of strollers, car seats, furniture, bedding, decors, toys, clothing, accessories, and nursing and feeding products. buybuy BABY has been a tenant at the Coral Sky Plaza Property since 2012. buybuy BABY has a lease expiration of January 31, 2023 and has three, 5-year renewal options remaining. buybuy BABY is a subsidiary of Bed Bath & Beyond and occupies its space pursuant to a sublease with Bed Bath & Beyond (which is the direct tenant of the space). The direct lease and the sublease have the same fixed rent and expiration date.
Five Below (9,933 SF, 4.3% of NRA, 8.5% of underwritten rent). Five Below is a discount retail chain that offers an assortment of products, such as crafts, party items, candy, sporting goods and media. Founded in 2002, Five Below operates approximately 900 stores in approximately 36 states and has approximately 13,900 employees. Five Below has been a tenant at the Coral Sky Plaza Property since 2017, has a lease expiration of January 31, 2027 and has two, five-year renewal options remaining.
The following table presents a summary regarding the major tenants at the Coral Sky Plaza Property:
| Tenant Summary(1) | ||||||||||||
| Tenant Name | Credit Rating (Fitch/Moody’s/ S&P)(2) | Tenant SF | Approx. % of SF | Annual UW Rent | Annual UW Rent PSF(3) | Most Recent Sales(5) | ||||||
| App. % of Total Annual UW Rent | $ | PSF | Occ. Cost %(6) | Term. Option(7) | Renewal Options | Lease Expiration | ||||||
| BJ'S Wholesale Club | NR/NR/B+ | 108,532 | 46.6% | $1,195,608 | $11.02 | 40.9% | $65,000,000 | $598.90 | 1.8% | N | 3 x 5 year | 1/31/2025 |
| Ross Dress for Less | NR/A2/A- | 30,187 | 13.0% | $377,338 | $12.50 | 12.9% | $9,849,396 | $326.28 | 3.8% | N | 2 x 5 year | 1/31/2022 |
| Bed Bath & Beyond | NR/Ba2/BB | 30,000 | 12.9% | $322,500 | $10.75 | 11.0% | $7,800,000 | $260.00 | 4.1% | N | 3 x 5 year | 1/31/2022 |
| buybuy BABY(4) | NR/Ba2/BB | 23,034 | 9.9% | $236,099 | $10.25 | 8.1% | NAV | NAV | NAV | N | 3 x 5 year | 1/31/2023 |
| Five Below | NR/NR/NR | 9,933 | 4.3% | $248,325 | $25.00 | 8.5% | NAV | NAV | NAV | N | 2 x 5 year | 1/31/2027 |
| Subtotal/Wtd. Avg. | 201,686 | 86.7% | $2,379,869 | $11.80 | 81.5% | |||||||
| Other Tenants | 20,804 | 8.9% | $539,933 | $25.95 | 18.5% | |||||||
| Vacant Space | 10,237 | 4.4% | $0 | $0 | 0.0% | |||||||
| Total/Wtd. Avg. | 232,727 | 100.0% | $2,919,802 | $13.12 | 100.0% | |||||||
| (1) | Information is based on the underwritten rent roll as of September 16, 2019. |
| (2) | Certain ratings are those of the parent company whether or not the parent guarantees the lease. |
| (3) | Wtd. Avg. Annual UW Rent PSF excludes Vacant Space. |
| (4) | buybuy BABY is a subsidiary of Bed Bath & Beyond and occupies its space pursuant to a sublease with Bed Bath & Beyond (which is the direct tenant of the space). The direct lease and the sublease have the same fixed rent and expiration date. |
| (5) | BJ’s Wholesale Club and Bed Bath & Beyond sales are as of December 2019. Ross Dress for Less sales are as of January 2019. |
| (6) | Occ. Cost % is based on the underwritten rent as of the September 16, 2019 rent roll divided by the most recently reported sales. |
| (7) | All of the anchor tenants, and certain other tenants, have co-tenancies tied to one or more other anchor tenants and/or overall occupancy of the Coral Sky Plaza Property. |
| This is not a research report and was not prepared by any Underwriter’s research department. Please see additional important information and qualifications at the end of this Term Sheet. |
T-145
| Retail - Anchored | Loan #13 | Cut-off Date Balance: | $26,125,000 | |
| 500-558 State Road 7 | Coral Sky Plaza | Cut-off Date LTV: | 65.6% | |
| Royal Palm Beach, FL 33411 | U/W NCF DSCR: | 2.47x | ||
| U/W NOI Debt Yield: | 10.3% |
The following table presents certain information relating to the lease rollover at the Coral Sky Plaza Property:
| Lease Rollover Schedule(1)(2) | ||||||||
| Year | # of Leases Rolling | SF Rolling | Annual UW Rent PSF Rolling(3) | Approx. % of Total SF Rolling | Approx. Cumulative % of SF Rolling | Total UW Rent Rolling | Approx. % of Total Rent Rolling | Approx. Cumulative % of Total Rent Rolling |
| MTM | 1 | 1,800 | $34.00 | 0.8% | 0.8% | $61,200 | 2.1% | 2.1% |
| 2020 | 0 | 0 | $0.00 | 0.0% | 0.8% | $0.00 | 0.0% | 2.1% |
| 2021 | 1 | 8,869 | $20.00 | 3.8% | 4.6% | $177,380 | 6.1% | 8.2% |
| 2022 | 3 | 64,062 | $12.63 | 27.5% | 32.1% | $808,878 | 27.7% | 35.9% |
| 2023 | 1 | 23,034 | $10.25 | 9.9% | 42.0% | $236,099 | 8.1% | 44.0% |
| 2024 | 0 | 0 | $0.00 | 0.0% | 42.0% | $0.00 | 0.0% | 44.0% |
| 2025 | 1 | 108,532 | $11.02 | 46.6% | 88.6% | $1,195,608 | 40.9% | 84.9% |
| 2026 | 1 | 4,500 | $27.78 | 1.9% | 90.6% | $125,000 | 4.3% | 89.2% |
| 2027 | 2 | 11,693 | $26.99 | 5.0% | 95.6% | $315,637 | 10.8% | 100.0% |
| 2028 | 0 | 0 | $0.00 | 0.0% | 95.6% | $0.00 | 0.0% | 100.0% |
| 2029 | 0 | 0 | $0.00 | 0.0% | 95.6% | $0.00 | 0.0% | 100.0% |
| 2030 & Beyond | 0 | 0 | $0.00 | 0.0% | 95.6% | $0.00 | 0.0% | 100.0% |
| Vacant | 0 | 10,237 | $0.00 | 4.4% | 100% | $0.00 | 0.0% | 100.0% |
| Total/Wtd. Avg. | 10 | 232,727 | $13.12 | 100.0% | $2,919,802 | 100.0% | ||
| (1) | Information is based on the underwritten rent roll as of September 16, 2019. |
| (2) | Certain tenants may have lease termination options that are exercisable prior to the stated expiration date of the subject lease or leases which are not considered in the lease rollover schedule. |
| (3) | Wtd. Avg. Annual UW Rent PSF Rolling excludes Vacant Space. |
The Market. The Coral Sky Plaza Property is located in Royal Palm Beach, Florida, within the Palm Beach County market and the Royal Palm Beach/Wellington submarket. According to the appraisal, as of the third quarter of 2019, the Palm Beach County market had approximately 80.1 million SF of retail space inventory, overall vacancy in the market was approximately 4.2% and asking rent was $24.20 PSF. According to the appraisal, as of the third quarter of 2019, the Royal Palm Beach/Wellington submarket had approximately 7.5 million SF of retail space inventory, overall vacancy in the submarket was approximately 5.5% and asking rent was $20.46 PSF. Primary access to the Coral Sky Plaza Property is provided by the Florida Turnpike. According to the appraisal, the 2018 estimated population within a one-, three- and five-mile radius of the Coral Sky Property was 9,667, 70,766 and 190,007, respectively. The 2018 estimated average household income within a one-, three- and five-mile radius of the Coral Sky Plaza Property was $98,888, $97,327 and $88,378, respectively.
The following table presents recent leasing data for anchor tenants at comparable retail properties with respect to the Coral Sky Plaza Property:
| Comparable Retail Property Summary (Anchor Tenants) | ||||||
Property Name/ City, State | Expense Basis | Tenant Name | Lease Area (SF) | Lease Date | Lease Term (Yrs) | Rent PSF |
Plaza at Coral Springs II Coral Springs, FL | NNN | BJ's Wholesale | 86,576 | 2014 | 20.0 | $10.00 |
West Gables Plaza Miami, FL | NNN | BJ's Wholesale | 100,000 | 2014 | - | $15.70 |
Shoppes at Southern Palms West Palm Beach, FL | NNN | Dick's Sporting Goods | 80,000 | - | - | $13.12 |
Plaza at Coral Springs II Coral Springs, FL | NNN | Dick's Sporting Goods | 50,000 | 2014 | 10.0 | $15.00 |
Fashion Square Mall Orlando, FL | NNN | Floor & Décor | 70,398 | 2018 | 10.0 | $16.75 |
Commons at Royal Palm Royal Palm Beach, FL | NNN | Hobby Lobby | 49,160 | 2017 | 10.0 | $11.00 |
Source: Appraisal and underwritten rent roll.
| This is not a research report and was not prepared by any Underwriter’s research department. Please see additional important information and qualifications at the end of this Term Sheet. |
T-146
| Retail - Anchored | Loan #13 | Cut-off Date Balance: | $26,125,000 | |
| 500-558 State Road 7 | Coral Sky Plaza | Cut-off Date LTV: | 65.6% | |
| Royal Palm Beach, FL 33411 | U/W NCF DSCR: | 2.47x | ||
| U/W NOI Debt Yield: | 10.3% |
The following table presents recent leasing data for junior anchor tenants at comparable retail properties with respect to the Coral Sky Plaza Property:
| Comparable Retail Property Summary (Junior Anchor Tenants) | ||||||
Property Name/ City, State | Expense Basis | Tenant Name | Lease Area (SF) | Lease Date | Lease Term (Yrs) | Rent PSF |
Boynton Commons Boynton Beach, FL | NNN | Marshalls | 22,096 | 2019 | 10.0 | $12.50 |
Homestead Pavilion Homestead, FL | NNN | Rana Furniture | 20,797 | 2019 | 10.0 | $13.00 |
Center of Winter Park Winter Park, FL | NNN | Ross Dress for Less | 27,000 | 2017 | 10.0 | $16.00 |
Center of Winter Park Winter Park, FL | NNN | Marshalls | 40,600 | 2017 | 10.0 | $14.00 |
E Hialeah Marketplace Hialeah, FL | NNN | Ross Dress for Less | 27,248 | 2017 | 10.0 | $13.00 |
Prosperity Centre Palm Beach Gardens, FL | NNN | Bed Bath & Beyond | 37,525 | 2015 | 5.0 | $17.00 |
Source: Appraisal and underwritten rent roll.
The following table presents comparable sales with respect to the Coral Sky Plaza Property:
| Comparable Sales Summary | |||||||
Property Name/ City, State | Built | Occupancy | Competitive Class | Lease Area (SF) | Sale Date | Sale Price | Price PSF |
Coral Sky Plaza Royal Palm Beach, FL | 1999-2001 | 95.6% | Class B | 232,727 | 2019 | - | - |
Commons at Royal Palm Royal Palm Beach, FL | 2001 | 95% | Class B | 158,267 | 2017 | $23,700,000 | $149.75 |
Shoppes at Boynton Boynton Beach, FL | 1994 | 89% | Class C | 151,705 | 2018 | $27,800,000 | $183.25 |
Boynton Commons Boynton Beach, FL | 1998 | 100% | Class B | 200,894 | 2019 | $50,000,000 | $248.89 |
Shoppes of Forest Hill West Palm Beach, FL | 1985 | 92% | Class B | 112,364 | 2019 | $19,600,000 | $174.43 |
Source:Appraisal and Underwritten rent roll.
The following table presents certain information relating to the appraisal’s market rent conclusion for the Coral Sky Plaza Property:
| Market Rent Summary | |||||
| Rentable SF | Market Rent PSF | Lease Term (Months) | Rent Increase Projection | Lease Type | |
| Large Anchor Space | 108,532 | $11.00 | 240 | 10% midterm | NNN |
| Junior Anchor Space | 83,221 | $15.00 | 120 | 10% midterm | NNN |
| In-Line Retail - 441 Frontage Space | 19,266 | $33.00 | 60 | 3% ann. | NNN |
| Large In-Line Space | 18,802 | $22.00 | 120 | 3% ann. | NNN |
| In-Line Retail - No Frontage Space | 2,906 | $26.00 | 60 | 3% ann. | NNN |
Source:Appraisal.
| This is not a research report and was not prepared by any Underwriter’s research department. Please see additional important information and qualifications at the end of this Term Sheet. |
T-147
| Retail - Anchored | Loan #13 | Cut-off Date Balance: | $26,125,000 | |
| 500-558 State Road 7 | Coral Sky Plaza | Cut-off Date LTV: | 65.6% | |
| Royal Palm Beach, FL 33411 | U/W NCF DSCR: | 2.47x | ||
| U/W NOI Debt Yield: | 10.3% |
Operating History and Underwritten Net Cash Flow. The following table presents certain information relating to the historical operating performance and the Underwritten Net Cash Flow at the Coral Sky Plaza Property:
| Cash Flow Analysis | ||||||
| TTM 6/30/2017 | TTM 6/30/2018 | TTM 6/30/2019 | TTM 10/31/19 | UW | UW PSF | |
| Gross Potential Rent(1) | $2,801,364 | $2,986,414 | $2,988,197 | $2,955,996 | $3,237,281 | $13.91 |
| Total Recoveries | $988,966 | $1,025,221 | $992,068 | $969,658 | $1,205,400 | $5.18 |
| Other Income | $540 | $441 | $360 | $2,627 | $0 | $0.00 |
| Less Vacancy & Credit Loss | $0 | $0 | $0 | $0 | ($385,140) | ($1.65) |
| Effective Gross Income | $3,790,870 | $4,012,076 | $3,980,625 | $3,928,281 | $4,057,541 | $17.43 |
| Real Estate Taxes | $514,117 | $544,156 | $538,243 | $541,043 | $696,109 | $2.99 |
| Insurance | $99,897 | $94,615 | $110,797 | $138,477 | $116,364 | $0.50 |
| Other Expenses | $558,054 | $587,216 | $573,212 | $547,227 | $541,538 | $2.33 |
| Total Expenses | $1,172,069 | $1,225,988 | $1,222,252 | $1,226,747 | $1,354,011 | $5.82 |
| Net Operating Income | $2,618,802 | $2,786,088 | $2,758,373 | $2,701,534 | $2,703,530 | $11.62 |
| Capital Expenditures | $0 | $0 | $0 | $0 | $37,267 | $0.16 |
| TI/LC | $0 | $0 | $0 | $0 | $230,608 | $0.99 |
| Net Cash Flow | $2,618,802 | $2,786,088 | $2,758,373 | $2,701,534 | $2,435,655 | $10.47 |
| Occupancy % | 98.8% | 98.8% | 98.8% | 95.6%(2) | 90.2% | |
| NOI DSCR | 2.65x | 2.82x | 2.80x | 2.74x | 2.74x | |
| NCF DSCR | 2.65x | 2.82x | 2.80x | 2.74x | 2.47x | |
| NOI Debt Yield | 10.0% | 10.7% | 10.6% | 10.3% | 10.3% | |
| NCF Debt Yield | 10.0% | 10.7% | 10.6% | 10.3% | 9.3% | |
| (1) | UW Gross Potential Rent is based on the underwritten rent roll dated September 16, 2019 and includes rent steps through December 31, 2020 totaling $93,700. |
| (2) | Occupancy % is based on underwritten rent roll dated September 16, 2019. |
| This is not a research report and was not prepared by any Underwriter’s research department. Please see additional important information and qualifications at the end of this Term Sheet. |
T-148
(THIS PAGE INTENTIONALLY LEFT BLANK)
T-149
| Mortgage Loan No. 14 – Embassy Suites - Charlotte |
| Mortgage Loan Information | Property Information | |||||
| Mortgage Loan Seller: | BANA | Single Asset/Portfolio: | Single Asset | |||
| Credit Assessment (DBRS/Fitch/S&P): | NR/NR/NR | Location: | Charlotte, NC 28217 | |||
| Original Balance: | $25,500,000 | General Property Type: | Hospitality | |||
| Cut-off Date Balance: | $25,500,000 | Detailed Property Type: | Full Service | |||
| % of Initial Pool Balance: | 2.1% | Title Vesting: | Fee | |||
| Loan Purpose: | Refinance | Year Built/Renovated: | 1989 / 2016 | |||
| Borrower Sponsor: | SREE Hospitality | Size: | 274 Rooms | |||
| Guarantors: | Parag Patel; Vinay Patel | Cut-off Date Balance per Room: | $93,066 | |||
| Mortgage Rate: | 3.4550% | Maturity Date Balance per Room: | $93,066 | |||
| Note Date: | 12/6/2019 | Property Manager: | SREE Hotels, LLC | |||
| First Payment Date: | 2/1/2020 | (borrower-related) | ||||
| Maturity Date: | 1/1/2030 | Underwriting and Financial Information | ||||
| Original Term to Maturity: | 120 months | UW NOI: | $4,999,153 | |||
| Original Amortization Term: | 0 months | UW NOI Debt Yield: | 19.6% | |||
| IO Period: | 120 months | UW NOI Debt Yield at Maturity: | 19.6% | |||
| Seasoning: | 2 months | UW NCF DSCR: | 4.96x | |||
| Prepayment Provisions: | LO (26); DEF (90); O (4) | Most Recent NOI: | $4,843,824 (12/31/2019) | |||
| Lockbox/Cash Mgmt Status: | Springing/Springing | 2nd Most Recent NOI: | $4,474,350 (12/31/2018) | |||
| Additional Debt Type: | N/A | 3rd Most Recent NOI: | 3,749,690 (12/31/2017) | |||
| Additional Debt Balance: | N/A | Most Recent Occupancy: | 76.1% (12/31/2019) | |||
| Future Debt Permitted (Type): | No (N/A) | 2nd Most Recent Occupancy: | 76.1% (12/31/2018) | |||
| Reserves | 3rd Most Recent Occupancy: | 75.0% (12/31/2017) | ||||
| Type | Initial | Monthly | Cap | Appraised Value (as of): | $54,000,000 (11/1/2019) | |
| RE Tax: | $65,000 | $32,500 | N/A | Appraised Value per Room: | $197,080 | |
| Insurance: | $0 | Springing(1) | N/A | Cut-off Date LTV Ratio: | 47.2% | |
| FF&E: | $0 | $47,916 | $2,740,000 | Maturity Date LTV Ratio: | 47.2% | |
| Sources and Uses | ||||||
| Sources | Proceeds | % of Total | Uses | Proceeds | % of Total | |
| Loan Amount: | $25,500,000 | 100.0% | Loan Payoff: | $23,998,081 | 94.1% | |
| Return of Equity: | $1,085,412 | 4.3% | ||||
| Closing Costs: | $351,507 | 1.4% | ||||
| Reserves: | $65,000 | 0.3% | ||||
| Total Sources: | $25,500,000 | 100.0% | Total Uses: | $25,500,000 | 100.0% | |
| (1) | Monthly deposits for insurance are suspended as long as the Embassy Suites - Charlotte Property (as defined below) is covered by a blanket insurance policy. |
The Mortgage Loan. The fourteenth largest mortgage loan (the “Embassy Suites - Charlotte Mortgage Loan”) is evidenced by a promissory note in the original principal amount of $25,500,000 and secured by a first priority fee mortgage on a 274-room full service hotel located in Charlotte, North Carolina (the “Embassy Suites - Charlotte Property”).
The Borrower and the Borrower Sponsors.The borrower is SREE Billy Graham Hotel LLC (the “Embassy Suites - Charlotte Borrower”), a single-purpose North Carolina limited liability company with at least one independent director.
The non-recourse carveout guarantors are Parag Patel and Vinay Patel, who are the Principal and Chief Executive Officer, respectively, of SREE Hospitality, the borrower sponsor. Founded in 1980, SREE Hospitality is a hospitality ownership, development, and management group. Headquartered in Charlotte, North Carolina, SREE Hospitality currently owns and operates over 20 hotel properties in North Carolina, South Carolina and Ohio, and is franchised with partners such as Marriott, Hilton, Starwood and Intercontinental Hotel Group. Within the Charlotte metropolitan statistical area (“MSA”), SREE Hospitality owns and manages 13 hotels.
The Property. The Embassy Suites - Charlotte Property is an eight-story, 274-room, full-service hotel that opened in 1989 and contains approximately 221,809 SF of gross building area. The Embassy Suites - Charlotte Property consists of a 6.04-acre site located along South Tryon Street proximate to Interstate 77 in Charlotte, North Carolina. The borrower sponsor acquired the asset in 2015 and subsequently invested $7.35 million in capital improvements from 2015 through 2016. The renovations included new soft goods and case goods for all guestrooms, adding walk-in showers to the king rooms and renovating the atrium and public spaces. All standard guestrooms are two-room suites featuring two 32-inch LCD televisions, complimentary internet access, a wet bar, coffeemaker, microwave, mini-refrigerator, and full-sized sofa bed in the living area. The hotel amenities include a restaurant and bar, indoor pool, fitness center, complimentary breakfast area, evening reception area, guest laundry facilities, business center, sundry shop, and approximately 14,831 SF of dedicated meeting space. The Embassy Suites - Charlotte Property also offers a 46,798 SF parking garage, totaling 459 parking spaces (1.7 spaces per room). The Embassy Suites - Charlotte Property operates under a franchise agreement with Hilton Franchise Holding LLC through May 31, 2031.
| This is not a research report and was not prepared by any Underwriter’s research department. Please see additional important information and qualifications at the end of this Term Sheet. |
T-150
| Hospitality – Full Service | Loan #14 | Cut-off Date Balance: | $25,500,000 | |
| 4800 South Tryon Street | Embassy Suites - Charlotte | Cut-off Date LTV: | 47.2% | |
| Charlotte, NC 28217 | U/W NCF DSCR: | 4.96x | ||
| U/W NOI Debt Yield: | 19.6% |
More specific information about the Embassy Suites - Charlotte Property and the related competitive set is set forth in the following table:
| Historical Occupancy, ADR, RevPAR(1) | |||||||||
| Competitive Set(2) | Embassy Suites - Charlotte Property | Penetration Factor | |||||||
| Year | Occupancy | ADR | RevPAR | Occupancy | ADR | RevPAR | Occupancy | ADR | RevPAR |
| 12/31/2016 | 74.6% | $125.87 | $93.95 | 73.6% | $135.73 | $99.93 | 98.6% | 107.8% | 106.4% |
| 12/31/2017 | 73.4% | $130.35 | $95.73 | 75.0% | $139.88 | $104.88 | 102.1% | 107.3% | 109.6% |
| 12/31/2018 | 71.1% | $134.53 | $95.66 | 76.2% | $144.79 | $110.27 | 107.1% | 107.6% | 115.3% |
| 12/31/2019 | 74.2% | $131.06 | $97.31 | 79.3% | $143.13 | $113.47 | 106.8% | 109.2% | 116.6% |
Source: Industry Report.
| (1) | Variances between the underwriting, the appraisal and the industry report data with respect to Occupancy, ADR and RevPAR at the Embassy Suites - Charlotte Property are attributable to variances in reporting methodologies and/or timing differences. |
| (2) | The competitive set includes Sheraton Charlotte Airport Hotel, Crowne Plaza Charlotte Executive Park, Hilton Charlotte Executive Park and Renaissance Charlotte Suites Hotel. |
The Market.The Embassy Suites - Charlotte Property is located in the Charlotte market and the Charlotte I-77 & SouthPark submarket and is located 4 miles from the Charlotte central business district in Mecklenburg County. According to the appraisal, Charlotte continues to be a major financial center, second only to New York City in terms of assets held. Charlotte is a hub for the energy, transportation, banking and healthcare industries that also offers arts, culture, sports and entertainment. The Charlotte MSA is home to Fortune 500 companies including Bank of America Corporation, Lowe’s Co., Duke Energy Corporation, Nucor Corporation, Sonic Automotive, Inc. and Sealed Air Corporation. The hotel’s location, which is just off interstates 77 and 85, provides quick access to local attractions, including the Carowinds amusement park, NASCAR races at Charlotte Motor Speedway, Blumenthal Performing Arts Center, sporting events at Bank of America Stadium and kayaking or zip lining through the U.S. National White Water Center.
The Charlotte Douglas International Airport is located less than five miles northwest of the Embassy Suites - Charlotte Property and is a primary demand generator in the immediate area. Acting as the second largest hub for American Airlines, the airport is also served by eight other airlines offering 178 nonstop destinations, including 37 international destinations, and averages over 700 daily departures. In 2018, the airport had total passenger traffic of 46.4 million. Charlotte Douglas International Airport is currently in the middle of a $2.5 billion, ten-year airport terminal renovation and expansion that is expected to include the addition of a fourth parallel runway which will allow for direct international flights to the Asia Pacific region.
According to the appraisal, the estimated 2019 population within a one-, three- and five-mile radius of the Embassy Suites - Charlotte Property was 5,344, 80,523 and 199,037, respectively. The 2019 average household income within the same radii is $63,777, $66,723 and $92,155, respectively.
The following table presents certain information relating to the primary competitive properties to the Embassy Suites - Charlotte Property:
| Property Competitive Summary(1) | ||||||||
| Property Name | No. of Rooms | Year Built | Commercial | Meeting & Group | Leisure | Estimated 2018 | Estimated 2018 ADR | Estimated 2018 RevPAR |
| Embassy Suites - Charlotte | 274 | 1989 | 50% | 20% | 30% | 76.1% | $144.64 | $110.10 |
| Crowne Plaza Charlotte Executive Park | 300 | 1983 | 55% | 25% | 20% | 65%-70% | $125-$130 | $85-$90 |
| Hilton Charlotte Executive Park | 181 | 1988 | 55% | 30% | 15% | 70%-75% | $140-$145 | $100-$105 |
| Renaissance Charlotte Suites Hotel | 275 | 1999 | 60% | 25% | 15% | 70%-75% | $135-$140 | $100-$105 |
| Sheraton Charlotte Airport Hotel | 222 | 1985 | 60% | 20% | 20% | 70%-75% | $130-$135 | $95-$100 |
Source:Appraisal.
| (1) | Variances between the underwriting, the appraisal and the Historical Occupancy, ADR, RevPAR table above with respect to Occupancy, ADR and RevPAR at the Embassy Suites - Charlotte Property are attributable to variances in reporting methodologies and/or timing differences. |
| This is not a research report and was not prepared by any Underwriter’s research department. Please see additional important information and qualifications at the end of this Term Sheet. |
T-151
| Hospitality – Full Service | Loan #14 | Cut-off Date Balance: | $25,500,000 | |
| 4800 South Tryon Street | Embassy Suites - Charlotte | Cut-off Date LTV: | 47.2% | |
| Charlotte, NC 28217 | U/W NCF DSCR: | 4.96x | ||
| U/W NOI Debt Yield: | 19.6% |
Operating History and Underwritten Net Cash Flow. The following table presents certain information relating to the operating history and Underwritten Net Cash Flow at the Embassy Suites - Charlotte Property:
| Cash Flow Analysis | ||||||
| 2016 | 2017 | 2018 | 2019 | UW | UW per Room | |
| Occupancy | 74.6% | 75.0% | 76.1% | 76.1% | 76.1% | |
| ADR | $135.62 | $139.79 | $144.64 | $ 143.19 | $143.19 | |
| RevPAR | $101.17 | $104.84 | $110.07 | $ 108.97 | $108.97 | |
| Room Revenue | $9,546,612 | $10,481,684 | $10,955,608 | $11,334,819 | $11,334,819 | $41,368 |
| Food & Beverage Revenue | $1,757,165 | $1,919,749 | $2,169,795 | $2,826,675 | $2,826,675 | $10,316 |
| Other Income(1) | $175,959 | $51,639 | $79,780 | $86,358 | $86,358 | $315 |
| Total Revenue | $11,479,736 | $12,453,072 | $13,205,183 | $14,247,852 | $14,247,852 | $51,999 |
| Real Estate Taxes | $406,077 | $374,856 | $425,469 | $413,756 | $419,244 | $1,530 |
| Insurance | $69,852 | $68,882 | $79,512 | $66,372 | $44,089 | $161 |
| Other Expenses | $7,579,866 | $8,259,644 | $8,225,852 | $8,923,900 | $8,785,366 | $32,063 |
| Total Expenses | $8,055,795 | $8,703,382 | $8,730,833 | $9,404,028 | $9,248,699 | $33,754 |
| Net Operating Income | $3,423,941 | $3,749,690 | $4,474,350 | $4,843,824 | $4,999,153 | $18,245 |
| FF&E | $381,864 | $419,267 | $440,430 | $560,888 | $569,914 | $2,080 |
| Net Cash Flow | $3,042,077 | $3,330,423 | $4,033,920 | $4,282,936 | $4,429,239 | $16,165 |
| NOI DSCR | 3.83x | 4.20x | 5.01x | 5.42x | 5.60x | |
| NCF DSCR | 3.41x | 3.73x | 4.52x | 4.79x | 4.96x | |
| NOI Debt Yield | 13.4% | 14.7% | 17.5% | 19.0% | 19.6% | |
| NCF Debt Yield | 11.9% | 13.1% | 15.8% | 16.8% | 17.4% | |
| (1) | Other Income includes dry cleaning revenue, pet fee revenue, miscellaneous income and parking revenue. |
| This is not a research report and was not prepared by any Underwriter’s research department. Please see additional important information and qualifications at the end of this Term Sheet. |
T-152
(THIS PAGE INTENTIONALLY LEFT BLANK)
T-153
| Mortgage Loan No. 15 – Prince William Square |
| Mortgage Loan Information | Property Information | ||||||
| Mortgage Loan Seller: | MSMCH | Single Asset/Portfolio: | Single Asset | ||||
| Credit Assessment (DBRS/Fitch/S&P): | NR/NR/NR | Location: | Woodbridge, VA 22192 | ||||
| Original Balance: | $25,000,000 | General Property Type: | Retail | ||||
| Cut-off Date Balance: | $25,000,000 | Detailed Property Type: | Anchored | ||||
| % of Initial Pool Balance: | 2.1% | Title Vesting: | Fee | ||||
| Loan Purpose: | Acquisition | Year Built/Renovated: | 1986/2008 | ||||
| Borrower Sponsor: | ALTO Real Estate Funds | Size: | 232,957 SF | ||||
| Guarantors: | ALTO Fund III Holding, LP | Cut-off Date Balance Per SF: | $107 | ||||
| Mortgage Rate: | 3.4030% | Maturity Date Balance Per SF: | $107 | ||||
| Note Date: | 1/28/2020 | Property Manager: | Rosenthal Realty, LLC | ||||
| First Payment Date: | 3/1/2020 | ||||||
| Maturity Date: | 2/1/2027 | ||||||
| Original Term to Maturity: | 84 months | Underwriting and Financial Information | |||||
| Original Amortization Term: | 0 months | UW NOI: | $2,940,839 | ||||
| IO Period: | 84 months | UW NOI Debt Yield: | 11.8% | ||||
| Seasoning: | 1 month | UW NOI Debt Yield at Maturity: | 11.8% | ||||
| Prepayment Provisions: | LO (25); DEF (54); O (5) | UW NCF DSCR: | 3.07x | ||||
| Lockbox/Cash Mgmt Status: | Springing/Springing | Most Recent NOI: | $2,155,290 (9/30/2019 T-9 Ann.) | ||||
| Additional Debt Type: | N/A | 2nd Most Recent NOI: | $2,492,249 (12/31/2018) | ||||
| Additional Debt Balance: | N/A | 3rd Most Recent NOI: | $2,300,434 (12/31/2017) | ||||
| Future Debt Permitted (Type): | No (N/A) | Most Recent Occupancy: | 88.4% (11/1/2019) | ||||
| Reserves | 2nd Most Recent Occupancy: | 74.0% (12/1/2018) | |||||
| Type | Initial | Monthly | Cap | 3rd Most Recent Occupancy: | 87.8% (12/31/2017) | ||
| RE Tax: | $38,857 | $38,857 | N/A | Appraised Value (as of): | $38,600,000 (11/26/2019) | ||
| Insurance(1): | $0 | Springing | N/A | Appraised Value per SF: | $166 | ||
| Capital Expenditures: | $0 | $3,300 | N/A | Cut-off Date LTV Ratio: | 64.8% | ||
| TI/LC: | $0 | $16,501 | $395,000 | Maturity Date LTV Ratio: | 64.8% | ||
| Other(2): | $343,370 | $0 | N/A | ||||
| Sources and Uses | ||||||
| Sources | Proceeds | % of Total | Uses | Proceeds | % of Total | |
| Loan Amount: | $25,000,000 | 63.3% | Purchase Price: | $37,850,000 | 95.9% | |
| Borrower Equity: | $14,466,882 | 36.7% | Closing Costs: | $1,234,655 | 3.1% | |
| Reserves: | $382,227 | 1.0% | ||||
| Total Sources: | $39,466,882 | 100.0% | Total Uses: | $39,466,882 | 100.0% | |
| (1) | Monthly insurance reserves are springing upon the failure of the Prince William Square Borrower (as defined below) to provide written evidence of a blanket policy. |
| (2) | Other Reserves are comprised of VAABC Free Rent Reserve Fund ($12,946.57); VAABC Special Leasing Reserve Fund ($229,629); Dental Care Alliance Special Leasing Reserve Fund ($20,795); and Harbor Special Leasing Reserve Fund ($80,000). |
The Mortgage Loan.The fifteenth largest mortgage loan (the “Prince William Square Mortgage Loan”) is evidenced by a promissory note in the original principal amount of $25,000,000 and secured by a first priority fee mortgage encumbering a 232,957 SF anchored retail shopping center located in Woodbridge, Virginia (the “Prince William Square Property”).
The Borrower and the Borrower Sponsor.The borrower for the Prince William Square Mortgage Loan is ALTO Prince William Square, LP (the “Prince William Square Borrower”), a single-purpose Delaware limited partnership with one independent director. The non-recourse carveout guarantor is ALTO Fund III Holding, LP and the borrower sponsor is ALTO Real Estate Funds. ALTO Real Estate Funds (“ALTO”) specializes in acquiring retail assets in markets across the United States. ALTO maintains U.S. offices in Hoboken, New Jersey, Plano, Texas and Columbus, Ohio, with an additional office in Tel Aviv, Israel. Since its inception, ALTO has invested in more than 60 properties, encompassing more than 12 million SF.
The Property.The Prince William Square Property is an anchored retail shopping center, totaling 232,957 SF, on an approximately 20.64-acre site in Woodbridge, Virginia. The Prince William Square Property was built in 1986 and renovated in 2008. The Prince William Square Property is anchored by Ashley Furniture Homestore, Ross Dress For Less, dd's Discounts (an affiliate of Ross Dress for Less) and JOANN Fabrics and Crafts. As of November 1, 2019, the Prince William Square Property was 88.4% leased to 24 tenants. The Prince William Square Property contains 966 parking spaces (4.1 spaces per 1,000 SF).
| This is not a research report and was not prepared by any Underwriter’s research department. Please see additional important information and qualifications at the end of this Term Sheet. |
T-154
| Retail - Anchored | Loan #15 | Cut-off Date Balance: | $25,000,000 | |
| 14200 Smoketown Road | Prince William Square | Cut-off Date LTV: | 64.8% | |
| Woodbridge, VA 22192 | U/W NCF DSCR: | 3.07x | ||
| U/W NOI Debt Yield: | 11.8% |
Major Tenants.
Ashley Furniture Homestore (38,453 SF, 16.5% of NRA, 16.0% of underwritten rent). Ashley Furniture Homestore is an American furniture store chain. Its parent company, Ashley Furniture Industries, was founded in 1945 and is currently headquartered in Arcadia, Wisconsin. Ashley Furniture Industries is listed at #74 on Forbes’ list of America’s largest private companies and has approximately 31,000 employees. Ashley Furniture Homestore has been a tenant at the Prince William Square Property since 2008 and has renewed once. Ashley Furniture Homestore has a lease expiration of September 30, 2023 and has one, 5-year renewal option remaining.
Ross Dress For Less (32,120 SF, 13.8% of NRA, 9.7% of underwritten rent). Ross Dress For Less is a chain of off-price department stores that offers a selection of women’s and men’s apparel, accessories, footwear and furniture. Based in California, Ross Dress For Less has more than 88,000 employees and over 1,550 stores in 38 states. Ross Dress for Less signed a lease for its space at the Prince William Square Property in October 2019, has a lease expiration of January 31, 2029 and has four, 5-year renewal options remaining.
dd's Discounts (24,784 SF, 10.6% of NRA, 10.1% of underwritten rent). dd’s Discounts is a national chain of off-price department stores. A subsidiary of the California-based Ross Stores, Inc. (the parent company of tenant Ross Dress For Less), dd’s Discounts operates 260 stores in 18 states. In 2018, dd’s Discounts took the suite that Ross Dress for Less had previously occupied through June 2016. dd’s Discounts has a lease expiration date of January 31, 2027 and has four, 5-year renewal options remaining. dd’s Discounts may terminate its lease if gross sales do not exceed $6.5 million between February 1, 2022 and January 31, 2023.
JOANN Fabrics and Crafts (23,890 SF, 10.3% of NRA, 11.6% of underwritten rent). JOANN Fabrics and Crafts offers a variety of merchandise used in sewing, crafting and home decorating projects, including fabric, crafts, frames, paper crafting supplies, artificial floral, finished seasonal and home décor items. JOANN Fabrics and Crafts operates approximately 850 stores in 49 states. Headquartered in Hudson, Ohio, JOANN Fabrics and Crafts is listed at #197 on Forbes’ list of America’s largest private companies and has approximately 23,000 employees. JOANN Fabrics and Crafts has been a tenant the Prince William Square Property since 2009 and has renewed once. JOANN Fabrics and Crafts has a lease expiration of January 31, 2025 and has three, 5-year renewal options remaining.
Harbor Freight Tools (15,000 SF, 6.4% of NRA, 6.1% of underwritten rent). Founded in 1977, Harbor Freight Tools is a privately-held discount tool and equipment retailer with over 1,000 stores in the United States. Harbor Freight Tools has been a tenant at the Prince William Square Property since 2003, has a lease expiration of December 31, 2022 and has one, five-year renewal option remaining.
The following table presents a summary regarding the major tenants at the Prince William Square Property:
| Tenant Summary(1) | ||||||||||||
| Tenant Name | Credit Rating (Fitch/ Moody’s/S&P)(2) | Tenant SF | Approx.% of SF | Annual UW Rent | Annual UW Rent PSF(3) | Most Recent Sales(4) | ||||||
| App. % of Total Annual UW Rent | $ | PSF | Occ. Cost %(5) | Term. Option | Renewal Options | Lease Expiration | ||||||
| Ashley Furniture Homestore | NR/NR/NR | 38,453 | 16.5% | $487,111 | $12.67 | 16.0% | $13,258,080 | $345 | 3.7% | N | 1 x 5 year | 9/30/2023 |
| Ross Dress For Less | NR/A2/A- | 32,120 | 13.8% | $297,000 | $9.25 | 9.7% | NAV | NAV | NAV | N | 4 x 5 year | 1/31/2030 |
| dd's Discounts(6) | NR/A2/A- | 24,784 | 10.6% | $306,826 | $12.38 | 10.1% | NAV | NAV | NAV | N(7) | 4 x 5 year | 1/31/2027 |
| JOANN Fabrics and Crafts | NR/NR/B- | 23,890 | 10.3% | $353,572 | $14.80 | 11.6% | NAV | NAV | NAV | N | 3 x 5 year | 1/31/2025 |
| Harbor Freight Tools | NR/NR/NR | 15,000 | 6.4% | $185,400 | $12.36 | 6.1% | NAV | NAV | NAV | N | 1 x 5 year | 12/31/2022 |
| Subtotal/Wtd. Avg. | 134,247 | 57.6% | $1,629,909 | $12.14 | 53.5% | |||||||
| Other Tenants | 71,726 | 30.8% | $1,417,912 | $19.77 | 46.5% | |||||||
| Vacant Space | 26,984 | 11.6% | $0 | $0.00 | 0.0% | |||||||
| Total/Wtd. Avg. | 232,957 | 100.0% | $3,047,822 | $14.80 | 100.0% | |||||||
| (1) | Information is based on the underwritten rent roll as of November 1, 2019. |
| (2) | Certain ratings are those of the parent company whether or not the parent guarantees the lease. |
| (3) | Wtd. Avg. Annual UW Rent PSF excludes Vacant Space. |
| (4) | Most recent sales are as of the 12 month period ending September 2018. |
| (5) | Occ. Cost % is based on the underwritten rent as of the November 1, 2019 rent roll divided by the most recently reported sales. |
| (6) | dd’s Discounts is an affiliate of Ross Dress for Less. |
| (7) | No unilateral termination option. However, dd’s Discounts may terminate its lease if gross sales do not exceed $6.5 million between February 1, 2022 and January 31, 2023. |
| This is not a research report and was not prepared by any Underwriter’s research department. Please see additional important information and qualifications at the end of this Term Sheet. |
T-155
| Retail - Anchored | Loan #15 | Cut-off Date Balance: | $25,000,000 | |
| 14200 Smoketown Road | Prince William Square | Cut-off Date LTV: | 64.8% | |
| Woodbridge, VA 22192 | U/W NCF DSCR: | 3.07x | ||
| U/W NOI Debt Yield: | 11.8% |
The following table presents certain information relating to the lease rollover at the Prince William Square Property:
| Lease Rollover Schedule(1)(2) | ||||||||
| Year | # of Leases Rolling | SF Rolling | Annual UW Rent PSF Rolling(3) | Approx. % of Total SF Rolling | Approx. Cumulative % of SF Rolling | Total UW Rent Rolling | Approx. % of Total Rent Rolling | Approx. Cumulative % of Total Rent Rolling |
| MTM | 1 | 2,300 | $20.00 | 1.0% | 1.0% | $46,000 | 1.5% | 1.5% |
| 2020 | 4 | 8,869 | $26.88 | 3.8% | 4.8% | $238,375 | 7.8% | 9.3% |
| 2021 | 1 | 1,665 | $14.00 | 0.7% | 5.5% | $23,310 | 0.8% | 10.1% |
| 2022 | 4 | 20,500 | $16.80 | 8.8% | 14.3% | $344,415 | 11.3% | 21.4% |
| 2023 | 3 | 50,333 | $13.74 | 21.6% | 35.9% | $691,663 | 22.7% | 44.1% |
| 2024 | 1 | 1,600 | $23.34 | 0.7% | 36.6% | $37,344 | 1.2% | 45.3% |
| 2025 | 6 | 46,462 | $17.68 | 19.9% | 56.5% | $821,386 | 26.9% | 72.3% |
| 2026 | 0 | 0 | $0.00 | 0.0% | 56.5% | $0 | 0.0% | 72.3% |
| 2027 | 3 | 42,124 | $13.02 | 18.1% | 74.6% | $548,328 | 18.0% | 90.3% |
| 2028 | 0 | 0 | $0.00 | 0.0% | 74.6% | $0 | 0.0% | 90.3% |
| 2029 | 0 | 0 | $0.00 | 0.0% | 74.6% | $0 | 0.0% | 90.3% |
| 2030 | 1 | 32,120 | $9.25 | 13.8% | 88.4% | $297,000 | 9.7% | 100.0% |
| 2031 & Beyond | 0 | 0 | $0.00 | 0.0% | 88.4% | $0 | 0.0% | 100.0% |
| Vacant | 0 | 26,984 | $0.00 | 11.6% | 100.0% | $0 | 0.0% | 100.0% |
| Total/Wtd. Avg. | 24 | 232,957 | $14.80 | 100.0% | $3,047,822 | 100.0% | ||
| (1) | Information is based on the underwritten rent roll as of November 1, 2019. |
| (2) | Certain tenants may have lease termination options that are exercisable prior to the stated expiration date of the subject lease or leases which are not considered in the lease rollover schedule. |
| (3) | Wtd. Avg. Annual UW Rent PSF Rolling excludes Vacant Space. |
The Market. The Prince William Square Property is located in Woodbridge, Virginia within the Suburban Virginia retail market and the Prince William County submarket. The local area offers a variety of amenities for residents and visitors, including the Potomac Mills Mall. The Potomac Mills Mall is one of the largest shopping centers in northern Virginia. Anchor tenants include JC Penney’s, Bloomingdale’s, AMC Theater, Costco, Nordstrom Rack, Marshalls, Burlington, TJ Maxx, Sears, Neiman Marcus, Off Broadway and Old Navy. Primary access to the Prince William Square Property is provided by Interstate 95. According to the appraisal, as of the third quarter of 2019, the Suburban Virginia retail market had approximately 40.5 million SF of retail space inventory, overall vacancy in the market was approximately 6.2% and asking rent was $30.56 PSF. According to the appraisal, as of the third quarter of 2019, the Prince William County submarket had approximately 9.8 million SF of retail space inventory, overall vacancy in the market was approximately 7.2% and asking rent was $22.49 PSF. According to the appraisal, the 2019 estimated population within a one-, three- and five-mile radius of the Prince William Square Property was 6,747, 122,011 and 233,527, respectively. The 2019 estimated average household income within a one-, three- and five-mile radius of the Prince William Square Property was $97,699, $111,403 and $124,035, respectively.
The following table presents recent leasing data for anchor tenants at comparable retail properties with respect to the Prince William Square Property:
| Comparable Retail Property Summary (Anchor Tenants) | ||||||
Property Name/ City, State | Lease Type | Tenant Name | Lease Area (SF) | Lease Date | Lease Term (Yrs) | Rent PSF |
Pasadena Crossroads Pasadena, MD | NNN | HomeGoods | 24,311 | 12/19 | 10 | $11.57 |
Chantilly Plaza Chantilly, VA | NNN | 2nd & Charles | 25,401 | 2/19 | 10 | $10.50 |
Shops at Waldorf Waldorf, MD | NNN | Michael's | 21,600 | 2/19 | 10 | $15.00 |
Annapolis Plaza Annapolis, MD | NNN | HomeSense | 33,033 | 9/18 | 10 | $11.00 |
Bowie Gateway Center Bowie, MD | NNN | Burlington Coat Factory | 42,804 | 6/18 | 10 | $12.00 |
Manaport Plaza Manassas, VA | NNN | Gabes | 44,715 | 5/18 | 10 | $10.25 |
Plaza IV at Virginia Gateway Gainesville, VA | NNN | Hobby Lobby | 42,108 | 1/18 | 10 | $15.60 |
Potomac Festival Woodbridge, VA | NNN | Bob's Discount Furniture | 31,780 | 7/17 | 10 | $13.00 |
Source: Appraisal.
| This is not a research report and was not prepared by any Underwriter’s research department. Please see additional important information and qualifications at the end of this Term Sheet. |
T-156
| Retail - Anchored | Loan #15 | Cut-off Date Balance: | $25,000,000 | |
| 14200 Smoketown Road | Prince William Square | Cut-off Date LTV: | 64.8% | |
| Woodbridge, VA 22192 | U/W NCF DSCR: | 3.07x | ||
| U/W NOI Debt Yield: | 11.8% |
The following table presents recent leasing data for junior anchor tenants at comparable retail properties with respect to the Prince William Square Property:
| Comparable Retail Property Summary (Junior Anchor Tenants) | ||||||
Property Name/ City, State | Lease Type | Tenant Name | Lease Area (SF) | Lease Date | Lease Term (Yrs) | Rent PSF |
Waterside Village at Easton Easton, MD | NNN | Michael's | 16,658 | 8/18 | 10 | $18.00 |
Culpeper Colonnade Culpeper, VA | NNN | Michael's | 16,496 | 2/18 | 10 | $18.25 |
Maryland City Plaza Laurel, MD | NNN | Salontra Select Suites | 10,407 | 1/17 | 10 | $15.00 |
Virginia Gateway Gainesville, VA | NNN | Total Wine | 18,527 | 4/16 | 10 | $16.75 |
Shops of Waldorf Waldorf, MD | NNN | David's Bridal | 7,500 | 9/17 | 10 | $23.00 |
Bowie Gateway Center Bowie, MD | NNN | Super Beauty | 10,236 | 11/16 | 10 | $18.25 |
Bowie Marketplace Bowie, MD | NNN | Petco | 11,287 | 9/16 | 10 | $18.00 |
Source: Appraisal.
The following table presents certain information relating to the appraisal’s market rent conclusion for the Prince William Square Property:
| Market Rent Summary | |||||
| Anchor | Jr. Anchor | In Line < 2,300 SF | In Line > 2,300 SF | End Cap | |
| Market Rent (PSF) | $11.00 | $18.00 | $24.00 to $28.00 | $21.00 | $40.00 |
| Lease Term (Years) | 10 | 10 | 5 | 5 | 5 |
| Lease Type (Reimbursements) | Net + 10% admin | Net + 10% admin | Net + 20% admin | Net + 20% admin | Net + 20% admin |
| Rent Increase Projection | 10.0% every 5 years | 10.0% every 5 years | 3.0% per annum | 3.0% per annum | 3.0% per annum |
Source:Appraisal.
| This is not a research report and was not prepared by any Underwriter’s research department. Please see additional important information and qualifications at the end of this Term Sheet. |
T-157
| Retail - Anchored | Loan #15 | Cut-off Date Balance: | $25,000,000 | |
| 14200 Smoketown Road | Prince William Square | Cut-off Date LTV: | 64.8% | |
| Woodbridge, VA 22192 | U/W NCF DSCR: | 3.07x | ||
| U/W NOI Debt Yield: | 11.8% |
Operating History and Underwritten Net Cash Flow. The following table presents certain information relating to the historical operating performance and the Underwritten Net Cash Flow at the Prince William Square Property:
| Cash Flow Analysis | |||||
| 2017 | 2018 | 9/30/2019 T-9 Ann. | UW | UW PSF | |
| Gross Potential Rent(1) | $2,468,159 | $2,618,974 | $2,487,141 | $3,664,086 | $15.73 |
| Total Recoveries | $583,116 | $737,157 | $529,863 | $1,049,845 | $4.51 |
| Other Income | $23,177 | $22,118 | ($10,181) | $0 | $0.00 |
| Less Vacancy & Credit Loss | $0 | $0 | $0 | ($745,351) | ($3.20) |
| Effective Gross Income | $3,074,452 | $3,378,249 | $3,006,822 | $3,968,580 | $17.04 |
| Real Estate Taxes | $378,134 | $368,934 | $343,378 | $531,776 | $2.28 |
| Insurance | $17,058 | $17,335 | $21,115 | $33,437 | $0.14 |
| Other Expenses | $378,825 | $499,731 | $487,039 | $462,528 | $1.99 |
| Total Expenses | $774,017 | $886,000 | $851,532 | $1,027,741 | $4.41 |
| Net Operating Income | $2,300,434 | $2,492,249 | $2,155,290 | $2,940,839 | $12.62 |
| Capital Expenditures | $0 | $0 | $0 | $39,603 | $0.17 |
| TI/LC | $0 | $0 | $0 | $249,264 | $1.07 |
| Net Cash Flow | $2,300,434 | $2,492,249 | $2,155,290 | $2,651,972 | $11.38 |
| Occupancy % | 87.8% | 74.0%(2) | 88.4%(3) | 83.2%(4) | |
| NOI DSCR | 2.67x | 2.89x | 2.50x | 3.41x | |
| NCF DSCR | 2.67x | 2.89x | 2.50x | 3.07x | |
| NOI Debt Yield | 9.2% | 10.0% | 8.6% | 11.8% | |
| NCF Debt Yield | 9.2% | 10.0% | 8.6% | 10.6% | |
| (1) | UW Gross Potential Rent is based on the underwritten rent roll dated November 1, 2019. The increase from 9/30/2019 T-9 Ann. to UW Gross Potential Rent and Net Operating Income is due to (i) rent steps through January 31, 2021 totaling $114,714 and (ii) recent leasing including Ross Dress for Less, Woodbridge Dental Associates, VA ABC and Quality Vacuums ($481,697 of gross potential rent). |
| (2) | 2018 Occupancy is as of December 1, 2018. |
| (3) | 9/30/2019 T-9 Ann. Occupancy is as of the rent roll dated November 1, 2019. |
| (4) | Represents economic occupancy. The Prince William Square Property was 88.4% leased as of November 1, 2019. |
| This is not a research report and was not prepared by any Underwriter’s research department. Please see additional important information and qualifications at the end of this Term Sheet. |
T-158
| BANK 2020-BNK26 | Collateral Statistics |
This material was prepared by sales, trading, banking or other non-research personnel of one of the following: Morgan Stanley & Co. LLC, Morgan Stanley & Co. International Limited, Morgan Stanley Japan Limited and/or Morgan Stanley Dean Witter Asia Limited (together with their affiliates, hereinafter “Morgan Stanley”), BofA Securities, Inc. (together with its affiliates, “BofA Securities”), Wells Fargo Securities, LLC (together with its affiliates, “Wells Fargo”), Academy Securities, Inc. (together with its affiliates, “Academy”) and Drexel Hamilton, LLC (together with its affiliates, “Drexel” and collectively with Morgan Stanley, BofA Securities, Wells Fargo and Academy, the “Underwriters”). This material was not produced by an Underwriter’s research analyst, although it may refer to an Underwriter’s research analyst or research report. Unless otherwise indicated, these views (if any) are the author’s and may differ from those of the fixed income or equity research departments of the Underwriters or others in those firms.
This material may have been prepared by or in conjunction with the respective trading desks of the Underwriters that may deal as principal in or own or act as market maker or liquidity provider for the securities/instruments (or related derivatives) mentioned herein. The trading desk may have accumulated a position in the subject securities/instruments based on the information contained herein. Trading desk materials are not independent of the proprietary interests of the Underwriters, which may conflict with your interests. Each of the Underwriters may also perform or seek to perform investment banking services for the issuers of the securities and instruments mentioned herein.
The information contained in this material is subject to change, completion or amendment from time to time, and the information in this material supersedes information in any other communication relating to the securities referred to in this material. This material is not a solicitation to participate in any trading strategy, and is not an offer to sell any security or instrument or a solicitation of an offer to buy or sell any security or instrument in any jurisdiction where an offer, solicitation or sale is not permitted. Unless otherwise set forth in this material, any securities referred to in this material may not have been registered under the U.S. Securities Act of 1933, as amended, and, if not, may not be offered or sold absent an exemption therefrom. Recipients are required to comply with any legal or contractual restrictions on their purchase, holding, sale, exercise of rights or performance of obligations under any securities/instruments transaction.
The securities/instruments discussed in this material may not be suitable for all investors. This material has been prepared and issued by the Underwriters for intended distribution to market professionals and institutional investor clients. Other recipients should seek independent investment advice prior to making any investment decision based on this material. This material does not provide individually tailored investment advice or offer tax, regulatory, accounting or legal advice. Prior to entering into any proposed transaction, recipients should determine, in consultation with their own investment, legal, tax, regulatory and accounting advisors, the economic risks and merits, as well as the legal, tax, regulatory and accounting characteristics and consequences, of the transaction. You should consider this material as only a single factor in making an investment decision.
The value of and income from investments may vary because of changes in interest rates, foreign exchange rates, default rates, prepayment rates, securities/instruments prices, market indexes, operational or financial conditions of companies or other factors. There may be time limitations on the exercise of options or other rights in securities/instruments transactions. Past performance is not necessarily a guide to future performance. Estimates of future performance are based on assumptions that may not be realized. Actual events may differ from those assumed and changes to any assumptions may have a material impact on any projections or estimates. Other events not taken into account may occur and may significantly affect the projections or estimates. Certain assumptions may have been made for modeling purposes only to simplify the presentation and/or calculation of any projections or estimates, and the Underwriters do not represent that any such assumptions will reflect actual future events. Accordingly, there can be no assurance that estimated returns or projections will be realized or that actual returns or performance results will not materially differ from those estimated herein. Some of the information contained in this document may be aggregated data of transactions in securities or other financial instruments executed by an Underwriter that has been compiled so as not to identify the underlying transactions of any particular customer.
Notwithstanding anything herein to the contrary, the Underwriters and each recipient hereof (and their employees, representatives, and other agents) may disclose to any and all persons, without limitation of any kind from the commencement of discussions, the U.S. federal and state income tax treatment and tax structure of the transaction and all materials of any kind (including opinions or other tax analyses) that are provided to it relating to the tax treatment and tax structure (as such terms are defined in Treasury Regulation 1.6011-4). For this purpose, "tax structure" is limited to facts relevant to the U.S. federal and state income tax treatment of the transaction and does not include information relating to the identity of the parties, their affiliates, agents or advisors. This authorization of tax disclosure is retroactively effective to the commencement of discussions with prospective investors regarding the transactions contemplated herein.
THE DISTRIBUTION OF THIS MATERIAL (A) IF MADE BY A PERSON WHO IS NOT AN AUTHORIZED PERSON UNDER THE FINANCIAL SERVICES AND MARKETS ACT 2000 (“FSMA”), IS BEING MADE ONLY TO, OR DIRECTED ONLY AT, PERSONS WHO (I) ARE OUTSIDE THE UNITED KINGDOM, (II) HAVE PROFESSIONAL EXPERIENCE IN MATTERS RELATING TO INVESTMENTS AND QUALIFY AS INVESTMENT PROFESSIONALS IN ACCORDANCE WITH ARTICLE 19(5) OF THE FINANCIAL SERVICES AND MARKETS ACT 2000 (FINANCIAL PROMOTION) ORDER 2005 (AS AMENDED, THE “FINANCIAL PROMOTION ORDER”), (III) ARE PERSONS FALLING WITHIN ARTICLE 49(2)(A) THROUGH (D) (“HIGH NET WORTH COMPANIES, UNINCORPORATED ASSOCIATIONS, ETC.”) OF THE FINANCIAL PROMOTION ORDER OR (IV) ARE PERSONS TO WHICH THIS MATERIAL MAY OTHERWISE LAWFULLY BE COMMUNICATED OR DIRECTED; AND (B) IF MADE BY A PERSON WHO IS AN AUTHORIZED PERSON UNDER THE FSMA, IS BEING MADE ONLY TO, OR DIRECTED ONLY AT, PERSONS WHO (I) ARE OUTSIDE THE UNITED KINGDOM, (II) HAVE PROFESSIONAL EXPERIENCE OF PARTICIPATING IN UNREGULATED SCHEMES (AS DEFINED FOR PURPOSES OF THE FINANCIAL SERVICES AND MARKETS ACT 2000 (PROMOTION OF COLLECTIVE INVESTMENT SCHEMES) (EXEMPTIONS) ORDER 2001 (AS AMENDED, THE “PROMOTION OF COLLECTIVE INVESTMENT SCHEMES EXEMPTIONS ORDER”)) AND QUALIFY AS INVESTMENT PROFESSIONALS IN ACCORDANCE WITH ARTICLE 14(5) OF THE PROMOTION OF COLLECTIVE INVESTMENT SCHEMES EXEMPTIONS ORDER, (III) ARE PERSONS FALLING WITHIN ARTICLE 22(2)(A) THROUGH (D) (“HIGH NET WORTH COMPANIES, UNINCORPORATED ASSOCIATIONS, ETC.”) OF THE PROMOTION OF COLLECTIVE INVESTMENT SCHEMES EXEMPTIONS ORDER, OR (IV) ARE PERSONS TO WHOM THE ISSUING ENTITY MAY LAWFULLY BE PROMOTED IN ACCORDANCE WITH SECTION 4.12 OF THE UK FINANCIAL CONDUCT AUTHORITY’S CONDUCT OF BUSINESS SOURCEBOOK.
THE OFFERED CERTIFICATES HAVE NOT BEEN AND WILL NOT BE REGISTERED UNDER THE FINANCIAL INSTRUMENTS AND EXCHANGE LAW OF JAPAN, AS AMENDED (THE “FIEL”), AND DISCLOSURE UNDER THE FIEL HAS NOT BEEN AND WILL NOT BE MADE WITH RESPECT TO THE OFFERED CERTIFICATES. ACCORDINGLY, EACH OF MORGAN STANLEY & CO. LLC, BOFA SECURITIES, INC., WELLS FARGO SECURITIES, LLC,Academy Securities, Inc. ANDDrexel Hamilton, LLCHAS REPRESENTED AND AGREED THAT IT HAS NOT, DIRECTLY OR INDIRECTLY, OFFERED OR SOLD AND WILL NOT, DIRECTLY OR INDIRECTLY, OFFER OR SELL ANY OFFERED CERTIFICATES IN JAPAN OR TO, OR FOR THE BENEFIT OF, ANY RESIDENT OF JAPAN (WHICH TERM AS USED IN THIS MATERIAL MEANS ANY PERSON RESIDENT IN JAPAN, INCLUDING ANY CORPORATION OR OTHER ENTITY ORGANIZED UNDER THE LAWS OF JAPAN) OR TO OTHERS FOR REOFFERING OR RE SALE, DIRECTLY OR INDIRECTLY, IN JAPAN OR TO, OR FOR THE BENEFIT OF, ANY RESIDENT OF JAPAN EXCEPT PURSUANT TO AN EXEMPTION FROM THE REGISTRATION REQUIREMENTS OF, AND OTHERWISE IN COMPLIANCE WITH, THE FIEL AND OTHER RELEVANT LAWS, REGULATIONS AND MINISTERIAL GUIDELINES OF JAPAN. AS PART OF THIS OFFERING OF THE OFFERED CERTIFICATES, THE UNDERWRITERS MAY OFFER THE OFFERED CERTIFICATES IN JAPAN TO UP TO 49 OFFEREES IN ACCORDANCE WITH THE ABOVE PROVISIONS.
©2020 Morgan Stanley