| FREE WRITING PROSPECTUS | ||
| FILED PURSUANT TO RULE 433 | ||
| REGISTRATION FILE NO.: 333-227446-13 | ||
 |  |  |
BANK 2021-BNK32
Free Writing Prospectus
Structural and Collateral Term Sheet
$904,782,971
(Approximate Total Mortgage Pool Balance)
$754,249,000
(Approximate Offered Certificates)
Morgan Stanley Capital I Inc.
as Depositor
Morgan Stanley Mortgage Capital Holdings LLC
Bank of America, National Association
Wells Fargo Bank, National Association
National Cooperative Bank, N.A.
as Sponsors and Mortgage Loan Sellers
Commercial Mortgage Pass-Through Certificates
Series 2021-BNK32
March 10, 2021
| MORGAN STANLEY Co-Lead Bookrunner Manager | WELLS FARGO SECURITIES Co-Lead Bookrunner Manager | BofA SECURITIES Co-Lead Bookrunner Manager |
| Academy Securities, Inc. Co-Manager | Drexel Hamilton Co-Manager | |
STATEMENT REGARDING THIS FREE WRITING PROSPECTUS
The depositor has filed a registration statement (including a prospectus) with the SEC (File No. 333-227446) for the offering to which this communication relates. Before you invest, you should read the prospectus in that registration statement and other documents the depositor has filed with the SEC for more complete information about the depositor, the issuing entity and this offering. You may get these documents for free by visiting EDGAR on the SEC web site at www.sec.gov. Alternatively, the depositor or any underwriter or any dealer participating in the offering will arrange to send you the prospectus if you request it by calling toll free 1-866-718-1649 or by email to prospectus@ms.com.
This is not a research report and was not prepared by any Underwriter’s research department. Please see additional important information and qualifications at the end of this Term Sheet.
| BANK 2021-BNK32 |
Neither this Term Sheet nor anything contained herein shall form the basis for any contract or commitment whatsoever. The information contained herein is preliminary as of the date hereof. This Term Sheet is subject to change, completion or amendment from time to time. The information contained herein supersedes information in any other communication relating to the securities described herein; provided, that the information contained herein will be superseded by similar information delivered to you as part of the Preliminary Prospectus. The information contained herein should be reviewed only in conjunction with the entire Preliminary Prospectus. All of the information contained herein is subject to the same limitations and qualifications contained in the Preliminary Prospectus. The information contained herein does not contain all relevant information relating to the underlying mortgage loans or mortgaged properties. Such information is described in the Preliminary Prospectus. The information contained herein will be more fully described in the Preliminary Prospectus. The information contained herein should not be viewed as projections, forecasts, predictions or opinions with respect to value. Prior to making any investment decision, prospective investors are strongly urged to read the Preliminary Prospectus in its entirety. Neither the Securities and Exchange Commission nor any state securities commission has approved or disapproved of these securities or determined if this Term Sheet is truthful or complete. Any representation to the contrary is a criminal offense.
Wells Fargo Securities is the trade name for the capital markets and investment banking services of Wells Fargo & Company and its subsidiaries, including but not limited to Wells Fargo Securities, LLC, a member of the New York Stock Exchange, the Financial Industry Regulatory Authority (“FINRA”), the National Futures Association (“NFA”) and the Securities Investor Protection Corporation (“SIPC”), Wells Fargo Prime Services, LLC, a member of FINRA, NFA and SIPC, and Wells Fargo Bank, National Association. Wells Fargo Securities, LLC and Wells Fargo Prime Services, LLC are distinct entities from affiliated banks and thrifts.
IMPORTANT NOTICE RELATING TO AUTOMATICALLY GENERATED EMAIL DISCLAIMERS
Any legends, disclaimers or other notices that may appear at the bottom of, or attached to, the email communication to which this Term Sheet may have been attached are not applicable to this Term Sheet and should be disregarded. Such legends, disclaimers or other notices have been automatically generated as a result of this Term Sheet having been sent via Bloomberg or another email system.
IMPORTANT NOTICE REGARDING THE CONDITIONS FOR THIS OFFERING OF ASSET-BACKED SECURITIES
THE ASSET-BACKED SECURITIES REFERRED TO IN THIS TERM SHEET ARE BEING OFFERED WHEN, AS AND IF ISSUED. IN PARTICULAR, YOU ARE ADVISED THAT THE ASSET-BACKED SECURITIES, AND THE ASSET POOL BACKING THEM, ARE SUBJECT TO MODIFICATION OR REVISION (INCLUDING, AMONG OTHER THINGS, THE POSSIBILITY THAT ONE OR MORE CLASSES OF SECURITIES MAY BE SPLIT, COMBINED OR ELIMINATED), AT ANY TIME PRIOR TO ISSUANCE OR AVAILABILITY OF A FINAL PROSPECTUS. AS A RESULT, YOU MAY COMMIT TO PURCHASE SECURITIES THAT HAVE CHARACTERISTICS THAT MAY CHANGE, AND YOU ARE ADVISED THAT ALL OR A PORTION OF THE SECURITIES MAY NOT BE ISSUED THAT HAVE THE CHARACTERISTICS DESCRIBED IN THIS TERM SHEET. OUR OBLIGATION TO SELL SECURITIES TO YOU IS CONDITIONED ON THE SECURITIES AND THE UNDERLYING TRANSACTION HAVING THE CHARACTERISTICS DESCRIBED IN THIS TERM SHEET. IF WE DETERMINE THAT THE FOREGOING CONDITION IS NOT SATISFIED IN ANY MATERIAL RESPECT, WE WILL NOTIFY YOU, AND NEITHER THE ISSUING ENTITY NOR ANY UNDERWRITER WILL HAVE ANY OBLIGATION TO YOU TO DELIVER ALL OR ANY PORTION OF THE SECURITIES WHICH YOU HAVE COMMITTED TO PURCHASE, AND THERE WILL BE NO LIABILITY BETWEEN US AS A CONSEQUENCE OF THE NON-DELIVERY.
This is not a research report and was not prepared by any Underwriter’s research department. Please see additional important information and qualifications at the end of this Term Sheet.
2
| BANK 2021-BNK32 | Structural Overview |
Offered Certificates
| Class | Expected Ratings (Fitch/Moody’s/DBRS Morningstar)(1) | Approximate Initial Certificate Balance or Notional Amount(2) | Approximate Initial Credit Support(3) | Pass-Through Rate Description | Expected Weighted Average Life (Years)(4) | Expected Principal Window (Months)(4) | Certificate Principal UW NOI Debt Yield(5) | Certificate Principal to Value Ratio(6) |
| Class A-1 | AAAsf/Aaa(sf)/AAA(sf) | $8,800,000 | 30.000% | (7) | 2.95 | 1 – 60 | 18.0% | 35.1% |
| Class A-2 | AAAsf/Aaa(sf)/AAA(sf) | $28,200,000 | 30.000% | (7) | 4.98 | 60 – 60 | 18.0% | 35.1% |
| Class A-SB | AAAsf/Aaa(sf)/AAA(sf) | $18,727,500 | 30.000% | (7) | 7.46 | 60 – 117 | 18.0% | 35.1% |
| Class A-3 | AAAsf/Aaa(sf)/AAA(sf) | $16,672,500 | 30.000% | (7) | 7.62 | 83 – 95 | 18.0% | 35.1% |
| Class A-4(8) | AAAsf/Aaa(sf)/AAA(sf) | (8)(9) | 30.000% | (7)(8) | (9) | (9) | 18.0% | 35.1% |
| Class A-5(8) | AAAsf/Aaa(sf)/AAA(sf) | (8)(9) | 30.000% | (7)(8) | (9) | (9) | 18.0% | 35.1% |
| Class X-A | AAAsf/Aaa(sf)/AAA(sf) | $601,680,000(10) | N/A | Variable IO(11) | N/A | N/A | N/A | N/A |
| Class X-B | A-sf/NR/AAA(sf) | $152,569,000(10) | N/A | Variable IO(11) | N/A | N/A | N/A | N/A |
| Class A-S(8) | AAAsf/Aa1(sf)/AAA(sf) | $68,764,000(8) | 22.000% | (7)(8) | 9.98 | 120 – 120 | 16.2% | 39.1% |
| Class B(8) | AA-sf/NR/AAA(sf) | $42,977,000(8) | 17.000% | (7)(8) | 9.98 | 120 – 120 | 15.2% | 41.6% |
| Class C(8) | A-sf/NR/AA(high)(sf) | $40,828,000(8) | 12.250% | (7)(8) | 9.98 | 120 – 120 | 14.4% | 44.0% |
Privately Offered Certificates(12)
| Class | Expected Ratings (Fitch/Moody’s/DBRS Morningstar)(1) | Approximate Initial Certificate Balance or Notional Amount(2) | Approximate Initial Credit Support(3) | Pass-Through Rate Description | Expected Weighted Average Life (Years)(4) | Expected Principal Window (Months)(4) | Certificate Principal UW NOI Debt Yield(5) | Certificate Principal to Value Ratio(6) |
| Class X-D | BBB-sf/NR/A(sf) | $45,126,000(10) | N/A | Variable IO(11) | N/A | N/A | N/A | N/A |
| Class X-F | BB-sf/NR/BBB(low)(sf) | $20,414,000(10) | N/A | Variable IO(11) | N/A | N/A | N/A | N/A |
| Class X-G | B-sf/NR/BBB(low)(sf) | $9,670,000(10) | N/A | Variable IO(11) | N/A | N/A | N/A | N/A |
| Class X-H | NR/NR/NR | $30,084,822(10) | N/A | Variable IO(11) | N/A | N/A | N/A | N/A |
| Class D | BBBsf/NR/A(high)(sf) | $25,787,000 | 9.250% | (7) | 9.98 | 120 – 120 | 13.9% | 45.5% |
| Class E | BBB-sf/NR/A(low)(sf) | $19,339,000 | 7.000% | (7) | 9.98 | 120 – 120 | 13.5% | 46.6% |
| Class F | BB-sf/NR/BB(high)(sf) | $20,414,000 | 4.625% | (7) | 10.05 | 120 – 121 | 13.2% | 47.8% |
| Class G | B-sf/NR/BB(high)(sf) | $9,670,000 | 3.500% | (7) | 10.06 | 121 – 121 | 13.1% | 48.3% |
| Class H | NR/NR/NR | $30,084,822 | 0.000% | (7) | 10.06 | 121 – 121 | 12.6% | 50.1% |
Non-Offered Eligible Vertical Interest(12)
| Class | Expected Ratings (Fitch/Moody’s/DBRS Morningstar)(1) | Approximate Initial Certificate Balance or Notional Amount(2) | Approximate Initial Credit Support(3) | Pass-Through Rate Description | Expected Weighted Average Life (Years)(4) | Expected Principal Window (Months)(4) | Certificate Principal UW NOI Debt Yield(5) | Certificate Principal to Value Ratio(6) |
| RR Interest | NR/NR/NR | $45,239,148.55 | N/A | (13) | 9.50 | 1 – 121 | N/A | N/A |
| (1) | Ratings shown are those of Fitch Ratings, Inc. (“Fitch”), Moody’s Investors Service, Inc. (“Moody’s”) and DBRS, Inc. (“DBRS Morningstar”). Certain nationally recognized statistical rating organizations that were not hired by the depositor may use information they receive pursuant to Rule 17g-5 under the Securities Exchange Act of 1934, as amended, or otherwise to rate the certificates. There can be no assurance as to what ratings a non-hired nationally recognized statistical rating organization would assign. See “Risk Factors—Other Risks Relating to the Certificates—Nationally Recognized Statistical Rating Organizations May Assign Different Ratings to the Certificates; Ratings of the Certificates Reflect Only the Views of the Applicable Rating Agencies as of the Dates Such Ratings Were Issued; Ratings May Affect ERISA Eligibility; Ratings May Be Downgraded” and “Ratings” in the Preliminary Prospectus to be dated on or about the date hereof (the “Preliminary Prospectus”). Capitalized terms used but not defined herein have the meanings assigned to such terms in the Preliminary Prospectus. |
| (2) | Approximate, subject to a permitted variance of plus or minus 5% and further subject to the discussion in footnote (9) below. In addition, the notional amounts of the Class X-A, Class X-B, Class X-D, Class X-F, Class X-G and Class X-H certificates may vary depending upon the final pricing of the classes of principal balance certificates or trust components whose certificate or principal balances comprise such notional amounts, and, if as a result of such pricing the pass-through rate of any class of the Class X-A, Class X-B, Class X-D, Class X-F, Class X-G or Class X-H certificates, as applicable, would be equal to zero at all times, such class of certificates will not be issued on the closing date of this securitization. |
| (3) | The approximate initial credit support percentages set forth for the certificates are approximate and, for the Class A-1, Class A-2, Class A-SB, Class A-3, Class A-4 and Class A-5 certificates, are presented in the aggregate, taking into account the principal balances of the Class A-4 and Class A-5 trust components. The approximate initial credit support percentage set forth for each class of the Class A-S, Class B and Class C certificates represents the approximate credit support for the underlying trust component with the same alphanumeric designation. The RR Interest provides credit support only to the limited extent that it is allocated a portion of any losses incurred on the underlying mortgage loans, which such losses are allocated between it, on the one hand, and to the Non-Retained Certificates, on the other hand, pro rata in accordance with their respective Percentage Allocation Entitlements (as defined below). See “Credit Risk Retention” in the Preliminary Prospectus. |
This is not a research report and was not prepared by any Underwriter’s research department. Please see additional important information and qualifications at the end of this Term Sheet.
3
| BANK 2021-BNK32 | Structural Overview |
| (4) | The Expected Weighted Average Life and Expected Principal Window during which distributions of principal would be received as set forth in the foregoing table with respect to each class of certificates having a certificate balance are based on the assumptions set forth under “Yield and Maturity Considerations—Weighted Average Life” in the Preliminary Prospectus and on the assumptions that there are no prepayments, modifications or losses in respect of the mortgage loans and that there are no extensions or forbearances of maturity dates or anticipated repayment dates of the mortgage loans. |
| (5) | Certificate Principal UW NOI Debt Yield for any class of principal balance certificates shown in the table above (other than the RR Interest) is calculated as the product of (a) the weighted average UW NOI Debt Yield for the mortgage pool, multiplied by (b) a fraction, the numerator of which is the aggregate initial certificate or principal balance of all the principal balance certificates, and the denominator of which is the sum of (x) the aggregate initial certificate or principal balance of the subject class of principal balance certificates (or, with respect to the Class A-4, Class A-5, Class A-S, Class B or Class C certificates, the trust component with the same alphanumeric designation) and all other classes of principal balance certificates (other than the RR Interest), if any, that are senior to such class and (y) the outstanding certificate balance of the RR Interest, multiplied by the applicable RR Interest Computation Percentage. The Certificate Principal UW NOI Debt Yields of the Class A-1, Class A-2, Class A-SB, Class A-3, Class A-4 and Class A-5 certificates are calculated in the aggregate for those classes as if they were a single class. With respect to any class of principal balance certificates, the “RR Interest Computation Percentage” is equal to a fraction, expressed as a percentage, the numerator of which is the total initial certificate or principal balance of the subject class of principal balance certificates (or, with respect to the Class A-4, Class A-5, Class A-S, Class B or Class C certificates, the trust component with the same alphanumeric designation) and all other classes of principal balance certificates (other than the RR Interest), if any, that are senior to such class, and the denominator of which is the sum of the aggregate initial certificate or principal balance of all the principal balance certificates (other than the RR Interest). |
| (6) | Certificate Principal to Value Ratio for any class of principal balance certificates shown in the table above (other than the RR Interest) is calculated as the product of (a) the weighted average Cut-off Date LTV Ratio of the mortgage pool, multiplied by (b) a fraction, the numerator of which is the sum of (x) the aggregate initial certificate or principal balance of the subject class of principal balance certificates (or, with respect to the Class A-4, Class A-5, Class A-S, Class B or Class C certificates, the trust component with the same alphanumeric designation) and all other classes of principal balance certificates (other than the RR Interest), if any, that are senior to such class and (y) the outstanding certificate balance of the RR Interest, multiplied by the applicable RR Interest Computation Percentage, and the denominator of which is the aggregate initial certificate or principal balance of all the principal balance certificates. The Certificate Principal to Value Ratios of the Class A-1, Class A-2, Class A-SB, Class A-3, Class A-4 and Class A-5 certificates are calculated in the aggregate for those classes as if they were a single class. |
| (7) | The pass-through rate for each class of the Class A-1, Class A-2, Class A-SB, Class A-3, Class A-4, Class A-5, Class A-S, Class B, Class C, Class D, Class E, Class F, Class G and Class H certificates will be one of the following: (i) a fixed rate per annum, (ii) a variable rate per annum equal to the weighted average of the net mortgage interest rates on the mortgage loans for the related distribution date, (iii) a variable rate per annum equal to the lesser of (a) a fixed rate and (b) the weighted average of the net mortgage interest rates on the mortgage loans for the related distribution date or (iv) a variable rate per annum equal to the weighted average of the net mortgage interest rates on the mortgage loans for the related distribution date minus a specified percentage. For purposes of the calculation of the weighted average of the net mortgage interest rates on the mortgage loans for each distribution date, the net mortgage interest rates will be adjusted as necessary to a 30/360 basis. |
| (8) | The Class A-4-1, Class A-4-2, Class A-4-X1, Class A-4-X2, Class A-5-1, Class A-5-2, Class A-5-X1, Class A-5-X2, Class A-S-1, Class A-S-2, Class A-S-X1, Class A-S-X2, Class B-1, Class B-2, Class B-X1, Class B-X2, Class C-1, Class C-2, Class C-X1 and Class C-X2 certificates are also offered certificates. Such classes of certificates, together with the Class A-4, Class A-5, Class A-S, Class B and Class C certificates, constitute the “Exchangeable Certificates”. The Class A-1, Class A-2, Class A-SB, Class A-3, Class D, Class E, Class F, Class G and Class H certificates, together with the RR Interest and the Exchangeable Certificates with a certificate balance, are referred to as the “principal balance certificates.” Each class of Exchangeable Certificates will have the certificate balance or notional amount and pass-through rate described below under “Exchangeable Certificates.” Each Class of Class A-4, Class A-5, Class A-S, Class B and Class C Exchangeable Certificates will have the same ratings as the Class A-4, Class A-5, Class A-S, Class B and Class C certificates, respectively, shown in the table above. |
| (9) | The exact initial principal balances or notional amounts of the Class A-4, Class A-4-X1, Class A-4-X2, Class A-5, Class A-5-X1 and Class A-5-X2 trust components (and consequently, the exact aggregate initial certificate balances or notional amounts of the Exchangeable Certificates with an “A-4” or “A-5” designation) are unknown and will be determined based on the final pricing of the certificates. However, the initial principal balances, weighted average lives and principal windows of the Class A-4 and Class A-5 trust components are expected to be within the applicable ranges reflected in the following chart. The aggregate initial principal balance of the Class A-4 and Class A-5 trust components is expected to be approximately $529,280,000, subject to a variance of plus or minus 5%. The Class A-4-X1 and Class A-4-X2 trust components will have initial notional amounts equal to the initial principal balance of the Class A-4 trust component. The Class A-5-X1 and Class A-5-X2 trust components will have initial notional amounts equal to the initial principal balance of the Class A-5 trust component. In the event that the Class A-5 trust component is issued with an initial certificate balance of $529,280,000, the Class A-4 trust component (and, correspondingly, the Class A-4 Exchangeable Certificates) will not be issued. |
| Trust Components | Expected Range of Initial Principal Balance | Expected Range of Weighted Average Life (Years) | Expected Range of Principal Window (Months) |
| Class A-4 | $0 - $240,000,000 | NAP – 9.50 | NAP / 108 – 119 |
| Class A-5 | $289,280,000 - $529,280,000 | 9.73 – 9.93 | 108 – 120 / 119 – 120 |
| (10) | The Class X-A, Class X-B, Class X-D, Class X-F, Class X-G and Class X-H certificates (collectively referred to as the “Class X certificates”) are notional amount certificates and will not be entitled to distributions of principal. The notional amount of the Class X-A certificates will be equal to the aggregate certificate or principal balance of the Class A-1, Class A-2, Class A-SB and Class A-3 certificates and the Class A-4 and Class A-5 trust components. The notional amount of the Class X-B certificates will be equal to the aggregate principal balance of the Class A-S, Class B and Class C trust components. The notional amount of the Class X-D certificates will be equal to the aggregate certificate balance of the Class D and Class E certificates. The notional amount of each class of the Class X-F, Class X-G and Class X-H certificates will be equal to the certificate balance of the class of principal balance certificates that, with the addition of “X-,” has the same alphabetical designation as the subject class of Class X certificates. |
| (11) | The pass-through rate for the Class X-A certificates for any distribution date will be a per annum rate equal to the excess, if any, of (a) the weighted average of the net mortgage interest rates on the mortgage loans for the related distribution date, over (b) the weighted average of the pass-through rates on the Class A-1, Class A-2, Class A-SB and Class A-3 certificates and the Class A-4, Class A-4-X1, Class A-4-X2, Class A-5, Class A-5-X1 and Class A-5-X2 trust components for the related distribution date, weighted on the basis of their respective certificate or principal balances or notional amounts outstanding immediately prior to that distribution date (but excluding trust components with a notional amount in the denominator of such weighted average calculation). The pass-through rate for the Class X-B certificates for any distribution date will be a per annum rate equal to the excess, if any, of (a) the weighted average of the net mortgage interest rates on the mortgage loans for the related distribution date, over (b) the weighted average of the pass-through rates on the Class A-S, Class A-S-X1, Class A-S-X2, Class B, Class B-X1, Class B-X2, Class C, Class C-X1 and Class C-X2 trust components for the related distribution date, weighted on the basis of their respective principal balances or notional amounts outstanding immediately prior to that distribution date (but excluding trust components with a notional amount in the denominator of such weighted average calculation). The pass-through rate for the Class X-D certificates for any distribution date will be a per annum rate equal to the excess, if any, of (a) the weighted average of the net mortgage interest rates on the mortgage loans for the related distribution date, over (b) the weighted average of the pass-through rates on the Class D and Class E certificates for the related distribution date, weighted on the basis of their respective certificate balances outstanding immediately prior to that distribution date. The pass-through rate for each class of the Class X-F, Class X-G and Class X-H certificates for any distribution date will be a per annum rate equal to the excess, if any, of (a) the |
This is not a research report and was not prepared by any Underwriter’s research department. Please see additional important information and qualifications at the end of this Term Sheet.
4
| BANK 2021-BNK32 | Structural Overview |
| weighted average of the net mortgage interest rates on the mortgage loans for the related distribution date, over (b) the pass-through rate for the related distribution date on the class of principal balance certificates that, with the addition of “X-,” has the same alphabetical designation as the subject class of Class X certificates. For purposes of the calculation of the weighted average of the net mortgage interest rates on the mortgage loans for each distribution date, the net mortgage interest rates will be adjusted as necessary to a 30/360 basis. |
| (12) | Not offered pursuant to the Preliminary Prospectus or this Term Sheet. Information provided in this Term Sheet regarding the characteristics of these certificates is provided only to enhance your understanding of the offered certificates. The privately offered certificates also include the Class V and Class R certificates, which do not have a certificate balance, notional amount, credit support, pass-through rate, rating, assumed final distribution date or rated final distribution date, and which are not shown in the chart. The Class V certificates represent a beneficial ownership interest held through the grantor trust in a specified percentage of certain excess interest in respect of mortgage loans having anticipated repayment dates, if any. The Class R certificates represent the beneficial ownership of the residual interest in each of the real estate mortgage investment conduits, as further described in the Preliminary Prospectus. |
| (13) | Although it does not have a specified pass-through rate (other than for tax reporting purposes), the effective pass-through rate for the RR Interest will be a variable rate per annum equal to the weighted average of the net mortgage interest rates on the mortgage loans for the related distribution date (in each case adjusted, if necessary, to accrue on the basis of a 360-day year consisting of twelve 30-day months). |
This is not a research report and was not prepared by any Underwriter’s research department. Please see additional important information and qualifications at the end of this Term Sheet.
5
| BANK 2021-BNK32 | Structural Overview |
Issue Characteristics
| Offered Certificates: | $754,249,000 (approximate) monthly pay, multi-class, commercial mortgage pass-through certificates, consisting of 19 principal balance classes (Class A-1, Class A-2, Class A-SB, Class A-3, Class A-4, Class A-4-1, Class A-4-2, Class A-5, Class A-5-1, Class A-5-2, Class A-S, Class A-S-1, Class A-S-2, Class B, Class B-1, Class B-2, Class C, Class C-1 and Class C-2) and 12 interest-only classes (Class A-4-X1, Class A-4-X2, Class A-5-X1, Class A-5-X2, Class X-A, Class X-B, Class A-S-X1, Class A-S-X2, Class B-X1, Class B-X2, Class C-X1 and Class C-X2) |
| Co-Lead Managers and Joint Bookrunners: | Morgan Stanley & Co. LLC, BofA Securities, Inc and Wells Fargo Securities, LLC |
| Co-Managers: | Academy Securities, Inc. and Drexel Hamilton, LLC |
| Mortgage Loan Sellers: | Morgan Stanley Mortgage Capital Holdings LLC, Bank of America, National Association, Wells Fargo Bank, National Association and National Cooperative Bank, N.A. |
| Rating Agencies: | Fitch, Moody’s and DBRS Morningstar |
| Master Servicers: | Wells Fargo Bank, National Association and National Cooperative Bank, N.A. |
| Special Servicers: | Rialto Capital Advisors, LLC and National Cooperative Bank, N.A. |
| Certificate Administrator/ Certificate Registrar/Custodian: | Wells Fargo Bank, National Association |
| Trustee: | Wilmington Trust, National Association |
| Operating Advisor: | Park Bridge Lender Services LLC |
| Asset Representations Reviewer: | Park Bridge Lender Services LLC |
| Initial Directing Certificateholder: | RREF IV Debt AIV, LP |
| Risk Retention Consultation Party: | Morgan Stanley Mortgage Capital Holdings LLC |
| U.S. Credit Risk Retention: | For a discussion on the manner in which the U.S. credit risk retention requirements will be addressed by Morgan Stanley Mortgage Capital Holdings LLC, as the retaining sponsor, see “Credit Risk Retention” in the Preliminary Prospectus. |
| EU Risk Retention: | None of the sponsors, the depositor or the underwriters or their respective affiliates, or any other person, intends to retain a material net economic interest in the securitization constituted by the issue of the certificates, or to take any other action in respect of such securitization, in a manner prescribed or contemplated by the EU Securitization Regulation or the UK Securitization Regulation. In particular, no such person undertakes to take any action which may be required by any potential investor or certificateholder for the purposes of its compliance with any requirement of the EU Securitization Regulation or the UK Securitization Regulation. In addition, the arrangements described under “Credit Risk Retention” in the Preliminary Prospectus have not been structured with the objective of ensuring compliance by any person with any requirement of the EU Securitization Regulation or the UK Securitization Regulation. Consequently, the Offered Certificates may not be a suitable investment for investors that are subject to any requirement of the EU Securitization Regulation or the UK Securitization Regulation. See “Risk Factors—Other Risks Relating to the Certificates—EU Securitization Regulation and UK Securitization Regulation” in the Preliminary Prospectus. |
| Cut-off Date: | The mortgage loans will be considered part of the trust fund as of their respective cut-off dates. The cut-off date with respect to each mortgage loan is the respective due date for the monthly debt service payment that is due in March 2021 (or, in the case of any mortgage loan that has its first due date after March 2021, the date that would have been its due date in March 2021 under the terms of that mortgage loan if a monthly debt service payment were scheduled to be due in that month). |
| Expected Pricing Date: | Week of March 15, 2021 |
| Expected Closing Date: | March 24, 2021 |
| Determination Dates: | The 11th day of each month or, if the 11th day is not a business day, then the business day immediately following such 11th day. |
| Distribution Dates: | The 4th business day following each determination date. The first distribution date will be in April 2021. |
| Rated Final Distribution Date: | The distribution date in April 2054 |
| Interest Accrual Period: | Preceding calendar month |
| Payment Structure: | Sequential pay |
| Tax Treatment: | REMIC, except that the Exchangeable Certificates will evidence interests in a grantor trust |
| Optional Termination: | 1.00% clean-up call |
| Minimum Denominations: | $10,000 for each class of Offered Certificates (other than Class X-A and Class X-B certificates); $1,000,000 for the Class X-A and Class X-B certificates |
| Settlement Terms: | DTC, Euroclear and Clearstream |
This is not a research report and was not prepared by any Underwriter’s research department. Please see additional important information and qualifications at the end of this Term Sheet.
6
| BANK 2021-BNK32 | Structural Overview |
| Legal/Regulatory Status: | Each class of Offered Certificates is expected to be eligible for exemptive relief under ERISA. No class of Offered Certificates is SMMEA eligible. |
| Analytics: | The certificate administrator is expected to make available all distribution date statements, CREFC® reports and supplemental notices received by it to certain modeling financial services as described in the Preliminary Prospectus. |
| Bloomberg Ticker: | BANK 2021-BNK32<MTGE><GO> |
| Risk Factors: | THE CERTIFICATES INVOLVE CERTAIN RISKS AND MAY NOT BE SUITABLE FOR ALL INVESTORS. SEE THE “RISK FACTORS” SECTION OF THE PRELIMINARY PROSPECTUS. |
This is not a research report and was not prepared by any Underwriter’s research department. Please see additional important information and qualifications at the end of this Term Sheet.
7
| BANK 2021-BNK32 | Structural Overview |
Structural Overview
| Allocation Between the RR Interest and the Non-Retained Certificates: |
The aggregate amount available for distributions to the holders of the Certificates (including the RR Interest) on each distribution date (net of specified expenses of the issuing entity, including fees payable to, and costs and expenses reimbursable to, each applicable master servicer, primary servicer and special servicer, the certificate administrator, the trustee, the operating advisor, the asset representations reviewer and CREFC®) will be allocated between amounts available for distribution to the holders of the RR Interest, on the one hand, and to all other Certificates (other than the Class V and Class R Certificates), referred to herein as the “Non-Retained Certificates”, on the other hand. The portion of such amount allocable to (a) the RR Interest will at all times be the product of such amount multiplied by 5% and (b) the Non-Retained Certificates will at all times be the product of such amount multiplied by the difference between 100% and the percentage set forth in clause (a) (each, the respective “Percentage Allocation Entitlement”).
|
| Accrual: | Each class of Offered Certificates will accrue interest on a 30/360 basis. |
| Amount and Order of Distributions: |
On each distribution date, the Non-Retained Certificates’ Percentage Allocation Entitlement of funds available for distribution from the mortgage loans, net of (i) any yield maintenance charges and prepayment premiums and (ii) any excess interest, will be distributed in the following amounts and order of priority:
First, to the Class A-1, Class A-2, Class A-SB, Class A-3, Class X-A, Class X-B, Class X-D, Class X-F, Class X-G and Class X-H certificates and the Class A-4, Class A-4-X1, Class A-4-X2, Class A-5, Class A-5-X1 and Class A-5-X2 trust components, in respect of interest, up to an amount equal to, and pro rata in accordance with, the interest entitlements for those classes of certificates and trust components;
Second, to the Class A-1, Class A-2, Class A-SB and Class A-3 certificates and the Class A-4 and Class A-5 trust components as follows, to the extent of applicable available funds allocated to principal: either (i)(a) first, to principal on the Class A-SB certificates, until the certificate balance of the Class A-SB certificates is reduced to the planned principal balance for the related distribution date set forth in Annex E to the Preliminary Prospectus, and (b) second, to principal on the Class A-1 certificates, the Class A-2 certificates, the Class A-3 certificates, the Class A-4 trust component, the Class A-5 trust component and the Class A-SB certificates, in that order, in each case until the certificate or principal balance of such class of certificates or trust component has been reduced to zero, or (ii) if the certificate or principal balance of each class of principal balance certificates and trust components other than the Class A-1, Class A-2, Class A-SB and Class A-3 certificates, the Class A-4 and Class A-5 trust components and the RR Interest has been reduced to zero as a result of the allocation of losses on the mortgage loans to those certificates, to principal on the Class A-1, Class A-2, Class A-SB and Class A-3 certificates and the Class A-4 and Class A-5 trust components, pro rata, without regard to the distribution priorities described above or the planned principal balance of the Class A-SB certificates;
Third, to the Class A-1, Class A-2, Class A-SB and Class A-3 certificates and the Class A-4 and Class A-5 trust components, first, up to an amount equal to, and pro rata based on, any previously unreimbursed losses on the mortgage loans allocable to principal that were previously borne by each such class or trust component and then in the amount of interest thereon;
Fourth, to the Class A-S, Class A-S-X1 and Class A-S-X2 trust components, as follows: (a) to each such trust component in respect of interest, up to an amount equal to, and pro rata in accordance with, the interest entitlements for those trust components; (b) to the extent of applicable available funds allocable to principal remaining after distributions in respect of principal to each class of certificates or trust component with a higher priority (as set forth in prior enumerated clauses set forth above), to principal on the Class A-S trust component until its principal balance has been reduced to zero; and (c) to reimburse the Class A-S trust component, first, in the amount of any previously unreimbursed losses on the mortgage loans that were previously allocated thereto, then in the amount of interest thereon;
Fifth, to the Class B, Class B-X1 and Class B-X2 trust components, as follows: (a) to each such trust component in respect of interest, up to an amount equal to, and pro rata in accordance with, the interest entitlements for those trust components; (b) to the extent of applicable available funds allocable to principal remaining after distributions in respect of principal to each class of certificates or trust component with a higher priority (as set forth in prior enumerated clauses set forth above), to principal on the Class B trust component until its principal balance has been reduced to zero; and (c) to reimburse the Class B trust component, first, in the amount of any previously unreimbursed losses on the mortgage loans that were previously allocated thereto, then in the amount of interest thereon;
Sixth, to the Class C, Class C-X1 and Class C-X2 trust components, as follows: (a) to each such trust component in respect of interest, up to an amount equal to, and pro rata in accordance with, the interest entitlements for those trust components; (b) to the extent of applicable available funds allocable to principal remaining after distributions in respect of principal to each class of certificates or trust component with a higher priority (as set forth in prior enumerated clauses set forth above), to principal on the Class C trust component until its principal balance has been reduced to zero; and (c) to reimburse the Class C trust component, first, in the amount of any previously unreimbursed losses on the mortgage loans that were previously allocated thereto, then in the amount of interest thereon;
Seventh, to the Class D, Class E, Class F, Class G and Class H certificates in the amounts and order of priority described in “Description of the Certificates—Distributions” in the Preliminary Prospectus; and
Eighth, to the Class R certificates, any remaining amounts. |
This is not a research report and was not prepared by any Underwriter’s research department. Please see additional important information and qualifications at the end of this Term Sheet.
8
| BANK 2021-BNK32 | Structural Overview |
| Principal and interest payable on each trust component will be distributed pro rata to the corresponding classes of Exchangeable Certificates representing interests therein in accordance with their Class Percentage Interests therein as described below under “Exchangeable Certificates.”
|
| Interest and Principal Entitlements: |
The interest entitlement of each class of Offered Certificates on each distribution date generally will be the interest accrued during the related interest accrual period on the related certificate balance or notional amount at the related pass-through rate, net of any prepayment interest shortfalls allocated to that class for such distribution date as described below. If prepayment interest shortfalls arise from voluntary prepayments on serviced mortgage loans during any collection period, the applicable master servicer is required to make a limited compensating interest payment to offset those shortfalls. See “Description of the Certificates—Prepayment Interest Shortfalls” in the Preliminary Prospectus. The remaining amount of prepayment interest shortfalls will be allocated between the RR Interest, on one hand, and the Non-Retained Certificates, on the other hand, in accordance with their respective Percentage Allocation Entitlements. The prepayment interest shortfalls allocated to the Non-Retained Certificates will be allocated among such classes of certificates (other than the Exchangeable Certificates) and trust components that are entitled to interest, on a pro rata basis, based on their respective amounts of accrued interest for the related distribution date, to reduce the interest entitlement on each such class of certificates and trust components. For any distribution date, prepayment interest shortfalls allocated to a trust component will be allocated among the related classes of Exchangeable Certificates, pro rata, in accordance with their respective class percentage interests for that distribution date. If a class of certificates or trust component receives less than the entirety of its interest entitlement on any distribution date, then the shortfall (excluding any shortfall due to prepayment interest shortfalls), together with interest thereon, will be added to its interest entitlement for the next succeeding distribution date.
The aggregate principal distribution amount for each distribution date generally will be the aggregate amount of principal received or advanced in respect of the mortgage loans, net of any non-recoverable advances and interest thereon and any workout-delayed reimbursement amounts that are reimbursed to the applicable master servicer or the trustee during the related collection period. Non-recoverable advances and interest thereon are reimbursable from principal collections before reimbursement from other amounts. Workout-delayed reimbursement amounts will be reimbursable from principal collections. The Non-Retained Certificates and the RR Interest will be entitled to their respective Percentage Allocation Entitlements of the aggregate principal distribution amount.
|
| Exchangeable Certificates: | Certificates of each class of Exchangeable Certificates may be exchanged for certificates of the corresponding classes of Exchangeable Certificates set forth next to such class in the table below, and vice versa. Following any exchange of certificates of one or more classes of Exchangeable Certificates (the applicable “Surrendered Classes”) for certificates of one or more classes of other Exchangeable Certificates (the applicable “Received Classes”), the Class Percentage Interests (as defined below) of the outstanding principal balances or notional amounts of the Corresponding Trust Components that are represented by the Surrendered Classes (and consequently their related certificate balances or notional amounts) will be decreased, and those of the Received Classes (and consequently their related certificate balances or notional amounts) will be increased. The dollar denomination of the certificates of each of the Received Classes must be equal to the dollar denomination of the certificates of each of the Surrendered Classes. No fee will be required with respect to any exchange of Exchangeable Certificates. |
| Surrendered Classes (or Received Classes) of Certificates | Received Classes (or Surrendered Classes) of Certificates | |
| Class A-4 | Class A-4-1, Class A-4-X1 | |
| Class A-4 | Class A-4-2, Class A-4-X2 | |
| Class A-5 | Class A-5-1, Class A-5-X1 | |
| Class A-5 | Class A-5-2, Class A-5-X2 | |
| Class A-S | Class A-S-1, Class A-S-X1 | |
| Class A-S | Class A-S-2, Class A-S-X2 | |
| Class B | Class B-1, Class B-X1 | |
| Class B | Class B-2, Class B-X2 | |
| Class C | Class C-1, Class C-X1 | |
| Class C | Class C-2, Class C-X2 |
| On the closing date, the issuing entity will issue the following “trust components,” each with the initial principal balance (or, if such trust component has an “X” suffix, notional amount) and pass-through rate set forth next to it in the table below. Each trust component with an “X” suffix will not be entitled to distributions of principal. |
| Trust Component | Initial Principal Balance or Notional Amount | Pass-Through Rate | |
| Class A-4 | See footnote (9) to the first table above under “Structural Overview” | Class A-4 certificate pass-through rate minus 1.00% | |
| Class A-4-X1 | Equal to Class A-4 trust component principal balance | 0.50% | |
| Class A-4-X2 | Equal to Class A-4 trust component principal balance | 0.50% | |
| Class A-5 | See footnote (9) to the first table above under “Structural Overview” | Class A-5 certificate pass-through rate minus 1.00% |
This is not a research report and was not prepared by any Underwriter’s research department. Please see additional important information and qualifications at the end of this Term Sheet.
9
| BANK 2021-BNK32 | Structural Overview |
| Class A-5-X1 | Equal to Class A-5 trust component principal balance | 0.50% | |
| Class A-5-X2 | Equal to Class A-5 trust component principal balance | 0.50% | |
| Class A-S | $68,764,000 | Class A-S certificate pass-through rate minus 1.00% | |
| Class A-S-X1 | Equal to Class A-S trust component principal balance | 0.50% | |
| Class A-S-X2 | Equal to Class A-S trust component principal balance | 0.50% | |
| Class B | $42,977,000 | Class B certificate pass-through rate minus 1.00% | |
| Class B-X1 | Equal to Class B trust component principal balance | 0.50% | |
| Class B-X2 | Equal to Class B trust component principal balance | 0.50% | |
| Class C | $40,828,000 | Class C certificate pass-through rate minus 1.00% | |
| Class C-X1 | Equal to Class C trust component principal balance | 0.50% | |
| Class C-X2 | Equal to Class C trust component principal balance | 0.50% |
| Each class of Exchangeable Certificates represents an undivided beneficial ownership interest in the trust components set forth next to it in the table below (the “Corresponding Trust Components”). Each class of Exchangeable Certificates has a pass-through rate equal to the sum of the pass-through rates of the Corresponding Trust Components and represents a percentage interest (the related “Class Percentage Interest”) in each Corresponding Trust Component, including principal and interest payable thereon (and reimbursement of losses allocable thereto), equal to (x) the certificate balance (or, if such class has an “X” suffix, notional amount) of such class of certificates, divided by (y) the principal balance of the Class A-4 trust component (if such class of Exchangeable Certificates has an “A-4” designation), the Class A-5 trust component (if such class of Exchangeable Certificates has an “A-5” designation), the Class A-S trust component (if such class of Exchangeable Certificates has an “A-S” designation), the Class B trust component (if such class of Exchangeable Certificates has a “B” designation), or the Class C trust component (if such class of Exchangeable Certificates has a “C” designation). |
| Group of Exchangeable Certificates | Class of Exchangeable Certificates | Corresponding Trust Components |
| “Class A-4 Exchangeable Certificates” | Class A-4 | Class A-4, Class A-4-X1, Class A-4-X2 |
| Class A-4-1 | Class A-4, Class A-4-X2 | |
| Class A-4-2 | Class A-4 | |
| Class A-4-X1 | Class A-4-X1 | |
| Class A-4-X2 | Class A-4-X1, Class A-4-X2 | |
| “Class A-5 Exchangeable Certificates” | Class A-5 | Class A-5, Class A-5-X1, Class A-5-X2 |
| Class A-5-1 | Class A-5, Class A-5-X2 | |
| Class A-5-2 | Class A-5 | |
| Class A-5-X1 | Class A-5-X1 | |
| Class A-5-X2 | Class A-5-X1, Class A-5-X2 | |
| “Class A-S Exchangeable Certificates” | Class A-S | Class A-S, Class A-S-X1, Class A-S-X2 |
| Class A-S-1 | Class A-S, Class A-S-X2 | |
| Class A-S-2 | Class A-S | |
| Class A-S-X1 | Class A-S-X1 | |
| Class A-S-X2 | Class A-S-X1, Class A-S-X2 | |
| “Class B Exchangeable Certificates” | Class B | Class B, Class B-X1, Class B-X2 |
| Class B-1 | Class B, Class B-X2 | |
| Class B-2 | Class B | |
| Class B-X1 | Class B-X1 | |
| Class B-X2 | Class B-X1, Class B-X2 | |
| “Class C Exchangeable Certificates” | Class C | Class C, Class C-X1, Class C-X2 |
| Class C-1 | Class C, Class C-X2 | |
| Class C-2 | Class C | |
| Class C-X1 | Class C-X1 | |
| Class C-X2 | Class C-X1, Class C-X2 |
| The maximum certificate balance or notional amount of each class of Class A-4 Exchangeable Certificates, Class A-5 Exchangeable Certificates, Class A-S Exchangeable Certificates, Class B Exchangeable Certificates or Class C Exchangeable Certificates that could be issued in an exchange is equal to the principal balance of the Class A-4, Class A-5, Class A-S, Class B or Class C trust component, respectively. The maximum certificate |
This is not a research report and was not prepared by any Underwriter’s research department. Please see additional important information and qualifications at the end of this Term Sheet.
10
| BANK 2021-BNK32 | Structural Overview |
| balances of Class A-4, Class A-5, Class A-S, Class B and Class C certificates (subject to the constraint on the aggregate initial principal balance of the Class A-4 and Class A-5 trust components discussed in footnote (9) to the first table above under “Structural Overview”) will be issued on the closing date, and the certificate balance or notional amount of each other class of Exchangeable Certificates will be equal to zero on the closing date. |
| Each class of Class A-4 Exchangeable Certificates, Class A-5 Exchangeable Certificates, Class A-S Exchangeable Certificates, Class B Exchangeable Certificates and Class C Exchangeable Certificates will have a certificate balance or notional amount equal to its Class Percentage Interest multiplied by the principal balance of the Class A-4, Class A-5, Class A-S, Class B or Class C trust component, respectively. Each class of Class A-4 Exchangeable Certificates, Class A-5 Exchangeable Certificates, Class A-S Exchangeable Certificates, Class B Exchangeable Certificates and Class C Exchangeable Certificates with a certificate balance will have the same approximate initial credit support percentage, Expected Weighted Average Life, Expected Principal Window, Certificate Principal UW NOI Debt Yield and Certificate Principal to Value Ratio as the Class A-4, Class A-5, Class A-S, Class B or Class C certificates, respectively, shown above. |
| Special Servicer Compensation: | The principal compensation to be paid to a special servicer in respect of its special servicing activities will be the special servicing fee, the workout fee and the liquidation fee.
The special servicing fee for each distribution date is calculated based on the outstanding principal balance of each serviced mortgage loan that is a specially serviced mortgage loan (and any related serviced companion loan) or as to which the related mortgaged property has become an REO property at the special servicing fee rate, which will be a rate equal to (a) with respect to Rialto Capital Advisors, LLC, the greater of 0.25000% per annum and the per annum rate that would result in a special servicing fee for the related month of $5,000, and (b) with respect to National Cooperative Bank, N.A., the greater of 0.25000% per annum and the per annum rate that would result in a special servicing fee of $1,000 for the related month. The special servicing fee will be payable monthly, first, from liquidation proceeds, insurance and condemnation proceeds, and other collections in respect of the related specially serviced mortgage loan or REO property and, then, from general collections on all the mortgage loans and any REO properties.
Each applicable special servicer will also be entitled to (i) liquidation fees generally equal to 1.0% (or, if such rate would result in an aggregate liquidation fee less than $25,000, then the liquidation fee rate will be equal to the lesser of (i) 3.0% and (ii) such lower rate as would result in an aggregate liquidation fee equal to $25,000) of liquidation proceeds and certain other collections in respect of a specially serviced mortgage loan (and any related serviced companion loan) or related REO property and of amounts received in respect of mortgage loan repurchases by the related mortgage loan sellers and (ii) workout fees generally equal to 1.0% of interest (other than post-ARD excess interest on mortgage loans with anticipated repayment dates and other than default interest) and principal payments made in respect of a rehabilitated mortgage loan (and any related serviced companion loan), subject to a floor of $25,000 with respect to any mortgage loan, whole loan or related REO property, and in the case of each of clause (i) and (ii), subject to certain adjustments and exceptions as described in the Preliminary Prospectus under “Pooling and Servicing Agreement—Servicing and Other Compensation and Payment of Expenses—Special Servicing Compensation”.
With respect to any non-serviced mortgage loan, the related special servicer under the related other pooling and servicing agreement pursuant to which such mortgage loan is being serviced will be entitled to similar compensation as that described above with respect to such non-serviced mortgage loan under such other pooling and servicing agreement as further described in the Preliminary Prospectus, although any related fees may accrue at a different rate and there may be a higher (or no) cap on liquidation and workout fees.
|
| Prepayment Premiums/Yield Maintenance Charges: |
If any yield maintenance charge or prepayment premium is collected during any collection period with respect to any mortgage loan, then on the immediately succeeding distribution date, the certificate administrator will pay: |
| (1) to the Non-Retained Certificates, in the following amounts: |
| (a) to the holders of each class of the Class A-1, Class A-2, Class A-SB, Class A-3, Class A-4, Class A-4-1, Class A-4-2, Class A-5, Class A-5-1, Class A-5-2, Class A-S, Class A-S-1, Class A-S-2, Class B, Class B-1, Class B-2, Class C, Class C-1, Class C-2, Class D and Class E certificates, the product of (x) the Non-Retained Certificates’ Percentage Allocation Entitlement of such yield maintenance charge or prepayment premium, (y) the related Base Interest Fraction for such class and the applicable principal prepayment, and (z) a fraction, the numerator of which is equal to the amount of principal distributed to such class for that distribution date, and the denominator of which is the total amount of principal distributed to the Class A-1, Class A-2, Class A-SB, Class A-3, Class D and Class E certificates and the Class A-4 Exchangeable Certificates, the Class A-5 Exchangeable Certificates, the Class A-S Exchangeable Certificates, the Class B Exchangeable Certificates and the Class C Exchangeable Certificates for that distribution date, |
| (b) to the holders of the Class A-4-X1 certificates, the product of (x) the Non-Retained Certificates’ Percentage Allocation Entitlement of such yield maintenance charge or prepayment premium, (y) a fraction, the numerator of which is equal to the amount of principal distributed to the Class A-4-1 certificates for that distribution date, and the denominator of which is the total amount of principal distributed to the Class A-1, Class A-2, Class A-SB, Class A-3, Class D and Class E certificates and the Class A-4 Exchangeable Certificates, the Class A-5 Exchangeable Certificates, the Class A-S Exchangeable Certificates, the Class B Exchangeable Certificates and the Class C Exchangeable Certificates for that distribution date, and (z) the difference between (1) the Base Interest Fraction for |
This is not a research report and was not prepared by any Underwriter’s research department. Please see additional important information and qualifications at the end of this Term Sheet.
11
| BANK 2021-BNK32 | Structural Overview |
| the Class A-4 certificates and the applicable principal prepayment and (2) the Base Interest Fraction for the Class A-4-1 certificates and the applicable principal prepayment, |
| (c) to the holders of the Class A-4-X2 certificates, the product of (x) the Non-Retained Certificates’ Percentage Allocation Entitlement of such yield maintenance charge or prepayment premium, (y) a fraction, the numerator of which is equal to the amount of principal distributed to the Class A-4-2 certificates for that distribution date, and the denominator of which is the total amount of principal distributed to the Class A-1, Class A-2, Class A-SB, Class A-3, Class D and Class E certificates and the Class A-4 Exchangeable Certificates, the Class A-5 Exchangeable Certificates, the Class A-S Exchangeable Certificates, the Class B Exchangeable Certificates and the Class C Exchangeable Certificates for that distribution date, and (z) the difference between (1) the Base Interest Fraction for the Class A-4 certificates and the applicable principal prepayment and (2) the Base Interest Fraction for the Class A-4-2 certificates and the applicable principal prepayment, |
| (d) to the holders of the Class A-5-X1 certificates, the product of (x) the Non-Retained Certificates’ Percentage Allocation Entitlement of such yield maintenance charge or prepayment premium, (y) a fraction, the numerator of which is equal to the amount of principal distributed to the Class A-5-1 certificates for that distribution date, and the denominator of which is the total amount of principal distributed to the Class A-1, Class A-2, Class A-SB, Class A-3, Class D and Class E certificates and the Class A-4 Exchangeable Certificates, the Class A-5 Exchangeable Certificates, the Class A-S Exchangeable Certificates, the Class B Exchangeable Certificates and the Class C Exchangeable Certificates for that distribution date, and (z) the difference between (1) the Base Interest Fraction for the Class A-5 certificates and the applicable principal prepayment and (2) the Base Interest Fraction for the Class A-5-1 certificates and the applicable principal prepayment, |
| (e) to the holders of the Class A-5-X2 certificates, the product of (x) the Non-Retained Certificates’ Percentage Allocation Entitlement of such yield maintenance charge or prepayment premium, (y) a fraction, the numerator of which is equal to the amount of principal distributed to the Class A-5-2 certificates for that distribution date, and the denominator of which is the total amount of principal distributed to the Class A-1, Class A-2, Class A-SB, Class A-3, Class D and Class E certificates and the Class A-4 Exchangeable Certificates, the Class A-5 Exchangeable Certificates, the Class A-S Exchangeable Certificates, the Class B Exchangeable Certificates and the Class C Exchangeable Certificates for that distribution date, and (z) the difference between (1) the Base Interest Fraction for the Class A-5 certificates and the applicable principal prepayment and (2) the Base Interest Fraction for the Class A-5-2 certificates and the applicable principal prepayment, |
| (f) to the holders of the Class A-S-X1 certificates, the product of (x) the Non-Retained Certificates’ Percentage Allocation Entitlement of such yield maintenance charge or prepayment premium, (y) a fraction, the numerator of which is equal to the amount of principal distributed to the Class A-S-1 certificates for that distribution date, and the denominator of which is the total amount of principal distributed to the Class A-1, Class A-2, Class A-SB, Class A-3, Class D and Class E certificates and the Class A-4 Exchangeable Certificates, the Class A-5 Exchangeable Certificates, the Class A-S Exchangeable Certificates, the Class B Exchangeable Certificates and the Class C Exchangeable Certificates for that distribution date, and (z) the difference between (1) the Base Interest Fraction for the Class A-S certificates and the applicable principal prepayment and (2) the Base Interest Fraction for the Class A-S-1 certificates and the applicable principal prepayment, |
| (g) to the holders of the Class A-S-X2 certificates, the product of (x) the Non-Retained Certificates’ Percentage Allocation Entitlement of such yield maintenance charge or prepayment premium, (y) a fraction, the numerator of which is equal to the amount of principal distributed to the Class A-S-2 certificates for that distribution date, and the denominator of which is the total amount of principal distributed to the Class A-1, Class A-2, Class A-SB, Class A-3, Class D and Class E certificates and the Class A-4 Exchangeable Certificates, the Class A-5 Exchangeable Certificates, the Class A-S Exchangeable Certificates, the Class B Exchangeable Certificates and the Class C Exchangeable Certificates for that distribution date, and (z) the difference between (1) the Base Interest Fraction for the Class A-S certificates and the applicable principal prepayment and (2) the Base Interest Fraction for the Class A-S-2 certificates and the applicable principal prepayment, |
| (h) to the holders of the Class B-X1 certificates, the product of (x) the Non-Retained Certificates’ Percentage Allocation Entitlement of such yield maintenance charge or prepayment premium, (y) a fraction, the numerator of which is equal to the amount of principal distributed to the Class B-1 certificates for that distribution date, and the denominator of which is the total amount of principal distributed to the Class A-1, Class A-2, Class A-SB, Class A-3, Class D and Class E certificates and the Class A-4 Exchangeable Certificates, the Class A-5 Exchangeable Certificates, the Class A-S Exchangeable Certificates, the Class B Exchangeable Certificates and the Class C Exchangeable Certificates for that distribution date, and (z) the difference between (1) the Base Interest Fraction for the Class B certificates and the applicable principal prepayment and (2) the Base Interest Fraction for the Class B-1 certificates and the applicable principal prepayment, |
| (i) to the holders of the Class B-X2 certificates, the product of (x) the Non-Retained Certificates’ Percentage Allocation Entitlement of such yield maintenance charge or prepayment premium, (y) a fraction, the numerator of which is equal to the amount of principal distributed to the Class B-2 certificates for that distribution date, and the denominator of which is the total amount of principal distributed to the Class A-1, Class A-2, Class A-SB, Class A-3, Class D and Class E certificates and the Class A-4 Exchangeable Certificates, the Class A-5 Exchangeable Certificates, the Class A-S Exchangeable Certificates, the Class B Exchangeable Certificates and the Class C Exchangeable |
This is not a research report and was not prepared by any Underwriter’s research department. Please see additional important information and qualifications at the end of this Term Sheet.
12
| BANK 2021-BNK32 | Structural Overview |
| Certificates for that distribution date, and (z) the difference between (1) the Base Interest Fraction for the Class B certificates and the applicable principal prepayment and (2) the Base Interest Fraction for the Class B-2 certificates and the applicable principal prepayment, |
| (j) to the holders of the Class C-X1 certificates, the product of (x) the Non-Retained Certificates’ Percentage Allocation Entitlement of such yield maintenance charge or prepayment premium, (y) a fraction, the numerator of which is equal to the amount of principal distributed to the Class C-1 certificates for that distribution date, and the denominator of which is the total amount of principal distributed to the Class A-1, Class A-2, Class A-SB, Class A-3, Class D and Class E certificates and the Class A-4 Exchangeable Certificates, the Class A-5 Exchangeable Certificates, the Class A-S Exchangeable Certificates, the Class B Exchangeable Certificates and the Class C Exchangeable Certificates for that distribution date, and (z) the difference between (1) the Base Interest Fraction for the Class C certificates and the applicable principal prepayment and (2) the Base Interest Fraction for the Class C-1 certificates and the applicable principal prepayment, |
| (k) to the holders of the Class C-X2 certificates, the product of (x) the Non-Retained Certificates’ Percentage Allocation Entitlement of such yield maintenance charge or prepayment premium, (y) a fraction, the numerator of which is equal to the amount of principal distributed to the Class C-2 certificates for that distribution date, and the denominator of which is the total amount of principal distributed to the Class A-1, Class A-2, Class A-SB, Class A-3, Class D and Class E certificates and the Class A-4 Exchangeable Certificates, the Class A-5 Exchangeable Certificates, the Class A-S Exchangeable Certificates, the Class B Exchangeable Certificates and the Class C Exchangeable Certificates for that distribution date, and (z) the difference between (1) the Base Interest Fraction for the Class C certificates and the applicable principal prepayment and (2) the Base Interest Fraction for the Class C-2 certificates and the applicable principal prepayment, |
| (l) to the holders of the Class X-A certificates, the excess, if any, of (x) the product of (1) the Non-Retained Certificates’ Percentage Allocation Entitlement of such yield maintenance charge or prepayment premium and (2) a fraction, the numerator of which is equal to the total amount of principal distributed to the Class A-1, Class A-2, Class A-SB and Class A-3 certificates and the Class A-4 Exchangeable Certificates and the Class A-5 Exchangeable Certificates for that distribution date, and the denominator of which is the total amount of principal distributed to the Class A-1, Class A-2, Class A-SB, Class A-3, Class D and Class E certificates and the Class A-4 Exchangeable Certificates, the Class A-5 Exchangeable Certificates, the Class A-S Exchangeable Certificates, the Class B Exchangeable Certificates and the Class C Exchangeable Certificates for that distribution date, over (y) the total amount of such yield maintenance charge or prepayment premium distributed to the Class A-1, Class A-2, Class A-SB and Class A-3 certificates and the Class A-4 Exchangeable Certificates and the Class A-5 Exchangeable Certificates as described above, |
| (m) to the holders of the Class X-B certificates, the excess, if any, of (x) the product of (1) the Non-Retained Certificates’ Percentage Allocation Entitlement of such yield maintenance charge or prepayment premium and (2) a fraction, the numerator of which is equal to the total amount of principal distributed to the Class A-S Exchangeable Certificates, the Class B Exchangeable Certificates and the Class C Exchangeable Certificates for that distribution date, and the denominator of which is the total amount of principal distributed to the Class A-1, Class A-2, Class A-SB, Class A-3, Class D and Class E certificates and the Class A-4 Exchangeable Certificates, the Class A-5 Exchangeable Certificates, the Class A-S Exchangeable Certificates, the Class B Exchangeable Certificates and the Class C Exchangeable Certificates for that distribution date, over (y) the total amount of such yield maintenance charge or prepayment premium distributed to the Class A-S Exchangeable Certificates, the Class B Exchangeable Certificates and Class C Exchangeable Certificates as described above, |
| and (n) to the holders of the Class X-D certificates, any remaining portion of the Non-Retained Certificates’ Percentage Allocation Entitlement of such yield maintenance charge or prepayment premium not distributed as described above in this clause (1), |
| and (2) to the RR Interest, its Percentage Allocation Entitlement of such yield maintenance charge or prepayment premium. All yield maintenance charges and prepayment premiums referred to above will be net of any liquidation fees payable therefrom. |
| No yield maintenance charges or prepayment premiums will be distributed to the holders of the Class X-F, Class X-G, Class X-H, Class F, Class G, Class H, Class V or Class R Certificates. |
| “Base Interest Fraction” means, with respect to any principal prepayment of any mortgage loan that provides for the payment of a yield maintenance charge or prepayment premium, and with respect to any class of principal balance certificates (other than the RR Interest), a fraction (A) the numerator of which is the greater of (x) zero and (y) the difference between (i) the pass-through rate on that class, and (ii) the applicable discount rate and (B) the denominator of which is the difference between (i) the mortgage interest rate on the related mortgage loan and (ii) the applicable discount rate; provided, that: under no circumstances will the Base Interest Fraction be greater than one; if the discount rate referred to above is greater than or equal to both the mortgage interest rate on the related mortgage loan and the pass-through rate on that class, then the Base Interest Fraction will equal zero; and if the discount rate referred to above is greater than or equal to the mortgage interest rate on the related mortgage loan and is less than the pass-through rate on that class, then the Base Interest Fraction will be equal to 1.0. |
This is not a research report and was not prepared by any Underwriter’s research department. Please see additional important information and qualifications at the end of this Term Sheet.
13
| BANK 2021-BNK32 | Structural Overview |
| Consistent with the foregoing, the Base Interest Fraction is equal to: |
| (Pass-Through Rate – Discount Rate) | ||
| (Mortgage Rate – Discount Rate) |
| Realized Losses: | On each distribution date, immediately following the distributions to be made to the certificateholders on that date, the certificate administrator is required to calculate the amount, if any, by which (i) the aggregate stated principal balance of the mortgage loans, including any successor REO loans, expected to be outstanding immediately following that distribution date is less than (ii) the then aggregate certificate balance of the principal balance certificates after giving effect to distributions of principal on that distribution date. The Non-Retained Certificates’ Percentage Allocation Entitlement of such amount will be applied to the Class H, Class G, Class F, Class E and Class D certificates and the Class C, Class B and Class A-S trust components, in that order, in each case until the related certificate or principal balance has been reduced to zero, and then to the Class A-1, Class A-2, Class A-SB and Class A-3 certificates and the Class A-4 and Class A-5 trust components, pro rata based upon their respective certificate or principal balances, until their respective certificate or principal balances have been reduced to zero. The RR Interest’s Percentage Allocation Entitlement of such amount will be applied to the RR Interest until the related RR Interest balance has been reduced to zero.
Any portion of such amount applied to the Class A-4, Class A-5, Class A-S, Class B or Class C trust component will reduce the certificate balance or notional amount of each class of certificates in the related group of Exchangeable Certificates by an amount equal to the product of (x) its certificate balance or notional amount, divided by the principal balance of such trust component prior to the applicable reduction, and (y) the amount applied to such trust component.
|
| Serviced Whole Loans: | Each of the following mortgaged properties or portfolio of mortgaged properties secures a mortgage loan and one or more pari passu promissory notes and, in some cases, one or more generally subordinate promissory notes (each, a “serviced companion loan”) that will be serviced pursuant to the related intercreditor agreement and the pooling and servicing agreement for this transaction: Pathline Park 9 & 10 and Extra Space Rock ‘N Roll Self Storage Portfolio. With respect to each such mortgaged property or portfolio of mortgaged properties, the related mortgage loan, together with the related serviced companion loan(s), is referred to herein (for so long as it is serviced under the pooling and servicing agreement for this transaction) as a “serviced whole loan.” Each serviced companion loan is not part of the mortgage pool and may be contributed to one or more future securitization transactions (if not already securitized) or may be otherwise transferred at any time, subject to compliance with the related intercreditor agreement. See the table below entitled “Mortgage Loans with Pari Passu Companion Loans,” as well as “Description of the Mortgage Pool—The Whole Loans” in the Preliminary Prospectus, for additional information regarding each such whole loan.
With respect to each “servicing shift whole loan”, the pooling and servicing agreement for this transaction will govern servicing of such whole loan until the securitization of the related control note; however, servicing of such whole loan will generally be directed by the holder of the related control note (which is not included in this securitization), and such holder will have the right to replace the special servicer with respect to the related whole loan with or without cause. After the securitization of such promissory note, such loan will cease to be a serviced whole loan and will be serviced pursuant to the pooling and servicing agreement for another securitization transaction (see “—Non-Serviced Whole Loans” below). There will be no servicing shift mortgage loans related to the trust as of the Closing Date.
|
| Non-Serviced Whole Loans: | Each of the following mortgaged properties or portfolio of mortgaged properties secures a mortgage loan (each, a “non-serviced mortgage loan”), one or more pari passu promissory notes and, in some cases, one or more generally subordinate promissory notes (each such promissory note, a “non-serviced companion loan”) that will be serviced pursuant to the related intercreditor agreement and the pooling and servicing agreement or trust and servicing agreement (referred to herein as a related “pooling and servicing agreement”) for another securitization transaction: Miami Design District, 605 Third Avenue, Boca Office Portfolio and McClellan Park. With respect to each such mortgaged property or portfolio of mortgaged properties, the related mortgage loan, together with the related non-serviced companion loan(s), is referred to herein (for so long as it is serviced under the pooling and servicing agreement for another securitization transaction) as a “non-serviced whole loan.” Each non-serviced companion loan is not part of the mortgage pool and may be contributed to one or more future securitization transactions (if not already securitized) or may be otherwise transferred at any time, subject to compliance with the related intercreditor agreement. Servicing of each non-serviced whole loan will generally be directed by the holder of the related control note (or, if such control note is included in a securitization, the directing certificateholder thereunder (or other party designated thereunder to exercise the rights of such control note)), and such holder will have the right to replace the special servicer with respect to the related whole loan with or without cause. See the tables below entitled “Mortgage Loans with Pari Passu Companion Loans” and “Mortgage Loans with Subordinate Debt,” as well as “Description of the Mortgage Pool—The Whole Loans” in the Preliminary Prospectus, for additional information regarding each such whole loan. |
| Directing Certificateholder/ Controlling Class: |
The “Directing Certificateholder” will be (i) with respect to a servicing shift mortgage loan, the related Loan-Specific Directing Certificateholder, and (ii) with respect to each other mortgage loan, the Controlling Class Certificateholder (or its representative) selected by more than 50% (by certificate balance) of the Controlling Class Certificateholders; provided, that (1) absent that selection, (2) until a Directing Certificateholder is so selected or (3) upon receipt of a notice from a majority of the Controlling Class Certificateholders (by certificate balance) that a Directing Certificateholder is no longer designated, the Controlling Class |
This is not a research report and was not prepared by any Underwriter’s research department. Please see additional important information and qualifications at the end of this Term Sheet.
14
| BANK 2021-BNK32 | Structural Overview |
Certificateholder that owns the largest aggregate certificate balance of the Controlling Class (or its representative) will be the Directing Certificateholder; provided, that (a) in the case of clause (3), if no one holder owns the largest aggregate certificate balance of the Controlling Class, then there will be no Directing Certificateholder until appointed in accordance with the terms of the pooling and servicing agreement, and (b) the certificate administrator and the other parties to the pooling and servicing agreement will be entitled to assume that the identity of the Directing Certificateholder has not changed until such parties receive written notice of a replacement of the Directing Certificateholder from a party holding the requisite interest in the Controlling Class (as confirmed by the certificate registrar), or the resignation of the then current Directing Certificateholder.
As used herein, the term “Directing Certificateholder,” unless used in relation to a Servicing Shift Mortgage Loan, means the entity determined pursuant to clause (ii) of the definition of such term.
The “Loan-Specific Directing Certificateholder” with respect to a servicing shift mortgage loan is the “controlling holder”, the “directing certificateholder”, the “directing holder”, “directing lender” or any analogous concept under the related intercreditor agreement. Prior to the securitization of the related control note, the Loan-Specific Directing Certificateholder with respect to a servicing shift mortgage loan will be the holder of the related control note. On and after the securitization of the related control note, there will be no Loan-Specific Directing Certificateholder under the PSA with respect to such servicing shift mortgage loan.
The “Controlling Class” will be, as of any time of determination, the most subordinate class of Control Eligible Certificates then outstanding that has an aggregate certificate balance (as notionally reduced by any Cumulative Appraisal Reduction Amounts (as defined below) allocable to such class) at least equal to 25% of the initial certificate balance of that class; provided, that if at any time the certificate balances of the certificates other than the Control Eligible Certificates and the RR Interest have been reduced to zero as a result of principal payments on the mortgage loans, then the Controlling Class will be the most subordinate class of Control Eligible Certificates that has a certificate balance greater than zero without regard to any Cumulative Appraisal Reduction Amounts. The Controlling Class as of the closing date will be the Class H certificates.
The “Control Eligible Certificates” will be any of the Class G and Class H certificates. |
| Control Rights: | Prior to a Control Termination Event, the Directing Certificateholder will have certain consent and consultation rights under the pooling and servicing agreement with respect to certain major decisions and other matters. A “Control Termination Event” will occur when (i) the Class G certificates have a certificate balance (taking into account the application of the allocable portion of any Cumulative Appraisal Reduction Amounts to notionally reduce the certificate balance thereof) of less than 25% of the initial certificate balance of that class or (ii) a holder of the Class G certificates is the majority Controlling Class Certificateholder and has irrevocably waived its right, in writing, to exercise any of the rights of the Controlling Class Certificateholder and such rights have not been reinstated to a successor controlling class certificateholder; provided that no Control Termination Event may occur with respect to the Loan-Specific Directing Certificateholder, and the term “Control Termination Event” will not be applicable to the Loan-Specific Directing Certificateholder; provided, further, that a Control Termination Event will be deemed not continuing in the event that the certificate balances of the principal balance certificates other than the Control Eligible Certificates and the RR Interest have been reduced to zero as a result of principal payments on the mortgage loans.
After the occurrence of a Control Termination Event but prior to the occurrence of a Consultation Termination Event, the Directing Certificateholder will not have any consent rights, but the Directing Certificateholder will have certain non-binding consultation rights under the pooling and servicing agreement with respect to certain major decisions and other matters. A “Consultation Termination Event” will occur when (i) no class of Control Eligible Certificates has a certificate balance (without regard to the application of the allocable portion of any Cumulative Appraisal Reduction Amounts) at least equal to 25% of the initial certificate balance of that class; or (ii) a holder of the Class G certificates is the majority Controlling Class Certificateholder and has irrevocably waived its right, in writing, to exercise any of the rights of the Controlling Class Certificateholder and such rights have not been reinstated to a successor controlling class certificateholder; provided that no Consultation Termination Event resulting solely from the operation of clause (ii) will be deemed to have existed or be in continuance with respect to a successor holder of the Class G certificates that has not irrevocably waived its right to exercise any of the rights of the Controlling Class Certificateholder; provided, further, that no Consultation Termination Event may occur with respect to the Loan-Specific Directing Certificateholder, and the term “Consultation Termination Event” will not be applicable to the Loan-Specific Directing Certificateholder; provided, further, that a Consultation Termination Event will be deemed not continuing in the event that the certificate balances of the principal balance certificates other than the Control Eligible Certificates and the RR Interest have been reduced to zero as a result of principal payments on the mortgage loans.
In the event of any transfer of the Class G certificates by a Controlling Class Certificateholder that had irrevocably waived its rights, the successor Controlling Class Certificateholder that purchased such Class G certificates, even if it does not waive its rights, will not have any consent rights with respect to any Mortgage Loan that became a Specially Serviced Loan prior to such successor Controlling Class Certificateholder’s purchase of such Class G certificates and had not become a Corrected Loan prior to such purchase until such Mortgage Loan becomes a Corrected Loan.
After the occurrence of a Consultation Termination Event, the Directing Certificateholder will not have any consent or consultation rights, except with respect to any rights expressly set forth in the pooling and servicing agreement, and the operating advisor will retain certain non-binding consultation rights under the pooling and servicing agreement with respect to certain major decisions and other matters.
Notwithstanding the proviso to the definitions of “Control Termination Event” and “Consultation Termination Event”, a Control Termination Event and a Consultation Termination Event will each be deemed to have occurred |
This is not a research report and was not prepared by any Underwriter’s research department. Please see additional important information and qualifications at the end of this Term Sheet.
15
| BANK 2021-BNK32 | Structural Overview |
with respect to any Excluded Loan with respect to the Directing Certificateholder or the holder of the majority of the Controlling Class, and neither the Directing Certificateholder nor any Controlling Class Certificateholder will have any consent or consultation rights with respect to the servicing of such Excluded Loan.
An “Excluded Loan” means (a) with respect to the Directing Certificateholder or the holder of the majority of the Controlling Class, a mortgage loan or whole loan with respect to which, as of any date of determination, the Directing Certificateholder or the holder of the majority of the Controlling Class is a Borrower Party or (b) with respect to the Risk Retention Consultation Party or the holder of the majority of the RR Interest, a mortgage loan or whole loan with respect to which, as of any date of determination, the Risk Retention Consultation Party or the holder of the majority of the RR Interest is a Borrower Party. It is expected that there will be no Excluded Loans with respect to this securitization on the closing date.
“Borrower Party” means a borrower, a mortgagor, a manager of a mortgaged property, the holder of a mezzanine loan that has been accelerated or as to which foreclosure or enforcement proceedings have been commenced against the equity collateral pledged to secure the related mezzanine loan, or any Borrower Party Affiliate. With respect to a mortgage loan secured by a residential cooperative property, a person will not be considered a “Borrower Party” solely by reason of such person holding one or more cooperative unit loans that are secured by direct equity interests in the related borrower or owning one or more residential cooperative units comprising the related mortgaged property as a result of any foreclosure, transfer in lieu of foreclosure or other exercise of remedies with respect to any such unit loan(s).
“Borrower Party Affiliate” means, with respect to a borrower, a mortgagor, a manager of a mortgaged property or the holder of a mezzanine loan that has been accelerated or as to which foreclosure or enforcement proceedings have been commenced against the equity collateral pledged to secure the related mezzanine loan, (a) any other person controlling or controlled by or under common control with such borrower, mortgagor, manager or mezzanine lender, as applicable, or (b) any other person owning, directly or indirectly, 25% or more of the beneficial interests in such borrower, mortgagor, manager or mezzanine lender, as applicable. For the purposes of this definition, “control” when used with respect to any specified person means the power to direct the management and policies of such person, directly or indirectly, whether through the ownership of voting securities, by contract or otherwise and the terms “controlling” and “controlled” have meanings correlative to the foregoing.
Notwithstanding any of the foregoing to the contrary, if any mortgage loan is part of a whole loan, the Directing Certificateholder’s consent and/or consultation rights with respect thereto may be limited as described in the Preliminary Prospectus. In particular, with respect to each non-serviced whole loan and each servicing shift whole loan, the Directing Certificateholder (other than a Loan-Specific Directing Certificateholder) will only have certain consultation rights with respect to certain major decisions and other matters related to such whole loan, in each case only prior to a Control Termination Event or Consultation Termination Event, as applicable, and the Loan-Specific Directing Certificateholder will be entitled to similar consent and/or consultation rights with respect to such whole loan. In addition, with respect to any serviced A/B whole loan, for so long as the holder of the related subordinate companion loan is the controlling note holder, the holder of such subordinate companion loan (rather than the Directing Certificateholder) will be entitled to exercise such consent and consultation rights with respect to such whole loan. |
| Appraisal Reduction Amounts and Collateral Deficiency Amounts: |
An “Appraisal Reduction Amount” generally will be created in the amount, if any, by which the principal balance of a required appraisal loan (which is a mortgage loan with respect to which certain defaults, modifications or insolvency events have occurred as further described in the Preliminary Prospectus) plus other amounts overdue or advanced in connection with such mortgage loan exceeds 90% of the appraised value of the related mortgaged property plus certain escrows and reserves (including letters of credit) held with respect to the mortgage loan.
A mortgage loan will cease to be subject to an Appraisal Reduction Amount when it has been brought current for at least three consecutive months, no additional event of default is foreseeable in the reasonable judgment of the applicable special servicer and no other circumstances exist that would cause such mortgage loan or any related companion loan to be a specially serviced loan; however, a “Collateral Deficiency Amount” may exist with respect to any mortgage loan that is modified into an AB loan structure (an “AB Modified Loan”) and remains a corrected mortgage loan and, if so, will generally equal the excess of (i) the stated principal balance of such AB Modified Loan (taking into account the related junior note(s) and any pari passu notes included therein), over (ii) the sum of (in the case of a whole loan, solely to the extent allocable to the subject mortgage loan) (x) the most recent appraised value for the related mortgaged property or mortgaged properties, plus (y) solely to the extent not reflected or taken into account in such appraised value (or in the calculation of any related Appraisal Reduction Amount) and to the extent on deposit with, or otherwise under the control of, the lender as of the date of such determination, any capital or additional collateral contributed by the related borrower at the time the mortgage loan became (and as part of the modification related thereto) such AB Modified Loan for the benefit of the related mortgaged property or mortgaged properties (provided that in the case of an non-serviced mortgage loan, the amounts set forth in this clause (y) will be taken into account solely to the extent relevant information is received by the applicable special servicer), plus (z) any other escrows or reserves (in addition to any amounts set forth in the immediately preceding clause (y) and solely to the extent not reflected or taken into account in the calculation of any related Appraisal Reduction Amount) held by the lender in respect of such AB Modified Loan as of the date of such determination, which such excess, for the avoidance of doubt, will be determined separately from and exclude any related Appraisal Reduction Amounts.
As used herein, a “Cumulative Appraisal Reduction Amount” will be the sum of any Appraisal Reduction Amounts and any Collateral Deficiency Amounts. |
This is not a research report and was not prepared by any Underwriter’s research department. Please see additional important information and qualifications at the end of this Term Sheet.
16
| BANK 2021-BNK32 | Structural Overview |
Any Appraisal Reduction Amount in respect of any non-serviced mortgage loan generally will be calculated in accordance with the other servicing agreement pursuant to which such mortgage loan is being serviced, which calculations are expected to be generally similar to those provided for in the pooling and servicing agreement for this transaction.
If any mortgage loan is part of a whole loan, any Appraisal Reduction Amount or Collateral Deficiency Amount will (or effectively will) be calculated in respect of such whole loan taken as a whole and allocated, to the extent provided in the related intercreditor agreement and the related pooling and servicing agreement, first, to any related subordinate companion loan, and second, to the related mortgage loan and any pari passu companion loan on a pro rata basis by unpaid principal balance.
Appraisal Reduction Amounts will proportionately reduce the interest portion of debt service advances required to be made in respect of the related mortgage loan. Appraisal Reduction Amounts and Collateral Deficiency Amounts (in each case, to the extent of the Non-Retained Certificates’ Percentage Allocation Entitlement thereof) will be (i) taken into account in determining the identity of the controlling class entitled to appoint the Directing Certificateholder, the existence of a Control Termination Event and the allocation and/or exercise of voting rights for certain purposes (see “Directing Certificateholder/Controlling Class” above) and (ii) allocated to the following classes of certificates and trust components, in each case to notionally reduce their certificate balances or principal balances until the certificate balance or principal balance of each such class or trust component is notionally reduced to zero: the Class H, Class G, Class F, Class E and Class D certificates and the Class C, Class B and Class A-S trust components, in that order, and then pro rata to the Class A-1, Class A-2, Class A-SB and Class A-3 certificates and the Class A-4 and Class A-5 trust components. Appraisal Reduction Amounts and Collateral Deficiency Amounts allocated to the Class A-4, Class A-5, Class A-S, Class B or Class C trust component will be allocated to the corresponding classes of Exchangeable Certificates with certificate balances pro rata to notionally reduce their certificate balances in accordance with their Class Percentage Interests therein.
Neither (i) a Payment Accommodation with respect to any mortgage loan or serviced whole loan nor (ii) any default or delinquency that would have existed but for such Payment Accommodation will constitute an appraisal reduction event, for so long as the related borrower is complying with the terms of such Payment Accommodation.
A “Payment Accommodation” for any mortgage loan or serviced whole loan means the entering into of any temporary forbearance agreement as a result of the COVID-19 emergency (and qualification as a COVID-19 emergency forbearance will be determined by the special servicer in its sole and absolute discretion in accordance with the Servicing Standard) relating to payment obligations or operating covenants under the related mortgage loan documents or the use of funds on deposit in any reserve account or escrow account for any purpose other than the explicit purpose described in the related mortgage loan documents, that in each case (i) is entered into by June 30, 2021, (ii) defers no greater than 3 monthly debt service payments (but no greater than 9 monthly debt service payments in the aggregate with any other Payment Accommodations) and (iii) requires full repayment of deferred payments, reserves and escrows by the date that is 12 months following the date of the first Payment Accommodation for such mortgage loan or serviced whole loan. |
| Appraised-Out Class: | An “Appraised-Out Class” is any class of Control Eligible Certificates, the certificate balance of which (taking into account the application of the Non-Retained Certificates’ Percentage Allocation Entitlement of any Appraisal Reduction Amounts or Collateral Deficiency Amounts to notionally reduce the certificate balance of such class) has been reduced to less than 25% of its initial certificate balance. Any Appraised-Out Class may not exercise any direction, control, consent and/or similar rights of the Controlling Class until such time, if any, as such class is reinstated as the Controlling Class, and the rights of the Controlling Class will be exercised by the next most senior class of Control Eligible Certificates that is not an Appraised-Out Class, if any, during such period. |
| Appraisal Remedy: | The holders of the majority (by certificate balance) of an Appraised-Out Class (such holders, the “Requesting Holders”) will have the right, at their sole expense, to require the applicable special servicer to order (or, with respect to a non-serviced mortgage loan, require the applicable special servicer to request from the applicable non-serviced special servicer) a second appraisal of any mortgage loan (or serviced whole loan) for which an appraisal reduction event has occurred or as to which there exists a Collateral Deficiency Amount. With respect to any serviced mortgage loan, the applicable special servicer will be required to use its reasonable efforts to ensure that such appraisal is delivered within 30 days from receipt of the Requesting Holders’ written request and will be required to cause such appraisal to be prepared on an “as-is” basis by an MAI appraiser. With respect to any non-serviced mortgage loan, the applicable special servicer will be required to use commercially reasonable efforts to obtain such second appraisal from the applicable non-serviced special servicer. Upon receipt of such supplemental appraisal, the applicable special servicer will be required to determine, in accordance with the Servicing Standard, whether, based on its assessment of such supplemental appraisal, any recalculation of the applicable Appraisal Reduction Amount or Collateral Deficiency Amount is warranted and, if so warranted, such person will be required to recalculate such Appraisal Reduction Amount or Collateral Deficiency Amount, as applicable, based upon such supplemental appraisal as described above. If required by any such recalculation, the applicable Appraised-Out Class will be reinstated as the Controlling Class and each Appraised-Out Class will, if applicable, have its related certificate balance notionally restored to the extent required by such recalculation of the Appraisal Reduction Amount or Collateral Deficiency Amount, if applicable.
In addition, the Requesting Holders of any Appraised-Out Class will have the right to challenge the Appraisal Reduction Amount and to require the applicable special servicer to order an additional appraisal of any serviced mortgage loan as to which there exists a Collateral Deficiency Amount if an event has occurred at, or with respect to, the related mortgaged property or mortgaged properties that would have a material effect on its or their appraised value, and such special servicer is required to use reasonable efforts to obtain an |
This is not a research report and was not prepared by any Underwriter’s research department. Please see additional important information and qualifications at the end of this Term Sheet.
17
| BANK 2021-BNK32 | Structural Overview |
| appraisal from an MAI appraiser reasonably acceptable to such special servicer within 30 days from receipt of the Requesting Holders’ written request. |
| Sale of Defaulted Loans: | Under certain circumstances the applicable special servicer may be required to use reasonable efforts to solicit offers for a defaulted serviced mortgage loan (and any related companion loan (to the extent provided under the related intercreditor agreement) and/or related REO properties).
The Directing Certificateholder will not have a right of first refusal to purchase a defaulted loan.
If the applicable special servicer does not receive an offer at least equal to the outstanding principal balance plus all accrued and unpaid interest and outstanding costs and expenses and certain other amounts specified in the pooling and servicing agreement (the “Par Purchase Price”), the applicable special servicer may purchase the defaulted loan or REO property at the Par Purchase Price or may accept the first cash offer received from any person that is determined to be a fair price for such defaulted loan or REO property. If multiple offers are received during the period designated by the applicable special servicer for receipt of offers, such special servicer is generally required to select the highest offer. The applicable special servicer will be required to determine whether any cash offer constitutes a fair price for any defaulted loan or REO property if the highest offeror is a person other than a party to the pooling and servicing agreement for this transaction (the “PSA”), the Directing Certificateholder, the Risk Retention Consultation Party, any sponsor, any Borrower Party, any independent contractor engaged by a special servicer, the trustee for the securitization of a related companion loan (with respect to a whole loan if it is a defaulted loan), any related companion loan holder or its representative, any holder of a related mezzanine loan or any known affiliate of any of the preceding entities (each, an “Interested Person”). If an offer is made by an Interested Person, the trustee will be required to determine (based upon the most recent appraisal conducted in accordance with the terms of the PSA) whether the offer constitutes a fair price for the defaulted loan or REO property unless (i) the offer is equal to or greater than the applicable Par Purchase Price and (ii) the offer is the highest offer received. Absent an offer at least equal to the Par Purchase Price, no offer from an Interested Person will constitute a fair price unless (x) it is the highest offer received and (y) at least two other offers are received from independent third parties. Neither the trustee nor any of its affiliates may make an offer for or purchase any specially serviced loan or REO property.
Notwithstanding any of the foregoing to the contrary, the applicable special servicer is not required to accept the highest offer and may accept a lower offer for a defaulted loan or REO property if such special servicer determines, in accordance with the Servicing Standard (and subject to the requirements of any related intercreditor agreement), that a rejection of such offer would be in the best interests of the certificateholders and any related companion loan holders as a collective whole as if they constituted a single lender (and with respect to a serviced A/B whole loan, taking into account the subordinate nature of any related subordinate companion loan), so long as such lower offer was not made by such special servicer or any of its affiliates.
If title to any mortgaged property is acquired by the trust fund, the applicable special servicer will generally be required to sell such mortgaged property prior to the close of the third calendar year beginning after the year of acquisition.
The foregoing applies to mortgage loans serviced under the PSA. With respect to any non-serviced whole loan, if the special servicer under the applicable pooling and servicing agreement determines to sell the related controlling companion loan if it becomes a defaulted loan, then the applicable special servicer will be required to sell the related whole loan, including the related mortgage loan included in the BANK 2021-BNK32 securitization trust and the related pari passu companion loan(s) and, under certain circumstances, any subordinate companion loan(s), as a single loan. In connection with any such sale, the special servicer under the applicable pooling and servicing agreement will be required to follow procedures substantially similar to those set forth above.
|
| Risk Retention Consultation Party: | A risk retention consultation party may be appointed by the holder or holders of more than 50% of the RR Interest, by certificate balance. The majority RR Interest holder will have a continuing right to appoint, remove or replace the risk retention consultation party in its sole discretion. This right may be exercised at any time and from time to time. Except with respect to an Excluded Loan as to such party or the holder of the majority of the RR Interest, the risk retention consultation party will be entitled to consult with the applicable special servicer, upon request of the risk retention consultation party, with respect to certain material servicing actions proposed by such special servicer; provided, that prior to the occurrence and continuance of a Consultation Termination Event, such mortgage loan must also be a specially serviced mortgage loan. |
| Appointment and Replacement of each Special Servicer: |
The Directing Certificateholder will appoint each initial special servicer as of the closing date. Prior to the occurrence and continuance of a Control Termination Event, any special servicer may generally be replaced by the Directing Certificateholder with or without cause at any time.
After the occurrence and during the continuance of a Control Termination Event and upon (a) the written direction of holders of principal balance certificates evidencing not less than 25% of the voting rights of all classes of certificates (other than the RR Interest) entitled to principal (taking into account the application of Cumulative Appraisal Reduction Amounts to notionally reduce the certificate balances of classes to which such Cumulative Appraisal Reduction Amounts are allocable) requesting a vote to replace the applicable special servicer with a replacement special servicer, (b) payment by such requesting holders to the certificate administrator of all reasonable fees and expenses to be incurred by the certificate administrator in connection with administering such vote and (c) delivery by such holders of a rating agency confirmation from each applicable rating agency, the certificate administrator will be required to promptly post such notice on its internet website and by mail and conduct the solicitation of votes of all certificates in such regard, which requisite affirmative votes must be received within 180 days of the posting of such notice. Upon the written direction of holders of at least 66 |
This is not a research report and was not prepared by any Underwriter’s research department. Please see additional important information and qualifications at the end of this Term Sheet.
18
| BANK 2021-BNK32 | Structural Overview |
2/3% of a Certificateholder Quorum, the trustee will be required to immediately replace the applicable special servicer with a qualified replacement special servicer designated by such holders of certificates.
After the occurrence and during the continuance of a Consultation Termination Event, if the operating advisor determines that the applicable special servicer is not performing its duties as required under the pooling and servicing agreement or is otherwise not acting in accordance with the Servicing Standard, the operating advisor may also recommend the replacement of such special servicer. The operating advisor’s recommendation to replace such special servicer must be confirmed by an affirmative vote of holders of principal balance certificates evidencing at least a majority of the aggregate voting rights (taking into account the application of any Cumulative Appraisal Reduction Amounts to notionally reduce the respective certificate balances) of all principal balance certificates on an aggregate basis (which requisite affirmative vote must be received within 180 days of posting of the notice of the operating advisor’s recommendation to the certificate administrator’s website).
A “Certificateholder Quorum” means, in connection with any solicitation of votes in connection with the replacement of a special servicer or the asset representations reviewer, the holders of certificates evidencing at least 50% of the aggregate voting rights (taking into account the application of realized losses and, other than with respect to the termination of the asset representations reviewer, any Cumulative Appraisal Reduction Amounts to notionally reduce the certificate balance of the certificates) of all classes of certificates entitled to principal (other than the RR Interest) on an aggregate basis.
With respect to each serviced whole loan, any holder of a related pari passu companion loan, following a servicer termination event with respect to the applicable special servicer that affects such holder, will be entitled to direct the trustee (and the trustee will be required) to terminate such special servicer solely with respect to such serviced whole loan. A replacement special servicer will be selected by the trustee or, prior to a Control Termination Event, by the Directing Certificateholder; provided, that any successor special servicer appointed to replace the special servicer with respect to such whole loan cannot be the entity (or its affiliate) that was terminated at the direction of the holder of the related pari passu companion loan.
Notwithstanding any of the foregoing to the contrary, with respect to each servicing shift whole loan and any serviced A/B whole loans as to which a subordinate companion loan holder is the related controlling note holder, the holder of the related control note will be entitled to replace the applicable special servicer with respect to such whole loan at any time, with or without cause, and while it is a serviced whole loan, no other party may replace the applicable special servicer for such whole loan unless there is a servicer termination event with respect thereto.
With respect to any non-serviced whole loan, subject to conditions or restrictions in the applicable intercreditor agreement, the BANK 2021-BNK32 trust, as holder of the related mortgage loan, has the right to terminate the applicable special servicer under the related pooling and servicing agreement if a servicer termination event occurs, with respect to such special servicer that affects the trust in its capacity as such holder. Such rights may be exercised by the Directing Certificateholder prior to a Consultation Termination Event (or the applicable special servicer, following the occurrence and during the continuance of a Consultation Termination Event). The successor special servicer will be selected pursuant to the applicable pooling and servicing agreement by the related directing holder prior to a control termination event under such pooling and servicing agreement. |
| Servicing Standard: | Each applicable master servicer and each applicable special servicer is obligated to service and administer the mortgage loans (and, if applicable, the serviced companion loans) in accordance with the definition of the “Servicing Standard” described in the Preliminary Prospectus and the terms of the pooling and servicing agreement, provided that each non-serviced mortgage loan, if any, will be serviced by another master servicer or special servicer under the pooling and servicing agreement with respect to the securitization of a related companion loan, which entities will be obligated to service and administer such non-serviced mortgage loan pursuant to a similar standard set forth in the related pooling and servicing agreement. |
| Excluded Special Servicer: | If a special servicer obtains knowledge that it has become a Borrower Party with respect to any mortgage loan (an “Excluded Special Servicer Loan”), such special servicer will be required to resign as special servicer of that Excluded Special Servicer Loan. Prior to the occurrence and continuance of a Control Termination Event, the Directing Certificateholder will be required to appoint (and may remove and replace with or without cause) a separate special servicer that is not a Borrower Party (an “Excluded Special Servicer”) with respect to any Excluded Special Servicer Loan, unless such Excluded Special Servicer Loan is also an Excluded Loan with respect to the Directing Certificateholder or the holder of the majority of the Controlling Class. After the occurrence and during the continuance of a Control Termination Event, if at any time the applicable Excluded Special Servicer Loan is also an Excluded Loan with respect to the Directing Certificateholder or the holder of the majority of the Controlling Class or if the Directing Certificateholder is entitled to appoint the Excluded Special Servicer but does not so appoint within 30 days of notice of such resignation, the resigning special servicer will be required to use reasonable efforts to select the related Excluded Special Servicer. Any Excluded Special Servicer will be required to perform all of the obligations of the applicable special servicer and will be entitled to all special servicing compensation with respect to such Excluded Special Servicer Loan earned while the related mortgage loan is an Excluded Special Servicer Loan. |
| Liquidated Loan Waterfall: | On liquidation of any mortgage loan, all net liquidation proceeds related to the mortgage loan (but not any related companion loan) will be applied so that amounts allocated as a recovery of accrued and unpaid interest will not, in the first instance, include any delinquent interest that was not advanced as a result of Appraisal Reduction Amounts (or would not have been advanced in the absence of a non-recoverability determination) or accrued on the portion of the stated principal balance thereof equal to any related Collateral |
This is not a research report and was not prepared by any Underwriter’s research department. Please see additional important information and qualifications at the end of this Term Sheet.
19
| BANK 2021-BNK32 | Structural Overview |
| Deficiency Amount in effect from time to time and as to which no advance was made (collectively, the “Subordinated Interest Amount”). After the adjusted interest amount is so allocated, any remaining liquidation proceeds will be allocated to pay principal on the mortgage loan until the unpaid principal amount of the mortgage loan has been reduced to zero. Any remaining liquidation proceeds will then be allocated to pay the Subordinated Interest Amount. | |
| Operating Advisor: | The operating advisor will be required to perform certain review duties if a Control Termination Event has occurred and is continuing, which will generally include a limited annual review of, and the preparation of a report regarding, certain actions of the applicable special servicer with respect to the resolution and/or liquidation of specially serviced loans. The review and report generally will be based on any asset status reports and additional information delivered to the operating advisor by such special servicer. In addition, if a Control Termination Event has occurred and is continuing, the applicable special servicer must consult with the operating advisor (in addition to the Directing Certificateholder if no Consultation Termination Event has occurred and is continuing) in connection with major decisions with respect to mortgage loans. Furthermore, under certain circumstances, but only if a Consultation Termination Event has occurred and is continuing, the operating advisor may recommend the replacement of the applicable special servicer as described above under “—Appointment and Replacement of each Special Servicer”; however, the operating advisor will not have any rights or obligations with respect to a non-serviced whole loan.
If a Consultation Termination Event has occurred and is continuing, the operating advisor may be removed and replaced without cause upon the affirmative direction of certificates owners holding not less than 75% of the voting rights of all certificates (taking into account the application of Cumulative Appraisal Reduction Amounts), following a proposal from certificate owners holding not less than 25% of the voting rights of all certificates (taking into account the application of Cumulative Appraisal Reduction Amounts). The certificateholders who initiate a vote on a termination and replacement of the operating advisor without cause must cause the payment of the fees and expenses incurred in the replacement. In addition, in the event there are no classes of certificates outstanding other than the Control Eligible Certificates, the RR Interest and the Class X-F, Class F, Class X-G, Class X-H, Class V and Class R certificates, then all of the rights and obligations of the operating advisor under the PSA will terminate without payment of any penalty or termination fee (other than any rights or obligations that accrued prior to the date of such termination (including accrued and unpaid compensation) and other than indemnification rights arising out of events occurring prior to such termination). See “Pooling and Servicing Agreement—The Operating Advisor—Termination of the Operating Advisor Without Cause” in the Preliminary Prospectus.
|
| Asset Representations Reviewer: | The asset representations reviewer will be required to review certain delinquent mortgage loans (excluding a mortgage loan for which a Payment Accommodation has been made and the related borrower is complying with the terms of such Payment Accommodation) after a specified delinquency threshold has been met and the required percentage of certificateholders vote to direct a review as described below. The asset representations reviewer will be entitled to the Asset Representations Reviewer Fee with respect to such review. See “Pooling and Servicing Agreement—The Asset Representations Reviewer” in the Preliminary Prospectus.
The certificate administrator will be required to notify certificateholders if the specified delinquency threshold has been met as described in the Preliminary Prospectus under “—The Asset Representations Reviewer”.
If certificateholders evidencing not less than 5.0% of the voting rights request a vote to commence an asset review, and if subsequently (i) a majority of those certificateholders who cast votes and (ii) a majority of an Asset Review Quorum authorizes an asset review within 150 days of the request for a vote, the asset representations reviewer will be required to conduct an asset review of delinquent loans.
The asset representations reviewer may be terminated and replaced without cause. Upon (i) the written direction of certificateholders evidencing not less than 25% of the voting rights (without regard to the application of any Cumulative Appraisal Reduction Amounts) requesting a vote to terminate and replace the asset representations reviewer with a proposed successor asset representations reviewer that is an eligible asset representations reviewer, and (ii) payment by such holders to the certificate administrator of the reasonable fees and expenses to be incurred by the certificate administrator in connection with administering such vote, the certificate administrator will be required to promptly provide notice to all certificateholders and the asset representations reviewer of such request by posting such notice on its internet website, and by mailing such notice to all certificateholders and the asset representations reviewer. Upon the written direction of certificateholders evidencing at least 75% of a Certificateholder Quorum (without regard to the application of any Cumulative Appraisal Reduction Amounts), the trustee will be required to terminate all of the rights and obligations of the asset representations reviewer under the pooling and servicing agreement (other than any rights or obligations that accrued prior to the date of such termination and other than indemnification rights arising out of events occurring prior to such termination) by written notice to the asset representations reviewer, and the proposed successor asset representations reviewer will be appointed. See “Pooling and Servicing Agreement—The Asset Representations Reviewer” in the Preliminary Prospectus.
An “Asset Review Quorum” means, in connection with any solicitation of votes to authorize an Asset Review as described above, the holders of certificates evidencing at least 5.0% of the aggregate voting rights represented by all certificates that have voting rights.
|
| Dispute Resolution Provisions: | The mortgage loan sellers will be subject to the dispute resolution provisions set forth in the PSA to the extent those provisions are triggered with respect to any mortgage loan sold to the depositor by a mortgage loan seller, and such mortgage loan seller will be obligated under the related mortgage loan purchase agreement to comply with all applicable provisions and to take part in any mediation or arbitration proceedings that may result. Generally, in the event that a Repurchase Request is not “Resolved” within 180 days after the related |
This is not a research report and was not prepared by any Underwriter’s research department. Please see additional important information and qualifications at the end of this Term Sheet.
20
| BANK 2021-BNK32 | Structural Overview |
mortgage loan seller receives such Repurchase Request, then the enforcing servicer will be required to send a notice to the first certificateholder (or beneficial owner) to deliver a certificateholder repurchase request with respect to the mortgage loan (the “Initial Requesting Certificateholder”) (if any) and to the certificate administrator (which will be required to make such notice available to certificateholders via the certificate administrator’s website) indicating the enforcing servicer’s intended course of action with respect to the Repurchase Request. If (a) the enforcing servicer’s intended course of action with respect to the Repurchase Request does not involve pursuing further action to exercise rights against the related mortgage loan seller with respect to the Repurchase Request and the Initial Requesting Certificateholder, if any, or any other certificateholder or certificate owner wishes to exercise its right to refer the matter to mediation (including nonbinding arbitration) or arbitration, or (b) the enforcing servicer’s intended course of action is to pursue further action to exercise rights against the related mortgage loan seller with respect to the Repurchase Request but the Initial Requesting Certificateholder, if any, or any other certificateholder or certificate owner does not agree with the dispute resolution method selected by the enforcing servicer, then the Initial Requesting Certificateholder, if any, or such other certificateholder or certificate owner may deliver a written notice to the enforcing servicer indicating its intent to exercise its right to refer the matter to either mediation or arbitration.
“Resolved” means, with respect to a Repurchase Request, (i) that the related material defect or breach has been cured, (ii) the related mortgage loan has been repurchased in accordance with the related mortgage loan purchase agreement, (iii) a mortgage loan has been substituted for the related mortgage loan in accordance with the related mortgage loan purchase agreement, (iv) the applicable mortgage loan seller has made a loss of value payment, (v) a contractually binding agreement has been entered into between the enforcing servicer, on behalf of the issuing entity, and the related mortgage loan seller that settles the related mortgage loan seller’s obligations under the related mortgage loan purchase agreement, or (vi) the related mortgage loan is no longer property of the issuing entity as a result of a sale or other disposition in accordance with the pooling and servicing agreement. See “Pooling and Servicing Agreement—Dispute Resolution Provisions” in the Preliminary Prospectus. |
| Investor Communications: | The certificate administrator is required to include on any Form 10-D any request received from a certificateholder to communicate with other certificateholders related to certificateholders exercising their rights under the terms of the PSA. Any certificateholder wishing to communicate with other certificateholders regarding the exercise of its rights under the terms of the PSA will be able to deliver a written request signed by an authorized representative of the requesting investor to the certificate administrator. |
| Deal Website: | The certificate administrator will be required to maintain a deal website which will include, among other items: (a) summaries of asset status reports prepared by a special servicer, (b) inspection reports, (c) appraisals, (d) various “special notices” described in the Preliminary Prospectus, (e) the “Investor Q&A Forum” and (f) a voluntary “Investor Registry”. Investors may access the deal website following execution of a certification and confidentiality agreement. |
This is not a research report and was not prepared by any Underwriter’s research department. Please see additional important information and qualifications at the end of this Term Sheet.
21
| BANK 2021-BNK32 | Collateral Overview |
| Mortgage Loan Sellers | No. of Mortgage Loans | No. of Mortgaged Properties | Aggregate Cut-off Date Balance | % of Pool(1) |
| Bank of America, National Association | 14 | 49 | $330,584,900 | 36.5% |
| Morgan Stanley Mortgage Capital Holdings LLC | 23 | 25 | $328,340,000 | 36.3% |
| Wells Fargo Bank, National Association | 9 | 14 | $185,852,676 | 20.5% |
| National Cooperative Bank, National Association(2) | 18 | 18 | $60,005,395 | 6.6% |
| Total: | 64 | 106 | $904,782,971 | 100.0% |
Pool Statistics
| Aggregate Cut-off Date Balance: | $904,782,971 |
| Number of Mortgage Loans: | 64 |
| Average Cut-off Date Balance per Mortgage Loan: | $14,137,234 |
| Number of Mortgaged Properties: | 106 |
| Average Cut-off Date Balance per Mortgaged Property: | $8,535,688 |
| Weighted Average Mortgage Rate: | 3.2847% |
| % of Pool Secured by 5 Largest Mortgage Loans: | 43.8% |
| % of Pool Secured by 10 Largest Mortgage Loans: | 59.5% |
| % of Pool Secured by ARD Loans(3): | 0.0% |
| Weighted Average Original Term to Maturity (months)(3): | 118 |
| Weighted Average Remaining Term to Maturity (months)(3): | 116 |
| Weighted Average Seasoning (months): | 2 |
| % of Pool Secured by Single Tenant Mortgaged Properties: | 21.8% |
| % of Pool Secured by Refinance Loans: | 60.4% |
| % of Pool Secured by Recapitalization Loans: | 20.7% |
| % of Pool Secured by Acquisition Loans: | 15.7% |
| % of Pool Secured by Recapitalization/Acquisition Loans: | 3.3% |
Additional Debt
| % of Pool with Pari Passu Mortgage Debt: | 42.8% |
| % of Pool with Subordinate Mortgage Debt(4): | 17.8% |
| % of Pool with Mezzanine Debt: | 7.8% |
Credit Statistics(5)(6)
| Weighted Average UW NOI DSCR: | 3.61x |
| Weighted Average UW NOI Debt Yield(7): | 12.6% |
| Weighted Average UW NCF DSCR: | 3.46x |
| Weighted Average UW NCF Debt Yield(7): | 12.1% |
| Weighted Average Cut-off Date LTV Ratio(7)(8): | 50.1% |
| Weighted Average Maturity Date LTV Ratio(3)(8): | 48.7% |
Footnotes are set forth on the following page.
This is not a research report and was not prepared by any Underwriter’s research department. Please see additional important information and qualifications at the end of this Term Sheet.
22
| BANK 2021-BNK32 | Collateral Overview |
Amortization
| Weighted Average Original Amortization Term (months)(9): | 365 |
| Weighted Average Remaining Amortization Term (months)(9): | 365 |
| % of Pool Interest Only through Maturity: | 78.5% |
| % of Pool Interest Only followed by Amortizing Balloon: | 16.4% |
| % of Pool Amortizing Balloon: | 5.0% |
| % of Pool Fully Amortizing: | 0.1% |
Lockboxes
| % of Pool with Hard Lockboxes: | 43.4% |
| % of Pool with Springing Lockboxes: | 41.2% |
| % of Pool with No Lockboxes: | 8.3% |
| % of Pool with Soft Lockboxes: | 7.1% |
Reserves
| % of Pool Requiring Tax Reserves: | 57.2% |
| % of Pool Requiring Insurance Reserves: | 19.1% |
| % of Pool Requiring Replacement Reserves: | 52.3% |
| % of Pool Requiring TI/LC Reserves(10): | 66.3% |
Call Protection
| % of Pool with lockout period, followed by defeasance until open period: | 69.6% |
| % of Pool with lockout period, followed by greater of a prepayment premium and yield maintenance, followed by defeasance or the greater of a prepayment premium and yield maintenance until open period: | 9.9% |
| % of Pool with no lockout period. The greater of a prepayment premium and yield maintenance, followed by defeasance or the greater of a prepayment premium and yield maintenance until open period: | 7.8% |
| % of Pool with no lockout period. Greater of a prepayment premium and yield maintenance followed by prepayment premium until open period: | 6.6% |
| % of Pool with lockout period, followed by the greater of a prepayment premium and yield maintenance until open period: | 4.1% |
| % of Pool with no lockout period. Yield maintenance, followed by defeasance or yield maintenance until open period: | 1.8% |
| (1) | Unless otherwise indicated, all references to “% of Pool” in this Term Sheet reflect a percentage of the aggregate principal balance of the mortgage pool as of the Cut-off Date, after application of all payments of principal due during or prior to March 2021. |
| (2) | Sixteen (16) of the eighteen (18) mortgage loans for which National Cooperative Bank, N.A. is the mortgage loan seller were originated by its parent company, National Consumer Cooperative Bank, and transferred to National Cooperative Bank, N.A. Each such mortgage loan originated by National Consumer Cooperative Bank was underwritten pursuant to National Cooperative Bank, N.A.’s underwriting guidelines. |
| (3) | With respect to any ARD Loan, unless otherwise indicated, references in this Term Sheet to the applicable “maturity date” or “maturity” refer to the applicable anticipated repayment date with respect to such ARD Loan, and such applicable anticipated repayment date is treated as its maturity date for all purposes hereof. |
| (4) | Fifteen (15) of the mortgage loans, each of which is secured by a residential cooperative property, currently have in place subordinate secured lines of credit to the related mortgage borrowers that permit future advances (such loans, collectively, the “Subordinate Coop LOCs”). The percentage figure expressed as “% of Pool with Subordinate Mortgage Debt” is determined as a percentage of the initial pool balance and does not take into account any Subordinate Coop LOCs and future subordinate debt (whether or not secured by the mortgaged property), if any, that may be permitted under the terms of any mortgage loan or the pooling and servicing agreement. See “Description of the Mortgage Pool—Additional Indebtedness—Other Secured Indebtedness” and “Description of the Mortgage Pool—Additional Debt Financing for Mortgage Loans Secured by Residential Cooperatives” in the Preliminary Prospectus. |
| (5) | With respect to any mortgage loan that is part of a whole loan, unless otherwise indicated, all LTV, DSCR and Debt Yield calculations in this Term Sheet include any related pari passu companion loans and exclude any subordinate companion loans, as applicable. Additionally, LTV, DSCR and Debt Yield figures in this Term Sheet are calculated for mortgage loans without regard to any additional indebtedness that may be incurred at a future date. For mortgaged properties securing residential cooperative mortgage loans all LTV, DSCR and Debt Yield calculations do not take into account any subordinate debt (whether or not secured by the related mortgaged property), that currently exists or is allowed under the terms of any mortgage loan. With respect to any leased fee loans, the SF/Units and Balance per SF/Unit figures in this Term Sheet are based on the size of the non-collateral improvements. |
| (6) | For mortgaged properties securing residential cooperative mortgage loans, all DSCR and Debt Yield calculations for each such mortgaged property is calculated using underwritten net operating Income or underwritten net cash flow, as applicable, for the related residential cooperative property which is the projected net operating income or net cash flow, as applicable, reflected in the most recent appraisal obtained by or otherwise in the possession of the related mortgage loan seller as of the Cut-off Date. All LTV ratio calculations are based upon the appraised value of the residential cooperative property determined as if such residential cooperative property is operated as a residential cooperative, inclusive of the amount of the underlying debt encumbering such residential cooperative property. |
| (7) | With respect to certain mortgage loans, debt yields and LTVs (such as, for example, UW NOI Debt Yield, UW NCF Debt Yield or Cut-off Date LTV Ratio) have been calculated based on a principal balance that is net of a holdback or earnout reserve. Such mortgage loans are identified under the definitions of “Underwritten NOI Debt Yield”, “Underwritten NCF Debt Yield” and “Cut-off Date LTV Ratio” set forth under “Description of the Mortgage Pool—Certain Calculations and Definitions” in the Preliminary Prospectus. |
| (8) | The LTV ratios set forth in this Term Sheet are generally based on the “as-is” values of the related mortgaged properties; provided that the “as-is” value for a portfolio of mortgaged properties may include a premium relating to the valuation of the mortgaged properties as a whole rather than as the sum of individually valued mortgaged properties; provided, further, that such LTV ratios may be based on “as-stabilized”, “as complete” or other contingent values in certain cases in which reserves have been established at origination for the applicable condition or circumstance that is expected to result in stabilization provided, further, that such LTV ratios may have been calculated based on a principal balance that is net of a holdback or earnout reserve. See the definition of “Appraised Value” under “Description of the Mortgage Pool—Certain Calculations and Definitions” in the Preliminary Prospectus. |
| (9) | Excludes mortgage loans that provide for payments of interest only through the related maturity date or anticipated repayment date, as applicable. |
| (10) | Excludes hospitality, multifamily, manufactured housing, leased fee and self storage properties. |
This is not a research report and was not prepared by any Underwriter’s research department. Please see additional important information and qualifications at the end of this Term Sheet.
23
| BANK 2021-BNK32 | Collateral Overview |
COVID-19 Update(1)
The following table contains information regarding the status of the mortgage loans and mortgaged properties provided by the respective borrowers as of the date set forth in the “Information as of Date” column. The cumulative effects of the COVID-19 emergency on the global economy may cause tenants to be unable to pay their rent and borrowers to be unable to pay debt service under the mortgage loans. As a result, we cannot assure you that the information in the following table is indicative of future performance or that tenants or borrowers will not seek rent or debt service relief (including forbearance arrangements) or other lease or loan modifications in the future. Such actions may lead to shortfalls and losses on the certificates. Any information in the following table will be superseded by the information contained under the heading “Description of the Mortgage Pool—COVID Considerations” in the Preliminary Prospectus.
Loan No. | Mortgage Loan Seller | Info. as of Date | Origination Date | Property Name | Property Type | Lease Modification or Rent Relief Requested (Y/N) | Tenants Making Full January Rent Payment (% NRA)(1) | Tenants Making Full January Rent Payment (% of UW rent)(1) | Tenants Making Full February Rent Payment (% NRA)(1) | Tenants Making Full February Rent Payment (% of UW rent)(1) |
| 1 | WFB | 2/23/2021 | 2/2/2021 | Pathline Park 9 & 10 | Office | N | N/A(4) | N/A(4) | N/A(4) | N/A(4) |
| 2 | BANA | 3/5/2021 | 2/28/2020 | Miami Design District(2) | Retail | Y(3) | 88.5% | 90.2% | 91.1% | 91.8% |
| 3 | BANA | 2/24/2021 | 3/1/2021 | Extra Space Rock ‘N Roll Self Storage Portfolio | Self Storage | N | 98.0% | 97.1% | 98.2% | 96.9% |
| 4 | MSMCH | 2/23/2021 | 11/20/2020 | 605 Third Avenue | Office | Y(5) | 93.5% | 94.1% | 92.9% | 93.5% |
| 5 | MSMCH | 2/22/2021 | 2/26/2021 | 530 Seventh Avenue Fee | Other | N | (6) | (6) | (6) | (6) |
| 6 | BANA | 2/25/2021 | 2/9/2021 | ExchangeRight Net Leased Portfolio #43 | Various | N | 100.0% | 100.0% | 100.0% | 100.0% |
| 7 | BANA | 2/26/2021 | 2/17/2021 | Boca Office Portfolio | Mixed Use | Y(7) | 94.0% | 95.0% | NAV | NAV |
| 8 | BANA | 2/11/2021 | 3/1/2021 | Park Del Amo | Office | Y(8) | 100.0% | 100.0% | 100.0% | 100.0% |
| 9 | MSMCH | 2/25/2021 | 3/3/2021 | Lakeshore Business Center | Office | Y(9) | 95.8%(10) | 95.8%(10) | 95.0%(10) | 95.0%(10) |
| 10 | BANA | 3/1/2021 | 3/4/2021 | Southern Flexible-Apartment Portfolio(11) | Multifamily | N | N/A | N/A | N/A | N/A |
| 11 | MSMCH | 2/16/2021 | 12/23/2020 | 250 Bedford Avenue | Retail | N | 100.0% | 100.0% | 100.0% | 100.0% |
| 12 | WFB | 3/1/2021 | 2/4/2021 | Lake Region Portfolio | Self Storage | N | 87.2% | 99.6% | 88.2% | 99.7% |
| 13 | MSMCH | 2/26/2021 | 2/4/2021 | Heath Town Center | Retail | Y(12) | 100.0% | 100.0% | 100.0% | 100.0% |
| 14 | WFB | 2/18/2021 | 11/13/2020 | McClellan Park | Industrial | Y(13) | 99.0% | 99.0% | 95.0% | 94.0% |
| 15 | MSMCH | 2/18/2021 | 1/26/2021 | 111 Fourth Avenue | Multifamily | N | 98.0% | 98.0% | 100.0% | 100.0% |
| 16 | WFB | 2/19/2021 | 2/4/2021 | Extra Space Storage - DC | Self Storage | N | N/A | 98.3% | N/A | 98.1% |
| 17 | MSMCH | 2/22/2021 | 3/4/2021 | 12900 I Street | Industrial | N | 100.0% | 100.0% | 100.0% | 100.0% |
| 18 | MSMCH | 2/18/2021 | 1/28/2021 | ASM America HQ | Industrial | N | 100.0% | 100.0% | 100.0% | 100.0% |
| 19 | WFB | 2/22/2021 | 2/3/2021 | Chapel Lakes | Multifamily | Y | 78.3% | 99.2% | 88.8% | 98.9% |
| 20 | MSMCH | 3/1/2021 | 1/28/2021 | Candlewood Apartments & Country Villas | Multifamily | N | 89.2% | 89.2% | N/A(14) | N/A(14) |
| 21 | WFB | 2/24/2021 | 2/9/2021 | El Paseo | Mixed Use | Y(15) | 41.3%(16) | 59.6% | 41.3%(16) | 57.8% |
| 22 | MSMCH | 2/18/2021 | 2/18/2021 | Olin Technology Administration Center | Office | N | 100.0% | 100.0% | 100.0% | 100.0% |
| 23 | MSMCH | 3/2/2021 | 1/25/2021 | North Austin Portfolio | Retail | Y(17) | 100.0% | 100.0% | 100.0% | 100.0% |
| 24 | NCB | 1/31/2021 | 2/19/2021 | Towne House Village North Owners, Inc. | Multifamily | N | 94.6%(18) | N/A(19) | N/A(18) | N/A(19) |
| 25 | MSMCH | 2/26/2021 | 2/26/2021 | 2 Boston Post Road | Industrial | N | 100.0% | 100.0% | 100.0% | 100.0% |
| 26 | WFB | 2/23/2021 | 2/23/2021 | Walgreens Sale-Leaseback Portfolio - NV,FL,TX | Retail | N | N/A(20) | N/A(20) | 100.0% | 100.0% |
| 27 | NCB | 2/26/2021 | 2/26/2021 | Valerie Arms Apartment Corp. | Multifamily | N | 99.2%(18) | N/A(19) | 97.2%(18) | N/A(19) |
| 28 | NCB | 1/31/2021 | 1/27/2021 | Blossom Gardens Apartments, Inc. | Multifamily | N | 85.9%(18) | N/A(19) | N/A(18) | N/A(19) |
| 29 | BANA | 2/26/2021 | 2/26/2021 | Extra Space Storage - Lompoc, CA | Self Storage | N | 94.4% | 94.1% | N/A(14) | N/A(14) |
| 30 | WFB | 2/18/2021 | 2/16/2021 | A Storage Place – Fort Collins | Self Storage | N | (21) | (21) | (21) | (21) |
| 31 | MSMCH | 2/22/2021 | 1/27/2021 | Foley Cubesmart | Self Storage | N | 98.7% | 98.7% | N/A | N/A |
| 32 | MSMCH | 2/16/2021 | 2/26/2021 | Lowe's Cromwell | Other | N | 100.0% | 100.0% | 100.0% | 100.0% |
| 33 | MSMCH | 2/11/2021 | 1/19/2021 | CVS-Walgreens Portfolio | Retail | N | 100.0% | 100.0% | 100.0% | 100.0% |
| 34 | MSMCH | 2/26/2021 | 2/18/2021 | Winding Way Apartments | Multifamily | N | 90.4% | 90.4% | 90.4% | 90.4% |
| 35 | MSMCH | 2/16/2021 | 2/12/2021 | Yuba City 99 Self Storage | Self Storage | N | 98.7% | 98.7% | N/A(14) | N/A(14) |
| 36 | MSMCH | 3/1/2021 | 2/26/2021 | Summer Haven MHP | Manufactured Housing | N | 100.0% | 100.0% | 100.0% | 100.0% |
| 37 | BANA | 2/24/2021 | 2/25/2021 | Lockaway Self Storage - Castro Valley, CA | Self Storage | N | 100.0% | 100.0% | 98.6% | 97.2% |
| 38 | MSMCH | 2/16/2021 | 1/26/2021 | CVS Bartlesville OK | Retail | N | 100.0% | 100.0% | 100.0% | 100.0% |
| 39 | WFB | 2/22/2021 | 2/5/2021 | WAG - Aurora, CO | Retail | N | 100.0% | 100.0% | 100.0% | 100.0% |
| 40 | BANA | 2/24/2021 | 1/28/2021 | Woodland Park Self Storage, Sheridan, WY | Self Storage | N | 99.2% | 97.4% | 96.8% | 97.7% |
| 41 | MSMCH | 3/1/2021 | 3/3/2021 | Holiday Acres MHP | Manufactured Housing | N | 96.4% | 96.4% | 97.1% | 97.1% |
This is not a research report and was not prepared by any Underwriter’s research department. Please see additional important information and qualifications at the end of this Term Sheet.
24
| BANK 2021-BNK32 | Collateral Overview |
COVID-19 Update Continued(1)
Loan No. | Mortgage Loan Seller | Info. as of Date | Origination Date | Property Name | Property Type | Lease Modification or Rent Relief Requested (Y/N) | Tenants Making Full January Rent Payment (% NRA)(1) | Tenants Making Full January Rent Payment (% of UW rent)(1) | Tenants Making Full February Rent Payment (% NRA)(1) | Tenants Making Full February Rent Payment (% of UW rent)(1) |
| 42 | MSMCH | 2/18/2021 | 2/23/2021 | 52 Ludlow Street | Multifamily | N | 81.0% | 88.5% | N/A(14) | N/A(14) |
| 43 | BANA | 2/24/2021 | 1/20/2021 | Stuff Ur Storage Henderson, NV | Self Storage | N | 99.7% | 99.9% | N/A(14) | N/A(14) |
| 44 | BANA | 2/25/2021 | 1/8/2021 | 16680 Valley View Avenue Data Center | Other | N | 100.0% | 100.0% | 100.0% | 100.0% |
| 45 | NCB | 1/31/2021 | 2/23/2021 | Tee-Lex Operating Inc. | Multifamily | N | 93.7%(18) | N/A(19) | N/A(18) | N/A(19) |
| 46 | NCB | 2/28/2021 | 1/28/2021 | 30 Clinton Place Owners, Inc. | Multifamily | N | 94.1%(18) | N/A(19) | 76.5%(18) | N/A(19) |
| 47 | MSMCH | 2/26/2021 | 2/18/2021 | Gold Creek Apartments | Multifamily | N | 98.6% | 98.6% | 98.6% | 98.6% |
| 48 | BANA | 3/3/2021 | 1/22/2021 | Storelocal - Coeur d'Alene, ID | Self Storage | N | 95.9% | 95.2% | N/A(14) | N/A(14) |
| 49 | NCB | 1/31/2021 | 1/29/2021 | Larchmont Gables Apartment Corp. | Multifamily | N | 85.4%(18) | N/A(19) | N/A(18) | N/A(19) |
| 50 | NCB | 2/28/2021 | 3/4/2021 | 305 Equities Corp. | Multifamily | N | 89.6%(18) | N/A(19) | 93.8%(18) | N/A(19) |
| 51 | BANA | 3/2/2021 | 2/10/2021 | Glenview Mobile Lodge Community | Manufactured Housing | N | 100.0% | 100.0% | 98.0% | 98.1% |
| 52 | NCB | 2/26/2021 | 2/26/2021 | 511 West 232nd Owners Corp. | Multifamily | N | 97.0%(18) | N/A(19) | 93.9%(18) | N/A(19) |
| 53 | NCB | 2/26/2021 | 1/29/2021 | Shore Lane Arms Owners Corp. | Multifamily | N | 93.9%(18) | N/A(19) | 92.9%(18) | N/A(19) |
| 54 | MSMCH | 2/24/2021 | 3/3/2021 | 69 Meserole Avenue | Multifamily | N | 100.0% | 100.0% | 100.0% | 100.0% |
| 55 | NCB | 2/26/2021 | 2/24/2021 | 267 W. 89 Owners Corp. | Multifamily | N | 96.9%(18) | N/A(19) | 93.8%(18) | N/A(19) |
| 56 | NCB | 2/28/2021 | 2/24/2021 | 169 Spring Owners Corp. | Multifamily | N | 91.7%(18) | N/A(19) | 75.0%(18) | N/A(19) |
| 57 | NCB | 2/22/2021 | 1/28/2021 | 14 Jay Street Owners Corp. | Multifamily | N | 100.0%(18) | N/A(19) | 71.4%(18) | N/A(19) |
| 58 | NCB | 2/24/2021 | 2/11/2021 | 327-329 4th St. Owners Corp. | Multifamily | N | 100.0%(18) | N/A(19) | 100.0%(18) | N/A(19) |
| 59 | NCB | 2/26/2021 | 1/26/2021 | 210 Equities Corp. | Multifamily | N | 92.9%(18) | N/A(19) | 75.0%(18) | N/A(19) |
| 60 | NCB | 1/31/2021 | 2/23/2021 | 39-75 56th Street Owners Corp. | Multifamily | N | 79.2%(18) | N/A(19) | N/A(18) | N/A(19) |
| 61 | BANA | 3/2/2021 | 3/1/2021 | Squaw Valley Mobile Home Community | Manufactured Housing | N | 100.0% | 100.0% | 100.0% | 100.0% |
| 62 | NCB | 2/19/2021 | 1/29/2021 | Woodbury Gardens Redevelopment Company Owners Corp. | Multifamily | N | 97.7%(18) | N/A(19) | 93.0%(18) | N/A(19) |
| 63 | NCB | 2/26/2021 | 2/25/2021 | Parkway Owners Inc. | Multifamily | N | 98.0%(18) | N/A(19) | 92.2%(18) | N/A(19) |
| 64 | NCB | 2/15/2021 | 3/1/2021 | 91 Tenants Corp. | Multifamily | N | 100.0%(18) | N/A(19) | 97.2%(18) | N/A(19) |
Footnotes are set forth on the following page.
This is not a research report and was not prepared by any Underwriter’s research department. Please see additional important information and qualifications at the end of this Term Sheet.
25
| BANK 2021-BNK32 | Collateral Overview |
| (1) | All loans are current on their debt service payments or have a first payment date on April 1, 2021, and no forbearance or debt service relief has been requested by any related borrower except as noted in footnote 2 below. For all NCB mortgage loans, the first payment is either March 1, 2021 or April 1, 2021 (that payment is subject to a 10-day grace period and therefore may not be received until the 10th day of each month). |
| (2) | With respect to the Miami Design District mortgaged property, as of April 29, 2020, the borrower entered into a loan modification to defer debt service payments for May, June and July 2020, which are payable on the earlier of the maturity date or when the loan is paid in full. On December 1, 2020, the borrower deposited $10,474,740 (equal to 6.0 months of interest-only debt service on the Miami Design District Whole Loan) as a debt service reserve. The debt service reserve began being applied to debt service payments on January 1, 2021, and will continue to be applied to debt service payments on future payment dates, provided that no event of default is continuing. |
| (3) | With respect to the Miami Design District mortgaged property, two tenants (0.7% of NRA and 0.8% of underwritten base rent) fully or partially abated their rent for January and February 2021 as previously agreed upon with the related borrower. Sixteen tenants (9.5% of NRA and 8.9% of underwritten base rent) did not make rent payments in January 2021. Fourteen tenants (7.9% of NRA and 8.2% of underwritten base rent) did not make rent payments in February 2021. |
| (4) | With respect to the Pathline Park 9 & 10 mortgage property, the sole tenant has free rent through May 2021. All outstanding rent abatements were reserved for at loan origination. |
| (5) | With respect to the 605 Third Avenue mortgage loan, the borrower has reported that six tenants (16.8% of NRA and 15.6% of underwritten base rent) at the 605 Third Avenue Property have been granted deferrals of rent by the 605 Third Avenue Borrower. Five of the six tenants (16.1% of NRA and 14.5% of underwritten base rent) were granted between 3 and 5 months of deferred rent with repayment over fixed periods commencing on various dates in 2020 and 2021. One of the six tenants (0.7% of NRA and 1.1% of underwritten base rent) was granted deferred rent from January through June 2021, of which 50% was forgiven and the remaining deferred amount is required to be repaid across 24 monthly installments beginning January 1, 2022. |
| (6) | With respect to the 530 Seventh Avenue Fee mortgage loan, the 530 Seventh Avenue Fee ground lessee is current on its rent through December 2020 and has not requested any relief due to the COVID-19 pandemic. Ground lease payments are paid quarterly in arrears through March 2021 and the ground lease payments for January and February 2021 are expected to be paid in March 2021. After March 2021, ground lease payments are payable monthly. With regard to the underlying non-collateral improvements, twenty-seven tenants (40.8% of NRA and 45.8% of base rent) were granted some form of rent relief. Rent deferrals ranged between three and 16 months, with repayment over fixed periods commencing on various dates in 2020 and 2021. |
| (7) | With respect to the Boca Office Portfolio mortgaged property, at the beginning of COVID-19, the sponsor entered into deferral agreements with approximately 50+ tenants throughout the Boca Office Portfolio Properties. The vast majority of deferrals included one to three months of deferred rent and which was paid back by December 2020. |
| (8) | With respect to the Park Del Amo mortgaged property, one tenant, Thomas C. Penland (1.1% of NRA and 1.1% of underwritten base rent), abated 50% of its rent from November 2020 to February 2021, and has been underwritten as vacant by the lender. |
| (9) | With respect to the Lakeshore Business Center mortgage loan, one tenant (1.7% of NRA and 1.9% of underwritten rent) received deferred rent for the months of May and June 2020. |
| (10) | With respect to the Lakeshore Business Center mortgage loan, the collections figure are based on the amount that was billed for the respective month. |
| (11) | With respect to the Southern Flexible-Apartment Portfolio mortgaged property, aging reports are not utilized by property management as tenants typically pre-pay for their stays and are subsequently evicted if past their paid stay period |
| (12) | With respect to the Heath Town Center mortgage loan, all tenants have paid rent consistently since March 2020, with four tenants (11.7% of NRA and 19.7% of underwritten rent) having received relief in the form of forgivable loans from the City of Heath’s Economic Development Council. |
| (13) | With respect to the McClellan Park mortgaged property, six tenants, representing 5.7% of the NRA, have requested rent relief. |
| (14) | Given the timing of collection and reporting, an accurate estimate of the percentage of tenants paying rent in February is not available. |
| (15) | With respect to the El Paso mortgaged property, 11 tenant representing 57.6% of NRA and 62.8% of UW Rent, received rent abatements of 50-100% for 3-11 months. Of the tenants that received rent abatements, six tenants representing 30.3% of NRA and 30.0% of UW Rent, are required to repay the abated rent over a defined repayment period, while the rent abatements for the remaining tenants will be forgiven. |
| (16) | With respect to the El Paso mortgaged property, in addition to the tenants receiving rent relief, one tenant representing 11.5% of NRA and 12.7% of UW Rent, is in a 100% free rent period through March 2021. |
| (17) | With respect to the North Austin Portfolio mortgage loan, five tenants (14.6% of NRA and 13.5% of underwritten rent) received rent relief during 2020 and are in the process of repayment. Each of these tenants have returned to paying their rent in full. |
| (18) | For residential cooperative properties, the percentages reported were determined based on available cooperative maintenance receivables reports provided from the borrowers (although the borrowers were not required, pursuant to the loan documents, to furnish those reports). Generally, this information is not tracked for residential cooperative properties and the borrowers are not required, pursuant to the loan documents, to report this data on a monthly basis. In addition, for residential cooperative properties, the figures reported were determined based on revenue derived from maintenance charges payable by tenant-shareholders, and not based on rental income for commercial units as to which cooperative shares have not been allocated. Further, with respect to certain residential cooperative properties, the related cooperative borrower may have entered into a primary master lease with a third-party or the cooperative’s sponsor. Generally, however, information regarding subleases under such primary master leases are not tracked for residential cooperative properties. |
| (19) | This information is not presented for residential cooperative properties. The base rent represented in the underwritten cash flow for residential cooperative properties is the hypothetical income derived from the appraisal. Residential cooperative properties are structured to allow for an increase in unit owner maintenance charges or the assessment of additional charges to cover operating deficits, including deficits resulting from unpaid or delinquent rents or maintenance charges. |
| (20) | With respect to the Walgreens Sale-Leaseback Portfolio mortgaged properties, the leases commenced on February 23, 2021; therefore, no January rent was paid. |
| (21) | With respect to the A Storage Place - Fort Collins mortgaged property, as of February 18, 2021, approximately 0.8% of annual UW base rent was 30 or more days delinquent. |
This is not a research report and was not prepared by any Underwriter’s research department. Please see additional important information and qualifications at the end of this Term Sheet.
26
| BANK 2021-BNK32 | Characteristics of the Mortgage Loans |
| Top 10 Mortgage Loans or Groups of Cross-Collateralized Mortgage Loans(1) | |||||||||||||
| Loan No. | Mortgage Loan Seller | Property Name | City | State | Property Type | Cut-off Date Balance | % of Pool | SF/Units | Cut-off Date Balance per SF/Unit | UW NCF DSCR | UW NOI Debt Yield | Cut-off Date LTV | Maturity Date LTV |
| 1 | WFB | Pathline Park 9 & 10 | Sunnyvale | CA | Office | $90,000,000 | 9.9% | 242,226 | $536.69 | 3.87x | 10.2% | 51.8% | 51.8% |
| 2 | BANA | Miami Design District | Miami | FL | Retail | $90,000,000 | 9.9% | 497,094 | $804.68 | 2.14x | 9.3% | 46.7% | 46.7% |
| 3 | BANA | Extra Space Rock ‘N Roll Self Storage Portfolio | Various | Various | Self Storage | $90,000,000 | 9.9% | 1,186,768 | $91.00 | 2.56x | 8.8% | 57.9% | 57.9% |
| 4 | MSMCH | 605 Third Avenue | New York | NY | Office | $71,000,000 | 7.8% | 1,027,736 | $224.77 | 6.61x | 13.9% | 33.7% | 33.7% |
| 5 | MSMCH | 530 Seventh Avenue Fee | New York | NY | Other | $55,000,000 | 6.1% | 495,245 | $111.06 | 3.97x | 9.5% | 39.0% | 39.0% |
| 6 | BANA | ExchangeRight Net Leased Portfolio #43 | Various | Various | Various | $38,140,000 | 4.2% | 285,465 | $133.61 | 2.66x | 9.0% | 62.0% | 62.0% |
| 7 | BANA | Boca Office Portfolio | Boca Raton | FL | Mixed Use | $29,700,000 | 3.3% | 514,527 | $192.41 | 2.46x | 10.6% | 63.5% | 63.5% |
| 8 | BANA | Park Del Amo | Torrance | CA | Office | $28,140,000 | 3.1% | 205,312 | $137.06 | 3.62x | 12.1% | 67.0% | 67.0% |
| 9 | MSMCH | Lakeshore Business Center | Fort Lauderdale | FL | Office | $25,100,000 | 2.8% | 237,682 | $105.60 | 1.66x | 10.9% | 62.4% | 56.6% |
| 10 | BANA | Southern Flexible–Apartment Portfolio | Various | Various | Multifamily | $21,500,000 | 2.4% | 605 | $35,537.19 | 2.50x | 14.8% | 56.2% | 50.9% |
| Total/Wtd. Avg. | $538,580,000 | 59.5% | 3.40x | 10.5% | 51.1% | 50.6% | |||||||
| (1) | With respect to any mortgage loan that is part of a whole loan, unless otherwise indicated, all LTV, DSCR, Debt Yield and Balance per SF/Unit calculations in this Term Sheet include any related pari passu companion loans and exclude any subordinate companion loans, as applicable. Additionally, LTV, DSCR, Debt Yield and Balance per SF/Unit figures in this Term Sheet are calculated for mortgage loans without regard to any additional indebtedness that may be incurred at a future date. With respect to any leased fee loans, the SF/Units and Balance per SF/Unit figures in this Term Sheet are based on the size of the non-collateral improvements. |
This is not a research report and was not prepared by any Underwriter’s research department. Please see additional important information and qualifications at the end of this Term Sheet.
27
| BANK 2021-BNK32 | Characteristics of the Mortgage Loans |
| Mortgage Loans with Pari Passu Companion Loans | ||||||||||||
| Loan No. | Mortgage Loan Seller | Property Name | Mortgage Loan Cut-off Date Balance | Aggregate Pari Passu Companion Loan Cut-off Date Balance | Combined Cut-off Date Balance | Lead Servicing Agreement | Master Servicer | Special Servicer | Control Rights | Combined UW NCF DSCR(1) | Combined UW NOI Debt Yield(1) | Combined Cut-off Date LTV(1) |
| 1 | WFB | Pathline Park 9 & 10 | $90,000,000 | $40,000,000 | $130,000,000 | BANK 2021-BNK32 | Wells Fargo | Rialto | BANK 2021-BNK32 | 3.87x | 10.2% | 51.8% |
| 2 | BANA | Miami Design District | $90,000,000 | $310,000,000 | $400,000,000 | (2) | Wells Fargo | Greystone | (2) | 2.14x | 9.3% | 46.7% |
| 3 | BANA | Extra Space Rock ‘N Roll Self Storage Portfolio | $90,000,000 | $18,000,000 | $108,000,000 | BANK 2021-BNK32 | Wells Fargo | Rialto | BANK 2021-BNK32 | 2.56x | 8.8% | 57.9% |
| 4 | MSMCH | 605 Third Avenue | $71,000,000 | $160,000,000 | $231,000,000 | BANK 2020-BNK30 | Wells Fargo | Greystone | (3) | 6.61x | 13.9% | 33.7% |
| 7 | BANA | Boca Office Portfolio | $29,700,000 | $69,300,000 | $99,000,000 | BMARK 2021-B24 | Midland | Greystone | BMARK 2021-B24 | 2.46x | 10.6% | 63.5% |
| 14 | WFB | McClellan Park | $16,600,000 | $341,400,000 | $358,000,000 | BANK 2020-BNK30 | Wells Fargo | Greystone | BANK 2020-BNK30 | 2.90x | 10.5% | 60.2% |
| (1) | DSCR, Debt Yield and LTV calculations include any related pari passu companion loans and exclude any subordinate companion loans, as applicable. |
| (2) | The Miami Design District whole loan will be serviced pursuant to the BANK 2020-BNK30 pooling and servicing agreement until the securitization of the related promissory note A-1. The initial directing holder is the holder of the related promissory note B until the occurrence of a control appraisal event under the related intercreditor agreement, at which time the directing holder will be the directing certificateholder (or other designated party) under the related lead servicing agreement. See “Description of the Mortgage Pool—The Whole Loans—The Miami Design District Pari Passu-A/B Whole Loan” in the Preliminary Prospectus. |
| (3) | The initial directing holder is the holder of the related promissory note B-1 until the occurrence of a control appraisal event under the related intercreditor agreement, at which time the directing holder will be the directing certificateholder (or other designated party) under the related lead servicing agreement. See “Description of the Mortgage Pool—The Whole Loans—The 605 Third Avenue Pari Passu-A/B Whole Loan” in the Preliminary Prospectus. |
| Mortgage Loans with Subordinate Debt(1) | |||||||||||
| Loan No. | Mortgage Loan Seller | Property Name | Mortgage Loan Cut-off Date Balance | Cut-off Date Balance per SF | Subordinate Debt Cut-off Date Balance | UW NCF DSCR | UW NOI Debt Yield | Cut-off Date LTV | Whole Loan UW NCF DSCR(2) | Whole Loan UW NOI Debt Yield(2) | Whole Loan Cut-off Date LTV(2) |
| 2 | BANA | Miami Design District | $90,000,000 | $804.68 | $100,000,000 | 2.14x | 9.3% | 46.7% | 1.72x | 7.4% | 58.4% |
| 4 | MSMCH | 605 Third Avenue | $71,000,000 | $224.77 | $78,000,000 | 6.61x | 13.9% | 33.7% | 4.30x | 10.4% | 45.1% |
| (1) | In addition, fifteen (15) of the mortgage loans, each of which is secured by a residential cooperative property, currently have in place Subordinate Coop LOCs that permit future advances. See “Description of the Mortgage Pool—Additional Indebtedness—Other Secured Indebtedness” and “Description of the Mortgage Pool—Additional Debt Financing for Mortgage Loans Secured by Residential Cooperatives” in the Preliminary Prospectus. |
| (2) | Whole Loan UW NCF DSCR, Whole Loan UW NOI Debt Yield and Whole Loan Cut-off Date LTV figures shown above are calculated based on any related pari passu notes and any related subordinate note(s). |
| Mortgage Loans with Mezzanine Debt | |||||||||||
| Loan No. | Mortgage Loan Seller | Property Name | Mortgage Loan Cut-off Date Balance | Cut-off Date Balance per SF | Mezzanine Debt Cut-off Date Balance | UW NCF DSCR | UW NOI Debt Yield | Cut-off Date LTV | Total Debt UW NCF DSCR(1) | Total Debt UW NOI Debt Yield(1) | Total Debt Cut-off Date LTV(1) |
| 4 | MSMCH | 605 Third Avenue | $71,000,000 | $224.77 | $91,000,000 | 6.61x | 13.9% | 33.7% | 2.58x | 8.0% | 58.4% |
| (1) | Total Debt UW NCF DSCR, Total Debt UW NOI Debt Yield and Total Debt Cut-off Date LTV figures shown above are calculated based on any related pari passu notes, any related subordinate note(s) and the mezzanine debt. |
This is not a research report and was not prepared by any Underwriter’s research department. Please see additional important information and qualifications at the end of this Term Sheet.
28
| BANK 2021-BNK32 | Characteristics of the Mortgage Loans |
Mortgage Loans with Scheduled Balloon Payments and Related Classes(1)
| Class A-2 ($28,200,000) | ||||||||||||||||
| Loan No. | Mortgage Loan Seller | Property Name | State | Property Type | Cut-off Date Balance | % of Pool | Maturity Date Balance | % of Class A-2 Certificate Principal Balance | SF | Cut-off Date Balance per SF | UW NCF DSCR | UW NOI Debt Yield | Cut-off Date LTV | Maturity Date LTV | Rem. IO Period (mos.) | Rem. Term to Maturity (mos.) |
| 7 | BANA | Boca Office Portfolio | FL | Mixed Use | $29,700,000 | 3.3% | $29,700,000 | 105.3% | 514,527 | $192.41 | 2.46x | 10.6% | 63.5% | 63.5% | 60 | 60 |
| Total/Wtd. Avg. | $29,700,000 | 3.3% | $29,700,000 | 105.3% | 2.46x | 10.6% | 63.5% | 63.5% | 60 | 60 | ||||||
| (1) | The table above reflects the mortgage loans whose balloon payments will be applied to pay down the Class A-2 certificates, assuming (i) that none of the mortgage loans experience prepayments, defaults or losses; (ii) there are no extensions of maturity dates; and (iii) each mortgage loan is paid in full on its stated maturity date or, in the case of any mortgage loan with an anticipated repayment date, on such anticipated repayment date. The table above is otherwise based on the Structuring Assumptions set forth under “Yield and Maturity Considerations—Weighted Average Life” in the Preliminary Prospectus. |
Mortgage Loans with Scheduled Balloon Payments and Related Classes(1)
| Class A-3 ($16,672,500) | ||||||||||||||||
| Loan No. | Mortgage Loan Seller | Property Name | State | Property Type | Cut-off Date Balance | % of Pool | Maturity Date Balance | % of Class A-3 Certificate Principal Balance | SF | Cut-off Date Balance per SF | UW NCF DSCR | UW NOI Debt Yield | Cut-off Date LTV | Maturity Date LTV | Rem. IO Period (mos.) | Rem. Term to Maturity (mos.) |
| 18 | MSMCH | ASM America HQ | AZ | Industrial | $12,850,000 | 1.4% | $12,850,000 | 77.1% | 130,282 | $98.63 | 3.61x | 11.1% | 42.5% | 42.5% | 95 | 95 |
| 39 | WFB | WAG - Aurora, CO | CO | Retail | $4,700,000 | 0.5% | $4,700,000 | 28.2% | 14,121 | $332.84 | 2.04x | 8.5% | 61.8% | 61.8% | 83 | 83 |
| Total/Wtd. Avg. | $17,550,000 | 1.9% | $17,550,000 | 105.3% | 3.19x | 10.4% | 47.7% | 47.7% | 92 | 92 | ||||||
| (1) | The table above reflects the mortgage loans whose balloon payments will be applied to pay down the Class A-3 certificates, assuming (i) that none of the mortgage loans experience prepayments, defaults or losses; (ii) there are no extensions of maturity dates; and (iii) each mortgage loan is paid in full on its stated maturity date or, in the case of any mortgage loan with an anticipated repayment date, on such anticipated repayment date. The table above is otherwise based on the Structuring Assumptions set forth under “Yield and Maturity Considerations—Weighted Average Life” in the Preliminary Prospectus. |
This is not a research report and was not prepared by any Underwriter’s research department. Please see additional important information and qualifications at the end of this Term Sheet.
29
| BANK 2021-BNK32 | Characteristics of the Mortgage Loans |
| Prior Securitization History(1) | ||||||||||||||
| Loan No. | Mortgage Loan Seller | Property Name | City | State | Property Type | Cut-off Date Balance | % of Pool | SF/Units/Pads | Cut-off Date Balance per SF/Unit/Pad(3) | UW NCF DSCR(2)(3) | UW NOI Debt Yield(2)(3) | Cut-off Date LTV(2)(3) | Maturity Date LTV(2)(3) | Prior Securitization |
| 7.02 | BANA | Fountains Center | Boca Raton | FL | Mixed Use | $8,550,000 | 0.9% | 188,666 | $192.41 | 2.46x | 10.6% | 63.5% | 63.5% | GSMS 2014-GC26 |
| 9 | MSMCH | Lakeshore Business Center | Fort Lauderdale | FL | Office | $25,100,000 | 2.8% | 237,682 | $105.60 | 1.66x | 10.9% | 62.4% | 56.6% | RAITF 2016-FL6 |
| 19 | WFB | Chapel Lakes | Wetumpka | AL | Multifamily | $12,577,676 | 1.4% | 152 | $82,747.87 | 1.48x | 8.3% | 69.5% | 54.4% | FNA 2011-M8 |
| 36 | MSMCH | Summer Haven MHP | Forney | TX | Manufactured Housing | $5,000,000 | 0.6% | 106 | $47,169.81 | 1.34x | 8.3% | 66.2% | 58.2% | WFCM 2015-C31 |
| 41 | MSMCH | Holiday Acres MHP | Victoria | TX | Manufactured Housing | $4,530,000 | 0.5% | 137 | $33,065.69 | 1.32x | 8.2% | 72.9% | 62.4% | FREMF 2017-K67 |
| Total | $55,757,676 | 6.2% | ||||||||||||
| (1) | Includes mortgage loans for which all or a portion of the previously existing debt was most recently securitized in conduit securitizations, based on information provided by the related borrower or obtained through searches of a third-party database. The information has not otherwise been confirmed by the mortgage loan sellers. With respect to any mortgage loan that is part of a whole loan, unless otherwise indicated, all LTV, DSCR, Debt Yield and Cut-off Date Balance per SF/Unit/Pad calculations include any related pari passu companion loans and exclude any related subordinate companion loans, as applicable. |
| (2) | For mortgaged properties securing residential cooperative mortgage loans, the UW NCF DSCR and UW NOI Debt Yield for each such mortgaged property is calculated using underwritten net operating income or underwritten net cash flow, as applicable, for the related residential cooperative property which is the projected net operating income or net cash flow, as applicable, reflected in the most recent appraisal obtained by or otherwise in the possession of the related mortgage loan seller as of the Cut-off Date. LTV calculations are based upon the appraised value of the residential cooperative property determined as if such residential cooperative property is operated as a residential cooperative, inclusive of the amount of the underlying debt encumbering such residential cooperative property. |
| (3) | For properties that are part of a portfolio, the Cut-off Date Balance Per SF/Unit/Pad, UW NCF DSCR, UW NOI Debt Yield, Cut-off Date LTV and Maturity Date LTV calculations reflect the values of the portfolio as a whole. |
This is not a research report and was not prepared by any Underwriter’s research department. Please see additional important information and qualifications at the end of this Term Sheet.
30
| BANK 2021-BNK32 | Characteristics of the Mortgage Loans |
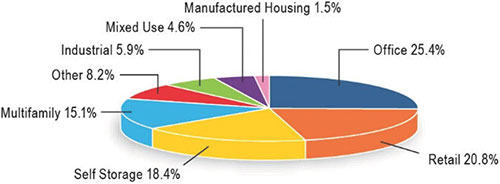
| Property Type Distribution(1) | ||||||||
| Property Type | Number of Mortgaged Properties | Aggregate Cut-off Date Balance | % of Pool | Wtd. Avg. Mortgage Rate | Wtd. Avg. UW NCF DSCR | Wtd. Avg. UW NOI Debt Yield | Wtd. Avg. Cut-off Date LTV | Wtd. Avg. Maturity Date LTV |
| Office | 7 | $230,260,426 | 25.4% | 2.6094% | 4.34x | 11.6% | 49.9% | 49.3% |
| Suburban | 4 | $154,940,000 | 17.1% | 2.8994% | 3.35x | 10.6% | 57.0% | 56.0% |
| CBD | 1 | $71,000,000 | 7.8% | 1.9375% | 6.61x | 13.9% | 33.7% | 33.7% |
| Medical Office | 2 | $4,320,426 | 0.5% | 3.2530% | 2.66x | 9.0% | 62.0% | 62.0% |
| Retail | 23 | $187,982,950 | 20.8% | 3.8299% | 2.22x | 9.3% | 53.2% | 52.4% |
| Luxury Retail | 1 | $90,000,000 | 9.9% | 4.1325% | 2.14x | 9.3% | 46.7% | 46.7% |
| Single Tenant | 18 | $49,682,950 | 5.5% | 3.4994% | 2.29x | 8.7% | 62.5% | 61.2% |
| Anchored | 2 | $36,800,000 | 4.1% | 3.5983% | 2.27x | 8.8% | 57.2% | 57.2% |
| Unanchored | 2 | $11,500,000 | 1.3% | 3.6300% | 2.34x | 13.9% | 51.6% | 43.1% |
| Self Storage | 29 | $166,929,900 | 18.4% | 3.4700% | 2.50x | 9.2% | 59.2% | 57.9% |
| Self Storage | 29 | $166,929,900 | 18.4% | 3.4700% | 2.50x | 9.2% | 59.2% | 57.9% |
| Multifamily | 29 | $136,833,071 | 15.1% | 3.3406% | 5.44x | 25.3% | 34.4% | 31.2% |
| Cooperative | 19 | $75,005,395 | 8.3% | 3.1095% | 7.99x | 36.8% | 14.5% | 12.8% |
| Garden | 4 | $33,777,676 | 3.7% | 3.5123% | 2.22x | 9.4% | 60.8% | 55.1% |
| Flexible Apartments | 4 | $21,500,000 | 2.4% | 3.8000% | 2.50x | 14.8% | 56.2% | 50.9% |
| Mid Rise | 2 | $6,550,000 | 0.7% | 3.5929% | 2.47x | 8.9% | 54.3% | 54.3% |
| Other | 5 | $73,871,624 | 8.2% | 2.6979% | 3.52x | 9.4% | 44.5% | 44.0% |
| Leased Fee | 4 | $69,721,624 | 7.7% | 2.6199% | 3.64x | 9.4% | 43.9% | 43.9% |
| Data Center | 1 | $4,150,000 | 0.5% | 4.0080% | 1.57x | 9.5% | 54.6% | 46.1% |
| Industrial | 4 | $53,450,000 | 5.9% | 3.5681% | 3.11x | 13.4% | 46.4% | 44.6% |
| Warehouse | 3 | $40,600,000 | 4.5% | 3.8175% | 2.95x | 14.1% | 47.7% | 45.3% |
| Flex/R&D | 1 | $12,850,000 | 1.4% | 2.7800% | 3.61x | 11.1% | 42.5% | 42.5% |
| Mixed Use | 5 | $41,700,000 | 4.6% | 3.8701% | 2.45x | 11.5% | 60.4% | 58.9% |
| Office/Retail | 4 | $29,700,000 | 3.3% | 4.0200% | 2.46x | 10.6% | 63.5% | 63.5% |
| Retail/Office/Multifamily | 1 | $12,000,000 | 1.3% | 3.4990% | 2.44x | 13.7% | 52.7% | 47.5% |
| Manufactured Housing | 4 | $13,755,000 | 1.5% | 4.6105% | 1.52x | 9.0% | 67.1% | 60.1% |
| Manufactured Housing | 4 | $13,755,000 | 1.5% | 4.6105% | 1.52x | 9.0% | 67.1% | 60.1% |
| Total/Wtd. Avg. | 106 | $904,782,971 | 100.0% | 3.2847% | 3.46x | 12.6% | 50.1% | 48.7% |
| (1) | All numerical information concerning the mortgage loans is approximate and, in the case of mortgage loans secured by multiple properties, is based on allocated loan amounts with respect to such properties. All weighted average information regarding the mortgage loans reflects the weighting of the mortgage loans based on their outstanding principal balances as of the Cut-off Date or, in the case of mortgage loans secured by multiple properties, allocated loan amounts. The sum of numbers and percentages in columns may not match the “Total” due to rounding. With respect to any mortgage loan that is part of a whole loan, unless otherwise indicated, all LTV, DSCR and Debt Yield calculations include any related pari passu companion loans and exclude any related subordinate companion loans, as applicable. For mortgaged properties securing residential cooperative mortgage loans, the UW NCF DSCR and UW NOI Debt Yield for each such mortgaged property is calculated using underwritten net operating income or underwritten net cash flow, as applicable, for the related residential cooperative property which is the projected net operating income or net cash flow, as applicable, reflected in the most recent appraisal obtained by or otherwise in the possession of the related mortgage loan seller as of the Cut-off Date. LTV calculations are based upon the appraised value of the residential cooperative property determined as if such residential cooperative property is operated as a residential cooperative, inclusive of the amount of the underlying debt encumbering such residential cooperative property. |
This is not a research report and was not prepared by any Underwriter’s research department. Please see additional important information and qualifications at the end of this Term Sheet.
31
| BANK 2021-BNK32 | Characteristics of the Mortgage Loans |
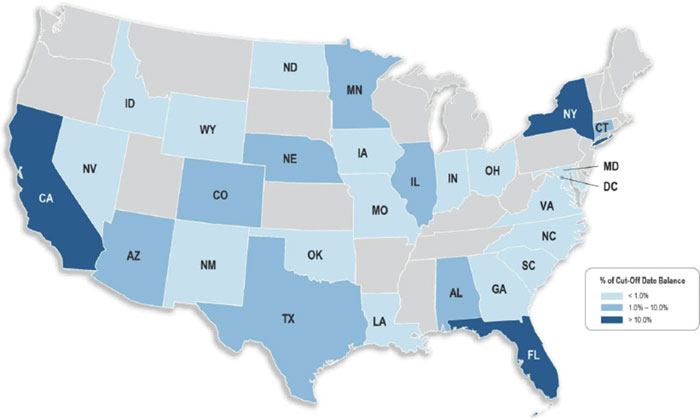
| Geographic Distribution(1) | ||||||||
| State or Other Jurisdiction | Number of Mortgaged Properties | Aggregate Cut-off Date Balance | % of Pool | Wtd. Avg. Mortgage Rate | Wtd. Avg. UW NCF DSCR | Wtd. Avg. UW NOI Debt Yield | Wtd. Avg. Cut-off Date LTV | Wtd. Avg. Maturity Date LTV |
| New York | 26 | $233,041,158 | 25.8% | 2.6059% | 5.86x | 19.5% | 31.8% | 31.3% |
| California | 17 | $217,362,400 | 24.0% | 2.9987% | 3.26x | 10.4% | 55.7% | 55.2% |
| California – Northern(2) | 10 | $148,530,733 | 16.4% | 2.8495% | 3.45x | 10.1% | 53.4% | 53.4% |
| California – Southern(2) | 7 | $68,831,667 | 7.6% | 3.3206% | 2.86x | 11.1% | 60.6% | 59.1% |
| Florida | 9 | $162,252,224 | 17.9% | 4.0219% | 2.15x | 9.8% | 53.8% | 52.8% |
| Texas | 13 | $83,477,429 | 9.2% | 3.7490% | 2.21x | 10.0% | 59.5% | 56.6% |
| Illinois | 6 | $25,798,666 | 2.9% | 3.3592% | 2.55x | 8.9% | 58.5% | 58.5% |
| Alabama | 2 | $19,577,676 | 2.2% | 3.6578% | 1.46x | 8.3% | 67.6% | 54.8% |
| Minnesota | 4 | $18,700,000 | 2.1% | 3.4900% | 2.88x | 10.5% | 60.8% | 60.8% |
| Connecticut | 2 | $16,400,000 | 1.8% | 3.7129% | 2.77x | 10.9% | 49.3% | 49.3% |
| District of Columbia | 1 | $14,500,000 | 1.6% | 3.8500% | 1.42x | 8.1% | 67.9% | 57.1% |
| Arizona | 2 | $14,225,000 | 1.6% | 3.0052% | 3.46x | 11.4% | 44.2% | 43.5% |
| Nebraska | 1 | $14,000,000 | 1.5% | 4.6400% | 2.84x | 19.9% | 37.8% | 30.8% |
| Colorado | 2 | $11,700,000 | 1.3% | 3.7537% | 2.27x | 8.7% | 61.3% | 61.3% |
| Nevada | 2 | $7,985,055 | 0.9% | 3.6109% | 2.06x | 8.8% | 60.0% | 57.0% |
| Louisiana | 2 | $6,629,581 | 0.7% | 3.6466% | 2.54x | 13.2% | 57.8% | 54.0% |
| Georgia | 1 | $6,245,092 | 0.7% | 3.2530% | 2.66x | 9.0% | 62.0% | 62.0% |
| New Mexico | 1 | $6,120,000 | 0.7% | 3.8000% | 2.50x | 14.8% | 56.2% | 50.9% |
| Ohio | 2 | $5,489,720 | 0.6% | 3.6765% | 2.54x | 13.5% | 57.5% | 53.4% |
| Indiana | 3 | $5,361,792 | 0.6% | 3.2530% | 2.66x | 9.0% | 62.0% | 62.0% |
| Virginia | 1 | $5,358,333 | 0.6% | 3.3255% | 2.56x | 8.8% | 57.9% | 57.9% |
| Oklahoma | 1 | $4,700,000 | 0.5% | 3.8200% | 2.36x | 9.2% | 57.3% | 57.3% |
| Wyoming | 1 | $4,582,500 | 0.5% | 3.1800% | 3.28x | 11.0% | 64.5% | 64.5% |
| Idaho | 1 | $3,700,000 | 0.4% | 3.6500% | 2.83x | 10.7% | 64.9% | 64.9% |
| North Dakota | 1 | $3,440,224 | 0.4% | 3.2530% | 2.66x | 9.0% | 62.0% | 62.0% |
| South Carolina | 1 | $3,291,667 | 0.4% | 3.3255% | 2.56x | 8.8% | 57.9% | 57.9% |
| Iowa | 1 | $3,223,273 | 0.4% | 3.2530% | 2.66x | 9.0% | 62.0% | 62.0% |
| Maryland | 1 | $2,696,392 | 0.3% | 3.2530% | 2.66x | 9.0% | 62.0% | 62.0% |
| Missouri | 1 | $2,463,944 | 0.3% | 3.2530% | 2.66x | 9.0% | 62.0% | 62.0% |
| North Carolina | 1 | $2,460,845 | 0.3% | 3.2530% | 2.66x | 9.0% | 62.0% | 62.0% |
| Total/Wtd. Avg. | 106 | $904,782,971 | 100.0% | 3.2847% | 3.46x | 12.6% | 50.1% | 48.7% |
| (1) | All numerical information concerning the mortgage loans is approximate and, in the case of mortgage loans secured by multiple properties, is based on allocated loan amounts with respect to such properties. All weighted average information regarding the mortgage loans reflects the weighting of the mortgage loans based on their outstanding principal balances as of the Cut-off Date or, in the case of mortgage loans secured by multiple properties, allocated loan amounts. The sum of numbers and percentages in columns may not match the “Total” due to rounding. With respect to any mortgage loan that is part of a whole loan, unless otherwise indicated, all LTV, DSCR and Debt Yield calculations include any related pari passu companion loans and exclude any related subordinate companion loans, as applicable. For mortgaged properties securing residential cooperative mortgage loans, the UW NCF DSCR and UW NOI Debt Yield for each such mortgaged property is calculated using underwritten net operating income or underwritten net cash flow, as applicable, for the related residential cooperative property which is the projected net operating income or net cash flow, as applicable, reflected in the most recent appraisal obtained by or otherwise in the possession of the related mortgage loan seller as of the Cut-off Date. LTV calculations are based upon the appraised value of the residential cooperative property determined as if such residential cooperative property is operated as a residential cooperative, inclusive of the amount of the underlying debt encumbering such residential cooperative property. |
| (2) | “California – Northern” includes zip codes above 93600, and “California – Southern” includes zip codes at or below 93600. |
This is not a research report and was not prepared by any Underwriter’s research department. Please see additional important information and qualifications at the end of this Term Sheet.
32
| BANK 2021-BNK32 | Collateral Statistics |
Collateral Statistics(1)
Cut-off Date Balance ($)
| No. of Mortgage Loans | Aggregate Cut-off Date Balance ($) | % of Pool | |
| 1,000,000 - 10,000,000 | 40 | 166,795,295 | 18.4 |
| 10,000,001 - 20,000,000 | 14 | 199,407,676 | 22.0 |
| 20,000,001 - 30,000,000 | 4 | 104,440,000 | 11.5 |
| 30,000,001 - 40,000,000 | 1 | 38,140,000 | 4.2 |
| 40,000,001 - 60,000,000 | 1 | 55,000,000 | 6.1 |
| 60,000,001 - 90,000,000 | 4 | 341,000,000 | 37.7 |
| Total: | 64 | $904,782,971 | 100.0% |
Min: $1,000,000 Max: $90,000,000 Avg: $14,137,234 | |||
State or Other Jurisdiction(2)
| No. of Mortgaged Properties | Aggregate Cut-off Date Balance ($) | % of Pool | |
| New York | 26 | 233,041,158 | 25.8 |
| California | 17 | 217,362,400 | 24.0 |
| California – Northern(3) | 10 | 148,530,733 | 16.4 |
| California – Southern(3) | 7 | 68,831,667 | 7.6 |
| Florida | 9 | 162,252,224 | 17.9 |
| Texas | 13 | 83,477,429 | 9.2 |
| Illinois | 6 | 25,798,666 | 2.9 |
| Alabama | 2 | 19,577,676 | 2.2 |
| Minnesota | 4 | 18,700,000 | 2.1 |
| Connecticut | 2 | 16,400,000 | 1.8 |
| District of Columbia | 1 | 14,500,000 | 1.6 |
| Arizona | 2 | 14,225,000 | 1.6 |
| Nebraska | 1 | 14,000,000 | 1.5 |
| Colorado | 2 | 11,700,000 | 1.3 |
| Nevada | 2 | 7,985,055 | 0.9 |
| Louisiana | 2 | 6,629,581 | 0.7 |
| Georgia | 1 | 6,245,092 | 0.7 |
| New Mexico | 1 | 6,120,000 | 0.7 |
| Ohio | 2 | 5,489,720 | 0.6 |
| Indiana | 3 | 5,361,792 | 0.6 |
| Virginia | 1 | 5,358,333 | 0.6 |
| Oklahoma | 1 | 4,700,000 | 0.5 |
| Wyoming | 1 | 4,582,500 | 0.5 |
| Idaho | 1 | 3,700,000 | 0.4 |
| North Dakota | 1 | 3,440,224 | 0.4 |
| South Carolina | 1 | 3,291,667 | 0.4 |
| Iowa | 1 | 3,223,273 | 0.4 |
| Maryland | 1 | 2,696,392 | 0.3 |
| Missouri | 1 | 2,463,944 | 0.3 |
| North Carolina | 1 | 2,460,845 | 0.3 |
| Total: | 106 | $904,782,971 | 100.0% |
Property Type(2)
| No. of Mortgaged Properties | Aggregate Cut-off Date Balance ($) | % of Pool | |
| Office | 7 | 230,260,426 | 25.4 |
| Suburban | 4 | 154,940,000 | 17.1 |
| CBD | 1 | 71,000,000 | 7.8 |
| Medical Office | 2 | 4,320,426 | 0.5 |
| Retail | 23 | 187,982,950 | 20.8 |
| Luxury Retail | 1 | 90,000,000 | 9.9 |
| Single Tenant | 18 | 49,682,950 | 5.5 |
| Anchored | 2 | 36,800,000 | 4.1 |
| Unanchored | 2 | 11,500,000 | 1.3 |
| Self Storage | 29 | 166,929,900 | 18.4 |
| Self Storage | 29 | 166,929,900 | 18.4 |
| Multifamily | 29 | 136,833,071 | 15.1 |
| Cooperative | 19 | 75,005,395 | 8.3 |
| Garden | 4 | 33,777,676 | 3.7 |
| Flexible Apartments | 4 | 21,500,000 | 2.4 |
| Mid Rise | 2 | 6,550,000 | 0.7 |
| Other | 5 | 73,871,624 | 8.2 |
| Leased Fee | 4 | 69,721,624 | 7.7 |
| Data Center | 1 | 4,150,000 | 0.5 |
| Industrial | 4 | 53,450,000 | 5.9 |
| Warehouse | 3 | 40,600,000 | 4.5 |
| Flex/R&D | 1 | 12,850,000 | 1.4 |
| Mixed Use | 5 | 41,700,000 | 4.6 |
| Office/Retail | 4 | 29,700,000 | 3.3 |
| Retail/Office/Multifamily | 1 | 12,000,000 | 1.3 |
| Manufactured Housing | 4 | 13,755,000 | 1.5 |
| Manufactured Housing | 4 | 13,755,000 | 1.5 |
| Total: | 106 | $904,782,971 | 100.0% |
Mortgage Rate (%)
| No. of Mortgage Loans | Aggregate Cut-off Date Balance ($) | % of Pool | |
| 1.9375 - 3.2490 | 17 | 327,537,233 | 36.2 |
| 3.2500 - 3.4990 | 17 | 226,558,338 | 25.0 |
| 3.5000 - 3.9990 | 19 | 185,932,400 | 20.5 |
| 4.0000 - 5.1100 | 11 | 164,755,000 | 18.2 |
| Total: | 64 | $904,782,971 | 100.0% |
| Min: 1.9375% | Max: 5.1100% Wtd Avg: 3.2847% | ||
Original Term to Maturity or ARD (mos.)
| No. of Mortgage Loans | Aggregate Cut-off Date Balance ($) | % of Pool | |
| 60 | 1 | 29,700,000 | 3.3 |
| 84 | 1 | 4,700,000 | 0.5 |
| 96 | 1 | 12,850,000 | 1.4 |
| 120 | 55 | 787,452,971 | 87.0 |
| 121 | 6 | 70,080,000 | 7.7 |
| Total: | 64 | $904,782,971 | 100.0% |
| Min: 60 mos. | Max: 121 mos. Wtd Avg: 118 mos. | ||
Remaining Term to Maturity or ARD (mos.)
| No. of Mortgage Loans | Aggregate Cut-off Date Balance ($) | % of Pool | |
| 60 – 119 | 29 | 487,020,571 | 53.8 |
| 120 - 121 | 35 | 417,762,400 | 46.2 |
| Total: | 64 | $904,782,971 | 100.0% |
| Min: 60 mos. | Max: 121 mos. Wtd Avg: 116 mos. | ||
Original Amortization Term (mos.)
| No. of Mortgage Loans | Aggregate Cut-off Date Balance ($) | % of Pool | |
| Interest Only | 38 | 710,249,900 | 78.5 |
| 120 | 1 | 1,200,000 | 0.1 |
| 360 | 22 | 182,742,096 | 20.2 |
| 480 | 3 | 10,590,975 | 1.2 |
| Total: | 64 | $904,782,971 | 100.0% |
| Min: 120 mos. | Max: 480 mos. Wtd Avg: 365 mos. | ||
Remaining Amortization Term (mos.)
| No. of Mortgage Loans | Aggregate Cut-off Date Balance ($) | % of Pool | |
| Interest Only | 38 | 710,249,900 | 78.5 |
| 120 | 1 | 1,200,000 | 0.1 |
| 359 – 360 | 22 | 182,742,096 | 20.2 |
| 479 - 480 | 3 | 10,590,975 | 1.2 |
| Total: | 64 | $904,782,971 | 100.0% |
| Min: 120 mos. | Max: 480 mos. Wtd Avg: 365 mos. | ||
Mortgage Loan Sellers
| No. of Mortgage Loans | Aggregate Cut-off Date Balance ($) | % of Pool | ||
| BANA | 14 | 330,584,900 | 36.5 | |
| MSMCH | 23 | 328,340,000 | 36.3 | |
| WFB | 9 | 185,852,676 | 20.5 | |
| NCB | 18 | 60,005,395 | 6.6 | |
| Total: | 64 | $904,782,971 | 100.0% | |
Amortization Type
| No. of Mortgage Loans | Aggregate Cut-off Date Balance ($) | % of Pool | |
| Interest Only | 38 | 710,249,900 | 78.5 |
| Partial Interest Only(4) | 14 | 148,330,000 | 16.4 |
| Amortizing Balloon | 11 | 45,003,071 | 5.0 |
| Fully Amortizing | 1 | 1,200,000 | 0.1 |
| Total: | 64 | $904,782,971 | 100.0% |
Cut-off Date LTV Ratio (%)
| No. of Mortgage Loans | Aggregate Cut-off Date Balance ($) | % of Pool | |
| 1.3 - 45.0 | 25 | 242,627,795 | 26.8 |
| 45.1 - 50.0 | 4 | 103,200,000 | 11.4 |
| 50.1 - 55.0 | 5 | 122,075,000 | 13.5 |
| 55.1 - 60.0 | 9 | 171,635,000 | 19.0 |
| 60.1 - 72.9 | 21 | 265,245,176 | 29.3 |
| Total: | 64 | $904,782,971 | 100.0% |
| Min: 1.3% | Max: 72.9% Wtd Avg: 50.1% | ||
Maturity Date or ARD LTV Ratio (%)
| No. of Mortgage Loans | Aggregate Cut-off Date Balance ($) | % of Pool | |
| 0.2 - 30.0 | 18 | 71,005,395 | 7.8 |
| 30.1 - 40.0 | 4 | 144,000,000 | 15.9 |
| 40.1 - 45.0 | 4 | 39,122,400 | 4.3 |
| 45.1 - 50.0 | 6 | 119,350,000 | 13.2 |
| 50.1 - 55.0 | 5 | 129,877,676 | 14.4 |
| 55.1 - 67.0 | 27 | 401,427,500 | 44.4 |
| Total: | 64 | $904,782,971 | 100.0% |
| Min: 0.2% | Max: 67.0% Wtd Avg: 48.7% | ||
UW NCF DSCR (x)
| No. of Mortgage Loans | Aggregate Cut-off Date Balance ($) | % of Pool | |
| 1.32 - 1.60 | 7 | 57,532,676 | 6.4 |
| 1.61 - 1.80 | 2 | 27,150,000 | 3.0 |
| 1.81 - 2.00 | 1 | 2,850,000 | 0.3 |
| 2.01 - 2.20 | 5 | 119,275,000 | 13.2 |
| 2.21 - 2.40 | 5 | 40,160,000 | 4.4 |
| 2.41 - 83.82 | 44 | 657,815,295 | 72.7 |
| Total: | 64 | $904,782,971 | 100.0% |
| Min: 1.32x | Max: 83.82x Wtd Avg: 3.46x | ||
UW NOI Debt Yield (%)
| No. of Mortgage Loans | Aggregate Cut-off Date Balance ($) | % of Pool | |
| 7.3 - 9.0 | 14 | 234,922,676 | 26.0 |
| 9.1 - 10.0 | 11 | 205,635,000 | 22.7 |
| 10.1 - 12.0 | 12 | 224,704,900 | 24.8 |
| 12.1 - 13.0 | 2 | 33,140,000 | 3.7 |
| 13.1 - 15.0 | 5 | 117,375,000 | 13.0 |
| 15.1 - 445.2 | 20 | 89,005,395 | 9.8 |
| Total: | 64 | $904,782,971 | 100.0% |
| Min: 7.3% | Max: 445.2% Wtd Avg: 12.6% | ||
| (1) | All numerical information concerning the mortgage loans is approximate. All weighted average information regarding the mortgage loans reflects the weighting of the mortgage loans based on their outstanding principal balances as of the Cut-off Date. The sum of numbers and percentages in columns may not match the “Total” due to rounding. With respect to any mortgage loan that is part of a whole loan, unless otherwise indicated, all LTV, DSCR and Debt Yield calculations include any related pari passu companion loans and exclude any related subordinate companion loans, as applicable. For mortgaged properties securing residential cooperative mortgage loans, the UW DSCR and UW NOI Debt Yield for each such mortgaged property is calculated using underwritten net operating income or underwritten net cash flow, as applicable, for the related residential cooperative property which is the projected net operating income or net cash flow, as applicable, reflected in the most recent appraisal obtained by or otherwise in the possession of the related mortgage loan seller as of the Cut-off Date. LTV calculations are based upon the appraised value of the residential cooperative property determined as if such residential cooperative property is operated as a residential cooperative, inclusive of the amount of the underlying debt encumbering such residential cooperative property. |
| (2) | In the case of mortgage loans secured by multiple properties, cut-off date balance information is based on allocated loan amounts with respect to such properties. |
| (3) | “California – Northern” includes zip codes above 93600, and “California – Southern” includes zip codes at or below 93600. |
| (4) | Partial Interest Only metrics include two loans, 12900 I Street and 305 Equities Corp., that are amortizing balloon. The first payment date for the these mortgage loans is in May 2021. On the Closing Date, the lender will deposit sufficient funds to pay the amount of interest that would be due with respect to an April 2021 payment. |
This is not a research report and was not prepared by any Underwriter’s research department. Please see additional important information and qualifications at the end of this Term Sheet.
33
| Office – Suburban | Loan #1 | Cut-off Date Balance: | $90,000,000 | |
| 625 North Mary Avenue and 925 West | Pathline Park 9 & 10 | Cut-off Date LTV: | 51.8% | |
| Maude Avenue | UW NCF DSCR: | 3.87x | ||
| Sunnyvale, CA 94085 | UW NOI Debt Yield: | 10.2% |
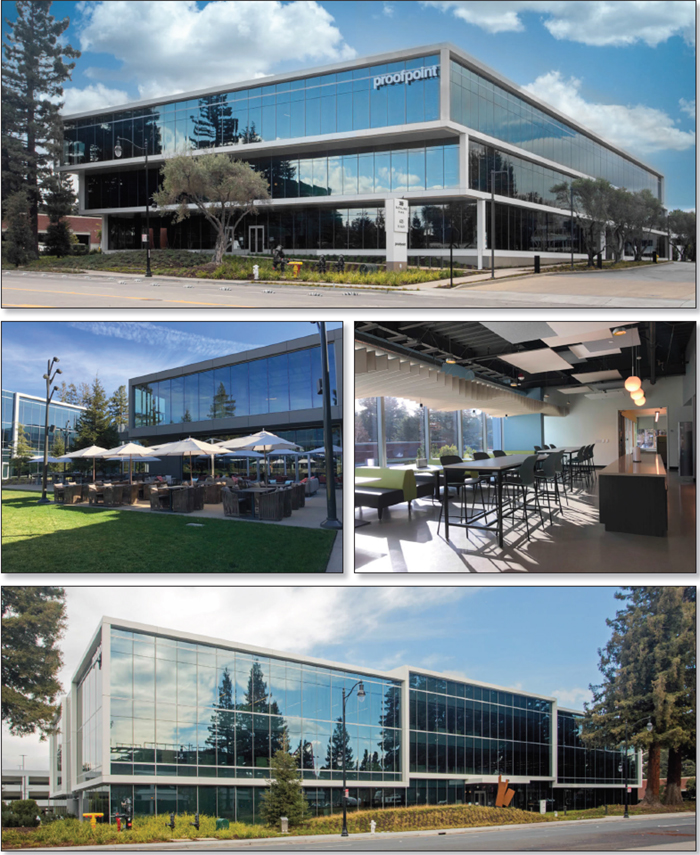
This is not a research report and was not prepared by any Underwriter’s research department. Please see additional important information and qualifications at the end of this Term Sheet.
34
| Office – Suburban | Loan #1 | Cut-off Date Balance: | $90,000,000 | |
| 625 North Mary Avenue and 925 West | Pathline Park 9 & 10 | Cut-off Date LTV: | 51.8% | |
| Maude Avenue | UW NCF DSCR: | 3.87x | ||
| Sunnyvale, CA 94085 | UW NOI Debt Yield: | 10.2% |

This is not a research report and was not prepared by any Underwriter’s research department. Please see additional important information and qualifications at the end of this Term Sheet.
35
| Mortgage Loan No. 1 – Pathline Park 9 & 10 |
| Mortgage Loan Information | Property Information | |||||
| Mortgage Loan Seller: | WFB | Single Asset/Portfolio: | Single Asset | |||
| Credit Assessment (Moody’s/DBRSM/Fitch): | NR/NR/NR | Location: | Sunnyvale, CA 94085 | |||
| Original Balance(1): | $90,000,000 | General Property Type: | Office | |||
| Cut-off Date Balance(1): | $90,000,000 | Detailed Property Type: | Suburban | |||
| % of Initial Pool Balance: | 9.9% | Title Vesting: | Fee | |||
| Loan Purpose: | Recapitalization | Year Built/Renovated: | 2020/N/A | |||
| Sponsor: | The Irvine Company LLC | Size: | 242,226 SF | |||
| Guarantor: | TT Peery Park JV LLC | Cut-off Date Balance per SF(1): | $537 | |||
| Mortgage Rate: | 2.5020% | Maturity Balance per SF(1): | $537 | |||
| Note Date: | 2/2/2021 | Property Manager: | Irvine Management Company | |||
| First Payment Date: | 3/11/2021 | (borrower-related) | ||||
| Maturity Date: | 2/11/2031 | |||||
| Original Term to Maturity: | 120 months | |||||
| Original Amortization Term: | 0 months | Underwriting and Financial Information(5) | ||||
| IO Period: | 120 months | UW NOI: | $13,298,939 | |||
| Seasoning: | 1 month | UW NOI Debt Yield(1): | 10.2% | |||
| Prepayment Provisions(2): | LO (24); YM1 (1); DEF/YM1 (90); O (5) | UW NOI Debt Yield at Maturity(1): | 10.2% | |||
| Lockbox/Cash Mgmt Status: | Hard/Springing | UW NCF DSCR(1): | 3.87x | |||
| Additional Debt Type(1)(3): | Pari Passu | Most Recent NOI(6): | N/A | |||
| Additional Debt Balance(1)(3): | $40,000,000 | 2nd Most Recent NOI(6): | N/A | |||
| Future Debt Permitted (Type): | No (N/A) | 3rd Most Recent NOI(6): | N/A | |||
| Reserves(4) | Most Recent Occupancy: | 100.0% (3/1/2021) | ||||
| 2nd Most Recent Occupancy(6): | N/A | |||||
| Type | Initial | Monthly | Cap | 3rd Most Recent Occupancy(6): | N/A | |
| RE Taxes: | $0 | Springing | N/A | Appraised Value (as of)(7): | $251,000,000 (6/1/2021) | |
| Insurance: | $0 | Springing | N/A | Appraised Value per SF(7): | $1,036 | |
| Recurring Replacements: | $0 | Springing | $1,161,000 | Cut-off Date LTV Ratio(7): | 51.8% | |
| Rent Concession Reserve: | $3,451,721 | $0 | N/A | Maturity Date LTV Ratio(7): | 51.8% | |
| Leasing Event Period Springing Reserve: | $0 | Springing | N/A | |||
| Remaining Construction Payment Reserve: | $7,902,662 | $0 | N/A | |||
| Sources and Uses | ||||||
| Sources | Proceeds | % of Total | Uses | Proceeds | % of Total | |
| Whole Loan Amount(1): | $130,000,000 | 100.0% | Upfront Reserves: | $11,354,383 | 8.7% | |
| Closing Costs: | $434,949 | 0.3% | ||||
| Return of Equity(8): | $118,210,669 | 90.9% | ||||
| Total Sources: | $130,000,000 | 100.0% | Total Uses: | $130,000,000 | 100.0% | |
| (1) | The Pathline Park 9 & 10 Mortgage Loan (as defined below) is part of the Pathline Park 9 & 10 Whole Loan (as defined below) with an original aggregate principal balance of $130,000,000. The Cut-off Date Balance per SF, Maturity Date Balance per SF, UW NOI Debt Yield, UW NOI Debt Yield at Maturity, UW NCF DSCR, Cut-off Date LTV Ratio and Maturity Date LTV Ratio numbers presented above are based on the Pathline Park 9 & 10 Whole Loan. |
| (2) | At any time on or after March 11, 2023 and prior to October 11, 2030, the Pathline Park 9 & 10 Borrower (as defined below) may prepay the Pathline Park 9 & 10 Whole Loan in whole, but not in part, upon payment of a yield maintenance premium in accordance with the loan documents. In addition, at any time after the earlier of (i) March 11, 2024 and (ii) two years from the closing date of the securitization that includes the last pari passu note of the Pathline Park 9 & 10 Whole Loan to be securitized, the Pathline Park 9 & 10 Borrower has the right to defease the Pathline Park 9 & 10 Whole Loan in whole, but not in part. The assumed prepayment premium period of 1 payment and prepayment/defeasance period of 90 payments are based on the closing date of this transaction in March 2021. |
| (3) | See “The Mortgage Loan” and “Additional Secured Indebtedness (not including trade debts)” below for further discussion of additional debt. |
| (4) | See “Escrows and Reserves” below for further discussion of reserve requirements. |
| (5) | The novel coronavirus pandemic is an evolving situation and could impact the Pathline Park 9 & 10 Whole Loan more severely than assumed in the underwriting of the Pathline Park 9 & 10 Whole Loan and could adversely affect the NOI, NCF and occupancy information, as well as the appraised value and the DSCR, LTV and Debt Yield metrics presented above and herein. See "Risk Factors—Risks Related to Market Conditions and Other External Factors—The Coronavirus Pandemic Has Adversely Affected the Global Economy and Will Likely Adversely Affect the Performance of the Mortgage Loans" in the Preliminary Prospectus. |
| (6) | The Pathline Park 9 & 10 Property (as defined below) was built in 2020; therefore, no historical operating history or occupancy is available. |
| (7) | The Appraised Value represents the Prospective Market Value at Stabilization as of June 1, 2021, which assumes Proofpoint Inc. (“Proofpoint”) is paying full rent. Proofpoint is currently in a free rent period through and including May 2021, which was reserved for at origination. The appraisal also concluded to a Market Value As Is of $244,000,000 as of January 12, 2021, and a Go Dark Value of $172,000,000 as of January 12, 2021. The Market Value As Is results in a Cut-off Date LTV Ratio and Maturity Date LTV Ratio of 53.3%. |
| (8) | The Pathline Park 9 & 10 Property was previously unencumbered, as it was developed by The Irvine Company LLC for all cash. The Irvine Company LLC reported a total cost basis for the Pathline Park 9 & 10 Property of $196,592,139 ($812 PSF). |
The Mortgage Loan. The largest mortgage loan (the “Pathline Park 9 & 10 Mortgage Loan”) is part of a whole loan (the “Pathline Park 9 & 10 Whole Loan”) that is evidenced by three pari passu promissory notes in the aggregate original principal amount of $130,000,000. The Pathline Park 9 & 10 Whole Loan is secured by a first priority fee mortgage encumbering two Class A office buildings located in Sunnyvale, California (the “Pathline Park 9 & 10 Property”). The Pathline Park 9 & 10 Mortgage Loan is evidenced by the controlling promissory Note A-1 in the original principal amount of $90,000,000. The non-controlling promissory Notes A-2 and A-3 (the “Pathline Park 9 & 10 Serviced Pari Passu Companion Loans), in the aggregate original principal amount of $40,000,000, are currently held by Wells Fargo Bank, N.A. and are expected to be contributed to one or more future
This is not a research report and was not prepared by any Underwriter’s research department. Please see additional important information and qualifications at the end of this Term Sheet.
36
| Office – Suburban | Loan #1 | Cut-off Date Balance: | $90,000,000 | |
| 625 North Mary Avenue and 925 West | Pathline Park 9 & 10 | Cut-off Date LTV: | 51.8% | |
| Maude Avenue | UW NCF DSCR: | 3.87x | ||
| Sunnyvale, CA 94085 | UW NOI Debt Yield: | 10.2% |
securitization trusts. The Pathline Park 9 & 10 Whole Loan will be serviced pursuant to the pooling and servicing agreement for the BANK 2021-BNK32 securitization trust. See “Description of the Mortgage Pool—The Whole Loans—The Serviced Pari Passu Whole Loans” and “Pooling and Servicing Agreement” in the Preliminary Prospectus. The proceeds of the Pathline Park 9 & 10 Whole Loan were primarily used to recapitalize the Pathline Park 9 & 10 Borrower, fund reserves, and pay closing costs.
| Pathline Park 9 & 10 Whole Loan Summary | ||||
| Notes | Original Balance | Cut-off Date Balance | Note Holder | Controlling Piece |
| A-1 | $90,000,000 | $90,000,000 | BANK 2021-BNK32 | Yes |
| A-2 | $25,000,000 | $25,000,000 | Wells Fargo Bank, N.A. | No |
| A-3 | $15,000,000 | $15,000,000 | Wells Fargo Bank, N.A. | No |
| Total Whole Loan | $130,000,000 | $130,000,000 | ||
The Borrower and the Borrower Sponsors. The borrower is Pathline Park II LLC (the “Pathline Park 9 & 10 Borrower”), a Delaware limited liability company and single purpose entity with two independent directors. The borrower sponsor is The Irvine Company LLC (“The Irvine Company”), and the non-recourse carveout guarantor is TT Peery Park JV LLC, an affiliate of The Irvine Company.
The Irvine Company is a private real estate investment company governed by an independent board of directors that is committed to long-term ownership and operation of its real estate portfolio. The Irvine Company’s holdings consist of approximately 126 million SF and include more than 560 office buildings, 125 apartment communities with 65,000 units, 40 retail centers, one coastal resort, two hotels, three golf courses, and five marinas. The company’s investment property portfolio is largely located in Orange County, California, with approximately 35% of the portfolio in Silicon Valley, San Diego, West Los Angeles, Chicago, and New York City.
The Property. The Pathline Park 9 & 10 Property comprises two, three-story Class A office buildings totaling 242,226 SF and a parking structure located on an 8.8-acre parcel within the Pathline Park office campus in Sunnyvale, California. Built in 2020, the Pathline Park 9 & 10 Property consists of buildings 9 and 10 of the larger office campus and features 30’x30’ column spacing, with floor plates of approximately 40,000 SF. The free standing parking garage contains 856 parking stalls, with 814 spaces allocated to the Pathline Park 9 & 10 Property, in addition to 37 surface parking spaces, resulting in a parking ratio of 3.5 spaces per 1,000 SF of rentable area. The Pathline Park 9 & 10 Property is 100.0% leased to Proofpoint through May 31, 2031.
The overall Pathline Park office campus comprises approximately 1.4 million SF of office space across 11 buildings situated on approximately 42 acres. The project includes nine, three-story office buildings ranging from 95,000 to 121,000 SF and two, four-story office buildings ranging from 140,000 to 167,000 SF. Communal spaces throughout the campus include ample open space, abundant indoor and outdoor seating with complimentary WiFi, and an amenity building, which contains food and beverage options and outdoor game areas. The Pathline Park development was previously improved with several older, low-rise office/R&D buildings. The Irvine Company acquired and assembled the properties over the past several years and received approvals for the redevelopment in 2016 with the adoption of the Peery Park Specific Plan by the City of Sunnyvale.
Major Tenant.
Proofpoint (242,226 SF; 100.0% of NRA; 100.0% of underwritten base rent). Proofpoint is a publicly traded (NASDAQ: PFPT) cyber security company founded in 2002 by Eric Hahn, the former Chief Technology Officer (CTO) of Netscape. Headquartered at the Pathline Park 9 & 10 Property with additional offices across 10 countries, the company has grown to more than 3,600 employees serving over 8,000 enterprises worldwide. With an integrated suite of cloud-based solutions, Proofpoint helps companies around the world stop targeted threats, safeguard their data, and make their users more resilient against cyber-attacks. Proofpoint’s products include email protection, cloud security, digital risk protection, advanced threat protection, and archive & compliance.
Proofpoint executed a 127-month lease at the Pathline Park 9 & 10 Property in October 2018, which had a lease commencement date of November 1, 2020 and has an expiration date of May 31, 2031. Proofpoint’s lease included a 7-month free rent period, which extends through and including May 2021 and was reserved for at the origination of the Pathline Park 9 & 10 Whole Loan. The tenant currently has a rental rate of $57.00 PSF with 3.0% annual escalations, one 5-year renewal option at fair market rent with 9 months’ notice, and no termination options.
The following table presents certain information relating to the tenancy at the Pathline Park 9 & 10 Property:
| Tenant Summary | |||||||||
| Tenant Name | Credit Rating (Fitch/Moody's /S&P) | Tenant SF | Approx. % of SF | Annual UW Rent(1) | % of Total Annual UW Rent | Annual UW Rent PSF(1) | Termination Option (Y/N) | Lease Expiration | Renewal Options |
| Proofpoint(2) | NR/NR/NR | 242,226 | 100.0% | $14,213,822 | 100.0% | $58.68 | N | 5/31/2031 | 1, 5-year |
| Subtotal/Wtd. Avg. | 242,226 | 100.0% | $14,213,822 | 100.0% | $58.68 | ||||
| Other Tenants | 0 | 0.0% | $0 | 0.0% | $0.00 | ||||
| Vacant Space | 0 | 0.0% | $0 | 0.0% | $0.00 | ||||
| Total/Wtd. Avg. | 242,226 | 100.0% | $14,213,822 | 100.0% | $58.68 | ||||
| (1) | Proofpoint’s current contractual rental rate is $57.00 PSF, with 3.0% annual escalations. The Annual UW Rent and Annual UW Rent PSF include the contractual increase in November 2021. |
| (2) | Proofpoint is in occupancy but has not yet commenced paying rent. The tenant has a free rent period through and including May 2021, which was reserved for at loan closing (see “Escrows and Reserves” section below). |
This is not a research report and was not prepared by any Underwriter’s research department. Please see additional important information and qualifications at the end of this Term Sheet.
37
| Office – Suburban | Loan #1 | Cut-off Date Balance: | $90,000,000 | |
| 625 North Mary Avenue and 925 West | Pathline Park 9 & 10 | Cut-off Date LTV: | 51.8% | |
| Maude Avenue | UW NCF DSCR: | 3.87x | ||
| Sunnyvale, CA 94085 | UW NOI Debt Yield: | 10.2% |
The following table presents certain information relating to the lease rollover schedule at the Pathline Park 9 & 10 Property:
| Lease Rollover Schedule(1) | ||||||||
| Year | # of Leases Rolling | SF Rolling | Annual UW Rent PSF Rolling | Approx. % of Total SF Rolling | Approx. Cumulative % of SF Rolling | Total UW Rent Rolling | Approx. % of Total Rent Rolling | Approx. Cumulative % of Total Rent Rolling |
| MTM | 0 | 0 | $0.00 | 0.0% | 0.0% | $0 | 0.0% | 0.0% |
| 2021 | 0 | 0 | $0.00 | 0.0% | 0.0% | $0 | 0.0% | 0.0% |
| 2022 | 0 | 0 | $0.00 | 0.0% | 0.0% | $0 | 0.0% | 0.0% |
| 2023 | 0 | 0 | $0.00 | 0.0% | 0.0% | $0 | 0.0% | 0.0% |
| 2024 | 0 | 0 | $0.00 | 0.0% | 0.0% | $0 | 0.0% | 0.0% |
| 2025 | 0 | 0 | $0.00 | 0.0% | 0.0% | $0 | 0.0% | 0.0% |
| 2026 | 0 | 0 | $0.00 | 0.0% | 0.0% | $0 | 0.0% | 0.0% |
| 2027 | 0 | 0 | $0.00 | 0.0% | 0.0% | $0 | 0.0% | 0.0% |
| 2028 | 0 | 0 | $0.00 | 0.0% | 0.0% | $0 | 0.0% | 0.0% |
| 2029 | 0 | 0 | $0.00 | 0.0% | 0.0% | $0 | 0.0% | 0.0% |
| 2031 | 1 | 242,226 | $58.68 | 100.0% | 100.0% | $14,213,822 | 100.0% | 100.0% |
| 2032 & Beyond | 0 | 0 | $0.00 | 0.0% | 100.0% | $0.00 | 0.0% | 100.0% |
| Vacant | 0 | 0 | $0.00 | 0.0% | 100.0% | $0.00 | 0.0% | 100.0% |
| Total/Wtd. Avg. | 1 | 242,226 | $58.68 | 100.0% | $14,213,822 | 100.0% | ||
| (1) | Information is based on the underwritten rent roll. |
COVID-19 Update. As of March 4, 2021, the Pathline Park 9 & 10 Whole Loan is current and is not subject to any forbearance, modification or debt service relief request. The Pathline Park 9 & 10 Property is open and operating; however, the majority of Proofpoint employees are working remotely. Proofpoint is in a free rent period through and including May 2021, which was reserved for at the origination of the Pathline Park 9 & 10 Whole Loan (see “Escrows and Reserves” section below). There have not been any lease modification or rent relief requests from the tenant.
The Market. The Pathline Park 9 & 10 Property is situated within the 42-acre Pathline Park office campus in Sunnyvale, Santa Clara County, California, and is part of the larger Peery Park Specific Plan. During the 1970s, the area known as Peery Park was developed primarily with Class B and C one-story buildings, and the area has been largely redeveloped by The Irvine Company and others. The City of Sunnyvale is located in the northwestern portion of Santa Clara County, just west of San Jose, approximately 11 miles from downtown San Jose and 45 miles east of the Pacific Ocean. The Pathline Park 9 & 10 Property is located in the north-central portion of Downtown Sunnyvale in a predominantly commercial and office area with many corporations such as Yahoo!, Juniper Networks, AMD, Network Appliance, Spansion and Ariba. In addition, other notable corporations have regional offices in the city, including Google, Apple, Amazon, Facebook, LinkedIn, Honeywell, Northrop Grumman, and Lockheed Martin. The primary east-west highway in the market area is the Southbay Freeway (State Highway 237), which runs just north of the Pathline Park 9 & 10 Property. Major non-highway roadways within the market area include Mathilda Avenue, Sunnyvale Saratoga Road, Evelyn Avenue, and Fair Oaks Avenue. Rail and bus service to and from Sunnyvale is provided by Caltrain and the local light-rail system operated by the Santa Clara Valley Transportation Authority. The estimated 2021 population within a 3- and 5-mile radius of the Pathline Park 9 & 10 Property is 166,997 and 394,744, respectively; and the estimated 2021 median household income within the same radii is $215,494 and $223,153, respectively.
According to the appraisal, the Pathline Park 9 & 10 Property is situated within the Sunnyvale/Moffett Park office submarket. As of January 2021, the overall office submarket reported total inventory of approximately 20.0 million SF, with an 8.7% vacancy rate and average asking rent of $50.16 PSF. The Class A office submarket reported total inventory of approximately 12.8 million SF, with a 7.6% vacancy rate and average asking rent of $96.92 PSF. The appraisal concluded to a market rent for the Pathline Park 9 & 10 Property of $57.00 PSF.
The following table presents certain information relating to the appraisal’s market rent conclusion for the Pathline Park 9 & 10 Property:
| Market Leasing Assumptions | |
| Office | |
| Market Rent (PSF) | $57.00 |
| Lease Term (Years) | 7 |
| Concessions | 6 months |
| Lease Type (Reimbursements) | Triple Net |
| Rent Increase Projection | 3.0% per annum |
| Source: Appraisal. |
This is not a research report and was not prepared by any Underwriter’s research department. Please see additional important information and qualifications at the end of this Term Sheet.
38
| Office – Suburban | Loan #1 | Cut-off Date Balance: | $90,000,000 | |
| 625 North Mary Avenue and 925 West | Pathline Park 9 & 10 | Cut-off Date LTV: | 51.8% | |
| Maude Avenue | UW NCF DSCR: | 3.87x | ||
| Sunnyvale, CA 94085 | UW NOI Debt Yield: | 10.2% |
The following table presents information relating to comparable office property sales for the Pathline Park 9 & 10 Property:
| Property Name/Location | Tenant | Sale Date | Year Built | Total NRA (SF) | Occupancy | Sale Price | Sale Price PSF | Appraiser’s Adjusted Sale Price PSF(1) |
620 National 620 National Ave. Mountain View, CA | Sep-19 | 2016 | 151,064 | 100.0% | $190,000,000 | $1,258 | $1,069 | |
Grove 221 221 N. Mathilda Ave. Sunnyvale, CA | 23andMe | Mar-19 | 2019 | 154,987 | 100.0% | $183,000,000 | $1,181 | $1,122 |
Campus at Lawson Lane 2215 Lawson Ln Santa Clara, CA | ServiceNow, Inc. | Feb-20 | 2012 | 328,867 | 100.0% | $276,300,000 | $840 | $1,050 |
Coleman Highline 1143-1155 Coleman Ave. San Jose, CA | Roku | Nov-20 | 2017 | 362,386 | 100.0% | $275,000,000 | $759 | $1,024 |
District 237 100 Headquarters Dr. San Jose, CA | Raytheon | Jun-20 | 2000 | 144,047 | 100.0% | $95,200,000 | $661 | $991 |
Source: Appraisal.
| (1) | Adjusted for location, access/exposure/visibility, building size, year built/condition, construction quality/design, parking ratio, and economic attributes (as applicable). |
The following table presents certain information relating to comparable office leases for the Pathline Park 9 & 10 Property:
| Property Name/Location | Tenant Name | Lease Date/Term | Lease Area (SF) | Annual Base Rent PSF | Lease Type |
Pathline Park 9 & 10 Property (subject) | Proofpoint | Nov-20 / 127 months | 242,226 | $57.00 | NNN |
Pathline Park 1-3 770-800 N Mary & 655 Palomar Ave. Sunnyvale, CA | Synopsis | Feb-20 / 12 years | 360,000 | $51.00 | NNN |
Crossroads Tech Center 465 N Mary Ave. Sunnyvale, CA | Q3-2021 / 11 years | 194,850 | $54.60 | NNN | |
Grove 221 221 N Mathilda Ave. Sunnyvale, CA | 23andMe, Inc. | Aug-19 / 12 years | 154,987 | $61.80 | NNN |
Sunnyvale CityLine 200 S Mathilda Ave. Sunnyvale, CA | Uber Technologies, Inc. | Jun-20 / 10.5 years | 156,960 | $72.00 | NNN |
Sunnyvale CityLine 190 Mathilda Pl. Sunnyvale, CA | Uber Technologies, Inc. | Jun-20 / 10.5 years | 133,221 | $72.00 | NNN |
Source: Appraisal.
This is not a research report and was not prepared by any Underwriter’s research department. Please see additional important information and qualifications at the end of this Term Sheet.
39
| Office – Suburban | Loan #1 | Cut-off Date Balance: | $90,000,000 | |
| 625 North Mary Avenue and 925 West | Pathline Park 9 & 10 | Cut-off Date LTV: | 51.8% | |
| Maude Avenue | UW NCF DSCR: | 3.87x | ||
| Sunnyvale, CA 94085 | UW NOI Debt Yield: | 10.2% |
Underwritten Net Cash Flow. The following table presents certain information relating to the Underwritten Net Cash Flow at the Pathline Park 9 & 10 Property:
| Cash Flow Analysis(1) | ||
| UW | UW PSF | |
| Gross Potential Base Rent | $13,806,882 | $57.00 |
| Contractual Rent Steps | $406,940 | $1.68 |
| Total Recoveries | $3,879,649 | $16.02 |
| Less Vacancy & Credit Loss(2) | ($710,691) | ($2.93) |
| Effective Gross Income | $17,382,780 | $71.76 |
| Real Estate Taxes | $2,962,355 | $12.23 |
| Insurance | $97,997 | $0.40 |
| Other Operating Expenses | $1,023,489 | $4.23 |
| Total Expenses | $4,083,841 | $16.86 |
| Net Operating Income | $13,298,939 | $54.90 |
| Capital Expenditures | $48,445 | $0.20 |
| TI/LC | $484,452 | $2.00 |
| Net Cash Flow | $12,766,041 | $52.70 |
| Occupancy %(2) | 95.0% | |
| NOI DSCR(3) | 4.03x | |
| NCF DSCR(3) | 3.87x | |
| NOI Debt Yield(3) | 10.2% | |
| NCF Debt Yield(3) | 9.8% | |
| (1) | No historical operating or occupancy statements are available because the Pathline Park 9 & 10 Property was completed in 2020. No COVID-19 specific adjustments have been incorporated in the lender underwriting. |
| (2) | The underwritten economic vacancy is 5.0%. The Pathline Park 9 & 10 Property was 100.0% leased as of March 1, 2021. |
| (3) | The debt service coverage ratios and debt yields are based on the Pathline Park 9 & 10 Whole Loan. |
Escrows and Reserves.
Real Estate Taxes – During either a Cash Trap Event Period (see “Lockbox and Cash Management” section) or a Leasing Event Period (as defined below), or if the Pathline Park 9 & 10 Borrower fails to provide the lender with paid receipts or other satisfactory evidence that all taxes have been fully paid prior to the delinquency date, ongoing monthly real estate tax reserves are required in an amount equal to one-twelfth of the real estate taxes that the lender estimates will be payable during the next 12 months.
Insurance – Ongoing monthly insurance reserves are not required as long as either (i) (a) the Pathline Park 9 & 10 Property is insured pursuant to a blanket policy acceptable to the lender and (b) the Pathline Park 9 & 10 Borrower provides the lender with evidence of renewal of the policies at least 10 business days prior to expiration; or (ii) no Cash Trap Event Period is continuing and no Leasing Event Period is continuing.
Replacement Reserves – Ongoing monthly replacement reserves are required in an amount equal to $4,037 during either a Cash Trap Event Period or a Leasing Event Period (subject to a cap of $1,161,000, as long as no event of default is continuing).
Rent Concession Reserve – The Pathline Park 9 & 10 Borrower deposited an upfront reserve of $3,451,721 related to outstanding free rent for Proofpoint through and including May 2021.
Remaining Construction Payments Reserve – The Pathline Park 9 & 10 Borrower deposited an upfront reserve of $7,902,662 related to remaining payments payable to contractors in connection with the initial construction of the improvements.
Leasing Event Period Springing Reserve – Upon the occurrence of a Leasing Event Period, the Pathline Park 9 & 10 Borrower is required either to deposit with the lender (i) on the first monthly payment date following the occurrence of the Leasing Event Period, an amount equal to the Proofpoint Funds Amount (as defined below), or (ii) on the first monthly payment date occurring after the Leasing Event Period and on each monthly payment date thereafter, an amount equal to one-twelfth of the Proofpoint Funds Amount until the Pathline Park 9 & 10 Borrower has deposited an aggregate amount at least equal to the Proofpoint Funds Amount.
A “Leasing Event Period” will commence upon Proofpoint or any replacement tenant of at least 121,113 SF of the current Proofpoint space:
| (i) | canceling or terminating its lease prior to its then current expiration date (other than in connection with one or more new replacement leases being entered into), or providing notice of its intent to do so; |
| (ii) | committing a material default under its lease beyond any applicable notice and cure period; |
| (iii) | going dark in more than 121,113 SF of the office space at the Pathline Park 9 & 10 Property (excluding the discontinuation of operations due |
This is not a research report and was not prepared by any Underwriter’s research department. Please see additional important information and qualifications at the end of this Term Sheet.
40
| Office – Suburban | Loan #1 | Cut-off Date Balance: | $90,000,000 | |
| 625 North Mary Avenue and 925 West | Pathline Park 9 & 10 | Cut-off Date LTV: | 51.8% | |
| Maude Avenue | UW NCF DSCR: | 3.87x | ||
| Sunnyvale, CA 94085 | UW NOI Debt Yield: | 10.2% |
| to compliance with governmental restrictions related to the COVID-19 pandemic or any other pandemic or epidemic, provided the tenant resumes operations in at least 121,113 SF within 90 days after the applicable restrictions are lifted or expire (or within 6 months if the tenant is reoccupying its space in stages and written notice is provided to the lender), as further outlined in the loan documents); |
| (iv) | filing, or any lease guarantor filing, for relief under creditors rights laws; and |
| (v) | (a) with respect to Proofpoint, failing to renew its lease by the earlier of (1) 12 months prior to the maturity date of the Pathline Park 9 & 10 Whole Loan and (2) the required notice period in its lease (Proofpoint’s lease currently requires 9 months’ notice); or (b) with respect to any replacement tenant that has an initial term (excluding extension options) that expires prior to the date that is 16 months after the maturity date of the Pathline Park 9 & 10 Whole Loan, failing to renew its lease by the earlier of (I) the monthly payment date that occurs in the month that is 16 months prior to such tenant’s lease expiration date and (II) the required notice period in the tenant’s lease. |
A Leasing Event Period will end upon the occurrence of the following:
| ● | All or substantially all of the Proofpoint space (or the space in which the applicable tenant has discontinued its business under clause (iii) above) has been leased pursuant to one or more leases acceptable to the lender with an initial term (excluding any renewal or extension options) of not less than five years and payment of a net effective rent of not less than 95% of the then prevailing effective fair market rent for similar properties and leases in the market area (after taking into account any free rent, construction allowances, tenant characteristics, and lease term, among other items (collectively, “Fair Market Rent Qualifications”)), with all tenant improvements and leasing commissions having been paid in full (or borrower having reserved with the lender such costs or delivered a letter of credit or guaranty for such costs), and all replacement tenants paying rent (or the borrower having reserved with the lender any remaining free rent, or having delivered a letter of credit or guaranty for such amounts); |
| ● | With regard to clause (ii) above, the cure of such event of default with no other material default under the lease for a period of three consecutive months following such cure; |
| ● | With regard to clause (iv) above, the lease being assumed or affirmed by the tenant in accordance with its terms and without any negative material change in the economics, scope or duration pursuant to a final unappealable order; |
| ● | With regard to clause (v) above, (1) as applicable, (a) Proofpoint having entered into a lease extension for all or substantially all of its space for a term of not less than five years, or (b) the replacement tenant having entered into a lease extension for its space for a term that expires no earlier than the date that is 16 months following the maturity date of the Pathline Park 9 & 10 Whole Loan; and (2) payment of a net effective rent during the extension term of not less than 95% of the then prevailing effective fair market rent for similar properties and leases in the market area (after taking into account the Fair Market Rent Qualifications). |
The “Proofpoint Funds Amount” means, with respect to a Leasing Event Period other than under clause (iii) of the definition of Leasing Event Period above, the product of (a) $40 multiplied by (b) the total amount of SF of space demised under the applicable lease (or, with respect to clause (iii) of the definition of Leasing Event Period above, the total amount of SF of space in which the tenant has discontinued its business).
In lieu of all or a portion of the reserve deposits required above, the Pathline Park 9 & 10 Borrower may deliver to the lender either (i) one or more letters of credit or (ii) a reserve guaranty from a guarantor that is an affiliate of the Pathline Park 9 & 10 Borrower that either (a) maintains an investment grade rating or (b) has been reasonably approved by the lender and for which the lender has received rating agency confirmation with respect to such event.
Lockbox and Cash Management. The Pathline Park 9 & 10 Whole Loan is structured with an in-place hard lockbox and springing cash management. The Pathline Park 9 & 10 Borrower is required to deposit all rents within three business days of receipt, and to direct all tenants to make direct rent deposits into the lockbox account. As long as a Cash Trap Event Period is not in effect, all funds in the lockbox account are required to be distributed to the Pathline Park 9 & 10 Borrower. During a Cash Trap Event Period, all funds in the lockbox account are required to be swept to a lender-controlled cash management account. Any excess cash flow remaining after satisfaction of the waterfall items outlined in the loan documents is required (i) if an Excess Cash Flow Sweep Stop (as defined below) is not in effect, to be swept to an excess cash flow subaccount controlled by the lender as additional security for the Pathline Park 9 & 10 Whole Loan or (ii) if an Excess Cash Flow Sweep Stop is in effect, to be disbursed to the Pathline Park 9 & 10 Borrower (excluding the $1,648,887.50 required to remain in the excess cash flow subaccount).
An “Excess Cash Flow Sweep Stop” will be in effect during a Cash Trap Event Period if, as of any monthly payment date during such Cash Trap Event Period, (i) no event of default is continuing and (ii) the total undisbursed funds then on deposit in the excess cash flow subaccount on such monthly payment date are at least $1,648,887.50.
A “Cash Trap Event Period” will commence upon the earlier of the following:
| (i) | the occurrence of an event of default; or |
| (ii) | the net cash flow debt service coverage ratio (based on a hypothetical 30-year amortization period) being less than 1.15x. |
A Cash Trap Event Period will end upon the occurrence of the following:
| ● | with regard to clause (i), the cure of such event of default; or |
| ● | with regard to clause (ii), the net cash flow debt service coverage ratio (based on a hypothetical 30-year amortization period) being equal to or greater than 1.20x for two consecutive calendar quarters. |
Additional Secured Indebtedness (not including trade debts). The Pathline Park 9 & 10 Property also secures the Pathline Park 9 & 10 Serviced Pari Passu Companion Loans, which have an aggregate Cut-off Date principal balance of $40,000,000. The Pathline Park 9 & 10 Serviced Pari Passu Companion Loans accrue interest at the same rate as the Pathline Park 9 & 10 Mortgage Loan. The Pathline Park 9 & 10 Mortgage Loan is entitled to payments of principal and interest on a pro rata and pari passu basis with the Pathline Park 9 & 10 Serviced Pari Passu Companion Loans. The holders of the Pathline Park 9 & 10 Mortgage Loan and the Pathline Park 9 & 10 Serviced Pari Passu Companion Loans have entered into a co-lender agreement which sets forth the allocation of collections on the Pathline Park 9 & 10 Whole Loan. See “Description of the Mortgage Pool—The Whole Loans—The Serviced Pari Passu Whole Loans”.
Mezzanine Loan and Preferred Equity. Not permitted.
Release of Property. Not permitted.
This is not a research report and was not prepared by any Underwriter’s research department. Please see additional important information and qualifications at the end of this Term Sheet.
41
| Office – Suburban | Loan #1 | Cut-off Date Balance: | $90,000,000 | |
| 625 North Mary Avenue and 925 West | Pathline Park 9 & 10 | Cut-off Date LTV: | 51.8% | |
| Maude Avenue | UW NCF DSCR: | 3.87x | ||
| Sunnyvale, CA 94085 | UW NOI Debt Yield: | 10.2% |
Letter of Credit. None.
Ground Lease. None.
Right of First Offer/Right of First Refusal. None.
Terrorism Insurance. The Pathline Park 9 & 10 Whole Loan documents require that the “all risk” insurance policy required to be maintained by the Pathline Park 9 & 10 Borrower provide coverage for terrorism in an amount equal to the full replacement cost of the Pathline Park 9 & 10 Property, as well as business interruption insurance covering no less than the 18-month period following the occurrence of a casualty event, together with a 12-month extended period of indemnity (provided that if TRIPRA or a similar statute is not in effect, the Pathline Park 9 & 10 Borrower will not be obligated to pay terrorism insurance premiums in excess of two times the premium for the casualty and business interruption coverage on a stand-alone basis).
This is not a research report and was not prepared by any Underwriter’s research department. Please see additional important information and qualifications at the end of this Term Sheet.
42
(THIS PAGE INTENTIONALLY LEFT BLANK)
This is not a research report and was not prepared by any Underwriter’s research department. Please see additional important information and qualifications at the end of this Term Sheet.
43
| Retail - Luxury Retail | Loan #2 | Cut-off Date Balance: | $90,000,000 | |
| 151 NE 40th Street | Miami Design District | Cut-off Date LTV: | 46.7% | |
| Miami, FL 33137 | UW NCF DSCR: | 2.14x | ||
| UW NOI Debt Yield: | 9.3% |

This is not a research report and was not prepared by any Underwriters research department. Please see additional important information and qualifications at the end of this Term Sheet.
44
| Retail - Luxury Retail | Loan #2 | Cut-off Date Balance: | $90,000,000 | |
| 151 NE 40th Street | Miami Design District | Cut-off Date LTV: | 46.7% | |
| Miami, FL 33137 | UW NCF DSCR: | 2.14x | ||
| UW NOI Debt Yield: | 9.3% |
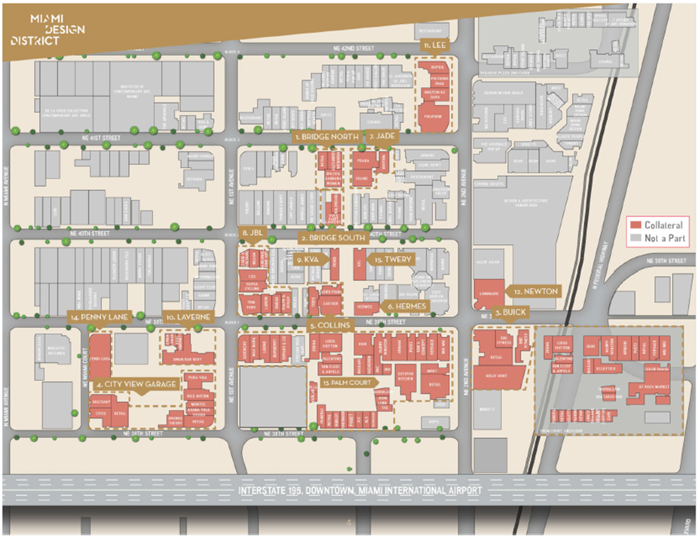
This is not a research report and was not prepared by any Underwriters research department. Please see additional important information and qualifications at the end of this Term Sheet.
45
| Retail - Luxury Retail | Loan #2 | Cut-off Date Balance: | $90,000,000 | |
| 151 NE 40th Street | Miami Design District | Cut-off Date LTV: | 46.7% | |
| Miami, FL 33137 | UW NCF DSCR: | 2.14x | ||
| UW NOI Debt Yield: | 9.3% |
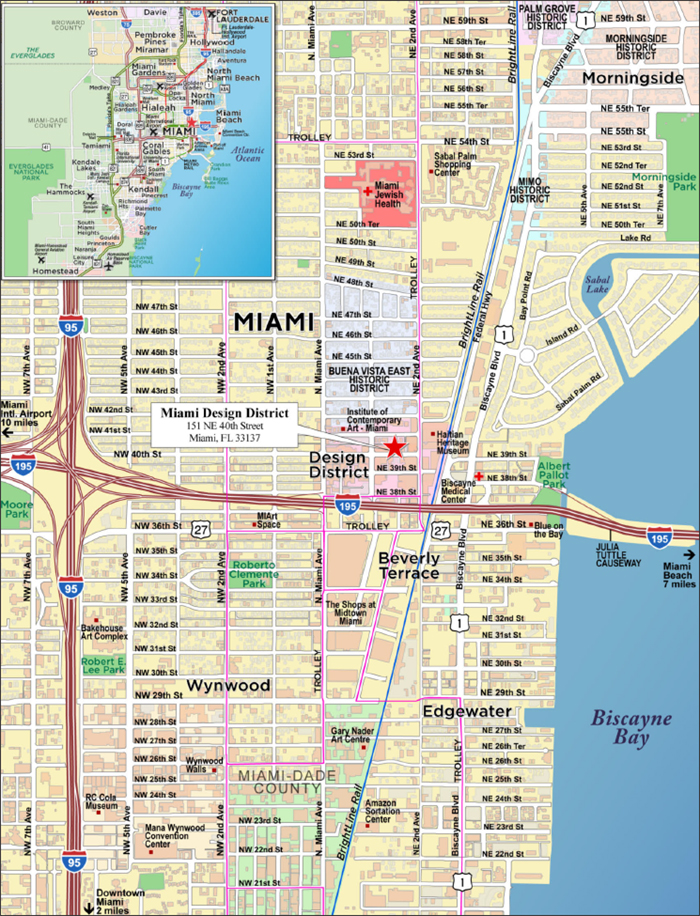
This is not a research report and was not prepared by any Underwriters research department. Please see additional important information and qualifications at the end of this Term Sheet.
46
| Mortgage Loan No. 2 – Miami Design District |
| Mortgage Loan Information | Property Information | |||||||
| Mortgage Loan Seller: | BANA | Single Asset/Portfolio: | Single Asset | |||||
| Credit Assessment (Moody’s/DBRSM/Fitch): | NR/NR/NR | Location: | Miami, FL 33137 | |||||
| Original Balance(1): | $90,000,000 | General Property Type: | Retail | |||||
| Cut-off Date Balance(1): | $90,000,000 | Detailed Property Type: | Luxury Retail | |||||
| % of Initial Pool Balance: | 9.9% | Title Vesting: | Fee | |||||
| Loan Purpose: | Refinance | Year Built/Renovated: | 2014-2019 / N/A | |||||
| Borrower Sponsor: | Miami Design District Associates, LLC | Size: | 497,094 SF | |||||
| Guarantor: | Miami Design District Associates, LLC | Cut-off Date Balance Per SF(1): | $805 | |||||
| Mortgage Rate: | 4.1325% | Maturity Date Balance Per SF(1): | $805 | |||||
| Note Date: | 2/28/2020 | Property Manager: | Design District Management, Inc. | |||||
| First Payment Date: | 4/1/2020 | (borrower-related) | ||||||
| Maturity Date: | 3/1/2030 | |||||||
| Original Term to Maturity: | 120 months | |||||||
| Original Amortization Term: | 0 months | |||||||
| IO Period: | 120 months | Underwriting and Financial Information(5) | ||||||
| Seasoning: | 12 months | UW NOI: | $37,034,101 | |||||
| Prepayment Provisions(2): | LO (36); DEF (77); O (7) | UW NOI Debt Yield(1): | 9.3% | |||||
| Lockbox/Cash Mgmt Status: | Hard/Springing | UW NOI Debt Yield at Maturity(1): | 9.3% | |||||
| Additional Debt Type(1)(3): | Pari Passu/B-Note | UW NCF DSCR(1): | 2.14x | |||||
| Additional Debt Balance(1)(3): | $310,000,000 / $100,000,000 | Most Recent NOI: | $32,810,895 (12/31/2020) | |||||
| Future Debt Permitted (Type): | No (N/A) | 2nd Most Recent NOI: | $33,817,392 (12/31/2019) | |||||
| Reserves(4) | 3rd Most Recent NOI: | $32,133,624 (12/31/2018) | ||||||
| Type | Initial | Monthly | Cap | Most Recent Occupancy: | 88.5% (9/1/2020) | |||
| RE Taxes: | $2,100,000 | $525,000 | N/A | 2nd Most Recent Occupancy: | 92.4% (12/31/2019) | |||
| Insurance: | $0 | Springing | N/A | 3rd Most Recent Occupancy: | 93.1% (12/31/2018) | |||
| Replacement Reserve: | $0 | $8,285 | N/A | Appraised Value (as of)(6): | $856,000,000 (3/1/2020) | |||
| TI/LC Reserve: | $4,907,050 | $82,849 | N/A | Appraised Value Per SF(6): | $1,722 | |||
| Free/Gap Rent Reserve: | $1,724,567 | $0 | N/A | Cut-off Date LTV Ratio(1)(6): | 46.7% | |||
| Debt Service Reserve: | $10,474,740 | $0 | N/A | Maturity Date LTV Ratio(1)(6): | 46.7% | |||
| Sources and Uses | ||||||
| Sources | Proceeds | % of Total | Uses | Proceeds | % of Total | |
| Whole Loan Amount(1): | $500,000,000 | 100.0% | Loan Payoff(7): | $476,005,977 | 95.2% | |
| Return of Equity: | $11,474,730 | 2.3% | ||||
| Reserves: | $8,731,617 | 1.7% | ||||
| Closing Costs: | $3,787,676 | 0.8% | ||||
| Total Sources: | $500,000,000 | 100.0% | Total Uses: | $500,000,000 | 100.0% | |
| (1) | The Miami Design District Mortgage Loan (as defined below) is part of the Miami Design District Whole Loan (as defined below), which is comprised of fifteen pari passu senior promissory notes and one subordinate note. The Cut-off Date Balance Per SF, Maturity Date Balance Per SF, UW NOI Debt Yield, UW NOI Debt Yield at Maturity, UW NCF DSCR, Cut-off Date LTV Ratio and Maturity Date LTV Ratio numbers presented above are based on the principal balance of the Miami Design District Senior Loan (as defined below). The Cut-off Date Balance Per SF, Maturity Date Balance Per SF, UW NOI Debt Yield, UW NOI Debt Yield at Maturity, UW NCF DSCR, Cut-off Date LTV Ratio and Maturity Date LTV Ratio based on the principal balance of the Miami Design District Whole Loan are $1,006, $1,006, 7.4%, 7.4%, 1.72x, 58.4% and 58.4%, respectively. |
| (2) | Defeasance of the Miami Design District Whole Loan is permitted at any time after the earlier to occur of (a) the end of the two-year period commencing on the closing date of the securitization of the last portion of the Miami Design District Whole Loan to be securitized and (b) March 1, 2025. The assumed prepayment lockout period of 36 payments is based on the closing date of this transaction in March 2021. |
| (3) | See “Additional Secured Indebtedness (not including trade debts)” below for further discussion of additional debt. |
| (4) | See “Escrows and Reserves” below for further discussion of reserve information. |
| (5) | The appraised value was determined prior to the emergence of the novel coronavirus and the economic disruption resulting from measures to combat the coronavirus. In addition, the novel coronavirus pandemic is an evolving situation and could impact the Miami Design District Whole Loan more severely than assumed in the underwriting of the Miami Design District Whole Loan and could adversely affect the NOI, NCF and occupancy information, as well as the appraised value and the DSCR, LTV and Debt Yield metrics presented above and herein. See "Risk Factors–Risks Related to Market Conditions and Other External Factors–The Coronavirus Pandemic Has Adversely Affected the Global Economy and Will Likely Adversely Affect the Performance of the Mortgage Loans" in the Preliminary Prospectus. |
| (6) | The appraisal also provided an “Upon Stabilization” value of $883,000,000 as of March 1, 2021, which value assumes physical and economic stabilization and results in an Appraised Value Per SF, Cut-off Date LTV Ratio and Maturity Date LTV Ratio of $1,776, 45.3% and 45.3%, respectively, based on the principal balance of the Miami Design District Senior Loan. The appraisal also provided a “land” value of $600,000,000 for the land portion (assumed unimproved) of the Miami Design District Property (as defined below), which value would result in a Cut-off Date LTV Ratio and Maturity Date LTV Ratio of 66.7% and 66.7%, respectively, based on the principal balance of the Miami Design District Senior Loan. |
| (7) | Loan Payoff includes existing debt secured by components of the larger Miami Design District that are not collateral for the Miami Design District Whole Loan. |
This is not a research report and was not prepared by any Underwriters research department. Please see additional important information and qualifications at the end of this Term Sheet.
47
| Retail - Luxury Retail | Loan #2 | Cut-off Date Balance: | $90,000,000 | |
| 151 NE 40th Street | Miami Design District | Cut-off Date LTV: | 46.7% | |
| Miami, FL 33137 | UW NCF DSCR: | 2.14x | ||
| UW NOI Debt Yield: | 9.3% |
The Mortgage Loan. The second largest mortgage loan (the “Miami Design District Mortgage Loan”) is part of a whole loan (the “Miami Design District Whole Loan”) evidenced by fifteen pari passu senior promissory notes in the aggregate original principal amount of $400,000,000 (together, the “Miami Design District Senior Loan”) and one note in the original principal amount of $100,000,000 (the “Miami Design District Subordinate Companion Loan”) that is subordinate to the Miami Design District Senior Loan. The Miami Design District Whole Loan is secured by a first priority fee mortgage encumbering a 497,094 SF luxury retail development located in Miami, Florida (the “Miami Design District Property”). The Miami Design District Mortgage Loan is evidenced by the non-controlling Note A-4, Note A-8, Note A-10 and Note A-11 with an aggregate original principal amount of $90,000,000. The remaining promissory notes comprising the Miami Design District Whole Loan are summarized in the below table. The Miami Design District Whole Loan will be serviced pursuant to the pooling and servicing agreement for the BANK 2020-BNK30 securitization trust until the securitization of Note A-1, at which point it will be serviced pursuant to the pooling and servicing agreement for the securitization to which Note A-1 is contributed. See “Description of the Mortgage Pool—The Whole Loans—The Miami Design District Pari Passu-A/B Whole Loan” and “Pooling and Servicing Agreement—Servicing of the Non-Serviced Mortgage Loans” in the Preliminary Prospectus.
Miami Design District Whole Loan Summary | ||||
Note | Original Balance | Cut-off Date Balance | Note Holder | Controlling Piece |
| A-1, A-12, A-14, A-15 | $95,000,000 | $95,000,000 | Bank of America, N.A. | No |
| A-2, A-7 | $80,000,000 | $80,000,000 | BANK 2021-BNK31 | No |
| A-3, A-6 | $75,000,000 | $75,000,000 | BANK 2020-BNK30 | No |
| A-4, A-8, A-10, A-11 | $90,000,000 | $90,000,000 | BANK 2021-BNK32 | No |
| A-5, A-9, A-13 | $60,000,000 | $60,000,000 | 3650 REIT | No |
| B | $100,000,000 | $100,000,000 | Third Party Investor | Yes(1) |
| Total (Whole Loan) | $500,000,000 | $500,000,000 | ||
| (1) | Pursuant to the related co-lender agreement, the holder of Note B is the controlling noteholder unless a “control appraisal period” has occurred and is continuing under the co-lender agreement, in which case Note A-1 will become the controlling noteholder. |
The Borrower and the Borrower Sponsor. The borrower is Oak Plaza Associates (Del.) LLC (the “Miami Design District Borrower”), a Delaware limited liability company structured to be bankruptcy-remote with at least two independent directors.
The borrower sponsor and non-recourse carveout guarantor is Miami Design District Associates, LLC, a partnership between Dacra (38.75%), L Catterton Real Estate (38.75%), and Brookfield Property Partners (22.265%).
Dacra is a real estate development company founded in 1987 that has developed over 2.0 million SF of commercial, residential and mixed-use communities. Dacra has played an active role in revitalization efforts and redevelopment in Miami and Miami Beach. In addition to the Miami Design District, Dacra has developed real estate projects in South Beach’s Art Deco District and on Lincoln Road. Since the 1990’s, Dacra had been aggregating the land for the Miami Design District, with the vision of transforming the area into a retail, art and dining destination. In 2010, Dacra partnered with L Catterton Real Estate, a Catterton, LVMH and Groupe Arnault-sponsored global real estate development and investment fund specializing in creating luxury shopping destinations. The partnership brought LVMH brands, including Louis Vuitton, Dior, Fendi, Bulgari, Celine, Berluti, Hermes and Cartier to the Miami Design District, which paved the way for other global luxury brands and upscale contemporary brands to follow. Dacra and L Catterton Real Estate completed the first phase of the Miami Design District in 2012. In 2014, a joint venture between General Growth Properties (now Brookfield Property Partners (NASDAQ: BPY)) and Ashkenazy Acquisition Corp. acquired an interest in the Miami Design District. Brookfield Property Partners is a diversified global real estate company that owns, operates and develops one of the largest portfolios of office, retail, multifamily, industrial, hospitality, triple net lease, self-storage, student housing and manufactured housing assets.
The borrower sponsor owns approximately 20 acres (developed and available for future development) in the Miami Design District, of which the Miami Design District Property represents 7.4 acres. The Miami Design District Borrower covenanted that its affiliates will not, without the consent of the lender, (i) develop such parcels held for future development in a manner that would materially interfere with the continued use and operation of the Miami Design District Property, or (ii) engage in any leasing that would result in a material adverse effect to the Miami Design District Property.
The Property. The Miami Design District Property is a 497,094 SF portion of a Class A luxury retail development known as the Miami Design District in Miami, Florida. The Miami Design District is a LEED Neighborhood Development located at the northwest quadrant of Interstate 195 and N Federal Highway that was designed as a creative neighborhood for shopping, dining and contemporary public art exhibitions. The Miami Design District encompasses approximately 30 acres in a walkable urban environment, and is home to more than 120 flagship stores, including luxury brand retailers and jewelers Balenciaga, Hermes, Fendi, Dior, Cartier and Louis Vuitton. The Miami Design District also includes design showrooms, art galleries and cultural institutions, including The Institute of Contemporary Art Miami (ICA), de la Cruz Collection Contemporary Art Space, Locust Projects Alternative Art Space and the Haitian Heritage Museum. The buildings within the Miami Design District are arranged along a typical urban street block grid system, with on-street metered parking and a north/south running pedestrian-only corridor through the center, known as Paseo Ponti.
The Miami Design District Property consists of 15 buildings that were redeveloped between 2014 and 2019 from former warehouse, showroom and industrial space. The Miami Design District Property includes a total of 497,094 SF of rentable space plus 559 total parking spaces located in two garages. Many of the buildings are built-to-suit for luxury retailers, both with respect to the interior buildouts and exterior facades. As of September 1, 2020, the Miami Design District Property was 88.5% leased. The largest tenants by base rent include Hermes, Harry Winston, Holly Hunt, Fendi Casa/Luxury Living and Tom Ford, with no other tenant representing more than 3.1% of underwritten base rent. Overall property sales for tenants who report at the Miami Design District Property increased 29.5% from 2018 to 2019 to $1,002 PSF ($231.5 million total sales). For year-end 2020, (including the months March through May 2020, when the Miami Design District Property was closed) the total sales for the tenants who report was $208.7 million ($947 PSF).
This is not a research report and was not prepared by any Underwriters research department. Please see additional important information and qualifications at the end of this Term Sheet.
48
| Retail - Luxury Retail | Loan #2 | Cut-off Date Balance: | $90,000,000 | |
| 151 NE 40th Street | Miami Design District | Cut-off Date LTV: | 46.7% | |
| Miami, FL 33137 | UW NCF DSCR: | 2.14x | ||
| UW NOI Debt Yield: | 9.3% |
| Property Summary | |||||
| Building | Year Built/ Renovated | Stories | Rentable SF | Occupancy | Major Tenants |
| Bridge South | 2017 | 2 | 7,076 | 100.0% | Yves Saint Laurent (4,183 SF) Balenciaga (2,893 SF) |
| Bridge North | 2017 | 2 | 12,603 | 100.0% | Dolce & Gabbana (5,320 SF) Alexander McQueen (4,460 SF) Mason Margiela (2,823 SF) |
| Buick | 1926/2015 | 4 | 82,396 | 97.1% | Holly Hunt (24,897 SF) Dacra (18,828 SF)(1) MDDA (Management Office) (10,776 SF)(1) |
| City View Garage | 2015 | 7 | 40,853 | 84.3% | Luxury Brand Partners (18,077 SF) Pura Vida (2,977 SF) Citco (2,614 SF) Rise Nation (2,613 SF) |
| Collins | 2015 | 2 | 17,026 | 100.0% | Cartier (7,735 SF) Loro Piana (4,767 SF) Tod’s (4,524 SF) |
| Hermes | 2015 | 3 | 13,500 | 100.0% | Hermes (13,500 SF) |
| Jade | 2017 | 3 | 15,324 | 100.0% | Prada (6,442 SF) Celine (5,191 SF) Okami (Ovation) (3,691 SF) |
| JBL | 2014 | 3 | 42,082 | 77.6% | Tom Ford (8,582 SF) COS (4,886 SF) Lanvin (3,367 SF) Omega (3,152 SF) |
| KVA | 2006 | 2 | 5,384 | 100.0% | Fendi (5,384 SF) |
| Laverne | 1961/2017 | 1 | 12,257 | 95.3% | Swan and Bar Bevy (10,180 SF) |
| Lee | 1955/2017 | 3 | 54,961 | 77.9% | Poliform (8,902 SF) Unifor, Inc. (Moltini) (7,384 SF) Dupuis (6,323 SF) Poltrona Frau (5,842 SF) |
| Newton | 1983/2018 | 2 | 15,000 | 100.0% | Luminaire (15,000 SF) |
| Palm Court | 2014 | 2 | 148,993 | 82.4% | Christian Dior (10,595 SF) Louis Vuitton (10,244 SF) St. Roche (MIA Market) (9,292 SF) Harry Winston (7,219 SF) Giorgio Armani (6,976 SF) |
| Penny Lane | 2017 | 3 | 22,439 | 100.0% | Fendi Casa/Luxury Living (22,439 SF) |
| Twery | 2006 | 2 | 7,200 | 100.0% | OTL (7,200 SF) |
Source: Appraisal and the underwritten rent roll dated September 2020.
| (1) | Sponsor-affiliated office space. |
Major Tenants.
Hermes (13,500 SF, 2.7% of NRA, 4.4% of underwritten base rent). Hermes International (“Hermes”) designs, produces and distributes personal luxury accessories and apparel. The company is over 183 years old and operates 311 boutiques worldwide under the Hermes name that sell items such as leather, scarves, men's clothes, ties, women's fashions, perfume, watches, stationery, shoes, hats, gloves and jewelry. Hermes occupies its own building on a lease that expires in February 2025, with two five-year renewal options each with six months’ notice. Hermes is currently paying an annual rent of $112.55 PSF, with annual rent increases of 3%. If at any time less than six of the permanent retail store tenants (including Armani, Balenciaga, Bulgari, Burberry, Carolina Herrera, Cartier, Celine, Chanel, Chloe, Christian Louboutin, DeBeers, Dior, Dunhill, Fendi, Givenchy, Gucci, Kiton, LV, Marc Jacobs, Prada, Pucci, Tag Heuer, Tiffany, Tomas Maier, Van Cleef, Versace, YSL, and Zegna) are open and operating for a period of six or more consecutive months, then Hermes will have the right to pay alternate rent of 6% of gross sales. If such co-tenancy event continues for an additional 12 months (18 months total), then Hermes will have the right, within 30 days after the expiration of the 18 month period, to terminate the lease. Sales for Hermes at the Miami Design District Property were reported at $2,012 PSF, $2,127 PSF and $1,713 PSF for 2018, 2019 and 2020, respectively.
Harry Winston (7,219 SF, 1.5% of NRA, 4.4% of underwritten base rent). Founded in 1932, Harry Winston is a jewelry retailer known for its expertise, fine craftsmanship, quality gems and innovative gemstone settings. In 2013, the Swatch Group Ltd. acquired Harry Winston. Harry Winston has retail salons around the world, including locations in New York, London, Paris, Geneva, Tokyo, Hong Kong and Shanghai. Harry Winston occupies 7,219 SF in the Palm Court building on a lease that expires in March 2025. Harry Winston is currently paying annual rent of $202.69 PSF, with annual rent increases of 3%. If at any time at least six of the permanent retail store tenants (including Bulgari, Cartier, Chanel, Dior, Dior Homme, Dolce G, Fendi, Giorgio, Gucci, Hermes, J.P. Tod’s, LV, Prada, Tag Heuer, Tiffany, Valentino, YSL, Zegna, and Zenith) (three of which must be Cartier, Dior, Hermes and LV) are not open and operating for a period of twelve consecutive months, then Harry Winston will have the right to pay alternate rent of 6% of gross sales or terminate the lease within 30 days after those twelve months. If such co-tenancy event continues for an additional 12 months (24 months total), then Harry Winston will have the right, within 30 days after the expiration of the 24 month period, to terminate the lease. Sales for Harry Winston at the Miami Design District Property were reported at $626 PSF, $505 PSF and $255 PSF for 2018, 2019 and 2020, respectively.
Holly Hunt (24,897 SF, 5.0% of NRA, 3.6% of underwritten base rent). Founded in 1983, Holly Hunt is a luxury home furnishing showroom with products including indoor and outdoor furniture, lighting, rugs, textiles and leathers. Holly Hunt partners with iconic modern brands such as Vladimir Kagan furniture designs and Assemblage bespoke wallcoverings. Holly Hunt renewed its lease in May 2020 for 24,897 SF of showroom/gallery space in the Buick building. The lease expires on April 30, 2025. Holly Hunt is currently paying annual rent of $50.21 PSF, with annual rent increases of 3.0% starting May 1, 2021. The lease does not have any renewal or termination options.
This is not a research report and was not prepared by any Underwriters research department. Please see additional important information and qualifications at the end of this Term Sheet.
49
| Retail - Luxury Retail | Loan #2 | Cut-off Date Balance: | $90,000,000 | |
| 151 NE 40th Street | Miami Design District | Cut-off Date LTV: | 46.7% | |
| Miami, FL 33137 | UW NCF DSCR: | 2.14x | ||
| UW NOI Debt Yield: | 9.3% |
Fendi Casa/Luxury Living (22,439 SF, 4.5% of NRA, 3.4% of underwritten base rent). Founded nearly 40 years ago, Fendi Casa/Luxury Living designs, manufactures in Italy, and distributes high-end furniture for international luxury brands. Luxury Living Group has been producing and distributing furniture for the collections of Fendi Casa, Bentley Home, Trussardi Casa, Bugatti Home, Paul Mathieu for Luxury Living Collections and Luxury Living Outdoor. Fendi Casa/Luxury Living occupies 22,439 SF in the Penny Lane building on a lease that expires on April 16, 2027. The lease requires current annual base rent of $52.00 PSF and the next rent increase will be the greater of (i) 4% of the immediately preceding base rent or (ii) base rent multiplied by a fraction of (a) CPI of the month preceding the adjustment over (b) CPI of April 2017. The lease does not have any renewal or termination options.
Tom Ford (8,582 SF, 1.7% of NRA, 3.4% of underwritten base rent). In April 2005, Tom Ford announced the creation of the Tom Ford brand for luxury clothing, accessories, fragrance and cosmetics. Ford was joined in this venture by former Gucci Group President and Chief Executive Officer Domenico De Sole, who serves as Chairman of the company. That same year, Ford announced his partnership with Marcolin Group to produce and distribute optical frames and sunglasses, as well as an alliance with Esteé Lauder to create the Tom Ford Beauty brand. Presently, there are 113 freestanding Tom Ford stores and shop-in-shops in locations such as New York, Toronto, Beverly Hills, Zurich, Milan, Hong Kong, Shanghai, Rome, London and Sydney. Tom Ford occupies 8,582 SF in the JBL building under a lease that expires in March 2025. Tom Ford is currently paying an annual rent of $134.74 PSF with 3% annual increases. The lease does not have any renewal or termination options. Sales for Tom Ford at the Miami Design District Property were reported at $563 PSF, $785 PSF and $634 PSF for 2018, 2019 and 2020, respectively.
The following table presents certain information relating to the major tenants at the Miami Design District Property:
| Tenant Summary(1) | ||||||||||||
| % of | 2020 Sales(2) | |||||||||||
| Tenant Name | Tenant Type | Credit Rating (Fitch/ Moody’s/ S&P) | Tenant SF | Approx. % of SF | Annual UW Rent | Total Annual UW Rent | Annual UW Rent PSF | $ | PSF | Occ. Cost % | Lease Exp. | Term. Options |
| Hermes | Fashion | NR/NR/NR | 13,500 | 2.7% | $1,519,425 | 4.4% | $112.55 | $23,119,936 | $1,713 | 10.2% | 2/23/2025 | N |
| Harry Winston | Jewelry/Watches | NR/NR/NR | 7,219 | 1.5% | $1,507,111 | 4.4% | $208.77 | $1,837,265 | $255 | 109.3% | 3/31/2025 | N |
| Holly Hunt | Showroom/Gallery | NR/NR/NR | 24,897 | 5.0% | $1,250,000 | 3.6% | $50.21 | NAV | NAV | NAV | 4/30/2025 | N |
| Fendi Casa/Luxury Living | Showroom/Gallery | NR/NR/NR | 22,439 | 4.5% | $1,166,828 | 3.4% | $52.00 | NAV | NAV | NAV | 4/16/2027 | N |
| Tom Ford | Fashion | NR/NR/NR | 8,582 | 1.7% | $1,156,342 | 3.4% | $134.74 | $5,441,943 | $634 | 30.1% | 3/31/2025 | N |
| Subtotal/Wtd. Avg. | 76,637 | 15.4% | $6,599,706 | 19.2% | $86.12 | |||||||
| Other Tenants | 363,340 | 73.1% | $27,857,171 | 80.8% | $76.67 | |||||||
| Vacant | 57,117 | 11.5% | $0 | 0.0% | $0.00 | |||||||
| Total/Wtd. Avg.(3) | 497,094 | 100.0% | $34,456,877 | 100.0% | $78.32 | |||||||
| (1) | Information is based on the underwritten rent roll dated September 2020. Tenants ordered by % of Total Annual UW Rent. |
| (2) | Information is as of December 31, 2020, as provided by the borrower sponsors. The sales include the months March through May 2020, when the Miami Design District Property was closed. As of December 31, 2019, Hermes reported sales PSF and occupancy cost of $2,127 and 8.2%, respectively. As of December 31, 2019, Harry Winston reported sales PSF and occupancy cost of $505 and 55.0%, respectively. As of December 31, 2019, Tom Ford reported sales PSF and occupancy cost of $785 and 24.3%, respectively. |
| (3) | Total/Wtd. Avg. Annual UW Rent PSF excludes vacant space. |
This is not a research report and was not prepared by any Underwriters research department. Please see additional important information and qualifications at the end of this Term Sheet.
50
| Retail - Luxury Retail | Loan #2 | Cut-off Date Balance: | $90,000,000 | |
| 151 NE 40th Street | Miami Design District | Cut-off Date LTV: | 46.7% | |
| Miami, FL 33137 | UW NCF DSCR: | 2.14x | ||
| UW NOI Debt Yield: | 9.3% |
The following table presents certain information relating to the lease rollover schedule at the Miami Design District Property:
| Lease Rollover Schedule(1)(2) | ||||||||
| Year | # of Leases Rolling | SF Rolling | UW Rent PSF Rolling | Approx. % of Total SF Rolling | Approx. Cumulative % of SF Rolling | Total UW Rent Rolling | Approx. % of Total Rent Rolling | Approx. Cumulative % of Total Rent Rolling |
| MTM/2020 | 9 | 29,128 | $13.79 | 5.9% | 5.9% | $401,585 | 1.2% | 1.2% |
| 2021 | 8 | 18,240 | $41.38 | 3.7% | 9.5% | $754,850 | 2.2% | 3.4% |
| 2022 | 13 | 39,196 | $39.02 | 7.9% | 17.4% | $1,529,325 | 4.4% | 7.8% |
| 2023 | 8 | 39,034 | $29.29 | 7.9% | 25.3% | $1,143,141 | 3.3% | 11.1% |
| 2024 | 10 | 50,071 | $96.94 | 10.1% | 35.3% | $4,853,973 | 14.1% | 25.2% |
| 2025 | 29 | 143,457 | $108.13 | 28.9% | 64.2% | $15,511,582 | 45.0% | 70.2% |
| 2026 | 1 | 5,384 | $110.40 | 1.1% | 65.3% | $594,394 | 1.7% | 71.9% |
| 2027 | 7 | 43,506 | $95.57 | 8.8% | 74.0% | $4,157,724 | 12.1% | 84.0% |
| 2028 | 8 | 44,058 | $88.11 | 8.9% | 82.9% | $3,881,931 | 11.3% | 95.3% |
| 2029 | 2 | 9,300 | $63.60 | 1.9% | 84.8% | $591,460 | 1.7% | 97.0% |
| 2030 | 2 | 7,827 | $132.48 | 1.6% | 86.3% | $1,036,912 | 3.0% | 100.0% |
| 2031 & Beyond(3) | 1 | 10,776 | $0.00 | 2.2% | 88.5% | $0 | 0.0% | 100.0% |
| Vacant | 0 | 57,117 | $0.00 | 11.5% | 100.0% | $0 | 0.0% | 100.0% |
| Total/Wtd. Avg.(4) | 98 | 497,094 | $78.32 | 100.0% | $34,456,877 | 100.0% | ||
| (1) | Information is based on the underwritten rent roll dated September 2020. |
| (2) | Certain tenants may have lease termination options that are exercisable prior to the originally stated expiration date of the subject lease and that are not considered in the Lease Rollover Schedule. |
| (3) | 2031 & Beyond includes space for a management office that has no rent associated with it. |
| (4) | Total/Wtd. Avg. UW Rent PSF Rolling excludes vacant space. |
COVID-19 Update. The Miami Design District Whole Loan is current as of the March 2021 debt service payment. Pursuant to a loan amendment dated April 29, 2020, debt service for the months of May, June and July 2020 was deferred until the maturity date or earlier repayment of the Miami Design District Whole Loan. Additionally, pursuant to a loan amendment dated October 2020, the Miami Design District Borrower deposited $10,474,740 as a debt service reserve (see “Escrows and Reserves” below) and postponed any test for a Trigger Period (see “Lockbox and Cash Management” below) until the quarter commencing April 1, 2021. The Miami Design District Property was closed between March 19 and May 18, 2020 due to COVID-19 restrictions, and was closed for ten days in June 2020 due to civil unrest, over which time no damage occurred. As of November 6, 2020, the borrower sponsor has reported that the Miami Design District Property is open and operating with safety precautions including reduced hours (Monday – Saturday: 11am – 7pm and Sunday: 12pm – 5pm), rigorous cleaning protocols, masks and hand sanitizer stations, complimentary in-house personal shoppers to shop and deliver goods to customers, and contactless parking and free valet service. Many retailers and restaurants are offering curbside pick-up. Two tenants (0.7% of NRA and 0.8% of underwritten base rent) fully or partially abated their rent for January and February 2021 as previously agreed upon with the Miami Design District Borrower. Fourteen tenants (7.9% of NRA and 8.2% of underwritten base rent) did not make rent payments in February 2021. 91.1% of tenants by NRA and 91.8% of tenants by underwritten base rent have paid their full February 2021 rent payments.
The Market. The Miami Design District Property is located in the Buena Vista neighborhood, in the northeastern portion of Miami, Florida. According to the appraisal, the Miami-Fort Lauderdale-West Palm Beach metro area (“Miami MSA”) had a population of approximately 2.79 million, with a 3.4% unemployment rate and a 6.0% personal income growth rate for 2019. Major employers include University of Miami, Jackson Health System, Publix Super Markets, Inc., Baptist Health Systems of Southern Florida and American Airlines. The Miami MSA has an international draw, ranking first in the country in immigration by ratio to population, ranking second in the country in overseas visitors (after New York City) and ranking second in the country in international cargo receipts (after Anchorage). The Miami MSA is the only metro area in the country where more than half of its residents are foreign-born.
Primary access to the Miami Design District Property is by Interstates 95 and 195 via Biscayne Boulevard or Miami Avenue, and by neighborhood north/south roadways including NW 2nd Avenue, N Miami Avenue, NE 2nd Avenue and Federal Highway, between east/west roadways from NE 38th Street to NE 54th Street. The Miami International Airport is located approximately 7.0 miles west, the Miami central business district is located approximately 5.0 miles south, and South Beach is located approximately 6.5 miles southeast of the Miami Design District Property.
The Miami Design District is a part of the Wynwood-Design District commercial real estate submarket and is known to be a creative neighborhood and shopping destination dedicated to innovative fashion, design, art, architecture and dining. The area contains multiple retail, design and furniture showroom properties which together draw regional demand from both local shoppers and tourists. For 2019, the Wynwood-Design District submarket had approximately 3.5 million SF of inventory (71,010 SF of new completions), with a 10.2% vacancy rate and overall asking rents of $59.53 PSF. Within the 0.25-mile radius of the Miami Design District Property, 2019 inventory was approximately 1.2 million SF (43,327 SF of new completions), with a 6.7% vacancy rate and overall asking rents of $85.95 PSF.
According to the appraisal, the estimated 2019 population within a one-, three- and five-mile radius of the Miami Design District Property was 33,589, 216,668 and 572,510, respectively. The estimated 2019 average household income within the same radii was $68,975, $57,649 and $68,788, respectively.
This is not a research report and was not prepared by any Underwriters research department. Please see additional important information and qualifications at the end of this Term Sheet.
51
| Retail - Luxury Retail | Loan #2 | Cut-off Date Balance: | $90,000,000 | |
| 151 NE 40th Street | Miami Design District | Cut-off Date LTV: | 46.7% | |
| Miami, FL 33137 | UW NCF DSCR: | 2.14x | ||
| UW NOI Debt Yield: | 9.3% |
The following table presents recent leasing data at comparable retail properties with respect to the Miami Design District Property:
| Comparable Lease Summary | |||||||
Property Address | Year Built | Distance from Subject | Center | Anchor/ Notable Tenants | Occupancy | Sales PSF | NNN Rent PSF |
Miami Design District 151 NE 40th Street Miami, FL | 2014-2019 | N/A | 497,094(1) | Hermes, Christian Dior, Louis Vuitton, Cartier, Tom Ford, Prada, Tiffany & Co., Van Kleef & Arpels, Dolce & Gabbana, Yves Saint Laurent, Tod's, Omega, Fendi, A. Lange Sohne, Versace,Tag Heuer, Giorgio Armani, Bulgari, Valentino, IWC | 88.5%(1) | $947(2) | $50 - $125 |
Bal Harbour Shops 9700 Collins Avenue Bal Harbour, FL | 1965, 1982 | 9.0 miles | 463,114 | Saks 5th Avenue, Neiman Marcus, Dolce & Gabbana, Balenciaga, Gucci, Loro Piana, Prada, Ralph Lauren, Saint Laurent Paris, Valentino, Chanel, Dior, Fendi, Louis Vuitton, Jimmy Choo, Bulgari, Panerai, Van Cleef & Arpels, Tiffany & Co. | (+/-) 99% | $3,530 | $200 - $350 |
Aventura Mall 19501 Biscayne Boulevard Aventura, FL | 1983, 1997, 2008, 2017 | 15.0 miles | 2,086,948 | Nordstrom, Macy's, Bloomingdales, JC Penney, Apple, Chanel, Louis Vuitton, Gucci, Cartier, Burberry, Fendi, Tag Heuer, Tiffani & Co., Givenchy, Rolex | (+/-) 98% | $1,625 | $150 - $250 |
Brickell City Center 701 S Miami Avenue Miami, FL | 2016-2017 | 5.0 miles | 483,372 | Saks 5th Avenue, Apple, Coach, Cole Haan, Boss, Intermix, IRO, Lululemon, Victoria's Secret, Pandora, Kendra Scott, Zara | (+/-) 95% | $1,055 | $50 - $175 |
Worth Avenue Retail 100-300 Worth Avenue Palm Beach, FL | 1938, 1983, 2010 | 70.0 miles | 250,000(3) | Saks 5th Avenue, Neiman Marcus, Bruno Cucinelli, Ralph Lauren, Loro Piana, Jimmy Choo, Tiffany & Co., Chanel, Intermix, Michael Kors, Valentino, MaxMara, Torneau, Louis Vuitton, Panerai, Hublot, Gucci | (+/-) 98% | N/A | $100 - $250 |
Lincoln Road Pedestrian Mall 400-1100 Lincoln Road Miami Beach, FL | 1950, 2006, 2010
| 5.5 miles | 500,000(3) | Nike, Anthropologie, Athleta, Guess, Banana Republic, GAP, H&M, Intermix, J. Crew, Pandora, Lululemon, Sephora, Zadig & Voltaire, Zara, Victoria's Secret, Macy's, Ross Dress for Less and Marshals | (+/-) 90% | N/A | $150 - $300 |
Source: Appraisal.
| (1) | Information obtained from underwritten rent roll dated September 2020. |
| (2) | Information is as of December 31, 2020, as provided by the borrower sponsors, and only includes tenants reporting sales. The Sales PSF include the months March through May 2020, when the Miami Design District Property was closed. |
| (3) | Represents approximate gross leasable area. |
The following table presents certain information relating to the appraisal’s market rent conclusions for the Miami Design District Property:
| Market Rent Summary | |||
| Market Rent (PSF) | Lease Term (Yrs) | Rental Increase Projection | |
| Retail Fashion | $115 | 10 | 3% per annum |
| Retail General | $40 | 10 | 3% per annum |
| Retail Jewelry | $180 | 10 | 3% per annum |
| Retail Restaurant - Full Service | $45 | 10 | 3% per annum |
| Retail Restaurant - Limited Service | $30 | 10 | 3% per annum |
| Retail Restaurant - Drink | $45 | 10 | 3% per annum |
| Retail Showroom | $45 | 10 | 3% per annum |
| Retail Art Gallery | $140 | 10 | 3% per annum |
| Retail Services | $45 | 10 | 3% per annum |
| Office | $27 | 10 | 3% per annum |
| Storage | $30 | 5 | 0% |
Source: Appraisal.
This is not a research report and was not prepared by any Underwriters research department. Please see additional important information and qualifications at the end of this Term Sheet.
52
| Retail - Luxury Retail | Loan #2 | Cut-off Date Balance: | $90,000,000 | |
| 151 NE 40th Street | Miami Design District | Cut-off Date LTV: | 46.7% | |
| Miami, FL 33137 | UW NCF DSCR: | 2.14x | ||
| UW NOI Debt Yield: | 9.3% |
Operating History and Underwritten Net Cash Flow. The following table presents certain information relating to the historical operating performance and Underwritten Net Cash Flow at the Miami Design District Property:
| Cash Flow Analysis | ||||||
| 2017 | 2018 | 2019 | 2020(1) | UW(2) | UW PSF | |
| Gross Potential Rent | $24,853,605 | $29,909,090 | $31,279,003 | $30,509,279 | $41,080,090 | $82.64 |
| Reimbursements | $12,575,427 | $14,238,369 | $15,158,900 | $14,515,124 | $14,928,995 | $30.03 |
| Other Income(3) | $3,986,235 | $3,979,719 | $4,136,244 | $1,811,327 | $3,655,678 | $7.35 |
| Vacancy and Concessions | $0 | $0 | $0 | $0 | ($6,623,213) | ($13.32) |
| Effective Gross Income | $41,415,267 | $48,127,178 | $50,574,148 | $46,835,731 | $53,041,550 | $106.70 |
| Real Estate Taxes | $4,610,638 | $5,462,967 | $5,582,649 | $4,926,795 | $6,140,915 | $12.35 |
| Insurance | $611,547 | $718,405 | $691,057 | $634,954 | $775,000 | $1.56 |
| Other Operating Expenses | $10,578,921 | $9,812,182 | $10,483,050 | $8,463,086 | $9,091,534 | $18.29 |
| Total Operating Expenses | $15,801,105 | $15,993,554 | $16,756,756 | $14,024,835 | $16,007,449 | $32.20 |
| Net Operating Income | $25,614,162 | $32,133,624 | $33,817,392 | $32,810,895 | $37,034,101 | $74.50 |
| TI/LC | $0 | $0 | $0 | $0 | $994,188 | $2.00 |
| CapEx | $0 | $0 | $0 | $0 | $99,419 | $0.20 |
| Net Cash Flow | $25,614,162 | $32,133,624 | $33,817,392 | $32,810,895 | $35,940,495 | $72.30 |
| Occupancy % | 87.0% | 93.1% | 92.4% | 88.5%(4) | 88.6% | |
| NOI DSCR(5) | 1.53x | 1.92x | 2.02x | 1.96x | 2.21x | |
| NCF DSCR(5) | 1.53x | 1.92x | 2.02x | 1.96x | 2.14x | |
| NOI Debt Yield(5) | 6.4% | 8.0% | 8.5% | 8.2% | 9.3% | |
| NCF Debt Yield(5) | 6.4% | 8.0% | 8.5% | 8.2% | 9.0% | |
| (1) | The Miami Design District Property was closed between March 19 and May 18, 2020 due to COVID-19 restrictions, and was closed for ten days in June 2020 due to civil unrest, over which time no damage occurred. |
| (2) | UW Gross Potential Rent is based on the September 2020 rent roll with adjustments made for executed leases and tenants that have vacated or are expected to vacate after loan closing. UW Gross Potential Rent includes grossed up vacant space of $6,623,213 and contractual rent increases through March 2021. |
| (3) | Other Income consists of parking income, temporary tenant income, events revenue, % in lieu, and overage rent. The 2020 period did not have other income from temporary tenant income, % in lieu, or overage rent. |
| (4) | Occupancy shown is as of September 1, 2020. |
| (5) | Debt service coverage ratios and debt yields are based on the Miami Design District Senior Loan and exclude the Miami Design District Subordinate Companion Loan. |
Escrows and Reserves.
Real Estate Taxes – The Miami Design District Borrower deposited at loan origination $2,100,000 to the real estate tax reserve and is required to deposit monthly to the reserve 1/12 of the annual estimated real estate taxes (currently $525,000).
Insurance – Unless the Miami Design District Property is covered by a blanket policy for which the premiums have been prepaid (as currently), the Miami Design District Borrower is required to deposit monthly 1/12 of the annual estimated insurance premiums to the insurance reserve.
Replacement Reserve – The Miami Design District Borrower is required to deposit monthly $8,285 for replacements to the Miami Design District Property.
TI/LC Reserve – The Miami Design District Borrower deposited at loan origination $4,907,050 for outstanding landlord obligations related to nine tenants and is required to deposit monthly $82,849 for future tenant improvements and leasing commissions.
Free/Gap Rent Reserve – The Miami Design District Borrower deposited at loan origination the amount of $1,724,567 for gap rent and free rent, which total reserve includes $460,756 of gap rent for periods of one to seven months related to four tenants and $1,263,811 of free rent through March 31, 2021 related to seven tenants.
Debt Service Reserve – The Miami Design District Borrower deposited on December 1, 2020 $10,474,740 (equal to 6 months of interest-only debt service on the Miami Design District Whole Loan) as a debt service reserve. So long as no event of default is continuing, funds in the debt service reserve began being applied to debt service payments in January 1, 2021.
Lockbox and Cash Management. The Miami Design District Whole Loan is structured with a hard lockbox and springing cash management. All rents from the Miami Design District Property are required to be deposited directly to the lockbox account and so long as a Trigger Period (as defined below) is not continuing, funds in the lockbox account will be transferred to the borrower’s operating account. During a Trigger Period, the Miami Design District Borrower will not have access to the funds in the lockbox account and such funds will be transferred on each business day to the lender-controlled cash management account and disbursed according to the Miami Design District Whole Loan documents. During a Trigger Period, all excess cash is required to be held by the lender as additional security for the Miami Design District Whole Loan; however, provided no event of default is continuing as to which the lender has accelerated the Miami Design District Whole Loan or initiated an enforcement action, the Miami Design District Borrower is permitted to use excess cash to pay the costs of replacements at the Miami Design District Property not otherwise included in the annual budget or to pay for leasing costs.
This is not a research report and was not prepared by any Underwriters research department. Please see additional important information and qualifications at the end of this Term Sheet.
53
| Retail - Luxury Retail | Loan #2 | Cut-off Date Balance: | $90,000,000 | |
| 151 NE 40th Street | Miami Design District | Cut-off Date LTV: | 46.7% | |
| Miami, FL 33137 | UW NCF DSCR: | 2.14x | ||
| UW NOI Debt Yield: | 9.3% |
A “Trigger Period” will occur during either (a) the period commencing upon the occurrence of an event of default and ending upon the cure or waiver of the event of default, or (b) the period beginning when the trailing six month (annualized) debt yield on the Miami Design District Whole Loan is less than 6.50% (tested quarterly beginning with the quarter commencing April 1, 2021, for two consecutive quarters) and ending when the trailing six month (annualized) debt yield on the Miami Design District Whole Loan is at least 6.50% (tested quarterly for two consecutive quarters).
Additional Secured Indebtedness (not including trade debts). The Miami Design District Property also secures eleven pari passu senior promissory notes (the “Miami Design District Non-Serviced Pari Passu Companion Loan”), which have an aggregate Cut-off Date principal balance of $310,000,000, and the Miami Design District Subordinate Companion Loan, which has a Cut-off Date principal balance of $100,000,000. The Miami Design District Non-Serviced Pari Passu Companion Loan and the Miami Design District Subordinate Companion Loan accrue interest at the same rate as the Miami Design District Mortgage Loan. The Miami Design District Mortgage Loan is entitled to payments of interest on a pro rata and pari passu basis with the Miami Design District Non-Serviced Pari Passu Companion Loan, which payments are senior in right of payment to the Miami Design District Subordinate Companion Loan. The holders of the promissory notes evidencing the Miami Design District Whole Loan have entered into a co-lender agreement that sets forth the allocation of collections on the Miami Design District Whole Loan. See “Description of the Mortgage Pool—The Whole Loans—The Miami Design District Pari Passu-A/B Whole Loan” and “Pooling and Servicing Agreement—Servicing of the Non-Serviced Mortgage Loans” in the Preliminary Prospectus.
Subordinate Note Summary | ||||||||
| B-Note Original Principal Balance | B-Note Interest Rate | Original Term (mos.) | Original Amort. Term (mos.) | Original IO Term (mos.) | Whole Loan UW NCF DSCR | Whole Loan UW NOI Debt Yield | Whole Loan Cut- off Date LTV | |
| Miami Design District Subordinate Companion Loan | $100,000,000 | 4.1325% | 120 | 0 | 120 | 1.72x | 7.4% | 58.4% |
Mezzanine Loan and Preferred Equity. Not permitted.
Release of Property. Not permitted.
Right of First Offer/Right of First Refusal. None.
Ground Lease. None.
Letter of Credit. None.
Terrorism Insurance. The Miami Design District Borrower is required to obtain and maintain property insurance that covers perils and acts of terrorism and is required to obtain and maintain business interruption insurance for 24 months plus a 12-month extended period of indemnity; provided that the Miami Design District Borrower will only be required to pay for terrorism insurance a maximum of two times the annual insurance premiums payable for the Miami Design District Property at the time with respect to the property and business interruption policies. See “Risk Factors—Risks Relating to the Mortgage Loans—Terrorism Insurance May Not Be Available for All Mortgaged Properties” in the Preliminary Prospectus.
This is not a research report and was not prepared by any Underwriters research department. Please see additional important information and qualifications at the end of this Term Sheet.
54
(THIS PAGE INTENTIONALLY LEFT BLANK)
This is not a research report and was not prepared by any Underwriter’s research department. Please see additional important information and qualifications at the end of this Term Sheet.
55
| Self Storage – Self Storage | Loan #3 | Cut-off Date Balance: | $90,000,000 | |
| Property Addresses – Various | Extra Space Rock ‘N Roll Self Storage Portfolio | Cut-off Date LTV: | 57.9% | |
| U/W NCF DSCR: | 2.56x | |||
| U/W NOI Debt Yield: | 8.8% |
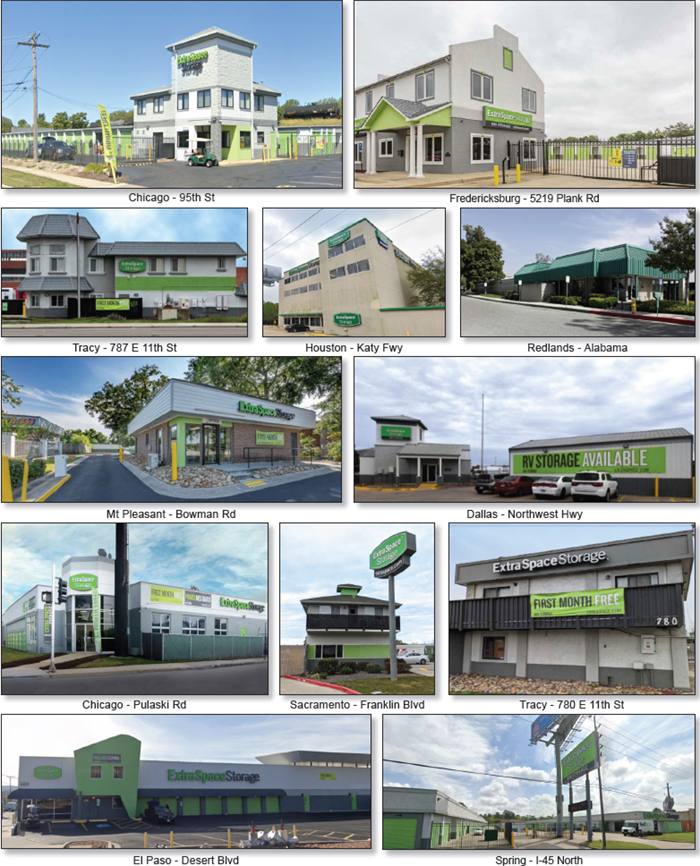
This is not a research report and was not prepared by any Underwriters research department. Please see additional important information and qualifications at the end of this Term Sheet.
56
| Self Storage – Self Storage | Loan #3 | Cut-off Date Balance: | $90,000,000 | |
| Property Addresses – Various | Extra Space Rock ‘N Roll Self Storage Portfolio | Cut-off Date LTV: | 57.9% | |
| U/W NCF DSCR: | 2.56x | |||
| U/W NOI Debt Yield: | 8.8% |
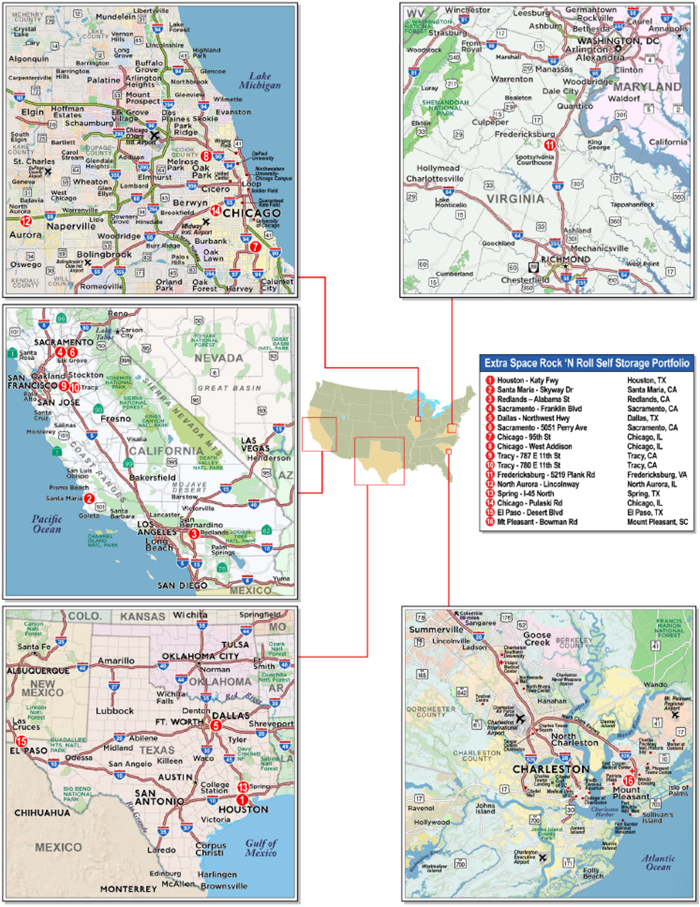
This is not a research report and was not prepared by any Underwriters research department. Please see additional important information and qualifications at the end of this Term Sheet.
57
| Mortgage Loan No. 3 – Extra Space Rock ‘N Roll Self Storage Portfolio |
| Mortgage Loan Information | Property Information | |||||
| Mortgage Loan Seller: | BANA | Single Asset/Portfolio: | Portfolio | |||
| Credit Assessment (Moody’s/DBRSM/Fitch): | NR/NR/NR | Location: | Various | |||
| Original Balance(1): | $90,000,000 | General Property Type: | Self Storage | |||
| Cut-off Date Balance(1): | $90,000,000 | Detailed Property Type: | Self Storage | |||
| % of Initial Pool Balance: | 9.9% | Title Vesting: | Fee | |||
| Loan Purpose: | Recapitalization | Year Built/Renovated: | Various/Various | |||
| Borrower Sponsors: | Extra Space Storage Inc.; G-Unit LLC | Size: | 1,186,768 SF | |||
| Guarantor: | Extra Space Storage Inc. | Cut-off Date Balance per SF(1): | $91 | |||
| Mortgage Rate: | 3.3255% | Maturity Date Balance per SF(1): | $91 | |||
| Note Date: | 3/1/2021 | Property Manager: | Extra Space Management, Inc. | |||
| First Payment Date: | 4/1/2021 | (borrower-related) | ||||
| Maturity Date: | 3/1/2031 | Underwriting and Financial Information(5) | ||||
| Original Term to Maturity: | 120 months | UW NOI: | $9,499,396 | |||
| Original Amortization Term: | 0 months | UW NOI Debt Yield(1): | 8.8% | |||
| IO Period: | 120 months | UW NOI Debt Yield at Maturity(1): | 8.8% | |||
| Seasoning: | 0 months | UW NCF DSCR(1): | 2.56x | |||
| Prepayment Provisions(2): | LO (24); DEF (89); O (7) | Most Recent NOI: | $10,007,036 (12/31/2020) | |||
| Lockbox/Cash Mgmt Status: | Springing/Springing | 2nd Most Recent NOI: | $10,337,925 (12/31/2019) | |||
| Additional Debt Type(1)(3): | Pari Passu | 3rd Most Recent NOI: | $10,020,379 (12/31/2018) | |||
| Additional Debt Balance(1)(3): | $18,000,000 | Most Recent Occupancy: | 94.3% (2/1/2021) | |||
| Future Debt Permitted (Type): | No (N/A) | 2nd Most Recent Occupancy: | 94.0% (12/31/2020) | |||
| Reserves(4) | 3rd Most Recent Occupancy: | 92.6% (12/31/2019) | ||||
| Type | Initial | Monthly | Cap | Appraised Value (as of)(6): | $186,530,000 (2/17/2021) | |
| RE Tax: | $0 | Springing | N/A | Appraised Value per SF: | $157 | |
| Insurance: | $0 | Springing | N/A | Cut-off Date LTV Ratio(1)(6): | 57.9% | |
| Deferred Maintenance: | $750,000 | $0 | N/A | Maturity Date LTV Ratio(1)(6): | 57.9% | |
| Sources and Uses | ||||||
| Sources | Proceeds | % of Total | Uses | Proceeds | % of Total | |
| Whole Loan Amount(1) | $108,000,000 | 63.0% | Purchase Price(7): | $168,884,857 | 98.6% | |
| Borrower Equity: | $63,367,053 | 37.0% | Closing Costs: | 1,732,196 | 1.0% | |
| Reserves: | $750,000 | 0.4% | ||||
| Total Sources: | $171,367,053 | 100.0% | Total Uses: | $171,367,053 | 100.0% | |
| (1) | The Extra Space Rock ‘N Roll Self Storage Portfolio Mortgage Loan (as defined below) is a part of the Extra Space Rock ‘N Roll Self Storage Portfolio Whole Loan (as defined below) with an original aggregate principal balance of $108,000,000. The Cut-off Date Balance per SF, Maturity Date Balance per SF, UW NOI Debt Yield, UW NOI Debt Yield at Maturity, UW NCF DSCR, Cut-off Date LTV Ratio and Maturity Date LTV Ratio numbers presented above are based on the Extra Space Rock ‘N Roll Self Storage Portfolio Whole Loan. |
| (2) | The Extra Space Rock ‘N Roll Self Storage Portfolio Borrowers (as defined below) have the right to defease the Extra Space Rock ‘N Roll Self Storage Portfolio Whole Loan, in whole or in part, on any date after the earlier to occur of (i) two years after the closing date of the securitization that includes the last pari passu note to be securitized and (ii) March 1, 2024. The assumed defeasance lockout period of 24 payments is based on the closing date of this transaction in March 2021. Partial prepayment of the Extra Space Rock ‘N Roll Self Storage Portfolio Whole Loan is also permitted in connection with the release of any of the individual Extra Space Rock ‘N Roll Self Storage Properties through partial defeasance, as described under “Release of Property” below. |
| (3) | See “The Mortgage Loan” and “Additional Secured Indebtedness (not including trade debts)” below for a discussion of additional indebtedness. |
| (4) | See “Escrows and Reserves” below for further discussion of reserve requirements. |
| (5) | The novel coronavirus pandemic is an evolving situation and could impact the Extra Space Rock ‘N Roll Self Storage Portfolio Whole Loan more severely than assumed in the underwriting of the Extra Space Rock ‘N Roll Self Storage Portfolio Whole Loan and could adversely affect the NOI, NCF and occupancy information, as well as the appraised value and the DSCR, LTV and Debt Yield metrics presented above and herein. See "Risk Factors-—Risks Related to Market Conditions and Other External Factors—The Coronavirus Pandemic Has Adversely Affected the Global Economy and Will Likely Adversely Affect the Performance of the Mortgage Loans" in the Preliminary Prospectus. |
| (6) | The Appraised Value is the “as is portfolio” appraised value of the Extra Space Rock ‘N Roll Self Storage Portfolio Properties (as defined below) as a whole, which reflects a 6.41% premium over the aggregate of the “as-is” appraised values of the individual properties. The aggregate of the “as-is” appraised values for the individual properties as of January 11, 2021 through January 15, 2021, as applicable, is $175,290,000, which results in a Cut-off Date LTV Ratio and a Maturity Date LTV Ratio of 61.6%. |
| (7) | Prior to the origination of the Extra Space Rock ‘N Roll Self Storage Portfolio Whole Loan, the Extra Space Rock ‘N Roll Self Storage Portfolio was wholly owned by Extra Space Storage Inc. related entities and was unencumbered. The Extra Space Rock ‘N Roll Self Storage Portfolio Properties were acquired in phases from 2003 through 2015. As part of this transaction, Extra Space Storage Inc. created a new joint venture with GIC Realty (as defined below), which acquired a 45% equity stake in the Extra Space Rock ‘N Roll Self Storage Portfolio Properties. The Purchase Price is the imputed price of the Extra Space Rock ‘N Roll Self Storage Portfolio Properties based on such equity stake acquisition. |
The Mortgage Loan. The third largest mortgage loan (the “Extra Space Rock ‘N Roll Self Storage Portfolio Mortgage Loan”) is part of a whole loan (the “Extra Space Rock ‘N Roll Self Storage Portfolio Whole Loan”) that is evidenced by four pari passu promissory notes in the original aggregate principal amount of $108,000,000. The Extra Space Rock ‘N Roll Self Storage Portfolio Whole Loan is secured by a first priority fee mortgage encumbering 16 self storage properties located in five states (the “Extra Space Rock ‘N Roll Self Storage Portfolio Properties”). The Extra Space Rock ‘N Roll Self Storage Portfolio Mortgage Loan is evidenced by the controlling promissory Note A-1 and non-controlling promissory Note A-2 and Note A-3, in the aggregate original principal amount of $90,000,000. In addition, non-controlling promissory Note A-4 (the “Extra Space Rock ‘N Roll Self Storage Portfolio Serviced Pari Passu Companion Loan”), in the original principal amount of $18,000,000, is expected to be contributed to future securitization trusts or may be otherwise transferred at any time. The Extra Space Rock ‘N Roll Self Storage Portfolio Whole Loan will be serviced pursuant to the pooling and servicing agreement for the BANK 2021-BNK32 securitization trust. See “Description of the Mortgage Pool—The Whole Loans—The Serviced Pari Passu Whole Loans” and “Pooling and Servicing Agreement” in the Preliminary Prospectus.
This is not a research report and was not prepared by any Underwriters research department. Please see additional important information and qualifications at the end of this Term Sheet.
58
| Self Storage – Self Storage | Loan #3 | Cut-off Date Balance: | $90,000,000 | |
| Property Addresses – Various | Extra Space Rock ‘N Roll Self Storage Portfolio | Cut-off Date LTV: | 57.9% | |
| U/W NCF DSCR: | 2.56x | |||
| U/W NOI Debt Yield: | 8.8% |
| Extra Space Rock ‘N Roll Self Storage Portfolio Whole Loan Summary | ||||
| Note | Original Balance | Cut-off Date Balance | Note Holder | Controlling Piece |
| A-1, A-2, A-3 | $90,000,000 | $90,000,000 | BANK 2021-BNK32 | Yes |
| A-4 | $18,000,000 | $18,000,000 | Bank of America, N.A. | No |
| Total | $108,000,000 | $108,000,000 | ||
The Borrowers and the Borrower Sponsor. The borrowers are ESS CA-TIVS JV TIVS REIT SUB LLC, a Delaware limited liability company and ESS CA-TIVS JV CA REIT SUB LP, a Delaware limited partnership (collectively, the “Extra Space Rock ‘N Roll Self Storage Portfolio Borrowers”), each structured to be bankruptcy-remote with two independent directors. The equity interests in the Extra Space Rock ‘N Roll Self Storage Portfolio Borrowers are owned by affiliates of Extra Space Storage Inc. (“Extra Space Storage”) (55%) and GIC (Realty) Private Limited (“GIC Realty”) (45%).
Extra Space Storage and G-Unit LLC, which is indirectly owned by GIC Realty, are the borrower sponsors. Extra Space Storage is the non-recourse carveout guarantor, with respect to the Extra Space Rock ‘N Roll Self Storage Portfolio Whole Loan. Extra Space Storage is headquartered in Salt Lake City, Utah and owns or operates over 1,800 self-storage locations across 40 states, Washington, D.C. and Puerto Rico comprising approximately 1.3 million units and 135 million SF of rentable space.
GIC Realty’s 45% ownership interest in the Extra Space Rock ‘N Roll Self Storage Portfolio Borrowers is wholly held by G-Unit LLC, a borrower sponsor, which is wholly owned by NA-RE Investment Holdings LLC. NA-RE Investment Holdings LLC is directly and indirectly wholly owned by GIC Realty. GIC Realty is GIC Private Limited’s global real estate investment arm, which utilizes underlying fund investment vehicles determined by the nature of the investment opportunity. GIC Private Limited, formerly known as Government of Singapore Investment Corporation, is a sovereign wealth fund established by the Government of Singapore in 1981 to manage the country’s currency reserves, with an orientation toward foreign investment. GIC Private Limited, as a fund manager for the Government of Singapore, is mandated by the Ministry of Finance to manage all assets in a single pool on an unencumbered basis with the objective of achieving good long-term real returns.
If a buy/sell event occurs or is anticipated to occur such that G-Unit LLC becomes the controlling indirect owner of the Extra Space Rock ‘N Roll Self Storage Portfolio Borrowers, the Extra Space Rock ‘N Roll Self Storage Portfolio Borrowers are required to replace the original guarantor (Extra Space Storage Inc.) for liabilities under the non-recourse carveout guaranty and environmental indemnity agreement with a replacement guarantor meeting the eligibility requirements set forth in the loan agreement, subject to certain conditions, including delivery by the Extra Space Rock ‘N Roll Self Storage Portfolio Borrowers of a rating agency confirmation.
The Properties. The Extra Space Rock ‘N Roll Self Storage Portfolio Properties are comprised of 16 self storage properties containing a total of 9,959 units, comprised of approximately 67.2% non-climate controlled units, approximately 29.7% climate controlled units and approximately 3.1% parking storage units. The Extra Space Rock ‘N Roll Self Storage Portfolio Properties range in size from approximately 39,211 SF to 130,346 SF, and average unit size is 119 SF. The Extra Space Rock ‘N Roll Self Storage Portfolio Properties are located in California (6 properties representing 35.0% of total SF), Texas (4 properties representing 31.1% of total SF), Illinois (4 properties representing 25.5% of total SF), Virginia (1 property representing 5.0% of total SF) and South Carolina (1 property representing 3.3% of total SF). The Extra Space Rock ‘N Roll Self Storage Portfolio Properties have exhibited stable occupancy, having averaged 93.2% occupancy since 2016, with no property dropping below 87.7% occupancy during that time. As of February 1, 2021, the Extra Space Rock ‘N Roll Self Storage Portfolio Properties were 94.3% occupied. The Extra Space Rock ‘N Roll Self Storage Portfolio Properties were built between 1936 and 2013 and three properties were renovated in 2001, 2006 and 2011. The Extra Space Rock ‘N Roll Self Storage Portfolio Borrowers have spent approximately $4.9 million in capital expenditures across the portfolio since 2015.
This is not a research report and was not prepared by any Underwriters research department. Please see additional important information and qualifications at the end of this Term Sheet.
59
| Self Storage – Self Storage | Loan #3 | Cut-off Date Balance: | $90,000,000 | |
| Property Addresses – Various | Extra Space Rock ‘N Roll Self Storage Portfolio | Cut-off Date LTV: | 57.9% | |
| U/W NCF DSCR: | 2.56x | |||
| U/W NOI Debt Yield: | 8.8% |
The following table presents certain information relating to the Extra Space Rock ‘N Roll Self Storage Portfolio Properties:
| Extra Space Rock ‘N Roll Self Storage Portfolio Summary(1) | |||||||||
Property Name | City | State | Year | Total GLA | Units | Cut-off Date | % of ALA | Appraised | % of Appraised Value(2) |
| Houston - Katy Fwy | Houston | TX | 2013 | 93,270 | 831 | $10,120,000 | 9.4% | $17,800,000 | 10.2% |
| Santa Maria - Skyway Dr | Santa Maria | CA | 1996 | 84,005 | 603 | $8,900,000 | 8.2% | $14,160,000 | 8.1% |
| Redlands – Alabama St | Redlands | CA | 1986 | 70,825 | 662 | $8,430,000 | 7.8% | $13,950,000 | 8.0% |
| Sacramento - Franklin Blvd | Sacramento | CA | 2007 | 82,035 | 682 | $8,340,000 | 7.7% | $14,380,000 | 8.2% |
| Dallas - Northwest Hwy | Dallas | TX | 1986 | 130,346 | 636 | $7,660,000 | 7.1% | $10,980,000 | 6.3% |
| Sacramento - 5051 Perry Ave | Sacramento | CA | 1986 | 62,865 | 535 | $6,760,000 | 6.3% | $12,420,000 | 7.1% |
| Chicago - 95th St | Chicago | IL | 2001 | 80,650 | 680 | $6,570,000 | 6.1% | $9,900,000 | 5.6% |
| Chicago - West Addison | Chicago | IL | 1936 | 72,614 | 889 | $6,540,000 | 6.1% | $11,650,000 | 6.6% |
| Tracy - 787 E 11th St | Tracy | CA | 2003 | 54,820 | 442 | $6,540,000 | 6.1% | $11,160,000 | 6.4% |
| Tracy - 780 E 11th St | Tracy | CA | 1989 | 61,195 | 517 | $6,510,000 | 6.0% | $10,840,000 | 6.2% |
| Fredericksburg - 5219 Plank Rd | Fredericksburg | VA | 2000 | 59,025 | 598 | $6,430,000 | 6.0% | $9,360,000 | 5.3% |
| North Aurora - Lincolnway | North Aurora | IL | 2008 | 77,540 | 655 | $5,960,000 | 5.5% | $9,100,000 | 5.2% |
| Spring - I-45 North | Spring | TX | 1999 | 70,485 | 612 | $5,750,000 | 5.3% | $8,400,000 | 4.8% |
| Chicago - Pulaski Rd | Chicago | IL | 1950 | 72,392 | 730 | $5,500,000 | 5.1% | $9,500,000 | 5.4% |
| El Paso - Desert Blvd | El Paso | TX | 1999 | 75,490 | 505 | $4,040,000 | 3.7% | $6,300,000 | 3.6% |
| Mt Pleasant - Bowman Rd | Mount Pleasant | SC | 1986 | 39,211 | 382 | $3,950,000 | 3.7% | $5,390,000 | 3.1% |
| Total/Wtd. Avg.: | 1,186,768 | 9,959 | $108,000,000 | 100.0% | $186,530,000 | 100.0% | |||
| (1) | Based on the borrower rent rolls. |
| (2) | The Appraised Value is the “as is portfolio” appraised value of the Extra Space Rock ‘N Roll Self Storage Portfolio Properties as a whole, which reflects a 6.41% premium to the aggregate of the “as-is” appraised values of the individual properties. The aggregate of the “as-is” appraised values for the individual properties as of January 11, 2021 through January 15, 2021, as applicable, is $175,290,000, which results in a Cut-off Date LTV Ratio and a Maturity Date LTV Ratio of 61.6%.The % of Appraised Value is based on the aggregate appraised value for the individual properties. |
The following table presents certain information relating to the unit mix and net operating income of the Extra Space Rock ‘N Roll Self Storage Portfolio Properties:
| Extra Space Rock ‘N Roll Self Storage Portfolio Summary(1) | |||||||||
Property Name | City / State | Rentable Units | Non-Climate Controlled Units | Climate Controlled Units | Parking Units | NRA | 2/1/2021 Occ. % | 12/31/2020 NOI | % of Total 12/31/2020 TTM NOI |
| Houston - Katy Fwy | Houston / TX | 831 | 0 | 831 | 0 | 93,270 | 94.0% | $886,905 | 8.9% |
| Santa Maria - Skyway Dr | Santa Maria / CA | 603 | 603 | 0 | 0 | 84,005 | 90.7% | $881,642 | 8.8% |
| Redlands – Alabama St | Redlands / CA | 662 | 657 | 0 | 5 | 70,825 | 96.6% | $774,624 | 7.7% |
| Sacramento - Franklin Blvd | Sacramento / CA | 682 | 682 | 0 | 0 | 82,035 | 96.9% | $807,085 | 8.1% |
| Dallas - Northwest Hwy | Dallas / TX | 636 | 0 | 457 | 179 | 130,346 | 91.3% | $679,467 | 6.8% |
| Sacramento - 5051 Perry Ave | Sacramento / CA | 535 | 528 | 0 | 7 | 62,865 | 95.9% | $562,120 | 5.6% |
| Chicago - 95th St | Chicago / IL | 680 | 645 | 0 | 35 | 80,650 | 91.5% | $619,763 | 6.2% |
| Chicago - West Addison | Chicago / IL | 889 | 770 | 112 | 7 | 72,614 | 93.3% | $642,646 | 6.4% |
| Tracy - 787 E 11th St | Tracy / CA | 442 | 438 | 0 | 4 | 54,820 | 97.0% | $640,848 | 6.4% |
| Tracy - 780 E 11th St | Tracy / CA | 517 | 517 | 0 | 0 | 61,195 | 99.2% | $640,473 | 6.4% |
| Fredericksburg - 5219 Plank Rd | Fredericksburg / VA | 598 | 148 | 440 | 10 | 59,025 | 95.3% | $557,188 | 5.6% |
| North Aurora - Lincolnway | North Aurora / IL | 655 | 451 | 204 | 0 | 77,540 | 92.7% | $525,679 | 5.3% |
| Spring - I-45 North | Spring / TX | 612 | 429 | 181 | 2 | 70,485 | 94.7% | $505,942 | 5.1% |
| Chicago - Pulaski Rd | Chicago / IL | 730 | 0 | 696 | 34 | 72,392 | 94.9% | $578,749 | 5.8% |
| El Paso - Desert Blvd | El Paso / TX | 505 | 461 | 23 | 21 | 75,490 | 96.3% | $358,019 | 3.6% |
| Mt Pleasant - Bowman Rd | Mount Pleasant / SC | 382 | 363 | 11 | 8 | 39,211 | 92.8% | $345,886 | 3.5% |
| Total/Wtd. Avg.: | 9,959 | 6,692 | 2,955 | 312 | 1,186,768 | 94.3% | $10,007,036 | 100.0% | |
| (1) | Based on the borrower rent rolls. |
COVID-19 Update. The first payment date for the Extra Space Rock ‘N Roll Self Storage Portfolio Whole Loan is April 1, 2021. As of February 24, 2021, the Extra Space Rock ‘N Roll Self Storage Portfolio Whole Loan is not subject to any forbearance, modification or debt service relief request. As of February 24, 2021, the borrower sponsor has reported that the Extra Space Rock ‘N Roll Self Storage Portfolio Properties are open and operating, and 98.2% of tenants by number of units and 96.9% of tenants by base rent have paid their full February 2021 rent payments.
This is not a research report and was not prepared by any Underwriters research department. Please see additional important information and qualifications at the end of this Term Sheet.
60
| Self Storage – Self Storage | Loan #3 | Cut-off Date Balance: | $90,000,000 | |
| Property Addresses – Various | Extra Space Rock ‘N Roll Self Storage Portfolio | Cut-off Date LTV: | 57.9% | |
| U/W NCF DSCR: | 2.56x | |||
| U/W NOI Debt Yield: | 8.8% |
The Markets. The Extra Space Rock ‘N Roll Self Storage Portfolio Properties are located across five states.
The following table presents the geographical distribution of the Extra Space Rock ‘N Roll Self Storage Portfolio Properties:
| Extra Space Rock ‘N Roll Self Storage Portfolio Summary(1) | |||||||||
State | Total GLA (SF) | Units | Cut-off Date | % of ALA | 2/1/2021 | Non-Climate Controlled | Climate | Parking | 12/31/2020 |
| California | 415,745 | 3,441 | $45,480,000 | 42.1% | 95.80% | 3,425 | 0 | 16 | $4,306,792 |
| Texas | 369,591 | 2,584 | $27,570,000 | 25.5% | 93.6% | 890 | 1,492 | 202 | $2,430,333 |
| Illinois | 303,196 | 2,954 | $24,570,000 | 22.8% | 93.1% | 1,866 | 1,012 | 76 | $2,366,837 |
| Virginia | 59,025 | 598 | $6,430,000 | 6.0% | 95.3% | 148 | 440 | 10 | $557,188 |
| South Carolina | 39,211 | 382 | $3,950,000 | 3.7% | 92.80% | 363 | 11 | 8 | $345,886 |
| Total/Wtd. Avg.: | 1,186,768 | 9,959 | $108,000,000 | 100.0% | 94.3% | 6,692 | 2,955 | 312 | $10,007,036 |
| (1) | Based on the borrower rent rolls. |
The following table presents local demographics data for the Extra Space Rock ‘N Roll Self Storage Portfolio Properties:
| Local Demographics Summary | ||||
Property Name | City | State | 2020 Population (within 3-mi. / 5-mi. Radius) | 2020 Average Household Income (within 3-mi. / 5-mi. Radius) |
| Houston - Katy Fwy | Houston | TX | 127,643 / 457,182 | $78,008 / $71,445 |
| Santa Maria - Skyway Dr | Santa Maria | CA | 68,747 / 137,306 | $68,997 / $68,936 |
| Redlands – Alabama St | Redlands | CA | 78,974 / 169,538 | $66,993 / $65,287 |
| Sacramento - Franklin Blvd | Sacramento | CA | 195,531 / 392,824 | $45,847 / $59,308 |
| Dallas - Northwest Hwy | Dallas | TX | 81,257 / 256,278 | $61,521 / $64,783 |
| Sacramento - 5051 Perry Ave | Sacramento | CA | 173,526 / 411,773 | $54,561 / $56,781 |
| Chicago - 95th St | Chicago | IL | 218,222 / 512,726 | $39,033 / $38,054 |
| Chicago - West Addison | Chicago | IL | 434,238 / 1,136,181 | $61,996 / $67,169 |
| Tracy - 787 E 11th St | Tracy | CA | 83,299 / 100,929 | $87,017 / $90,185 |
| Tracy - 780 E 11th St | Tracy | CA | 85,558 / 100,980 | $87,568 / $90,211 |
| Fredericksburg - 5219 Plank Rd | Fredericksburg | VA | 42,336 / 105,242 | $83,133 / $83,856 |
| North Aurora - Lincolnway | North Aurora | IL | 111,383 / 220,205 | $59,790 / $70,067 |
| Spring - I-45 North | Spring | TX | 66,073 / 171,207 | $112,170 / $119,863 |
| Chicago - Pulaski Rd | Chicago | IL | 311,696 / 779,974 | $43,243 / $44,545 |
| El Paso - Desert Blvd | El Paso | TX | 89,448 / 149,686 | $66,981 / $58,769 |
| Mt Pleasant - Bowman Rd | Mount Pleasant | SC | 54,280 / 82,800 | $89,672 / $94,664 |
Source: Appraisals.
This is not a research report and was not prepared by any Underwriters research department. Please see additional important information and qualifications at the end of this Term Sheet.
61
| Self Storage – Self Storage | Loan #3 | Cut-off Date Balance: | $90,000,000 | |
| Property Addresses – Various | Extra Space Rock ‘N Roll Self Storage Portfolio | Cut-off Date LTV: | 57.9% | |
| U/W NCF DSCR: | 2.56x | |||
| U/W NOI Debt Yield: | 8.8% |
The following table presents certain information relating to certain self-storage lease comparables provided in the appraisals for the Extra Space Rock ‘N Roll Self Storage Portfolio Properties:
| Competitive Set Summary | ||||||
Property Name | City | State | Occupancy Rates | Competitive Set | Avg. Asking Rent | Avg. Market Rent |
| Houston - Katy Fwy | Houston | TX | 94.0% | 91.8% | $235 | $196 |
| Santa Maria - Skyway Dr | Santa Maria | CA | 90.7% | 92.4% | $214 | $177 |
| Redlands – Alabama St | Redlands | CA | 96.6% | 93.7% | $194 | $160 |
| Sacramento - Franklin Blvd | Sacramento | CA | 96.9% | 91.9% | $174 | $150 |
| Dallas - Northwest Hwy | Dallas | TX | 91.3% | 89.1% | $147 | $143 |
| Sacramento - 5051 Perry Ave | Sacramento | CA | 95.9% | 89.8% | $203 | $175 |
| Chicago - 95th St | Chicago | IL | 91.5% | 92.9% | $152 | $157 |
| Chicago - West Addison | Chicago | IL | 93.3% | 93.6% | $135 | $123 |
| Tracy - 787 E 11th St | Tracy | CA | 97.0% | 95.6% | $228 | $181 |
| Tracy - 780 E 11th St | Tracy | CA | 99.2% | 95.6% | $181 | $154 |
| Fredericksburg - 5219 Plank Rd | Fredericksburg | VA | 95.3% | 94.0% | $138 | $119 |
| North Aurora - Lincolnway | North Aurora | IL | 92.7% | 87.2% | $144 | $118 |
| Spring - I-45 North | Spring | TX | 94.7% | 93.6% | $163 | $123 |
| Chicago - Pulaski Rd | Chicago | IL | 94.9% | 95.0% | $136 | $120 |
| El Paso - Desert Blvd | El Paso | TX | 96.3% | 96.6% | $132 | $116 |
| Mt Pleasant - Bowman Rd | Mount Pleasant | SC | 92.8% | 92.7% | $132 | $125 |
Source: Appraisals and borrower rent rolls.
Operating History and Underwritten Net Cash Flow. The following table presents certain information relating to the historical operating performance and the Underwritten Net Cash Flow of the Extra Space Rock ‘N Roll Self Storage Portfolio Properties:
| Cash Flow Analysis | ||||||
| 2017 | 2018 | 2019 | 2020 | UW | UW PSF | |
| Gross Potential Rent | $16,095,383 | $16,997,390 | $17,386,304 | $17,138,461 | $17,138,460 | $14.44 |
| Concessions | ($521,728) | ($667,012) | ($614,077) | ($551,259) | ($551,259) | ($0.46) |
| Vacancy and Credit Loss | ($1,341,843) | ($1,507,822) | ($1,625,310) | ($1,475,119) | ($1,475,119) | ($1.24) |
| Total Other Income | $724,133 | $740,774 | $757,597 | $601,738 | $534,886 | $0.45 |
| Effective Gross Income | $14,955,945 | $15,563,330 | $15,904,514 | $15,713,821 | $15,646,968 | $13.18 |
| Real Estate Taxes | $1,447,961 | $2,018,616 | $1,868,255 | $1,981,716 | $2,577,652 | $2.17 |
| Insurance | $123,731 | $121,930 | $143,448 | $149,739 | $153,730 | $0.13 |
| Other Expenses | $3,432,437 | $3,402,405 | $3,554,886 | $3,575,330 | $3,416,190 | $2.88 |
| Total Expenses | $5,004,129 | $5,542,951 | $5,566,589 | $5,706,785 | $6,147,572 | $5.18 |
| Net Operating Income | $9,951,816 | $10,020,379 | $10,337,925 | $10,007,036 | $9,499,396 | $8.00 |
| Capital Expenditures | $0 | $0 | $0 | $0 | $178,018 | $0.15 |
| Net Cash Flow | $9,951,816 | $10,020,379 | $10,337,925 | $10,007,036 | $9,321,378 | $7.85 |
| Occupancy %(1) | 93.1% | 92.7% | 92.6% | 94.0% | 91.1% | |
| NOI DSCR(2) | 2.73x | 2.75x | 2.84x | 2.75x | 2.61x | |
| NCF DSCR(2) | 2.73x | 2.75x | 2.84x | 2.75x | 2.56x | |
| NOI Debt Yield(2) | 9.2% | 9.3% | 9.6% | 9.3% | 8.8% | |
| NCF Debt Yield(2) | 9.2% | 9.3% | 9.6% | 9.3% | 8.6% | |
| (1) | As of February 1, 2021, the Extra Space Rock ‘N Roll Self Storage Portfolio Properties were 94.3% occupied. |
| (2) | Debt service coverage ratios and debt yields are based on the Extra Space Rock ‘N Roll Self Storage Portfolio Whole Loan. |
Escrows and Reserves.
Taxes – Monthly reserves for real estate taxes are not required so long as (i) no event of default is continuing, (ii) no Cash Sweep Event Period (as defined below) has occurred and is continuing, and (iii) the Extra Space Rock ‘N Roll Self Storage Portfolio Borrowers provide the lender with paid receipts for real estate taxes upon lender’s written request and by no later than three business days prior to the date on which such real estate taxes would be delinquent. If such conditions are not satisfied, the Extra Space Rock ‘N Roll Self Storage Portfolio Borrowers will be required to deposit monthly reserves for real estate taxes in an amount equal to 1/12 of the real estate taxes that the lender estimates will be payable during the next twelve months.
This is not a research report and was not prepared by any Underwriters research department. Please see additional important information and qualifications at the end of this Term Sheet.
62
| Self Storage – Self Storage | Loan #3 | Cut-off Date Balance: | $90,000,000 | |
| Property Addresses – Various | Extra Space Rock ‘N Roll Self Storage Portfolio | Cut-off Date LTV: | 57.9% | |
| U/W NCF DSCR: | 2.56x | |||
| U/W NOI Debt Yield: | 8.8% |
Insurance – Monthly reserves for insurance premiums are not required so long as (i) no event of default is continuing, (ii) the insurance coverage for each Extra Space Rock ‘N Roll Self Storage Portfolio Property is included in a blanket or umbrella policy approved by the lender in its reasonable discretion, and (iii) the Extra Space Rock ‘N Roll Self Storage Portfolio Borrowers provide the lender with evidence of payment of the insurance premiums and renewals of the insurance policies, no later than ten days prior to the expiration of the current policy. If such conditions are not satisfied, the Extra Space Rock ‘N Roll Self Storage Portfolio Borrowers will be required to deposit monthly reserves for insurance premiums in an amount equal to 1/12 of the insurance premiums that the lender estimates will be payable for the renewal of coverage upon the expiration of the insurance policies.
Deferred Maintenance – The Extra Space Rock ‘N Roll Self Storage Portfolio Borrowers deposited $750,000 at loan origination, which amount represents the estimated cost of roof repairs to be made at the Chicago – Pulaski Rd property. The Extra Space Rock ‘N Roll Self Storage Portfolio Borrowers are required to complete the required repairs in a good and workmanlike manner on or before the date that is twelve months from loan origination.
Lockbox and Cash Management. The Extra Space Rock ‘N Roll Self Storage Portfolio Whole Loan is structured with a springing lockbox and springing cash management. Upon the first occurrence of a Cash Sweep Event Period, the Extra Space Rock ‘N Roll Self Storage Portfolio Borrowers are required to establish (i) a lockbox account into which, during a Cash Sweep Event Period, the Extra Space Rock ‘N Roll Self Storage Portfolio Borrowers are required to directly deposit, or cause to be deposited, all rents, and all De Minimis Revenue (as defined below) (less anticipated costs for debits for credit card chargebacks, fees and refunded items) from the Extra Space Rock ‘N Roll Self Storage Portfolio Properties, and (ii) a lender-controlled cash management account, into which the Extra Space Rock ‘N Roll Self Storage Portfolio Borrowers are required to cause all sums in the lockbox account to be transferred on each business day during a Cash Sweep Event Period. During a Cash Sweep Event Period, provided no event of default is continuing, all funds in the cash management account are required to be applied on each monthly payment date: (i) to make deposits into an account for payment of tenant insurance premiums, sales tax, and packing supply cash receipts (“De Minimis Revenue”), which are to be disbursed to the Extra Space Rock ‘N Roll Self Storage Portfolio Borrowers within five business days of delivery to the lender of a budget for such expenses, (ii) to make the monthly deposits into the real estate tax and insurance reserves, if any, as described above under “Escrows and Reserves,” (iii) to pay debt service on the Extra Space Rock ‘N Roll Self Storage Portfolio Whole Loan, (iv) to pay operating expenses set forth in the annual budget (which is required to be approved by the lender during a Cash Sweep Event Period) and lender-approved extraordinary expenses, and (v) to deposit any remainder into an excess cash flow subaccount to be held as additional security for the Extra Space Rock ‘N Roll Self Storage Portfolio Whole Loan during such Cash Sweep Event Period. If no Cash Sweep Event Period exists, funds in the lockbox account are required to be disbursed to the Extra Space Rock ‘N Roll Self Storage Portfolio Borrowers.
A “Cash Sweep Event Period” means a period:
| (i) | commencing upon the occurrence of an event of default under the Extra Space Rock ‘N Roll Self Storage Portfolio Whole Loan documents and ending upon the cure of such event of default; or |
| (ii) | commencing upon the debt service coverage ratio on the Extra Space Rock ‘N Roll Self Storage Portfolio Whole Loan falling below 1.10x based upon the trailing-twelve months (calculated at the end of each calendar quarter assuming a 30 year amortization schedule), and ending on the date the debt service coverage ratio equals or exceeds 1.25x for two consecutive calendar quarters (calculated assuming a 30 year amortization schedule). |
Additional Secured Indebtedness (not including trade debts). In addition to the Extra Space Rock ‘N Roll Self Storage Portfolio Mortgage Loan, the Extra Space Rock ‘N Roll Self Storage Portfolio Properties also secure the Extra Space Rock ‘N Roll Self Storage Portfolio Serviced Pari Passu Companion Loan, which has a Cut-off Date principal balance of $18,000,000. The Extra Space Rock ‘N Roll Self Storage Portfolio Serviced Pari Passu Companion Loan accrues interest at the same rate as the Extra Space Rock ‘N Roll Self Storage Portfolio Mortgage Loan. The Extra Space Rock ‘N Roll Self Storage Portfolio Mortgage Loan is entitled to payments of interest and principal on a pro rata and pari passu basis with the Extra Space Rock ‘N Roll Self Storage Portfolio Serviced Pari Passu Companion Loan. The holders of the Extra Space Rock ‘N Roll Self Storage Portfolio Mortgage Loan and the Extra Space Rock ‘N Roll Self Storage Portfolio Serviced Pari Passu Companion Loan have entered into a co-lender agreement which sets forth the allocation of collections on the Extra Space Rock ‘N Roll Self Storage Portfolio Whole Loan. See “Description of the Mortgage Pool—The Whole Loans—The Serviced Pari Passu Whole Loans” in the Preliminary Prospectus.
Mezzanine Loan and Preferred Equity. None.
Release of Property. After the expiration of the defeasance lockout period for the Extra Space Rock ‘N Roll Self Storage Portfolio Whole Loan, the Extra Space Rock ‘N Roll Self Storage Portfolio Borrowers have the right to obtain a release of any of the individual Extra Space Rock ‘N Roll Self Storage Portfolio Properties, provided certain conditions are satisfied, including but not limited to: (i) no event of default is continuing, (ii) the Extra Space Rock ‘N Roll Self Storage Portfolio Borrowers partially defease the Extra Space Rock ‘N Roll Self Storage Portfolio Whole Loan in an amount equal to (x) with respect to the first 20% of the original principal balance being defeased, 115% of the allocated loan amount for the individual property which is being released, and (y) with respect to all remaining amounts being defeased, 120% of the allocated loan amount for the individual property, (iii) the debt yield for all remaining Extra Space Rock ‘N Roll Self Storage Portfolio Properties is not less than the greater of (a) 8.63% and (b) the debt yield immediately preceding the release, (iv) the debt service coverage ratio for all remaining Extra Space Rock ‘N Roll Self Storage Portfolio Properties is not less than the greater of (a) 1.64x and (b) the debt service coverage ratio immediately preceding the release, and (iv) customary REMIC requirements are satisfied.
Right of First Offer/Right of First Refusal. None.
Ground Lease. None.
Letter of Credit. None.
Terrorism Insurance. The Extra Space Rock ‘N Roll Self Storage Portfolio Borrowers are required to obtain and maintain an “all risk” property insurance policy that covers perils of terrorism and acts of terrorism in an amount equal to the “full replacement cost” of the Extra Space Rock ‘N Roll Self Storage Portfolio Properties, together with business income insurance covering not less than the 18-month period commencing at the time of loss, together with an extended period of indemnity endorsement of not less than 12 months. See “Risk Factors—Risks Relating to the Mortgage Loans—Terrorism Insurance May Not Be Available for All Mortgaged Properties” in the Preliminary Prospectus.
This is not a research report and was not prepared by any Underwriters research department. Please see additional important information and qualifications at the end of this Term Sheet.
63
| Office – CBD | Loan #4 | Cut-off Date Balance: | $71,000,000 | |
| 605 Third Avenue | 605 Third Avenue | Cut-off Date LTV: | 33.7% | |
| New York, NY 10158 | UW NCF DSCR: | 6.61x | ||
| UW NOI Debt Yield: | 13.9% |

This is not a research report and was not prepared by any Underwriter’s research department. Please see additional important information and qualifications at the end of this Term Sheet.
64
| Office – CBD | Loan #4 | Cut-off Date Balance: | $71,000,000 | |
| 605 Third Avenue | 605 Third Avenue | Cut-off Date LTV: | 33.7% | |
| New York, NY 10158 | UW NCF DSCR: | 6.61x | ||
| UW NOI Debt Yield: | 13.9% |

This is not a research report and was not prepared by any Underwriter’s research department. Please see additional important information and qualifications at the end of this Term Sheet.
65
| Office – CBD | Loan #4 | Cut-off Date Balance: | $71,000,000 | |
| 605 Third Avenue | 605 Third Avenue | Cut-off Date LTV: | 33.7% | |
| New York, NY 10158 | UW NCF DSCR: | 6.61x | ||
| UW NOI Debt Yield: | 13.9% |
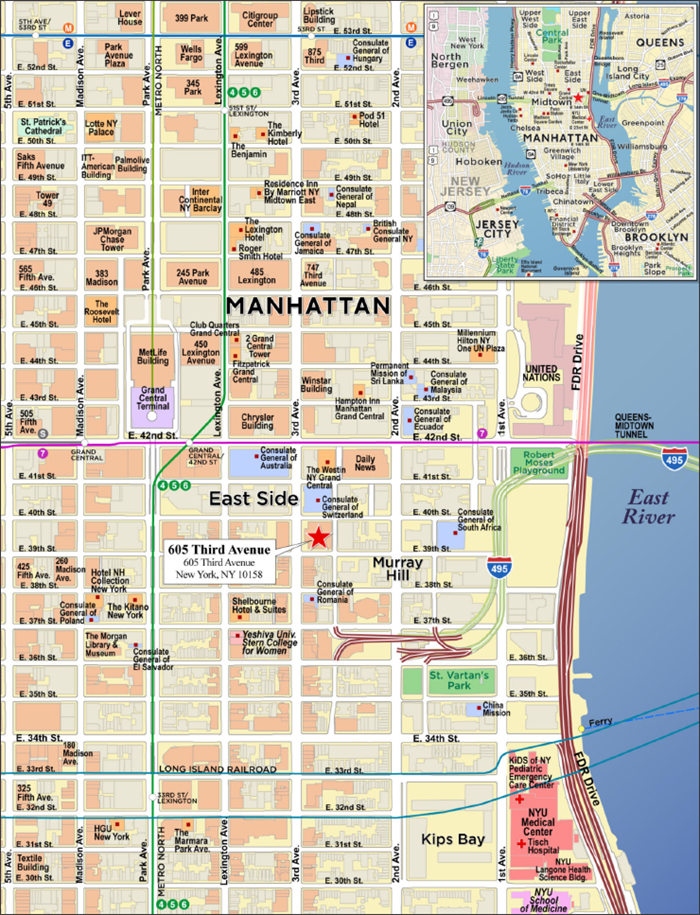
This is not a research report and was not prepared by any Underwriter’s research department. Please see additional important information and qualifications at the end of this Term Sheet.
66
| Mortgage Loan No. 4 – 605 Third Avenue |
| Mortgage Loan Information | Property Information | ||||||
| Mortgage Loan Seller: | MSMCH | Single Asset/Portfolio: | Single Asset | ||||
| Credit Assessment (Moody’s/DBRSM/Fitch): | Baa3/A(low)/BBB-sf | Location: | New York, NY 10158 | ||||
| Original Balance(1): | $71,000,000 | General Property Type: | Office | ||||
| Cut-off Date Balance(1): | $71,000,000 | Detailed Property Type: | CBD | ||||
| % of Initial Pool Balance: | 7.8% | Title Vesting: | Fee | ||||
| Loan Purpose: | Refinance | Year Built/Renovated: | 1965/2018 | ||||
| Borrower Sponsors: | RP 605 Acquisition; FB 605 Equity | Size: | 1,027,736 SF | ||||
| LLC, FB 605 Corp.; Hadwin LLC | Cut-off Date Balance Per SF(1): | $225 | |||||
| Guarantor(2): | N/A | Maturity Date Balance Per SF(1): | $225 | ||||
| Mortgage Rate(3): | 1.93752% | Property Manager: | Fisher Brothers Management Co. | ||||
| Note Date: | 11/20/2020 | LLC (borrower-related) | |||||
| First Payment Date: | 1/5/2021 | ||||||
| Maturity Date: | 12/5/2030 | ||||||
| Original Term to Maturity: | 120 months | ||||||
| Original Amortization Term: | 0 months | Underwriting and Financial Information(8)(9) | |||||
| IO Period: | 120 months | UW NOI(9): | $32,130,565 | ||||
| Seasoning: | 3 months | UW NOI Debt Yield(1): | 13.9% | ||||
| Prepayment Provisions(4): | YM1 (27); DEF/YM1 (86); O (7) | UW NOI Debt Yield at Maturity(1): | 13.9% | ||||
| Lockbox/Cash Mgmt Status: | Hard/Springing | UW NCF DSCR(1): | 6.61x | ||||
| Additional Debt Type(1)(5): | Pari Passu/Subordinate/Mezzanine | Most Recent NOI(9): | $23,869,945 (9/30/2020 TTM) | ||||
| Additional Debt Balance(1)(5): | $160,000,000/$78,000,000/$91,000,000 | 2nd Most Recent NOI(9): | $8,013,280 (12/31/2019) | ||||
| Future Debt Permitted (Type)(6): | Yes (Mezzanine) | 3rd Most Recent NOI: | $10,798,472 (12/31/2018) | ||||
| Reserves(7) | Most Recent Occupancy: | 97.2% (10/1/2020) | |||||
| Type | Initial | Monthly | Cap | 2nd Most Recent Occupancy: | 96.7% (12/31/2019) | ||
| RE Taxes : | $0 | Springing | N/A | 3rd Most Recent Occupancy: | 76.6% (12/31/2018) | ||
| Insurance: | $0 | Springing | N/A | Appraised Value (as of): | $685,000,000 (11/1/2020) | ||
| Replacement Reserve: | $0 | Springing | $411,096 | Appraised Value Per SF: | $667 | ||
| TI/LC Reserve: | $1,092,905 | Springing | $4,000,000 | Cut-off Date LTV Ratio(1): | 33.7% | ||
| Free Rent Reserve: | $934,456 | Springing | N/A | Maturity Date LTV Ratio(1): | 33.7% | ||
| Sources and Uses | ||||||
| Sources | Proceeds | % of Total | Uses | Proceeds | % of Total | |
| Senior Loan Amount(1): | $231,000,000 | 57.8% | Loan Payoff: | $189,965,577 | 47.5% | |
| Subordinate Loan Amount: | $78,000,000 | 19.5% | Return of Equity: | $201,920,067 | 50.5% | |
| Mezzanine Loan: | $91,000,000 | 22.8% | Closing Costs: | $6,086,995 | 1.5% | |
| Reserves: | $2,027,361 | 0.5% | ||||
| Total Sources: | $400,000,000 | 100.0% | Total Uses: | $400,000,000 | 100.0% | |
| (1) | The 605 Third Avenue Mortgage Loan (as defined below) is part of the 605 Third Avenue Whole Loan (as defined below), which is comprised of five pari passu senior promissory notes with an aggregate original principal balance of $231,000,000 (collectively, the “605 Third Avenue Senior Loans”) and three promissory notes that are subordinate to the 605 Third Avenue Senior Loans with an aggregate original principal balance of $78,000,000 (collectively, the “605 Third Avenue Subordinate Companion Loans”, and together with the 605 Third Avenue Senior Loans, the “605 Third Avenue Whole Loan”). The Cut-off Date Balance Per SF, Maturity Date Balance Per SF, UW NOI Debt Yield, UW NOI Debt Yield at Maturity, UW NCF DSCR, Cut-off Date LTV Ratio and Maturity Date LTV Ratio numbers presented above are based on the aggregate Cut-off Date principal balance of the 605 Third Avenue Senior Loans, without regard to the 605 Third Avenue Subordinate Companion Loans or the 605 Third Avenue Mezzanine Loan (as defined below). The Cut-off Date Balance Per SF, Maturity Date Balance Per SF, UW NOI Debt Yield, UW NOI Debt Yield at Maturity, UW NCF DSCR, Cut-off Date LTV Ratio and Maturity Date LTV Ratio numbers based on the entire 605 Third Avenue Whole Loan are $301, $301, 10.4%, 10.4%, 4.30x, 45.1% and 45.1%, respectively. The Cut-off Date Balance Per SF, Maturity Date Balance Per SF, UW NOI Debt Yield, UW NOI Debt Yield at Maturity, UW NCF DSCR, Cut-off Date LTV Ratio and Maturity Date LTV Ratio numbers based on the combined balance of the 605 Third Avenue Whole Loan and the 605 Third Avenue Mezzanine Loan are $389, $389, 8.0%, 8.0%, 2.58x, 58.4% and 58.4%, respectively. |
| (2) | There is no non-recourse carveout guarantor or separate environmental indemnitor with respect to the 605 Third Avenue Whole Loan. |
| (3) | Reflects the 605 Third Avenue Senior Loans only. The 605 Third Avenue Subordinate Companion Loans bear interest at the rate of 3.0780% per annum. |
| (4) | Defeasance of the 605 Third Avenue Whole Loan is permitted at any time after the earlier of (i) November 20, 2023, or (ii) two years from the closing date of the securitization that includes the last note evidencing a portion of the 605 Third Avenue Whole Loan to be securitized. The assumed defeasance lockout period of 27 payments is based on the closing date of this transaction in March 2021. In addition, prepayment of the 605 Third Avenue Whole Loan is permitted at any time, subject to, prior to the open prepayment date, payment of a prepayment fee equal to the greater of 1.00% of the amount prepaid and a yield maintenance premium. |
| (5) | See “The Mortgage Loan”, “Additional Secured Indebtedness (not including trade debts)” and “Mezzanine Loan and Preferred Equity” below, for a discussion of additional debt. |
| (6) | See “Mezzanine Loan and Preferred Equity” below for further discussion of the permitted future mezzanine debt. |
| (7) | See “Escrows and Reserves” below for further discussion of reserve requirements. |
| (8) | The novel coronavirus pandemic is an evolving situation and could impact the 605 Third Avenue Whole Loan more severely than assumed in the underwriting of the 605 Third Avenue Whole Loan and could adversely affect the NOI, NCF and occupancy information, as well as the appraised value and the DSCR, LTV and Debt Yield metrics presented above and herein. See "Risk Factors-—Risks Related to Market Conditions and Other External Factors—The Coronavirus Pandemic Has Adversely Affected the Global Economy and Will Likely Adversely Affect the Performance of the Mortgage Loans" in the Preliminary Prospectus. |
| (9) | See “Operating History and Underwritten Net Cash Flow” for information regarding the increases in NOI from 2nd Most Recent NOI to Most Recent NOI and from Most Recent NOI to UW NOI. |
This is not a research report and was not prepared by any Underwriter’s research department. Please see additional important information and qualifications at the end of this Term Sheet.
67
| Office – CBD | Loan #4 | Cut-off Date Balance: | $71,000,000 | |
| 605 Third Avenue | 605 Third Avenue | Cut-off Date LTV: | 33.7% | |
| New York, NY 10158 | UW NCF DSCR: | 6.61x | ||
| UW NOI Debt Yield: | 13.9% |
The Mortgage Loan. The fourth largest mortgage loan (the “605 Third Avenue Mortgage Loan”) is part of the 605 Third Avenue Whole Loan in the original principal balance of $309,000,000. The 605 Third Avenue Whole Loan is secured by a first priority fee mortgage encumbering an office property located in New York, New York (the “605 Third Avenue Property”). The 605 Third Avenue Whole Loan was originated by Morgan Stanley Bank, N.A., as to the 605 Third Avenue Senior Loans, and by Morgan Stanley Mortgage Capital Holdings LLC, as to the 605 Third Avenue Subordinate Companion Loans. The 605 Third Avenue Whole Loan is comprised of the 605 Third Avenue Senior Loans, consisting of five pari passu senior promissory notes in the aggregate original principal balance of $231,000,000, and the 605 Third Avenue Subordinate Companion Loans, consisting of three subordinate promissory notes in the aggregate original principal balance of $78,000,000. The non-controlling senior Notes A-3 and A-4, with an aggregate original principal balance of $71,000,000, represent the 605 Third Avenue Mortgage Loan and will be included in the BANK 2021-BNK32 securitization trust. The remaining senior promissory notes, with an aggregate original principal balance of $160,000,000 (collectively, the “605 Third Avenue Non-Serviced Pari Passu Companion Loans”), have been contributed to one or more securitization transactions. The 605 Third Avenue Whole Loan will be serviced pursuant to the pooling and servicing agreement for the BANK 2020-BNK30 securitization trust. See “Description of the Mortgage Pool—The Whole Loans—The 605 Third Avenue Pari Passu-AB Whole Loan” and “Pooling and Servicing Agreement—Servicing of the Non-Serviced Mortgage Loans” in the Preliminary Prospectus.
| 605 Third Avenue Whole Loan Summary | ||||
| Notes | Original Balance | Cut-off Date Balance | Note Holder | Controlling Piece |
| A-1 | $80,000,000 | $80,000,000 | BANK 2020-BNK30 | No(1) |
| A-2 | $60,000,000 | $60,000,000 | BANK 2021-BNK31 | No |
| A-3 | $40,000,000 | $40,000,000 | BANK 2021-BNK32 | No |
| A-4 | $31,000,000 | $31,000,000 | BANK 2021-BNK32 | No |
| A-5 | $20,000,000 | $20,000,000 | BANK 2021-BNK31 | No |
| B-1 | $40,600,000 | $40,600,000 | Third party holder | Yes(1) |
| B-2 | $20,000,000 | $20,000,000 | Third party holder | No(1) |
| B-3 | $17,400,000 | $17,400,000 | Third party holder | No(1) |
| Total Whole Loan | $309,000,000 | $309,000,000 | ||
| (1) | Pursuant to the related co-lender agreement, the holder of Note B-1 is the controlling noteholder unless a “control appraisal period” has occurred and is continuing under the co-lender agreement, in which case Note A-1 will become the controlling noteholder. See “Description of the Mortgage Pool—The Whole Loans—The 605 Third Avenue Pari Passu-AB Whole Loan” in the Preliminary Prospectus. |
The Borrower and the Borrower Sponsors. The borrower is 605 Third Avenue Fee LLC (the “605 Third Avenue Borrower”), a Delaware limited liability company structured with two independent directors. There is no non-recourse carveout guarantor or separate environmental indemnitor with respect to the 605 Third Avenue Whole Loan. The 605 Third Avenue Borrower is owned by a joint venture between affiliates of Fisher Brothers (approximately 50.5%) and the Commingled Pension Trust Fund (Special Situation Property) (the “Fund”) of JP Morgan Chase Bank, N.A. (approximately 49.0%). The borrower sponsors are RP 605 Acquisition LLC (which is indirectly owned by the Fund), and FB 605 Equity LLC, FB 605 Corp. and Hadwin LLC (all of which are indirectly owned by members of the Fisher family and/or their family trusts). Fisher Brothers has been a builder, owner and operator of commercial real estate in New York City for over 100 years. The company has developed, owned and managed more than 10 million SF of Class-A commercial space, with 1.5 million SF of space under development. Fisher Brothers developed the 605 Third Avenue Property in 1963 and has operated the 605 Third Avenue Property ever since. The related Whole Loan documents generally permit transfers of interests in the 605 Third Avenue Borrower among the owners of the joint venture and certain of their affiliates, including affiliates of Fisher Brothers and certain affiliates of JP Morgan Chase Bank, N.A. and related funds.
The Property. The 605 Third Avenue Property is a Class A, 44-story office property totaling 1,027,736 SF, including 16,340 SF of retail space, located in New York City. The 605 Third Avenue Property was built in 1965 and most recently renovated in 2018. Since 2014, the borrower sponsor spent approximately $104.3 million in capital expenditures at the 605 Third Avenue Property. Capital expenditures included modifications to the building lobby, elevator modernization, the creation of a bike room, the creation of a marketing and messenger center, fire alarm upgrades, and tenant improvement allowances, as well as base building upgrades.
The 605 Third Avenue Property was 97.2% leased as of October 1, 2020 to 25 office tenants and 5 retail tenants. The tenant mix includes financial technology, financial and diplomatic mission tenants, including the three largest tenants: Univision Communications, Inc. (“Univision”), United Nations Population Fund (“UNPF”) and Broadridge Financial Solutions, Inc. (“Broadridge”). The office component of the 605 Third Avenue Property is 97.1% leased to a mixture of tenants, anchored by seven tenants that exceed 50,000 SF. Aside from the three largest tenants at the 605 Third Avenue Property, no other tenant accounts for more than 6.7% of underwritten rent or 7.6% of total SF. The 605 Third Avenue Property contains a retail component that comprises 1.6% of the total NRA and accounts for approximately 3.6% of underwritten rent. The retail component is currently 100.0% leased to Orangetheory Fitness (5,761 SF), Wagamama (5,418 SF), HSBC (3,161 SF), Starbucks (1,800 SF) and J&J News, Inc. (200 SF).
Approximately 230,000 SF have been leased in the building since January 2019. Tenants that have signed leases over the past two years include Broadridge (85,089 SF), Permanent Mission of Japan to the United Nations (50,391 SF), Deluxe Financial Services, LLC (21,229 SF), Katsky Korins LLP (19,871 SF) and Wellspring Capital Management Group LLC (14,698 SF).
Major Tenants.
Univision (194,701 SF, 18.9% of NRA, 18.0% of underwritten rent). Univision is the leading Spanish language media company in the United States. The company provides news, sports and entertainment content across broadcast and cable television, audio and digital platforms. Univision has been a tenant at the 605 Third Avenue Property since 2013 and has a lease expiration of December 31, 2028. Univision has two, 5-year renewal options or one, 10-year renewal option, upon notice of at least 18 months prior to the expiration of the current term. Univision may only exercise its renewal option with respect to at least 37,000 rentable SF. The fixed annual rent for each extension term is required to be an amount equal to 95% of the market value rent. Univision is currently subleasing space to the following subtenants through Univision’s lease expiration: Wolf, Greenfield & Sacks (19,871 SF) at $52.00 PSF, Shoptalk Commerce (19,871 SF) at $41.00 PSF, Levy Konigsberg (19,871 SF) at $45.00 PSF, and DCS Advisory (29,331 SF) at $45.00 PSF. Univision has a free rent period from January through June 2024 (for which the 605 Third Avenue Borrower is required to make deposits into a free rent reserve as described below under “Escrows and Reserves—Free Rent Reserve” during the period from January 2022 through December 2023) and
This is not a research report and was not prepared by any Underwriter’s research department. Please see additional important information and qualifications at the end of this Term Sheet.
68
| Office – CBD | Loan #4 | Cut-off Date Balance: | $71,000,000 | |
| 605 Third Avenue | 605 Third Avenue | Cut-off Date LTV: | 33.7% | |
| New York, NY 10158 | UW NCF DSCR: | 6.61x | ||
| UW NOI Debt Yield: | 13.9% |
also has free rent during April, July and October 2028 (for which the 605 Third Avenue Borrower is required to make deposits into a free rent reserve as described below under “Escrows and Reserves—Free Rent Reserve” during the period from April 1, 2027 through March 31, 2028).
UNPF (130,740 SF, 12.7% of NRA, 8.9% of underwritten rent). UNPF is the United Nations sexual and reproductive health agency. Headquartered in New York City, UNPF works in more than 150 countries and territories that are home to the majority of the world’s people. UNPF has been a tenant at the 605 Third Avenue Property since 2018 and has a lease expiration of December 31, 2025. If the United Nations leaves its headquarters in New York City, UNPF has the option to terminate its lease upon written notice and subject to termination costs equal to the sum of unamortized tenant improvements, leasing commissions and legal fees. The termination date will occur one year after UNPF provides written notice of intent to vacate. UNPF has one, 10-year renewal option available.
Broadridge (87,165 SF, 8.5% of NRA, 10.6% of underwritten rent). Broadridge is a provider of investor communications and technology-driven solutions to banks, broker-dealers, mutual funds and corporate issuers. The company's segments include investor communication solutions and global technology and operations. Broadridge has been a tenant at the 605 Third Avenue Property since February 2020, has a lease expiration of January 31, 2035 and has one, 10-year renewal option available.
The following table presents certain information relating to the major tenants at the 605 Third Avenue Property:
| Tenant Summary(1) | |||||||||
| Tenant Name | Credit Rating (Fitch/Moody's/ S&P)(2) | Tenant SF | Approx. % of SF | Annual UW Rent | % of Total Annual UW Rent | Annual UW Rent PSF(3) | Lease Expiration | Renewal Options | Term. Option (Y/N) |
| Univision(4) | NR/NR/NR | 194,701 | 18.9% | $11,056,864 | 18.0% | $56.79 | 12/31/2028 | (5) | N |
| UNPF(6) | NR/NR/NR | 130,740 | 12.7% | $5,471,469 | 8.9% | $41.85 | 12/31/2025 | 1 x 10-year | Y |
| Broadridge | BBB+/Baa1/BBB+ | 87,165 | 8.5% | $6,476,486 | 10.6% | $74.30 | 1/31/2035 | 1 x 10-year | N |
| AECOM Technology Corporation(7) | NR/NR/NR | 78,484 | 7.6% | $4,081,168 | 6.7% | $52.00 | 3/31/2033 | 1 x 10-year | Y |
| Anti-Defamation League of B’nai B’rith, Inc. | NR/NR/NR | 73,333 | 7.1% | $3,571,735 | 5.8% | $48.71 | 3/31/2027 | 1 x 10-year | N |
| Subtotal/Wtd. Avg. | 564,423 | 54.9% | $30,657,721 | 50.0% | $54.32 | ||||
| Other Tenants | 434,505 | 42.3% | $30,610,678 | 50.0% | $70.45 | ||||
| Vacant Space | 28,808 | 2.8% | $0 | 0.0% | |||||
| Total/Wtd. Avg. | 1,027,736 | 100.0% | $61,268,399 | 100.0% | $61.33 | ||||
| (1) | Information is based on the underwritten rent roll as of October 1, 2020. |
| (2) | Certain ratings are those of the parent company whether or not the parent company guarantees the lease. |
| (3) | Total/Wtd. Avg. Annual UW Rent PSF excludes vacant space. |
| (4) | Univision is currently subleasing space to the following subtenants through Univision’s lease expiration: Wolf, Greenfield & Sacks (19,871 SF) at $52.00 PSF, Shoptalk Commerce (19,871 SF) at $41.00 PSF, Levy Konigsberg (19,871 SF) at $45.00 PSF, and DCS Advisory (29,331 SF) at $45.00 PSF. The 605 Third Avenue Whole Loan was underwritten based on the rent under the prime lease. Univision has a free rent period from January through June 2024 (for which the 605 Third Avenue Borrower is required to make deposits into a free rent reserve as described below under “Escrows and Reserves—Free Rent Reserve” during the period from January 2022 through December 2023) and also has free rent during April, July and October 2028 (for which the 605 Third Avenue Borrower is required to make deposits into a free rent reserve as described below under “Escrows and Reserves—Free Rent Reserve” during the period from April 1, 2027 through March 31, 2028). |
| (5) | Univision has two, 5-year renewal options or one, 10-year renewal option, upon notice of at least 18 months prior to the expiration of the current term. Univision may only exercise its renewal option with respect to at least 37,000 rentable SF. The fixed annual rent for each extension term is required to be an amount equal to 95% of the market value rent. |
| (6) | If the United Nations leaves its headquarters in New York City, UNPF has the option to terminate its lease upon written notice and subject to termination costs equal to the sum of unamortized tenant improvements, leasing commissions and legal fees. The termination date will occur one year after UNPF provides written notice of intent to vacate. |
| (7) | AECOM Technology Corporation has the option to terminate its lease effective September 30, 2028 upon written notice given by September 30, 2026 accompanied by a termination payment. AECOM Technology Corporation has free rent through June 2021 and a partial rent abatement in July 2021, which have been reserved for. |
This is not a research report and was not prepared by any Underwriter’s research department. Please see additional important information and qualifications at the end of this Term Sheet.
69
| Office – CBD | Loan #4 | Cut-off Date Balance: | $71,000,000 | |
| 605 Third Avenue | 605 Third Avenue | Cut-off Date LTV: | 33.7% | |
| New York, NY 10158 | UW NCF DSCR: | 6.61x | ||
| UW NOI Debt Yield: | 13.9% |
The following table presents certain information relating to the lease rollover schedule at the 605 Third Avenue Property:
| Lease Rollover Schedule(1)(2) | ||||||||
| Year | # of Leases Rolling | SF Rolling | UW Rent PSF Rolling | Approx. % of Total SF Rolling | Approx. Cumulative % of SF Rolling | Total UW Rent Rolling | Approx. % of Total Rent Rolling | Approx. Cumulative % of Total Rent Rolling |
| 2021 | 1 | 19,871 | $92.00 | 1.9% | 1.9% | $1,828,132 | 3.0% | 3.0% |
| 2022 | 2 | 10,980 | $53.26 | 1.1% | 3.0% | $584,844 | 1.0% | 3.9% |
| 2023 | 0 | 0 | $0.00 | 0.0% | 3.0% | $0 | 0.0% | 3.9% |
| 2024 | 0 | 0 | $0.00 | 0.0% | 3.0% | $0 | 0.0% | 3.9% |
| 2025 | 1 | 130,740 | $41.85 | 12.7% | 15.7% | $5,471,469 | 8.9% | 12.9% |
| 2026 | 1 | 3,161 | $271.43 | 0.3% | 16.0% | $857,990 | 1.4% | 14.3% |
| 2027 | 5 | 100,030 | $55.63 | 9.7% | 25.8% | $5,565,077 | 9.1% | 23.4% |
| 2028 | 4 | 271,898 | $59.19 | 26.5% | 52.2% | $16,093,898 | 26.3% | 49.6% |
| 2029 | 4 | 72,513 | $70.42 | 7.1% | 59.3% | $5,106,086 | 8.3% | 58.0% |
| 2030 | 3 | 69,321 | $57.70 | 6.7% | 66.0% | $3,999,948 | 6.5% | 64.5% |
| 2031 | 1 | 28,976 | $63.00 | 2.8% | 68.8% | $1,825,488 | 3.0% | 67.5% |
| 2032 & Beyond | 8 | 291,438 | $68.40 | 28.4% | 97.2% | $19,935,467 | 32.5% | 100.0% |
| Vacant Space | 0 | 28,808 | $0.00 | 2.8% | 100.0% | $0 | 0.0% | 100.0% |
| Total/Wtd. Avg.(3) | 30 | 1,027,736 | $61.33 | 100.0% | $61,268,399 | 100.0% | ||
| (1) | Information is based on the underwritten rent roll as of October 1, 2020. |
| (2) | Certain tenants may have lease termination options that are exercisable prior to the stated expiration date of the subject lease or leases that are not considered in the lease rollover schedule. |
| (3) | Total/Wtd. Avg. UW Rent PSF Rolling excludes vacant space. |
COVID-19 Update. As of March 5, 2021, the 605 Third Avenue Whole Loan is current as of the March debt service payment and is not subject to any forbearance, modification or debt service relief request. As of February 23, 2021, the 605 Third Avenue Borrower has reported that the 605 Third Avenue Property is open and operating, with 92.9% of tenants by occupied NRA and 93.5% of tenants by underwritten base rent having paid their full February 2021 rent payments. Six tenants (16.8% of NRA and 15.6% of underwritten base rent) at the 605 Third Avenue Property have been granted deferrals of rent by the 605 Third Avenue Borrower. Five of the six tenants (16.1% of NRA and 14.5% of underwritten base rent) were granted between 3 and 5 months of deferred rent with repayment over fixed periods commencing on various dates in 2020 and 2021. One of the six tenants (0.7% of NRA and 1.1% of underwritten base rent) was granted deferred rent from January through June 2021, of which 50% was forgiven and the remaining deferred amount is required to be repaid across 24 monthly installments beginning January 1, 2022.
The Market. The 605 Third Avenue Property is located in New York, New York along the entire eastern blockfront of Third Avenue between East 39th and East 40th Streets within the Grand Central office submarket of Midtown Manhattan. The 605 Third Avenue Property is located near major commercial landmarks and public attractions such as St. Patrick’s Cathedral, The New York Public Library, The MetLife Building, The Helmsley Building, The Bank of America Tower and the Chrysler Building. Primary access to the 605 Third Avenue Property is provided by Grand Central Terminal, which services Metro-North and many subway lines. The 605 Third Avenue Property is located four blocks southeast of the 42nd Street – Bryant Park subway station, which services the 7, B, D, F and M lines. According to the appraisal, as of the third quarter of 2020, the vacancy rate in the Grand Central office submarket was approximately 7.1%, with average asking rents of $89.46 PSF and inventory of approximately 47.6 million SF. According to the appraisal, as of the third quarter of 2020, the vacancy rate in the Midtown office market was approximately 6.0%, with average asking rents of $85.76 PSF and inventory of approximately 288.0 million SF.
The following table presents certain information relating to the appraisal’s market rent conclusion for the 605 Third Avenue Property:
| Market Rent Summary | ||||
| Market Rent (PSF) | Lease Term (Years) | Lease Type (Reimbursements) | Rent Increase Projection | |
| Office (Floors 2-10) | $60.00 | 10 | Modified Gross | $7.00 PSF Every 5-Years |
| Office (Floors 11-14) | $65.00 | 10 | Modified Gross | $7.00 PSF Every 5-Years |
| Office (Floors 15-24) | $68.00 | 10 | Modified Gross | $7.00 PSF Every 5-Years |
| Office (Floors 25-34) | $72.00 | 10 | Modified Gross | $7.00 PSF Every 5-Years |
| Office (Floors 35-44) | $75.00 | 10 | Modified Gross | $7.00 PSF Every 5-Years |
| Retail Ground Third Avenue | $175.00 | 10 | Modified Gross | 2.50% Annual Increase |
| Ground Corner | $250.00 | 10 | Modified Gross | 2.50% Annual Increase |
| Retail Ground Side Street | $125.00 | 10 | Modified Gross | 2.50% Annual Increase |
| Retail Multi-Level | $65.00 | 10 | Modified Gross | 2.50% Annual Increase |
| Storage | $25.00 | 10 | Modified Gross | 2.50% Annual Increase |
| Retail Newstand | $55.00 | 10 | Modified Gross | 2.50% Annual Increase |
This is not a research report and was not prepared by any Underwriter’s research department. Please see additional important information and qualifications at the end of this Term Sheet.
70
| Office – CBD | Loan #4 | Cut-off Date Balance: | $71,000,000 | |
| 605 Third Avenue | 605 Third Avenue | Cut-off Date LTV: | 33.7% | |
| New York, NY 10158 | UW NCF DSCR: | 6.61x | ||
| UW NOI Debt Yield: | 13.9% |
The following table presents recent leasing data with respect to comparable office properties with respect to the 605 Third Avenue Property:
| Comparable Office Lease Summary | |||||||
| Property/Location | Year Built | SF | Tenant Name | Size (SF) | Lease Date | Rent PSF | Lease Type |
605 Third Avenue (subject) New York, NY | 1965 | 1,027,736 | Univision | 194,701 | Various | $56.79 | Modified Gross |
600 Third Avenue New York, NY | 1970 | 575,600 | Energy Impact Partners Pomerantz | 13,129 4,668
| Oct. 2020 July 2020
| $85.00 $64.00
| Modified Gross Modified Gross |
19 West 44th Street New York, NY | 1916 / 2014 | 303,943 | Corporation Service Company | 12,273 | May 2020 | $64.00 | Modified Gross |
99 Park Avenue New York, NY | 1954 | 640,122 | Bosley Medical | 14,469 | April 2020 | $67.00 | Modified Gross |
366 Madison Avenue New York, NY | 1920 | 93,000 | FordHarrison | 6,851 | Jan. 2020 | $65.00 | Modified Gross |
711 Third Avenue New York, NY | 1955 / 2010 | 592,772 | Strategic Financial Planning Center on Addiction and Substance Abuse Goldberg Segalla LLP | 82,557 30,035 10,422 | Dec. 2019 Nov. 2019 Oct. 2019 | $62.00 $62.00 $67.13 | Modified Gross Modified Gross Modified Gross |
420 Lexington Avenue New York, NY | 1927 / 1999 | 1,513,673 | Greenberg Traurig LLP | 46,744 | Dec. 2019 | $65.00 | Modified Gross |
733 Third Avenue New York, NY | 1961 / 2018 | 445,000 | EisnerAmper
| 124,364
| Dec. 2019 | $59.50 | Modified Gross |
708 Third Avenue New York, NY | 1931 / 2019 | 420,000 | ZEFR Crux Informatics | 17,896
13,220
| Nov. 2019
Sept. 2019
| $80.00
$83.00
| Modified Gross
Modified Gross
|
675 Third Avenue New York, NY | 1927 / 1994 | 342,000 | T&R Productions | 8,569 | Nov. 2019 | $70.00 | Modified Gross |
575 Fifth Avenue New York, NY | 1984 | 513,740 | Forter, Inc. | 21,690 | Sept. 2019 | $81.00 | Modified Gross |
Source: Appraisal.
Operating History and Underwritten Net Cash Flow. The following table presents certain information relating to the operating history and Underwritten Net Cash Flow at the 605 Third Avenue Property:
| Cash Flow Analysis(1) | ||||||
| 2017(2) | 2018(2) | 2019(3) | 9/30/2020 TTM(3)(4) | UW(4) | UW PSF | |
| Gross Potential Rent(5) | $40,934,326 | $39,522,660 | $37,440,783 | $52,128,598 | $61,268,399 | $59.61 |
| Total Recoveries | $7,715,168 | $4,583,083 | $4,400,331 | $4,802,886 | $5,609,565 | $5.46 |
| Other Income | $1,135,055 | $1,327,105 | $2,111,375 | $1,850,293 | $1,282,031 | $1.25 |
| Less Vacancy & Credit Loss | $0 | $0 | $0 | $0 | $0 | $0.00 |
| Effective Gross Income | $49,784,549 | $45,432,848 | $43,952,489 | $58,781,777 | $68,159,995 | $66.32 |
| Real Estate Taxes | $13,712,598 | $14,086,765 | $14,463,311 | $13,863,649 | $14,330,316 | $13.94 |
| Insurance | $600,483 | $665,212 | $655,019 | $557,557 | $714,021 | $0.69 |
| Other Expenses | $22,275,086 | $19,882,399 | $20,820,879 | $20,490,626 | $20,985,093 | $20.42 |
| Total Expenses | $36,588,167 | $34,634,376 | $35,939,209 | $34,911,832 | $36,029,430 | $35.06 |
| Net Operating Income | $13,196,382 | $10,798,472 | $8,013,280 | $23,869,945 | $32,130,565 | $31.26 |
| CapEx | $0 | $0 | $0 | $0 | $205,547 | $0.20 |
| TI/LC | $0 | $0 | $0 | $0 | $1,950,230 | $1.90 |
| Net Cash Flow | $13,196,382 | $10,798,472 | $8,013,280 | $23,869,945 | $29,974,788 | $29.17 |
| Occupancy % | 71.9% | 76.6% | 96.7% | 97.2%(6) | 97.2% | |
| NOI DSCR(7) | 2.91x | 2.38x | 1.77x | 5.26x | 7.08x | |
| NCF DSCR(7) | 2.91x | 2.38x | 1.77x | 5.26x | 6.61x | |
| NOI Debt Yield(7) | 5.7% | 4.7% | 3.5% | 10.3% | 13.9% | |
| NCF Debt Yield(7) | 5.7% | 4.7% | 3.5% | 10.3% | 13.0% | |
| (1) | For the avoidance of doubt, no COVID-19 specific adjustments have been made to the lender underwriting. |
| (2) | The decrease in Gross Potential Rent and Net Operating Income between 2017 and 2018 was mainly due to Neuberger Berman vacating the 605 Third Avenue Property. |
| (3) | The increase in Gross Potential Rent and Net Operating Income between 2019 and 9/30/2020 TTM was mainly due to (i) new leases signed between the end of 2019 and the beginning of 2020 totaling approximately $9,227,237 of rent, (ii) an increase in overall base rent for a number of tenants from 2019, (iii) a reduction in the repairs and maintenance expense of approximately $832,000 and (iv) expiration of free rent periods. |
| (4) | The increase in Gross Potential Rent and Net Operating Income between 9/30/2020 TTM and UW is mainly due to recent new leases signed in 2020 including Broadridge ($6,476,486 of UW rent), Katsky Korins LLP ($1,351,228 of UW rent), Global X Capital Management ($1,101,848 of UW rent) and One Sky Flight ($357,124 of UW rent). |
| (5) | UW Gross Potential Rent is as of October 1, 2020 and includes rent steps of $126,203 through October 31, 2021. |
| (6) | 9/30/2020 TTM Occupancy % is as of October 1, 2020. |
| (7) | The debt service coverage ratios and debt yields are based on the 605 Third Avenue Senior Loans, and exclude the 605 Third Avenue Subordinate Companion Loans and 605 Third Avenue Mezzanine Loan. |
This is not a research report and was not prepared by any Underwriter’s research department. Please see additional important information and qualifications at the end of this Term Sheet.
71
| Office – CBD | Loan #4 | Cut-off Date Balance: | $71,000,000 | |
| 605 Third Avenue | 605 Third Avenue | Cut-off Date LTV: | 33.7% | |
| New York, NY 10158 | UW NCF DSCR: | 6.61x | ||
| UW NOI Debt Yield: | 13.9% |
Escrows and Reserves.
Real Estate Taxes – During a Trigger Period (as defined below), the 605 Third Avenue Whole Loan documents provide for ongoing monthly deposits into a reserve for real estate taxes in an amount equal to 1/12 of the real estate taxes that the lender estimates will be payable during the next twelve months for the 605 Third Avenue Property.
Insurance – During a Trigger Period, the 605 Third Avenue Whole Loan documents provide for ongoing monthly deposits into a reserve for insurance premiums in an amount equal to 1/12 of the insurance premiums that the lender estimates will be payable for the renewal of coverage upon the expiration of the insurance policies; provided that such monthly deposits are not required so long as a blanket insurance policy acceptable to the lender is in effect with respect to the policies required under the 605 Third Avenue Whole Loan documents.
Replacement Reserve – During a Trigger Period, the 605 Third Avenue Whole Loan documents provide for ongoing monthly deposits of approximately $17,129 into a reserve for approved capital expenditures; provided that such monthly deposits are not required so long as the balance in such reserve equals or exceeds $411,096.
TI/LC Reserve – The 605 Third Avenue Whole Loan documents provide for an upfront reserve of approximately $1,092,905 for outstanding tenant improvements or rent credits payable to the tenant Podell, Schwartz, Schecter & Bankfield, LLP. In addition, during a Trigger Period, the 605 Third Avenue Whole Loan documents provide for ongoing monthly deposits of approximately $107,056 into a reserve for future tenant improvements and leasing commissions; provided that such monthly deposits are not required so long as the balance in such reserve equals or exceeds $4,000,000 (excluding from such balance any remaining portion of the upfront reserve and any proceeds of a 605 Third Avenue Permitted Future Mezzanine Loan (as defined below) deposited into such reserve).
Free Rent Reserve – The 605 Third Avenue Whole Loan documents provide for an upfront reserve of approximately $934,456 for outstanding free rent credits for various tenants, including Aecom Technology Corporation, and so long as the Univision lease remains in effect, (i) on each monthly payment date during the First Univision Sweep Period (as defined below), ongoing monthly deposits of approximately $250,441 into a reserve for outstanding free rent credits available to Univision during the First Univision Free Rent Period (as defined below), and (ii) on each monthly payment date during the Second Univision Sweep Period (as defined below), ongoing monthly deposits of approximately $250,441 into a reserve for outstanding free rent credits available to Univision during the Second Univision Free Rent Period (as defined below).
“First Univision Sweep Period” means the period commencing on January 1, 2022 and ending on December 31, 2023.
“First Univision Free Rent Period” means the period of free rent credit provided to Univision pursuant to the terms of the Univision lease during the period commencing on January 1, 2024 and ending June 30, 2024.
“Second Univision Sweep Period” means the period commencing on April 1, 2027 and ending on March 31, 2028.
“Second Univision Free Rent Period” means the period of free rent credit provided to Univision pursuant to the terms of the Univision lease during the calendar months of April, 2028, July, 2028, and October, 2028.
Lockbox and Cash Management. The 605 Third Avenue Whole Loan is structured with a hard lockbox and springing cash management. The 605 Third Avenue Borrower is required to establish and maintain a lockbox account for the benefit of an administrative agent for the lender (the “Agent”), to direct all tenants of the 605 Third Avenue Property to deposit all rents directly into the lockbox account, and to deposit any funds received by the 605 Third Avenue Borrower or property manager into the lockbox account within two business days of receipt. In addition, the 605 Third Avenue Borrower is required to establish and maintain a cash management account controlled by the Agent on behalf of the lender. So long as no Trigger Period or Univision Sweep Period (as defined below) is continuing, all funds in the lockbox account are required to be swept to the 605 Third Avenue Borrower’s operating account. During the continuance of a Trigger Period, provided no event of default under the 605 Third Avenue Whole Loan documents is continuing, all funds in the cash management account are required to be applied on each monthly payment date: (i) to make the monthly deposits into the real estate tax and insurance reserves as described above under “Escrows and Reserves,” (ii) to pay debt service on the 605 Third Avenue Whole Loan, (iii) to make the monthly deposit into the replacement reserve and the rollover funds reserve as described above under “Escrows and Reserves,” (iv) if the Trigger Period exists during a Univision Sweep Period, to make the required deposits into the free rent reserve as described above under “Escrows and Reserves,” (v) to pay operating expenses set forth in the annual budget (which is deemed approved by the lender so long as it meets certain specified parameters) and lender-approved extraordinary expenses, (vi) if the 605 Third Avenue Mezzanine Loan is outstanding, to pay debt service and other amounts then due and payable under the 605 Third Avenue Mezzanine Loan, (vii) if a 605 Third Avenue Permitted Future Mezzanine Loan is outstanding, to pay debt service and other amounts then due and payable under the 605 Third Avenue Permitted Future Mezzanine Loan, and (viii) to deposit any remainder into an excess cash flow reserve to be held as additional security for the 605 Third Avenue Whole Loan during the continuance of such Trigger Period (provided that, at the 605 Third Avenue Borrower’s request, provided no event of default is continuing, funds in such reserve will be applied to pay the amounts described in clauses (i) through (vii) and certain other property expenses). During the continuance of a Univision Sweep Period, provided no event of default or Trigger Period is continuing, all amounts deposited into the cash management account in respect of free rent during the preceding month will be disbursed (i) to the free rent account to make payments on account of free rent and (ii) any remainder, to the 605 Third Avenue Borrower.
“Trigger Period” means a period:
| (i) | commencing upon an event of default under the 605 Third Avenue Whole Loan documents or an event of default under the 605 Third Avenue Mezzanine Loan documents, and ending upon the lender’s or mezzanine lender’s, as applicable, acceptance of a cure of such event of default; or |
| (ii) | commencing upon the debt yield on the 605 Third Avenue Whole Loan falling below 8.10% as of the last day of any calendar quarter, and ending on the date such debt yield equals or exceeds 8.10% as of the last day of two consecutive calendar quarters; or |
| (iii) | commencing upon the aggregate debt yield on the 605 Third Avenue Whole Loan, the 605 Third Avenue Mezzanine Loan and any 605 Third Avenue Permitted Future Mezzanine Loan falling below 6.25% as of the last day of any calendar quarter, and ending on the date such aggregate debt yield equals or exceeds 6.25% as of the last day of two consecutive calendar quarters. |
This is not a research report and was not prepared by any Underwriter’s research department. Please see additional important information and qualifications at the end of this Term Sheet.
72
| Office – CBD | Loan #4 | Cut-off Date Balance: | $71,000,000 | |
| 605 Third Avenue | 605 Third Avenue | Cut-off Date LTV: | 33.7% | |
| New York, NY 10158 | UW NCF DSCR: | 6.61x | ||
| UW NOI Debt Yield: | 13.9% |
“Univision Sweep Period” means the First Univision Sweep Period or Second Univision Sweep Period, as the case may be.
Additional Secured Indebtedness (not including trade debts). The 605 Third Avenue Property also secures the 605 Third Avenue Non-Serviced Pari Passu Companion Loans, which have an aggregate Cut-off Date principal balance of $160,000,000, and the 605 Third Avenue Subordinate Companion Loans, which have an aggregate Cut-off Date principal balance of $78,000,000. The 605 Third Avenue Non-Serviced Pari Passu Companion Loans accrue interest at the same rate as the 605 Third Avenue Mortgage Loan and the 605 Third Avenue Subordinate Companion Loans accrue interest at the rate of 3.07800% per annum. The 605 Third Avenue Mortgage Loan and the 605 Third Avenue Non-Serviced Pari Passu Companion Loans are pari passu in right of payment and together are senior in right of payment to the 605 Third Avenue Subordinate Companion Loans. The holders of the 605 Third Avenue Mortgage Loan, the 605 Third Avenue Non-Serviced Pari Passu Companion Loans and the 605 Third Avenue Subordinate Companion Loans have entered into a co-lender agreement which sets forth the allocation of collections on the 605 Third Avenue Whole Loan. See “Description of the Mortgage Pool—The Whole Loans—The 605 Third Avenue Pari Passu-A/B Whole Loan” in the Preliminary Prospectus.
Mezzanine Loan and Preferred Equity. Concurrently with the funding of the 605 Third Avenue Whole Loan, Morgan Stanley Mortgage Capital Holdings LLC funded a mezzanine loan in the amount of $91,000,000 (the “605 Third Avenue Mezzanine Loan”) to the holder of 100% of the direct equity interests in the 605 Third Avenue Borrower (such holder, the “605 Third Avenue Mezzanine Borrower”), secured by a pledge of such equity interests. The 605 Third Avenue Mezzanine Loan is co-terminous with the 605 Third Avenue Whole Loan, accrues interest at the rate of 5.05000% per annum and requires payments of interest only until its maturity date. The 605 Third Avenue Mezzanine Loan has been sold to a third party holder.
The 605 Third Avenue total debt as of the origination date is summarized in the following table.
| 605 Third Avenue Total Debt Summary | |||||
| Note | Original Balance | Interest Rate | Cumulative UW NCF DSCR | Cumulative UW NOI Debt Yield | Cumulative Cut-off Date LTV |
| Senior Loans | $231,000,000 | 1.93752% | 6.61x | 13.9% | 33.7% |
| Subordinate Companion Loans | $78,000,000 | 3.0780% | 4.30x | 10.4% | 45.1% |
| Mezzanine Loan | $91,000,000 | 5.0500% | 2.58x | 8.0% | 58.4% |
| Total Debt | $400,000,000 | 2.8680% | 2.58x | 8.0% | 58.4% |
In addition, the holders of the direct or indirect equity interests in the 605 Third Avenue Mezzanine Borrower are permitted to incur future mezzanine debt secured by a pledge of 100% of such equity interests in the 605 Third Avenue Mezzanine Borrower (a “605 Third Avenue Permitted Future Mezzanine Loan”), provided that, among other conditions: (i) no event of default is continuing; (ii) the aggregate loan-to-value ratio of the 605 Third Avenue Whole Loan, the 605 Third Avenue Mezzanine Loan and the 605 Third Avenue Permitted Future Mezzanine Loan (collectively, the “605 Third Avenue Total Debt”) is less than or equal to 58.4%, (iii) the aggregate debt service coverage ratio of the 605 Third Avenue Total Debt is at least 2.00x, (iv) the aggregate debt yield of the 605 Third Avenue Total Debt is at least 7.8%, and the debt yield of the 605 Third Avenue Whole Loan is at least 10.0%; (v) the term of the 605 Third Avenue Permitted Future Mezzanine Loan is at least co-terminous with the term of the 605 Third Avenue Whole Loan; (vi) an intercreditor agreement is executed that is reasonably acceptable to the lender and acceptable to the rating agencies rating securities backed by the 605 Third Avenue Whole Loan; and (vii) a rating agency confirmation is delivered by each rating agency rating securities backed by the 605 Third Avenue Whole Loan.
In the event that the 605 Third Avenue Permitted Future Mezzanine Loan is originated from and after July 1, 2027, the net loan proceeds must be deposited into the rollover funds reserve in an amount equal to $75 PSF of space which, as of the origination date of the 605 Third Avenue Permitted Future Mezzanine Loan, is vacant or is excluded from the calculation of underwritten net cash flow under the 605 Third Avenue Whole Loan Documents (other than due to free rent periods). A 605 Third Avenue Permitted Future Mezzanine Loan may be prepaid or defeased without simultaneous prepayment or defeasance of the 605 Third Avenue Whole Loan, and may be refinanced by another mezzanine loan that meets the conditions to a 605 Third Avenue Permitted Future Mezzanine Loan.
Release of Property. Not permitted.
Letter of Credit. None.
Right of First Offer / Right of First Refusal. None.
Ground Lease. None.
Terrorism Insurance. The 605 Third Avenue Borrower is required to obtain and maintain an “all risk” property insurance policy that covers perils of terrorism and acts of terrorism in an amount equal to the “full replacement cost” of the 605 Third Avenue Property together with 18 months of business income insurance, provided that such coverage is commercially available. For so long as the Terrorism Risk Insurance Program Reauthorization Act of 2015 or any replacement, reauthorization or extension thereof (“TRIPRA”) is in effect, the lender is required to accept terrorism insurance which covers against “certified” acts as defined by TRIPRA but only in the event that TRIPRA continues to cover both domestic and foreign acts of terrorism. If TRIPRA is not in effect, then, provided that terrorism insurance is commercially available, the 605 Third Avenue Borrower will be required to carry terrorism insurance, but in such event it will not be required to spend on terrorism insurance more than two times the amount of the insurance premiums that are payable at such time in respect of the property and business income insurance required under the loan documents (without giving effect to the cost of terrorism and earthquake components of such insurance). See “Risk Factors—Risks Relating to the Mortgage Loans—Terrorism Insurance May Not Be Available for All Mortgaged Properties” in the Preliminary Prospectus.
This is not a research report and was not prepared by any Underwriter’s research department. Please see additional important information and qualifications at the end of this Term Sheet.
73
| Other - Leased Fee | Loan #5 | Cut-off Date Balance: | $55,000,000 |
| 530 Seventh Avenue | 530 Seventh Avenue Fee | Cut-off Date LTV: | 39.0% |
| New York, NY 10018 | U/W NCF DSCR: | 3.97x | |
| U/W NOI Debt Yield: | 9.5% |
This is not a research report and was not prepared by any Underwriter’s research department. Please see additional important information and qualifications at the end of this Term Sheet.
74
| Other - Leased Fee | Loan #5 | Cut-off Date Balance: | $55,000,000 |
| 530 Seventh Avenue | 530 Seventh Avenue Fee | Cut-off Date LTV: | 39.0% |
| New York, NY 10018 | U/W NCF DSCR: | 3.97x | |
| U/W NOI Debt Yield: | 9.5% |
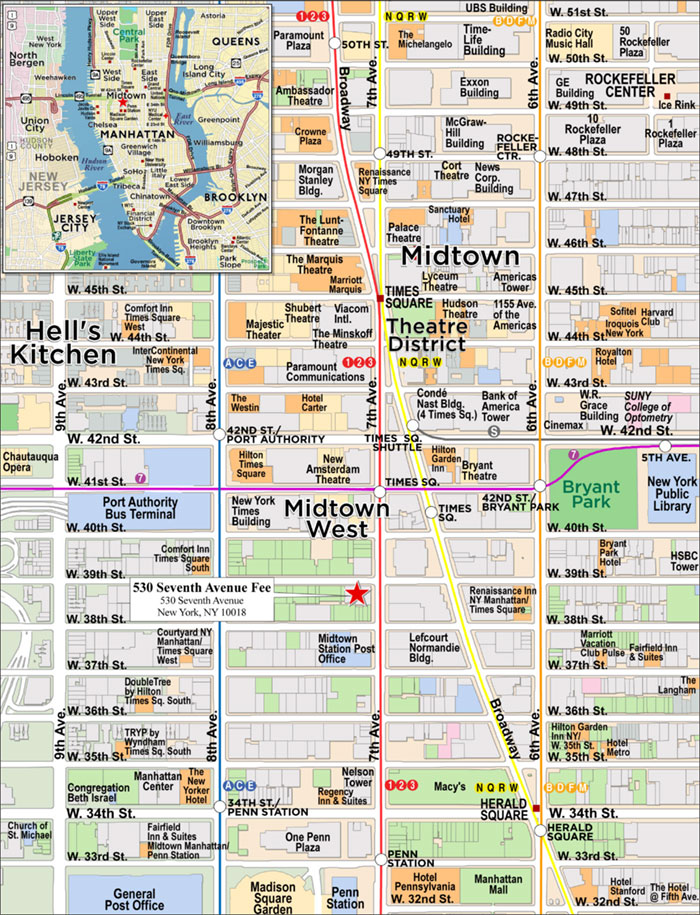
This is not a research report and was not prepared by any Underwriter’s research department. Please see additional important information and qualifications at the end of this Term Sheet.
75
| Mortgage Loan No. 5 – 530 Seventh Avenue Fee |
| Mortgage Loan Information | Property Information(3) | ||||||
| Mortgage Loan Seller: | MSMCH | Single Asset/Portfolio: | Single Asset | ||||
| Credit Assessment (Moody’s/DBRSM/Fitch): | Aaa/AAA/BBB-sf | Location: | New York, NY 10018 | ||||
| Original Balance: | $55,000,000 | General Property Type: | Other | ||||
| Cut-off Date Balance: | $55,000,000 | Detailed Property Type: | Leased Fee | ||||
| % of Initial Pool Balance: | 6.1% | Title Vesting: | Fee | ||||
| Loan Purpose: | Refinance | Year Built/Renovated: | 1929/N/A | ||||
| Borrower Sponsor: | Robert Savitt | Size: | 495,245 SF | ||||
| Guarantor(1): | N/A | Cut-off Date Balance Per SF: | $111 | ||||
| Mortgage Rate: | 2.3600% | Maturity Date Balance Per SF: | $111 | ||||
| Note Date: | 2/26/2021 | Property Manager(4): | Savitt Partners | ||||
| First Payment Date: | 4/1/2021 | (borrower-related) | |||||
| Maturity Date: | 3/1/2031 | ||||||
| Original Term to Maturity: | 120 months | Underwriting and Financial Information(5)(6)(7) | |||||
| Original Amortization Term: | 0 months | UW NOI: | $5,220,000 | ||||
| IO Period: | 120 months | UW NOI Debt Yield: | 9.5% | ||||
| Seasoning: | 0 months | UW NOI Debt Yield at Maturity: | 9.5% | ||||
| Prepayment Provisions: | LO (24); DEF (89); O (7) | UW NCF DSCR: | 3.97x | ||||
| Lockbox/Cash Mgmt Status: | Springing/Springing | Most Recent NOI: | $4,785,000 (12/31/2020) | ||||
| Additional Debt Type: | No | 2nd Most Recent NOI: | $4,785,000 (12/31/2019) | ||||
| Additional Debt Balance: | N/A | 3rd Most Recent NOI: | $4,785,000 (12/31/2018) | ||||
| Future Debt Permitted (Type): | No (N/A) | Most Recent Occupancy: | 100.0% (12/1/2020) | ||||
| Reserves(2) | 2nd Most Recent Occupancy: | 100.0% (12/31/2019) | |||||
| Type | Initial | Monthly | Cap | 3rd Most Recent Occupancy: | 100.0% (12/31/2018) | ||
| RE Taxes: | $0 | Springing | N/A | Appraised Value (as of): | $141,000,000 (1/20/2021) | ||
| Insurance: | $0 | Springing | N/A | Appraised Value Per SF: | $285 | ||
| Replacement Reserve: | $0 | Springing | N/A | Cut-off Date LTV Ratio: | 39.0% | ||
| TI/LC Reserve: | $0 | Springing | N/A | Maturity Date LTV Ratio: | 39.0% | ||
| Sources and Uses | ||||||
| Sources | Proceeds | % of Total | Uses | Proceeds | % of Total | |
| Loan Amount: | $55,000,000 | 100.0% | Loan Payoff: | $30,404,167 | 55.3% | |
| Return of Equity: | $23,161,103 | 42.1% | ||||
| Closing Costs: | $1,434,730 | 2.6% | ||||
| Total Sources: | $55,000,000 | 100.0% | Total Uses: | $55,000,000 | 100.0% | |
| (1) | There is no non-recourse carveout guarantor or separate environmental indemnitor with respect to the 530 Seventh Avenue Fee Mortgage Loan (as defined below). |
| (2) | See “Escrows and Reserves” below for further discussion of reserve requirements |
| (3) | The 530 Seventh Avenue Fee Mortgage Loan is secured by land occupied by a 30-story office building located at 530 Seventh Avenue in New York, New York and encumbered by a ground lease. The improvements are not collateral for the 530 Seventh Avenue Fee Mortgage Loan other than the 530 Seventh Avenue Fee Borrower’s (as defined below) reversionary interest therein. Certain property information, such as Size, Cut-off Date Balance per SF, Maturity Date Balance per SF, and Year Built/Renovated relate to the Non-Collateral Improvements (defined below) and are for informational purposes only. |
| (4) | The property manager manages the Non-Collateral Improvements pursuant to a property management agreement between the ground tenant and the property manager, to which the 530 Seventh Avenue Fee Borrower is not a party. |
| (5) | Underwriting and Financial information is based on the current annual ground lease payment due under the ground lease described below under “The Property”. |
| (6) | The novel coronavirus pandemic is an evolving situation and could impact the 530 Seventh Avenue Fee Mortgage Loan more severely than assumed in the underwriting of the 530 Seventh Avenue Fee Mortgage Loan and could adversely affect the NOI, NCF and occupancy information, as well as the appraised value and the DSCR, LTV and Debt Yield metrics presented above and herein. See "Risk Factors—Risks Related to Market Conditions and Other External Factors—The Coronavirus Pandemic Has Adversely Affected the Global Economy and Will Likely Adversely Affect the Performance of the Mortgage Loans" in the Preliminary Prospectus. |
| (7) | See “Operating History and Underwritten Net Cash Flow” below for historical operating information and occupancy data related to the Non-Collateral Improvements. |
The Mortgage Loan. The fifth largest mortgage loan (the “530 Seventh Avenue Fee Mortgage Loan”) is evidenced by a promissory note in the original principal amount of $55,000,000 and secured by a first priority fee mortgage encumbering land under a 30-story office building located at 530 Seventh Avenue, in New York, New York (the “530 Seventh Avenue Fee Property”).
The Borrower and the Borrower Sponsor. The borrower is RS Realty SPE 530 LLC (the “530 Seventh Avenue Fee Borrower”), a single-purpose Delaware limited liability company with one independent director in its organizational structure. There is no non-recourse carveout guarantor or separate environmental indemnitor with respect to the 530 Seventh Avenue Fee Mortgage Loan. The borrower sponsor is Robert Savitt. The 530 Seventh Avenue Fee Borrower is managed by Robert Savitt and wholly owned by RS Realty 530 LLC. RS Realty 530 LLC is owned by Louise Grunwald U/A DTD 12/22/95 (42.69%), 530 Adler Entity Family Trust 2011 (24.5%), 550 Adler Entity Family Trust 2011 (18.71%), 475 Adler Entity Family Trust 2011 (5.79%), Louise Grunwald U/I/D 1/1/00 (3.84%), Robert Savitt (2.96%), and Louise Grunwald (1.52%).
The Property. The 530 Seventh Avenue Fee Property consists of an approximately 0.35 acre parcel of land located at 530 Seventh Avenue in New York, New York, which is encumbered by a ground lease with G&S Realty 1, LLC (the “530 Seventh Avenue Fee Tenant”), an affiliate of the 530 Seventh Avenue Fee Borrower, that commenced on December 1, 2000 and expires on November 30, 2049 with no extension options (the “Ground Lease”). The 530 Seventh Avenue Fee Tenant, or any successor tenant under the Ground Lease (the “Ground Tenant”), owns the improvements currently located on the 530 Seventh Avenue Fee Property (the “Non-Collateral Improvements”), and none of the Non-Collateral Improvements serve as
This is not a research report and was not prepared by any Underwriter’s research department. Please see additional important information and qualifications at the end of this Term Sheet.
76
| Other - Leased Fee | Loan #5 | Cut-off Date Balance: | $55,000,000 |
| 530 Seventh Avenue | 530 Seventh Avenue Fee | Cut-off Date LTV: | 39.0% |
| New York, NY 10018 | U/W NCF DSCR: | 3.97x | |
| U/W NOI Debt Yield: | 9.5% |
collateral for the 530 Seventh Avenue Fee Mortgage Loan (other than the 530 Seventh Avenue Fee Borrower’s reversionary interest therein). Accordingly, the 530 Seventh Avenue Fee Borrower will receive only the rental income from the Ground Lease, and will not receive rental income directly from the operation of the Non-Collateral Improvements. The Ground Tenant is required to pay ground rent in the initial amount of $5,220,000, annually, on an absolute net basis. Furthermore, the ground rent is scheduled to increase in 2030 and 2040 to $5,655,000 and $6,090,000, respectively. The Non-Collateral Improvements, which were constructed in 1929, consist of a 30-story, 495,245 SF office building that was 94.6% leased to 87 tenants as of November 30, 2020, with no single tenant accounting for more than 8.8% of underwritten rent. The owner recently invested $18.0 million to preserve the Art Deco structure, including making base building upgrades, replacing the boiler system, and upgrading the elevators. The capital improvements were coupled with over $20.0 million in leasing build-out costs related to the recently signed leases. Other notable renovations include the borrower-affiliate-occupied space on the mezzanine floor, known as Space530, and the 3-level rooftop bar and lounge on the 30th through 32nd floors, known as the Skylark. There are three borrower-affiliated tenants of the Non-Collateral Improvements, which collectively represent approximately 10.8% of net rentable area and 4.2% of underwritten base rent.
The following table presents a summary regarding the largest tenants at the Non-Collateral Improvements located on the 530 Seventh Avenue Fee Property:
| Non-Collateral Improvements Tenant Summary(1) | |||||||||
| Tenant Name | Credit Rating (Fitch/Moody's/S&P)(2) | Tenant SF | Approx. % of SF | Annual UW Rent | % of Total Annual UW Rent | Annual UW Rent PSF(3) | Term. Option | Renewal Options | Lease Expiration |
| Major Tenants | |||||||||
| Perry Ellis International(4) | NR/NR/NR | 38,949 | 7.9% | $2,459,293 | 8.8% | $63.14 | N | 1, 5-year | 3/31/2023 |
| BCI Brands(5) | NR/NR/NR | 34,011 | 6.9% | $2,179,998 | 7.8% | $64.10 | Y | None | 5/31/2027 |
| Space530(6) | NR/NR/NR | 29,087 | 5.9% | $727,175 | 2.6% | $25.00 | N | None | 12/31/2035 |
| Knotel 530 Seventh Avenue LLC(7) | NR/NR/NR | 25,997 | 5.2% | $1,664,404 | 5.9% | $64.02 | N | None | (7) |
| RDG Global | NR/NR/NR | 20,783 | 4.2% | $1,310,421 | 4.7% | $63.05 | N | None | (8) |
| Subtotal/Wtd. Avg. | 148,827 | 30.1% | $8,341,290 | 29.7% | $56.05 | ||||
| Other Tenants | 319,623 | 64.5% | $19,713,415 | 70.3% | $61.68 | ||||
| Vacant Space | 26,795 | 5.4% | $0 | 0.0% | $0.00 | ||||
| Total/Wtd. Avg. | 495,245 | 100.0% | $28,054,705 | 100.0% | $59.89 | ||||
| (1) | The Non-Collateral Improvements are not collateral for the 530 Seventh Avenue Fee Mortgage Loan (except for the reversionary interest of the 530 Seventh Avenue Fee Borrower therein). The tenant information above represents leases of the Ground Tenant’s Non-Collateral Improvements and is provided for informational purposes only. Information regarding the Non-Collateral Improvements is based on the rent roll dated November 30, 2020 and no assurance can be given that changes to tenancy or the cash flow of the Non-Collateral Improvements have not been made since then. |
| (2) | Certain ratings are those of the parent company whether or not the parent guarantees the lease. |
| (3) | Wtd. Avg. Annual UW Rent PSF excludes vacant space. |
| (4) | Perry Ellis International subleases Suites 2501 and 2601 (20,449 SF) to separate companies. Perry Ellis International leases 18,500 SF on the 2nd floor through March 2023. The 2nd floor space is currently dark and on the market. Rent from such space is included in the column “Look-Through to the Non-Collateral Improvements” set forth in the table “Cash Flow Analysis of the Non-Collateral Improvements” below. |
| (5) | BCI Brands has a termination option effective as of May 31, 2022. The tenant must provide notice prior to August 31, 2021. A termination penalty of $490,438 is due at the time of notice. |
| (6) | Space530 is in a free rent period through December 2021. Space530 is a co-working space that offers private pre-built offices, team suites, common amenities, meeting rooms, and showroom space that is accessible to all tenants in the building. Space530 is owned and managed by affiliates of the 530 Seventh Avenue Fee Borrower. |
| (7) | As of January 28, 2021, Knotel 530 Seventh Avenue LLC surrendered its space at the 530 Seventh Avenue Fee Property with the exception of one suite (3,600 SF) that was replaced with a direct lease starting in February 2021. The term of the new lease is 2 years and 2 months (expiring March 31, 2023) at a base rent of $52.00 PSF. |
| (8) | The RDG Global tenant has multiple leases at the 530 Seventh Avenue Fee Property. 17,683 SF is expiring in July 2027 and 3,100 SF is expiring in February 2021. |
This is not a research report and was not prepared by any Underwriter’s research department. Please see additional important information and qualifications at the end of this Term Sheet.
77
| Other - Leased Fee | Loan #5 | Cut-off Date Balance: | $55,000,000 |
| 530 Seventh Avenue | 530 Seventh Avenue Fee | Cut-off Date LTV: | 39.0% |
| New York, NY 10018 | U/W NCF DSCR: | 3.97x | |
| U/W NOI Debt Yield: | 9.5% |
The following table presents certain information relating to the lease rollover schedule for the Non-Collateral Improvements located on the 530 Seventh Avenue Fee Property:
| Lease Rollover Schedule(1)(2) | ||||||||
| Year | # of Leases Rolling | SF Rolling | Annual UW Rent PSF Rolling | Approx. % of Total SF Rolling | Approx. Cumulative % of SF Rolling | Total UW Rent Rolling | Approx. % of Total Rent Rolling | Approx. Cumulative % of Total Rent Rolling |
| MTM | 2 | 1,507 | $47.84 | 0.3% | 0.3% | $72,090 | 0.3% | 0.3% |
| 2021 | 24 | 79,408 | $61.33 | 16.0% | 16.3% | $4,869,827 | 17.4% | 17.6% |
| 2022 | 24 | 73,725 | $58.84 | 14.9% | 31.2% | $4,338,148 | 15.5% | 33.1% |
| 2023 | 18 | 105,373 | $61.06 | 21.3% | 52.5% | $6,433,639 | 22.9% | 56.0% |
| 2024 | 6 | 25,257 | $40.47 | 5.1% | 57.6% | $1,022,223 | 3.6% | 59.7% |
| 2025 | 8 | 55,320 | $64.52 | 11.2% | 68.8% | $3,569,368 | 12.7% | 72.4% |
| 2026 | 3 | 4,819 | $205.22 | 1.0% | 69.7% | $988,962 | 3.5% | 75.9% |
| 2027 | 3 | 57,215 | $64.42 | 11.6% | 81.3% | $3,685,820 | 13.1% | 89.0% |
| 2028 | 0 | 0 | $0.00 | 0.0% | 81.3% | $0 | 0.0% | 89.0% |
| 2029 | 1 | 152 | $25.13 | 0.0% | 81.3% | $3,820 | 0.0% | 89.1% |
| 2030 | 3 | 31,688 | $73.96 | 6.4% | 87.7% | $2,343,633 | 8.4% | 97.4% |
| 2031 | 0 | 0 | $0.00 | 0.0% | 87.7% | $0 | 0.0% | 97.4% |
| 2032 & Beyond | 3 | 33,986 | $21.40 | 6.9% | 94.6% | $727,175 | 2.6% | 100.0% |
| Vacant | 0 | 26,795 | $0.00 | 5.4% | 100.0% | $0 | 0.0% | 100.0% |
| Total/Wtd. Avg. | 95 | 495,245 | $59.89 | 100.0% | $28,054,705 | 100.0% | ||
| (1) | The Non-Collateral Improvements are not collateral for the 530 Seventh Avenue Fee Mortgage Loan (except for the reversionary interest of the 530 Seventh Avenue Fee Borrower therein). The lease rollover schedule above represents leases of the Ground Tenant’s Non-Collateral Improvements and is provided for informational purposes only. Information regarding the Non-Collateral Improvements is based on the rent roll dated November 30, 2020 and no assurance can be given that changes to tenancy or the cash flow of the Non-Collateral Improvements have not been made since then. |
| (2) | Wtd. Avg. UW Rent PSF Rolling excludes vacant space. |
COVID-19 Update. As of February 22, 2021, the 530 Seventh Avenue Fee Ground Tenant is current on its rent through December 2020 and has not requested any relief due to the COVID-19 pandemic. Through the payment in March 2021, ground lease payments are paid quarterly in arrears and the ground lease payments for January and February 2021 are expected in March 2021 (after March 2021, ground lease payments will be paid monthly pursuant to an amendment to the ground lease). As of February 22, 2021, the 530 Seventh Avenue Fee Mortgage Loan is not subject to any modification or forbearance request. The first debt service payment of the 530 Seventh Avenue Fee Mortgage Loan is due in April 2021. With regard to the Non-Collateral Improvements, twenty-seven tenants (40.8% of NRA and 45.8% of base rent) were granted some form of rent relief. Rent deferrals ranged between three and 16 months, with repayment over fixed periods commencing on various dates in 2020 and 2021.
The Market. The 530 Seventh Avenue Fee Property is located in New York, New York within the Midtown office market and the Times Square South office submarket. The 530 Seventh Avenue Fee Property is located within the Garment District of Midtown. This area is generally bounded by the neighborhoods of Times Square to the north, Hudson Yards to the west, Penn Station to the south and Herald Square to the east. Located six blocks southwest of the 530 Seventh Avenue Fee Property lies the recently redeveloped Moynihan Train Station, a brand-new transit-oriented urban hub that comprises over 1.0 million SF and features passenger facilities, office, retail, and food hall space. The 530 Seventh Avenue Fee Property is located within close proximity to Bryant Park, the New York Public Library and Herald Square, which is a major retail destination within this area of Manhattan, known for serving as the home to the flagship Macy’s department store as well as the world’s largest Victoria’s Secret store. According to the appraisal, as of the fourth quarter of 2020, the Midtown office market had approximately 289.7 million SF of office space inventory, overall vacancy in the market was approximately 8.1% and asking rent was $80.11 PSF. According to the appraisal, as of the fourth quarter of 2020, the Times Square South office submarket had approximately 35.9 million SF of office space inventory, overall vacancy in the submarket was approximately 8.7% and asking rent was $54.83 PSF. According to the appraisal, the 2020 estimated population within a 0.25-, 0.5- and one-mile radius of the 530 Seventh Avenue Fee Property was 823, 17,162 and 189,445, respectively. The 2020 estimated median household income within a 0.25-, 0.5- and one-mile radius of the 530 Seventh Avenue Fee Property was $113,609, $114,012 and $122,532, respectively.
This is not a research report and was not prepared by any Underwriter’s research department. Please see additional important information and qualifications at the end of this Term Sheet.
78
| Other - Leased Fee | Loan #5 | Cut-off Date Balance: | $55,000,000 |
| 530 Seventh Avenue | 530 Seventh Avenue Fee | Cut-off Date LTV: | 39.0% |
| New York, NY 10018 | U/W NCF DSCR: | 3.97x | |
| U/W NOI Debt Yield: | 9.5% |
The following table presents leasing information for New York office properties comparable to the Non-Collateral Improvements located on the 530 Seventh Avenue Fee Property:
| Comparable Office Property Summary (Anchor and Junior Anchor Tenants) | |||||||
Property Name/ City, State | Year Built | NRA | Tenant Name | Lease Area (SF) | Lease Date | Lease Term (Yrs.) | Rent PSF |
| 111 West 33rd Street | 1954 | 731,199 | Clearview Healthcare Partners | 39,067 | 11/1/2020 | 132 | $63.00 |
| 1333 Broadway | 1915 | 359,836 | Sanne NYS Energy Research & Development Authority (NYSERDA) | 20,865 10,059 | 8/1/2020 2/1/2020 | 88 91 | $66.00 $63.00 |
| 1440 Broadway | 1924 | 745,057 | WeWork | 75,590 | 7/1/2020 | 182 | $73.00 |
| 1411 Broadway | 1969 | 1,300,000 | Screenvision | 25,261 | 5/1/2020 | 60 | $77.00 |
| 2 Herald Square | 1909 | 376,898 | WeWork Mercy College | 29,018 29,018 | 5/1/2020 5/1/2020 | 190 368 | $66.00 $61.57 |
| 31 Penn Plaza | 1925 | 446,250 | Orion Systems Integrators | 8,083 | 3/1/2020 | 68 | $68.68 |
| 1250 Broadway | 1968 | 777,825 | Transperfect Ledger Holdings | 108,160 5,893 | 2/1/2020 11/1/2019 | 180 62 | $73.00 $90.00 |
| 1400 Broadway | 1930 | 935,401 | Uber | 67,578 | 12/1/2019 | 121 | $72.50 |
| 450 Seventh Avenue | 1930 | 520,000 | MDASoft Inc. | 6,142 | 12/1/2019 | 125 | $59.00 |
| 14 Penn Plaza | 1925 | 558,766 | Abacus Group LLC | 6,417 | 11/1/2019 | 120 | $59.00 |
| 5 Penn Plaza | 1915 | 687,384 | Aetion | 28,977 | 9/1/2019 | 127 | $67.00 |
| 330 West 34th Street | 1926 | 722,000 | Marquee Brands | 27,811 | 8/1/2019 | 125 | $85.00 |
Source: Appraisal.
The following table presents certain information relating to the appraisal’s market rent conclusion for the Non-Collateral Improvements located on the 530 Seventh Avenue Fee Property:
| Market Rent Summary | ||||
| Market Rent (PSF) | Lease Term (Months) | Lease Type (Reimbursements) | Rent Increase Projection | |
| Office (2-15) | $60.00 | 10 yrs. | Modified Gross | $5.00 PSF every 5 years |
| Office (16-30) | $70.00 | 10 yrs. | Modified Gross | $5.00 PSF every 5 years |
| Penthouse (30-32) | $80.00 | 10 yrs. | Gross | $5.00 PSF every 5 years |
| Seventh Avenue Corner Retail | $300.00 | 10 yrs. | Modified Gross | 2.50% annually |
| Seventh Avenue In-Line Retail | $250.00 | 10 yrs. | Modified Gross | 2.50% annually |
| Side Street Retail | $175.00 | 10 yrs. | Modified Gross | 2.50% annually |
| Storage | $25.00 | 10 yrs. | Modified Gross | 2.50% annually |
Source: Appraisal.
This is not a research report and was not prepared by any Underwriter’s research department. Please see additional important information and qualifications at the end of this Term Sheet.
79
| Other - Leased Fee | Loan #5 | Cut-off Date Balance: | $55,000,000 |
| 530 Seventh Avenue | 530 Seventh Avenue Fee | Cut-off Date LTV: | 39.0% |
| New York, NY 10018 | U/W NCF DSCR: | 3.97x | |
| U/W NOI Debt Yield: | 9.5% |
Cash Flow Analysis of the Non-Collateral Improvements. The following table presents certain information relating to the operating history and Look Through to the Non-Collateral Improvements at the 530 Seventh Avenue Fee Property:
| Cash Flow Analysis of the Non-Collateral Improvements(1) | |||||
| Leasehold 2017 | Leasehold 2018 | Leasehold 2019 | Leasehold 9/30/2020 TTM | “Look-Through” to the Non-Collateral Improvements(2) | |
| Gross Potential Rent | $25,860,748 | $26,577,672 | $27,998,457 | $25,068,158 | $30,060,092 |
| Total Recoveries | $4,411,421 | $4,967,798 | $4,756,595 | $3,896,452 | $4,794,291 |
| Less Vacancy & Credit Loss | $0 | $0 | $0 | $0 | ($1,742,719) |
| Effective Gross Income | $30,272,169 | $31,545,470 | $32,755,052 | $28,964,610 | $33,111,664 |
| Real Estate Taxes | $6,345,396 | $6,816,320 | $7,331,255 | $7,480,317 | $8,492,604 |
| Insurance | $203,176 | $200,442 | $216,969 | $219,241 | $298,810 |
| Other Expenses | $4,443,306 | $4,768,429 | $4,465,278 | $4,258,858 | $4,722,766 |
| Total Expenses | $10,991,878 | $11,785,191 | $12,013,502 | $11,958,416 | $13,514,180 |
| Net Operating Income | $19,280,291 | $19,760,279 | $20,741,550 | $17,006,194 | $19,597,484 |
| Ground Rent | $4,785,000 | $4,785,000 | $4,785,000 | $4,785,000 | $5,220,000 |
| Net Cash Flow | $14,495,291 | $14,975,279 | $15,956,550 | $12,221,194 | $14,377,484 |
| Occupancy % | 98.3% | 96.4% | 97.1% | 95.0% | 94.6% |
| NOI DSCR | 14.65x | 15.02x | 15.76x | 12.92x | 14.89x |
| NCF DSCR | 11.01x | 11.38x | 12.12x | 9.29x | 10.92x |
| NOI Debt Yield | 35.1% | 35.9% | 37.7% | 30.9% | 35.6% |
| NCF Debt Yield | 26.4% | 27.2% | 29.0% | 22.2% | 26.1% |
| (1) | The Non-Collateral Improvements are not collateral for the 530 Seventh Avenue Fee Mortgage Loan (except for the reversionary interest of the 530 Seventh Avenue Fee Borrower therein). The Leasehold columns of the Cash Flow Analysis table above represent historical operating results of the Non-Collateral Improvements and this historical operating data is provided for informational purposes only. The historical Occupancy % numbers reflect the occupancy of the Non-Collateral Improvements. |
| (2) | The “Look-Through” to the Non-Collateral Improvements represents assumed cash flow based on the lender’s estimate of the Ground Tenant’s income and expenses. The “Look-Through” is based on the rent roll dated November 30, 2020 and no assurance can be given that changes to tenancy or the cash flow of the Non-Collateral Improvements have not been made since then. |
Operating History and Underwritten Net Cash Flow. The following table presents certain information relating to the operating history and Underwritten Net Cash Flow at the 530 Seventh Avenue Fee Property:
| Cash Flow Analysis(1)(2) | ||||||
| 2017 | 2018 | 2019 | 2020 | UW | UW PSF | |
| Gross Potential Rent | $4,785,000 | $4,785,000 | $4,785,000 | $4,785,000 | $5,220,000 | $10.54 |
| Total Recoveries | $0 | $0 | $0 | $0 | $0 | $0.00 |
| Less Vacancy & Credit Loss | $0 | $0 | $0 | $0 | $0 | $0.00 |
| Effective Gross Income | $4,785,000 | $4,785,000 | $4,785,000 | $4,785,000 | $5,220,000 | $10.54 |
| Real Estate Taxes | $0 | $0 | $0 | $0 | $0 | $0.00 |
| Insurance | $0 | $0 | $0 | $0 | $0 | $0.00 |
| Other Expenses | $0 | $0 | $0 | $0 | $0 | $0.00 |
| Total Expenses | $0 | $0 | $0 | $0 | $0 | $0.00 |
| Net Operating Income | $4,785,000 | $4,785,000 | $4,785,000 | $4,785,000 | $5,220,000 | $10.54 |
| Ground Rent | $0 | $0 | $0 | $0 | $0 | $0.00 |
| Net Cash Flow | $4,785,000 | $4,785,000 | $4,785,000 | $4,785,000 | $5,220,000 | $10.54 |
| Occupancy % | 100.0% | 100.0% | 100.0% | 100.0% | 100.0% | |
| NOI DSCR | 3.64x | 3.64x | 3.64x | 3.64x | 3.97x | |
| NCF DSCR | 3.64x | 3.64x | 3.64x | 3.64x | 3.97x | |
| NOI Debt Yield | 8.7% | 8.7% | 8.7% | 8.7% | 9.5% | |
| NCF Debt Yield | 8.7% | 8.7% | 8.7% | 8.7% | 9.5% | |
| (1) | For the avoidance of doubt, no COVID-19 specific adjustments have been made to the lender underwriting. |
| (2) | All historical columns reflect the historical ground lease payments at the 530 Seventh Avenue Fee Property. The UW Net Cash Flow represents the ground rent payable to the 530 Seventh Avenue Fee Borrower. The contractual annual rent payment is $5,220,000 on an absolute net basis. The ground lease has certain contractual rent steps as described under “The Property” above. |
This is not a research report and was not prepared by any Underwriter’s research department. Please see additional important information and qualifications at the end of this Term Sheet.
80
| Other - Leased Fee | Loan #5 | Cut-off Date Balance: | $55,000,000 |
| 530 Seventh Avenue | 530 Seventh Avenue Fee | Cut-off Date LTV: | 39.0% |
| New York, NY 10018 | U/W NCF DSCR: | 3.97x | |
| U/W NOI Debt Yield: | 9.5% |
Escrows and Reserves.
Real Estate Taxes – So long as no event of default is continuing under the 530 Seventh Avenue Fee Mortgage Loan, and the 530 Seventh Avenue Fee Borrower provides the lender with (i) satisfactory evidence that the Ground Tenant is obligated under the terms of the Ground Lease to either directly pay or reimburse the 530 Seventh Avenue Fee Borrower for all real estate taxes and (ii) upon the lender’s request, evidence that the Ground Tenant has in fact directly paid or reimbursed for all such taxes prior to the date they become delinquent or incur penalties or fee, no deposits are required to be made into a real estate tax reserve. If such conditions are not satisfied, the 530 Seventh Avenue Fee Mortgage Loan documents provide for ongoing monthly deposits into a reserve for real estate taxes in an amount equal to 1/12 of the real estate taxes that the lender estimates will be payable during the next twelve months.
Insurance – So long as no event of default is continuing under the 530 Seventh Avenue Fee Mortgage Loan, and the 530 Seventh Avenue Fee Borrower provides the lender with (i) satisfactory evidence that the Ground Tenant is obligated under the terms of the Ground Lease to pay all insurance premiums for the 530 Seventh Avenue Fee Property and (ii) upon the lender’s request, evidence that the Ground Tenant has in fact directly paid all such insurance premiums prior to the date they become delinquent or incur penalties or fee, no deposits are required to be made into an insurance premium reserve. If such conditions are not satisfied, the 530 Seventh Avenue Fee Mortgage Loan documents provide for ongoing monthly deposits into a reserve for insurance premiums in an amount equal to 1/12 of the insurance premiums that the lender estimates will be payable for the renewal of coverage upon the expiration of the insurance policies; provided that such monthly deposits are not required so long as (i) no event of default is continuing, (ii) the liability and casualty insurance coverage for the 530 Seventh Avenue Fee Property is included in a blanket policy approved by the lender in its reasonable discretion, and (iii) the 530 Seventh Avenue Fee Borrower provides the lender with evidence of payment of the insurance premiums no later than ten days prior to the expiration of the current policy and evidence of renewals of the insurance policies prior to their expiration dates.
Replacement Reserve – So long as no event of default is continuing under the 530 Seventh Avenue Fee Mortgage Loan, and the 530 Seventh Avenue Fee Borrower provides the lender with (i) satisfactory evidence that the Ground Tenant is obligated under the terms of the Ground Lease to either directly pay or reimburse the 530 Seventh Avenue Fee Borrower for all capital expenditures and (ii) upon the lender’s request, evidence that the Ground Tenant has in fact directly paid or reimbursed for all such capital expenditures as the same become due and payable without incurring penalties or fees, no deposits are required to be made into a capital expenditures reserve. If such conditions are not satisfied, the 530 Seventh Avenue Fee Mortgage Loan documents provide for ongoing monthly deposits of approximately $250 into a reserve for approved capital expenditures.
TI/LC Reserve – Solely if an event of default is continuing under the 530 Seventh Avenue Fee Mortgage Loan, the 530 Seventh Avenue Fee Mortgage Loan documents provide for ongoing monthly deposits of approximately $1,875 into a reserve for future tenant improvements and leasing commissions.
Lockbox and Cash Management. The 530 Seventh Avenue Fee Mortgage Loan is structured with a springing lockbox and springing cash management. Upon the occurrence of an event of default under the 530 Seventh Avenue Fee Mortgage Loan, the 530 Seventh Avenue Fee Borrower is required to establish and maintain a lockbox account for the benefit of the lender, and to deposit all ground rent directly into the lockbox account within two business days of receipt. In addition, the 530 Seventh Avenue Fee Borrower was required at origination to deliver to the lender tenant a direction letter directing the Ground Tenant to deposit rents directly into the lockbox account (which the lender is authorized to deliver to the Ground Tenant upon the occurrence of an event of default) and is required to deliver to the lender (or if requested by the lender after the occurrence of an event of default, directly to the Ground Tenant), any replacement tenant direction letters that the lender may request. Upon the occurrence of an event of default under the 530 Seventh Avenue Fee Mortgage Loan, the lender is required to establish, and the 530 Seventh Avenue Fee Borrower is required to cooperate with the cash management bank to establish, a lender-controlled cash management account, into which all funds in the lockbox account will be required to be deposited, so long as the lender has not accepted a cure of such event of default. The 530 Seventh Avenue Fee Mortgage Loan documents provide for funds in the cash management account to be applied on each monthly payment date: (i) to make the monthly deposits into the real estate tax and insurance reserves, if any, as described above under “Escrows and Reserves,” (ii) to pay debt service on the 530 Seventh Avenue Fee Mortgage Loan, (iii) to make the monthly deposits into the Replacement Reserve and the TI/LC Reserve, if any, as described above under “Escrows and Reserves,” (iv) to pay operating expenses set forth in the lender-approved annual budget and lender-approved extraordinary expenses, and (v) to deposit any remainder into an excess cash flow reserve to be held as additional security for the 530 Seventh Avenue Fee Mortgage Loan during the continuance of an event of default. However, the 530 Seventh Avenue Fee Mortgage Loan documents further provide that notwithstanding the foregoing provisions, during the continuance of an event of default under the 530 Seventh Avenue Fee Mortgage Loan documents, the lender may apply funds in the cash management account to the obligations under the 530 Seventh Avenue Fee Mortgage Loan documents in such order of priority as the lender may determine in its sole discretion.
Additional Secured Indebtedness (not including trade debts). None.
Mezzanine Loan and Preferred Equity. Not permitted.
Release of Property. Not permitted.
Letter of Credit. None.
Right of First Offer/ Right of First Refusal. The Ground Tenant has a right of first refusal if the 530 Seventh Avenue Borrower elects to transfer the 530 Seventh Avenue Fee Property. The ground lease provides that such right of first refusal does not apply to an exercise of rights by the fee mortgagee. In addition, pursuant to an attornment agreement executed by the ground tenant, the ground tenant has acknowledged that such right will not apply to the foreclosure of the mortgage, a deed in lieu of foreclosure, or the first subsequent transfer following a foreclosure or deed in lieu.
Ground Lease. The 530 Seventh Avenue Fee Property is a leased fee property which has been leased by the 530 Seventh Avenue Fee Borrower to an affiliated Ground Tenant pursuant to the Ground Lease, as described above under “The Property.”
Terrorism Insurance. The 530 Seventh Avenue Fee Borrower is required to obtain or cause to be obtained insurance against acts of terrorism or other similar acts or events to the extent such insurance is available in form and substance reasonably satisfactory to the lender (in an amount not less than the sum of 100% of full replacement cost and 18 months of business interruption insurance). Notwithstanding the foregoing, for so long as the Terrorism Risk Insurance Act of 2002, as extended and modified by the Terrorism Risk Insurance Program Reauthorization Act of 2015 (or any extension thereof or other federal government program with substantially similar protection) is in effect, the lender is required to accept terrorism insurance which covers “covered acts” (as defined by such statute or other program), as full compliance as it relates to the risks required to be covered pursuant to the preceding sentence, so long as such statute or other program covers both domestic and foreign acts of terrorism.
This is not a research report and was not prepared by any Underwriter’s research department. Please see additional important information and qualifications at the end of this Term Sheet.
81
| Property Types – Various | Loan #6 | Cut-off Date Balance: | $38,140,000 |
| Property Addresses – Various | ExchangeRight Net Leased Portfolio #43 | Cut-off Date LTV: | 62.0% |
| U/W NCF DSCR: | 2.66x | ||
| U/W NOI Debt Yield: | 9.0% |
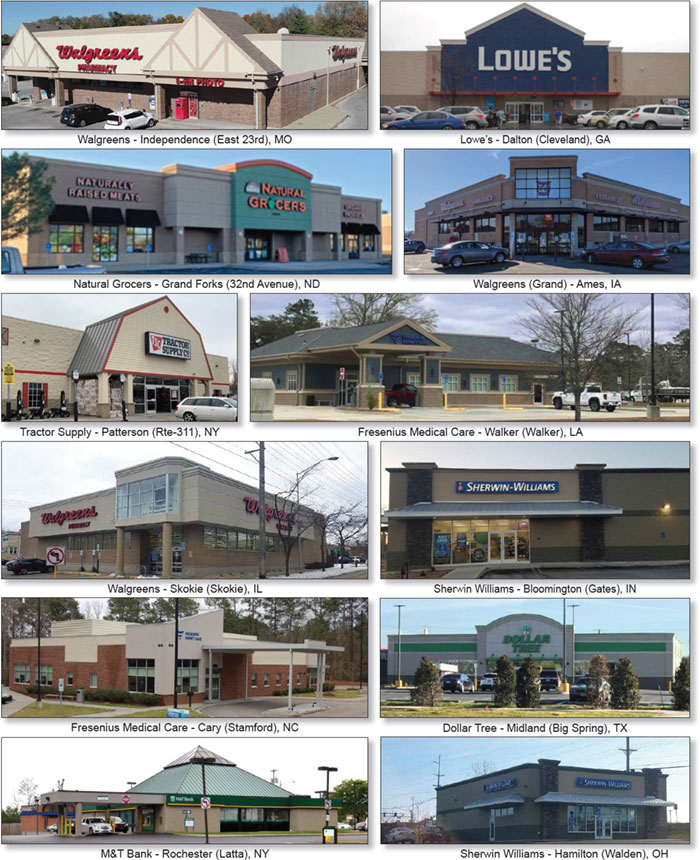
This is not a research report and was not prepared by any Underwriter’s research department. Please see additional important information and qualifications at the end of this Term Sheet.
82
| Property Types – Various | Loan #6 | Cut-off Date Balance: | $38,140,000 |
| Property Addresses – Various | ExchangeRight Net Leased Portfolio #43 | Cut-off Date LTV: | 62.0% |
| U/W NCF DSCR: | 2.66x | ||
| U/W NOI Debt Yield: | 9.0% |
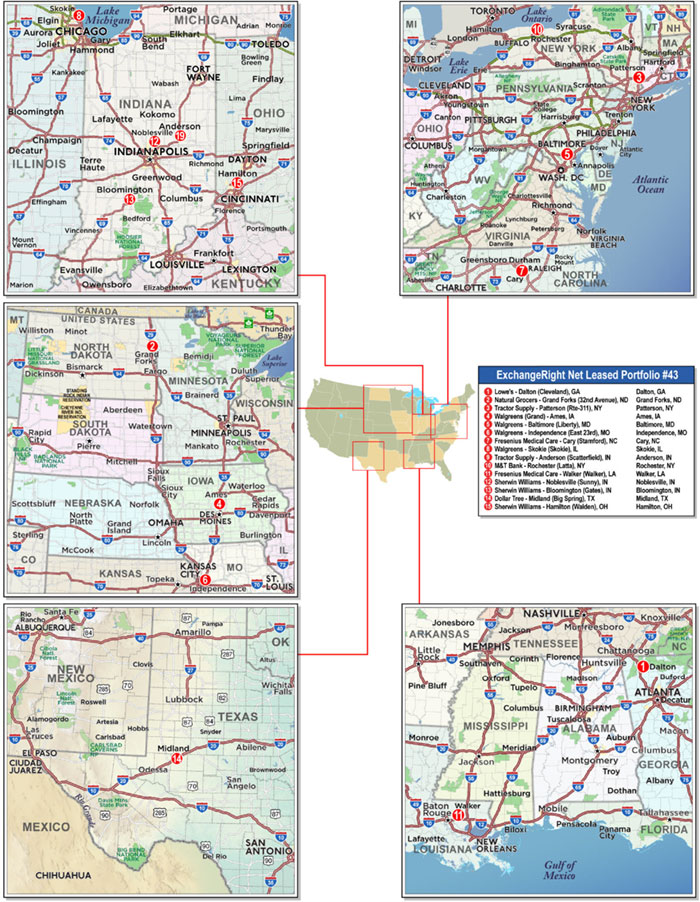
This is not a research report and was not prepared by any Underwriter’s research department. Please see additional important information and qualifications at the end of this Term Sheet.
83
| Mortgage Loan No. 6 – ExchangeRight Net Leased Portfolio #43 |
| Mortgage Loan Information | Property Information | ||||||
| Mortgage Loan Seller: | BANA | Single Asset/Portfolio: | Portfolio | ||||
| Credit Assessment (Moody’s/DBRSM/Fitch): | NR/NR/NR | Location(2): | Various | ||||
| Original Balance: | $38,140,000 | General Property Type(2): | Various | ||||
| Cut-off Date Balance: | $38,140,000 | Detailed Property Type(2): | Various | ||||
| % of Initial Pool Balance: | 4.2% | Title Vesting: | Fee | ||||
| Loan Purpose: | Acquisition | Year Built/Renovated(2): | Various/Various | ||||
| Borrower Sponsor: | ExchangeRight Real Estate, LLC | Size: | 285,465 SF | ||||
| Guarantors: | Warren Thomas; David Fisher; Joshua | Cut-off Date Balance Per SF: | $134 | ||||
| Ungerecht | Maturity Date Balance Per SF: | $134 | |||||
| Mortgage Rate: | 3.2530% | Property Manager: | NLP Management, LLC | ||||
| Note Date: | 2/9/2021 | (borrower-related) | |||||
| First Payment Date: | 4/1/2021 | ||||||
| Maturity Date: | 3/1/2031 | ||||||
| Original Term to Maturity: | 120 months | ||||||
| Original Amortization Term: | 0 months | ||||||
| IO Period: | 120 months | Underwriting and Financial Information(3) | |||||
| Seasoning: | 0 months | UW NOI: | $3,422,880 | ||||
| Prepayment Provisions: | LO (24); DEF (92); O (4) | UW NOI Debt Yield: | 9.0% | ||||
| Lockbox/Cash Mgmt Status: | Hard/Springing | UW NOI Debt Yield at Maturity: | 9.0% | ||||
| Additional Debt Type: | No | UW NCF DSCR: | 2.66x | ||||
| Additional Debt Balance: | N/A | Most Recent NOI(4): | N/A | ||||
| Future Debt Permitted (Type): | No (N/A) | 2nd Most Recent NOI(4): | N/A | ||||
| Reserves(1) | 3rd Most Recent NOI(4): | N/A | |||||
| Type | Initial | Monthly | Cap | Most Recent Occupancy: | 100.0% (3/1/2021) | ||
| RE Taxes: | $61,475 | $13,730 | N/A | 2nd Most Recent Occupancy(4): | N/A | ||
| Insurance: | $0 | Springing | N/A | 3rd Most Recent Occupancy(4): | N/A | ||
| Replacement Reserve: | $224,000 | $1,194 | N/A | Appraised Value (as of)(5): | $61,530,000 (Various) | ||
| Deferred Maintenance: | $39,298 | $0 | N/A | Appraised Value Per SF: | $216 | ||
| TI/LC Reserve: | $500,000 | Springing | N/A | Cut-off Date LTV Ratio: | 62.0% | ||
| Water Treatment Reserve: | $12,500 | $0 | N/A | Maturity Date LTV Ratio: | 62.0% | ||
| Sources and Uses | ||||||
| Sources | Proceeds | % of Total | Uses | Proceeds | % of Total | |
| Mortgage Loan Amount(1): | $38,140,000 | 59.9% | Purchase Price: | $61,905,805 | 97.3% | |
| Borrower Equity: | $25,480,734 | 40.1% | Closing Costs: | $877,656 | 1.4% | |
| Reserves: | $837,273 | 1.3% | ||||
| Total Sources: | $63,620,734 | 100.0% | Total Uses: | $63,620,734 | 100.0% | |
| (1) | See “Escrows and Reserves” section below for further discussion of reserve requirements. |
| (2) | See “The Properties” section below. |
| (3) | The novel coronavirus pandemic is an evolving situation and could impact the ExchangeRight Net Leased Portfolio #43 Mortgage Loan (as defined below) more severely than assumed in the underwriting of the ExchangeRight Net Leased Portfolio #43 Mortgage Loan and could adversely affect the NOI, NCF and occupancy information, as well as the appraised value and the DSCR, LTV and Debt Yield metrics presented above and herein. See "Risk Factors-—Risks Related to Market Conditions and Other External Factors—The Coronavirus Pandemic Has Adversely Affected the Global Economy and Will Likely Adversely Affect the Performance of the Mortgage Loans" in the Preliminary Prospectus. |
| (4) | Historical occupancy and NOI are unavailable because the ExchangeRight Properties (as defined below) were acquired by the borrower sponsor between January 28, 2021 and February 9, 2021. |
| (5) | The individual appraised value as-of dates are between December 1, 2020 and January 13, 2021. |
The Mortgage Loan. The sixth largest mortgage loan (the “ExchangeRight Net Leased Portfolio #43 Mortgage Loan”) is evidenced by a promissory note in the original principal amount of $38,140,000 and secured by the fee interests in 15 net leased, single-tenant retail, medical office and leased fee properties located in twelve states (the “ExchangeRight Properties”).
The Borrower and the Borrower Sponsor. The borrower for the ExchangeRight Net Leased Portfolio #43 Mortgage Loan is ExchangeRight Net Leased Portfolio 43 DST (the “ExchangeRight Net Leased Portfolio #43 Borrower”), a Delaware statutory trust. The borrower sponsor is ExchangeRight Real Estate, LLC. ExchangeRight Real Estate, LLC has more than 13 million SF of commercial properties under management and owns more than 775 investment-grade retail and Class B/B+ multifamily properties located in 39 states. ExchangeRight Real Estate, LLC and its three owners, David Fisher, Joshua Ungerecht and Warren Thomas (collectively, the “Individual Guarantors”), are the guarantors of certain non-recourse carveout liabilities under the ExchangeRight Net Leased Portfolio #43 Mortgage Loan.
The ExchangeRight Net Leased Portfolio #43 Borrower has master leased the ExchangeRight Properties to a master tenant (the “ExchangeRight Net Leased Portfolio #43 Master Tenant”) owned by ExchangeRight Real Estate, LLC, which is in turn owned by the Individual Guarantors. The ExchangeRight Net Leased Portfolio #43 Master Tenant is a Delaware limited liability company structured to be bankruptcy-remote, with one independent director. The master lease generally imposes responsibility on the ExchangeRight Net Leased Portfolio #43 Master Tenant for the operation, maintenance and management of the ExchangeRight Properties and payment of all expenses incurred in the maintenance and repair of the Exchange Right Properties, other than capital expenses. The ExchangeRight Net Leased Portfolio #43 Master Tenant’s interest in all tenant rents was assigned to the ExchangeRight Net Leased Portfolio #43 Borrower, which in turn collaterally assigned its interest to the lender. The master lease is
This is not a research report and was not prepared by any Underwriter’s research department. Please see additional important information and qualifications at the end of this Term Sheet.
84
| Property Types – Various | Loan #6 | Cut-off Date Balance: | $38,140,000 |
| Property Addresses – Various | ExchangeRight Net Leased Portfolio #43 | Cut-off Date LTV: | 62.0% |
| U/W NCF DSCR: | 2.66x | ||
| U/W NOI Debt Yield: | 9.0% |
subordinate to the ExchangeRight Net Leased Portfolio #43 Mortgage Loan and, upon an event of default under the ExchangeRight Net Leased Portfolio #43 Mortgage Loan, the lender has the right to cause the ExchangeRight Net Leased Portfolio #43 Borrower to terminate the master lease. A default under the master lease is an event of default under the ExchangeRight Net Leased Portfolio #43 Mortgage Loan and gives rise to recourse liability to the non-recourse carveout guarantors for losses, unless such default arises solely in connection with the failure of the ExchangeRight Net Leased Portfolio #43 Master Tenant to pay rent as a result of the ExchangeRight Properties not generating sufficient cash flow for the payment of such rent.
The lender has the right to require the ExchangeRight Net Leased Portfolio #43 Borrower to convert from a Delaware statutory trust to a limited liability company upon (i) an event of default or the lender’s good faith determination of imminent default under the ExchangeRight Net Leased Portfolio #43 Mortgage Loan, (ii) the lender’s good faith determination that the ExchangeRight Net Leased Portfolio #43 Borrower will be unable to make a material decision or take a material action required in connection with the operation and maintenance of any ExchangeRight Property, and (iii) 90 days prior to the maturity date of the ExchangeRight Net Leased Portfolio #43 Mortgage Loan, if an executed commitment from an institutional lender to refinance the ExchangeRight Net Leased Portfolio #43 Mortgage Loan is not delivered to the lender.
At any time after February 9, 2022, the borrower sponsor has the right to effect a one-time transfer of all (but not less than all) of the outstanding ownership interests in the ExchangeRight Net Leased Portfolio #43 Borrower to an Approved Transferee (as defined below) and to replace the non-recourse carveout guarantors as the person who controls the ExchangeRight Net Leased Portfolio #43 Borrower with such Approved Transferee; provided that certain conditions are satisfied, including among others: (i) no event of default has occurred and is continuing, (ii) the Approved Transferee owns 100% of the beneficial ownership interests in, and controls, the ExchangeRight Net Leased Portfolio #43 Borrower and ExchangeRight Net Leased Portfolio #43 Master Tenant, (iii) the Approved Transferee executes a full payment guarantee and indemnity pursuant to which it agrees to be liable (from and after the transfer) for all indemnity obligations (including environmental liabilities and obligations) for which the existing non-recourse carveout guarantors are liable under the non-recourse carveout guaranty, (iv) the delivery of a REMIC opinion, a non-consolidation opinion and other opinions required by the lender and (v) the receipt of confirmation from each rating agency that such transfer and guarantor replacement will not result in a downgrade of the respective ratings assigned to the BANK 2021-BNK32 certificates (such a transfer and replacement, a “Qualified Transfer”). A Cash Management Period (as defined below) will be triggered if a Qualified Transfer does not occur by March 1, 2028 (36 months prior to the maturity date of the ExchangeRight Net Leased Portfolio #43 Mortgage Loan). See “Lockbox and Cash Management” below.
"Approved Transferee" means (A) a depository institution that satisfies certain ratings criteria and is wholly-owned and controlled by a bank, savings and loan association, investment bank, insurance company, trust company, real estate investment trust, commercial credit corporation, pension plan, pension fund or pension advisory firm, mutual fund, government entity or plan or institution similar to any of the foregoing or (B) any person that (1)(i) has never been indicted or convicted of, or pled guilty or no contest to a felony, (ii) has never been indicted or convicted of, or pled guilty or no contest to a Patriot Act offense and is not on any government watch list, (iii) has never been the subject of a voluntary or involuntary (to the extent the same has not been discharged) bankruptcy proceeding, (iv) has no material outstanding judgments, litigations or regulatory actions against it or its interests and (v) is not crowdfunded, (2) is regularly engaged in the business of owning or operating commercial properties, or interests therein, which are similar to the ExchangeRight Properties, (3) owns interests in, or operates, at least five properties with a minimum of 750,000 SF in the aggregate, (4) satisfies certain net worth or ratings criteria and (5) causes a conversion of the ExchangeRight Net Leased Portfolio #43 Borrower into a Delaware limited liability company.
The Properties. The ExchangeRight Properties are comprised of 11 single-tenant retail, 2 medical office and 2 leased fee properties totaling 285,465 SF and located across twelve states. The ExchangeRight Properties are located in Georgia (one property, 45.8% of NRA and 15.9% of underwritten rent), Indiana (three properties, 9.6% of NRA and 13.8% of underwritten rent), New York (two properties, 9.3% of NRA and 14.3% of underwritten rent), North Dakota (one property, 7.4% of NRA and 9.4% of underwritten rent) and Iowa (one property, 5.2% of NRA and 8.2% of underwritten rent), with the seven remaining ExchangeRight Properties located in Missouri, Maryland, Illinois, Texas, North Carolina, Louisiana and Ohio. Built between 1975 and 2020, with 5 of the 15 properties built between 2017 and 2020 (inclusive), the ExchangeRight Properties range in size from 3,503 SF to 130,833 SF. Two properties, Lowe's - Dalton (Cleveland), GA and M&T Bank - Rochester (Latta), NY, are on a ground lease with the borrower owning the underlying land and leasing it to the applicable tenant.
The ExchangeRight Properties are net leased to the following eight nationally recognized tenants operating in diverse retail segments: Lowe’s, Walgreens, Tractor Supply, Natural Grocers, Fresenius Medical Care, Sherwin Williams, Dollar Tree and M&T Bank. The ExchangeRight Properties have a weighted average remaining lease term of approximately 11.1 years. Leases representing 70.6% of NRA and 59.7% of the underwritten base rent expire after the maturity date of the ExchangeRight Net Leased Portfolio #43 Mortgage Loan. For the purposes of the preceding two sentences, the Walgreens leases, which grant early termination rights to Walgreens, were assumed to expire on the date when the earliest termination right under the lease, if exercised, would be effective.
This is not a research report and was not prepared by any Underwriter’s research department. Please see additional important information and qualifications at the end of this Term Sheet.
85
| Property Types – Various | Loan #6 | Cut-off Date Balance: | $38,140,000 |
| Property Addresses – Various | ExchangeRight Net Leased Portfolio #43 | Cut-off Date LTV: | 62.0% |
| U/W NCF DSCR: | 2.66x | ||
| U/W NOI Debt Yield: | 9.0% |
The following table presents certain information relating to the ExchangeRight Properties, which are presented in descending order of their Appraised Values.
| ExchangeRight Properties Summary | |||||||||||
Tenant Name City, State | Year Built/ Renovated | Tenant NRSF | %of Portfolio NRSF | Lease Expiration Date(1) | Appraised Value | % of Portfolio Appraised Value | Annual UW Base Rent | Annual UW Base Rent PSF | % of Annual UW Base Rent | Renewal Options(2) | |
Lowe’s Dalton, GA | 2002 / N/A | 130,833 | 45.8% | 12/31/2032 | $10,075,000 | 16.4% | $580,000 | $4.43 | 15.9% | 8, 5-year | |
Natural Grocers Grand Forks, ND | 1975 / 2016 | 21,169 | 7.4% | 8/31/2031 | $5,550,000 | 9.0% | $341,952 | $16.15 | 9.4% | 3, 5-year | |
Tractor Supply Patterson, NY | 2009 / N/A | 22,685 | 7.9% | 2/28/2031 | $5,500,000 | 8.9% | $328,200 | $14.47 | 9.0% | 4, 5-year | |
Walgreens Ames, IA | 2008 / N/A | 14,867 | 5.2% | 6/30/2034 | $5,200,000 | 8.5% | $300,000 | $20.18 | 8.2% | 10, 5-year | |
Walgreens Baltimore, MD | 1999 / N/A | 12,681 | 4.4% | 10/31/2030 | $4,350,000 | 7.1% | $262,000 | $20.66 | 7.2% | 6, 5-year | |
Walgreens Independence, MO | 1998 / N/A | 13,828 | 4.8% | 7/31/2033 | $3,975,000 | 6.5% | $246,000 | $17.79 | 6.7% | 9, 5-year | |
Fresenius Medical Care Cary, NC | 2018 / N/A | 7,324 | 2.6% | 5/31/2033 | $3,970,000 | 6.5% | $228,248 | $31.16 | 6.3% | 3, 5-year | |
Walgreens Skokie, IL | 1999 / N/A | 11,847 | 4.2% | 1/31/2030 | $3,900,000 | 6.3% | $243,000 | $20.51 | 6.7% | 8, 5-year | |
Tractor Supply Anderson, IN | 2001 / N/A | 19,085 | 6.7% | 1/31/2030 | $3,450,000 | 5.6% | $197,616 | $10.35 | 5.4% | 3, 5-year | |
M&T Bank Rochester, NY | 1990 / N/A | 4,000 | 1.4% | 6/30/2030 | $3,350,000 | 5.4% | $193,026 | $48.26 | 5.3% | None | |
Fresenius Medical Care Walker, LA | 2017 / N/A | 5,363 | 1.9% | 6/1/2032 | $3,000,000 | 4.9% | $173,771 | $32.40 | 4.8% | 3, 5-year | |
| Sherwin Williams Noblesville, IN | 2007 / 2019 | 4,261 | 1.5% | 9/30/2032 | $2,950,000 | 4.8% | $183,000 | $42.95 | 5.0% | 2, 5-year | |
Sherwin Williams Bloomington, IN | 2020 / N/A | 4,026 | 1.4% | 12/30/2031 | $2,250,000 | 3.7% | $124,000 | $30.80 | 3.4% | 2, 5-year | |
Dollar Tree Midland, TX | 2020 / N/A | 9,993 | 3.5% | 1/31/2031 | $2,010,000 | 3.3% | $133,107 | $13.32 | 3.6% | 3, 5-year | |
Sherwin Williams Hamilton, OH | 2020 / N/A | 3,503 | 1.2% | 9/30/2030 | $2,000,000 | 3.3% | $115,000 | $32.83 | 3.2% | 2, 5-year | |
| Total/Weighted Average | 285,465 | 100.0% | $61,530,000 | 100.0% | $3,648,920 | $12.78 | 100.0% | ||||
Source: Appraisal and underwritten rent roll.
| (1) | For the purposes of the table and loan underwriting, the Walgreens leases, which each grant early termination rights to Walgreens, were assumed to expire on the date as of when the earliest termination right under each lease, if exercised, would be effective. |
| (2) | Where any termination right effective date has been assumed to be the lease expiration date, the Renewal Options as shown reflect periods between subsequent termination right effective dates. |
The following table presents a summary regarding the major tenants at the ExchangeRight Properties:
| Tenant Summary(1) | |||||||
| Tenant Name | Credit Rating (S&P/ Moody’s/Fitch)(2) | No. of Properties | Tenant SF | Approx.% of SF | Annual UW Base Rent | Annual UW Base Rent PSF | App. % of Total Annual UW base Rent |
| Lowe's | BBB+ / Baa1 / NR | 1 | 130,833 | 45.8% | $580,000 | $4.43 | 15.9% |
| Walgreens | BBB / Baa2 / BBB- | 4 | 53,223 | 18.6% | $1,051,000 | $19.75 | 28.8% |
| Tractor Supply | BBB / Baa1 / NR | 2 | 41,770 | 14.6% | $525,816 | $12.59 | 14.4% |
| Natural Grocers | NR / NR / NR | 1 | 21,169 | 7.4% | $341,952 | $16.15 | 9.4% |
| Fresenius Medical Care | BBB / Baa3 / BBB- | 2 | 12,687 | 4.4% | $402,019 | $31.69 | 11.0% |
| Sherwin Williams | BBB- / Baa2 / BBB | 3 | 11,790 | 4.1% | $422,000 | $35.79 | 11.6% |
| Dollar Tree | BBB / Baa2 / NR | 1 | 9,993 | 3.5% | $133,107 | $13.32 | 3.6% |
| M&T Bank | A- / A3 / A | 1 | 4,000 | 1.4% | $193,026 | $48.26 | 5.3% |
| Subtotal/Wtd. Avg. | 15 | 285,465 | 100.0% | $3,648,920 | $12.78 | 100.0% | |
| Vacant Space | 0 | 0 | 0.00% | $0 | $0.00 | 0.0% | |
| Total/Wtd. Avg. | 15 | 285,465 | 100.00% | $3,648,920 | $12.78 | 100.0% | |
| (1) | Information is based on the underwritten rent roll. |
| (2) | Certain ratings are those of the parent company whether or not the parent guarantees the lease. |
This is not a research report and was not prepared by any Underwriter’s research department. Please see additional important information and qualifications at the end of this Term Sheet.
86
| Property Types – Various | Loan #6 | Cut-off Date Balance: | $38,140,000 |
| Property Addresses – Various | ExchangeRight Net Leased Portfolio #43 | Cut-off Date LTV: | 62.0% |
| U/W NCF DSCR: | 2.66x | ||
| U/W NOI Debt Yield: | 9.0% |
The following table presents certain information relating to the lease rollover at the ExchangeRight Properties:
| Lease Rollover Schedule(1)(2)(3) | ||||||||
| Year | # of Leases Rolling | SF Rolling | Annual UW Base Rent PSF Rolling | Approx. % of Total SF Rolling | Approx. Cumulative % of SF Rolling | Total UW Base Rent Rolling | Approx. % of Total UW Base Rent Rolling | Approx. Cumulative % of Total UW Base Rent Rolling |
| 2021 | 0 | 0 | $0.00 | 0.0% | 0.0% | $0 | 0.0% | 0.0% |
| 2022 | 0 | 0 | $0.00 | 0.0% | 0.0% | $0 | 0.0% | 0.0% |
| 2023 | 0 | 0 | $0.00 | 0.0% | 0.0% | $0 | 0.0% | 0.0% |
| 2024 | 0 | 0 | $0.00 | 0.0% | 0.0% | $0 | 0.0% | 0.0% |
| 2025 | 0 | 0 | $0.00 | 0.0% | 0.0% | $0 | 0.0% | 0.0% |
| 2026 | 0 | 0 | $0.00 | 0.0% | 0.0% | $0 | 0.0% | 0.0% |
| 2027 | 0 | 0 | $0.00 | 0.0% | 0.0% | $0 | 0.0% | 0.0% |
| 2028 | 0 | 0 | $0.00 | 0.0% | 0.0% | $0 | 0.0% | 0.0% |
| 2029 | 0 | 0 | $0.00 | 0.0% | 0.0% | $0 | 0.0% | 0.0% |
| 2030 | 5 | 51,116 | $19.77 | 17.9% | 17.9% | $1,010,642 | 27.7% | 27.7% |
| 2031 | 4 | 57,873 | $16.02 | 20.3% | 38.2% | $927,259 | 25.4% | 53.1% |
| 2032 & Beyond | 6 | 176,476 | $9.70 | 61.8% | 100.0% | $1,711,019 | 46.9% | 100.0% |
| Vacant | 0 | 0 | $0.00 | 0.0% | 100.0% | $0 | 0.0% | 100.0% |
| Total/Wtd. Avg. | 15 | 285,465 | $12.78 | 100.0% | $3,648,920 | 100.0% | ||
| (1) | Information is based on the underwritten rent roll. |
| (2) | Certain tenants may have lease termination options that are exercisable prior to the stated expiration date of the subject lease or leases which are not considered in the lease rollover schedule. |
| (3) | For the purposes of the table and loan underwriting, the Walgreens leases, which each grant early termination rights to Walgreens, were assumed to expire on the date as of when the earliest termination right under each lease, if exercised, would be effective. |
COVID-19 Update. As of February 25, 2021, the ExchangeRight Properties are open and operating, all tenants have remained current on all rent and lease obligations, and no lease modification or rent relief requests have been received. The first debt service payment on the ExchangeRight Net Leased Portfolio #43 Mortgage Loan is due in April 2021 and, as of February 25, 2021, the ExchangeRight Net Leased Portfolio #43 Mortgage Loan is not subject to any forbearance, modification or debt service relief request.
Underwritten Net Cash Flow. The following table presents certain information relating to the Underwritten Net Cash Flow at the ExchangeRight Properties:
| Cash Flow Analysis(1)(2) | ||
| UW | UW PSF | |
| Gross Potential Rent(3) | $3,719,951 | $13.03 |
| Less Vacancy & Credit Loss | ($185,998) | ($0.65) |
| Effective Gross Income | $3,533,953 | $12.38 |
| Insurance(4) | $5,054 | $0.02 |
| Other Expenses(5) | $106,019 | $0.37 |
| Total Expenses | $111,073 | $0.39 |
| Net Operating Income | $3,422,880 | $11.99 |
| CapEx | $14,327 | $0.05 |
| TI/LC | $60,975 | $0.21 |
| Net Cash Flow | $3,347,578 | $11.73 |
| Occupancy %(6) | 95.0% | |
| NOI DSCR | 2.72x | |
| NCF DSCR | 2.66x | |
| NOI Debt Yield | 9.0% | |
| NCF Debt Yield | 8.8% | |
| (1) | For the avoidance of doubt, no COVID-19 specific adjustments have been made to the lender underwriting. |
| (2) | Historical financial information is not available because the ExchangeRight Properties were acquired by the borrower sponsor between January 28, 2021 and February 9, 2021. |
| (3) | Gross Potential Rent includes straight-line average rent over the lesser of: (i) loan term and (ii) remaining lease term on investment grade tenants that have rent increases occurring during the applicable term ($66,178). |
| (4) | Property Insurance for the Tractor Supply – Patterson (Rte-311), NY property is not reimbursed by the tenant and the ExchangeRight Net Leased Portfolio #43 Borrower provides such insurance. Property insurance is underwritten to actual insurance premium. |
| (5) | Other Expenses consist of a 3.0% management fee. |
| (6) | Occupancy % represents economic occupancy at the ExchangeRight Properties. As of March 1, 2021, the ExchangeRight Properties were 100.0% occupied. |
This is not a research report and was not prepared by any Underwriter’s research department. Please see additional important information and qualifications at the end of this Term Sheet.
87
| Property Types – Various | Loan #6 | Cut-off Date Balance: | $38,140,000 |
| Property Addresses – Various | ExchangeRight Net Leased Portfolio #43 | Cut-off Date LTV: | 62.0% |
| U/W NCF DSCR: | 2.66x | ||
| U/W NOI Debt Yield: | 9.0% |
Escrows and Reserves.
Real Estate Taxes – The ExchangeRight Net Leased Portfolio #43 Borrower deposited at loan origination $61,475 for real estate taxes and is required to deposit $13,730 monthly. For the properties where the tenant is responsible for paying taxes directly, commencing upon any of (i) an event of default under the ExchangeRight Net Leased Portfolio #43 Mortgage Loan, (ii) an event of default under a tenant lease, (iii) a tenant no longer being liable to pay property taxes directly to the taxing authority, or (iv) the ExchangeRight Net Leased Portfolio #43 Borrower failing to provide evidence that such property taxes have been paid in full on or prior to the date when due, the ExchangeRight Net Leased Portfolio #43 Borrower will be required to make monthly deposits for real estate taxes with respect to the applicable individual property (or, in the case of clause (i) all of the properties) in an amount equal to 1/12th of the estimated annual amount due.
Insurance – Unless waived due to a blanket policy being in place, as is currently the case, the ExchangeRight Net Leased Portfolio #43 Mortgage Loan documents require that the ExchangeRight Net Leased Portfolio #43 Borrower make monthly escrows of 1/12th of the estimated annual all-risk insurance premiums due.
Replacement Reserve – The ExchangeRight Net Leased Portfolio #43 Borrower deposited at loan origination $224,000 and is required to deposit $1,194 monthly for replacements.
TI/LC Reserve – The ExchangeRight Net Leased Portfolio #43 Borrower deposited at loan origination $500,000 for tenant improvements and leasing commissions. During an event of default, the ExchangeRight Net Leased Portfolio #43 Borrower will be required to make monthly deposits in the amount of $5,081 for tenant improvements and leasing commissions.
Deferred Maintenance – The ExchangeRight Net Leased Portfolio #43 Borrower deposited at loan origination $39,298 (representing 125% of the estimated cost of repairs) for specified repairs at each of the Tractor Supply - Patterson (Rte-311), NY, Walgreens - Baltimore (Liberty), MD, Walgreens - Independence (East 23rd), MO, Walgreens - Skokie (Skokie), IL, Tractor Supply - Anderson (Scatterfield), IN, Fresenius Medical Care - Walker (Walker), LA, Sherwin Williams - Noblesville (Sunny), IN, Sherwin Williams - Bloomington (Gates), IN and Sherwin Williams - Hamilton (Walden), OH properties.
Water Treatment Reserve – The ExchangeRight Net Leased Portfolio #43 Mortgage Loan documents require an upfront reserve in the amount of $12,500. The phase I for the Tractor Supply - Patterson (Rte-311), NY property recommended obtaining and reviewing water quality testing records for the on-site well or in lieu of reviewing existing records, conducting water sampling to confirm potability. As required by the loan documents, in the event that testing results indicate that water treatment is warranted to address common levels of undesirable water constituents, the ExchangeRight Net Leased Portfolio #43 Borrower is required to install a water treatment system. The reserve represents 125% of the estimated cost to install and operate a typical water treatment system, should testing indicate a need for a water treatment system.
Lockbox and Cash Management. The ExchangeRight Net Leased Portfolio #43 Mortgage Loan is structured with a hard lockbox and springing cash management. The ExchangeRight Net Leased Portfolio #43 Borrower is required to (or to cause the ExchangeRight Net Leased Portfolio #43 Master Tenant or property manager to) cause all rents relating to the ExchangeRight Properties to be transmitted directly by the tenants of each property into the lockbox account and, to the extent that such rents are received by the ExchangeRight Net Leased Portfolio #43 Borrower (or ExchangeRight Net Leased Portfolio #43 Master Tenant or property manager), cause such amounts to be deposited into the lockbox account within one business day following receipt. The lockbox account bank is required to sweep such funds into the ExchangeRight Net Leased Portfolio #43 Master Tenant’s operating account on each business day other than during a Cash Management Period. Upon the delivery of notice by the lender of the commencement of the initial Cash Management Period, if any, the ExchangeRight Net Leased Portfolio #43 Borrower is required to establish a lender-controlled cash management account, into which account all funds in the lockbox account will be required to be deposited on each business day during a Cash Management Period. During a Cash Management Period, and provided no event of default is continuing, funds in the cash management account are required to be applied (i) to make the next monthly deposits (to the extent required) into the real estate taxes and insurance reserves as described above under “—Escrows and Reserves”, (ii) to reserve the next monthly debt service payment due on the ExchangeRight Net Leased Portfolio #43 Mortgage Loan, (iii) to make the next monthly deposits into the replacement reserve and the TI/LC reserve (to the extent required) as described above under “—Escrows and Reserves”, (iv) to pay operating expenses set forth in the annual budget (which is required to be reasonably approved by the lender during a Cash Management Period) and additional operating expenses reasonably approved by the lender and (v) to deposit any remainder into a cash collateral subaccount to be held as additional security for the ExchangeRight Net Leased Portfolio #43 Mortgage Loan during such Cash Management Period. Upon cessation of a Cash Management Period, all available amounts on deposit in the cash management account must be released to the ExchangeRight Net Leased Portfolio #43 Borrower or ExchangeRight Net Leased Portfolio #43 Master Tenant.
A “Cash Management Period" means a period:
| (i) | commencing when the interest-only debt service coverage ratio (based on net operating income for the trailing 12 months) as of the end of any calendar quarter is less than 1.50x and ending when the interest-only debt service coverage ratio (based on net operating income for the trailing 12 months) is at least 1.55x as of the end of each of two consecutive calendar quarters, or |
| (ii) | commencing on March 1, 2028 (36 months before the maturity date of the ExchangeRight Net Leased Portfolio #43 Mortgage Loan), unless a Qualified Transfer has occurred as of such date (see “The Borrower and the Borrower Sponsor” above), and ending when a Qualified Transfer occurs. |
Additional Secured Indebtedness (not including trade debts). None
Mezzanine Loan and Preferred Equity. Not permitted.
Release of Property. Not permitted.
Real Estate Substitution. Not permitted.
Letter of Credit. None.
Purchase Option and Rights of First Refusal. The related single tenant at each of the following five ExchangeRight Properties has a right of first refusal (“ROFR”) to purchase the related ExchangeRight Property: Natural Grocers - Grand Forks (32nd Avenue), ND, Tractor Supply - Patterson (Rte-311), NY, Walgreens - Baltimore (Liberty), MD, Walgreens - Independence (East 23rd), MO and Walgreens - Skokie (Skokie), IL. In addition, the related single tenant at the following ExchangeRight Property has a right of first offer (“ROFO”) to purchase the related ExchangeRight Property: Lowe's -
This is not a research report and was not prepared by any Underwriter’s research department. Please see additional important information and qualifications at the end of this Term Sheet.
88
| Property Types – Various | Loan #6 | Cut-off Date Balance: | $38,140,000 |
| Property Addresses – Various | ExchangeRight Net Leased Portfolio #43 | Cut-off Date LTV: | 62.0% |
| U/W NCF DSCR: | 2.66x | ||
| U/W NOI Debt Yield: | 9.0% |
Dalton (Cleveland), GA. No such ROFR or ROFO will apply to the mortgagee or any other party that acquires title or right of possession to the leased premises through a foreclosure, deed-in-lieu of foreclosure or any other enforcement action under the applicable mortgage, but each such ROFR or ROFO will apply to subsequent purchasers of the applicable ExchangeRight Property. See “Description of the Mortgage Pool—Tenant Issues—Purchase Options and Rights of First Refusal” in the Preliminary Prospectus.
Ground Lease. None.
Terrorism Insurance. The ExchangeRight Net Leased Portfolio #43 Mortgage Loan documents require that the property insurance policy required to be maintained by the ExchangeRight Net Leased Portfolio #43 Borrower provide coverage for perils and acts of terrorism in an amount equal to the full replacement cost of the ExchangeRight Properties, as well as business interruption insurance covering no less than the 18-month period following the occurrence of a casualty event, together with a 6-month extended period of indemnity. See “Risk Factors—Risks Relating to the Mortgage Loans—Terrorism Insurance May Not Be Available for All Mortgaged Properties” in the Preliminary Prospectus.
This is not a research report and was not prepared by any Underwriter’s research department. Please see additional important information and qualifications at the end of this Term Sheet.
89
| Mixed Use – Office/Retail | Loan #7 | Cut-off Date Balance: | $29,700,000 | |
| Various | Boca Office Portfolio | Cut-off Date LTV: | 63.5% | |
| Boca Raton, FL 33433 | UW NCF DSCR: | 2.46x | ||
| UW NOI Debt Yield: | 10.6% |
This is not a research report and was not prepared by any Underwriters research department. Please see additional important information and qualifications at the end of this Term Sheet.
90
| Mixed Use – Office/Retail | Loan #7 | Cut-off Date Balance: | $29,700,000 | |
| Various | Boca Office Portfolio | Cut-off Date LTV: | 63.5% | |
| Boca Raton, FL 33433 | UW NCF DSCR: | 2.46x | ||
| UW NOI Debt Yield: | 10.6% |
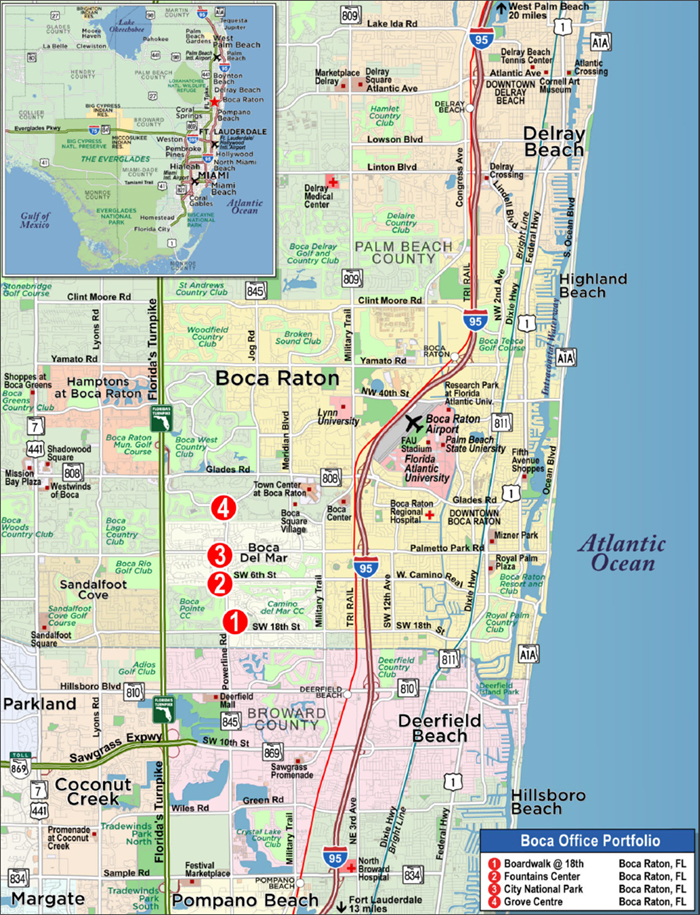
This is not a research report and was not prepared by any Underwriters research department. Please see additional important information and qualifications at the end of this Term Sheet.
91
| Mortgage Loan No. 7 – Boca Office Portfolio |
| Mortgage Loan Information | Property Information | ||||||
| Mortgage Loan Seller: | BANA | Single Asset/Portfolio: | Portfolio | ||||
| Credit Assessment (Moody’s/DBRSM/Fitch): | NR/NR/NR | Location: | Boca Raton, FL 33433 | ||||
| Original Balance(1): | $29,700,000 | General Property Type: | Mixed Use | ||||
| Cut-off Date Balance(1): | $29,700,000 | Detailed Property Type: | Office/Retail | ||||
| % of Initial Pool Balance: | 3.3% | Title Vesting: | Fee | ||||
| Loan Purpose: | Recapitalization; Acquisition | Year Built/Renovated: | Various / Various | ||||
| Borrower Sponsors: | Carlos Ulloa; Debra Corchia; Daniel | Size: | 514,527 SF | ||||
| Statlander; James Caprio | Cut-off Date Balance PSF(1): | $192 | |||||
| Guarantors: | Carlos Ulloa; Debra Corchia; Daniel | Maturity Date Balance PSF(1): | $192 | ||||
| Statlander; James Caprio | Property Manager: | Omicrom Property Management, LLC | |||||
| Mortgage Rate: | 4.0200% | (borrower-related) ; Stateland Brown, | |||||
| Note Date: | 2/17/2021 | LLC | |||||
| First Payment Date: | 4/6/2021 | ||||||
| Maturity Date: | 3/6/2026 | ||||||
| Original Term to Maturity: | 60 months | ||||||
| Original Amortization Term: | 0 months | ||||||
| IO Period: | 60 months | ||||||
| Seasoning: | 0 months | ||||||
| Prepayment Provisions(2): | LO (24); DEF (33); O (3) | Underwriting and Financial Information(5) | |||||
| Lockbox/Cash Mgmt Status: | Soft/Springing | UW NOI: | $10,461,465 | ||||
| Additional Debt Type(1)(3): | Pari Passu | UW NOI Debt Yield(1): | 10.6% | ||||
| Additional Debt Balance(1)(3): | $69,300,000 | UW NOI Debt Yield at Maturity(1): | 10.6% | ||||
| Future Debt Permitted (Type): | No (N/A) | UW NCF DSCR(1): | 2.46x | ||||
| Reserves(4) | Most Recent NOI: | $8,048,222 (12/31/2020) | |||||
| Type | Initial | Monthly | Cap | 2nd Most Recent NOI: | $8,927,635 (12/31/2019) | ||
| RE Taxes: | $609,758 | $152,439 | N/A | 3rd Most Recent NOI: | $8,512,154 (12/31/2018) | ||
| Insurance: | $1,008,948 | $84,079 | N/A | Most Recent Occupancy: | 90.4% (1/23/2021) | ||
| Recurring Replacements: | $0 | $10,614 | N/A | 2nd Most Recent Occupancy: | 91.4% (12/31/2020) | ||
| Deferred Maintenance: | $18,755 | $0 | N/A | 3rd Most Recent Occupancy: | 85.8% (12/31/2019) | ||
| TI/LC Reserve: | $1,500,000 | $42,877 | $3,000,000 | Appraised Value (as of)(6): | $155,900,000 (11/13/2020) | ||
| Debt Service Reserve: | $1,000,000 | $0 | N/A | Appraised Value PSF(6): | $303 | ||
| Unfunded Obligations: | $211,000 | $0 | N/A | Cut-off Date LTV Ratio(1)(6): | 63.5% | ||
| Environmental Reserve: | $6,750 | $0 | N/A | Maturity Date LTV Ratio(1)(6): | 63.5% | ||
| Sources and Uses | ||||||
| Sources | Proceeds | % of Total | Uses | Proceeds | % of Total | |
| Whole Loan Amount(1): | $99,000,000 | 74.4% | Payoff Existing Debt: | $103,381,641 | 77.7% | |
| Equity Contribution: | $34,100,085 | 25.6% | LP Payoff(7): | $19,484,855 | 14.6% | |
| Reserves: | $4,355,211 | 3.3% | ||||
| Closing Costs: | $5,878,378 | 4.4% | ||||
| Total Sources: | $133,100,085 | 100.0% | Total Uses: | $133,100,085 | 100.0% | |
| (1) | The Boca Office Portfolio Mortgage Loan (as defined below) is part of the Boca Office Portfolio Whole Loan (as defined below), which is comprised of three pari passu promissory notes. The Cut-off Date Balance PSF, Maturity Date Balance PSF, UW NOI Debt Yield, UW NOI Debt Yield at Maturity, UW NCF DSCR, Cut-off Date LTV Ratio and Maturity Date LTV Ratio numbers presented above are based on the principal balance of the Boca Office Portfolio Whole Loan. |
| (2) | Defeasance of the Boca Office Portfolio Whole Loan is permitted at any time after the earlier to occur of (a) the end of the two-year period commencing on the closing date of the securitization of the last portion of the Boca Office Portfolio Whole Loan to be securitized and (b) February 17, 2025. The assumed prepayment lockout period of 24 payments is based on the closing date of this transaction in March 2021. Partial prepayment of the Boca Office Portfolio Whole Loan is also permitted in connection with the release of unimproved parcels, as described under “Release of Property” below. |
| (3) | See “Additional Secured Indebtedness (not including trade debts)” below for further discussion of additional debt. |
| (4) | See “Escrows and Reserves” below for further discussion of reserve information. |
| (5) | The novel coronavirus pandemic is an evolving situation and could impact the Boca Office Portfolio Whole Loan more severely than assumed in the underwriting of the Boca Office Portfolio Whole Loan and could adversely affect the NOI, NCF and occupancy information, as well as the appraised value and the DSCR, LTV and Debt Yield metrics presented above and herein. See “Risk Factors—Risks Related to Market Conditions and Other External Factors—The Coronavirus Pandemic Has Adversely Affected the Global Economy and Will Likely Adversely Affect the Performance of the Mortgage Loans” in the Preliminary Prospectus. |
| (6) | Based on the “As Portfolio” appraised value (inclusive of a portfolio premium of 3.5%). Based on the sum of the “As Is” appraised values of $150,700,000, the Cut-off Date LTV Ratio and Maturity Date LTV Ratio are equal to 65.7%. |
| (7) | LP Payoff represents the payoff of the former limited partner as part of the recapitalization of the Boca Office Portfolio Properties (as defined below). |
This is not a research report and was not prepared by any Underwriters research department. Please see additional important information and qualifications at the end of this Term Sheet.
92
| Mixed Use – Office/Retail | Loan #7 | Cut-off Date Balance: | $29,700,000 | |
| Various | Boca Office Portfolio | Cut-off Date LTV: | 63.5% | |
| Boca Raton, FL 33433 | UW NCF DSCR: | 2.46x | ||
| UW NOI Debt Yield: | 10.6% |
The Mortgage Loan. The seventh largest mortgage loan (the “Boca Office Portfolio Mortgage Loan”) is part of a whole loan (the “Boca Office Portfolio Whole Loan”) evidenced by three pari passu promissory notes in the aggregate original principal amount of $99,000,000. The Boca Office Portfolio Whole Loan is secured by a first priority fee mortgage encumbering four mixed use properties located in Boca Raton, Florida (the “Boca Office Portfolio Properties”). The Boca Office Portfolio Whole Loan was co-originated on February 17, 2021 by Citi Real Estate Funding Inc. (“CREFI”) and Bank of America, N.A.
The Boca Office Portfolio Mortgage Loan is evidenced by the non-controlling Note A-3 with an original principal amount of $29,700,000. The remaining promissory notes comprising the Boca Office Portfolio Whole Loan (the “Boca Office Portfolio Non-Serviced Pari Passu Companion Loans”) are summarized in the below table. The Boca Office Portfolio Whole Loan will be serviced under the pooling and servicing agreement for the Benchmark 2021-B24 securitization trust. See “Description of the Mortgage Pool—The Whole Loans—The Non-Serviced Pari Passu Whole Loans” and “Pooling and Servicing Agreement—Servicing of the Non-Serviced Mortgage Loans” in the Preliminary Prospectus.
| Boca Office Portfolio Whole Loan Summary | ||||
Note | Original Balance | Cut-off Date Balance | Note Holder | Controlling Piece |
| A-1 | $50,000,000 | $50,000,000 | Benchmark 2021-B24 | Yes |
| A-2 | $19,300,000 | $19,300,000 | CREFI(1) | No |
| A-3 | $29,700,000 | $29,700,000 | BANK 2021-BNK32 | No |
| Total (Whole Loan) | $99,000,000 | $99,000,000 | ||
| (1) | The related note is expected to be contributed to one or more future securitizations. |
The Borrowers and the Borrower Sponsors. The borrowers are Boca Wharfside, LLC, Boca Medical Plaza, LLC, TJAC Palmetto Park, LLC and TJAC Boca Grove, LLC (collectively, the “Boca Office Portfolio Borrowers”), each a Delaware limited liability company structured to be bankruptcy-remote with one independent director.
The sponsors and non-recourse carveout guarantors with respect to the Boca Office Portfolio Whole Loan are James Caprio, Carlos Ulloa, Daniel Statlander and Debra Corchia. The Boca Office Portfolio Borrowers are collectively owned by a joint venture partnership between entities affiliated with Zvi Schwartzman of TJAC Development, Kireland Equity Investments, the Holdun Family Office and Omicrom Development. Headquartered in Boston, TJAC Development is a full-service real estate investment and development company with a focus on the acquisition and development of mixed-use, retail and student housing properties throughout the United States. TJAC Development has more than 20 years of real estate operational experience and currently owns and operates more than 1.1 million SF of real estate throughout the East Coast of the United States. Kireland Equity Investments is managed by Alex Kurkin for the benefit of the Klein Family. Holdun Family Office is a fifth generation family office controlled and managed by the Dunn family that provides discretionary capital management, tax and estate planning and asset protection for individual families, private companies, foundations and endowments. Omricom Development is a Boca Raton-based commercial real estate management and investment company. Its principals, James Caprio, Carlos Ulloa and Daniel Statlander, have a combined 75 years of industry experience.
The Properties. The Boca Office Portfolio Properties are comprised of four Class B mixed use properties totaling 514,527 SF (the “Portfolio NRA”) located throughout Boca Raton, Florida. The Boca Office Portfolio Properties consist of: Fountains Center (36.7% of Portfolio NRA, 28.3% of Portfolio UW NOI), Boardwalk @ 18th (25.7% of Portfolio NRA, 30.8% of Portfolio UW NOI), City National Park (25.7% of Portfolio NRA, 29.5% of Portfolio UW NOI) and Grove Centre (12.0% of Portfolio NRA, 11.4% of Portfolio UW NOI). As of January 23, 2021, the Boca Office Portfolio Properties were 90.4% occupied by approximately 153 tenants, with no individual tenant comprising more than 3.5% of Portfolio NRA or 3.7% of underwritten base rent. The largest tenants include Belux LLC (Aka Opus) (3.5% of Portfolio NRA), Women’s Health Partners, LLC (3.2% of Portfolio NRA), TDL Centers Inc (2.7% of Portfolio NRA), University of Miami (2.5% of Portfolio NRA) and Soberinves Sober Investments, LLC (2.1% of Portfolio NRA).
The Fountains Center property (36.7% of Portfolio NRA) consists of seven office buildings totaling 188,666 SF and comprised of 164,437 SF of office space and 24,229 SF of retail space. The Fountains Center property was built in 1983 and was 84.5% occupied as of January 23, 2021 (the office component was 82.2% occupied and the retail component was 100.0% occupied by eight tenants). The office component contributes 87.2% of the Fountains Center property’s NRA, while the retail component contributes 12.8% of the Fountains Center property’s NRA.
The City National Park property (25.7% of Portfolio NRA) consists of three office buildings totaling 132,207 SF and comprised of 111,699 SF of office space and 20,508 SF of retail space. The City National Park property was 97.4% occupied as of January 23, 2021. The office component was built in 1986 and was 96.9% occupied as of January 23, 2021. The retail component was built in 1998 and 1991 and was 100.0% occupied by six retail tenants as of January 23, 2021. The office component contributes 84.5% of the City National Park property’s NRA, while the retail component contributes 15.5% of the City National Park property’s NRA.
The Boardwalk @ 18th property (25.7% of Portfolio NRA) totals 132,132 SF, comprised of 86,480 SF of office/medical office space and 45,652 SF of retail space. The property was built in 1986 and renovated in 2017. Overall, the Boardwalk @ 18th property was 91.8% occupied by 20 office tenants and 21 retail tenants as of January 23, 2021. The office component contributes 65.4% of the Boardwalk @ 18th property’s NRA, while the retail component contributes 34.6% of the Boardwalk @ 18th property’s NRA.
The Grove Centre property (12.0% of Portfolio NRA) totals 61,522 SF and consists of a three-story, 54,022 SF office building and a 7,500 SF retail building. The Grove Centre property was 90.8% occupied as of January 23, 2021. The office component was built in 1983 and was 89.6% occupied as of January 23, 2021. The retail component was constructed in 2017 and was 100.0% occupied by two retail tenants as of January 23, 2021. The office component contributes 87.8% of the Grove Centre property’s NRA, while the retail component contributes 12.2% of the Grove Centre property’s NRA.
This is not a research report and was not prepared by any Underwriters research department. Please see additional important information and qualifications at the end of this Term Sheet.
93
| Mixed Use – Office/Retail | Loan #7 | Cut-off Date Balance: | $29,700,000 | |
| Various | Boca Office Portfolio | Cut-off Date LTV: | 63.5% | |
| Boca Raton, FL 33433 | UW NCF DSCR: | 2.46x | ||
| UW NOI Debt Yield: | 10.6% |
The following table presents certain information relating to the major tenants at the Boca Office Portfolio Properties:
| Tenant Summary(1) | |||||||||
| Tenant Name | Credit Rating (Fitch/Moody's/S&P) | Tenant SF | Approx. % of SF | Annual UW Rent | % of Total Annual UW Rent | Annual UW Rent PSF | Lease Expiration | Renewal Options | Term.Option (Y/N) |
| Belux LLC (Aka Opus) | NR/NR/NR | 17,902 | 3.5% | $321,353 | 3.0% | $17.95 | 12/31/2030 | 1, 5-year | N |
| Women's Health Partners, LLC | NR/NR/NR | 16,662 | 3.2% | $397,646 | 3.7% | $23.87 | 12/31/2027 | 2, 5-year | N |
| TDL Centers Inc | NR/NR/NR | 14,067 | 2.7% | $260,802 | 2.4% | $18.54 | 7/14/2030 | N | N |
| University of Miami | NR/NR/NR | 12,987 | 2.5% | $233,766 | 2.2% | $18.00 | 4/30/2026 | N | N |
| Executive Suites | NR/NR/NR | 11,571 | 2.2% | $0 | 0.0% | $0.00 | MTM | N | N |
| Soberinves Sober Investments, LLC | NR/NR/NR | 10,885 | 2.1% | $271,581 | 2.5% | $24.95 | 6/30/2024 | 1, 5-year | N |
| Hellenic Petroleum LLC | NR/NR/NR | 8,381 | 1.6% | $159,239 | 1.5% | $19.00 | 2/28/2025 | 2, 3-year | N |
| Harbinger Capital Group | NR/NR/NR | 8,281 | 1.6% | $114,940 | 1.1% | $13.88 | 6/30/2021 | N | Y(2) |
| Revamp Healthcare Partners | NR/NR/NR | 7,622 | 1.5% | $196,535 | 1.8% | $25.79 | 8/31/2027 | 1, 3-year | N |
| TT of NAS LLC | NR/NR/NR | 7,028 | 1.4% | $145,914 | 1.4% | $20.76 | 2/25/2026 | N | Y(3) |
| Subtotal/Wtd. Avg. | 115,386 | 22.4% | $2,101,777 | 19.7% | $18.22 | ||||
| Other Occupied | 349,901 | 68.0% | $8,593,921 | 80.3% | $24.56 | ||||
| Vacant Space | 49,240 | 9.6% | $0 | 0.0% | $0.00 | ||||
| Total/Wtd. Avg. | 514,527 | 100.0% | $10,695,698 | 100.0% | $22.99(4) | ||||
| (1) | Information is based on the underwritten rent roll dated January 23, 2021. |
| (2) | Harbinger Capital Group can terminate its lease with 60-days’ advance written notice. |
| (3) | TT of NAS LLC has two termination options: (i) on December 31, 2022 upon six-months’ advance written notice and (ii) on December 31, 2023 upon six-months’ advance written notice. |
| (4) | Total/Wtd. Avg. Annual UW Rent PSF excludes Vacant Space. |
The following table presents certain information relating to the lease rollover schedule at the Boca Office Portfolio Properties:
| Lease Rollover Schedule(1)(2) | ||||||||
| Year | # of Leases Rolling | SF Rolling | UW Rent PSF Rolling | Approx. % of Total SF Rolling | Approx. Cumulative % of SF Rolling | Total UW Rent Rolling | Approx. % of Total Rent Rolling | Approx. Cumulative % of Total Rent Rolling |
| MTM/2021 | 22 | 57,137 | $17.02 | 11.1% | 11.1% | $972,722 | 9.1% | 9.1% |
| 2022 | 17 | 37,938 | $22.34 | 7.4% | 18.5% | $847,451 | 7.9% | 17.0% |
| 2023 | 23 | 59,358 | $24.09 | 11.5% | 30.0% | $1,429,770 | 13.4% | 30.4% |
| 2024 | 26 | 70,605 | $22.67 | 13.7% | 43.7% | $1,600,428 | 15.0% | 45.3% |
| 2025 | 28 | 75,696 | $22.68 | 14.7% | 58.4% | $1,716,884 | 16.1% | 61.4% |
| 2026 | 14 | 51,670 | $23.04 | 10.0% | 68.5% | $1,190,540 | 11.1% | 72.5% |
| 2027 | 6 | 33,236 | $25.70 | 6.5% | 75.0% | $854,211 | 8.0% | 80.5% |
| 2028 | 8 | 27,556 | $32.25 | 5.4% | 80.3% | $888,612 | 8.3% | 88.8% |
| 2029 | 3 | 8,720 | $23.52 | 1.7% | 82.0% | $205,053 | 1.9% | 90.7% |
| 2030 | 5 | 39,371 | $19.80 | 7.7% | 89.7% | $779,590 | 7.3% | 98.0% |
| 2031 | 1 | 4,000 | $52.61 | 0.8% | 90.4% | $210,440 | 2.0% | 100.0% |
| 2032 & Beyond | 0 | 0 | $0.00 | 0.0% | 90.4% | $0 | 0.0% | 100.0% |
| Vacant | 0 | 49,240 | $0.00 | 9.6% | 100.0% | $0 | 0.0% | 100.0% |
| Total/Wtd. Avg.(3) | 153 | 514,527 | $22.99 | 100.0% | $10,695,698 | 100.0% | ||
| (1) | Information is based on the underwritten rent roll dated January 23, 2021. |
| (2) | Certain tenants may have lease termination options that are exercisable prior to the originally stated expiration date of the subject lease and that are not considered in the Lease Rollover Schedule. |
| (3) | Total/Wtd. Avg. UW Rent PSF Rolling excludes vacant space. |
COVID-19 Update. The Boca Office Portfolio Properties have remained open and operational throughout the COVID-19 pandemic. At the beginning of the pandemic, the Boca Office Portfolio Borrowers entered into deferral agreements with approximately 50 tenants throughout the Boca Office Portfolio Properties. The vast majority of deferrals included one to three months of deferred rent, which was required to be paid back by December 2020. Rent collections in December 2020 and January 2021 totaled 96.0% and 95.0% of underwritten base rent, respectively. As of February 6, 2021, no loan modification or forbearance requests have been made on the Boca Office Portfolio Whole Loan.
The Market. The Boca Office Portfolio Properties are located in Boca Raton, Florida, within Palm Beach County in the Miami-Fort Lauderdale-West Palm Beach, Florida metropolitan statistical area (“MSA”) and within a five-mile radius of each other. The Boca Office Portfolio Properties are in the unincorporated area of Boca Raton, which is considered a suburban location. The MSA, which is also known as the South Florida region, is among the most populous areas in the nation, with a population of approximately 6.2 million people. Boca Raton is situated in southwest Palm Beach County, approximately 22 miles northwest of the Fort Lauderdale central business district and approximately 25 miles southwest of the West Palm Beach central business district.
This is not a research report and was not prepared by any Underwriters research department. Please see additional important information and qualifications at the end of this Term Sheet.
94
| Mixed Use – Office/Retail | Loan #7 | Cut-off Date Balance: | $29,700,000 | |
| Various | Boca Office Portfolio | Cut-off Date LTV: | 63.5% | |
| Boca Raton, FL 33433 | UW NCF DSCR: | 2.46x | ||
| UW NOI Debt Yield: | 10.6% |
According to the appraisal, the Boca Office Portfolio Properties are located within the Palm Beach County office market and the Boca Raton submarket. The Palm Beach County office market had a second quarter 2020 inventory of approximately 22.94 million SF, an overall vacancy of 12.0%, and an average annual asking rent of $24.48 per SF. For the same period, the market reported a positive net absorption of 41,959 SF and leasing transactions of 100,021 SF. As of the second quarter of 2020, 836,566 SF was under construction (3.6% of total inventory). The Boca Raton submarket had a second quarter 2020 inventory of approximately 11.40 million SF, overall vacancy of 11.1%, and an average annual asking rent of $24.07 per SF.
The appraisal identified six office properties to be the competitive set for the Boca Office Portfolio Properties. The six properties range from 64,419 SF to 237,331 SF, and were constructed between 1981 and 1989. Excluding an outlier comparable that has a 41.0% occupancy, the comparable properties had physical occupancies ranging from 89.0% to 97.0%, with a weighted average of 92.5%, and rental rates ranging from $18.00 per SF to $34.40 per SF. The appraiser also identified three retail comparables. The retail comparable properties have physical occupancies ranging from 97.0% to 100.0%, with a weighted average of 99.4%, and rental rates ranging from $23.00 per SF to $65.00 per SF.
Operating History and Underwritten Net Cash Flow. The following table presents certain information relating to the historical operating performance and Underwritten Net Cash Flow at the Boca Office Portfolio Properties:
| Cash Flow Analysis | ||||||
| 2017 | 2018 | 2019 | 2020 | UW | UW PSF | |
| Gross Potential Rent(1) | $6,668,945 | $7,482,834 | $8,233,181 | $7,787,257 | $11,971,533 | $23.27 |
| Reimbursements | $4,937,569 | $5,488,716 | $5,753,904 | $5,532,564 | $5,376,057 | $10.45 |
| Other Income | $369,865 | $596,757 | $638,225 | $575,370 | $551,691 | $1.07 |
| Vacancy and Concessions | $0 | $0 | $0 | $0 | ($1,275,835) | ($2.48) |
| Effective Gross Income | $11,976,379 | $13,568,307 | $14,625,310 | $13,895,191 | $16,623,446 | $32.31 |
| Real Estate Taxes | $1,229,281 | $1,381,847 | $1,583,234 | $1,785,991 | $1,735,882 | $3.37 |
| Insurance | $614,725 | $679,764 | $695,146 | $780,321 | $960,903 | $1.87 |
| Other Operating Expenses | $3,191,267 | $2,994,542 | $3,419,295 | $3,280,658 | $3,465,196 | $6.73 |
| Total Operating Expenses | $5,035,273 | $5,056,153 | $5,697,675 | $5,846,969 | $6,161,981 | $11.98 |
| Net Operating Income(2)(3) | $6,941,106 | $8,512,154 | $8,927,635 | $8,048,222 | $10,461,465 | $20.33 |
| TI/LC | $0 | $0 | $0 | $0 | $411,477 | $0.80 |
| CapEx | $0 | $0 | $0 | $0 | $127,369 | $0.25 |
| Net Cash Flow | $6,941,106 | $8,512,154 | $8,927,635 | $8,048,222 | $9,922,619 | $19.28 |
| Occupancy % | 89.6% | 82.3% | 85.8% | 91.4% | 90.4%(4) | |
| NOI DSCR(5) | 1.72x | 2.11x | 2.21x | 1.99x | 2.59x | |
| NCF DSCR(5) | 1.72x | 2.11x | 2.21x | 1.99x | 2.46x | |
| NOI Debt Yield(5) | 7.0% | 8.6% | 9.0% | 8.1% | 10.6% | |
| NCF Debt Yield(5) | 7.0% | 8.6% | 9.0% | 8.1% | 10.0% | |
| (1) | UW Gross Potential Rent is based on the January 2021 rent roll and includes grossed up vacant space ($1,275,835) and contractual rent increases through January 2022 ($262,648). |
| (2) | The increase from 2020 NOI to UW NOI at the Boca Office Portfolio Properties is primarily attributable to unrealized rent accounting for new tenants occupying space, rent abatement expiration and contractual rent steps. |
| (3) | The increase from 2017 NOI to 2018 NOI is attributed to the completion of renovations at the Boardwalk @ 18th and Grove Centre properties in 2017 and subsequent stabilization over the course of the year. |
| (4) | The Boca Office Portfolio properties are 90.4% occupied as of January 23, 2021. |
| (5) | Debt service coverage ratios and debt yields are based on the Boca Office Portfolio Whole Loan. |
Escrows and Reserves.
Real Estate Taxes – The Boca Office Portfolio Borrowers deposited at loan origination $609,758 to the real estate tax reserve and are required to deposit monthly to the reserve 1/12 of the annual estimated real estate taxes (currently $152,439).
Insurance – The Boca Office Portfolio Borrowers deposited at loan origination $1,008,948 to the insurance reserve and are required to deposit monthly to the reserve 1/12 of the amount that would be sufficient to pay the insurance premiums due for the renewal of coverage (currently $84,079).
Replacement Reserve – The Boca Office Portfolio Borrowers are required to deposit monthly $10,614 for replacements to the Boca Office Portfolio Properties.
Deferred Maintenance – The Boca Office Portfolio Whole Loan documents provide for an upfront reserve of approximately $18,755 for required repairs.
TI/LC Reserve – The Boca Office Portfolio Borrowers deposited at loan origination $1,500,000 for outstanding landlord obligations and are required to deposit monthly $42,877 for future tenant improvements and leasing commissions, subject to a cap of $3,000,000.
Debt Service Reserve – The Boca Office Portfolio Borrowers deposited at loan origination $1,000,000 for a debt service reserve. On any monthly payment date occurring during a Trigger Period (as defined below), to the extent there are insufficient funds on deposit in the Cash Management Account (as defined below) to cover the monthly debt service payment amount, funds in the debt service reserve may be used to cover such payments.
This is not a research report and was not prepared by any Underwriters research department. Please see additional important information and qualifications at the end of this Term Sheet.
95
| Mixed Use – Office/Retail | Loan #7 | Cut-off Date Balance: | $29,700,000 | |
| Various | Boca Office Portfolio | Cut-off Date LTV: | 63.5% | |
| Boca Raton, FL 33433 | UW NCF DSCR: | 2.46x | ||
| UW NOI Debt Yield: | 10.6% |
Unfunded Obligations – The Boca Office Portfolio Borrowers deposited at loan origination $211,000 for unfunded obligations to cover any rent credits, rent abatements and/or leasing commissions that remain outstanding.
Environmental Reserve – The Boca Office Portfolio Borrowers deposited at loan origination $6,750, representing 150% of the estimated cost of abandoning and closing a monitoring well located on the City National Park property, as required pursuant to and as more particularly described in the related environmental report.
Lockbox and Cash Management. The Boca Office Portfolio Whole Loan is structured with a soft lockbox and springing cash management. The Boca Office Portfolio Borrowers are required to deposit (and to cause the property manager to deposit) all revenue derived from the Boca Office Portfolio Properties into the restricted account. Within five days after the first occurrence of a Trigger Period, the Boca Office Portfolio Borrowers are required to deliver a tenant direction letter to the existing tenants at the Boca Office Portfolio Properties, directing it to remit their rent checks directly to the lender-controlled lockbox. The Boca Office Portfolio Borrowers are required to cause revenue received by the Boca Office Portfolio Borrowers or the property manager from the Boca Office Portfolio Properties to be deposited into such lockbox within one day of receipt. All funds deposited into the lockbox are required to be transferred on each business day to or at the direction of the Boca Office Portfolio Borrowers unless a Trigger Period exists. During the continuance of a Trigger Period, all funds in the lockbox account are required to be swept on each business day to a cash management account under the control of the lender to be applied and disbursed in accordance with the Boca Office Portfolio Whole Loan documents, and all excess cash flow funds remaining in the cash management account after the application of such funds in accordance with the Boca Office Portfolio Whole Loan documents are required to be held by the lender in an excess cash flow reserve account as additional collateral for the Boca Office Portfolio Whole Loan. Upon the cure of the applicable Trigger Period, so long as no other Trigger Period exists, the lender is required to return any amounts remaining on deposit in the excess cash flow reserve account to the Boca Office Portfolio Borrowers.
A “Trigger Period” means a period (A) commencing upon the earliest of (i) the occurrence of an event of default by the Boca Office Portfolio Borrowers or (ii) the debt yield falling below 7.5%; and (B) expiring upon (x) with regard to any Trigger Period commenced in connection with clause (i) above, the cure (if applicable) of such event of default and (y) with regard to any Trigger Period commenced in connection with clause (ii) above, the date that the debt yield is equal to or greater than 7.5% for two consecutive calendar quarters.
Additional Secured Indebtedness (not including trade debts). The Boca Office Portfolio Properties also secure the Boca Office Portfolio Non-Serviced Pari Passu Companion Loans, which have an aggregate Cut-off Date principal balance of $69,300,000. The Boca Office Portfolio Non-Serviced Pari Passu Companion Loans accrue interest at the same rate as the Boca Office Portfolio Mortgage Loan. The Boca Office Portfolio Mortgage Loan is entitled to payments of principal and interest on a pro rata and pari passu basis with the Boca Office Portfolio Non-Serviced Pari Passu Companion Loans. The holders of the Boca Office Portfolio Mortgage Loan and Boca Office Portfolio Non-Serviced Pari Passu Companion Loans have entered into a co-lender agreement that sets forth the allocation of collections on the Boca Office Portfolio Whole Loan. See “Description of the Mortgage Pool—The Whole Loans—The Non-Serviced Pari Passu Whole Loans”.
Mezzanine Loan and Preferred Equity. Not permitted.
Release of Property. (A) After the date that is 60 days following the closing date of the securitization of the last portion of the Boca Office Portfolio Whole Loan to be securitized, the Boca Office Portfolio Borrowers may obtain the release of unimproved parcels of land, forming a portion of the Boca Office Portfolio Properties known as Fountains Center and/or the City National Park (individually and/or collectively, as the context may require, the “Unimproved Parcel”) from the lien of the related mortgage (the “Unimproved Parcel Release”), upon the satisfaction of the following conditions, among others, (a) (i) the Boca Office Portfolio Borrowers partially prepay the Boca Office Portfolio Whole Loan in an amount equal to $1,000,000 with respect to each Unimproved Parcel released plus, if prior to the open period, an amount equal to the yield maintenance premium as set forth in the Boca Office Portfolio Whole Loan documents (calculated based on a partial prepayment in the amount of $1,000,000), (ii) the Boca Office Portfolio Borrowers deliver to the lender evidence from the applicable rating agencies that the Unimproved Parcel release will not cause any such rating agency to withdraw, qualify or downgrade the then-applicable rating on any security issued in connection with the applicable securitization, (iii) the Boca Office Portfolio Borrowers deliver a REMIC opinion, and (B) in the event that the lender determines that the Boca Office Portfolio Borrowers have not satisfied the conditions to the Unimproved Parcel Release set forth in clause (A) above, the Boca Office Portfolio Borrowers may request to demise a leasehold interest in the Unimproved Parcel to an unaffiliated third party pursuant to a ground lease whereby the applicable tenant intends to develop improvements to be used as general office, retail, restaurant, medical office, out-patient facility, school, assisted living facility, multifamily, hotel, and/or uses ancillary to the foregoing (any such lease an “Unimproved Parcel Ground Lease”); provided that the lender’s agreement to reasonably consider any Unimproved Parcel Ground Lease is conditioned upon satisfaction of the following, among others (in each case as determined in the lender’s sole discretion): (i) the lender’s determination that such Unimproved Parcel Ground Lease is permitted under and complies in all respects with REMIC requirements; (ii) the tenant under such Unimproved Parcel Ground Lease being obligated to perform all work thereunder (and in no event will any Boca Office Portfolio Borrowers party or affiliate of any the Boca Office Portfolio Borrowers party have any obligation to perform work thereunder), (iii) the tenant under such Unimproved Parcel Ground Lease having sufficient financial wherewithal to complete all work contemplated therein, (iv) the tenant under such Unimproved Parcel Ground Lease or an affiliate of such tenant providing a completion guaranty with respect to the work contemplated in such Unimproved Parcel Ground Lease, which completion guaranty will be in a form acceptable to the lender, (v) the Boca Office Portfolio Borrowers furnish to the lender a REMIC opinion with respect to the Unimproved Parcel Ground Lease, and (vi) satisfaction of such other conditions as the lender may require (including delivery of a rating agency confirmation).
Right of First Offer/Right of First Refusal. None.
Ground Lease. None.
Letter of Credit. None.
Terrorism Insurance. The Boca Office Portfolio Whole Loan documents require that the property insurance policy required to be maintained by the Boca Office Portfolio Borrowers provide coverage for perils and acts of terrorism in an amount equal to the full replacement cost of the Boca Office Portfolio Properties, as well as business interruption insurance covering no less than the 12-month period following the occurrence of a casualty event, together with a 6-month extended period of indemnity. See “Risk Factors—Risks Relating to the Mortgage Loans—Terrorism Insurance May Not Be Available for All Mortgaged Properties” in the Preliminary Prospectus.
This is not a research report and was not prepared by any Underwriters research department. Please see additional important information and qualifications at the end of this Term Sheet.
96
(THIS PAGE INTENTIONALLY LEFT BLANK)
This is not a research report and was not prepared by any Underwriter’s research department. Please see additional important information and qualifications at the end of this Term Sheet.
97
| Office – Suburban | Loan #8 | Cut-off Date Balance: | $28,140,000 | |
| 2355 & 2377 Crenshaw Boulevard | Park Del Amo | Cut-off Date LTV: | 67.0% | |
| Torrance, CA 90501 | UW NCF DSCR: | 3.62x | ||
| UW NOI Debt Yield: | 12.1% |
This is not a research report and was not prepared by any Underwriters research department. Please see additional important information and qualifications at the end of this Term Sheet.
98
| Office – Suburban | Loan #8 | Cut-off Date Balance: | $28,140,000 | |
| 2355 & 2377 Crenshaw Boulevard | Park Del Amo | Cut-off Date LTV: | 67.0% | |
| Torrance, CA 90501 | UW NCF DSCR: | 3.62x | ||
| UW NOI Debt Yield: | 12.1% |
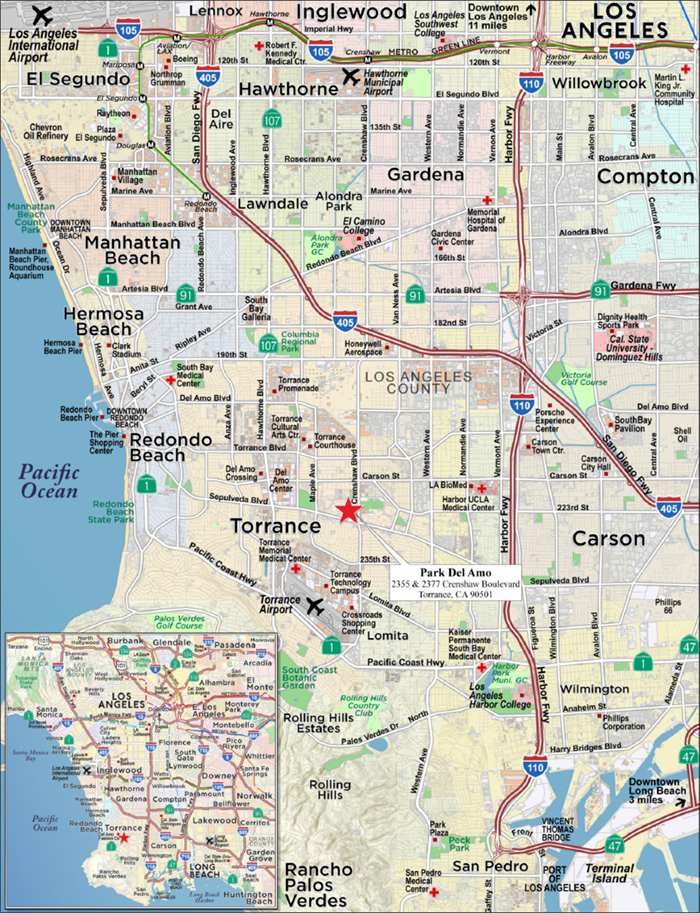
This is not a research report and was not prepared by any Underwriter’s research department. Please see additional important information and qualifications at the end of this Term Sheet.
99
| Mortgage Loan No. 8 – Park Del Amo |
| Mortgage Loan Information | Property Information | ||||||
| Mortgage Loan Seller: | BANA | Single Asset/Portfolio: | Single Asset | ||||
| Credit Assessment (Moody’s/DBRSM/Fitch): | NR/NR/NR | Location: | Torrance, CA 90501 | ||||
| Original Balance: | $28,140,000 | General Property Type: | Office | ||||
| Cut-off Date Balance: | $28,140,000 | Detailed Property Type: | Suburban | ||||
| % of Initial Pool Balance: | 3.1% | Title Vesting: | Fee | ||||
| Loan Purpose: | Refinance | Year Built/Renovated: | 1985/2017 | ||||
| Borrower Sponsor: | Omninet Capital, LLC | Size: | 205,312 SF | ||||
| Guarantor: | Neil Kadisha; Benjamin Nazarian | Cut-off Date Balance Per SF: | $137 | ||||
| Mortgage Rate: | 2.8650% | Maturity Date Balance Per SF: | $137 | ||||
| Note Date: | 3/1/2021 | Property Manager: | Omninet Property Management, Inc. | ||||
| First Payment Date: | 4/1/2021 | (borrower-related) | |||||
| Maturity Date: | 3/1/2031 | ||||||
| Original Term to Maturity: | 120 months | ||||||
| Original Amortization Term: | 0 months | ||||||
| IO Period: | 120 months | ||||||
| Seasoning: | 0 months | ||||||
| Prepayment Provisions: | LO (24); DEF (89); O (7) | Underwriting and Financial Information(2) | |||||
| Lockbox/Cash Mgmt Status: | Hard/Springing | UW NOI: | $3,411,143 | ||||
| Additional Debt Type: | No | UW NOI Debt Yield: | 12.1% | ||||
| Additional Debt Balance: | N/A | UW NOI Debt Yield at Maturity: | 12.1% | ||||
| Future Debt Permitted (Type): | No (N/A) | UW NCF DSCR: | 3.62x | ||||
| Reserves(1) | Most Recent NOI: | $3,321,776 (T-6 Ann. 12/31/2020) | |||||
| Type | Initial | Monthly | Cap | 2nd Most Recent NOI: | $2,804,121 (12/31/2019) | ||
| RE Taxes: | $0 | $41,374 | N/A | 3rd Most Recent NOI: | $3,312,357 (12/31/2018) | ||
| Insurance: | $0 | Springing | N/A | Most Recent Occupancy: | 89.1% (1/25/2021) | ||
| Deferred Maintenance: | $65,000 | $0 | N/A | 2nd Most Recent Occupancy: | 91.2% (12/31/2019) | ||
| Replacement Reserve: | $0 | $8,555 | N/A | 3rd Most Recent Occupancy: | 97.9% (12/31/2018) | ||
| TI/LC Reserve: | $840,000 | 17,100 | $840,000 | Appraised Value (as of): | $42,000,000 (1/22/2021) | ||
| Existing TI/LC Reserve: | $156,189 | $0 | N/A | Appraised Value Per SF: | $205 | ||
| Free Rent Reserve: | $46,536 | $0 | N/A | Cut-off Date LTV Ratio: | 67.0% | ||
| Trigger Tenant Reserve: | $0 | Springing | (1) | Maturity Date LTV Ratio: | 67.0% | ||
| Sources and Uses | ||||||
| Sources | Proceeds | % of Total | Uses | Proceeds | % of Total | |
| Loan Amount: | $28,140,000 | 100.0% | Loan Payoff(3): | $21,777,920 | 77.4% | |
| Return of Equity(3): | $4,878,750 | 17.3% | ||||
| Reserves: | $1,107,725 | 3.9% | ||||
| Closing Costs: | $375,605 | 1.3% | ||||
| Total Sources: | $28,140,000 | 100.0% | Total Uses: | $28,140,000 | 100.0% | |
| (1) | See “Escrows and Reserves” below for further discussion of reserve information. |
| (2) | The coronavirus pandemic is an evolving situation and could impact the Park Del Amo Mortgage Loan (as defined below) more severely than assumed in the underwriting of the Park Del Amo Mortgage Loan and could adversely affect the NOI, NCF and occupancy information, as well as the Appraised Value and the DSCR, LTV and Debt Yield metrics presented above. See "Risk Factors—Risks Related to Market Conditions and Other External Factors—The Coronavirus Pandemic Has Adversely Affected the Global Economy and Will Likely Adversely Affect the Performance of the Mortgage Loans" in the Preliminary Prospectus. |
| (3) | The borrower sponsor acquired the Park Del Amo Property (as defined below) in May 2020 for $39,000,000 in an all-cash purchase. Loan Payoff refers to repayment of short-term financing that was obtained following such cash purchase. |
The Mortgage Loan. The eighth largest mortgage loan (the “Park Del Amo Mortgage Loan”) is evidenced by a promissory note in the original principal amount of $28,140,000 and secured by a first priority fee mortgage encumbering a 205,312 SF, two-building office complex located in Torrance, California (the “Park Del Amo Property”).
The Borrower and the Borrower Sponsor. The borrower is Omninet Park Del Amo, LLC (the “Park Del Amo Borrower”), a single-purpose Delaware limited liability company with one independent director. Omninet Capital, LLC (“Omninet”) is the borrower sponsor and its CEO and Managing Partner, Neil Kadisha and Benjamin Nazarian, respectively, are the non-recourse carveout guarantors for the Park Del Amo Mortgage Loan. Omninet is a diversified real estate investment and operating firm that develops, operates and manages residential and commercial real estate. Omninet’s current portfolio consists of over 13,000 residential units and over 7 million SF of commercial space.
The Property. The Park Del Amo Property consists of two three-story office buildings containing a total of 205,312 SF, located in Torrance, California. The Park Del Amo Property was constructed in 1985 on a 2.1-acre site and was most recently renovated in 2017. The office buildings offer a campus setting with a landscaped central courtyard and 900 surface parking spaces (approximately 4.4 spaces per 1,000 SF). Each building has a two-story lobby with both central elevators and central staircases. The Park Del Amo Property was 89.1% occupied as of January 25, 2021 by 33 office tenants
This is not a research report and was not prepared by any Underwriter’s research department. Please see additional important information and qualifications at the end of this Term Sheet.
100
| Office – Suburban | Loan #8 | Cut-off Date Balance: | $28,140,000 | |
| 2355 & 2377 Crenshaw Boulevard | Park Del Amo | Cut-off Date LTV: | 67.0% | |
| Torrance, CA 90501 | UW NCF DSCR: | 3.62x | ||
| UW NOI Debt Yield: | 12.1% |
and five retail tenants. The underwritten base rent for the office space is $29.18 PSF. The largest tenant is Keenan & Associates. No other tenant occupies more than 3.6% of NRA or represents more than 4.0% of underwritten base rent.
Major Tenant.
Keenan & Associates (86,911 SF, 42.3% of NRA, 46.8% of underwritten rent). Keenan & Associates (“Keenan") is an insurance company established in 1972 that services California schools, community colleges, public agencies and heath care organizations, and provides employee benefits and property and casualty insurance. Keenan employs more than 750 employees housed in nine offices throughout California, including its headquarter office at the Park Del Amo Property. As of April 2017, Keenan became a part of the Assured Partners, Inc. national family of companies and is now the twelfth largest broker in the United States. Keenan occupies suites 200 and 300 at the 2355 Crenshaw building (70,598 SF) under a lease that commenced in October 2000, and occupies suites 100, 105, 220 and 251 at the 2377 Crenshaw building (16,313 SF) under a lease that commenced in May 2004. The leases require annual rent increases of 3.0%, effective each April, and are guaranteed by Assured Partners, Inc. The leases were most recently renewed in April 2019 and extend through March 2024, each with one five-year renewal option remaining at fair market rent with a minimum of 9 months’ notice. The renewal option is for a minimum of 75,000 SF. The leases do not contain any termination options. The Park Del Amo Mortgage Loan is structured with a cash sweep should Keenan vacate or terminate its lease, fail to renew its lease, default in payment, or should the tenant or its lease guarantor become subject to bankruptcy. See “Lockbox and Cash Management”. In addition to its 86,911 SF of directly leased space, Keenan subleases 3,621 SF of retail space through June 30, 2022.
The following table presents certain information relating to the major tenants at the Park Del Amo Property:
| Tenant Summary(1) | |||||||||
| Tenant Name | Credit Rating (Fitch/Moody’s/S&P) | Tenant SF | Approx % of SF | Annual UW Rent | % of Total Annual UW Rent | Annual UW Rent PSF | Lease Expiration | Renewal Options | Term. Options (Y/N) |
| Keenan & Associates | NR/NR/NR | 86,911 | 42.3% | $2,489,493 | 46.8% | $28.64 | 3/31/2024 | 1x5 Yr | N |
| High Ground Insurance Services | NR/NR/NR | 7,417 | 3.6% | $213,966 | 4.0% | $28.85 | 8/31/2023 | 1x5 Yr | N |
| Emptech | NR/NR/NR | 5,867 | 2.9% | $192,168 | 3.6% | $32.75 | 7/31/2023 | N/A | N |
| Servatius, O’Brien & Fong, LLP | NR/NR/NR | 4,899 | 2.4% | $135,641 | 2.5% | $27.69 | 5/31/2022 | N/A | N |
| CBIZ Benefits & Insurance Services, Inc.(2) | NR/NR/NR | 4,733 | 2.3% | $152,100 | 2.9% | $32.14 | 11/30/2026 | N/A | N |
| Subtotal/Wtd. Avg. | 109,827 | 53.5% | $3,183,367 | 59.8% | $28.99 | ||||
| Other Office | 60,851 | 29.6% | $1,797,127 | 33.8% | $29.53 | ||||
| Retail(3) | 12,174 | 5.9% | $339,741 | 6.4% | $27.91 | ||||
| Vacant Space (Office) | 22,460 | 10.9% | $0 | 0.0% | $0.00 | ||||
| Total/Wtd. Avg. | 205,312 | 100.0% | 5,320,235 | 100.0% | $29.10(4) | ||||
| (1) | Information based on the underwritten rent roll. |
| (2) | CBIZ Benefits & Insurance Services, Inc. is entitled to $36,918 of free rent and a $156,189 tenant improvement allowance, which landlord obligations have been fully reserved by the lender. |
| (3) | In addition to its 86,911 SF of directly leased space, Keenan & Associates subleases 3,621 SF of retail space through June 30, 2022. |
| (4) | Wtd. Avg. Annual UW Rent PSF excludes vacant space. |
This is not a research report and was not prepared by any Underwriter’s research department. Please see additional important information and qualifications at the end of this Term Sheet.
101
| Office – Suburban | Loan #8 | Cut-off Date Balance: | $28,140,000 | |
| 2355 & 2377 Crenshaw Boulevard | Park Del Amo | Cut-off Date LTV: | 67.0% | |
| Torrance, CA 90501 | UW NCF DSCR: | 3.62x | ||
| UW NOI Debt Yield: | 12.1% |
The following table presents certain information relating to the lease rollover schedule at the Park Del Amo Property:
| Lease Rollover Schedule(1)(2) | ||||||||
| Year | # of Leases Rolling | SF Rolling | UW Rent PSF Rolling | Approx. % of Total SF Rolling | Approx. Cumulative % of SF Rolling | Total UW Rent Rolling | Approx. % of Total Rent Rolling | Approx. Cumulative % of Total Rent Rolling |
| 2021 | 6 | 8,839 | $28.28 | 4.3% | 4.3% | $249,990 | 4.7% | 4.7% |
| 2022 | 16 | 37,353 | $29.31 | 18.2% | 22.5% | $1,094,707 | 20.6% | 25.3% |
| 2023 | 6 | 19,833 | $30.63 | 9.7% | 32.2% | $607,566 | 11.4% | 36.7% |
| 2024 | 4 | 95,723 | $28.74 | 46.6% | 78.8% | $2,751,076 | 51.7% | 88.4% |
| 2025 | 5 | 16,371 | $28.39 | 8.0% | 86.8% | $464,798 | 8.7% | 97.1% |
| 2026 | 1 | 4,733 | $32.14 | 2.3% | 89.1% | $152,100 | 2.9% | 100.0% |
| 2027 | 0 | 0 | $0.00 | 0.0% | 89.1% | $0 | 0.0% | 100.0% |
| 2028 | 0 | 0 | $0.00 | 0.0% | 89.1% | $0 | 0.0% | 100.0% |
| 2029 | 0 | 0 | $0.00 | 0.0% | 89.1% | $0 | 0.0% | 100.0% |
| 2030 | 0 | 0 | $0.00 | 0.0% | 89.1% | $0 | 0.0% | 100.0% |
| 2031 & Beyond | 0 | 0 | $0.00 | 0.0% | 89.1% | $0 | 0.0% | 100.0% |
| Vacant | 0 | 22,460 | $0.00 | 10.9% | 100.0% | $0 | 0.0% | 100.0% |
| Total/Wtd. Avg. | 38 | 205,312 | $29.10(3) | 100.0% | $5,320,235 | 100.0% | ||
| (1) | Information is based on the underwritten rent roll. |
| (2) | Certain tenants may have lease termination options that are exercisable prior to the originally stated expiration date of the subject lease and that are not considered in this Lease Rollover Schedule. |
| (3) | Wtd. Avg. UW Rent PSF Rolling excludes vacant space. |
COVID-19 Update. As of February 11, 2021, the Park Del Amo Property is open and operating. 100.0% of the tenants by NRA and 100.0% by underwritten rent have paid full rental payments in January and February 2021. Throughout the pandemic, only one tenant (Thomas C. Penland, 1.1% of NRA) has requested rent relief, which tenant has paid partial rent since November 2020, and which tenant has been underwritten by the lender as vacant. The first debt service payment on the Park Del Amo Mortgage Loan is due in April 2021 and, as of March 1, 2021, the Park Del Amo Mortgage Loan is not subject to any forbearance, modification or debt service relief request.
The Market. The Park Del Amo Property is located at the northwest corner of Crenshaw Boulevard and Sepulveda Boulevard, in Torrance, California. Torrance benefits from its access to other areas within the South Bay of Los Angeles and to both Los Angeles and Orange Counties, and from its proximity to Los Angeles International Airport. Torrance is home to the headquarters of major employers such as Honda, Epson and Kubota. Local attractions include Torrance Beach, Madrona Marsh, the Torrance Cultural Arts Center, the Joslyn Fine Arts Gallery, the Torrance Historical Society Museum in old Downtown Torrance, the South Bay Center of the Arts at El Camino College and Del Amo Fashion Center (the largest enclosed shopping mall in the Western United States, located approximately 1.0 mile west of the Park Del Amo Property).
The Park Del Amo Property is located in the South Bay submarket of the Los Angeles, California office market. As of the third quarter of 2020, the South Bay Class B/C office submarket had approximately 4.7 million SF of inventory, with a 16.6% vacancy rate and $27.30 PSF average asking rent. There has been no new office construction within the submarket over the last five years.
According to the appraisal, the estimated 2020 population within a one-, three- and five-mile radius of the Park Del Amo Property was 29,611, 220,699 and 554,776, respectively. The 2020 average household income within the same radii was $130,460, $118,613 and $124,488, respectively. While the population within a one-mile radius of the Park Del Amo Property has grown by an annual compound rate of 0.6% since 2000, the average household income has grown at an annual compound rate of 3.0% over that time period.
This is not a research report and was not prepared by any Underwriter’s research department. Please see additional important information and qualifications at the end of this Term Sheet.
102
| Office – Suburban | Loan #8 | Cut-off Date Balance: | $28,140,000 | |
| 2355 & 2377 Crenshaw Boulevard | Park Del Amo | Cut-off Date LTV: | 67.0% | |
| Torrance, CA 90501 | UW NCF DSCR: | 3.62x | ||
| UW NOI Debt Yield: | 12.1% |
The following table presents recent sales data with respect to comparable office properties to the Park Del Amo Property:
| Comparable Office Sale Summary | ||||||
| Property/Location | Year Built/ Renovated | SF / # Stories | Occupancy | Sale Date | Sale Price / $PSF | Cap Rate |
| Park Del Amo 2355 & 2377 Crenshaw Boulevard Torrance, CA | 1985/2017 | 205,312(1) / 3 | 89.1%(2) | May 2020 | $39,000,000 / $190 | 7.00% |
| Pacific Gateway II 19191 South Vermont Avenue Torrance, CA | 1982/2019 | 237,145 / 10 | 85% | Oct 2020 | $55,500,000 / $234 | 5.90% |
| San Dimas Corporate Park 924-960 Overland Court San Dimas, CA | 1992/2018 | 177,541 / 2 | 100%(3) | Aug 2020 | $42,850,000 / $241 | 7.88% |
| Commerce Plaza(4) 5701 South Eastern Avenue Commerce, CA | 1982/2005 | 195,147 / 6 | 73% | May 2020 | $37,500,000 / $192 | 7.50% |
| Agoura Hills Business Park 30401 Agoura Road Agoura Hills, CA | 1987/2019 | 114,570 / 2 | 82% | Jan 2020 | $21,950,000 / $192 | 6.00% |
| Overland Office Building 955 Overland Court San Dimas, CA | 1987/2006 | 87,210 / 2 | 100% | Sept 2019 | $19,919,301 / $228 | 7.48% |
| Baytower Corporate Center 15901 Hawthorne Boulevard Lawndale, CA | 1988/1992 | 73,824 / 4 | 100% | Jul 2019 | $16,750,000 / $227 | 5.31% |
| 2325 Crenshaw Boulevard Torrance, CA | 1988/2010 | 60,804 / 1 | 100%(3) | Feb 2019 | $15,759,000 / $259 | 6.10% |
Source: Appraisal.
| (1) | Based on the underwritten rent roll. |
| (2) | Occupancy as of January 25, 2021. |
| (3) | Single-tenant property. |
| (4) | Purchased by an affiliate of the borrower sponsor. |
The following table presents recent leasing data with respect to comparable office properties to the Park Del Amo Property:
| Comparable Office Lease Summary | ||||||||
| Property/Location | Year Built/Reno. | SF | Tenant Name | Lease Size (SF) | Lease Date | Lease Term (Yrs.) | Rent PSF (Gross) | Rent Steps/Free Rent/ TI PSF |
| Park Del Amo 2355 & 2377 Crenshaw Boulevard Torrance, CA | 1985/2017 | 205,312(1) | (2) | 26,534(2) | (2) | 3.9(2) | $30.28(2) | 3.0% / 2.7 mos / $3.53(2) |
| Gramercy Plaza 2050 West 190th Street Torrance, CA | 1991/2019 | 158,342 | confidential Sanrio, Inc. | 6,319 21,268 | Feb 2021 Nov 2019 | 5.4 6.5 | $35.40 $31.80 | 3.0% / 5 mos / $65 3.0% / 6 mos / $55 |
| DYAD South Bay 19700-19750 South Vermont Avenue Los Angeles, CA | 1983/2019 | 116,226 | Overton Moore | 4,184 | May 2020 | 5.4 | $30.36 | 3.0% / 6mos / $75 |
| South Bay Centre 1515 W 190th Street Gardena, CA | 1984/2017 | 210,919 | confidential | 9,044 | Mar 2020 | 3.1 | $29.40 | 3.0% / 1 mo / $13 |
| Torrance Pointe 21041-21081 South Western Avenue Torrance, CA | 1985/2001 | 138,223 | Intellisense Systems, Inc. | 49,008 | Mar 2020 | 11.2 | $26.04 | 3.0% / 2 mos / $41 |
| Hamilton Place 20101 Hamilton Avenue Torrance, CA | 1985/2017 | 241,866 | Faneuil, Inc. | 25,950 | Sept 2019 | 8.0 | $26.28(3) | 3.0% / 3 mos / $50 |
| Pacific Pointe 879 West 190th Street Gardena, CA | 1988/2009 | 257,156 | confidential | 3,563 | Jun 2019 | 3.2 | $28.80 | 3.0% / 2 mos / $0 |
Source: Appraisal.
| (1) | Based on the underwritten rent roll. |
| (2) | Information based on weighted average information for the nine most recent leases (new and renewal) commencing at the Park Del Amo Property between January 2020 and December 2020. |
| (3) | Modified Gross Rent. |
This is not a research report and was not prepared by any Underwriter’s research department. Please see additional important information and qualifications at the end of this Term Sheet.
103
| Office – Suburban | Loan #8 | Cut-off Date Balance: | $28,140,000 | |
| 2355 & 2377 Crenshaw Boulevard | Park Del Amo | Cut-off Date LTV: | 67.0% | |
| Torrance, CA 90501 | UW NCF DSCR: | 3.62x | ||
| UW NOI Debt Yield: | 12.1% |
The following table presents certain information relating to the appraisal’s market rent conclusion for the Park Del Amo Property:
| Market Rent Summary | |
| Office | |
| Market Rent (PSF) | $29.40 |
| Lease Term (Yrs.) | 5 |
| Rent Increase Projection | 3.0% per annum |
Operating History and Underwritten Net Cash Flow. The following table presents certain information relating to the historical operating performance and Underwritten Net Cash Flow at the Park Del Amo Property:
| Cash Flow Analysis | |||||||||||
| 2018 | 2019 | T-6 Annualized (12/31/2020)(1) | UW | UW PSF | |||||||
| Gross Potential Rent(2) | $5,439,012 | $5,072,262 | $5,234,065 | $5,982,903 | $29.14 | ||||||
| Expense Reimbursement | $371,308 | $177,668 | $64,386 | $27,145 | $0.13 | ||||||
| Other Income | $14,211 | $21,777 | $16,736 | $7,506 | $0.04 | ||||||
| Concessions | $0 | $0 | ($36,324) | $0 | $0.00 | ||||||
| Vacancy | $0 | $0 | $0 | ($725,886) | ($3.54) | ||||||
| Effective Gross Income | $5,824,531 | $5,271,707 | $5,278,863 | $5,291,668 | $25.77 | ||||||
| Taxes | $439,023 | $449,406 | $472,511 | $481,090 | $2.34 | ||||||
| Insurance | $122,641 | $92,057 | $32,844 | $34,213 | $0.17 | ||||||
| Other Operating Expenses | $1,950,510 | $1,926,123 | $1,451,732 | $1,365,222 | $6.65 | ||||||
| Total Operating Expenses | $2,512,174 | $2,467,586 | $1,957,087 | $1,880,525 | $9.16 | ||||||
| Net Operating Income(2) | $3,312,357 | $2,804,121 | $3,321,776 | $3,411,143 | $16.61 | ||||||
| TI/LC | $0 | $0 | $0 | $386,600 | $1.88 | ||||||
| Capital Expenditures | $0 | $0 | $0 | $61,594 | $0.30 | ||||||
| Net Cash Flow | $3,312,357 | $2,804,121 | $3,321,776 | $2,962,949 | $14.43 | ||||||
| Occupancy% | 97.9% | 91.2% | 90.2% | 89.1%(3) | |||||||
| NOI DSCR | 4.05x | 3.43x | 4.06x | 4.17x | |||||||
| NCF DSCR | 4.05x | 3.43x | 4.06x | 3.62x | |||||||
| NOI Debt Yield | 11.8% | 10.0% | 11.8% | 12.1% | |||||||
| NCF Debt Yield | 11.8% | 10.0% | 11.8% | 10.5% | |||||||
| (1) | The Park Del Amo Property was purchased by the borrower sponsor in May 2020. |
| (2) | UW Gross Potential Rent includes contractual rent steps through March 1, 2022 ($103,913). |
| (3) | Occupancy as of January 25, 2021 |
Escrows and Reserves.
Real Estate Taxes and Insurance - The Park Del Amo Borrower is required to reserve monthly 1/12 of the estimated annual property taxes (currently $41,374) and 1/12 of the estimated annual insurance premiums, unless the Park Del Amo Property is covered by a blanket policy acceptable to the lender (as currently).
Deferred Maintenance - The Park Del Amo Borrower deposited at loan origination $65,000, which amount represents 125% of the estimated cost for immediate repairs.
Replacement Reserve - The Park Del Amo Borrower is required to reserve $8,555 monthly on each payment date through March 1, 2026 and $1,711 monthly on each payment date thereafter for capital repairs, replacements and improvements.
TI/LC Reserve - The Park Del Amo Borrower deposited at loan origination $840,000 for general leasing expenses and is required to reserve monthly $17,100 if the balance in the reserve falls below the cap of $840,000. During a Cash Sweep Period (as defined below) caused solely by a DSCR Event (as defined below), all excess cash is required to be deposited to the TI/LC Reserve until the reserve reaches a balance of $6,000,000. During a Cash Sweep Period caused by both a DSCR Event and a Keenan Trigger Event (as defined below), all excess cash is required to be deposited to the TI/LC Reserve until the reserve reaches a balance equal to the sum of $6,000,000 plus the Trigger Tenant Cap (as defined below).
Existing Tenant Improvements Reserve - The Park Del Amo Borrower deposited at loan origination $156,189 for remaining tenant improvements owed to the tenant CBIZ Benefits & Insurance Services, Inc.
Free Rent Reserve - The Park Del Amo Borrower deposited $46,536 at loan origination for free rent owed, which amount is required to be applied to monthly debt service payments in an amount equal to $12,306 on each payment date from September 1, 2021 through November 1, 2021 as rent for the tenant CBIZ Benefits & Insurance Services, Inc., and in an amount equal to $9,619 on the payment date of December 1, 2021 as rent for the tenant Cal-Surance.
This is not a research report and was not prepared by any Underwriter’s research department. Please see additional important information and qualifications at the end of this Term Sheet.
104
| Office – Suburban | Loan #8 | Cut-off Date Balance: | $28,140,000 | |
| 2355 & 2377 Crenshaw Boulevard | Park Del Amo | Cut-off Date LTV: | 67.0% | |
| Torrance, CA 90501 | UW NCF DSCR: | 3.62x | ||
| UW NOI Debt Yield: | 12.1% |
Trigger Tenant Reserve - During a Cash Sweep Period caused solely by a Keenan Trigger Event, all excess cash is required to be deposited to the Trigger Tenant Reserve until the Trigger Tenant Cap is reached. The Trigger Tenant Reserve is to be used for any re-tenanting related to the Keenan leased space.
The “Trigger Tenant Cap” is equal to $30 PSF on the area that Keenan has vacated and which has not been re-leased to a replacement tenant who has taken occupancy pursuant to a replacement lease approved by the lender.
Lockbox and Cash Management. The Park Del Amo Mortgage Loan documents require a hard lockbox with springing cash management upon the occurrence of a Cash Sweep Period. During the continuance of a Cash Sweep Period, all funds in the lockbox account are required to be swept each business day to a lender-controlled cash management account and disbursed in accordance with the Park Del Amo Mortgage Loan documents. Also during a Cash Sweep Period, excess cash is required to be collected to either or both the TI/LC Reserve and the Trigger Tenant Reserve, subject to caps as described above.
A “Cash Sweep Period” means the earliest of the period (i) commencing on the occurrence of an event of default under the Park Del Amo Mortgage Loan and expiring upon the cure or the lender’s waiver of such event of default, (ii) commencing when the amortizing debt service coverage ratio is less than 1.15x (assuming a 30-year amortization period) on a trailing six month basis, tested quarterly, and expiring when the amortizing debt service coverage ratio is at least 1.15x (assuming a 30-year amortization period) on a trailing six month basis, tested quarterly for two consecutive calendar quarters (“DSCR Event”), or (iii) during which a Keenan Trigger Event exists.
A “Keenan Trigger Event” means a period
| (i) | commencing upon the earlier of (a) Keenan failing to renew and/or extend its leases on or before the dates required in its leases or (b) the date that is nine months prior to the lease expirations (provided that a Keenan Trigger Event will not be caused by Keenan’s failure to renew and/or extend its lease at 2377 Crenshaw (16,313 SF) if Keenan renews its lease at 2355 Crenshaw (70,598 SF) for a period of at least five years) and expiring when a replacement tenant re-tenants and takes occupancy of the premises pursuant to a replacement lease approved by the lender; |
| (ii) | commencing upon Keenan defaulting in payment of rent beyond any applicable notice and cure periods, and expiring when the default is cured; |
| (iii) | commencing upon Keenan or its lease guarantor becoming subject to any bankruptcy proceeding, and expiring when the lease has been assumed and affirmed by the court with lease obligations remaining unaltered or when the subject bankruptcy proceeding is discharged, stayed or dismissed; and |
| (iv) | commencing upon Keenan vacating or terminating its lease or giving notice to vacate or terminate its lease, and expiring when a replacement tenant re-tenants and takes occupancy of the premises pursuant to a replacement lease approved by the lender. |
Additional Secured Indebtedness (not including trade debts). Not permitted.
Mezzanine Loan and Preferred Equity. Not permitted.
Release of Property. Not permitted.
Right of First Refusal. None.
Ground Lease. None
Letter of Credit. None.
Terrorism Insurance. The Park Del Amo Borrower is required to obtain and maintain property insurance that covers perils of terrorism and acts of terrorism in an amount equal to the full replacement cost of the Park Del Amo Property and business interruption insurance for eighteen months with a six month extended period of indemnity; provided that if the Terrorism Risk Insurance Program Reauthorization Act is no longer in effect, the Park Del Amo Borrower will not be obligated to pay insurance premiums for terrorism coverage in excess of two times the premium for a separate special form or all risks policy or equivalent policy insuring only the Park Del Amo Property on a stand-alone basis at the time that any terrorism coverage is excluded from any policy. See “Risk Factors—Risks Relating to the Mortgage Loans—Terrorism Insurance May Not Be Available for All Mortgaged Properties” in the Preliminary Prospectus.
This is not a research report and was not prepared by any Underwriter’s research department. Please see additional important information and qualifications at the end of this Term Sheet.
105
| Office – Suburban | Loan #9 | Cut-off Date Balance: | $25,100,000 | |
| 3201 & 3125 West Commercial Boulevard | Lakeshore Business Center | Cut-off Date LTV: | 62.4% | |
| and 5100 & 5200 Northwest 33rd Avenue | UW NCF DSCR: | 1.66x | ||
| Fort Lauderdale, Florida 33309 | UW NOI Debt Yield: | 10.9% |
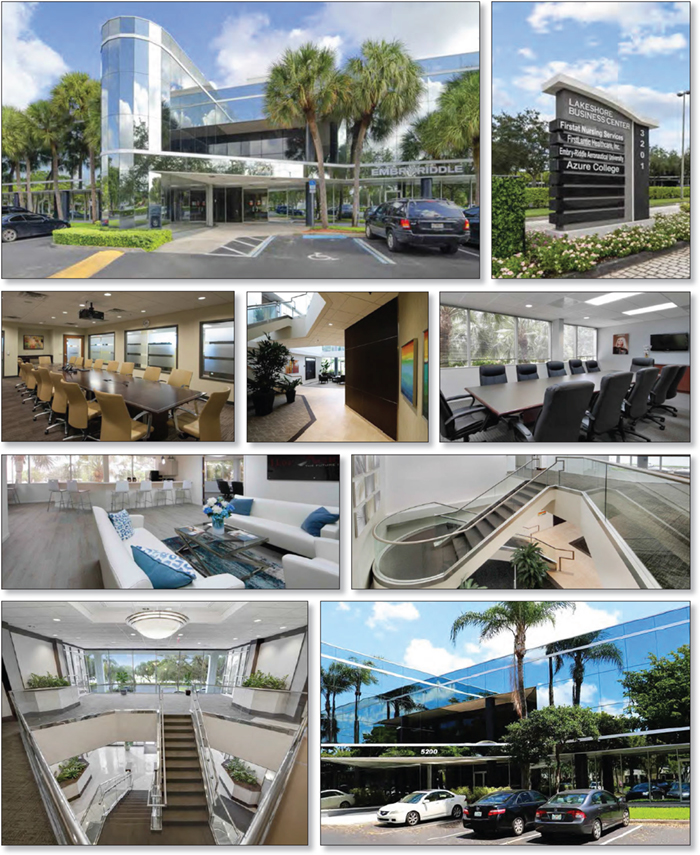
This is not a research report and was not prepared by any Underwriter’s research department. Please see additional important information and qualifications at the end of this Term Sheet.
106
| Office – Suburban | Loan #9 | Cut-off Date Balance: | $25,100,000 | |
| 3201 & 3125 West Commercial Boulevard | Lakeshore Business Center | Cut-off Date LTV: | 62.4% | |
| and 5100 & 5200 Northwest 33rd Avenue | UW NCF DSCR: | 1.66x | ||
| Fort Lauderdale, Florida 33309 | UW NOI Debt Yield: | 10.9% |
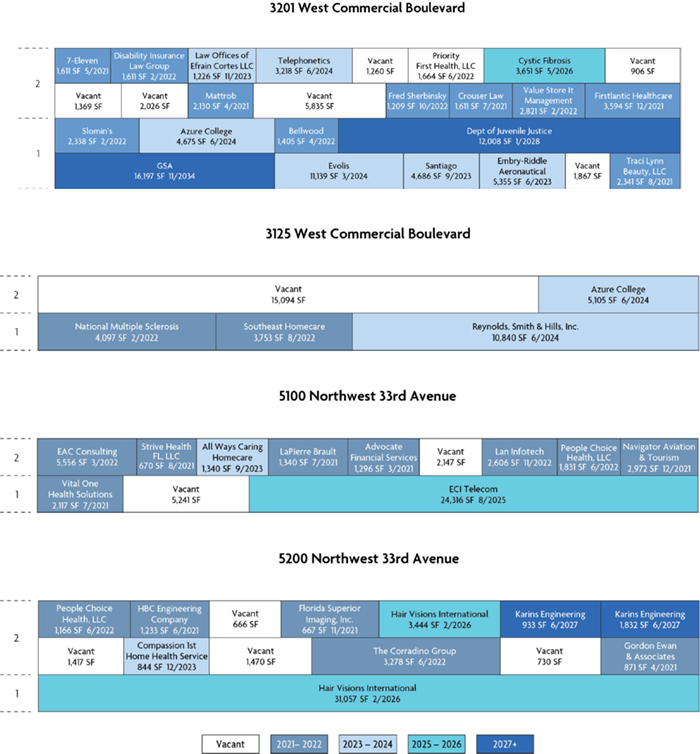
This is not a research report and was not prepared by any Underwriter’s research department. Please see additional important information and qualifications at the end of this Term Sheet.
107
| Office – Suburban | Loan #9 | Cut-off Date Balance: | $25,100,000 | |
| 3201 & 3125 West Commercial Boulevard | Lakeshore Business Center | Cut-off Date LTV: | 62.4% | |
| and 5100 & 5200 Northwest 33rd Avenue | UW NCF DSCR: | 1.66x | ||
| Fort Lauderdale, Florida 33309 | UW NOI Debt Yield: | 10.9% |
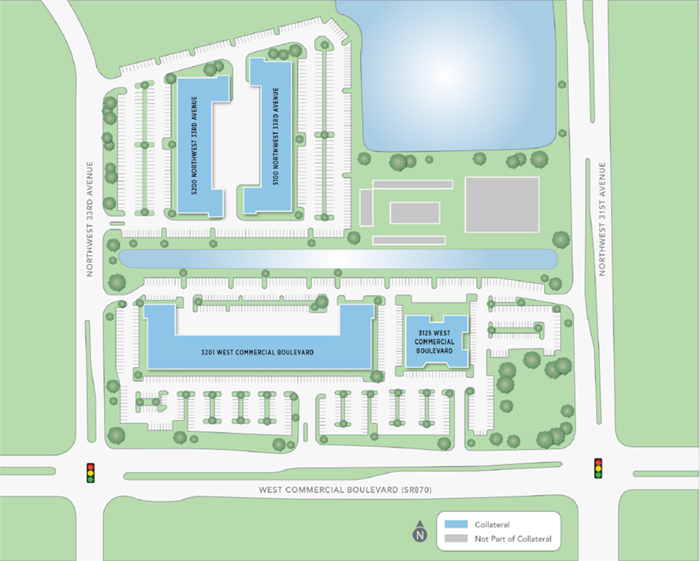
This is not a research report and was not prepared by any Underwriter’s research department. Please see additional important information and qualifications at the end of this Term Sheet.
108
| Office – Suburban | Loan #9 | Cut-off Date Balance: | $25,100,000 | |
| 3201 & 3125 West Commercial Boulevard | Lakeshore Business Center | Cut-off Date LTV: | 62.4% | |
| and 5100 & 5200 Northwest 33rd Avenue | UW NCF DSCR: | 1.66x | ||
| Fort Lauderdale, Florida 33309 | UW NOI Debt Yield: | 10.9% |
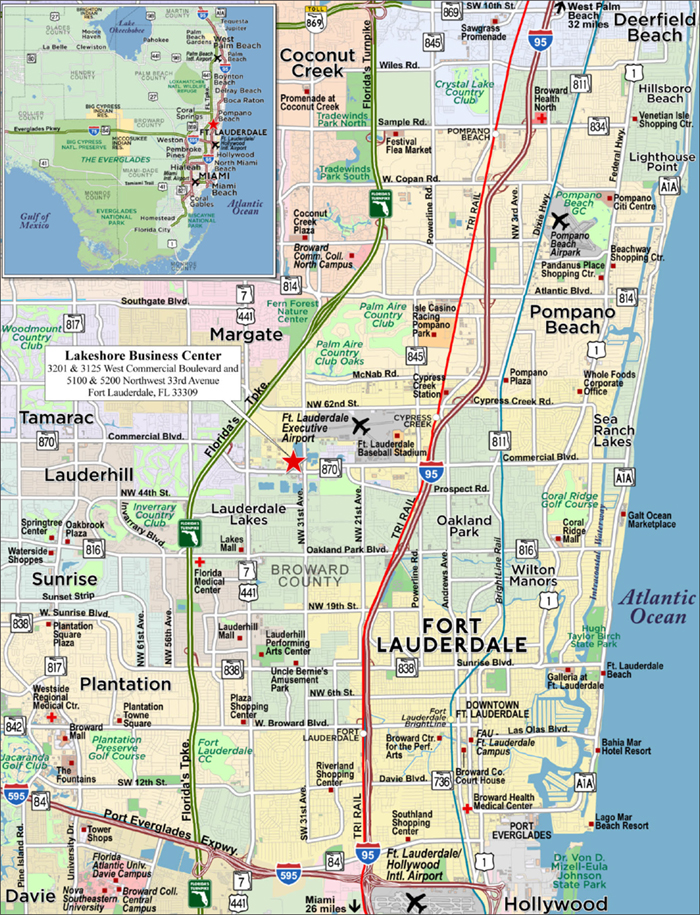
This is not a research report and was not prepared by any Underwriter’s research department. Please see additional important information and qualifications at the end of this Term Sheet.
109
| Mortgage Loan No. 9 – Lakeshore Business Center |
| Mortgage Loan Information | Property Information | ||||||
| Mortgage Loan Seller: | MSMCH | Single Asset/Portfolio: | Single Asset | ||||
| Credit Assessment (Moody’s/DBRSM/Fitch): | NR/NR/NR | Location: | Fort Lauderdale, FL 33309 | ||||
| Original Balance: | $25,100,000 | General Property Type: | Office | ||||
| Cut-off Date Balance: | $25,100,000 | Detailed Property Type: | Suburban | ||||
| % of Initial Pool Balance: | 2.8% | Title Vesting: | Fee | ||||
| Loan Purpose: | Refinance | Year Built/Renovated: | 1987;1989;2000/N/A | ||||
| Borrower Sponsors: | YMP Real Estate | Size: | 237,682 SF | ||||
| Guarantor: | Joseph Popack; Moshe Popack | Cut-off Date Balance Per SF: | $106 | ||||
| Mortgage Rate: | 3.9500% | Maturity Date Balance Per SF: | $96 | ||||
| Note Date: | 3/3/2021 | Property Manager: | YMP Real Estate Management, | ||||
| First Payment Date(1): | 4/1/2021 | LLC (borrower-related) | |||||
| Maturity Date: | 4/1/2031 | ||||||
| Original Term to Maturity(1): | 121 months | ||||||
| Original Amortization Term: | 360 months | Underwriting and Financial Information(2) | |||||
| IO Period(1): | 61 months | UW NOI: | $2,748,432 | ||||
| Seasoning: | 0 months | UW NOI Debt Yield: | 10.9% | ||||
| Prepayment Provisions(1): | LO (24); DEF (91); O (6) | UW NOI Debt Yield at Maturity: | 12.1% | ||||
| Lockbox/Cash Mgmt Status: | Springing/Springing | UW NCF DSCR: | 1.66x | ||||
| Additional Debt Type: | No | Most Recent NOI: | $2,185,273 (12/31/2020) | ||||
| Additional Debt Balance: | N/A | 2nd Most Recent NOI: | $2,154,958 (12/31/2019) | ||||
| Future Debt Permitted (Type): | No (N/A) | 3rd Most Recent NOI: | $1,958,521 (12/31/2018) | ||||
| Reserves(3) | Most Recent Occupancy: | 82.6% (1/15/2021) | |||||
| Type | Initial | Monthly | Cap | 2nd Most Recent Occupancy: | 76.8% (12/31/2020) | ||
| RE Taxes: | $160,953 | $53,651 | N/A | 3rd Most Recent Occupancy: | 83.8% (12/31/2019) | ||
| Insurance: | $174,609 | $14,551 | N/A | Appraised Value (as of): | $40,251,546 (12/15/2020) | ||
| Deferred Maintenance: | $14,688 | $0 | N/A | Appraised Value Per SF: | $169 | ||
| Replacement Reserve: | $0 | $4,931 | N/A | Cut-off Date LTV Ratio: | 62.4% | ||
| TI/LC Reserve: | $0 | $24,759 | $375,000 | Maturity Date LTV Ratio: | 56.6% | ||
| Existing TI/LC Reserve: | $1,172,173 | $0 | N/A | ||||
| Sources and Uses | ||||||
| Sources | Proceeds | % of Total | Uses | Proceeds | % of Total | |
| Loan Amount: | $25,100,000 | 100.0% | Loan Payoff: | $21,715,181 | 86.5% | |
| Reserves: | $1,522,423 | 6.1% | ||||
| Return of Equity: | $1,393,241 | 5.6% | ||||
| Closing Costs: | $469,155 | 1.9% | ||||
| Total Sources: | $25,100,000 | 100.0% | Total Uses: | $25,100,000 | 100.0% | |
| (1) | The first payment date for the Lakeshore Business Center Mortgage Loan is May 1, 2021. On the closing date, Morgan Stanley Mortgage Capital Holdings LLC will deposit sufficient funds to pay the amount of interest that would be due with respect to an April 1, 2021 payment. First Payment Date, Original Term to Maturity, IO Period and Prepayment Provisions are inclusive of the additional April 1, 2021 interest-only payment funded by MSMCH on the closing date. |
| (2) | The novel coronavirus pandemic is an evolving situation and could impact the Lakeshore Business Center Mortgage Loan more severely than assumed in the underwriting of the Lakeshore Business Center Mortgage Loan and could adversely affect the NOI, NCF and occupancy information, as well as the appraised value and the DSCR, LTV and Debt Yield metrics presented above and herein. See "Risk Factors-—Risks Related to Market Conditions and Other External Factors—The Coronavirus Pandemic Has Adversely Affected the Global Economy and Will Likely Adversely Affect the Performance of the Mortgage Loans" in the Preliminary Prospectus. |
| (3) | See “Escrows and Reserves” below for further discussion of reserve requirements. |
The Mortgage Loan. The ninth largest mortgage loan (the “Lakeshore Business Center Mortgage Loan”) is evidenced by a promissory note in the original principal balance of $25,100,000 and secured by a first priority fee mortgage encumbering a four-building office property in Fort Lauderdale, Florida (the “Lakeshore Business Center Property”).
The Borrower and the Borrower Sponsors. The borrower is DE Lakeshore LLC (the “Lakeshore Business Center Borrower”), a Delaware limited liability company structured with one independent director in its organizational structure. The non-recourse guarantors are Joseph and Moshe Popack and the sponsor is YMP Real Estate. The Lakeshore Business Center Borrower is 50.0% owned by Joseph Popack and 25.0% owned by Moshe Popack. YMP Real Estate is a private real estate firm engaged in the acquisition and management of multifamily and commercial properties. YMP Real Estate was founded by Moshe Popack, a third-generation real estate investor. Currently, YMP Real Estate owns and manages a portfolio consisting of approximately 4,000 multifamily units and 1.3 million SF of commercial space located in Florida, Georgia, Alabama, North Carolina and New Jersey.
This is not a research report and was not prepared by any Underwriter’s research department. Please see additional important information and qualifications at the end of this Term Sheet.
110
| Office – Suburban | Loan #9 | Cut-off Date Balance: | $25,100,000 | |
| 3201 & 3125 West Commercial Boulevard | Lakeshore Business Center | Cut-off Date LTV: | 62.4% | |
| and 5100 & 5200 Northwest 33rd Avenue | UW NCF DSCR: | 1.66x | ||
| Fort Lauderdale, Florida 33309 | UW NOI Debt Yield: | 10.9% |
The Property. The Lakeshore Business Center Property is a 237,682 SF, four-building office property located in Fort Lauderdale, Florida. Lakeshore I is comprised of two, two-story buildings constructed in 1987 with a total of 101,040 SF. Lakeshore II is comprised of a two-story building constructed in 1989, with a total of 97,753 SF. Lakeshore III is comprised of a two-story building constructed in 2000, with a total of 38,889 SF. As of January 15, 2021, the Lakeshore Business Center Property was 82.6% occupied. The Lakeshore Business Center Property has two large government tenants, including the General Services Administration of the United States of America (“GSA”) (16,197 SF) and the State of Florida (12,008 SF), which recently executed long-term leases. The GSA space at the Lakeshore Business Center Property is being utilized by the Social Security Administration and the State of Florida space at the Lakeshore Business Center Property is being utilized by the Department of Juvenile Justice. Other notable tenants include Hair Visions International (34,501 SF), ECI Telecom (24,316 SF), and Evolis (11,139 SF). The GSA and the State of Florida, together, account for 26.8% of total underwritten rent. Aside from the four largest tenants at the Lakeshore Business Center Property, no other tenant accounts for more than 5.3% of underwritten rent or 4.7% of total SF. Five tenants (7.8% of NRA and 8.8% of underwritten rent) have been in occupancy at the Lakeshore Business Center Property for over 15 years and 13 tenants (38.3% of NRA and 51.7% of underwritten rent) have been in occupancy at the Lakeshore Business Center Property for over 10 years.
Major Tenants.
Hair Visions International (34,501 SF, 14.5% of NRA, 10.1% of underwritten rent). Established in 1975, Hair Visions International is a global distributor of men’s hair replacement products and services providing its clients with the latest technologies in hair systems, a full line of hair care products, accessories, and innovative marketing programs. Hair Visions International has been a tenant at the Lakeshore Business Center Property since 2017, has a lease expiration of February 28, 2026 and two, five-year renewal options remaining.
ECI Telecom (24,316 SF, 10.2% of NRA, 11.4% of underwritten rent). ECI Telecom manufactures and develops telephone transmission equipment. The company provides professional training and knowledge management, end-to-end program maintenance packages, network design and audit, and traffic analysis and optimization services. ECI Telecom has been a tenant at the Lakeshore Business Center Property since 2007 and has extended its lease multiple times. The tenant has a lease expiration of August 31, 2025 and no renewal options remaining. ECI Telecom, Inc. has the option to terminate its lease effective August 31, 2023 by written notice no later than December 1, 2022.
GSA (Social Security Administration) (16,197 SF, 6.8% of NRA, 16.6% of underwritten rent). The Social Security Administration is the organization that oversees and administers the Social Security program in the United States. The benefits administered include social security retirement income and disability income programs, among others. The Social Security Administration is also responsible for issuing Social Security numbers and managing the program's finances and trust fund. The Social Security Administration has been a tenant at the Lakeshore Business Center Property since 2009, has a lease expiration of November 30, 2034 and no renewal options remaining. The Social Security Administration has the option to terminate its lease effective at any time after December 31, 2032, upon 60 days’ notice.
Department of Juvenile Justice (12,008 SF, 5.1% of NRA, 10.2% of underwritten rent). The Department of Juvenile Justice is a government program that supports local and state efforts to prevent delinquency and improve the juvenile justice system. The Department of Juvenile Justice signed a long term lease at the Lakeshore Business Center Property in February 2021. The lease has an expiration of January 31, 2028 and two, five-year renewal options remaining. The Department of Juvenile Justice has the right to terminate its lease without penalty in the event that a state-owned building becomes available for the tenant to occupy, and upon giving six months advance written notice to the landlord. In addition, the Department of Juvenile Justice lease has an appropriations clause that states that the landlord acknowledges that the State of Florida’s performance and obligation to pay under the lease contract is contingent upon an annual appropriation by the Florida legislature.
Evolis (11,139 SF, 4.7% of NRA, 5.3% of underwritten rent). Evolis designs, manufactures, and markets a comprehensive range of printing systems and plastic card personalization solutions. Evolis has been a tenant at the Lakeshore Business Center Property since 2007 and has extended its lease multiple times. The tenant has a lease expiration of March 31, 2024 and no renewal options remaining. Evolis has the option to terminate its lease effective September 30, 2022, upon not less than 270 days prior written notice.
This is not a research report and was not prepared by any Underwriter’s research department. Please see additional important information and qualifications at the end of this Term Sheet.
111
| Office – Suburban | Loan #9 | Cut-off Date Balance: | $25,100,000 | |
| 3201 & 3125 West Commercial Boulevard | Lakeshore Business Center | Cut-off Date LTV: | 62.4% | |
| and 5100 & 5200 Northwest 33rd Avenue | UW NCF DSCR: | 1.66x | ||
| Fort Lauderdale, Florida 33309 | UW NOI Debt Yield: | 10.9% |
The following table presents certain information relating to the major tenants at the Lakeshore Business Center Property:
| Tenant Summary(1) | |||||||||
| Tenant Name | Credit Rating (Fitch/Moody's/ S&P)(2) | Tenant SF | Approx. % of SF | Annual UW Rent | % of Total Annual UW Rent | Annual UW Rent PSF(3) | Lease Expiration | Renewal Options | Term. Option (Y/N) |
| Hair Visions International | NR/NR/NR | 34,501 | 14.5% | $325,096 | 10.1% | $9.42 | 2/28/2026 | 2 x 5-year | N |
| ECI Telecom(4) | NR/NR/NR | 24,316 | 10.2% | $367,605 | 11.4% | $15.12 | 8/31/2025 | None | Y |
| GSA(5) | AAA/Aaa/NR | 16,197 | 6.8% | $533,784 | 16.6% | $32.96 | 11/30/2034 | None | Y |
| Department of Juvenile Justice(6) | AAA/Aaa/AAA | 12,008 | 5.1% | $329,623 | 10.2% | $27.45 | 1/31/2028 | 2 x 5-year | Y |
| Evolis(7) | NR/NR/NR | 11,139 | 4.7% | $171,541 | 5.3% | $15.40 | 3/31/2024 | None | Y |
| Subtotal/Wtd. Avg. | 98,161 | 41.3% | $1,727,648 | 53.7% | $17.60 | ||||
| Other Tenants | 98,197 | 41.3% | $1,491,391 | 46.3% | $15.19 | ||||
| Vacant Space | 41,324 | 17.4% | $0 | 0.0% | $0.00 | ||||
| Total/Wtd. Avg. | 237,682 | 100.0% | $3,219,039 | 100.0% | $16.39 | ||||
| (1) | Information is based on the underwritten rent roll as of January 15, 2021. |
| (2) | Certain ratings are those of the parent company or government whether or not the parent company or government guarantees the lease. |
| (3) | Total/Wtd. Avg. Annual UW Rent PSF excludes vacant space. |
| (4) | ECI Telecom has the option to terminate its lease effective August 31, 2023 by written notice no later than December 1, 2022. |
| (5) | The Social Security Administration has the option to terminate its lease effective at any time after December 31, 2032, upon 60 days’ notice. |
| (6) | The Department of Juvenile Justice has the right to terminate its lease without penalty in the event that a state-owned building becomes available for the tenant to occupy, and upon giving six months’ advance written notice to the landlord. In addition, the Department of Juvenile Justice lease has an appropriations clause that states that the landlord acknowledges that the State of Florida’s performance and obligation to pay under the lease contract is contingent upon an annual appropriation by the Florida legislature. |
| (7) | Evolis, Inc. has the option to terminate its lease effective September 30, 2022 by not less than 270 days’ prior written notice. |
The following table presents certain information relating to the lease rollover schedule at the Lakeshore Business Center Property:
| Lease Rollover Schedule(1)(2) | ||||||||
| Year | # of Leases Rolling | SF Rolling | UW Rent PSF Rolling | Approx. % of Total SF Rolling | Approx. Cumulative % of SF Rolling | Total UW Rent Rolling | Approx. % of Total Rent Rolling | Approx. Cumulative % of Total Rent Rolling |
| 2021 | 12 | 21,157 | $14.80 | 8.9% | 8.9% | $313,129 | 9.7% | 9.7% |
| 2022 | 12 | 33,335 | $15.68 | 14.0% | 22.9% | $522,780 | 16.2% | 26.0% |
| 2023 | 5 | 13,451 | $13.18 | 5.7% | 28.6% | $177,231 | 5.5% | 31.5% |
| 2024 | 4 | 34,977 | $15.90 | 14.7% | 43.3% | $556,305 | 17.3% | 48.8% |
| 2025 | 1 | 24,316 | $15.12 | 10.2% | 53.5% | $367,605 | 11.4% | 60.2% |
| 2026 | 2 | 38,152 | $9.85 | 16.1% | 69.6% | $375,863 | 11.7% | 71.9% |
| 2027 | 1 | 2,765 | $15.45 | 1.2% | 70.7% | $42,719 | 1.3% | 73.2% |
| 2028 | 1 | 12,008 | $27.45 | 5.1% | 75.8% | $329,623 | 10.2% | 83.4% |
| 2029 | 0 | 0 | $0.00 | 0.0% | 75.8% | $0 | 0.0% | 83.4% |
| 2030 | 0 | 0 | $0.00 | 0.0% | 75.8% | $0 | 0.0% | 83.4% |
| 2031 | 0 | 0 | $0.00 | 0.0% | 75.8% | $0 | 0.0% | 83.4% |
| 2032 & Beyond | 1 | 16,197 | $32.96 | 6.8% | 82.6% | $533,784 | 16.6% | 100.0% |
| Vacant Space | 0 | 41,324 | $0.00 | 17.4% | 100.0% | $0 | 0.0% | 100.0% |
| Total/Wtd. Avg.(3) | 39 | 237,682 | $16.39 | 100.0% | $3,219,039 | 100.0% | ||
| (1) | Information is based on the underwritten rent roll as of January 15, 2021. |
| (2) | Certain tenants may have lease termination options that are exercisable prior to the stated expiration date of the subject lease or leases that are not considered in the lease rollover schedule. |
| (3) | Total/Wtd. Avg. UW Rent PSF Rolling excludes vacant space. |
COVID-19 Update. The first debt service payment date for the Lakeshore Business Center Mortgage Loan is April 1, 2021 and, as of February 25, 2021, the Lakeshore Business Center Mortgage Loan is not subject to any forbearance, modification or debt service relief request. As of February 25, 2021, the Lakeshore Business Center Borrower has reported that the Lakeshore Business Center Property is open and operating, with 95.0% of billed rent being collected in February 2021. One tenant (1.7% of NRA and 1.9% of underwritten rent) received deferred rent for the months of May and June 2020.
The Market. The Lakeshore Business Center Property is located in Fort Lauderdale, Florida within the Cypress Creek office submarket of Broward County. Primary access to the area is provided by Interstate 95 and Florida’s Turnpike, two major arterials that cross Broward County in a north/south direction. Public transportation in the area is provided by Broward County Transit, which is the second-largest transit system in Florida, after Miami-Dade Transit. Fort Lauderdale International Airport is located about 15 miles south of the Lakeshore Business Center Property, and the Downtown Fort Lauderdale CBD, the economic and cultural center of the region, is approximately 10 miles south of the Lakeshore Business Center Property. Major employers in the area include Citrix, which is headquartered at the northeast portion of the submarket. According to the appraisal, as of the third quarter of 2020, the vacancy rate in the Cypress Creek office submarket was approximately 11.7%, with average asking rents of $17.76 PSF and inventory of approximately 8.4 million SF. According to the appraisal, as of the third quarter of 2020, the vacancy rate in the Broward County market was approximately 10.2%, with average asking rents of $23.84 PSF and inventory of approximately 70.6 million SF. According to the appraisal, the 2020 estimated population within a one-, three- and five-mile radius of the Lakeshore Business Center Property was 11,251, 166,585 and 479,038,
This is not a research report and was not prepared by any Underwriter’s research department. Please see additional important information and qualifications at the end of this Term Sheet.
112
| Office – Suburban | Loan #9 | Cut-off Date Balance: | $25,100,000 | |
| 3201 & 3125 West Commercial Boulevard | Lakeshore Business Center | Cut-off Date LTV: | 62.4% | |
| and 5100 & 5200 Northwest 33rd Avenue | UW NCF DSCR: | 1.66x | ||
| Fort Lauderdale, Florida 33309 | UW NOI Debt Yield: | 10.9% |
respectively. The 2020 estimated median household income within a one-, three- and five-mile radius of the Lakeshore Business Center Property was $45,391, $42,758 and $45,179, respectively.
The following table presents certain information relating to the appraisal’s market rent conclusion for the Lakeshore Business Center Property:
| Market Rent Summary | ||||
| Market Rent (PSF) | Lease Term (Mos.) | Lease Type (Reimbursements) | Rent Increase Projection | |
| Lakeshore I-II Office <10,000 SF Space: | $15.00 | 60 | NNN | 3.00% Annual Increase |
| Lakeshore I-II Office >10,000 SF Space: | $14.00 | 84 | NNN | 3.00% Annual Increase |
| Lakeshore III Office <10,000 SF Space: | $17.00 | 60 | NNN | 3.00% Annual Increase |
| Lakeshore III Office >10,000 SF Space: | $16.00 | 84 | NNN | 3.00% Annual Increase |
| GSA Office Space: | $30.00 | 120 | Gross | 3.00% Annual Increase |
The following table presents recent leasing data with respect to comparable office properties with respect to the Lakeshore Business Center Property:
| Comparable Office Lease Summary | |||||||
| Property/Location | Year Built | SF | Tenant Name | Size (SF) | Lease Date | Rent PSF | Lease Type |
| Lakeshore Business Center (subject) Fort Lauderdale, FL | 1987-2000 | 237,682 | Hair Visions International ECI Telecom | 34,501 24,316 | Feb. 2018 April 2008 | $9.42 $15.12 | NNN NNN |
| 7200 W Commercial Boulevard Lauderhill, FL | 1983 | 16,533 | Care Management Resources | 1,337 | Feb. 2019 | $13.25 | NNN |
| Crown Center Office Park Fort Lauderdale, FL | 1983 | 341,965 | Early Learning Coalition S FL Institute of Aging | 15,552 2,782 | Feb. 2019 Jan. 2019 | $14.00 $15.00 | NNN NNN |
Source: Appraisal and underwritten rent roll.
The following table presents recent leasing data with respect to GSA office leases comparable to the government leases at the Lakeshore Business Center Property:
| Comparable GSA Office Lease Summary | |||||||
| Property/Location | Year Built | SF | Tenant Name | Size (SF) | Lease Date | Rent PSF | Lease Type |
| Lakeshore Business Center (subject) Fort Lauderdale, FL | 1987-2000 | 237,682 | United States of America (SSA) Department of Juvenile Justice | 16,197 12,008 | Dec. 2019 Feb 2021 | $32.96 $27.45 | Modified Gross |
| Probation and Parole Office Gainesville, FL | 1997 | 53,103 | United States Government | 27,378 | July 2019 | $28.84 | Modified Gross |
| Department of Homeland Security Miami, FL | 2007 | 73,853 | Department of Homeland Security | 72,028 | Feb. 2018 | $37.57 | Modified Gross |
| 501 South Flagler Drive West Palm Beach, FL | 1984 | 90,000 | US Probation Office | 20,107 | Aug. 2016 | $44.58 | Modified Gross |
| 720 20th Place Vero Beach, FL | 2009 | 10,129 | Social Security Administration | 5,809 | April 2019 | $29.44 | Full Service |
| US Dept of Homeland Security Lauderhill, FL | 1983 | 16,000 | US Dept of Homeland Security | 16,000 | April 2018 | $37.19 | Full Service |
| U.S. Customs and Border Protection Jacksonville, FL | 2004 | 12,160 | U.S. Customs and Border Protection | 12,160 | May 2019 | $30.33 | Full Service |
Source: Appraisal and underwritten rent roll.
This is not a research report and was not prepared by any Underwriter’s research department. Please see additional important information and qualifications at the end of this Term Sheet.
113
| Office – Suburban | Loan #9 | Cut-off Date Balance: | $25,100,000 | |
| 3201 & 3125 West Commercial Boulevard | Lakeshore Business Center | Cut-off Date LTV: | 62.4% | |
| and 5100 & 5200 Northwest 33rd Avenue | UW NCF DSCR: | 1.66x | ||
| Fort Lauderdale, Florida 33309 | UW NOI Debt Yield: | 10.9% |
Operating History and Underwritten Net Cash Flow. The following table presents certain information relating to the operating history and Underwritten Net Cash Flow at the Lakeshore Business Center Property:
| Cash Flow Analysis(1) | |||||||||||||
| 2017 | 2018 | 2019 | 2020 | UW | UW PSF | ||||||||
| Gross Potential Rent(2) | $2,426,493 | $2,718,342 | $3,309,628 | $3,423,697 | $3,852,620 | $16.21 | |||||||
| Total Recoveries | $838,628 | $1,068,179 | $1,218,248 | $1,474,018 | $1,315,852 | $5.54 | |||||||
| Other Income | $2,349 | $18,291 | $15,383 | $31,536 | $12,387 | $0.05 | |||||||
| Discount Concessions | ($84,042) | ($256,992) | ($179,583) | ($176,520) | $0 | $0.00 | |||||||
| Less Vacancy & Credit Loss | $0 | ($226) | ($362,677) | ($575,855) | ($633,581) | ($2.67) | |||||||
| Effective Gross Income | $3,183,427 | $3,547,594 | $4,000,999 | $4,176,875 | $4,547,278 | $19.13 | |||||||
| Real Estate Taxes | $394,063 | $407,573 | $447,144 | $600,048 | $600,048 | $2.52 | |||||||
| Insurance | $149,286 | $131,683 | $190,568 | $192,990 | $175,980 | $0.74 | |||||||
| Other Expenses | $992,967 | $1,049,817 | $1,208,329 | $1,198,564 | $1,022,818 | $4.30 | |||||||
| Total Expenses | $1,536,316 | $1,589,072 | $1,846,041 | $1,991,603 | $1,798,846 | $7.57 | |||||||
| Net Operating Income | $1,647,111 | $1,958,521 | $2,154,958 | $2,185,273 | $2,748,432 | $11.56 | |||||||
| CapEx | $0 | $0 | $0 | $0 | $77,508 | $0.33 | |||||||
| TI/LC | $0 | $0 | $0 | $0 | $297,103 | $1.25 | |||||||
| Net Cash Flow | $1,647,111 | $1,958,521 | $2,154,958 | $2,185,273 | $2,373,821 | $9.99 | |||||||
| Occupancy % | N/A | N/A | 83.8% | 76.8% | 86.1% | ||||||||
| NOI DSCR | 1.15x | 1.37x | 1.51x | 1.53x | 1.92x | ||||||||
| NCF DSCR | 1.15x | 1.37x | 1.51x | 1.53x | 1.66x | ||||||||
| NOI Debt Yield | 6.6% | 7.8% | 8.6% | 8.7% | 10.9% | ||||||||
| NCF Debt Yield | 6.6% | 7.8% | 8.6% | 8.7% | 9.5% | ||||||||
| (1) | For the avoidance of doubt, no COVID-19 specific adjustments have been made to the lender underwriting. |
| (2) | UW Gross Potential Rent is based on the underwritten rent roll as of January 15, 2021. The increase between 2020 and UW Gross Potential Rent and Net Operating Income is mainly due to (i) rent steps of $50,642 through January 31, 2022 and (ii) new leases signed with the Department of Juvenile Justice and Karin's Engineering Group ($372,342). |
Escrows and Reserves.
Required Repairs Reserve. At origination, the Lakeshore Business Center Borrower reserved $14,688 with the lender for required repairs.
Real Estate Taxes – The Lakeshore Business Center Mortgage Loan documents provide for an upfront reserve of approximately $160,953 for real estate taxes and ongoing monthly deposits into a reserve for real estate taxes in an amount equal to 1/12 of the real estate taxes that the lender estimates will be payable during the next twelve months (initially $53,651).
Insurance – The Lakeshore Business Center Mortgage Loan documents provide for an upfront reserve of approximately $174,609 for insurance premiums and ongoing monthly deposits into a reserve for insurance premiums in an amount equal to 1/12 of the insurance premiums that the lender estimates will be payable for the renewal of coverage upon the expiration of the insurance policies (initially $14,551); provided that such monthly deposits are not required so long as (i) no event of default has occurred and is continuing, (ii) the liability and casualty insurance coverage for the Lakeshore Business Center Property is included in a blanket policy approved by the lender in its reasonable discretion, and (iii) the Lakeshore Business Center Borrower provides the lender with evidence of payment of the insurance premiums and renewals of the insurance policies, no later than ten days prior to the expiration of the current policy.
Replacement Reserve – The Lakeshore Business Center Mortgage Loan documents provide for ongoing monthly deposits of approximately $4,931 into a reserve for approved capital expenditures.
TI/LC Reserve – The Lakeshore Business Center Mortgage Loan documents provide for an upfront reserve of approximately $1,172,173 for outstanding tenant improvements and leasing commissions for the tenants GSA-Social Security Administration and State of Florida. In addition, the Lakeshore Business Center Mortgage Loan documents provide for ongoing monthly deposits of approximately $24,759 into a reserve for future tenant improvements and leasing commissions; provided that the Lakeshore Business Center Borrower is not required to deposit any portion of such monthly deposit which would cause the balance in such reserve to exceed $375,000.
Lockbox and Cash Management. The Lakeshore Business Center Mortgage Loan is structured with a springing lockbox and springing cash management. Upon the first occurrence of a Cash Sweep Event Period (as defined below), the Lakeshore Business Center Borrower is required to establish and maintain a lockbox account for the benefit of the lender, and to deposit all rents directly into the lockbox account within one business day of receipt. In addition, the Lakeshore Business Center Borrower was required at origination to deliver to the lender tenant direction letters directing all tenants to deposit rents directly into the lockbox account (which the lender is authorized to deliver to such tenants upon the occurrence of a Cash Sweep Event Period) and is required to deliver to the lender (or if requested by the lender after the occurrence of a Cash Sweep Event Period, directly to the tenant) similar tenant direction letters for any tenants entering into leases after origination. Upon the first occurrence of a Cash Sweep Event Period, the lender is required to establish, and the Lakeshore Business Center Borrower is required to cooperate with the cash management bank to establish, a lender-controlled cash management account, into which all funds in the lockbox account will be required to be deposited, so long as the Cash Sweep
This is not a research report and was not prepared by any Underwriter’s research department. Please see additional important information and qualifications at the end of this Term Sheet.
114
| Office – Suburban | Loan #9 | Cut-off Date Balance: | $25,100,000 | |
| 3201 & 3125 West Commercial Boulevard | Lakeshore Business Center | Cut-off Date LTV: | 62.4% | |
| and 5100 & 5200 Northwest 33rd Avenue | UW NCF DSCR: | 1.66x | ||
| Fort Lauderdale, Florida 33309 | UW NOI Debt Yield: | 10.9% |
Event Period is continuing. During the continuance of a Cash Sweep Event Period, provided no event of default under the Lakeshore Business Center Mortgage Loan documents is continuing, all funds in the cash management account are required to be applied on each monthly payment date: (i) to make the monthly deposits into the real estate tax and insurance reserves as described above under “Escrows and Reserves,” (ii) to pay debt service on the Lakeshore Business Center Mortgage Loan, (iii) to make the monthly deposit into the Replacement Reserve and the TI/LC Reserve as described above under “Escrows and Reserves,” (iv) to pay operating expenses set forth in the lender-approved annual budget and lender-approved extraordinary expenses, and (v) to deposit any remainder into an excess cash flow reserve to be held as additional security for the Lakeshore Business Center Mortgage Loan during the continuance of such Cash Sweep Event Period. If no Cash Sweep Event Period is continuing, all funds in the excess cash flow subaccount are required to be disbursed to the Lakeshore Business Center Borrower.
“Cash Sweep Event Period” means a period:
| (i) | commencing upon an event of default under the Lakeshore Business Center Mortgage Loan documents and ending upon the cure, if applicable, of such event of default; and |
| (ii) | commencing upon the debt yield of the Lakeshore Business Center Mortgage Loan falling below 6.50% at the end of any calendar quarter based on the operating statements and current in-place rent rolls for the immediately preceding six calendar months and ending upon the date that the debt yield is equal to or greater than 6.50% for the immediately preceding six calendar months. |
Additional Secured Indebtedness (not including trade debts). None.
Mezzanine Loan and Preferred Equity. Not permitted.
Release of Property. Not permitted.
Letter of Credit. None.
Right of First Offer / Right of First Refusal. None.
Ground Lease. None.
Terrorism Insurance. The Lakeshore Business Center Borrower is required to obtain and maintain an “all risk” property insurance policy that covers perils of terrorism and acts of terrorism in an amount equal to the “full replacement cost” of the Lakeshore Business Center Property together with 18 months of business income insurance, provided that such coverage is commercially available. For so long as the Terrorism Risk Insurance Act of 2002, as extended and modified by the Terrorism Risk Insurance Program Reauthorization Act of 2015 (“TRIPRA”) is in effect (including any extensions thereof or if another federal governmental program is in effect relating to “acts of terrorism” which provides substantially similar protections as TRIPRA), the lender is required to accept terrorism insurance which covers against “covered acts” (as defined by TRIPRA) but only in the event that TRIPRA continues to cover both domestic and foreign acts of terrorism. See “Risk Factors—Risks Relating to the Mortgage Loans—Terrorism Insurance May Not Be Available for All Mortgaged Properties” in the Preliminary Prospectus.
This is not a research report and was not prepared by any Underwriter’s research department. Please see additional important information and qualifications at the end of this Term Sheet.
115
| Multifamily – Flexible Apartments | Loan #10 | Cut-off Date Balance: | $21,500,000 |
| Property Addresses - Various | Southern Flexible-Apartment Portfolio | Cut-off Date LTV: | 56.2% |
| UW NCF DSCR: | 2.50x | ||
| UW NOI Debt Yield: | 14.8% |
This is not a research report and was not prepared by any Underwriters research department. Please see additional important information and qualifications at the end of this Term Sheet.
116
| Multifamily – Flexible Apartments | Loan #10 | Cut-off Date Balance: | $21,500,000 |
| Property Addresses - Various | Southern Flexible-Apartment Portfolio | Cut-off Date LTV: | 56.2% |
| UW NCF DSCR: | 2.50x | ||
| UW NOI Debt Yield: | 14.8% |
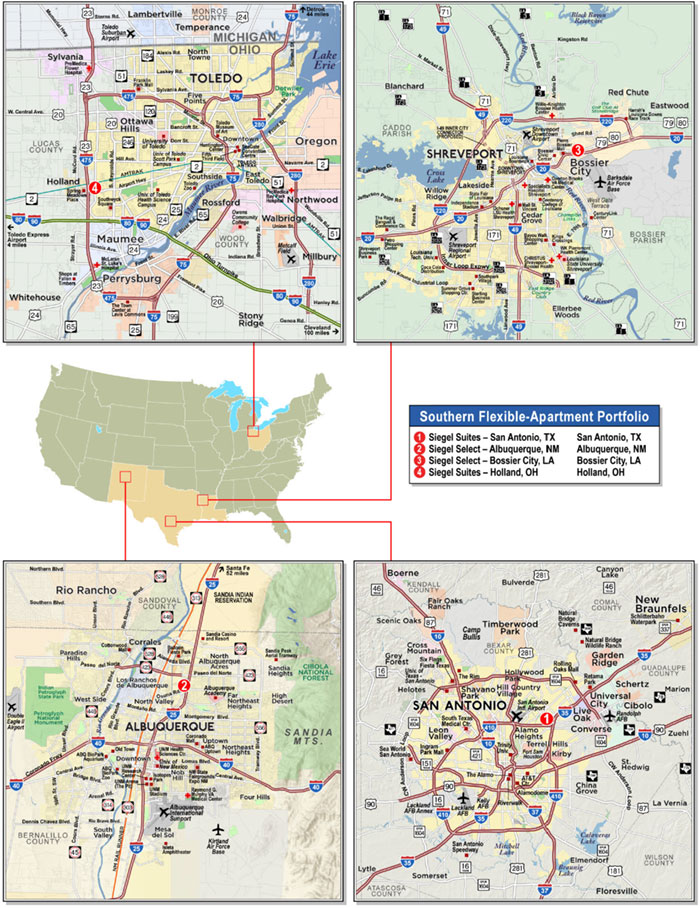
This is not a research report and was not prepared by any Underwriters research department. Please see additional important information and qualifications at the end of this Term Sheet.
117
| Mortgage Loan No. 10 – Southern Flexible-Apartment Portfolio |
| Mortgage Loan Information | Property Information | ||||||
| Mortgage Loan Seller: | BANA | Single Asset/Portfolio: | Portfolio | ||||
| Credit Assessment (Moody’s/DBRSM/Fitch): | NR/NR/NR | Location: | Various | ||||
| Original Balance: | $21,500,000 | General Property Type: | Multifamily | ||||
| Cut-off Date Balance: | $21,500,000 | Detailed Property Type: | Flexible Apartments | ||||
| % of Initial Pool Balance: | 2.4% | Title Vesting: | Fee | ||||
| Loan Purpose: | Refinance | Year Built/Renovated: | Various/Various | ||||
| Borrower Sponsor: | Stephen G. Siegel | Size: | 605 Units | ||||
| Guarantor: | Stephen G. Siegel | Cut-off Date Balance Per Unit: | $35,537 | ||||
| Mortgage Rate: | 3.8000% | Maturity Date Balance Per Unit: | $32,201 | ||||
| Note Date: | 3/4/2021 | Property Manager: | The Siegel Group Nevada, Inc. | ||||
| First Payment Date: | 5/1/2021 | (borrower-related) | |||||
| Maturity Date: | 4/1/2031 | ||||||
| Original Term to Maturity(1): | 121 months | Underwriting and Financial Information(3) | |||||
| Original Amortization Term: | 360 months | UW NOI: | $3,190,770 | ||||
| IO Period(1): | 61 months | UW NOI Debt Yield: | 14.8% | ||||
| Seasoning: | 0 months | UW NOI Debt Yield at Maturity: | 16.4% | ||||
| Prepayment Provisions: | LO (24); DEF (93); O (4) | UW NCF DSCR: | 3.63x (IO) 2.50x (P&I) | ||||
| Lockbox/Cash Mgmt Status: | Springing/Springing | Most Recent NOI: | $2,879,512 (12/31/2020) | ||||
| Additional Debt Type: | No | 2nd Most Recent NOI(4): | N/A | ||||
| Additional Debt Balance: | N/A | 3rd Most Recent NOI(4): | N/A | ||||
| Future Debt Permitted (Type): | No (N/A) | Most Recent Occupancy: | 94.2% (2/1/2021) | ||||
| Reserves(2) | 2nd Most Recent Occupancy(4): | N/A | |||||
| Type | Initial | Monthly | Cap | 3rd Most Recent Occupancy(4): | N/A | ||
| RE Taxes: | $62,972 | $20,890 | N/A | Appraised Value (as of)(5): | $38,270,000 (Various) | ||
| Insurance: | $0 | Springing | N/A | Appraised Value Per Unit: | $63,256 | ||
| Deferred Maintenance: | $182,063 | $0 | N/A | Cut-off Date LTV Ratio: | 56.2% | ||
| Replacement Reserve: | $0 | $12,150 | N/A | Maturity Date LTV Ratio: | 50.9% | ||
| Sources and Uses | ||||||
| Sources | Proceeds | % of Total | Uses | Proceeds | % of Total | |
| Loan Amount: | $21,500,000 | 100.0% | Loan Payoff(6): | $14,676,586 | 68.3% | |
| Return of Equity: | $6,178,461 | 28.7% | ||||
| Closing Costs: | $399,918 | 1.9% | ||||
| Reserves: | $245,035 | 1.1% | ||||
| Total Sources: | $21,500,000 | 100.0% | Total Uses: | $21,500,000 | 100.0% | |
| (1) | The first payment date for the Southern Flexible-Apartment Portfolio Mortgage Loan (as defined below) is May 1, 2021. On the closing date, BANA will deposit sufficient funds to pay the amount of interest that would be due with respect to an April 1, 2021 payment for such mortgage loan. |
| (2) | See “Escrows and Reserves” below for further discussion of reserve information. |
| (3) | The coronavirus pandemic is an evolving situation and could impact the Southern Flexible-Apartment Portfolio Mortgage Loan more severely than assumed in the underwriting of the Southern Flexible-Apartment Portfolio Mortgage Loan and could adversely affect the NOI, NCF and occupancy information, as well as the Appraised Value and the DSCR, LTV and Debt Yield metrics presented above and herein. See "Risk Factors—Risks Related to Market Conditions and Other External Factors—The Coronavirus Pandemic Has Adversely Affected the Global Economy and Will Likely Adversely Affect the Performance of the Mortgage Loans" in the Preliminary Prospectus. |
| (4) | Historical NOI and Occupancy information prior to 2020 is not available because the Southern Flexible-Apartment Portfolio Properties (as defined below) were purchased by the borrower sponsor between 2017 and 2019 and underwent significant renovations after their acquisitions. |
| (5) | The individual appraised value as-of dates are between October 15, 2020 and October 27, 2020. |
| (6) | Loan Payoff does not include any payoff amounts for the Siegel Suites - Holland, OH property or the Siegel Select – Bossier City, LA property, which were previously unencumbered. |
The Mortgage Loan. The tenth largest mortgage loan (the “Southern Flexible-Apartment Portfolio Mortgage Loan”) is evidenced by a promissory note in the original principal amount of $21,500,000 and secured by first priority fee mortgages encumbering four multifamily communities located in Albuquerque, New Mexico, San Antonio, Texas, Bossier City, Louisiana and Holland, Ohio (together, the “Southern Flexible-Apartment Portfolio Properties”).
The Borrowers and the Borrower Sponsor. The borrowers are 3070 Texas St. Bossier City Holdings LLC, Holland Ohio Holdings LLC, 3855 San Antonio Holdings LLC, and 2500 Albuquerque Holdings LLC (together, the “Southern Flexible-Apartment Portfolio Borrower”), each a single-purpose Nevada limited liability company. Stephen G. Siegel is the borrower sponsor and non-recourse carveout guarantor for the Southern Flexible-Apartment Portfolio Mortgage Loan. Stephen G. Siegel is the CEO and President of The Siegel Group, a privately held real estate investment and management firm. The Siegel Group focuses on acquisitions of under-performing real estate assets for repositioning, particularly multifamily and extended stay products that are located in urban areas with access to public transportation and major employment centers. The Siegel Group’s current portfolio consists of 59 multifamily and flexible-stay properties (including the Southern-Flexible Apartment Portfolio Properties), nine retail properties, one office property, one boutique hotel and five land parcels for future development.
This is not a research report and was not prepared by any Underwriters research department. Please see additional important information and qualifications at the end of this Term Sheet.
118
| Multifamily – Flexible Apartments | Loan #10 | Cut-off Date Balance: | $21,500,000 |
| Property Addresses - Various | Southern Flexible-Apartment Portfolio | Cut-off Date LTV: | 56.2% |
| UW NCF DSCR: | 2.50x | ||
| UW NOI Debt Yield: | 14.8% |
The Properties. The Southern Flexible-Apartment Portfolio Properties consist of four flexible- stay multifamily communities located in New Mexico, Texas, Louisiana and Ohio. The borrower sponsor acquired the Southern Flexible-Apartment Portfolio Properties between 2017 and 2019 and has invested approximately $9.0 million in major capital improvements to the properties. The Southern Flexible-Apartment Portfolio Properties are flexible stay multifamily properties that offer furnished units and allow for shorter-term stays. The Siegel Suites branded properties offer minimum one-month rentals that are required to be prepaid in full and accompanied by a security deposit and move-in and processing fees. Siegel Suites properties can be rented furnished or unfurnished. The Siegel Select branded properties offer minimum one-week rentals and are also required to be prepaid in full and accompanied by move-in and processing fees. As reported by the borrower sponsor, the average length of stay across The Siegel Group’s flexible-apartment properties in its portfolio between both brands is approximately 18 months and the average occupancy is approximately 89%.
Siegel Select - Albuquerque, NM
The Siegel Select - Albuquerque, NM property is a 208-unit multifamily property located in Albuquerque, New Mexico. The borrower sponsor purchased the property in November 2017 for $4,000,000 and in June 2019 completed the approximately $3.54 million conversion of the property from two separate hotels into one three-story apartment building. The unit mix consists of 185 studio units (average unit size 275-325 SF) that are 92.4% occupied at an average rent of $936 per month, 12 one-bedroom/two-bathroom units (average unit size 550 SF) that are 100.0% occupied at an average rent of $1,027 per month, and 11 two-bedroom/three-bathroom units (average unit size 850 SF) that are 90.9% occupied at an average rent of $1,341 per month. The Siegel Select - Albuquerque, NM property features two passenger elevators and 185 surface parking spaces. All units are furnished and feature a full kitchen appliance package and a mounted flat screen TV. Community amenities include a newly constructed pool and laundry facility. The Siegel Select - Albuquerque, NM property opened for new tenants beginning in the fall of 2019 and has an average length of current tenant occupancy of 4 months.
Siegel Suites - San Antonio, TX
The Siegel Suites - San Antonio, TX property is a 182-unit multifamily property located in San Antonio, Texas. The Siegel Suites - San Antonio, TX property was constructed in 1963 and in August 2017 was purchased by the borrower sponsor for $3,300,000 and underwent an approximately $3.86 million renovation which was completed in 2020. The Siegel Suites - San Antonio, TX property is comprised of five two-story buildings. The unit mix consists of 158 studio units (average unit size 290 SF) that are 93.7% occupied at an average rent of $913 per month and 24 one-bedroom/one-bathroom units (average unit size 580 SF) that are 87.5% occupied at an average rent of $1,241 per month. The Siegel Suites - San Antonio, TX property includes 247 surface parking spaces. All units are furnished with full utilities paid and feature a two-burner cooktop, full size refrigerator, table and chairs, one or two full sized beds and a mounted flat screen TV. Community amenities include a leasing office, swimming pool and laundry facility. The Siegel Suites - San Antonio, TX property opened for new tenants beginning in early 2020 and has an average length of current tenant occupancy of 7 months.
Siegel Select - Bossier City, LA
The Siegel Select - Bossier City, LA property is a 119-unit, three-story multifamily property located in Bossier City, Louisiana. The Siegel Select - Bossier City, LA property was constructed in 1995 and in February 2018 was purchased by the borrower sponsor for $3,469,325 and underwent an approximately $1.37 million renovation. The unit mix consists of 92 studio units (average unit size 240 SF) that are 97.8% occupied at an average rent of $903 per month, 25 large studio units (average unit size 260 SF) that are 96.0% occupied at an average rent of $1,019 per month, 1 deluxe studio unit (280 SF) that is rented at a rate of $1,079 per month, and 1 one-bedroom/one-bathroom unit (320 SF) that is rented at a rate of $1,166 per month. The Siegel Select - Bossier City, LA property includes 134 surface parking spaces. All units are furnished with full utilities paid and feature a two-burner cooktop, full size refrigerator, table and chairs, sofa, one or two full-size beds, dresser and a mounted flat screen TV. Community amenities include a leasing office and laundry facility. The Siegel Select - Bossier City, LA property has an average length of current tenant occupancy of 6 months.
Siegel Suites - Holland, OH
The Siegel Suites - Holland, OH property is a 96-unit multifamily property located in Holland, Ohio. The Siegel Suites - Holland, OH property was constructed in 1987 and in October 2019 was purchased by the borrower sponsor for $2,150,000. Between 2019 and 2020, the Siegel Suites - Holland, OH property underwent an approximately $443,600 renovation. The Siegel Suites - Holland, OH property is comprised of twelve two-story buildings. The unit mix consists of 72 studio units (average unit size 419 SF) that are 100.0% occupied at an average rent of $1,210 per month and 24 one-bedroom/one-bathroom units (average unit size 672 SF) that are 100.0% occupied at an average rent of $1,343 per month. The Siegel Suites - Holland, OH property includes 100 surface parking spaces. All units are furnished with full utilities paid and feature a full appliance package, table and chairs, sofa and coffee table, one or two full-sized beds, dresser and a flat screen TV. Community amenities include a leasing office/clubhouse, sports court, swimming pool and laundry facility. The Siegel Suites - Holland, OH property has an average length of current tenant occupancy of 7 months.
This is not a research report and was not prepared by any Underwriters research department. Please see additional important information and qualifications at the end of this Term Sheet.
119
| Multifamily – Flexible Apartments | Loan #10 | Cut-off Date Balance: | $21,500,000 |
| Property Addresses - Various | Southern Flexible-Apartment Portfolio | Cut-off Date LTV: | 56.2% |
| UW NCF DSCR: | 2.50x | ||
| UW NOI Debt Yield: | 14.8% |
| Southern Flexible-Apartment Portfolio Properties Summary | |||||||||||
Property Address | Year Built/ Renovated | Units | % of Portfolio Units | 2/1/2021 Occupancy | Appraised Value | % of Portfolio Appraised Value | Allocated Loan Amount | UW NOI | UW NOI Per Unit | % of Total UW NOI | |
Siegel Select - Albuquerque, NM 2500 University Boulevard Northeast Albuquerque, NM 87107 | 1985 / 2019 | 208 | 34.4% | 90.9% | $12,250,000 | 32.0% | $6,120,000 | $908,188 | $4,366 | 28.5% | |
Siegel Suites - San Antonio, TX 3855 North PanAm Expressway San Antonio, TX 78219 | 1963 / 2020 | 182 | 30.1% | 92.9% | $11,720,000 | 30.6% | $6,360,000 | $943,240 | $5,183 | 29.6% | |
Siegel Select - Bossier City, LA 3070 East Texas Street Bossier City, LA 71111 | 1995 / 2018 | 119 | 19.7% | 97.5% | $7,400,000 | 19.3% | $4,770,000 | $707,900 | $5,949 | 22.2% | |
Siegel Suites - Holland, OH 6101 Trust Drive Holland, OH 43528 | 1987 / 2019-2020 | 96 | 15.9% | 100.0% | $6,900,000 | 18.0% | $4,250,000 | $631,442 | $6,578 | 19.8% | |
| Total/Weighted Average | 605 | 100.0% | 94.2% | $38,270,000 | 100.0% | $21,500,000 | $3,190,770 | 100.0% | |||
COVID-19 Update. As of February 11, 2021, the Southern Flexible-Apartment Portfolio Properties are open and operating. During the pandemic, no rent relief has been given as tenants pre-pay their rent and are subsequently evicted if past their paid stay period. The first debt service payment on the Southern Flexible-Apartment Portfolio Mortgage Loan is due in May 2021 and, as of March 4, 2021, the Southern Flexible-Apartment Portfolio Mortgage Loan is not subject to any forbearance, modification or debt service relief request.
The Markets.
Siegel Select - Albuquerque, NM
The Siegel Select - Albuquerque, NM property is located approximately 2.5 miles northeast of downtown Albuquerque in an established neighborhood surrounded by residential development, neighborhood and community retail centers, and office and industrial developments, including Lovelace Women’s Hospital and the surrounding medical office buildings. Single-family residential development within a one-mile radius of the Siegel Select - Albuquerque, NM property has a median year built of 1974 and a median home value within a one-mile radius of approximately $140,865, increasing to $213,710 within a three-mile radius. The immediate area is dominated by renters, who occupy over 63% of the housing units within a one-mile radius.
The Siegel Select - Albuquerque, NM property is located in the Albuquerque apartment market and the MLS Area 41 submarket. According to the appraiser’s survey of 154 market rate properties in Albuquerque, the market had an overall occupancy of 94.6% as of January 2020, with an average market rent of $923 per month, an 8.4% increase from the prior year. The MLS Area 41 submarket had an average occupancy of 93.0% as of January 2020, with an average market rent of $788 per month. The borrower sponsor owns and operates two other multifamily properties in the market as shown in the table below.
According to the appraisal, the estimated 2020 population within a one-, three- and five-mile radius of the Siegel Select - Albuquerque, NM property was 5,315, 102,365 and 269,923, respectively. The 2020 average household income within the same radii was $60,506, $60,421 and $62,511 respectively.
This is not a research report and was not prepared by any Underwriters research department. Please see additional important information and qualifications at the end of this Term Sheet.
120
| Multifamily – Flexible Apartments | Loan #10 | Cut-off Date Balance: | $21,500,000 |
| Property Addresses - Various | Southern Flexible-Apartment Portfolio | Cut-off Date LTV: | 56.2% |
| UW NCF DSCR: | 2.50x | ||
| UW NOI Debt Yield: | 14.8% |
The following table presents recent leasing data with respect to comparable properties to the Siegel Select - Albuquerque, NM property:
| Comparable Properties - Siegel Select - Albuquerque, NM | ||||||
| Property/Location | Distance | Year Built/Reno. | Occupancy | Total Units | Avg Unit Size (SF) | Avg Monthly Rent Per Unit |
Siegel Select - Albuquerque, NM 2500 University Boulevard Northeast Albuquerque, NM | N/A | 1985/2019 | 90.9%(1) | 208 | Studio - 275-325 1BR - 550 2BR - 850 | Studio - $965 1BR - $1,043 2BR - $1,359(2) |
Siegel Select - Albuquerque, NM II(3) 5020 Ellison Street NE Albuquerque, NM | 3.8 miles | 1998/2018 | 84% | 131 | Studio - 225-330 | Studio - $875-$961 |
Siegel Suites Albuquerque(3) 75 Hotel Circle NE Albuquerque, NM | 5.7 miles | 1970/2015 | 93% | 125 | Studio - 200 1BR - 300 | Studio - $789 1BR - $1,003 |
InTown Suites Albuquerque 4676 Commerce Drive NE Albuquerque, NM | 1.9 miles | 1999 | 97% | 136 | Studio - 350 | Studio - $986-$1,200 |
Suburban Extended Stay Albuquerque 2401 Wellesley Avenue NE Albuquerque, NM | 0.9 miles | 1997 | 90% | 133 | Studio - 325 | Studio - $1,114-$1,346 |
Comanche Wells 3400 Comanche Road NE Albuquerque, NM | 1.2 miles | 1985 | 94% | 179 | Studio - 420 1BR - 520 2BR - 727 | Studio - $694-$1,023 1BR - $724-$1,063 2BR - $803-$1,217 |
Rock Creek 3135 Comanche Road NE Albuquerque, NM | 2.1 miles | 1973/2019 | 98% | 122 | Studio - 365-400 1BR - 548 2BR - 650 | Studio - $655 1BR - $785 2BR - $950 |
Source: Appraisal.
| (1) | Occupancy as of February 1, 2021. |
| (2) | Information based on quoted rates. |
| (3) | Owned and operated by the borrower sponsor. |
Siegel Suites - San Antonio, TX
The Siegel Suites - San Antonio, TX property is located in the Alamo Heights area of San Antonio, Texas, approximately 5 miles northeast of the San Antonio central business district and approximately 4 miles southeast of the San Antonio International Airport. The Alamo Heights residential area is an established residential neighborhood with many older homes that have been restored. Retail developments such as The Alamo Quarry Market, Terrell Plaza, and North Star Mall and Park North service the area. Fort Sam Houston is located just south of the Siegel Suites - San Antonio, TX property and is one of the largest military medical training facilities in the world, employing more than 27,000 personnel. Also in the area is Trinity University. The median home value within a one-mile radius of the Siegel Suites - San Antonio, TX property is $63,602, with a median year built of 2000.
The Siegel Suites - San Antonio, TX property is located in the San Antonio Metro apartment market and the Alamo Heights submarket. As of the second quarter of 2020, the San Antonio Metro market had an average occupancy of 93.1% with an average market rent of $1,005 per month. The Alamo Heights submarket had an average occupancy of 93.0% with an average market rent of $1,170 per month.
According to the appraisal, the estimated 2020 population within a one-, three- and five-mile radius of the Siegel Suites - San Antonio, TX property was 1,825, 67,646 and 237,391, respectively. The 2020 average household income within the same radii was $34,476, $61,134 and $67,093 respectively.
This is not a research report and was not prepared by any Underwriters research department. Please see additional important information and qualifications at the end of this Term Sheet.
121
| Multifamily – Flexible Apartments | Loan #10 | Cut-off Date Balance: | $21,500,000 |
| Property Addresses - Various | Southern Flexible-Apartment Portfolio | Cut-off Date LTV: | 56.2% |
| UW NCF DSCR: | 2.50x | ||
| UW NOI Debt Yield: | 14.8% |
The following table presents recent leasing data with respect to comparable properties to the Siegel Suites - San Antonio, TX property:
| Comparable Properties - Siegel Suites - San Antonio, TX | ||||||
| Property/Location | Distance | Year Built/Reno. | Occupancy | Total Units | Avg Unit Size (SF) | Avg Monthly Rent Per Unit |
Siegel Suites - San Antonio, TX 3855 North PanAm Expressway San Antonio, TX | N/A | 1963/2020 | 92.9%(1) | 182 | Studio - 290 1BR - 580 | Studio - $906 1BR - $1,209(2) |
The Edge 3735 E. Commerce Street San Antonio, TX | 3.7 miles | 1973/2018 | 94% | 123 | 1BR - 581 | 1BR - $745 |
Avalon 3600 Eisenhauer Road San Antonio, TX | 5.0 miles | 1986/2016 | 96% | 208 | 1BR - 535-603 | 1BR - $799-$839 |
Treehouse Apartments 101 and 102 Arcadia Place Alamo Heights, TX | 6.5 miles | 1972/2004 | 90% | 106 | 1BR - 472-812 | 1BR - $625-$900 |
South Hill Apartments 2715 Lasses Blvd San Antonio, TX | 10.9 miles | 1965 | 96% | 174 | 1BR - 520-720 | 1BR - $685-$760 |
Kennedy Arms 1919 Jamar Street San Antonio, TX | 11.8 miles | 1971 | 100% | 96 | 1BR - 625 | 1BR - $792 |
Budget Suites - Extended Stay Apartments 7880 Fredericksburg Road San Antonio, TX | 14.0 miles | 2002 | 90% | 360 | 1BR - 400 | 1BR - $1,000 |
WoodSpring Suites Fort Sam 6922 Interstate 35 North San Antonio, TX | 7.0 miles | 2006 | 63% | 121 | Studio - 400 | Studio - $1,376 |
Studio 6 3617 N. Pan Am Expressway San Antonio, TX | 2.4 miles | 1970 | 53% | 85 | Studio - 400 | Studio - $1,269 |
Source: Appraisal.
| (1) | Occupancy as of February 1, 2021. |
| (2) | Information based on quoted rates. |
Siegel Select - Bossier City, LA
The Siegel Select - Bossier City, LA property is located in an established neighborhood in Bossier City, Louisiana, approximately 1.5 miles northwest of the Barksdale Air Force Base, which is the largest employer in the region and an economic driver for the area, and is approximately 1 mile east of the Louisiana Boardwalk Outlets, the largest retail/mixed use development in the neighborhood. Also in the area is the Cyber Innovation Center, the anchor of the 3,000-acre National Cyber Research Park, home to governmental agencies, academic institutions and private industries, including technology and defense firms such as Northrop Grumman, Boeing, Lockheed Martin, Computer Science Corporation and Venyu. Single-family residential development within a three-mile radius of the Siegel Select - Bossier City, LA property is generally comprised of tract homes, with the majority of homes constructed between 1950 and 1989 and an average home value of $124,323.
The Siegel Select - Bossier City, LA property is located in the Shreveport/Bossier City metropolitan area and the Bossier City apartment submarket. As of the third quarter of 2020, the Shreveport/Bossier City metropolitan area had an average occupancy of 93.5% and an average market rent of $808 per month, and the Bossier City submarket had an average occupancy of 92.6% and an average market rent of $856 per month.
According to the appraisal, the estimated 2020 population within a one-, three- and five-mile radius of the Siegel Select - Bossier City, LA property was 1,390, 19,944 and 55,803, respectively. The 2020 average household income within the same radii was $111,621, $103,350 and $76,217 respectively.
This is not a research report and was not prepared by any Underwriters research department. Please see additional important information and qualifications at the end of this Term Sheet.
122
| Multifamily – Flexible Apartments | Loan #10 | Cut-off Date Balance: | $21,500,000 |
| Property Addresses - Various | Southern Flexible-Apartment Portfolio | Cut-off Date LTV: | 56.2% |
| UW NCF DSCR: | 2.50x | ||
| UW NOI Debt Yield: | 14.8% |
The following table presents recent leasing data with respect to comparable properties to the Siegel Select - Bossier City, LA property:
| Comparable Properties - Siegel Select - Bossier City, LA | ||||||
| Property/Location | Distance | Year Built/Reno. | Occupancy | Total Units | Avg Unit Size (SF) | Avg Monthly Rent Per Unit |
Siegel Select - Bossier City, LA 3070 East Texas Street Bossier City, LA | N/A | 1995/2018 | 97.5%(1) | 119 | Studio - 240-280 1BR - 320 | Studio - $884-$1,079 1BR - $1,166(2) |
Green Acres Village 2579 Airline Drive Bossier City, LA | 1.8 miles | 1977/2006 | 92.0% | 104 | 1BR - 720-800 | 1BR - $705-$725 |
North Pointe 2604 Benton Road Bossier City, LA | 2.9 miles | 1994 | 94.2% | 103 | 1BR - 713 | 1BR - $809 |
North Gate Square 3310 Industrial Drive Bossier City, LA | 0.9 miles | 1979/2000 | 88.0% | 128 | 1BR - 610 | 1BR - $630 |
Sherwood Forest Apartments 2307 Foster Street Bossier City, LA | 2.0 miles | 1976/2004 | 95.8% | 72 | 1BR - 691 | 1BR - $562 |
Chaparral Apartments 2704 Shed Road Bossier City, LA | 0.8 miles | 1974/2009 | 95.0% | 184 | 1BR - 593-835 | 1BR - $725-$800 |
WoodSpring Suites Shreveport Bossier City 2275 Old Minden Rd Bossier City, LA | 1.5 miles | 2013 | 65.0% | 124 | Studio - 320 | Studio - $1,180 |
Source: Appraisal.
| (1) | Occupancy as of February 1, 2021. |
| (2) | Information based on quoted rates. |
Siegel Suites - Holland, OH
The Siegel Suites - Holland, OH property is located in a suburban community, approximately 9 miles southwest (an approximately 15-minute commute) of the Toledo central business district. Single-family residential homes within a three-mile radius of the Siegel Suites - Holland, OH property have a median year built of 1978 and an average home value of $162,064.
The Siegel Suites - Holland, OH property is located in the Toledo apartment market and the West Toledo submarket. As of the third quarter of 2020, the Toledo market had an average occupancy of 95.8% and an average market rent of $780 per month, and the West Toledo submarket had an average occupancy of 96.3% and an average market rent of $744 per month.
According to the appraisal, the estimated 2020 population within a one-, three- and five-mile radius of the Siegel Suites - Holland, OH property was 4,971, 59,938 and 144,475, respectively. The 2020 average household income within the same radii was $69,684, $69,088 and $77,638 respectively.
This is not a research report and was not prepared by any Underwriters research department. Please see additional important information and qualifications at the end of this Term Sheet.
123
| Multifamily – Flexible Apartments | Loan #10 | Cut-off Date Balance: | $21,500,000 |
| Property Addresses - Various | Southern Flexible-Apartment Portfolio | Cut-off Date LTV: | 56.2% |
| UW NCF DSCR: | 2.50x | ||
| UW NOI Debt Yield: | 14.8% |
The following table presents recent leasing data with respect to comparable properties to the Siegel Suites - Holland, OH property:
| Comparable Properties - Siegel Suites - Holland, OH | ||||||
| Property/Location | Distance | Year Built/Reno. | Occupancy | Total Units | Avg Unit Size (SF) | Avg Monthly Rent Per Unit |
Siegel Suites - Holland, OH 6101 Trust Drive Holland, OH 43528 | N/A | 1987/2019-2020 | 100.0%(1) | 96 | Studio - 419 1BR - 672
| Studio - $1,279 1BR - $1,410(2) |
Extended Stay America 542 West Dussel Drive Maumee, OH | 2.3 miles | 1997 | 84% | 73 | Studio - 400 1BR - 500 | Studio - $1,620 1BR -$2,520 |
Homewood Suites 1410 Arrowhead Road Maumee, OH | 2.3 miles | 1997 | 73% | 78 | 1BR -425-500 | 1BR -$2,436 |
Arbor Landings Apartments 1302 Brookview Drive Toledo, OH | 2.7 miles | 1979 | 94% | 589 | 1BR -540-595 | 1BR - $549-659 |
Hunters Ridge Apartments 3406 Gibralter Heights Drive Toledo, OH | 3.3 miles | 1978 | 99% | 251 | Studio - 417 1BR - 715 | Studio - $529-$596 1BR - $626 |
Orchard Lakes Apartments 2161 Orchard Lakes Pl Toledo, OH | 3.1 miles | 2000 | 99% | 240 | 1BR -709-842 | 1BR - $830-$890 |
Source: Appraisal.
| (1) | Occupancy as of February 1, 2021. |
| (2) | Information based on quoted rates. |
The following table presents certain information relating to the appraisal’s market rent conclusions for the Southern Flexible-Apartment Portfolio Properties:
| Market Rent Summary | ||||
| Siegel Select - Albuquerque, NM | Siegel Suites - San Antonio, TX | Siegel Select - Bossier City, LA | Siegel Suites - Holland, OH | |
| Market Rent (Monthly Per Unit) - Studio | $965 | $906 | $1,009(1) | $1,279 |
| Market Rent (Monthly Per Unit) - 1 BR | $1,043 | $1,209 | $1,166 | $1,410 |
| Market Rent (Monthly Per Unit) - 2 BR | $1,296 | N/A | N/A | N/A |
| (1) | The Siegel Select - Bossier City, LA property offers multiple studio unit configurations. The market rent as shown represents the weighted average rent. |
This is not a research report and was not prepared by any Underwriters research department. Please see additional important information and qualifications at the end of this Term Sheet.
124
| Multifamily – Flexible Apartments | Loan #10 | Cut-off Date Balance: | $21,500,000 |
| Property Addresses - Various | Southern Flexible-Apartment Portfolio | Cut-off Date LTV: | 56.2% |
| UW NCF DSCR: | 2.50x | ||
| UW NOI Debt Yield: | 14.8% |
Operating History and Underwritten Net Cash Flow. The following table presents certain information relating to the historical operating performance and Underwritten Net Cash Flow at the Southern Flexible-Apartment Portfolio Properties:
| Cash Flow Analysis(1) | ||||
| 12/31/2020 | 12/31/2020 T-3 Ann | UW(1) | UW Per Unit | |
| Gross Potential Rent | $7,652,196 | $7,599,112 | $7,757,328 | $12,822 |
| Other Income(2) | $263,635 | $323,124 | $314,508 | $520 |
| Vacancy | ($1,812,345) | ($1,017,408) | ($936,732) | ($1,548) |
| Effective Gross Income | $6,103,486 | $6,904,828 | $7,135,104 | $ 11,794 |
| Real Estate Taxes | $245,091 | $195,904 | $416,163 | $688 |
| Insurance | $117,944 | $134,128 | $128,963 | $213 |
| Other Operating Expenses | $2,860,939 | $3,052,788 | $3,399,208 | $5,619 |
| Total Operating Expenses | $3,223,974 | $3,382,820 | $3,944,334 | $6,520 |
| Net Operating Income | $2,879,512 | $3,522,008 | $3,190,770 | $5,274 |
| Capital Expenditures | $20,569 | $0 | $181,500 | $300 |
| Net Cash Flow | $2,858,943 | $3,522,008 | $3,009,270 | $4,974 |
| Occupancy%(3) | 76.3% | 86.6% | 87.9% | |
| NOI DSCR (IO) | 3.48x | 4.25x | 3.85x | |
| NOI DSCR (P&I) | 2.40x | 2.93x | 2.65x | |
| NCF DSCR (IO) | 3.45x | 4.25x | 3.63x | |
| NCF DSRC (P&I) | 2.38x | 2.93x | 2.50x | |
| NOI Debt Yield | 13.4% | 16.4% | 14.8% | |
| NCF Debt Yield | 13.3% | 16.4% | 14.0% | |
| (1) | Historical information prior to 2020 is not available because the Southern Flexible-Apartment Portfolio Properties were purchased by the borrower sponsor between 2017 and 2019 and underwent significant renovations after their acquisitions. |
| (2) | Other Income includes late fees, surcharges and other miscellaneous income. |
| (3) | Economic occupancy is shown. Physical occupancy as of February 1, 2021 was 94.2%. |
Escrows and Reserves.
Real Estate Taxes and Insurance - The Southern Flexible-Apartment Portfolio Borrower deposited at loan origination $62,972 for property taxes and is required to reserve monthly 1/12 of the estimated annual property taxes (currently $20,890) and 1/12 of the estimated annual insurance premiums (unless the Southern Flexible-Apartment Portfolio Properties are covered by a blanket policy acceptable to the lender, as currently is the case).
Deferred Maintenance - The Southern Flexible-Apartment Portfolio Borrower deposited at loan origination $182,063 for immediate repairs, which amount represents 125% of the estimated cost of such repairs to be completed.
Replacement Reserve - The Southern Flexible-Apartment Portfolio Borrower is required to reserve monthly $12,150 for capital repairs, replacements and improvements.
Lockbox and Cash Management. The Southern Flexible-Apartment Portfolio Mortgage Loan documents require a springing lockbox and springing cash management upon the occurrence of a Cash Sweep Period (as defined below). During a Cash Sweep Period, all rents are required to be deposited directly to the lockbox account and all funds in the lockbox account are required to be swept each business day to a lender-controlled cash management account and disbursed in accordance with the Southern Flexible-Apartment Portfolio Mortgage Loan documents. Also during a Cash Sweep Period, all excess cash flow is required to be held as additional security for the Southern Flexible-Apartment Portfolio Mortgage Loan. If the Southern Flexible-Apartment Portfolio Borrower fails to make any payment due under the Southern Flexible-Apartment Portfolio Mortgage Loan (beyond notice and cure periods) such that the lender draws down on the excess cash collected during a Cash Sweep Period, the Southern Flexible-Apartment Portfolio Borrower is required to deposit cash or a letter of credit in an amount which, when combined with the remaining excess cash, would equal one year of debt service.
A “Cash Sweep Period” means a period commencing when the amortizing debt service coverage ratio is less than 1.50x for one calendar quarter and ending when the amortizing debt service coverage ratio is equal to or greater than 1.50x for two consecutive calendar quarters. If a Cash Sweep Period is triggered, the Southern Flexible-Apartment Portfolio Borrower may at its election deposit with the lender cash or a letter of credit in the amount of one year of debt service in order to postpone a Cash Sweep Period for a period of one year.
Additional Secured Indebtedness (not including trade debts). None.
Mezzanine Loan and Preferred Equity. Not permitted.
Release of Property. At any time following the first two years after the closing date, provided no event of default is continuing and the effect of any release would not result in a failure of the BANK 2020-BNK32 securitization trust to maintain its status as a REMIC trust, the Southern Flexible-Apartment Portfolio Borrower is permitted to release any individual property or properties in connection with an arms-length transaction through partial
This is not a research report and was not prepared by any Underwriters research department. Please see additional important information and qualifications at the end of this Term Sheet.
125
| Multifamily – Flexible Apartments | Loan #10 | Cut-off Date Balance: | $21,500,000 |
| Property Addresses - Various | Southern Flexible-Apartment Portfolio | Cut-off Date LTV: | 56.2% |
| UW NCF DSCR: | 2.50x | ||
| UW NOI Debt Yield: | 14.8% |
defeasance, subject to the following conditions, among others: (i) the Southern Flexible-Apartment Portfolio Mortgage Loan is defeased by an amount equal to 125% of the allocated loan amount specified in the Southern Flexible-Apartment Portfolio Mortgage Loan agreement of the property or properties being released, (ii) if required by the lender, rating agency confirmation has been obtained, and (iii) after giving effect to the release, the remaining property or properties meet (a) a minimum debt yield of the greater of 14% and the debt yield immediately prior to the release based on the trailing twelve month period and (b) a minimum amortizing debt service coverage ratio of the greater of 2.50x and the amortizing debt service coverage ratio immediately prior to the release based on the trailing twelve month period.
Right of First Refusal. None.
Ground Lease. None
Letter of Credit. None.
Terrorism Insurance. The Southern Flexible-Apartment Portfolio Borrower is required to obtain and maintain property insurance that covers perils of terrorism and acts of terrorism in an amount equal to the full replacement cost of the Southern Flexible-Apartment Portfolio Properties and business interruption insurance for twelve months with a six month extended period of indemnity. See “Risk Factors—Risks Relating to the Mortgage Loans—Terrorism Insurance May Not Be Available for All Mortgaged Properties” in the Preliminary Prospectus.
This is not a research report and was not prepared by any Underwriters research department. Please see additional important information and qualifications at the end of this Term Sheet.
126
(THIS PAGE INTENTIONALLY LEFT BLANK)
This is not a research report and was not prepared by any Underwriter’s research department. Please see additional important information and qualifications at the end of this Term Sheet.
127
| Mortgage Loan No. 11 – 250 Bedford Avenue |
| Mortgage Loan Information | Property Information | ||||||
| Mortgage Loan Seller: | MSMCH | Single Asset/Portfolio: | Single Asset | ||||
| Credit Assessment (Moody’s/DBRSM/Fitch): | NR/NR/NR | Location: | Brooklyn, NY 11249 | ||||
| Original Balance: | $20,000,000 | General Property Type: | Retail | ||||
| Cut-off Date Balance: | $20,000,000 | Detailed Property Type: | Anchored | ||||
| % of Initial Pool Balance: | 2.2% | Title Vesting: | Fee | ||||
| Loan Purpose: | Acquisition | Year Built/Renovated: | 2010/N/A | ||||
| Borrower Sponsor: | Abraham Bennun | Size: | 52,032 SF | ||||
| Guarantor: | Abraham Bennun | Cut-off Date Balance Per SF: | $384 | ||||
| Mortgage Rate: | 3.2650% | Maturity Date Balance Per SF: | $384 | ||||
| Note Date: | 12/23/2020 | Property Manager: | Triton Realty Group, LLC | ||||
| First Payment Date: | 2/1/2021 | (borrower-related) | |||||
| Maturity Date: | 1/1/2031 | ||||||
| Original Term to Maturity: | 120 months | ||||||
| Original Amortization Term: | 0 months | ||||||
| IO Period: | 120 months | Underwriting and Financial Information(6) | |||||
| Seasoning: | 2 months | UW NOI: | $1,763,034 | ||||
| Prepayment Provisions(1): | LO (26); DEF (90); O (4) | UW NOI Debt Yield: | 8.8% | ||||
| Lockbox/Cash Mgmt Status(2): | Hard/Springing | UW NOI Debt Yield at Maturity: | 8.8% | ||||
| Additional Debt Type: | No | UW NCF DSCR: | 2.45x | ||||
| Additional Debt Balance: | N/A | Most Recent NOI: | $1,643,841 (12/31/2020) | ||||
| Future Debt Permitted (Type): | No (N/A) | 2nd Most Recent NOI: | $1,900,652 (12/31/2019) | ||||
| Reserves | 3rd Most Recent NOI: | $1,802,345 (12/31/2018) | |||||
| Type | Initial | Monthly | Cap | Most Recent Occupancy(7): | 100.0% (1/1/2021) | ||
| RE Taxes: | $0 | $5,592 | N/A | 2nd Most Recent Occupancy: | 100.0% (12/31/2019) | ||
| Insurance(3): | $0 | Springing | N/A | 3rd Most Recent Occupancy: | 100.0% (12/31/2018) | ||
| Replacement Reserve: | $0 | $434 | N/A | Appraised Value (as of): | $36,300,000 (12/2/2020) | ||
| TI/LC Reserve(4): | $45,000 | Springing | $43,786 | Appraised Value Per SF: | $698 | ||
| Parking Reserve(5): | $125,000 | $0 | N/A | Cut-off Date LTV Ratio: | 55.1% | ||
| Maturity Date LTV Ratio: | 55.1% | ||||||
| Sources and Uses | ||||||
| Sources | Proceeds | % of Total | Uses | Proceeds | % of Total | |
| Loan Amount: | $20,000,000 | 60.7% | Purchase Price: | $31,949,615 | 96.9% | |
| Borrower Equity: | $12,958,618 | 39.3% | Closing Costs: | $839,003 | 2.5% | |
| Reserves: | $170,000 | 0.5% | ||||
| Total Sources: | $32,958,618 | 100.0% | Total Uses: | $32,958,618 | 100.0% | |
| (1) | The 250 Bedford Avenue Mortgage Loan (as defined below) is also subject to partial prepayment in connection with a partial release, as described below under “Partial Release”. |
| (2) | The 250 Bedford Avenue Mortgage Loan requires a hard lockbox for the two retail condominium units, and a soft lockbox for the garage condominium unit, at the 250 Bedford Avenue Property (as defined below). |
| (3) | Monthly insurance reserves are springing upon any of the following: (i) an event of default, (ii) failure of the borrower to provide written evidence of blanket policy and (iii) failure of the borrower to provide receipts for the payment of insurance premiums at least 10 days prior to the expiration of the applicable policy. |
| (4) | Monthly TI/LC reserves ($1,824) are springing if the reserve balance falls below the cap or the entire initial deposit amount is disbursed. |
| (5) | See description of the parking reserve under “The Property” below. |
| (6) | The novel coronavirus pandemic is an evolving situation and could impact the 250 Bedford Avenue Mortgage Loan more severely than assumed in the underwriting of the 250 Bedford Avenue Mortgage Loan and could adversely affect the NOI, NCF and occupancy information, as well as the appraised value and the DSCR, LTV and Debt Yield metrics presented above and herein. See "Risk Factors-—Risks Related to Market Conditions and Other External Factors—The Coronavirus Pandemic Has Adversely Affected the Global Economy and Will Likely Adversely Affect the Performance of the Mortgage Loans" in the Preliminary Prospectus. |
| (7) | Excludes garage space, as to which no income has been underwritten. |
The Mortgage Loan. The eleventh largest mortgage loan (the “250 Bedford Avenue Mortgage Loan”) is evidenced by a promissory note in the original principal amount of $20,000,000 and secured by a first priority fee mortgage encumbering a retail property located in Brooklyn, New York (the “250 Bedford Avenue Property”).
The Borrower and the Borrower Sponsor. The borrower is Bensing 250 LLC (the “250 Bedford Avenue Borrower”), a single-purpose Delaware limited liability company with no independent director in its organizational structure. The non-recourse carveout guarantor and borrower sponsor is Abraham Bennun. The 250 Bedford Avenue Borrower is managed by Abraham Bennun and owned by Ethika Realty Holdings, LLC (50.0%) and Cedarbrant LLC (50.0%). Abraham Bennun has been an active real estate investor and developer since 2003. As the founder and managing partner of Ethika Capital, LLC, Mr. Bennun focuses on development projects in New York City. Mr. Bennun originally developed the 250 Bedford Avenue Property and sold it to the current seller, before re-acquiring it in connection with the origination of the 250 Bedford Avenue Mortgage Loan.
This is not a research report and was not prepared by any Underwriters research department. Please see additional important information and qualifications at the end of this Term Sheet.
128
| Retail - Anchored | Loan #11 | Cut-off Date Balance: | $20,000,000 |
| 129-139 North 3rd Street a/k/a 248-252 | 250 Bedford Avenue | Cut-off Date LTV: | 55.1% |
| Bedford Avenue a/k/a 195-205 Berry Street | U/W NCF DSCR: | 2.45x | |
| Brooklyn, NY 11249 | U/W NOI Debt Yield: | 8.8% |
The Property. The 250 Bedford Avenue Property is comprised of three condominium units (totaling 52,032 SF) in Brooklyn, New York. The collateral for the 250 Bedford Avenue Mortgage Loan is comprised of two commercial condominium units (21,893 SF) and one parking garage condominium unit (142 spaces), which has been underwritten as vacant. The 250 Bedford Avenue Property is situated at the ground, second, and below grade levels of a mid-rise condominium project built in 2010 with a total site size of approximately 0.95 acres and known as Williamsburg THS Condominum (the “Condominium”). In addition to the 250 Bedford Avenue Property, the Condominium is comprised of (i) a third commercial unit, which is owned by an affiliate of the borrower sponsor (the “Non-Collateral Commercial Unit”), (ii) a residential unit known as Tower Unit 1, which contains 44 residential apartments, (iii) a residential unit known as Tower Unit 2, which contains 28 residential apartments, and (iv) 12 townhouse units. The two commercial condominium units included in the 250 Bedford Avenue Property are currently 100.0% leased to two tenants: Duane Reade (16,500 SF; 31.7% NRA / 51.2% of underwritten rent through December 31, 2030) and HSBC Bank USA (5,393 SF / 10.4% NRA / 48.8% of underwritten rent through December 31, 2025). Duane Reade has been in occupancy at the 250 Bedford Avenue Property since 2010 and currently leases space on the ground floor (2,500 SF) and the lower level (14,000 SF). HSBC Bank USA has been in occupancy at the 250 Bedford Avenue Property since 2010 and currently leases space on the lower level (299 SF), on the ground floor (2,829 SF) and the second floor (2,265 SF). HSBC Bank USA recently renewed its lease in September 2020 for an additional five years.
The parking condominium unit is a 142 space underground parking garage with 30,139 SF of space, of which 1,560 SF is at grade level. Prior to origination, the parking condominium unit was leased to QP Berry Street LLC. At or prior to origination, the 250 Bedford Avenue Borrower terminated the lease with QP Berry Street LLC, which, according to the 250 Bedford Avenue Borrower, was delinquent in payments. At origination, the 250 Bedford Avenue Borrower and QP Berry Street LLC were engaged in litigation regarding such termination; however, such litigation was settled on January 7, 2021, and QP Berry Street LLC thereafter vacated the garage and was replaced by 197 Berry Street Garage LLC, an affiliate of City Parking, which entered into a parking management agreement with the 250 Bedford Avenue Borrower. At origination, the 250 Bedford Avenue Borrower reserved $125,000 with the lender to be held until such time as either (A) the 250 Bedford Avenue Borrower enters into a lease reasonably approved by the lender with a Qualified Parking Manager (as defined below) for the entirety of the garage unit and such Qualified Parking Manager is in physical possession of its premises, open to the public for business during customary hours and paying full unabated rent, and such lease requires annual payments of not less than $180,000 of gross rent or (B) the 250 Bedford Avenue Borrower enters into a parking management agreement in accordance with the loan documents with a Qualified Parking Manager, and following the effectiveness of the parking management agreement, parking operations income will be equal to the cumulative amount of at least $45,000 over a consecutive three-month period. “Qualified Parking Manager” means either (i) any of City Parking, Central Parking Systems, Garage Management Company, Manhattan Parking Group, Imperial Parking, Champion Parking, Edison ParkFast, Herz Corporation (Parking) or LAZ, or (ii) a reputable and experienced parking management organization approved by the lender (which may be conditioned upon receipt of a rating agency confirmation). The conditions to release of the parking reserve have not been satisfied. The parking condominium unit has been underwritten as vacant.
The 250 Bedford Avenue Property has a 25.1857% interest in the Condominium, of which 12.0941% is attributable to the garage unit. The Condominium documents provide for a sub-board (the “Non-Residential Board”) that governs the non-residential portion of the Condominium (which is comprised of (i) the two commercial units and the garage unit that comprise the 250 Bedford Property, and (ii) the Non-Collateral Commercial Unit). The Non-Residential Board has three members, as to which two members are appointed by the owners of the units comprising the 250 Bedford Property, and the third member is appointed by the owner of the Non-Collateral Commercial Unit. The Condominium documents further provide for a condominium board with respect to the entire Condominium, which is comprised of five members. A majority of the Non-Residential Board has the right to appoint one member of such five member condominium board. Accordingly, the 250 Bedford Avenue Borrower does not control the Condominium.
The 250 Bedford Avenue Property benefits from a 25-year Industrial and Commercial Incentive Program (“ICIP”) tax abatement. The ICIP abatement commenced in the tax year of 2010/2011 and expires in 2034/2035, providing the 250 Bedford Avenue Borrower a 100% exemption from any increases in the 250 Bedford Avenue Property’s real estate taxes for the first 16 years (i.e. through the 2026/2027 tax year), then phasing out the exemption by 10% every year thereafter. According to the appraisal, the condominium unit leased to Duane Reade is expected to receive an estimated tax savings due to the ICIP of $154,411 in the 2020/2021 tax year, and has an estimated net present value of tax savings of $1,403,388; the condominium unit leased to HSBC Bank USA is expected to receive an estimated tax savings due to the ICIP of $80,780 in the 2020/2021 tax year, and has an estimated net present value of tax savings of $734,178; and the garage unit is expected to receive an estimated tax savings due to the ICIP of $132,057 in the 2020/2021 tax year, and has an estimated net present value of tax savings of $1,200,217.
The following table presents a summary of the major tenants at the 250 Bedford Avenue Property:
| Tenant Summary(1) | ||||||||||||
| Tenant Name | Credit Rating (Fitch/ Moody’s/S&P)(2) | Tenant SF | Approx.% of SF | Annual UW Rent | Annual UW Rent PSF | Most Recent Sales | ||||||
| App. % of Total Annual UW Rent | $ | PSF | Occ. Cost % | Term. Option | Renewal Options | Lease Expiration | ||||||
| Duane Reade | BBB-/Baa2/BBB | 16,500 | 31.7% | $1,016,402 | $61.60 | 51.2% | NAV | NAV | NAV | N | 2 x 5 year | 12/31/2030 |
| HSBC Bank USA | A+/A2/A- | 5,393 | 10.4% | $967,951 | $179.48 | 48.8% | NAV | NAV | NAV | N | 2 x 5 year | 12/31/2025 |
| Subtotal/Wtd. Avg. | 21,893 | 42.1% | $1,984,353 | $90.64 | 100.0% | |||||||
| Other Tenants | 0 | 0.0% | $0 | $0.00 | 0.0% | |||||||
| Vacant Space(3) | 30,139 | 57.9% | $0.00 | $0.00 | 0.0% | |||||||
| Total/Wtd. Avg. | 52,032 | 100.0% | $1,984,353 | $90.64 | 100.0% | |||||||
| (1) | Information is based on the underwritten rent roll as of January 1, 2021. |
| (2) | Certain ratings are those of the parent company whether or not the parent guarantees the lease. |
| (3) | Vacant space is entirely comprised of the parking condominium, as to which no income has been underwritten. |
This is not a research report and was not prepared by any Underwriters research department. Please see additional important information and qualifications at the end of this Term Sheet.
129
| Retail - Anchored | Loan #11 | Cut-off Date Balance: | $20,000,000 |
| 129-139 North 3rd Street a/k/a 248-252 | 250 Bedford Avenue | Cut-off Date LTV: | 55.1% |
| Bedford Avenue a/k/a 195-205 Berry Street | U/W NCF DSCR: | 2.45x | |
| Brooklyn, NY 11249 | U/W NOI Debt Yield: | 8.8% |
The following table presents certain information relating to the lease rollover at the 250 Bedford Avenue Property:
| Lease Rollover Schedule(1)(2) | ||||||||
| Year | # of Leases Rolling | SF Rolling | Annual UW Rent PSF Rolling | Approx. % of Total SF Rolling | Approx. Cumulative % of SF Rolling | Total UW Rent Rolling | Approx. % of Total Rent Rolling | Approx. Cumulative % of Total Rent Rolling |
| 2021 | 0 | 0 | $0.00 | 0.0% | 0.0% | $0 | 0.0% | 0.0% |
| 2022 | 0 | 0 | $0.00 | 0.0% | 0.0% | $0 | 0.0% | 0.0% |
| 2023 | 0 | 0 | $0.00 | 0.0% | 0.0% | $0 | 0.0% | 0.0% |
| 2024 | 0 | 0 | $0.00 | 0.0% | 0.0% | $0 | 0.0% | 0.0% |
| 2025 | 1 | 5,393 | $179.48 | 10.4% | 10.4% | $967,951 | 48.8% | 48.8% |
| 2026 | 0 | 0 | $0.00 | 0.0% | 10.4% | $0 | 0.0% | 48.8% |
| 2027 | 0 | 0 | $0.00 | 0.0% | 10.4% | $0 | 0.0% | 48.8% |
| 2028 | 0 | 0 | $0.00 | 0.0% | 10.4% | $0 | 0.0% | 48.8% |
| 2029 | 0 | 0 | $0.00 | 0.0% | 10.4% | $0 | 0.0% | 48.8% |
| 2030 | 1 | 16,500 | $61.60 | 31.7% | 42.1% | $1,016,402 | 51.2% | 100.0% |
| 2031 | 0 | 0 | $0.00 | 0.0% | 42.1% | $0 | 0.0% | 100.0% |
| 2032 & Beyond | 0 | 0 | $0.00 | 0.0% | 42.1% | $0 | 0.0% | 100.0% |
| Vacant(3) | 0 | 30,139 | $0.00 | 57.9% | 100.0% | $0 | 0.0% | 100.0% |
| Total/Wtd. Avg. | 2 | 52,032 | $90.64 | 100.0% | $1,984,353 | 100.0% | ||
| (1) | Information is based on the underwritten rent roll as of January 1, 2021. |
| (2) | Certain tenants may have lease termination options that are exercisable prior to the stated expiration date of the subject lease or leases, which are not considered in the lease rollover schedule. |
| (3) | Vacant space is entirely comprised of the parking condominium, as to which no income has been underwritten. |
COVID-19 Update. As of March 2, 2021, the 250 Bedford Avenue Mortgage Loan is current as of the March debt service payment and is not subject to any forbearance, modification or debt service relief request. As of February 16, 2021, the 250 Bedford Avenue Borrower has reported that the 250 Bedford Avenue Property is open and operating with both of the two retail tenants having paid their full February 2021 rent payments. No rent relief was requested by either of the two retail tenants.
The Market. The 250 Bedford Avenue Property is located in Brooklyn, New York within the Brooklyn market and the Williamsburg submarket. The 250 Bedford Avenue Property is located in a mixed-use neighborhood that is generally improved with a variety of low-rise residential buildings and commercial buildings. Bedford Avenue is the prime retail corridor in the market. McCarren Park is located less than a mile northeast of the 250 Bedford Avenue Property and serves as the boundary between the Williamsburg and Greenpoint neighborhoods. The 35-acre park is home to the McCarren Park Pool and Play Center, which was completed in 2012 along with baseball fields, basketball courts, football fields, soccer fields, handball courts, tennis courts, playgrounds and bocce courts. Primary access to the area is provided by the Bedford Avenue subway station located between North 6th and North 7th Streets, which services the L line. The L line travels east and west throughout Brooklyn, offering connections at several stops on 14th Street in Manhattan. According to the appraisal, the 2020 estimated population within a 0.25-, 0.5- and one-mile radius of the 250 Bedford Avenue Property was 13,859, 40,802 and 146,834, respectively. The 2020 estimated median household income within a 0.25-, 0.5- and one-mile radius of the 250 Bedford Avenue Property was $102,809, $103,216 and $67,730, respectively.
The following table presents recent leasing data for tenants at comparable retail properties with respect to the 250 Bedford Avenue Property:
| Comparable Retail Property Summary (Anchor and Junior Anchor Tenants) | |||||||
Property Name/ City, State | NRA | Lease Type | Tenant Name | Lease Area (SF) | Lease Date | Lease Term (Yrs.) | Rent PSF |
250 Bedford Avenue (subject) Brooklyn, New York | 52,032 | Modified Gross | Duane Reade HSBC Bank USA | 16,500 5,393 | June 2010 Jan. 2021 | 20 4 | $61.60 $179.48 |
166 Berry St. Brooklyn, New York | 6,200 | NNN | Bank of America | 6,200 | Oct. 2020 | 20 | $233.87 |
85 North 6th St. Brooklyn, New York | 18,100 | Modified Gross | Santander Bank | 9,800 | Oct. 2019 | 10 | $117.96 |
241 Bedford Ave. Brooklyn, New York | 58,678 | Modified Gross | Alo Yoga | 10,084 | July 2018 | 10 | $141.31 |
102 North 6th St. Brooklyn, New York | 11,095 | Modified Gross | Everlane | 8,655 | Jan. 2018 | 11 | $94.53 |
129 North 6th St. Brooklyn, New York | 11,250 | Modified Gross | Lululemon Athletic | 3,450 | Oct. 2017 | 10 | $181.00 |
180 Bedford Ave. Brooklyn, New York | 7,200 | Modified Gross | JP Morgan Chase | 5,550 | April 2017 | 10 | $306.31 |
Source: Appraisal.
This is not a research report and was not prepared by any Underwriters research department. Please see additional important information and qualifications at the end of this Term Sheet.
130
| Retail - Anchored | Loan #11 | Cut-off Date Balance: | $20,000,000 |
| 129-139 North 3rd Street a/k/a 248-252 | 250 Bedford Avenue | Cut-off Date LTV: | 55.1% |
| Bedford Avenue a/k/a 195-205 Berry Street | U/W NCF DSCR: | 2.45x | |
| Brooklyn, NY 11249 | U/W NOI Debt Yield: | 8.8% |
The following table presents certain information relating to the appraisal’s market rent conclusion for the 250 Bedford Avenue Property:
| Market Rent Summary | ||||
| Market Rent (PSF) | Lease Term (Months) | Lease Type (Reimbursements) | Rent Increase Projection | |
| Retail (Duane Reade Space): | $70.00 | 120 | Modified Gross | 10% every 5 years |
| Retail (HSBC Bank USA Space) | $170.00 | 120 | Modified Gross | 10% every 5 years |
| Parking Garage Space: | $8.25 | 120 | Modified Gross | 2.00%/year |
Source: Appraisal.
Operating History and Underwritten Net Cash Flow. The following table presents certain information relating to the historical operating performance and Underwritten Net Cash Flow of the 250 Bedford Avenue Property:
| Cash Flow Analysis(1)(2) | ||||||
| 2017 | 2018 | 2019 | 2020 | UW(3) | UW PSF | |
| Gross Potential Rent | $1,768,399 | $1,773,535 | $1,778,799 | $1,620,672 | $2,138,103 | $41.09 |
| Total Recoveries | $23,156 | $23,061 | $23,097 | $23,134 | $87,096 | $1.67 |
| Other Income | $62 | $5,749 | $98,756 | $35 | $0 | $0.00 |
| Less Vacancy & Credit Loss | $0 | $0 | $0 | $0 | ($192,970) | ($3.71) |
| Effective Gross Income | $1,791,617 | $1,802,345 | $1,900,652 | $1,643,841 | $2,032,229 | $39.06 |
| Real Estate Taxes(4) | $0 | $0 | $0 | $0 | $138,521 | $2.66 |
| Insurance | $0 | $0 | $0 | $0 | $15,610 | $0.30 |
| Other Expenses | $0 | $0 | $0 | $0 | $115,064 | $2.21 |
| Total Expenses | $0 | $0 | $0 | $0 | $269,195 | $5.17 |
| Net Operating Income | $1,791,617 | $1,802,345 | $1,900,652 | $1,643,841 | $1,763,034 | $33.88 |
| CapEx | $0 | $0 | $0 | $0 | $6,834 | $0.13 |
| TI/LC | $0 | $0 | $0 | $0 | $136,844 | $2.63 |
| Net Cash Flow | $1,791,617 | $1,802,345 | $1,900,652 | $1,643,841 | $1,619,356 | $31.12 |
| Occupancy % | 100.0% | 100.0% | 100.0% | 100.0% | 92.8%(5) | |
| NOI DSCR | 2.71x | 2.72x | 2.87x | 2.48x | 2.66x | |
| NCF DSCR | 2.71x | 2.72x | 2.87x | 2.48x | 2.45x | |
| NOI Debt Yield | 9.0% | 9.0% | 9.5% | 8.2% | 8.8% | |
| NCF Debt Yield | 9.0% | 9.0% | 9.5% | 8.2% | 8.1% | |
| (1) | For the avoidance of doubt, no COVID-19 specific adjustments have been made to the lender underwriting. |
| (2) | The seller of the Mortgaged Property did not provide operating statements for the Mortgaged Property, but instead provided real property income and expense statements (“RPIEs”) that were used for tax filing purposes, and accordingly, the historic information set forth above is based on such seller-provided RPIEs. Expenses set forth in such RPIEs have been excluded from the presentation of historic cash flows. |
| (3) | UW Gross Potential Rent is based on the rent roll as of January 1, 2021, and includes straight lined rent for HSBC and Duane Reade during the lease terms. |
| (4) | UW Real Estate Taxes represents the 10-year average of the real estate taxes after giving effect to the ICIP tax abatement benefit at the 250 Bedford Avenue Property. |
| (5) | UW Occupancy % represents economic occupancy. The retail space at the 250 Bedford Avenue Property is 100% occupied as of January 1, 2021. |
Partial Release. The 250 Bedford Avenue Mortgage Loan documents allow for the release of the parking garage condominium unit in connection with a sale of the unit to an affiliate of the 250 Bedford Avenue Borrower or the non-recourse carveout guarantor, for use as either a parking garage or a future development which is not incompatible with the use of the remainder of the 250 Bedford Avenue Property as retail storefronts, upon prepayment of the 250 Bedford Avenue Mortgage Loan in an amount equal to $1.3 million (together with, if prior to the open period, a prepayment fee equal to the greater of 1.00% of the amount prepaid and a yield maintenance premium), provided that, among other conditions, (i) such release is in compliance with the terms of all leases, condominium documents and other material agreements applicable to the remaining 250 Bedford Avenue Property, including, without limitation, provisions relating to the availability of parking, and (ii) certain REMIC related conditions are satisfied.
This is not a research report and was not prepared by any Underwriters research department. Please see additional important information and qualifications at the end of this Term Sheet.
131
| Mortgage Loan No. 12 – Lake Region Portfolio |
| Mortgage Loan Information | Mortgaged Property Information | ||||||
| Mortgage Loan Seller: | WFB | Single Asset/Portfolio: | Portfolio | ||||
| Credit Assessment (Moody’s/DBRSM/Fitch): | NR/NR/NR | Location: | Various, MN | ||||
| Original Balance: | $18,700,000 | General Property Type: | Self Storage | ||||
| Cut-off Date Balance: | $18,700,000 | Detailed Property Type: | Self Storage | ||||
| % of Initial Pool Balance: | 2.1% | Title Vesting: | Fee | ||||
| Loan Purpose: | Acquisition | Year Built/Renovated: | Various / N/A | ||||
| Borrower Sponsor(1): | Westport Properties, Inc. | Size: | 297,498 SF | ||||
| Guarantor: | Westport/TR Storage Venture III LLC | Cut-off Date Balance per SF: | $63 | ||||
| Mortgage Rate: | 3.4900% | Maturity Date Balance per SF: | $63 | ||||
| Note Date: | 2/4/2021 | Property Manager: | Westport Properties, Inc. | ||||
| First Payment Date: | 3/11/2021 | (borrower-related) | |||||
| Maturity Date: | 2/11/2031 | ||||||
| Original Term to Maturity: | 120 months | Underwriting and Financial Information(5) | |||||
| Original Amortization Term: | 0 months | UW NOI: | $1,954,827 | ||||
| IO Period: | 120 months | UW NOI Debt Yield: | 10.5% | ||||
| Seasoning: | 1 month | UW NOI Debt Yield at Maturity: | 10.5% | ||||
| Prepayment Provisions: | LO (25); DEF (88); O (7) | UW NCF DSCR: | 2.88x | ||||
| Lockbox/Cash Mgmt Status: | Springing/Springing | Most Recent NOI: | $2,180,723 (12/31/2020) | ||||
| Additional Debt Type: | N/A | 2nd Most Recent NOI: | $2,176,038 (12/31/2019) | ||||
| Additional Debt Balance: | N/A | 3rd Most Recent NOI: | $2,129,192 (12/31/2018) | ||||
| Future Debt Permitted (Type): | No (N/A) | Most Recent Occupancy: | 90.8% (2/1/2021) | ||||
| Reserves | 2nd Most Recent Occupancy(6): | 92.2% (12/31/2020) | |||||
| Type | Initial | Monthly | Cap | 3rd Most Recent Occupancy(6): | 94.0% (12/31/2019) | ||
| RE Tax: | $217,960 | $43,592 | N/A | Appraised Value (as of)(7): | $30,750,000 (Various) | ||
| Insurance: | $0 | Springing(2) | N/A | Appraised Value per SF: | $103 | ||
| Replacement Reserve: | $0 | $4,103 | $147,708(3) | Cut-off Date LTV Ratio: | 60.8% | ||
| Environmental Reserve: | $83,000(4) | $0 | N/A | Maturity Date LTV Ratio: | 60.8% | ||
| Sources and Uses | ||||||
| Sources | Proceeds | % of Total | Uses | Proceeds | % of Total | |
| Loan Amount: | $18,700,000 | 59.4% | Purchase Price: | $30,700,000 | 97.6% | |
| Borrower Equity: | $12,756,648 | 40.6% | Closing Costs: | $455,688 | 1.4% | |
| Reserves: | $300,960 | 1.0% | ||||
| Total Sources: | $31,456,648 | 100.0% | Total Uses: | $31,456,648 | 100.0% | |
| (1) | See “The Borrowers and the Borrower Sponsor” section. |
| (2) | Springing upon any of the following: (i) an event of default; (ii) the properties not being covered under a blanket policy acceptable to the lender; or (iii) the borrower does not provide the lender with evidence of renewal and payment of insurance premiums at least 30 days prior to policy expiration. |
| (3) | Monthly deposits are required beyond the cap upon (i) an event of default or (ii) the property not being properly maintained as determined by the lender. |
| (4) | Represents 125% of the upper range of the environmental consultant’s estimate for vapor remediation at the US Storage Centers – St. Paul Property. See "Description of the Mortgage Pool--Environmental Considerations" in the Preliminary Prospectus. |
| (5) | The novel coronavirus pandemic is an evolving situation and could impact the Lake Region Portfolio Mortgage Loan more severely than assumed in the underwriting of the Lake Region Portfolio Mortgage Loan and could adversely affect the NOI, NCF and occupancy information, as well as the appraised value and the DSCR, LTV and Debt Yield metrics presented above and herein. See " Risk Factors—Risks Related to Market Conditions and Other External Factors—Coronavirus Pandemic Has Adversely Affected the Global Economy and Will Likely Adversely Affect the Performance of the Mortgage Loans" in the Preliminary Prospectus. |
| (6) | Represents the average occupancy rate over the course of each year. |
| (7) | Appraised Values are as of dates ranging from September 21, 2020 to September 22, 2020. |
The Mortgage Loan. The twelfth largest mortgage loan (the “Lake Region Portfolio Mortgage Loan”) is evidenced by a promissory note secured by a first mortgage encumbering the fee interests in four self storage properties in Minnesota (the “Lake Region Portfolio Properties”).
The Borrowers and the Borrower Sponsors. The borrowers are Westport Duluth Self Storage, LLC, Westport St. Paul Self Storage, LLC, and Westport Brainerd Self Storage, LLC, each a Delaware limited liability company and single purpose entity with no independent directors. The non-recourse carveout guarantor of the Lake Region Portfolio Mortgage Loan is Westport/TR Storage Venture III LLC, which is a joint venture between Westport Properties, Inc. (“Westport”) and the Teachers Retirement System of the State of Illinois and is the sole member of the borrowers. The borrower sponsor is Westport. However, as required by the loan documents, after a change of control resulting from the removal of Westport as manager of the guarantor (the sole member of the borrowers), TR Storage LLC, an affiliate of the Teachers Retirement System of the State of Illinois, would replace Westport as the borrower sponsor.
This is not a research report and was not prepared by any Underwriters research department. Please see additional important information and qualifications at the end of this Term Sheet.
132
| Self Storage – Self Storage | Loan #12 | Cut-off Date Balance: | $18,700,000 | |
| Various | Lake Region Portfolio | Cut-off Date LTV: | 60.8% | |
| Various, MN | UW NCF DSCR: | 2.88x | ||
| UW NOI Debt Yield: | 10.5% |
Westport, which was founded in 1985, operates 140 self storage locations, with ownership in 90 facilities, totaling more than 9.0 million SF throughout the United States. Based in Irvine, California, the leadership team has over 100 years of experience in the real estate, construction, development, management, and self storage industries. Westport manages over $1.5 billion in assets for institutional investors and property management clients.
The Portfolio. The Lake Region Portfolio Properties comprise four self storage properties totaling 297,498 SF of NRA, including 1,955 traditional self storage units and 41 rentable parking spaces (approximately 1.3% of the underwritten effective gross income) located throughout Minnesota. The properties are managed by Westport Properties, Inc. and are operated under their US Storage Centers brand. Approximately 83.8% of the traditional self storage units are climate controlled, with the percentage of climate controlled units at the individual properties ranging from 39.3% to 100.0% (excluding US Storage Center – Pine Tree, which has no climate controlled units). Built between 1998 and 2009, each of the Lake Region Portfolio Properties is situated on a site ranging in size from 3.0 acres to 28.9 acres. As of February 1, 2021, the Lake Region Portfolio Properties were 90.8% occupied, with individual property occupancy rates ranging from 86.2% to 99.3%. Since 2017, the Lake Region Portfolio Properties have averaged 93.4% occupancy, never dropping below 92.2% in the aggregate.
The following table presents certain information relating to the Lake Region Portfolio Properties:
| Property Summary | ||||||
| Property Name | Allocated Cut-off Date Balance | % of ALA | Appraised Value | Allocated LTV | UW NCF | % UW NCF |
| US Storage Centers - Duluth | $9,180,000 | 49.1% | $15,100,000 | 60.8% | $977,455 | 51.3% |
| US Storage Centers - St. Paul | $5,565,000 | 29.8% | $9,150,000 | 60.8% | $508,918 | 26.7% |
| US Storage Centers - Brainerd | $3,620,000 | 19.4% | $5,950,000 | 60.8% | $382,718 | 20.1% |
| US Storage Centers - Pine Tree | $335,000 | 1.8% | $550,000 | 60.9% | $36,493 | 1.9% |
| Total/Wtd. Avg. | $18,700,000 | 100.0% | $30,750,000 | 60.8% | $1,905,584 | 100.0% |
The Properties.
US Storage Centers - Duluth Property. The US Storage Centers - Duluth Property is an 849-unit (all conventional self storage units), 120,035 SF self storage facility located in Duluth, Minnesota, situated on a 6.0-acre site. The US Storage Centers - Duluth Property comprises 3 two-story buildings constructed in 2004 and 2007. Amenities include surveillance cameras, individual alarms, individual locks, keypad entry, on-site management and 100% of the units are climate controlled. As of February 1, 2021, the US Storage Centers - Duluth Property was 94.2% occupied and has averaged 94.3% occupancy since 2017.
US Storage Centers – St. Paul Property. The US Storage Centers – St. Paul Property is a 667-unit (including 41 parking units), 101,628 SF self storage facility located in Saint Paul, Minnesota, situated on a 3.0-acre site. The US Storage Centers – St. Paul Property comprises 1 two-story building constructed in 2009. Amenities include surveillance cameras, individual alarms, individual locks, keypad entry, on-site management and 100% of the units are climate controlled. As of February 1, 2021, the US Storage Centers – St. Paul Property was 86.2% occupied and has averaged 90.5% occupancy since 2017.
US Storage Centers - Brainerd Property. The US Storage Centers - Brainerd Property is a 415-unit (all conventional self storage units), 63,915 SF self storage facility located in Brainerd, Minnesota, situated on a 28.9-acre site. The US Storage Centers - Brainerd Property comprises 4 one-story buildings constructed in 2002. Amenities include surveillance cameras, on-site management and climate controlled units (39.3%). As of February 1, 2021, the US Storage Centers – Brainerd Property was 90.1% occupied and has averaged 92.0% occupancy since 2017.
US Storage Centers – Pine Tree Property. The US Storage Centers – Pine Tree Property is a 65-unit (all conventional self storage units), 11,920 SF self storage facility located in Brainerd, Minnesota, situated on a 13.6-acre site. The US Storage Centers – Pine Tree Property comprises 2 one-story buildings constructed in 1998. Amenities include surveillance cameras and on-site management. As of February 1, 2021, the US Storage Centers – Pine Tree Property was 99.3% occupied and has averaged 97.7% occupancy since 2017.
The following table presents information with respect to the unit mix of the Lake Region Portfolio Properties:
| Property Name | Year Built/ Renovated | Net Rentable Area (SF) | % GLA | Self Storage Units | % Climate Controlled | Parking Units | Current Occupancy (2/1/2021) |
| US Storage Centers - Duluth | 2004-2007/N/A | 120,035 | 40.3% | 849 | 100.0% | 0 | 94.2% |
| US Storage Centers - St. Paul | 2009/N/A | 101,628 | 34.2% | 626 | 100.0% | 41 | 86.2% |
| US Storage Centers - Brainerd | 2002/N/A | 63,915 | 21.5% | 415 | 39.3% | 0 | 90.1% |
| US Storage Centers - Pine Tree | 1998/N/A | 11,920 | 4.0% | 65 | 0.0% | 0 | 99.3% |
| Total/Wtd. Avg. | 297,498 | 100.0% | 1,955 | 83.8% | 41 | 90.8% |
COVID 19 Update. The Lake Region Portfolio Mortgage Loan is not subject to any forbearance, modification or debt service relief requests and the first payment date is March 11, 2021. As of March 1, 2021, the Lake Region Portfolio Properties are open and operating. As of February 28, 2021, accounts receivable (greater than 30 days outstanding) totaled $9,377 (0.3% of total annual underwritten base rent) attributable to 1.1% of total units (1.2% of occupied units).
This is not a research report and was not prepared by any Underwriters research department. Please see additional important information and qualifications at the end of this Term Sheet.
133
| Self Storage – Self Storage | Loan #12 | Cut-off Date Balance: | $18,700,000 | |
| Various | Lake Region Portfolio | Cut-off Date LTV: | 60.8% | |
| Various, MN | UW NCF DSCR: | 2.88x | ||
| UW NOI Debt Yield: | 10.5% |
The Markets.
The US Storage Centers - Duluth Property is located adjacent to I-35, with the nearest access 0.5 miles away, and 3.3 miles south of downtown Duluth, the fourth largest city in Minnesota. According to the appraisal, the 5-mile trade area comprises 2,651 units (368,621 SF) and reported an 8.0% vacancy rate. The appraisal concluded to average market rent of $129 per unit per month for a 10x10 climate controlled unit (compared to average in-place rent of $133). According to the appraisal, there are no planned self-storage facilities within a 5-mile radius.
The US Storage Centers – St. Paul Property is located 0.2 miles north of the I-94, 4.5 miles west of the St. Paul central business district (“CBD”) and 4.0 miles east of the Minneapolis CBD. According to the appraisal, the 3-mile trade area comprises 7,877 units (924,208 SF) and reported a 16.0% vacancy rate. The appraisal concluded to average market rent of $139 per unit per month for 10x10 climate controlled units (compared to average in-place rent of $156). According to the appraisal, there are no planned self-storage facilities within a 3-mile radius.
The US Storage Centers - Brainerd Property is located along State Highway 371, the primary north/south artery in the area, 4.5 miles south of downtown Brainerd, and 60 miles north of St. Cloud. According to the appraisal, the 15-mile trade area comprises 2,198 units (325,517 SF) and reported a 7.0% vacancy rate. The appraisal concluded to average market rents of $92 per unit per month for 10x10 non-climate controlled units (compared to average in-place rent of $92) and $125 per unit per month for 10x10 climate controlled units (compared to average in-place rent of $134). According to the appraisal, there are no planned self-storage facilities within a 15-mile radius.
The US Storage Centers – Pine Tree Property is located along Highway 210, the primary north/south thoroughfare in the local area, 4.5 miles east of downtown Brainerd, and 55 miles north of St. Cloud. According to the appraisal, the 15-mile trade area comprises 1,705 units (252,042 SF) and reported a 7.0% vacancy rate. The appraisal concluded to average market rent of $80 per unit per month for a 10x20 non-climate controlled unit (compared to average in-place rent of $74). According to the appraisal, there are no planned self-storage facilities within a 15-mile radius.
The following table presents certain local demographic data related to the Lake Region Portfolio Properties:
| Property Name | 2020 Population (within 1-mi. / 3-mi. / 5-mi. Radius)(1) | 2020 Average Household Income (within 1-mi. / 3-mi. / 5-mi. Radius)(1) |
| US Storage Centers - Duluth | N/A / 31,877 / 84,508 | N/A / $53,956 / $59,399 |
| US Storage Centers - St. Paul | 12,575 / 182,873 / 479,924 | $83,406 / $84,695 / $81,524 |
| US Storage Centers - Brainerd | 40,376 / 52,861 / 69,843 | $74,510/ $73,014 / $72,279 |
| US Storage Centers - Pine Tree | 32,777 / 53,533 / 68,300 | $67,160 / $71,424/ $72,207 |
| (1) | Represents the local demographic data within a 10-mi. / 15-mi. / 20-mi. Radius for the US Storage Centers – Brainerd Property and the US Storage Centers – Pine Tree Property. |
The following table presents certain information relating to certain self storage lease comparables provided in the appraisals for the Lake Region Portfolio Properties:
| Competitive Set | ||||
| Property Name | Current Occupancy (2/1/2021) | Average Occupancy Rate | Monthly Underwritten Rent/Unit | Appraiser’s Monthly Market Rent/Unit |
| US Storage Centers - Duluth | 94.2% | 87.2% | $160 | $163 |
| US Storage Centers - St. Paul | 86.2% | 78.0% | $156 | $157 |
| US Storage Centers - Brainerd | 90.1% | 92.5% | $135 | $133 |
| US Storage Centers - Pine Tree | 99.3% | 93.2% | $72 | $79 |
This is not a research report and was not prepared by any Underwriters research department. Please see additional important information and qualifications at the end of this Term Sheet.
134
| Self Storage – Self Storage | Loan #12 | Cut-off Date Balance: | $18,700,000 | |
| Various | Lake Region Portfolio | Cut-off Date LTV: | 60.8% | |
| Various, MN | UW NCF DSCR: | 2.88x | ||
| UW NOI Debt Yield: | 10.5% |
Operating History and Underwritten Net Cash Flow. The following table presents certain information relating to the historic operating performance and Underwritten Net Cash Flow at the Lake Region Portfolio Properties:
| Cash Flow Analysis | ||||||
| 2017 | 2018 | 2019 | 2020 | UW(1) | UW PSF(1) | |
| Gross Potential Rent | $3,098,167 | $3,225,553 | $3,318,853 | $3,294,774 | $3,597,545 | $12.09 |
| Other Income(2) | $63,613 | $58,074 | $62,282 | $47,543 | $47,543 | $0.16 |
| Less Vacancy | $0 | $0 | $0 | $0 | ($352,820)(3) | ($1.19) |
| Less Concessions & Credit Loss | $0 | $0 | $0 | $0 | $0 | $0 |
| Effective Gross Income | $3,161,781 | $3,283,627 | $3,381,135 | $3,342,317 | $3,292,269 | $11.07 |
| Real Estate Taxes | $350,314 | $374,428 | $408,692 | $431,262 | $485,553 | $1.63 |
| Insurance | $40,284 | $38,964 | $46,317 | $42,527 | $44,557 | $0.15 |
| Management Fee | $0 | $0 | $0 | $0 | $98,768 | $0.33 |
| Other Operating Expenses | $728,285 | $741,043 | $750,087 | $687,805 | $708,563 | $2.38 |
| Total Expenses | $1,118,883 | $1,154,435 | $1,205,096 | $1,161,594 | $1,337,442 | $4.50 |
| Net Operating Income | $2,042,898 | $2,129,192 | $2,176,038 | $2,180,723 | $1,954,827 | $6.57 |
| Capital Expenditures | $0 | $0 | $0 | $0 | $49,243 | $0.17 |
| TI/LC | $0 | $0 | $0 | $0 | $0 | $0.00 |
| Net Cash Flow | $2,042,898 | $2,129,192 | $2,176,038 | $2,180,723 | $1,905,584 | $6.41 |
| Occupancy %(3) | 93.0% | 94.3% | 94.0% | 92.2% | 90.8%(4) | |
| NOI DSCR | 3.09x | 3.22x | 3.29x | 3.30x | 2.95x | |
| NCF DSCR | 3.09x | 3.22x | 3.29x | 3.30x | 2.88x | |
| NOI Debt Yield | 10.9% | 11.4% | 11.6% | 11.7% | 10.5% | |
| NCF Debt Yield | 10.9% | 11.4% | 11.6% | 11.7% | 10.2% | |
| (1) | For the avoidance of doubt, no COVID-19 specific adjustments have been incorporated in the lender underwriting. |
| (2) | Other Income includes all miscellaneous revenues such as administrative fees, late fees, forfeited deposits, merchandise sales, and minor miscellaneous income. |
| (3) | Represents the average occupancy rate over the course of each year. |
| (4) | The underwritten economic vacancy is 9.8%. The Lake Region Portfolio Properties were 90.8% physically occupied as of February 1, 2021. |
Release of Property. Following the earlier of March 11, 2025 or two years after securitization, provided no event of default is continuing, the borrower is permitted to obtain the release of any of the Lake Region Portfolio Properties from the lien of the Lake Region Portfolio Mortgage Loan, upon partial defeasance of the Lake Region Portfolio Mortgage Loan, provided that certain conditions are satisfied, including but not limited to the following conditions:
| ● | The principal amount of the loan to be defeased is an amount equal to the greatest of: |
| o | 120% of the allocated loan amount of the property being released; |
| o | an amount that would result in, immediately following the release, the net cash flow debt service coverage ratio being no less than the greater of (a) the net cash flow debt service coverage ratio immediately prior to the release and (b) 2.85x; |
| o | an amount that would result in, immediately following the release, the net cash flow debt yield being no less than the greater of (a) the net cash flow debt yield immediately prior to the release and (b) 10.2%; |
| o | an amount that would result in, immediately following the release, the loan-to-value ratio being no greater than the lesser of (a) the loan-to-value ratio immediately prior to the release and (b) 57.5%; and |
| o | if, immediately following the release, the ratio of the unpaid principal balance of the loan to the value of the remaining real property collateral would be greater than 125% (based solely on real property and excluding personal property and going concern value, if any), an amount such that the securitization will not fail to maintain its status as a REMIC trust. |
| ● | either or both of the remaining properties located in Brainerd, Minnesota are not the sole remaining properties; and |
| ● | the lender receives rating agency confirmation. |
This is not a research report and was not prepared by any Underwriters research department. Please see additional important information and qualifications at the end of this Term Sheet.
135
| Mortgage Loan No. 13 – Heath Town Center |
| Mortgage Loan Information | Property Information | ||||||
| Mortgage Loan Seller: | MSMCH | Single Asset/Portfolio: | Single Asset | ||||
| Credit Assessment (Moody’s/DBRSM/Fitch): | NR/NR/NR | Location: | Heath, TX 75032 | ||||
| Original Balance: | $16,800,000 | General Property Type: | Retail | ||||
| Cut-off Date Balance: | $16,800,000 | Detailed Property Type: | Anchored | ||||
| % of Initial Pool Balance: | 1.9% | Title Vesting: | Fee | ||||
| Loan Purpose: | Acquisition | Year Built/Renovated: | 2019/N/A | ||||
| Borrower Sponsor: | Younger Partners | Size: | 77,669 SF | ||||
| Guarantor: | Jennifer Kathleen Permenter; Moody | Cut-off Date Balance Per SF: | $216 | ||||
| Younger | Maturity Date Balance Per SF: | $216 | |||||
| Mortgage Rate: | 3.9950% | Property Manager: | Younger Partners Property | ||||
| Note Date: | 2/4/2021 | Services, LLC (borrower-related) | |||||
| First Payment Date: | 4/1/2021 | ||||||
| Maturity Date: | 3/1/2031 | ||||||
| Original Term to Maturity: | 120 months | Underwriting and Financial Information(3)(4) | |||||
| Original Amortization Term: | 0 months | UW NOI: | $1,483,856 | ||||
| IO Period: | 120 months | UW NOI Debt Yield: | 8.8% | ||||
| Seasoning: | 0 months | UW NOI Debt Yield at Maturity: | 8.8% | ||||
| Prepayment Provisions: | LO (24); DEF (91); O (5) | UW NCF DSCR: | 2.06x | ||||
| Lockbox/Cash Mgmt Status: | Springing/Springing | Most Recent NOI: | N/A | ||||
| Additional Debt Type: | No | 2nd Most Recent NOI: | N/A | ||||
| Additional Debt Balance: | N/A | 3rd Most Recent NOI: | N/A | ||||
| Future Debt Permitted (Type): | No (N/A) | Most Recent Occupancy: | 97.6% (1/31/2021) | ||||
| Reserves | 2nd Most Recent Occupancy: | N/A | |||||
| Type | Initial | Monthly | Cap | 3rd Most Recent Occupancy: | N/A | ||
| RE Tax: | $15,666 | $5,222 | N/A | Appraised Value (as of): | $28,100,000 (12/28/2020) | ||
| Insurance(1): | $0 | Springing | N/A | Appraised Value Per SF: | $362 | ||
| Recurring Replacements: | $0 | $971 | N/A | Cut-off Date LTV Ratio: | 59.8% | ||
| TI/LC(2): | $0 | Springing | $233,007 | Maturity Date LTV Ratio: | 59.8% | ||
| Deferred Maintenance: | $6,250 | $0 | N/A | ||||
| Debt Service Interest Reserve: | $170,120 | $0 | N/A | ||||
| Sources and Uses | ||||||
| Sources | Proceeds | % of Total | Uses | Proceeds | % of Total | |
| Mortgage Loan Amount: | $16,800,000 | 61.0% | Purchase Price: | $26,836,735 | 97.5% | |
| Borrower Equity: | $10,732,117 | 39.0% | Closing Costs: | $503,346 | 1.8% | |
| Reserves | $192,036 | 0.7% | ||||
| Total Sources: | $27,532,117 | 100.0% | Total Uses: | $27,532,117 | 100.0% | |
| (1) | Monthly insurance reserves are springing upon any of the following: (i) an event of default, (ii) failure of the borrower to provide written evidence of a blanket policy and (iii) failure of the borrower to provide evidence of payment and renewal certificates at least 20 days prior to expiration. |
| (2) | Monthly TI/LC reserves are springing on January 1, 2024. On each payment date on and after such date, the Heath Town Center Borrower (as defined below) is required to deposit with the lender $4,854, subject to a cap of $233,007. |
| (3) | The novel coronavirus pandemic is an evolving situation and could impact the Heath Town Center Mortgage Loan (as defined below) more severely than assumed in the underwriting of the Heath Town Center Mortgage Loan and could adversely affect the NOI, NCF and occupancy information, as well as the appraised value and the DSCR, LTV and Debt Yield metrics presented above and herein. See "Risk Factors-—Risks Related to Market Conditions and Other External Factors—The Coronavirus Pandemic Has Adversely Affected the Global Economy and Will Likely Adversely Affect the Performance of the Mortgage Loans" in the Preliminary Prospectus. |
| (4) | Historical NOI and occupancy information is not available because the Heath Town Center Property (as defined below) was built in 2019 and undergoing lease-up during 2020. |
The Mortgage Loan. The thirteenth largest mortgage loan (the “Heath Town Center Mortgage Loan”) is evidenced by a promissory note in the original principal amount of $16,800,000 and secured by a first priority fee mortgage encumbering a 77,669 SF anchored retail shopping center located in Heath, Texas (the “Heath Town Center Property”).
The Borrower and the Borrower Sponsor. The borrower for the Heath Town Center Mortgage Loan is Heath Younger LLC (the “Heath Town Center Borrower”), a single-purpose Delaware limited liability company with no independent directors in its organizational structure. The non-recourse carveout guarantors are Jennifer Kathleen Permenter (“Kathy Permenter”) and Moody Younger and the borrower sponsor is Younger Partners. Founded in 2012, Younger Partners has grown from its two original partners to over 80 employees responsible for 8 million SF of properties in the Dallas/Fort Worth market. Younger Partners is led by its co-managing partners, Moody Younger and Kathy Permenter. Moody Younger has spent more than 30 years in the commercial real estate industry, having held senior management positions with Grubb & Ellis, CBRE, Trammell Crow Company, Jones Lang LaSalle and Transwestern Commercial Services. Kathy Permenter also has more than 30 years of experience in the industry, and oversees leasing at Younger Partners.
The Property. The Heath Town Center Property is a 77,669 SF anchored retail shopping center on an approximately 8.72-acre site in Heath, Texas. The Heath Town Center Property was built in 2019. The Heath Town Center Property is anchored by Tom Thumb and, as of January 31, 2021, was
This is not a research report and was not prepared by any Underwriters research department. Please see additional important information and qualifications at the end of this Term Sheet.
136
| Retail - Anchored | Loan #13 | Cut-off Date Balance: | $16,800,000 | |
| 453, 455, 457, 459, 465, 469, 473, | Heath Town Center | Cut-off Date LTV: | 59.8% | |
| 551 and 585 Laurence Drive | U/W NCF DSCR: | 2.06x | ||
| Heath, TX 75032 | U/W NOI Debt Yield: | 8.8% |
97.6% leased to 9 tenants. The Heath Town Center Property contains 435 parking spaces (5.6 spaces per 1,000 SF). Tom Thumb (70.8% of NRA and 55.2% of underwritten rent) signed a new 20-year triple net lease at the Heath Town Center Property that expires in September 2039. The remainder of the rent roll is leased to a complementary roster of national, regional and local tenants, including The UPS Store, Great Clips, Aria Nail Bar, Hummingbird Dental and Mannys Tex-Mex Restaurant. The Heath Town Center Property also includes a Tom Thumb Express fuel station and convenience store. Other than the top three tenants, no tenant accounts for more than 3.9% of NRA and 6.1% of underwritten rent.
Major Tenants.
Tom Thumb (55,000 SF, 70.8% of NRA, 55.2% of underwritten rent). Tom Thumb is a chain of supermarkets in the Dallas–Fort Worth metroplex and is a subsidiary of Albertsons Companies, an American grocery company founded and headquartered in Boise, Idaho. Albertsons Companies is a food and drug retailer in the United States, operating stores across 34 states and the District of Columbia under 20 brands. Albertsons Companies operates more than 400 fuel centers, including nearly three dozen convenience stores. Tom Thumb has been a tenant at the Heath Town Center Property since 2019, has a lease expiration date of September 30, 2039 and has 10, five-year renewal options remaining. Tom Thumb is the largest tenant at the Heath Town Center Property, occupying the 55,000 SF anchor space as well as a 0.97 acre pad, which is improved with a Tom Thumb Express fuel station and convenience store that is owned by the tenant.
Mannys Tex-Mex Restaurant (7,310 SF, 9.4% of NRA, 12.2% of underwritten rent). Mannys Tex-Mex Restaurant is a restaurant with traditional family recipes founded by Manuel “Manny” Rios in 2005 in uptown Dallas, Texas. Manny’s Tex-Mex Restaurant has five locations across the Dallas-Fort Worth area. Manny’s Tex-Mex Restaurant signed a lease at the Heath Town Center Property in January 2020, has a lease expiration date of January 31, 2030 and has two, five-year renewal options remaining.
The following table presents a summary regarding the major tenants at the Heath Town Center Property:
| Tenant Summary(1) | ||||||||||||
| Tenant Name | Credit Rating (Fitch/Moody’s/ S&P)(2) | Tenant SF | Approx. % of SF | Annual UW Rent | Annual UW Rent PSF(3) | Most Recent Sales | ||||||
| App. % of Total Annual UW Rent | $ | PSF | Occ. Cost % | Term. Option | Renewal Options | Lease Expiration | ||||||
| Tom Thumb(4) | NR/B1/BB- | 55,000 | 70.8% | $869,000 | $15.80 | 55.2% | NAV | NAV | NAV | N | 10 x 5 year | 9/30/2039 |
| Mannys Tex-Mex Restaurant | NR/NR/NR | 7,310 | 9.4% | $192,715 | $26.36 | 12.2% | NAV | NAV | NAV | N | 2 x 5 year | 1/31/2030 |
| Aria Nail Bar | NR/NR/NR | 3,500 | 4.5% | $128,625 | $36.75 | 8.2% | NAV | NAV | NAV | N | 1 x 5 year | 12/31/2029 |
| Giannis Italian Bistro | NR/NR/NR | 3,000 | 3.9% | $96,000 | $32.00 | 6.1% | NAV | NAV | NAV | N | 3 x 5 year | 1/31/2027 |
| Haute Salon | NR/NR/NR | 2,540 | 3.3% | $87,630 | $34.50 | 5.6% | NAV | NAV | NAV | N | 2 x 5 year | 7/31/2030 |
| Subtotal/Wtd. Avg. | 71,350 | 91.9% | $1,373,970 | $19.26 | 87.3% | |||||||
| Other Tenants | 4,492 | 5.8% | $200,450 | $44.62 | 12.7% | |||||||
| Vacant Space | 1,827 | 2.4% | $0 | $0.00 | 0.0% | |||||||
| Total/Wtd. Avg. | 77,669 | 100.0% | $1,574,420 | $20.76 | 100.0% | |||||||
| (1) | Information is based on the underwritten rent roll as of January 31, 2021. |
| (2) | Certain ratings are those of the parent company whether or not the parent company guarantees the lease. |
| (3) | Wtd. Avg. Annual UW Rent PSF excludes Vacant Space. |
| (4) | Tom Thumb Tenant SF and Annual UW Rent does not include the Tom Thumb Express space, as to which the tenant owns the improvements. |
This is not a research report and was not prepared by any Underwriters research department. Please see additional important information and qualifications at the end of this Term Sheet.
137
| Retail - Anchored | Loan #13 | Cut-off Date Balance: | $16,800,000 | |
| 453, 455, 457, 459, 465, 469, 473, | Heath Town Center | Cut-off Date LTV: | 59.8% | |
| 551 and 585 Laurence Drive | U/W NCF DSCR: | 2.06x | ||
| Heath, TX 75032 | U/W NOI Debt Yield: | 8.8% |
The following table presents certain information relating to the lease rollover at the Heath Town Center Property:
| Lease Rollover Schedule(1)(2) | ||||||||
| Year | # of Leases Rolling | SF Rolling | Annual UW Rent PSF Rolling(3) | Approx. % of Total SF Rolling | Approx. Cumulative % of SF Rolling | Total UW Rent Rolling | Approx. % of Total Rent Rolling | Approx. Cumulative % of Total Rent Rolling |
| 2021 | 0 | 0 | $0.00 | 0.0% | 0.0% | $0 | 0.0% | 0.0% |
| 2022 | 0 | 0 | $0.00 | 0.0% | 0.0% | $0 | 0.0% | 0.0% |
| 2023 | 0 | 0 | $0.00 | 0.0% | 0.0% | $0 | 0.0% | 0.0% |
| 2024 | 1 | 1,120 | $33.00 | 1.4% | 1.4% | $36,960 | 2.3% | 2.3% |
| 2025 | 0 | 0 | $0.00 | 0.0% | 1.4% | $0 | 0.0% | 2.3% |
| 2026 | 0 | 0 | $0.00 | 0.0% | 1.4% | $0 | 0.0% | 2.3% |
| 2027 | 1 | 3,000 | $32.00 | 3.9% | 5.3% | $96,000 | 6.1% | 8.4% |
| 2028 | 0 | 0 | $0.00 | 0.0% | 5.3% | $0 | 0.0% | 8.4% |
| 2029 | 2 | 4,972 | $35.49 | 6.4% | 11.7% | $176,465 | 11.2% | 19.7% |
| 2030 | 3 | 11,750 | $29.28 | 15.1% | 26.8% | $343,995 | 21.8% | 41.5% |
| 2031 | 0 | 0 | $0.00 | 0.0% | 26.8% | $0 | 0.0% | 41.5% |
| 2032 & Beyond | 2 | 55,000 | $16.75 | 70.8% | 97.6% | $921,000 | 58.5% | 100.0% |
| Vacant | 0 | 1,827 | $0.00 | 2.4% | 100.0% | $0 | 0.0% | 100.0% |
| Total/Wtd. Avg. | 9 | 77,669 | $20.76 | 100.0% | $1,574,420 | 100.0% | ||
| (1) | Information is based on the underwritten rent roll as of January 31, 2021. |
| (2) | Certain tenants may have lease termination options that are exercisable prior to the stated expiration date of the subject lease or leases which are not considered in the lease rollover schedule. |
| (3) | Wtd. Avg. Annual UW Rent PSF Rolling excludes Vacant space. |
COVID-19 Update. The first debt service payment date for the Heath Town Center Mortgage Loan is April 1, 2021 and, as of February 26, 2021, the Heath Town Center Mortgage Loan is not subject to any forbearance, modification or debt service relief request. As of February 26, 2021, the Heath Town Center Borrower has reported that the Heath Town Center Property is open and operating, with 100.0% of tenants by occupied NRA and 100.0% of tenants by underwritten base rent having paid their full February 2021 rent payments. All tenants have paid rent consistently since March 2020, with four tenants (11.7% of NRA and 19.7% of underwritten rent) having received relief in the form of forgivable loans from the City of Heath’s Economic Development Council. As of February 26, 2021, none of the tenants have received any rent relief from the Heath Town Center Borrower.
The Market. The Heath Town Center Property is located in Heath, Texas, within the Dallas metropolitan statistical area (“MSA”) and the Rockwall submarket. According to the appraisal, as of the third quarter of 2020, the Dallas MSA had approximately 438.9 million SF of retail space inventory, overall vacancy in the market was approximately 5.8% and asking rent was $16.95 PSF. According to the appraisal, as of the third quarter of 2020, the Rockwall submarket had approximately 4.6 million SF of retail space inventory, overall vacancy in the submarket was approximately 2.6% and asking rent was $25.71 PSF. Primary access to the Heath Town Center Property is provided by Interstate 30. According to the appraisal, the 2020 estimated population within a one-, three- and five-mile radius of the Heath Town Center Property was 1,993, 18,390 and 56,558, respectively. The 2020 estimated average household income within a one-, three- and five-mile radius of the Heath Town Center Property was $191,161, $153,118 and $113,677, respectively.
The following table presents recent leasing data for grocery tenants at comparable retail properties with respect to the Heath Town Center Property:
| Comparable Grocery Retail Lease Summary | |||||||
| Property/Location | Year Built | SF | Tenant Name | Size (SF) | Lease Date | Rent PSF | Lease Type |
Heath Town Center (subject) Heath, TX | 2019 | 77,669 | Tom Thumb | 55,000 | Sept. 2019 | $15.80 | NNN |
| Flower Mound, TX | 2012 | 59,637 | Tom Thumb | 59,637 | Jan. 2018 | $13.35 | NNN |
| Plano, TX | 2009 | 69,971 | Market Street | 69,971 | April 2019 | $15.43 | NNN |
| Mesquite, TX | 1999 | 54,252 | Tom Thumb | 54,252 | Nov. 2017 | $12.98 | NNN |
| Mansfield, TX | 2018 | 83,800 | Market Street | 83,800 | May 2018 | $12.81 | NNN |
| Irving, TX | 2016 | 44,280 | Whole Foods | 44,280 | Jan. 2017 | $19.50 | NNN |
| Fort Worth, TX | 2015 | 47,913 | Whole Foods | 47,913 | Oct. 2016 | $15.13 | NNN |
Source: Appraisal and underwritten rent roll.
This is not a research report and was not prepared by any Underwriters research department. Please see additional important information and qualifications at the end of this Term Sheet.
138
| Retail - Anchored | Loan #13 | Cut-off Date Balance: | $16,800,000 | |
| 453, 455, 457, 459, 465, 469, 473, | Heath Town Center | Cut-off Date LTV: | 59.8% | |
| 551 and 585 Laurence Drive | U/W NCF DSCR: | 2.06x | ||
| Heath, TX 75032 | U/W NOI Debt Yield: | 8.8% |
The following table presents recent leasing data for in-line tenants at comparable retail properties with respect to the Heath Town Center Property:
| Comparable In-line Retail Lease Summary | |||||||
| Property/Location | Year Built | SF | Tenant Name | Size (SF) | Lease Date | Rent PSF | Lease Type |
Heath Town Center (subject) Heath, TX | 2019 | 77,669 | Mannys Tex-Mex Restaurant Aria Nail Bar | 7,310 3,500 | Jan. 2020 Dec. 2019 | $26.36 $36.75 | NNN NNN |
Shopping Center Heath, TX | 2020 | 11,959 | - | 1,677 | Jan. 2021 | $35.00 | NNN |
Retail Strip Center Rockwall, TX | 2001 | 11,001 | - | 1,863 | April 2020 | $28.50 | NNN |
Retail Strip Center Royse City, TX | 2019 | 11,000 | - | 5,000 | Jan. 2020 | $31.00 | NNN |
Lakeshore Commons Rockwall, TX | 2018 | 9,873 | Deca Dental | 2,000 | May 2018 | $31.40 | NNN |
Rockwall Market Center Rockwall, TX | 1999 | 209,054 | - | 1,496 | Dec. 2018 | $28.00 | NNN |
Source: Appraisal and underwritten rent roll.
The following table presents comparable sales with respect to the Heath Town Center Property:
| Comparable Sales Summary | ||||||
Property Name/ City, State | Built | Occupancy | Lease Area (SF) | Sale Date | Sale Price | Price PSF |
Heath Town Center (subject) Heath, TX | 2019 | 97.6% | 77,669 | Dec. 2020 | $26,836,735 | $345.53 |
Las Colinas Village Irving, TX | 2000 | 86% | 53,564 | Dec. 2019 | $15,625,315 | $291.71 |
Kimball Oaks Shopping Southlake, TX | 2015 | 100% | 126,654 | June 2019 | $36,799,999 | $290.56 |
Preston Forest Shopping Dallas, TX | 1960 | 95% | 195,554 | Jan. 2020 | $64,000,000 | $327.28 |
Eldorado Market Place Frisco, TX | 2008 | 95% | 186,068 | Sept. 2019 | $71,000,000 | $381.58 |
Lake Highlands Town Dallas, TX | 2017 | 95% | 67,337 | Dec. 2018 | $31,450,000 | $467.05 |
Source: Appraisal and Underwritten rent roll.
The following table presents certain information relating to the appraisal’s market rent conclusion for the Heath Town Center Property:
| Market Rent Summary | ||||
| Market Rent PSF | Lease Term (Months) | Rent Increase Projection | Lease Type | |
| In-line Space | $34.00 | 60 | 2.5% per annum | NNN |
| Grocery Space | $16.00 | 240 | 2.5% per annum | NNN |
Source: Appraisal.
This is not a research report and was not prepared by any Underwriters research department. Please see additional important information and qualifications at the end of this Term Sheet.
139
| Retail - Anchored | Loan #13 | Cut-off Date Balance: | $16,800,000 | |
| 453, 455, 457, 459, 465, 469, 473, | Heath Town Center | Cut-off Date LTV: | 59.8% | |
| 551 and 585 Laurence Drive | U/W NCF DSCR: | 2.06x | ||
| Heath, TX 75032 | U/W NOI Debt Yield: | 8.8% |
Underwritten Net Cash Flow. The following table presents certain information relating to the Underwritten Net Cash Flow at the Heath Town Center Property:
| Cash Flow Analysis(1)(2) | ||
| UW | UW PSF | |
| Gross Potential Rent(3) | $1,634,711 | $21.05 |
| Total Recoveries | $563,514 | $7.26 |
| Other Income | $0 | $0.00 |
| Less Vacancy & Credit Loss | ($109,911) | ($1.42) |
| Effective Gross Income | $2,088,314 | $26.89 |
| Real Estate Taxes | $388,345 | $5.00 |
| Insurance | $23,301 | $0.30 |
| Other Expenses | $192,811 | $2.48 |
| Total Expenses | $604,457 | $7.78 |
| Net Operating Income | $1,483,856 | $19.10 |
| Capital Expenditures | $11,650 | $0.15 |
| TI/LC | $70,679 | $0.91 |
| Net Cash Flow | $1,401,527 | $18.04 |
| Occupancy %(3) | 97.6% | |
| NOI DSCR | 2.18x | |
| NCF DSCR | 2.06x | |
| NOI Debt Yield | 8.8% | |
| NCF Debt Yield | 8.3% | |
| | |
| (1) | For the avoidance of doubt, no COVID-19 specific adjustments have been made to the lender underwriting. |
| (2) | Historical NOI and occupancy information is not available because the Heath Town Center Property was built in 2019 and undergoing lease-up during 2020. |
| (3) | UW Gross Potential Rent and Occupancy % is based on the underwritten rent roll dated January 31, 2021. |
Release of Property. The Heath Town Center Borrower may obtain the release of the Tom Thumb Express fuel station and convenience store parcel upon defeasance of the Heath Town Center Mortgage Loan in an amount equal to 125% of the allocated loan amount of such parcel (which allocated loan amount is $717,000), subject to the following conditions, (a) no event of default is continuing, (b) the debt yield after the release being greater than the greater of 8.31% and the debt yield immediately prior to such release, (c) the loan-to-value ratio after the release being no greater than the lesser of 59.8% and the loan-to-value ratio immediately prior to such release, (d) the remaining property is in compliance with zoning requirements and has a separate tax identification number and (e) compliance with certain REMIC-related requirements.
This is not a research report and was not prepared by any Underwriters research department. Please see additional important information and qualifications at the end of this Term Sheet.
140
(THIS PAGE INTENTIONALLY LEFT BLANK)
This is not a research report and was not prepared by any Underwriter’s research department. Please see additional important information and qualifications at the end of this Term Sheet.
141
| Mortgage Loan No. 14 – McClellan Park |
| Mortgage Loan Information | Property Information | ||||||
| Mortgage Loan Seller: | WFB | Single Asset/Portfolio: | Single Asset | ||||
| Credit Assessment (Moody’s/DBRSM/Fitch): | NR/NR/NR | Location: | McClellan, CA 95652 | ||||
| Original Balance(1): | $16,600,000 | General Property Type: | Industrial | ||||
| Cut-off Date Balance(1): | $16,600,000 | Detailed Property Type: | Warehouse | ||||
| % of Initial Pool Balance: | 1.8% | Title Vesting: | Fee | ||||
| Loan Purpose: | Refinance | Year Built/Renovated: | 1938/2019 | ||||
| Borrower Sponsor: | McClellan Business Park, LLC | Size: | 6,925,484 SF | ||||
| Guarantor: | McClellan Business Park, LLC | Cut-off Date Balance PSF(1): | $52 | ||||
| Mortgage Rate: | 3.3090% | Maturity Balance PSF(1): | $52 | ||||
| Note Date: | 11/13/2020 | Property Manager: | LDKV Management, Inc. | ||||
| First Payment Date: | 1/11/2021 | (borrower-related) | |||||
| Maturity Date: | 12/11/2030 | ||||||
| Original Term to Maturity: | 120 months | ||||||
| Original Amortization Term: | 0 months | ||||||
| IO Period: | 120 months | ||||||
| Seasoning: | 3 months | Underwriting and Financial Information(8) | |||||
| Prepayment Provisions(2): | YM (27);DEF/YM (86);O (7) | UW NOI(9): | $37,628,413 | ||||
| Lockbox/Cash Mgmt Status: | Hard/Springing | UW NOI Debt Yield(1): | 10.5% | ||||
| Additional Debt Type(1): | Pari Passu | UW NOI Debt Yield at Maturity(1): | 10.5% | ||||
| Additional Debt Balance(1)(3): | $341,400,000 | UW NCF DSCR(1): | 2.90x | ||||
| Future Debt Permitted (Type): | No (N/A) | Most Recent NOI(9): | $29,593,816 (9/30/2020 TTM) | ||||
| Reserves | 2nd Most Recent NOI(9): | $27,579,910 (12/31/2019) | |||||
| Type | Initial | Monthly | Cap | 3rd Most Recent NOI(9): | $24,924,493 (12/31/2018) | ||
| RE Taxes(4): | $0 | Springing | N/A | Most Recent Occupancy: | 86.8% (9/15/2020) | ||
| Insurance(5): | $0 | Springing | N/A | 2nd Most Recent Occupancy: | 88.4% (12/31/2019) | ||
| Recurring Replacements(6): | $0 | Springing | $2,077,645 | 3rd Most Recent Occupancy: | 83.4% (12/31/2018) | ||
| TI/LC Reserve(7): | $0 | Springing | $6,925,484 | Appraised Value (as of): | $595,000,000 (9/15/2020) | ||
| Tenant Specific TI/LC Reserve: | $5,482,591 | $0 | N/A | Appraised Value PSF: | $86 | ||
| Rent Concession Reserve: | $18,717 | $0 | N/A | Cut-off Date LTV Ratio(1): | 60.2% | ||
| Development Agency Reserve: | $689,614 | $0 | N/A | Maturity Date LTV Ratio(1): | 60.2% | ||
| Sources and Uses | ||||||
| Sources | Proceeds | % of Total | Uses | Proceeds | % of Total | |
| Whole Loan Amount(1): | $358,000,000 | 100.0% | Loan Payoff: | $334,182,430 | 93.3% | |
| Reserves: | $6,190,922 | 1.7% | ||||
| Closing Costs: | $5,652,858 | 1.6% | ||||
| Return of Equity: | $11,973,790 | 3.3% | ||||
| Total Sources: | $358,000,000 | 100.0% | Total Uses: | $358,000,000 | 100.0% | |
| (1) | The McClellan Park Mortgage Loan (as defined below) is part of the McClellan Park Whole Loan (as defined below) with an original aggregate principal balance of $358,000,000. The Cut-off Date Balance PSF, Maturity Date Balance PSF, UW NOI Debt Yield, UW NOI Debt Yield at Maturity, UW NCF DSCR, Cut-off Date LTV Ratio and LTV Ratio at Maturity numbers presented above are based on the McClellan Park Whole Loan. |
| (2) | At any time after the earlier of (i) January 11, 2024 and (ii) two years from the closing date of the securitization that includes the last pari passu note of the McClellan Park Whole Loan to be securitized, the McClellan Park Borrower (as defined below) has the right to defease the McClellan Park Whole Loan in whole, but not in part. Additionally, the McClellan Park Borrower may prepay the McClellan Park Whole Loan in whole, or in part, in connection with a partial release, at any time during the term with a 30-day prior notice and, if such prepayment occurs on or before May 11, 2030, payment of the yield maintenance premium. See “Release of Property” section below. |
| (3) | See “The Mortgage Loan” below for further discussion of additional debt. |
| (4) | During a Cash Trap Event Period (a Cash Trap Event Period means the period commencing on the earlier of an event of default or the net cash flow debt yield falling below 7.0% at the end of any calendar quarter, and ending upon the cure of such event of default or the net cash flow debt yield being equal to or greater than 7.0% at the end of any calendar quarter, as applicable), the McClellan Park Whole Loan documents require ongoing monthly real estate tax reserves in an amount equal to one-twelfth of the real estate taxes that the lender estimates will be payable during the next 12 months. |
| (5) | During a Cash Trap Event Period, the McClellan Park Whole Loan documents require ongoing monthly insurance reserves in an amount equal to one-twelfth of the insurance premiums that the lender estimates will be payable for the renewal of the coverage afforded by the policies upon the expiration thereof. |
| (6) | During a Cash Trap Event Period, the McClellan Park Whole Loan documents require ongoing monthly replacement reserves of $86,569 ($0.15 PSF annually), subject to a cap of $2,077,645 ($0.30 PSF). |
| (7) | During a Cash Trap Event Period, the McClellan Park Whole Loan documents require ongoing monthly TI/LC reserves of $288,562 ($0.50 PSF annually), subject to a cap of $6,925,484 ($1.00 PSF). |
| (8) | The novel coronavirus pandemic is an evolving situation and could impact the McClellan Park Whole Loan more severely than assumed in the underwriting of the McClellan Park Whole Loan and could adversely affect the NOI, NCF and occupancy information, as well as the appraised value and the DSCR, LTV and Debt Yield metrics presented above and herein. See “Risk Factors—Risks Related to Market Conditions and Other External Factors—The Coronavirus Pandemic Has Adversely Affected the Global Economy and Will Likely Adversely Affect the Performance of the Mortgage Loans” in the Preliminary Prospectus. |
| (9) | See “Operating History and Underwritten Cash Flow” section below for information regarding year-over-year increases in NOI and increase to UW NOI from Most Recent NOI. |
This is not a research report and was not prepared by any Underwriters research department. Please see additional important information and qualifications at the end of this Term Sheet.
142
| Industrial-Warehouse | Loan #14 | Cut-off Date Balance: | $16,600,000 | |
| Various | McClellan Park | Cut-off Date LTV: | 60.2% | |
| McClellan, CA 95652 | UW NCF DSCR: | 2.90x | ||
| UW NOI Debt Yield: | 10.5% |
The Mortgage Loan. The 14th largest mortgage loan (the “McClellan Park Mortgage Loan”) is part of a whole loan (the “McClellan Park Whole Loan”) that is evidenced by eight pari passu promissory notes in the aggregate original principal amount of $358,000,000. The McClellan Park Whole Loan is secured by a first priority fee mortgage encumbering McClellan Park, a 6,925,484 SF primarily industrial and office portfolio located in McClellan, California (the “McClellan Park Property”). The McClellan Park Whole Loan was co-originated on November 13, 2020 by WFB and Goldman Sachs Bank USA.
The McClellan Park Mortgage Loan is evidenced by the non-controlling promissory Note A-5 in the original principal amount of $16,600,000. The remaining promissory notes comprising the McClellan Park Whole Loan are summarized in the table below. The McClellan Park Whole Loan will be serviced under the pooling and servicing agreement for the BANK 2020-BNK30 securitization trust. See “Description of the Mortgage Pool—The Whole Loans—The Non-Serviced Pari Passu Whole Loans” and “Pooling and Servicing Agreement —Servicing of the Non-Serviced Mortgage Loans” in the Preliminary Prospectus.
| McClellan Park Whole Loan Summary | |||||
| Notes | Original Balance | Cut-off Date Balance | Note Holder | Controlling Piece | |
| A-1 | $75,000,000 | $75,000,000 | BANK 2020-BNK30 | Yes | |
| A-2 | $69,000,000 | $69,000,000 | WFCM 2020-C58 | No | |
| A-3 | $54,000,000 | $54,000,000 | BANK 2021-BNK31 | No | |
| A-4 | $36,000,000 | $36,000,000 | BANK 2021-BNK31 | No | |
| A-5 | $16,600,000 | $16,600,000 | BANK 2021-BNK32 | No | |
| A-6 | $75,000,000 | $75,000,000 | BMARK 2020-B21 | No | |
| A-7 | $16,400,000 | $16,400,000 | BMARK 2020-B22 | No | |
| A-8 | $16,000,000 | $16,000,000 | BMARK 2020-B22 | No | |
| Total Whole Loan | $358,000,000 | $358,000,000 | |||
The Borrower and the Borrower Sponsor. The borrower is McClellan Realty, LLC (the “McClellan Park Borrower”), a Delaware limited liability company and single purpose entity with two independent directors.
The borrower sponsor and non-recourse carveout guarantor is McClellan Business Park, LLC (the “Guarantor”). McClellan Business Park, LLC is a privately held company that was selected to acquire and redevelop McClellan Air Force Base in 1999. Today, the project consists of 3,000 acres with approximately 8.5 million SF of rentable space and 500 acres of developable land. The company is comprised of three entities, MBP Ventures, LLC, LDK Capital, LLC and Industrial Realty Group. MBP Ventures, LLC has acquired and developed real estate totaling over 20 million SF and more than 5,000 acres of land. LDK Capital, LLC has developed numerous master planned communities and business parks. Industrial Realty Group specializes in industrial properties and has holdings in excess of 100 million SF.
The Property. The McClellan Park Property is a portion of McClellan Park, a large office and industrial park encompassing 3,000-acres and approximately 8.5 million SF of leasable space, located west of Watt Avenue in an unincorporated area of Sacramento County, California. The McClellan Park Property represents the majority of McClellan Park with 6,925,484 SF and comprises 139 buildings spanning approximately 785.1 acres. The McClellan Park Property surrounds the 10,600-foot McClellan Airfield runway, which, according to the appraisal, is one of the west coast’s most active airstrips for private aircraft. The McClellan Park Property benefits from approximately seven miles of on-site rail, with multiple rails spurs, trans load yard, and rail served warehouses, which are serviced by both Burlington Northern Railroad and Union Pacific Railroad. Onsite amenities include a 112-room hotel, dining options, a gym, a credit union and a park.
Until July 2001, the McClellan Park Property served as McClellan Air Force Base, one of five major depots in the United States that provided repair and maintenance services to military aircraft. The McClellan Park Borrower was selected to acquire the base and implement an extensive redevelopment program. Since the acquisition in 2001, the borrower sponsor has invested more than $580 million in critical infrastructure, building improvements, and land development, which has driven the lease-up or sale of more than seven million SF of office and industrial space.
As of September 15, 2020, the McClellan Park Property was 86.8% leased by approximately 176 tenants, with no tenant accounting for more than 6.0% of the NRA or 7.0% of underwritten base rent. The McClellan Park Property has averaged 84.7% occupancy over the past five years. Since 2018, there has been over 3.4 million SF of leasing activity. Approximately 21.7% of the NRA and 37.5% of underwritten base rent is attributable to investment grade tenants.
This is not a research report and was not prepared by any Underwriters research department. Please see additional important information and qualifications at the end of this Term Sheet.
143
| Industrial-Warehouse | Loan #14 | Cut-off Date Balance: | $16,600,000 | |
| Various | McClellan Park | Cut-off Date LTV: | 60.2% | |
| McClellan, CA 95652 | UW NCF DSCR: | 2.90x | ||
| UW NOI Debt Yield: | 10.5% |
The following table presents a summary of the property types at the McClellan Park Property:
| Property Summary | |||
| Use Type | NRSF | % of NRSF | In Place Cut-Off Date Occupancy |
| Warehouse | 2,532,812 | 36.6% | 96.6% |
| Manufacturing | 1,660,684 | 24.0% | 91.6% |
| Research | 604,753 | 8.7% | 70.2% |
| Airfield | 843,221 | 12.2% | 78.6% |
| Total Industrial | 5,641,470 | 81.5% | 89.6% |
| Office | 1,020,349 | 14.7% | 72.5% |
| Residential | 157,254 | 2.3% | 71.8% |
| Commercial | 103,291 | 1.5% | 93.8% |
| Yard | 3,120 | 0.0% | 100.0% |
| Collateral Total | 6,925,484 | 100.0% | 86.8% |
Industrial (81.5% of NRA; 60.8% of underwritten gross rent). The industrial component of the McClellan Park Property includes over 5.6 million SF, representing 81.5% of NRA and 60.8% of underwritten gross rent (including rent attributed to grossed up vacant space), and encompasses warehouse, manufacturing, research, and airfield/hanger buildings. The cluster of manufacturing, warehouse, research, residential, and office space provides the opportunity for industrial tenants to lease complementary use products all within one park.
Office (14.7% of NRA; 31.8% of underwritten gross rent). The office component of the McClellan Park Property includes buildings designated as office and recreational (37 primary buildings totaling 1,020,349 SF). These buildings range in size from 800 to 331,670 SF, with most buildings below 15,000 SF in size. The median size within this set of buildings is 7,606 SF. Originally constructed from 1938 to 1992, many of the buildings have been renovated to various levels. Existing office tenants include a variety of larger and small public and private operations such as the USDA Forest Services, Gateway Charters, and Faneuil, Inc.
Residential (2.3% of NRA; 5.0% of underwritten gross rent). The residential component at the McClellan Park Property includes seven primary buildings, which include renovated and non-renovated dorm buildings. These buildings are consistent in size, ranging from 19,038 to 25,380 SF with a median of 24,000 SF. The subject residential space is currently 71.8% occupied by two tenants, the USDA Forest Service and AmeriCorps.
Commercial (1.5% of NRA; 2.5% of underwritten gross rent). Currently 93.8% leased, the retail portion of the McClellan Park Property consists of 11 buildings totaling over 103,291 SF of improved retail space. The retail operations provide tenants amenities such as a credit union, a gas station, restaurants, and a gym.
The following table presents certain information relating to the tenancy at the McClellan Park Property:
| Tenant Summary | |||||||||
| Tenant Name | Credit Rating (Fitch/Moody's/S&P)(1) | Tenant SF | Approx. % of SF | Annual UW Rent(2) | % of Total Annual UW Rent | Annual UW Rent PSF(2) | Lease Expiration | Renewal Options | Term. Options |
| Amazon | A+/A2/AA- | 417,637 | 6.0% | $2,568,468 | 6.5% | $6.15 | 6/30/2030 | 2, 5- year | N |
| Hydra Distribution | NR/NR/NR | 388,784 | 5.6% | $1,184,293 | 3.0% | $3.05 | 4/16/2025 | 1, 5-year | N |
| Dome Printing | NR/NR/NR | 320,000 | 4.6% | $1,033,815 | 2.6% | $3.23 | 11/17/2033 | 2, 5-year | N |
| McClellan Jet Services | NR/NR/NR | 280,839 | 4.1% | $1,031,119 | 2.6% | $3.67 | 9/12/2022 | None | Y(3) |
| Northrop Grumman Systems | BBB/Baa1/BBB | 267,618 | 3.9% | $2,801,193 | 7.0% | $10.47 | Multiple(4) | Various(5) | Y(6) |
| Subtotal/Wtd. Avg. | 1,674,878 | 24.2% | $8,618,888 | 21.7% | $5.15 | ||||
| Other Tenants(7) | 4,333,579 | 62.6% | $31,137,427 | 78.3% | $7.19 | ||||
| Vacant Space | 917,027 | 13.2% | $0 | 0.0% | $0.00 | ||||
| Total/Wtd. Avg.(8) | 6,925,484 | 100.0% | $39,756,315 | 100.0% | $6.62 | ||||
| (1) | Certain ratings are those of the parent company, whether or not the parent company guarantees the lease. |
| (2) | The Annual UW Rent and Annual UW Rent PSF shown above include rent steps through October 2021 totaling $1,210,817. The lender’s underwriting gives separate credit for straight-line rent averaging for investment grade tenants totaling $585,214 (see “Operating History and Underwritten Net Cash Flow” below),which credit is not included in the Annual UW Rent PSF and Annual UW Rent shown in the table above. |
| (3) | McClellan Jet Services has the right to terminate 1,373 SF of its space after November 30, 2023 with 30 days’ notice. |
| (4) | Northrup Grumman Systems’ lease for its 161,589 SF space and its 92,922 SF space expire on December 31, 2021 (collectively, the “NG Space A”), its 4,857 SF space expires on July 31, 2022 (“NG Space B”) and its 8,250 SF space expires on November 30, 2022 (“NG Space C”). |
| (5) | NG Space A lease has two 5-year options to renew with nine months’ notice, NG Space B lease has two, 1-year options to renew with six months’ notice and NG Space C has no renewal options. |
| (6) | Northrup Grumman may terminate NG Space B on December 1st of each year of its term with 180 days’ notice and payment of the unamortized portion of the funded tenant improvement allowance, plus unamortized leasing commissions and three months of the base rent payable for the month immediately preceding the termination date. |
| (7) | Includes two tenants, Siemens Industry, Inc. (65,785 SF) and Veterans Affairs (10,000 SF), that have leases starting in May 2021 and March 2021, respectively. |
| (8) | Wtd. Avg. Annual UW Rent PSF excludes vacant space. |
This is not a research report and was not prepared by any Underwriters research department. Please see additional important information and qualifications at the end of this Term Sheet.
144
| Industrial-Warehouse | Loan #14 | Cut-off Date Balance: | $16,600,000 | |
| Various | McClellan Park | Cut-off Date LTV: | 60.2% | |
| McClellan, CA 95652 | UW NCF DSCR: | 2.90x | ||
| UW NOI Debt Yield: | 10.5% |
The following table presents certain information relating to the lease rollover schedule at the McClellan Park Property:
| Lease Rollover Schedule(1)(2) | ||||||||
| Year | # of Leases Rolling | SF Rolling | Annual UW Rent PSF Rolling | Approx. % of Total SF Rolling | Approx. Cumulative % of SF Rolling | Total UW Rent Rolling | Approx. % of Total Rent Rolling | Approx. Cumulative % of Total Rent Rolling |
| MTM | 15 | 75,533 | $6.41 | 1.1% | 1.1% | $484,397 | 1.2% | 1.2% |
| 2020 | 17 | 150,128 | $9.33 | 2.2% | 3.3% | $1,399,982 | 3.5% | 4.7% |
| 2021 | 94 | 896,269 | $8.39 | 12.9% | 16.2% | $7,521,327 | 18.9% | 23.7% |
| 2022 | 63 | 1,044,895 | $7.90 | 15.1% | 31.3% | $8,252,111 | 20.8% | 44.4% |
| 2023 | 35 | 783,580 | $5.04 | 11.3% | 42.6% | $3,945,606 | 9.9% | 54.3% |
| 2024 | 21 | 463,243 | $4.92 | 6.7% | 49.3% | $2,279,219 | 5.7% | 60.1% |
| 2025 | 26 | 791,251 | $5.38 | 11.4% | 60.7% | $4,257,919 | 10.7% | 70.8% |
| 2026 | 5 | 152,898 | $6.61 | 2.2% | 62.9% | $1,010,198 | 2.5% | 73.3% |
| 2027 | 21 | 601,568 | $5.07 | 8.7% | 71.6% | $3,048,594 | 7.7% | 81.0% |
| 2028 | 21 | 233,106 | $11.59 | 3.4% | 75.0% | $2,702,656 | 6.8% | 87.8% |
| 2029 | 3 | 64,800 | $18.28 | 0.9% | 75.9% | $1,184,601 | 3.0% | 90.8% |
| 2030 | 5 | 420,757 | $6.10 | 6.1% | 82.0% | $2,568,468 | 6.5% | 97.2% |
| 2031 & Beyond | 13 | 330,429 | $3.33 | 4.8% | 86.8% | $1,101,237 | 2.8% | 100.0% |
| Vacant | 0 | 917,027 | $0.00 | 13.2% | 100.0% | $0 | 0.0% | 100.0% |
| Total/Wtd. Avg.(3) | 339 | 6,925,484 | $6.62 | 100.0% | $39,756,315 | 100.0% | ||
| (1) | Information is based on the underwritten rent roll. |
| (2) | Certain tenants may have lease termination options that are exercisable prior to the originally stated expiration date of the subject lease and that are not considered in the Lease Rollover Schedule. |
| (3) | Wtd. Avg. Annual UW Rent PSF excludes vacant space. |
COVID-19 Update. As of February 18, 2021, most tenants at the McClellan Park Property are open and operating. Approximately 99% of the tenants by square footage and by underwritten base rent made their full January rent payments. Approximately 95% of the tenants by square footage and 94% of the tenants by underwritten base rent made their full February rent payments. Four tenants, representing approximately 4.2% of underwritten base rent, received rent deferrals ranging from 3-5 months. Three of the four tenants concurrently extended their leases. Two tenants representing 0.2% of underwritten base rent have pending rent relief requests. As of February 18, 2021, the McClellan Park Whole Loan is current and is not subject to any modification or forbearance request.
The Market. The McClellan Park Property is located 3.6 miles north of the Interstate 80 on/off ramp, which provides access westbound towards the San Francisco Bay area and eastbound towards the Nevada border. The McClellan Park Property surrounds the McClellan Airfield and is immediately adjacent to the Sacramento McClellan Airport. The Sacramento International Airport is positioned 14.2 miles west of the McClellan Park Property and the deep-water Port of Sacramento is situated 16.1 miles southwest of the McClellan Park Property. Additionally, the McClellan Park Property is approximately 7.4 miles from downtown Sacramento.
According to the California Department of Finance, of the ten largest cities in California, Sacramento grew by the largest percentage (1.5%) in 2018. The City of Sacramento added more new residents than San Diego, San Francisco, Los Angeles, or San Jose in the same year. According to the appraisal, a large portion of Sacramento’s employment has historically been dominated by the State government and other public-sector employers. State and local government accounts for 26% of the region’s labor pool (approximately 225,000 employees).
According to a third party market research provider, the estimated 2020 population within a three- and five-mile radius of the McClellan Park Property was approximately 344,204 and 1,070,132, respectively; and the estimated 2020 average household income within the same radii was approximately $74,927 and $84,655, respectively.
According to a third-party market research report, the McClellan Park Property is situated within the McClellan industrial submarket of the Sacramento - CA industrial market. As of November 10, 2020, the industrial submarket reported a total inventory of approximately 17.4 million SF with a 5.2% vacancy rate and average asking rent of $9.23 PSF, triple net. The submarket vacancy rate has decreased from 20.3% in 2010 and has averaged 8.1% since 2015.
This is not a research report and was not prepared by any Underwriters research department. Please see additional important information and qualifications at the end of this Term Sheet.
145
| Industrial-Warehouse | Loan #14 | Cut-off Date Balance: | $16,600,000 | |
| Various | McClellan Park | Cut-off Date LTV: | 60.2% | |
| McClellan, CA 95652 | UW NCF DSCR: | 2.90x | ||
| UW NOI Debt Yield: | 10.5% |
The following table presents certain information relating to the appraisal’s market rent conclusions for the McClellan Park Property:
| Market Rent Summary | ||||||
| Warehouse | Warehouse – Amazon | Manufacturing | Office | Airfield | Research | |
| Market Rent (PSF/Month) | $0.40 | $0.50 | $0.45 | $1.10 | $0.52 | $0.90 |
| Lease Term (Years) | 4 | 4 | 4 | 4 | 4 | 4 |
| Lease Type (Reimbursements) | NNN | NNN | NNN | Full Service / Base Year | NNN | NNN |
| Rent Increase Projection | 3.00% per annum | 3.00% per annum | 3.00% per annum | 3.00% per annum | 3.00% per annum | 3.00% per annum |
| Tenant Improvements (New) | $3.00 PSF | $3.00 PSF | $5.00 PSF | $25.00 PSF | $10.00 PSF | $20.00 PSF |
| Tenant Improvements (Renew) | $1.00 PSF | $1.00 PSF | $1.00 PSF | $5.00 PSF | $1.00 PSF | $5.00 PSF |
The following table presents information relating to comparable office property sales for the McClellan Park Property:
| Comparable Property Sale Summary | ||||||||
| Property Name/Location | Sale Date | Year Built/ Renovated | Total NRA (SF) | Occupancy | Sale Price | Adjusted Sale Price(1) | Sale Price PSF | Appraiser’s Adjusted Sale Price PSF(1) |
Depot Park Fruitridge Rd. Sacramento, CA | Jun. 2018 | 1940/2000 | 2,144,568 | 89% | $126,590,000 | $170,471,710 | $59 | $79 |
Delta Industrial Portfolio Multiple Multiple | Aug. 2017 | 1997/NAP | 8,766,532 | 96% | $590,000,000 | $594,721,531 | $67 | $68 |
NW Mutual NV Ind. Portfolio Greg St, et al Sparks, Reno | May 2019 | 1995/NAP | 1,765,258 | 98% | $157,800,000 | $149,128,996 | $89 | $84 |
Texas Logistics Portfolio Multiple Multiple | Jul. 2019 | 1995/NAP | 2,682,696 | 91% | $248,000,000 | $221,349,247 | $92 | $83 |
Source: Appraisal.
| (1) | Adjusted sale price was adjusted for location, size, age/condition, features/amenities and economic characteristics (as applicable). |
This is not a research report and was not prepared by any Underwriters research department. Please see additional important information and qualifications at the end of this Term Sheet.
146
| Industrial-Warehouse | Loan #14 | Cut-off Date Balance: | $16,600,000 | |
| Various | McClellan Park | Cut-off Date LTV: | 60.2% | |
| McClellan, CA 95652 | UW NCF DSCR: | 2.90x | ||
| UW NOI Debt Yield: | 10.5% |
Operating History and Underwritten Net Cash Flow. The following table presents certain information relating to the historical operating performance and Underwritten Net Cash Flow at the McClellan Park Property:
| Cash Flow Analysis | ||||||
| 2017 | 2018 | 2019 | 9/30/2020 TTM | UW | UW PSF | |
| Gross Potential Base Rent | $30,020,185 | $34,154,288 | $36,215,976 | $38,587,412 | $38,545,498 | $5.57 |
| Contractual Rent Steps | $0 | $0 | $0 | $0 | $1,210,817(1) | $0.17 |
| Rent Average Benefit | $0 | $0 | $0 | $0 | $585,214 | $0.08 |
| TI Amortization(2) | $0 | $0 | $0 | $0 | $535,080 | $0.08 |
| Yard Rent(2)(3) | $0 | $0 | $0 | $0 | $4,145,429 | $0.60 |
| Grossed Up Vacant Space | $0 | $0 | $0 | $0 | $10,013,909(4) | $1.45 |
| Total Recoveries | $4,748,711 | $5,452,877 | $6,256,187 | $6,754,163 | $6,850,394 | $0.99 |
| Other Income(5) | $252,056 | $47,853 | $300,496 | $793,948 | $793,948 | $0.11 |
| Less Vacancy & Credit Loss | $0 | $0 | $0 | $0 | ($10,013,909)(6) | ($1.45) |
| Effective Gross Income | $35,020,952 | $39,655,018 | $42,772,659 | $46,135,523 | $52,666,380 | $7.60 |
| Real Estate Taxes | $3,963,293 | $4,255,008 | $4,257,566 | $4,625,532 | $4,454,422 | $0.64 |
| Insurance | $642,426 | $674,916 | $712,904 | $844,519 | $844,519 | $0.12 |
| Other Operating Expenses | $8,770,024 | $9,800,601 | $10,222,279 | $11,071,656 | $9,739,026 | $1.41 |
| Total Expenses | $13,375,743 | $14,730,525 | $15,192,749 | $16,541,707 | $15,037,967 | $2.17 |
| Net Operating Income(7) | $21,645,209 | $24,924,493 | $27,579,910 | $29,593,816 | $37,628,413 | $5.43 |
| CapEx | $0 | $0 | $0 | $0 | $1,038,823 | $0.15 |
| TI/LC | $0 | $0 | $0 | $0 | $1,731,371 | $0.25 |
| Net Cash Flow | $21,645,209 | $24,924,493 | $27,579,910 | $29,593,816 | $34,858,219 | $5.03 |
| Occupancy % | 80.3% | 83.4% | 88.4% | 86.8%(8) | 86.8%(6) | |
| NOI DSCR(9) | 1.80x | 2.08x | 2.30x | 2.46x | 3.13x | |
| NCF DSCR(9) | 1.80x | 2.08x | 2.30x | 2.46x | 2.90x | |
| NOI Debt Yield(9) | 6.0% | 7.0% | 7.7% | 8.3% | 10.5% | |
| NCF Debt Yield(9) | 6.0% | 7.0% | 7.7% | 8.3% | 9.7% | |
| (1) | Represents rent steps through October 2021. |
| (2) | Yard Rent and TI Amortization has historically been captured under base rent. |
| (3) | Yard Rent represents land that is leased to tenants for additional parking needs. It is typically co-terminous with the contractual obligations in the lease. |
| (4) | Grossed Up Vacant Space is grossed up at appraisal concluded market rents. |
| (5) | Other Income represents late fees, termination fees, excess rail usage and ancillary income. |
| (6) | Occupancy is based on the in-place rent roll dated September 15, 2020. Vacancy of 19% represents the economic vacancy. |
| (7) | The increase from 2017 to 2018 NOI was primarily due to an increase in occupancy from 80.3% to 83.4% and annual increases in existing tenant rental rates. The increase from 2018 NOI to 2019 NOI was primarily due to an increase in occupancy from 83.4% to 88.4% and annual increases in existing tenant rental rates. The increase in UW NOI from the TTM 9/30/2020 is partially driven by $1,210,817 in rent steps and $585,214 in straight line rent average for investment grade tenants. The other main driver is Amazon’s lease for 417,637 SF, under which it began paying rent in July of 2020. Its lease represents approximately $2.6 million of UW base rent and an additional $1.2 million of Yard Rent. Additionally, the UW base rent includes approximately $526,152 of UW rent from two tenants, Siemens Industry, Inc. (65,785 SF) and Veterans Affairs (10,000 SF) which have leases starting in May 2021 and March 2021, respectively. Lastly, the management fee is capped at $1.0 million. |
| (8) | Based on the underwritten rent roll dated September 15, 2020. |
| (9) | The NOI DSCR, NCF DSCR, NOI Debt Yield and NCF Debt Yield are based on the McClellan Park Whole Loan. |
Development Loan. In 2011, the Sacramento County Successor Agency, the successor agency to the Former Redevelopment Agency of the County of Sacramento (the “Development Agency”), made a $1,000,000 loan (the “Development Agency Loan”) to the predecessor-in-interest to the McClellan Park Borrower in connection with the renovation of portions of three buildings at the McClellan Park Property. The loan, which is due and payable in 2023, is secured by a deed of trust lien on such portion of the McClellan Park Property and is forgivable once the renovated space reaches 80% occupancy. At origination of the McClellan Park Whole Loan, the Development Agency entered into a subordination agreement that subordinated such deed of trust lien to the McClellan Park Whole Loan documents. The McClellan Park Borrower maintains that the occupancy required for forgiveness of the Development Agency Loan has been achieved and is currently negotiating loan forgiveness with the Development Agency. The amount reserved with lender for the Development Agency Loan (see “Reserves” in initial table above) has been certified by the Development Agency as sufficient to obtain the satisfaction and release of the deed of trust lien securing the Development Agency Loan. Provided no event of default is continuing, upon receipt of a payoff statement and wiring instructions from the Development Agency, the lender will disburse funds from such reserve to pay off the Development Agency Loan and, upon receipt of evidence that the lien has been released, disburse any remaining funds in the reserve to the McClellan Park Borrower (or, if a cash trap event period then exists, to the cash management account with the lender).
Release of Property. Provided no event of default is continuing, the McClellan Park Borrower is permitted to issue a partial reconveyance, satisfaction or release of one or more income producing parcels from the lien of McClellan Park Whole Loan (collectively, an “Income Producing Parcel Release”), subject, but not limited, to the following conditions:
| ● | the Income Producing Parcel Release is conveyed to a person other than the McClellan Park Borrower; |
This is not a research report and was not prepared by any Underwriters research department. Please see additional important information and qualifications at the end of this Term Sheet.
147
| Industrial-Warehouse | Loan #14 | Cut-off Date Balance: | $16,600,000 | |
| Various | McClellan Park | Cut-off Date LTV: | 60.2% | |
| McClellan, CA 95652 | UW NCF DSCR: | 2.90x | ||
| UW NOI Debt Yield: | 10.5% |
| ● | the lender having received a Release Price (as defined below), in addition to any yield maintenance and interest shortfall then due (if any); |
| ● | immediately following the Income Producing Parcel Release, the net cash flow debt yield is no less than 10.0%; |
| ● | immediately following the Income Producing Parcel Release, at least 100 parcels are subject to the lien of the McClellan Park Whole Loan and no single parcel being more than 10.0% of the remaining aggregate adjusted net cash flow; |
| ● | immediately following the release, at least 60.0% of the rentable square footage remaining at the McClellan Park Property will be used for industrial purposes; |
| ● | the lender having received reasonably satisfactory evidence that, following the release, the McClellan Park Property complies with all applicable zoning laws, land use, parking requirements, major leases, and permitted encumbrances as defined in the McClellan Park Whole Loan documents; and |
| ● | the lender’s reasonable satisfaction that the release will satisfy REMIC requirements. |
Provided no event of default is continuing, the McClellan Park Borrower is permitted to issue a partial reconveyance, satisfaction or release of one or more vacant non-income providing parcels from the lien of McClellan Park Whole Loan (collectively, an “Non-Income Producing Parcel Release”) and, upon completion of the condominium conversion (as described below), the McClellan Park Borrower is permitted to release the Twin Rivers NIP Parcel (as defined below) as a Non-Income Producing Parcel Release, subject, but not limited, to the following conditions:
| ● | the Non-Income Producing Parcel Release is conveyed to a person other than the McClellan Park Borrower; |
| ● | the lender having received evidence that no portion of the Non-Income Producing Parcel Release is required to remain part of the McClellan Park Property pursuant to the terms of any leases, legal agreements or for use as parking, access, ingress/egress and/or storage at the McClellan Park Property; and |
| ● | the lender having received evidence that the Non-Income Producing Parcel Release is occurring solely (i) to accommodate parcel/tax lot adjustments for potential development by an affiliate of the McClellan Park Borrower or guarantor or (ii) for the sale of such Non-Income Producing Parcel Release parcel to a third party that is not an affiliate of the McClellan Park Borrower or guarantor. |
“Release Price” means (a) with respect to the Twin Rivers Release Parcel (as defined below), an amount equal to 100% of its allocated loan amount ($10,447,854), however, as provided below, following such condominium conversion of the Twin Rivers NIP Parcel to a commercial condominium to effectuate the conveyance of the Twin Rivers condominium unit to Twin Rivers Unified School District, the Twin Rivers NIP Parcel may be released as a free release; and (b) with respect to each other release parcel, (i) for the first 10% of the original principal balance of the McClellan Park Whole Loan being prepaid, 110% of the allocated loan amount of the subject release parcel(s) and (ii) for the remaining McClellan Park Whole Loan collateral, 115% of the allocated loan amount of the subject release parcel(s). A partial release of the Twin Rivers Release Parcel at the Release Price set forth in clause (a) above will count towards the 10% threshold set forth in clause (b)(i) above if such threshold has not yet been reached.
“Twin Rivers Parcel” is comprised of (i) a single tenant building leased to Twin Rivers Unified School District and identified as APN 215-0320-127 (the “Twin Rivers NIP Parcel”), and (ii) a multi-tenant building identified as APN 215-0320–126 (the “Twin Rivers Release Parcel”).
Condominium Conversion Option. Following the date which is the earlier of (x) November 13, 2021 and (y) 60 days following the last securitization of the component notes evidencing the McClellan Park Whole Loan and provided no event of default is continuing, the McClellan Park Borrower is permitted to convert the Twin Rivers Parcel to a commercial condominium form of ownership, subject, but not limited, to the following conditions:
| ● | the condominium regime is required to create two or more condominium units, one of which will consist solely of the Twin Rivers NIP Parcel and each condominium unit will have its own separate tax parcel; and |
| ● | the McClellan Park Borrower will deliver to the lender (i) an irrevocable proxy from the McClellan Park Borrower granting the lender the right to vote, on the McClellan Park Borrower’s behalf in any vote taken by the condominium association after the acceleration of the McClellan Park Whole Loan and (ii) a conditional resignation (effective upon the lender’s demand upon the acceleration of the McClellan Park Whole Loan) of any board members that are appointed or controlled by the McClellan Park Borrower. |
This is not a research report and was not prepared by any Underwriters research department. Please see additional important information and qualifications at the end of this Term Sheet.
148
(THIS PAGE INTENTIONALLY LEFT BLANK)
This is not a research report and was not prepared by any Underwriter’s research department. Please see additional important information and qualifications at the end of this Term Sheet.
149
| Mortgage Loan No. 15 – 111 Fourth Avenue |
| Mortgage Loan Information | Property Information | |||||||
| Mortgage Loan Seller: | MSMCH | Single Asset/Portfolio: | Single Asset | |||||
| Credit Assessment (Moody’s/DBRSM/Fitch): | Aaa/AAA/AAsf | Location: | New York, NY 10003 | |||||
| Original Balance: | $15,000,000 | General Property Type: | Multifamily | |||||
| Cut-off Date Balance: | $15,000,000 | Detailed Property Type: | Cooperative | |||||
| % of Initial Pool Balance: | 1.7% | Title Vesting: | Fee | |||||
| Loan Purpose: | Refinance | Year Built/Renovated: | 1921/1988 | |||||
| Borrower Sponsor(1): | N/A | Size: | 161 Units | |||||
| Guarantor(1): | N/A | Cut-off Date Balance per Unit: | $93,168 | |||||
| Mortgage Rate: | 2.7250% | Maturity Date Balance per Unit: | $78,140 | |||||
| Note Date: | 1/26/2021 | Property Manager: | AKAM Associates, Inc. | |||||
| First Payment Date: | 3/1/2021 | |||||||
| Maturity Date: | 2/1/2031 | Underwriting and Financial Information(3) | ||||||
| Original Term to Maturity: | 120 months | UW NOI(4): | $2,874,259 | |||||
| Original Amortization Term: | 360 months | UW NOI Debt Yield(4): | 19.2% | |||||
| IO Period: | 36 months | UW NOI Debt Yield at Maturity(4): | 22.8% | |||||
| Seasoning: | 1 month | UW NCF DSCR(4): | 3.86x | |||||
| Prepayment Provisions: | LO (25); DEF (91); O (4) | Most Recent NOI(5): | N/A | |||||
| Lockbox/Cash Mgmt Status: | None | 2nd Most Recent NOI(5): | N/A | |||||
| Additional Debt Type: | No | 3rd Most Recent NOI(5): | N/A | |||||
| Additional Debt Balance: | N/A | Most Recent Occupancy(6): | N/A | |||||
| Future Debt Permitted (Type)(2): | Yes (Subordinate Secured) | 2nd Most Recent Occupancy(6): | N/A | |||||
| 3rd Most Recent Occupancy(6): | N/A | |||||||
| Reserves | Appraised Value (as of)(7): | $187,060,000 (12/7/2020) | ||||||
| Type | Initial | Monthly | Cap | Appraised Value per Unit(7): | $1,161,863 | |||
| RE Tax: | $364,985 | $182,492 | N/A | Cut-off Date LTV Ratio(7): | 8.0% | |||
| Insurance: | $13,968 | $6,984 | N/A | Maturity Date LTV Ratio(7): | 6.7% | |||
| Deferred Maintenance: | $21,000 | $0 | N/A | Coop-Rental Value(8): | $70,000,000 (12/7/2020) | |||
| Facade Reserve | $1,000,000 | $0 | N/A | Coop-LTV as Rental(8): | 21.4% | |||
| Sources and Uses | ||||||
| Sources | Proceeds | % of Total | Uses | Proceeds | % of Total | |
| Loan Amount: | $15,000,000 | 100.0% | Loan Payoff: | $3,590,840 | 23.9% | |
| Return of Equity: | $9,470,071 | 63.1% | ||||
| Reserves: | $1,399,952 | 9.3% | ||||
| Closing Costs: | $539,137 | 3.6% | ||||
| Total Sources: | $15,000,000 | 100.0% | Total Uses: | $15,000,000 | 100.0% | |
| (1) | The 111 Fourth Avenue Property (as defined below) is owned by the 111 Fourth Avenue Borrower (as defined below), which is a cooperative housing corporation. No individual or entity (other than the 111 Fourth Avenue Borrower) has recourse obligations with respect to the 111 Fourth Avenue Mortgage Loan (as defined below), including pursuant to any guaranty or environmental indemnity. |
| (2) | The 111 Fourth Avenue Borrower is permitted to incur subordinate debt (including a revolving or term line of credit) secured by the 111 Fourth Avenue Property, subject to the lender’s consent (which may not be unreasonably withheld, conditioned or delayed) and satisfaction of the following conditions (i) such additional financing must be in a maximum principal amount not exceeding the lesser of (A) $5,000,000 and (B) an amount which will not result in an aggregate loan to value ratio of the 111 Fourth Avenue Mortgage Loan and such subordinate debt in excess of 35%, (ii) the subordinate lender enters into a subordination and standstill agreement reasonably acceptable to the mortgage lender, (iii) the subordinate financing has a maturity date that is either co-terminous with or extends beyond the term of the 111 Fourth Avenue Mortgage Loan, and (iv) the 111 Fourth Avenue Borrower delivers a rating agency confirmation to the lender prior to entering into such subordinate financing. |
| (3) | The novel coronavirus pandemic is an evolving situation and could impact the 111 Fourth Avenue Mortgage Loan more severely than assumed in the underwriting of the 111 Fourth Avenue Mortgage Loan and could adversely affect the NOI, NCF and occupancy information, as well as the appraised value and the DSCR, LTV and Debt Yield metrics presented above and herein. See "Risk Factors—Risks Related to Market Conditions and Other External Factors—The Coronavirus Pandemic Has Adversely Affected the Global Economy and Will Likely Adversely Affect the Performance of the Mortgage Loans" in the Preliminary Prospectus. |
| (4) | See “Underwritten Net Cash Flow” section below. |
| (5) | Most Recent NOI, 2nd Most Recent NOI and 3rd Most Recent NOI are not available. Residential cooperatives are not-for-profit entities that set maintenance fees to cover current expenses and plan for future capital needs. A residential cooperative can increase or decrease maintenance fees according to its anticipated expenses and level of cash reserves. The historical NOI figures are not representative of the cash flow generated by the 111 Fourth Avenue Property if it were operated as a multifamily rental property. |
| (6) | Occupancy is not reported as all residential units are owned by tenant-shareholders. |
| (7) | For purposes of determining the Appraised Value, the Cut-off Date LTV Ratio and the Maturity Date LTV Ratio, the value estimate reflected in the appraisal of the 111 Fourth Avenue Property is determined as if such residential cooperative property is operated as a residential cooperative and, in general, such value equals the gross sellout value of all residential cooperative units in such residential cooperative property, based in part on various comparable sales of cooperative apartment units in the market. Such value does not represent a market value. In addition, the appraised value set forth above is based on the extraordinary assumption that all repairs relating to the partial collapse of the 111 Fourth Avenue Property’s façade and windows will be completed within the specified timeline (within the calendar year of 2021) and budget, and the partial vacate order with respect to the parking lot at the 111 Fourth Avenue Property will be rescinded. See “Description of the Mortgage Pool—Redevelopment, Renovation and Expansion” in the Preliminary Prospectus. |
| (8) | The Coop-Rental Value and the Coop-LTV as Rental assumes the 111 Fourth Avenue Property is operated as a multifamily rental property. |
The Mortgage Loan. The fifteenth largest mortgage loan (the “111 Fourth Avenue Mortgage Loan”) is evidenced by a promissory note in the original principal amount of $15,000,000 and secured by a first priority fee mortgage encumbering a cooperative apartment complex comprising 161 units in one, 13-story building located in New York, New York (the “111 Fourth Avenue Property”). The proceeds of the 111 Fourth Avenue Mortgage Loan were used to refinance existing debt, return equity to the 111 Fourth Avenue Borrower and pay closing costs.
This is not a research report and was not prepared by any Underwriters research department. Please see additional important information and qualifications at the end of this Term Sheet.
150
| Multifamily – Cooperative | Loan #15 | Cut-off Date Balance: | $15,000,000 | |
| 111 Fourth Avenue | 111 Fourth Avenue | Cut-off Date LTV: | 8.0% | |
| New York, NY 10003 | U/W NCF DSCR: | 3.86x | ||
| U/W NOI Debt Yield: | 19.2% |
The Borrower. The borrower is Fourth Avenue Owners, Corp., a cooperative housing corporation organized under the laws of the State of New York (the “111 Fourth Avenue Borrower”). The 111 Fourth Avenue Property is owned in fee simple by the 111 Fourth Avenue Borrower. No individual or entity (other than the 111 Fourth Avenue Borrower) has recourse obligations with respect to the 111 Fourth Avenue Mortgage Loan, including pursuant to any guaranty or environmental indemnity.
The Property. The 111 Fourth Avenue Property is a cooperative apartment complex with 161 residential units and 3 commercial suites, situated within a 13-story building in New York, New York. The 161 rentable residential units consist of 91,402 SF of total NRA and the commercial units consist of 9,540 SF of total NRA. The 161 residential units are 100.0% owned by tenant shareholders. Two of the three commercial units are currently leased to two tenants: Valley National Bank (3,350 SF and 35.1% of commercial NRA through December 2022), a regional bank branch that has been at the 111 Fourth Avenue Property since 2007, and Dr. Isaac Datikashvili (2,350 SF and 24.6% of commercial NRA through June 2022), a dental office that has been at the 111 Fourth Avenue Property since 2012. The landlord is in the process of negotiating a lease for the remaining vacant commercial unit (3,840 SF); however there is no assurance a lease will be entered into. Amenities at the 111 Fourth Avenue Property include a fitness center, a laundry room on each floor, tenant storage units, bicycle storage, an on-site superintendent, and 22 surface parking spaces. Since 2016, approximately $790,000 has been spent on capital expenditures, including façade restoration, sidewalk repairs, and boiler/water cooler upgrades. The 111 Fourth Avenue Borrower currently plans to use proceeds of the 111 Fourth Avenue Mortgage Loan to invest approximately $9.9 million over the next two years on façade repairs, a new roof and roof gardens, and a new HVAC and boiler system; however, other than the façade renovations, for which $1,000,000 was escrowed with the lender at origination, such renovations are not required and have not been reserved for under the 111 Fourth Avenue Mortgage Loan documents. See “Description of the Mortgage Pool—Redevelopment, Renovation and Expansion” in the Preliminary Prospectus.
The table below shows the residential apartment unit mix at the 111 Fourth Avenue Property:
| Unit Mix | ||||
| Unit Type | Units | % of Total Units | Average SF per Unit | Total SF |
| Studio | 60 | 37.3% | 414 | 24,861 |
| 1 Bedroom | 80 | 49.7% | 553 | 44,203 |
| 2 Bedroom | 18 | 11.2% | 944 | 16,989 |
| 3 Bedroom | 3 | 1.9% | 1,783 | 5,349 |
| Total/Wtd. Avg. | 161 | 100.0% | 568 | 91,402 |
Source: Appraisal
COVID-19 Update. As of March 5, 2021, the 111 Fourth Avenue Mortgage Loan is current as of its March debt service and is not subject to any forbearance, modification or debt service relief request. As of February 18, 2021, the 111 Fourth Avenue Borrower has reported that 100.0% of units have paid their February 2021 maintenance payments and no commercial tenants or residential coop owners have requested rent or maintenance relief.
The Market. The 111 Fourth Avenue Property is located in the East Village neighborhood of Manhattan. The East Village is roughly bounded by East 14th Street to the north, Bowery and Cooper Square to the west, East Houston Street to the south and the East River to the east. The East Village is located in close proximity to the Gramercy, Nolita, Little Italy and the Lower East Side neighborhoods of Manhattan. Primary access to the 111 Fourth Avenue Property is provided by public bus stops located on the same block as the 111 Fourth Avenue Property and is serviced by the M1, M2 and M3 bus lines. The 111 Fourth Avenue Property is in close proximity to the 14th Street Union Square subway station, which provides access to the 4, 5, 6, L, N, Q, R and W lines. According to the appraisal, the 111 Fourth Avenue Property is located within the East Village submarket of the New York City apartment market. According to the appraisal, as of the third quarter of 2020, the East Village submarket had an inventory of 33,927 units, a vacancy rate of 3.7% and average asking rent per month of $4,082. According to the appraisal, as of the third quarter of 2020, the New York City apartment market had an inventory of approximately 1.4 million units, a vacancy rate of 4.4% and average asking rent per month of $2,716.
The following table presents certain information relating to multifamily rental properties comparable to the 111 Fourth Avenue Property:
| Comparable Rental Properties(1) | ||||||
| Property | Year Built | # Units | Occupancy | Average SF per Unit | Average Monthly Rent per Unit | Average Monthly Rent PSF |
| 111 Fourth Avenue | 1921 | 161 | 95.0%(2) | 568 | $3,194(3) | $5.63(3) |
| 143 Avenue B | 1928 | 82 | 97.0% | 532 | $3,320 | $6.25 |
| 29 Avenue B | 1900 | 52 | 98.0% | 617 | $2,962 | $4.78 |
| 201 East 12th Street | 1930 | 120 | 97.0% | 750 | $2,808 | $3.67 |
| 225 East 6th Street | 1996 | 86 | 97.0% | 585 | $3,603 | $6.11 |
| 250 E Houston Street | 1989 | 132 | 99.0% | 764 | $4,674 | $5.95 |
| 115 4th Avenue | 1905 | 70 | 97.0% | 1,639 | $7,871 | $4.73 |
| 240 East 10th Street | 1999 | 39 | 97.0% | 1,597 | $8,764 | $5.44 |
Source: Appraisal.
| (1) | The comparable properties are not rent restricted. |
| (2) | Occupancy reported reflects the vacancy assumption in the related appraisal for purposes of determining the appraised value of the 111 Fourth Avenue Property as a multifamily rental property. |
| (3) | The average rent for the 111 Fourth Avenue Property is based on estimated market rents as determined by the appraisal. However, approximately 100.0% of the residential cooperative units at the 111 Fourth Avenue Property were rent restricted prior to the cooperative conversion and accordingly would again be subject to rent restrictions if the 111 Fourth Avenue Property were operated as a multifamily rental property. See “Risk Factors—Risks Relating to the Mortgage Loans—Residential Cooperative Properties Have Special Risks” in the Preliminary Prospectus. |
This is not a research report and was not prepared by any Underwriters research department. Please see additional important information and qualifications at the end of this Term Sheet.
151
| Multifamily – Cooperative | Loan #15 | Cut-off Date Balance: | $15,000,000 | |
| 111 Fourth Avenue | 111 Fourth Avenue | Cut-off Date LTV: | 8.0% | |
| New York, NY 10003 | U/W NCF DSCR: | 3.86x | ||
| U/W NOI Debt Yield: | 19.2% |
Underwritten Net Cash Flow. The following table presents certain information relating to the Underwritten Net Cash Flow at the 111 Fourth Avenue Property:
| Cash Flow Analysis(1)(2) | ||
| UW | UW Per Unit | |
| Gross Potential Rent | $7,012,600 | $43,556.52 |
| Other Income | $157,950 | $981.06 |
| Reimbursements | $46,394 | $288.16 |
| Less Vacancy & Credit Loss(3) | ($619,614) | ($3,848.53) |
| Effective Gross Income | $6,597,330 | $40,977.21 |
| Real Estate Taxes | $2,189,907 | $13,601.91 |
| Insurance | $89,014 | $552.88 |
| Other Expenses | $1,444,150 | $8,969.88 |
| Total Expenses | $3,723,071 | $23,124.66 |
| Net Operating Income | $2,874,259 | $17,852.54 |
| Capital Expenditures | $50,356 | $312.77 |
| Net Cash Flow | $2,823,903 | $17,539.77 |
| Occupancy %(3) | 90.6% | |
| NOI DSCR (P&I) | 3.92x | |
| NOI DSCR (IO) | 6.94x | |
| NCF DSCR (P&I) | 3.86x | |
| NCF DSCR (IO) | 6.81x | |
| NOI Debt Yield | 19.2% | |
| NCF Debt Yield | 18.8% | |
| | |
| (1) | For the avoidance of doubt, no COVID-19 specific adjustments have been incorporated in the lender underwriting. |
| (2) | Residential cooperatives are generally organized and operated as not-for-profit entities that set maintenance fees to cover current expenses and plan for future capital needs. The UW Net Operating Income and the UW Net Cash Flow for The 111 Fourth Avenue Property are the projected net operating income and the projected net cash flow, respectively, reflected in the appraisal. The projected net operating income, in general, equals projected effective gross income at the 111 Fourth Avenue Property assuming that it is operated as a multifamily rental property with rents and other income set at the prevailing market rates, reduced by underwritten property operating expenses and a market-rate vacancy assumption, in each case as determined by the appraiser. While such projected net operating income assumes the 111 Fourth Avenue Property is rented at market rates, 100% of the residential cooperative units at the 111 Fourth Avenue Property were rent restricted prior to the cooperative conversion and accordingly would again be subject to rent restrictions if the 111 Fourth Avenue Property were operated as a multifamily rental property. The projected net cash flow equals the projected net operating income reduced by the projected replacement reserves as determined by the appraiser. The projected rental income used in such determinations differs materially from the scheduled monthly maintenance payments from the tenant-shareholders at the 111 Fourth Avenue Property. See “Risk Factors—Risks Relating to the Mortgage Loans—Residential Cooperative Properties Have Special Risks” in the Preliminary Prospectus. |
| (3) | Occupancy % and Vacancy & Credit Loss reported reflect the vacancy assumption in the related appraisal for purposes of determining the appraised value of the 111 Fourth Avenue Property as a multifamily rental property. |
This is not a research report and was not prepared by any Underwriters research department. Please see additional important information and qualifications at the end of this Term Sheet.
152
| BANK 2021-BNK32 |
This material was prepared by sales, trading, banking or other non-research personnel of one of the following: Morgan Stanley & Co. LLC, Morgan Stanley & Co. International Limited, Morgan Stanley Japan Limited and/or Morgan Stanley Dean Witter Asia Limited (together with their affiliates, hereinafter “Morgan Stanley”), Wells Fargo Securities, LLC (together with its affiliates, “Wells Fargo”), BofA Securities, Inc. (together with its affiliates, “BofA Securities”), Academy Securities, Inc. (together with its affiliates, “Academy”) and Drexel Hamilton, LLC (together with its affiliates, “Drexel” and, collectively with Morgan Stanley, Wells Fargo, BofA Securities and Academy, the “Underwriters”). This material was not produced by an Underwriter’s research analyst, although it may refer to an Underwriter’s research analyst or research report. Unless otherwise indicated, these views (if any) are the author’s and may differ from those of the fixed income or equity research departments of the Underwriters or others in those firms.
This material may have been prepared by or in conjunction with the respective trading desks of the Underwriters that may deal as principal in or own or act as market maker or liquidity provider for the securities/instruments (or related derivatives) mentioned herein. The trading desk may have accumulated a position in the subject securities/instruments based on the information contained herein. Trading desk materials are not independent of the proprietary interests of the Underwriters, which may conflict with your interests. Each of the Underwriters may also perform or seek to perform investment banking services for the issuers of the securities and instruments mentioned herein.
The information contained in this material is preliminary as of the date hereof. This material is subject to change, completion or amendment from time to time. The information in this material supersedes information in any other communication relating to the securities referred to in this material; provided, that the information in this material will be superseded by similar information delivered to you as part of a preliminary prospectus. This material is not a solicitation to participate in any trading strategy, and is not an offer to sell any security or instrument or a solicitation of an offer to buy or sell any security or instrument in any jurisdiction where an offer, solicitation or sale is not permitted. Unless otherwise set forth in this material, any securities referred to in this material may not have been registered under the U.S. Securities Act of 1933, as amended, and, if not, may not be offered or sold absent an exemption therefrom. Recipients are required to comply with any legal or contractual restrictions on their purchase, holding, sale, exercise of rights or performance of obligations under any securities/instruments transaction.
The securities/instruments discussed in this material may not be suitable for all investors. This material has been prepared and issued by the Underwriters for intended distribution to market professionals and institutional investor clients. Other recipients should seek independent investment advice prior to making any investment decision based on this material. This material does not provide individually tailored investment advice or offer tax, regulatory, accounting or legal advice. Prior to entering into any proposed transaction, recipients should determine, in consultation with their own investment, legal, tax, regulatory and accounting advisors, the economic risks and merits, as well as the legal, tax, regulatory and accounting characteristics and consequences, of the transaction. You should consider this material as only a single factor in making an investment decision.
The value of and income from investments may vary because of changes in interest rates, foreign exchange rates, default rates, prepayment rates, securities/instruments prices, market indexes, operational or financial conditions of companies or other factors. There may be time limitations on the exercise of options or other rights in securities/instruments transactions. Past performance is not necessarily a guide to future performance. Estimates of future performance are based on assumptions that may not be realized. Actual events may differ from those assumed and changes to any assumptions may have a material impact on any projections or estimates. Other events not taken into account may occur and may significantly affect the projections or estimates. Certain assumptions may have been made for modeling purposes only to simplify the presentation and/or calculation of any projections or estimates, and the Underwriters do not represent that any such assumptions will reflect actual future events. Accordingly, there can be no assurance that estimated returns or projections will be realized or that actual returns or performance results will not materially differ from those estimated herein. Some of the information contained in this document may be aggregated data of transactions in securities or other financial instruments executed by an Underwriter that has been compiled so as not to identify the underlying transactions of any particular customer.
Notwithstanding anything herein to the contrary, the Underwriters and each recipient hereof (and their employees, representatives, and other agents) may disclose to any and all persons, without limitation of any kind from the commencement of discussions, the U.S. federal and state income tax treatment and tax structure of the transaction and all materials of any kind (including opinions or other tax analyses) that are provided to it relating to the tax treatment and tax structure (as such terms are defined in Treasury Regulation 1.6011-4). For this purpose, "tax structure" is limited to facts relevant to the U.S. federal and state income tax treatment of the transaction and does not include information relating to the identity of the parties, their affiliates, agents or advisors. This authorization of tax disclosure is retroactively effective to the commencement of discussions with prospective investors regarding the transactions contemplated herein.
THE DISTRIBUTION OF THIS MATERIAL (A) IF MADE BY A PERSON WHO IS NOT AN AUTHORIZED PERSON UNDER THE FINANCIAL SERVICES AND MARKETS ACT 2000 (“FSMA”), IS BEING MADE ONLY TO, OR DIRECTED ONLY AT, PERSONS WHO (I) ARE OUTSIDE THE UNITED KINGDOM, OR (II) HAVE PROFESSIONAL EXPERIENCE IN MATTERS RELATING TO INVESTMENTS AND QUALIFY AS INVESTMENT PROFESSIONALS IN ACCORDANCE WITH ARTICLE 19(5) OF THE FINANCIAL SERVICES AND MARKETS ACT 2000 (FINANCIAL PROMOTION) ORDER 2005 (AS AMENDED, THE “FINANCIAL PROMOTION ORDER”), OR (III) ARE PERSONS FALLING WITHIN ARTICLE 49(2)(A) THROUGH (D) (“HIGH NET WORTH COMPANIES, UNINCORPORATED ASSOCIATIONS, ETC.”) OF THE FINANCIAL PROMOTION ORDER OR, (IV) ARE PERSONS TO WHOM THIS MATERIAL MAY OTHERWISE LAWFULLY BE COMMUNICATED OR DIRECTED; AND (B) IF MADE BY A PERSON WHO IS AN AUTHORIZED PERSON UNDER THE FSMA, IS BEING MADE ONLY TO, OR DIRECTED ONLY AT, PERSONS WHO (I) ARE OUTSIDE THE UNITED KINGDOM, OR (II) HAVE PROFESSIONAL EXPERIENCE OF PARTICIPATING IN UNREGULATED SCHEMES (AS DEFINED FOR PURPOSES OF THE FINANCIAL SERVICES AND MARKETS ACT 2000 (PROMOTION OF COLLECTIVE INVESTMENT SCHEMES) (EXEMPTIONS) ORDER 2001 (AS AMENDED, THE “PROMOTION OF COLLECTIVE INVESTMENT SCHEMES EXEMPTIONS ORDER”)) AND QUALIFY AS INVESTMENT PROFESSIONALS IN ACCORDANCE WITH ARTICLE 14(5) OF THE PROMOTION OF COLLECTIVE INVESTMENT SCHEMES EXEMPTIONS ORDER, OR (III) ARE PERSONS FALLING WITHIN ARTICLE 22(2)(A) THROUGH (D) (HIGH NET WORTH COMPANIES, UNINCORPORATED ASSOCIATIONS, ETC.) OF THE PROMOTION OF COLLECTIVE INVESTMENT SCHEMES EXEMPTIONS ORDER, OR (IV) ARE PERSONS TO WHOM THE ISSUING ENTITY MAY LAWFULLY BE PROMOTED IN ACCORDANCE WITH SECTION 4.12 OF THE FCA HANDBOOK CONDUCT OF BUSINESS SOURCEBOOK.
THE OFFERED CERTIFICATES HAVE NOT BEEN AND WILL NOT BE REGISTERED UNDER THE FINANCIAL INSTRUMENTS AND EXCHANGE LAW OF JAPAN, AS AMENDED (THE “FIEL”), AND DISCLOSURE UNDER THE FIEL HAS NOT BEEN AND WILL NOT BE MADE WITH RESPECT TO THE OFFERED CERTIFICATES. ACCORDINGLY, EACH OF MORGAN STANLEY & CO. LLC, WELLS FARGO SECURITIES, LLC, BOFA SECURITIES, INC., ACADEMY SECURITIES, INC. AND DREXEL HAMILTON, LLC HAS REPRESENTED AND AGREED THAT IT HAS NOT, DIRECTLY OR INDIRECTLY, OFFERED OR SOLD AND WILL NOT, DIRECTLY OR INDIRECTLY, OFFER OR SELL ANY OFFERED CERTIFICATES IN JAPAN OR TO, OR FOR THE BENEFIT OF, ANY RESIDENT OF JAPAN (WHICH TERM AS USED IN THIS MATERIAL MEANS ANY PERSON RESIDENT IN JAPAN, INCLUDING ANY CORPORATION OR OTHER ENTITY ORGANIZED UNDER THE LAWS OF JAPAN) OR TO OTHERS FOR REOFFERING OR RE SALE, DIRECTLY OR INDIRECTLY, IN JAPAN OR TO, OR FOR THE BENEFIT OF, ANY RESIDENT OF JAPAN EXCEPT PURSUANT TO AN EXEMPTION FROM THE REGISTRATION REQUIREMENTS OF, AND OTHERWISE IN COMPLIANCE WITH, THE FIEL AND OTHER RELEVANT LAWS, REGULATIONS AND MINISTERIAL GUIDELINES OF JAPAN. AS PART OF THIS OFFERING OF THE OFFERED CERTIFICATES, THE UNDERWRITERS MAY OFFER THE OFFERED CERTIFICATES IN JAPAN TO UP TO 49 OFFEREES IN ACCORDANCE WITH THE ABOVE PROVISIONS.
This is not a research report and was not prepared by any Underwriter’s research department. Please see additional important information and qualifications at the end of this Term Sheet.
153