| FREE WRITING PROSPECTUS | ||
| FILED PURSUANT TO RULE 433 | ||
| REGISTRATION FILE NO.: 333-227446-16 | ||
 |  |  |
BANK 2021-BNK35
Free Writing Prospectus
Structural and Collateral Term Sheet
$1,394,856,187
(Approximate Total Mortgage Pool Balance)
$1,181,007,000
(Approximate Offered Certificates)
Morgan Stanley Capital I Inc.
as Depositor
Morgan Stanley Mortgage Capital Holdings LLC
Bank of America, National Association
Wells Fargo Bank, National Association
National Cooperative Bank, N.A.
as Sponsors and Mortgage Loan Sellers
Commercial Mortgage Pass-Through Certificates
Series 2021-BNK35
July 22, 2021
MORGAN STANLEY Co-Lead Bookrunner Manager | WELLS FARGO SECURITIES Co-Lead Bookrunner Manager | BofA SECURITIES Co-Lead Bookrunner Manager |
Academy Securities, Inc. Co-Manager | Drexel Hamilton Co-Manager |
STATEMENT REGARDING THIS FREE WRITING PROSPECTUS
The depositor has filed a registration statement (including a prospectus) with the SEC (File No. 333-227446) for the offering to which this communication relates. Before you invest, you should read the prospectus in that registration statement and other documents the depositor has filed with the SEC for more complete information about the depositor, the issuing entity and this offering. You may get these documents for free by visiting EDGAR on the SEC web site at www.sec.gov. Alternatively, the depositor or any underwriter or any dealer participating in the offering will arrange to send you the prospectus if you request it by calling toll free 1-866-718-1649 or by email to prospectus@ms.com.
| This is not a research report and was not prepared by any Underwriter’s research department. Please see additional important information and qualifications at the end of this Term Sheet. |
| BANK 2021-BNK35 |
Neither this Term Sheet nor anything contained herein shall form the basis for any contract or commitment whatsoever. The information contained herein is preliminary as of the date hereof. This Term Sheet is subject to change, completion or amendment from time to time. The information contained herein supersedes information in any other communication relating to the securities described herein; provided, that the information contained herein will be superseded by similar information delivered to you as part of the Preliminary Prospectus. The information contained herein should be reviewed only in conjunction with the entire Preliminary Prospectus. All of the information contained herein is subject to the same limitations and qualifications contained in the Preliminary Prospectus. The information contained herein does not contain all relevant information relating to the underlying mortgage loans or mortgaged properties. Such information is described in the Preliminary Prospectus. The information contained herein will be more fully described in the Preliminary Prospectus. The information contained herein should not be viewed as projections, forecasts, predictions or opinions with respect to value. Prior to making any investment decision, prospective investors are strongly urged to read the Preliminary Prospectus in its entirety. Neither the Securities and Exchange Commission nor any state securities commission has approved or disapproved of these securities or determined if this Term Sheet is truthful or complete. Any representation to the contrary is a criminal offense.
BofA Securities is the marketing name for the global banking and global markets businesses of Bank of America Corporation. Lending, derivatives, and other commercial banking activities are performed globally by banking affiliates of Bank of America Corporation, including Bank of America, N.A., member FDIC. Securities, strategic advisory, and other investment banking activities are performed globally by investment banking affiliates of Bank of America Corporation, including, in the United States, BofA Securities, Inc., which is a registered broker-dealer and member of the Financial Industry Regulatory Authority (“FINRA”) and the Securities Investor Protection Corporation (“SIPC”), and, in other jurisdictions, locally registered entities.
Wells Fargo Securities is the trade name for the capital markets and investment banking services of Wells Fargo & Company and its subsidiaries, including but not limited to Wells Fargo Securities, LLC, a member of the New York Stock Exchange, FINRA, the National Futures Association (“NFA”) and SIPC, Wells Fargo Prime Services, LLC, a member of FINRA, NFA and SIPC, and Wells Fargo Bank, National Association. Wells Fargo Securities, LLC and Wells Fargo Prime Services, LLC are distinct entities from affiliated banks and thrifts.
IMPORTANT NOTICE RELATING TO AUTOMATICALLY GENERATED EMAIL DISCLAIMERS
Any legends, disclaimers or other notices that may appear at the bottom of, or attached to, the email communication to which this Term Sheet may have been attached are not applicable to this Term Sheet and should be disregarded. Such legends, disclaimers or other notices have been automatically generated as a result of this Term Sheet having been sent via Bloomberg or another email system.
IMPORTANT NOTICE REGARDING THE CONDITIONS FOR THIS OFFERING OF ASSET-BACKED SECURITIES
THE ASSET-BACKED SECURITIES REFERRED TO IN THIS TERM SHEET ARE BEING OFFERED WHEN, AS AND IF ISSUED. IN PARTICULAR, YOU ARE ADVISED THAT THE ASSET-BACKED SECURITIES, AND THE ASSET POOL BACKING THEM, ARE SUBJECT TO MODIFICATION OR REVISION (INCLUDING, AMONG OTHER THINGS, THE POSSIBILITY THAT ONE OR MORE CLASSES OF SECURITIES MAY BE SPLIT, COMBINED OR ELIMINATED), AT ANY TIME PRIOR TO ISSUANCE OR AVAILABILITY OF A FINAL PROSPECTUS. AS A RESULT, YOU MAY COMMIT TO PURCHASE SECURITIES THAT HAVE CHARACTERISTICS THAT MAY CHANGE, AND YOU ARE ADVISED THAT ALL OR A PORTION OF THE SECURITIES MAY NOT BE ISSUED THAT HAVE THE CHARACTERISTICS DESCRIBED IN THIS TERM SHEET. OUR OBLIGATION TO SELL SECURITIES TO YOU IS CONDITIONED ON THE SECURITIES AND THE UNDERLYING TRANSACTION HAVING THE CHARACTERISTICS DESCRIBED IN THIS TERM SHEET. IF WE DETERMINE THAT THE FOREGOING CONDITION IS NOT SATISFIED IN ANY MATERIAL RESPECT, WE WILL NOTIFY YOU, AND NEITHER THE ISSUING ENTITY NOR ANY UNDERWRITER WILL HAVE ANY OBLIGATION TO YOU TO DELIVER ALL OR ANY PORTION OF THE SECURITIES WHICH YOU HAVE COMMITTED TO PURCHASE, AND THERE WILL BE NO LIABILITY BETWEEN US AS A CONSEQUENCE OF THE NON-DELIVERY.
| This is not a research report and was not prepared by any Underwriter’s research department. Please see additional important information and qualifications at the end of this Term Sheet. |
2
| BANK 2021-BNK35 | Structural Overview |
Offered Certificates
| Class | Expected Ratings (Fitch/S&P/DBRS Morningstar)(1) | Approximate Initial Certificate Balance or Notional Amount(2) | Approximate Initial Credit Support(3) | Pass-Through Rate Description | Expected Weighted Average Life (Years)(4) | Expected Principal Window (Months)(4) | Certificate Principal UW NOI Debt Yield(5) | Certificate Principal to Value Ratio(6) |
| Class A-1 | AAAsf/AAA(sf)/AAA(sf) | $22,700,000 | 30.000% | (7) | 2.59 | 1 – 58 | 17.7% | 36.4% |
| Class A-2 | AAAsf/AAA(sf)/AAA(sf) | $90,700,000 | 30.000% | (7) | 4.90 | 58 – 59 | 17.7% | 36.4% |
| Class A-3 | AAAsf/AAA(sf)/AAA(sf) | $32,600,000 | 30.000% | (7) | 6.90 | 82 – 83 | 17.7% | 36.4% |
| Class A-SB | AAAsf/AAA(sf)/AAA(sf) | $35,500,000 | 30.000% | (7) | 7.40 | 59 – 117 | 17.7% | 36.4% |
| Class A-4(8) | AAAsf/AAA(sf)/AAA(sf) | (8)(9) | 30.000% | (7)(8) | (9) | (9) | 17.7% | 36.4% |
| Class A-5(8) | AAAsf/AAA(sf)/AAA(sf) | (8)(9) | 30.000% | (7)(8) | (9) | (9) | 17.7% | 36.4% |
| Class X-A | AAAsf/AAA(sf)/AAA(sf) | $927,579,000(10) | N/A | Variable IO(11) | N/A | N/A | N/A | N/A |
| Class X-B | A-sf/A+(sf)/AA(sf) | $253,428,000(10) | N/A | Variable IO(11) | N/A | N/A | N/A | N/A |
| Class A-S(8) | AAAsf/AAA(sf)/AAA(sf) | $142,450,000(8) | 19.250% | (7)(8) | 9.93 | 119 – 119 | 15.4% | 42.0% |
| Class B(8) | AA-sf/AA+(sf)/AAA(sf) | $57,973,000(8) | 14.875% | (7)(8) | 9.93 | 119 – 119 | 14.6% | 44.3% |
| Class C(8) | A-sf/A+(sf)/AA(low)(sf) | $53,005,000(8) | 10.875% | (7)(8) | 9.93 | 119 – 119 | 13.9% | 46.3% |
Privately Offered Certificates(12)
| Class | Expected Ratings (Fitch/S&P/DBRS Morningstar)(1) | Approximate Initial Certificate Balance or Notional Amount(2) | Approximate Initial Credit Support(3) | Pass-Through Rate Description | Expected Weighted Average Life (Years)(4) | Expected Principal Window (Months)(4) | Certificate Principal UW NOI Debt Yield(5) | Certificate Principal to Value Ratio(6) |
| Class X-D | BBB-sf/NR/A(low)(sf) | $57,974,000(10) | N/A | Variable IO(11) | N/A | N/A | N/A | N/A |
| Class X-FG | BB-sf/NR/BBB(low)(sf) | $28,158,000(10) | N/A | Variable IO(11) | N/A | N/A | N/A | N/A |
| Class X-H | B-sf/NR/BB(high)(sf) | $13,251,000(10) | N/A | Variable IO(11) | N/A | N/A | N/A | N/A |
| Class X-J | NR/NR/B(high)(sf) | $13,251,000(10) | N/A | Variable IO(11) | N/A | N/A | N/A | N/A |
| Class X-K | NR/NR/NR | $31,472,378(10) | N/A | Variable IO(11) | N/A | N/A | N/A | N/A |
| Class D | BBBsf/BBB(sf)/A(low)(sf) | $33,128,000 | 8.375% | (7) | 9.95 | 119 – 120 | 13.5% | 47.6% |
| Class E | BBB-sf/NR/BBB(high)(sf) | $24,846,000 | 6.500% | (7) | 10.01 | 120 – 120 | 13.3% | 48.6% |
| Class F | BB+sf/NR/BBB(low)(sf) | $14,907,000 | 5.375% | (7) | 10.01 | 120 – 120 | 13.1% | 49.2% |
| Class G | BB-sf/NR/BB(high)(sf) | $13,251,000 | 4.375% | (7) | 10.01 | 120 – 120 | 13.0% | 49.7% |
| Class H | B-sf/NR/BB(sf) | $13,251,000 | 3.375% | (7) | 10.01 | 120 – 120 | 12.8% | 50.2% |
| Class J | NR/NR/B(sf) | $13,251,000 | 2.375% | (7) | 10.01 | 120 – 120 | 12.7% | 50.8% |
| Class K | NR/NR/NR | $31,472,378 | 0.000% | (7) | 10.01 | 120 – 120 | 12.4% | 52.0% |
Non-Offered Eligible Vertical Interest(12)
| Class | Expected Ratings (Fitch/S&P/DBRS Morningstar)(1) | Approximate Initial Certificate Balance or Notional Amount(2) | Approximate Initial Credit Support(3) | Pass-Through Rate Description | Expected Weighted Average Life (Years)(4) | Expected Principal Window (Months)(4) | Certificate Principal UW NOI Debt Yield(5) | Certificate Principal to Value Ratio(6) |
| RR Interest | NR/NR/NR | $69,742,809.38 | N/A | (13) | 9.28 | 1 – 120 | N/A | N/A |
| (1) | Ratings shown are those of Fitch Ratings, Inc. (“Fitch”), S&P Global Ratings (“S&P”) and DBRS, Inc. (“DBRS Morningstar”). Certain nationally recognized statistical rating organizations that were not hired by the depositor may use information they receive pursuant to Rule 17g-5 under the Securities Exchange Act of 1934, as amended, or otherwise to rate the certificates. There can be no assurance as to what ratings a non-hired nationally recognized statistical rating organization would assign. See “Risk Factors—Other Risks Relating to the Certificates—Nationally Recognized Statistical Rating Organizations May Assign Different Ratings to the Certificates; Ratings of the Certificates Reflect Only the Views of the Applicable Rating Agencies as of the Dates Such Ratings Were Issued; Ratings May Affect ERISA Eligibility; Ratings May Be Downgraded” and “Ratings” in the Preliminary Prospectus to be dated on or about the date hereof (the “Preliminary Prospectus”). Capitalized terms used but not defined herein have the meanings assigned to such terms in the Preliminary Prospectus. |
| (2) | Approximate, subject to a permitted variance of plus or minus 5% and further subject to the discussion in footnote (9) below. In addition, the notional amounts of the Class X-A, Class X-B, Class X-D, Class X-FG, Class X-H, Class X-J and Class X-K certificates may vary depending upon the final pricing of the classes of principal balance certificates or trust components whose certificate or principal balances comprise such notional amounts, and, if as a result of such pricing the pass-through rate of any class of the Class X-A, Class X-B, Class X-D, Class X-FG, Class X-H, Class X-J or Class X-K certificates, as applicable, would be equal to zero at all times, such class of certificates will not be issued on the closing date of this securitization. |
| (3) | The approximate initial credit support percentages set forth for the certificates are approximate and, for the Class A-1, Class A-2, Class A-3, Class A-SB, Class A-4 and Class A-5 certificates, are presented in the aggregate, taking into account the principal balances of the Class A-4 and Class A-5 trust components. The approximate initial credit support percentage set forth for each class of the Class A-S, Class B and Class C certificates represents the |
| This is not a research report and was not prepared by any Underwriter’s research department. Please see additional important information and qualifications at the end of this Term Sheet. |
3
| BANK 2021-BNK35 | Structural Overview |
| approximate credit support for the underlying trust component with the same alphanumeric designation. The RR Interest provides credit support only to the limited extent that it is allocated a portion of any losses incurred on the underlying mortgage loans, which such losses are allocated between it, on the one hand, and to the Non-Retained Certificates, on the other hand, pro rata in accordance with their respective Percentage Allocation Entitlements (as defined below). See “Credit Risk Retention” in the Preliminary Prospectus. |
| (4) | The Expected Weighted Average Life and Expected Principal Window during which distributions of principal would be received as set forth in the foregoing table with respect to each class of certificates having a certificate balance are based on the assumptions set forth under “Yield and Maturity Considerations—Weighted Average Life” in the Preliminary Prospectus and on the assumptions that there are no prepayments, modifications or losses in respect of the mortgage loans and that there are no extensions or forbearances of maturity dates or anticipated repayment dates of the mortgage loans. |
| (5) | Certificate Principal UW NOI Debt Yield for any class of principal balance certificates shown in the table above (other than the RR Interest) is calculated as the product of (a) the weighted average UW NOI Debt Yield for the mortgage pool, multiplied by (b) a fraction, the numerator of which is the aggregate initial certificate or principal balance of all the principal balance certificates, and the denominator of which is the sum of (x) the aggregate initial certificate or principal balance of the subject class of principal balance certificates (or, with respect to the Class A-4, Class A-5, Class A-S, Class B or Class C certificates, the trust component with the same alphanumeric designation) and all other classes of principal balance certificates (other than the RR Interest), if any, that are senior to such class and (y) the outstanding certificate balance of the RR Interest, multiplied by the applicable RR Interest Computation Percentage. The Certificate Principal UW NOI Debt Yields of the Class A-1, Class A-2, Class A-3, Class A-SB, Class A-4 and Class A-5 certificates are calculated in the aggregate for those classes as if they were a single class. With respect to any class of principal balance certificates, the “RR Interest Computation Percentage” is equal to a fraction, expressed as a percentage, the numerator of which is the total initial certificate or principal balance of the subject class of principal balance certificates (or, with respect to the Class A-4, Class A-5, Class A-S, Class B or Class C certificates, the trust component with the same alphanumeric designation) and all other classes of principal balance certificates (other than the RR Interest), if any, that are senior to such class, and the denominator of which is the sum of the aggregate initial certificate or principal balance of all the principal balance certificates (other than the RR Interest). |
| (6) | Certificate Principal to Value Ratio for any class of principal balance certificates shown in the table above (other than the RR Interest) is calculated as the product of (a) the weighted average Cut-off Date LTV Ratio of the mortgage pool, multiplied by (b) a fraction, the numerator of which is the sum of (x) the aggregate initial certificate or principal balance of the subject class of principal balance certificates (or, with respect to the Class A-4, Class A-5, Class A-S, Class B or Class C certificates, the trust component with the same alphanumeric designation) and all other classes of principal balance certificates (other than the RR Interest), if any, that are senior to such class and (y) the outstanding certificate balance of the RR Interest, multiplied by the applicable RR Interest Computation Percentage, and the denominator of which is the aggregate initial certificate or principal balance of all the principal balance certificates. The Certificate Principal to Value Ratios of the Class A-1, Class A-2, Class A-3, Class A-SB, Class A-4 and Class A-5 certificates are calculated in the aggregate for those classes as if they were a single class. |
| (7) | The pass-through rate for each class of the Class A-1, Class A-2, Class A-3, Class A-SB, Class A-4, Class A-5, Class A-S, Class B, Class C, Class D, Class E, Class F, Class G, Class H, Class J and Class K certificates for any distribution date will be one of the following: (i) a fixed rate per annum, (ii) a variable rate per annum equal to the weighted average of the net mortgage interest rates on the mortgage loans for the related distribution date, (iii) a variable rate per annum equal to the lesser of (a) a fixed rate and (b) the weighted average of the net mortgage interest rates on the mortgage loans for the related distribution date or (iv) a variable rate per annum equal to the weighted average of the net mortgage interest rates on the mortgage loans for the related distribution date minus a specified percentage. For purposes of the calculation of the weighted average of the net mortgage interest rates on the mortgage loans for each distribution date, the net mortgage interest rates will be adjusted as necessary to a 30/360 basis. |
| (8) | The Class A-4-1, Class A-4-2, Class A-4-X1, Class A-4-X2, Class A-5-1, Class A-5-2, Class A-5-X1, Class A-5-X2, Class A-S-1, Class A-S-2, Class A-S-X1, Class A-S-X2, Class B-1, Class B-2, Class B-X1, Class B-X2, Class C-1, Class C-2, Class C-X1 and Class C-X2 certificates are also offered certificates. Such classes of certificates, together with the Class A-4, Class A-5, Class A-S, Class B and Class C certificates, constitute the “Exchangeable Certificates”. The Class A-1, Class A-2, Class A-3, Class A-SB, Class D, Class E, Class F, Class G, Class H, Class J and Class K certificates, together with the RR Interest and the Exchangeable Certificates with a certificate balance, are referred to as the “principal balance certificates.” Each class of Exchangeable Certificates will have the certificate balance or notional amount and pass-through rate described below under “Exchangeable Certificates.” Each class of Class A-4, Class A-5, Class A-S, Class B and Class C Exchangeable Certificates will have the same ratings as the Class A-4, Class A-5, Class A-S, Class B and Class C certificates, respectively, shown in the table above. |
| (9) | The exact initial principal balances or notional amounts of the Class A-4, Class A-4-X1, Class A-4-X2, Class A-5, Class A-5-X1 and Class A-5-X2 trust components (and consequently, the exact aggregate initial certificate balances or notional amounts of the Exchangeable Certificates with an “A-4” or “A-5” designation) are unknown and will be determined based on the final pricing of the certificates. However, the initial principal balances, weighted average lives and principal windows of the Class A-4 and Class A-5 trust components are expected to be within the applicable ranges reflected in the following chart. The aggregate initial principal balance of the Class A-4 and Class A-5 trust components is expected to be approximately $746,079,000, subject to a variance of plus or minus 5%. The Class A-4-X1 and Class A-4-X2 trust components will have initial notional amounts equal to the initial principal balance of the Class A-4 trust component. The Class A-5-X1 and Class A-5-X2 trust components will have initial notional amounts equal to the initial principal balance of the Class A-5 trust component. In the event that the Class A-5 trust component is issued with an initial certificate balance of $746,079,000, the Class A-4 trust component (and, correspondingly, the Class A-4 Exchangeable Certificates) will not be issued. |
| Trust Components | Expected Range of Initial Principal Balance | Expected Range of Weighted Average Life (Years) | Expected Range of Principal Window (Months) |
| Class A-4 | $0 - $350,000,000 | N/A – 9.77 | N/A / 111 – 119 |
| Class A-5 | $396,079,000 - $746,079,000 | 9.85 – 9.93 | 111 - 119 / 119 – 119 |
| (10) | The Class X-A, Class X-B, Class X-D, Class X-FG, Class X-H, Class X-J and Class X-K certificates (collectively referred to as the “Class X certificates”) are notional amount certificates and will not be entitled to distributions of principal. The notional amount of the Class X-A certificates will be equal to the aggregate certificate or principal balance of the Class A-1, Class A-2, Class A-3 and Class A-SB certificates and the Class A-4 and Class A-5 trust components. The notional amount of the Class X-B certificates will be equal to the aggregate principal balance of the Class A-S, Class B and Class C trust components. The notional amount of the Class X-D certificates will be equal to the aggregate certificate balance of the Class D and Class E certificates. The notional amount of the Class X-FG certificates will be equal to the aggregate certificate balance of the Class F and Class G certificates. The notional amount of each class of the Class X-H, Class X-J and Class X-K certificates will be equal to the certificate balance of the class of principal balance certificates that, with the addition of “X-,” has the same alphabetical designation as the subject class of Class X certificates. |
| (11) | The pass-through rate for the Class X-A certificates for any distribution date will be a per annum rate equal to the excess, if any, of (a) the weighted average of the net mortgage interest rates on the mortgage loans for the related distribution date, over (b) the weighted average of the pass-through rates on the Class A-1, Class A-2, Class A-3 and Class A-SB certificates and the Class A-4, Class A-4-X1, Class A-4-X2, Class A-5, Class A-5-X1 and Class A-5-X2 trust components for the related distribution date, weighted on the basis of their respective certificate or principal balances or notional amounts outstanding immediately prior to that distribution date (but excluding trust components with a notional amount in the denominator of such weighted average calculation). The pass-through rate for the Class X-B certificates for any distribution date will be a per annum rate equal to the excess, if any, of (a) the weighted average of the net mortgage interest rates on the mortgage loans for the related distribution date, over (b) the weighted average of the pass-through rates on the |
| This is not a research report and was not prepared by any Underwriter’s research department. Please see additional important information and qualifications at the end of this Term Sheet. |
4
| BANK 2021-BNK35 | Structural Overview |
| Class A-S, Class A-S-X1, Class A-S-X2, Class B, Class B-X1, Class B-X2, Class C, Class C-X1 and Class C-X2 trust components for the related distribution date, weighted on the basis of their respective principal balances or notional amounts outstanding immediately prior to that distribution date (but excluding trust components with a notional amount in the denominator of such weighted average calculation). The pass-through rate for the Class X-D certificates for any distribution date will be a per annum rate equal to the excess, if any, of (a) the weighted average of the net mortgage interest rates on the mortgage loans for the related distribution date, over (b) the weighted average of the pass-through rates on the Class D and Class E certificates for the related distribution date, weighted on the basis of their respective certificate balances outstanding immediately prior to that distribution date. The pass-through rate for the Class X-FG certificates for any distribution date will be a per annum rate equal to the excess, if any, of (a) the weighted average of the net mortgage interest rates on the mortgage loans for the related distribution date, over (b) the weighted average of the pass-through rates on the Class F and Class G certificates for the related distribution date, weighted on the basis of their respective certificate balances outstanding immediately prior to that distribution date. The pass-through rate for each class of the Class X-H, Class X-J and Class X-K certificates for any distribution date will be a per annum rate equal to the excess, if any, of (a) the weighted average of the net mortgage interest rates on the mortgage loans for the related distribution date, over (b) the pass-through rate for the related distribution date on the class of principal balance certificates that, with the addition of “X-,” has the same alphabetical designation as the subject class of Class X certificates. For purposes of the calculation of the weighted average of the net mortgage interest rates on the mortgage loans for each distribution date, the net mortgage interest rates will be adjusted as necessary to a 30/360 basis. |
| (12) | Not offered pursuant to the Preliminary Prospectus or this Term Sheet. Information provided in this Term Sheet regarding the characteristics of these certificates is provided only to enhance your understanding of the offered certificates. The privately offered certificates also include the Class V and Class R certificates, which do not have a certificate balance, notional amount, credit support, pass-through rate, rating, assumed final distribution date or rated final distribution date, and which are not shown in the chart. The Class V certificates represent a beneficial ownership interest held through the grantor trust in a specified percentage of certain excess interest in respect of mortgage loans having anticipated repayment dates, if any. The Class R certificates represent the beneficial ownership of the residual interest in each of the real estate mortgage investment conduits, as further described in the Preliminary Prospectus. |
| (13) | Although it does not have a specified pass-through rate (other than for tax reporting purposes), the effective pass-through rate for the RR Interest will be a variable rate per annum equal to the weighted average of the net mortgage interest rates on the mortgage loans for the related distribution date (in each case adjusted, if necessary, to accrue on the basis of a 360-day year consisting of twelve 30-day months). |
| This is not a research report and was not prepared by any Underwriter’s research department. Please see additional important information and qualifications at the end of this Term Sheet. |
5
| BANK 2021-BNK35 | Structural Overview |
Issue Characteristics
| Offered Certificates: | $1,181,007,000 (approximate) monthly pay, multi-class, commercial mortgage pass-through certificates, consisting of 19 principal balance classes (Class A-1, Class A-2, Class A-3, Class A-SB, Class A-4, Class A-4-1, Class A-4-2, Class A-5, Class A-5-1, Class A-5-2, Class A-S, Class A-S-1, Class A-S-2, Class B, Class B-1, Class B-2, Class C, Class C-1 and Class C-2) and 12 interest-only classes (Class A-4-X1, Class A-4-X2, Class A-5-X1, Class A-5-X2, Class X-A, Class X-B, Class A-S-X1, Class A-S-X2, Class B-X1, Class B-X2, Class C-X1 and Class C-X2) |
| Co-Lead Managers and Joint Bookrunners: | Morgan Stanley & Co. LLC, BofA Securities, Inc. and Wells Fargo Securities, LLC |
| Co-Managers: | Academy Securities, Inc. and Drexel Hamilton, LLC |
| Mortgage Loan Sellers: | Morgan Stanley Mortgage Capital Holdings LLC, Bank of America, National Association, Wells Fargo Bank, National Association and National Cooperative Bank, N.A. |
| Rating Agencies: | Fitch, S&P and DBRS Morningstar |
| Master Servicers: | Wells Fargo Bank, National Association and National Cooperative Bank, N.A. |
| Special Servicers: | KeyBank National Association and National Cooperative Bank, N.A. |
| Certificate Administrator/ Certificate Registrar/Custodian: | Wells Fargo Bank, National Association |
| Trustee: | Wilmington Trust, National Association |
| Operating Advisor: | Park Bridge Lender Services LLC |
| Asset Representations Reviewer: | Park Bridge Lender Services LLC |
| Initial Directing Certificateholder: | Ellington Management Group, LLC or an affiliate |
| Risk Retention Consultation Party: | Morgan Stanley Mortgage Capital Holdings LLC |
| U.S. Credit Risk Retention: | For a discussion on the manner in which the U.S. credit risk retention requirements will be addressed by Morgan Stanley Mortgage Capital Holdings LLC, as the retaining sponsor, see “Credit Risk Retention” in the Preliminary Prospectus. |
| EU Risk Retention: | None of the sponsors, the depositor or the underwriters or their respective affiliates, or any other person, intends to retain a material net economic interest in the securitization constituted by the issue of the certificates, or to take any other action in respect of such securitization, in a manner prescribed or contemplated by the EU Securitization Regulation or the UK Securitization Regulation. In particular, no such person undertakes to take any action which may be required by any potential investor or certificateholder for the purposes of its compliance with any requirement of the EU Securitization Regulation or the UK Securitization Regulation. In addition, the arrangements described under “Credit Risk Retention” in the Preliminary Prospectus have not been structured with the objective of ensuring compliance by any person with any requirement of the EU Securitization Regulation or the UK Securitization Regulation. Consequently, the Offered Certificates may not be a suitable investment for investors that are subject to any requirement of the EU Securitization Regulation or the UK Securitization Regulation. See “Risk Factors—Other Risks Relating to the Certificates—EU Securitization Regulation and UK Securitization Regulation” in the Preliminary Prospectus. |
| Cut-off Date: | The mortgage loans will be considered part of the trust fund as of their respective cut-off dates. The cut-off date with respect to each mortgage loan is the respective due date for the monthly debt service payment that is due in August 2021 (or, in the case of any mortgage loan that has its first due date after August 2021, the date that would have been its due date in August 2021 under the terms of that mortgage loan if a monthly debt service payment were scheduled to be due in that month). |
| Expected Pricing Date: | Week of July 26, 2021 |
| Expected Closing Date: | August 11, 2021 |
| Determination Dates: | The 11th day of each month or, if the 11th day is not a business day, then the business day immediately following such 11th day. |
| Distribution Dates: | The 4th business day following each determination date. The first distribution date will be in September 2021. |
| Rated Final Distribution Date: | The distribution date in June 2064 |
| Interest Accrual Period: | Preceding calendar month |
| Payment Structure: | Sequential pay |
| Tax Treatment: | REMIC, except that the Exchangeable Certificates will evidence interests in a grantor trust |
| Optional Termination: | 1.00% clean-up call |
| Minimum Denominations: | $10,000 for each class of Offered Certificates (other than Class X-A and Class X-B certificates); $1,000,000 for the Class X-A and Class X-B certificates |
| Settlement Terms: | DTC, Euroclear and Clearstream |
| This is not a research report and was not prepared by any Underwriter’s research department. Please see additional important information and qualifications at the end of this Term Sheet. |
6
| BANK 2021-BNK35 | Structural Overview |
| Legal/Regulatory Status: | Each class of Offered Certificates is expected to be eligible for exemptive relief under ERISA. No class of Offered Certificates is SMMEA eligible. |
| Analytics: | The certificate administrator is expected to make available all distribution date statements, CREFC® reports and supplemental notices received by it to certain modeling financial services as described in the Preliminary Prospectus. |
| Bloomberg Ticker: | BANK 2021-BNK35<MTGE><GO> |
| Risk Factors: | THE CERTIFICATES INVOLVE CERTAIN RISKS AND MAY NOT BE SUITABLE FOR ALL INVESTORS. SEE THE “RISK FACTORS” SECTION OF THE PRELIMINARY PROSPECTUS. |
| This is not a research report and was not prepared by any Underwriter’s research department. Please see additional important information and qualifications at the end of this Term Sheet. |
7
| BANK 2021-BNK35 | Structural Overview |
Structural Overview
| Allocation Between the RR Interest and the Non-Retained Certificates: |
The aggregate amount available for distributions to the holders of the Certificates (including the RR Interest) on each distribution date (net of specified expenses of the issuing entity, including fees payable to, and costs and expenses reimbursable to, each applicable master servicer, primary servicer and special servicer, the certificate administrator, the trustee, the operating advisor, the asset representations reviewer and CREFC®) will be allocated between amounts available for distribution to the holders of the RR Interest, on the one hand, and to all other Certificates (other than the Class V and Class R Certificates), referred to herein as the “Non-Retained Certificates”, on the other hand. The portion of such amount allocable to (a) the RR Interest will at all times be the product of such amount multiplied by 5% and (b) the Non-Retained Certificates will at all times be the product of such amount multiplied by the difference between 100% and the percentage set forth in clause (a) (each, the respective “Percentage Allocation Entitlement”).
|
| Accrual: | Each class of Offered Certificates will accrue interest on a 30/360 basis. |
| Amount and Order of Distributions: |
On each distribution date, the Non-Retained Certificates’ Percentage Allocation Entitlement of funds available for distribution from the mortgage loans, net of (i) any yield maintenance charges and prepayment premiums and (ii) any excess interest, will be distributed in the following amounts and order of priority:
First, to the Class A-1, Class A-2, Class A-3, Class A-SB, Class X-A, Class X-B, Class X-D, Class X-FG, Class X-H, Class X-J and Class X-K certificates and the Class A-4, Class A-4-X1, Class A-4-X2, Class A-5, Class A-5-X1 and Class A-5-X2 trust components, in respect of interest, up to an amount equal to, and pro rata in accordance with, the interest entitlements for those classes of certificates and trust components;
Second, to the Class A-1, Class A-2, Class A-3 and Class A-SB certificates and the Class A-4 and Class A-5 trust components as follows, to the extent of applicable available funds allocated to principal: either (i)(a) first, to principal on the Class A-SB certificates, until the certificate balance of the Class A-SB certificates is reduced to the planned principal balance for the related distribution date set forth in Annex E to the Preliminary Prospectus, and (b) second, to principal on the Class A-1 certificates, the Class A-2 certificates, the Class A-3 certificates, the Class A-4 trust component, the Class A-5 trust component and the Class A-SB certificates, in that order, in each case until the certificate or principal balance of such class of certificates or trust component has been reduced to zero, or (ii) if the certificate or principal balance of each class of principal balance certificates and trust components other than the Class A-1, Class A-2, Class A-3 and Class A-SB certificates, the Class A-4 and Class A-5 trust components and the RR Interest has been reduced to zero as a result of the allocation of losses on the mortgage loans to those certificates, to principal on the Class A-1, Class A-2, Class A-3 and Class A-SB certificates and the Class A-4 and Class A-5 trust components, pro rata, without regard to the distribution priorities described above or the planned principal balance of the Class A-SB certificates;
Third, to the Class A-1, Class A-2, Class A-3 and Class A-SB certificates and the Class A-4 and Class A-5 trust components, first, up to an amount equal to, and pro rata based on, any previously unreimbursed losses on the mortgage loans allocable to principal that were previously borne by each such class or trust component and then in the amount of interest thereon;
Fourth, to the Class A-S, Class A-S-X1 and Class A-S-X2 trust components, as follows: (a) to each such trust component in respect of interest, up to an amount equal to, and pro rata in accordance with, the interest entitlements for those trust components; (b) to the extent of applicable available funds allocable to principal remaining after distributions in respect of principal to each class of certificates or trust component with a higher priority (as set forth in prior enumerated clauses set forth above), to principal on the Class A-S trust component until its principal balance has been reduced to zero; and (c) to reimburse the Class A-S trust component, first, in the amount of any previously unreimbursed losses on the mortgage loans that were previously allocated thereto, then in the amount of interest thereon;
Fifth, to the Class B, Class B-X1 and Class B-X2 trust components, as follows: (a) to each such trust component in respect of interest, up to an amount equal to, and pro rata in accordance with, the interest entitlements for those trust components; (b) to the extent of applicable available funds allocable to principal remaining after distributions in respect of principal to each class of certificates or trust component with a higher priority (as set forth in prior enumerated clauses set forth above), to principal on the Class B trust component until its principal balance has been reduced to zero; and (c) to reimburse the Class B trust component, first, in the amount of any previously unreimbursed losses on the mortgage loans that were previously allocated thereto, then in the amount of interest thereon;
Sixth, to the Class C, Class C-X1 and Class C-X2 trust components, as follows: (a) to each such trust component in respect of interest, up to an amount equal to, and pro rata in accordance with, the interest entitlements for those trust components; (b) to the extent of applicable available funds allocable to principal remaining after distributions in respect of principal to each class of certificates or trust component with a higher priority (as set forth in prior enumerated clauses set forth above), to principal on the Class C trust component until its principal balance has been reduced to zero; and (c) to reimburse the Class C trust component, first, in the amount of any previously unreimbursed losses on the mortgage loans that were previously allocated thereto, then in the amount of interest thereon;
Seventh, to the Class D, Class E, Class F, Class G, Class H, Class J and Class K certificates in the amounts and order of priority described in “Description of the Certificates—Distributions” in the Preliminary Prospectus; and
Eighth, to the Class R certificates, any remaining amounts.
|
| This is not a research report and was not prepared by any Underwriter’s research department. Please see additional important information and qualifications at the end of this Term Sheet. |
8
| BANK 2021-BNK35 | Structural Overview |
Principal and interest payable on each trust component will be distributed pro rata to the corresponding classes of Exchangeable Certificates representing interests therein in accordance with their Class Percentage Interests therein as described below under “Exchangeable Certificates.” |
| Interest and Principal Entitlements: |
The interest entitlement of each class of Offered Certificates on each distribution date generally will be the interest accrued during the related interest accrual period on the related certificate balance or notional amount at the related pass-through rate, net of any prepayment interest shortfalls allocated to that class for such distribution date as described below. If prepayment interest shortfalls arise from voluntary prepayments on serviced mortgage loans during any collection period, the applicable master servicer is required to make a limited compensating interest payment to offset those shortfalls. See “Description of the Certificates—Prepayment Interest Shortfalls” in the Preliminary Prospectus. The remaining amount of prepayment interest shortfalls will be allocated between the RR Interest, on one hand, and the Non-Retained Certificates, on the other hand, in accordance with their respective Percentage Allocation Entitlements. The prepayment interest shortfalls allocated to the Non-Retained Certificates will be allocated among such classes of certificates (other than the Exchangeable Certificates) and trust components that are entitled to interest, on a pro rata basis, based on their respective amounts of accrued interest for the related distribution date, to reduce the interest entitlement on each such class of certificates and trust components. For any distribution date, prepayment interest shortfalls allocated to a trust component will be allocated among the related classes of Exchangeable Certificates, pro rata, in accordance with their respective class percentage interests for that distribution date. If a class of certificates or trust component receives less than the entirety of its interest entitlement on any distribution date, then the shortfall (excluding any shortfall due to prepayment interest shortfalls), together with interest thereon, will be added to its interest entitlement for the next succeeding distribution date.
The aggregate principal distribution amount for each distribution date generally will be the aggregate amount of principal received or advanced in respect of the mortgage loans, net of any non-recoverable advances and interest thereon and any workout-delayed reimbursement amounts that are reimbursed to the applicable master servicer or the trustee during the related collection period. Non-recoverable advances and interest thereon are reimbursable from principal collections before reimbursement from other amounts. Workout-delayed reimbursement amounts will be reimbursable from principal collections. The Non-Retained Certificates and the RR Interest will be entitled to their respective Percentage Allocation Entitlements of the aggregate principal distribution amount.
|
| Exchangeable Certificates: | Certificates of each class of Exchangeable Certificates may be exchanged for certificates of the corresponding classes of Exchangeable Certificates set forth next to such class in the table below, and vice versa. Following any exchange of certificates of one or more classes of Exchangeable Certificates (the applicable “Surrendered Classes”) for certificates of one or more classes of other Exchangeable Certificates (the applicable “Received Classes”), the Class Percentage Interests (as defined below) of the outstanding principal balances or notional amounts of the Corresponding Trust Components that are represented by the Surrendered Classes (and consequently their related certificate balances or notional amounts) will be decreased, and those of the Received Classes (and consequently their related certificate balances or notional amounts) will be increased. The dollar denomination of the certificates of each of the Received Classes must be equal to the dollar denomination of the certificates of each of the Surrendered Classes. No fee will be required with respect to any exchange of Exchangeable Certificates. |
| Surrendered Classes (or Received Classes) of Certificates | Received Classes (or Surrendered Classes) of Certificates |
| Class A-4 | Class A-4-1, Class A-4-X1 |
| Class A-4 | Class A-4-2, Class A-4-X2 |
| Class A-5 | Class A-5-1, Class A-5-X1 |
| Class A-5 | Class A-5-2, Class A-5-X2 |
| Class A-S | Class A-S-1, Class A-S-X1 |
| Class A-S | Class A-S-2, Class A-S-X2 |
| Class B | Class B-1, Class B-X1 |
| Class B | Class B-2, Class B-X2 |
| Class C | Class C-1, Class C-X1 |
| Class C | Class C-2, Class C-X2 |
| On the closing date, the issuing entity will issue the following “trust components,” each with the initial principal balance (or, if such trust component has an “X” suffix, notional amount) and pass-through rate set forth next to it in the table below. Each trust component with an “X” suffix will not be entitled to distributions of principal. |
| Trust Component | Initial Principal Balance or Notional Amount | Pass-Through Rate | |
| Class A-4 | See footnote (9) to the first table above under “Structural Overview” | Class A-4 certificate pass-through rate minus 1.00% | |
| Class A-4-X1 | Equal to Class A-4 trust component principal balance | 0.50% | |
| Class A-4-X2 | Equal to Class A-4 trust component principal balance | 0.50% | |
| Class A-5 | See footnote (9) to the first table above under “Structural Overview” | Class A-5 certificate pass-through rate minus 1.00% | |
| Class A-5-X1 | Equal to Class A-5 trust component principal balance | 0.50% |
| This is not a research report and was not prepared by any Underwriter’s research department. Please see additional important information and qualifications at the end of this Term Sheet. |
9
| BANK 2021-BNK35 | Structural Overview |
| Class A-5-X2 | Equal to Class A-5 trust component principal balance | 0.50% | |
| Class A-S | $142,450,000 | Class A-S certificate pass-through rate minus 1.00% | |
| Class A-S-X1 | Equal to Class A-S trust component principal balance | 0.50% | |
| Class A-S-X2 | Equal to Class A-S trust component principal balance | 0.50% | |
| Class B | $57,973,000 | Class B certificate pass-through rate minus 1.00% | |
| Class B-X1 | Equal to Class B trust component principal balance | 0.50% | |
| Class B-X2 | Equal to Class B trust component principal balance | 0.50% | |
| Class C | $53,005,000 | Class C certificate pass-through rate minus 1.00% | |
| Class C-X1 | Equal to Class C trust component principal balance | 0.50% | |
| Class C-X2 | Equal to Class C trust component principal balance | 0.50% |
| Each class of Exchangeable Certificates represents an undivided beneficial ownership interest in the trust components set forth next to it in the table below (the “Corresponding Trust Components”). Each class of Exchangeable Certificates has a pass-through rate equal to the sum of the pass-through rates of the Corresponding Trust Components and represents a percentage interest (the related “Class Percentage Interest”) in each Corresponding Trust Component, including principal and interest payable thereon (and reimbursement of losses allocable thereto), equal to (x) the certificate balance (or, if such class has an “X” suffix, notional amount) of such class of certificates, divided by (y) the principal balance of the Class A-4 trust component (if such class of Exchangeable Certificates has an “A-4” designation), the Class A-5 trust component (if such class of Exchangeable Certificates has an “A-5” designation), the Class A-S trust component (if such class of Exchangeable Certificates has an “A-S” designation), the Class B trust component (if such class of Exchangeable Certificates has a “B” designation), or the Class C trust component (if such class of Exchangeable Certificates has a “C” designation). |
| Group of Exchangeable Certificates | Class of Exchangeable Certificates | Corresponding Trust Components |
| “Class A-4 Exchangeable Certificates” | Class A-4 | Class A-4, Class A-4-X1, Class A-4-X2 |
| Class A-4-1 | Class A-4, Class A-4-X2 | |
| Class A-4-2 | Class A-4 | |
| Class A-4-X1 | Class A-4-X1 | |
| Class A-4-X2 | Class A-4-X1, Class A-4-X2 | |
| “Class A-5 Exchangeable Certificates” | Class A-5 | Class A-5, Class A-5-X1, Class A-5-X2 |
| Class A-5-1 | Class A-5, Class A-5-X2 | |
| Class A-5-2 | Class A-5 | |
| Class A-5-X1 | Class A-5-X1 | |
| Class A-5-X2 | Class A-5-X1, Class A-5-X2 | |
| “Class A-S Exchangeable Certificates” | Class A-S | Class A-S, Class A-S-X1, Class A-S-X2 |
| Class A-S-1 | Class A-S, Class A-S-X2 | |
| Class A-S-2 | Class A-S | |
| Class A-S-X1 | Class A-S-X1 | |
| Class A-S-X2 | Class A-S-X1, Class A-S-X2 | |
| “Class B Exchangeable Certificates” | Class B | Class B, Class B-X1, Class B-X2 |
| Class B-1 | Class B, Class B-X2 | |
| Class B-2 | Class B | |
| Class B-X1 | Class B-X1 | |
| Class B-X2 | Class B-X1, Class B-X2 | |
| “Class C Exchangeable Certificates” | Class C | Class C, Class C-X1, Class C-X2 |
| Class C-1 | Class C, Class C-X2 | |
| Class C-2 | Class C | |
| Class C-X1 | Class C-X1 | |
| Class C-X2 | Class C-X1, Class C-X2 |
| The maximum certificate balance or notional amount of each class of Class A-4 Exchangeable Certificates, Class A-5 Exchangeable Certificates, Class A-S Exchangeable Certificates, Class B Exchangeable Certificates or Class C Exchangeable Certificates that could be issued in an exchange is equal to the principal balance of the Class A-4, Class A-5, Class A-S, Class B or Class C trust component, respectively. The maximum certificate balances of Class A-4, Class A-5, Class A-S, Class B and Class C certificates (subject to the constraint on the aggregate initial principal balance of the Class A-4 and Class A-5 trust components discussed in footnote (9) to the first table above under “Structural Overview”) will be issued on the closing date, and the certificate balance or notional amount of each other class of Exchangeable Certificates will be equal to zero on the closing date. |
| This is not a research report and was not prepared by any Underwriter’s research department. Please see additional important information and qualifications at the end of this Term Sheet. |
10
| BANK 2021-BNK35 | Structural Overview |
| Each class of Class A-4 Exchangeable Certificates, Class A-5 Exchangeable Certificates, Class A-S Exchangeable Certificates, Class B Exchangeable Certificates and Class C Exchangeable Certificates will have a certificate balance or notional amount equal to its Class Percentage Interest multiplied by the principal balance of the Class A-4, Class A-5, Class A-S, Class B or Class C trust component, respectively. Each class of Class A-4 Exchangeable Certificates, Class A-5 Exchangeable Certificates, Class A-S Exchangeable Certificates, Class B Exchangeable Certificates and Class C Exchangeable Certificates with a certificate balance will have the same approximate initial credit support percentage, Expected Weighted Average Life, Expected Principal Window, Certificate Principal UW NOI Debt Yield and Certificate Principal to Value Ratio as the Class A-4, Class A-5, Class A-S, Class B or Class C certificates, respectively, shown above. |
| Special Servicer Compensation: | The principal compensation to be paid to a special servicer in respect of its special servicing activities will be the special servicing fee, the workout fee and the liquidation fee.
The special servicing fee for each distribution date is calculated based on the outstanding principal balance of each serviced mortgage loan that is a specially serviced mortgage loan (and any related serviced companion loan) or as to which the related mortgaged property has become an REO property at the special servicing fee rate, which will be a rate equal to 0.25000% per annum. The special servicing fee will be payable monthly, first, from liquidation proceeds, insurance and condemnation proceeds, and other collections in respect of the related specially serviced mortgage loan or REO property and, then, from general collections on all the mortgage loans and any REO properties.
Each applicable special servicer will also be entitled to (i) liquidation fees generally equal to 1.0% (or, if such rate would result in an aggregate liquidation fee less than $25,000, then the liquidation fee rate will be equal to the lesser of (i) 3.0% and (ii) such lower rate as would result in an aggregate liquidation fee equal to $25,000) of liquidation proceeds and certain other collections in respect of a specially serviced mortgage loan (and any related serviced companion loan) or related REO property and of amounts received in respect of mortgage loan repurchases by the related mortgage loan sellers and (ii) workout fees generally equal to 1.0% of interest (other than post-ARD excess interest on mortgage loans with anticipated repayment dates and other than default interest) and principal payments made in respect of a rehabilitated mortgage loan (and any related serviced companion loan), subject to a floor of $25,000 with respect to any mortgage loan, whole loan or related REO property, and in the case of each of clause (i) and (ii), subject to certain adjustments and exceptions as described in the Preliminary Prospectus under “Pooling and Servicing Agreement—Servicing and Other Compensation and Payment of Expenses—Special Servicing Compensation”.
With respect to any non-serviced mortgage loan, the related special servicer under the related other pooling and servicing agreement pursuant to which such mortgage loan is being serviced will be entitled to similar compensation as that described above with respect to such non-serviced mortgage loan under such other pooling and servicing agreement as further described in the Preliminary Prospectus, although any related fees may accrue at a different rate and there may be a higher (or no) cap on liquidation and workout fees. |
| Prepayment Premiums/Yield Maintenance Charges: |
If any yield maintenance charge or prepayment premium is collected during any collection period with respect to any mortgage loan, then on the immediately succeeding distribution date, the certificate administrator will pay:
(1) to the Non-Retained Certificates, in the following amounts:
(a) to the holders of each class of the Class A-1, Class A-2, Class A-3, Class A-SB, Class A-4, Class A-4-1, Class A-4-2, Class A-5, Class A-5-1, Class A-5-2, Class A-S, Class A-S-1, Class A-S-2, Class B, Class B-1, Class B-2, Class C, Class C-1, Class C-2, Class D and Class E certificates, the product of (x) the Non-Retained Certificates’ Percentage Allocation Entitlement of such yield maintenance charge or prepayment premium, (y) the related Base Interest Fraction for such class and the applicable principal prepayment, and (z) a fraction, the numerator of which is equal to the amount of principal distributed to such class for that distribution date, and the denominator of which is the total amount of principal distributed to the Class A-1, Class A-2, Class A-3, Class A-SB, Class D and Class E certificates and the Class A-4 Exchangeable Certificates, the Class A-5 Exchangeable Certificates, the Class A-S Exchangeable Certificates, the Class B Exchangeable Certificates and the Class C Exchangeable Certificates for that distribution date,
(b) to the holders of the Class A-4-X1 certificates, the product of (x) the Non-Retained Certificates’ Percentage Allocation Entitlement of such yield maintenance charge or prepayment premium, (y) a fraction, the numerator of which is equal to the amount of principal distributed to the Class A-4-1 certificates for that distribution date, and the denominator of which is the total amount of principal distributed to the Class A-1, Class A-2, Class A-3, Class A-SB, Class D and Class E certificates and the Class A-4 Exchangeable Certificates, the Class A-5 Exchangeable Certificates, the Class A-S Exchangeable Certificates, the Class B Exchangeable Certificates and the Class C Exchangeable Certificates for that distribution date, and (z) the difference between (1) the Base Interest Fraction for the Class A-4 certificates and the applicable principal prepayment and (2) the Base Interest Fraction for the Class A-4-1 certificates and the applicable principal prepayment,
(c) to the holders of the Class A-4-X2 certificates, the product of (x) the Non-Retained Certificates’ Percentage Allocation Entitlement of such yield maintenance charge or prepayment premium, (y) a fraction, the numerator of which is equal to the amount of principal distributed to the Class A-4-2 certificates for that distribution date, and the denominator of which is the total amount of principal distributed to the Class A-1, Class A-2, Class A-3, Class A-SB, Class D and Class E certificates and |
| This is not a research report and was not prepared by any Underwriter’s research department. Please see additional important information and qualifications at the end of this Term Sheet. |
11
| BANK 2021-BNK35 | Structural Overview |
the Class A-4 Exchangeable Certificates, the Class A-5 Exchangeable Certificates, the Class A-S Exchangeable Certificates, the Class B Exchangeable Certificates and the Class C Exchangeable Certificates for that distribution date, and (z) the difference between (1) the Base Interest Fraction for the Class A-4 certificates and the applicable principal prepayment and (2) the Base Interest Fraction for the Class A-4-2 certificates and the applicable principal prepayment,
(d) to the holders of the Class A-5-X1 certificates, the product of (x) the Non-Retained Certificates’ Percentage Allocation Entitlement of such yield maintenance charge or prepayment premium, (y) a fraction, the numerator of which is equal to the amount of principal distributed to the Class A-5-1 certificates for that distribution date, and the denominator of which is the total amount of principal distributed to the Class A-1, Class A-2, Class A-3, Class A-SB, Class D and Class E certificates and the Class A-4 Exchangeable Certificates, the Class A-5 Exchangeable Certificates, the Class A-S Exchangeable Certificates, the Class B Exchangeable Certificates and the Class C Exchangeable Certificates for that distribution date, and (z) the difference between (1) the Base Interest Fraction for the Class A-5 certificates and the applicable principal prepayment and (2) the Base Interest Fraction for the Class A-5-1 certificates and the applicable principal prepayment,
(e) to the holders of the Class A-5-X2 certificates, the product of (x) the Non-Retained Certificates’ Percentage Allocation Entitlement of such yield maintenance charge or prepayment premium, (y) a fraction, the numerator of which is equal to the amount of principal distributed to the Class A-5-2 certificates for that distribution date, and the denominator of which is the total amount of principal distributed to the Class A-1, Class A-2, Class A-3, Class A-SB, Class D and Class E certificates and the Class A-4 Exchangeable Certificates, the Class A-5 Exchangeable Certificates, the Class A-S Exchangeable Certificates, the Class B Exchangeable Certificates and the Class C Exchangeable Certificates for that distribution date, and (z) the difference between (1) the Base Interest Fraction for the Class A-5 certificates and the applicable principal prepayment and (2) the Base Interest Fraction for the Class A-5-2 certificates and the applicable principal prepayment,
(f) to the holders of the Class A-S-X1 certificates, the product of (x) the Non-Retained Certificates’ Percentage Allocation Entitlement of such yield maintenance charge or prepayment premium, (y) a fraction, the numerator of which is equal to the amount of principal distributed to the Class A-S-1 certificates for that distribution date, and the denominator of which is the total amount of principal distributed to the Class A-1, Class A-2, Class A-3, Class A-SB, Class D and Class E certificates and the Class A-4 Exchangeable Certificates, the Class A-5 Exchangeable Certificates, the Class A-S Exchangeable Certificates, the Class B Exchangeable Certificates and the Class C Exchangeable Certificates for that distribution date, and (z) the difference between (1) the Base Interest Fraction for the Class A-S certificates and the applicable principal prepayment and (2) the Base Interest Fraction for the Class A-S-1 certificates and the applicable principal prepayment,
(g) to the holders of the Class A-S-X2 certificates, the product of (x) the Non-Retained Certificates’ Percentage Allocation Entitlement of such yield maintenance charge or prepayment premium, (y) a fraction, the numerator of which is equal to the amount of principal distributed to the Class A-S-2 certificates for that distribution date, and the denominator of which is the total amount of principal distributed to the Class A-1, Class A-2, Class A-3, Class A-SB, Class D and Class E certificates and the Class A-4 Exchangeable Certificates, the Class A-5 Exchangeable Certificates, the Class A-S Exchangeable Certificates, the Class B Exchangeable Certificates and the Class C Exchangeable Certificates for that distribution date, and (z) the difference between (1) the Base Interest Fraction for the Class A-S certificates and the applicable principal prepayment and (2) the Base Interest Fraction for the Class A-S-2 certificates and the applicable principal prepayment,
(h) to the holders of the Class B-X1 certificates, the product of (x) the Non-Retained Certificates’ Percentage Allocation Entitlement of such yield maintenance charge or prepayment premium, (y) a fraction, the numerator of which is equal to the amount of principal distributed to the Class B-1 certificates for that distribution date, and the denominator of which is the total amount of principal distributed to the Class A-1, Class A-2, Class A-3, Class A-SB, Class D and Class E certificates and the Class A-4 Exchangeable Certificates, the Class A-5 Exchangeable Certificates, the Class A-S Exchangeable Certificates, the Class B Exchangeable Certificates and the Class C Exchangeable Certificates for that distribution date, and (z) the difference between (1) the Base Interest Fraction for the Class B certificates and the applicable principal prepayment and (2) the Base Interest Fraction for the Class B-1 certificates and the applicable principal prepayment,
(i) to the holders of the Class B-X2 certificates, the product of (x) the Non-Retained Certificates’ Percentage Allocation Entitlement of such yield maintenance charge or prepayment premium, (y) a fraction, the numerator of which is equal to the amount of principal distributed to the Class B-2 certificates for that distribution date, and the denominator of which is the total amount of principal distributed to the Class A-1, Class A-2, Class A-3, Class A-SB, Class D and Class E certificates and the Class A-4 Exchangeable Certificates, the Class A-5 Exchangeable Certificates, the Class A-S Exchangeable Certificates, the Class B Exchangeable Certificates and the Class C Exchangeable Certificates for that distribution date, and (z) the difference between (1) the Base Interest Fraction for the Class B certificates and the applicable principal prepayment and (2) the Base Interest Fraction for the Class B-2 certificates and the applicable principal prepayment,
(j) to the holders of the Class C-X1 certificates, the product of (x) the Non-Retained Certificates’ Percentage Allocation Entitlement of such yield maintenance charge or prepayment premium, (y) a fraction, the numerator of which is equal to the amount of principal distributed to the Class C-1 certificates for that distribution date, and the denominator of which is the total amount of principal |
| This is not a research report and was not prepared by any Underwriter’s research department. Please see additional important information and qualifications at the end of this Term Sheet. |
12
| BANK 2021-BNK35 | Structural Overview |
distributed to the Class A-1, Class A-2, Class A-3, Class A-SB, Class D and Class E certificates and the Class A-4 Exchangeable Certificates, the Class A-5 Exchangeable Certificates, the Class A-S Exchangeable Certificates, the Class B Exchangeable Certificates and the Class C Exchangeable Certificates for that distribution date, and (z) the difference between (1) the Base Interest Fraction for the Class C certificates and the applicable principal prepayment and (2) the Base Interest Fraction for the Class C-1 certificates and the applicable principal prepayment,
(k) to the holders of the Class C-X2 certificates, the product of (x) the Non-Retained Certificates’ Percentage Allocation Entitlement of such yield maintenance charge or prepayment premium, (y) a fraction, the numerator of which is equal to the amount of principal distributed to the Class C-2 certificates for that distribution date, and the denominator of which is the total amount of principal distributed to the Class A-1, Class A-2, Class A-3, Class A-SB, Class D and Class E certificates and the Class A-4 Exchangeable Certificates, the Class A-5 Exchangeable Certificates, the Class A-S Exchangeable Certificates, the Class B Exchangeable Certificates and the Class C Exchangeable Certificates for that distribution date, and (z) the difference between (1) the Base Interest Fraction for the Class C certificates and the applicable principal prepayment and (2) the Base Interest Fraction for the Class C-2 certificates and the applicable principal prepayment,
(l) to the holders of the Class X-A certificates, the excess, if any, of (x) the product of (1) the Non-Retained Certificates’ Percentage Allocation Entitlement of such yield maintenance charge or prepayment premium and (2) a fraction, the numerator of which is equal to the total amount of principal distributed to the Class A-1, Class A-2, Class A-3 and Class A-SB certificates and the Class A-4 Exchangeable Certificates and the Class A-5 Exchangeable Certificates for that distribution date, and the denominator of which is the total amount of principal distributed to the Class A-1, Class A-2, Class A-3, Class A-SB, Class D and Class E certificates and the Class A-4 Exchangeable Certificates, the Class A-5 Exchangeable Certificates, the Class A-S Exchangeable Certificates, the Class B Exchangeable Certificates and the Class C Exchangeable Certificates for that distribution date, over (y) the total amount of such yield maintenance charge or prepayment premium distributed to the Class A-1, Class A-2, Class A-3 and Class A-SB certificates and the Class A-4 Exchangeable Certificates and the Class A-5 Exchangeable Certificates as described above,
(m) to the holders of the Class X-B certificates, the excess, if any, of (x) the product of (1) the Non-Retained Certificates’ Percentage Allocation Entitlement of such yield maintenance charge or prepayment premium and (2) a fraction, the numerator of which is equal to the total amount of principal distributed to the Class A-S Exchangeable Certificates, the Class B Exchangeable Certificates and the Class C Exchangeable Certificates for that distribution date, and the denominator of which is the total amount of principal distributed to the Class A-1, Class A-2, Class A-3, Class A-SB, Class D and Class E certificates and the Class A-4 Exchangeable Certificates, the Class A-5 Exchangeable Certificates, the Class A-S Exchangeable Certificates, the Class B Exchangeable Certificates and the Class C Exchangeable Certificates for that distribution date, over (y) the total amount of such yield maintenance charge or prepayment premium distributed to the Class A-S Exchangeable Certificates, the Class B Exchangeable Certificates and Class C Exchangeable Certificates as described above,
and (n) to the holders of the Class X-D certificates, any remaining portion of the Non-Retained Certificates’ Percentage Allocation Entitlement of such yield maintenance charge or prepayment premium not distributed as described above in this clause (1),
and (2) to the RR Interest, its Percentage Allocation Entitlement of such yield maintenance charge or prepayment premium. All yield maintenance charges and prepayment premiums referred to above will be net of any liquidation fees payable therefrom.
No yield maintenance charges or prepayment premiums will be distributed to the holders of the Class X-FG, Class X-H, Class X-J, Class X-K, Class F, Class G, Class H, Class J, Class K, Class V or Class R Certificates.
“Base Interest Fraction” means, with respect to any principal prepayment of any mortgage loan that provides for the payment of a yield maintenance charge or prepayment premium, and with respect to any class of principal balance certificates (other than the RR Interest), a fraction (A) the numerator of which is the greater of (x) zero and (y) the difference between (i) the pass-through rate on that class, and (ii) the applicable discount rate and (B) the denominator of which is the difference between (i) the mortgage interest rate on the related mortgage loan and (ii) the applicable discount rate; provided, that: under no circumstances will the Base Interest Fraction be greater than one; if the discount rate referred to above is greater than or equal to both the mortgage interest rate on the related mortgage loan and the pass-through rate on that class, then the Base Interest Fraction will equal zero; and if the discount rate referred to above is greater than or equal to the mortgage interest rate on the related mortgage loan and is less than the pass-through rate on that class, then the Base Interest Fraction will be equal to 1.0.
Consistent with the foregoing, the Base Interest Fraction is equal to: |
| (Pass-Through Rate – Discount Rate) | ||
| (Mortgage Rate – Discount Rate) |
| This is not a research report and was not prepared by any Underwriter’s research department. Please see additional important information and qualifications at the end of this Term Sheet. |
13
| BANK 2021-BNK35 | Structural Overview |
| Realized Losses: | On each distribution date, immediately following the distributions to be made to the certificateholders on that date, the certificate administrator is required to calculate the amount, if any, by which (i) the aggregate stated principal balance of the mortgage loans, including any successor REO loans, expected to be outstanding immediately following that distribution date is less than (ii) the then aggregate certificate balance of the principal balance certificates after giving effect to distributions of principal on that distribution date. The Non-Retained Certificates’ Percentage Allocation Entitlement of such amount will be applied to the Class K, Class J, Class H, Class G, Class F, Class E and Class D certificates and the Class C, Class B and Class A-S trust components, in that order, in each case until the related certificate or principal balance has been reduced to zero, and then to the Class A-1, Class A-2, Class A-3 and Class A-SB certificates and the Class A-4 and Class A-5 trust components, pro rata based upon their respective certificate or principal balances, until their respective certificate or principal balances have been reduced to zero. The RR Interest’s Percentage Allocation Entitlement of such amount will be applied to the RR Interest until the related RR Interest balance has been reduced to zero.
Any portion of such amount applied to the Class A-4, Class A-5, Class A-S, Class B or Class C trust component will reduce the certificate balance or notional amount of each class of certificates in the related group of Exchangeable Certificates by an amount equal to the product of (x) its certificate balance or notional amount, divided by the principal balance of such trust component prior to the applicable reduction, and (y) the amount applied to such trust component.
|
| Serviced Whole Loans: | Each of the following mortgaged properties or portfolios of mortgaged properties secures a mortgage loan and one or more pari passu promissory notes and, in some cases, one or more generally subordinate promissory notes (each, a “serviced companion loan”) that will be serviced pursuant to the related intercreditor agreement and the pooling and servicing agreement for this transaction: The Domain and Newport Pavilion. With respect to each such mortgaged property or portfolio of mortgaged properties, the related mortgage loan, together with the related serviced companion loan(s), is referred to herein (for so long as it is serviced under the pooling and servicing agreement for this transaction) as a “serviced whole loan.” Each serviced companion loan is not part of the mortgage pool and may be contributed to one or more future securitization transactions (if not already securitized) or may be otherwise transferred at any time, subject to compliance with the related intercreditor agreement. See the table below entitled “Mortgage Loans with Pari Passu Companion Loans” and “Mortgage Loans with Subordinate Debt,” as well as “Description of the Mortgage Pool—The Whole Loans” in the Preliminary Prospectus, for additional information regarding each such whole loan.
With respect to each “servicing shift whole loan”, the pooling and servicing agreement for this transaction will govern servicing of such whole loan until the securitization of the related control note; however, servicing of such whole loan will generally be directed by the holder of the related control note (which is not included in this securitization), and such holder will have the right to replace the special servicer with respect to the related whole loan with or without cause. After the securitization of such promissory note, such loan will cease to be a serviced whole loan and will be serviced pursuant to the pooling and servicing agreement for another securitization transaction (see “—Non-Serviced Whole Loans” below). There will be no servicing shift mortgage loans related to the trust as of the Closing Date.
|
| Non-Serviced Whole Loans: | Each of the following mortgaged properties or portfolios of mortgaged properties secures a mortgage loan (each, a “non-serviced mortgage loan”), one or more pari passu promissory notes and, in some cases, one or more generally subordinate promissory notes (each such promissory note, a “non-serviced companion loan”) that will be serviced pursuant to the related intercreditor agreement and the pooling and servicing agreement or trust and servicing agreement (referred to herein as a related “pooling and servicing agreement”) for another securitization transaction: Four Constitution Square, 375 Pearl Street, Three Constitution Square, U.S. Steel Tower and Fortune 7 Leased Campus. With respect to each such mortgaged property or portfolio of mortgaged properties, the related mortgage loan, together with the related non-serviced companion loan(s), is referred to herein (for so long as it is serviced under the pooling and servicing agreement for another securitization transaction) as a “non-serviced whole loan.” Each non-serviced companion loan is not part of the mortgage pool and may be contributed to one or more future securitization transactions (if not already securitized) or may be otherwise transferred at any time, subject to compliance with the related intercreditor agreement. Servicing of each non-serviced whole loan will generally be directed by the holder of the related control note (or, if such control note is included in a securitization, the directing certificateholder thereunder (or other party designated thereunder to exercise the rights of such control note)), and such holder will have the right to replace the special servicer with respect to the related whole loan with or without cause. See the tables below entitled “Mortgage Loans with Pari Passu Companion Loans” and “Mortgage Loans with Subordinate Debt,” as well as “Description of the Mortgage Pool—The Whole Loans” in the Preliminary Prospectus, for additional information regarding each such whole loan. |
| Directing Certificateholder/ Controlling Class: |
The “Directing Certificateholder” will be (i) with respect to a servicing shift mortgage loan, the related Loan-Specific Directing Certificateholder, and (ii) with respect to each other mortgage loan, the Controlling Class Certificateholder (or its representative) selected by more than 50% (by certificate balance) of the Controlling Class Certificateholders; provided, that (1) absent that selection, (2) until a Directing Certificateholder is so selected or (3) upon receipt of a notice from a majority of the Controlling Class Certificateholders (by certificate balance) that a Directing Certificateholder is no longer designated, the Controlling Class Certificateholder that owns the largest aggregate certificate balance of the Controlling Class (or its representative) will be the Directing Certificateholder; provided, that (a) in the case of clause (3), if no one holder owns the largest aggregate certificate balance of the Controlling Class, then there will be no Directing Certificateholder until appointed in accordance with the terms of the pooling and servicing agreement, and (b) the certificate administrator and the other parties to the pooling and servicing agreement will be entitled to assume that the identity of the Directing Certificateholder has not changed until such parties receive written |
| This is not a research report and was not prepared by any Underwriter’s research department. Please see additional important information and qualifications at the end of this Term Sheet. |
14
| BANK 2021-BNK35 | Structural Overview |
notice of a replacement of the Directing Certificateholder from a party holding the requisite interest in the Controlling Class (as confirmed by the certificate registrar), or the resignation of the then current Directing Certificateholder.
As used herein, the term “Directing Certificateholder,” unless used in relation to a Servicing Shift Mortgage Loan, means the entity determined pursuant to clause (ii) of the definition of such term.
The “Loan-Specific Directing Certificateholder” with respect to a servicing shift mortgage loan is the “controlling holder”, the “directing certificateholder”, the “directing holder”, “directing lender” or any analogous concept under the related intercreditor agreement. Prior to the securitization of the related control note, the Loan-Specific Directing Certificateholder with respect to a servicing shift mortgage loan will be the holder of the related control note. On and after the securitization of the related control note, there will be no Loan-Specific Directing Certificateholder under the PSA with respect to such servicing shift mortgage loan.
The “Controlling Class” will be, as of any time of determination, the most subordinate class of Control Eligible Certificates then outstanding that has an aggregate certificate balance (as notionally reduced by any Cumulative Appraisal Reduction Amounts (as defined below) allocable to such class) at least equal to 25% of the initial certificate balance of that class; provided, that if at any time the certificate balances of the certificates other than the Control Eligible Certificates and the RR Interest have been reduced to zero as a result of principal payments on the mortgage loans, then the Controlling Class will be the most subordinate class of Control Eligible Certificates that has a certificate balance greater than zero without regard to any Cumulative Appraisal Reduction Amounts. The Controlling Class as of the closing date will be the Class K certificates.
The “Control Eligible Certificates” will be any of the Class F, Class G, Class H, Class J and Class K certificates. |
| Control Rights: | Prior to a Control Termination Event, the Directing Certificateholder will have certain consent and consultation rights under the pooling and servicing agreement with respect to certain major decisions and other matters. A “Control Termination Event” will occur when (i) the Class F certificates have a certificate balance (taking into account the application of the allocable portion of any Cumulative Appraisal Reduction Amounts to notionally reduce the certificate balance thereof) of less than 25% of the initial certificate balance of that class or (ii) a holder of the Class F certificates is the majority Controlling Class Certificateholder and has irrevocably waived its right, in writing, to exercise any of the rights of the Controlling Class Certificateholder and such rights have not been reinstated to a successor controlling class certificateholder; provided that no Control Termination Event may occur with respect to the Loan-Specific Directing Certificateholder, and the term “Control Termination Event” will not be applicable to the Loan-Specific Directing Certificateholder; provided, further, that a Control Termination Event will be deemed not continuing in the event that the certificate balances of the principal balance certificates other than the Control Eligible Certificates and the RR Interest have been reduced to zero as a result of principal payments on the mortgage loans.
After the occurrence of a Control Termination Event but prior to the occurrence of a Consultation Termination Event, the Directing Certificateholder will not have any consent rights, but the Directing Certificateholder will have certain non-binding consultation rights under the pooling and servicing agreement with respect to certain major decisions and other matters. A “Consultation Termination Event” will occur when (i) no class of Control Eligible Certificates has a certificate balance (without regard to the application of the allocable portion of any Cumulative Appraisal Reduction Amounts) at least equal to 25% of the initial certificate balance of that class; or (ii) a holder of the Class F certificates is the majority Controlling Class Certificateholder and has irrevocably waived its right, in writing, to exercise any of the rights of the Controlling Class Certificateholder and such rights have not been reinstated to a successor controlling class certificateholder; provided that no Consultation Termination Event resulting solely from the operation of clause (ii) will be deemed to have existed or be in continuance with respect to a successor holder of the Class F certificates that has not irrevocably waived its right to exercise any of the rights of the Controlling Class Certificateholder; provided, further, that no Consultation Termination Event may occur with respect to the Loan-Specific Directing Certificateholder, and the term “Consultation Termination Event” will not be applicable to the Loan-Specific Directing Certificateholder; provided, further, that a Consultation Termination Event will be deemed not continuing in the event that the certificate balances of the principal balance certificates other than the Control Eligible Certificates and the RR Interest have been reduced to zero as a result of principal payments on the mortgage loans.
In the event of any transfer of the Class F certificates by a Controlling Class Certificateholder that had irrevocably waived its rights, the successor Controlling Class Certificateholder that purchased such Class F certificates, even if it does not waive its rights, will not have any consent rights with respect to any Mortgage Loan that became a Specially Serviced Loan prior to such successor Controlling Class Certificateholder’s purchase of such Class F certificates and had not become a Corrected Loan prior to such purchase until such Mortgage Loan becomes a Corrected Loan.
After the occurrence of a Consultation Termination Event, the Directing Certificateholder will not have any consent or consultation rights, except with respect to any rights expressly set forth in the pooling and servicing agreement, and the operating advisor will retain certain non-binding consultation rights under the pooling and servicing agreement with respect to certain major decisions and other matters.
Notwithstanding the proviso to the definitions of “Control Termination Event” and “Consultation Termination Event”, a Control Termination Event and a Consultation Termination Event will each be deemed to have occurred with respect to any Excluded Loan with respect to the Directing Certificateholder or the holder of the majority of the Controlling Class, and neither the Directing Certificateholder nor any Controlling Class Certificateholder will have any consent or consultation rights with respect to the servicing of such Excluded Loan.
An “Excluded Loan” means (a) with respect to the Directing Certificateholder or the holder of the majority of the Controlling Class, a mortgage loan or whole loan with respect to which, as of any date of determination, |
| This is not a research report and was not prepared by any Underwriter’s research department. Please see additional important information and qualifications at the end of this Term Sheet. |
15
| BANK 2021-BNK35 | Structural Overview |
the Directing Certificateholder or the holder of the majority of the Controlling Class is a Borrower Party or (b) with respect to the Risk Retention Consultation Party or the holder of the majority of the RR Interest, a mortgage loan or whole loan with respect to which, as of any date of determination, the Risk Retention Consultation Party or the holder of the majority of the RR Interest is a Borrower Party. It is expected that there will be no Excluded Loans with respect to this securitization on the closing date.
“Borrower Party” means a borrower, a mortgagor, a manager of a mortgaged property, the holder of a mezzanine loan that has been accelerated or as to which foreclosure or enforcement proceedings have been commenced against the equity collateral pledged to secure the related mezzanine loan, or any Borrower Party Affiliate. With respect to a mortgage loan secured by a residential cooperative property, a person will not be considered a “Borrower Party” solely by reason of such person holding one or more cooperative unit loans that are secured by direct equity interests in the related borrower or owning one or more residential cooperative units comprising the related mortgaged property as a result of any foreclosure, transfer in lieu of foreclosure or other exercise of remedies with respect to any such unit loan(s).
“Borrower Party Affiliate” means, with respect to a borrower, a mortgagor, a manager of a mortgaged property or the holder of a mezzanine loan that has been accelerated or as to which foreclosure or enforcement proceedings have been commenced against the equity collateral pledged to secure the related mezzanine loan, (a) any other person controlling or controlled by or under common control with such borrower, mortgagor, manager or mezzanine lender, as applicable, or (b) any other person owning, directly or indirectly, 25% or more of the beneficial interests in such borrower, mortgagor, manager or mezzanine lender, as applicable. For the purposes of this definition, “control” when used with respect to any specified person means the power to direct the management and policies of such person, directly or indirectly, whether through the ownership of voting securities, by contract or otherwise and the terms “controlling” and “controlled” have meanings correlative to the foregoing.
Notwithstanding any of the foregoing to the contrary, if any mortgage loan is part of a whole loan, the Directing Certificateholder’s consent and/or consultation rights with respect thereto may be limited as described in the Preliminary Prospectus. In particular, with respect to each non-serviced whole loan and each servicing shift whole loan, the Directing Certificateholder (other than a Loan-Specific Directing Certificateholder) will only have certain consultation rights with respect to certain major decisions and other matters related to such whole loan, in each case only prior to a Control Termination Event or Consultation Termination Event, as applicable, and the Loan-Specific Directing Certificateholder will be entitled to similar consent and/or consultation rights with respect to such whole loan. In addition, with respect to any serviced A/B whole loan, for so long as the holder of the related subordinate companion loan is the controlling note holder, the holder of such subordinate companion loan (rather than the Directing Certificateholder) will be entitled to exercise such consent and consultation rights with respect to such whole loan. |
| Appraisal Reduction Amounts and Collateral Deficiency Amounts: |
An “Appraisal Reduction Amount” generally will be created in the amount, if any, by which the principal balance of a required appraisal loan (which is a mortgage loan with respect to which certain defaults, modifications or insolvency events have occurred as further described in the Preliminary Prospectus) plus other amounts overdue or advanced in connection with such mortgage loan exceeds 90% of the appraised value of the related mortgaged property plus certain escrows and reserves (including letters of credit) held with respect to the mortgage loan.
A mortgage loan will cease to be subject to an Appraisal Reduction Amount when it has been brought current for at least three consecutive months, no additional event of default is foreseeable in the reasonable judgment of the applicable special servicer and no other circumstances exist that would cause such mortgage loan or any related companion loan to be a specially serviced loan; however, a “Collateral Deficiency Amount” may exist with respect to any mortgage loan that is modified into an AB loan structure (an “AB Modified Loan”) and remains a corrected mortgage loan and, if so, will generally equal the excess of (i) the stated principal balance of such AB Modified Loan (taking into account the related junior note(s) and any pari passu notes included therein), over (ii) the sum of (in the case of a whole loan, solely to the extent allocable to the subject mortgage loan) (x) the most recent appraised value for the related mortgaged property or mortgaged properties, plus (y) solely to the extent not reflected or taken into account in such appraised value (or in the calculation of any related Appraisal Reduction Amount) and to the extent on deposit with, or otherwise under the control of, the lender as of the date of such determination, any capital or additional collateral contributed by the related borrower at the time the mortgage loan became (and as part of the modification related thereto) such AB Modified Loan for the benefit of the related mortgaged property or mortgaged properties (provided that in the case of an non-serviced mortgage loan, the amounts set forth in this clause (y) will be taken into account solely to the extent relevant information is received by the applicable master servicer), plus (z) any other escrows or reserves (in addition to any amounts set forth in the immediately preceding clause (y) and solely to the extent not reflected or taken into account in the calculation of any related Appraisal Reduction Amount) held by the lender in respect of such AB Modified Loan as of the date of such determination, which such excess, for the avoidance of doubt, will be determined separately from and exclude any related Appraisal Reduction Amounts.
As used herein, a “Cumulative Appraisal Reduction Amount” will be the sum of any Appraisal Reduction Amounts and any Collateral Deficiency Amounts.
Any Appraisal Reduction Amount in respect of any non-serviced mortgage loan generally will be calculated in accordance with the other servicing agreement pursuant to which such mortgage loan is being serviced, which calculations are expected to be generally similar to those provided for in the pooling and servicing agreement for this transaction. |
| This is not a research report and was not prepared by any Underwriter’s research department. Please see additional important information and qualifications at the end of this Term Sheet. |
16
| BANK 2021-BNK35 | Structural Overview |
If any mortgage loan is part of a whole loan, any Appraisal Reduction Amount or Collateral Deficiency Amount will (or effectively will) be calculated in respect of such whole loan taken as a whole and allocated, to the extent provided in the related intercreditor agreement and the related pooling and servicing agreement, first, to any related subordinate companion loan, and second, to the related mortgage loan and any pari passu companion loan on a pro rata basis by unpaid principal balance.
Appraisal Reduction Amounts will proportionately reduce the interest portion of debt service advances required to be made in respect of the related mortgage loan. Appraisal Reduction Amounts and Collateral Deficiency Amounts (in each case, to the extent of the Non-Retained Certificates’ Percentage Allocation Entitlement thereof) will be (i) taken into account in determining the identity of the controlling class entitled to appoint the Directing Certificateholder, the existence of a Control Termination Event and the allocation and/or exercise of voting rights for certain purposes (see “Directing Certificateholder/Controlling Class” above) and (ii) allocated to the following classes of certificates and trust components, in each case to notionally reduce their certificate balances or principal balances until the certificate balance or principal balance of each such class or trust component is notionally reduced to zero: the Class K, Class J, Class H, Class G, Class F, Class E and Class D certificates and the Class C, Class B and Class A-S trust components, in that order, and then pro rata to the Class A-1, Class A-2, Class A-3 and Class A-SB certificates and the Class A-4 and Class A-5 trust components. Appraisal Reduction Amounts and Collateral Deficiency Amounts allocated to the Class A-4, Class A-5, Class A-S, Class B or Class C trust component will be allocated to the corresponding classes of Exchangeable Certificates with certificate balances pro rata to notionally reduce their certificate balances in accordance with their Class Percentage Interests therein.
Neither (i) a Payment Accommodation with respect to any mortgage loan or serviced whole loan nor (ii) any default or delinquency that would have existed but for such Payment Accommodation will constitute an appraisal reduction event, for so long as the related borrower is complying with the terms of such Payment Accommodation.
A “Payment Accommodation” for any mortgage loan or serviced whole loan means the entering into of any temporary forbearance agreement as a result of the COVID-19 emergency relating to payment obligations or operating covenants under the related mortgage loan documents or the use of funds on deposit in any reserve account or escrow account for any purpose other than the explicit purpose described in the related mortgage loan documents, that in each case (i) defers no greater than 3 monthly debt service payments (but no greater than 9 monthly debt service payments in the aggregate with any other Payment Accommodations) and (ii) requires full repayment of deferred payments, reserves and escrows by the date that is 24 months following the date of the first Payment Accommodation for such mortgage loan or serviced whole loan. |
| Appraised-Out Class: | An “Appraised-Out Class” is any class of Control Eligible Certificates, the certificate balance of which (taking into account the application of the Non-Retained Certificates’ Percentage Allocation Entitlement of any Appraisal Reduction Amounts or Collateral Deficiency Amounts to notionally reduce the certificate balance of such class) has been reduced to less than 25% of its initial certificate balance. Any Appraised-Out Class may not exercise any direction, control, consent and/or similar rights of the Controlling Class until such time, if any, as such class is reinstated as the Controlling Class, and the rights of the Controlling Class will be exercised by the next most senior class of Control Eligible Certificates that is not an Appraised-Out Class, if any, during such period. |
| Appraisal Remedy: | The holders of the majority (by certificate balance) of an Appraised-Out Class (such holders, the “Requesting Holders”) will have the right, at their sole expense, to require the applicable special servicer to order (or, with respect to a non-serviced mortgage loan, require the applicable master servicer to request from the applicable non-serviced special servicer) a second appraisal of any mortgage loan (or serviced whole loan) for which an appraisal reduction event has occurred or as to which there exists a Collateral Deficiency Amount. With respect to any serviced mortgage loan, the applicable special servicer will be required to use its reasonable best efforts to ensure that such appraisal is delivered within 30 days from receipt of the Requesting Holders’ written request and will ensure that such appraisal is prepared on an “as-is” basis by an MAI appraiser. With respect to any non-serviced mortgage loan, the applicable master servicer will be required to use commercially reasonable efforts to obtain such second appraisal from the applicable non-serviced special servicer and to forward such second appraisal to the applicable special servicer. Upon receipt of such supplemental appraisal, the applicable master servicer (for Collateral Deficiency Amounts on non-serviced mortgage loans), the non-serviced special servicer (for Appraisal Reduction Amounts on non-serviced mortgage loans to the extent provided for in the applicable Non-Serviced PSA and applicable intercreditor agreement) and the applicable special servicer (for any serviced mortgage loan) will be required to determine, in accordance with the Servicing Standard, whether, based on its assessment of such supplemental appraisal, any recalculation of the applicable Appraisal Reduction Amount or Collateral Deficiency Amount is warranted and, if so warranted, such person will be required to recalculate such Appraisal Reduction Amount or Collateral Deficiency Amount, as applicable, based upon such supplemental appraisal and (for any serviced mortgage loan) receipt of information that is in the possession of the applicable master servicer and reasonably requested by such special servicer from the applicable master servicer as described above. If required by any such recalculation, the applicable Appraised-Out Class will be reinstated as the Controlling Class and each Appraised-Out Class will, if applicable, have its related certificate balance notionally restored to the extent required by such recalculation of the Appraisal Reduction Amount or Collateral Deficiency Amount, if applicable. |
| Sale of Defaulted Loans: | Under certain circumstances the applicable special servicer may be required to use reasonable efforts to solicit offers for a defaulted serviced mortgage loan that is a specially serviced mortgage loan (and any related companion loan (to the extent provided under the related intercreditor agreement) and/or related REO properties).
The Directing Certificateholder will not have a right of first refusal to purchase a defaulted loan. |
| This is not a research report and was not prepared by any Underwriter’s research department. Please see additional important information and qualifications at the end of this Term Sheet. |
17
| BANK 2021-BNK35 | Structural Overview |
If the applicable special servicer does not receive an offer at least equal to the outstanding principal balance plus all accrued and unpaid interest and outstanding costs and expenses and certain other amounts specified in the pooling and servicing agreement (the “Par Purchase Price”), the applicable special servicer may purchase the defaulted loan or REO property at the Par Purchase Price or may accept the first cash offer received from any person that is determined to be a fair price for such defaulted loan or REO property. If multiple offers are received during the period designated by the applicable special servicer for receipt of offers, such special servicer is generally required to select the highest offer. The applicable special servicer will be required to determine whether any cash offer constitutes a fair price for any defaulted loan or REO property if the highest offeror is a person other than a party to the pooling and servicing agreement for this transaction (the “PSA”), the Directing Certificateholder, the Risk Retention Consultation Party, any sponsor, any Borrower Party, any independent contractor engaged by a special servicer, the trustee for the securitization of a related companion loan (with respect to a whole loan if it is a defaulted loan), any related companion loan holder or its representative, any holder of a related mezzanine loan or any known affiliate of any of the preceding entities (each, an “Interested Person”). If an offer is made by an Interested Person, the trustee will be required to determine (based upon the most recent appraisal conducted in accordance with the terms of the PSA) whether the offer constitutes a fair price for the defaulted loan or REO property unless (i) the offer is equal to or greater than the applicable Par Purchase Price and (ii) the offer is the highest offer received. Absent an offer at least equal to the Par Purchase Price, no offer from an Interested Person will constitute a fair price unless (x) it is the highest offer received and (y) at least two other offers are received from independent third parties. Neither the trustee nor any of its affiliates may make an offer for or purchase any specially serviced loan or REO property.
Notwithstanding any of the foregoing to the contrary, the applicable special servicer is not required to accept the highest offer and may accept a lower offer for a defaulted loan or REO property if such special servicer determines, in accordance with the Servicing Standard (and subject to the requirements of any related intercreditor agreement), that a rejection of such offer would be in the best interests of the certificateholders and any related companion loan holders as a collective whole as if they constituted a single lender (and with respect to a serviced A/B whole loan, taking into account the subordinate nature of any related subordinate companion loan), so long as such lower offer was not made by such special servicer or any of its affiliates.
If title to any mortgaged property is acquired by the trust fund, the applicable special servicer will generally be required to sell such mortgaged property prior to the close of the third calendar year beginning after the year of acquisition.
The foregoing applies to mortgage loans serviced under the PSA. With respect to any non-serviced whole loan, if the special servicer under the applicable pooling and servicing agreement determines to sell the related controlling companion loan if it becomes a defaulted loan, then the applicable special servicer will be required to sell the related whole loan, including the related mortgage loan included in the BANK 2021-BNK35 securitization trust and the related pari passu companion loan(s) and, under certain circumstances, any subordinate companion loan(s), as a single loan. In connection with any such sale, the special servicer under the applicable pooling and servicing agreement will be required to follow procedures substantially similar to those set forth above. |
| Risk Retention Consultation Party: | A risk retention consultation party may be appointed by the holder or holders of more than 50% of the RR Interest, by certificate balance. The majority RR Interest holder will have a continuing right to appoint, remove or replace the risk retention consultation party in its sole discretion. This right may be exercised at any time and from time to time. Except with respect to an Excluded Loan as to such party or the holder of the majority of the RR Interest, the risk retention consultation party will be entitled to consult with the applicable special servicer, upon request of the risk retention consultation party, with respect to certain material servicing actions proposed by such special servicer; provided, that prior to the occurrence and continuance of a Consultation Termination Event, such mortgage loan must also be a specially serviced mortgage loan. |
| Appointment and Replacement of each Special Servicer: |
The Directing Certificateholder will appoint each initial special servicer as of the closing date. Prior to the occurrence and continuance of a Control Termination Event, any special servicer may generally be replaced by the Directing Certificateholder with or without cause at any time.
After the occurrence and during the continuance of a Control Termination Event and upon (a) the written direction of holders of principal balance certificates evidencing not less than 25% of the voting rights of all classes of certificates (other than the RR Interest) entitled to principal (taking into account the application of Cumulative Appraisal Reduction Amounts to notionally reduce the certificate balances of classes to which such Cumulative Appraisal Reduction Amounts are allocable) requesting a vote to replace the applicable special servicer with a replacement special servicer, (b) payment by such requesting holders to the certificate administrator of all reasonable fees and expenses to be incurred by the certificate administrator in connection with administering such vote and (c) delivery by such holders of a rating agency confirmation from each applicable rating agency, the certificate administrator will be required to promptly post such notice on its internet website and by mail and conduct the solicitation of votes of all certificates in such regard, which requisite affirmative votes must be received within 180 days of the posting of such notice. Upon the written direction of holders of at least 66 2/3% of a Certificateholder Quorum, the trustee will be required to immediately replace the applicable special servicer with a qualified replacement special servicer designated by such holders of certificates.
After the occurrence and during the continuance of a Consultation Termination Event, if the operating advisor determines that the applicable special servicer is not performing its duties as required under the pooling and servicing agreement or is otherwise not acting in accordance with the Servicing Standard, the operating advisor may also recommend the replacement of such special servicer. The operating advisor’s recommendation to replace such special servicer must be confirmed by an affirmative vote of holders of |
| This is not a research report and was not prepared by any Underwriter’s research department. Please see additional important information and qualifications at the end of this Term Sheet. |
18
| BANK 2021-BNK35 | Structural Overview |
principal balance certificates evidencing at least a majority of the aggregate voting rights (taking into account the application of any Cumulative Appraisal Reduction Amounts to notionally reduce the respective certificate balances) of all principal balance certificates on an aggregate basis (which requisite affirmative vote must be received within 180 days of posting of the notice of the operating advisor’s recommendation to the certificate administrator’s website).
A “Certificateholder Quorum” means, in connection with any solicitation of votes in connection with the replacement of a special servicer or the asset representations reviewer, the holders of certificates evidencing at least 50% of the aggregate voting rights (taking into account the application of realized losses and, other than with respect to the termination of the asset representations reviewer, any Cumulative Appraisal Reduction Amounts to notionally reduce the certificate balance of the certificates) of all classes of certificates entitled to principal (other than the RR Interest) on an aggregate basis.
With respect to each serviced whole loan, any holder of a related pari passu companion loan, following a servicer termination event with respect to the applicable special servicer that affects such holder, will be entitled to direct the trustee (and the trustee will be required) to terminate such special servicer solely with respect to such serviced whole loan. A replacement special servicer will be selected by the trustee or, prior to a Control Termination Event, by the Directing Certificateholder; provided, that any successor special servicer appointed to replace the special servicer with respect to such whole loan cannot be the entity (or its affiliate) that was terminated at the direction of the holder of the related pari passu companion loan.
Notwithstanding any of the foregoing to the contrary, with respect to each servicing shift whole loan and any serviced A/B whole loans as to which a subordinate companion loan holder is the related controlling note holder, the holder of the related control note will be entitled to replace the applicable special servicer with respect to such whole loan at any time, with or without cause, and while it is a serviced whole loan, no other party may replace the applicable special servicer for such whole loan unless there is a servicer termination event with respect thereto.
With respect to any non-serviced whole loan, subject to conditions or restrictions in the applicable intercreditor agreement, the BANK 2021-BNK35 trust, as holder of the related mortgage loan, has the right to terminate the applicable special servicer under the related pooling and servicing agreement if a servicer termination event occurs with respect to such special servicer that affects the trust in its capacity as such holder. Such rights may be exercised by the Directing Certificateholder prior to a Consultation Termination Event (or the applicable special servicer, following the occurrence and during the continuance of a Consultation Termination Event). The successor special servicer will be selected pursuant to the applicable pooling and servicing agreement by the related directing holder prior to a control termination event under such pooling and servicing agreement. |
| Servicing Standard: | Each applicable master servicer and each applicable special servicer is obligated to service and administer the mortgage loans (and, if applicable, the serviced companion loans) in accordance with the definition of the “Servicing Standard” described in the Preliminary Prospectus and the terms of the pooling and servicing agreement, provided that each non-serviced mortgage loan, if any, will be serviced by another master servicer or special servicer under the pooling and servicing agreement with respect to the securitization of a related companion loan, which entities will be obligated to service and administer such non-serviced mortgage loan pursuant to a similar standard set forth in the related pooling and servicing agreement. |
| Excluded Special Servicer: | If a special servicer obtains knowledge that it has become a Borrower Party with respect to any mortgage loan (an “Excluded Special Servicer Loan”), such special servicer will be required to resign as special servicer of that Excluded Special Servicer Loan. Prior to the occurrence and continuance of a Control Termination Event, the Directing Certificateholder will be required to appoint (and may remove and replace with or without cause) a separate special servicer that is not a Borrower Party (an “Excluded Special Servicer”) with respect to any Excluded Special Servicer Loan, unless such Excluded Special Servicer Loan is also an Excluded Loan with respect to the Directing Certificateholder or the holder of the majority of the Controlling Class. After the occurrence and during the continuance of a Control Termination Event, if at any time the applicable Excluded Special Servicer Loan is also an Excluded Loan with respect to the Directing Certificateholder or the holder of the majority of the Controlling Class or if the Directing Certificateholder is entitled to appoint the Excluded Special Servicer but does not so appoint within 30 days of notice of such resignation, the resigning special servicer will be required to use reasonable efforts to select the related Excluded Special Servicer. Any Excluded Special Servicer will be required to perform all of the obligations of the applicable special servicer and will be entitled to all special servicing compensation with respect to such Excluded Special Servicer Loan earned while the related mortgage loan is an Excluded Special Servicer Loan. |
| Liquidated Loan Waterfall: |
On liquidation of any mortgage loan, all net liquidation proceeds related to the mortgage loan (but not any related companion loan) will be applied so that amounts allocated as a recovery of accrued and unpaid interest will not, in the first instance, include any delinquent interest that was not advanced as a result of Appraisal Reduction Amounts (or would not have been advanced in the absence of a non-recoverability determination) or accrued on the portion of the stated principal balance thereof equal to any related Collateral Deficiency Amount in effect from time to time and as to which no advance was made (collectively, the “Subordinated Interest Amount”). After the adjusted interest amount is so allocated, any remaining liquidation proceeds will be allocated to pay principal on the mortgage loan until the unpaid principal amount of the mortgage loan has been reduced to zero. Any remaining liquidation proceeds will then be allocated to pay the Subordinated Interest Amount.
|
| Operating Advisor: | The operating advisor will be required to perform certain review duties if a Control Termination Event has occurred and is continuing, which will generally include a limited annual review of, and the preparation of a |
| This is not a research report and was not prepared by any Underwriter’s research department. Please see additional important information and qualifications at the end of this Term Sheet. |
19
| BANK 2021-BNK35 | Structural Overview |
report regarding, certain actions of the applicable special servicer with respect to the resolution and/or liquidation of specially serviced loans. The review and report generally will be based on any asset status reports and additional information delivered to the operating advisor by such special servicer. In addition, if a Control Termination Event has occurred and is continuing, the applicable special servicer must consult with the operating advisor (in addition to the Directing Certificateholder if no Consultation Termination Event has occurred and is continuing) in connection with major decisions with respect to mortgage loans. Furthermore, under certain circumstances, but only if a Consultation Termination Event has occurred and is continuing, the operating advisor may recommend the replacement of the applicable special servicer as described above under “—Appointment and Replacement of each Special Servicer”; however, the operating advisor will not have any rights or obligations with respect to a non-serviced whole loan.
If a Consultation Termination Event has occurred and is continuing, the operating advisor may be removed and replaced without cause upon the affirmative direction of certificates owners holding not less than 75% of the voting rights of all certificates (taking into account the application of Cumulative Appraisal Reduction Amounts), following a proposal from certificate owners holding not less than 25% of the voting rights of all certificates (taking into account the application of Cumulative Appraisal Reduction Amounts). The certificateholders who initiate a vote on a termination and replacement of the operating advisor without cause must cause the payment of the fees and expenses incurred in the replacement. In addition, in the event there are no classes of certificates outstanding other than the Control Eligible Certificates, the RR Interest and the Class X-FG, Class X-H, Class X-J, Class X-K, Class V and Class R certificates, then all of the rights and obligations of the operating advisor under the PSA will terminate without payment of any penalty or termination fee (other than any rights or obligations that accrued prior to the date of such termination (including accrued and unpaid compensation) and other than indemnification rights arising out of events occurring prior to such termination). See “Pooling and Servicing Agreement—The Operating Advisor—Termination of the Operating Advisor Without Cause” in the Preliminary Prospectus. |
| Asset Representations Reviewer: | The asset representations reviewer will be required to review certain delinquent mortgage loans (excluding a mortgage loan for which a Payment Accommodation has been made and the related borrower is complying with the terms of such Payment Accommodation) after a specified delinquency threshold has been met and the required percentage of certificateholders vote to direct a review as described below. The asset representations reviewer will be entitled to the Asset Representations Reviewer Fee with respect to such review. See “Pooling and Servicing Agreement—The Asset Representations Reviewer” in the Preliminary Prospectus.
The certificate administrator will be required to notify certificateholders if the specified delinquency threshold has been met as described in the Preliminary Prospectus under “—The Asset Representations Reviewer”.
If certificateholders evidencing not less than 5.0% of the voting rights request a vote to commence an asset review, and if subsequently (i) a majority of those certificateholders who cast votes and (ii) a majority of an Asset Review Quorum authorizes an asset review within 150 days of the request for a vote, the asset representations reviewer will be required to conduct an asset review of delinquent loans.
The asset representations reviewer may be terminated and replaced without cause. Upon (i) the written direction of certificateholders evidencing not less than 25% of the voting rights (without regard to the application of any Cumulative Appraisal Reduction Amounts) requesting a vote to terminate and replace the asset representations reviewer with a proposed successor asset representations reviewer that is an eligible asset representations reviewer, and (ii) payment by such holders to the certificate administrator of the reasonable fees and expenses to be incurred by the certificate administrator in connection with administering such vote, the certificate administrator will be required to promptly provide notice to all certificateholders and the asset representations reviewer of such request by posting such notice on its internet website, and by mailing such notice to all certificateholders and the asset representations reviewer. Upon the written direction of certificateholders evidencing at least 75% of a Certificateholder Quorum (without regard to the application of any Cumulative Appraisal Reduction Amounts), the trustee will be required to terminate all of the rights and obligations of the asset representations reviewer under the pooling and servicing agreement (other than any rights or obligations that accrued prior to the date of such termination and other than indemnification rights arising out of events occurring prior to such termination) by written notice to the asset representations reviewer, and the proposed successor asset representations reviewer will be appointed. See “Pooling and Servicing Agreement—The Asset Representations Reviewer” in the Preliminary Prospectus.
An “Asset Review Quorum” means, in connection with any solicitation of votes to authorize an Asset Review as described above, the holders of certificates evidencing at least 5.0% of the aggregate voting rights represented by all certificates that have voting rights.
|
| Dispute Resolution Provisions: | The mortgage loan sellers will be subject to the dispute resolution provisions set forth in the PSA to the extent those provisions are triggered with respect to any mortgage loan sold to the depositor by a mortgage loan seller, and such mortgage loan seller will be obligated under the related mortgage loan purchase agreement to comply with all applicable provisions and to take part in any mediation or arbitration proceedings that may result. Generally, in the event that a Repurchase Request is not “Resolved” within 180 days after the related mortgage loan seller receives such Repurchase Request, then the enforcing servicer will be required to send a notice to the first certificateholder (or beneficial owner) to deliver a certificateholder repurchase request with respect to the mortgage loan (the “Initial Requesting Certificateholder”) (if any) and to the certificate administrator (which will be required to make such notice available to certificateholders via the certificate administrator’s website) indicating the enforcing servicer’s intended course of action with respect to the Repurchase Request. If (a) the enforcing servicer’s intended course of action with respect to the Repurchase Request does not involve pursuing further action to exercise rights against the related mortgage loan seller with respect to the Repurchase Request and the Initial Requesting Certificateholder, if any, or any other certificateholder or certificate owner wishes to exercise its right to refer the matter to mediation (including |
| This is not a research report and was not prepared by any Underwriter’s research department. Please see additional important information and qualifications at the end of this Term Sheet. |
20
| BANK 2021-BNK35 | Structural Overview |
| nonbinding arbitration) or arbitration, or (b) the enforcing servicer’s intended course of action is to pursue further action to exercise rights against the related mortgage loan seller with respect to the Repurchase Request but the Initial Requesting Certificateholder, if any, or any other certificateholder or certificate owner does not agree with the dispute resolution method selected by the enforcing servicer, then the Initial Requesting Certificateholder, if any, or such other certificateholder or certificate owner may deliver a written notice to the enforcing servicer indicating its intent to exercise its right to refer the matter to either mediation or arbitration.
“Resolved” means, with respect to a Repurchase Request, (i) that the related material defect or breach has been cured, (ii) the related mortgage loan has been repurchased in accordance with the related mortgage loan purchase agreement, (iii) a mortgage loan has been substituted for the related mortgage loan in accordance with the related mortgage loan purchase agreement, (iv) the applicable mortgage loan seller has made a loss of value payment, (v) a contractually binding agreement has been entered into between the enforcing servicer, on behalf of the issuing entity, and the related mortgage loan seller that settles the related mortgage loan seller’s obligations under the related mortgage loan purchase agreement, or (vi) the related mortgage loan is no longer property of the issuing entity as a result of a sale or other disposition in accordance with the pooling and servicing agreement. See “Pooling and Servicing Agreement—Dispute Resolution Provisions” in the Preliminary Prospectus. |
| Investor Communications: | The certificate administrator is required to include on any Form 10-D any request received from a certificateholder to communicate with other certificateholders related to certificateholders exercising their rights under the terms of the PSA. Any certificateholder wishing to communicate with other certificateholders regarding the exercise of its rights under the terms of the PSA will be able to deliver a written request signed by an authorized representative of the requesting investor to the certificate administrator. |
| Deal Website: | The certificate administrator will be required to maintain a deal website which will include, among other items: (a) summaries of asset status reports prepared by a special servicer, (b) inspection reports, (c) appraisals, (d) various “special notices” described in the Preliminary Prospectus, (e) the “Investor Q&A Forum” and (f) a voluntary “Investor Registry”. Investors may access the deal website following execution of a certification and confidentiality agreement. |
| This is not a research report and was not prepared by any Underwriter’s research department. Please see additional important information and qualifications at the end of this Term Sheet. |
21
| BANK 2021-BNK35 | Collateral Overview |
| Mortgage Loan Sellers | No. of Mortgage Loans | No. of Mortgaged Properties | Aggregate Cut-off Date Balance | % of Pool(1) |
| Morgan Stanley Mortgage Capital Holdings LLC | 18 | 41 | $481,978,724 | 34.6% |
| Bank of America, National Association | 17 | 23 | $470,913,396 | 33.8% |
| Wells Fargo Bank, National Association | 15 | 19 | $364,437,385 | 26.1% |
| National Cooperative Bank, National Association(2) | 26 | 26 | $77,526,683 | 5.6% |
| Total: | 76 | 109 | $1,394,856,187 | 100.0% |
| Pool Statistics | |
| Aggregate Cut-off Date Balance: | $1,394,856,187 |
| Number of Mortgage Loans: | 76 |
| Average Cut-off Date Balance per Mortgage Loan: | $18,353,371 |
| Number of Mortgaged Properties: | 109 |
| Average Cut-off Date Balance per Mortgaged Property: | $12,796,846 |
| Weighted Average Mortgage Rate: | 3.1767% |
| % of Pool Secured by 5 Largest Mortgage Loans: | 25.1% |
| % of Pool Secured by 10 Largest Mortgage Loans: | 41.5% |
| % of Pool Secured by ARD Loans(3): | 7.5% |
| Weighted Average Original Term to Maturity (months)(3): | 115 |
| Weighted Average Remaining Term to Maturity (months)(3): | 114 |
| Weighted Average Seasoning (months): | 1 |
| % of Pool Secured by Single Tenant Mortgaged Properties: | 8.6% |
| % of Pool Secured by Refinance Loans: | 67.0% |
| % of Pool Secured by Acquisition Loans: | 22.8% |
| % of Pool Secured by Recapitalization Loans: | 10.2% |
| Additional Debt | |
| % of Pool with Pari Passu Mortgage Debt: | 22.3% |
| % of Pool with Mezzanine Mortgage Debt: | 9.2% |
| % of Pool with Subordinate Debt(4): | 2.2% |
| Credit Statistics(5)(6) | |
| Weighted Average UW NOI DSCR: | 3.49x |
| Weighted Average UW NOI Debt Yield(7): | 12.4% |
| Weighted Average UW NCF DSCR: | 3.36x |
| Weighted Average UW NCF Debt Yield(7): | 11.9% |
| Weighted Average Cut-off Date LTV Ratio(7)(8): | 52.0% |
| Weighted Average Maturity Date LTV Ratio(3)(8): | 50.2% |
Footnotes are set forth on the following page.
| This is not a research report and was not prepared by any Underwriter’s research department. Please see additional important information and qualifications at the end of this Term Sheet. |
22
| BANK 2021-BNK35 | Collateral Overview |
Amortization
| Weighted Average Original Amortization Term (months)(9): | 369 |
| Weighted Average Remaining Amortization Term (months)(9): | 368 |
| % of Pool Interest Only through Maturity: | 67.3% |
| % of Pool Amortizing Balloon: | 16.0% |
| % of Pool Interest Only followed by Amortizing Balloon: | 9.2% |
| % of Pool Interest Only, ARD: | 6.7% |
| % of Pool Interest Only, Amortizing ARD: | 0.8% |
| Lockboxes | |
| % of Pool with Hard Lockboxes: | 51.7% |
| % of Pool with Springing Lockboxes: | 30.6% |
| % of Pool with No Lockboxes: | 9.5% |
| % of Pool with Soft Lockboxes: | 8.2% |
| Reserves | |
| % of Pool Requiring Tax Reserves: | 73.6% |
| % of Pool Requiring Insurance Reserves: | 34.7% |
| % of Pool Requiring Replacement Reserves: | 68.4% |
| % of Pool Requiring TI/LC Reserves(10): | 47.0% |
| Call Protection | |
| % of Pool with lockout period, followed by defeasance until open period: | 80.9% |
| % of Pool with lockout period, followed by the greater of a prepayment premium and yield maintenance until open period: | 7.9% |
| % of Pool with lockout period, followed by defeasance or the greater of a prepayment premium and yield maintenance until open period: | 5.7% |
| % of Pool with no lockout period. Greater of a prepayment premium and yield maintenance followed by prepayment premium until open period: | 5.6% |
| (1) | Unless otherwise indicated, all references to “% of Pool” in this Term Sheet reflect a percentage of the aggregate principal balance of the mortgage pool as of the Cut-off Date, after application of all payments of principal due during or prior to August 2021. |
| (2) | Twenty (20) of the twenty-six (26) mortgage loans for which National Cooperative Bank, N.A. is the mortgage loan seller were originated by its parent company, National Consumer Cooperative Bank, and transferred to National Cooperative Bank, N.A. Each such mortgage loan originated by National Consumer Cooperative Bank was underwritten pursuant to National Cooperative Bank, N.A.’s underwriting guidelines. |
| (3) | With respect to any ARD Loan, unless otherwise indicated, references in this Term Sheet to the applicable “maturity date” or “maturity” refer to the applicable anticipated repayment date with respect to such ARD Loan, and such applicable anticipated repayment date is treated as its maturity date for all purposes hereof. |
| (4) | Twenty (20) of the mortgage loans, each of which is secured by a residential cooperative property, currently have either (i) subordinate secured lines of credit to the related mortgage borrowers that permit future advances (such loans, collectively, the “Subordinate Coop LOCs”) or (ii) a subordinate wraparound mortgage to the related mortgage borrower that is currently held by the cooperative sponsor (such loan, the “Subordinate Wrap Mortgage”). The percentage figure expressed as “% of Pool with Subordinate Mortgage Debt” is determined as a percentage of the initial pool balance and does not take into account any Subordinate Coop LOCs, Subordinate Wrap Mortgage and/or future subordinate debt (whether or not secured by the mortgaged property), if any, that may be permitted under the terms of any mortgage loan or the pooling and servicing agreement. See “Description of the Mortgage Pool—Additional Indebtedness—Other Secured Indebtedness” and “Description of the Mortgage Pool—Additional Debt Financing for Mortgage Loans Secured by Residential Cooperatives” in the Preliminary Prospectus. |
| (5) | With respect to any mortgage loan that is part of a whole loan, unless otherwise indicated, all LTV, DSCR and Debt Yield calculations in this Term Sheet include any related pari passu companion loans and exclude any subordinate companion loans, as applicable. Additionally, LTV, DSCR and Debt Yield figures in this Term Sheet are calculated for mortgage loans without regard to any additional indebtedness that may be incurred at a future date. For mortgaged properties securing residential cooperative mortgage loans all LTV, DSCR and Debt Yield calculations do not take into account any subordinate debt (whether or not secured by the related mortgaged property), that currently exists or is allowed under the terms of any mortgage loan. With respect to any leased fee loans, the SF/Units and Balance per SF/Unit figures in this Term Sheet are based on the size of the non-collateral improvements. |
| (6) | For mortgaged properties securing residential cooperative mortgage loans, all DSCR and Debt Yield calculations for each such mortgaged property is calculated using underwritten net operating Income or underwritten net cash flow, as applicable, for the related residential cooperative property which is the projected net operating income or net cash flow, as applicable, reflected in the most recent appraisal obtained by or otherwise in the possession of the related mortgage loan seller as of the Cut-off Date. All LTV ratio calculations are based upon the appraised value of the residential cooperative property determined as if such residential cooperative property is operated as a residential cooperative, inclusive of the amount of the underlying debt encumbering such residential cooperative property. |
| (7) | With respect to certain mortgage loans, debt yields and LTVs (such as, for example, UW NOI Debt Yield, UW NCF Debt Yield or Cut-off Date LTV Ratio) have been calculated based on a principal balance that is net of a holdback or earnout reserve. Such mortgage loans are identified under the definitions of “Underwritten NOI Debt Yield”, “Underwritten NCF Debt Yield” and “Cut-off Date LTV Ratio” set forth under “Description of the Mortgage Pool—Certain Calculations and Definitions” in the Preliminary Prospectus. |
| (8) | The LTV ratios set forth in this Term Sheet are generally based on the “as-is” values of the related mortgaged properties; provided that the “as-is” value for a portfolio of mortgaged properties may include a premium relating to the valuation of the mortgaged properties as a whole rather than as the sum of individually valued mortgaged properties; provided, further, that such LTV ratios may be based on “as-stabilized”, “as complete” or other contingent values in certain cases in which reserves have been established at origination for the applicable condition or circumstance that is expected to result in stabilization provided, further, that such LTV ratios may have been calculated based on a principal balance that is net of a holdback or earnout reserve. See the definition of “Appraised Value” under “Description of the Mortgage Pool—Certain Calculations and Definitions” in the Preliminary Prospectus. |
| (9) | Excludes mortgage loans that provide for payments of interest only through the related maturity date or anticipated repayment date, as applicable. |
| (10) | Excludes multifamily, self storage and manufactured housing properties. |
| This is not a research report and was not prepared by any Underwriter’s research department. Please see additional important information and qualifications at the end of this Term Sheet. |
23
| BANK 2021-BNK35 | Characteristics of the Mortgage Loans |
COVID-19 Update(1)
The following table contains information regarding the status of the mortgage loans and mortgaged properties provided by the respective borrowers as of the date set forth in the “Information as of Date” column. The cumulative effects of the COVID-19 emergency on the global economy may cause tenants to be unable to pay their rent and borrowers to be unable to pay debt service under the mortgage loans. As a result, we cannot assure you that the information in the following table is indicative of future performance or that tenants or borrowers will not seek rent or debt service relief (including forbearance arrangements) or other lease or loan modifications in the future. Such actions may lead to shortfalls and losses on the certificates. Any information in the following table will be superseded by the information contained under the heading “Description of the Mortgage Pool—COVID Considerations” in the Preliminary Prospectus.
Loan No. | Mortgage Loan Seller | Info. as of Date | Origination Date | Property Name | Property Type | Lease Modification or Rent Relief Requested (Y/N) | Tenants Making Full May Rent Payment (% NRA)(2) | Tenants Making Full May Rent Payment (% of UW rent)(2) | Tenants Making Full June Rent Payment (% NRA)(2) | Tenants Making Full June Rent Payment (% of UW rent)(2) |
| 1 | BANA | 7/7/2021 | 6/25/2021 | 30 Dunnigan | Industrial | N | 100.0% | 100.0% | 100.0% | 100.0% |
| 2 | BANA | 7/7/2021 | 6/16/2021 | The Domain | Retail | Y(3) | (3) | (3) | (3) | (3) |
| 3 | BANA | 7/5/2021 | 5/14/2021 | Four Constitution Square | Office | N | 100.0% | 100.0% | 100.0% | 100.0% |
| 4 | MSMCH | 6/23/2021 | 6/18/2021 | River House Coop | Multifamily | Y(4) | 97.0%(23) | N/A(24) | 98.0%(23) | N/A(24) |
| 5 | WFB | 7/14/2021 | 6/1/2021 | 375 Pearl Street | Office | N | 100.0% | 100.0% | 100.0% | 100.0% |
| 6 | WFB | 6/28/2021 | 6/21/2021 | Camp Hill Shopping Center | Retail | Y(5) | 100.0% | 100.0% | 100.0% | 100.0% |
| 7 | BANA | 7/1/2021 | 7/1/2021 | Rochester Multifamily Portfolio | Multifamily | NAV | NAV | 95.0% | NAV | NAV |
| 8 | MSMCH | 7/9/2021 | 6/25/2021 | The Lodges Phase I and II(6) | Multifamily | N | 95.9% | 95.9% | 93.8% | 93.8% |
| 9 | MSMCH | 7/9/2021 | 6/3/2021 | The Landing at Woodyard | Retail | Y(7) | 86.8% | 89.3% | 98.6% | 96.8% |
| 10 | MSMCH | 7/6/2021 | 7/14/2021 | Mi Place at Vineyard | Multifamily | N | 98.0% | 98.0% | 100.0% | 100.0% |
| 11 | WFB | 6/28/2021 | 7/9/2021 | One Trinity Center | Office | N | 100.0% | 100.0% | 100.0% | 100.0% |
| 12 | BANA | 7/5/2021 | 5/14/2021 | Three Constitution Square | Office | N | 100.0% | 100.0% | 100.0% | 99.8% |
| 13 | MSMCH | 6/30/2021 | 6/30/2021 | Northeast Self Storage Portfolio | Self Storage | N | 99.0% | 99.0% | NAV(10) | NAV(10) |
| 14 | MSMCH | 7/13/2021 | 6/10/2021 | Overseas Market | Retail | Y(8) | 97.7% | 96.7% | 94.4% | 91.8% |
| 15 | WFB | 7/1/2021 | 6/17/2021 | Rosemead Place | Retail | Y(9) | 83.9% | 90.2% | NAV(10) | NAV(10) |
| 16 | WFB | N/A | 5/27/2021 | Carleton Portfolio(11) | Various | Y(12) | NAV | NAV | NAV | NAV |
| 17 | MSMCH | 7/1/2021 | 5/6/2021 | U.S. Steel Tower | Office | Y(13) | 99.4% | 99.4% | 99.5% | 99.5% |
| 18 | BANA | 7/7/2021 | 6/15/2021 | Denver West Village Shopping Center | Retail | Y(14) | (14) | (14) | (14) | (14) |
| 19 | MSMCH | 7/13/2021 | 6/21/2021 | Goodfarb Industrial Portfolio | Industrial | Y(15) | 100.0% | 100.0% | 97.8% | 97.8% |
| 20 | MSMCH | 6/15/2021 | 6/16/2021 | Newport Pavilion | Retail | Y(16) | 97.0% | 97.0% | 90.0% | 90.0% |
| 21 | WFB | 6/29/2021 | 6/23/2021 | The Crossing At Lake Mead | Multifamily | N | 79.5% | 95.5% | 79.7% | 95.3% |
| 22 | MSMCH | 7/9/2021 | 4/23/2021 | Fortune 7 Leased Campus | Office | N | 100.0% | 100.0% | 100.0% | 100.0% |
| 23 | WFB | 7/14/2021 | 6/21/2021 | AD6 Creative Office Complex(17) | Office | N | 100.0% | 99.9% | NAV | NAV |
| 24 | WFB | 7/13/2021 | 6/9/2021 | Ridgeview Plaza - MD(18) | Retail | N | NAV | NAV | NAV | NAV |
| 25 | MSMCH | 7/6/2021 | 7/9/2021 | 235 245 Main Street | Office | Y(19) | 92.7% | 92.5% | 96.9% | 97.3% |
| 26 | BANA | 7/8/2021 | 7/13/2021 | 3562 Eastham Drive | Office | Y(20) | 100.0% | 100.0% | 100.0% | 100.0% |
| 27 | MSMCH | 7/8/2021 | 6/24/2021 | Prestige Park Portfolio | Industrial | Y(21) | 98.6% | 98.5% | 98.6% | 98.5% |
| 28 | MSMCH | 7/13/2021 | 6/10/2021 | Butler Crossing | Retail | Y(22) | 100.0% | 100.0% | 100.0% | 100.0% |
| 29 | BANA | 7/8/2021 | 7/13/2021 | 605 Place Student Housing | Multifamily | N | 99.5% | 99.4% | 99.3% | 98.9% |
| 30 | WFB | 6/25/2021 | 6/21/2021 | 211 South Gulph | Office | N | 100.0% | 100.0% | 100.0% | 100.0% |
| 31 | WFB | 7/1/2021 | 6/10/2021 | Verano Courtyard Apartments | Multifamily | N | 100.0% | 100.0% | 100.0% | 100.0% |
| 32 | BANA | 7/8/2021 | 7/1/2021 | Laurel Canyon Self Storage – San Fernando, CA | Self Storage | N | 100.0% | 100.0% | 97.4% | 98.3% |
| 33 | WFB | 6/18/2021 | 6/17/2021 | Citizens Bank - VA | Office | N | 100.0% | 100.0% | 100.0% | 100.0% |
| 34 | BANA | 7/13/2021 | 6/18/2021 | StorQuest Express Self Storage Portfolio | Self Storage | N | 98.7% | 99.9% | 94.8% | 99.6% |
| 35 | WFB | 7/11/2021 | 6/4/2021 | AC Self Storage - Sonoma | Self Storage | N | NAV | 98.8% | NAV | 100.0% |
| 36 | MSMCH | 6/22/2021 | 6/15/2021 | JCI Industrial | Industrial | N | 100.0% | 100.0% | 100.0% | 100.0% |
| 37 | MSMCH | 7/13/2021 | 7/14/2021 | Extra Space Fall River Self Storage | Self Storage | N | 98.6% | 98.6% | 98.6% | 98.6% |
| 38 | WFB | 7/7/2021 | 6/9/2021 | Element at Kierland | Office | N | 100.0% | 100.0% | 100.0% | 100.0% |
| This is not a research report and was not prepared by any Underwriter’s research departments. Please see additional important information and qualifications at the end of this Term Sheet. |
24
| BANK 2021-BNK35 | Characteristics of the Mortgage Loans |
COVID-19 Update Continued(1)
Loan No. | Mortgage Loan Seller | Info. as of Date | Origination Date | Property Name | Property Type | Lease Modification or Rent Relief Requested (Y/N) | Tenants Making Full May Rent Payment (% NRA)(2) | Tenants Making Full May Rent Payment (% of UW rent)(2) | Tenants Making Full June Rent Payment (% NRA)(2) | Tenants Making Full June Rent Payment (% of UW rent)(2) |
| 39 | NCB | 6/30/2021 | 6/30/2021 | Hudson View Owners Corporation | Multifamily | N | 97.2%(23) | N/A(24) | 92.8%(23) | N/A(24) |
| 40 | BANA | 7/1/2021 | 6/10/2021 | Sun City MHC | Manufactured Housing | N | 100.0% | 100.0% | 100.0% | 100.0% |
| 41 | BANA | 7/8/2021 | 7/1/2021 | Coldwater Self Storage – North Hollywood, CA | Self Storage | N | 99.9% | 99.1% | 98.3% | 97.4% |
| 42 | BANA | 7/8/2021 | 7/1/2021 | Guardian Self Storage - Pittsburgh, PA | Self Storage | N | 99.7% | 99.0% | 98.6% | 99.0% |
| 43 | NCB | 6/30/2021 | 6/18/2021 | The Woodlands Apt. Corp. | Multifamily | N | 96.4%(23) | N/A(24) | 88.3%(23) | N/A(24) |
| 44 | BANA | 7/1/2021 | 7/1/2021 | Hi-Park Campus | Industrial | N | 100.0% | 100.0% | 100.0% | 100.0% |
| 45 | WFB | 7/13/2021 | 6/28/2021 | Storage Sense - Easton | Self Storage | N | 98.3% | 96.4% | 97.9% | 95.9% |
| 46 | BANA | 7/8/2021 | 7/1/2021 | Guardian Self Storage - West Mifflin, PA | Self Storage | N | 99.6% | 97.3% | 98.7% | 99.3% |
| 47 | NCB | 6/30/2021 | 6/18/2021 | 301 East Tenants Corp. | Multifamily | N | 99.2%(23) | N/A(24) | 93.8%(23) | N/A(24) |
| 48 | MSMCH | 7/6/2021 | 6/17/2021 | Beachwood Office Park | Office | N | 98.0% | 98.0% | 100.0% | 98.0% |
| 49 | MSMCH | 7/13/2021 | 6/23/2021 | 10080 Alta Drive | Office | N | 100.0% | 100.0% | 100.0% | 100.0% |
| 50 | NCB | 6/30/2021 | 6/30/2021 | Dak Equities Corp. | Multifamily | N | 97.8%(23) | N/A(24) | 95.6%(23) | N/A(24) |
| 51 | NCB | 6/30/2021 | 6/30/2021 | 40 Stoner Avenue Corp. | Multifamily | N | 100.0%(23) | N/A(24) | 97.4%(23) | N/A(24) |
| 52 | NCB | 6/30/2021 | 5/28/2021 | 144-80 Sanford Apartment Corp. | Multifamily | N | 97.9%(23) | N/A(24) | 96.8%(23) | N/A(24) |
| 53 | NCB | 6/30/2021 | 5/13/2021 | Herald Square Loft Corp. | Multifamily | N | 90.9%(23) | N/A(24) | 90.9%(23) | N/A(24) |
| 54 | NCB | 6/30/2021 | 6/28/2021 | 67-87 & 68-09 Booth Owners Corp. | Multifamily | N | 100.0%(23) | N/A(24) | 99.1%(23) | N/A(24) |
| 55 | NCB | 6/30/2021 | 6/18/2021 | 3065 Sedgwick Owners Corporation | Multifamily | N | 97.3%(23) | N/A(24) | 91.8%(23) | N/A(24) |
| 56 | WFB | 7/13/2021 | 7/7/2021 | All City Self Storage | Self Storage | N | 98.6% | 95.5% | 97.9% | 94.8% |
| 57 | MSMCH | 6/24/2021 | 7/14/2021 | 139 Emerson | Multifamily | Y(25) | 98.0% | 98.0% | N/A | N/A |
| 58 | BANA | 7/20/2021 | 6/8/2021 | Springfield Storage Depot Self Storage – Springfield, OH | Self Storage | N | 98.6% | 94.8% | 95.8% | 96.1% |
| 59 | BANA | 7/17/2021 | 6/29/2021 | Ponderosa MHC | Manufactured Housing | N | 100.0% | 100.0% | 100.0% | 100.0% |
| 60 | NCB | 6/30/2021 | 6/30/2021 | 40 Prospect Park West Owners Corp. | Multifamily | N | 88.1%(23) | N/A(24) | 84.7%(23) | N/A(24) |
| 61 | NCB | 6/30/2021 | 5/27/2021 | North And South Lewis Place Owners Corp. | Multifamily | N | 100.0%(23) | N/A(24) | 91.8%(23) | N/A(24) |
| 62 | NCB | 6/30/22021 | 6/30/2021 | 50-22 Owners Ltd. | Multifamily | N | 79.2%(23) | N/A(24) | 75.0%(23) | N/A(24) |
| 63 | NCB | 6/30/2021 | 7/12/2021 | Shady Glen Owners’ Corp. | Multifamily | N | 98.8%(23) | N/A(24) | 95.3%(23) | N/A(24) |
| 64 | NCB | 6/30/2021 | 6/2/2021 | Washington Place Apartment Corporation | Multifamily | N | 100.0%(23) | N/A(24) | 100.0%(23) | N/A(24) |
| 65 | NCB | 6/30/2021 | 6/29/2021 | 256 West 21st Owners Corp. | Multifamily | N | 91.2%(23) | N/A(24) | 85.3%(23) | N/A(24) |
| 66 | NCB | 6/30/2021 | 6/14/2021 | 311-313 West 82nd St. Owners Corp., successor by merger to 82 West River Realty Corp. | Multifamily | N | 100.0%(23) | N/A(24) | 100.0%(23) | N/A(24) |
| 67 | NCB | 6/30/2021 | 6/29/2021 | West 239th Owners, Inc. | Multifamily | N | 100.0%(23) | N/A(24) | 100.0%(23) | N/A(24) |
| 68 | NCB | 6/30/2021 | 6/25/2021 | Saunders Street Owners Ltd. | Multifamily | N | 91.6%(23) | N/A(24) | 88.8%(23) | N/A(24) |
| 69 | NCB | 6/30/2021 | 6/9/2021 | Island Gardens Owners, Corp. | Multifamily | N | 97.2%(23) | N/A(24) | 97.2%(23) | N/A(24) |
| 70 | NCB | 6/30/2021 | 5/26/2021 | Ruggles House, Inc. | Multifamily | N | 100.0%(23) | N/A(24) | 81.8%(23) | N/A(24) |
| 71 | NCB | 6/30/2021 | 6/29/2021 | Palmer Avenue Owners, Inc. | Multifamily | N | 97.5%(23) | N/A(24) | 87.5%(23) | N/A(24) |
| 72 | NCB | 6/30/2021 | 6/16/2021 | Belmont Owners Corp. | Multifamily | N | 98.3%(23) | N/A(24) | 98.3%(23) | N/A(24) |
| 73 | NCB | 6/30/2021 | 6/15/2021 | 1580 East 18th Street Owners Corp. | Multifamily | N | 95.7%(23) | N/A(24) | 95.7%(23) | N/A(24) |
| 74 | NCB | 6/30/2021 | 6/17/2021 | 916 Union Street Apartments Inc. | Multifamily | N | 91.7%(23) | N/A(24) | 83.3%(23) | N/A(24) |
| 75 | NCB | 6/30/2021 | 6/25/2021 | Crescents by the Shore Corp. | Multifamily | N | 94.4%(23) | N/A(24) | 77.8%(23) | N/A(24) |
| 76 | NCB | 7/8/2021 | 5/28/2021 | East 94th Street Housing Corporation | Multifamily | N | 93.3%(23) | N/A(24) | 93.3%(23) | N/A(24) |
Footnotes are set forth on the following page.
| This is not a research report and was not prepared by any Underwriter’s research departments. Please see additional important information and qualifications at the end of this Term Sheet. |
25
| BANK 2021-BNK35 | Characteristics of the Mortgage Loans |
| (1) | All loans are current on their debt service payments or have a first payment date on June, July, August or September 2021. For all NCB mortgage loans, payment is subject to a 10-day grace period and therefore may not be received until the 10th day of each month. |
| (2) | Tenants Making Full May Rent Payment (% NRA/Units), Tenants Making Full June Rent Payment (% NRA/Units), Tenants Making Full May Rent Payment (% of UW rent) and Tenants Making Full June Rent Payment (% of UW rent) for multifamily, self storage and mixed use properties are based on the percentage of total billed rent collected. |
| (3) | With respect to The Domain mortgaged property, 99.0% of the expected rents in May and June were received. Rents for open and billed tenants, which may or may not include percent in lieu rent tenants, were adjusted for active amendments, bankruptcies, write-offs and tenant credits. |
| (4) | With respect to the River House Coop mortgaged property, three of the cooperative tenant-shareholders had issues with their maintenance payments. According to the borrower, one unit owner has fully repaid its missed payments and is back to paying full maintenance charges, one tenant-shareholder is in the process of sending in its missed payment and one tenant-shareholder is in communication with the board regarding selling its unit. In addition, the sole commercial tenant, The River Club of New York, Inc., has been in rent forbearance since early 2020, and has been underwritten as vacant. |
| (5) | With respect to the Camp Hill Shopping Center mortgage loan, nine tenants, representing approximately 59.3% NRA and 40.9% of UW base rent were granted rent relief, including up to ten months of fully or partially abated rent and up to ten months of deferred rent, with deferred rent required to be repaid on various terms. Three tenants representing approximately 43.8% of NRA and 22.5% of UW base rent has outstanding deferred rents with all rent expected to be repaid by February 2022. |
| (6) | With respect to The Lodges Phase I and II mortgage loan, there are currently 25 units with rents in arrears totaling approximately $31,000. The borrower sponsor plans to work on payment plans with the tenants to bring rents current. The borrower sponsor’s typical process is to work with the tenants for up to two months of being past due on a payment before taking any legal action, subject to any applicable eviction moratoriums. |
| (7) | With respect to The Landing at Woodyard mortgaged property, six tenants (25.8% of NRA and 21.4% of underwritten rent) received rent relief or deferred rent in 2020. All tenants who received rent relief have resumed paying full rent and those tenants which elected to defer rent have been repaying the deferred rent as agreed, with the exception of Clinton Park Cleaners and Allure Nail Salon (collectively, 1.2% of NRA and 2.7% of underwritten rent) which continue to pay reduced rent. |
| (8) | With respect to the Overseas Market mortgaged property, ten tenants (14.8% of NRA and 25.2% of underwritten rent) received rent relief for the months of April, May, and June 2020. Four of the ten tenants (9.1% of NRA and 14.9% of underwritten rent) are currently repaying the deferred rent in equal installments over a nine-month period from January 2021 through September 2021. Five of the ten tenants (4.0% of NRA and 7.8% of underwritten rent) repaid their full deferred rent upfront in January 2021. In exchange for the full upfront payment, the landlord is abating 50% of the upfront payment from the tenant’s monthly rent over a nine-month period from January 2021 through September 2021. The remaining tenant (1.7% of NRA and 2.5% of underwritten rent) repaid 50% of its deferred rent upfront in January 2021. The landlord is abating 25% of the upfront payment from the tenant’s rent in equal installments over a nine-month period from January 2021 through September 2021. |
| (9) | With respect to the Rosemead Place mortgage loan, 14 tenants representing approximately 21.7% of NRA and 30.5% of UW base rent received rent relief. Repayment terms are still being negotiated with LA Fitness and TGI Fridays. |
| (10) | Given the timing of collection and reporting, an accurate estimate of the percentage of tenants paying rent is not available. |
| (11) | With respect to the Carleton Portfolio mortgage loan, given the acquisition, the borrower sponsor does not have rent payment information available. |
| (12) | With respect to the Carleton Portfolio mortgage loan, six tenants representing 14.0% of NRA and 9.3% of UW base rent received rent relief. |
| (13) | With respect to the U.S. Steel Tower mortgaged property, three tenants (0.8% of NRA and 6.4% of underwritten rent) were granted rent relief. Two of the three tenants have repaid their deferred rent in full and are current on their rent payments. One of the tenants received a 6 month rent deferral and a 3 month rent abatement in exchange for an additional five years on its lease term. |
| (14) | With respect to the Denver West Village Shopping Center mortgaged property, 99.0% of the expected rents in May and June were received (excluding the largest tenant, United Artists Theatre (16.6% NRA and 16.9% UW rent)). United Artists Theatre was underwritten as vacant. Rents for open and billed tenants, which may or may not include percent in lieu rent tenants, were adjusted for active amendments, bankruptcies, write-offs and tenant credits. |
| (15) | With respect to the Newport Pavilion mortgaged property, ten tenants (37.1% of the NRA and 43.4% of underwritten rent) were given some form of rent relief either in the form of deferred rent or abated rent. Six tenants (14.4% of the SF and 19.4% of underwritten rent) were given rent relief in the form of deferred rent ranging between two and three months and four tenants (22.7% of the SF and 24.0% of underwritten rent) were given rent relief in the form of an abatement. Approximately 48.2% of the deferred rent has already been repaid. |
| (16) | With respect to the Goodfarb Industrial Portfolio mortgaged properties, four tenants (15.6% of the NRA and 16.0% of underwritten rent) received deferent rent. Three of the four tenants (8.1% of the NRA and 7.3% of underwritten rent) have satisfied their repayment and the last tenant (7.5% of the NRA and 8.8% of underwritten rent) is current on its repayment plan. |
| (17) | With respect to the AD6 Creative Office Complex mortgage loan, given that the mortgaged property was newly acquired, the borrower sponsor does not have rent payment information available for June 2021. |
| (18) | With respect to the Ridgeview Plaza - MD mortgage loan, given that the mortgaged property is newly acquired, the borrower sponsor does not have rent payment information available. |
| (19) | With respect to the 235 245 Main Street mortgaged property, three tenants (4.6% of NRA and 6.8% of underwritten rent) received a few months of rent relief between 2020 and 2021. There are no formal repayment agreements in place. Two tenants (2.0% of NRA and 2.8% of underwritten rent) have returned to paying full rent. |
| (20) | With respect to the 3562 Eastham Drive mortgaged property, the second largest tenant, Ritual (21.1% NRA and 21.6% UW Rent) received 50% rent deferral in June and September 2020 ($60,456). The tenant is required to repay the deferral in $10,000 monthly installments from July through December 2021. |
| (21) | With respect to the Prestige Park Portfolio mortgaged property, Ger Oil Company (7.2% of NRA and 6.4% of underwritten rent) received a one-time COVID related rent credit for 2019 and 2020 operating expense reconciliations ($7,398.49 and $9,600.10, respectively). Savol Pools (2.4% of NRA and 2.7% of underwritten rent) was provided a 2020 rent credit of approximately $10,418. Two tenants (2.8% of NRA and 3.6% of underwritten rent) received rent deferrals, but these were caught up and paid in full in 2020. |
| (22) | With respect to the Butler Crossing mortgaged property, seven tenants (38.5% of NRA and 41.4% of underwritten rent) received some form of rent relief in 2020, including deferrals and abatements. With respect to the deferred rents, all applicable tenants are on repayment plans spanning between six and nine months between 2020 and 2021. |
| This is not a research report and was not prepared by any Underwriter’s research departments. Please see additional important information and qualifications at the end of this Term Sheet. |
26
| BANK 2021-BNK35 | Characteristics of the Mortgage Loans |
| (23) | For residential cooperative properties, the percentages reported were determined based on available cooperative maintenance receivables reports provided from the borrowers (although the borrowers were not required, pursuant to the loan documents, to furnish those reports). Generally, this information is not tracked for residential cooperative properties and the borrowers are not required, pursuant to the loan documents, to report this data on a monthly basis. In addition, for residential cooperative properties, the figures reported were determined based on revenue derived from maintenance charges payable by tenant-shareholders, and not based on rental income for commercial units as to which cooperative shares have not been allocated. Further, with respect to certain residential cooperative properties, the related cooperative borrower may have entered into a primary master lease with a third-party or the cooperative’s sponsor. Generally, however, information regarding subleases under such primary master leases are not tracked for residential cooperative properties. |
| (24) | This information is not presented for residential cooperative properties. The base rent represented in the underwritten cash flow for residential cooperative properties is the hypothetical income derived from the appraisal. Residential cooperative properties are structured to allow for an increase in unit owner maintenance charges or the assessment of additional charges to cover operating deficits, including deficits resulting from unpaid or delinquent rents or maintenance charges. |
| (25) | With respect to the 139 Emerson mortgaged property, two units have arrearages spanning between nine and ten months and have requested rent relief. They are awaiting relief funds to cover the rents. |
| This is not a research report and was not prepared by any Underwriter’s research departments. Please see additional important information and qualifications at the end of this Term Sheet. |
27
| BANK 2021-BNK35 | Characteristics of the Mortgage Loans |
| Top 10 Mortgage Loans or Groups of Cross-Collateralized Mortgage Loans(1) | |||||||||||||
| Loan No. | Mortgage Loan Seller | Property Name | City | State | Property Type | Cut-off Date Balance | % of Pool | SF/Units | Cut-off Date Balance per SF/Unit | UW NCF DSCR | UW NOI Debt Yield | Cut-off Date LTV | Maturity Date LTV |
| 1 | BANA | 30 Dunnigan | Suffern | NY | Industrial | $109,823,396 | 7.9% | 893,127 | $122.97 | 1.78x | 9.5% | 52.3% | 40.3% |
| 2 | BANA | The Domain | Austin | TX | Retail | $76,000,000 | 5.4% | 886,526 | $236.88 | 4.17x | 13.8% | 46.5% | 46.5% |
| 3 | BANA | Four Constitution Square | Washington | DC | Office | $55,000,000 | 3.9% | 493,620 | $279.57 | 4.54x | 11.8% | 45.2% | 45.2% |
| 4 | MSMCH | River House Coop | New York | NY | Multifamily | $54,898,724 | 3.9% | 75 | $731,982.98 | 3.56x | 16.7% | 10.6% | 7.9% |
| 5 | WFB | 375 Pearl Street | New York | NY | Office | $54,000,000 | 3.9% | 573,083 | $383.89 | 2.67x | 9.2% | 60.3% | 60.3% |
| 6 | WFB | Camp Hill Shopping Center | Camp Hill | PA | Retail | $49,315,000 | 3.5% | 430,198 | $114.63 | 3.77x | 11.6% | 54.3% | 54.3% |
| 7 | BANA | Rochester Multifamily Portfolio | Various | NY | Multifamily | $46,000,000 | 3.3% | 376 | $122,340.43 | 1.50x | 8.3% | 71.0% | 64.0% |
| 8 | MSMCH | The Lodges Phase I and II | Yakima | WA | Multifamily | $44,850,000 | 3.2% | 426 | $105,281.69 | 2.32x | 8.1% | 65.5% | 65.5% |
| 9 | MSMCH | The Landing at Woodyard | Clinton | MD | Retail | $44,500,000 | 3.2% | 209,505 | $212.41 | 2.21x | 8.8% | 65.5% | 65.5% |
| 10 | MSMCH | Mi Place at Vineyard | Lewes | DE | Multifamily | $44,000,000 | 3.2% | 288 | $152,777.78 | 1.96x | 8.9% | 68.6% | 68.6% |
| Total/Wtd. Avg. | $578,387,119 | 41.5% | 2.84x | 10.8% | 52.6% | 49.5% | |||||||
| (1) | With respect to any mortgage loan that is part of a whole loan, unless otherwise indicated, all LTV, DSCR, Debt Yield and Balance per SF/Unit calculations in this Term Sheet include any related pari passu companion loans and exclude any subordinate companion loans, as applicable. Additionally, LTV, DSCR, Debt Yield and Balance per SF/Unit figures in this Term Sheet are calculated for mortgage loans without regard to any additional indebtedness that may be incurred at a future date. |
| This is not a research report and was not prepared by any Underwriter’s research departments. Please see additional important information and qualifications at the end of this Term Sheet. |
28
| BANK 2021-BNK35 | Characteristics of the Mortgage Loans |
| Mortgage Loans with Pari Passu Companion Loans | ||||||||||||
| Loan No. | Mortgage Loan Seller | Property Name | Mortgage Loan Cut-off Date Balance | Aggregate Pari Passu Companion Loan Cut-off Date Balance | Combined Cut-off Date Balance | Lead Servicing Agreement | Master Servicer | Special Servicer | Control Rights | Combined UW NCF DSCR(1) | Combined UW NOI Debt Yield(1) | Combined Cut-off Date LTV(1) |
| 2 | BANA | The Domain | $76,000,000 | $134,000,000 | $210,000,000 | BANK 2021-BNK35 | Wells Fargo | KeyBank | BANK 2021-BNK35 | 4.17x | 13.8% | 46.5% |
| 3 | BANA | Four Constitution Square | $55,000,000 | $83,000,000 | $138,000,000 | BANK 2021-BNK34 | Wells Fargo | Greystone | BANK 2021-BNK34 | 4.54x | 11.8% | 45.2% |
| 5 | WFB | 375 Pearl Street | $54,000,000 | $166,000,000 | $220,000,000 | BANK 2021-BNK34 | Wells Fargo | Greystone | BANK 2021-BNK34 | 2.67x | 9.2% | 60.3% |
| 12 | BANA | Three Constitution Square | $38,000,000 | $58,000,000 | $96,000,000 | BANK 2021-BNK34 | Wells Fargo | Greystone | BANK 2021-BNK34 | 4.94x | 13.0% | 43.2% |
| 17 | MSMCH | U.S. Steel Tower | $30,000,000 | $130,000,000 | $160,000,000 | BANK 2021-BNK34 | Wells Fargo | Greystone | (2) | 2.85x | 11.5% | 41.9% |
| 20 | MSMCH | Newport Pavilion | $30,000,000 | $21,590,000 | $51,590,000 | BANK 2021-BNK35 | Wells Fargo | KeyBank | BANK 2021-BNK35 | 3.16x | 10.5% | 69.8% |
| 22 | MSMCH | Fortune 7 Leased Campus | $28,000,000 | $50,000,000 | $78,000,000 | BANK 2021-BNK34 | Wells Fargo | Greystone | BANK 2021-BNK34 | 3.32x | 10.4% | 62.9% |
| (1) | DSCR, Debt Yield and LTV calculations include any related pari passu companion loans and exclude any subordinate companion loans, as applicable. |
| (2) | The initial directing holder are the holders of the related promissory notes B-1 through B-6, collectively, until the occurrence of a control appraisal event under the related intercreditor agreement, at which time the directing holder will be the directing certificateholder (or other designated party) under the related lead servicing agreement. See “Description of the Mortgage Pool—The Whole Loans—The U.S. Steel Tower Pari Passu-A/B Whole Loan” in the Preliminary Prospectus. |
| Mortgage Loans with Subordinate Debt(1) | |||||||||||
| Loan No. | Mortgage Loan Seller | Property Name | Mortgage Loan Cut-off Date Balance | Cut-off Date Balance per SF | Subordinate Debt Cut-off Date Balance | UW NCF DSCR | UW NOI Debt Yield | Cut-off Date LTV | Whole Loan UW NCF DSCR(2) | Whole Loan UW NOI Debt Yield(2) | Whole Loan Cut-off Date LTV(2) |
| 17 | MSMCH | U.S. Steel Tower | $30,000,000 | $68.49 | $40,000,000 | 2.85x | 11.5% | 41.9% | 1.98x | 9.2% | 52.4% |
| (1) | In addition, twenty (20) of the mortgage loans, each of which is secured by a residential cooperative property, currently have in place either (i) Subordinate Coop LOCs that permit future advances or (ii) a Subordinate Wrap Mortgage. See “Description of the Mortgage Pool—Additional Indebtedness—Other Secured Indebtedness” and “Description of the Mortgage Pool—Additional Debt Financing for Mortgage Loans Secured by Residential Cooperatives” in the Preliminary Prospectus. |
| (2) | Whole Loan UW NCF DSCR, Whole Loan UW NOI Debt Yield and Whole Loan Cut-off Date LTV figures shown above are calculated based on any related pari passu notes and any related subordinate note(s). |
| Mortgage Loans with Mezzanine Debt | |||||||||||
| Loan No. | Mortgage Loan Seller | Property Name | Mortgage Loan Cut-off Date Balance | Cut-off Date Balance per Unit/SF | Mezzanine Debt Cut-off Date Balance | UW NCF DSCR | UW NOI Debt Yield | Cut-off Date LTV | Total Debt UW NCF DSCR(1) | Total Debt UW NOI Debt Yield(1) | Total Debt Cut-off Date LTV(1) |
| 5 | WFB | 375 Pearl Street | $54,000,000 | $383.89 | $30,000,000 | 2.67x | 9.2% | 60.3% | 2.08x | 8.1% | 68.5% |
| 10 | MSMCH | Mi Place at Vineyard | $44,000,000 | $152,777.78 | $5,000,000 | 1.96x | 8.9% | 68.6% | 1.58x | 8.0% | 76.4% |
| 17 | MSMCH | U.S. Steel Tower | $30,000,000 | $68.49 | $45,000,000 | 2.85x | 11.5% | 41.9% | 1.27x | 7.5% | 64.2% |
| (1) | Total Debt UW NCF DSCR, Total Debt UW NOI Debt Yield and Total Debt Cut-off Date LTV figures shown above are calculated based on any related pari passu notes, any related subordinate note(s) and the mezzanine debt. |
| This is not a research report and was not prepared by any Underwriter’s research departments. Please see additional important information and qualifications at the end of this Term Sheet. |
29
| BANK 2021-BNK35 | Characteristics of the Mortgage Loans |
Mortgage Loans with Scheduled Balloon Payments and Related Classes(1)
| Class A-2 ($90,700,000) | ||||||||||||||||
| Loan No. | Mortgage Loan Seller | Property Name | State | Property Type | Cut-off Date Balance | % of Pool | Maturity Date Balance | % of Class A-2 Certificate Principal Balance | SF | Cut-off Date Balance per SF | UW NCF DSCR | UW NOI Debt Yield | Cut-off Date LTV | Maturity Date LTV | Rem. IO Period (mos.) | Rem. Term to Maturity (mos.) |
| 15 | WFB | Rosemead Place | CA | Retail | $35,000,000 | 2.5% | $35,000,000 | 38.6% | 332,474 | $105.27 | 3.09x | 10.9% | 40.1% | 40.1% | 59 | 59 |
| 17 | MSMCH | U.S. Steel Tower | PA | Office | $30,000,000 | 2.2% | $30,000,000 | 33.1% | 2,336,270 | $68.49 | 2.85x | 11.5% | 41.9% | 41.9% | 58 | 58 |
| 20 | MSMCH | Newport Pavilion | KY | Retail | $30,000,000 | 2.2% | $30,000,000 | 33.1% | 332,311 | $155.25 | 3.16x | 10.5% | 69.8% | 69.8% | 59 | 59 |
| Total/Wtd. Avg. | $95,000,000 | 6.8% | $95,000,000 | 104.7% | 3.04x | 11.0% | 50.0% | 50.0% | 59 | 59 | ||||||
| (1) | The table above reflects the mortgage loans whose balloon payments will be applied to pay down the Class A-2 certificates, assuming (i) that none of the mortgage loans experience prepayments, defaults or losses; (ii) there are no extensions of maturity dates; and (iii) each mortgage loan is paid in full on its stated maturity date or, in the case of any mortgage loan with an anticipated repayment date, on such anticipated repayment date. The table above is otherwise based on the Structuring Assumptions set forth under “Yield and Maturity Considerations—Weighted Average Life” in the Preliminary Prospectus. |
Mortgage Loans with Scheduled Balloon Payments and Related Classes(1)
| Class A-3 ($32,600,000) | ||||||||||||||||
| Loan No. | Mortgage Loan Seller | Property Name | State | Property Type | Cut-off Date Balance | % of Pool | Maturity Date Balance | % of Class A-3 Certificate Principal Balance | SF | Cut-off Date Balance per SF | UW NCF DSCR | UW NOI Debt Yield | Cut-off Date LTV | Maturity Date LTV | Rem. IO Period (mos.) | Rem. Term to Maturity (mos.) |
| 23 | WFB | AD6 Creative Office Complex | CA | Office | $25,740,000 | 1.8% | $24,713,787 | 75.8% | 188,521 | $136.54 | 2.12x | 11.9% | 59.9% | 57.5% | 59 | 83 |
| 38 | WFB | Element at Kierland | AZ | Office | $9,715,000 | 0.7% | $9,715,000 | 29.8% | 57,929 | $167.71 | 4.21x | 12.9% | 54.6% | 54.6% | 82 | 82 |
| Total/Wtd. Avg. | $35,455,000 | 2.5% | $34,428,787 | 105.6% | 2.69x | 12.2% | 58.4% | 56.7% | 65 | 83 | ||||||
| (1) | The table above reflects the mortgage loans whose balloon payments will be applied to pay down the Class A-3 certificates, assuming (i) that none of the mortgage loans experience prepayments, defaults or losses; (ii) there are no extensions of maturity dates; and (iii) each mortgage loan is paid in full on its stated maturity date or, in the case of any mortgage loan with an anticipated repayment date, on such anticipated repayment date. The table above is otherwise based on the Structuring Assumptions set forth under “Yield and Maturity Considerations—Weighted Average Life” in the Preliminary Prospectus. |
| This is not a research report and was not prepared by any Underwriter’s research departments. Please see additional important information and qualifications at the end of this Term Sheet. |
30
| BANK 2021-BNK35 | Characteristics of the Mortgage Loans |
| Prior Securitization History(1) | ||||||||||||||
| Loan No. | Mortgage Loan Seller | Property Name | City | State | Property Type | Cut-off Date Balance | % of Pool | SF/Units | Cut-off Date Balance per SF/Unit | UW NCF DSCR(2) | UW NOI Debt Yield(2)(3) | Cut-off Date LTV(2) | Maturity Date LTV(2) | Prior Securitization |
| 1 | BANA | 30 Dunnigan | Suffern | NY | Industrial | $109,823,396 | 7.9% | 893,127 | $122.97 | 1.78x | 9.5% | 52.3% | 40.3% | COMM 2014-UBS5 |
| 2 | BANA | The Domain | Austin | TX | Retail | $76,000,000 | 5.4% | 886,526 | $236.88 | 4.17x | 13.8% | 46.5% | 46.5% | WFRBS 2011-C5 |
| 17 | MSMCH | U.S. Steel Tower | Pittsburgh | PA | Office | $30,000,000 | 2.2% | 2,336,270 | $68.49 | 2.85x | 11.5% | 41.9% | 41.9% | DBUBS 2011-LC2 |
| 18 | BANA | Denver West Village Shopping Center | Lakewood | CO | Retail | $30,000,000 | 2.2% | 311,518 | $96.30 | 4.33x | 13.5% | 53.4% | 53.4% | JPMCC 2011-C5 |
| 21 | WFB | The Crossing At Lake Mead | Las Vegas | NV | Multifamily | $28,900,000 | 2.1% | 444 | $65,090.09 | 2.43x | 8.0% | 55.3% | 55.3% | FREMF 2017-KF39 |
| 31 | WFB | Verano Courtyard Apartments | Santa Barbara | CA | Multifamily | $13,850,000 | 1.0% | 70 | $197,857.14 | 2.23x | 7.8% | 63.0% | 63.0% | FNA 2013-M11 |
| 32 | BANA | Laurel Canyon Self Storage – San Fernando, CA | San Fernando | CA | Self Storage | $13,150,000 | 0.9% | 113,021 | $116.35 | 2.52x | 9.2% | 58.4% | 58.4% | MSBAM 2013-C12 |
| 41 | BANA | Coldwater Self Storage – North Hollywood, CA | North Hollywood | CA | Self Storage | $8,750,000 | 0.6% | 62,675 | $139.61 | 2.51x | 9.2% | 56.1% | 56.1% | MSBAM 2013-C12 |
| 42 | BANA | Guardian Self Storage - Pittsburgh, PA | Pittsburgh | PA | Self Storage | $8,255,000 | 0.6% | 87,640 | $94.19 | 2.99x | 9.7% | 62.3% | 62.3% | JPMCC 2012-C8 |
| 46 | BANA | Guardian Self Storage - West Mifflin, PA | West Mifflin | PA | Self Storage | $7,150,000 | 0.5% | 87,198 | $82.00 | 3.05x | 9.9% | 56.8% | 56.8% | JPMCC 2012-C8 |
| 50 | NCB | Dak Equities Corp. | New York | NY | Multifamily | $5,000,000 | 0.4% | 45 | $111,111.11 | 12.49x | 38.8% | 6.3% | 6.3% | WFRBS 2014-C23 |
| 60 | NCB | 40 Prospect Park West Owners Corp. | Brooklyn | NY | Multifamily | $2,995,293 | 0.2% | 59 | $50,767.67 | 7.57x | 39.9% | 5.6% | 4.3% | WFCM 2015-C29 |
| 61 | NCB | North And South Lewis Place Owners Corp. | Rockville Centre | NY | Multifamily | $2,741,261 | 0.2% | 73 | $37,551.51 | 5.83x | 31.2% | 13.4% | 10.4% | WFRBS 2013-C18 |
| 62 | NCB | 50-22 Owners Ltd. | Sunnyside | NY | Multifamily | $2,396,219 | 0.2% | 48 | $49,921.23 | 4.24x | 22.3% | 16.6% | 12.9% | WFCM 2015-C29 |
| 65 | NCB | 256 West 21st Owners Corp. | New York | NY | Multifamily | $1,900,000 | 0.1% | 34 | $55,882.35 | 7.42x | 25.0% | 7.9% | 7.9% | WFRBS 2014-C23 |
| 67 | NCB | West 239th Owners, Inc. | Bronx | NY | Multifamily | $1,697,428 | 0.1% | 42 | $40,414.94 | 6.07x | 32.9% | 13.0% | 10.1% | WFRBS 2013-C12 |
| Total | $342,608,596 | 24.6% | ||||||||||||
| (1) | Includes mortgage loans for which all or a portion of the previously existing debt was most recently securitized in conduit securitizations, based on information provided by the related borrower or obtained through searches of a third-party database. The information has not otherwise been confirmed by the mortgage loan sellers. With respect to any mortgage loan that is part of a whole loan, unless otherwise indicated, all LTV, DSCR, Debt Yield and Cut-off Date Balance per SF/Unit calculations include any related pari passu companion loans and exclude any related subordinate companion loans, as applicable. |
| (2) | For mortgaged properties securing residential cooperative mortgage loans, the UW NCF DSCR and UW NOI Debt Yield for each such mortgaged property is calculated using underwritten net operating income or underwritten net cash flow, as applicable, for the related residential cooperative property which is the projected net operating income or net cash flow, as applicable, reflected in the most recent appraisal obtained by or otherwise in the possession of the related mortgage loan seller as of the Cut-off Date. LTV calculations are based upon the appraised value of the residential cooperative property determined as if such residential cooperative property is operated as a residential cooperative, inclusive of the amount of the underlying debt encumbering such residential cooperative property. |
| This is not a research report and was not prepared by any Underwriter’s research department. Please see additional important information and qualifications at the end of this Term Sheet. |
31
| BANK 2021-BNK35 | Characteristics of the Mortgage Loans |
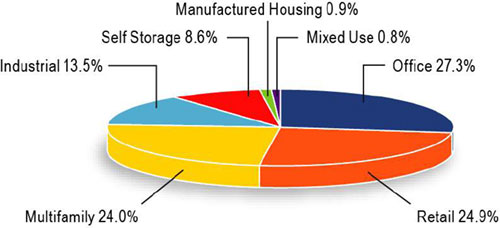
| Property Type Distribution(1) | ||||||||
| Property Type | Number of Mortgaged Properties | Aggregate Cut-off Date Balance | % of Pool | Wtd. Avg. Mortgage Rate | Wtd. Avg. UW NCF DSCR | Wtd. Avg. UW NOI Debt Yield | Wtd. Avg. Cut-off Date LTV | Wtd. Avg. Maturity Date LTV |
| Office | 17 | $380,894,436 | 27.3% | 3.0372% | 3.52x | 11.3% | 52.4% | 52.1% |
| CBD | 6 | $245,000,000 | 17.6% | 2.9692% | 3.72x | 11.2% | 49.5% | 49.5% |
| Suburban | 10 | $129,973,627 | 9.3% | 3.1631% | 3.15x | 11.6% | 57.2% | 56.3% |
| Flex | 1 | $5,920,809 | 0.4% | 3.0870% | 3.39x | 11.2% | 64.5% | 64.5% |
| Retail | 9 | $346,815,000 | 24.9% | 3.1732% | 3.31x | 11.4% | 56.2% | 55.4% |
| Anchored | 9 | $346,815,000 | 24.9% | 3.1732% | 3.31x | 11.4% | 56.2% | 55.4% |
| Multifamily | 39 | $334,300,407 | 24.0% | 3.2945% | 4.06x | 17.2% | 42.5% | 40.7% |
| Garden | 8 | $160,864,408 | 11.5% | 3.6001% | 2.08x | 8.3% | 65.3% | 64.0% |
| Cooperative | 27 | $132,425,407 | 9.5% | 2.8807% | 6.87x | 29.9% | 11.5% | 9.4% |
| Student Housing | 1 | $20,800,000 | 1.5% | 3.4000% | 3.02x | 10.7% | 43.7% | 43.7% |
| Age Restricted | 2 | $16,735,592 | 1.2% | 3.4920% | 1.50x | 8.3% | 71.0% | 64.0% |
| Mid Rise | 1 | $3,475,000 | 0.2% | 3.3300% | 6.65x | 22.8% | 20.7% | 20.7% |
| Industrial | 21 | $188,789,843 | 13.5% | 3.1781% | 2.23x | 10.0% | 56.7% | 49.0% |
| Warehouse Distribution | 1 | $109,823,396 | 7.9% | 3.0850% | 1.78x | 9.5% | 52.3% | 40.3% |
| Flex | 15 | $49,026,638 | 3.5% | 3.5003% | 2.50x | 10.4% | 64.1% | 61.2% |
| Warehouse | 4 | $18,699,809 | 1.3% | 2.9454% | 3.51x | 11.7% | 57.4% | 57.4% |
| Manufacturing | 1 | $11,240,000 | 0.8% | 3.0700% | 3.25x | 10.8% | 66.1% | 66.1% |
| Self Storage | 20 | $119,964,885 | 8.6% | 3.2847% | 2.86x | 9.6% | 57.8% | 57.4% |
| Self Storage | 20 | $119,964,885 | 8.6% | 3.2847% | 2.86x | 9.6% | 57.8% | 57.4% |
| Manufactured Housing | 2 | $12,250,000 | 0.9% | 3.4015% | 3.02x | 10.8% | 44.7% | 42.0% |
| Manufactured Housing | 2 | $12,250,000 | 0.9% | 3.4015% | 3.02x | 10.8% | 44.7% | 42.0% |
| Mixed Use | 1 | $11,841,617 | 0.8% | 3.0870% | 3.39x | 11.2% | 64.5% | 64.5% |
| Office/Warehouse | 1 | $11,841,617 | 0.8% | 3.0870% | 3.39x | 11.2% | 64.5% | 64.5% |
| Total/Wtd. Avg. | 109 | $1,394,856,187 | 100.0% | 3.1767% | 3.36x | 12.4% | 52.0% | 50.2% |
| (1) | All numerical information concerning the mortgage loans is approximate and, in the case of mortgage loans secured by multiple properties, is based on allocated loan amounts with respect to such properties. All weighted average information regarding the mortgage loans reflects the weighting of the mortgage loans based on their outstanding principal balances as of the Cut-off Date or, in the case of mortgage loans secured by multiple properties, allocated loan amounts. The sum of numbers and percentages in columns may not match the “Total” due to rounding. With respect to any mortgage loan that is part of a whole loan, unless otherwise indicated, all LTV, DSCR and Debt Yield calculations include any related pari passu companion loans and exclude any related subordinate companion loans, as applicable. For mortgaged properties securing residential cooperative mortgage loans, the UW NCF DSCR and UW NOI Debt Yield for each such mortgaged property is calculated using underwritten net operating income or underwritten net cash flow, as applicable, for the related residential cooperative property which is the projected net operating income or net cash flow, as applicable, reflected in the most recent appraisal obtained by or otherwise in the possession of the related mortgage loan seller as of the Cut-off Date. LTV calculations are based upon the appraised value of the residential cooperative property determined as if such residential cooperative property is operated as a residential cooperative, inclusive of the amount of the underlying debt encumbering such residential cooperative property. |
| This is not a research report and was not prepared by any Underwriter’s research department. Please see additional important information and qualifications at the end of this Term Sheet. |
32
| BANK 2021-BNK35 | Characteristics of the Mortgage Loans |
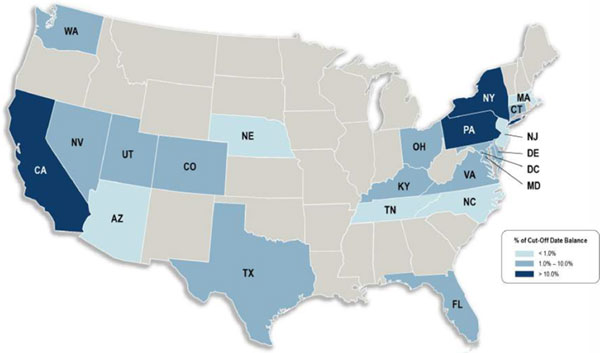
| Geographic Distribution(1) | ||||||||
| State or Other Jurisdiction | Number of Mortgaged Properties | Aggregate Cut-off Date Balance | % of Pool | Wtd. Avg. Mortgage Rate | Wtd. Avg. UW NCF DSCR | Wtd. Avg. UW NOI Debt Yield | Wtd. Avg. Cut-off Date LTV | Wtd. Avg. Maturity Date LTV |
| New York | 39 | $373,273,803 | 26.8% | 3.1538% | 3.76x | 16.6% | 41.7% | 36.6% |
| California | 15 | $217,964,568 | 15.6% | 3.1076% | 3.20x | 11.0% | 50.3% | 50.1% |
| California – Southern(2) | 12 | $160,612,500 | 11.5% | 3.1332% | 3.11x | 11.1% | 51.4% | 51.0% |
| California – Northern(2) | 3 | $57,352,068 | 4.1% | 3.0358% | 3.45x | 10.9% | 47.4% | 47.4% |
| Pennsylvania | 8 | $145,920,000 | 10.5% | 3.1573% | 3.39x | 11.3% | 55.3% | 55.3% |
| District of Columbia | 2 | $93,000,000 | 6.7% | 2.5537% | 4.70x | 12.3% | 44.4% | 44.4% |
| Texas | 2 | $79,250,000 | 5.7% | 3.1352% | 4.06x | 13.6% | 47.3% | 46.9% |
| Maryland | 2 | $69,000,000 | 4.9% | 3.5518% | 2.11x | 9.4% | 67.1% | 63.4% |
| Washington | 1 | $44,850,000 | 3.2% | 3.3200% | 2.32x | 8.1% | 65.5% | 65.5% |
| Delaware | 1 | $44,000,000 | 3.2% | 4.3700% | 1.96x | 8.9% | 68.6% | 68.6% |
| Virginia | 7 | $42,250,000 | 3.0% | 2.9862% | 3.47x | 11.4% | 59.5% | 59.5% |
| Florida | 2 | $41,162,932 | 3.0% | 3.3963% | 2.50x | 8.7% | 60.1% | 60.1% |
| Ohio | 4 | $40,750,000 | 2.9% | 3.0890% | 3.06x | 10.4% | 63.8% | 62.4% |
| Kentucky | 2 | $38,800,000 | 2.8% | 3.0185% | 3.19x | 10.4% | 67.3% | 67.3% |
| Nevada | 2 | $34,125,000 | 2.4% | 3.1178% | 2.56x | 8.6% | 55.4% | 55.4% |
| Colorado | 1 | $30,000,000 | 2.2% | 2.8000% | 4.33x | 13.5% | 53.4% | 53.4% |
| Connecticut | 12 | $27,440,000 | 2.0% | 3.8846% | 1.68x | 9.2% | 67.9% | 62.7% |
| Utah | 1 | $20,800,000 | 1.5% | 3.4000% | 3.02x | 10.7% | 43.7% | 43.7% |
| North Carolina | 1 | $11,240,000 | 0.8% | 3.0700% | 3.25x | 10.8% | 66.1% | 66.1% |
| New Jersey | 3 | $10,400,000 | 0.7% | 2.9450% | 3.31x | 10.0% | 58.9% | 58.9% |
| Massachusetts | 1 | $10,000,000 | 0.7% | 3.8900% | 2.30x | 9.3% | 49.8% | 49.8% |
| Arizona | 1 | $9,715,000 | 0.7% | 2.8960% | 4.21x | 12.9% | 54.6% | 54.6% |
| Nebraska | 1 | $7,420,000 | 0.5% | 3.0000% | 3.60x | 12.3% | 57.1% | 57.1% |
| Tennessee | 1 | $3,494,885 | 0.3% | 3.5500% | 1.89x | 10.4% | 58.2% | 45.7% |
| Total/Wtd. Avg. | 109 | $1,394,856,187 | 100.0% | 3.1767% | 3.36x | 12.4% | 52.0% | 50.2% |
| (1) | All numerical information concerning the mortgage loans is approximate and, in the case of mortgage loans secured by multiple properties, is based on allocated loan amounts with respect to such properties. All weighted average information regarding the mortgage loans reflects the weighting of the mortgage loans based on their outstanding principal balances as of the Cut-off Date or, in the case of mortgage loans secured by multiple properties, allocated loan amounts. The sum of numbers and percentages in columns may not match the “Total” due to rounding. With respect to any mortgage loan that is part of a whole loan, unless otherwise indicated, all LTV, DSCR and Debt Yield calculations include any related pari passu companion loans and exclude any related subordinate companion loans, as applicable. For mortgaged properties securing residential cooperative mortgage loans, the UW NCF DSCR and UW NOI Debt Yield for each such mortgaged property is calculated using underwritten net operating income or underwritten net cash flow, as applicable, for the related residential cooperative property which is the projected net operating income or net cash flow, as applicable, reflected in the most recent appraisal obtained by or otherwise in the possession of the related mortgage loan seller as of the Cut-off Date. LTV calculations are based upon the appraised value of the residential cooperative property determined as if such residential cooperative property is operated as a residential cooperative, inclusive of the amount of the underlying debt encumbering such residential cooperative property. |
| (2) | “California – Northern” includes zip codes above 93600, and “California – Southern” includes zip codes at or below 93600. |
| This is not a research report and was not prepared by any Underwriter’s research department. Please see additional important information and qualifications at the end of this Term Sheet. |
33
| BANK 2021-BNK35 | Collateral Statistics |
Collateral Statistics(1)
Cut-off Date Balance ($)
| No. of Mortgage Loans | Aggregate Cut-off Date Balance ($) | % of Pool | |||||
| 996,916 - 10,000,000 | 40 | 169,661,568 | 12.2 | ||||
| 10,000,001 - 20,000,000 | 7 | 90,705,000 | 6.5 | ||||
| 20,000,001 - 30,000,000 | 13 | 340,480,000 | 24.4 | ||||
| 30,000,001 - 40,000,000 | 6 | 215,622,500 | 15.5 | ||||
| 40,000,001 - 50,000,000 | 5 | 228,665,000 | 16.4 | ||||
| 50,000,001 - 60,000,000 | 3 | 163,898,724 | 11.8 | ||||
| 60,000,001 - 109,823,396 | 2 | 185,823,396 | 13.3 | ||||
| Total: | 76 | $1,394,856,187 | 100.0 | % | |||
| Min: $996,916 | Max: $109,823,396 Avg: $18,353,371 | ||||||
State or Other Jurisdiction(2)
| No. of Mortgaged Properties | Aggregate Cut-off Date Balance ($) | % of Pool |
| ||||
| New York | 39 | 373,273,803 | 26.8 | ||||
| California | 15 | 217,964,568 | 15.6 | ||||
| California – Southern(3) | 12 | 160,612,500 | 11.5 | ||||
| California – Northern (3) | 3 | 57,352,068 | 4.1 | ||||
| Pennsylvania | 8 | 145,920,000 | 10.5 | ||||
| District of Columbia | 2 | 93,000,000 | 6.7 | ||||
| Texas | 2 | 79,250,000 | 5.7 | ||||
| Maryland | 2 | 69,000,000 | 4.9 | ||||
| Washington | 1 | 44,850,000 | 3.2 | ||||
| Delaware | 1 | 44,000,000 | 3.2 | ||||
| Virginia | 7 | 42,250,000 | 3.0 | ||||
| Florida | 2 | 41,162,932 | 3.0 | ||||
| Ohio | 4 | 40,750,000 | 2.9 | ||||
| Kentucky | 2 | 38,800,000 | 2.8 | ||||
| Nevada | 2 | 34,125,000 | 2.4 | ||||
| Colorado | 1 | 30,000,000 | 2.2 | ||||
| Connecticut | 12 | 27,440,000 | 2.0 | ||||
| Utah | 1 | 20,800,000 | 1.5 | ||||
| North Carolina | 1 | 11,240,000 | 0.8 | ||||
| New Jersey | 3 | 10,400,000 | 0.7 | ||||
| Massachusetts | 1 | 10,000,000 | 0.7 | ||||
| Arizona | 1 | 9,715,000 | 0.7 | ||||
| Nebraska | 1 | 7,420,000 | 0.5 | ||||
| Tennessee | 1 | 3,494,885 | 0.3 | ||||
| Total: | 109 | $1,394,856,187 | 100.0 | % |
Property Type(2)
| No. of Mortgaged Properties | Aggregate Cut-off Date Balance ($) | % of Pool | |||||
| Office | 17 | 380,894,436 | 27.3 | ||||
| CBD | 6 | 245,000,000 | 17.6 | ||||
| Suburban | 10 | 129,973,627 | 9.3 | ||||
| Flex | 1 | 5,920,809 | 0.4 | ||||
| Retail | 9 | 346,815,000 | 24.9 | ||||
| Anchored | 9 | 346,815,000 | 24.9 | ||||
| Multifamily | 39 | 334,300,407 | 24.0 | ||||
| Garden | 8 | 160,864,408 | 11.5 | ||||
| Cooperative | 27 | 132,425,407 | 9.5 | ||||
| Student Housing | 1 | 20,800,000 | 1.5 | ||||
| Age Restricted | 2 | 16,735,592 | 1.2 | ||||
| Mid Rise | 1 | 3,475,000 | 0.2 | ||||
| Industrial | 21 | 188,789,843 | 13.5 | ||||
| Warehouse Distribution | 1 | 109,823,396 | 7.9 | ||||
| Flex | 15 | 49,026,638 | 3.5 | ||||
| Warehouse | 4 | 18,699,809 | 1.3 | ||||
| Manufacturing | 1 | 11,240,000 | 0.8 | ||||
| Self Storage | 20 | 119,964,885 | 8.6 | ||||
| Self Storage | 20 | 119,964,885 | 8.6 | ||||
| Manufactured Housing | 2 | 12,250,000 | 0.9 | ||||
| Manufactured Housing | 2 | 12,250,000 | 0.9 | ||||
| Mixed Use | 1 | 11,841,617 | 0.8 | ||||
| Office/Warehouse | 1 | 11,841,617 | 0.8 | ||||
| Total: | 109 | $1,394,856,187 | 100.0 | % | |||
Mortgage Rate (%)
| No. of Mortgage Loans | Aggregate Cut-off Date Balance ($) | % of Pool | |||||
| 2.3750 - 3.2490 | 36 | 872,201,929 | 62.5 | ||||
| 3.2500 - 3.4990 | 28 | 301,204,374 | 21.6 | ||||
| 3.5000 - 3.9990 | 8 | 145,409,885 | 10.4 | ||||
| 4.0000 - 4.3700 | 4 | 76,040,000 | 5.5 | ||||
| Total: | 76 | $1,394,856,187 | 100.0 | % | |||
| Min: 2.3750% | Max: 4.3700% Wtd Avg: 3.1767% | ||||||
Original Term to Maturity or ARD (mos.)
| No. of Mortgage Loans | Aggregate Cut-off Date Balance ($) | % of Pool | |||||
| 60 | 3 | 95,000,000 | 6.8 | ||||
| 84 | 2 | 35,455,000 | 2.5 | ||||
| 113 | 1 | 55,000,000 | 3.9 | ||||
| 119 | 1 | 38,000,000 | 2.7 | ||||
| 120 | 69 | 1,171,401,187 | 84.0 | ||||
| Total: | 76 | $1,394,856,187 | 100.0 | % | |||
| Min: 60 mos. | Max: 120 mos. Wtd Avg: 115 mos. | ||||||
Remaining Term to Maturity or ARD (mos.)
| No. of Mortgage Loans | Aggregate Cut-off Date Balance ($) | % of Pool | |||||
| 58 - 119 | 69 | 1,267,081,187 | 90.8 | ||||
| 120 | 7 | 127,775,000 | 9.2 | ||||
| Total: | 76 | $1,394,856,187 | 100.0 | % | |||
| Min: 58 mos. | Max: 120 mos. Wtd Avg: 114 mos. | ||||||
Original Amortization Term (mos.)
| No. of Mortgage Loans | Aggregate Cut-off Date Balance ($) | % of Pool | |||||
| Interest Only | 48 | 1,043,182,500 | 74.8 | ||||
| 360 | 23 | 325,349,610 | 23.3 | ||||
| 480 | 5 | 26,324,078 | 1.9 | ||||
| Total: | 76 | $1,394,856,187 | 100.0 | % | |||
| Min: 360 mos. | Max: 480 mos. Wtd Avg: 369 mos. | ||||||
Remaining Amortization Term (mos.)
| No. of Mortgage Loans | Aggregate Cut-off Date Balance ($) | % of Pool | |||||
| Interest Only | 48 | 1,043,182,500 | 74.8 | ||||
| 358 - 360 | 23 | 325,349,610 | 23.3 | ||||
| 361 - 479 | 5 | 26,324,078 | 1.9 | ||||
| Total: | 76 | $1,394,856,187 | 100.0 | % | |||
| Min: 358 mos. | Max: 479 mos. Wtd Avg: 368 mos. | ||||||
Mortgage Loan Sellers
| No. of Mortgage Loans | Aggregate Cut-off Date Balance ($) | % of Pool | |||||
| MSMCH | 18 | 481,978,724 | 34.6 | ||||
| BANA | 17 | 470,913,396 | 33.8 | ||||
| WFB | 15 | 364,437,385 | 26.1 | ||||
| NCB | 26 | 77,526,683 | 5.6 | ||||
| Total: | 76 | $1,394,856,187 | 100.0 | % |
Amortization Type
| No. of Mortgage Loans | Aggregate Cut-off Date Balance ($) | % of Pool | |||||
| Interest Only | 45 | 938,942,500 | 67.3 | ||||
| Amortizing Balloon | 22 | 223,393,687 | 16.0 | ||||
| Interest Only, Amortizing Balloon | 6 | 128,280,000 | 9.2 | ||||
| Interest Only - ARD | 2 | 93,000,000 | 6.7 | ||||
| Interest Only - Amortizing ARD | 1 | 11,240,000 | 0.8 | ||||
| Total: | 76 | $1,394,856,1 | 100.0 | % |
Cut-off Date LTV Ratio (%)
| No. of Mortgage Loans | Aggregate Cut-off Date Balance ($) | % of Pool | |||||
| 2.9 - 45.0 | 35 | 332,200,407 | 23.8 | ||||
| 45.1 - 50.0 | 3 | 141,000,000 | 10.1 | ||||
| 50.1 - 55.0 | 4 | 198,853,396 | 14.3 | ||||
| 55.1 - 60.0 | 13 | 195,694,885 | 14.0 | ||||
| 60.1 – 71.0 | 21 | 527,107,500 | 37.8 | ||||
| Total: | 76 | $1,394,856,187 | 100.0 | % | |||
| Min: 2.9% | Max: 71.0% Wtd Avg: 52.0% | ||||||
Maturity Date or ARD LTV Ratio (%)
| No. of Mortgage Loans | Aggregate Cut-off Date Balance ($) | % of Pool | |||||
| 2.5 - 30.0 | 28 | 135,900,407 | 9.7 | ||||
| 30.1 - 40.0 | 2 | 32,500,000 | 2.3 | ||||
| 40.1 - 45.0 | 6 | 273,623,396 | 19.6 | ||||
| 45.1 - 50.0 | 4 | 144,494,885 | 10.4 | ||||
| 50.1 - 55.0 | 3 | 89,030,000 | 6.4 | ||||
| 55.1 - 69.8 | 33 | 719,307,500 | 51.6 | ||||
| Total: | 76 | $1,394,856,187 | 100.0 | % | |||
| Min: 2.5% | Max: 69.8% Wtd Avg: 50.2% | ||||||
UW NCF DSCR (x)
| No. of Mortgage Loans | Aggregate Cut-off Date Balance ($) | % of Pool | |||||
| 1.37 - 1.60 | 4 | 78,040,000 | 5.6 | ||||
| 1.61 - 1.80 | 1 | 109,823,396 | 7.9 | ||||
| 1.81 - 2.00 | 3 | 71,994,885 | 5.2 | ||||
| 2.01 - 2.20 | 2 | 49,740,000 | 3.6 | ||||
| 2.21 - 2.40 | 4 | 113,200,000 | 8.1 | ||||
| 2.41 - 26.53 | 62 | 972,057,907 | 69.7 | ||||
| Total: | 76 | $1,394,856,187 | 100.0 | % | |||
| Min: 1.37x | Max: 26.53x Wtd Avg: 3.36x | ||||||
UW NOI Debt Yield (%)
| No. of Mortgage Loans | Aggregate Cut-off Date Balance ($) | % of Pool | |||||
| 7.8 - 9.0 | 11 | 319,405,000 | 22.9 | ||||
| 9.1 - 10.0 | 9 | 258,128,396 | 18.5 | ||||
| 10.1 - 12.0 | 21 | 479,587,385 | 34.4 | ||||
| 12.1 - 13.0 | 4 | 72,335,000 | 5.2 | ||||
| 13.1 - 15.0 | 4 | 131,397,102 | 9.4 | ||||
| 15.1 - 123.2 | 27 | 134,003,305 | 9.6 | ||||
| Total: | 76 | $1,394,856,187 | 100.0 | % | |||
| Min: 7.8% | Max: 123.2% Wtd Avg: 12.4% | ||||||
| (1) | All numerical information concerning the mortgage loans is approximate. All weighted average information regarding the mortgage loans reflects the weighting of the mortgage loans based on their outstanding principal balances as of the Cut-off Date. The sum of numbers and percentages in columns may not match the “Total” due to rounding. With respect to any mortgage loan that is part of a whole loan, unless otherwise indicated, all LTV, DSCR and Debt Yield calculations include any related pari passu companion loans and exclude any related subordinate companion loans, as applicable. For mortgaged properties securing residential cooperative mortgage loans, the UW DSCR and UW NOI Debt Yield for each such mortgaged property is calculated using underwritten net operating income or underwritten net cash flow, as applicable, for the related residential cooperative property which is the projected net operating income or net cash flow, as applicable, reflected in the most recent appraisal obtained by or otherwise in the possession of the related mortgage loan seller as of the Cut-off Date. LTV calculations are based upon the appraised value of the residential cooperative property determined as if such residential cooperative property is operated as a residential cooperative, inclusive of the amount of the underlying debt encumbering such residential cooperative property. |
| (2) | In the case of mortgage loans secured by multiple properties, cut-off date balance information is based on allocated loan amounts with respect to such properties. |
| (3) | “California – Northern” includes zip codes above 93600, and “California – Southern” includes zip codes at or below 93600. |
| This is not a research report and was not prepared by any Underwriter’s research department. Please see additional important information and qualifications at the end of this Term Sheet. |
34
(THIS PAGE INTENTIONALLY LEFT BLANK)
| This is not a research report and was not prepared by any Underwriter’s research department. Please see additional important information and qualifications at the end of this Term Sheet. |
35
| Industrial – Warehouse Distribution | Loan # 1 | Cut-off Date Balance: | $109,823,396 | |
| 30 Dunnigan Drive | 30 Dunnigan | Cut-off Date LTV: | 52.3% | |
| Suffern, NY 10901 | UW NCF DSCR: | 1.78x | ||
| UW NOI Debt Yield: | 9.5% |
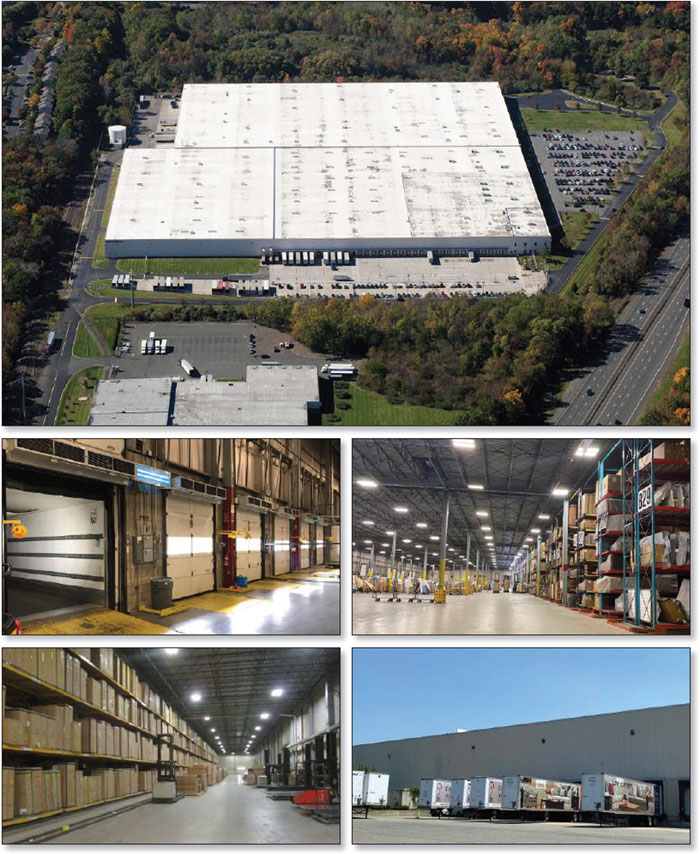
| This is not a research report and was not prepared by any Underwriter’s research department. Please see additional important information and qualifications at the end of this Term Sheet. |
36
| Industrial – Warehouse Distribution | Loan # 1 | Cut-off Date Balance: | $109,823,396 | |
| 30 Dunnigan Drive | 30 Dunnigan | Cut-off Date LTV: | 52.3% | |
| Suffern, NY 10901 | UW NCF DSCR: | 1.78x | ||
| UW NOI Debt Yield: | 9.5% |
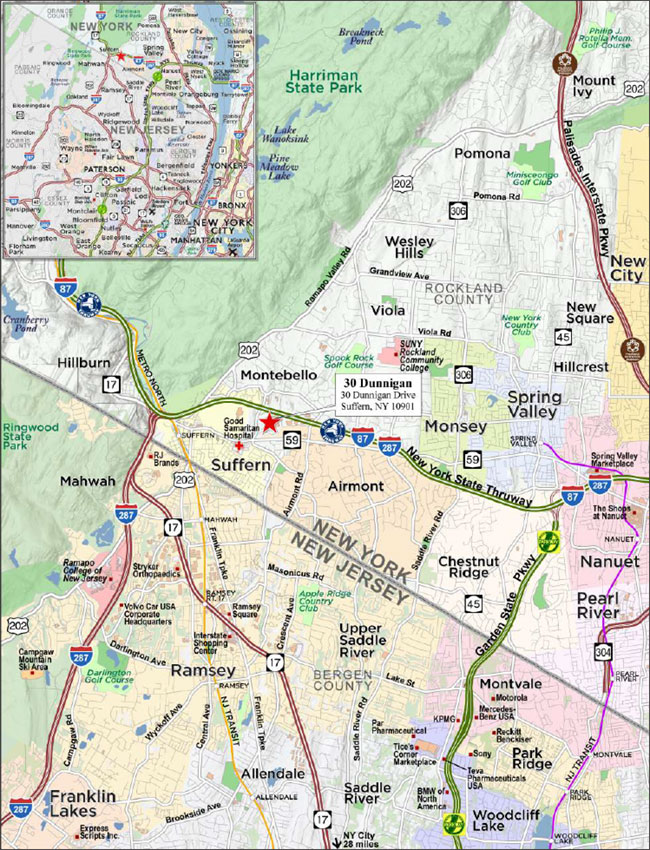
| This is not a research report and was not prepared by any Underwriter’s research department. Please see additional important information and qualifications at the end of this Term Sheet. |
37
| Mortgage Loan No. 1 – 30 Dunnigan |
| Mortgage Loan Information | Property Information | ||||||
| Mortgage Loan Seller: | BANA | Single Asset/Portfolio: | Single Asset | ||||
| Credit Assessment (DBRSM/Fitch/S&P): | NR/NR/NR | Location: | Suffern, NY 10901 | ||||
| Original Balance: | $110,000,000 | General Property Type: | Industrial | ||||
| Cut-off Date Balance: | $109,823,396 | Detailed Property Type: | Warehouse Distribution | ||||
| % of Initial Pool Balance: | 7.9% | Title Vesting: | Fee | ||||
| Loan Purpose: | Refinance | Year Built/Renovated: | 1976 / 2012-2015 | ||||
| Borrower Sponsors: | Neil Goldberg and Seth Goldberg | Size: | 893,127 SF | ||||
| Guarantor: | Neil Goldberg Family Asset | Cut-off Date Balance PSF: | $122.97 | ||||
| Preservation Trust | Maturity Date Balance PSF: | $94.79 | |||||
| Mortgage Rate: | 3.0850% | Property Manager: | Raymours Furniture Company, Inc. | ||||
| Note Date: | 6/25/2021 | (borrower-related) | |||||
| First Payment Date: | 8/1/2021 | ||||||
| Maturity Date: | 7/1/2031 | ||||||
| Original Term to Maturity: | 120 months | Underwriting and Financial Information(3) | |||||
| Original Amortization Term: | 360 months | UW NOI: | $10,421,786 | ||||
| IO Period: | 0 months | UW NOI Debt Yield: | 9.5% | ||||
| Seasoning: | 1 month | UW NOI Debt Yield at Maturity: | 12.3% | ||||
| Prepayment Provisions: | L(25),D(91),O(4) | UW NCF DSCR: | 1.78x | ||||
| Lockbox/Cash Mgmt Status: | Hard/In Place | Most Recent NOI: | $9,102,220 (3/31/2021) | ||||
| Additional Debt Type: | No | 2nd Most Recent NOI: | $9,354,142 (12/31/2020) | ||||
| Additional Debt Balance: | NAP | 3rd Most Recent NOI: | $9,033,481 (12/31/2019) | ||||
| Future Debt Permitted (Type): | No (NAP) | Most Recent Occupancy: | 100.0% (7/1/2021) | ||||
| Reserves(1) | 2nd Most Recent Occupancy: | 100.0% (12/31/2020) | |||||
| Type | Initial | Monthly | Cap | 3rd Most Recent Occupancy: | 100.0% (12/31/2019) | ||
| RE Taxes: | $884,359 | $89,581 | NAP | Appraised Value (as of)(4): | $210,000,000 (5/13/2021) | ||
| Insurance: | $0 | Springing | NAP | Appraised Value PSF: | $235.13 | ||
| Replacement Reserve: | $0 | $7,443 | $450,000 | Cut-off Date LTV Ratio(4): | 52.3% | ||
| TI/LC Reserve: | $0 | Springing | NAP(2) | Maturity Date LTV Ratio(4): | 40.3% | ||
| Sources and Uses | ||||||
| Sources | Proceeds | % of Total | Uses | Proceeds | % of Total | |
| Mortgage Loan Amount: | $110,000,000 | 100.0% | Loan Payoff: | $60,518,844 | 55.0% | |
| Return of Equity(5): | $47,782,276 | 43.4% | ||||
| Reserves: | $884,359 | 0.8% | ||||
| Closing Costs: | $814,520 | 0.7% | ||||
| Total Sources: | $110,000,000 | 100.0% | Total Uses: | $110,000,000 | 100.0% | |
| (1) | See “Escrows and Reserves” below for further discussion of reserve information. |
| (2) | The TI/LC reserve account will be capped at $1,000,000 if the Cash Sweep Period (as defined below) is caused solely by Par Pharmaceutical Trigger Event (as defined below). |
| (3) | The novel coronavirus pandemic is an evolving situation and could impact the 30 Dunnigan Mortgage Loan (as defined below) more severely than assumed in the underwriting of the 30 Dunnigan Mortgage Loan. The pandemic and resulting economic disruption could also adversely affect the NOI, NCF and occupancy information, as well as the appraised value and DSCR, LTV and Debt Yield metrics presented above and herein. See “Risk Factors—Risks Related to Market Conditions and Other External Factors—The Coronavirus Pandemic Has Adversely Affected the Global Economy and Will Likely Adversely Affect the Performance of the Mortgage Loans” in the prospectus. |
| (4) | The appraisal also provided a “Hypothetical – Go Dark” value of $190,000,000 as of May 13, 2021, a value which would result in an Appraised Value Per SF, Cut-off Date LTV Ratio and LTV Ratio at Maturity of $213, 57.8% and 44.6%, respectively. |
| (5) | The borrower sponsors of the 30 Dunnigan Mortgage Loan acquired the 30 Dunnigan Property (as defined below) in 2012 and have a current cost basis of approximately $75.2 million. |
The Mortgage Loan. The largest mortgage loan (the “30 Dunnigan Mortgage Loan”) is evidenced by a promissory note in the original principal balance of $110,000,000. The 30 Dunnigan Mortgage Loan is secured by a first priority fee mortgage encumbering an 893,127 SF industrial warehouse distribution center located in Suffern, New York (the “30 Dunnigan Property”).
The Borrower and the Borrower Sponsors. The borrower is Suffern Dunnigan Drive, LLC, a New York limited liability company structured to be bankruptcy-remote with at least two independent directors. The borrower sponsors are Neil Goldberg and Seth Goldberg, and the non-recourse carveout guarantor is Neil Goldberg Family Asset Preservation Trust.
The Goldberg family has owned and operated Raymours Furniture Company, Inc. (d.b.a. Raymour & Flanigan Furniture) (“Raymour & Flanigan”) since its founding in 1947. Current Chief Executive Officer and Chairman Neil Goldberg joined the family business in 1972 and was later joined by Steven Goldberg and Michael Goldberg. Seth Goldberg became President in January 2021. Collectively, the family members serve as the senior executives at Raymour & Flanigan and oversee the operation of over 11.0 million SF of commercial real estate, which includes a portfolio of 80 retail, 20 industrial and 1 office property related to the furniture business and 125 retail and 7 industrial properties with third party tenants.
| This is not a research report and was not prepared by any Underwriter’s research department. Please see additional important information and qualifications at the end of this Term Sheet. |
38
| Industrial – Warehouse Distribution | Loan #1 | Cut-off Date Balance: | $109,823,396 | |
| 30 Dunnigan Drive | 30 Dunnigan | Cut-off Date LTV: | 52.3% | |
| Suffern, NY 10901 | UW NCF DSCR: | 1.78x | ||
| UW NOI Debt Yield: | 9.5% |
The Property. The 30 Dunnigan Property is an 893,127 SF Class A industrial warehouse distribution center constructed in 1976 on a 49.12-acre site in Suffern, New York. The 30 Dunnigan Property features 873,127 SF of warehouse space with 32’ clear heights, 20,000 SF of office space, 250 parking spaces and 80 tractor trailer spaces. In addition, the 30 Dunnigan Property features an unfinished mezzanine that is not included in the gross building area. Regional access to the 30 Dunnigan Property is provided by four major highways (I-87, I-287, Palisades Interstate Parkway and Garden State Parkway, which is accessible via I-87), and the 30 Dunnigan Property is served by an active Norfolk Southern rail line. The borrower sponsors acquired the property in 2012. After the acquisition, the borrower sponsors invested approximately $32.9 million in capital expenditures including roof replacement, sprinklers, racking, electrical, site work, loading docks, generator, bathroom remodel, and office space optimization. As of July 1, 2021, the 30 Dunnigan Property was 100.0% leased to two tenants, Raymour & Flanigan and Par Pharmaceutical.
Major Tenants.
Raymour & Flanigan (703,554 SF, 78.8% of NRA, 79.5% of underwritten base rent). Raymour & Flanigan is the primary tenant and is affiliated with the borrower sponsors. The borrower sponsors, Neil and Seth Goldberg, and various members of their family, own and control Raymour & Flanigan, the largest furniture retailer in the Northeast United States. Founded in 1947, Raymour & Flanigan is a privately held, family run American furniture retail chain headquartered in Liverpool, New York. Raymour & Flanigan operates 103 full-line showrooms, 27 outlet centers, 5 clearance centers, 15 customer service centers and 4 distribution centers, serving customers in seven states: Connecticut, Delaware, Massachusetts, New Jersey, New York, Pennsylvania and Rhode Island. Approximately one-third of Raymour & Flanigan’s sales are generated in the metropolitan New York market. As the largest Customer Distribution Center (“CDC”) in the company, the 30 Dunnigan Property supports Raymour & Flanigan’s deliveries to customers located in New York City’s five boroughs, as well as Rockland and Westchester counties and Northern New Jersey. In total, the 30 Dunnigan Property supports 49 stores in these areas. The 30 Dunnigan Property provides operational efficiencies and savings to Raymour & Flanigan by reducing the time and cost of transporting inventory from Newark, New Jersey and other east coast ports up to its northern distribution center in Syracuse, New York and then back to the CDC’s and customers in the above referenced markets.
Raymour & Flanigan has occupied the 30 Dunnigan Property since 2012 and executed a new 15-year NNN lease that commenced at loan origination and extends through June 30, 2036 at a flat rent of $12.50 PSF (except as described below). Additionally, the new lease includes an expansion clause for Raymour & Flanigan. Upon expiration of the Par Pharmaceutical lease on January 31, 2024 (unless the Par Pharmaceutical lease is renewed or replaced), Raymour & Flanigan is required to take over the Par Pharmaceutical space under a lease expansion that will be co-terminous with the 15-year lease of the current Raymour & Flanigan space. Post expansion, Raymour & Flanigan will be required to pay a flat rent of $12.75 PSF on all of its space. Raymour & Flanigan has reportedly spent approximately $7.5 million on improvements and equipment for its space at the 30 Dunnigan Property.
Par Pharmaceutical (189,573 SF, 21.2% of NRA, 20.5% of underwritten base rent). Par Pharmaceutical (NYSE: PRX) was founded in 1978 and develops, manufactures, markets and distributes generic pharmaceutical drugs. Par Pharmaceutical is a subsidiary of Endo Pharmaceuticals. Par Pharmaceutical has invested approximately $3 million in its space at the 30 Dunnigan Property to build offices, add 3 HVAC units, a Drug Enforcement Administration vault to store controlled substances, a backup generator and additional various systems, sensors, coolers, and racking.
Par Pharmaceutical has occupied the 30 Dunnigan Property since 2002 and has a lease expiration date in January 2024 with no renewal options remaining. The current base rent is $11.94 PSF, increasing to $12.30 PSF on February 1, 2022. Par Pharmaceutical has expressed interest in relocating a portion of its operations to Southern New Jersey and is currently marketing 133,500 SF of its space for sublease.
The following table presents certain information relating to the major tenants at the 30 Dunnigan Property:
| Tenant Summary(1) | ||||||||||
| Tenant Name | Credit Rating (Fitch/ Moody’s/ S&P) | Tenant SF | Approx. % of SF | Annual UW Rent | % of Total Annual UW Rent | Annual UW Rent PSF | ||||
Lease Exp. | Renewal Options | Term. Options | ||||||||
| Raymour & Flanigan(2) | NR/NR/NR | 703,554 | 78.8% | $8,794,425 | 79.5% | $12.50 | 6/30/2036 | N | N | |
| Par Pharmaceutical(2) | NR/NR/NR | 189,573 | 21.2% | $2,263,601 | 20.5% | $11.94 | 1/31/2024 | N | N | |
| Collateral Total/Wtd. Avg. | 893,127 | 100.0% | $11,058,026 | 100.0% | $12.38 | |||||
| (1) | Information is based on the underwritten rent roll dated July 2021. |
| (2) | Par Pharmaceutical has expressed interest in relocating a portion of its operations to Southern New Jersey and is currently marketing 133,500 SF of its space for sublease. Upon expiration of the Par Pharmaceutical lease (unless the Par Pharmaceutical lease is renewed or replaced), Raymour & Flanigan is required to take over the Par Pharmaceutical space under a lease expansion that will be co-terminous with the 15-year lease of the current Raymour & Flanigan space. Post expansion, Raymour & Flanigan will be required to pay a flat rent of $12.75 PSF on all of its space. |
| This is not a research report and was not prepared by any Underwriter’s research department. Please see additional important information and qualifications at the end of this Term Sheet. |
39
| Industrial – Warehouse Distribution | Loan #1 | Cut-off Date Balance: | $109,823,396 | |
| 30 Dunnigan Drive | 30 Dunnigan | Cut-off Date LTV: | 52.3% | |
| Suffern, NY 10901 | UW NCF DSCR: | 1.78x | ||
| UW NOI Debt Yield: | 9.5% |
The following table presents certain information relating to the lease rollover schedule at the 30 Dunnigan Property:
| Lease Rollover Schedule(1) | ||||||||
| Year | # of Leases Rolling | SF Rolling | UW Rent PSF Rolling | Approx. % of Total SF Rolling | Approx. Cumulative % of SF Rolling | Total UW Rent Rolling | Approx. % of Total Rent Rolling | Approx. Cumulative % of Total Rent Rolling |
| MTM/2021 | 0 | 0 | $0.00 | 0.0% | 0.0% | $0 | 0.0% | 0.0% |
| 2022 | 0 | 0 | $0.00 | 0.0% | 0.0% | $0 | 0.0% | 0.0% |
| 2023 | 0 | 0 | $0.00 | 0.0% | 0.0% | $0 | 0.0% | 0.0% |
| 2024 | 1 | 189,573 | $11.94 | 21.2% | 21.2% | $2,263,601 | 20.5% | 20.5% |
| 2025 | 0 | 0 | $0.00 | 0.0% | 21.2% | $0 | 0.0% | 20.5% |
| 2026 | 0 | 0 | $0.00 | 0.0% | 21.2% | $0 | 0.0% | 20.5% |
| 2027 | 0 | 0 | $0.00 | 0.0% | 21.2% | $0 | 0.0% | 20.5% |
| 2028 | 0 | 0 | $0.00 | 0.0% | 21.2% | $0 | 0.0% | 20.5% |
| 2029 | 0 | 0 | $0.00 | 0.0% | 21.2% | $0 | 0.0% | 20.5% |
| 2030 | 0 | 0 | $0.00 | 0.0% | 21.2% | $0 | 0.0% | 20.5% |
| 2031 | 0 | 0 | $0.00 | 0.0% | 21.2% | $0 | 0.0% | 20.5% |
| 2032 & Beyond | 1 | 703,554 | $12.50 | 78.8% | 100.0% | $8,794,425 | 79.5% | 100.0% |
| Vacant | 0 | 0 | $0.00 | 0.0% | 100.0% | $0 | 0.0% | 100.0% |
| Total/Wtd. Avg. | 2 | 893,127 | $12.38 | 100.0% | $11,058,026 | 100.0% | ||
| (1) | Information is based on the underwritten rent roll dated July 2021. |
COVID-19 Update. As of July 7, 2021, the 30 Dunnigan Property was open and operating with 100.0% of tenants by NRA and 100.0% of tenants by underwritten rent having paid their full June 2021 rent payments. No tenants at the 30 Dunnigan Property requested rent relief or lease modifications during the COVID-19 pandemic. The 30 Dunnigan Property remains 100.0% occupied as of July 1, 2021. The first debt service payment on the 30 Dunnigan Mortgage Loan is due in August 2021 and, as of July 1, 2021, the 30 Dunnigan Mortgage Loan was not subject to any forbearance, modification or debt service relief request.
The Market. The 30 Dunnigan Property is located within the Northern New Jersey industrial market and more specifically, the Rockland County industrial submarket. Rockland County is approximately 20 miles north of New York City. The 30 Dunnigan Property has access to four major highways - I-87, I-287, Palisades Interstate Parkway and Garden State Parkway. The 30 Dunnigan Property’s neighborhood is also serviced by numerous local roadways including State Route 59 and North Airmont Road.
According to the appraisal, as of the first quarter of 2021, the Rockland County industrial submarket contained approximately 16.4 million SF of industrial space across 390 buildings, with an additional 16,000 SF under construction. The vacancy rate in the Rockland County industrial submarket was 6.7% as of the first quarter of 2021, falling 70 basis points from the previous quarter and the average asking rent was $9.76 PSF.
According to the appraisal, the estimated 2020 population within a one, three and five-mile radius of the 30 Dunnigan Property was 7,723, 57,778 and 172,350, respectively, and the estimated 2020 average household income within the same radii was $131,901, $134,179 and $131,471, respectively.
The following table presents recent sales data for comparable properties with respect to the 30 Dunnigan Property:
| Comparable Sales | ||||||
Property Name Location | Year Built / Renov. | Rentable Area (SF) | Occupancy | Sale Price | Sale Date | Sale Price (PSF) |
30 Dunnigan Drive Suffern, NY | 1976 / 2012-2015 | 893,127 | 100% | $210,000,000(1) | NAP | NAP |
10 Princess Road 10 Princess Road Lawrenceville, NJ | 2020 / NAP | 340,400 | 100% | $75,000,000 | Apr-21 | $220.33 |
Boston Infill Portfolio 65 Industrial Way Wilmington, MA | 1973 / NAP | 687,389 | 96% | $154,000,000 | Dec-20 | $224.04 |
Amazon SoPhi Last Mile Delivery Station 2400 Weccacoe Ave Philadelphia, PA | 1965 / 2020 | 283,500 | 100% | $71,500,000 | Oct-20 | $252.20 |
150 Whitman Avenue 150 Whitman Avenue Edison, NJ | 2020 / NAP | 124,560 | 100% | $28,805,000 | Aug-20 | $231.25 |
LG Electronics USA 50 Veronica Avenue Somerset, NJ | 2020 / NAP | 926,392 | 100%
| $164,000,000 | Jun-20 | $177.03 |
25 Enterprise Avenue North 25 Enterprise Avenue North Secaucus, NJ | 1980 / NAP
| 149,000 | 100% | $33,543,900 | Jan-20 | $225.13 |
Source: Appraisal.
| (1) | Reflects the appraised value as of May 13, 2021. |
| This is not a research report and was not prepared by any Underwriter’s research department. Please see additional important information and qualifications at the end of this Term Sheet. |
40
| Industrial – Warehouse Distribution | Loan #1 | Cut-off Date Balance: | $109,823,396 | |
| 30 Dunnigan Drive | 30 Dunnigan | Cut-off Date LTV: | 52.3% | |
| Suffern, NY 10901 | UW NCF DSCR: | 1.78x | ||
| UW NOI Debt Yield: | 9.5% |
The following table presents recent leasing data at comparable properties with respect to the 30 Dunnigan Property:
| Comparable Industrial Leases | ||||||||
Property Address | Year Built | Total NRA (SF) | Distance from Subject (miles) | Tenant | Lease Date/ Term (yrs) | Lease Size (SF) | Base Rent PSF | Escalations / Free rent |
30 Dunnigan Drive Suffern, NY 10901 | 1976 | 893,127(1) | - | Raymour & Flanigan | June-21 / 15.0(1) | 703,554(1) | $12.50(1) | Flat / 0 months |
201 Bay Avenue Elizabeth, NJ 07201 | 1980 | 509,093 | 41.3 | Wayfair | Jan-21 / 10.0 | 306,351 | $12.75 | 3.0% Annual / 0 months |
2205 State Route 27 Edison, NJ 08817 | 2020 | 900,022 | 53.5 | Amazon | Oct-20 / 10.0 | 900,022 | $11.00 | 3.0% Annual / 0 months |
10-12 Plant Road Hasbrouck Heights, NJ 07604 | 1973 | 42,000 | 23.5 | Amazon.com Services LLC | Apr-20 / 10.3 | 42,000 | $12.91 | 3.0% Annual / 0 months |
200 & 400 Oritani Drive Baluvelt, NY 10913 | 2008 | 220,000 | 11.7 | Amazon | Feb-20 / 10.3 | 220,000 | $10.15 | 3.0% Annual / 3 months |
125 North Street Teterboro, NJ 07608 | 2018 | 220,833 | 23.1 | Amazon | Jan-20 / 10.0 | 220,833 | $15.44 | 3.0% Annual / 3 months |
37 Ramland Road Orangeburg, NY 10962 | 1987 | 56,500 | 13.0 | Tremont Electric | Sep-19 / 5.0 | 11,200 | $10.00 | Periodic / 0 months |
178 Bauer Drive Oakland, NJ 07436 | 1975 | 183,695 | 13.2 | Amerlux LLC | Jun-19 / 5.6 | 183,695 | $9.54 | 2.0% Annual / 0 months |
100 Performance Drive Mahwah, NJ 07495 | 2018 | 271,176 | 4.6 | Snow Joe | Apr-18 / 10.0 | 271,176 | $10.00 | 3.0% Annual / 6 months |
663 East Crescent Avenue Ramsey, NJ 07446 | 1980 | 89,000 | 4.7 | FRS Distribution | Mar-18 / 10.0 | 26,443 | $10.50 | NAP / 0 months |
800 & 900 Bradley Hill Road Blauvelt, NY 10913 | 1977 | 121,598 | 11.9 | Tri Seal International | Feb-18 / 10.0 | 56,431 | $7.00 | 17.9% yr. 6 / 0 months |
Source: Appraisal.
| (1) | Information obtained from the underwritten rent roll. Raymour & Flanigan executed an amended and restated lease agreement at loan closing, with a fifteen-year lease term, at a flat rent of $12.50 PSF. Additionally, the amended and restated lease agreement includes a clause requiring expansion into any vacant space at a $12.75 PSF rate, with a term co-terminous with the Raymour & Flanigan lease. |
The following table presents certain information relating to the appraisal’s market rent conclusions for the 30 Dunnigan Property:
| Market Rent (PSF) | Lease Term (Yrs) | Rental Increase Projection |
| $11.00 | 10 | 3% per annum |
| This is not a research report and was not prepared by any Underwriter’s research department. Please see additional important information and qualifications at the end of this Term Sheet. |
41
| Industrial – Warehouse Distribution | Loan #1 | Cut-off Date Balance: | $109,823,396 | |
| 30 Dunnigan Drive | 30 Dunnigan | Cut-off Date LTV: | 52.3% | |
| Suffern, NY 10901 | UW NCF DSCR: | 1.78x | ||
| UW NOI Debt Yield: | 9.5% |
Operating History and Underwritten Net Cash Flow. The following table presents certain information relating to the historical operating performance and Underwritten Net Cash Flow at the 30 Dunnigan Property:
| Cash Flow Analysis | |||||
| 2019 | 2020 | 3/31/2021 TTM | UW | UW PSF | |
| Gross Potential Rent(1) | $8,965,543 | $9,227,876 | $9,249,693 | $11,124,277 | $12.46 |
| Reimbursements | $2,060,948 | $2,063,546 | $2,099,492 | $2,759,912 | $3.09 |
| Other Income | $2,189 | $223 | $223 | $0 | $0.00 |
| (Vacancy & Concessions) | $0 | $0 | $0 | ($694,209) | ($0.78) |
| Effective Gross Income | $11,028,680 | $11,291,645 | $11,349,408 | $13,189,980 | $14.77 |
| Real Estate Taxes(2) | $1,130,981 | $1,136,237 | $1,397,944 | $1,430,470 | $1.60 |
| Insurance | $321,277 | $315,271 | $315,271 | $340,840 | $0.38 |
| Other Operating Expenses | $542,941 | $485,995 | $533,973 | $996,884 | $1.12 |
| Total Operating Expenses | $1,995,199 | $1,937,503 | $2,247,188 | $2,768,194 | $3.10 |
| Net Operating Income | $9,033,481 | $9,354,142 | $9,102,220 | $10,421,786 | $11.67 |
| Replacement Reserves | $0 | $0 | $0 | $89,313 | $0.10 |
| TI/LC | $0 | $0 | $0 | $312,594 | $0.35 |
| Net Cash Flow | $9,033,481 | $9,354,142 | $9,102,220 | $10,019,879 | $11.22 |
| Occupancy % | 100.0% | 100.0% | 100.0% | 95.0%(3) | |
| NOI DSCR | 1.61x | 1.66x | 1.62x | 1.85x | |
| NCF DSCR | 1.61x | 1.66x | 1.62x | 1.78x | |
| NOI Debt Yield | 8.2% | 8.5% | 8.3% | 9.5% | |
| NCF Debt Yield | 8.2% | 8.5% | 8.3% | 9.1% | |
| (1) | UW Gross Potential Rent includes (i) the February 2022 contractual rent step of $12.30 PSF for Par Pharmaceutical resulting in $67,908 of additional annual rent and (ii) the recently executed lease rent of $12.50 PSF NNN for Raymour & Flanigan, resulting in $1,758,885 of additional annual rent. |
| (2) | In 2012, the County of Rockland Industrial Development Agency entered into a payment in lieu of taxes (“PILOT”) agreement with the borrower, which will remain in effect until the 2024/2025 tax year. Upon expiration of the PILOT period, the borrower will be required to resume paying real estate taxes based on a full tax assessment and applicable tax rate. Real Estate Taxes are underwritten to the non-exempt tax level. Actual PILOT payments for 2021 are $1,135,921. |
| (3) | Represents economic occupancy. The 30 Dunnigan Property is currently 100.0% occupied. |
Escrows and Reserves.
Real Estate Taxes – The 30 Dunnigan Mortgage Loan documents provide for an upfront reserve of approximately $884,359 for real estate taxes and ongoing monthly deposits into a reserve for real estate taxes in an amount equal to 1/12th of the real estate taxes that the lender estimates will be payable during the next twelve months for the 30 Dunnigan Property (initially approximately $89,581 per month).
Insurance – In the event the 30 Dunnigan Property is no longer covered by a blanket insurance policy, the borrower is required to deposit 1/12th of the annual estimated insurance premiums monthly.
Replacement Reserve – The borrower is required to deposit approximately $7,443 for replacements monthly, subject to a cap of $450,000.
TI/LC Reserve – During a Cash Sweep Period (as defined below), the borrower is required to make monthly deposits of approximately $26,050 into the TI/LC reserve account. Additionally, during a Cash Sweep Period continuing solely due to the continuance of a Par Pharmaceutical Trigger Event, all excess cash is required to be deposited into the TI/LC reserve account, until the TI/LC reserve account reaches $1,000,000. Funds reserved during a Par Pharmaceutical Trigger Event will be released back to the borrower when the Par Pharmaceutical space is leased to a replacement tenant acceptable to the lender who is open and operating.
Lockbox and Cash Management. The 30 Dunnigan Mortgage Loan is structured with a hard lockbox and in place cash management. The borrower is required to direct all tenants of the 30 Dunnigan Property to deposit all rents directly into the lockbox account, which funds are then required to be swept to the lender-controlled cash management account on each business day, and, provided no event of default is continuing, applied on each monthly payment date: (i) to make the monthly deposits into the real estate tax and insurance reserves, if any, as described above under “Escrows and Reserves,” (ii) to pay debt service on the 30 Dunnigan Mortgage Loan, (iii) to make the monthly deposit into the replacement reserve and the future TI/LC reserve, if any as described above under “Escrows and Reserves,” (iv) to pay operating expenses set forth in the lender-approved annual budget and lender-approved extraordinary expenses, (v) if a Cash Sweep Period exists, to deposit any remainder into an excess cash flow reserve to be held as additional security for the 30 Dunnigan Mortgage Loan during the continuance of such Cash Sweep Period and (vi) if no event of default exists under the 30 Dunnigan Mortgage Loan and no Cash Sweep Period exists, to disburse any remainder to the borrower.
A “Cash Sweep Period” means any one or more of the following periods: (i) commencing when the trailing twelve month debt service coverage ratio falls below 1.20x (tested quarterly) and continuing until the trailing twelve month debt service coverage ratio is equal to or greater than 1.25x for two consecutive calendar quarters, (ii) commencing when Raymour & Flanigan goes dark, vacates or gives notice of its intent to vacate or terminate its lease and continuing until it is re-opened and operating, in the case of termination until its space is re-leased to one or more replacement tenants acceptable to the lender, (iii) commencing when Raymour & Flanigan defaults in the payment of rent under its lease and continuing until the default is cured, (iv) commencing when
| This is not a research report and was not prepared by any Underwriter’s research department. Please see additional important information and qualifications at the end of this Term Sheet. |
42
| Industrial – Warehouse Distribution | Loan #1 | Cut-off Date Balance: | $109,823,396 | |
| 30 Dunnigan Drive | 30 Dunnigan | Cut-off Date LTV: | 52.3% | |
| Suffern, NY 10901 | UW NCF DSCR: | 1.78x | ||
| UW NOI Debt Yield: | 9.5% |
Raymour & Flanigan becomes the subject of bankruptcy and continuing until it and its assets are no longer subject to bankruptcy and the lease remains unaltered, or (v) during the continuance of a Par Pharmaceutical Trigger Event.
A “Par Pharmaceutical Trigger Event” will commence if (i) Par Pharmaceutical fails to renew its lease on or before January 31, 2023 (twelve months prior to lease expiration), for a term of no less than five years or (ii) the Par Pharmaceutical lease is terminated. A Par Pharmaceutical Trigger Event will end when the Par Pharmaceutical lease is renewed or replaced by a replacement tenant acceptable to the lender or when the TI/LC Reserve reaches a balance of $1,000,000.
Additional Secured Indebtedness (not including trade debts). None.
Mezzanine Loan and Preferred Equity. Not permitted.
Release of Property. Not permitted.
Right of First Offer/Right of First Refusal. None.
Ground Lease. None.
Letter of Credit. None.
Terrorism Insurance. The borrower is required to obtain and maintain property insurance that covers perils and acts of terrorism and is required to obtain and maintain business interruption insurance for 18 months plus a 6-month extended period of indemnity. See “Risk Factors—Risks Relating to the Mortgage Loans—Terrorism Insurance May Not Be Available for All Mortgaged Properties” in the prospectus.
| This is not a research report and was not prepared by any Underwriter’s research department. Please see additional important information and qualifications at the end of this Term Sheet. |
43
| Retail - Anchored | Loan #2 | Cut-off Date Balance: | $76,000,000 | |
| 11410 Century Oaks Terrace | The Domain | Cut-off Date LTV: | 46.5% | |
| Austin, TX 78758 | UW NCF DSCR: | 4.17x | ||
| UW NOI Debt Yield: | 13.8% |
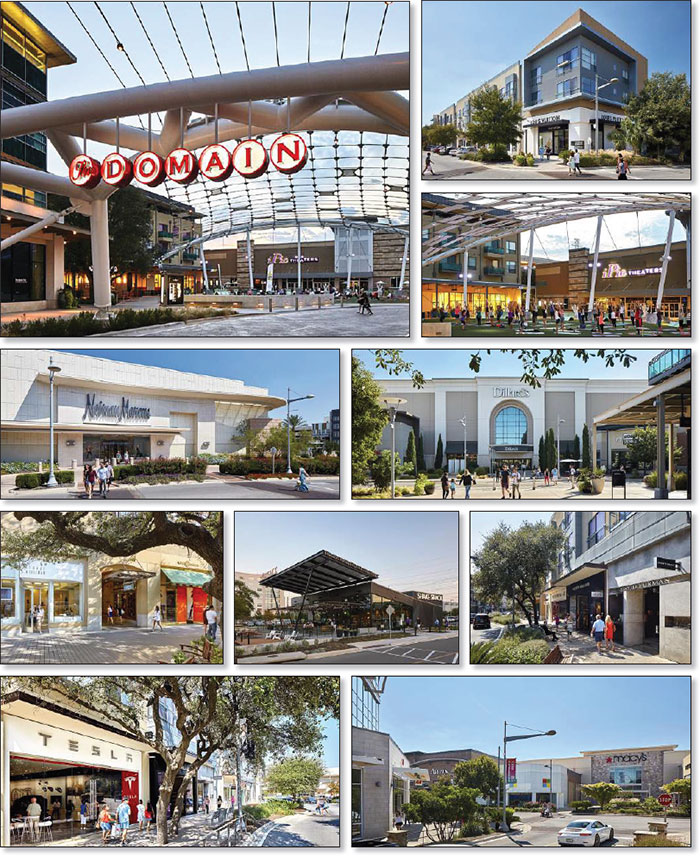
| This is not a research report and was not prepared by any Underwriter’s research department. Please see additional important information and qualifications at the end of this Term Sheet. |
44
| Retail - Anchored | Loan #2 | Cut-off Date Balance: | $76,000,000 | |
| 11410 Century Oaks Terrace | The Domain | Cut-off Date LTV: | 46.5% | |
| Austin, TX 78758 | UW NCF DSCR: | 4.17x | ||
| UW NOI Debt Yield: | 13.8% |
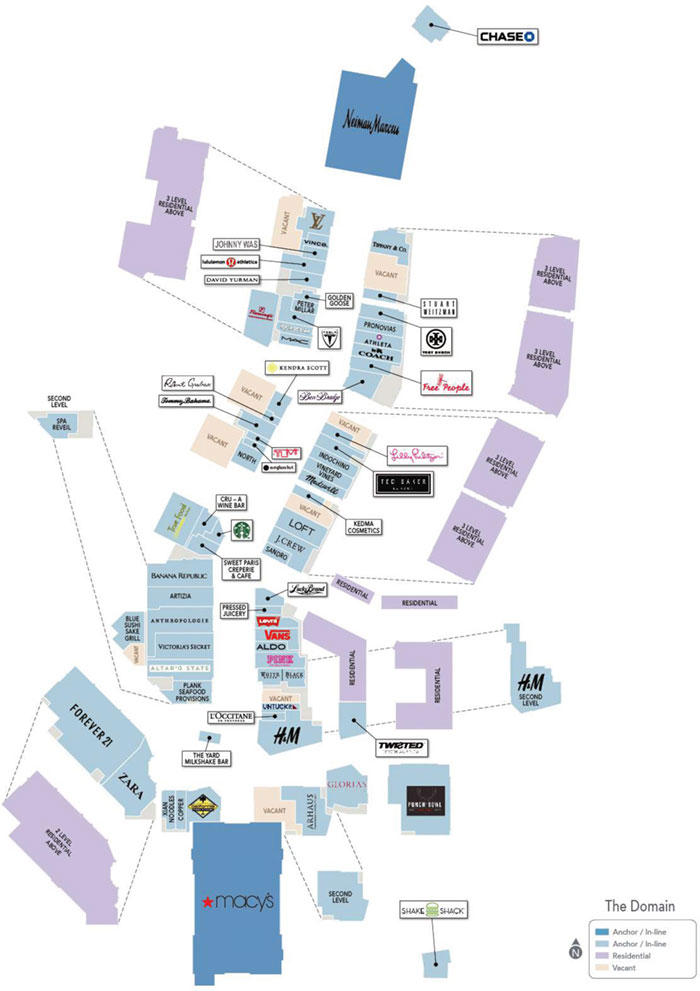
| This is not a research report and was not prepared by any Underwriter’s research department. Please see additional important information and qualifications at the end of this Term Sheet. |
45
| Retail - Anchored | Loan #2 | Cut-off Date Balance: | $76,000,000 | |
| 11410 Century Oaks Terrace | The Domain | Cut-off Date LTV: | 46.5% | |
| Austin, TX 78758 | UW NCF DSCR: | 4.17x | ||
| UW NOI Debt Yield: | 13.8% |
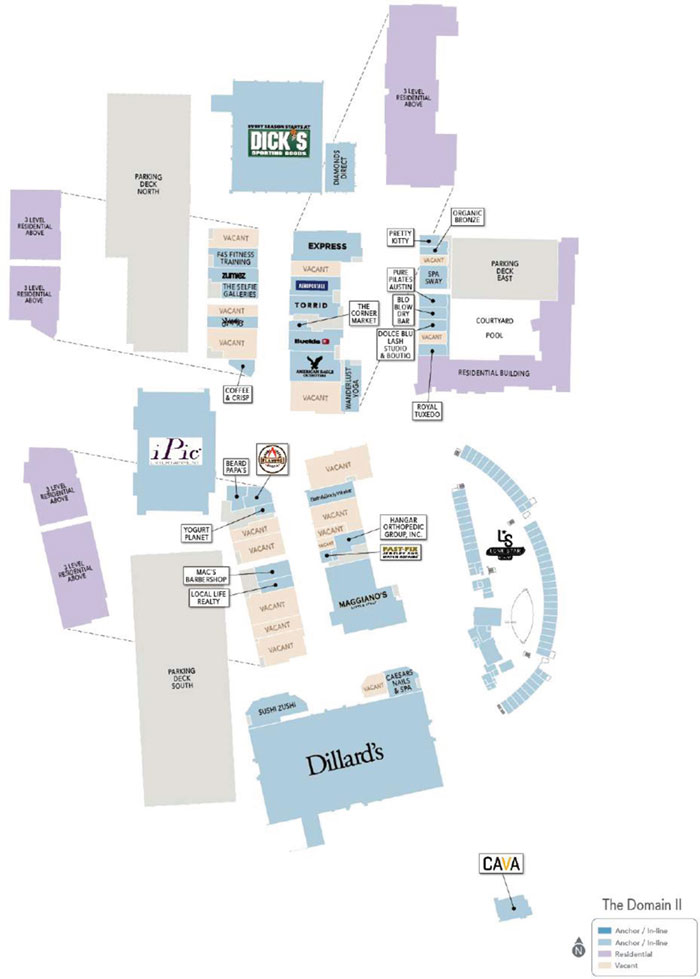
| This is not a research report and was not prepared by any Underwriter’s research department. Please see additional important information and qualifications at the end of this Term Sheet. |
46
| Retail - Anchored | Loan #2 | Cut-off Date Balance: | $76,000,000 | |
| 11410 Century Oaks Terrace | The Domain | Cut-off Date LTV: | 46.5% | |
| Austin, TX 78758 | UW NCF DSCR: | 4.17x | ||
| UW NOI Debt Yield: | 13.8% |
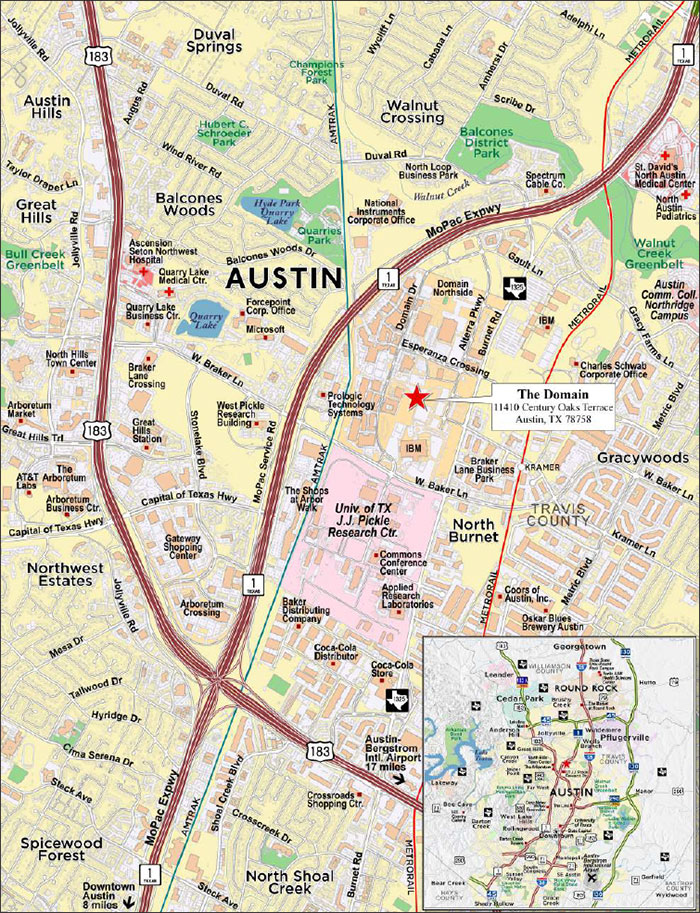
| This is not a research report and was not prepared by any Underwriter’s research department. Please see additional important information and qualifications at the end of this Term Sheet. |
47
| Mortgage Loan No. 2 – The Domain |
| Mortgage Loan Information | Property Information | |||||
| Mortgage Loan Seller: | BANA | Single Asset/Portfolio: | Single Asset | |||
| Credit Assessment (DBRSM/Fitch/S&P): | NR/NR/NR | Location: | Austin, TX 78758 | |||
| Original Balance(1): | $76,000,000 | General Property Type: | Retail | |||
| Cut-off Date Balance(1): | $76,000,000 | Detailed Property Type: | Anchored | |||
| % of Initial Pool Balance: | 5.4% | Title Vesting: | Fee | |||
| Loan Purpose: | Refinance | Year Built/Renovated: | 2007/2015-2018 | |||
| Borrower Sponsor: | Simon Property Group, L.P. | Size: | 886,526 SF | |||
| Guarantor: | Simon Property Group, L.P. | Cut-off Date Balance PSF(1): | $236.88 | |||
| Mortgage Rate: | 3.0940% | Maturity Date Balance PSF(1): | $236.88 | |||
| Note Date: | 6/16/2021 | Property Manager: | Simon Management Associates (Texas), | |||
| First Payment Date: | 8/1/2021 | LLC (borrower-related) | ||||
| Maturity Date: | 7/1/2031 | |||||
| Original Term to Maturity: | 120 months | |||||
| Original Amortization Term: | 0 months | |||||
| IO Period: | 120 months | |||||
| Seasoning: | 1 month | Underwriting and Financial Information(5) | ||||
| Prepayment Provisions(2)(3): | L(25),D(88),O(7) | UW NOI: | $28,956,844 | |||
| Lockbox/Cash Mgmt Status: | Hard/Springing | UW NOI Debt Yield(1): | 13.8% | |||
| Additional Debt Type(1): | Pari Passu | UW NOI Debt Yield at Maturity(1): | 13.8% | |||
| Additional Debt Balance(1): | $134,000,000 | UW NCF DSCR(1): | 4.17x | |||
| Future Debt Permitted (Type): | No (NAP) | Most Recent NOI: | $25,770,979 (4/30/2021 TTM) | |||
| Reserves(4) | 2nd Most Recent NOI: | $24,927,304 (12/31/2020) | ||||
| Type | Initial | Monthly | Cap | 3rd Most Recent NOI: | $28,744,950 (12/31/2019) | |
| RE Taxes: | $0 | Springing | NAP | Most Recent Occupancy: | 93.1% (6/3/2021) | |
| Insurance: | $0 | Springing | NAP | 2nd Most Recent Occupancy: | 90.4% (12/31/2020) | |
| Replacement Reserve: | $0 | Springing | $265,968 | 3rd Most Recent Occupancy: | 93.5% (12/31/2019) | |
| TI/LC Reserve: | $0 | Springing | $2,659,584 | Appraised Value (as of): | $452,000,000 (5/10/2021) | |
| Major Tenant Reserve: | $0 | Springing | $4,020,000 | Appraised Value PSF: | $509.86 | |
| Outstanding TI/LC Reserve: | $6,565,265 | $0 | NAP | Cut-off Date LTV Ratio(1): | 46.5% | |
| Gap Rent Reserve: | $347,023 | $0 | NAP | Maturity Date LTV Ratio(1): | 46.5% | |
| Sources and Uses | ||||||
| Sources | Proceeds | % of Total | Uses | Proceeds | % of Total | |
| Whole Loan Amount(1): | $210,000,000 | 100.0% | Loan Payoff: | $175,106,561 | 83.4% | |
| Return of Equity: | $33,823,051 | 16.1% | ||||
| Closing Costs: | $1,070,388 | 0.5% | ||||
| Total Sources: | $210,000,000 | 100.0% | Total Uses: | $210,000,000 | 100.0% | |
| (1) | The Domain Mortgage Loan (as defined below) is part of The Domain Whole Loan (as defined below), which is evidenced by four pari passu promissory notes with an aggregate principal balance of $210,000,000. The Cut-off Date Balance PSF, Maturity Date Balance PSF, UW NOI Debt Yield, UW NOI Debt Yield at Maturity, UW NCF DSCR, Cut-off Date LTV Ratio and Maturity Date LTV Ratio numbers presented above are based on the aggregate principal balance of the promissory notes comprising The Domain Whole Loan. |
| (2) | Defeasance of The Domain Whole Loan is permitted at any time after the earlier to occur of (a) the end of the two-year period commencing on the closing date of the securitization of the last portion of The Domain Whole Loan to be securitized and (b) January 1, 2025. The assumed prepayment lockout period of 25 payments is based on the closing date of this transaction in August 2021. |
| (3) | Partial defeasance is permitted in connection with a partial release. See “Release of Parcel” below. |
| (4) | See “Escrows and Reserves” below for further discussion of reserve information. |
| (5) | The novel coronavirus pandemic is an evolving situation and could impact The Domain Whole Loan more severely than assumed in the underwriting of The Domain Whole Loan and could adversely affect the NOI, NCF and occupancy information, as well as the appraised value and the DSCR, LTV and Debt Yield metrics presented above and herein. See “Risk Factors-—Risks Related to Market Conditions and Other External Factors—The Coronavirus Pandemic Has Adversely Affected the Global Economy and Will Likely Adversely Affect the Performance of the Mortgage Loans” in the prospectus. |
The Mortgage Loan. The second largest mortgage loan (“The Domain Mortgage Loan”) is part of a whole loan (“The Domain Whole Loan”) evidenced by four pari passu promissory notes in the aggregate original principal amount of $210,000,000, which is secured by a first priority fee mortgage encumbering an 886,526 SF open-air retail and office development located in Austin, Texas (“The Domain Property”). The Domain Whole Loan was co-originated by Bank of America, N.A. and Goldman Sachs Bank USA. The Domain Mortgage Loan is evidenced by the controlling Note A-1 and the non-controlling Note A-2-2 with an aggregate original principal amount of $76,000,000. The remaining promissory notes comprising The Domain Whole Loan (“The Domain Serviced Pari Passu Companion Loans”) are summarized in the below table. The Domain Whole Loan will be serviced pursuant to the pooling and servicing agreement for the BANK 2021-BNK35 securitization trust. See “Description of the Mortgage Pool—The Whole Loans—The Serviced Pari Passu Whole Loans”, and “Pooling and Servicing Agreement” in the prospectus.
| This is not a research report and was not prepared by any Underwriter’s research department. Please see additional important information and qualifications at the end of this Term Sheet. |
48
| Retail - Anchored | Loan #2 | Cut-off Date Balance: | $76,000,000 | |
| 11410 Century Oaks Terrace | The Domain | Cut-off Date LTV: | 46.5% | |
| Austin, TX 78758 | UW NCF DSCR: | 4.17x | ||
| UW NOI Debt Yield: | 13.8% |
| The Domain Whole Loan Summary | ||||
Note | Original Balance | Cut-off Date Balance | Note Holder | Controlling Piece |
| A-1 | $68,000,000 | $68,000,000 | BANK 2021-BNK35 | Yes |
| A-2-1 | $50,000,000 | $50,000,000 | MSC 2021-L6 | No |
| A-2-2 | $8,000,000 | $8,000,000 | BANK 2021-BNK35 | No |
| A-3 | $84,000,000 | $84,000,000 | Goldman Sachs Bank USA | No |
| Total | $210,000,000 | $210,000,000 | ||
The Borrowers and the Borrower Sponsor. The borrowers are The Domain Mall, LLC and The Domain Mall II, LLC, each a Delaware limited liability company structured to be bankruptcy-remote with at least two independent directors.
The borrower sponsor and non-recourse carveout guarantor is Simon Property Group, L.P. (“Simon”). Simon’s liability is limited to 15% ($31,500,000) of the original principal amount of The Domain Whole Loan, plus all reasonable out-of-pocket costs and expenses incurred in the enforcement of the guaranty or preservation of the lender’s rights under the guaranty. Simon owns shopping, dining, entertainment and mixed-use destinations, with properties across North America, Europe and Asia. Simon is an S&P 100 company, publicly traded under the ticker SPG, and rated A3/A- by Moody’s/S&P. As of March 31, 2021, Simon owned or held an interest in 202 properties in 37 U.S. states and Puerto Rico, including 98 malls, 69 Premium Outlet branded centers, 14 Mills branded centers, 4 lifestyle centers and 17 other retail properties, along with 31 Premium Outlets and Designer Outlet branded properties primarily located in Asia, Europe and Canada. Simon also owns an 80% non-controlling interest in the Taubman Realty Group, LLC, which has an interest in 24 regional, super-regional, and outlet malls in the United States and Asia.
Simon developed The Domain Property in 2007, expanded it in 2010, and spent approximately $14.3 million on renovations between 2015-2018, consisting of a common area redesign, enhancement of landscaping, signage and lighting, and upgrades to the IPIC Theatre.
The Property. The Domain Property is an 886,526 SF Class A anchored retail development consisting of 730,285 SF of retail space and 156,241 SF of office space within the larger Domain development (“The Domain”). The Domain Property is 93.1% occupied by 127 retail and office tenants. The retail component at The Domain Property consists of two phases, Domain I and Domain II. Domain I, which is anchored by Macy’s (not collateral for The Domain Whole Loan) and the only Neiman Marcus in the Austin area, is tenanted by upscale retailers and sit-down restaurants. Domain II, which is anchored by Dillard’s (not collateral for The Domain Whole Loan) and Dick’s Clothing & Sporting Goods, is tenanted by a variety of mid-market retailers and service establishments. Further, almost half of the retail stores at The Domain Property are exclusive within the Austin market. The Domain Property is a live-work-play development, featuring a park-like setting containing four children’s play areas and The Lawn, a dynamic green space covered by a cable LED-lit overhead structure that hosts entertainment, concerts and other activities. The Domain is a multi-phase development consisting of The Domain Property, over 800 residential units in two buildings and four on-site hotels. The portions of the retail spaces located in the two residential buildings are subject to condominium regimes whereby the related condominium association governs the management, repair, replacement and maintenance of the common areas in the related condominium. The borrowers have a 50% voting interest in each condominium regime.
The Domain Property has a granular rent roll, with no tenant occupying more than 9.1% of the net rentable area or accounting for more than 6.9% of underwritten base rent. As of June 3, 2021, The Domain Property was 93.1% leased. The largest tenants by base rent include Hanger Orthopedic Group, Inc, Forever 21, H&M, IPIC Theaters and Dick’s Clothing & Sporting Goods, with no other tenant representing more than 2.5% of underwritten base rent. Overall inline property sales for tenants who report at The Domain Property increased 17.3% from 2018 to 2019 to $625 PSF. Sales declined in 2020 as The Domain Property was closed between March 18 and May 1, 2020 due to COVID-19 restrictions. However, as of the trailing 12 month period ending April 30, 2021, sales have increased by 11.5% over the 2020 figure of $496 PSF to $553 PSF.
The following table contains inline sales history for The Domain Property:
| Inline Sales History(1) | |||||
| 2018 | 2019 | 2020(2) | 3/31/2021 TTM | 4/30/2021 TTM | |
| Sales PSF (Inline < 10,000 SF) | $533 | $625 | $496 | $515 | $553 |
| Occupancy Cost (Inline < 10,000 SF) | 13.2% | 12.5% | 15.2% | 15.4% | 14.6% |
| (1) | Information is as of April 30, 2021, as provided by the borrower sponsor, and only includes tenants reporting sales. |
| (2) | The Domain Property was closed between March 18 and May 1, 2020 due to COVID-19 restrictions. |
| This is not a research report and was not prepared by any Underwriter’s research department. Please see additional important information and qualifications at the end of this Term Sheet. |
49
| Retail - Anchored | Loan #2 | Cut-off Date Balance: | $76,000,000 | |
| 11410 Century Oaks Terrace | The Domain | Cut-off Date LTV: | 46.5% | |
| Austin, TX 78758 | UW NCF DSCR: | 4.17x | ||
| UW NOI Debt Yield: | 13.8% |
The following table contains anchor and major tenant sales history for The Domain Property:
| Major Tenant Sales History(1) | ||||||
| Tenant | SF | 2018 | 2019 | 2020(2) | 4/30/2021 TTM | Sales PSF/Screen(3) |
| Dillard’s (Non-collateral) | 206,308 | $21,293,049 | $21,503,483 | $18,208,744 | NAV | $88 |
| Macy’s (Non-collateral) | 140,000 | $23,800,000 | $23,600,000 | NAV | NAV | $169 |
| Dick’s Clothing & Sporting Goods | 80,400 | $11,019,624 | $10,477,728 | $14,159,244 | $12,761,088 | $159 |
| Neiman Marcus | 80,000 | $40,045,600 | $45,960,800 | $31,453,600 | $35,256,663 | $441 |
| IPIC Theaters | 37,321 | $6,199,018 | $5,398,109 | $1,566,362 | $1,109,180 | $138,648 |
| Forever 21 | 31,691 | $7,145,370 | $6,374,328 | $4,444,346 | $5,992,451 | $189 |
| H&M | 24,065 | $7,351,598 | $8,110,963 | $5,065,562 | $6,110,532 | $254 |
| (1) | Information is as of April 30, 2021, as provided by the borrower sponsor. |
| (2) | The Domain Property was closed between March 18 and May 1, 2020 due to COVID-19 restrictions. On May 1, 2020, IPIC Theaters opened at limited capacity, on June 3, 2020 it began operating at 50% capacity and starting June 11, 2020 it fully re-opened. |
| (3) | Sales PSF/Screen are based on 2020 sales for Dillard’s and 2019 sales for Macy’s, and 4/30/2021 TTM for all other tenants. Macy’s is not required to report sales and their sales shown above are estimates. Dillard’s is only required to report sales annually. |
Major Tenants.
Dick’s Clothing & Sporting Goods (80,400 SF, 9.1% of NRA, 2.9% of underwritten base rent). Dick’s Clothing & Sporting Goods (“Dick’s”), founded in 1948, is a leading sporting goods retailer offering sports equipment, apparel, footwear and accessories in 847 stores across the United States. Dick’s occupies its own building at Domain II on a lease that expires in January 2025, with no renewal options. Dick’s is currently paying an annual rent of $9.70 PSF, with no remaining rent increases. Sales for Dick’s at The Domain Property were reported at $137 PSF, $130 PSF, $176 PSF and $159 PSF for 2018, 2019, 2020, and 4/30/2021 TTM, respectively.
Neiman Marcus (80,000 SF, 9.0% of NRA, 1.1% of underwritten base rent). Neiman Marcus is a privately-owned luxury department store retailer that operates 43 namesake Neiman Marcus stores, two Bergdorf Goodman full-line stores and 10 Last Call clearance centers. Neiman Marcus owns its improvements and is subject to a ground lease at Domain I that expires in March 2027, with four 5-year renewal options upon at least 14-months’ prior written notice. Neiman Marcus is currently paying annual ground rent of $3.87 PSF with no rent increases along with 2.5% of gross sales in excess of $15,000,000 (an additional $6.33 PSF based on 4/30/2021 TTM sales). Sales for Neiman Marcus at The Domain Property were reported at $501 PSF, $575 PSF, $393 PSF and $441 PSF for 2018, 2019, 2020, and 4/30/2021 TTM, respectively.
Hanger Orthopedic Group, Inc (77,694 SF, 8.8% of NRA, 6.9% of underwritten base rent). Headquartered at The Domain Property, Hanger Orthopedic Group, Inc. (“Hanger”) is a publicly-traded (NYSE: HNGR) provider of orthotic and prosthetic services and products, with nearly 5,000 employees and 800 Hanger Clinic locations across the United States. Hanger is the largest domestic provider of healthcare services enabling human mobility. Hanger has occupied 77,694 SF of office space at Domain I since 2010 on a lease that expires in July 2023, with two 5-year renewal options upon at least 9-months’ prior written notice. Hanger is currently paying annual rent of $23.25 PSF, with annual rent increases of $0.75 PSF.
IPIC Theaters (37,321 SF, 4.2% of NRA, 3.1% of underwritten base rent). Established in 2010, IPIC Theaters is a luxury restaurant-and-movie theater brand with boutique theaters featuring chef-driven menus, bars and lounges. IPIC Theaters has 15 locations across the United States. IPIC Theaters occupies 37,321 SF at Domain II on a lease that expires in January 2031, with three 5-year renewal options upon at least 6-months’ prior written notice. IPIC Theaters is currently paying annual rent of $21.00 PSF, with 4.7%-5.5% increases every 5 years. Sales for IPIC Theaters at The Domain Property were reported at $774,877 per screen, $674,764 per screen, $195,795 per screen and $138,648 per screen for 2018, 2019, 2020, and 4/30/2021 TTM, respectively.
Forever 21 (31,691 SF, 3.6% of NRA, 3.8% of underwritten base rent). Founded in 1984, Forever 21 is an American fast fashion retailer that sells accessories, beauty products, home goods and clothing. Forever 21 occupies 31,691 SF at Domain I on a lease that expires in January 2023, with no renewal options. Forever 21 does not pay base rent, but pays 17.14% of gross sales ($32.41 PSF based on 4/30/2021 TTM sales). Sales for Forever 21 at The Domain Property were reported at $225 PSF, $201 PSF, $140 PSF and $189 PSF for 2018, 2019, 2020, and 4/30/2021 TTM, respectively.
H&M (24,065 SF, 2.7% of NRA, 3.2% of underwritten base rent). H&M is a Swedish global apparel company with a family of brands and businesses in 74 markets. H&M occupies 24,065 SF at Domain I on a lease that expires in January 2023, with one 5-year renewal option upon at least 180-days’ prior written notice. H&M is currently paying annual rent of $35.30 PSF, which steps to $36.00 PSF for the remaining lease term. Sales for H&M at The Domain Property were reported at $305 PSF, $337 PSF, $210 PSF and $254 PSF for 2018, 2019, 2020, and 4/30/2021 TTM, respectively.
| This is not a research report and was not prepared by any Underwriter’s research department. Please see additional important information and qualifications at the end of this Term Sheet. |
50
| Retail - Anchored | Loan #2 | Cut-off Date Balance: | $76,000,000 | |
| 11410 Century Oaks Terrace | The Domain | Cut-off Date LTV: | 46.5% | |
| Austin, TX 78758 | UW NCF DSCR: | 4.17x | ||
| UW NOI Debt Yield: | 13.8% |
The following table presents certain information relating to the major tenants at The Domain Property:
| Tenant Summary(1) | ||||||||||||
| 4/30/2021 TTM Sales | ||||||||||||
| Tenant Name | Tenant Type | Credit Rating (Fitch/ Moody’s/ S&P)(2) | Tenant SF | Approx % of SF | Annual UW Rent(3) | % of Total Annual UW Rent(3) | Annual UW Rent PSF(3) | $ | PSF / Screen | Occ. Cost % | Lease Exp. | Term. Options |
| Dick’s Clothing & Sporting Goods | Retail – Anchor | NR/NR/NR | 80,400 | 9.1% | $779,880 | 2.9% | $9.70 | $12,761,088 | $159 | 10.5% | 1/31/2025 | N |
| Neiman Marcus | Retail – Anchor | NR/NR/NR | 80,000 | 9.0% | $310,000 | 1.1% | $3.87 | $35,256,663 | $441 | 3.9% | 3/8/2027 | N |
| Hanger Orthopedic Group, Inc | Office | NR/B1/B+ | 77,694 | 8.8% | $1,864,656 | 6.9% | $24.00 | NAP | NAP | NAP | 7/31/2023 | N |
| IPIC Theaters(4) | Retail – Major | NR/NR/NR | 37,321 | 4.2% | $843,456 | 3.1% | $22.60 | $5,398,109 | $674,764 | 15.6% | 1/31/2031 | N |
| Forever 21 | Retail – Major | NR/NR/NR | 31,691 | 3.6% | $1,024,709 | 3.8% | $32.33 | $5,992,451 | $189 | 17.1% | 1/31/2023 | N |
| H&M | Retail – Major | NR/NR/BBB | 24,065 | 2.7% | $866,442 | 3.2% | $36.00 | $6,110,532 | $254 | 16.3% | 1/31/2023 | N |
| Subtotal/Wtd. Avg. | 331,171 | 37.4% | $5,689,143 | 21.0% | $17.18 | |||||||
| Other Retail Tenants | 417,959 | 47.1% | $18,248,423 | 67.3% | $43.66 | |||||||
| Other Office Tenants | 76,071 | 8.6% | $3,175,428 | 11.7% | $41.74 | |||||||
| Vacant Retail | 58,849 | 6.6% | $0 | 0.0% | $0.00 | |||||||
| Vacant Office | 2,476 | 0.3% | $0 | 0.0% | $0.00 | |||||||
| Total/Wtd. Avg.(5) | 886,526 | 100.0% | $27,112,994 | 100.0% | $32.86 | |||||||
| Non-Collateral Anchors(6) | ||||||||||||
| Dillard’s | Retail – Anchor | BB/Baa3/BB- | 206,308 | $18,208,744 | $88 | |||||||
| Macy’s | Retail – Anchor | BB/Ba3/B+ | 140,000 | $23,600,000 | $169 | |||||||
| (1) | Information is based on the underwritten rent roll dated June 3, 2021. |
| (2) | Certain ratings are those of the parent company whether or not the parent guarantees the lease. |
| (3) | Annual UW Rent, % of Total Annual UW Rent and Annual UW Rent PSF include percent in lieu. In addition to the rent shown in the table above, Neiman Marcus pays 2.5% of gross sales in excess of $15,000,000, which equates to an additional $6.33 PSF based on 4/30/2021 TTM sales. Rent shown above for Forever 21 reflects percent in lieu of 17.14% of gross sales based on 4/30/2021 TTM sales. |
| (4) | Sales shown for IPIC Theaters are based on 2019 sales, prior to the COVID-19 pandemic. IPIC Theaters was closed between March 18 and May 1, 2020. After May 1, 2020, the theater opened at limited capacity, on June 3, 2020 it began operating at 50% capacity and starting June 11, 2020, it fully re-opened. Total sales for 4/30/2021 TTM are $1,109,180, which equates to $138,648 per screen and a 102.7% occupancy cost. |
| (5) | Total/Wtd. Avg. Annual UW Rent PSF excludes vacant space. |
| (6) | Sales $ and Sales PSF/Screen are based on 2020 sales for Dillard’s and 2019 sales for Macy’s. Macy’s is not required to report sales and their sales shown above are estimates. Dillard’s is only required to report sales annually. |
The following table presents certain information relating to the lease rollover schedule at The Domain Property:
| Lease Rollover Schedule(1)(2) | ||||||||
| Year | # of Leases Rolling | SF Rolling | UW Rent PSF Rolling(3) | Approx. % of Total SF Rolling | Approx. Cumulative % of SF Rolling | Total UW Rent Rolling(3) | Approx. % of Total Rent Rolling | Approx. Cumulative % of Total Rent Rolling |
| MTM/2021 | 6 | 7,598 | $56.04 | 0.9% | 0.9% | $425,767 | 1.6% | 1.6% |
| 2022 | 10 | 45,859 | $47.53 | 5.2% | 6.0% | $2,179,753 | 8.0% | 9.6% |
| 2023 | 25 | 213,631 | $34.43 | 24.1% | 30.1% | $7,354,290 | 27.1% | 36.7% |
| 2024 | 15 | 72,675 | $34.17 | 8.2% | 38.3% | $2,483,271 | 9.2% | 45.9% |
| 2025 | 11 | 121,743 | $20.87 | 13.7% | 52.1% | $2,540,534 | 9.4% | 55.3% |
| 2026 | 9 | 49,369 | $40.93 | 5.6% | 57.6% | $2,020,476 | 7.5% | 62.7% |
| 2027 | 16 | 139,503 | $23.82 | 15.7% | 73.4% | $3,323,291 | 12.3% | 75.0% |
| 2028 | 13 | 32,913 | $70.78 | 3.7% | 77.1% | $2,329,677 | 8.6% | 83.6% |
| 2029 | 6 | 24,240 | $46.73 | 2.7% | 79.8% | $1,132,774 | 4.2% | 87.7% |
| 2030 | 2 | 17,415 | $34.38 | 2.0% | 81.8% | $598,736 | 2.2% | 90.0% |
| 2031 | 11 | 88,507 | $26.85 | 10.0% | 91.8% | $2,376,563 | 8.8% | 98.7% |
| 2032 & Beyond | 5 | 11,748 | $29.61 | 1.3% | 93.1% | $347,862 | 1.3% | 100.0% |
| Vacant | 0 | 61,325 | $0.00 | 6.9% | 100.0% | $0 | 0.0% | 100.0% |
| Total/Wtd. Avg.(4) | 129 | 886,526 | $32.86 | 100.0% | $27,112,994 | 100.0% | ||
| (1) | Information is based on the underwritten rent roll dated June 3, 2021. |
| (2) | Certain tenants may have lease termination options that are exercisable prior to the originally stated expiration date of the subject lease and that are not considered in the Lease Rollover Schedule. |
| (3) | UW Rent PSF Rolling and Total UW Rent Rolling include percent in lieu. |
| (4) | Total/Wtd. Avg. UW Rent PSF Rolling excludes vacant space. |
| This is not a research report and was not prepared by any Underwriter’s research department. Please see additional important information and qualifications at the end of this Term Sheet. |
51
| Retail - Anchored | Loan #2 | Cut-off Date Balance: | $76,000,000 | |
| 11410 Century Oaks Terrace | The Domain | Cut-off Date LTV: | 46.5% | |
| Austin, TX 78758 | UW NCF DSCR: | 4.17x | ||
| UW NOI Debt Yield: | 13.8% |
COVID-19 Update. The first debt service payment on The Domain Whole Loan is due in August 2021 and, as of June 16, 2021, The Domain Whole Loan is not subject to any forbearance, modification or debt service relief request. As of June 11, 2021, the borrower sponsor has reported that 99% of the expected June 2021 rent payments were received. Rents for open and billed tenants, which may or may not include percent in lieu rent tenants, were adjusted for active amendments, bankruptcies, write-offs and tenant credits. Given the timing of collections and reporting, the final rents collected in May may be understated. The Domain Property was closed between March 18 and May 1, 2020 due to COVID-19 restrictions. Additionally, the borrower sponsor has leased over 64,000 SF of space to more than 15 tenants over the past six months.
The Market. The Domain Property is located in Austin, Texas, 10 miles north of downtown Austin, at the confluence of US Highway 183, Mopac Expressway (Loop 1) and Capital of Texas Highway (Loop 360), and adjacent to the Capital Metro Kramer Station rail stops, which connects to downtown Austin. According to the appraisal, prior to the onset of the COVID-19 pandemic, Austin’s job growth outpaced the national average, with high-wage jobs growing at twice the national pace, and unemployment reached a low of 2.5%. As a result of the COVID-19 pandemic, in April 2020, the unemployment rate grew to 12.2%; however, by August 2020, the unemployment rate had dropped back down to 5.5%, significantly below the Texas and United States unemployment rates. Austin is home to the headquarters of Dell and Whole Foods Market, and a center for high technology, with the tech sector driving Austin’s economic recovery. Within the immediate vicinity of The Domain Property, office users include high-tech companies such as Amazon, HomeAway, Indeed, IBM, Apple, Oracle and National Instruments.
According to the appraisal, The Domain Property’s primary trade area encompasses a 10.0-mile radius, with the secondary trade area spanning 15.0 miles. The estimated 2020 population within a 5-, 10- and 15-mile radius of The Domain Property was 308,235, 907,661 and 1,439,271, respectively. The estimated 2020 average household income within the same radii was $100,262, $111,800 and $111,351, respectively, above the United States national average of $90,941.
The following table presents information regarding certain competitive properties to The Domain Property:
| Competitive Property Summary | |||||||
Property Address |
Type | Year Built / Renovated |
Size (SF) | Occupancy | Sales PSF(2) | Anchor Tenants | Distance From Subject |
The Domain 11410 Century Oaks Terrace Austin, TX | Lifestyle Center | 2007 / 2015-2018 | 886,526(1) | 93.1%(1) | $553 | Dillard’s, Macy’s, Dick’s, Neiman Marcus | NAP |
| Primary Competition | |||||||
Domain Northside 11700 Domain Boulevard Austin, TX | Lifestyle Center | 2016 / NAP | 618,000 | NAV | NAV | Nordstrom, Whole Foods | 0.0 mi |
The Arboretum 9853 Great Hills Trail Austin, TX | Lifestyle Center | 1994 / 2018 | 193,835 | 86% | $315 | Barnes & Noble, Pottery Barn | 1.3 mi |
| Secondary Competition | |||||||
Barton Creek Square(3) 2901 Capital of Texas Highway Austin, TX | Super-Regional Center/Mall | 1981 / 2013 | 1,430,122 | 92% | $480 | Dillard’s, JC Penney, Macy’s, Nordstrom | 11.0 mi |
Hill Country Galleria 12700 Hill Country Boulevard Bee Cave, TX | Lifestyle Center | 2007 / 2016 | 561,960 | 92% | $585 | Cinemark, Dick’s Sporting Goods, Dillard’s, Whole Foods | 14.0 mi |
Lakeline Mall(3) 11200 Lake Line Mall Drive Cedar Park, TX | Super-Regional Center/Mall | 1995 / 2008 | 1,099,420 | 94% | $290 | AMC Theatres, Dillard’s, JC Penney, Macy’s | 7.0 mi |
Round Rock Premium Outlets(3) 4401 North IH-35 Round Rock, TX | Outlet Center | 2006 / NAP | 488,689 | 94% | $375 | NAP | 12.0 mi |
Source: Appraisal, unless otherwise indicated.
| (1) | Information obtained from underwritten rent roll dated June 3, 2021. |
| (2) | Sales PSF represents pre-COVID-19 levels for competitive properties. For The Domain Property, information is as of April 30, 2021, as provided by the borrower sponsor, and only includes tenants reporting sales. |
| (3) | Owned and operated by the borrower sponsor. |
The following table presents certain information relating to the appraisal’s market rent conclusions for The Domain Property:
| Market Rent Summary | |||
| Market Rent (PSF) | Lease Term (Yrs) | Rental Increase Projection | |
| Inline - Domain I | $39.03 | 7 | 2% per year |
| Inline – Domain II | $20.69 | 7 | 2% per year |
| Anchors | $7.00 | 10 | 10% every 5 yrs |
| Majors | $25.00 | 10 | 10% every 5 yrs |
| Outparcels | $40.00 | 10 | 10% every 5 yrs |
| Office | $32.00 | 5 | 3% per year |
| This is not a research report and was not prepared by any Underwriter’s research department. Please see additional important information and qualifications at the end of this Term Sheet. |
52
| Retail - Anchored | Loan #2 | Cut-off Date Balance: | $76,000,000 | |
| 11410 Century Oaks Terrace | The Domain | Cut-off Date LTV: | 46.5% | |
| Austin, TX 78758 | UW NCF DSCR: | 4.17x | ||
| UW NOI Debt Yield: | 13.8% |
Operating History and Underwritten Net Cash Flow. The following table presents certain information relating to the historical operating performance and Underwritten Net Cash Flow at The Domain Property:
| Cash Flow Analysis | ||||||
| 2018 | 2019 | 2020(1) | 4/30/2021 TTM(1) | UW | UW PSF | |
| Gross Potential Rent(2) | $26,615,478 | $28,277,646 | $26,068,015 | $27,052,137 | $31,489,947 | $35.52 |
| Reimbursements | $18,014,114 | $18,023,323 | $13,044,082 | $12,764,985 | $15,284,221 | $17.24 |
| Other Income(3) | $2,133,463 | $2,347,787 | $1,613,890 | $1,535,577 | $1,433,012 | $1.62 |
| Vacancy and Credit Loss | ($174,949) | ($458,233) | ($4,250,737) | ($4,335,775) | ($3,036,993) | ($3.43) |
| Effective Gross Income | $46,588,106 | $48,190,523 | $36,475,250 | $37,016,924 | $45,170,187 | $50.95 |
| Taxes | $10,801,081 | $10,187,493 | $4,921,023 | $4,697,381 | $8,846,924 | $9.98 |
| Insurance | $332,136 | $333,222 | $341,837 | $340,369 | $314,271 | $0.35 |
| Other Operating Expenses | $8,354,943 | $8,924,858 | $6,285,086 | $6,208,195 | $7,052,148 | $7.95 |
| Total Operating Expenses | $19,488,160 | $19,445,573 | $11,547,946 | $11,245,945 | $16,213,342 | $18.29 |
| Net Operating Income | $27,099,946 | $28,744,950 | $24,927,304 | $25,770,979 | $28,956,844 | $32.66 |
| TI/LC | $0 | $0 | $0 | $0 | $1,329,789 | $1.50 |
| CapEx | $0 | $0 | $0 | $0 | $132,979 | $0.15 |
| Net Cash Flow | $27,099,946 | $28,744,950 | $24,927,304 | $25,770,979 | $27,494,076 | $31.01 |
| Occupancy % | 93.3% | 93.5% | 90.4% | 93.1%(4) | 93.5% | |
| NOI DSCR(5) | 4.11x | 4.36x | 3.78x | 3.91x | 4.40x | |
| NCF DSCR(5) | 4.11x | 4.36x | 3.78x | 3.91x | 4.17x | |
| NOI Debt Yield(5) | 12.9% | 13.7% | 11.9% | 12.3% | 13.8% | |
| NCF Debt Yield(5) | 12.9% | 13.7% | 11.9% | 12.3% | 13.1% | |
| (1) | The Domain Property was closed between March 18 and May 1, 2020 due to COVID-19 restrictions. |
| (2) | UW Gross Potential Rent is based on the June 2021 rent roll with adjustments made for executed leases and tenants that have vacated or are expected to vacate after loan closing. UW Gross Potential Rent includes grossed up vacant space of $2,709,329, percent in lieu income for six tenants of $2,040,109 based on 4/30/2021 TTM sales, overage rent of $1,667,624, and contractual rent increases through June 2022 of $565,804. |
| (3) | Other Income consists of temporary tenant and specialty leasing income, ad panel revenue, storage space income, valet minimum rent, local media income and other miscellaneous income. |
| (4) | Occupancy % is as of 6/3/2021. |
| (5) | Debt service coverage ratios and debt yields are based on The Domain Whole Loan. |
Escrows and Reserves.
Real Estate Taxes – During a Reserve Trigger Period (as defined below) or at any time taxes are not paid by the borrowers prior to such payments becoming delinquent (or failing to provide the lender with evidence of such payment upon request), the borrowers are required to deposit monthly to a real estate tax reserve 1/12 of the annual estimated real estate taxes. However, Simon is permitted to provide a guaranty in lieu of deposits into the tax reserve account.
Insurance – Unless The Domain Property is covered by a blanket policy acceptable to the lender, during a Reserve Trigger Period, the borrowers are required to deposit monthly 1/12 of the annual estimated insurance premiums to the insurance reserve. However, Simon is permitted to provide a guaranty in lieu of deposits into the insurance reserve account.
Replacement Reserve – During a Reserve Trigger Period, the borrowers are required to deposit monthly $11,082 for replacements to The Domain Property, subject to a cap of $265,968 (except such cap will not apply during a Lockbox Event Period (as defined below)). However, Simon is permitted to provide a guaranty in lieu of deposits into the replacement reserve account.
TI/LC Reserve – During a Reserve Trigger Period, the borrowers are required to deposit monthly $110,816 for future tenant improvements and leasing commissions, subject to a cap of $2,659,584 (except such cap will not apply during a Lockbox Event Period). However, Simon is permitted to provide a guaranty in lieu of deposits into the TI/LC reserve account.
Major Tenant Reserve – During a Major Tenant Trigger Event (as defined below), the borrowers will be required to deposit $335,000 monthly, subject to a cap of $4,020,000. However, Simon is permitted to provide a guaranty in lieu of deposits into such reserve account.
Outstanding TI/LC Reserve – In lieu of the borrowers making a cash deposit in the amount of $6,565,265 into a reserve for outstanding tenant improvement and leasing obligations of the borrowers under existing tenant leases, at loan origination, Simon provided a guaranty in such amount in accordance with the terms of The Domain Whole Loan documents.
Gap Rent Reserve – In lieu of the borrowers making a cash deposit in the amount of $347,023 into a reserve for future rent credits or abatements under existing tenant leases, at loan origination, Simon provided a guaranty in such amount in accordance with the terms of The Domain Whole Loan documents.
| This is not a research report and was not prepared by any Underwriter’s research department. Please see additional important information and qualifications at the end of this Term Sheet. |
53
| Retail - Anchored | Loan #2 | Cut-off Date Balance: | $76,000,000 | |
| 11410 Century Oaks Terrace | The Domain | Cut-off Date LTV: | 46.5% | |
| Austin, TX 78758 | UW NCF DSCR: | 4.17x | ||
| UW NOI Debt Yield: | 13.8% |
A “Reserve Trigger Period” will (a) commence if the trailing four-quarter debt yield on The Domain Whole Loan is less than 10.0% (tested quarterly for two consecutive quarters) and (b) terminate when the trailing four-quarter debt yield on The Domain Whole Loan is greater than or equal to 10.0% (tested quarterly for two consecutive quarters).
A “Lockbox Event Period” will (a) commence upon (i) the occurrence of an event of default, (ii) any bankruptcy action by the borrowers, (iii) any bankruptcy action by the property manager if the property manager is an affiliate of the borrowers, or (iv) the trailing four-quarter debt yield on The Domain Whole Loan being less than 9.0% (tested quarterly for two consecutive quarters) and (b) terminate when (i) with respect to clause (a)(i), the lender accepts a cure of such event of default, (ii) with respect to clause (a)(ii), such period will not terminate, (iii) with respect to clause (a)(iii), the property manager is replaced within 60 days by a qualified manager or the bankruptcy action is discharged or dismissed within 90 days without any adverse consequences to The Domain Property or The Domain Whole Loan, (iv) with respect to clause (a)(iv), the trailing four-quarter debt yield on The Domain Whole Loan is greater than or equal to 9.0% (tested quarterly for two consecutive quarters). However, the borrowers may not cure a Lockbox Event Period more than five times during the term of The Domain Whole Loan.
A “Major Tenant Trigger Event” will commence upon the earliest to occur of: a Major Tenant (as defined below) (i) files or is the subject of any bankruptcy proceeding, (ii) “goes dark” or vacates its leased premises on a permanent basis, (iii) gives notice that it will not be renewing its lease, or (iv) 6 months prior to the Major Tenant’s lease expiration date; and will continue: in the case of clause (i), until such Major Tenant has assumed and any applicable bankruptcy court has affirmed such assumption of the applicable Major Tenant’s lease; in the case of clause (ii), the Major Tenant is continuously operating at The Domain Property for at least 30 consecutive days and paying full rent; or in the case of clauses (iii) and (iv), the date on which the Major Tenant renews its lease or at least 50% of the space has been leased to new tenants.
A “Major Tenant” means Neiman Marcus and Dick’s.
Lockbox and Cash Management. The Domain Whole Loan is structured with a hard lockbox and springing cash management. All rents from The Domain Property are required to be deposited directly to the lockbox account and so long as a Lockbox Event Period is not continuing, funds in the lockbox account will be transferred to the borrowers’ operating account. During a Lockbox Event Period, the borrowers will not have access to the funds in the lockbox account and such funds will be transferred weekly to the lender-controlled cash management account and disbursed according to The Domain Whole Loan documents. During a Lockbox Event Period, all excess cash is required to be held by the lender as additional security for The Domain Whole Loan.
Additional Secured Indebtedness (not including trade debts). The Domain Property also secures The Domain Serviced Pari Passu Companion Loans, which have an aggregate Cut-off Date principal balance of $134,000,000. The Domain Serviced Pari Passu Companion Loans accrue interest at the same rate as The Domain Mortgage Loan. The Domain Mortgage Loan and The Domain Serviced Pari Passu Companion Loans are pari passu in right of payment. The holders of The Domain Mortgage Loan and The Domain Serviced Pari Passu Companion Loans have entered into a co-lender agreement which sets forth the allocation of collections on The Domain Whole Loan. See “Description of the Mortgage Pool—The Whole Loans—The Serviced Pari Passu Whole Loans” in the prospectus.
Mezzanine Loan and Preferred Equity. Not permitted.
Release of Parcel. Upon an Anchor Tenant Release Event (as defined below), the borrowers will be permitted to obtain the release of any of the related Anchor Tenant (as defined below) premises (each, a “Release Parcel”) in connection with a transfer of the related Release Parcel, upon satisfaction of certain conditions, including the following: (i) no event of default exists, (ii) certain Simon related entities maintain control of the borrowers, (iii) the borrowers defease The Domain Whole Loan in an amount equal to the greater of (x) the net sales proceeds from the sale of such Release Parcel and (y) the Release Parcel Price (as defined below), (iv) after giving effect to the release, the debt yield with respect to the remaining collateral must be at least equal to the greater of (x) 9.0% and (y) the debt yield for The Domain Property (including the Release Parcel(s)) for the twelve calendar months preceding the calendar quarter most recently completed prior to release, (v) if the Release Parcel is conveyed to an affiliate of the borrowers, certain anti-poaching provisions are satisfied, (vi) the borrowers deliver a REMIC opinion, and (vii) if required by the lender, rating agency confirmation is received.
“Anchor Tenant Release Event” means if (i) any Anchor Tenant “goes dark”, vacates or ceases to occupy its respective premises, (ii) any Anchor Tenant rejects its respective lease at The Domain Property in a bankruptcy action or proceeding, (iii) any Anchor Tenant otherwise vacates (on a permanent basis) its premises during the term of The Domain Whole Loan, or (iv) any Anchor Tenant’s respective lease at the property is terminated or expires.
“Anchor Tenant” means each of Dick’s, IPIC Theaters, Diamond’s Direct and any replacement tenant occupying all or substantially all of the space previously demised to any of such Anchor Tenants.
The “Release Parcel Price” means, (i) $3,047,500 for Dick’s, (ii) $4,059,500 for IPIC Theaters, or (iii) $218,500 for Diamond’s Direct, each representing 115% of the allocated loan amount of the related Release Parcel.
Right of First Offer/Right of First Refusal. None.
Ground Lease. None.
Letter of Credit. None.
Terrorism Insurance. The borrowers are required to obtain and maintain property insurance that covers perils and acts of terrorism and is required to obtain and maintain business interruption insurance for 18 months plus a 365-day extended period of indemnity; provided that, if the Terrorism Risk Insurance Program Reauthorization Act of 2015 is not in effect and such policies contain an exclusion for acts of terrorism, the borrowers will only be required to pay for terrorism insurance a maximum of two times the annual insurance premiums payable for The Domain Property at the time with respect to the property and business interruption policies (excluding the wind, flood and earthquake components of such premiums) on a stand-alone basis. See “Risk Factors—Risks Relating to the Mortgage Loans—Terrorism Insurance May Not Be Available for All Mortgaged Properties” in the prospectus.
| This is not a research report and was not prepared by any Underwriter’s research department. Please see additional important information and qualifications at the end of this Term Sheet. |
54
(THIS PAGE INTENTIONALLY LEFT BLANK)
| This is not a research report and was not prepared by any Underwriter’s research department. Please see additional important information and qualifications at the end of this Term Sheet. |
55
| Office - CBD | Loan #3 | Cut-off Date Balance: | $55,000,000 | |
| 150 M Street Northeast | Four Constitution Square | Cut-off Date LTV: | 45.2% | |
| Washington, D.C. 20002 | UW NCF DSCR: | 4.54x | ||
| UW NOI Debt Yield: | 11.8% |

| This is not a research report and was not prepared by any Underwriter’s research department. Please see additional important information and qualifications at the end of this Term Sheet. |
56
| Office - CBD | Loan #3 | Cut-off Date Balance: | $55,000,000 | |
| 150 M Street Northeast | Four Constitution Square | Cut-off Date LTV: | 45.2% | |
| Washington, D.C. 20002 | UW NCF DSCR: | 4.54x | ||
| UW NOI Debt Yield: | 11.8% |
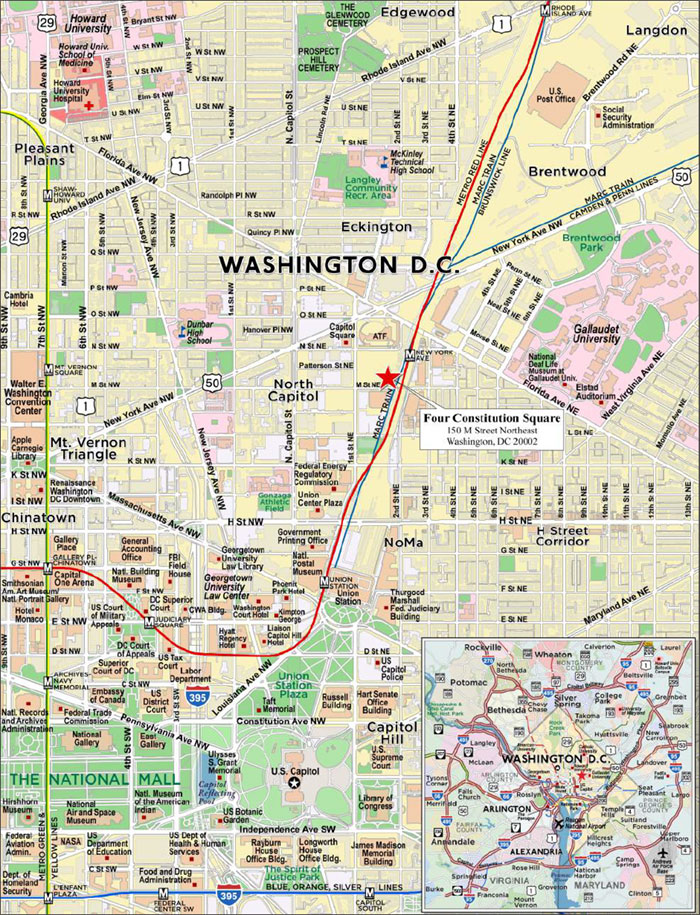
| This is not a research report and was not prepared by any Underwriter’s research department. Please see additional important information and qualifications at the end of this Term Sheet. |
57
| Mortgage Loan No. 3 – Four Constitution Square |
| Mortgage Loan Information | Property Information | |||||
| Mortgage Loan Seller: | BANA | Single Asset/Portfolio: | Single Asset | |||
| Credit Assessment (DBRSM/Fitch/S&P): | AAA/BBBsf/NR | Location: | Washington, D.C. 20002 | |||
| Original Balance(1): | $55,000,000 | General Property Type: | Office | |||
| Cut-off Date Balance(1): | $55,000,000 | Detailed Property Type: | CBD | |||
| % of Initial Pool Balance: | 3.9% | Title Vesting: | Fee | |||
| Loan Purpose: | Recapitalization | Year Built/Renovated: | 2018/NAP | |||
| Borrower Sponsor: | MetLife, Inc. and Norges Bank Investment | Size: | 493,620 SF | |||
| Management | Cut-off Date Balance Per SF(1): | $279.57 | ||||
| Guarantor(2): | ConSquare Office Four Owner, LLC | Maturity Date/ARD Balance Per SF(1): | $279.57 | |||
| Mortgage Rate(3): | 2.5365% | Property Manager: | SC Property Management, LLC | |||
| Note Date: | 5/14/2021 | |||||
| First Payment Date: | 7/1/2021 | |||||
| Anticipated Repayment Date(3): | 11/1/2030 | |||||
| Maturity Date(3): | 10/1/2033 | |||||
| Original Term to Maturity/ARD(3): | 113 months | |||||
| Original Amortization Term: | 0 months | |||||
| IO Period: | 113 months | |||||
| Seasoning: | 2 months | |||||
| Prepayment Provisions: | L(26),D(84),O(3) | Underwriting and Financial Information(6) | ||||
| Lockbox/Cash Mgmt Status: | Hard/Springing | UW NOI: | $16,220,697 | |||
| Additional Debt Type(1): | Pari Passu | UW NOI Debt Yield: | 11.8% | |||
| Additional Debt Balance(1): | $83,000,000 | UW NOI Debt Yield at Maturity/ARD: | 11.8% | |||
| Future Debt Permitted (Type)(4): | Yes (Mezzanine) | UW NCF DSCR: | 4.54x | |||
| Most Recent NOI: | $17,466,974 (12/31/2020) | |||||
| 2nd Most Recent NOI: | $18,698,640 (12/31/2019) | |||||
| 3rd Most Recent NOI: | NAV | |||||
| Reserves(5) | Most Recent Occupancy: | 100.0% (8/1/2021) | ||||
| Type | Initial | Monthly | Cap | 2nd Most Recent Occupancy: | 100.0% (12/31/2020) | |
| RE Taxes: | $0 | Springing | NAP | 3rd Most Recent Occupancy: | 100.0% (12/31/2019) | |
| Insurance: | $0 | Springing | NAP | Appraised Value (as of)(7): | $305,000,000 (4/14/2021) | |
| Replacement Reserve: | $0 | Springing | $246,810 | Appraised Value Per SF(7): | $617.88 | |
| TI/LC Reserve: | $0 | Springing | (5) | Cut-off Date LTV Ratio(7): | 45.2% | |
| USDOJ Lump Sum Payment Reserve: | $0 | Springing | NAP | Maturity Date/ARD LTV Ratio(7): | 45.2% | |
| Sources and Uses | ||||||
| Sources | Proceeds | % of Total | Uses | Proceeds | % of Total | |
| Whole Loan Amount(1): | $138,000,000 | 100.0% | Return of Equity(8): | $133,576,114 | 96.8% | |
| Closing Costs: | $4,423,886 | 3.2% | ||||
| Total Sources: | $138,000,000 | 100.0% | Total Uses: | $138,000,000 | 100.0% | |
| (1) | The Four Constitution Square Mortgage Loan (as defined below) is part of the Four Constitution Square Whole Loan (as defined below), which is evidenced by two pari passu promissory notes with an aggregate principal balance of $138,000,000. The Cut-off Date Balance Per SF, Maturity Date/ARD Balance Per SF, UW NCF DSCR, UW NOI Debt Yield, UW NOI Debt Yield at Maturity/ARD, Cut-off Date LTV Ratio and Maturity Date/ARD LTV Ratio numbers presented above are based on the Four Constitution Square Whole Loan (as defined below). |
| (2) | There is no non-recourse carveout guarantor and no separate environmental indemnitor for the Four Constitution Square Whole Loan. While the borrower is obligated under the non-recourse carveout provisions, no separate guaranty was executed by the borrower. |
| (3) | The Four Constitution Square Whole Loan has an initial term of 113 months to the anticipated repayment date (“ARD”) of November 1, 2030, with a final maturity date of October 1, 2033. Prior to the ARD, the Four Constitution Square Whole Loan will accrue interest at a rate equal to the Initial Interest Rate (as defined below). From and after the ARD until the outstanding principal balance of the Four Constitution Square Whole Loan has been paid in full, or until the final maturity date on October 1, 2033, whichever event occurs first, the Four Constitution Square Whole Loan will accrue interest at a rate equal to the Extension Rate (as defined below), and all excess cash flow from the Four Constitution Square Whole Loan will be collected by the lender (see “The Mortgage Loan” below). |
| (4) | See “Subordinate and Mezzanine Indebtedness” section below. |
| (5) | See “Escrows and Reserves” section. |
| (6) | The novel coronavirus pandemic is an evolving situation and could impact the Four Constitution Square Whole Loan more severely than assumed in the underwriting of the Four Constitution Square Whole Loan. The pandemic and resulting economic disruption could also adversely affect the NOI, NCF and occupancy information, as well as the appraised value and DSCR, LTV and Debt Yield metrics presented above. See “Risk Factors—Risks Related to Market Conditions and Other External Factors—The Coronavirus Pandemic Has Adversely Affected the Global Economy and Will Likely Adversely Affect the Performance of the Mortgage Loans” in the prospectus. |
| (7) | The appraisal also provided a “Hypothetical As If Dark” value of $164,000,000 as of April 14, 2021, which value would result in an Appraised Value Per SF, Cut-off Date LTV Ratio and Maturity Date/ARD LTV Ratio of $332.24, 84.1% and 84.1%, respectively, based on the principal balance of the Four Constitution Square Whole Loan. |
| (8) | The borrower sponsors of the Four Constitution Square Whole Loan acquired the development parcel for the Four Constitution Square Property, along with the adjacent Three Constitution Square, in January 2016 for approximate acquisition and development cost of $462.0 million. |
The Mortgage Loan. The third largest mortgage loan (the “Four Constitution Square Mortgage Loan”) is part of a whole loan (the “Four Constitution Square Whole Loan”) evidenced by two pari passu senior promissory notes in the aggregate original principal amount of $138,000,000. The Four Constitution Square Whole Loan is secured by a first priority fee mortgage encumbering a 493,620 SF office building located in Washington, D.C. (the “Four Constitution Square Property”). The Four Constitution Square Mortgage Loan is evidenced by Note A-2 with an original principal amount of
| This is not a research report and was not prepared by any Underwriter’s research department. Please see additional important information and qualifications at the end of this Term Sheet. |
58
| Office - CBD | Loan #3 | Cut-off Date Balance: | $55,000,000 | |
| 150 M Street Northeast | Four Constitution Square | Cut-off Date LTV: | 45.2% | |
| Washington, D.C. 20002 | UW NCF DSCR: | 4.54x | ||
| UW NOI Debt Yield: | 11.8% |
$55,000,000. Controlling Note A-1 (the “Four Constitution Square Non-Serviced Pari Passu Companion Loan”) was contributed to the BANK 2021-BNK34 securitization trust. The Four Constitution Square Whole Loan is being serviced pursuant to the pooling and servicing agreement for the BANK 2021-BNK34 securitization trust. See “Description of the Mortgage Pool—The Whole Loans”, “—The Non-Serviced Pari Passu Whole Loans” and “Pooling and Servicing Agreement—Servicing of the Non-Serviced Mortgage Loans” in the prospectus.
The Four Constitution Square Whole Loan has an initial term of 113 months to an anticipated repayment date (“ARD”) of November 1, 2030. Prior to the ARD, the Four Constitution Square Whole Loan will accrue interest at a rate equal to 2.5365% (the “Initial Interest Rate”). From and after the ARD until the outstanding principal balance of the Four Constitution Square Whole Loan and all accrued interest has been paid in full, or until the final maturity date of October 1, 2033, whichever event occurs first, the Four Constitution Square Whole Loan will accrue interest at a rate equal to 2.50% plus the Initial Interest Rate (the “Extension Rate”), and all excess cash flow from the Four Constitution Square Property will be collected by the lender and applied to reduce the principal balance of the Four Constitution Square Whole Loan until the entire outstanding principal balance is paid in full, and then, to pay any additional interest on the Four Constitution Square Whole Loan that has accrued at the excess of the Extension Rate over the Initial Interest Rate and has been deferred until repayment of the Four Constitution Square Whole Loan.
| Four Constitution Square Whole Loan Summary | ||||
| Note | Original Balance | Cut-off Date Balance | Note Holder | Controlling Piece |
| A-1 | $83,000,000 | $83,000,000 | BANK 2021-BNK34 | Yes |
| A-2 | $55,000,000 | $55,000,000 | BANK 2021-BNK35 | No |
| Total | $138,000,000 | $138,000,000 | ||
The Borrower and the Borrower Sponsors. The borrower is ConSquare Office Four Owner, LLC, a Delaware limited liability company structured to be bankruptcy-remote with at least two independent directors.
The borrower sponsors are MetLife, Inc. and Norges Bank Investment Management (“NBIM”), who are also the borrower sponsors for the Three Constitution Square Whole Loan. There is no non-recourse guarantor and no separate environmental indemnitor for the Four Constitution Square Whole Loan.
MetLife is a global leader in real estate investments. MetLife Investment Management (“MIM”) has been involved in the real estate business since 1878 as a mortgage lender, developer and owner. As of September 30, 2020, MIM’s real estate platform managed a portfolio of approximately $104 billion invested in real estate products including commercial mortgages and equities.
NBIM manages the Norwegian Government Pension Fund Global, which is invested in international equity, fixed-income markets, and real estate. As of September 30, 2020, NBIM manages assets worth approximately $1.3 trillion, of which approximately $34.5 billion is invested in unlisted real estate.
MetLife and NBIM established a partnership in 2013, with a focus on office assets located in major market central business districts throughout the United States. As of September 30, 2020, the joint venture has invested in six Class A office buildings located in Boston, San Francisco and Washington, D.C.
The Property. The Four Constitution Square Property is a 493,620 SF, 13-story, Class A, LEED Platinum office building constructed in 2018 on a 1.24-acre site within the larger Constitution Square development in the NoMa area of Washington, D.C. Constitution Square is a 2.5 million SF mixed-use development consisting of four Class A office buildings, a 440-unit multifamily property, a 50,000 SF Harris Teeter grocery store and a 204-room Hilton Garden Inn.
The Four Constitution Square Property features a 2-level subterranean parking garage that includes 286 parking spaces (0.58 spaces per 1,000 square feet), a fitness center, tenant lounge, rooftop terrace, landscaped interior courtyards, 24-hour on-site personnel, and food service.
The Four Constitution Square Property was built-to-suit for, and is currently 100% leased to the United States General Services Administration (“GSA”) for use by the US Department of Justice (“USDOJ”). On the first floor, the Four Constitution Square Property is connected to the adjacent Three Constitution Square (which secures the Three Constitution Square Whole Loan), which is also leased to the USDOJ. Additionally, the USDOJ leases the majority of the NRA at Two Constitution Square, as part of a consolidation of its office space into the Constitution Square development.
Major Tenant.
USDOJ (493,620 SF, 100.0% of NRA; 100.0% of underwritten base rent). USDOJ (Fitch/Moody’s/S&P: AAA/Aaa/AA+) is a federal executive department of the United States government responsible for the enforcement of the law and administration of justice. Several federal law enforcement agencies are administered by the USDOJ including the Federal Bureau of Investigation and the Drug Enforcement Administration. The department is headed by the Attorney General and employs over 115,000 attorneys, correctional officers, agents and others. The USDOJ is headquartered approximately 2 miles from the Four Constitution Square Property at the Robert F. Kennedy Department of Justice Building near the National Mall.
The USDOJ’s 15-year lease commenced on October 6, 2018 and expires on October 5, 2033. The lease requires current annual rent of $48.82 PSF and remains flat through the lease term. The USDOJ lease does not contain extension or termination options. The USDOJ has received a tenant improvement allowance of $20,685,161, which is repaid monthly over the Four Constitution Square Whole Loan term as additional rent in the amount of $114,917.56 ($2.79 PSF annually) (the “USDOJ Amortized TI Rent Amount”) and Building Specific Amortized Capital of $14,185,002, which is repaid monthly over the Four Constitution Square Whole Loan term as additional rent in the amount of $78,805.57 ($1.92 PSF annually). In addition, the USDOJ received an additional cash allowance equal to $38,623,511.65, which was used to fund various design costs and improvements to the premises. The USDOJ reportedly invested an additional $6.0 million toward the improvement of its office space.
| This is not a research report and was not prepared by any Underwriter’s research department. Please see additional important information and qualifications at the end of this Term Sheet. |
59
| Office - CBD | Loan #3 | Cut-off Date Balance: | $55,000,000 | |
| 150 M Street Northeast | Four Constitution Square | Cut-off Date LTV: | 45.2% | |
| Washington, D.C. 20002 | UW NCF DSCR: | 4.54x | ||
| UW NOI Debt Yield: | 11.8% |
The following table presents certain information relating to the tenancy at the Four Constitution Square Property:
| Tenant Summary(1) | ||||||||||
| Tenant Name | Credit Rating (Fitch/Moody’s/S&P)(2) | Tenant SF | Approx % of SF | Annual UW Rent(3) | % of Total Annual UW Rent | Annual UW Rent PSF | Lease Expiration | Renewal Options | Term. Options (Y/N) | |
| USDOJ | AAA/Aaa/AA+ | 493,620 | 100.0% | $24,100,411 | 100.0% | $48.82 | 10/5/2033 | N | N | |
| Total/Wtd. Avg. | 493,620 | 100.0% | $24,100,411 | 100.0% | $48.82 | |||||
| (1) | Information based on the underwritten rent roll. |
| (2) | Certain ratings are those of the parent company or government whether or not the parent company or government guarantees the lease. |
| (3) | Annual U/W Base Rent PSF and Annual U/W Base Rent for the USDOJ includes the USDOJ Amortized TI Rent Amount. |
The following table presents certain information relating to the lease rollover schedule at the Four Constitution Square Property:
| Lease Rollover Schedule(1)(2) | ||||||||
| Year | # of Leases Rolling | SF Rolling | UW Rent PSF Rolling | Approx. % of Total SF Rolling | Approx. Cumulative % of SF Rolling | Total UW Rent Rolling | Approx. % of Total Rent Rolling | Approx. Cumulative % of Total Rent Rolling |
| MTM | 0 | 0 | $0.00 | 0.0% | 0.0% | $0 | 0.0% | 0.0% |
| 2021 | 0 | 0 | $0.00 | 0.0% | 0.0% | $0 | 0.0% | 0.0% |
| 2022 | 0 | 0 | $0.00 | 0.0% | 0.0% | $0 | 0.0% | 0.0% |
| 2023 | 0 | 0 | $0.00 | 0.0% | 0.0% | $0 | 0.0% | 0.0% |
| 2024 | 0 | 0 | $0.00 | 0.0% | 0.0% | $0 | 0.0% | 0.0% |
| 2025 | 0 | 0 | $0.00 | 0.0% | 0.0% | $0 | 0.0% | 0.0% |
| 2026 | 0 | 0 | $0.00 | 0.0% | 0.0% | $0 | 0.0% | 0.0% |
| 2027 | 0 | 0 | $0.00 | 0.0% | 0.0% | $0 | 0.0% | 0.0% |
| 2028 | 0 | 0 | $0.00 | 0.0% | 0.0% | $0 | 0.0% | 0.0% |
| 2029 | 0 | 0 | $0.00 | 0.0% | 0.0% | $0 | 0.0% | 0.0% |
| 2030 | 0 | 0 | $0.00 | 0.0% | 0.0% | $0 | 0.0% | 0.0% |
| 2031 & Beyond | 1 | 493,620 | $48.82 | 100.0% | 100.0% | $24,100,411 | 100.0% | 100.0% |
| Vacant | 0 | 0 | $0.00 | 0.0% | 100.0% | $0 | 0.0% | 100.0% |
| Total/Wtd. Avg. | 1 | 493,620 | $48.82 | 100.0% | $24,100,411 | 100.0% | ||
| (1) | Information is based on the underwritten rent roll. |
| (2) | Certain tenants may have lease termination options that are exercisable prior to the originally stated expiration date of the subject lease and that are not considered in this Lease Rollover Schedule. |
COVID-19 Update. As of July 5, 2021, the Four Constitution Square Whole Loan is current on its debt service payments and is not subject to any forbearance, modification or debt service relief request. As of July 5, 2021, the borrower sponsors have reported that 100% of tenants by net rentable area and 100% of tenants by underwritten base rent have paid their full May and June 2021 rent payments and have not requested any rent relief or lease modifications.
The Market. The Four Constitution Square Property is located at 150 M Street Northeast, in Washington, D.C.’s NoMa district, part of the core downtown area of the city. According to the appraisal, NoMA has transitioned from a predominantly industrial area to a mixed-use neighborhood containing new office buildings, multifamily residential buildings and street-level retail with open space/parks abutting Union Station’s rail yard. A critical mass of government offices continue to be the primary driver for office demand in the area. Federal agencies with a significant presence in the area include the USDOJ, Bureau of Alcohol Tobacco and Firearms and the Federal Energy Regulatory Commission. The Four Constitution Square Property is also near to the U.S. Capitol, Supreme Court, Securities and Exchange Commission headquarters and the Federal Communications Commission headquarters.
The Four Constitution Square Property is immediately adjacent to the NoMa-Gallaudet Metrorail Station, connecting the downtown area with suburban Montgomery County, Maryland. Prior to the COVID-19 pandemic, the NoMa/Gallaudet Station saw an average of 10,179 weekday riders.
Over the past 10 years, the NoMa office submarket inventory has increased by 23.4%, from 9.9 million square feet to 12.2 million SF, with 3.1 million SF of positive absorption and an increase in average asking rate from $46.55 PSF to $50.75 PSF. As of the first quarter of 2021, the NoMa submarket had a vacancy rate of 6.2%, up slightly from the year-end 2020 vacancy of 5.5%, but well below the Washington D.C. office market vacancy of 13.1%, and the lowest of all Washington D.C. submarkets.
According to the appraisal, the estimated 2020 population within a one, three and five-mile radius was 68,138, 397,057 and 800,152, respectively, and the estimated 2020 average household income within the same radii was $137,477, $133,654 and $125,922, respectively.
| This is not a research report and was not prepared by any Underwriter’s research department. Please see additional important information and qualifications at the end of this Term Sheet. |
60
| Office - CBD | Loan #3 | Cut-off Date Balance: | $55,000,000 | |
| 150 M Street Northeast | Four Constitution Square | Cut-off Date LTV: | 45.2% | |
| Washington, D.C. 20002 | UW NCF DSCR: | 4.54x | ||
| UW NOI Debt Yield: | 11.8% |
The following table presents certain information relating to the appraiser’s market rent conclusions for the Four Constitution Square Property:
| Market Rent Summary | |
| GSA Office | |
| Market Rent (PSF) | $50.00 |
| Lease Term (Yrs.) | 10 |
| Rent Increase Projection | Flat |
The following table presents recent comparable office sales data with respect to the Four Constitution Square Property:
| Comparable Office Sales | |||||||
| Property/Location | Submarket | Year Built/Renovated | Total NRA (SF) / Stories | Occupancy | Date of Sale | Sale Price / PSF | Cap Rate |
99 M 99 M Street SE | Capitol Riverfront | 2018 / NAP | 234,676 / 11 | 88% | Jan-20 | $170,000,000 / $724 | 5.20% |
One Constitution Square 1275 1st Street NE | NoMa | 2010 / NAP | 345,699 / 12 | 79% | Sept-19 | $189,886,408 / $549 | 5.59% |
Union Center Plaza 3 830 1st Street NE | NoMa | 2001 / NAP | 247,337 / 11 | 100% | Mar-19 | $116,550,000 / $471 | 6.35% |
Sentinel Square II 1050 1st Street NE | NoMa | 2013 / NAP | 289,524 / 12 | 94% | Dec-17 | $165,900,000 / $573 | 5.40% |
Two Independence Square 300 E Street SW | Southwest | 1991 / 2013 | 605,897 / 9 | 100% | Jul-17 | $359,600,000 / $594 | 5.44% |
Source: Appraisal.
The following table presents recent office leasing data at comparable properties with respect to the Four Constitution Square Property:
| Comparable GSA Office Leases | |||||||||
| Property Address | Submarket | Year Built | Total NRA (SF) / Stories | GSA Tenant | Lease Date / Term (yrs) | Lease Size (SF) | Initial Rent PSF | Rent PSF per annum /TI PSF | |
Four Constitution Square 150 M Street Northeast | NoMa | 2018 | 493,620 / 13 | USDOJ | Oct-18 / 15.0 | 493,620 | $48.82(1) | Flat / $41.91(2) | |
L’Enfant Plaza North 955 L’Enfant Plaza SW | Southwest | 1969 | 299,476 / 8 | FAA (renewal) | Jan-21 / 15.0 | 65,734 | $48.15 | (3) / $0.00 | |
L’Enfant Plaza North 955 L’Enfant Plaza SW | Southwest | 1969 | 299,476 / 8 | NTSB (renewal) | Nov-20 / 5.0 | 159,870 | $49.00 | Flat / $0.00 | |
Station Place 100 F Street NE | NoMa | 2005 | 712,851 / 10 | Securities and Exchange Commission (extension) | Mar-19 / 4.4 | 712,851 | $42.70 | Flat / $0.00 | |
National Square 500 D Street SW | Southwest | 2016 | 348,173 / 12 | Agency for International Development | Mar-18 / 20.0 | 348,173 | $49.75 | Flat / $80.00 | |
The Portals II 445 12th SW | Southwest | 1997 | 602,350 / 8 | Pension Benefit Guaranty Corporation | Dec-17 / 15.0 | 431,785 | $49.00 | Flat / $71.74 | |
One Constitution Square 1275 1st Street NE | NoMa | 2010 | 400,000 / 12 | Peace Corps | Nov-17 / 15.0 | 173,000 | $51.00 | Flat / $46.74 | |
Sentinel Square III 45 L Street NE | NoMa | 2019 | 545,823 / 11 | Federal Communications Commission | Dec-16 / 15.0 | 473,000 | $48.00 | Flat / $60.00 | |
Union Center Plaza, Phase 4 888 1st Street NE | NoMa | 1995 | 509,397 / 11 | Federal Energy Regulatory Commission (renewal) | Jul-15 / 10.0 | 503,997 | $49.95 | Flat / $15.00 | |
Source: Appraisal.
| (1) | Information obtained from the underwritten rent roll. |
| (2) | The USDOJ received a tenant improvement allowance of $20,685,161 ($41.91 PSF), which is repaid monthly over the Four Constitution Square Whole Loan term as additional rent in the amount equal to the USDOJ Amortized TI Rent Amount and Building Specific Amortized Capital of $14,185,002, which is repaid monthly over the Four Constitution Square Whole Loan term as additional rent in the amount of $78,805.57 ($1.92 PSF annually). In addition, the USDOJ received an additional cash allowance equal to $38,623,511.65, which was used to fund various design costs and improvements to the premises. |
| (3) | Rent increases in years 6 and 11 of the lease term. |
| This is not a research report and was not prepared by any Underwriter’s research department. Please see additional important information and qualifications at the end of this Term Sheet. |
61
| Office - CBD | Loan #3 | Cut-off Date Balance: | $55,000,000 | |
| 150 M Street Northeast | Four Constitution Square | Cut-off Date LTV: | 45.2% | |
| Washington, D.C. 20002 | UW NCF DSCR: | 4.54x | ||
| UW NOI Debt Yield: | 11.8% |
Operating History and Underwritten Net Cash Flow. The following table presents certain information relating to the historical operating performance and Underwritten Net Cash Flow at the Four Constitution Square Property:
| Cash Flow Analysis | |||||||||
| 2019 | 2020 | UW | UW PSF | ||||||
| Gross Potential Rent(1) | $22,599,017 | $24,100,411 | $24,100,411 | $48.82 | |||||
| Expense Reimbursement | $13,607 | $108,988 | $367,487 | $0.74 | |||||
| Other Income(2) | $1,062,246 | $911,049 | $841,835 | $1.71 | |||||
| Vacancy | $0 | $0 | ($611,697) | ($1.24) | |||||
| Effective Gross Income | $23,674,870 | $25,120,448 | $24,698,036 | $50.03 | |||||
| Taxes | $2,678,106 | $4,585,993 | $4,879,702 | $9.89 | |||||
| Insurance | $59,891 | $164,450 | $147,680 | $0.30 | |||||
| Other Operating Expenses | $2,238,233 | $2,903,031 | $3,449,956 | $6.99 | |||||
| Total Operating Expenses | $4,976,230 | $7,653,474 | $8,477,338 | $17.17 | |||||
| Net Operating Income | $18,698,640 | $17,466,974 | $16,220,697 | $32.86 | |||||
| TI/LC | $0 | $0 | $0 | $0.00 | |||||
| Capital Expenditures | $0 | $0 | $123,405 | $0.25 | |||||
| Net Cash Flow | $18,698,640 | $17,466,974 | $16,097,292 | $32.61 | |||||
| Occupancy%(3) | 100.0% | 100.0% | 97.5% | ||||||
| NOI DSCR(4) | 5.27x | 4.92x | 4.57x | ||||||
| NCF DSCR(4) | 5.27x | 4.92x | 4.54x | ||||||
| NOI Debt Yield(4) | 13.5% | 12.7% | 11.8% | ||||||
| NCF Debt Yield(4) | 13.5% | 12.7% | 11.7% | ||||||
| (1) | UW Gross Potential Rent includes the USDOJ Amortized TI Rent Amount. |
| (2) | UW Other Income includes parking income. Parking at the Four Constitution Square Property is 100% leased to the USDOJ. |
| (3) | UW Occupancy represents economic occupancy. The Four Constitution Square Property is currently 100.0% occupied. |
| (4) | Debt service coverage ratios and debt yields are based on the Four Constitution Square Whole Loan. |
Escrows and Reserves.
Real Estate Taxes - During a Cash Sweep Period (as defined below), the borrower is required to deposit 1/12 of the annual estimated real estate taxes monthly, which reserve will be disbursed to the borrower when the Cash Sweep Period expires.
Insurance - During a Cash Sweep Period, the borrower is required to deposit 1/12 of the annual estimated insurance premiums monthly, which will be disbursed to the borrower when the Cash Sweep Period expires.
Replacement Reserve - During a Cash Sweep Period, the borrower is required to deposit $10,283.75 for replacements monthly, subject to a cap of $246,810 (the “Replacement Reserve Cap”), which reserve will be disbursed to the borrower when the Cash Sweep Period expires. Notwithstanding the foregoing, the borrower may provide a letter of credit in lieu of any cash deposit in the amount at least equal to the Replacement Reserve Cap less any amount in the replacement reserve account.
TI/LC Reserve - The borrower is required to deposit any lease termination fees received in connection with any termination or modification, reduction of rents, shortening of term or surrender of space. The borrower is also required, during a Cash Sweep Period, to deposit $41,135 monthly for tenant improvements and leasing commissions, subject to a cap of $50 per available rentable square foot at the Four Constitution Square Property (the “TI/LC Reserve Cap”), which amounts will be disbursed to the borrower when the Cash Sweep Period expires. Notwithstanding the foregoing, the borrower may provide a letter of credit or a payment guaranty in lieu of any cash deposit in the amount at least equal to the TI/LC Reserve Cap less any amount in the TI/LC reserve account.
USDOJ Lump Sum Payment Reserve – The borrower is required to deposit, within five business days of receipt, any lump sum payment received in connection with the USDOJ’s exercise of its right to repay the remaining unpaid amortized portion of the tenant improvement allowance. Except during a Cash Sweep Period, such funds are required to be disbursed to the borrower on a monthly basis in an amount equal to the USDOJ Amortized TI Rent Amount.
A “Cash Sweep Period” will occur during the existence of any of:
(a) an event of default until cured or waived by the lender;
(b) bankruptcy or insolvency of the borrower;
(c) failure by the borrower to repay the Four Constitution Square Whole Loan in full on or before the ARD;
(d) a Debt Yield Trigger (as defined below); or
(e) a Lease Sweep Period (as defined below).
| This is not a research report and was not prepared by any Underwriter’s research department. Please see additional important information and qualifications at the end of this Term Sheet. |
62
| Office - CBD | Loan #3 | Cut-off Date Balance: | $55,000,000 | |
| 150 M Street Northeast | Four Constitution Square | Cut-off Date LTV: | 45.2% | |
| Washington, D.C. 20002 | UW NCF DSCR: | 4.54x | ||
| UW NOI Debt Yield: | 11.8% |
During the continuance of a Cash Sweep Period, all excess cash is required to be held by the lender as additional collateral for the Four Constitution Square Whole Loan. Notwithstanding the foregoing, so long as 100% of the office space at the Four Constitution Square Property remains leased to the USDOJ and no monetary default by the USDOJ exists, no Cash Sweep Period will occur upon a Debt Yield Trigger or Lease Sweep Period.
A “Debt Yield Trigger” will commence when the trailing twelve month debt yield is less than 7.50% for two consecutive calendar quarters, and will end when the trailing twelve month debt yield is at least 7.50% for two consecutive quarters. Notwithstanding the foregoing, the borrower may provide cash or a letter of credit in lieu of an excess cash sweep in the amount that, if applied to the outstanding principal balance of the Four Constitution Square Whole Loan, would result in a debt yield at least equal to 7.50%.
A “Lease Sweep Period” will occur during the existence of any of:
(a) the USDOJ (or its replacement tenant) terminating its lease or giving notice of its intent to terminate its lease;
(b) the USDOJ (or its replacement tenant) goes dark in more than 25% of its space, until the amount in the TI/LC Reserve equals or exceeds the TI/LC Reserve Cap. In lieu of an excess cash sweep, the borrower may deposit cash, post a letter of credit, or provide a payment guaranty from a creditworthy guarantor equal to the TI/LC Reserve Cap;
(c) a default under the USDOJ (or its replacement tenant) lease, until such default is cured to the satisfaction of the lender;
(d) bankruptcy or insolvency action of the USDOJ (or its replacement tenant) until such action has terminated and the lease has been affirmed, assumed or assigned in a manner reasonably satisfactory to the lender; or
(e) 24 months prior to the USDOJ’s lease expiration date until the amount in the TI/LC Reserve equals or exceeds the TI/LC Reserve Cap. In lieu of an excess cash sweep, the borrower may deposit cash, post a letter of credit, or provide a payment guaranty from a creditworthy guarantor equal to the TI/LC Reserve Cap.
A Lease Sweep Period will terminate upon the execution and delivery of an acceptable replacement lease.
Lockbox and Cash Management. The Four Constitution Square Whole Loan is structured with a hard lockbox and springing cash management upon a Cash Sweep Period. Revenues from the Four Constitution Square Property are required to be deposited by tenants directly into the lockbox account. During the continuance of a Cash Sweep Period, funds are required to be transferred on each business day to the lender-controlled cash management account and disbursed according to the Four Constitution Square Whole Loan documents.
Additional Secured Indebtedness (not including trade debts). The Four Constitution Square Property also secures the Four Constitution Square Non-Serviced Pari Passu Companion Loan, which has a Cut-off Date principal balance of $83,000,000. The Four Constitution Square Non-Serviced Pari Passu Companion Loan accrues interest at the same rate as the Four Constitution Square Mortgage Loan. The Four Constitution Square Mortgage Loan and the Four Constitution Square Non-Serviced Pari Passu Companion Loan are pari passu in right of payment. The holders of the Four Constitution Square Mortgage Loan and the Four Constitution Square Non-Serviced Pari Passu Companion Loan have entered into a co-lender agreement which sets forth the allocation of collections on the Four Constitution Square Whole Loan. See “Description of the Mortgage Pool—The Whole Loans—The Non-Serviced Pari Passu Whole Loans” in the prospectus.
Subordinate and Mezzanine Indebtedness. The holders of the direct or indirect equity interests in the borrower are permitted to incur future mezzanine debt secured by a pledge of 100% of such equity interests in the borrower (a “Four Constitution Square Permitted Future Mezzanine Loan”); provided that, among other conditions: (i) no event of default is continuing; (ii) the aggregate loan-to-value ratio of the Four Constitution Square Whole Loan and the Four Constitution Square Permitted Future Mezzanine Loan (collectively, the “Four Constitution Square Total Debt”) is less than or equal to 45.25%; (iii) the aggregate debt yield of the Four Constitution Square Total Debt is at least 11.84%; (iv) the term of the Four Constitution Square Permitted Future Mezzanine Loan is at least co-terminous with the term of the Four Constitution Square Whole Loan; (v) an intercreditor agreement is executed that is reasonably acceptable to the lender and acceptable to the rating agencies rating securities backed by the Four Constitution Square Whole Loan; and (vi) a rating agency confirmation is delivered by each rating agency rating securities backed by the Four Constitution Square Whole Loan.
Release of Property. Not permitted.
Right of First Refusal. None.
Ground Lease. None
Letter of Credit. None.
Terrorism Insurance. The borrower is required to obtain and maintain property insurance that covers perils and acts of terrorism and is required to obtain and maintain business interruption insurance for 24 months plus a 12-month extended period of indemnity (provided that if TRIPRA or a similar statute is not in effect, the borrower will not be obligated to pay terrorism insurance premiums in excess of two times the annual premium for the casualty and business interruption coverage). See “Risk Factors—Risks Relating to the Mortgage Loans—Terrorism Insurance May Not Be Available for All Mortgaged Properties” in the prospectus.
| This is not a research report and was not prepared by any Underwriter’s research department. Please see additional important information and qualifications at the end of this Term Sheet. |
63
| Multifamily – Cooperative | Loan #4 | Cut-off Date Balance: | $54,898,724 | |
| 435 East 52nd Street aka 433-449 | River House Coop | Cut-off Date LTV: | 10.6% | |
| East 52nd Street | U/W NCF DSCR: | 3.56x | ||
| New York, NY 10022 | U/W NOI Debt Yield: | 16.7% |

| This is not a research report and was not prepared by any Underwriter’s research department. Please see additional important information and qualifications at the end of this Term Sheet. |
64
| Multifamily – Cooperative | Loan #4 | Cut-off Date Balance: | $54,898,724 | |
| 435 East 52nd Street aka 433-449 | River House Coop | Cut-off Date LTV: | 10.6% | |
| East 52nd Street | U/W NCF DSCR: | 3.56x | ||
| New York, NY 10022 | U/W NOI Debt Yield: | 16.7% |

| This is not a research report and was not prepared by any Underwriter’s research department. Please see additional important information and qualifications at the end of this Term Sheet. |
65
| Mortgage Loan No. 4 – River House Coop |
| Mortgage Loan Information | Property Information | |||||
| Mortgage Loan Seller: | MSMCH | Single Asset/Portfolio: | Single Asset | |||
| Credit Assessment (DBRSM/Fitch/S&P): | AAA/AAAsf/NR | Location: | New York, NY 10022 | |||
| Original Balance: | $55,000,000 | General Property Type: | Multifamily | |||
| Cut-off Date Balance: | $54,898,724 | Detailed Property Type: | Cooperative | |||
| % of Initial Pool Balance: | 3.9% | Title Vesting: | Fee | |||
| Loan Purpose: | Refinance | Year Built/Renovated: | 1931 / 2011 | |||
| Borrower Sponsor(1): | NAP | Size(3): | 75 Units | |||
| Guarantor(1): | NAP | Cut-off Date Balance per Unit(3): | $731,983 | |||
| Mortgage Rate: | 2.3750% | Maturity Date Balance per Unit(3): | $548,379 | |||
| Note Date: | 6/18/2021 | Property Manager: | Douglas Elliman Property | |||
| First Payment Date: | 8/1/2021 | Management | ||||
| Maturity Date: | 7/1/2031 | Underwriting and Financial Information(4) | ||||
| Original Term to Maturity: | 120 months | UW NOI(5): | $9,159,735 | |||
| Original Amortization Term: | 360 months | UW NOI Debt Yield(5): | 16.7% | |||
| IO Period: | 0 months | UW NOI Debt Yield at Maturity(5): | 22.3% | |||
| Seasoning: | 1 month | UW NCF DSCR(5): | 3.56x | |||
| Prepayment Provisions: | L(25),D(91),O(4) | Most Recent NOI(6): | NAP | |||
| Lockbox/Cash Mgmt Status: | None | 2nd Most Recent NOI(6): | NAP | |||
| Additional Debt Type: | No | 3rd Most Recent NOI(6): | NAP | |||
| Additional Debt Balance: | NAP | Most Recent Occupancy(7): | NAP | |||
| Future Debt Permitted (Type): | No (NAP) | 2nd Most Recent Occupancy(7): | NAP | |||
| 3rd Most Recent Occupancy(7): | NAP | |||||
| Reserves(2) | Appraised Value (as of)(8): | $517,379,750 (5/10/2021) | ||||
| Type | Initial | Monthly | Cap | Appraised Value per Unit(3)(8): | $6,898,397 | |
| RE Tax: | $397,526 | $397,526 | NAP | Cut-off Date LTV Ratio(8): | 10.6% | |
| Insurance: | $168,468 | $18,719 | NAP | Maturity Date LTV Ratio(8): | 7.9% | |
| TI/LC: | $0 | Springing | NAP | Coop-Rental Value(9): | $287,700,000 (5/10/2021) | |
| Completion/Repair: | $8,750 | $0 | NAP | Coop-LTV as Rental(9): | 19.1% | |
| Recurring Replacement: | $0 | Springing | NAP | |||
| Sources and Uses | ||||||
| Sources | Proceeds | % of Total | Uses | Proceeds | % of Total | |
| Loan Amount: | $55,000,000 | 100.0% | Loan Payoff: | $25,591,407 | 46.5% | |
| Return of Equity: | 27,836,295 | 50.6% | ||||
| Closing Costs: | $997,555 | 1.8% | ||||
| Reserves: | $574,744 | 1.0% | ||||
| Total Sources: | $55,000,000 | 100.0% | Total Uses: | $55,000,000 | 100.0% | |
| (1) | The River House Coop Property (as defined below) is owned by the borrower, which is a cooperative housing corporation. No individual or entity (other than the borrower) has recourse obligations with respect to the River House Coop Mortgage Loan (as defined below), including pursuant to any guaranty or environmental indemnity. |
| (2) | See “Escrows and Reserves” below. |
| (3) | Based solely on residential units and excludes the one commercial unit. |
| (4) | The novel coronavirus pandemic is an evolving situation and could impact the River House Coop Mortgage Loan more severely than assumed in the underwriting of the River House Coop Mortgage Loan and could adversely affect the NOI, NCF and occupancy information, as well as the appraised value and the DSCR, LTV and Debt Yield metrics presented above and herein. See “Risk Factors—Risks Related to Market Conditions and Other External Factors—The Coronavirus Pandemic Has Adversely Affected the Global Economy and Will Likely Adversely Affect the Performance of the Mortgage Loans” in the prospectus. |
| (5) | See “Underwritten Net Cash Flow” section below. |
| (6) | Most Recent NOI, 2nd Most Recent NOI and 3rd Most Recent NOI are not available. Residential cooperatives are not-for-profit entities that set maintenance fees to cover current expenses and plan for future capital needs. A residential cooperative can increase or decrease maintenance fees according to its anticipated expenses and level of cash reserves. The historical NOI figures are not representative of the cash flow generated by the River House Coop Property if it were operated as a multifamily rental property. |
| (7) | Occupancy is not reported as all residential units are owned by tenant-shareholders. |
| (8) | For purposes of determining the Appraised Value, the Cut-off Date LTV Ratio and the Maturity Date LTV Ratio, the value estimate reflected in the appraisal of the River House Coop Property is determined as if such residential cooperative property were operated as a residential cooperative and, in general, such value equals the gross sellout value of all residential cooperative units in such residential cooperative property, based in part on various comparable sales of cooperative apartment units in the market, and without deducting marketing and promotion costs, sales commission, legal and transfer expenses, carrying costs or developer’s profit, or taking into account any absorption period for the units. The net sellout value taking into account such factors is $380,400,000. Neither the gross sellout value nor the net sellout value represents a market value. |
| (9) | The Coop-Rental Value and the Coop-LTV as Rental assumes the River House Coop Property is operated as a rental property. Such value takes into account income from the River Club (as defined below) lease, which has not been underwritten, and as to which the tenant is in rent forbearance. See “The Property” below. |
The Mortgage Loan. The fourth largest mortgage loan (the “River House Coop Mortgage Loan”) is evidenced by a promissory note in the original principal amount of $55,000,000 and secured by a first priority fee mortgage encumbering the underlying fee and improvements of one, mixed use, 26-story cooperative building encompassing 75 residential units and one commercial unit located in New York, New York (the “River House Coop Property”). The proceeds of the River House Coop Mortgage Loan were used to refinance existing debt, fund reserves and pay closing costs.
| This is not a research report and was not prepared by any Underwriter’s research department. Please see additional important information and qualifications at the end of this Term Sheet. |
66
| Multifamily – Cooperative | Loan #4 | Cut-off Date Balance: | $54,898,724 | |
| 435 East 52nd Street aka 433-449 | River House Coop | Cut-off Date LTV: | 10.6% | |
| East 52nd Street | U/W NCF DSCR: | 3.56x | ||
| New York, NY 10022 | U/W NOI Debt Yield: | 16.7% |
The Borrower. The borrower is River House Realty Co., Inc., a cooperative housing corporation organized under the laws of the State of New York. The borrower has no independent directors. The River House Coop Property is owned in fee simple by the borrower. No individual or entity (other than the borrower) has recourse obligations with respect to the River House Coop Mortgage Loan, including pursuant to any guaranty or environmental indemnity.
The Property. The River House Coop Property is comprised of the land and improvements of a 26-story mixed use cooperative building constructed in 1931, with 75 residential units and one commercial unit, located from the eastern end of 52nd Street to the eastern end of 53rd Street in New York, New York. The 75 residential units consist of 321,900 SF of total NRA and the commercial unit consists of 65,000 SF of total NRA. The 75 residential units are 100.0% owned by tenant shareholders. The residential component consists of two one-bedroom units, 14 three-bedroom units, 50 four-bedroom units, and nine five-bedroom units. The average residential unit size is 4,296 square feet. Amenities at the River House Coop Property include a laundry room, twelve elevators, a 24-hour attended lobby, concierge and a landscaped courtyard. Since 2011, approximately $36.7 million has been spent on capital expenditures, including façade and roof restoration, and the installation of an emergency generator. The board of the River House Coop Property has approved two future capital projects that will seek both to enhance the value of the River House Coop Property and to achieve compliance with New York City Local Law 11. These two projects, which are expected to be addressed over the next two years, include reconstruction of the central tower bulkhead and the ground level motor court and further façade restorations. These projects are anticipated to cost a total of approximately $25 million. Such renovations are not required or reserved for under the River House Coop Mortgage Loan documents.
The one commercial unit at the River House Coop Property is owned by the borrower and leased by it to The River Club of New York, Inc. (“River Club”), with a lease expiration date of December 31, 2065 at an annual rent of approximately $2,649,151 in 2021, subject to increases. The River Club, which spans three floors at the River House Coop Property, is a private membership club. The space leased to the River Club includes two tennis courts, three squash courts, two golf simulators, a pool, ballroom, fitness center and a restaurant, which is leased and managed by the River Club tenant. The River Club recently reopened after being subject to a state mandated closure for most of 2020 due to the coronavirus pandemic. The River Club has been under forbearance as to its rent payments since early 2020. Rent from the River Club lease was not underwritten.
The table below shows the residential apartment unit mix at the River House Coop Property:
| Unit Mix | |||
| Unit Type | Units | % of Total Units | Average SF per Unit |
| 1 Bedroom | 2 | 2.7% | 1,280 |
| 3 Bedroom | 14 | 18.7% | 2,640 |
| 4 Bedroom | 50 | 66.7% | 4,415 |
| 5 Bedroom | 9 | 12.0% | 6,877 |
| Total/Wtd. Avg. | 75 | 100.0% | 4,296 |
Source: Appraisal
COVID-19 Update. The first debt service payment on the River House Coop Mortgage Loan is due in August 2021 and as of June 18, 2021, the River House Coop Mortgage Loan is not subject to any forbearance, modification or debt service relief request. The borrower has incurred a Paycheck Protection Program loan in the original principal amount of $742,610, and may incur future Paycheck Protection Program or similar loans provided that the aggregate outstanding amount of such loans is not more than $742,610. As of June 23, 2021, the borrower has reported that 98.0% of residential units have paid their June 2021 maintenance payments. Three of the cooperative unit owners had issues with their maintenance payments. The borrower has reported that one unit owner has fully repaid its missed payments and is back to paying full maintenance charges, one unit owner is in the process of sending in its missed payment and one unit owner is in communication with the board regarding selling its unit. See “The Property” above regarding the rent forbearance status of the sole commercial tenant, The River Club, which has been underwritten as vacant.
The Market. The River House Coop Property is located in New York City within the New York multifamily market and the Midtown East multifamily submarket. The River House Coop Property is in close proximity to the 51st street subway station and the 53rd street/Lexington Avenue subway station, which provides access to the 4, 6, E and M lines. According to a third party report, as of the fourth quarter of 2020, the New York multifamily market had had an inventory of approximately 1.4 million units, a vacancy rate of 4.5% and average asking rent per month of $2,713. According to a third party report, as of the fourth quarter of 2020, the Midtown East multifamily submarket had an inventory of 14,012 units, a vacancy rate of 5.0% and average asking rent per month of $4,156. According to a third party report, the estimated 2021 population within the River House Coop Property zip code (10022) is 101,941 and the estimated 2021 median household income within the same zip code is $137,555.
| This is not a research report and was not prepared by any Underwriter’s research department. Please see additional important information and qualifications at the end of this Term Sheet. |
67
| Multifamily – Cooperative | Loan #4 | Cut-off Date Balance: | $54,898,724 | |
| 435 East 52nd Street aka 433-449 | River House Coop | Cut-off Date LTV: | 10.6% | |
| East 52nd Street | U/W NCF DSCR: | 3.56x | ||
| New York, NY 10022 | U/W NOI Debt Yield: | 16.7% |
The following table presents certain information relating to multifamily rental properties comparable to the River House Coop Property:
| Comparable Rental Properties(1) | |||||
| Property | Year Built | Unit Type | Size (SF) | Average Monthly Rent per Unit | Average Annual Rent PSF |
| River House Coop | 1931 | 1BR | 1,280 | $7,000 | $65.63 |
| 6 W 22nd St - 7W21 | 2016 | 1BR-1BA | 800 | $6,044 | $90.66 |
| 10 West 74th Street | 1941 | 1BR-1BA | 600 1,400 | $3,896 $9,070 | $77.92 $77.74 |
| 3BR-3½BA | |||||
| 321 Columbus Avenue | 1898 | 1BR-1BA | 600 2,300 | $3,163 $18,000 | $63.26 $93.91 |
| 4BR-4½BA | |||||
| 930 Park Ave | 1916 | 3BR-3BA | 2,000 3,000 | $14,000 $20,000 | $84.00 $80.00 |
| 4BR-3BA | |||||
| The Atelier | 1905 | 3BR-1BA | 1,250 | $6,000 | $57.60 |
| 825 Fifth Avenue | 1926 | 1BR-1BA | 1,000 2,500 | $6,700 $17,500 | $80.40 $84.00 |
| 3BR-3BA | |||||
| 149 East 73rd Street | 1924 | 1BR-1BA | 1,000 2,500 | $6,700 $17,750 | $80.40 $85.20 |
| 3BR-3BA | |||||
| 141 East 88th Street | 1927 | 3BR-3½BA | 2,738 2,650 | $18,500 $17,500 | $81.08 $79.25 |
| 4BR-3BA | |||||
Source: Appraisal.
| (1) | The rents for the comparable properties are based on market rents for such properties, whether or not such properties include rent restricted units. All or a portion of the residential cooperative units at the River House Coop Property were rent restricted prior to the cooperative conversion and accordingly would again be subject to rent restrictions if the River House Coop Property were operated as a multifamily rental property. |
Underwritten Net Cash Flow. The following table presents certain information relating to the Underwritten Net Cash Flow at the River House Coop Property:
| Cash Flow Analysis(1)(2) | ||
| UW | UW Per Unit | |
| Gross Potential Rent(3) | $23,760,000 | $316,800.00 |
| Other Income | $0 | $0.00 |
| Less Vacancy & Credit Loss(4) | ($1,188,000) | ($15,840.00) |
| Effective Gross Income | $22,572,000 | $300,960.00 |
| Real Estate Taxes | $5,796,655 | $77,288.73 |
| Insurance | $322,500 | $4,300.00 |
| Other Expenses | $7,293,110 | $97,241.47 |
| Total Expenses | $13,412,265 | $178,830.20 |
| Net Operating Income | $9,159,735 | $122,129.80 |
| TI/LC | $0 | $0.00 |
| Capital Expenditures | $22,200 | $296.00 |
| Net Cash Flow | $9,137,535 | $121,833.80 |
| Occupancy %(4) | 95.0% | |
| NOI DSCR | 3.57x | |
| NCF DSCR | 3.56x | |
| NOI Debt Yield | 16.7% | |
| NCF Debt Yield | 16.6% | |
| (1) | For the avoidance of doubt, no COVID-19 specific adjustments have been incorporated in the lender underwriting. |
| (2) | Residential cooperatives are generally organized and operated as not-for-profit entities that set maintenance fees to cover current expenses and plan for future capital needs. The UW Net Operating Income and the UW Net Cash Flow for the River House Coop Property are the projected net operating income and the projected net cash flow, respectively, reflected in the appraisal. The projected net operating income, in general, equals projected effective gross income at the River House Coop Property assuming that it is operated as a multifamily rental property with rents and other income set at the prevailing market rates, reduced by underwritten property operating expenses and a market-rate vacancy assumption, in each case as determined by the appraiser. While such projected net operating income assumes the River House Coop Property is rented at market rates, all or a portion of the residential cooperative units at the River House Coop Property were rent restricted prior to the cooperative conversion and accordingly would again be subject to rent restrictions if the River House Coop Property were operated as a multifamily rental property. The projected net cash flow equals the projected net operating income reduced by the projected replacement reserves as determined by the appraiser. The projected rental income used in such determinations differs materially from the scheduled monthly maintenance payments from the tenant-shareholders at the River House Coop Property. See “Risk Factors—Risks Relating to the Mortgage Loans—Residential Cooperative Properties Have Special Risks” in the prospectus. |
| (3) | Given the rent forbearance status of the River Club and current rent schedule, no revenues from the River Club premises are included in the underwritten cash flow. |
| (4) | Occupancy % and Vacancy & Credit Loss reported reflect the vacancy assumption in the related appraisal for purposes of determining the appraised value of the River House Coop Property as a multifamily rental property. |
| This is not a research report and was not prepared by any Underwriter’s research department. Please see additional important information and qualifications at the end of this Term Sheet. |
68
| Multifamily – Cooperative | Loan #4 | Cut-off Date Balance: | $54,898,724 | |
| 435 East 52nd Street aka 433-449 | River House Coop | Cut-off Date LTV: | 10.6% | |
| East 52nd Street | U/W NCF DSCR: | 3.56x | ||
| New York, NY 10022 | U/W NOI Debt Yield: | 16.7% |
Escrows and Reserves.
Taxes – At origination, the borrower made an upfront deposit of $397,526 for real estate taxes. In addition, the River House Coop Mortgage Loan documents provide for ongoing monthly deposits into a reserve for real estate taxes in an amount equal to 1/12 of the real estate taxes that the lender estimates will be payable during the next twelve months (initially, $397,526).
Insurance – At origination, the borrower made an upfront deposit of $168,468 for insurance premiums. In addition, the River House Coop Mortgage Loan documents provide for ongoing monthly deposits into a reserve for insurance premiums in an amount equal to 1/12 of the insurance premiums that the lender estimates will be payable for the renewal of coverage upon the expiration of the insurance policies (initially, $18,719). Notwithstanding the foregoing, the borrower is not required to make such monthly deposits if (i) no event of default is continuing, (ii) the borrower provides the lender with evidence reasonably satisfactory to the lender that all insurance coverages for the River House Coop Property are being maintained through one or more blanket policies, and (iii) the borrower provides the lender with paid receipts for the payment of the insurance premiums no later than twenty days prior to the expiration of the current policy.
Recurring Replacements Reserve – The River House Coop Mortgage Loan documents provide for ongoing monthly deposits of approximately $1,542 into a reserve for approved capital expenditures, provided and on condition that such deposits are not required if each and all of the Conditions Precedent (as defined below) are satisfied and remain satisfied at all times. “Conditions Precedent” means the following conditions precedent: (i) no event of default is continuing, (ii) the borrower maintains in its operating, or similar banking, account as of the end of each calendar year, minimum cash balances of at least $3,000,000 (“Reserve Balance”), and (iii) the borrower provides a banking statement(s) evidencing the Reserve Balance to the lender by January 20th of each calendar year.
Completion/Repair Reserve – The River House Coop Mortgage Loan documents provide for an upfront reserve of $8,750 for required repairs, including improvements to fire protection systems and removing outstanding Department of Building and Environmental Control Board code violations.
Outstanding TI/LC – The River House Coop Mortgage Loan documents provide for ongoing monthly deposits of approximately $10,833 into a reserve for tenant improvements and/or leasing commissions, provided and on condition that such deposits are not required if each and all of the Conditions Precedent are satisfied and remain satisfied at all times.
Lockbox and Cash Management. The River House Coop Mortgage Loan does not require a lockbox or cash management.
Additional Secured Indebtedness (not including trade debts). Not permitted.
Mezzanine Loan and Preferred Equity. Not permitted.
Release of Property. Not permitted.
Letter of Credit. None.
Right of First Offer / Right of First Refusal. None
Ground Lease. None
Terrorism Insurance.
The borrower is required to obtain and maintain an “all risk” property insurance policy that covers acts of terrorism in an amount equal to the “full replacement cost” of the River House Coop Property together with business income insurance covering not less than the 18-month period commencing at the time of loss, together with an extended period of indemnity endorsement which provides that after the physical loss to the improvements and personal property has been repaired the continued loss of income will be insured until such income either returns to the same level it was at prior to the loss or for such period as may be reasonably required by the lender. Notwithstanding the foregoing, for so long as the Terrorism Risk Insurance Act of 2002, as extended and modified by the Terrorism Risk Insurance Program Reauthorization Act of 2015 (“TRIPRA”) is in effect including any extensions thereof or if another federal governmental program is in effect relating to “acts of terrorism” which provides substantially similar protections as TRIPRA, the lender is required to accept terrorism insurance which covers against “covered acts” as defined by TRIPRA (or such other program) as full compliance with the loan documents, but only in the event that TRIPRA (or such other program) continues to cover both domestic and foreign acts of terrorism. See “Risk Factors—Risks Relating to the Mortgage Loans—Terrorism Insurance May Not Be Available for All Mortgaged Properties” in the prospectus.
| This is not a research report and was not prepared by any Underwriter’s research department. Please see additional important information and qualifications at the end of this Term Sheet. |
69
| Office – CBD | Loan #5 | Cut-off Date Balance: | $54,000,000 | |
| 375 Pearl Street | 375 Pearl Street | Cut-off Date LTV: | 60.3% | |
| New York, NY 10038 | UW NCF DSCR: | 2.67x | ||
| UW NOI Debt Yield: | 9.2% |

| This is not a research report and was not prepared by any Underwriter’s research department. Please see additional important information and qualifications at the end of this Term Sheet. |
70
| Office – CBD | Loan #5 | Cut-off Date Balance: | $54,000,000 | |
| 375 Pearl Street | 375 Pearl Street | Cut-off Date LTV: | 60.3% | |
| New York, NY 10038 | UW NCF DSCR: | 2.67x | ||
| UW NOI Debt Yield: | 9.2% |
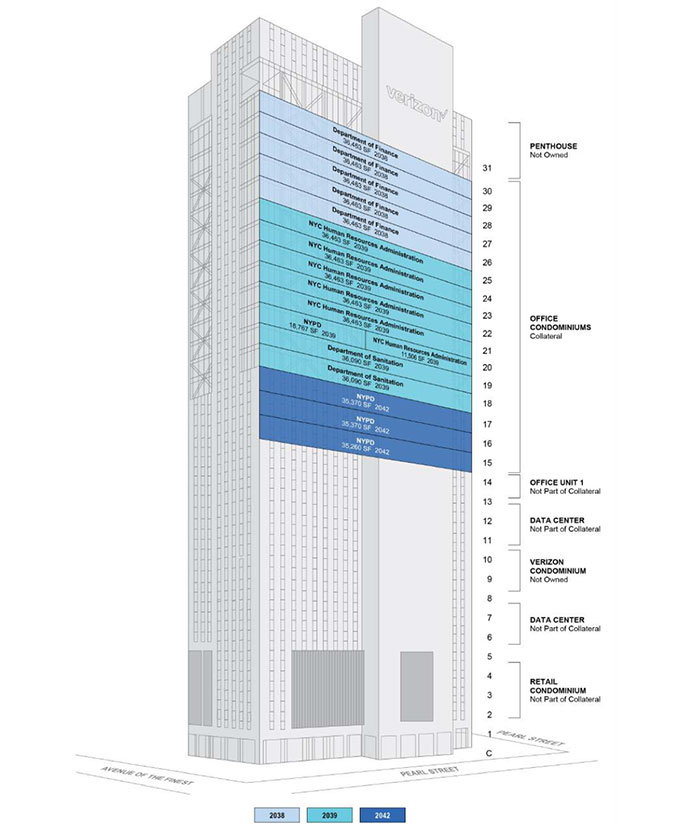
| This is not a research report and was not prepared by any Underwriter’s research department. Please see additional important information and qualifications at the end of this Term Sheet. |
71
| Office – CBD | Loan #5 | Cut-off Date Balance: | $54,000,000 | |
| 375 Pearl Street | 375 Pearl Street | Cut-off Date LTV: | 60.3% | |
| New York, NY 10038 | UW NCF DSCR: | 2.67x | ||
| UW NOI Debt Yield: | 9.2% |
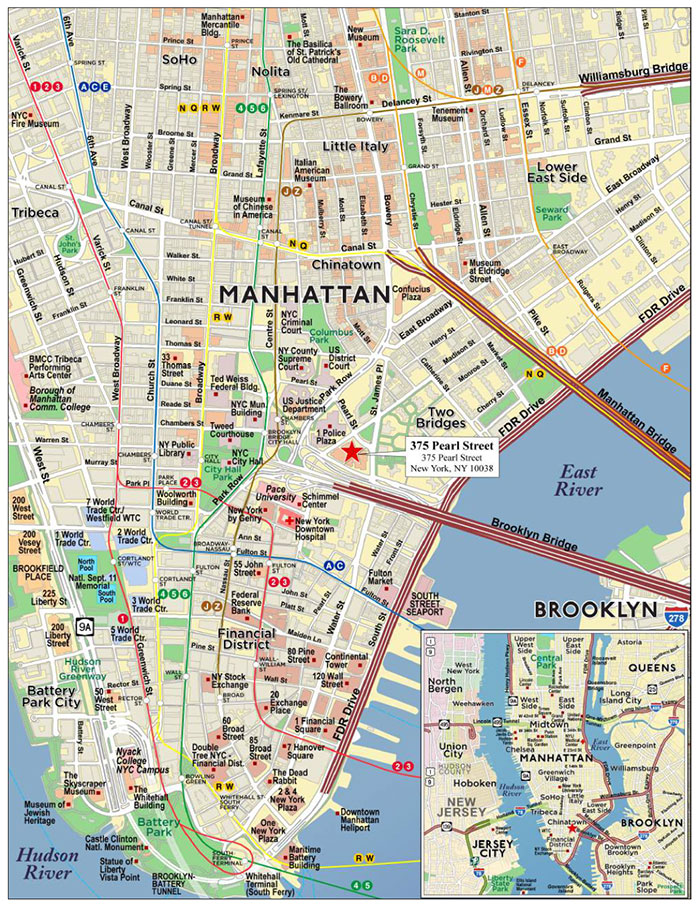
| This is not a research report and was not prepared by any Underwriter’s research department. Please see additional important information and qualifications at the end of this Term Sheet. |
72
| Mortgage Loan No. 5 – 375 Pearl Street |
| Mortgage Loan Information | Property Information | |||||
| Mortgage Loan Seller: | WFB | Single Asset/Portfolio: | Single Asset | |||
| Credit Assessment (DBRSM/Fitch/S&P): | NR/NR/NR | Location: | New York, NY 10038 | |||
| Original Balance(1): | $54,000,000 | General Property Type: | Office | |||
| Cut-off Date Balance(1): | $54,000,000 | Detailed Property Type: | CBD | |||
| % of Initial Pool Balance: | 3.9% | Title Vesting: | Fee | |||
| Loan Purpose: | Refinance | Year Built/Renovated: | 1975/2018 | |||
| Sponsor: | Sabey-National Properties LLC | Size: | 573,083 SF | |||
| Guarantor: | Indure Build-To-Core Fund, LLC | Cut-off Date Balance per SF(1): | $383.89 | |||
| Mortgage Rate: | 3.3682% | Maturity Balance per SF(1): | $383.89 | |||
| Note Date: | 6/1/2021 | Property Manager: | CBRE, Inc. | |||
| First Payment Date: | 7/11/2021 | |||||
| Maturity Date: | 6/11/2031 | |||||
| Original Term to Maturity: | 120 months | |||||
| Original Amortization Term: | 0 months | Underwriting and Financial Information(5) | ||||
| IO Period: | 120 months | UW NOI(1)(6): | $20,201,380 | |||
| Seasoning: | 2 months | UW NOI Debt Yield(1): | 9.2% | |||
| Prepayment Provisions: | L(26),D(87),O(7) | UW NOI Debt Yield at Maturity(1): | 9.2% | |||
| Lockbox/Cash Mgmt Status: | Hard/Springing | UW NCF DSCR(1): | 2.67x | |||
| Additional Debt Type(1)(2)(3): | Pari Passu / Mezzanine | Most Recent NOI(6): | $12,454,512 (12/31/2020) | |||
| Additional Debt Balance(1)(2)(3): | $166,000,000 / $30,000,000 | 2nd Most Recent NOI(6): | $3,202,972 (12/31/2019) | |||
| Future Debt Permitted (Type): | No (NAP) | 3rd Most Recent NOI(6): | NAP | |||
| Reserves(4) | Most Recent Occupancy: | 100.0% (5/1/2021) | ||||
| Type | Initial | Monthly | Cap | 2nd Most Recent Occupancy: | 81.5% (12/31/2020) | |
| RE Taxes: | $0 | Springing | NAP | 3rd Most Recent Occupancy: | 81.5% (12/31/2019) | |
| Insurance: | $0 | Springing | NAP | Appraised Value (as of)(7): | $365,000,000 (5/1/2021) | |
| Landlord Work Reserve: | $2,963,439 | $0 | NAP | Appraised Value per SF(7): | $636.91 | |
| Replacement Reserves: | $0 | Springing | NAP | Cut-off Date LTV Ratio(1)(7): | 60.3% | |
| Termination Fee Reserve: | $0 | Springing | (4)) | Maturity Date LTV Ratio(1)(7): | 60.3% | |
| Rent Concession Reserve: | $2,882,231 | $0 | NAP | |||
| Sources and Uses | ||||||
| Sources | Proceeds | % of Total | Uses | Proceeds | % of Total | |
| Whole Loan Amount(1): | $220,000,000 | 88.0% | Loan Payoff: | $234,451,625 | 93.8% | |
| Mezzanine Loan(3) | $30,000,000 | 12.0% | Upfront Reserves: | $5,845,670 | 2.3% | |
| Closing Costs: | $3,151,476 | 1.3% | ||||
| Return of Equity: | $6,551,229 | 2.6% | ||||
| Total Sources: | $250,000,000 | 100.0% | Total Uses: | $250,000,000 | 100.0% | |
| (1) | The 375 Pearl Street Mortgage Loan (as defined below) is part of the 375 Pearl Street Whole Loan (as defined below) with an original aggregate principal balance of $220,000,000. The Cut-off Date Balance per SF, Maturity Date Balance per SF, UW NOI Debt Yield, UW NOI Debt Yield at Maturity, UW NCF DSCR, Cut-off Date LTV Ratio and Maturity Date LTV Ratio numbers presented above are based on the 375 Pearl Street Whole Loan. |
| (2) | See “The Mortgage Loan” and “Additional Secured Indebtedness (not including trade debts)” below for further discussion of additional mortgage debt. |
| (3) | See “Mezzanine Loan and Preferred Equity” below for further discussion of mezzanine debt. |
| (4) | See “Escrows and Reserves” below for further discussion of reserve requirements. |
| (5) | The novel coronavirus pandemic is an evolving situation and could impact the 375 Pearl Street Whole Loan more severely than assumed in the underwriting of the 375 Pearl Street Whole Loan and could adversely affect the NOI, NCF and occupancy information, as well as the appraised value and the DSCR, LTV and Debt Yield metrics presented above and herein. See “Risk Factors—Risks Related to Market Conditions and Other External Factors—The Coronavirus Pandemic Has Adversely Affected the Global Economy and Will Likely Adversely Affect the Performance of the Mortgage Loans” in the prospectus. |
| (6) | See “Operating History and Underwritten Net Cash Flow” section below for information regarding year-over-year increases in NOI and increase to UW NOI from the Most Recent NOI. |
| (7) | The appraisal concluded to a “Hypothetical Market Value” of $365,000,000 as of May 1, 2021, which assumes contractually obligated free rent, tenant improvements, and capital improvements have been escrowed. The appraisal also concluded to an “As-Is” value of $360,000,000 as of the same date. The appraiser’s “Hypothetical Market Value” and “As-Is” value each include an estimated $1,600,000 of value for the ICAP (as defined below) tax benefits. |
The Mortgage Loan. The fifth largest mortgage loan (the “375 Pearl Street Mortgage Loan”) is part of a whole loan (the “375 Pearl Street Whole Loan”) that is evidenced by four pari passu promissory notes in the aggregate original principal amount of $220,000,000. The 375 Pearl Street Whole Loan is secured by a first priority fee mortgage encumbering a 573,083 SF office condominium in New York, New York (the “375 Pearl Street Property”). The 375 Pearl Street Whole Loan was co-originated by Wells Fargo Bank, National Association and JPMorgan Chase Bank, National Association. The 375 Pearl Street Mortgage Loan is evidenced by the non-controlling promissory Note A-3 in the original principal amount of $54,000,000. The controlling promissory Note A-1, in the original principal amount of $80,000,000, along with the non-controlling promissory Note A-4 was contributed to the BANK 2021-BNK34 securitization trust, and the non-controlling promissory Note A-2 in the original principal amount of $66,000,000 (together with Note A-1 and Note A-4, the “375 Pearl Street Non-Serviced Pari Passu Companion Loans”) was contributed to the BMARK 2021-B27 securitization trust. The 375 Pearl Street Whole Loan will be serviced pursuant to the pooling and servicing agreement for the BANK 2021-BNK34 securitization trust. See “Description of the Mortgage Pool—The Whole Loans—The Non-Serviced Pari Passu Whole Loans” and “Pooling and Servicing Agreement—Servicing of the Non-Serviced Mortgage
| This is not a research report and was not prepared by any Underwriter’s research department. Please see additional important information and qualifications at the end of this Term Sheet. |
73
| Office – CBD | Loan #5 | Cut-off Date Balance: | $54,000,000 | |
| 375 Pearl Street | 375 Pearl Street | Cut-off Date LTV: | 60.3% | |
| New York, NY 10038 | UW NCF DSCR: | 2.67x | ||
| UW NOI Debt Yield: | 9.2% |
Loans” in the prospectus. The proceeds of the 375 Pearl Street Whole Loan were primarily used to pay off existing debt, fund reserves pay closing costs and return borrower sponsor equity.
| 375 Pearl Street Whole Loan Summary | ||||
| Notes | Original Balance | Cut-off Date Balance | Note Holder | Controlling Piece |
| A-1 | $80,000,000 | $80,000,000 | BANK 2021-BNK34 | Yes |
| A-2 | $66,000,000 | $66,000,000 | BMARK 2021-B27 | No |
| A-3 | $54,000,000 | $54,000,000 | BANK 2021-BNK35 | No |
| A-4 | $20,000,000 | $20,000,000 | BANK 2021-BNK34 | No |
| Total Whole Loan | $220,000,000 | $220,000,000 | ||
The Borrower and the Borrower Sponsors. The borrower is Intergate.Manhattan Office LLC, a Delaware limited liability company and single purpose entity with two independent directors. The borrower sponsor under the 375 Pearl Street Whole Loan is Sabey-National Properties LLC, and the nonrecourse carveout guarantor is Indure Build-To-Core Fund, LLC.
The borrower is 51.5% owned by Sabey Properties LLC, an affiliate of Sabey Corporation (“Sabey”) and 48.5% owned by The Indure Build-To-Core Fund, LLC (the guarantor of the 375 Pearl Street Whole Loan and an affiliate of National Real Estate Advisors, LLC (“NREA”)). Sabey is a privately held real estate development and investment company specializing in mission critical and other technical space for the data center, medical and life sciences, education, government and military sectors. Over the past 40 years, Sabey has designed, constructed, and operated more than 30 million SF of space. NREA is a subsidiary of the National Electric Benefit Fund and specializes in developing and owning large-scale, urban commercial and multifamily projects for its institutional clients. NREA constructs various asset types including apartment, office, mixed-use, industrial, data center, and hotel.
The Property. The 375 Pearl Street Property consists of an office condominium totaling 573,083 SF located on floors 15 through 30 of the 375 Pearl Street building, a 32-story class A office and data center property located in New York, New York, and built in 1975. The entire 375 Pearl Street building contains 806,001 SF of gross building area situated on a 58,193 SF parcel of land. The 375 Pearl Street Property was renovated from data center use to office space in 2016 to 2018, and limestone walls on the top 15 stories of the building were removed and replaced with plate glass panels to improve the aesthetics and attract office tenants. In total, the borrower sponsors spent approximately $159 million in capital improvements at the 375 Pearl Street building. The 375 Pearl Street Property features approximately 37,000 SF floor plates and unobstructed 360-degree views due to the building’s location in a low-rise area.
The 375 Pearl Street Property is fully leased to four New York City agencies through leases with NYC Human Resources Administration, the Department of Finance, the New York City Police Department (“NYPD”), and the Department of Sanitation with all leases expiring between 2038 and 2042. The 375 Pearl Street building is located immediately adjacent to City Hall, One Police Plaza, and One Centre Street. According to the appraisal, NYC agencies own or occupy over 2.3 million SF of office space in the area of the 375 Pearl Street building, and all tenants of the 375 Pearl Street Property occupy additional office space in the immediate surrounding area. Further, according to the appraisal, the tenants at the 375 Pearl Street Property have invested approximately $44.5 million of capital into the buildout of their respective spaces.
Condominium Regime. The 375 Pearl Street Property is comprised of the borrower’s unit-ownership in a fractional condominium regime governing the 375 Pearl Street building (the “375 Pearl Street Condominium”). The 375 Pearl Street Condominium is comprised of “Verizon Units” (three mid-rise floors, plus sub-grade space for a telephone cable vault and switching equipment) and the “Principal Unit” (the remaining twenty-nine floors). Except for a third party-owned office unit on the 31st floor, the Principal Unit is owned either by the borrower (floors 15 through 30) or by affiliates of the borrower sponsor. Generally, the 375 Pearl Street Condominium is governed by a three-member “Board of Managers”, with matters specifically allocated to the Principal Unit being governed by a nine-member Principal Board. The borrower can effectively appoint one member of the current Board of Managers, and the borrower sponsor affiliates (as owner of additional units within the Principal Unit) can appoint an additional member. With respect to the Principal Board, the borrower can appoint three members, and the borrower sponsor affiliates can appoint five additional members. See “Description of the Mortgage Pool – Mortgage Pool Characteristics – Condominium and Other Shared Interests” in the prospectus.
Major Tenant.
NYC Human Resources Administration (193,821 SF, 33.8% of NRA; 34.3% of underwritten base rent; September 13, 2039 lease expiration) The NYC Human Resources Administration is a municipal agency serving more than three million people per year that fights poverty and provides New York City residents with tools and support to alleviate inequalities. Programs of the NYC Human Resources Administration include Child Support, Emergency Food Programs, Cash Assistance, Adult Protective Services, and a Job Center. According to the appraisal, the agency has a large footprint in Downtown Manhattan with six additional offices in Lower Manhattan and 10 offices directly across the Brooklyn Bridge. According to the appraisal, the NYC Human Resources Administration has invested approximately $11.0 million (approximately $57 PSF) into its space. The NYC Human Resources Administration has a termination option in September 2029 with 12 months’ notice and payment of a termination fee of approximately $22.3 million (See “Termination Option Summary” below).
Department of Finance (182,315 SF, 31.8% of NRA; 32.7% of underwritten base rent; September 13, 2038 lease expiration) The New York City Department of Finance administers the tax and revenue laws of New York City. The Department of Finance is the taxation agency, recorder of deeds, and revenue service provider of New York City. The department’s responsibilities include administering parking violations and overseeing the sheriff’s office. According to the appraisal, the Department of Finance has invested approximately $12.0 million (approximately $66 PSF) into its space. The Department of Finance has a termination option in September 2028 with 12 months’ notice and payment of a termination fee of approximately $21.1 million (See “Termination Option Summary” below).
NYPD (124,767 SF, 21.8% of NRA; 20.1% of underwritten base rent; Various lease expirations) The NYPD is the largest law enforcement agency in the world, providing security and safety to the residents, workers, and visitors throughout the five boroughs of New York City. There are currently over 34,000 uniformed members and over 15,000 civilian members employed by the NYPD. The NYPD has expanded its headquarters by moving its federal monitor and compliance units to the 20th floor of the 375 Pearl Street Property, and utilizing floors 15 through 17 to provide expansion space for the adjacent One
| This is not a research report and was not prepared by any Underwriter’s research department. Please see additional important information and qualifications at the end of this Term Sheet. |
74
| Office – CBD | Loan #5 | Cut-off Date Balance: | $54,000,000 | |
| 375 Pearl Street | 375 Pearl Street | Cut-off Date LTV: | 60.3% | |
| New York, NY 10038 | UW NCF DSCR: | 2.67x | ||
| UW NOI Debt Yield: | 9.2% |
Police Plaza. The NYPD has occupied its 20th floor space since 2018. The NYPD has a signed lease for its space on floors 15 through 17 but is not yet in occupancy and is expected to begin paying rent in January 2022. According to the appraisal, the NYPD has invested approximately $14.7 million (approximately $118 PSF) into its space. The NYPD has two termination options (one in April 2029 for its 20th floor space, and one in February 2032 for its space on floors 15 through 17) with 12 months’ notice and payment of a termination fee (approximately $915,014 for the Floor 20 space, and $11.8 million for the space on floors 15 through 17) (See “Termination Option Summary” below).
Department of Sanitation (72,180 SF, 12.6% of NRA; 12.9% of underwritten base rent; September 23, 2039 lease expiration) The New York City Department of Sanitation is the world’s largest sanitation department and manages approximately 6,300 miles of streets throughout the five boroughs of New York City. The Department of Sanitation is responsible for garbage and recycling collecting, snow removal, and street cleaning. The Department of Sanitation’s headquarters are a 10-minute walk from the 375 Pearl Street Property. According to the appraisal, the Department of Sanitation has invested approximately $6.8 million (approximately $94 PSF) into its space. The Department of Sanitation has a termination option in September 2029 with 12 months’ notice and payment of a termination fee of approximately $8.7 million (See “Termination Option Summary” below).
The following table presents certain information relating to the tenancy at the 375 Pearl Street Property:
| Tenant Summary | |||||||||
| Tenant Name | Credit Rating (Fitch/ Moody’s/ S&P)(1) | Tenant SF | Approx. % of SF | Annual UW Rent(1) | % of Total Annual UW Rent | Annual UW Rent PSF(1) | Termination Option (Y/N)(2) | Lease Exp. | Renewal Options |
| NYC Human Resources Administration | AA-/Aa2/AA | 193,821 | 33.8% | $8,964,223 | 34.3% | $46.25 | Y | 9/13/2039 | 2, 5-year |
| Department of Finance | AA-/Aa2/AA | 182,315 | 31.8% | $8,523,225 | 32.7% | $46.75 | Y | 9/13/2038 | 2, 5-year |
| NYPD (Floors 15-17)(3) | AA-/Aa2/AA | 106,000 | 18.5% | $4,505,000 | 17.3% | $42.50 | Y | 1/21/2042 | 2, 5-year |
| Department of Sanitation | AA-/Aa2/AA | 72,180 | 12.6% | $3,374,416 | 12.9% | $46.75 | Y | 9/23/2039 | 2, 5-year |
| NYPD (Floor 20)(3) | AA-/Aa2/AA | 18,767 | 3.3% | $731,913 | 2.8% | $39.00 | Y | 4/10/2039 | 2, 5-year |
| Subtotal/Wtd. Avg. | 573,083 | 100.0% | $26,098,777 | 100.0% | $45.54 | ||||
| Other Tenants | 0 | 0.0% | $0 | 0.0% | $0.00 | ||||
| Vacant Space | 0 | 0.0% | $0 | 0.0% | $0.00 | ||||
| Total/Wtd. Avg. | 573,083 | 100.0% | $26,098,777 | 100.0% | $45.54 | ||||
| (1) | Ratings shown represent the City of New York, which is the entity on each tenant’s lease. |
| (2) | Each lease contains a one-time termination right effective on the 10th anniversary of the rent commencement date, provided that the tenant provides 12 months’ notice and pays a termination fee. See “Termination Option Summary” below for further details on the termination option effective dates and estimated termination fees for each tenant. |
| (3) | The NYPD has executed a lease for its space on floors 15 through 17 but has not yet taken occupancy. NYPD is expected to begin paying rent in January 2022. The tenant is currently in occupancy and paying full rent on its 20th floor space. |
| Termination Option Summary(1) | |||
| Tenant | Estimated Fee(2) | Estimated Fee PSF(2) | Termination Effective Date |
| NYC Human Resources Administration | $22,318,637 | $115.15 | 9/14/2029 |
| Department of Finance | $21,095,726 | $115.71 | 9/14/2028 |
| NYPD (Floors 15-17) | $11,752,356 | $110.87 | 2/16/2032 |
| Department of Sanitation | $8,746,206 | $121.17 | 9/24/2029 |
| NYPD (Floor 20) | $915,014 | $48.76 | 4/11/2029 |
| Total | $64,827,939 | $113.12 | |
| (1) | Information obtained from the appraisal. |
| (2) | The termination fee for each tenant is equal to the sum of the unamortized portion of the landlord’s contribution, leasing commission and free rent amount, amortized on a straight-line basis over a 20-year period with interest at 6% per annum plus the total rent amount for the 6 months following the termination date (however, the NYPD 20th floor lease does not include interest in its amortization schedule as well as the total rent amount for the 6 months following the termination date). |
| This is not a research report and was not prepared by any Underwriter’s research department. Please see additional important information and qualifications at the end of this Term Sheet. |
75
| Office – CBD | Loan #5 | Cut-off Date Balance: | $54,000,000 | |
| 375 Pearl Street | 375 Pearl Street | Cut-off Date LTV: | 60.3% | |
| New York, NY 10038 | UW NCF DSCR: | 2.67x | ||
| UW NOI Debt Yield: | 9.2% |
The following table presents certain information relating to the lease rollover schedule at the 375 Pearl Street Property:
| Lease Rollover Schedule(1)(2) | ||||||||
| Year | # of Leases Rolling | SF Rolling | Annual UW Rent PSF Rolling | Approx. % of Total SF Rolling | Approx. Cumulative % of SF Rolling | Total UW Rent Rolling | Approx. % of Total Rent Rolling | Approx. Cumulative % of Total Rent Rolling |
| MTM | 0 | 0 | $0.00 | 0.0% | 0.0% | $0 | 0.0% | 0.0% |
| 2021 | 0 | 0 | $0.00 | 0.0% | 0.0% | $0 | 0.0% | 0.0% |
| 2022 | 0 | 0 | $0.00 | 0.0% | 0.0% | $0 | 0.0% | 0.0% |
| 2023 | 0 | 0 | $0.00 | 0.0% | 0.0% | $0 | 0.0% | 0.0% |
| 2024 | 0 | 0 | $0.00 | 0.0% | 0.0% | $0 | 0.0% | 0.0% |
| 2025 | 0 | 0 | $0.00 | 0.0% | 0.0% | $0 | 0.0% | 0.0% |
| 2026 | 0 | 0 | $0.00 | 0.0% | 0.0% | $0 | 0.0% | 0.0% |
| 2027 | 0 | 0 | $0.00 | 0.0% | 0.0% | $0 | 0.0% | 0.0% |
| 2028 | 0 | 0 | $0.00 | 0.0% | 0.0% | $0 | 0.0% | 0.0% |
| 2029 | 0 | 0 | $0.00 | 0.0% | 0.0% | $0 | 0.0% | 0.0% |
| 2030 | 0 | 0 | $0.00 | 0.0% | 0.0% | $0 | 0.0% | 0.0% |
| 2031 | 0 | 0 | $0.00 | 0.0% | 0.0% | $0 | 0.0% | 0.0% |
| 2032 & Beyond | 5 | 573,083 | $45.54 | 100.0% | 100.0% | $26,098,777 | 100.0% | 100.0% |
| Vacant | 0 | 0 | $0.00 | 0.0% | 100.0% | $0.00 | 0.0% | 100.0% |
| Total/Wtd. Avg. | 5 | 573,083 | $45.54 | 100.0% | $26,098,777 | 100.0% | ||
| (1) | Information is based on the underwritten rent roll. |
| (2) | All tenants have termination options, which are not accounted for on this table. See “Termination Option Summary” above. |
COVID-19 Update. As of July 14, 2021, the 375 Pearl Street Property was open and operational. All tenants paid full rent for May and June 2021 and there have been no rent relief requests through the COVID-19 pandemic. The 375 Pearl Street Whole Loan is not subject to any modification or forbearance request. The May, June and July 2021 debt service payments have been made for the 375 Pearl Street Whole Loan.
The Market. The 375 Pearl Street Property is situated within the City Hall office submarket of Downtown Manhattan in New York, New York and is bordered by Pearl Street to the east and south, Avenue of the Finest to the west, and Madison Street to the north. The building is also adjacent to the Manhattan-side entrance of the Brooklyn Bridge. The 375 Pearl Street Property is situated immediately adjacent to City Hall, One Police Plaza, and One Centre Street. According to the appraisal, NYC agencies own or occupy over 2.3 million SF of office space in the area of the 375 Pearl Street building, and all tenants of the 375 Pearl Street Property occupy additional office space in the immediate surrounding area.
According to the appraisal, as of the fourth quarter of 2020, the City Hall submarket reported total inventory of approximately 7.7 million SF with a 7.0% direct vacancy rate (8.8% overall vacancy rate) and average asking rent of $60.25 PSF. The appraiser concluded to a market rent for the 375 Pearl Street Property of $44.00 PSF for floors 15 to 17, $49.00 PSF for floors 18 to 22, and $52.00 PSF for floors 23 to 30, all on a modified gross basis.
The following table presents certain information relating to the appraisal’s market rent conclusions for the 375 Pearl Street Property:
| Market Rent Summary(1) | |||
| Floors 15-17 | Floors 18-22 | Floors 23-30 | |
| Market Rent (PSF) | $44.00 | $49.00 | $52.00 |
| Lease Term (Years) | 10 | 10 | 10 |
| Lease Type | MG | MG | MG |
| Rent Increase Projection | 10%/5 years | 10%/5 years | 10%/5 years |
| (1) | Information obtained from the appraisal. | |
| This is not a research report and was not prepared by any Underwriter’s research department. Please see additional important information and qualifications at the end of this Term Sheet. |
76
| Office – CBD | Loan #5 | Cut-off Date Balance: | $54,000,000 | |
| 375 Pearl Street | 375 Pearl Street | Cut-off Date LTV: | 60.3% | |
| New York, NY 10038 | UW NCF DSCR: | 2.67x | ||
| UW NOI Debt Yield: | 9.2% |
Operating History and Underwritten Net Cash Flow. The following table presents certain information relating to the historical operating performance and Underwritten Net Cash Flow at the 375 Pearl Street Property:
| Cash Flow Analysis(1) | ||||
| 2019 | 2020 | UW | UW PSF | |
| Gross Potential Base Rent | $21,403,560 | $21,836,662 | $26,098,777 | $45.54 |
| Rent Average Benefit | $0 | $0 | $3,852,698(2) | $6.72 |
| Free Rent | ($8,853,132) | $0 | $0 | $0.00 |
| Total Recoveries | $133,660 | $719,425 | $1,758,512 | $3.07 |
| Other Income | $714,779 | $736,581 | $756,242 | $1.32 |
| Less Vacancy & Credit Loss | $0 | $0 | $0(3) | $0.00 |
| Effective Gross Income | $13,398,867 | $23,292,668 | $32,466,229 | $56.65 |
| Real Estate Taxes | $3,493,494 | $2,888,190 | $3,465,549(4) | $6.05 |
| Insurance | $366,563 | $375,095 | $415,260 | $0.72 |
| Other Operating Expenses | $6,335,838 | $7,574,871 | $8,384,040 | $14.63 |
| Total Expenses | $10,195,895 | $10,838,156 | $12,264,849 | $21.40 |
| Net Operating Income(5) | $3,202,972 | $12,454,512 | $20,201,380 | $35.25 |
| CapEx | $0 | $0 | $114,617 | $0.20 |
| TI/LC | $0 | $0 | $0 | $0.00 |
| Net Cash Flow | $3,202,972 | $12,454,512 | $20,086,764 | $35.05 |
| Occupancy %(6) | 81.5% | 81.5% | 100.0% | |
| NOI DSCR(7) | 0.43x | 1.66x | 2.69x | |
| NCF DSCR(7) | 0.43x | 1.66x | 2.67x | |
| NOI Debt Yield(7) | 1.5% | 5.7% | 9.2% | |
| NCF Debt Yield(7) | 1.5% | 5.7% | 9.1% | |
| (1) | Prior historical operating history is not available, as the 375 Pearl Street Property was renovated and converted from data center space to professional office space in 2016 through 2018. |
| (2) | Represents straight-line rent averaging through each tenant’s lease expiration due to the investment-grade nature of the tenants. |
| (3) | The underwritten economic vacancy is 0.0%. The 375 Pearl Street Property was 100.0% leased as of May 1, 2021. |
| (4) | The 375 Pearl Street Property is subject to a 10-year tax abatement via the Industrial & Commercial Incentive Program (ICAP) as a result of its recent renovation. The ICAP abatement commenced in the 2016/2017 tax year and will expire at the end of the 2025/2026 tax year. According to a third-party tax projection analysis provided by the borrower, the estimated taxes inclusive of ICAP benefit for the 2020/2021 and 2021/2022 tax years were $2,854,104 and $3,677,695, respectively; and the real estate taxes were underwritten based on a blend of these two numbers. According to the same analysis, the estimated full unabated taxes for the 2020/2021 and 2026/2027 (once the ICAP benefit expires) tax years are $3,603,985 and $5,912,415, respectively. |
| (5) | The increase in Net Operating Income from 2019 to 2020 and from 2020 to U/W was due to tenant lease commencements and expiration of free rent periods following the completion of renovations at the 375 Pearl Street Property in 2018. The Department of Finance’s lease commenced in September 2018; The NYPD’s lease for floor 20 commenced in October 2018; The Department of Sanitation and the NYC Human Resource Administration’s leases commenced in January 2019; and The NYPD’s lease for floors 15 through 17 commenced in April 2021. |
| (6) | Historical occupancy prior to 2019 is not available, as the 375 Pearl Street Property was renovated and converted from data center space to office space from 2016 to 2018. |
| (7) | The debt service coverage ratios and debt yields are based on the 375 Pearl Street Whole Loan. |
Escrows and Reserves.
Real Estate Taxes – During a Cash Trap Event Period (as defined below), ongoing monthly real estate tax reserves are required in an amount equal to one-twelfth of the real estate taxes that the lender estimates will be payable during the next 12 months
Insurance – During a Cash Trap Event Period, ongoing monthly insurance reserves are required in an amount equal to one-twelfth of the insurance premiums that the lender estimates will be payable for the renewal of the coverage afforded by the policies upon the expiration thereof.
However, the borrower’s obligation to make insurance reserve payments will be waived so long as, (i) no event of default is continuing, (ii) the insurance policies maintained by the borrower are part of a blanket or umbrella policy approved by the lender in its reasonable discretion, (iii) the borrower provides the lender with paid receipts for the payment of the insurance premiums by no later than 10 business days prior to the expiration dates of said policies, and (iv) the borrower provides evidence of renewal of such policies.
Landlord Work Reserve – The loan documents require an upfront reserve of $2,963,439 for open contract payables with respect to certain ongoing construction work pursuant to contracts with contractors.
Replacement Reserve – During a Cash Trap Event Period, ongoing monthly replacement reserves are required in the amount of $4,776 ($0.10 PSF annually).
Termination Fee Reserve– The borrower is required to deposit termination fees or payments into the termination fee reserve account if either (a) the termination fee or payment is equal to or greater than $50,000, (b) the related event has a material adverse effect on the 375 Pearl Street Property, the borrower or the guarantor (among other conditions outlined in the loan documents), and/or (c) an event of default or Cash Trap Event Period is continuing. As long as no Cash Trap Event Period is continuing, the termination fee reserve account is subject to a cap in an amount equal to $80 PSF of the related premises (“Termination Fee Reserve Cap”). If a Cash Trap Event Period is ongoing, funds in excess of the Termination Fee Reserve Cap are required to
| This is not a research report and was not prepared by any Underwriter’s research department. Please see additional important information and qualifications at the end of this Term Sheet. |
77
| Office – CBD | Loan #5 | Cut-off Date Balance: | $54,000,000 | |
| 375 Pearl Street | 375 Pearl Street | Cut-off Date LTV: | 60.3% | |
| New York, NY 10038 | UW NCF DSCR: | 2.67x | ||
| UW NOI Debt Yield: | 9.2% |
deposited into the excess cash flow subaccount (see “Lockbox and Cash Management” section below). Funds in the Termination Fee Reserve account may only be used for qualified leasing expenses incurred in connection with the space related to the applicable termination fee or payment.
Rent Concession Reserve - The loan documents require an upfront reserve of $2,882,231 related to rent concessions through January 2022.
Lockbox and Cash Management. The 375 Pearl Street Whole Loan is structured with a hard lockbox and springing cash management. The borrower is required to deposit all rents within two business days of receipt, and to direct all tenants to make direct rent deposits into the lockbox account. As long as a Cash Trap Event Period is not in effect, all funds in the lockbox account are required to be distributed to the borrower. During a Cash Trap Event Period, all funds in the lockbox account are required to be swept to a lender-controlled cash management account. Any excess cash flow remaining after satisfaction of the waterfall items outlined in the loan documents is required (i) if a Cash Trap Event Period is in effect, to be swept to an excess cash flow subaccount controlled by the lender as additional security for the 375 Pearl Street Whole Loan or (ii) if a Cash Trap Event Period is not in effect and no event of default is continuing, to be disbursed to the borrower.
A “Cash Trap Event Period” will commence upon the earlier of the following:
| (i) | the occurrence of an event of default under the 375 Pearl Street Whole Loan or 375 Pearl Street Mezzanine Loan; or |
| (ii) | the net cash flow debt yield falling below 5.25% for the aggregate 375 Pearl Street Whole Loan and the 375 Pearl Street Mezzanine Loan (collectively, the “375 Pearl Street Total Debt”, tested quarterly, or upon any termination, modification or amendment or settlement of any lease, or any release or discharge of any tenant under its lease obligation). |
A Cash Trap Event Period will end upon the occurrence of the following:
| ● | with regard to clause (i), the cure of the applicable event of default; or |
| ● | with regard to clause (ii), the net cash flow debt yield being equal to or greater than 5.25% for the 375 Pearl Street Total Debt for one calendar quarter; or the borrower delivering to the lender cash or a letter of credit in an amount such that the proceeds, if applied to prepay the 375 Pearl Street Whole Loan, would result in a net cash flow debt yield of at least 5.25% for the 375 Pearl Street Total Debt. |
Additional Secured Indebtedness (not including trade debts). The 375 Pearl Street Property also secures the 375 Pearl Street Non-Serviced Pari Passu Companion Loans, which have a Cut-off Date principal balance of $166,000,000. The 375 Pearl Street Non-Serviced Pari Passu Companion Loans accrue interest at the same rate as the 375 Pearl Street Mortgage Loan. The 375 Pearl Street Mortgage Loan is entitled to payments of principal and interest on a pro rata and pari passu basis with the 375 Pearl Street Non-Serviced Pari Passu Companion Loans. The holders of the 375 Pearl Street Mortgage Loan and the 375 Pearl Street Non-Serviced Pari Passu Companion Loans have entered into a co-lender agreement which sets forth the allocation of collections on the 375 Pearl Street Whole Loan. See “Description of the Mortgage Pool—The Whole Loans—The Non-Serviced Pari Passu Whole Loans”.
Mezzanine Loan and Preferred Equity. Concurrently with the origination of the 375 Pearl Street Whole Loan, WFB made a $30,000,000 mezzanine loan (the “375 Pearl Street Mezzanine Loan”) to the sole member of the borrower, which is secured by the sole member’s ownership interest in the borrower. The 375 Pearl Street Mezzanine Loan was subsequently assigned to and assumed by 375 Pearl Mezz, LLC, of which U.S. Real Estate Core Mezzanine Debt REIT LLC is its sole member. The 375 Pearl Street Mezzanine Loan is coterminous with the 375 Pearl Street Whole Loan. The 375 Pearl Street Mezzanine Loan accrues interest at a fixed per annum rate equal to 7.000% and is interest-only through the loan term. See “Description of the Mortgage Pool—Additional Indebtedness—Mezzanine Indebtedness” in the prospectus.
The following table presents certain information relating to the 375 Pearl Street Mezzanine Loan:
Mezzanine Loan Original Principal Balance | Mezzanine Interest Rate | Original Term (mos.) | Original Amort. Term (mos.) | Original IO Term (mos.) | Total Debt UW NCF DSCR | Total Debt UW NOI Debt Yield | Total Debt Date LTV | |
| Mezzanine Loan | $30,000,000 | 7.000% | 120 | 0 | 120 | 2.08x | 8.1% | 68.5% |
Release of Property. Not permitted.
Letter of Credit. None.
Ground Lease. None.
Right of First Offer/Right of First Refusal. None.
Terrorism Insurance. The 375 Pearl Street Whole Loan documents require that the “all risk” insurance policy required to be maintained by the borrower provide coverage for terrorism in an amount equal to the full replacement cost of the 375 Pearl Street Property, as well as business interruption insurance covering no less than the 24-month period following the occurrence of a casualty event, together with a 6-month extended period of indemnity (provided that if TRIPRA or a similar statute is not in effect, the borrower will not be obligated to pay terrorism insurance premiums in excess of two times the premium for the casualty and business interruption coverage on a stand-alone basis). See “Risk Factors—Risks Relating to the Mortgage Loans—Terrorism Insurance May Not Be Available for All Mortgaged Properties” in the prospectus.
| This is not a research report and was not prepared by any Underwriter’s research department. Please see additional important information and qualifications at the end of this Term Sheet. |
78
(THIS PAGE INTENTIONALLY LEFT BLANK)
| This is not a research report and was not prepared by any Underwriter’s research department. Please see additional important information and qualifications at the end of this Term Sheet. |
79
| Retail – Anchored | Loan #6 | Cut-off Date Balance: | $49,315,000 | |
| 3301 Trindle Road | Camp Hill Shopping Center | Cut-off Date LTV: | 54.3% | |
| Camp Hill, PA 17011 | UW NCF DSCR: | 3.77x | ||
| UW NOI Debt Yield: | 11.6% |
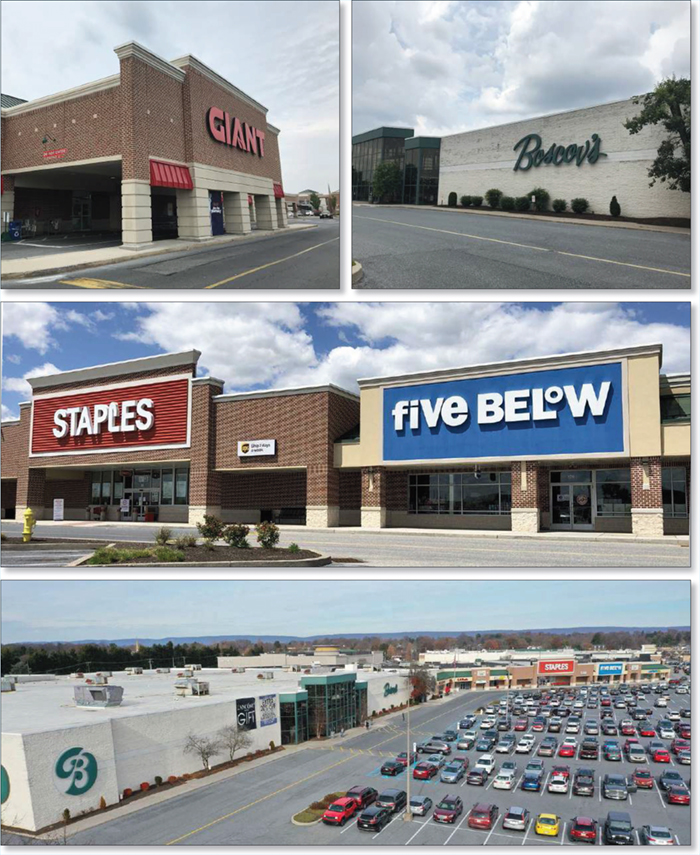
| This is not a research report and was not prepared by any Underwriter’s research department. Please see additional important information and qualifications at the end of this Term Sheet. |
80
| Retail – Anchored | Loan #6 | Cut-off Date Balance: | $49,315,000 | |
| 3301 Trindle Road | Camp Hill Shopping Center | Cut-off Date LTV: | 54.3% | |
| Camp Hill, PA 17011 | UW NCF DSCR: | 3.77x | ||
| UW NOI Debt Yield: | 11.6% |
| This is not a research report and was not prepared by any Underwriter’s research department. Please see additional important information and qualifications at the end of this Term Sheet. |
81
| Retail – Anchored | Loan #6 | Cut-off Date Balance: | $49,315,000 | |
| 3301 Trindle Road | Camp Hill Shopping Center | Cut-off Date LTV: | 54.3% | |
| Camp Hill, PA 17011 | UW NCF DSCR: | 3.77x | ||
| UW NOI Debt Yield: | 11.6% |
| This is not a research report and was not prepared by any Underwriter’s research department. Please see additional important information and qualifications at the end of this Term Sheet. |
82
| Mortgage Loan No. 6 – Camp Hill Shopping Center |
| Mortgage Loan Information | Property Information | |||||||
| Mortgage Loan Seller: | WFB | Single Asset/Portfolio: | Single Asset | |||||
| Credit Assessment (DBRSM/Fitch/S&P): | NR/NR/NR | Location: | Camp Hill, PA 17011 | |||||
| Original Balance: | $49,315,000 | General Property Type: | Retail | |||||
| Cut-off Date Balance: | $49,315,000 | Detailed Property Type: | Anchored | |||||
| % of Initial Pool Balance: | 3.5% | Title Vesting: | Fee | |||||
| Loan Purpose: | Acquisition | Year Built/Renovated: | 1960/2005 | |||||
| Borrower Sponsor: | Ramesh Bathini | Size: | 430,198 SF | |||||
| Guarantor: | Ramesh Bathini | Cut-off Date Balance PSF: | $114.63 | |||||
| Mortgage Rate: | 2.9200% | Maturity Date Balance PSF: | $114.63 | |||||
| Note Date: | 6/21/2021 | Property Manager: | Cedar Realty Trust Partnership, L.P. | |||||
| First Payment Date: | 8/11/2021 | |||||||
| Maturity Date: | 7/11/2031 | |||||||
| Original Term to Maturity: | 120 months | |||||||
| Original Amortization Term: | 0 months | |||||||
| IO Period: | 120 months | |||||||
| Seasoning: | 1 month | Underwriting and Financial Information(2) | ||||||
| Prepayment Provisions: | L(25),D(91),O(4) | UW NOI: | $5,739,201 | |||||
| Lockbox/Cash Mgmt Status: | Soft/Springing | UW NOI Debt Yield: | 11.6% | |||||
| Additional Debt Type: | No | UW NOI Debt Yield at Maturity: | 11.6% | |||||
| Additional Debt Balance: | NAP | UW NCF DSCR: | 3.77x | |||||
| Future Debt Permitted (Type): | No (NAP) | Most Recent NOI: | $5,714,345 (4/30/2021 TTM) | |||||
| Reserves(1) | 2nd Most Recent NOI: | $5,759,892 (12/31/2020) | ||||||
| Type | Initial | Monthly | Cap | 3rd Most Recent NOI: | $6,065,117 (12/31/2019) | |||
| RE Taxes: | $219,708 | $109,856 | NAP | Most Recent Occupancy: | 96.9% (6/10/2021) | |||
| Insurance: | $13,243 | $13,241 | NAP | 2nd Most Recent Occupancy: | 96.9% (12/31/2020) | |||
| Replacement Reserves: | $0 | $5,377 | $275,327 | 3rd Most Recent Occupancy: | 99.7% (12/31/2019) | |||
| Leasing Reserve: | $750,000 | $26,887 | $1,290,594 | Appraised Value (as of): | $90,800,000 (4/26/2021) | |||
| Deferred Maintenance: | $110,500 | $0 | NAP | Appraised Value PSF: | $211.07 | |||
| Existing TI/LC Reserve: | $250,000 | $0 | NAP | Cut-off Date LTV Ratio: | 54.3% | |||
| Environmental Insurance Reserve: | $40,525 | $0 | NAP | Maturity Date LTV Ratio: | 54.3% | |||
| Sources and Uses | ||||||
| Sources | Proceeds | % of Total | Uses | Proceeds | % of Total | |
| Loan Amount: | $49,315,000 | 53.1% | Purchase Price: | $89,662,500 | 96.5% | |
| Cash Equity Contribution: | $43,572,206 | 46.9% | Upfront Reserves: | $1,383,976 | 1.5% | |
| Closing Costs: | $1,840,730 | 2.0% | ||||
| Total Sources: | $92,887,206 | 100.0% | Total Uses: | $92,887,206 | 100.0% | |
| (1) | See “Escrows and Reserves” below for further discussion of reserve requirements. |
| (2) | The novel coronavirus pandemic is an evolving situation and could impact the Camp Hill Shopping Center Mortgage Loan (as defined below) more severely than assumed in the underwriting of the Camp Hill Shopping Center Mortgage Loan and could adversely affect the NOI, NCF and occupancy information, as well as the appraised value and the DSCR, LTV and Debt Yield metrics presented above and herein. See “Risk Factors-—Risks Related to Market Conditions and Other External Factors—The Coronavirus Pandemic Has Adversely Affected the Global Economy and Will Likely Adversely Affect the Performance of the Mortgage Loans” in the prospectus. |
The Mortgage Loan. The sixth largest mortgage loan (the “Camp Hill Shopping Center Mortgage Loan”) is evidenced by a promissory note in the original principal amount of $49,315,000 and secured by the fee interest in an anchored retail property located in Camp Hill, Pennsylvania (the “Camp Hill Shopping Center Property”).
The Borrower and the Borrower Sponsor. The borrower is GSD Camphill Pradsavi Group LLC, a Pennsylvania limited liability company and single purpose entity with one independent director. Legal counsel to the borrower delivered a non-consolidation opinion in connection with the origination of the Camp Hill Shopping Center Mortgage Loan. The borrower sponsor and non-recourse carveout guarantor is Ramesh Bathini.
Ramesh Bathini is a Managing Partner at Pradsavi Group, which is based in Camp Hill, Pennsylvania. Mr. Bathini has over 22 years of investment experience and over 9 years of real estate experience. Mr. Bathini currently manages over $250.0 million and has a real estate portfolio comprising 7 properties (not including the Camp Hill Shopping Center Property).
The Property. The Camp Hill Shopping Center Property is a Class A, anchored retail center totaling 430,198 SF of rentable area. Built in 1960 and renovated in 2005, the property is situated on a 24.3-acre parcel and is anchored by Boscov’s Department Stores (“Boscov’s”) and Giant Food. The collateral improvements comprise seven retail buildings with other larger tenants including LA Fitness, Barnes and Noble, Staples, and Five Below. The property contains 2,562 surface parking spaces, resulting in a parking ratio of 6.0 spaces per 1,000 SF of rentable area. 18 tenants totaling 92.2% of the net rentable area and 87.9% of underwritten base rent have been in occupancy for at least 10 years, and 15 tenants totaling 59.3% of the net rentable area and 51.0% of underwritten base rent have renewed their respective lease at least once. As of June 10, 2021, the Camp Hill Shopping Center Property was 96.9% occupied by 25 tenants, and has averaged 99.0% occupancy since 2011.
| This is not a research report and was not prepared by any Underwriter’s research department. Please see additional important information and qualifications at the end of this Term Sheet. |
83
| Retail – Anchored | Loan #6 | Cut-off Date Balance: | $49,315,000 | |
| 3301 Trindle Road | Camp Hill Shopping Center | Cut-off Date LTV: | 54.3% | |
| Camp Hill, PA 17011 | UW NCF DSCR: | 3.77x | ||
| UW NOI Debt Yield: | 11.6% |
Major Tenants.
Boscov’s (159,040 SF; 37.0% of NRA; 11.6% of underwritten base rent). Founded in 1918 and headquartered in Reading, Pennsylvania, Boscov’s is America’s largest family owned department store with 48 stores across the eastern portion of the United States. Boscov’s has been a tenant at the Camp Hill Shopping Center Property since 1984 and has a lease expiring in September 2030 with 1, 10-year renewal option remaining. Boscov’s does not have any termination options. Boscov’s reported 2020 sales of $145 PSF, which were down from 2019 sales of $188 PSF. Due to the COVID-19 pandemic, the lease was modified to provide that the tenant paid 3% percent of sales in lieu of rent between April 2020 and January 2021. Boscov’s began paying back the difference between the abated rent and gross rent in March 2021 with the full amount expected to be recovered by February 2022.
Giant Food (92,939 SF; 21.6% of NRA; 29.1% of underwritten base rent). Founded in 1936 as Washington, D.C.’s first supermarket, Giant Food currently has over 160 stores across Washington D.C., Delaware, Maryland, and Virginia. Giant Food has been a tenant at the Camp Hill Shopping Center Property since 1983 and has a lease expiring in October 2025 with eight, 5-year renewal options remaining. Giant Food does not have any termination options and is not required to report sales.
LA Fitness (45,000 SF; 10.5% of NRA; 8.8% of underwritten base rent). LA Fitness was founded in Southern California in 1984 and currently has over 700 clubs throughout the United States. LA Fitness has been a tenant at the Camp Hill Shopping Center Property since December 2006, recently renewed its lease in May 2021, and has a lease expiring in June 2031, with no renewal options remaining. LA Fitness does not have any termination options and is not required to report sales or membership figures. Due to the COVID-19 pandemic, the lease was modified whereby the tenant received full rent relief between April 2020 and June 2020 and 50% rent relief in January 2021, all of which has been forgiven by the landlord. Additionally, the remaining 50% of the January 2021 rent and 100% of the tenant’s share of common area expenses and taxes was deferred and was paid back in three equal monthly installments between May 2021 and July 2021.
The following table presents certain information relating to the tenancy at the Camp Hill Shopping Center Property:
| Tenant Summary | |||||||||
| Tenant Name | Credit Rating (Fitch/Moody’s/ S&P)(1) | Tenant SF | Approx. % of SF | Annual UW Rent(2) | % of Total Annual UW Rent | Annual UW Rent PSF(2) | Renewal Options | ||
| Termination Option (Y/N) | Lease Expiration | ||||||||
| Anchor Tenants | |||||||||
| Boscov’s | NR/NR/NR | 159,040 | 37.0% | $742,717 | 11.6% | $4.67 | N | 9/30/2030 | 1 x 10Yr |
| Giant Food | A-/Baa1/BBB+ | 92,939 | 21.6% | $1,866,215 | 29.1% | $20.08 | N | 10/31/2025 | 8 x 5Yr |
| Total/Wtd. Avg. | 251,979 | 58.6% | $2,608,932 | 40.7% | $10.35 | ||||
| Major Tenants | |||||||||
| LA Fitness | NR/NR/NR | 45,000 | 10.5% | $562,500 | 8.8% | $12.50 | N | 6/30/2031 | None |
| Barnes and Noble | NR/NR/NR | 24,908 | 5.8% | $551,250 | 8.6% | $22.13 | N | 1/31/2026 | 1 x 5Yr |
| Staples | NR/B2/B | 20,000 | 4.6% | $429,600 | 6.7% | $21.48 | N | 6/30/2025 | 2 x 5Yr |
| Five Below | NR/NR/NR | 8,220 | 1.9% | $176,319 | 2.7% | $21.45 | N | 5/31/2025 | 2 x 5Yr |
| Renal Care Dialysis Center | NR/NR/NR | 8,000 | 1.9% | $171,600 | 2.7% | $21.45 | N | 7/31/2022 | None |
| Total/Wtd. Avg. | 106,128 | 24.7% | $1,891,269 | 29.5% | $17.82 | ||||
| Non-Major Tenants | 58,876 | 13.7% | $1,912,819 | 29.8% | $32.49 | ||||
| Occupied Collateral Total | 416,983 | 96.9% | $6,413,020 | 100.0% | $15.38 | ||||
| Vacant Space | 13,215 | 3.1% | |||||||
| Total/Wtd. Avg. | 430,198 | 100.0% | |||||||
| (1) | Certain ratings are those of the parent company whether or not the parent guarantees the lease. |
| (2) | Annual UW Rent and Annual UW Rent PSF include contractual rent steps through April 2022 totaling $39,512. |
| This is not a research report and was not prepared by any Underwriter’s research department. Please see additional important information and qualifications at the end of this Term Sheet. |
84
| Retail – Anchored | Loan #6 | Cut-off Date Balance: | $49,315,000 | |
| 3301 Trindle Road | Camp Hill Shopping Center | Cut-off Date LTV: | 54.3% | |
| Camp Hill, PA 17011 | UW NCF DSCR: | 3.77x | ||
| UW NOI Debt Yield: | 11.6% |
The following table presents a summary of sales and occupancy costs for certain tenants at the Camp Hill Shopping Center Property.
| Sales and Occupancy Cost Summary(1) | |||||
| 2019 Sales (PSF) | 2020 Sales (PSF) | TTM 4/30/2021 Sales (PSF) | 2019 Occupancy Cost | TTM Occupancy Cost | |
| Boscov’s | $188 | $145 | NAV(2) | 4.5% | 5.8%(2) |
| Barnes and Noble | $247 | $205 | $186 | 8.9% | 11.9% |
| Arby’s | $368 | $348 | $355 | 6.8% | 7.0% |
| Carter’s | $245 | $197 | $241 | 15.3% | 15.6% |
| Panera Bread | $1,030 | $601 | $616 | 3.3% | 5.6% |
| Lenscrafters | $598 | $541 | $658 | 6.9% | 6.3% |
| Irvings Shoes | $485 | $346 | $396 | 7.2% | 8.8% |
| Noodles & Company | NAV | $347 | $376 | NAV | 11.1% |
| Subway | $242 | $154 | $172 | 17.1% | 24.1% |
| (1) | Information obtained from the borrower. |
| (2) | Boscov’s reports sales annually, therefore TTM information is not available and the TTM Occupancy Cost is based on 2020 Sales. |
The following table presents certain information relating to the lease rollover schedule at the Camp Hill Shopping Center Property:
| Lease Rollover Schedule(1)(2) | ||||||||
| Year | # of Leases Rolling | SF Rolling | UW Rent PSF Rolling(3) | Approx. % of Total SF Rolling | Approx. Cumulative % of SF Rolling | Total UW Rent Rolling | Approx. % of Total Rent Rolling | Approx. Cumulative % of Total Rent Rolling |
| MTM | 0 | 0 | $0.00 | 0.0% | 0.0% | $0 | 0.0% | 0.0% |
| 2021 | 0 | 0 | $0.00 | 0.0% | 0.0% | $0 | 0.0% | 0.0% |
| 2022 | 4 | 13,794 | $25.68 | 3.2% | 3.2% | $354,296 | 5.5% | 5.5% |
| 2023 | 0 | 0 | $0.00 | 0.0% | 3.2% | $0 | 0.0% | 5.5% |
| 2024 | 4 | 15,635 | $33.34 | 3.6% | 6.8% | $521,290 | 8.1% | 13.7% |
| 2025 | 5 | 127,396 | $21.44 | 29.6% | 36.5% | $2,731,432 | 42.6% | 56.2% |
| 2026 | 4 | 35,760 | $25.79 | 8.3% | 44.8% | $922,086 | 14.4% | 70.6% |
| 2027 | 2 | 4,483 | $34.09 | 1.0% | 45.8% | $152,841 | 2.4% | 73.0% |
| 2028 | 0 | 0 | $0.00 | 0.0% | 45.8% | $0 | 0.0% | 73.0% |
| 2029 | 1 | 4,600 | $29.70 | 1.1% | 46.9% | $136,620 | 2.1% | 75.1% |
| 2030 | 3 | 166,615 | $5.11 | 38.7% | 85.6% | $850,951 | 13.3% | 88.4% |
| 2031 | 1 | 45,000 | $12.50 | 10.5% | 96.1% | $562,500 | 8.8% | 97.2% |
| 2032 & Beyond | 1 | 3,700 | $48.92 | 0.9% | 96.9% | $181,004 | 2.8% | 100.0% |
| Vacant | 0 | 13,215 | $0.00 | 3.1% | 100.0% | $0 | 0.0% | 100.0% |
| Total/Wtd. Avg. | 25 | 430,198 | $15.38 | 100.0% | $6,413,020 | 100.0% | ||
| (1) | Information is based on the underwritten rent roll. |
| (2) | Certain tenants may have lease termination options that are exercisable prior to the originally stated expiration date of the related lease and are not considered in the lease rollover schedule. |
| (3) | Wtd. Avg. UW Rent PSF Rolling excludes vacant space. |
COVID-19 Update. The first payment date is in August 2021 and the loan is not subject to any forbearance, modification or debt service relief request. As of June 28, 2021, the borrower sponsor reported that all tenants were open and operating and that tenants representing approximately 100% of the occupied NRA and 100.0% of underwritten base rent made their full rent payment for June 2021. Nine tenants, representing approximately 59.3% of net rentable area and 40.9% of underwritten base rent, were granted rent relief related to COVID-19, including up to ten months of fully or partially abated rent and up to ten months of deferred rent, with deferred rent required to be repaid on various terms. Three tenants representing approximately 43.8% of net rentable area and 22.5% of underwritten base rent have outstanding deferred rents with all rent expected to be repaid by February 2022.
The Market. The Camp Hill Shopping Center Property is located in Camp Hill, Cumberland County, Pennsylvania, within the Harrisburg metropolitan area, which is the state capital. According to the appraisal, land uses within the neighborhood consist of a mixture of commercial and residential development. The majority of the single-family residential development within a one mile radius of the property consists of homes ranging from about 20 to 50 years old that are currently commanding prices ranging from $100,000 to $300,000. Within a 3-mile radius of the property, the top three employment industries are Health Care/Social Assistance, Profession/Scientific/Tech Services, and Public Administration. According to the appraisal, within a one-, three- and five-mile radius of the Camp Hill Shopping Center Property, the 2020 average household income was approximately $109,049, $95,347 and $84,179, respectively; and within the same radii, the 2020 estimated population was 8,448, 65,454 and 178,163, respectively.
According to a third-party market research report, the property is situated within the Harrisburg Area West submarket of the Philadelphia retail market. As of July 2021, the submarket reported total inventory of approximately 16.1 million SF, with a 5.4% vacancy rate and average asking rent of $15.52 PSF. The appraisal concluded to market rents ranging from $6.00 PSF for anchor space to $35.00 PSF for pad space (see table below).
| This is not a research report and was not prepared by any Underwriter’s research department. Please see additional important information and qualifications at the end of this Term Sheet. |
85
| Retail – Anchored | Loan #6 | Cut-off Date Balance: | $49,315,000 | |
| 3301 Trindle Road | Camp Hill Shopping Center | Cut-off Date LTV: | 54.3% | |
| Camp Hill, PA 17011 | UW NCF DSCR: | 3.77x | ||
| UW NOI Debt Yield: | 11.6% |
The following table presents certain information relating to the appraisal’s market rent conclusion for the Camp Hill Shopping Center Property:
| Market Rent Summary | ||||||
| Grocery | Anchor | Junior Anchor | Large In Line | Small In Line | Pad | |
| Market Rent (PSF) | $20.00 | $6.00 | $20.00 | $25.00 | $32.00 | $35.00 |
| Lease Term (Years) | 10 | 10 | 10 | 5 | 5 | 10 |
| Lease Type (Reimbursements) | Net | Net | Net | Net | Net | Net |
| Rent Increase Projection | 10% every 5 years | 10% every 5 years | 10% every 5 years | 2.5%/year | 2.5%/year | 10% every 5 years |
The table below presents certain information relating to comparable sales pertaining to the Camp Hill Shopping Center Property identified by the appraiser:
| Comparable Sales | |||||
Property Name | Location | Rentable Area (SF) | Sale Date | Sale Price (PSF) | Appraiser’s Adjusted Sale Price (PSF) |
| Camp Hill Shopping Center (Subject) | 3301 Trindle Road Camp Hill, PA | 430,198 | Jun-21 | $208.42 | NAP |
| Arundel Plaza | 6604-6654 Ritchie Highway Glen Burnie, MD | 289,189 | Mar-20 | $156.64 | $203.01 |
| Cherry Hill Commons | 500 Route 38 Cherry Hill, NJ | 265,933 | Aug-19 | $109.03 | $159.74 |
| Dillsburg Shopping Center | 830 North US Route 15 Dillsburg, PA | 162,783 | Sep-18 | $149.89 | $205.65 |
| MacArthur Commons | 2631 MacArthur Road Whitehall, PA | 371,886 | Apr-18 | $148.57 | $189.28 |
| Silver Spring Square | 6416 Carlisle Pike Mechanicsburg, PA | 342,600 | Apr-18 | $235.87 | $231.15 |
Source: Appraisal.
| This is not a research report and was not prepared by any Underwriter’s research department. Please see additional important information and qualifications at the end of this Term Sheet. |
86
| Retail – Anchored | Loan #6 | Cut-off Date Balance: | $49,315,000 | |
| 3301 Trindle Road | Camp Hill Shopping Center | Cut-off Date LTV: | 54.3% | |
| Camp Hill, PA 17011 | UW NCF DSCR: | 3.77x | ||
| UW NOI Debt Yield: | 11.6% |
Operating History and Underwritten Net Cash Flow. The following table presents certain information relating to the historical operating performance and Underwritten Net Cash Flow at the Camp Hill Shopping Center Property:
| Cash Flow Analysis | ||||||
| 2018 | 2019 | 2020 | 4/30/2021 TTM | UW | UW PSF | |
| Base Rent | $6,450,840 | $6,475,111 | $5,948,127 | $5,936,625 | $6,413,020(1)(2) | $14.91 |
| Grossed Up Vacant Space | $0 | $0 | $0 | $0 | $278,700 | $0.65 |
| Gross Potential Rent | $6,450,840 | $6,475,111 | $5,948,127 | $5,936,625 | $6,691,720 | $15.55 |
| Other Income | $9,528 | $3,822 | $14,398 | $15,331 | $15,331 | $0.04 |
| Percentage Rent(2) | $82,091 | $59,694 | $568,682 | $589,598 | $0 | $0.00 |
| Total Recoveries | $1,618,112 | $1,651,870 | $1,668,311 | $1,582,490 | $1,753,321 | $4.08 |
| Net Rental Income | $8,160,571 | $8,190,497 | $8,199,518 | $8,124,044 | $8,460,372 | $19.67 |
| (Vacancy & Credit Loss) | ($6,927) | ($17,066) | ($309,315) | ($378,050) | ($401,503)(3) | ($0.93) |
| Effective Gross Income | $8,153,644 | $8,173,431 | $7,890,203 | $7,745,994 | $8,058,869 | $18.73 |
| Real Estate Taxes | $1,203,749 | $1,229,018 | $1,255,492 | $1,161,158 | $1,370,280 | $3.19 |
| Insurance | $82,848 | $93,092 | $107,990 | $106,114 | $151,328 | $0.35 |
| Management Fee | $244,509 | $242,252 | $208,297 | $208,083 | $241,766 | $0.56 |
| Other Operating Expenses | $477,400 | $543,952 | $558,532 | $556,294 | $556,294 | $1.29 |
| Total Operating Expenses | $2,008,506 | $2,108,314 | $2,130,311 | $2,031,649 | $2,319,668 | $5.39 |
| Net Operating Income | $6,145,138 | $6,065,117 | $5,759,892 | $5,714,345 | $5,739,201 | $13.34 |
| Replacement Reserves | $0 | $0 | $0 | $0 | $86,040 | $0.20 |
| TI/LC | $0 | $0 | $0 | $0 | $154,789 | $0.36 |
| Net Cash Flow | $6,145,138 | $6,065,117 | $5,759,892 | $5,714,345 | $5,498,373 | $12.78 |
| Occupancy % | 99.7% | 99.7% | 96.9% | 96.9%(4) | 94.0% | |
| NOI DSCR | 4.21x | 4.15x | 3.95x | 3.91x | 3.93x | |
| NCF DSCR | 4.21x | 4.15x | 3.95x | 3.91x | 3.77x | |
| NOI Debt Yield | 12.5% | 12.3% | 11.7% | 11.6% | 11.6% | |
| NCF Debt Yield | 12.5% | 12.3% | 11.7% | 11.6% | 11.1% | |
| (1) | UW Base Rent includes contractual rent steps through April 2022 totaling $39,512. |
| (2) | Historically, Panera Bread was the only tenant consistently paying percentage rent from 2017 – 2020. In 2020, Boscov’s lease was modified to provide that the tenant paid 3% percent of sales in lieu of rent from April 2020 through January 2021. Boscov’s began paying back the difference between the abated rent and gross rent in March 2021 with the full amount expected to be recovered by February 2022. The increase between TTM 4/30/2021 Base Rent and UW Base Rent is due to UW Base Rent including Boscov’s full contractual rent, while TTM 4/30/2021 Base Rent reflects the modification that was in effect from April 2020 through January 2021. |
| (3) | The underwritten economic vacancy is 6.0%. The Camp Hill Shopping Center Property was 96.9% occupied as of June 10, 2021. |
| (4) | Occupancy % as of June 10, 2021. |
Escrows and Reserves.
Real Estate Taxes – The loan documents require an upfront deposit for real estate taxes equal to $219,708 and ongoing monthly deposits of $109,856.
Insurance – The loan documents require an upfront deposit for insurance equal to $13,243 and ongoing monthly deposits of $13,241.
Replacement Reserve – The loan documents require ongoing monthly replacement reserve deposits of $5,377, subject to a cap of $275,327 provided no event of default is continuing and the property is being properly maintained as reasonably determined by the lender.
Deferred Maintenance – The loan documents require an upfront deposit of $110,500 for immediate repairs at the Camp Hill Shopping Center Property.
Leasing Reserve – The loan documents require an upfront general tenant improvements and leasing commissions (“TI/LC”) reserve of $750,000 and ongoing monthly reserves of $26,887, subject to a cap of $1,290,594 provided no event of default is continuing, the property is at least 85% occupied, and the net cash flow debt yield being at least 10.0%. The cap will be adjusted to $1,011,777 provided no event of default is continuing, no “Cash Trap Event Period” (as defined below) has occurred, and Giant Food extends or renews its lease (on terms equal to or better than the current lease) for a period of at least three years beyond loan maturity.
Existing TI/LC Reserve – The loan documents require an upfront deposit of $250,000 for TI/LCs payable by the borrower under the LA Fitness lease.
Environmental Insurance Reserve – The loan documents required an upfront deposit of $40,525 for the payment of insurance premiums and associated costs in connection with a lender’s policy of environmental insurance covering the property. The reserve was released to the borrower in connection with its purchase of such policy.
| This is not a research report and was not prepared by any Underwriter’s research department. Please see additional important information and qualifications at the end of this Term Sheet. |
87
| Retail – Anchored | Loan #6 | Cut-off Date Balance: | $49,315,000 | |
| 3301 Trindle Road | Camp Hill Shopping Center | Cut-off Date LTV: | 54.3% | |
| Camp Hill, PA 17011 | UW NCF DSCR: | 3.77x | ||
| UW NOI Debt Yield: | 11.6% |
Lockbox and Cash Management. The Camp Hill Shopping Center Mortgage Loan is structured with a soft lockbox and springing cash management. The borrower and the property manager are required to deposit all rents into the established lockbox account within one business day after receipt. Upon the occurrence of a Cash Trap Event Period (as defined below), the borrower is required to direct all tenants to deposit rents directly into the deposit account and a cash management account is required to be established into which all funds in the lockbox account will be required to be deposited. During the continuance of a Cash Trap Event Period, all funds in the cash management account are required to be disbursed in accordance with the cash management waterfall set forth in the loan documents, with any excess funds required to be held as additional security in an excess cash flow subaccount controlled by the lender for so long as the Cash Trap Event Period continues.
A “Cash Trap Event Period” will commence upon the earlier of the following:
| (i) | the occurrence of an event of default; |
| (ii) | the net cash flow debt service coverage ratio (“NCF DSCR”) being less than 2.20x; |
| (iii) | Boscov’s or Giant Food (x) “going dark” or vacating (or providing notice to do so), or (y) becoming a debtor in a bankruptcy (or other insolvency) proceeding, |
| (iv) | Boscov’s or Giant Food failing to exercise its option to extend the term of its respective lease for a period of at least 5 years upon the earlier of a) the notice period set forth in its respective lease or b) 12 months prior to lease expiration; or |
| (v) | Koninklijke’s (Giant Food’s parent company) long-term debt rating being downgraded below investment grade by any rating agency |
A Cash Trap Event Period will end upon the occurrence of the following:
| ● | with regard to clause (i), the cure of such event of default; |
| ● | with regard to clause (ii), the NCF DSCR being greater than or equal to 3.00x for two consecutive calendar quarters; |
| ● | with regard to clause (iii), (a) provided such Cash Trap Event Period is a result of only one of Boscov’s or Giant Food triggering the Cash Trap Event Period, the balance in the excess cash flow subaccount being equal to or greater than $5,000,000; (b) upon a replacement tenant acceptable to lender taking occupancy of the entire space, commencing paying full, unabated rent, and being open for business and conducting normal operations pursuant to a lease acceptable to the lender; or (c) if the Cash Trap Event Period is only caused by (y), Boscov’s or Giant Food no longer being subject to any bankruptcy proceedings; |
| ● | with regard to clause (iv), Boscov’s or Giant Food exercising its lease extension option for a period of at least 5 years; or |
| ● | with regard to clause (v), Koninklijke’s long-term credit rating being upgraded at or above investment grade by S&P, Fitch or Moody’s or, provided that Koninklijke is not downgraded below BB+ (or its equivalent) by any rating agency, such Cash Trap Event Period will end two years from the commencement thereof. |
Additional Secured Indebtedness (not including trade debts). None.
Mezzanine Loan and Preferred Equity. None.
Release of Property. Not permitted.
Letter of Credit. None.
Right of First Offer/Right of First Refusal. None.
Ground Lease. None.
Terrorism Insurance. The loan documents require that the “all risk” insurance policy required to be maintained by the borrower provides coverage for terrorism in an amount equal to the full replacement cost of the Camp Hill Shopping Center Property, as well as business interruption insurance covering no less than the 18-month period following the occurrence of a casualty event, together with a 6-month extended period of indemnity.
Boscov’s may provide all or a portion of the property, liability, and terrorism coverages required under the loan documents, provided (i) the Boscov’s lease is in full force and effect, (ii) Boscov’s is not in default under the lease, and (iii) the insurance being provided by Boscov’s satisfies the terms of the loan documents, with the exception of rental loss and/or business interruption coverages (any such coverage, the “Permitted Tenant Coverage”). If Boscov’s fails to provide the Permitted Tenant Coverage, then the borrower is required to obtain, at borrower’s sole cost and expense, all insurance as required by the loan documents, including for the Boscov’s space. See “Risk Factors—Risks Relating to the Mortgage Loans—Terrorism Insurance May Not Be Available for All Mortgaged Properties” in the prospectus.
| This is not a research report and was not prepared by any Underwriter’s research department. Please see additional important information and qualifications at the end of this Term Sheet. |
88
(THIS PAGE INTENTIONALLY LEFT BLANK)
| This is not a research report and was not prepared by any Underwriter’s research department. Please see additional important information and qualifications at the end of this Term Sheet. |
89
| Multifamily – Various | Loan #7 | Cut-off Date Balance: | $46,000,000 | |
| Various | Rochester Multifamily Portfolio | Cut-off Date LTV: | 71.0% | |
| Various, NY | U/W NCF DSCR: | 1.50x | ||
| U/W NOI Debt Yield: | 8.3% |
| This is not a research report and was not prepared by any Underwriter’s research department. Please see additional important information and qualifications at the end of this Term Sheet. |
90
| Multifamily – Various | Loan #7 | Cut-off Date Balance: | $46,000,000 | |
| Various | Rochester Multifamily Portfolio | Cut-off Date LTV: | 71.0% | |
| Various, NY | U/W NCF DSCR: | 1.50x | ||
| U/W NOI Debt Yield: | 8.3% |
| This is not a research report and was not prepared by any Underwriter’s research department. Please see additional important information and qualifications at the end of this Term Sheet. |
91
| Mortgage Loan No. 7 – Rochester Multifamily Portfolio |
| Mortgage Loan Information | Property Information | |||||
| Mortgage Loan Seller: | BANA | Single Asset/Portfolio: | Portfolio | |||
| Credit Assessment (DBRSM/Fitch/S&P): | NR/NR/NR | Location: | Various, NY | |||
| Original Balance: | $46,000,000 | General Property Type: | Multifamily | |||
| Cut-off Date Balance: | $46,000,000 | Detailed Property Type: | Various | |||
| % of Initial Pool Balance: | 3.3% | Title Vesting: | Fee | |||
| Loan Purpose: | Acquisition | Year Built/Renovated: | Various / NAP | |||
| Borrower Sponsor: | Ryan Duling | Size: | 376 Units | |||
| Guarantor: | Ryan Duling | Cut-off Date Balance per Unit: | $122,340 | |||
| Mortgage Rate: | 3.4920% | Maturity Date Balance per Unit: | $110,273 | |||
| Note Date: | 7/1/2021 | Property Manager: | The Cabot Group, Inc. | |||
| First Payment Date: | 8/1/2021 | |||||
| Maturity Date: | 7/1/2031 | Underwriting and Financial Information(3) | ||||
| Original Term to Maturity: | 120 months | UW NOI: | $3,805,606 | |||
| Original Amortization Term: | 360 months | UW NOI Debt Yield: | 8.3% | |||
| IO Period: | 60 months | UW NOI Debt Yield at Maturity: | 9.2% | |||
| Seasoning: | 1 month | UW NCF DSCR: | 2.28x (IO) 1.50x (P&I) | |||
| Prepayment Provisions(1): | L(25),D(91),O(4) | Most Recent NOI: | $3,782,944 (3/31/2021 TTM) | |||
| Lockbox/Cash Mgmt Status: | Springing/Springing | 2nd Most Recent NOI: | $3,764,806 (12/31/2020) | |||
| Additional Debt Type: | No | 3rd Most Recent NOI: | $3,723,590 (12/31/2019) | |||
| Additional Debt Balance: | NAP | Most Recent Occupancy: | 99.7% (5/6/2021) | |||
| Future Debt Permitted (Type): | No (NAP) | 2nd Most Recent Occupancy: | 98.4% (12/31/2020) | |||
| Reserves(2) | 3rd Most Recent Occupancy: | 97.3% (12/31/2019) | ||||
| Type | Initial | Monthly | Cap | Appraised Value (as of): | $64,750,000 (Various) | |
| RE Taxes: | $438,675 | $61,681 | NAP | Appraised Value per Unit: | $172,207 | |
| Insurance: | $0 | Springing | NAP | Cut-off Date LTV Ratio: | 71.0% | |
| Replacement Reserve: | $0 | $7,654 | NAP | Maturity Date LTV Ratio: | 64.0% | |
| Sources and Uses | ||||||
| Sources | Proceeds | % of Total | Uses | Proceeds | % of Total | |
| Loan Amount: | $46,000,000 | 59.3% | Purchase Price(4): | $74,460,000 | 96.0% | |
| Borrower Equity | 11,090,429 | 14.3% | Closing Costs(5): | 2,647,442 | 3.4% | |
| Existing Loans(6) | 20,455,687 | 26.4% | Reserves: | 438,675 | 0.6% | |
| Total Sources: | $77,546,116 | 100.0% | Total Uses: | $77,546,116 | 100.0% | |
| (1) | Partial defeasance is permitted in connection with a partial release. See “Release of Parcel” below. |
| (2) | See “Escrows and Reserves” below for further discussion of reserve information. |
| (3) | The novel coronavirus pandemic is an evolving situation and could impact the Rochester Multifamily Portfolio Mortgage Loan (as defined below) more severely than assumed in the underwriting of the Rochester Multifamily Portfolio Mortgage Loan. The pandemic and resulting economic disruption could also adversely affect the NOI, NCF and occupancy information, as well as the appraised value and DSCR, LTV and Debt Yield metrics presented above. See “Risk Factors—Risks Related to Market Conditions and Other External Factors—The Coronavirus Pandemic Has Adversely Affected the Global Economy and Will Likely Adversely Affect the Performance of the Mortgage Loans” in the prospectus. |
| (4) | The borrower sponsor acquired a portfolio of 13 properties (the “Acquisition Portfolio”) for $74,460,000. The Rochester Multifamily Portfolio Mortgage Loan is collateralized by six of the 13 properties in the Acquisition Portfolio. The purchase price is not allocated to individual properties. |
| (5) | Closing costs include prepayment penalties for the payoff of the prior debt encumbering the Rochester Multifamily Portfolio Properties (as defined below) in the amount of $791,148 and an assumption fee related to the assumption by Ryan Duling of an existing loan with Minnesota Life Insurance Company secured by the seven non-collateral properties in the Acquisition Portfolio. |
| (6) | Includes the existing loan with Minnesota Life Insurance Company for the seven non-collateral properties, which was assumed by Ryan Duling as part of the consideration for his purchase of the Acquisition Portfolio, which had an outstanding amount of $15,455,687, at the time of assumption. Also includes a promissory note of $5,000,000 from the sole members of the borrowers in favor of the seller of the Acquisition Portfolio, which is not secured by the Rochester Multifamily Portfolio Properties. The note is guaranteed by Ryan Duling, John Adams and the borrowing entities of the seven non-collateral properties in the Acquisition Portfolio individually. |
The Mortgage Loan. The seventh largest mortgage loan (the “Rochester Multifamily Portfolio Mortgage Loan”) is evidenced by a promissory note in the original principal amount of $46,000,000 and secured by a first priority fee mortgage encumbering a six-property multifamily portfolio comprised of 376-units located in the Rochester metropolitan statistical area (“MSA”) of New York (the “Rochester Multifamily Portfolio Properties”).
The Borrowers and the Borrower Sponsor. The borrowers are LC Propco 1, LLC, LC Propco 2, LLC, LC Propco 3, LLC, LC Propco 4, LLC, LC Propco 5, LLC and LC Propco 6, LLC, each a Delaware limited liability company with one independent director.
The borrower sponsor and non-recourse carveout guarantor is Ryan Duling. The equity ownership in the borrower is held by Ryan Duling (77.309%), John Adams (19.828%) and Daniel Jones (2.863%). Ryan Duling has more than 15 years of experience as a real estate investor and manager and is currently responsible for the ongoing direct management of several hundred multifamily units and the asset management of several hundred additional units involving out of state third party management. Excluding the collateral for this loan, Ryan Duling’s portfolio is comprised of single family residential assets, raw land and condominium assets, totaling 30 properties and 2,733 units.
| This is not a research report and was not prepared by any Underwriter’s research department. Please see additional important information and qualifications at the end of this Term Sheet. |
92
| Multifamily – Various | Loan #7 | Cut-off Date Balance: | $46,000,000 | |
| Various | Rochester Multifamily Portfolio | Cut-off Date LTV: | 71.0% | |
| Various, NY | U/W NCF DSCR: | 1.50x | ||
| U/W NOI Debt Yield: | 8.3% |
The Properties. The Rochester Multifamily Portfolio Properties consist of six multifamily properties containing a total of 376 units located in the Rochester MSA. The garden-style communities are comprised of four traditional properties and two age restricted properties (55+ years old). The Rochester Multifamily Portfolio Properties were developed between 1972 and 2014 and were 99.7% occupied as of May 6, 2021.
| Rochester Multifamily Portfolio Summary | ||||||||||
Property Address | Year Built/ Renovated | Units | Property Sub-Type | May 2021 Occupancy | Appraised Value | % of Portfolio Appraised Value | Allocated Loan Amount | UW NOI | UW NOI Per Unit | % of Total UW NOI |
Legends at North Ponds Park Senior Townhomes 800-830 Holt Road Webster, NY 14580 | 2014 / NAP | 114 | Age Restricted | 100.0% | $16,600,000 | 25.6% | $11,798,998 | $960,651 | $8,427 | 25.2% |
Jordache Park 1401 Jorpark Circle Spencerport, NY 14559 | 2000-2004 / NAP | 106 | Garden | 99.1%(1) | $15,750,000 | 24.3% | $11,187,243 | $934,512 | $8,816 | 24.6% |
Villas of Brighton 1 Via Costa Court Brighton, NY 14618 | 2010 / NAP | 43 | Garden | 100.0% | $11,400,000 | 17.6% | $8,097,433 | $682,045 | $15,862 | 17.9% |
The Carriages at Cedar Rock 728-757 Cedar Rock Road Webster, NY 14580 | 2014 / NAP | 43 | Garden | 100.0% | $9,600,000 | 14.8% | $6,818,892 | $549,697 | $12,784 | 14.4% |
Unionville Station Senior Townhomes 28-80 Stothard Drive Hilton, NY 14468 | 2004 / NAP | 40 | Age Restricted | 100.0% | $6,950,000 | 10.7% | $4,936,593 | $407,920 | $10,198 | 10.7% |
Jefferson Manor 1-35 Jefferson Court Fairport, NY 14450 | 1972 / NAP | 30 | Garden | 100.0% | $4,450,000 | 6.9% | $3,160,840 | $270,781 | $9,026 | 7.1% |
| Total/Weighted Average: | 376 | 99.7%(1) | $64,750,000 | 100.0% | $46,000,000 | $3,805,606 | $10,121 | 100.0% | ||
| (1) | The vacancy is attributed to one unit that is used by management as a clubhouse. The Jordache Park property is 100.0% occupied as of May 2021 based on rentable units. |
Legends at North Ponds Park Senior Townhomes
The Legends at North Ponds Park Senior Townhomes property is a 114-unit multifamily community located in Webster, New York. The age restricted (55+) community was developed in 2014 and is improved with three, three-story residential buildings containing 114 units (100,600 SF of NRA) and one office building containing 2,900 SF. The 114 units average 882 SF with a unit mix as shown in the table below. Unit amenities include air-conditioning, fully-equipped kitchens with dishwasher and microwave, balcony/patio, walk-in closets and in-unit laundry. Community amenities include 24-hour management/maintenance, clubhouse, fitness center, common laundry facility, library, computer room and garage parking. Over the past three years, the previous owner spent approximately $50,867 ($446.20/unit) on capital improvements. The office building is occupied by a single-tenant, McMahon-LaRue Associates, P.C., a civil-engineering firm, on a ten-year lease that expires in December 2023, with a monthly rent of $4,550. The Legends at North Ponds Park Senior Townhomes property was 100.0% occupied as of May 6, 2021. Average occupancy at the Legends at North Ponds Park Senior Townhomes property for 2018, 2019, and 2020 was 97.0%, 98.0%, and 99.0%, respectively.
| The Legends at North Ponds Park Senior Townhomes Unit Mix | ||||||||||||||||||||
| Unit Mix / Type | Units | Occupied Units | % Occupied | Average SF per Unit | Total SF | Monthly Average Rent per Unit | Monthly Avg. Market Rent per Unit | |||||||||||||
| 1 BR 1 BA | 23 | 23 | 100.0 | % | 638 | 14,674 | $1,158 | $1,100 | ||||||||||||
| 2 BR 1 BA | 43 | 43 | 100.0 | % | 834 | 35,862 | 1,150 | 1,400 | ||||||||||||
| 2 BR 2 BA | 48 | 48 | 100.0 | % | 1043 | 50,064 | 1,153 | 1,550 | ||||||||||||
| Total/Wtd. Avg. | 114 | 114 | 100.0 | % | 882 | 100,600 | $1,153 | $1,403 | ||||||||||||
Source: Borrower rent roll as of May 6, 2021.
| This is not a research report and was not prepared by any Underwriter’s research department. Please see additional important information and qualifications at the end of this Term Sheet. |
93
| Multifamily – Various | Loan #7 | Cut-off Date Balance: | $46,000,000 | |
| Various | Rochester Multifamily Portfolio | Cut-off Date LTV: | 71.0% | |
| Various, NY | U/W NCF DSCR: | 1.50x | ||
| U/W NOI Debt Yield: | 8.3% |
Jordache Park
The Jordache Park property is a 106-unit multifamily community located in Spencerport, New York. The garden style community was developed between 2000 and 2004 and is improved with a total of 13 buildings and 136,140 SF of NRA. The 106 units average 1,284 SF with a unit mix as shown in the table below. Unit amenities include air-conditioning, dishwasher, balcony/patio, walk-in closets, washer/dryer hookups and private entrance. Community amenities include 24-hour management/maintenance, clubhouse, fitness center, common laundry facility and garage parking. Over the past three years, the previous owner spent approximately $149,291 ($1,408.41/unit) on capital improvements. The Jordache Park property was 99.1% occupied as of May 6, 2021. Average occupancy at the Jordache Park property for 2018, 2019, and 2020 was 99.0%, 96.0%, and 97.0%, respectively.
| Jordache Park Unit Mix | ||||||||||||||||||||
| Unit Mix / Type | Units | Occupied Units | % Occupied | Average SF per Unit | Total SF | Monthly Average Rent per Unit | Monthly Avg. Market Rent per Unit | |||||||||||||
| 1 BR 1 BA | 9 | 9 | 100.0 | % | 965 | 8,685 | $982 | $995 | ||||||||||||
| 2 BR 2 BA | 89 | 88 | 98.9 | %(1) | 1,295 | 115,255 | $1,128 | $1,175 | ||||||||||||
| 3 BR 2 BA | 8 | 8 | 100.0 | % | 1,525 | 12,200 | $1,364 | $1,395 | ||||||||||||
| Total/Wtd. Avg. | 106 | 105 | 99.1 | %(1) | 1,284 | 136,140 | $1,133 | $1,176 | ||||||||||||
Source: Borrower rent roll as of May 6, 2021.
| (1) | The vacancy is attributed to one unit that is used by management as a clubhouse. The Jordache Park property is 100.0% occupied as of May 2021 based on rentable units. |
Villas of Brighton
The Villas of Brighton property is a 43-unit multifamily community located in Brighton, New York. The garden style community was developed in 2010 and is improved with a total of 23 single-story buildings and 56,115 SF of NRA. The 43 units average 1,305 SF with a unit mix as shown in the table below. Unit amenities include air-conditioning, dishwasher, microwave, fireplace, dining room, walk-in closets, in-unit washer/dryer, 3-season room, vaulted ceilings, secured access, basic cable and internet, and private entrances. Community amenities include 24-hour management/maintenance, driveway and attached garage parking. Over the past three years, the previous owner spent approximately $40,524 ($942.43/unit) on capital improvements. The Villas of Brighton property was 100.0% occupied as of May 6, 2021. The Villas of Brighton property was 100.0% occupied as of May 6, 2021. Average occupancy at the Villas of Brighton property for 2018, 2019, and 2020 was 100.0%, 99.0%, and 100.0%, respectively.
| Villas of Brighton Unit Mix | |||||||||||||||||||||
| Unit Mix / Type | Units | Occupied Units | % Occupied | Average SF per Unit | Total SF | Monthly Average Rent per Unit | Monthly Avg. Market Rent per Unit | ||||||||||||||
| 2 BR 2 BA | 43 | 43 | 100.0 | % | 1305 | 56,115 | $1,902 | $2,107 | |||||||||||||
| Total/Wtd. Avg. | 43 | 43 | 100.0 | % | 1,305 | 56,115 | $1,902 | $2,107 | |||||||||||||
Source: Borrower rent roll as of May 6, 2021.
The Carriages at Cedar Rock
The Carriages at Cedar Rock property is a 43-unit multifamily community located in Webster, New York. The garden style community was developed in 2014 and is improved with a total of 10 single-story buildings and 56,375 SF of NRA. The 43 units average 1,311 SF with a unit mix as shown in the table below. Unit amenities include air-conditioning, dishwasher, microwave, patio space, walk-in closets, in-unit washer/dryer, fireplace, ceiling fans, granite countertops, basic cable and internet, and private entrances. Community amenities include 24-hour management/maintenance, gazebo, adequate surface guest parking, and driveway and attached garage parking. Over the past three years, the previous owner spent approximately $8,425 ($195.93/unit) on capital improvements. The Carriages at Cedar Rock property was 100.0% occupied as of May 6, 2021. Average occupancy at The Carriages at Cedar Rock property for 2018, 2019, and 2020 was 98.0%, 96.0%, and 98.0%, respectively.
| The Carriages at Cedar Rock Unit Mix | |||||||||||||||||||||
| Unit Mix / Type | Units | Occupied Units | % Occupied | Average SF per Unit | Total SF | Monthly Average Rent per Unit | Monthly Avg. Market Rent per Unit | ||||||||||||||
| 2 BR 2 BA | 19 | 19 | 100.0 | % | 1195 | 22,706 | $1,550 | $1,572 | |||||||||||||
| 2 BR 2.5 BA | 9 | 9 | 100.0 | % | 1,356 | 12,204 | $1,564 | $1,800 | |||||||||||||
| 3 BR 2.5 BA | 15 | 15 | 100.0 | % | 1,431 | 21,465 | $1,627 | $1,900 | |||||||||||||
| Total/Wtd. Avg. | 43 | 43 | 100.0 | % | 1,311 | 56,375 | $1,580 | $1,734 | |||||||||||||
Source: Borrower rent roll as of May 6, 2021.
Unionville Station Senior Townhomes
The Unionville Station Senior Townhomes property is a 40-unit multifamily community located in Hilton, New York. The age restricted (55+) community was developed in 2004 and is improved with a total of 20 single-story residential buildings (41,236 SF of NRA) and one maintenance building. The 40 units average 1,031 SF with a unit mix as shown in table below. Unit amenities include air-conditioning, dishwasher, walk-in closets, in-unit washer/dryer, mini-blinds, full basements, basic cable and internet, and private entrances. Community amenities include 24-hour management/maintenance, driveway, and attached garage parking. Over the past three years, the previous owner spent approximately $17,120 ($428.00/unit) on capital improvements. The
| This is not a research report and was not prepared by any Underwriter’s research department. Please see additional important information and qualifications at the end of this Term Sheet. |
94
| Multifamily – Various | Loan #7 | Cut-off Date Balance: | $46,000,000 | |
| Various | Rochester Multifamily Portfolio | Cut-off Date LTV: | 71.0% | |
| Various, NY | U/W NCF DSCR: | 1.50x | ||
| U/W NOI Debt Yield: | 8.3% |
Unionville Station Senior Townhomes property was 100.0% occupied as of May 6, 2021. Average occupancy at the Unionville Station Senior Townhomes property for 2018, 2019, and 2020 was 98.0%, 98.0%, and 98.0%, respectively.
| Unionville Station Senior Townhomes Unit Mix | |||||||||||||||||||||
| Unit Mix / Type | Units | Occupied Units | % Occupied | Average SF per Unit | Total SF | Monthly Average Rent per Unit | Monthly Avg. Market Rent per Unit | ||||||||||||||
| 2 BR 2 BA | 40 | 40 | 100.0 | % | 1031 | 41,236 | $1,205 | $1,300 | |||||||||||||
| Total/Wtd. Avg. | 40 | 40 | 100.0 | % | 1,031 | 41,236 | $1,205 | $1,300 | |||||||||||||
Source: Borrower rent roll as of May 6, 2021.
Jefferson Manor
The Jefferson Manor property is a 30-unit multifamily community located in Fairport, New York. The garden style community was developed in 1972 and is improved with a total of 15 one- and two-story buildings and 33,800 SF of NRA. The 30 units average 1,127 SF with a unit mix as shown in the table below. Unit amenities include air-conditioning, dishwasher, washer/dryer hookups and private entrance. Community amenities include 24-hour management/maintenance and free on-site surface parking. Over the past three years, the previous owner spent approximately $35,768 ($1,192.26/unit) on capital improvements. The Jefferson Manor property was 100.0% occupied as of May 6, 2021. Average occupancy at the Jefferson Manor property for 2018, 2019, and 2020 was 95.5%, 97.4%, and 99.9%, respectively.
| Jefferson Manor Unit Mix | |||||||||||||||||||||
| Unit Mix / Type | Units | Occupied Units | % Occupied | Average SF per Unit | Total SF | Monthly Average Rent per Unit | Monthly Avg. Market Rent per Unit | ||||||||||||||
| 2 BR 1.5 BA | 22 | 22 | 100.0 | % | 1100 | 24,200 | $1,158 | $1,200 | |||||||||||||
| 3 BR 1.5 BA | 8 | 8 | 100.0 | % | 1200 | 9,600 | $1,201 | $1,400 | |||||||||||||
| Total/Wtd. Avg. | 30 | 30 | 100.0 | % | 1,127 | 33,800 | $1,169 | $1,253 | |||||||||||||
Source: Borrower rent roll as of May 6, 2021.
COVID-19 Update. As of July 1, 2021, the Rochester Multifamily Portfolio Properties were open and operating with 95% of tenants having paid their full May 2021 rent payments. Information regarding collections for June 2021 rent payments and any tenant rent relief or lease modification requests is not available. The Rochester Multifamily Portfolio Properties were 99.7% occupied as of May 6, 2021. The first debt service payment on the Rochester Multifamily Portfolio Mortgage Loan is due in August 2021 and, as of July 1, 2021, the Rochester Multifamily Portfolio Mortgage Loan was not subject to any forbearance, modification or debt service relief request.
The Market. The Rochester Multifamily Portfolio Properties are located in the Rochester MSA. The Rochester MSA is the third largest metropolitan statistical area in the State of New York and had a 2020 population of 1,086,468. As of the first quarter of 2021, the Rochester market had a current inventory of 41,103 units with a 96% occupancy and average asking rent of $1,027 per unit. The region’s largest employers include the University of Rochester (29,003), Rochester Regional Health System (15,943), Wegmans Food Markets Inc. (13,491), Paychex Inc. (4,425), and the Rochester Institute of Technology (4,100).
Irondequoit/Webster
The Legends at North Ponds Park Senior Townhomes property and The Carriages at Cedar Rock property are located in the Irondequoit/Webster submarket in northeast Monroe County. As of first quarter 2021, the submarket had an inventory of 6,117 units, a vacancy rate of 4.9%, and an average asking rental rate of $968.
The Legends at North Ponds Park Senior Townhomes property is located at 800-830 Holt Road in Webster, New York, approximately 11.4 miles northeast of downtown Rochester, with Irondequoit-Wayne County Expressway (State Route 104) to the south, Phillips Road to the east, Lake Ontario to the south, and Bay Road to the west. The Legends at North Ponds Park Senior Townhomes property is located just north of the primary east-west arterial, Irondequoit-Wayne County Expressway, which provides convenient linkage to a variety of complementary retail, office, and institutional establishments.
The Carriages at Cedar Rock property is located at 728-757 Cedar Rock Road in Webster, New York, approximately 10.8 miles northeast of downtown Rochester, with Irondequoit-Wayne County Expressway (State Route 104) to the north, Hard Road to the east, Plank Road to the south, and Empire Boulevard to the west. In addition, Lake Ontario is to the north of the Carriages at Cedar Rock property and the Genesee River is to the west. The Carriages at Cedar Rock property is located just north of the primary east-west arterial, Irondequoit-Wayne County Expressway, which provides convenient linkage to a variety of complementary retail, office, and institutional establishments.
West Monroe/West Counties
The Jordache Park property and the Unionville Station Senior Townhomes property are located in the West Monroe/West Counties submarket. As of first quarter 2021, the submarket had an inventory of 6,690 units, a vacancy rate of 3.3%, and an average asking rental rate of $883.
The Jordache Park property is located at 1401 Jorpark Circle in Spencerport, New York, approximately 9.2 miles west of downtown Rochester, with Ridge Road (Route 104) to the north, Manitou Road to the east, Route 531 to the south, and South Union Street (Route 259) to the west. In addition, the Erie Canal is approximately 1.2 miles to the north and Lake Ontario is approximately 8.5 miles to the north. The Jordache Park property is located less than a mile east of major east-west arterial, Spencerport Road (Route 31), which provides convenient access to downtown Rochester. The appraiser identified five competitive properties with vacancy ranging from 0.0% to 6.0% and an average of 1.9%.
| This is not a research report and was not prepared by any Underwriter’s research department. Please see additional important information and qualifications at the end of this Term Sheet. |
95
| Multifamily – Various | Loan #7 | Cut-off Date Balance: | $46,000,000 | |
| Various | Rochester Multifamily Portfolio | Cut-off Date LTV: | 71.0% | |
| Various, NY | U/W NCF DSCR: | 1.50x | ||
| U/W NOI Debt Yield: | 8.3% |
The Unionville Station Senior Townhomes property is located at 28-80 Stothard Drive in Hilton, New York, approximately 18.2 miles northwest of downtown Rochester, with West Avenue (Route 18) to the north, Hilton Parma Corners Road to the east, West Ridge Road (State Route 104) to the south, and Sweden Walker Road to the west. In addition, Lake Ontario is to the north of the Unionville Station Senior Townhomes property and the Genesee River is to the east. The Unionville Station Senior Townhomes property is located directly west of Hilton Parma Corners Road which provides convenient linkage to a variety of complementary retail, office, and institutional establishments.
Brighton
The Villas of Brighton property is located in the Brighton submarket in Monroe County. As of first quarter 2021, the submarket had an inventory of 5,621 units, a vacancy rate of 1.6%, and an average asking rental rate of $1,119.
The Villas of Brighton property is located at 1 Via Costa Court in Brighton, New York, approximately 3.6 miles south of downtown Rochester, with Westfall Road to the north, Monroe Avenue to the east, Interstate 590 to the south, and Interstate 390 to the west. In addition, Lake Ontario is to the north of the Villas of Brighton property and the Genesee River is to the west. The Villas of Brighton property is located just north of Interstate 590 which provides the property with access to the Rochester central business district.
Southeast Monroe/East Counties
The Jefferson Manor property is located in the Southeast Monroe/East Counties submarket in Monroe County. As of first quarter 2021, the submarket had an inventory of 9,060 units, a vacancy rate of 5.8%, and an average asking rental rate of $1,224.
The Jefferson Manor property is located at 1-35 Jefferson Court in Fairport, New York, approximately 9.7 miles southeast of downtown Rochester, with Route 31F (Fairport Road) to the north, Route 250 (Fairport Nine Mile Point Road) and the Erie Canal to the east, Route 31 (Palmyra Road) to the south, and Interstate 490 to the west. The Jefferson Manor property is located directly south of Route 31F (Fairport Road) which provides convenient linkage to a variety of complementary retail, office, and institutional establishments.
| Rochester Multifamily Portfolio Demographic Summary | |||||||||
| Property Name | City, State | 3-mile Population | 5-mile Population | 10-mile Population | 3-mile Average Household Income | 5-mile Average Household Income | 10-mile Average Household Income | ||
| Legends at North Ponds Park Senior Townhomes | Webster, NY | 39,154 | 67,142 | 371,793 | $102,261 | $108,383 | $80,561 | ||
| Jordache Park | Spencerport, NY | 34,226 | 98,994 | 479,960 | $78,048 | $82,448 | $67,062 | ||
| Villas of Brighton | Brighton, NY | 96,457 | 255,581 | 597,264 | $78,230 | $71,381 | $79,230 | ||
| The Carriages at Cedar Rock | Webster, NY | 45,017 | 121,014 | 501,191 | $107,438 | $90,953 | $77,881 | ||
| Unionville Station Senior Townhomes | Hilton, NY | 12,086 | 36,943 | 199,695 | $81,239 | $95,731 | $76,800 | ||
| Jefferson Manor | Fairport, NY | 159,959 | 304,570 | 618,945 | $50,691 | $60,786 | $77,669 | ||
| Total / Wtd. Avg.(1) | 54,308 | 129,119 | 455,484 | $87,110 | $88,350 | $76,044 | |||
Source: Appraisals.
| (1) | The Wtd. Avg. figures are based on allocated loan amounts for the individual properties. |
| This is not a research report and was not prepared by any Underwriter’s research department. Please see additional important information and qualifications at the end of this Term Sheet. |
96
| Multifamily – Various | Loan #7 | Cut-off Date Balance: | $46,000,000 | |
| Various | Rochester Multifamily Portfolio | Cut-off Date LTV: | 71.0% | |
| Various, NY | U/W NCF DSCR: | 1.50x | ||
| U/W NOI Debt Yield: | 8.3% |
Operating History and Underwritten Net Cash Flow. The following table presents certain information relating to the historical operating performance and Underwritten Net Cash Flow at the Rochester Multifamily Portfolio Properties:
| Cash Flow Analysis | ||||||
| 2018 | 2019 | 2020 | 3/31/2021 TTM | UW | UW Per Unit | |
| Gross Potential Rent | $5,479,566 | $5,531,649 | $5,679,722 | $5,705,028 | $6,472,200 | $17,213.30 |
| Credit Loss | 0 | 0 | 0 | 0 | (59,258) | (157.60) |
| Vacancy | ($1,531) | 0 | 0 | 0 | (665,901)(1) | (1,771.01) |
| Other Income | 284,576 | 306,897 | 295,581 | 292,776 | 292,876 | 778.93 |
| Effective Gross Income | $5,762,611 | $5,838,546 | $5,975,303 | $5,997,804 | $6,039,917 | $16,063.61 |
| Real Estate Taxes(1) | 867,749 | 894,803 | 948,091 | 965,172 | 1,010,405 | 2,687.25 |
| Insurance | 101,442 | 95,397 | 132,224 | 115,832 | 132,969 | 353.64 |
| Other Operating Expenses | 1,125,887 | 1,124,756 | 1,130,182 | 1,133,856 | 1,090,937 | 2,901.43 |
| Total Operating Expenses | $2,095,078 | $2,114,956 | $2,210,497 | $2,214,860 | $2,234,311 | $5,942.32 |
| Net Operating Income | $3,667,533 | $3,723,590 | $3,764,806 | $3,782,944 | $3,805,606 | $10,121.29 |
| Replacement Reserves | 64,484 | 97,146 | 15,301 | 18,838 | 91,851 | 244.28 |
| Net Cash Flow | $3,603,049 | $3,626,444 | $3,749,505 | $3,764,106 | $3,713,755 | $9,877.01 |
| Occupancy | 98.0% | 97.3% | 98.4% | 99.7% | 88.8%(2) | |
| NOI DSCR | 1.48x | 1.50x | 1.52x | 1.53x | 1.54x | |
| NCF DSCR | 1.46x | 1.46x | 1.51x | 1.52x | 1.50x | |
| NOI Debt Yield | 8.0% | 8.1% | 8.2% | 8.2% | 8.3% | |
| NCF Debt Yield | 7.8% | 7.9% | 8.2% | 8.2% | 8.1% | |
| (1) | In 2012, the County of Monroe Industrial Development Agency arranged a payment in lieu of taxes (“PILOT”) with the borrower for the Legends at North Ponds Park Senior Townhomes property, which will remain in effect until June 30, 2023. Upon expiration of the PILOT period, the related borrower will be required to resume paying real estate taxes based on a full tax assessment and applicable tax rate. Real Estate Taxes are underwritten to the non-exempt tax level. |
| (2) | UW Occupancy represents the economic occupancy. The Rochester Multifamily Portfolio Properties were 99.7% occupied as of May 6, 2021. |
Escrows and Reserves.
Real Estate Taxes – The Rochester Multifamily Portfolio Mortgage Loan documents provide for an upfront reserve of approximately $438,675 for real estate taxes and ongoing monthly deposits into a reserve for real estate taxes in an amount equal to 1/12th of the real estate taxes that the lender estimates will be payable during the next twelve months for the Rochester Multifamily Portfolio Properties (initially approximately $61,681 per month).
Insurance – In the event the Rochester Multifamily Portfolio Properties are no longer covered by a blanket insurance policy, the borrower is required to deposit 1/12th of the annual estimated insurance premiums monthly.
Replacement Reserve – The borrower is required to deposit approximately $7,654 for replacements monthly.
Lockbox and Cash Management. The Rochester Multifamily Portfolio Mortgage Loan is structured with a springing lockbox and springing cash management. Upon the first occurrence of a Cash Sweep Period (defined below) or an event of default, the borrower is required to establish a lockbox account for the benefit of the lender, into which all rents and other revenue from the Rochester Multifamily Portfolio Properties are required to be deposited by the borrower. During a Cash Sweep Period, all funds in the lockbox account are required to be transferred to the lender-controlled cash management account and disbursed in accordance with the Rochester Multifamily Portfolio Mortgage Loan documents. Also, during a Cash Sweep Period all excess cash is required to be collected by the lender and held as additional security for the Rochester Multifamily Portfolio Mortgage Loan.
A “Cash Sweep Period” will commence when the debt service coverage ratio is less than 1.15x (tested quarterly) and continue until the debt service coverage ratio is equal to or greater than 1.15x for two consecutive calendar quarters.
Additional Secured Indebtedness (not including trade debts). None.
Mezzanine Loan and Preferred Equity. Not permitted.
Release of Property. At any time following the first two years after the Closing Date, the borrower is permitted to obtain the release of one or more individual properties in connection with a sale to a purchaser that is not affiliated with the borrower, subject to the following conditions, among others: (i) no event of default is continuing, (ii) the Rochester Multifamily Portfolio Mortgage Loan is defeased by an amount equal to 125% of the allocated loan amount for each property being released (iii) if required by the lender, rating agency confirmation has been obtained, (iv) after giving effect to the release, the remaining property or properties meet (a) a minimum debt yield of the greater of 8.1% and the debt yield immediately prior to the release and (b) a minimum amortizing debt service coverage ratio of the greater of 1.50x and the amortizing debt service coverage ratio immediately prior to the release, (c) a loan to value ratio less than the loan to value ratio immediately prior to the release, and (v) customary REMIC requirements are satisfied.
Letter of Credit. None.
| This is not a research report and was not prepared by any Underwriter’s research department. Please see additional important information and qualifications at the end of this Term Sheet. |
97
| Multifamily – Various | Loan #7 | Cut-off Date Balance: | $46,000,000 | |
| Various | Rochester Multifamily Portfolio | Cut-off Date LTV: | 71.0% | |
| Various, NY | U/W NCF DSCR: | 1.50x | ||
| U/W NOI Debt Yield: | 8.3% |
Right of First Offer / Right of First Refusal. None
Ground Lease. None
Terrorism Insurance. The borrower is required to obtain and maintain property insurance that covers perils and acts of terrorism and is required to obtain and maintain business interruption insurance for 18 months plus a 6-month extended period of indemnity. See “Risk Factors—Risks Relating to the Mortgage Loans—Terrorism Insurance May Not Be Available for All Mortgaged Properties” in the prospectus.
| This is not a research report and was not prepared by any Underwriter’s research department. Please see additional important information and qualifications at the end of this Term Sheet. |
98
(THIS PAGE INTENTIONALLY LEFT BLANK)
| This is not a research report and was not prepared by any Underwriter’s research department. Please see additional important information and qualifications at the end of this Term Sheet. |
99
| Multifamily – Garden | Loan #8 The Lodges Phase I and II | Cut-off Date Balance: | $44,850,000 | |
| 901 South 72nd Avenue | Cut-off Date LTV: | 65.5% | ||
| Yakima, WA 98908 | U/W NCF DSCR: | 2.32x | ||
| U/W NOI Debt Yield: | 8.1% |
| This is not a research report and was not prepared by any Underwriter’s research department. Please see additional important information and qualifications at the end of this Term Sheet. |
100
| Multifamily – Garden | Loan #8 The Lodges Phase I and II | Cut-off Date Balance: | $44,850,000 | |
| 901 South 72nd Avenue | Cut-off Date LTV: | 65.5% | ||
| Yakima, WA 98908 | U/W NCF DSCR: | 2.32x | ||
| U/W NOI Debt Yield: | 8.1% |
| This is not a research report and was not prepared by any Underwriter’s research department. Please see additional important information and qualifications at the end of this Term Sheet. |
101
| Mortgage Loan No. 8 – The Lodges Phase I and II |
| Mortgage Loan Information | Property Information | ||||||
| Mortgage Loan Seller: | MSMCH | Single Asset/Portfolio: | Single Asset | ||||
| Credit Assessment (DBRSM/Fitch/S&P): | NR/NR/NR | Location: | Yakima, WA 98908 | ||||
| Original Balance: | $44,850,000 | General Property Type: | Multifamily | ||||
| Cut-off Date Balance: | $44,850,000 | Detailed Property Type: | Garden | ||||
| % of Initial Pool Balance: | 3.2% | Title Vesting: | Fee | ||||
| Loan Purpose: | Refinance | Year Built/Renovated: | 2019-2021/NAP | ||||
| Borrower Sponsor: | Byron G. Borton | Size: | 426 Units | ||||
| Guarantors: | Byron G. Borton | Cut-off Date Balance per Unit: | $105,282 | ||||
| Mortgage Rate: | 3.3200% | Maturity Date Balance per Unit: | $105,282 | ||||
| Note Date: | 6/25/2021 | Property Manager: | Self-managed | ||||
| First Payment Date: | 8/1/2021 | ||||||
| Maturity Date: | 7/1/2031 | ||||||
| Original Term to Maturity: | 120 months | ||||||
| Original Amortization Term: | 0 months | ||||||
| IO Period: | 120 months | ||||||
| Seasoning: | 1 month | Underwriting and Financial Information(2) | |||||
| Prepayment Provisions: | L(25),D(90),O(5) | UW NOI: | $3,613,485 | ||||
| Lockbox/Cash Mgmt Status: | Springing/Springing | UW NOI Debt Yield: | 8.1% | ||||
| Additional Debt Type: | No | UW NOI Debt Yield at Maturity: | 8.1% | ||||
| Additional Debt Balance: | NAP | UW NCF DSCR: | 2.32x | ||||
| Future Debt Permitted (Type): | No (NAP) | Most Recent NOI(3): | $2,112,801 (5/31/2021 TTM) | ||||
| Reserves(1) | 2nd Most Recent NOI(3): | $998,819 (12/31/2020) | |||||
| Type | Initial | Monthly | Cap | 3rd Most Recent NOI: | NAP | ||
| RE Taxes: | $94,215 | $31,405 | NAP | Most Recent Occupancy(4): | 99.3% (7/2/2021) | ||
| Insurance: | $0 | Springing | NAP | 2nd Most Recent Occupancy(5): | 98.4% (12/31/2020) | ||
| Capital Expenditures: | $150,000 | $8,875 | NAP | 3rd Most Recent Occupancy: | NAP | ||
| Deferred Maintenance: | $3,750 | $0 | NAP | Appraised Value (as of): | $68,450,000 (5/17/2021) | ||
| Environmental Reserve: | $93,750 | $0 | NAP | Appraised Value per Unit: | $160,681 | ||
| Cut-off Date LTV Ratio: | 65.5% | ||||||
| Maturity Date LTV Ratio: | 65.5% | ||||||
| Sources and Uses | ||||||
| Sources | Proceeds | % of Total | Uses | Proceeds | % of Total | |
| Mortgage Loan Amount: | $44,850,000 | 100.0% | Loan Payoff: | $33,754,225 | 75.3% | |
| Return of Equity: | $10,472,120 | 23.3% | ||||
| Reserves: | $341,715 | 0.8% | ||||
| Closing Costs: | $281,940 | 0.6% | ||||
| Total Sources: | $44,850,000 | 100.0% | Total Uses: | $44,850,000 | 100.0% | |
| (1) | See “Escrows and Reserves” below. |
| (2) | The novel coronavirus pandemic is an evolving situation and could impact The Lodges Phase I and II Mortgage Loan (as defined below) more severely than assumed in the underwriting of The Lodges Phase I and II Mortgage Loan and could adversely affect the NOI, NCF and occupancy information, as well as the appraised value and the DSCR, LTV and Debt Yield metrics presented above and herein. See “Risk Factors—Risks Related to Market Conditions and Other External Factors—The Coronavirus Pandemic Has Adversely Affected the Global Economy and Will Likely Adversely Affect the Performance of the Mortgage Loans” in the prospectus. |
| (3) | See “Operating History and Underwritten Net Cash Flow” below. |
| (4) | 99.3% most recent occupancy represents percent leased. As of July 2, 2021, the Lodges Phase I and II Property (as defined below) was 92.7% occupied. |
| (5) | 2nd Most Recent Occupancy is based on the 258 units completed as of December 31, 2020. |
The Mortgage Loan. The eighth largest mortgage loan (“The Lodges Phase I and II Mortgage Loan”) is evidenced by a promissory note in the original principal amount of $44,850,000. The Lodges Phase I and II Mortgage Loan is secured by a first priority fee mortgage encumbering a multifamily property located in Yakima, Washington (“The Lodges Phase I and II Property”).
The Borrower and the Borrower Sponsor. The borrower is The Lodges Yakima, LLC, a single-purpose Delaware limited liability company with two independent directors. The borrower sponsor and the non-recourse carveout guarantor is Byron G. Borton. The borrower is managed by Byron G. Borton and is 100% owned by The Lodges in West Yakima, LLC which is also managed by Byron G. Borton. The borrower sponsor has ownership in 12 properties comprised of office, industrial, land, car wash, restaurant/bar, gym, and medical office uses totaling approximately 123,000 SF and 70 single family rentals throughout Washington totaling approximately 88,725 SF.
| This is not a research report and was not prepared by any Underwriter’s research department. Please see additional important information and qualifications at the end of this Term Sheet. |
102
| Multifamily – Garden | Loan #8 The Lodges Phase I and II | Cut-off Date Balance: | $44,850,000 | |
| 901 South 72nd Avenue | Cut-off Date LTV: | 65.5% | ||
| Yakima, WA 98908 | U/W NCF DSCR: | 2.32x | ||
| U/W NOI Debt Yield: | 8.1% |
The Property. The Lodges Phase I and II Property is a 426-unit garden multifamily apartment complex with 14 apartment buildings, a free-standing office/clubhouse, and a free-standing garage/storage/fitness center, situated on an approximately 20.06-acre site in Yakima, Washington. The Lodges Phase I and II Property was built during 2019 through 2021 and is comprised of 426 apartment units, totaling 377,694 SF. Phase II of The Lodges Phase I and II Property was recently still in lease up and as of July 2, 2021, Phase II was 98.9% leased. The apartment unit mix is comprised of studios, one-, two- and three-bedroom units ranging in size from 533 – 1,269 SF with an average of 887 SF. As of July 2, 2021, The Lodges Phase I and II Property is currently 99.3% leased and 92.7% occupied at an average contract rent of $969 per unit per month. Building amenities include a pool, property manager on site, free-standing office/clubhouse, storage units, garage spaces, a fitness center, a children’s playground, and walking and biking trails. Unit amenities include washer/dryer in unit, dishwasher, garbage disposal, walk in closets, granite countertops, stainless steel appliances, patio, and private deck. The Lodges Phase I and II Property contains 692 parking spaces (1.62 spaces per unit), with 686 surface spaces, and six garage spaces. The six garage spaces are available to rent at $125 per month. The Lodges Phase I and II Property also has 18 storage units available for rent. These units measure approximately 8’ x 15’ and have an asking rent of $300 per month. The borrower sponsor is in the process of leasing the garage and storage units. Approximately 6.6% of tenants lease their spaces on a month-to-month basis as of the July 2, 2021 rent roll.
The table below shows the residential apartment unit mix at The Lodges Phase I and II Property:
| Apartment Unit Mix | ||||||
| Unit Mix / Type | Total Units | Leased Units | % Leased | Average SF per Unit | Monthly Average Rent per Unit | Monthly Average Rent PSF |
| Studio | 120 | 118 | 98.3% | 533 | $691 | $1.30 |
| One Bedroom | 78 | 77 | 98.7% | 819 | $882 | $1.08 |
| Two Bedroom | 168 | 168 | 100.0% | 1,034 | $1,110 | $1.07 |
| Three Bedroom | 60 | 60 | 100.0% | 1,269 | $1,269 | $1.00 |
| Total/Average(1) | 426 | 423 | 99.3% | 887 | $969 | $1.09 |
Source: Borrower rent roll dated July 2, 2021.
| (1) | As of July 2, 2021, The Lodges Phase I and II Property is 92.7% occupied. |
COVID-19 Update. The Lodges Phase I and II Mortgage Loan was originated on June 25, 2021, and as of such date is not subject to any modification or forbearance request. The first debt service payment is in August 2021. As of July 9, 2021, the borrower sponsor has reported that 93.8% of billed rent was collected for the month of June 2021. There are currently 25 units with rents in arrears totaling approximately $31,000. The borrower sponsor plans to work on payment plans with the tenants to bring rents current. The borrower sponsor’s typical process is to work with the tenants for up to two months of being past due on a payment before taking any legal action, subject to any applicable eviction moratoriums.
The Market. The Lodges Phase I and II Property is located in Yakima, Washington in the Yakima multifamily submarket in the Yakima metropolitan statistical area (“MSA”). Primary access to The Lodges Phase I and II Property is provided by Summitview Ave, W. Nob Blvd, and S. 40th Avenue. Interstate 82 is located 6 miles east and is accessed directly from W. Nob Hill Blvd. This interstate connects with Interstate 90 that runs east-west from Seattle to Spokane. Public transportation includes the local bus service which is provided by Yakima Transit of Yakima and Kittitas Counties. Yakima has its own airport, McAllister Field, which is located about one mile from The Lodges Phase I and II Property and flies regionally. Valley Mall, which is located about four miles southeast from The Lodges Phase I and II Property, is the primary shopping center in the area and is anchored by Macy’s, Sears, and Kohl’s. According to the appraisal, as of the first quarter of 2021, the vacancy rate in the Yakima multifamily submarket was approximately 4.2%, with average asking rents of $889 per unit and inventory of approximately 6,474 units. According to the appraisal, as of the first quarter of 2021, the vacancy rate in the Yakima MSA multifamily market was approximately 3.3%, with average asking rents of $873 per unit and inventory of approximately 12,348 units. According to the appraisal, the estimated 2020 population within a one-, three- and five-mile radius of The Lodges Phase I and II Property was 8,843, 51,568 and 107,830, respectively. The estimated 2020 average household income within the same radii was $75,976, $80,030 and $67,858, respectively.
| This is not a research report and was not prepared by any Underwriter’s research department. Please see additional important information and qualifications at the end of this Term Sheet. |
103
| Multifamily – Garden | Loan #8 The Lodges Phase I and II | Cut-off Date Balance: | $44,850,000 | |
| 901 South 72nd Avenue | Cut-off Date LTV: | 65.5% | ||
| Yakima, WA 98908 | U/W NCF DSCR: | 2.32x | ||
| U/W NOI Debt Yield: | 8.1% |
The following table presents certain information relating to comparable multifamily rental properties to The Lodges Phase I and II Property:
| Comparable Rental Properties | ||||||
| Property | Year Built | # Units | Unit Mix | Average SF per Unit | Average Monthly Rent per Unit | Average Monthly Rent PSF |
The Lodges Phase I and II(1) Yakima, WA (subject property) | 2019- 2021 | 426 | Studio 1BR 2BR 3BR | 533 819 1,034 1,269 | $691 $882 $1,110 $1,269 | $1.30 $1.08 $1.07 $1.00 |
Northern Heights Apartments Spokane, WA | 2018 | 232 | Studio 1BR 2BR 3BR | 612 725 898 1,128 | $900 $1,000 $1,254 $2,200 | $1.47 $1.38 $1.40 $1.95 |
Seasons on 4th Avenue Kennewick, WA | 2006 | 168 | 1BR 2BR 3BR | 980 1,203 1,233 | $1,237 $1,461 $1,688 | $1.26 $1.21 $1.37 |
Columbia River Walk Pasco, WA | 2020 | 288 | 1BR 2BR 3BR | 860 1,007 1,250 | $999 $1,308 $1,600 | $1.16 $1.30 $1.28 |
Affinity at Southridge Kennewick, WA | 2013 | 150 | Studio 1BR 2BR | 500 597 805 | $1,245 $1,400 $1,795 | $2.49 $2.35 $2.23 |
University Parkway Apartments(2) Yakima, WA | 2014 | 534 | 1BR 2BR 3BR | 819 1,034 1,269 | $834 $1,011 $1,112 | $1.02 $0.98 $0.88 |
Castle Creek Apartments(2) Yakima, WA | 2009 | 330 | 1BR 2BR 3BR | 738 954 1,188 | $828 $956 $1,107 | $1.12 $1.00 $0.93 |
Source: Appraisal, unless otherwise indicated.
| (1) | Based on the borrower rent roll dated July 2, 2021. |
| (2) | Owned by the borrower sponsor. A second phase of the University Parkway property is under construction and is expected to add 168 units and to open by the end of 2021. |
The following table presents certain information relating to the appraisal’s market rent conclusion for The Lodges Phase I and II Property:
| Market Rent Summary | ||||||
| Building | Units(1) | Average Size (SF) (1) | Avg. Monthly Rent per Unit(1) | Avg. Monthly Rent PSF(1) | Avg. Monthly Market Rent per Unit(2) | Avg. Monthly Market Rent PSF(2) |
| Studio | 120 | 533 | $691 | $1.30 | $750 | $1.41 |
| One Bedroom | 78 | 819 | $882 | $1.08 | $950 | $1.16 |
| Two Bedroom | 168 | 1,034 | $1,110 | $1.07 | $1,200 | $1.16 |
| Three Bedroom | 60 | 1,269 | $1,269 | $1.00 | $1,400 | $1.10 |
| (1) | Based on the borrower rent roll dated July 2, 2021. |
| (2) | Based on the appraisal. |
| This is not a research report and was not prepared by any Underwriter’s research department. Please see additional important information and qualifications at the end of this Term Sheet. |
104
| Multifamily – Garden | Loan #8 The Lodges Phase I and II | Cut-off Date Balance: | $44,850,000 | |
| 901 South 72nd Avenue | Cut-off Date LTV: | 65.5% | ||
| Yakima, WA 98908 | U/W NCF DSCR: | 2.32x | ||
| U/W NOI Debt Yield: | 8.1% |
Operating History and Underwritten Net Cash Flow. The following table presents certain information relating to the historical operating performance and Underwritten Net Cash Flow at The Lodges Phase I and II Property:
| Cash Flow Analysis(1) | ||||
| 2020 | 5/31/2021 TTM | UW | UW per Unit | |
| Gross Potential Rent(2) | $1,365,850 | $4,033,984 | $5,005,500 | $11,750.00 |
| Discounts Concessions | ($4,134) | $0 | $0 | $0.00 |
| Other Income(3) | $95,658 | $148,004 | $165,404 | $388.27 |
| Vacancy & Credit Loss | $0 | $0 | ($250,275) | ($587.50) |
| Effective Gross Income | $1,457,375 | $4,181,988 | $4,920,629 | $11,550.77 |
| Real Estate Taxes | $9,727 | $467,881 | $376,858 | $884.64 |
| Insurance | $62,923 | $19,912 | $48,990 | $115.00 |
| Other Expenses | $385,905 | $612,607 | $881,296 | $2,068.77 |
| Total Expenses | $458,556 | $1,100,400 | $1,307,144 | $3,068.41 |
| Net Operating Income(4) | $998,819 | $3,081,588 | $3,613,485 | $8,482.36 |
| Capital Expenditures | $0 | $0 | $106,500 | $250.00 |
| TI/LC | $0 | $0 | $0 | $0.00 |
| Net Cash Flow | $998,819 | $3,081,588 | $3,506,985 | $8,232.36 |
| Occupancy %(2) | 98.4% | 99.3% | 94.9% | |
| NOI DSCR | 0.66x | 2.04x | 2.39x | |
| NCF DSCR | 0.66x | 2.04x | 2.32x | |
| NOI Debt Yield | 2.2% | 6.9% | 8.1% | |
| NCF Debt Yield | 2.2% | 6.9% | 7.8% | |
| (1) | For the avoidance of doubt, no COVID-19 specific adjustments have been made to the lender underwriting. |
| (2) | UW Gross Potential Rent and 5/31/2021 TTM Occupancy % are based on the borrower rent roll dated July 2, 2021 and shows the percentage of units at The Lodges Phase I and II Property that is leased. As of July 2, 2021 The Lodges Phase I and II Property is 92.7% occupied. 2020 occupancy is based on the 258 units completed as of December 31, 2020. |
| (3) | Other Income is comprised of non-refundable deposits, application fees, reimbursed expenses and a one-time payment that was required under a contract with Charter Communications, which provides communications services at The Lodges Phase I and II Property. The one-time payment is expected to be renegotiated at the conclusion of the contract with Charter Communications in 2023. The contract is subject to automatic one-year renewals unless either party elects not to renew. The UW includes one-year’s pro rata share of this contractual payment. |
| (4) | The increases in Net Operating Income from 2020 to 5/31/2021 TTM and from 5/31/2021 TTM to UW are due to The Lodges Phase I and II Property being built from 2019 through 2021, and being in lease up. |
Escrows and Reserves.
Real Estate Taxes –The Lodges Phase I and II Mortgage Loan documents provide for an upfront deposit of approximately $94,215 for real estate taxes, and for ongoing monthly deposits into a reserve for real estate taxes in an amount equal to 1/12 of the real estate taxes that the lender estimates will be payable during the next twelve months for The Lodges Phase I and II Property.
Insurance – The Lodges Phase I and II Mortgage Loan documents provide for ongoing monthly deposits into a reserve for insurance premiums in an amount equal to 1/12 of the insurance premiums that the lender estimates will be payable for the renewal of coverage upon the expiration of the insurance policies; provided that such monthly deposits are not required so long as (i) no event of default is continuing, (ii) the liability and casualty insurance coverage for The Lodges Phase I and II Property is included in a blanket policy approved by the lender in its reasonable discretion, and (iii) the borrower provides the lender with paid receipts for payment of the insurance premiums and provides evidence of renewals of the insurance policies, no later than ten days prior to the expiration of the current policy.
Deferred Maintenance – The Lodges Phase I and II Mortgage Loan documents provide for an upfront reserve of $3,750 for deferred maintenance consisting of inspection of fire extinguishers, fire alarm systems and fire suppression systems.
Capital Expenditures – The Lodges Phase I and II Mortgage Loan documents provide for an upfront reserve of approximately $150,000 for annual capital expenditures and landscaping expenses, and ongoing monthly deposits of $8,875 into a reserve for capital expenditures.
Environmental – The Lodges Phase I and II Mortgage Loan documents provide for an upfront reserve of approximately $93,750 for the purpose of performing and completing all outstanding environmental work at The Lodges Phase I and II Property in order for the borrower to obtain a no further action letter with respect to release of certain hazardous materials that are or were present at The Lodges Phase I and II Property.
Lockbox and Cash Management. The Lodges Phase I and II Mortgage Loan is structured with a springing lockbox and springing cash management. Upon the first occurrence of a Cash Sweep Event Period (as defined below), the borrower is required to establish and maintain a lockbox account for the benefit of the lender, and the borrower and property manager are required to deposit all rents directly into the lockbox account within one business day of receipt. Upon the first occurrence of a Cash Sweep Event Period, the lender is required to establish, and the borrower is required to cooperate with the cash management bank to establish, a lender-controlled cash management account, into which all funds in the lockbox account will be required to be deposited, so long as the Cash Sweep Event Period is continuing. During the continuance of a Cash Sweep Event Period, provided no event of default under The Lodges Phase I and II Mortgage Loan documents is continuing, all funds in the cash management account are required to be applied on each
| This is not a research report and was not prepared by any Underwriter’s research department. Please see additional important information and qualifications at the end of this Term Sheet. |
105
| Multifamily – Garden | Loan #8 The Lodges Phase I and II | Cut-off Date Balance: | $44,850,000 | |
| 901 South 72nd Avenue | Cut-off Date LTV: | 65.5% | ||
| Yakima, WA 98908 | U/W NCF DSCR: | 2.32x | ||
| U/W NOI Debt Yield: | 8.1% |
monthly payment date: (i) to make the monthly deposits into the real estate tax and insurance reserves as described above under “Escrows and Reserves,” (ii) to pay debt service on The Lodges Phase I and II Mortgage Loan, (iii) to make the monthly deposit into the capital expenditures reserve as described above under “Escrows and Reserves,” (iv) to pay operating expenses set forth in the lender-approved annual budget and lender-approved extraordinary expenses, and (v) to deposit any remainder into an excess cash flow reserve to be held as additional security for The Lodges Phase I and II Mortgage Loan during the continuance of such Cash Sweep Event Period. If no Cash Sweep Event Period is continuing, all funds in the excess cash flow subaccount are required to be disbursed to the borrower.
“Cash Sweep Event Period” means a period:
| (i) | commencing upon an event of default under The Lodges Phase I and II Mortgage Loan documents and ending upon the cure, if applicable, of such event of default; and |
| (ii) | commencing upon the debt service coverage ratio of The Lodges Phase I and II Mortgage Loan falling below 1.30x at the end of any calendar quarter and ending upon the date the debt service coverage ratio is equal to or greater than 1.30x for the immediately preceding two consecutive calendar quarters. |
Additional Secured Indebtedness (not including trade debts). None.
Mezzanine Loan and Preferred Equity. Not permitted.
Release of Property. Not permitted.
Letter of Credit. None.
Right of First Offer / Right of First Refusal. None.
Ground Lease. None.
Terrorism Insurance. The borrower is required to obtain and maintain an “all risk” or “special form” property insurance policy that covers acts of terrorism in an amount equal to the “full replacement cost” of The Lodges Phase I and II Property, together with business income insurance covering not less than the 18-month period commencing at the time of loss, together with an extended period of indemnity endorsement which provides that after the physical loss to the improvements and personal property has been repaired, the continued loss of income will be insured until such income returns to the same level it was at prior to the loss. Notwithstanding the foregoing, for so long as the Terrorism Risk Insurance Act of 2002, as extended and modified by the Terrorism Risk Insurance Program Reauthorization Act of 2015 (“TRIPRA”), is in effect (including any extensions thereof or if another federal governmental program is in effect relating to “acts of terrorism” which provides substantially similar protections as TRIPRA), the lender is required to accept terrorism insurance which covers against “covered acts” as defined by TRIPRA (or such other program) but only in the event that TRIPRA (or such other program) continues to cover both domestic and foreign acts of terrorism. See “Risk Factors—Risks Relating to the Mortgage Loans—Terrorism Insurance May Not Be Available for All Mortgaged Properties” in the prospectus.
| This is not a research report and was not prepared by any Underwriter’s research department. Please see additional important information and qualifications at the end of this Term Sheet. |
106
(THIS PAGE INTENTIONALLY LEFT BLANK)
| This is not a research report and was not prepared by any Underwriter’s research department. Please see additional important information and qualifications at the end of this Term Sheet. |
107
| Retail – Anchored | Loan #9 | Cut-off Date Balance: | $44,500,000 | |
| 8801-8823, 8827-8831, 8843, 8847, 8853, | The Landing at Woodyard | Cut-off Date LTV: | 65.5% | |
| 8871, 8875, 8879, 8883, 8887, 8893-8897 | UW NCF DSCR: | 2.21x | ||
| Woodyard Road Clinton, MD 20735 | UW NOI Debt Yield: | 8.8% |
| This is not a research report and was not prepared by any Underwriter’s research department. Please see additional important information and qualifications at the end of this Term Sheet. |
108
| Retail – Anchored | Loan #9 | Cut-off Date Balance: | $44,500,000 | |
| 8801-8823, 8827-8831, 8843, 8847, 8853, | The Landing at Woodyard | Cut-off Date LTV: | 65.5% | |
| 8871, 8875, 8879, 8883, 8887, 8893-8897 | UW NCF DSCR: | 2.21x | ||
| Woodyard Road Clinton, MD 20735 | UW NOI Debt Yield: | 8.8% |
| This is not a research report and was not prepared by any Underwriter’s research department. Please see additional important information and qualifications at the end of this Term Sheet. |
109
| Retail – Anchored | Loan #9 | Cut-off Date Balance: | $44,500,000 | |
| 8801-8823, 8827-8831, 8843, 8847, 8853, | The Landing at Woodyard | Cut-off Date LTV: | 65.5% | |
| 8871, 8875, 8879, 8883, 8887, 8893-8897 | UW NCF DSCR: | 2.21x | ||
| Woodyard Road Clinton, MD 20735 | UW NOI Debt Yield: | 8.8% |

| This is not a research report and was not prepared by any Underwriter’s research department. Please see additional important information and qualifications at the end of this Term Sheet. |
110
| Mortgage Loan No. 9 – The Landing at Woodyard |
| Mortgage Loan Information | Property Information | ||||||
| Mortgage Loan Seller: | MSMCH | Single Asset/Portfolio: | Single Asset | ||||
| Credit Assessment (DBRSM/Fitch/S&P): | NR/NR/NR | Location: | Clinton, MD 20735 | ||||
| Original Balance: | $44,500,000 | General Property Type: | Retail | ||||
| Cut-off Date Balance: | $44,500,000 | Detailed Property Type: | Anchored | ||||
| % of Initial Pool Balance: | 3.2% | Title Vesting: | Fee | ||||
| Loan Purpose: | Refinance | Year Built/Renovated: | 1980/2021 | ||||
| Borrower Sponsors: | Erik Hugus, Joseph Molle, Nicholas DeSanctis and Robert Prendergast | Size: | 209,505 SF | ||||
| Cut-off Date Balance Per SF: | $212 | ||||||
| Guarantors: | Erik Hugus, Joseph Molle, Nicholas DeSanctis and Robert Prendergast | Maturity Date Balance Per SF: | $212 | ||||
| Property Manager: | Integrated Properties, Inc. | ||||||
| Mortgage Rate: | 3.7400% | (borrower-related) | |||||
| Note Date: | 6/3/2021 | ||||||
| First Payment Date: | 8/1/2021 | ||||||
| Maturity Date: | 7/1/2031 | ||||||
| Original Term to Maturity: | 120 months | Underwriting and Financial Information(2) | |||||
| Original Amortization Term: | 0 months | UW NOI(3): | $3,905,694 | ||||
| IO Period: | 120 months | UW NOI Debt Yield: | 8.8% | ||||
| Seasoning: | 1 month | UW NOI Debt Yield at Maturity: | 8.8% | ||||
| Prepayment Provisions: | L(25),D(88),O(7) | UW NCF DSCR: | 2.21x | ||||
| Lockbox/Cash Mgmt Status: | Hard/Springing | Most Recent NOI: | $2,498,323 (3/31/2021 TTM) | ||||
| Additional Debt Type: | No | 2nd Most Recent NOI: | $2,219,610 (12/31/2020) | ||||
| Additional Debt Balance: | NAP | 3rd Most Recent NOI: | $913,370 (12/31/2019) | ||||
| Future Debt Permitted (Type): | No (N/A) | Most Recent Occupancy: | 96.1% (4/1/2021) | ||||
| Reserves(1) | 2nd Most Recent Occupancy: | 81.8% (12/31/2020) | |||||
| Type | Initial | Monthly | Cap | 3rd Most Recent Occupancy: | 69.1% (12/31/2019) | ||
| RE Tax: | $326,860 | $32,686 | NAP | Appraised Value (as of)(4): | $67,950,000 (4/8/2021) | ||
| Insurance: | $102,430 | $10,243 | NAP | Appraised Value Per SF: | $324 | ||
| Recurring Replacements: | $1,188,808 | $2,619 | NAP | Cut-off Date LTV Ratio: | 65.5% | ||
| Rollover: | $0 | Springing | $524,553 | Maturity Date LTV Ratio: | 65.5% | ||
| Other: | $1,424,139 | Springing | NAP | ||||
| Sources and Uses | ||||||
| Sources | Proceeds | % of Total | Uses | Proceeds | % of Total | |
| Mortgage Loan Amount: | $44,500,000 | 100.0% | Loan Payoff: | $37,937,461 | 85.3% | |
| Reserves: | $3,042,238 | 6.8% | ||||
| Return of Equity: | $2,800,851 | 6.3% | ||||
| Closing Costs: | $719,450 | 1.6% | ||||
| Total Sources: | $44,500,000 | 100.0% | Total Uses: | $44,500,000 | 100.0% | |
| (1) | See “Escrows and Reserves” below. |
| (2) | The novel coronavirus pandemic is an evolving situation and could impact The Landing at Woodyard Mortgage Loan (as defined below) more severely than assumed in the underwriting of The Landing at Woodyard Mortgage Loan and could adversely affect the NOI, NCF and occupancy information, as well as the appraised value and the DSCR, LTV and Debt Yield metrics presented above and herein. See “Risk Factors-—Risks Related to Market Conditions and Other External Factors—The Coronavirus Pandemic Has Adversely Affected the Global Economy and Will Likely Adversely Affect the Performance of the Mortgage Loans” in the prospectus. |
| (3) | Underwritten NOI includes rent from 5 tenants, representing 7.5% of NRA and 14.3% of underwritten base rent, as to which the related lease has not yet commenced, including Crafty Crab, Mezeh Grille, Supreme BBQ, Milk & Honey and Patriot Urgent Care. At origination gap rent was reserved for such tenants, and additional amounts are required to be reserved if such tenants’ premises are not delivered by a specified delivery date. See “Escrows and Reserves” below. |
| (4) | The Appraised Value of $67,950,000 is based on the extraordinary assumption of a capital reserve account equal to the planned capital expenditures and leasing costs to complete the current renovation project at The Landing at Woodyard Property (as defined below). The appraisal states that based on information provided by ownership of The Landing at Woodyard Property such costs total $3,081,554. As of the origination date, the borrower reserved with the lender $1,188,808 for capital expenditures, and $937,599 for leasing expenses, or a total of $2,126,408. The Appraised Value of $67,950,000 also excludes the value of an enterprise zone credit which The Landing at Woodyard Property is entitled to receive for a remaining period of nine years. Such credit was not underwritten by the lender. |
The Mortgage Loan. The ninth largest mortgage loan (“The Landing at Woodyard Mortgage Loan”) is evidenced by a promissory note in the original principal amount of $44,500,000 and secured by a first priority fee mortgage encumbering a 209,505 SF anchored retail shopping center located in Clinton, Maryland (“The Landing at Woodyard Property”).
The Borrower and the Borrower Sponsor. The borrower for The Landing at Woodyard Mortgage Loan is Clinton Investors, LLC, a single-purpose Delaware limited liability company with no independent directors in its organizational structure. The non-recourse carveout guarantors and borrower sponsors are Erik Hugus, Joseph Molle, Nicholas DeSanctis and Robert Prendergast. Joseph Molle and Erik Hugus are principals of Meritus Realty Ventures, LLC, a commercial real estate firm that acquires, repositions and manages shopping centers and medical office buildings throughout the eastern United States. Nicholas DeSanctis is a principal at Vedic Holdings, a real estate company that engages in the acquisition, operating, renovation, asset management and leasing of stabilized, value-add and distressed commercial and residential properties. Robert Prendergast is the founder and president
| This is not a research report and was not prepared by any Underwriter’s research department. Please see additional important information and qualifications at the end of this Term Sheet. |
111
| Retail – Anchored | Loan #9 | Cut-off Date Balance: | $44,500,000 | |
| 8801-8823, 8827-8831, 8843, 8847, 8853, | The Landing at Woodyard | Cut-off Date LTV: | 65.5% | |
| 8871, 8875, 8879, 8883, 8887, 8893-8897 | UW NCF DSCR: | 2.21x | ||
| Woodyard Road Clinton, MD 20735 | UW NOI Debt Yield: | 8.8% |
of Integrated Properties, Inc., a Boston based national real estate owner, property management and construction management firm specializing in real estate shopping centers and office buildings. The borrower sponsors collectively own approximately 1.00% of the borrower as common members or as owners of the manager of the borrower, and approximately 70 preferred members own 99.0% of the borrower, which includes approximately 12.43% owned by the borrower sponsors and 24.75% owned by a trust formed for the benefit of family members of certain of the borrower sponsors. No other preferred member owns more than 3.71% of the borrower. The preferred members do not have the right to take control of the borrower.
The Property. The Landing at Woodyard Property is a 209,505 SF anchored retail shopping center on an approximately 22.0-acre site in Clinton, Maryland. The Landing at Woodyard Property was built in 1980 and renovated in 2021. The Landing at Woodyard Property is anchored by Burlington Coat Factory (“Burlington”), Marshalls, Ross Dress for Less (“Ross”), and Aldi, and as of April 1, 2021, was 96.1% leased to 29 tenants. The Landing at Woodyard Property contains 853 parking spaces (4.1 spaces per 1,000 SF). The borrower recently completed the redevelopment and rebranding of The Landing at Woodyard Property at a total cost of approximately $25.8 million. The scope of the project included new building facades, a new roof, the complete reworking of the infrastructure for utilities, a parking lot and lighting upgrades, and a completely new build-out of the interiors. The borrower plans to spend an additional $2,126,408 on capital expenditures and tenant improvements which was escrowed for at origination. The borrower has received letters of interest from America’s Best Contacts & Lenses for the one vacant suite at The Landing at Woodyard Property, and the borrower is currently negotiating a lease with the potential tenant at a rental rate of $33.25 PSF. However, there can be no assurance that such a lease will be entered into.
Major Tenants.
Burlington (43,481 SF, 20.8% of NRA, 12.9% of underwritten rent). Burlington, headquartered in New Jersey, is a national retailer and Fortune 500 company. The company’s stores offer an extensive selection of in season, fashion-focused merchandise at up to 60% off other retailers’ prices, including women’s ready-to-wear apparel, menswear, youth apparel, baby, beauty, footwear, accessories, home, toys and coats. Burlington has been a tenant at The Landing at Woodyard Property since 2019, has a lease expiration of February 28, 2030 and has four, five-year renewal options remaining.
Aldi (22,148 SF, 10.6% of NRA, 5.5% of underwritten rent). Aldi is a discount grocery store headquartered in Batavia, Illinois. Aldi now has more than 2,000 stores across 36 states, employs over 25,000 people and has been steadily growing since opening its first US store in Iowa in 1976. Aldi has been a tenant at The Landing at Woodyard Property since 2019, has a lease expiration of May 31, 2029 and has five, five-year renewal options remaining.
Ross (22,000 SF, 10.5% of NRA, 6.0% of underwritten rent). Ross is a chain of off-price department stores that offers a selection of women’s and men’s apparel, accessories, footwear and furniture. Ross has more than 88,000 employees and 1,550 stores in 38 states. Ross has been a tenant at The Landing at Woodyard Property since 2019, has a lease expiration of July 31, 2029 and has four, five-year renewal options remaining.
Marshalls (21,589 SF, 10.3% of NRA, 6.2% of underwritten rent). Marshalls is an off-price apparel and home fashions retailer with stores located in the United States and worldwide. As of January 30, 2021, there are 1,131 Marshalls locations across the United States occupying 32.4 million SF of retail space. Marshalls has been a tenant at The Landing at Woodyard Property since 2020, has a lease expiration of July 31, 2030 and no renewal options remaining.
The following table presents a summary regarding the major tenants at The Landing at Woodyard Property:
| Tenant Summary(1) | ||||||||||||
| Tenant Name | Credit Rating (Fitch/Moody’s/ S&P)(2) | Tenant SF | Approx. % of SF | Annual UW Rent | Annual UW Rent PSF | App. % of Total Annual UW Rent | Most Recent Sales | |||||
| $ | PSF | Occ. Cost % | Term. Option | Renewal Options | Lease Expiration | |||||||
| Burlington | NR/NR/BB | 43,481 | 20.8% | $521,772 | $12.00 | 12.9% | NAV | NAV | NAV | N | 4 x 5 year | 2/28/2030 |
| Aldi | NR/NR/NR | 22,148 | 10.6% | $221,480 | $10.00 | 5.5% | NAV | NAV | NAV | N | 5 x 5 year | 5/31/2029 |
| Ross | NR/A2/BBB+ | 22,000 | 10.5% | $242,000 | $11.00 | 6.0% | $1,426,154 | $64.83 | 17.0% | N | 4 x 5 year | 7/31/2029 |
| Marshalls | NR/A2/A | 21,589 | 10.3% | $248,489 | $11.51 | 6.2% | NAV | NAV | NAV | N | None | 7/31/2030 |
| 5 Star Beauty | NR/NR/NR | 14,020 | 6.7% | $252,360 | $18.00 | 6.3% | NAV | NAV | NAV | N | 2 x 5 year | 5/31/2030 |
| Subtotal/Wtd. Avg. | 123,238 | 58.8% | $1,486,101 | $12.06 | 36.9% | |||||||
| Other Tenants | 78,029 | 37.2% | $2,543,320 | $32.59 | 63.1% | |||||||
| Vacant Space | 8,238 | 3.9% | $0 | $0.00 | 0.0% | |||||||
| Total/Wtd. Avg.(3) | 209,505 | 100.0% | $4,029,422 | $20.02 | 100.0% | |||||||
| (1) | Information is based on the underwritten rent roll as of April 1, 2021. |
| (2) | Certain ratings are those of the parent company whether or not the parent company guarantees the lease. |
| (3) | Total Wtd. Avg. Annual UW Rent PSF excludes vacant space. |
| This is not a research report and was not prepared by any Underwriter’s research department. Please see additional important information and qualifications at the end of this Term Sheet. |
112
| Retail – Anchored | Loan #9 | Cut-off Date Balance: | $44,500,000 | |
| 8801-8823, 8827-8831, 8843, 8847, 8853, | The Landing at Woodyard | Cut-off Date LTV: | 65.5% | |
| 8871, 8875, 8879, 8883, 8887, 8893-8897 | UW NCF DSCR: | 2.21x | ||
| Woodyard Road Clinton, MD 20735 | UW NOI Debt Yield: | 8.8% |
The following table presents certain information relating to the lease rollover at The Landing at Woodyard Property:
| Lease Rollover Schedule(1)(2) | ||||||||
| Year | # of Leases Rolling | SF Rolling | Annual UW Rent PSF Rolling | Approx. % of Total SF Rolling | Approx. Cumulative % of SF Rolling | Total UW Rent Rolling | Approx. % of Total Rent Rolling | Approx. Cumulative % of Total Rent Rolling |
| 2021 | 0 | 0 | $0.00 | 0.0% | 0.0% | $0 | 0.0% | 0.0% |
| 2022 | 0 | 0 | $0.00 | 0.0% | 0.0% | $0 | 0.0% | 0.0% |
| 2023 | 0 | 0 | $0.00 | 0.0% | 0.0% | $0 | 0.0% | 0.0% |
| 2024 | 2 | 7,910 | $21.17 | 3.8% | 3.8% | $167,435 | 4.2% | 4.2% |
| 2025 | 1 | 1,311 | $42.44 | 0.6% | 4.4% | $55,639 | 1.4% | 5.5% |
| 2026 | 2 | 7,000 | $26.79 | 3.3% | 7.7% | $187,500 | 4.7% | 10.2% |
| 2027 | 0 | 0 | $0.00 | 0.0% | 7.7% | $0 | 0.0% | 10.2% |
| 2028 | 3 | 4,939 | $41.05 | 2.4% | 10.1% | $202,769 | 5.0% | 15.2% |
| 2029 | 5 | 48,976 | $13.24 | 23.4% | 33.5% | $648,490 | 16.1% | 31.3% |
| 2030 | 7 | 93,861 | $16.38 | 44.8% | 78.3% | $1,537,805 | 38.2% | 69.5% |
| 2031 | 5 | 22,400 | $30.62 | 10.7% | 89.0% | $685,844 | 17.0% | 86.5% |
| 2032 & Beyond | 4 | 14,870 | $36.58 | 7.1% | 96.1% | $543,940 | 13.5% | 100.0% |
| Vacant | 0 | 8,238 | $0.00 | 3.9% | 100.0% | $0 | 0.0% | 100.0% |
| Total/Wtd. Avg. (3) | 29 | 209,505 | $20.02 | 100.0% | $4,029,422 | 100.0% | ||
| (1) | Information is based on the underwritten rent roll as of April 1, 2021. |
| (2) | Certain tenants may have lease termination options that are exercisable prior to the stated expiration date of the subject lease or leases which are not considered in the lease rollover schedule. |
| (3) | Total Wtd. Avg. Annual UW Rent PSF Rolling excludes vacant space. |
COVID-19 Update. The Landing at Woodyard Mortgage Loan was originated on June 3, 2021 and as of such date is not subject to any forbearance, modification or debt service relief request. The Landing at Woodyard Mortgage Loan has its first debt service payment date in August 2021. As of July 9, 2021, the borrower has reported that The Landing at Woodyard Property is open and operating, with 98.6% of tenants by occupied NRA and 96.8% of tenants by underwritten base rent having paid their full June 2021 rent payments. Six tenants (25.8% of NRA and 21.4% of underwritten rent) received rent relief or deferred rent in 2020. All tenants who received rent relief have resumed paying full rent and those tenants which elected to defer rent have been repaying the deferred rent as agreed, with the exception of Clinton Park Cleaners and Allure Nail Salon (1.2% of NRA and 2.7% of underwritten rent) which continue to pay reduced rent.
The Market. The Landing at Woodyard Property is located in Clinton, Maryland, in southern Prince George’s County within the Branch Avenue Corridor submarket in the Washington-Arlington-Alexandria metropolitan statistical area (“MSA”). This area is primarily influenced by its close proximity to Andrews Air Force Base. According to the appraisal, as of the first quarter of 2021, the Branch Avenue Corridor submarket had approximately 5.5 million SF of retail space inventory, overall vacancy in the market was approximately 4.7% and asking rent was $26.97 PSF. According to the appraisal, as of the first quarter of 2021, the Washington, DC MSA had approximately 264.8 million SF of retail space inventory, overall vacancy in the MSA was approximately 5.2% and asking rent was $26.99 PSF. Primary access to The Landing at Woodyard Property is provided by I-95/495, a major arterial that encircles Washington, DC through the Maryland and Northern Virginia suburbs. Neighborhood public transportation is provided by MetroBus, which travels along the neighborhood’s primary roads. The nearest stop is at the Clinton Park & Ride at the corner of Woody Terrace and Woodyard Road, located southwest of The Landing at Woodyard Property. The nearest metro station, provided by the Washington Metropolitan Area Transit Authority, is the Branch Avenue Metrorail, located 4 miles northwest of The Landing at Woodyard Property. Branch Avenue is on the Green Line, which travels through the Washington, DC central business district and terminates in Greenbelt, Maryland. According to the appraisal, the 2020 estimated population within a one-, three- and five-mile radius of The Landing at Woodyard Property is 8,531, 45,793 and 112,827, respectively. The 2020 estimated average household income within a one-, three- and five-mile radius of The Landing at Woodyard Property is $134,662, $129,624 and $123,535, respectively.
| This is not a research report and was not prepared by any Underwriter’s research department. Please see additional important information and qualifications at the end of this Term Sheet. |
113
| Retail – Anchored | Loan #9 | Cut-off Date Balance: | $44,500,000 | |
| 8801-8823, 8827-8831, 8843, 8847, 8853, | The Landing at Woodyard | Cut-off Date LTV: | 65.5% | |
| 8871, 8875, 8879, 8883, 8887, 8893-8897 | UW NCF DSCR: | 2.21x | ||
| Woodyard Road Clinton, MD 20735 | UW NOI Debt Yield: | 8.8% |
The following table presents recent leasing data for anchor tenants at comparable retail properties with respect to The Landing at Woodyard Property:
| Comparable Anchor Retail Lease Summary | |||||||
| Property/Location | Year Built | SF | Tenant Name | Size (SF) | Lease Date | Rent PSF | Lease Type |
The Landing at Woodyard (subject)(1) Clinton, MD | 1980 | 209,505 | Burlington Aldi Ross | 43,481 22,148 22,000 | April 2019 May 2019 July 2019 | $12.00 $10.00 $11.00 | NNN NNN NNN |
Olney Village Center Olney, MD | 1979 | 198,890 | Giant | 54,213 | July 2018 | $12.29 | NNN |
Largo Town Centre Largo, MD | 1991 | 277,348 | Burlington Coat Factory | 35,491 | June 2020 | $12.50 | NNN |
Pointer Ridge Plaza Bowie, MD | 1966 | 69,214 | SkyZone | 25,000 | April 2018 | $10.00 | NNN |
Rivertowne Commons Oxon Hill, MD | 1985 | 384,343 | Target | 84,640 | Oct. 2019 | $9.00 | NNN |
Safeway - Silver Spring Silver Spring, MD | 2000 | 44,600 | Safeway | 44,600 | April 2018 | $12.74 | Absolute Net |
Source: Appraisal, unless otherwise noted.
| (1) | Information is based on the underwritten rent roll as of April 1, 2021. |
The following table presents recent leasing data for large in-line tenants at comparable retail properties with respect to The Landing at Woodyard Property:
| Comparable Large In-line Retail Lease Summary | |||||||
| Property/Location | Year Built | SF | Tenant Name | Size (SF) | Lease Date | Rent PSF | Lease Type |
The Landing at Woodyard (subject)(1) Clinton, MD | 1980 | 209,505 | 5 Star Beauty DTLR | 14,020 8,000 | May 2020 Feb. 2021 | $18.00 $22.00 | NNN NNN |
Olney Village Center Olney, MD | 1979 | 198,890 | TJ Maxx | 26,539 | April 2018 | $19.00 | NNN |
Free State Shopping Center Bowie, MD | 1970 | 264,152 | Children of America | 12,500 | March 2017 | $25.84 | NNN |
Largo Town Centre Largo, MD | 1991 | 277,348 | Salon Plaza | 10,008 | July 2016 | $20.50 | NNN |
Manokeek Village Center Accokeek, MD | 2003 | 74,470 | Manokeek Wine & Spirits | 4,467 | May 2019 | $20.82 | NNN |
La Plata Plaza La Plata, MD | 2003 | 119,360 | PetCo | 15,000 | Feb. 2018 | $22.99 | NNN |
Source: Appraisal, unless otherwise noted.
| (1) | Information is based on the underwritten rent roll as of April 1, 2021. |
The following table presents recent leasing data for small in-line tenants at comparable retail properties with respect to The Landing at Woodyard Property:
| Comparable Small In-line Retail Lease Summary | |||||||
| Property/Location | Year Built | SF | Tenant Name | Size (SF) | Lease Date | Rent PSF | Lease Type |
The Landing at Woodyard (subject)(1) Clinton, MD | 1980 | 209,505 | Tropical Smoothie Marco’s Pizza | 1,618 1,610 | March 2019 March 2019 | $35.00 $38.00 | NNN NNN |
Takoma Langley Crossroads Takoma Park, MD | 1949 | 125,245 | African Bridal | 1,200 | Aug. 2021 | $40.00 | NNN |
Woodmore Towne Centre Landover, MD | 2010 | 681,245 | Milk & Honey | 1,564 | Nov. 2019 | $40.00 | NNN |
Olney Village Center Olney, MD | 1979 | 198,890 | Carpet & Vacuum | 1,500 | June 2020 | $45.00 | NNN |
Free State Shopping Center Bowie, MD | 1970 | 264,152 | Zips Dry Cleaners of Bowie | 4,019 | March 2018 | $30.00 | NNN |
Largo Town Centre Largo, MD | 1991 | 277,348 | Wigs & Bundles | 1,695 | Jan. 2019 | $33.50 | NNN |
Source: Appraisal, unless otherwise noted.
| (1) | Information is based on the underwritten rent roll as of April 1, 2021. |
| This is not a research report and was not prepared by any Underwriter’s research department. Please see additional important information and qualifications at the end of this Term Sheet. |
114
| Retail – Anchored | Loan #9 | Cut-off Date Balance: | $44,500,000 | |
| 8801-8823, 8827-8831, 8843, 8847, 8853, | The Landing at Woodyard | Cut-off Date LTV: | 65.5% | |
| 8871, 8875, 8879, 8883, 8887, 8893-8897 | UW NCF DSCR: | 2.21x | ||
| Woodyard Road Clinton, MD 20735 | UW NOI Debt Yield: | 8.8% |
The following table presents certain information relating to the appraisal’s market rent conclusion for The Landing at Woodyard Property:
| Market Rent Summary | ||||
| Market Rent PSF | Lease Term (Months) | Rent Increase Projection | Lease Type | |
| Small In-Line Space: | $40.00 | 10 | 3.0% per annum | NNN |
| Large In-Line Space: | $24.00 | 10 | 3.0% per annum | NNN |
| Anchor Space: | $12.00 | 15 | 10.0% every 5 years | NNN |
| Popeye’s Pad Site Space: | $61.67 | 15 | 10.0% every 5 years | NNN |
| Chick-Fil-A/Panera/Navy Fed Pads | $33.00 | 15 | 10.0% every 5 years | NNN |
| Checkers Pad Site Space: | $21.67 | 15 | 10.0% every 5 years | NNN |
| Medium In-Line Space: | $35.00 | 10 | 3.0% per annum | NNN |
Source: Appraisal.
Operating History and Underwritten Net Cash Flow. The following table presents certain information relating to the historical operating performance and the Underwritten Net Cash Flow at The Landing at Woodyard Property:
| Cash Flow Analysis(1) | |||||||
| 2017 | 2018 | 2019 | 2020 | 3/31/2021 TTM | UW | UW PSF | |
| Gross Potential Rent(2) | $1,393,439 | $827,087 | $1,644,263 | $2,560,410 | $2,778,260 | $4,335,060 | $20.69 |
| Total Recoveries | $321,880 | $109,582 | $298,150 | $724,950 | $868,990 | $1,126,457 | $5.38 |
| Other Income(3) | $55,093 | $41,218 | $38,587 | $46,352 | $46,336 | $5,400 | $0.03 |
| Discounts and Concessions | $0 | $0 | ($18,747) | ($35,066) | ($30,669) | $0 | $0.00 |
| Less Vacancy & Credit Loss | $0 | $0 | $0 | $0 | $0 | ($352,103) | ($1.68) |
| Effective Gross Income | $1,770,412 | $977,886 | $1,962,252 | $3,296,647 | $3,662,918 | $5,114,814 | $24.41 |
| Real Estate Taxes | $305,874 | $317,222 | $340,993 | $362,031 | $360,031 | $387,604 | $1.85 |
| Insurance | $39,280 | $43,559 | $98,259 | $110,807 | $111,761 | $119,331 | $0.57 |
| Other Expenses | $319,960 | $354,560 | $609,630 | $604,199 | $692,803 | $702,185 | $3.35 |
| Total Expenses | $665,115 | $715,341 | $1,048,882 | $1,077,037 | $1,164,595 | $1,209,120 | $5.77 |
| Net Operating Income(4)(5) | $1,105,297 | $262,545 | $913,370 | $2,219,610 | $2,498,323 | $3,905,694 | $18.64 |
| Capital Expenditures | $0 | $0 | $0 | $0 | $0 | $31,426 | $0.15 |
| TI/LC | $0 | $0 | $0 | $0 | $0 | $152,939 | $0.73 |
| Net Cash Flow | $1,105,297 | $262,545 | $913,370 | $2,219,610 | $2,498,323 | $3,721,329 | $17.76 |
| Occupancy %(2) | 20.4% | 20.1% | 69.1% | 81.8% | 96.1% | 92.9% | |
| NOI DSCR | 0.66x | 0.16x | 0.54x | 1.32x | 1.48x | 2.31x | |
| NCF DSCR | 0.66x | 0.16x | 0.54x | 1.32x | 1.48x | 2.21x | |
| NOI Debt Yield | 2.5% | 0.6% | 2.1% | 5.0% | 5.6% | 8.8% | |
| NCF Debt Yield | 2.5% | 0.6% | 2.1% | 5.0% | 5.6% | 8.4% | |
| (1) | For the avoidance of doubt, no COVID-19 specific adjustments have been made to the lender underwriting. |
| (2) | UW Gross Potential Rent and 3/31/2021 TTM Occupancy % are based on the underwritten rent roll dated April 1, 2021. UW Gross Potential Rent includes rent steps through May 2022 totaling $27,414. |
| (3) | Other Income includes pylon signage income and has been underwritten based on the borrower’s budget. Historically, Other Income has also included percentage rent paid by Popeye’s. This percentage rent is not projected to continue going forward as Popeye’s is no longer obligated to pay percentage rent. |
| (4) | Net Operating Income declined significantly in 2018 after Kmart vacated its 106,228 SF unit in 2017. Kmart had been a tenant at The Landing at Woodyard Property since 1980 and during the final year of its lease was paying base rent of $621,423 per annum. After Kmart vacated, The Landing at Woodyard Property was redeveloped/rebranded by the borrower between 2017 and 2020. |
| (5) | The Net Operating Income increase between 3/31/2021 TTM and UW is due to nine new leases commencing between 2021 and 2022. Underwritten NOI includes rent from five of such tenants, as to which the related lease has not yet commenced, including Crafty Crab, Mezeh Grille, Supreme BBQ, Milk & Honey and Patriot Urgent Care, representing 7.5% of NRA and 14.3% of underwritten base rent. At origination gap rent was reserved for such tenants, and additional amounts are required to be reserved if such tenants’ premises are not delivered by a specified delivery date. See “Escrows and Reserves” below. With respect to Crafty Crab, if the tenant does not obtain permits by June 1, 2021, the landlord has the right but not the obligation to attempt to obtain permits on behalf of the tenant. If the landlord does not obtain permits within 120 days after commencing such efforts, then both parties have the right to terminate the lease. The tenant did not receive its permits by June 1, 2021, and according to the borrower, the borrower is now seeking to obtain the permits. With respect to Patriot Urgent Care, if the landlord is unable to cause the delivery date to occur on or before the 10th month after May 24, 2021, the tenant has the right to terminate the lease upon written notice to the landlord. |
| This is not a research report and was not prepared by any Underwriter’s research department. Please see additional important information and qualifications at the end of this Term Sheet. |
115
| Retail – Anchored | Loan #9 | Cut-off Date Balance: | $44,500,000 | |
| 8801-8823, 8827-8831, 8843, 8847, 8853, | The Landing at Woodyard | Cut-off Date LTV: | 65.5% | |
| 8871, 8875, 8879, 8883, 8887, 8893-8897 | UW NCF DSCR: | 2.21x | ||
| Woodyard Road Clinton, MD 20735 | UW NOI Debt Yield: | 8.8% |
Escrows and Reserves.
Existing TI/LC Reserve – The Landing at Woodyard Mortgage Loan documents provide for an upfront deposit of approximately $937,599 for existing tenant improvement and leasing commission expenses for seven tenants or prospective tenants.
Real Estate Taxes – The Landing at Woodyard Mortgage Loan documents provide for an upfront deposit of $326,860 for real estate taxes, and for ongoing monthly deposits into a reserve for real estate taxes in an amount equal to 1/12 of the real estate taxes that the lender estimates will be payable during the next twelve months for The Landing at Woodyard Property.
Insurance – The Landing at Woodyard Mortgage Loan documents provide for an upfront deposit of $102,430 for insurance premiums, and for ongoing monthly deposits into a reserve for insurance premiums in an amount equal to 1/12 of the insurance premiums that the lender estimates will be payable for the renewal of coverage upon the expiration of the insurance policies; provided that such monthly deposits are not required so long as (i) no event of default is continuing, (ii) the liability and casualty insurance coverage for The Landing at Woodyard Property is included in a blanket or umbrella policy approved by the lender in its reasonable discretion, and (iii) the borrower provides the lender with paid receipts for payment of the insurance premiums and provides evidence of renewals of the insurance policies, no later than ten days prior to the expiration of the current policy.
Capital Expenditures – The Landing at Woodyard Mortgage Loan documents provide for ongoing monthly deposits of approximately $2,619 into a reserve for capital expenditures.
Rollover – Commencing on the monthly payment date in July 2022, the Landing at Woodyard Mortgage Loan documents provide for ongoing monthly deposits of approximately $8,729 into a reserve for future tenant improvement and leasing commission expenses; provided that the borrower is not required to deposit any portion of such monthly deposit which would cause the amount then on deposit in such reserve to exceed approximately $524,553.
Major Tenant Floor Repair Reserve - The Landing at Woodyard Mortgage Loan documents provide for an upfront deposit of $100,000 for any required repairs to the flooring identified in the estoppel delivered at origination by Burlington Coat Factory Warehouse Corporation that the borrower is required to complete pursuant to such tenant’s lease.
Ross Reserve – The borrower is required to deposit an amount equal to all rent and reimbursements payable under the lease with Ross Dress For Less, Inc. for a period of six months if the rent payable under such lease is abated in connection with a “Health Emergency Closure” as defined in such lease (generally, tenant’s closure as a result of a declared health emergency or order, directive or guidance issued by applicable government or the World Health Organization, or epidemic or pandemic).
Upfront Capital Expenditures – The Landing at Woodyard Mortgage Loan documents provide for an upfront reserve of approximately $1,188,808 for capital expenditures for work to be performed by the borrower for various tenants or prospective tenants, as well as general work to various buildings, as specified in the loan documents.
Gap Rent Reserve – The Landing at Woodyard Mortgage Loan documents provide for an upfront deposit of $386,540 for the gap period in the commencement of rent applicable to Crafty Crab, Mezeh, Supreme BBQ, Milk & Honey and Patriot Urgent Care (each a “New Tenant”).
New Tenant Delivery Date Reserve – With respect to each New Tenant, if (i) the borrower fails to deliver to the lender on or before the applicable “Delivery Date” set forth in the table below, a New Tenant Acceptable Tenant Estoppel (as defined below) confirming, among other things, that the borrower has delivered to the applicable New Tenant possession of the demised premises on or prior to such Delivery Date and otherwise in accordance with such New Tenant’s lease and (ii) the borrower fails to deliver to the lender a New Tenant Acceptable Tenant Estoppel from the applicable New Tenant on or prior to the applicable “Reserve Deposit Date” set forth in the table below, the borrower is required to deposit or cause to be deposited cash or a letter of credit in an amount equal to the applicable Monthly Deposit Amount set forth in the table below for such New Tenant on the applicable Reserve Deposit Date and each subsequent monthly payment date, until the borrower has delivered to the lender evidence that a New Tenant Cure (as defined below) has occurred with respect to the applicable New Tenant. A failure to make any such deposit will not constitute a default, but will give rise to a New Tenant Deposit Failure (as defined below). With respect to the Crafty Crab and Mezeh New Tenants, The Landing at Woodyard Mortgage Loan documents acknowledge that possession of the applicable New Tenant premises was delivered by the Delivery Date set forth below. Following August 1, 2021, or such earlier date as elected by the lender, if a New Tenant Cure occurs with respect to any applicable New Tenant, so long as no event of default is continuing, cash amounts deposited in the New Tenant Delivery Date Reserve are required to be (i) if a Cash Sweep Event Period (as defined below) is continuing, deposited into the cash management account and applied in the same manner as rents and (ii) otherwise, returned to the borrower, and any letter of credit provided for such reserve is required to be returned to the borrower.
| New Tenant Lease | Delivery Date | Reserve Deposit Date | Monthly Deposit Amount |
| Crafty Crab Lease | 6/3/2021 | 7/1/2021 | $19,462.00 |
| Mezeh Lease | 6/3/2021 | 7/1/2021 | $9,529.00 |
| Supreme BBQ Lease | 9/1/2021 | 10/1/2021 | $7,434.00 |
| Milk & Honey Lease | 7/15/2021 | 8/15/2021 | $6,255.00 |
| Patriot Lease | 9/21/2021 | 10/21/2021 | $12,853.00 |
“New Tenant Acceptable Tenant Estoppel” means (a) a fully-executed estoppel certificate from the applicable New Tenant that, in each case, affirms the applicable New Tenant lease as being in full force and effect and provides, among other things (i) that such New Tenant has accepted its space, (ii) that any improvements described in such lease that are required to be completed by the borrower as landlord have been completed and have been accepted by such New Tenant, (iii) that such New Tenant has no termination options under its lease (other than in connection with a casualty or condemnation or as a result of a default by the borrower, as landlord, under such lease), (iv) confirming the applicable rent commencement dates and lease termination dates, and (v) that there are no defaults by the borrower or such New Tenant under such New Tenant lease (other than any defaults by an applicable tenant arising solely in connection with a New Tenant Trigger Event (as defined below)), and is otherwise in form and substance reasonably satisfactory
| This is not a research report and was not prepared by any Underwriter’s research department. Please see additional important information and qualifications at the end of this Term Sheet. |
116
| Retail – Anchored | Loan #9 | Cut-off Date Balance: | $44,500,000 | |
| 8801-8823, 8827-8831, 8843, 8847, 8853, | The Landing at Woodyard | Cut-off Date LTV: | 65.5% | |
| 8871, 8875, 8879, 8883, 8887, 8893-8897 | UW NCF DSCR: | 2.21x | ||
| Woodyard Road Clinton, MD 20735 | UW NOI Debt Yield: | 8.8% |
to the lender, or (b) such other written evidence from the applicable tenant as may be acceptable to the lender that the borrower has delivered the applicable demised premises to such New Tenant pursuant to its lease.
“New Tenant Trigger Event” means each occurrence of (a) Crafty Crab exercising its lease termination option, (b) Patriot Urgent Care exercising its lease termination option, and/or (c) the date that is 30 days after the occurrence of any failure of the borrower to deliver a New Tenant’s premises to it by the Delivery Date set forth in the table above, provided that, with respect to a failure to deliver the Crafty Crab premises by the applicable Delivery Date, a New Tenant Acceptable Tenant Estoppel will not be required to confirm that Crafty Crab has no termination options.
“New Tenant Cure” means either:
| (a) | delivery by the borrower of (x) evidence reasonably acceptable to the lender that the borrower has entered into a lease with either or both of America’s Best Contacts and Eyeglasses and/or Fenton Dental (each, a “New Tenant Prospect”) on terms and conditions approved by the lender, (y) a New Tenant Acceptable Tenant Estoppel from the applicable New Tenant Prospect(s) and (z) evidence reasonably acceptable to the lender that the aggregate base rent and monthly reimbursements payable pursuant to one or both of the leases with the applicable New Tenant Prospect(s) exceed(s) the base rent and monthly reimbursements amounts under the applicable New Tenant lease giving rise to any New Tenant Trigger Event (provided each lease with a New Tenant Prospect may be used only one time in effecting such a cure); or |
| (b) | either (x) (i) with respect to Crafty Crab or Patriot Urgent Care exercising its lease termination option, the applicable New Tenant is in occupancy of the entirety of its leased space, and (ii) with respect to a failure to deliver a New Tenant’s space to it by the applicable Delivery Date, the applicable New Tenant has accepted delivery of possession of its space pursuant to its lease, and the case of either (i) or (ii), delivery by the borrower to the lender of a New Tenant Acceptable Tenant Estoppel with respect to the applicable New Tenant lease, or (y) the borrower enters into a replacement lease or leases for substantially all of the space demised pursuant to the applicable New Tenant lease and having an aggregate rent no less than that due under the applicable New Tenant lease and in form and substance acceptable to the lender and delivers an estoppel certificate from the applicable replacement tenant or tenants affirming that the applicable replacement lease is in full force and effect, its term has commenced, the replacement tenant has accepted and is occupying all the space demised under such replacement lease, any improvements required to be completed by the borrower as landlord have been completed and have been accepted by such replacement tenant, such replacement tenant has no termination options under such lease (other than in connection with a casualty or condemnation or as a result of a default by the borrower, as landlord, under such lease), the replacement tenant is not then entitled to any concession or rebate of rent or other charges, and there are no defaults by the borrower or tenant under such lease (other than any defaults by a tenant arising solely in connection with a New Tenant Trigger Event). |
Crafty Crab Lease Termination Reserve – The borrower is required to deposit or cause to be deposited within two business days after the occurrence of Crafty Crab exercising its lease termination option, cash or a letter of credit in an amount equal to $116,772. Following August 1, 2021, or such earlier date as elected by the lender, so long as no event of default is continuing, if a New Tenant Cure occurs with respect to Crafty Crab, cash amounts deposited in the Crafty Crab lease termination reserve are required to be (i) if a Cash Sweep Event Period is continuing, deposited into the cash management account and applied in the same manner as rents and (ii) otherwise, returned to the borrower, and any letter of credit provided for such reserve is required to be returned to the borrower.
Patriot Urgent Care Lease Termination Reserve – The borrower is required to deposit or cause to be deposited within two business days after the occurrence of Patriot Urgent Care exercising its lease termination option, cash or a letter of credit in an amount equal to $72,118. Following August 1, 2021, or such earlier date as elected by the lender, so long as no event of default is continuing, if a New Tenant Cure occurs with respect to Patriot Urgent Care, cash amounts deposited in the Patriot Urgent Care lease termination reserve are required to be (i) if a Cash Sweep Event Period is continuing, deposited into the cash management account and applied in the same manner as rents and (ii) otherwise, returned to the borrower, and any letter of credit provided for such reserve is required to be returned to the borrower.
Lockbox and Cash Management. The Landing at Woodyard Mortgage Loan is structured with a hard lockbox and springing cash management. The borrower is required to establish and maintain a lockbox account for the benefit of the lender, and to direct all tenants to deposit rents directly into such lockbox account, and the borrower and property manager are required to deposit any rents received by them, notwithstanding such direction, directly into the lockbox account within three business day of receipt. Upon the first occurrence of a Cash Sweep Event Period, the lender is required to establish, and the borrower is required to cooperate with the cash management bank to establish, a lender-controlled cash management account, into which all funds in the lockbox account will be required to be deposited, so long as the Cash Sweep Event Period is continuing. During the continuance of a Cash Sweep Event Period, provided no event of default is continuing, all funds in the cash management account are required to be applied on each monthly payment date: (i) to make the monthly deposits into the real estate tax and insurance reserves as described above under “Escrows and Reserves,” (ii) to pay debt service on The Landing at Woodyard Mortgage Loan, (iii) to make the monthly deposit into the capital expenditures reserve and the rollover reserve as described above under “Escrows and Reserves,” (iv) if a Cash Sweep Event Period is continuing, to pay operating expenses set forth in the annual budget (which is required to be approved by the lender) and extraordinary expenses approved by the lender, (v) to make the monthly deposits into the new tenant delivery date reserve as described above under “Escrows and Reserves,” (vi) to make the deposits into the Crafty Crab lease termination reserve and Patriot Urgent Care lease termination reserve as described above under “Escrows and Reserves,” and (vii) to apply any remainder (A) if the Cash Sweep Event Period has arisen solely as a result of a New Tenant Deposit Failure, to be disbursed to the borrower or (B) if the Cash Sweep Event Period has arisen solely as a result of any other event, to be deposited into an excess cash flow reserve to be held as additional security for The Landing at Woodyard Mortgage Loan during the continuance of such Cash Sweep Event Period. If no Cash Sweep Event Period is continuing, all funds in the excess cash flow subaccount are required to be disbursed to the borrower.
“Cash Sweep Event Period” means a period:
| (i) | commencing upon an event of default under The Landing at Woodyard Mortgage Loan documents and ending upon the acceptance by the lender of a cure of such event of default; or |
| (ii) | commencing upon the date the debt service coverage ratio of The Landing at Woodyard Mortgage Loan (assuming a 30 year amortization schedule and based upon the trailing twelve months operating statements and current in place rent roll) has fallen below 1.20x for the immediately preceding two consecutive calendar quarters, and ending on the date that the borrower provides evidence satisfactory to the lender that the debt service coverage ratio (assuming a 30 year amortization schedule) has been at least 1.25x for the immediately preceding two consecutive calendar quarters; or |
| This is not a research report and was not prepared by any Underwriter’s research department. Please see additional important information and qualifications at the end of this Term Sheet. |
117
| Retail – Anchored | Loan #9 | Cut-off Date Balance: | $44,500,000 | |
| 8801-8823, 8827-8831, 8843, 8847, 8853, | The Landing at Woodyard | Cut-off Date LTV: | 65.5% | |
| 8871, 8875, 8879, 8883, 8887, 8893-8897 | UW NCF DSCR: | 2.21x | ||
| Woodyard Road Clinton, MD 20735 | UW NOI Debt Yield: | 8.8% |
| (iii) | commencing upon a Major Tenant Lease Expiration Event (as defined below) and ending upon a Major Tenant Lease Expiration Cure (as defined below) with respect to such event; or |
| (iv) | commencing upon a Major Tenant Credit Event (as defined below) and ending upon a Major Tenant Credit Event Cure (as defined below) with respect to such event; or |
| (v) | commencing upon a New Tenant Deposit Failure (as defined below) and ending upon a New Tenant Deposit Failure Cure (as defined below) with respect to such event. |
“Major Tenant Lease Expiration Event” means the earlier of (i) Burlington or any replacement tenant that leases all or a portion of such tenant’s space (“Major Tenant”) not renewing or extending such Major Tenant’s lease by the earlier of the date (A) such Major Tenant is obligated under its lease to deliver a notice of renewal or term extension or (B) that is six months prior to the expiration of such Major Tenant’s lease, (ii) any Major Tenant giving written notice to vacate or exercising any termination option under such Major Tenant’s lease, or (iii) any Major Tenant canceling or terminating such Major Tenant’s lease.
“Major Tenant Lease Expiration Cure” means either (1) Major Tenant renews or extends such Major Tenant’s lease on terms and conditions acceptable to the lender, and the borrower delivers to the lender a tenant estoppel certificate from such Major Tenant in form and substance reasonably acceptable to the lender stating that such Major Tenant is in occupancy of the entirety of such Major Tenant’s space, open for business and paying full contractual rent, or (2) Major Tenant’s space has been re-let to one or more replacement tenant(s) pursuant to a replacement lease(s), which replacement tenant(s) and lease(s) are acceptable to the lender, and which replacement lease(s) have an aggregate rental of no less than the rent due under such Major Tenant’s lease, including, without limitation, any rent increases under such Major Tenant’s lease, and the borrower delivers to the lender a tenant estoppel certificate(s) from each such replacement tenant(s) in form and substance reasonably acceptable to the lender stating that such replacement tenant(s) is/are in occupancy of such Major Tenant’s space, open for business and paying full contractual rent (a “Major Tenant Replacement Cure”).
“Major Tenant Credit Event” means the earlier to occur of (i) Major Tenant has, for all or substantially all of such Major Tenant space, “gone dark”, vacated its space, not opened for business or terminated its lease (or given written notice of its intention to do so), excluding temporary closures in connection with (A) with casualty, condemnation or remodeling not exceeding thirty days, or (B) any closures mandated by government order not exceeding ninety days, provided that in the case of each of (A) and (B), (1) the applicable Major Tenant continues to pay unabated rent under its lease, (2) no other tenant at The Landing at Woodyard Property has given notice of the exercise or intent to exercise any co-tenancy rights as a result (in whole or in part) of such event, and (3) the applicable Major Tenant is not otherwise in default of its lease, or (ii) such Major Tenant or any guarantor of such Major Tenant’s obligations under its lease becoming insolvent or a debtor in any material action.
“Major Tenant Credit Event Cure” means (a) with respect to clause (i) of the definition of Major Tenant Credit Event, either (1) Major Tenant is in occupancy of the entirety of such Major Tenant’s space and the borrower delivers to the lender a tenant estoppel certificate(s) from such Major Tenant in form and substance reasonably acceptable to the lender stating that such Major Tenant is in occupancy of the entirety of such Major Tenant’s space, open for business and paying full contractual rent, or (2) a Major Tenant Replacement Cure occurs, or (b) with respect to clause (ii) of the definition of Major Tenant Credit Event, either (1) Major Tenant or the applicable guarantor under such Major Tenant’s lease, as the case may be, becomes solvent to the lender’s reasonable satisfaction or is no longer a debtor in any such material action and such Major Tenant has affirmed its lease pursuant to a final non-appealable order of a court of competent jurisdiction, and the borrower delivers to the lender a tenant estoppel certificate(s) from such Major Tenant in form and substance reasonably acceptable to the lender stating that such Major Tenant is in occupancy of the entirety of such Major Tenant’s space, open for business and paying full contractual rent, or (2) a Major Tenant Replacement Cure occurs.
“New Tenant Deposit Failure” means the failure of the borrower to make or cause to be made any required deposit into the New Tenant delivery date reserve, the Crafty Crab lease termination reserve or the Patriot Urgent Care lease termination reserve.
“New Tenant Deposit Failure Cure” means the earlier to occur of (a) such time as the borrower has made from its own funds all deposits then required to be made into the New Tenant delivery date reserve, the Crafty Crab lease termination reserve or the Patriot Urgent Care lease termination reserve for a period of two consecutive calendar months and (b) all such deposits then required to be made pursuant to the terms of The Landing at Woodyard Mortgage Loan documents have been made.
Additional Secured Indebtedness (not including trade debts). None.
Mezzanine Loan and Preferred Equity. Not permitted.
Release of Property. After the expiration of the defeasance lockout period and prior to the monthly payment date occurring in January 2031, the borrower has a right to obtain a release of each of the Popeye’s parcel, Chick Fil A parcel, and Panera parcel at The Landing at Woodyard Property (as delineated in the loan documents), provided no event of default is continuing and subject to the following conditions, among others, (1) partial defeasance of The Landing at Woodyard Mortgage Loan in an amount equal to the release price for the individual release parcel being released, (2) after giving effect to the partial defeasance, the debt yield of the remaining property is at least equal to the greater of (x) the debt yield immediately prior to the release and (y) 8.05%, (3) after giving effect to the partial defeasance, the loan-to-value ratio of the remaining property is not greater than the lesser of (x) the loan-to-value ratio immediately prior to such release and (y) 65.5%, (4) certain REMIC-related conditions are satisfied, (5) delivery of title endorsements and evidence of continued compliance with zoning and other legal requirements, including requirements under leases, as the lender may require, and (6) The Landing at Woodyard Property is recognized as a separate, legal tax lot from the applicable release parcel. The release prices are as follows: Popeye’s parcel: $2,541,500; Chick-Fil A parcel: $2,635,800; Panera parcel: $2,220,650.
Letter of Credit. None, however, the borrower may provide a letter of credit to satisfy the deposit requirements of the new tenant delivery date reserve, the Crafty Crab lease termination reserve and/or the Patriot Urgent Care lease termination reserve, as described above under “Escrows and Reserves.”
Purchase Option/ Right of First Offer / Right of First Refusal. None.
| This is not a research report and was not prepared by any Underwriter’s research department. Please see additional important information and qualifications at the end of this Term Sheet. |
118
| Retail – Anchored | Loan #9 | Cut-off Date Balance: | $44,500,000 | |
| 8801-8823, 8827-8831, 8843, 8847, 8853, | The Landing at Woodyard | Cut-off Date LTV: | 65.5% | |
| 8871, 8875, 8879, 8883, 8887, 8893-8897 | UW NCF DSCR: | 2.21x | ||
| Woodyard Road Clinton, MD 20735 | UW NOI Debt Yield: | 8.8% |
Ground Lease. None.
Terrorism Insurance. The borrower is required to obtain and maintain an “all risk” or “special form” property insurance policy that covers acts of terrorism in an amount equal to the “full replacement cost” of The Landing at Woodyard Property, together with business income insurance covering not less than the 18-month period commencing at the time of loss, together with an extended period of indemnity endorsement for a period of up to 90 days. Notwithstanding the foregoing, for so long as the Terrorism Risk Insurance Act of 2002, as extended and modified by the Terrorism Risk Insurance Program Reauthorization Act of 2015 (“TRIPRA”), is in effect (including any extensions thereof or if another federal governmental program is in effect relating to “acts of terrorism” which provides substantially similar protections as TRIPRA), the lender is required to accept terrorism insurance which covers against “covered acts” as defined by TRIPRA (or such other program) but only in the event that TRIPRA (or such other program) continues to cover both domestic and foreign acts of terrorism. See “Risk Factors—Risks Relating to the Mortgage Loans—Terrorism Insurance May Not Be Available for All Mortgaged Properties” in the prospectus.
| This is not a research report and was not prepared by any Underwriter’s research department. Please see additional important information and qualifications at the end of this Term Sheet. |
119
| Multifamily – Garden | Loan #10 | Cut-off Date Balance: | $44,000,000 | |
| 12001 Old Vine Boulevard | Mi Place at Vineyard | Cut-off Date LTV: | 68.6% | |
| Lewes, DE 19958 | U/W NCF DSCR: | 1.96x | ||
| U/W NOI Debt Yield: | 8.9% |
| This is not a research report and was not prepared by any Underwriter’s research department. Please see additional important information and qualifications at the end of this Term Sheet. |
120
| Multifamily – Garden | Loan #10 | Cut-off Date Balance: | $44,000,000 | |
| 12001 Old Vine Boulevard | Mi Place at Vineyard | Cut-off Date LTV: | 68.6% | |
| Lewes, DE 19958 | U/W NCF DSCR: | 1.96x | ||
| U/W NOI Debt Yield: | 8.9% |
| This is not a research report and was not prepared by any Underwriter’s research department. Please see additional important information and qualifications at the end of this Term Sheet. |
121
| Mortgage Loan No. 10 – Mi Place at Vineyard |
| Mortgage Loan Information | Property Information | ||||||
| Mortgage Loan Seller: | MSMCH | Single Asset/Portfolio: | Single Asset | ||||
| Credit Assessment (DBRSM/Fitch/S&P): | NR/NR/NR | Location: | Lewes, DE 19958 | ||||
| Original Balance: | $44,000,000 | General Property Type: | Multifamily | ||||
| Cut-off Date Balance: | $44,000,000 | Detailed Property Type: | Garden | ||||
| % of Initial Pool Balance: | 3.2% | Title Vesting: | Leasehold | ||||
| Loan Purpose: | Refinance | Year Built/Renovated: | 2012 - 2021/NAP | ||||
| Borrower Sponsor: | Jeffrey Fernbach and Fernbach 2008 Family Dynasty Trust | Size(3): | 288 Units | ||||
| Cut-off Date Balance per Unit(3): | $152,778 | ||||||
| Guarantors: | Jeffrey Fernbach and Fernbach 2008 Family Dynasty Trust | Maturity Date Balance per Unit(3): | $152,778 | ||||
| Property Manager: | OP Management LLC | ||||||
| Mortgage Rate: | 4.3700% | (borrower-related) | |||||
| Note Date: | 7/13/2021 | ||||||
| First Payment Date: | 9/1/2021 | ||||||
| Maturity Date: | 8/1/2031 | ||||||
| Original Term to Maturity: | 120 months | Underwriting and Financial Information(4) | |||||
| Original Amortization Term: | 0 months | UW NOI: | $3,899,099 | ||||
| IO Period: | 120 months | UW NOI Debt Yield: | 8.9% | ||||
| Seasoning: | 0 months | UW NOI Debt Yield at Maturity: | 8.9% | ||||
| Prepayment Provisions: | L(24),D(92),O(4) | UW NCF DSCR: | 1.96x | ||||
| Lockbox/Cash Mgmt Status: | Hard/In Place | Most Recent NOI: | $3,101,160 (5/31/2021 TTM) | ||||
| Additional Debt Type(1): | Mezzanine | 2nd Most Recent NOI: | $2,583,073 (12/31/2020) | ||||
| Additional Debt Balance: | $5,000,000 | 3rd Most Recent NOI: | $1,737,792 (12/31/2019) | ||||
| Future Debt Permitted (Type): | No (NAP) | Most Recent Occupancy(3): | 99.3% (7/5/2021) | ||||
| Reserves(2) | 2nd Most Recent Occupancy(5): | 97.8% (12/31/2020) | |||||
| Type | Initial | Monthly | Cap | 3rd Most Recent Occupancy(5): | 90.6% (12/31/2019) | ||
| RE Taxes: | $154,518 | $11,886 | NAP | Appraised Value (as of)(6): | $64,100,000 (3/16/2021) | ||
| Insurance: | $0 | Springing | NAP | Appraised Value per Unit(6): | $222,569 | ||
| Capital Expenditures: | $0 | $6,000 | NAP | Cut-off Date LTV Ratio: | 68.6% | ||
| Deferred Maintenance: | $17,500 | $0 | NAP | Maturity Date LTV Ratio: | 68.6% | ||
| Ground Rent Fund: | $248,201 | $0 | NAP | ||||
| Sources and Uses | ||||||
| Sources | Proceeds | % of Total | Uses | Proceeds | % of Total | |
| Mortgage Loan Amount: | $44,000,000 | 89.8% | Loan Payoff: | $39,238,416 | 80.1% | |
| Mezzanine Loan: | $5,000,000 | 10.2% | Return of Equity: | $8,222,151 | 16.8% | |
| Closing Costs: | $1,119,214 | 2.3% | ||||
| Reserves: | $420,219 | 0.9% | ||||
| Total Sources: | $49,000,000 | 100.0% | Total Uses: | $49,000,000 | 100.0% | |
| (1) | See “Mezzanine Loan and Preferred Equity” below. |
| (2) | See “Escrows and Reserves” below. |
| (3) | Reflects multifamily units only. The collateral also includes 21 commercial units. |
| (4) | The novel coronavirus pandemic is an evolving situation and could impact the Mi Place at Vineyard Mortgage Loan (as defined below) more severely than assumed in the underwriting of the Mi Place at Vineyard Mortgage Loan and could adversely affect the NOI, NCF and occupancy information, as well as the appraised value and the DSCR, LTV and Debt Yield metrics presented above and herein. See “Risk Factors—Risks Related to Market Conditions and Other External Factors—The Coronavirus Pandemic Has Adversely Affected the Global Economy and Will Likely Adversely Affect the Performance of the Mortgage Loans” in the prospectus. |
| (5) | Historical occupancy is based on the number of units that were completed as of the applicable occupancy date. As of 12/31/2020, 267 units were completed. As of 12/31/2019, 203 units were completed. |
| (6) | The Appraised Value is based on the extraordinary assumption that remaining construction and leaseup costs for building 1 will be held in escrow and available to any potential purchaser. As of the origination date, construction of building 1 had been completed and all units in building 1 that are included in the Mi Place at Vineyard Property (as defined below) were leased to tenants. |
The Mortgage Loan. The tenth largest mortgage loan (the “Mi Place at Vineyard Mortgage Loan”) is evidenced by a promissory note in the original principal amount of $44,000,000. The Mi Place at Vineyard Mortgage Loan is secured by a first priority fee mortgage encumbering the borrower’s leasehold interest in a multifamily property located in Lewes, Delaware (the “Mi Place at Vineyard Property”).
The Borrower and the Borrower Sponsor. The borrower is Vineyards Properties, LLC, a single-purpose Delaware limited liability company with two independent directors. The borrower sponsor and the non-recourse carveout guarantor is Jeffrey Fernbach. The borrower is managed by Jeffrey Fernbach and is 100% owned by Vineyards Properties Mezz LLC, which is also managed by Jeffrey Fernbach. Jeffrey Fernbach is the founder of Fernmoor Homes, a real estate company founded in 2009 that develops and builds single family, townhomes, condominiums and custom estate homes in New Jersey and Delaware.
| This is not a research report and was not prepared by any Underwriter’s research department. Please see additional important information and qualifications at the end of this Term Sheet. |
122
| Multifamily – Garden | Loan #10 | Cut-off Date Balance: | $44,000,000 | |
| 12001 Old Vine Boulevard | Mi Place at Vineyard | Cut-off Date LTV: | 68.6% | |
| Lewes, DE 19958 | U/W NCF DSCR: | 1.96x | ||
| U/W NOI Debt Yield: | 8.9% |
The Property. The Mi Place at Vineyard Property is comprised of the borrower’s undivided leasehold interest pursuant to a ground lease, which ground lease covers a larger mixed-use master planned community known as the Vineyards at Nassau Valley, situated on an approximately 77.80-acre site in Lewes, Delaware (the “Vineyard Community”) and the improvements thereon, including without limitation all of those certain leasehold residential, rental residential and commercial condominium units in five separate condominium regimes. The borrower’s leasehold interests in such condominiums include (i) the borrower’s leasehold interest in all of the rental residential condominium units in a condominium known as The Vineyards Rental Leasehold Condominium, which condominium comprises eight three-story multifamily apartment buildings containing 240 rental residential condominium units, (ii) the borrower’s leasehold interest in 20 residential condominium units located in two four-story multifamily apartment buildings in a condominium known as The Vineyards Residential Leasehold Condominium, which condominium comprises a total of 72 residential units located in such two four-story multifamily apartment buildings and single family homes, (iii) the borrower’s leasehold interest in 28 residential condominium units in a condominium known as The Vineyards Contemporary Residential Condominium, which condominium comprises a total of 44 residential condominium units located in two four-story mixed use buildings (the “Mixed Use Condominium Buildings”), (iv) the borrower’s leasehold interest in all 15 commercial condominium units in a condominium known as The Vineyards Commercial Leasehold Condominium, which condominium comprises 15 commercial condominium units located on the first floor of the Mixed Use Condominium Buildings, (v) the borrower’s leasehold interest in all condominium units in a condominium known as The Vineyards Phase EE Commercial Leasehold Condominium, which condominium consists of one unit which comprises six single-story commercial buildings with a total of six commercial spaces, and (vi) the percentage interest in the common elements of each of the above five condominiums that is allocated to the borrower’s condominium units. The completion of the Mi Place at Vineyard Property improvements commenced in 2012 and has been continuing in phases through 2021. In total, the Mi Place at Vineyard Property includes 288 apartment units, totaling 268,716 SF and 21 commercial units totaling 38,322 SF. As of July 5, 2021, the Mi Place at Vineyard Property residential space is currently 99.3% leased at an average contract rent of $1,637 per unit per month. The apartment unit mix is comprised of, one-, two-, three- and four-bedroom units ranging in size from 664 – 2,634 SF with an average of 933 SF. Unit amenities include washer/dryer in unit, dishwasher, security system, fireplace, microwave, granite countertops, patio, and balconies. Building amenities include a pool, clubhouse, elevators, garage spaces, a fitness center, a dog park, and walking and biking trails. Building amenities and parking are not part of the collateral, but are located in the Vineyard Community and tenants at the Mi Place at Vineyard Property have the right to use them pursuant to a master declaration applicable to the Vineyard Community. Approximately 90.5% of the underwritten rent for the Mi Place at Vineyard Property is from residential units and approximately 9.5% is from commercial units. As of July 5, 2021, the Mi Place at Vineyard Property commercial space is currently 88.2% occupied. The largest commercial tenant by underwritten rent is the General Service Administration (13.4% of commercial NRA/18.1% of total underwritten commercial rent), the second largest commercial tenant by underwritten rent is Janney Montgomery Scott, LLC (13.0% of commercial NRA/14.2% of total underwritten commercial rent), and the third largest commercial tenant by underwritten rent is Clint Wallis - Legum & Norman, Inc. (9.4% of commercial NRA/10.5% of total underwritten commercial rent). The Mi Place at Vineyard Property also has 28 storage units available for rent. These units range from 15 SF to 150 SF and have an average asking rent of $59.64 per month.
The table below shows the residential apartment unit mix at the Mi Place at Vineyard Property:
| Apartment Unit Mix(1) | |||||||||
| Unit Mix / Type | Total Units | Leased Units | % Leased | Average SF per Unit | Monthly Average Rent per Unit | Monthly Average Rent PSF | |||
| 1 Bedroom/1 Bathroom | 128 | 128 | 100.0% | 715 | $1,455 | $2.04 | |||
| 1 Bedroom/1 Bathroom/Den | 8 | 8 | 100.0% | 827 | $1,461 | $1.77 | |||
| 1 Bedroom/1 Bathroom/Loft | 4 | 4 | 100.0% | 1,154 | $1,868 | $1.62 | |||
| 2 Bedroom/2 Bathroom | 136 | 134 | 98.5% | 1,052 | $1,765 | $1.68 | |||
| 2 Bedroom/2.5 Bathroom/Study | 4 | 4 | 100.0% | 1,564 | $2,044 | $1.31 | |||
| 3 Bedroom/3 Bathroom | 4 | 4 | 100.0% | 1,694 | $2,024 | $1.19 | |||
| 3 Bedroom/3 Bathroom/Study | 2 | 2 | 100.0% | 2,320 | $2,612 | $1.13 | |||
| Four Bedroom/3 bathroom | 2 | 2 | 100.0% | 2,634 | $2,261 | $0.86 | |||
| Total/Average(1) | 288 | 286 | 99.3% | 933 | $1,637 | $1.82 | |||
Source: Borrower rent roll dated July 5, 2021.
| (1) | As of July 5, 2021, the Mi Place at Vineyard Property residential space is 99.3% occupied. |
| This is not a research report and was not prepared by any Underwriter’s research department. Please see additional important information and qualifications at the end of this Term Sheet. |
123
| Multifamily – Garden | Loan #10 | Cut-off Date Balance: | $44,000,000 | |
| 12001 Old Vine Boulevard | Mi Place at Vineyard | Cut-off Date LTV: | 68.6% | |
| Lewes, DE 19958 | U/W NCF DSCR: | 1.96x | ||
| U/W NOI Debt Yield: | 8.9% |
The following table presents a summary regarding the commercial tenants at the Mi Place at Vineyard Property:
| Commercial Tenant Summary(1) | |||||||||
| Tenant Name | Credit Rating (Fitch/Moody’s/ S&P)(2) | Tenant SF | Approx. % of SF | Annual UW Rent | Annual UW Rent PSF | Approx. % of | Lease | Renewal Options | Term. Option |
| General Service Administration | AAA/Aaa/AA | 5,122 | 13.4% | $98,906 | $19.31 | 18.1% | 6/18/2024 | 1, 5-year | Y(3) |
| Janney Montgomery Scott, LLC | NR/NR/NR | 4,986 | 13.0% | $77,643 | $15.57 | 14.2% | 4/17/2028 | 2, 5-yr & 1, 6-mo | Y(4) |
| Clint Wallis - Legum & Norman, Inc. | NR/NR/NR | 3,590 | 9.4% | $57,440 | $16.00 | 10.5% | 7/23/2023 | 1, 3-year | N |
| Richard Tananis, LLC | NR/NR/NR | 3,514 | 9.2% | $45,682 | $13.00 | 8.3% | 7/19/2027 | 3, 5-year | N |
| Fernmoor Properties/Fernmoor Custom Homes(5) | NR/NR/NR | 3,147 | 8.2% | $51,553 | $16.38 | 9.4% | 12/31/2029 | 1, 5-year | N |
| Commercial Subtotal/Wtd. Avg. | 20,359 | 53.1% | $331,224 | $16.27 | 60.5% | ||||
| Other Tenants | 13,445 | 35.1% | $216,011 | $16.07 | 39.5% | ||||
| Vacant Space(6) | 4,518 | 11.8% | $0 | $0.00 | 0.0% | ||||
| Total Wtd. Avg(7) | 38,322 | 100.0% | $547,235 | $16.19 | 100.0% | ||||
| (1) | Information is based on the underwritten rent roll as of July 5, 2021. |
| (2) | Certain ratings are those of the parent company or related government whether or not the parent company or government guarantees the lease. |
| (3) | The General Service Administration has the right to terminate its lease at any time upon 90 days’ notice. |
| (4) | Janney Montgomery Scott, LLC has the right to terminate its lease after April 1, 2025 upon a minimum of two months prior notice. |
| (5) | Fernmoor Properties and Fernmoor Custom Homes are affiliates of the borrower. Approximately 8.2% of the commercial NRA is leased to, and 9.1% of the underwritten commercial rent is from, affiliates of the borrower. |
| (6) | The tenant Mia Development was underwritten as vacant as it is a medical marijuana dispensary. |
| (7) | Total Wtd. Avg. Annual UW Rent PSF excludes Vacant Space. |
Condominium Structure. The Mi Place at Vineyard Property comprises an undivided leasehold interest in five separate condominium regimes, The Vineyards Rental Leasehold Condominium, The Vineyards Residential Leasehold Condominium, The Vineyards Contemporary Residential Condominium, The Vineyards Commercial Leasehold Condominium, and The Vineyards Phase EE Commercial Leasehold Condominium. The Vineyards Rental Leasehold Condominium includes a total of 240 units in eight rental residential apartment buildings, in which the borrower has a leasehold interest in all 240 units. Such condominium is subject to a declarant control period, during which the borrower (because it is the owner of at least 50% of the units) has the right to elect two of the five members to the condominium board (and the declarant has agreed to obtain the written consent of the borrower and lender for the appointment of the other three board members); upon the termination of such period, which is expected to occur during the term of the Mi Place at Vineyard Mortgage Loan, the borrower will have the right to elect all five members of the condominium board. The Vineyards Residential Leasehold Condominium includes a total of 72 units in two four-story multifamily apartment condominium buildings and single family homes, of which the borrower has a leasehold interest in 20 condominium units in the two condominium apartment buildings. Since the borrower’s leasehold interest does not include a majority of the units in this condominium, the borrower has no right to elect board members for this condominium. However, the condominium board and declarant have agreed to not take any action that would cause a material adverse effect on the units in which the borrower has a leasehold interest. The Vineyards Contemporary Residential Condominium includes a total of 44 residential units in the Mixed Use Condominium Buildings, of which the borrower has a leasehold interest in 28 condominium units. The borrower has a majority of the percentage interest in this condominium, and has the right to elect all three condominium board members. The Vineyards Commercial Leasehold Condominium includes a total of 15 commercial condominium units located on the first floor of the Mixed Use Condominium Buildings, of which the borrower has a leasehold interest in all 15 units. Such condominium is subject to a declarant control period, during which the borrower has the right to elect two of the five members of the condominium board (and the declarant has agreed to obtain the written consent of the borrower and lender for the appointment of the other three board members); upon the termination of such period, which is expected to occur during the term of the Mi Place at Vineyard Mortgage Loan, the borrower will have the right to elect all 5 members of the condominium board. The Vineyards Phase EE Commercial Leasehold Condominium is comprised of six commercial buildings containing one condominium unit containing a total of six commercial spaces, and the borrower has a leasehold interest in all of the commercial units in this condominium. The borrower has the right to elect all three members of this condominium board. The declarant of the condominiums has the right (i) to expand The Vineyards Rental Leasehold Condominium by 84 units and (ii) The Vineyards Residential Leasehold Condominium by additional single family units and carriage houses. With respect to each such condominium as to which the borrower has the right to elect less than a majority of the condominium board members, or does not have a right to elect condominium board members, the borrower does not control the related condominium. The condominiums require super-majority votes for certain actions, and, so long as the declarant owns any units in any of the condominiums, the declarant has the right to block amendments to the condominium documents that it determines will adversely affect its ability to sell or lease units, the value of its units or the financing available to it.
COVID-19 Update. The Mi Place at Vineyard Mortgage Loan was originated on July 13, 2021, and as of such date is not subject to any modification or forbearance request. The first debt service payment is in September 2021. As of July 6, 2021, the borrower sponsor has reported that 100.0% of billed rent was collected for the month of June 2021. No lease modifications or rent relief have been requested or granted.
The Market. The Mi Place at Vineyard Property is located in Lewes, Delaware in the Sussex County submarket in the Salisbury, Maryland multifamily and Sussex County retail market. Primary access to the Mi Place at Vineyard Property is provided by Route 1 (Coastal Highway) and Route 9 (Lewes Georgetown Highway), which are located 2 miles east of the Mi Place at Vineyard Property. Local access to the Mi Place at Vineyard Property is provided by Beaver Dam Road, which intersects with Lewes Georgetown Highway at Route 9. The Mi Place at Vineyard Property is located 4 miles away from the Lewes beaches. The Lewes beach towns consist of single-family homes with tourism-oriented retail and hospitality directly adjacent to the coast and main access roads. Commercial uses are generally found before the bridge to Lewes Beach. This area also includes various restaurants, a marina and museums. According to the appraisal, as of the fourth quarter of 2020, the vacancy rate in the Sussex County multifamily submarket was approximately 1.2%, with average asking rents of $1,161 per unit and inventory of approximately 2,004 units. According to the appraisal, as of the fourth quarter of 2020,
| This is not a research report and was not prepared by any Underwriter’s research department. Please see additional important information and qualifications at the end of this Term Sheet. |
124
| Multifamily – Garden | Loan #10 | Cut-off Date Balance: | $44,000,000 | |
| 12001 Old Vine Boulevard | Mi Place at Vineyard | Cut-off Date LTV: | 68.6% | |
| Lewes, DE 19958 | U/W NCF DSCR: | 1.96x | ||
| U/W NOI Debt Yield: | 8.9% |
the vacancy rate in the Salisbury, Maryland multifamily market was approximately 2.9%, with average asking rents of $1,118 per unit and inventory of approximately 6,802 units. According to the appraisal, as of the fourth quarter of 2020, the vacancy rate in the Sussex County retail market was approximately 5.1%, with average asking rents of $16.50 PSF and inventory of approximately 10.8 million SF. According to the appraisal, the estimated 2021 population within a one-, three- and five-mile radius of the Mi Place at Vineyard Property was 2,933, 18,021 and 37,565, respectively. The estimated 2021 average household income within the same radii was $97,588, $103,529 and $101,723, respectively.
The following table presents certain information relating to comparable multifamily rental properties to the Mi Place at Vineyard Property:
| Comparable Rental Properties | |||||
| Property | Year Built | # Units | Avg Unit Size (SF) | Average Monthly Rent per Unit | Average Monthly Rent PSF |
Mi Place at Vineyard(1) (subject property) | 2012 - 2021 | 288 | 933 | $1,637 | $1.82 |
| The Reserve at Sandbar | 2014 | 105 | 1,206 | $1,528 | $1.27 |
| Beach Plum Dunes | 2015 | 144 | 1,128 | $1,692 | $1.50 |
| Coastal Tide Apartments | 2021 | 168 | 959 | $1,588 | $1.65 |
| The Oaks at Georgetown | 2020 | 138 | 1,141 | $1,271 | $1.11 |
| Carillon Woods | 2019 | 250 | 964 | $1,398 | $1.45 |
Source: Appraisal, unless otherwise indicated.
| (1) | Based on the borrower rent roll dated July 5, 2021. |
The following table presents certain information relating to comparable commercial properties to the commercial portion of the Mi Place at Vineyard Property:
| Comparable Commercial Rental Properties | |||||||
| Property | Year Built | Lease term (Mos) | Tenant Name | Size (SF) | Lease Start Date | Rent PSF | Lease Type |
| The Village at Five | 2002 | 60 | N/A | 2,000 | Feb. 2021 | $17.00 | NNN |
| 17884 Coastal | 2012 | 36 | Holcomb Cabinetry | 1,500 | Feb. 2021 | $23.00 | NNN |
| Enterprise Office | 2006 | 24 | Compass Real Estate | 3,000 | Dec. 2020 | $24.00 | NNN |
| Enterprise Office | 2006 | 60 | Edward Jones | 1,733 | Dec. 2019 | $20.00 | NNN |
| 34634 Bay Crossing | 1995 | 36 | N/A | 1,362 | Jan. 2021 | $21.00 | NNN |
Source: Appraisal, unless otherwise indicated.
The following table presents certain information relating to the appraisal’s market rent conclusion for the multifamily units at the Mi Place at Vineyard Property:
| Market Rent Summary | ||||||
| Building(1) | Units(2) | Average Size (SF)(2) | Avg. Monthly Market Rent per Unit(3) | Avg. Monthly Market Rent PSF(2) | Avg. In-Place Monthly Rent Per Unit(3) | Avg. In-Place Monthly Rent PSF(3) |
| 1BR-1BA | 124 | 708 | $1,375 | $1.94 | $1,318 | $1.86 |
| 1BR-1BA | 8 | 827 | $1,425 | $1.72 | $1,419 | $1.72 |
| 1BR-1BA (condo) | 4 | 945 | $1,500 | $1.59 | $1,481 | $1.57 |
| 1BR-1BA (condo) | 4 | 1,154 | $1,575 | $1.36 | $1,581 | $1.37 |
| 2BR-2BA | 108 | 1,000 | $1,575 | $1.58 | $1,521 | $1.52 |
| 2BR-2BA (condo) | 28 | 1,250 | $1,800 | $1.44 | $1,778 | $1.42 |
| 2BR-2½BA (condo) | 4 | 1,564 | $1,850 | $1.18 | $1,832 | $1.17 |
| 3BR-3BA (condo) | 4 | 1,694 | $1,950 | $1.15 | $1,947 | $1.15 |
| 3BR-3BA (condo) | 2 | 2,320 | $2,300 | $0.99 | $2,289 | $0.99 |
| 4BR-3BA (condo) | 2 | 2,634 | $2,250 | $0.85 | $2,228 | $0.85 |
| (1) | The term “(condo)” used above refers to the 48 multifamily units in the condominium buildings in which the borrower has a leasehold interest only in selected units, rather than all of the units. |
| (2) | Based on the borrower rent roll dated July 5, 2021. |
| (3) | Based on the appraisal. |
| This is not a research report and was not prepared by any Underwriter’s research department. Please see additional important information and qualifications at the end of this Term Sheet. |
125
| Multifamily – Garden | Loan #10 | Cut-off Date Balance: | $44,000,000 | |
| 12001 Old Vine Boulevard | Mi Place at Vineyard | Cut-off Date LTV: | 68.6% | |
| Lewes, DE 19958 | U/W NCF DSCR: | 1.96x | ||
| U/W NOI Debt Yield: | 8.9% |
Operating History and Underwritten Net Cash Flow. The following table presents certain information relating to the historical operating performance and Underwritten Net Cash Flow at the Mi Place at Vineyard Property:
| Cash Flow Analysis(1) | ||||||||
| 2018 | 2019 | 2020 | 5/31/2021 TTM | UW | UW per Unit | |||
| Gross Potential Rent(2) | $2,318,312 | $3,346,471 | $3,829,794 | $4,433,721 | $5,652,516 | $19,626.79 | ||
| Total Recoveries | $0 | $0 | $0 | $0 | $18,879 | $65.55 | ||
| Other Income(3) | $526,074 | $563,862 | $619,284 | $629,814 | $634,735 | $2,203.94 | ||
| Vacancy & Credit Loss | ($784,905) | ($743,578) | $0 | $0 | ($284,675) | ($988.46) | ||
| Effective Gross Income | $2,059,481 | $3,166,755 | $4,449,078 | $5,063,535 | $6,021,456 | $20,907.83 | ||
| Real Estate Taxes | $44,614 | $67,213 | $90,557 | $101,146 | $138,476 | $480.82 | ||
| Insurance | $18,533 | $71,101 | $98,426 | $105,694 | $122,400 | $425.00 | ||
| Other Expenses | $716,948 | $1,290,649 | $1,677,023 | $1,755,534 | $1,861,480 | $6,463.47 | ||
| Total Expenses | $780,095 | $1,428,963 | $1,866,005 | $1,962,375 | $2,122,356 | $7,369.29 | ||
| Net Operating Income | $1,279,386 | $1,737,792 | $2,583,073 | $3,101,160 | $3,899,099 | $13,538.54 | ||
| Capital Expenditures | $0 | $0 | $0 | $0 | $77,748 | $269.96 | ||
| TI/LC | $0 | $0 | $0 | $0 | $0 | $0.00 | ||
| Net Cash Flow | $1,279,386 | $1,737,792 | $2,583,073 | $3,101,160 | $3,821,351 | $13,268.58 | ||
| Occupancy %(4) | 90.6% | 97.8% | 99.3% | 95.0% | ||||
| NOI DSCR | 0.66x | 0.89x | 1.32x | 1.59x | 2.00x | |||
| NCF DSCR | 0.66x | 0.89x | 1.32x | 1.59x | 1.96x | |||
| NOI Debt Yield | 2.9% | 3.9% | 5.9% | 7.0% | 8.9% | |||
| NCF Debt Yield | 2.9% | 3.9% | 5.9% | 7.0% | 8.7% | |||
| (1) | For the avoidance of doubt, no COVID-19 specific adjustments have been made to the lender underwriting. |
| (2) | The increase in Gross Potential Rent and Net Operating Income between 5/31/2021 TTM and UW was mainly due to the lease up of multiple newly constructed buildings. Approximately 64 units were delivered between March and July 2020 with a further 10 units delivered in June 2021. |
| (3) | Other Income is comprised of commercial revenue, early termination fees, application fees, tenant damage fees, storage unit rent, key fob and extra key fees. |
| (4) | The 5/31/2021 TTM Occupancy % is based on the borrower rent roll dated July 5, 2021. |
Escrows and Reserves.
Ground Rent – The Mi Place at Vineyard Mortgage Loan documents provide for an upfront deposit of $248,201 for ground rent.
Real Estate Taxes –The Mi Place at Vineyard Mortgage Loan documents provide for an upfront deposit of $154,518 for real estate taxes, and for ongoing monthly deposits into a reserve for real estate taxes in an amount equal to 1/12 of the real estate taxes that the lender estimates will be payable during the next twelve months for the Mi Place at Vineyard Property (initially, $11,886).
Insurance – The Mi Place at Vineyard Mortgage Loan documents provide for ongoing monthly deposits into a reserve for insurance premiums in an amount equal to 1/12 of the insurance premiums that the lender estimates will be payable for the renewal of coverage upon the expiration of the insurance policies; provided that such monthly deposits are not required so long as (i) no event of default is continuing, (ii) the liability and casualty insurance coverage for the Mi Place at Vineyard Property is included in a blanket policy approved by the lender in its reasonable discretion, and (iii) the borrower provides the lender with paid receipts for payment of the insurance premiums and evidence of renewals of the insurance policies, no later than ten days prior to the expiration of the current policy.
Deferred Maintenance – The Mi Place at Vineyard Mortgage Loan documents provide for an upfront reserve of $17,500 for deferred maintenance.
Capital Expenditures – The Mi Place at Vineyard Mortgage Loan documents provide for ongoing monthly deposits of $6,000 (250 per residential unit per annum) into a reserve for capital expenditures.
Lockbox and Cash Management. The Mi Place at Vineyard Mortgage Loan is structured with a hard lockbox and in place cash management. The borrower is required to establish and maintain a lockbox account for the benefit of the lender, to direct all tenants of the Mi Place at Vineyard Property to deposit all rents directly into the lockbox account, and to deposit any funds received by the borrower or property manager, notwithstanding such direction, into the lockbox account within one business day of receipt. In addition, the borrower is required to establish and maintain a cash management account controlled by the lender, into which all funds in the lockbox account are required to be swept within one business day of receipt. On each monthly payment date, funds in the cash management account are required to be applied: (i) to make the monthly deposits into the real estate tax and insurance reserves as described above under “Escrows and Reserves,” (ii) to pay debt service on the Mi Place at Vineyard Mortgage Loan, (iii) to make the monthly deposit into the capital expenditures reserve as described above under “Escrows and Reserves,” (iv) to pay operating expenses set forth in the lender-approved annual budget and lender-approved extraordinary expenses, (v) provided no event of default is continuing under the Mi Place at Vineyard Mortgage Loan, to pay debt service on the Mi Place at Vineyard Mezzanine Loan (as defined below), and (vi) to disburse all remaining amounts; (x) during a Cash Sweep Event Period caused solely by an event of default under the Mi Place at Vineyard Mezzanine Loan, into an account for the benefit of the mezzanine lender, (y) during a Cash Sweep Event Period not caused solely by an event of default under the Mi Place at Vineyard Mezzanine Loan, into an excess cash flow reserve to be held as additional security for the Mi Place at Vineyard Mortgage Loan during the continuance of such Cash Sweep Event Period and (z) if no Cash Sweep Event Period is continuing, to the borrower. If no Cash Sweep Event Period is continuing, all funds in the excess cash flow subaccount are required to be disbursed to the borrower.
| This is not a research report and was not prepared by any Underwriter’s research department. Please see additional important information and qualifications at the end of this Term Sheet. |
126
| Multifamily – Garden | Loan #10 | Cut-off Date Balance: | $44,000,000 | |
| 12001 Old Vine Boulevard | Mi Place at Vineyard | Cut-off Date LTV: | 68.6% | |
| Lewes, DE 19958 | U/W NCF DSCR: | 1.96x | ||
| U/W NOI Debt Yield: | 8.9% |
“Cash Sweep Event Period” means a period:
| (i) | commencing upon an event of default under the Mi Place at Vineyard Mortgage Loan documents and ending if no event of default exists; |
| (ii) | commencing upon an event of default under the Mi Place at Vineyard Mezzanine Loan documents and ending upon the lender receiving written notice from the mezzanine lender that no event of default exists under the Mi Place at Vineyard Mezzanine Loan documents; or |
| (iii) | commencing upon the aggregate debt service coverage ratio of the Mi Place at Vineyard Mortgage Loan and Mi Place at Vineyard Mezzanine Loan (assuming the actual loan constant and based on the trailing six months operating statements and current in place rent rolls) falling below 1.20x at the end of any calendar quarter and ending upon the date such aggregate debt service coverage ratio (assuming the actual loan constant) being at least 1.20x for the immediately preceding six consecutive calendar months. |
Additional Secured Indebtedness (not including trade debts). None.
Mezzanine Loan and Preferred Equity. Concurrently with the funding of the Mi Place at Vineyard Mortgage Loan, Morgan Stanley Mortgage Capital Holdings LLC funded a mezzanine loan in the amount of $5,000,000 (the “Mi Place at Vineyard Mezzanine Loan”) to the holder of 100% of the equity interests in the borrower, secured by a pledge of such equity interests. The Mi Place at Vineyard Mezzanine Loan is coterminous with the Mi Place at Vineyard Mortgage Loan, accrues interest at the rate of 9.25% per annum and requires interest-only payments until its maturity date. The Mi Place at Vineyard Mezzanine Loan has been sold to a third party holder.
The Mi Place at Vineyard total debt as of the origination date is summarized in the following table:
| Mi Place at Vineyard Total Debt Summary | |||||
| Note | Original Balance | Interest Rate | Cumulative UW NCF DSCR | Cumulative UW NOI Debt Yield | Cumulative Cut-off Date LTV |
| Mortgage Loan | $44,000,000 | 4.3700% | 1.96x | 8.9% | 68.6% |
| Mezzanine Loan | $5,000,000 | 9.2500% | 1.58x | 8.0% | 76.4% |
| Total Debt | $49,000,000 | 4.8680% | 1.58x | 8.0% | 76.4% |
Release of Property. Not permitted.
Letter of Credit. None.
Right of First Offer / Right of First Refusal. None.
Ground Lease. The borrower’s leasehold interest in the Mi Place at Vineyard Property consists of an undivided leasehold interest under a ground lease (the “Vineyard Community Ground Lease”), which commenced August 22, 2003 and expires August 21, 2102. The Vineyard Community Ground Lease includes one 99-year extension option, which extends the expiration date to August 21, 2201. A master association for the Vineyard Community acts on behalf of the named ground tenant, borrower and any third party unit owner to collect rent and take certain actions under the Vineyard Community Ground Lease, including exercising the extension option. Pursuant to a ground lease estoppel, the ground lessor has agreed that upon an event of default under the Vineyard Community Ground Lease by the named ground tenant under the ground lease or any other third party unit owner (other than the borrower) that holds an undivided leasehold interest under the ground lease, any exercise of remedies by the ground lessor will not affect borrower’s undivided leasehold interest under the ground lease and will not result in a termination of the leasehold estate of the borrower in the Mi Place at Vineyard Property under the Vineyard Community Ground Lease.
The annual ground rent payment owed by the borrower with respect to its undivided interest under the Vineyard Community Ground Lease for 2021 is $992,805. Annual rent for the borrower’s undivided interest under the Vineyard Community Ground Lease is calculated pursuant to a formula, equal to (1) for rental residential apartments in the eight residential buildings in The Vineyards Rental Leasehold Condominium, 17.0% of each rental apartment unit’s gross annual rent, (2) for those certain leasehold residential condominium units in The Vineyards Residential Condominium and The Vineyards Contemporary Residential Condominium (“Separate Residential Condominium Units”), $3,027.63 per condominium unit, (3) for commercial space in The Vineyards Commercial Condominium and The Vineyards Phase EE Leasehold Condominium, $3.03 per SF. The ground rent for Separate Residential Condominium Units and commercial space increases annually by the percentage change in the Consumer Price Index for all Urban Consumers-Northeast Division (1982-84), capped at 4%. In addition, with respect to four of the buildings in The Vineyards Rental Leasehold Condominium, the borrower is required to pay the ground lessor the positive difference, if any, between the annual rent that would be payable if rent were calculated as if the borrower’s units in such buildings were Separate Residential Condominium Units over the annual rent that would otherwise be payable for the borrower’s units in such buildings under the formula above, until December 31, 2028. The borrower is also required to pay real estate taxes, obtain insurance required by the Vineyard Community Ground Lease and pay operating expenses for the portion of the Vineyard Community in which it has an undivided interest under the Vineyard Community Ground Lease.
Terrorism Insurance. The borrower is required to obtain and maintain an “all risk” or “special form” property insurance policy that covers acts of terrorism in an amount equal to the “full replacement cost” of the Mi Place at Vineyard Property, together with business income insurance covering not less than the 18-month period commencing at the time of loss, together with an extended period of indemnity endorsement which provides that after the physical loss to the improvements and personal property has been repaired, the continued loss of income will be insured until either such income returns to the same level it was at prior to the loss or the expiration of six months from the date the Mi Place at Vineyard Property is repaired and operations are resumed, whichever first occurs. Notwithstanding the foregoing, for so long as the Terrorism Risk Insurance Act of 2002, as extended and modified by the Terrorism Risk Insurance Program Reauthorization Act of 2015 (“TRIPRA”), is in effect (including any extensions thereof or if another federal governmental program is in effect relating to “acts of terrorism” which provides substantially similar protections as TRIPRA), the lender is required to accept terrorism insurance which covers against “covered acts” as defined by TRIPRA (or such other program) but only in the event that TRIPRA (or such other program) continues to cover both domestic and foreign acts of terrorism. See “Risk Factors—Risks Relating to the Mortgage Loans—Terrorism Insurance May Not Be Available for All Mortgaged Properties” in the prospectus.
| This is not a research report and was not prepared by any Underwriter’s research department. Please see additional important information and qualifications at the end of this Term Sheet. |
127
| Mortgage Loan No. 11 – One Trinity Center |
| Mortgage Loan Information | Mortgaged Property Information | ||||||
| Mortgage Loan Seller: | WFB | Single Asset/Portfolio: | Single Asset | ||||
| Credit Assessment (DBRSM/Fitch/S&P): | NR/NR/NR | Location: | San Francisco, CA 94103 | ||||
| Original Balance: | $40,000,000 | General Property Type: | Office | ||||
| Cut-off Date Balance: | $40,000,000 | Detailed Property Type: | CBD | ||||
| % of Initial Pool Balance: | 2.9% | Title Vesting: | Fee | ||||
| Loan Purpose: | Recapitalization | Year Built/Renovated: | 1990/NAP | ||||
| Borrower Sponsors: | Anne Marie Kane, James | Size: | 135,560 SF | ||||
| Sangiacomo, Mark Sangiacomo, | Cut-off Date Balance per SF: | $295.07 | |||||
| Maryanne Sangiacomo, Maria | Maturity Date Balance per SF: | $295.07 | |||||
| Sangiacomo, Sandro Sangiacomo | Property Manager | Trinity Management Services | |||||
| and Susan Sangiacomo | (borrower affiliated) | ||||||
| Guarantor(1): | Trinity Center LLC | ||||||
| Mortgage Rate: | 2.910% | ||||||
| Note Date: | 7/9/2021 | ||||||
| First Payment Date: | 8/11/2021 | ||||||
| Maturity Date: | 7/11/2031 | ||||||
| Original Term to Maturity: | 120 months | ||||||
| Original Amortization Term: | 0 months | ||||||
| IO Period: | 120 months | Underwriting and Financial Information(7) | |||||
| Seasoning: | 1 month | UW NOI(8): | $4,628,852 | ||||
| Prepayment Provisions: | L(25),DorYM1(88),O(7) | UW NOI Debt Yield: | 11.6% | ||||
| Lockbox/Cash Mgmt Status(2): | Hard/In Place | UW NOI Debt Yield at Maturity: | 11.6% | ||||
| Additional Debt Type: | No | UW NCF DSCR: | 3.76x | ||||
| Additional Debt Balance: | NAP | Most Recent NOI(8): | $2,882,838 (3/31/2021 TTM) | ||||
| Future Debt Permitted (Type): | No (NAP) | 2nd Most Recent NOI: | $2,871,679 (12/31/2020) | ||||
| Reserves | 3rd Most Recent NOI: | $2,982,592 (12/31/2019) | |||||
| Type | Initial | Monthly | Cap | Most Recent Occupancy: | 87.4% (6/15/2021) | ||
| RE Taxes | $240,220 | $60,055 | NAP | 2nd Most Recent Occupancy: | 88.7% (12/31/2020) | ||
| Insurance(3) | $0 | Springing | NAP | 3rd Most Recent Occupancy: | 95.2% (12/31/2019) | ||
| Replacement Reserve(4) | $0 | Springing | NAP | Appraised Value (as of): | $93,000,000 (5/18/2021) | ||
| TI/LC Reserve(5) | $0 | Springing | NAP | Appraised Value per SF: | $686.04 | ||
| Cash Sweep Avoidance Reserve(6) | $0 | Springing | NAP | Cut-off Date LTV Ratio: | 43.0% | ||
| Maturity Date LTV Ratio: | 43.0% | ||||||
| Sources and Uses | ||||||
| Sources | Proceeds | % of Total | Uses | Proceeds | % of Total | |
| Loan Amount: | $40,000,000 | 100.0% | Existing Loan Payoff(9): | $0 | 0.0% | |
| Upfront Reserves: | $240,220 | 0.6% | ||||
| Closing Costs: | $537,326 | 1.3% | ||||
| Return of Equity | $39,222,454 | 98.1% | ||||
| Total Sources: | $40,000,000 | 100.0% | Total Uses: | $40,000,000 | 100.0% | |
| (1) | There is no non-recourse carveout guarantor or separate environmental indemnitor. |
| (2) | A Cash Trap Event Period will commence upon (a) an event of default or (b) the net operating income debt yield falling below 7.5%, tested quarterly (the “Low Debt Yield Trigger”). |
| (3) | The loan documents to do not require ongoing monthly insurance reserves for insurance premiums as long as (i) no event of default is continuing; (ii) the policies maintained by the borrower are part of a blanket or umbrella policy approved by the lender in its reasonable discretion, (iii) the borrower provides the lender evidence of the renewal of the policy; and (iv) the borrower provides paid receipts for the premiums no later than ten business days prior to the expiration dates of the policies. |
| (4) | The loan documents do not require ongoing monthly replacement reserves as long as (i) no event of default exists and (ii) the One Trinity Center Property (as defined below) is being adequately maintained as determined by the lender based on annual site inspections. |
| (5) | The loan documents do not require ongoing monthly leasing reserves as long as (i) no event of default exists and (ii) no Cash Trap Event Period has occurred. |
| (6) | In lieu of a Cash Trap Event Period caused solely by the Low Debt Yield Trigger, the borrower can deposit cash or a letter of credit into the Cash Sweep Avoidance Reserve in an amount that, if applied to the outstanding principal balance of the loan, would result in a net operating income debt yield of 7.5%. |
| (7) | The novel coronavirus pandemic is an evolving situation and could impact the One Trinity Center Mortgage Loan (as defined below) more severely than assumed in the underwriting of the One Trinity Center Mortgage Loan and could adversely affect the NOI, NCF and occupancy information, as well as the appraised value and the DSCR, LTV and Debt Yield metrics presented above and herein. See “Risk Factors—Risks Related to Market Conditions and Other External Factors—The Coronavirus Pandemic Has Adversely Affected the Global Economy and Will Likely Adversely Affect the Performance of the Mortgage Loans” in the prospectus. |
| (8) | The increase from the most recent NOI to the UW NOI is primarily due to a new lease representing $1,468,715 of underwritten rent being signed with the borrower affiliated tenant, Trinity Management Services, which did not previously have a lease. Additionally, average rent over the remaining lease term for SF Health Service System, SF Law Library, and SF Retirement City and County was underwritten given the AA/Aa1/AA+ credit rating by Fitch, Moody’s and S&P. |
| (9) | The One Trinity Center Property was previously unencumbered. |
| This is not a research report and was not prepared by any Underwriter’s research department. Please see additional important information and qualifications at the end of this Term Sheet. |
128
| Office – CBD | Loan #11 | Cut-off Date Balance: | $40,000,000 | |
| 1145 Market Street | One Trinity Center | Cut-off Date LTV: | 43.0% | |
| San Francisco, CA 94103 | UW NCF DSCR: | 3.76x | ||
| UW NOI Debt Yield: | 11.6% |
The Mortgage Loan. The 11th largest mortgage loan (the “One Trinity Center Mortgage Loan”) is evidenced by a single promissory note in the original principal amount of $40,000,000 secured by a first priority fee mortgage encumbering a 135,560 SF office building (the “One Trinity Center Property”), located in San Francisco, California. The proceeds of the One Trinity Center Mortgage Loan were used to fund upfront reserves, pay closing costs, and return equity to the borrower.
The Borrower and the Borrower Sponsors. The borrower is Trinity Center LLC, a Delaware limited liability company and single purpose entity with one independent director. There is no non-recourse carveout guarantor or separate environmental indemnitor for the One Trinity Center Mortgage Loan.
The borrower sponsors are Anne Marie Kane, James Sangiacomo, Mark Sangiacomo, Maryanne Sangiacomo, Maria Sangiacomo, Sandro Sangiacomo, and Susan Sangiacomo who own 100% of the borrower through trusts for the benefit of the Sangiacomo family. The borrower sponsors are the seven adult children of Angelo Sangiacomo, the founder of Trinity. Trinity was founded in 1949 and currently has a portfolio of 29 apartment buildings in San Francisco, California.
The Property. The One Trinity Center Property is a Class A, thirteen-story, plus basement, 135,560 SF office building located in San Francisco, California. Built in 1990, the property is situated on a 0.33-acre site, and has an eight-space garage. Floors 6, 7, 9, 10, 12, and 13 have outdoor terraces. The 11th - 13th floor are occupied by borrower-affiliated Trinity Management Services, connected with an internal stairway between the 12th and 13th floors. The 13th floor has ceiling heights of 14 to 16 feet and includes a private dining room and kitchen. As of June 15, 2021, the One Trinity Center Property was 87.4% occupied by seven tenants, including three distinct departments of the City & County of San Francisco.
Major Tenants.
City & County of San Francisco (AA/Aa1/AA+; F/M/S&P; 74,948 SF; 55.3% of NRA; 59.2% of underwritten base rent). There are three departments of the City & County of San Francisco which lease space at the One Trinity Center Property:
| ● | SF Retirement City and County (35,388 SF; 26.1% of NRA; 25.7% of underwritten base rent; 7/31/2024 lease expiration). The tenant has been at the One Trinity Center Property since 2014 and has one, 5-year renewal option with 12 months’ notice at 95% of fair market rent. |
| ● | SF Law Library (20,000 SF; 14.8% of NRA; 19.5% of underwritten base rent; 6/30/2023 lease expiration). The tenant has been at the One Trinity Center Property since 2013, with no remaining extension options. |
| ● | SF Health Service System (19,560 SF; 14.4% of NRA; 14.1% of underwritten base rent; 11/30/2023 lease expiration). The tenant has been at the One Trinity Center Property since 1997 and has one, 5-year renewal option with 12 months’ notice at 95% of fair market rent. |
Each of the departments of the City & County of San Francisco has early termination options as outlined in the Tenant Summary table below. Additionally, each lease contains a right of first refusal (the “ROFR”) to purchase the One Trinity Center Property if the borrower elects to market the One Trinity Center Property for sale. The ROFR is not extinguished by foreclosure, however, the ROFR does not apply to foreclosure or deed in lieu thereof.
Trinity Management Services (21,618; 15.9% of NRA; 21.8% of underwritten base rent). Trinity Management Services is affiliated with the borrower. The company has been located at the One Trinity Center Property since the building was constructed in 1990 and it recently signed a 12-year lease with an expiration date of June 15, 2033. The tenant occupies floors 11-13, with its employees located on the 11th floor, management-level employees on the 12th floor and the 13th floor is used primarily as the private offices of the Sangiacomo family. The lease contains no termination options and no renewal options.
| This is not a research report and was not prepared by any Underwriter’s research department. Please see additional important information and qualifications at the end of this Term Sheet. |
129
| Office – CBD | Loan #11 | Cut-off Date Balance: | $40,000,000 | |
| 1145 Market Street | One Trinity Center | Cut-off Date LTV: | 43.0% | |
| San Francisco, CA 94103 | UW NCF DSCR: | 3.76x | ||
| UW NOI Debt Yield: | 11.6% |
The following table presents certain information relating to the tenancy at the One Trinity Center Property:
| Tenant Summary | |||||||||
| Tenant Name | Credit Rating (Fitch/Moody’s/ S&P)(2) | Tenant SF | Approx. % of SF | Annual UW Rent(1) | % of Total Annual UW Rent | Annual UW Rent PSF(1) | Renewal Options | ||
| Termination Option (Y/N) | Lease Expiration | ||||||||
| Major Tenants | |||||||||
| SF Retirement City and County | AA/Aa1/AA+ | 35,388 | 26.1% | $1,729,303 | 25.7% | $48.87 | Y(3) | 7/31/2024 | 1, 5-year |
| Trinity Management Services(4) | NR/NR/NR | 21,618 | 15.9% | $1,468,715 | 21.8% | $67.94 | N | 6/15/2033 | N |
| SF Law Library | AA/Aa1/AA+ | 20,000 | 14.8% | $1,309,600 | 19.5% | $65.48 | Y(5) | 6/30/2023 | N |
| SF Health Service System | AA/Aa1/AA+ | 19,560 | 14.4% | $949,753 | 14.1% | $48.56 | Y(6) | 11/30/2023 | 1, 5-year |
| Sutter Bay Hospitals(7) | A/A1/A | 11,392 | 8.4% | $672,211 | 10.0% | $59.01 | N | 1/31/2025 | 1, 5-year |
| SubTotal/Wtd. Avg. | 107,958 | 79.6% | $6,129,581 | 91.0% | $56.78 | ||||
| Non-Major Tenants | 10,480 | 7.7% | $602,977 | 9.0% | $57.54 | ||||
| Occupied Collateral Total | 118,438 | 87.4% | $6,732,559 | 100.0% | $56.84 | ||||
| Vacant Space | 17,122 | 12.6% | |||||||
| Total/Wtd. Avg. | 135,560 | 100.0% | |||||||
| (1) | Annual UW Rent and Annual UW Rent PSF includes rent averaging over the remaining lease term for SF Retirement City and County, SF Law Library, and SF Health Services, and includes a contractual rent increase for Minerva Project, Inc. in October 2021 of $16,842. |
| (2) | Certain ratings are those of the parent company or related government whether or not the parent company or government guarantees the lease. |
| (3) | In the event the city constructs a new city owned building to house the tenant, SF Retirement City and County has the right to terminate its lease as of any date after July 1, 2017 with 12 months’ notice and the payment of unamortized leasing expenses on a ten year term at a 6% interest rate. Additionally, the tenant has the right to terminate without a fee if sufficient funds for rent and any other payments required under the lease are not appropriated. |
| (4) | Trinity Management Services is a borrower-affiliated tenant. |
| (5) | If a court determines its premises is not suitable for a law library or if the city is no longer legally required to maintain a law library, SF Law Library has the right to terminate its lease with at least 180 days prior written notice and payment of all unamortized leasing costs on a five-year term at a 7% interest rate. Additionally, the tenant has the right to terminate without a fee if sufficient funds for rent and any other payments required under the lease are not appropriated. |
| (6) | SF Health Service System has the right to terminate its lease as of any date after July 1, 2021 with 180 days’ notice and the payment of unamortized leasing expenses on a five-year term at a 7% interest rate. Additionally, the tenant has the right to terminate without a fee if sufficient funds for rent and any other payments required under the lease are not appropriated. |
| (7) | Sutter Bay Hospitals has vacated its space due to a reevaluation of its office requirements. The tenant continues to pay rent and has made the space available for sublease. |
The following table presents certain information relating to the lease rollover schedule at the One Trinity Center Property:
| Lease Rollover Schedule(1) | ||||||||
| Year | # of Leases Rolling | SF Rolling | UW Rent PSF Rolling | Approx. % of Total SF Rolling | Approx. Cumulative % of SF Rolling | Total UW Rent Rolling | Approx. % of Total Rent Rolling | Approx. Cumulative % of Total Rent Rolling |
| MTM | 0 | 0 | $0.00 | 0.0% | 0.0% | $0 | 0.0% | 0.0% |
| 2021 | 0 | 0 | $0.00 | 0.0% | 0.0% | $0 | 0.0% | 0.0% |
| 2022 | 1 | 10,074 | $57.40 | 7.4% | 7.4% | $578,257 | 8.6% | 8.6% |
| 2023 | 2 | 39,560 | $57.11 | 29.2% | 36.6% | $2,259,353 | 33.6% | 42.1% |
| 2024 | 2 | 35,794 | $49.00 | 26.4% | 63.0% | $1,754,023 | 26.1% | 68.2% |
| 2025 | 1 | 11,392 | $59.01 | 8.4% | 71.4% | $672,211 | 10.0% | 78.2% |
| 2026 | 0 | 0 | $0.00 | 0.0% | 71.4% | $0 | 0.0% | 78.2% |
| 2027 | 0 | 0 | $0.00 | 0.0% | 71.4% | $0 | 0.0% | 78.2% |
| 2028 | 0 | 0 | $0.00 | 0.0% | 71.4% | $0 | 0.0% | 78.2% |
| 2029 | 0 | 0 | $0.00 | 0.0% | 71.4% | $0 | 0.0% | 78.2% |
| 2030 | 0 | 0 | $0.00 | 0.0% | 71.4% | $0 | 0.0% | 78.2% |
| 2031 | 0 | 0 | $0.00 | 0.0% | 71.4% | $0 | 0.0% | 78.2% |
| 2032 & Beyond | 1 | 21,618 | $67.94 | 15.9% | 87.4% | $1,468,715 | 21.8% | 100.0% |
| Vacant | 0 | 17,122 | $0.00 | 12.6% | 100.0% | $0 | 0.0% | 100.0% |
| Total/Wtd. Avg.(2) | 7 | 135,560 | $56.84 | 100.0% | $6,732,559 | 100.0% | ||
| (1) | Information is based on the underwritten rent roll. |
| (2) | Total/Wtd. Avg. UW Rent PSF Rolling excludes vacant space. |
| This is not a research report and was not prepared by any Underwriter’s research department. Please see additional important information and qualifications at the end of this Term Sheet. |
130
| Office – CBD | Loan #11 | Cut-off Date Balance: | $40,000,000 | |
| 1145 Market Street | One Trinity Center | Cut-off Date LTV: | 43.0% | |
| San Francisco, CA 94103 | UW NCF DSCR: | 3.76x | ||
| UW NOI Debt Yield: | 11.6% |
COVID-19 Update. As of June 28, 2021, the One Trinity Center Property is open and operating. 100% of tenants by underwritten rent and 100% by SF paid rent for May and June 2021. The first payment date for the One Trinity Center Mortgage Loan is August 11, 2021. There have been no requests for loan modification or forbearance and no tenants have requested rent relief or lease modifications.
The Market. The One Trinity Center Property is located in the Civic Center/Central Market District of San Francisco, California. The property is located on Market Street, which is a major commercial roadway and bifurcates San Francisco in a northeast/southwest direction. The One Trinity Center Property has access to the East and South bay areas via Highway 101 and I-280, which are located within 2 miles of the property. Public transportation is abundant with several bus and trolley lines running along Market Street, as well as a Bay Area Rapid Transit (BART) station located on Market Street at the property.
The Civic Center/Central Market district is home to the headquarters of both Twitter and Uber, which are located less than 0.6 miles from the One Trinity Center Property. Additionally, Civic Center Plaza, City Hall and the United States Court of Appeals for the Ninth Circuit are all located within 0.5 miles of the property. Trinity Place, which is being developed adjacent to the property by an affiliate of the borrower, is expected to include 1,900 apartment units and 65,000 square feet of retail space. Within a one-, three- and five-mile radius of the One Trinity Center Property, the 2020 average household income was approximately $121,243, $179,310 and $171,735, respectively; and within the same radii, the 2020 estimated population was 133,171, 494,180 and 808,598, respectively.
According to a third-party market research report, the One Trinity Center Property is situated within the Midmarket submarket of the San Francisco office market. As of July 14, 2021, the submarket reported total inventory of approximately 7.6 million SF, with a 9.4% vacancy rate, 20.5% availability rate, and average asking rents of $59.48 PSF. The appraisal identified eight comparable properties with rents ranging from $57.00 to $78.00 PSF, full service.
The following table presents certain information relating to the appraisal’s market rent conclusion for the One Trinity Center Property:
| Market Rent Summary | ||||
| Office 1-5 | Office 6-11 | Office 12-13 | Cafe | |
| Market Rent (PSF) | $60.00 | $65.00 | $70.00 | $60.00 |
| Lease Term (Years) | 7 | 7 | 7 | 5 |
| Lease Type (Reimbursements) | FS-Spec | FS-Spec | FS-Spec | None |
| Rent Increase Projection | 3.0% per annum | 3.0% per annum | 3.0% per annum | 3.0% per annum |
Source: Appraisal.
The table below presents certain information relating to comparable sales pertaining to the One Trinity Center Property identified by the appraiser:
| Comparable Sales | |||||
Property Name | Location | Rentable Area (SF) | Occupancy | Sale Date | Sale Price (PSF) |
747 Front Street 747 Front Street | San Francisco, CA | 76,846 | 100.0% | Sep-2019 | $923 |
655 Montgomery Street 655 Montgomery Street | San Francisco, CA | 270,304 | 96.0% | May-2019 | $716 |
South Building 350 Rhode Island Street – South Building | San Francisco, CA | 138,939 | 100.0% | Feb-2019 | $864 |
Embarcadero Square 560 & 650 Davis and 75 Broadway | San Francisco, CA | 293,877 | 98.0% | Nov-2018 | $834 |
235 Pine Street 235 Pine Street | San Francisco, CA | 164,405 | 82.0% | Jun-2018 | $814 |
Source: Appraisal.
| This is not a research report and was not prepared by any Underwriter’s research department. Please see additional important information and qualifications at the end of this Term Sheet. |
131
| Office – CBD | Loan #11 | Cut-off Date Balance: | $40,000,000 | |
| 1145 Market Street | One Trinity Center | Cut-off Date LTV: | 43.0% | |
| San Francisco, CA 94103 | UW NCF DSCR: | 3.76x | ||
| UW NOI Debt Yield: | 11.6% |
The following table presents certain information relating to comparable office leases for the One Trinity Center Property:
| Comparable Building Leases | |||||||
| Property Name/Location | Year Built/ Renovated | Total GLA (SF) | Tenant Name | Lease Date/Term | Lease Area (SF) | Annual Base Rent PSF | Lease Type |
One Trinity Center 1145 Market Street San Francisco, CA | 1990/NAP | 135,560 | NAP | NAP | NAP | NAP | NAP |
Office Property 71 Stevenson Street San Francisco, CA | 1986/NAP | 323,300 | Finx | Aug-2020 / 1.8Yrs | 14,097 | $71.00 | FS |
1035 Market Street 1035 Market Street San Francisco, CA | 1912/2003 | 98,023 | SF AIDS Foundation
| Jun-2021 / 5.0Yrs | 45,322 | $78.00 | FS |
Central Plaza Building 455 Market Street San Francisco, CA | 1987/NAP | 379,203 | Securitas Security Svcs | Jan-2021 / 3.0Yrs | 1,937 | $72.00 | FS |
Tiffany Building 350-360 Post Street San Francisco, CA | 1972/NAP | 96,900 | Henry Khachaturian | Mar-2021 / 3.0Yrs | 1,600 | $72.00 | FS |
Fox Plaza 1390 Market Street San Francisco, CA | 1967/NAP | 219,700 | Arista
SF Dept of Children/Youth/Fam
| Oct-2022 / 5.0Yrs
Dec-2020/5.0Yrs
| 8,477
10,846
| $70.00
$65.00
| FS
FS
|
311 California Street 311 California Street San Francisco, CA | 1922/NAP | 89,900 | Roger, Joseph, O’Donnell et al | Oct-2021 / 10.0Yrs | 26,868 | $57.00 | FS |
Bank of the West Building 180 Montgomery Street San Francisco, CA | 1979/NAP | 304,400 | Allen, Glaessner, et al | Jul-2021 / 3.0Yrs | 6,276 | $67.00 | FS |
235 Pine Street 235 Pine Street San Francisco, CA | 1990/2018 | 164,400 | Elements Global Services | Jun-2021 / 5.0Yrs. | 3,445 | $59.00 | FS |
Source: Appraisal.
| This is not a research report and was not prepared by any Underwriter’s research department. Please see additional important information and qualifications at the end of this Term Sheet. |
132
| Office – CBD | Loan #11 | Cut-off Date Balance: | $40,000,000 | |
| 1145 Market Street | One Trinity Center | Cut-off Date LTV: | 43.0% | |
| San Francisco, CA 94103 | UW NCF DSCR: | 3.76x | ||
| UW NOI Debt Yield: | 11.6% |
Operating History and Underwritten Net Cash Flow. The following table presents certain information relating to the historical operating performance and Underwritten Net Cash Flow at the One Trinity Center Property:
| Cash Flow Analysis | ||||||
| 2018 | 2019 | 2020 | 3/31/2021 TTM | UW | UW PSF | |
| Base Rent | $5,206,163 | $5,319,545 | $5,047,398 | $5,025,303 | $6,732,559(1)(2) | $49.66 |
| Grossed Up Vacant Space | $0 | $0 | $0 | $0 | $1,080,410 | $7.97 |
| Gross Potential Rent | $5,206,163 | $5,319,545 | $5,047,398 | $5,025,303 | $7,812,969 | $57.63 |
| Other Income | $10,714 | $7,307 | $7,447 | $7,407 | $7,407 | $0.05 |
| Total Recoveries | $105,345 | $159,563 | $58,607 | $58,607 | $55,381 | $0.41 |
| Net Rental Income | $5,322,222 | $5,486,415 | $5,113,452 | $5,091,317 | $7,875,756 | $58.10 |
| (Vacancy & Credit Loss) | $0 | $0 | $0 | $0 | ($1,080,410)(3) | ($7.97) |
| Effective Gross Income | $5,322,222 | $5,486,415 | $5,113,452 | $5,091,317 | $6,795,346 | $50.13 |
| Real Estate Taxes | $483,669 | $651,504 | $674,892 | $680,808 | $686,336 | $5.06 |
| Insurance | $17,831 | $32,753 | $40,281 | $42,460 | $58,288 | $0.43 |
| Management Fee | $563,164 | $558,770 | $516,800 | $514,436 | $203,860(4) | $1.50 |
| Other Operating Expenses | $1,368,151 | $1,260,796 | $1,009,800 | $970,774 | $1,218,010 | $8.99 |
| Total Operating Expenses | $2,432,814 | $2,503,823 | $2,241,773 | $2,208,479 | $2,166,494 | $15.98 |
| Net Operating Income | $2,889,408 | $2,982,592 | $2,871,679 | $2,882,838 | $4,628,852(5) | $34.15 |
| Replacement Reserves | $0 | $0 | $0 | $0 | $27,112 | $0.20 |
| TI/LC | $0 | $0 | $0 | $0 | $169,450 | $1.25 |
| Net Cash Flow | $2,889,408 | $2,982,592 | $2,871,679 | $2,882,838 | $4,432,290 | $32.70 |
| Occupancy % | 97.5% | 95.2% | 88.7% | 89.2% (6) | 86.2%(3) | |
| NOI DSCR | 2.45x | 2.53x | 2.43x | 2.44x | 3.92x | |
| NCF DSCR | 2.45x | 2.53x | 2.43x | 2.44x | 3.76x | |
| NOI Debt Yield | 7.2% | 7.5% | 7.2% | 7.2% | 11.6% | |
| NCF Debt Yield | 7.2% | 7.5% | 7.2% | 7.2% | 11.1% | |
| (1) | Annual UW Rent and Annual UW Rent PSF includes straight line rent averaging of $193,094 over the remaining lease term for SF Retirement City and County, SF Law Library, and SF Health Services, and includes a contractual rent increase for Minerva Project, Inc. in October 2021 of $16,842. |
| (2) | Includes rent from Sutter Bay Hospitals who has vacated its space due to a reevaluation of its office requirements. The lease expires on January 31, 2025 and the tenant continues to pay rent on the space. |
| (3) | The One Trinity Center Property is 87.4% occupied as of June 15, 2021 and was underwritten to the implied economic vacancy of 13.8%. |
| (4) | The property manager is a borrower-affiliated company with a 10% fee. The management fee was underwritten at a market rate of 3% and the additional 7% is subordinate to the One Trinity Center Mortgage Loan. |
| (5) | The increase from the 3/31/2021 TTM NOI to the UW NOI is primarily due to a new lease representing $1,468,715 of underwritten rent being signed with the borrower-affiliated tenant, Trinity Management Services, which did not previously have a lease. Additionally, average rent over the remaining lease term for SF Health Service System, SF Law Library, and SF Retirement City and County was underwritten given the AA/Aa1/AA+ credit rating by Fitch, Moody’s and S&P. |
| (6) | Obtained from a third party market research report. This represents occupancy for the first quarter of 2021. |
| This is not a research report and was not prepared by any Underwriter’s research department. Please see additional important information and qualifications at the end of this Term Sheet. |
133
| Mortgage Loan No. 12 – Three Constitution Square |
| Mortgage Loan Information | Property Information | ||||||
| Mortgage Loan Seller: | BANA | Single Asset/Portfolio: | Single Asset | ||||
| Credit Assessment (DBRSM/Fitch/S&P): | AA(low)/BBB-sf/NR | Location: | Washington, D.C. 20002 | ||||
| Original Balance(1): | $38,000,000 | General Property Type: | Office | ||||
| Cut-off Date Balance(1): | $38,000,000 | Detailed Property Type: | CBD | ||||
| % of Initial Pool Balance: | 2.7% | Title Vesting: | Fee | ||||
| Loan Purpose: | Recapitalization | Year Built/Renovated: | 2013/NAP | ||||
| Borrower Sponsor: | MetLife, Inc. and Norges Bank Investment | Size: | 348,697 SF | ||||
| Management | Cut-off Date Balance Per SF(1): | $275.31 | |||||
| Guarantor(2): | ConSquare Office Three Owner, LLC | Maturity Date/ARD Balance Per SF(1): | $275.31 | ||||
| Mortgage Rate(3): | 2.5785% | Property Manager: | StonebridgeCarras Management, | ||||
| Note Date: | 5/14/2021 | LLC | |||||
| First Payment Date: | 7/1/2021 | ||||||
| Anticipated Repayment Date(3): | 5/1/2031 | ||||||
| Maturity Date(3): | 2/1/2032 | ||||||
| Original Term to Maturity/ARD(3): | 119 months | ||||||
| Original Amortization Term: | 0 months | ||||||
| IO Period: | 119 months | ||||||
| Seasoning: | 2 months | Underwriting and Financial Information(6) | |||||
| Prepayment Provisions: | L(26),D(86),O(7) | UW NOI: | $12,478,245 | ||||
| Lockbox/Cash Mgmt Status: | Hard/Springing | UW NOI Debt Yield(1): | 13.0% | ||||
| Additional Debt Type(1): | Pari Passu | UW NOI Debt Yield at Maturity/ARD (1): | 13.0% | ||||
| Additional Debt Balance(1): | $58,000,000 | UW NCF DSCR(1): | 4.94x | ||||
| Future Debt Permitted (Type)(4): | Yes (Mezzanine) | Most Recent NOI: | $13,279,246 (12/31/2020) | ||||
| 2nd Most Recent NOI: | $11,764,878 (12/31/2019) | ||||||
| 3rd Most Recent NOI: | NAV | ||||||
| Reserves(5) | Most Recent Occupancy: | 100.0% (8/1/2021) | |||||
| Type | Initial | Monthly | Cap | 2nd Most Recent Occupancy: | 100.0% (12/31/2020) | ||
| RE Taxes: | $0 | Springing | NAP | 3rd Most Recent Occupancy: | 100.0% (12/31/2019) | ||
| Insurance: | $0 | Springing | NAP | Appraised Value (as of) (7): | $222,000,000 (4/14/2021) | ||
| Replacement Reserve: | $0 | Springing | $174,349 | Appraised Value Per SF(7): | $636.66 | ||
| TI/LC Reserve: | $0 | Springing | (5) | Cut-off Date LTV Ratio(1)(7): | 43.2% | ||
| USDOJ Lump Sum Payment Reserve | $0 | Springing | NAP | Maturity Date/ARD LTV Ratio(1)(7): | 43.2% | ||
| Sources and Uses | ||||||
| Sources | Proceeds | % of Total | Uses | Proceeds | % of Total | |
| Whole Loan Amount(1): | $96,000,000 | 100.0% | Return of Equity(8): | $92,860,229 | 96.7% | |
| Closing Costs: | $3,139,771 | 3.3% | ||||
| Total Sources: | $96,000,000 | 100.0% | Total Uses: | $96,000,000 | 100.0% | |
| (1) | The Three Constitution Square Mortgage Loan (as defined below) is part of the Three Constitution Square Whole Loan (as defined below), which is evidenced by two pari passu promissory notes with an aggregate principal balance of $96,000,000. The Cut-off Date Balance Per SF, Maturity Date/ARD Balance Per SF, UW NCF DSCR, UW NOI Debt Yield, UW NOI Debt Yield at Maturity/ARD, Cut-off Date LTV Ratio and Maturity Date/ARD LTV Ratio numbers presented above are based on the Three Constitution Square Whole Loan. |
| (2) | There is no non-recourse carveout guarantor and no separate environmental indemnitor for the Three Constitution Square Whole Loan. While the borrower is obligated under the non-recourse carveout provisions, no separate guaranty was executed by the borrower. |
| (3) | The Three Constitution Square Whole Loan has an initial term of 119 months to the anticipated repayment date (“ARD”) of May 1, 2031, with a final maturity date of February 1, 2032. Prior to the ARD, the Three Constitution Square Whole Loan will accrue interest at a rate equal to the Initial Interest Rate (as defined below). From and after the ARD until the outstanding principal balance of the Three Constitution Square Whole Loan has been paid in full, or until the final maturity date on February 1, 2032, whichever event occurs first, the Three Constitution Square Whole Loan will accrue interest at a rate equal to the Extension Rate (as defined below), and all excess cash flow from the Three Constitution Square Whole Loan will be collected by the lender (see “The Mortgage Loan” below). |
| (4) | The holders of the direct or indirect equity interests in the borrower are permitted to incur future mezzanine debt secured by a pledge of 100% of such equity interests in the borrower (a “Three Constitution Square Permitted Future Mezzanine Loan”); provided that, among other conditions: (i) no event of default has occurred and is continuing; (ii) the aggregate loan-to-value ratio of the Three Constitution Square Whole Loan and the Three Constitution Square Permitted Future Mezzanine Loan (collectively, the “Three Constitution Square Total Debt”) is less than or equal to 43.24%; (iii) the aggregate debt yield of the Three Constitution Square Total Debt is at least 11.86%; (iv) the term of the Three Constitution Square Permitted Future Mezzanine Loan is at least co-terminous with the term of the Three Constitution Square Whole Loan; (v) an intercreditor agreement is executed that is reasonably acceptable to the lender and acceptable to the rating agencies rating securities backed by the Three Constitution Square Whole Loan; and (vi) a rating agency confirmation is delivered by each rating agency rating securities backed by the Three Constitution Square Whole Loan. |
| (5) | During a Cash Sweep Period the borrower is required to deposit (i) monthly real estate taxes, (ii) monthly insurance premiums, (iii) $7,264.52 monthly for replacements, subject to a cap of $174,348.50, (iv) $29,058.08 monthly for tenant improvements and leasing commissions, subject to a cap of $50 per available rentable square feet at the Three Constitution Property (as defined below). Borrower is required to deposit, within five business days of receipt, any lump sum payment received in connection with the USDOJ’s exercise of its right to repay the remaining unpaid amortized portion of the tenant improvement allowance in the USDOJ Lump Sum Payment Reserve. The borrower is permitted to provide a letter of credit in lieu of the cash reserves. A “Cash Sweep Period” will occur during (i) an event of default, (ii) a bankruptcy or insolvency of the borrower, (iii) a failure to repay the Three Constitution Whole Loan in full on or before the ARD, (iv) the debt yield being less than 7.5% for two consecutive calendar quarters and (v) a Lease Sweep Period. A “Lease Sweep Period” will occur during (i) USDOJ (as defined below) terminating its lease or giving notice to terminate, (ii) USDOJ defaults under its lease, (iii) USDOJ goes dark in more than 25% of its space, (iv) bankruptcy or insolvency action of the USDOJ and (v) 24 months prior to USDOJ’s lease expiration date. |
| (6) | The novel coronavirus pandemic is an evolving situation and could impact the Three Constitution Square Whole Loan more severely than assumed in the underwriting of the Three Constitution Square Whole Loan. The pandemic and resulting economic disruption could also adversely affect the NOI, NCF and occupancy information, as well as the appraised value and DSCR, LTV and Debt Yield metrics presented above and herein. See “Risk Factors—Risks Related to Market Conditions and Other External Factors—The Coronavirus Pandemic Has Adversely Affected the Global Economy and Will Likely Adversely Affect the Performance of the Mortgage Loans” in the prospectus. |
| This is not a research report and was not prepared by any Underwriter’s research department. Please see additional important information and qualifications at the end of this Term Sheet. |
134
| Office - CBD | Loan #12 | Cut-off Date Balance: | $38,000,000 | |
| 175 N Street Northeast | Three Constitution Square | Cut-off Date LTV: | 43.2% | |
| Washington, D.C. 20002 | UW NCF DSCR: | 4.94x | ||
| UW NOI Debt Yield: | 13.0% |
| (7) | The appraisal also provided a “Hypothetical As If Dark” value of $134,000,000 as of April 14, 2021, which value would result in an Appraised Value Per SF, Cut-off Date LTV Ratio and Maturity Date/ARD LTV Ratio of $384.29, 71.6% and 71.6%, respectively, based on the principal balance of the Three Constitution Square Whole Loan. |
| (8) | The borrower sponsors of the Three Constitution Square Whole Loan acquired the Three Constitution Square Property and the adjacent development parcel in January 2016 for approximate acquisition and development cost of $462.0 million. |
The Mortgage Loan. The twelfth largest mortgage loan (the “Three Constitution Square Mortgage Loan”) is part of a whole loan (the “Three Constitution Square Whole Loan”) evidenced by two pari passu senior promissory notes in the aggregate original principal amount of $96,000,000. The Three Constitution Square Whole Loan is secured by a first priority fee mortgage encumbering a 348,697 SF office building located in Washington, D.C. (the “Three Constitution Square Property”). The Three Constitution Square Mortgage Loan is evidenced by Note A-2 with an original principal amount of $38,000,000. The controlling Note A-1 was contributed to the BANK 2021-BNK34 securitization trust. The Three Constitution Square Whole Loan is being serviced pursuant to the pooling and servicing agreement for the BANK 2021-BNK34 securitization trust. See “Description of the Mortgage Pool—The Whole Loans”, “—The Non-Serviced Pari Passu Whole Loans”, and “Pooling and Servicing Agreement” in the prospectus.
The Three Constitution Square Whole Loan has an initial term of 119 months to an anticipated repayment date (“ARD”) of May 1, 2031. Prior to the ARD, the Three Constitution Square Whole Loan will accrue interest at a rate equal to 2.5785% (the “Initial Interest Rate”). From and after the ARD until the outstanding principal balance of the Three Constitution Square Whole Loan and all accrued interest has been paid in full, or until the final maturity date of February 1, 2032, whichever event occurs first, the Three Constitution Square Whole Loan will accrue interest at a rate equal to 2.50% plus the Initial Interest Rate (the “Extension Rate”), and all excess cash flow from the Three Constitution Square Property will be collected by the lender and applied to reduce the principal balance of the Three Constitution Square Whole Loan until the entire outstanding principal balance is paid in full, and then, to pay any additional interest on the Three Constitution Square Whole Loan that has accrued at the excess of the Extension Rate over the Initial Interest Rate and has been deferred until repayment of the Three Constitution Square Whole Loan.
| Three Constitution Square Whole Loan Summary | ||||
| Note | Original Balance | Cut-off Date Balance | Note Holder | Controlling Piece |
| A-1 | $58,000,000 | $58,000,000 | BANK 2021-BNK34 | Yes |
| A-2 | $38,000,000 | $38,000,000 | BANK 2021-BNK35 | No |
| Total | $96,000,000 | $96,000,000 | ||
The Borrower and the Borrower Sponsors. The borrower is ConSquare Office Three Owner, LLC, a Delaware limited liability company structured to be bankruptcy-remote with at least two independent directors.
The borrower sponsors are MetLife, Inc. (“MetLife”) and Norges Bank Investment Management (“NBIM”), who are also the borrower sponsors for the Four Constitution Square Whole Loan. There is no non-recourse guarantor and no separate environmental indemnitor for the Three Constitution Square Whole Loan.
MetLife is a global leader in real estate investments. MetLife Investment Management (“MIM”) has been involved in the real estate business since 1878 as a mortgage lender, developer and owner. As of September 30, 2020, MIM’s real estate platform managed a portfolio of approximately $104 billion invested in real estate products including commercial mortgages and equities.
NBIM manages the Norwegian Government Pension Fund Global, which is invested in international equity, fixed-income markets, and real estate. As of September 30, 2020, NBIM manages assets worth approximately $1.3 trillion, of which approximately $34.5 billion is invested in unlisted real estate.
MetLife and NBIM established a partnership in 2013, with a focus on office assets located in major market central business districts throughout the United States. As of September 30, 2020, the joint venture has invested in six Class A office buildings located in Boston, San Francisco and Washington, D.C.
The Property. The Three Constitution Square Property is a 348,697 SF, 12-story, Class A, LEED Platinum office building with a ground floor retail component. The Three Constitution Square Property was built in 2013 on a 0.99-acre site, within the larger Constitution Square development in the NoMa area of Washington, D.C. Constitution Square is a 2.5 million SF mixed-use development consisting of four Class A office buildings, a 440-unit multifamily property, a 50,000 SF Harris Teeter grocery store and a 204-room Hilton Garden Inn.
The Three Constitution Square Property features a 3-level subterranean parking garage that includes 250 parking spaces (0.72 spaces per 1,000 SF), a fitness center, tenant lounge, rooftop terrace, landscaped interior courtyards, and food service.
The Three Constitution Square Property is 100% leased, with 99.0% of the net rentable area leased to the United States General Services Administration (“GSA”) for use by the US Department of Justice (“USDOJ”). On the first floor, the Three Constitution Square Property is connected to the adjacent Four Constitution Square (which secures the Four Constitution Square Whole Loan), which was built-to-suit for the USDOJ. The USDOJ also leases the majority of the net rentable area at Two Constitution Square, as part of a consolidation of its office space into the Constitution Square development.
The remaining 1.0% of net rentable area at the Three Constitution Square Property is comprised of 3,317 square feet of retail space, currently leased to DVA Federal Credit Union and Dunkin’ Donuts.
| This is not a research report and was not prepared by any Underwriter’s research department. Please see additional important information and qualifications at the end of this Term Sheet. |
135
| Office - CBD | Loan #12 | Cut-off Date Balance: | $38,000,000 | |
| 175 N Street Northeast | Three Constitution Square | Cut-off Date LTV: | 43.2% | |
| Washington, D.C. 20002 | UW NCF DSCR: | 4.94x | ||
| UW NOI Debt Yield: | 13.0% |
Major Tenant.
USDOJ (345,380 SF, 99.0% of NRA; 99.1% of underwritten base rent). The USDOJ (Fitch/Moody’s/S&P: AAA/Aaa/AA+) is a federal executive department of the United States government responsible for the enforcement of the law and administration of justice. Several federal law enforcement agencies are administered by the USDOJ including the Federal Bureau of Investigation and the Drug Enforcement Administration. The department is headed by the Attorney General and employs over 115,000 attorneys, correctional officers, agents and others. The USDOJ is headquartered approximately 2 miles from the Three Constitution Square Property at the Robert F. Kennedy Department of Justice Building, near the National Mall.
The USDOJ’s 15-year lease commenced on February 11, 2017 and expires on February 10, 2032. The lease requires current annual rent of $49.25 PSF and remains flat through the lease term. The USDOJ lease does not contain extension or termination options. The USDOJ has received a tenant improvement allowance of $14,199,846, which is repaid monthly over the Three Constitution Square Whole Loan term as additional rent in the amount of $78,888.03 ($2.74 PSF annually) (“the USDOJ Amortized TI Rent Amount”) and Building Specific Amortized Capital of $11,937,703, which is repaid monthly over the Three Constitution Square Whole Loan term as additional rent in the amount of $66,320.57 ($2.30 PSF annually). In addition, the USDOJ received an additional cash allowance equal to $27,024,408.35, which was used to fund various design costs and improvements to the premises. The USDOJ reportedly invested an additional $7.0 million toward the improvement of its office space.
The following table presents certain information relating to the tenancy at the Three Constitution Square Property:
| Tenant Summary(1) | |||||||||
| Tenant Name | Credit Rating (Fitch/Moody’s/ S&P)(2) | Tenant SF | Approx % of SF | Annual UW Rent(3) | % of Total Annual UW Rent | Annual UW Rent PSF(3) | Lease Expiration | Renewal Options | Term. Options (Y/N) |
| Office | |||||||||
| USDOJ | AAA/Aaa/AA+ | 345,380 | 99.0% | $17,010,589 | 99.1% | $49.25 | 2/10/2032 | N | N |
| Retail | |||||||||
| DVA Federal Credit Union | NR/NR/NR | 1,880 | 0.5% | $86,649 | 0.5% | $46.09 | 6/30/2026 | 1, 5 year | N |
| Dunkin’ | NR/NR/NR | 1,437 | 0.4% | $71,132 | 0.4% | $49.50 | 12/31/2024 | 2, 5 years | N |
| Retail Subtotal | 3,317 | 1.0% | $157,781 | 0.9% | $47.57 | ||||
| Total/Wtd. Avg. | 348,697 | 100.0% | $17,168,370 | 100.0% | $49.24 | ||||
| (1) | Information based on the underwritten rent roll. |
| (2) | Certain ratings are those of the parent company or government whether or not the parent company or government guarantees the lease. |
| (3) | Annual UW Rent PSF and Annual UW Rent for the USDOJ includes the USDOJ Amortized TI Rent Amount. |
The following table presents certain information relating to the lease rollover schedule at the Three Constitution Square Property:
| Lease Rollover Schedule(1)(2) | ||||||||
| Year | # of Leases Rolling | SF Rolling | UW Rent PSF Rolling | Approx. % of Total SF Rolling | Approx. Cumulative % of SF Rolling | Total UW Rent Rolling | Approx. % of Total Rent Rolling | Approx. Cumulative % of Total Rent Rolling |
| MTM | 0 | 0 | $0.00 | 0.0% | 0.0% | $0 | 0.0% | 0.0% |
| 2021 | 0 | 0 | $0.00 | 0.0% | 0.0% | $0 | 0.0% | 0.0% |
| 2022 | 0 | 0 | $0.00 | 0.0% | 0.0% | $0 | 0.0% | 0.0% |
| 2023 | 0 | 0 | $0.00 | 0.0% | 0.0% | $0 | 0.0% | 0.0% |
| 2024 | 1 | 1,437 | $49.50 | 0.4% | 0.4% | $71,132 | 0.4% | 0.4% |
| 2025 | 0 | 0 | $0.00 | 0.0% | 0.4% | $0 | 0.0% | 0.4% |
| 2026 | 1 | 1,880 | $46.09 | 0.5% | 1.0% | $86,649 | 0.5% | 0.9% |
| 2027 | 0 | 0 | $0.00 | 0.0% | 1.0% | $0 | 0.0% | 0.9% |
| 2028 | 0 | 0 | $0.00 | 0.0% | 1.0% | $0 | 0.0% | 0.9% |
| 2029 | 0 | 0 | $0.00 | 0.0% | 1.0% | $0 | 0.0% | 0.9% |
| 2030 | 0 | 0 | $0.00 | 0.0% | 1.0% | $0 | 0.0% | 0.9% |
| 2031 & Beyond | 1 | 345,380 | $49.25 | 99.0% | 100.0% | $17,010,589 | 99.1% | 100.0% |
| Vacant | 0 | 0 | $0.00 | 0.0% | 100.0% | $0 | 0.0% | 100.0% |
| Total/Wtd. Avg. | 3 | 348,697 | $49.24 | 100.0% | $17,168,370 | 100.0% | ||
| (1) | Information is based on the underwritten rent roll. |
| (2) | Certain tenants may have lease termination options that are exercisable prior to the originally stated expiration date of the subject lease and that are not considered in this Lease Rollover Schedule. |
| This is not a research report and was not prepared by any Underwriter’s research department. Please see additional important information and qualifications at the end of this Term Sheet. |
136
| Office - CBD | Loan #12 | Cut-off Date Balance: | $38,000,000 | |
| 175 N Street Northeast | Three Constitution Square | Cut-off Date LTV: | 43.2% | |
| Washington, D.C. 20002 | UW NCF DSCR: | 4.94x | ||
| UW NOI Debt Yield: | 13.0% |
COVID-19 Update. The Three Constitution Square Whole Loan is current on its debt service payments and, as of July 5, 2021, the Three Constitution Square Whole Loan is not subject to any forbearance, modification or debt service relief request. As of July 5, 2021, the borrower sponsors have reported that 100% of tenants by net rentable area and 99.8% of tenants by underwritten base rent have paid their June 2021 rent payments.
The Market. The Three Constitution Square Property is located at 175 N Street Northeast, in Washington, D.C.’s NoMa district, part of the core downtown area of the city. According to the appraisal, NoMA has transitioned from a predominantly industrial area to a mixed-use neighborhood containing new office buildings, multifamily residential buildings and street-level retail with open space/parks abutting Union Station’s rail yard. A critical mass of government offices continue to be the primary driver for office demand in the area. Federal agencies with a significant presence in the area include the USDOJ, the Bureau of Alcohol Tobacco and Firearms and the Federal Energy Regulatory Commission. The Three Constitution Square Property is also proximate to the U.S. Capitol, Supreme Court, Securities and Exchange Commission headquarters and the Federal Communications Commission headquarters.
The Three Constitution Square Property is immediately adjacent to the NoMa-Gallaudet Metrorail Station, connecting the downtown area with suburban Montgomery County, Maryland. Prior to the COVID-19 pandemic, the NoMa/Gallaudet Station saw an average of 10,179 weekday riders.
Over the past 10 years, the NoMa office submarket inventory has increased by 23.4%, from 9.9 million square feet to 12.2 million square feet, with 3.1 million square feet of positive absorption and an increase in average asking rate from $46.55 PSF to $50.75 PSF. As of the first quarter of 2021, the NoMa submarket had a vacancy rate of 6.2%, up slightly from the year-end 2020 vacancy of 5.5%, but well below the Washington D.C. office market vacancy of 13.1%, and the lowest of all Washington D.C. submarkets.
According to the appraisal, the estimated 2020 population within a one, three and five-mile radius was 68,138, 397,057 and 800,152, respectively, and the estimated 2020 average household income within the same radii was $137,477, $133,654 and $125,922, respectively.
The following table presents certain information relating to the appraiser’s market rent conclusions for the Three Constitution Square Property:
| Market Rent Summary | ||
| GSA Office | Retail | |
| Market Rent (PSF) | $50.00 Gross | $49.50 Net |
| Lease Term (Yrs.) | 10 | 10 |
| Rent Increase Projection | Flat | 3% per annum |
The following table presents recent comparable office sales data with respect to the Three Constitution Square Property:
| Comparable Office Sales | |||||||
| Property/Location | Submarket | Year Built/Renovated | Total NRA (SF) / Stories | Occupancy | Date of Sale | Sale Price / PSF | Cap Rate |
99 M 99 M Street SE | Capitol Riverfront | 2018 / NAP | 234,676 / 11 | 88% | Jan-20 | $170,000,000 / $724 | 5.20% |
One Constitution Square 1275 1st Street NE | NoMa | 2010 / NAP | 345,699 / 12 | 79% | Sept-19 | $189,886,408 / $549 | 5.59% |
Union Center Plaza 3 830 1st Street NE | NoMa | 2001 / NAP | 247,337 / 11 | 100% | Mar-19 | $116,550,000 / $471 | 6.35% |
Sentinel Square II 1050 1st Street NE | NoMa | 2013 / NAP | 289,524 / 12 | 94% | Dec-17 | $165,900,000 / $573 | 5.40% |
Two Independence Square 300 E Street SW | Southwest | 1991 / 2013 | 605,897 / 9 | 100% | Jul-17 | $359,600,000 / $594 | 5.44% |
Source: Appraisal.
| This is not a research report and was not prepared by any Underwriter’s research department. Please see additional important information and qualifications at the end of this Term Sheet. |
137
| Office - CBD | Loan #12 | Cut-off Date Balance: | $38,000,000 | |
| 175 N Street Northeast | Three Constitution Square | Cut-off Date LTV: | 43.2% | |
| Washington, D.C. 20002 | UW NCF DSCR: | 4.94x | ||
| UW NOI Debt Yield: | 13.0% |
The following table presents recent office leasing data at comparable properties with respect to the Three Constitution Square Property:
| Comparable GSA Office Leases | ||||||||
| Property Address | Submarket | Year Built | Total NRA (SF) / Stories | GSA Tenant | Lease Date / Term (yrs) | Lease Size (SF) | Initial Rent PSF | Rent PSF per annum /TI PSF |
Three Constitution Square 175 N Street Northeast | NoMa | 2013 | 348,697 / 12 | USDOJ | Feb-17 / 15.0 | 345,380 | $49.24(1) | Flat / $41.11(2) |
L’Enfant Plaza North 955 L’Enfant Plaza SW | Southwest | 1969 | 299,476 / 8 | FAA (renewal) | Jan-21 / 15.0 | 65,734 | $48.15 | (3) / $0.00 |
L’Enfant Plaza North 955 L’Enfant Plaza SW | Southwest | 1969 | 299,476 / 8 | NTSB (renewal) | Nov-20 / 5.0 | 159,870 | $49.00 | Flat / $0.00 |
Station Place 100 F Street NE | NoMa | 2005 | 712,851 / 10 | Securities and Exchange Commission (extension) | Mar-19 / 4.4 | 712,851 | $42.70 | Flat / $0.00 |
National Square 500 D Street SW | Southwest | 2016 | 348,173 / 12 | Agency for International Development | Mar-18 / 20.0 | 348,173 | $49.75 | Flat / $80.00 |
The Portals II 445 12th SW | Southwest | 1997 | 602,350 / 8 | Pension Benefit Guaranty Corporation | Dec-17 / 15.0 | 431,785 | $49.00 | Flat / $71.74 |
One Constitution Square 1275 1st Street NE | NoMa | 2010 | 400,000 / 12 | Peace Corps | Nov-17 / 15.0 | 173,000 | $51.00 | Flat / $46.74 |
Sentinel Square III 45 L Street NE | NoMa | 2019 | 545,823 / 11 | Federal Communications Commission | Dec-16 / 15.0 | 473,000 | $48.00 | Flat / $60.00 |
Union Center Plaza, Phase 4 888 1st Street NE | NoMa | 1995 | 509,397 / 11 | Federal Energy Regulatory Commission | Jul-15 / 10.0 | 503,997 | $49.95 | Flat / $15.00 |
Source: Appraisal.
| (1) | Information obtained from the underwritten rent roll. |
| (2) | The USDOJ received a tenant improvement allowance of $14,199,846 ($41.11 PSF), which is repaid monthly over the Three Constitution Square Whole Loan term as additional rent in the amount equal to the USDOJ Amortized TI Rent Amount and Building Specific Amortized Capital of $11,937,703, which is repaid monthly over the Three Constitution Square Whole Loan term as additional rent in the amount of $66,320.57 ($2.30 PSF annually). In addition, the USDOJ received an additional cash allowance equal to $27,024,408.35, which was used to fund various design costs and improvements to the premises. |
| (3) | Rent increases in years 6 and 11 of the lease term. |
Operating History and Underwritten Net Cash Flow. The following table presents certain information relating to the historical operating performance and Underwritten Net Cash Flow at the Three Constitution Square Property:
| Cash Flow Analysis | |||||||||
| 2019 | 2020 | UW | UW PSF | ||||||
| Gross Potential Rent(1) | $15,713,031 | $17,165,847 | $17,168,370 | $49.24 | |||||
| Expense Reimbursement | $256,650 | $579,575 | $582,698 | $1.67 | |||||
| Other Income(2) | $819,790 | $822,195 | $842,476 | $2.42 | |||||
| Vacancy | $0 | $0 | ($443,777) | ($1.27) | |||||
| Effective Gross Income | $16,789,471 | $18,567,617 | $18,149,768 | $52.05 | |||||
| Taxes | $2,504,653 | $2,694,525 | $2,843,809 | $8.16 | |||||
| Insurance | $78,270 | $115,452 | $96,799 | $0.28 | |||||
| Other Operating Expenses | $2,441,670 | $2,478,394 | $2,730,915 | $7.83 | |||||
| Total Operating Expenses | $5,024,593 | $5,288,371 | $5,671,523 | $16.26 | |||||
| Net Operating Income | $11,764,878 | $13,279,246 | $12,478,245 | $35.79 | |||||
| TI/LC | $0 | $0 | $0 | $0.00 | |||||
| Capital Expenditures | $0 | $0 | $87,174 | $0.25 | |||||
| Net Cash Flow | $11,764,878 | $13,279,246 | $12,391,070 | $35.54 | |||||
| Occupancy% | 100.0% | 100.0% | 97.5%(3) | ||||||
| NOI DSCR(4) | 4.69x | 5.29x | 4.97x | ||||||
| NCF DSCR(4) | 4.69x | 5.29x | 4.94x | ||||||
| NOI Debt Yield(4) | 12.3% | 13.8% | 13.0% | ||||||
| NCF Debt Yield(4) | 12.3% | 13.8% | 12.9% | ||||||
| (1) | UW Gross Potential Rent includes the USDOJ Amortized TI Rent Amount. |
| (2) | UW Other Income includes parking income of $784,476. Parking at the Three Constitution Square Property is 100% leased to the USDOJ. |
| (3) | The Three Constitution Square Property is 100.0% occupied as of August 1, 2021. |
| (4) | Debt service coverage ratios and debt yields are based on the Three Constitution Square Whole Loan. |
| This is not a research report and was not prepared by any Underwriter’s research department. Please see additional important information and qualifications at the end of this Term Sheet. |
138
(THIS PAGE INTENTIONALLY LEFT BLANK)
| This is not a research report and was not prepared by any Underwriter’s research department. Please see additional important information and qualifications at the end of this Term Sheet. |
139
| Mortgage Loan No. 13 – Northeast Self Storage Portfolio |
| Mortgage Loan Information | Property Information | |||||
| Mortgage Loan Seller: | MSMCH | Single Asset/Portfolio: | Portfolio | |||
| Credit Assessment (DBRSM/Fitch/S&P): | NR/NR/NR | Location: | Various | |||
| Original Balance: | $35,500,000 | General Property Type: | Self Storage | |||
| Cut-off Date Balance: | $35,500,000 | Detailed Property Type: | Self Storage | |||
| % of Initial Pool Balance: | 2.5% | Title Vesting: | Fee | |||
| Loan Purpose: | Refinance | Year Built/Renovated: | Various / NAP | |||
| Borrower Sponsor: | Lawrence Charles Kaplan | Size: | 511,812 SF | |||
| Guarantor: | Lawrence Charles Kaplan | Cut-off Date Balance per SF: | $69.36 | |||
| Mortgage Rate: | 2.9450% | Maturity or ARD Date Balance per SF: | $69.36 | |||
| Note Date: | 6/30/2021 | Property Manager: | Storage Asset Management, | |||
| First Payment Date: | 8/1/2021 | LLC (borrower related) | ||||
| Maturity Date: | 7/1/2031 | |||||
| Original Term to Maturity: | 120 months | |||||
| Original Amortization Term: | 0 months | |||||
| IO Period: | 120 months | |||||
| Seasoning: | 1 month | Underwriting and Financial Information(1) | ||||
| Prepayment Provisions: | L(25),D(90),O(5) | UW NOI: | $3,560,210 | |||
| Lockbox/Cash Mgmt Status: | Springing/Springing | UW NOI Debt Yield: | 10.0% | |||
| Additional Debt Type: | No | UW NOI Debt Yield at Maturity: | 10.0% | |||
| Additional Debt Balance: | NAP | UW NCF DSCR: | 3.31x | |||
| Future Debt Permitted (Type): | No (NAP) | Most Recent NOI: | $3,614,753 (3/31/2021 TTM) | |||
| Reserves | 2nd Most Recent NOI: | $3,547,993 (12/31/2020) | ||||
| Type | Initial | Monthly | Cap | 3rd Most Recent NOI: | $2,967,625 (12/31/2019) | |
| RE Tax: | $107,994 | $53,997 | NAP | Most Recent Occupancy: | 92.6% (5/17/2021) | |
| Insurance: | $44,173 | $5,488 | NAP | 2nd Most Recent Occupancy(2): | NAP | |
| Deferred Maintenance: | $67,439 | $0 | NAP | 3rd Most Recent Occupancy(2): | NAP | |
| Recurring Replacements: | $0 | $4,514 | NAP | Appraised Value (as of): | $60,290,000 | |
| Appraised Value per SF: | $117.80 | |||||
| Cut-off Date LTV Ratio: | 58.9% | |||||
| Maturity Date LTV Ratio: | 58.9% | |||||
| Sources and Uses | ||||||
| Sources | Proceeds | % of Total | Uses | Proceeds | % of Total | |
| Mortgage Loan Amount: | $35,500,000 | 100.0% | Loan Payoff: | $33,476,880 | 94.3% | |
| Return of Equity: | 236,922 | 0.7% | ||||
| Closing Costs: | $1,566,592 | 4.4% | ||||
| Upfront Reserves: | $219,606 | 0.6% | ||||
| Total Sources: | $35,500,000 | 100.0% | Total Uses: | $35,500,000 | 100.0% | |
| (1) | The novel coronavirus pandemic is an evolving situation and could impact the Northeast Self Storage Portfolio Mortgage Loan more severely than assumed in the underwriting of the Northeast Self Storage Portfolio Mortgage Loan and could adversely affect the NOI, NCF and occupancy information, as well as the appraised value and the DSCR, LTV and Debt Yield metrics presented above and herein. See “Risk Factors—Risks Related to Market Conditions and Other External Factors—The Coronavirus Pandemic Has Adversely Affected the Global Economy and Will Likely Adversely Affect the Performance of the Mortgage Loans” in the prospectus. |
| (2) | Historical occupancy is not available due to a change of property manager on December 14, 2020. |
The Mortgage Loan. The thirteenth largest mortgage loan (the “Northeast Self Storage Portfolio Mortgage Loan”) is evidenced by a promissory note in the original principal balance of $35,500,000, secured by the fee interests in a portfolio of nine self-storage properties located across six states and totaling 511,812 SF (the “Northeast Self Storage Portfolio Properties”).
The Borrowers and the Borrower Sponsor. The borrowers are Curcio PA. Delmar Drive, LLC, Curcio CT, Chesire, LLC, Curcio KY. 1030, LLC, Curcio KY. 1040, LLC, Curcio KY. 1070, LLC, Curcio NJ, Cape May Courthouse, LLC, Curcio NJ, Hammonton, LLC, Curcio NJ, North Cape May, LLC, Curcio NY, Dolsontown Road, LLC, Curcio NY, Voorheesville, LLC, Curcio OH, Mentor, LLC, each a Delaware limited liability company structured to be bankruptcy-remote with at least one independent director. The borrower sponsor and nonrecourse carve-out guarantor is Lawrence Charles Kaplan. Lawrence Charles Kaplan is the managing partner of Fulton Realty Capital, which is a real estate investment company focused on core and value-add properties in the self-storage, multifamily and commercial sectors. Mr. Kaplan sits on the board of Storage Asset Management, LLC, the property manager of the Northeast Self Storage Portfolio Properties. The borrowers are 100% owned by Curcio Self-Storage Holdings LLC, of which the managers are Lawrence Charles Kaplan, Joseph Curcio, Anne Curcio, Jodi Genovese and Dana Mancuso. Curcio Self-Storage Holdings LLC is indirectly owned 54.9% by the Anne G. Curcio Trust, 22.6% by the Jodi Anne Genovese Trust and 22.6% by the Dana Mary Mancuso Trust. Mr. Kaplan does not have an ownership interest in the borrowers.
| This is not a research report and was not prepared by any Underwriter’s research department. Please see additional important information and qualifications at the end of this Term Sheet. |
140
| Self Storage – Self Storage | Loan #13 | Cut-off Date Balance: | $35,500,000 | |
| Property Addresses - Various | Northeast Self Storage Portfolio | Cut-off Date LTV: | 58.9% | |
| U/W NCF DSCR: | 3.31x | |||
| U/W NOI Debt Yield: | 10.0% |
The non-recourse carveout guarantor is also a non-recourse carveout guarantor with respect to the Hi-Park Campus mortgage loan, the Storage Sense - Easton mortgage loan and the Springfield Storage Depot Self Storage – Springfield, OH mortgage loan, which are also included in the BANK 2021-BNK35 securitization.
The Properties. The Northeast Self Storage Portfolio Properties are comprised of nine properties situated on 52.6 acres, containing a total of 2,552 traditional storage units, 753 climate controlled self storage units, 225 RV/Boat parking spaces, 70 commercial storage units, three office units and three apartment units. The Northeast Self Storage Portfolio Properties units range in size from approximately 15 SF to 1,500 SF and are managed by Storage Asset Management, LLC. The Northeast Self Storage Portfolio Properties are located in nine different cities across six states. The greatest concentration of Northeast Self Storage Portfolio Properties is located in New Jersey (three properties, 26.0% of SF) and New York (two properties, 10.2% of SF), with the remaining four properties (63.7% of SF) located across four different states. The Northeast Self Storage Portfolio Properties were built between 1988 and 2009. The weighted average occupancy for the Northeast Self Storage Portfolio Properties was 92.6% by SF, as of May 17, 2021. The Northeast Self Storage Properties have the right to use the “Storage Sense” name, a brand of the property manager, pursuant to the property management agreements. A release of one or more of the Northeast Self Storage Portfolio Properties is permitted subject to the limitations and conditions described under “Description of the Mortgage Pool—Certain Terms of the Mortgage Loans—Releases; Partial Releases; Property Additions” in the prospectus.
The following table presents detailed information with respect to each of the Northeast Self Storage Portfolio Properties.
| Northeast Self Storage Portfolio Properties Summary | ||||||||
| Property Name | City, State | SF | Total Units Storage / Parking | Allocated Loan Amount (“ALA”) | % of ALA | Appraised Value | % of Appraised Value | |
| Storage Sense - Nicholasville | Nicholasville, KY | 155,386 | 453 / 140 | 8,800,000 | 24.8% | $15,400,000 | 25.5% | |
| Storage Sense - Folcroft | Folcroft, PA | 45,400 | 392 / 0 | 4,650,000 | 13.1% | $7,840,000 | 13.0% | |
| Storage Sense - Cheshire | Cheshire, CT | 62,865 | 426 / 0 | 4,400,000 | 12.4% | $7,260,000 | 12.0% | |
| Storage Sense - Cape May Courthouse | Cape May Court House, NJ | 43,050 | 397 / 22 | 3,850,000 | 10.8% | $6,400,000 | 10.6% | |
| Storage Sense - Hammonton | Hammonton, NJ | 58,075 | 387 / 39 | 3,750,000 | 10.6% | $6,710,000 | 11.1% | |
| Storage Sense - Mentor | Mentor, OH | 62,550 | 453 / 0 | 3,700,000 | 10.4% | $6,080,000 | 10.1% | |
| Storage Sense - North Cape May | North Cape May, NJ | 32,175 | 333 / 7 | 2,800,000 | 7.9% | $4,600,000 | 7.6% | |
| Storage Sense - Middletown | Middletown, NY | 25,000 | 234 / 0 | 1,850,000 | 5.2% | $3,040,000 | 5.0% | |
| Storage Sense - Voorheesville | Voorheesville, NY | 27,311 | 230 / 17 | 1,700,000 | 4.8% | $2,960,000 | 4.9% | |
| Total | 511,812 | 3,530 | $35,500,000 | 100.0% | $60,290,000 | 100.0% | ||
The following table presents detailed information with respect to the individual performance of the Northeast Self Storage Portfolio Properties.
| Northeast Self Storage Portfolio Performance Summary | |||||
| Property Name | Total Units Storage/ Parking/ Commercial, Apartment & Office | Year Built | Occupancy(1)(2) | UW NOI | % UW NOI |
| Storage Sense - Nicholasville | 453 / 140 / 74 | 1994, 2003, 2009 | 87.0% | $848,405 | 23.8% |
| Storage Sense - Folcroft | 392 / 0 / 0 | 2006 | 90.1% | $464,383 | 13.0% |
| Storage Sense - Cheshire | 426 / 0 / 0 | 2002 | 96.4% | $441,843 | 12.4% |
| Storage Sense - Cape May Courthouse | 397 / 22 / 1 | 1997 | 99.3% | $397,634 | 11.2% |
| Storage Sense - Hammonton | 387 / 39 / 1 | 2007 | 97.2% | $363,711 | 10.2% |
| Storage Sense - Mentor | 453 / 0 / 0 | 2007 | 94.1% | $371,079 | 10.4% |
| Storage Sense - North Cape May | 333 / 7 / 0 | 1991 | 99.8% | $312,620 | 8.8% |
| Storage Sense - Middletown | 234 / 0 / 0 | 1988 | 89.8% | $189,471 | 5.3% |
| Storage Sense - Voorheesville | 230 / 17 / 0 | 1995 | 89.9% | $ 171,065 | 4.8% |
| Total / Wtd. Avg. | 3,606 | 92.6% | $3,560,210 | 100.0% | |
| (1) | Occupancy is as of May 17, 2021. |
| (2) | Occupancy is based on SF. |
| This is not a research report and was not prepared by any Underwriter’s research department. Please see additional important information and qualifications at the end of this Term Sheet. |
141
| Self Storage – Self Storage | Loan #13 | Cut-off Date Balance: | $35,500,000 | |
| Property Addresses - Various | Northeast Self Storage Portfolio | Cut-off Date LTV: | 58.9% | |
| U/W NCF DSCR: | 3.31x | |||
| U/W NOI Debt Yield: | 10.0% |
The Markets.
The following table presents detailed information for the Northeast Self Storage Portfolio Properties by state.
| Northeast Self Storage Portfolio State Summary | ||||||||||||
| Property State | Property Count | Total SF | % SF | Total Units Storage/ Parking/ Commercial, Apartment & Office | % Climate Controlled(1) | Occupancy(2) | Wtd. Avg. GPR PSF | UW NOI | % UW NOI | Appraisal Concluded Vacancy | Non-Climate Controlled Market Rent | Climate Controlled Market Rent |
| New Jersey | 3 | 133,300 | 26.0% | 1,117 / 68 / 2 | 13.9% | 98.5% | $14.91 | $1,073,965 | 30.2% | 13.5% | $136.64 | $159.38 |
| New York | 2 | 52,311 | 10.2% | 464 / 17 / 0 | 2.0% | 89.8% | $14.37 | $360,535 | 10.1% | 15.5% | $99.82 | $127.00 |
| Kentucky | 1 | 155,386 | 30.4% | 453 / 140 / 74 | 7.3% | 87.0% | $9.70 | $848,405 | 23.8% | 17.6% | $90.15 | $141.98 |
| Connecticut | 1 | 62,865 | 12.3% | 426 / 0 / 0 | 30.5% | 96.4% | $13.55 | $441,843 | 12.4% | 14.6% | $129.21 | $144.53 |
| Ohio | 1 | 62,550 | 12.2% | 453 / 0 / 0 | 33.3% | 94.1% | $12.98 | $371,079 | 10.4% | 10.9% | $86.21 | $119.11 |
| Pennsylvania | 1 | 45,400 | 8.9% | 392 / 0 / 0 | 19.8% | 90.1% | $17.30 | $464,383 | 13.0% | 14.1% | $120.12 | $149.87 |
| Total / Wtd. Avg. | 9 | 511,812 | 100.0% | 3,606 | 15.6% | 92.6% | $13.54 | $3,560,210 | 100.0% | 14.8% | $110.22 | $143.20 |
Source: Appraisals.
| (1) | % Climate Controlled Is based on SF. |
| (2) | Occupancy is based on SF. |
The following table presents certain information regarding demographics for the Northeast Self Storage Portfolio Properties:
| Northeast Self Storage Portfolio Demographic Summary | |||||||||
| Property Name | City, State | 1-mile Population | 3-mile Population | 5-mile Population | 1-mile Average Household Income | 3-mile Average Household Income | 5-mile Average Household Income | ||
| Storage Sense - Nicholasville | Nicholasville, KY | 340 | 19,085 | 79,849 | $137,463 | $77,619 | $95,987 | ||
| Storage Sense – Folcroft | Folcroft, PA | 18,717 | 150,917 | 397,452 | $77,648 | $74,378 | $76,293 | ||
| Storage Sense - Cheshire | Cheshire, CT | 991 | 30,317 | 110,849 | $176,241 | $136,362 | $110,678 | ||
| Storage Sense - Cape May Courthouse | Cape May Court House, NJ | 2,054 | 9,797 | 22,079 | $98,705 | $90,887 | $89,452 | ||
| Storage Sense - Hammonton | Hammonton, NJ | 21,901 | 72,981 | 285,509 | $101,410 | $101,609 | $102,909 | ||
| Storage Sense - Mentor | Mentor, OH | 5,931 | 56,952 | 103,136 | $103,037 | $86,303 | $88,692 | ||
| Storage Sense - North Cape May | North Cape May, NJ | 18,728 | 29,944 | 42,128 | $77,453 | $81,781 | $80,266 | ||
| Storage Sense - Middletown | Middletown, NY | 6,034 | 39,491 | 58,840 | $72,710 | $82,205 | $88,651 | ||
| Storage Sense - Voorheesville | Voorheesville, NY | 3,177 | 42,435 | 290,112 | $123,795 | $120,133 | $92,665 | ||
| Wtd. Avg.(1) | $7,757 | $49,416 | $149,178 | $114,072 | $91,957 | $92,709 | |||
Source: Appraisals.
| (1) | The Wtd. Avg. figures are based on allocated loan amounts for the individual properties. |
COVID-19 Update. The first payment date for the Northeast Self Storage Portfolio Mortgage Loan is August 1, 2021. As of June 30, 2021, the Northeast Self Storage Portfolio Mortgage Loan is not subject to any forbearance, modification or debt service relief request. As of June 30, 2021, the borrower sponsor has reported that the Northeast Self Storage Portfolio Properties are all open and operating and 99.0% of billed May 2021 rent payments were received. No rent relief requests were made by tenants at the Northeast Self Storage Portfolio Properties.
| This is not a research report and was not prepared by any Underwriter’s research department. Please see additional important information and qualifications at the end of this Term Sheet. |
142
| Self Storage – Self Storage | Loan #13 | Cut-off Date Balance: | $35,500,000 | |
| Property Addresses - Various | Northeast Self Storage Portfolio | Cut-off Date LTV: | 58.9% | |
| U/W NCF DSCR: | 3.31x | |||
| U/W NOI Debt Yield: | 10.0% |
Operating History and Underwritten Net Cash Flow. The following table presents certain information relating to the historical operating performance and Underwritten Net Cash Flow at the Northeast Self Storage Portfolio Property:
| Cash Flow Analysis(1) | |||||
| 2019 | 2020 | 3/31/2021 TTM | UW | UW per SF | |
| Gross Potential Rent | $5,025,667 | $5,403,393 | $5,601,559 | $6,642,473 | $12.98 |
| Other Income(2) | $445,431 | $514,374 | $455,890 | $455,890 | $0.89 |
| Vacancy & Credit Loss | $0 | $0 | $0 | ($1,040,914) | ($2.03) |
| Effective Gross Income | $5,471,097 | $5,917,767 | $6,057,449 | $6,057,449 | $11.84 |
| Real Estate Taxes | $665,182 | $649,519 | $643,072 | $672,854 | $1.31 |
| Insurance | $41,866 | $33,163 | $42,721 | $60,803 | $0.12 |
| Other Expenses | $1,796,424 | $1,687,093 | $1,756,903 | $1,763,582 | $3.45 |
| Total Expenses | $2,503,472 | $2,369,774 | $2,442,696 | $2,497,239 | $4.88 |
| Net Operating Income | $2,967,625 | $3,547,993 | $3,614,753 | $3,560,210 | $6.96 |
| Capital Expenditures | $0 | $0 | $0 | $54,166 | $0.11 |
| TI/LC | $0 | $0 | $0 | $0 | $0.00 |
| Net Cash Flow | $2,967,625 | $3,547,993 | $3,614,753 | $3,506,044 | $6.85 |
| Occupancy %(3)(4) | NAP | NAP | 92.6% | 84.3% | |
| NOI DSCR | 2.80x | 3.35x | 3.41x | 3.36x | |
| NCF DSCR | 2.80x | 3.35x | 3.41x | 3.31x | |
| NOI Debt Yield | 8.4% | 10.0% | 10.2% | 10.0% | |
| NCF Debt Yield | 8.4% | 10.0% | 10.2% | 9.9% | |
| (1) | For the avoidance of doubt, no COVID-19 specific adjustments have been made to the lender underwriting. |
| (2) | Other Income is comprised of late fees, truck rental income, application fees and miscellaneous income. |
| (3) | 3/31/2021 TTM Occupancy is as of May 17, 2021. |
| (4) | Historical occupancy is not available due to a change of property manager on December 14, 2020. |
| This is not a research report and was not prepared by any Underwriter’s research department. Please see additional important information and qualifications at the end of this Term Sheet. |
143
| Mortgage Loan No. 14 – Overseas Market |
| Mortgage Loan Information | Property Information | ||||||
| Mortgage Loan Seller: | MSMCH | Single Asset/Portfolio: | Single Asset | ||||
| Credit Assessment (DBRSM/Fitch/S&P): | NR/NR/NR | Location: | Key West, FL 33040 | ||||
| Original Balance: | $35,500,000 | General Property Type: | Retail | ||||
| Cut-off Date Balance: | $35,500,000 | Detailed Property Type: | Anchored | ||||
| % of Initial Pool Balance: | 2.5% | Title Vesting: | Fee | ||||
| Loan Purpose: | Refinance | Year Built/Renovated: | 1992/NAP | ||||
| Borrower Sponsors: | Kenneth R. Silverman | Size: | 183,382 SF | ||||
| Guarantors: | Kenneth R. Silverman | Cut-off Date Balance Per SF: | $194 | ||||
| Mortgage Rate: | 3.3750% | Maturity Date Balance Per SF: | $194 | ||||
| Note Date: | 6/10/2021 | Property Manager: | Knight-Gardner, LLC, d/b/a | ||||
| First Payment Date: | 8/1/2021 | Berkshire Hathaway Home | |||||
| Maturity Date: | 7/1/2031 | Services Knight & Gardner Realty | |||||
| Original Term to Maturity: | 120 months | Underwriting and Financial Information(3) | |||||
| Original Amortization Term: | 0 months | UW NOI: | $3,088,135 | ||||
| IO Period: | 120 months | UW NOI Debt Yield: | 8.7% | ||||
| Seasoning: | 1 month | UW NOI Debt Yield at Maturity: | 8.7% | ||||
| Prepayment Provisions: | L(23),YM1(92),O(5) | UW NCF DSCR: | 2.50x | ||||
| Lockbox/Cash Mgmt Status: | Hard/Springing | Most Recent NOI: | $2,869,945 (3/1/2021 TTM) | ||||
| Additional Debt Type: | No | 2nd Most Recent NOI: | $2,706,651 (12/31/2019) | ||||
| Additional Debt Balance: | NAP | 3rd Most Recent NOI: | $2,786,059 (12/31/2018) | ||||
| Future Debt Permitted (Type): | No (NAP) | Most Recent Occupancy: | 89.6% (4/1/2021) | ||||
| Reserves | 2nd Most Recent Occupancy: | 95.4% (12/31/2020) | |||||
| Type | Initial | Monthly | Cap | 3rd Most Recent Occupancy: | 94.7% (12/31/2019) | ||
| RE Tax: | $189,784 | $23,723 | NAP | Appraised Value (as of): | $58,400,000 (4/5/2021) | ||
| Insurance: | $0 | $810 | NAP | Appraised Value Per SF: | $318 | ||
| Recurring Replacements: | $0 | $3,807 | $137,044 | Cut-off Date LTV Ratio: | 60.8% | ||
| Rollover(1): | $2,000,000 | Springing | $750,000 | Maturity Date LTV Ratio: | 60.8% | ||
| Other(2): | $1,094,430 | $0 | NAP | ||||
| Sources and Uses | ||||||
| Sources | Proceeds | % of Total | Uses | Proceeds | % of Total | |
| Mortgage Loan Amount: | $35,500,000 | 100.0% | Loan Payoff: | $27,534,751 | 77.6% | |
| Return of Equity: | $4,006,443 | 11.3% | ||||
| Reserves: | $3,284,214 | 9.3% | ||||
| Closing Costs: | $674,592 | 1.9% | ||||
| Total Sources: | $35,500,000 | 100.0% | Total Uses: | $35,500,000 | 100.0% | |
| (1) | The borrower is required to make monthly deposits of $15,165 beginning upon the balance of the rollover reserve being less than $200,000, until such time that the balance of the rollover reserve is greater than or equal to $750,000. |
| (2) | Other reserves are comprised of roof repair funds ($306,250), Winn-Dixie Parking repair funds ($78,180) and a Tropical Wellness holdback reserve ($710,000). As of June 10, 2021, Tropical Wellness satisfied the holdback release requirements and has requested release of such reserve. |
| (3) | The novel coronavirus pandemic is an evolving situation and could impact the Overseas Market Mortgage Loan (as defined below) more severely than assumed in the underwriting of the Overseas Market Mortgage Loan and could adversely affect the NOI, NCF and occupancy information, as well as the appraised value and the DSCR, LTV and Debt Yield metrics presented above and herein. See “Risk Factors—Risks Related to Market Conditions and Other External Factors—The Coronavirus Pandemic Has Adversely Affected the Global Economy and Will Likely Adversely Affect the Performance of the Mortgage Loans” in the prospectus. |
The Mortgage Loan. The fourteenth largest mortgage loan (the “Overseas Market Mortgage Loan”) is evidenced by a promissory note in the original principal amount of $35,500,000 and secured by a first priority fee mortgage encumbering a 183,382 SF anchored retail shopping center located in Key West, Florida (the “Overseas Market Property”).
The Borrower and the Borrower Sponsor. The borrower for the Overseas Market Mortgage Loan is Overseas Market Retail LLC, a single-purpose Delaware limited liability company with one independent director in its organizational structure. The non-recourse carveout guarantor and borrower sponsor is Kenneth R. Silverman. Kenneth R. Silverman has over 30 years of commercial real estate experience as a senior executive, focusing on property acquisition and management. Currently, Kenneth R. Silverman is a commercial real estate owner and investor, focused primarily on retail properties in North Carolina and Key West, Florida.
The Property. The Overseas Market Property is a 183,382 SF anchored retail shopping center on an approximately 15.21-acre site in Key West, Florida. The Overseas Market Property was built in 1992 and is anchored by Winn-Dixie and Ross Dress For Less. As of April 1, 2021, the Overseas Market Property was 89.6% leased to 26 tenants. The Overseas Market Property contains 700 parking spaces (3.8 spaces per 1,000 SF). The Overseas Market Property includes 2,500 SF of office space and three apartment units. With the exception of the Overseas Market Property’s two largest tenants, Winn-Dixie (32.5% of underwritten rent) and Ross Dress for Less (“Ross”) (12.6% of underwritten rent), no tenant individually accounts for more than 6.4% of underwritten rent.
| This is not a research report and was not prepared by any Underwriter’s research department. Please see additional important information and qualifications at the end of this Term Sheet. |
144
| Retail – Anchored | Loan #14 | Cut-off Date Balance: | $35,500,000 | |
| 2814 North Roosevelt Boulevard | Overseas Market | Cut-off Date LTV: | 60.8% | |
| Key West, FL 33040 | UW NCF DSCR: | 2.50x | ||
| UW NOI Debt Yield: | 8.7% |
Major Tenants.
Winn-Dixie (62,516 SF, 34.1% of NRA, 32.5% of underwritten rent). Founded in 1925, Winn-Dixie grocery stores, liquor stores and in-store pharmacies serve communities throughout five southeastern states - Alabama, Florida, Georgia, Louisiana and Mississippi. Winn-Dixie Stores, Inc. is a subsidiary of Southeastern Grocers, which is a large supermarket chain based in the Southeast. Winn-Dixie occupies two suites at the Overseas Market Property including suite 2778 (56,328 SF) for a grocery store and suite 2760 (6,188 SF) for a liquor store. The grocery suite has been occupied by Winn-Dixie since 1989 and the liquor suite has been occupied by Winn-Dixie since 2001. Both suites have a lease expiration of December 31, 2030 and have three, ten-year renewal options remaining.
Ross Dress for Less (33,630 SF, 18.3% of NRA, 12.6% of underwritten rent). Ross is a chain of off-price department stores that offers a selection of women’s and men’s apparel, accessories, footwear and furniture. Ross has more than 88,000 employees and 1,550 stores in 38 states. Ross has been a tenant at the Overseas Market Property since 2000, has a lease expiration of January 31, 2027 and has one, five-year renewal option remaining.
The following table presents a summary regarding the major tenants at the Overseas Market Property:
| Tenant Summary(1) | ||||||||||||
| Tenant Name | Credit Rating (Fitch/Moody’s/ S&P)(2) | Tenant SF | Approx.% of SF | Annual UW Rent | Annual UW Rent PSF(3) | App. % of Total Annual UW Rent | Most Recent Sales | |||||
| $ | PSF | Occ. Cost % | Term. Option | Renewal Options | Lease Expiration | |||||||
| Winn-Dixie | NR/Caa1/B+ | 62,516 | 34.1% | $1,041,248 | $16.66 | 32.5% | $41,334,783 | $661.19 | 2.5% | N | 3 x 10 year | 12/31/2030 |
| Ross Dress For Less | NR/A2/A | 33,630 | 18.3% | $403,560 | $12.00 | 12.6% | $10,899,535 | $324.10 | 3.7% | N | 1 x 5 year | 1/31/2027 |
| CVS | NR/Baa2/BBB | 10,368 | 5.7% | $147,781 | $14.25 | 4.6% | $5,802,676 | $559.67 | 2.5% | N | 1 x 5 year | 4/13/2026 |
| Body Zone Gym | NR/NR/NR | 9,210 | 5.0% | $206,562 | $22.43 | 6.4% | NAV | NAV | NAV | N | None | 6/1/2026 |
| Subtotal/Wtd. Avg. | 115,724 | 63.1% | $1,799,151 | $15.55 | 56.1% | |||||||
| Other Tenants | 48,572 | 26.5% | $1,407,957 | $28.99 | 43.9% | |||||||
| Vacant Space | 19,086 | 10.4% | $0 | $0.00 | 0.0% | |||||||
| Total/Wtd. Avg. | 183,382 | 100.0% | $3,207,108 | $19.52 | 100.0% | |||||||
| (1) | Information is based on the underwritten rent roll as of April 1, 2021. |
| (2) | Certain ratings are those of the parent company whether or not the parent company guarantees the lease. |
| (3) | Total Wtd. Avg. Annual UW Rent PSF excludes vacant space. |
The following table presents certain information relating to the lease rollover at the Overseas Market Property:
| Lease Rollover Schedule(1)(2) | ||||||||
| Year | # of Leases Rolling | SF Rolling | Annual UW Rent PSF Rolling(3) | Approx. % of Total SF Rolling | Approx. Cumulative % of SF Rolling | Total UW Rent Rolling | Approx. % of Total Rent Rolling | Approx. Cumulative % of Total Rent Rolling |
| MTM | 3 | 1,350 | $12.00 | 0.7% | 0.7% | $16,200 | 0.5% | 0.5% |
| 2021 | 0 | 0 | $0.00 | 0.0% | 0.7% | $0 | 0.0% | 0.5% |
| 2022 | 4 | 8,160 | $28.94 | 4.4% | 5.2% | $236,142 | 7.4% | 7.9% |
| 2023 | 6 | 8,625 | $30.46 | 4.7% | 9.9% | $262,715 | 8.2% | 16.1% |
| 2024 | 2 | 5,288 | $28.17 | 2.9% | 12.8% | $148,969 | 4.6% | 20.7% |
| 2025 | 1 | 3,000 | $35.53 | 1.6% | 14.4% | $106,578 | 3.3% | 24.0% |
| 2026 | 3 | 22,693 | $19.10 | 12.4% | 26.8% | $433,536 | 13.5% | 37.5% |
| 2027 | 4 | 45,464 | $16.33 | 24.8% | 51.6% | $742,474 | 23.2% | 60.7% |
| 2028 | 0 | 0 | $0.00 | 0.0% | 51.6% | $0 | 0.0% | 60.7% |
| 2029 | 0 | 0 | $0.00 | 0.0% | 51.6% | $0 | 0.0% | 60.7% |
| 2030 | 2 | 63,716 | $16.94 | 34.7% | 86.3% | $1,079,648 | 33.7% | 94.4% |
| 2031 | 0 | 0 | $0.00 | 0.0% | 86.3% | $0 | 0.0% | 94.4% |
| 2032 & Beyond | 1 | 6,000 | $30.14 | 3.3% | 89.6% | $180,847 | 5.6% | 100.0% |
| Vacant | 0 | 19,086 | $0.00 | 10.4% | 100.0% | $0 | 0.0% | 100.0% |
| Total/Wtd. Avg. | 26 | 183,382 | $19.52 | 100.0% | $3,207,108 | 100.0% | ||
| (1) | Information is based on the underwritten rent roll as of April 1, 2021. |
| (2) | Certain tenants may have lease termination options that are exercisable prior to the stated expiration date of the subject lease or leases which are not considered in the lease rollover schedule. |
| (3) | Total Wtd. Avg. Annual UW Rent PSF Rolling excludes vacant space. |
| This is not a research report and was not prepared by any Underwriter’s research department. Please see additional important information and qualifications at the end of this Term Sheet. |
145
| Retail – Anchored | Loan #14 | Cut-off Date Balance: | $35,500,000 | |
| 2814 North Roosevelt Boulevard | Overseas Market | Cut-off Date LTV: | 60.8% | |
| Key West, FL 33040 | UW NCF DSCR: | 2.50x | ||
| UW NOI Debt Yield: | 8.7% |
COVID-19 Update. The Overseas Market Mortgage Loan was originated on June 10, 2021 and as of such date is not subject to any forbearance, modification or debt service relief request. The Overseas Market Mortgage Loan has its first debt service payment date in August 2021. As of July 13, 2021, the borrower has reported that the Overseas Market Property is open and operating, with 94.4% of tenants by occupied NRA and 91.8% of tenants by underwritten base rent having paid their full June 2021 rent payments. Ten tenants (14.8% of NRA and 25.2% of underwritten rent) received rent relief for the months of April, May, and June 2020. Four of the ten tenants (9.1% of NRA and 14.9% of underwritten rent) are currently repaying the deferred rent in equal installments over a nine-month period from January 2021 through September 2021. Five of the ten tenants (4.0% of NRA and 7.8% of underwritten rent) repaid their full deferred rent upfront in January 2021. In exchange for the full upfront payments, the landlord is abating 50% of the upfront payments from the tenants’ monthly rents over a nine-month period from January 2021 through September 2021. The remaining tenant (1.7% of NRA and 2.5% of underwritten rent) repaid 50% of its deferred rent upfront in January 2021. In exchange for the 50% upfront payment, the landlord is abating 25% of the upfront payment from the tenant’s rent in equal installments over a nine-month period from January 2021 through September 2021.
The Market. The Overseas Market Property is located in Key West, Florida, on the northern side of the island, within the Key West retail market. The Overseas Market Property is situated near the entrance to Key West, which consists of predominately larger hotels and shopping centers, whereas further to the west is Old Town Key West. The Overseas Market Property is located along North Roosevelt Boulevard, a main east/west arterial roadway that provides access into Key West. Other main roadways in the local area consist of Duval Street, which is a north/south, two-lane road, located on the western side of the island. U.S. Highway 1 / Truman Avenue is the main thoroughfare into and out of the City of Key West and the Florida Keys. U.S. Highway 1 travels parallel to the Atlantic Ocean and/or the Intracoastal Waterway through Florida and up the eastern seaboard of the United States. According to the appraisal, as of the first quarter of 2021, the Key West retail market had approximately 5.5 million SF of retail space inventory, overall vacancy in the market was approximately 4.4% and asking rent was $48.52 PSF. According to the appraisal, the 2020 estimated population within a one-, three- and five-mile radius of the Overseas Market Property was 11,141, 30,342 and 30,382, respectively. The 2020 estimated average household income within a one-, three- and five-mile radius of the Overseas Market Property was $82,616, $91,910 and $91,924, respectively.
The following table presents recent leasing data for retail tenants at comparable retail properties with respect to the Overseas Market Property:
| Comparable Retail Lease Summary | |||||||
| Property/Location | Year Built | SF | Tenant Name | Size (SF) | Lease Date | Rent PSF | Lease Type |
The Overseas Market (subject) Key West, FL | 1992 | 183,382(1) | Winn-Dixie(1) Ross Dress For Less | 62,516(1) 33,630 | March 1991(1) Feb. 2017 | $16.66(1) $12.00 | NNN NNN |
Petco Stuart, FL | 1976 | 15,000 | Petco | 15,500 | May 2020 | $19.50 | NNN |
Southern Palm Crossing Royal Palm Beach, FL | 2006 | 346,200 | 24 Hour Fitness | 36,000 | April 2020 | $31.19 | NNN |
1814 Harrison Street Hollywood, FL | 1962 | 2,708 | Shavos | 20,708 | Sept. 2019 | $26.58 | NNN |
Jupiter West Plaza Jupiter, FL | 1990 | 134,820 | ALDI | 25,512 | June 2019 | $15.00 | NNN |
Legacy Place Palm Beach Gardens, FL | 2007 | 422,854 | Bassett Furniture | 15,000 | June 2019 | $20.00 | NNN |
Floor & Decor at Gatlin Port Saint Lucie, FL | 2018 | 70,000 | Floor and Decor | 70,000 | June 2018 | $14.75 | NNN |
11379 West Palmetto Park Road Boca Raton, FL | 1985 | 107,000 | Monkey Joe’s | 14,014 | May 2017 | $15.00 | NNN |
Source: Appraisal, unless otherwise noted.
| (1) | Information is based on the underwritten rent roll as of April 1, 2021. |
The following table presents certain information relating to the appraisal’s market rent conclusion for the Overseas Market Property:
| Market Rent Summary | ||||
| Market Rent PSF | Lease Term (Years) | Rent Increase Projection | Lease Type | |
| In-Line Space: | $28.00 | 5 | 3.0% per annum | NNN |
| Large In-Line Space: | $25.00 | 5 | 3.0% per annum | NNN |
| Grocery Anchor Space: | $16.00 | 20 | Flat | NNN |
| Big Box: | $12.00 | 20 | Flat | NNN |
| End Cap and Outparcel Space: | $32.00 | 10 | 3.0% per annum | NNN |
| Drug Store Space: | $20.00 | 10 | Flat | NNN |
Source: Appraisal.
| This is not a research report and was not prepared by any Underwriter’s research department. Please see additional important information and qualifications at the end of this Term Sheet. |
146
| Retail – Anchored | Loan #14 | Cut-off Date Balance: | $35,500,000 | |
| 2814 North Roosevelt Boulevard | Overseas Market | Cut-off Date LTV: | 60.8% | |
| Key West, FL 33040 | UW NCF DSCR: | 2.50x | ||
| UW NOI Debt Yield: | 8.7% |
Operating History and Underwritten Net Cash Flow. The following table presents certain information relating to historical operating performance and the Underwritten Net Cash Flow at the Overseas Market Property:
| Cash Flow Analysis(1) | ||||||||||||||||||
| 2017 | 2018 | 2019 | 3/1/2021 TTM | UW | UW PSF | |||||||||||||
| Gross Potential Rent(2) | $2,750,172 | $3,026,305 | $3,050,169 | $3,262,658 | $3,695,241 | $20.15 | ||||||||||||
| Total Recoveries | $880,838 | $923,651 | $886,263 | $1,190,223 | $1,289,520 | $7.03 | ||||||||||||
| Other Income(3) | $68,565 | $70,764 | $55,340 | $13,236 | $105,800 | $0.58 | ||||||||||||
| Less Vacancy & Credit Loss | $0 | $0 | $0 | ($213,325 | ) | ($651,478 | ) | ($3.55 | ) | |||||||||
| Effective Gross Income | $3,699,575 | $4,020,721 | $3,991,772 | $4,252,792 | $4,439,083 | $24.21 | ||||||||||||
| Real Estate Taxes | $171,458 | $171,458 | $212,309 | $302,287 | $302,287 | $1.65 | ||||||||||||
| Insurance | $421,561 | $500,013 | $494,397 | $364,760 | $364,760 | $1.99 | ||||||||||||
| Other Expenses | $654,568 | $563,190 | $578,415 | $715,800 | $683,901 | $3.73 | ||||||||||||
| Total Expenses | $1,247,587 | $1,234,661 | $1,285,121 | $1,382,847 | $1,350,948 | $7.37 | ||||||||||||
| Net Operating Income | $2,451,988 | $2,786,059 | $2,706,651 | $2,869,945 | $3,088,135 | $16.84 | ||||||||||||
| Capital Expenditures | $0 | $0 | $0 | $0 | $45,681 | $0.25 | ||||||||||||
| TI/LC | $0 | $0 | $0 | $0 | $8,652 | $0.05 | ||||||||||||
| Net Cash Flow | $2,451,988 | $2,786,059 | $2,706,651 | $2,869,945 | $3,033,801 | $16.54 | ||||||||||||
| Occupancy %(2) | 97.4% | 99.6% | 94.7% | 89.6% | 86.8% | |||||||||||||
| NOI DSCR | 2.02x | 2.29x | 2.23x | 2.36x | 2.54x | |||||||||||||
| NCF DSCR | 2.02x | 2.29x | 2.23x | 2.36x | 2.50x | |||||||||||||
| NOI Debt Yield | 6.9% | 7.8% | 7.6% | 8.1% | 8.7% | |||||||||||||
| NCF Debt Yield | 6.9% | 7.8% | 7.6% | 8.1% | 8.5% | |||||||||||||
| (1) | For the avoidance of doubt, no COVID-19 specific adjustments have been made to the lender underwriting. |
| (2) | UW Gross Potential Rent and 3/1/2021 TTM Occupancy % are based on the underwritten rent roll dated April 1, 2021. 2020 historical information is not available because the borrower sponsor, which had previously purchased the fee interest in the land in December 2019, acquired the leasehold interest in the improvements in March 2020, thereby acquiring the entire fee interest in the property. |
| (3) | Other Income includes in-place rent for the three apartment units and a percentage rent adjustment for Winn-Dixie, which is based off of the base rent for the tenant being adjusted annually based on a percentage of the tenant’s prior calendar year’s gross sales. |
| This is not a research report and was not prepared by any Underwriter’s research department. Please see additional important information and qualifications at the end of this Term Sheet. |
147
| Mortgage Loan No. 15 – Rosemead Place |
| Mortgage Loan Information | Property Information | ||||||
| Mortgage Loan Seller: | WFB | Single Asset/Portfolio: | Single Asset | ||||
| Credit Assessment (DBRSM/Fitch/S&P): | NR/NR/NR | Location: | Rosemead, CA 91770 | ||||
| Original Balance: | $35,000,000 | General Property Type: | Retail | ||||
| Cut-off Date Balance: | $35,000,000 | Detailed Property Type: | Anchored | ||||
| % of Initial Pool Balance: | 2.5% | Title Vesting: | Fee | ||||
| Loan Purpose: | Refinance | Year Built/Renovated: | 1967/2002 | ||||
| Borrower Sponsor: | Herbert Yang | Size: | 332,474 SF | ||||
| Guarantor: | Aespace America, Inc. | Cut-off Date Balance PSF: | $105.27 | ||||
| Mortgage Rate: | 3.2500% | Maturity Date Balance PSF: | $105.27 | ||||
| Note Date: | 6/17/2021 | Property Manager: | Beacon Property Management, Inc. | ||||
| First Payment Date: | 8/11/2021 | ||||||
| Maturity Date: | 7/11/2026 | ||||||
| Original Term to Maturity: | 60 months | ||||||
| Original Amortization Term: | 0 months | ||||||
| IO Period: | 60 months | ||||||
| Seasoning: | 1 month | Underwriting and Financial Information(5) | |||||
| Prepayment Provisions: | L(25),D(31),O(4) | UW NOI: | $3,801,292 | ||||
| Lockbox/Cash Mgmt Status: | Springing/Springing | UW NOI Debt Yield: | 10.9% | ||||
| Additional Debt Type: | No | UW NOI Debt Yield at Maturity: | 10.9% | ||||
| Additional Debt Balance: | NAP | UW NCF DSCR: | 3.09x | ||||
| Future Debt Permitted (Type): | No (NAP) | Most Recent NOI: | $3,640,654 (4/30/2021 TTM) | ||||
| 2nd Most Recent NOI: | $3,850,854 (12/31/2020) | ||||||
| Reserves | 3rd Most Recent NOI: | $4,686,959 (12/31/2019) | |||||
| Type | Initial | Monthly | Cap | Most Recent Occupancy: | 93.4% (6/7/2021) | ||
| RE Taxes: | $255,364 | $63,841 | NAP | 2nd Most Recent Occupancy(6): | 95.9% (12/31/2020) | ||
| Insurance: | $0 | Springing(1) | NAP | 3rd Most Recent Occupancy(6): | 96.4% (12/31/2019) | ||
| Replacement Reserves: | $0 | $5,050 | NAP | Appraised Value (as of): | $87,200,000 (3/31/2021) | ||
| Leasing Reserve: | $250,000 | Springing | $250,000(2) | Appraised Value PSF: | $262.28 | ||
| Rent Concession Reserve Funds(3): | $30,014 | $0 | NAP | Cut-off Date LTV Ratio: | 40.1% | ||
| Existing TI/LC Reserve(4): | $92,181 | $0 | NAP | Maturity Date LTV Ratio: | 40.1% | ||
| Sources and Uses | ||||||
| Sources | Proceeds | % of Total | Uses | Proceeds | % of Total | |
| Loan Amount: | $35,000,000 | 100.0% | Loan Payoff: | $26,772,388 | 76.5% | |
| Upfront Reserves: | $627,558 | 1.8% | ||||
| Closing Costs: | $415,870 | 1.2% | ||||
| Return of Equity: | $7,184,183 | 20.5% | ||||
| Total Sources: | $35,000,000 | 100.0% | Total Uses: | $35,000,000 | 100.0% | |
| (1) | The Rosemead Place Mortgage Loan (as defined below) documents do not require ongoing monthly escrows for insurance premiums as long as (i) no event of default is continuing, (ii) the Rosemead Place Property (as defined below) is covered under a blanket policy acceptable to the lender, and (iii) the borrower provides proof of renewal and receipts for the payment of insurance premiums no later than 10 business days prior to policy expiration. |
| (2) | The Rosemead Place Mortgage Loan documents require ongoing monthly escrows for leasing reserves in the amount of $10,417 beyond the cap upon an event of default. |
| (3) | The Rosemead Place Mortgage Loan documents require an upfront deposit equal to $30,014 for outstanding free rent owed to Dave’s Hot Chicken. |
| (4) | The Rosemead Place Mortgage Loan documents require an upfront deposit equal to $92,181 for tenant improvement costs owed to Dave’s Hot Chicken. |
| (5) | The novel coronavirus pandemic is an evolving situation and could impact the Rosemead Place Mortgage Loan (as defined below) more severely than assumed in the underwriting of the Rosemead Place Mortgage Loan and could adversely affect the NOI, NCF and occupancy information, as well as the appraised value and the DSCR, LTV and Debt Yield metrics presented above and herein. See “Risk Factors-—Risks Related to Market Conditions and Other External Factors—The Coronavirus Pandemic Has Adversely Affected the Global Economy and Will Likely Adversely Affect the Performance of the Mortgage Loans” in the prospectus. |
| (6) | Information obtained from a third party market research report. |
The Mortgage Loan. The fifteenth largest mortgage loan (the “Rosemead Place Mortgage Loan”) is evidenced by a promissory note in the original principal amount of $35,000,000 and secured by the fee interest in an anchored retail property located in Rosemead, California (the “Rosemead Place Property”).
The Borrower and the Borrower Sponsor. The borrower is Rosemead Place, LLC, a California limited liability company and single purpose entity with one independent director. The borrower sponsor is Herbert Yang and the non-recourse carveout guarantor is Aespace America, Inc.
Herbert Yang is Vice President of Aespace America, Inc. (“Aespace”), which is a real estate holding company headquartered in Los Angeles, California. Aespace focuses on identification, acquisition, and development of income yielding projects including mixed-use commercial, office, and residential properties throughout Southern California. As of January 31, 2021, Aespace owns three, mixed-retail shopping complexes and several specialized retail/rental properties situated in and around the San Gabriel Valley, totaling over 1 million SF gross leasable area.
| This is not a research report and was not prepared by any Underwriter’s research department. Please see additional important information and qualifications at the end of this Term Sheet. |
148
| Retail – Anchored | Loan #15 | Cut-off Date Balance: | $35,000,000 | |
| 3506-3684 Rosemead Boulevard & | Rosemead Place | Cut-off Date LTV: | 40.1% | |
| 3501-3505 Hart Avenue | UW NCF DSCR: | 3.09x | ||
| Rosemead, CA 91770 | UW NOI Debt Yield: | 10.9% |
The Property. The Rosemead Place Property is an anchored retail center totaling 332,474 SF of rentable area, which also includes 31,961 SF of office space. Built in 1967 and renovated in 2002, the property is situated on a 26.1-acre parcel and is anchored by Target, Ross Dress for Less and LA Fitness. The collateral improvements comprise nine retail and two office buildings with other major tenants including Petsmart, Ulta, and Dollar Tree. There is one tenant, IHOP (2.2% of underwritten base rent), that is a ground lease tenant and owns its improvements. The property contains 1,653 surface parking spaces, resulting in a parking ratio of 5.0 spaces per 1,000 SF of rentable area. 27 tenants totaling 67.4% of the net rentable area and 47.5% of underwritten base rent have been in occupancy for at least 10 years, and 27 tenants totaling 67.6% of the net rentable area and 46.4% of underwritten base rent have renewed at least once. As of June 7, 2021, the Rosemead Place Property was 93.4% occupied by 50 tenants.
Major Tenants.
Target (135,603 SF; 40.8% of NRA; 3.6% of underwritten base rent). Target has been a tenant at the Rosemead Place Property since 2002 and has a lease expiring in August 2027 with 1, 10-year renewal option remaining. Target does not have any termination options and is not required to report sales.
LA Fitness (42,500 SF; 12.8% of NRA; 7.3% of underwritten base rent). LA Fitness was founded in Southern California in 1984 and currently has over 700 clubs throughout the United States. LA Fitness has been a tenant at the Rosemead Place Property since 1989, recently renewed in March 2021, and has a lease expiring in February 2026, with 1, 5-year renewal option remaining. LA Fitness does not have any termination options and is not required to report sales or membership figures. Due to the COVID-19 pandemic, the tenant received rent deferral beginning in April 2020 through June 2020, which was expected to be paid back in 24 equal installments beginning in January 2021. However, the tenant was not able to pay any rent until March 2021 and paid 50% of contractual base rent through June 2021. LA Fitness resumed paying full contractual base rent in July 2021. No repayment terms have been negotiated at this time.
Ross Dress for Less (24,713 SF; 7.4% of NRA; 9.5% of underwritten base rent). Ross Dress for Less (“Ross”) has been a tenant at the Rosemead Place Property since 2017 and has a lease expiring in January 2029, with 4, 5-year renewal options remaining. Ross does not have any termination options and is not required to report sales. Due to the COVID-19 pandemic, the tenant received rent deferral between March 2020 and May 2020, which was repaid in full in June 2020, and between July 2020 and October 2020, which was repaid in full November 2020.
The following table presents certain information relating to the tenancy at the Rosemead Place Property:
| Tenant Summary | |||||||||
| Tenant Name | Credit Rating (Fitch/Moody’s/ S&P)(1) | Tenant SF | Approx. % of SF | Annual UW Rent(2) | % of Total Annual UW Rent | Annual UW Rent PSF(2) | Renewal Options | ||
| Termination Option (Y/N) | Lease Expiration | ||||||||
| Anchor Tenants | |||||||||
| Target | A/A2/A | 135,603 | 40.8% | $156,252 | 3.6% | $1.15 | N | 8/31/2027 | 1 x 10Yr |
| Total/Wtd. Avg. | 135,603 | 40.8% | $156,252 | 3.6% | $1.15 | ||||
| Major Tenants | |||||||||
| LA Fitness | NR/NR/NR | 42,500 | 12.8% | $315,812(3) | 7.3% | $7.43(3) | N | 2/28/2026 | 1 x 5Yr |
| Ross | NR/A2/BBB+ | 24,713 | 7.4% | $412,296 | 9.5% | $16.68 | N | 1/31/2029 | 4 x 5Yr |
| Petsmart | NR/ Caa1/B | 11,265 | 3.4% | $285,000 | 6.6% | $25.30 | N | 9/30/2025 | 3 x 5Yr |
| Ulta | NR/NR/NR | 10,006 | 3.0% | $272,463 | 6.3% | $27.23 | N | 10/31/2026 | 2 x 5Yr |
| Dollar Tree | NR/Baa2/BBB | 9,520 | 2.9% | $159,456 | 3.7% | $16.75 | N | 9/30/2025 | 1 x 5Yr |
| Total/Wtd. Avg. | 98,004 | 29.5% | $1,445,027 | 33.2% | $14.74 | ||||
| Non-Major Tenants | 76,952 | 23.1% | $2,745,359 | 63.2% | $34.44(4) | ||||
| Occupied Collateral Total | 310,559 | 93.4% | $4,346,638 | 100.0% | $13.69(4) | ||||
| Vacant Space | 21,915 | 6.6% | |||||||
| Total/Wtd. Avg. | 332,474 | 100.0% | |||||||
| (1) | Certain ratings are those of the parent company whether or not the parent guarantees the lease. |
| (2) | Annual UW Rent and Annual UW Rent PSF include contractual rent steps through March 2022 totaling $27,507 and straight-lined average rent for Ross and Bank of America totaling $17,781. |
| (3) | Annual UW Rent and Annual UW Rent PSF for LA Fitness is equal to 50% of the current contractual rent of $631,623 ($14.86 PSF). |
| (4) | IHOP (2.2% of underwritten base rent) is a ground lease tenant and owns its improvements with no associated NRA. The weighted average Annual UW Rent PSF calculations exclude the underwritten base rent associated with this leased fee tenant. |
| This is not a research report and was not prepared by any Underwriter’s research department. Please see additional important information and qualifications at the end of this Term Sheet. |
149
| Retail – Anchored | Loan #15 | Cut-off Date Balance: | $35,000,000 | |
| 3506-3684 Rosemead Boulevard & | Rosemead Place | Cut-off Date LTV: | 40.1% | |
| 3501-3505 Hart Avenue | UW NCF DSCR: | 3.09x | ||
| Rosemead, CA 91770 | UW NOI Debt Yield: | 10.9% |
The following table presents certain information relating to the lease rollover schedule at the Rosemead Place Property:
| Lease Rollover Schedule(1)(2) | ||||||||
| Year | # of Leases Rolling | SF Rolling | UW Rent PSF Rolling(3) | Approx. % of Total SF Rolling | Approx. Cumulative % of SF Rolling | Total UW Rent Rolling | Approx. % of Total Rent Rolling | Approx. Cumulative % of Total Rent Rolling |
| MTM | 4 | 3,206 | $10.43 | 1.0% | 1.0% | $33,444 | 0.8% | 0.8% |
| 2021 | 3 | 4,789 | $28.75 | 1.4% | 2.4% | $137,700 | 3.2% | 3.9% |
| 2022 | 12 | 20,773 | $34.30 | 6.2% | 8.7% | $712,523 | 16.4% | 20.3% |
| 2023 | 6 | 8,750 | $42.26 | 2.6% | 11.3% | $369,764 | 8.5% | 28.8% |
| 2024 | 8 | 12,197 | $39.72 | 3.7% | 15.0% | $484,484 | 11.1% | 40.0% |
| 2025 | 5 | 25,936 | $26.08 | 7.8% | 22.8% | $676,385 | 15.6% | 55.5% |
| 2026 | 6 | 60,619 | $14.29 | 18.2% | 41.0% | $866,462 | 19.9% | 75.5% |
| 2027 & Beyond(4) | 7 | 174,289 | $5.57 | 52.4% | 93.4% | $1,065,876 | 24.5% | 100.0% |
| Vacant | 0 | 21,915 | $0.00 | 6.6% | 100.0% | $0 | 0.0% | 100.0% |
| Total/Wtd. Avg.(4) | 51 | 332,474 | $13.69 | 100.0% | $4,346,638 | 100.0% | ||
| (1) | Information is based on the underwritten rent roll. |
| (2) | Certain tenants may have lease termination options that are exercisable prior to the originally stated expiration date of the related lease and are not considered in the rollover schedule. |
| (3) | Wtd. Avg. UW Rent PSF Rolling excludes vacant space. |
| (4) | IHOP (2.2% of underwritten base rent) is a ground lease tenant and owns its improvements with no associated NRA. Wtd. Avg. UW Rent PSF Rolling excludes underwritten base rent attributed to IHOP. |
COVID-19 Update. The first payment date is in August 2021 and the loan is not subject to any forbearance, modification or debt service relief request. As of July 1, 2021, the borrower sponsor reported that all tenants were open and operating, except for Dave’s Hot Chicken (0.7% of NRA and 2.8% of underwritten base rent), which is a new tenant that is currently building out its space. Tenants representing approximately 83.9% of the occupied NRA and 90.2% of underwritten base rent made their full rent payment for May 2021. Seventeen tenants, representing approximately 32.1% of occupied net rentable area and 43.7% of underwritten base rent, were granted rent relief related to COVID-19, including up to thirteen months of full or partial deferred rent, which is expected to be repaid on various terms with certain repayment terms still being negotiated with LA Fitness and TGI Fridays.
The Market. The Rosemead Place Property is located within the northeast quadrant of Rosemead Boulevard and IH-10 in Rosemead, Los Angeles County, California. The property is located approximately 10.7 miles east of the Los Angeles central business district and has access to major freeways including IH-10, SR-60, and SR-164. According to the appraisal, the property serves as the sole power center and largest shopping center in the city of Rosemead. Rosemead’s major employers include Edison International, Panda Restaurant Group, Walmart, Target, and DoubleTree. According to the appraisal, within a one- three- and five-mile radius of the Rosemead Place Property, the 2020 average household income was approximately $73,970, $78,438, and $93,106, respectively; and within the same radii, the 2020 estimated population was 28,757, 263,732, and 602,346, respectively.
According to a third-party market research report, the property is situated within the Western SGV submarket of the Los Angeles retail market. As of July 2021, the submarket reported total inventory of approximately 27.0 million SF, with a 3.9% vacancy rate and average asking rent of $29.14 PSF. The appraisal concluded to market rents ranging from $12.00 PSF for large anchor space to $45.00 PSF for shop < 3,000 SF space (see table below).
The following table presents certain information relating to the appraisal’s market rent conclusion for the Rosemead Place Property:
| Market Rent Summary | |||||||||
| Large Anchor | Junior Anchor | Fitness Anchor | Large Shop | In Line | Pad Ground Lease | Shop < 3,000 SF | Shop 3,000-8,000 SF | Office | |
| Market Rent (PSF) | $12.00 | $18.00 | $21.00 | $25.80 | $33.60 | $150,000 | $45.00 | $30.00 | $25.80 |
| Lease Term (Years) | 10 | 10 | 10 | 10 | 5 | 10 | 5 | 5 | 3 |
Lease Type (Reimbursements) | NNN | NNN | NNN | NNN | NNN | NNN | NNN | NNN | Gross |
| Rent Increase Projection | 10% every 5 years | 10% every 5 years | 10% every 5 years | 10% every 5 years | 3.0%/year | 10% every 5 years | 3.0%/year | 3.0%/year | 3.0%/year |
| This is not a research report and was not prepared by any Underwriter’s research department. Please see additional important information and qualifications at the end of this Term Sheet. |
150
| Retail – Anchored | Loan #15 | Cut-off Date Balance: | $35,000,000 | |
| 3506-3684 Rosemead Boulevard & | Rosemead Place | Cut-off Date LTV: | 40.1% | |
| 3501-3505 Hart Avenue | UW NCF DSCR: | 3.09x | ||
| Rosemead, CA 91770 | UW NOI Debt Yield: | 10.9% |
The table below presents certain information relating to comparable sales pertaining to the Rosemead Place Property identified by the appraiser:
| Comparable Sales | ||||
Property Name | Location | Rentable Area (SF) | Sale Date | Sale Price (PSF) |
| Chatsworth Plaza | 21405-21515 Devonshire Street Chatsworth, CA | 67,841 | Dec-20 | $236.60 |
| Monrovia Landing | 723-737 East Huntington Drive Monrovia, CA | 96,885 | Aug-19 | $314.81 |
| Towne Center East | 2450 East Willow Street Signal Hill, CA | 154,950 | Sep-19 | $393.68 |
| The Promenade at Downey | 8800-9050 Apollo Way & 12214 Lakewood Boulevard Downey, CA | 446,557 | Sep-18 | $385.17 |
| Eastland Center | NWQ of IH-10 and Barranca Street West Covina, CA | 811,437 | Dec-19 | $227.68 |
| San Dimas Marketplace | 802-868 West Arrow Highway San Dimas, CA | 154,000 | Dec-18 | $302.60 |
| Plaza Pacoima | 13510-13550 Paxton Street Pacoima, CA | 203,743 | Oct-19 | $251.79 |
Source: Appraisal.
Operating History and Underwritten Net Cash Flow. The following table presents certain information relating to the historical operating performance and Underwritten Net Cash Flow at the Rosemead Place Property:
| Cash Flow Analysis | ||||||
| 2018 | 2019 | 2020 | 4/30/2021 TTM | UW | UW PSF | |
| Base Rent | $4,424,990 | $4,449,445 | $4,095,901 | $4,123,406 | $4,346,638 (1) | $13.07 |
| Grossed Up Vacant Space | $0 | $0 | $0 | $0 | $643,010 | $1.93 |
| Gross Potential Rent | $4,424,990 | $4,449,445 | $4,095,901 | $4,123,406 | $4,989,648 | $15.01 |
| Other Income | ($9,536) | $4,866 | $8,988 | $4,950 | $4,950 | $0.01 |
| Total Recoveries | $1,235,298 | $1,293,208 | $980,466 | $1,126,667 | $1,380,320 | $4.15 |
| Net Rental Income | $5,650,752 | $5,747,520 | $5,085,355 | $5,255,023 | $6,374,918 | $19.17 |
| (Vacancy & Credit Loss) | $0 | $0 | $0 | $0 | ($643,010)(2) | ($1.93) |
| Effective Gross Income | $5,650,752 | $5,747,520 | $5,085,355 | $5,255,023 | $5,731,908 | $17.24 |
| Real Estate Taxes(3) | $552,907 | $61,626 | $117,953 | $481,670 | $729,609 | $2.19 |
| Insurance | $67,059 | $61,033 | $63,127 | $57,126 | $74,838 | $0.23 |
| Management Fee | $133,011 | $133,509 | $118,756 | $121,361 | $171,957 | $0.52 |
| Other Operating Expenses | $728,891 | $804,392 | $934,666 | $954,212 | $954,212 | $2.87 |
| Total Operating Expenses | $1,481,868 | $1,060,560 | $1,234,502 | $1,614,369 | $1,930,616 | $5.81 |
| Net Operating Income | $4,168,884 | $4,686,959(4) | $3,850,854(4) | $3,640,654 | $3,801,292 | $11.43 |
| Replacement Reserves | $0 | $0 | $0 | $0 | $59,845 | $0.18 |
| TI/LC | $0 | $0 | $0 | $0 | $172,027 | $0.52 |
| Net Cash Flow | $4,168,884 | $4,686,959 | $3,850,854 | $3,640,654 | $3,569,421 | $10.74 |
| Occupancy % | 95.9% | 96.4% | 95.9% | 93.4%(5) | 87.1%(2) | |
| NOI DSCR | 3.61x | 4.06x | 3.34x | 3.16x | 3.30x | |
| NCF DSCR | 3.61x | 4.06x | 3.34x | 3.16x | 3.09x | |
| NOI Debt Yield | 11.9% | 13.4% | 11.0% | 10.4% | 10.9% | |
| NCF Debt Yield | 11.9% | 13.4% | 11.0% | 10.4% | 10.2% | |
| (1) | UW Base Rent includes contractual rent steps through March 2022 totaling $27,507 and straight-lined average rent for Ross and Bank of America totaling $17,781. |
| (2) | The underwritten economic vacancy is 12.9%. The Rosemead Place Property was 93.4% occupied as of June 7, 2021. |
| (3) | The fluctuation in the amounts shown for historical Real Estate Taxes are due to the borrower’s operating statement representation for accounting purposes. The UW Real Estate Taxes are based on the 2020/2021 tax bill. |
| (4) | The decrease in Base Rent and Net Operating Income between 2019 and 2020 was due to tenants receiving rent relief related to the COVID-19 pandemic. |
| (5) | Occupancy % as of June 7, 2021. |
| This is not a research report and was not prepared by any Underwriter’s research department. Please see additional important information and qualifications at the end of this Term Sheet. |
151
| BANK 2021-BNK35 |
This material was prepared by sales, trading, banking or other non-research personnel of one of the following: Morgan Stanley & Co. LLC, Morgan Stanley & Co. International Limited, Morgan Stanley Japan Limited and/or Morgan Stanley Dean Witter Asia Limited (together with their affiliates, hereinafter “Morgan Stanley”), BofA Securities, Inc. (together with its affiliates, “BofA Securities”), Wells Fargo Securities, LLC (together with its affiliates, “Wells Fargo”), Academy Securities, Inc. (together with its affiliates, “Academy”) and Drexel Hamilton, LLC (together with its affiliates, “Drexel”, and collectively with Morgan Stanley, BofA Securities, Wells Fargo and Academy, the “Underwriters”). This material was not produced by an Underwriter’s research analyst, although it may refer to an Underwriter’s research analyst or research report. Unless otherwise indicated, these views (if any) are the author’s and may differ from those of the fixed income or equity research departments of the Underwriters or others in those firms.
This material may have been prepared by or in conjunction with the respective trading desks of the Underwriters that may deal as principal in or own or act as market maker or liquidity provider for the securities/instruments (or related derivatives) mentioned herein. The trading desk may have accumulated a position in the subject securities/instruments based on the information contained herein. Trading desk materials are not independent of the proprietary interests of the Underwriters, which may conflict with your interests. Each of the Underwriters may also perform or seek to perform investment banking services for the issuers of the securities and instruments mentioned herein.
The information contained in this material is preliminary as of the date hereof. This material is subject to change, completion or amendment from time to time. The information in this material supersedes information in any other communication relating to the securities referred to in this material; provided, that the information in this material will be superseded by similar information delivered to you as part of a preliminary prospectus. This material is not a solicitation to participate in any trading strategy, and is not an offer to sell any security or instrument or a solicitation of an offer to buy or sell any security or instrument in any jurisdiction where an offer, solicitation or sale is not permitted. Unless otherwise set forth in this material, any securities referred to in this material may not have been registered under the U.S. Securities Act of 1933, as amended, and, if not, may not be offered or sold absent an exemption therefrom. Recipients are required to comply with any legal or contractual restrictions on their purchase, holding, sale, exercise of rights or performance of obligations under any securities/instruments transaction.
The securities/instruments discussed in this material may not be suitable for all investors. This material has been prepared and issued by the Underwriters for intended distribution to market professionals and institutional investor clients. Other recipients should seek independent investment advice prior to making any investment decision based on this material. This material does not provide individually tailored investment advice or offer tax, regulatory, accounting or legal advice. Prior to entering into any proposed transaction, recipients should determine, in consultation with their own investment, legal, tax, regulatory and accounting advisors, the economic risks and merits, as well as the legal, tax, regulatory and accounting characteristics and consequences, of the transaction. You should consider this material as only a single factor in making an investment decision.
The value of and income from investments may vary because of changes in interest rates, foreign exchange rates, default rates, prepayment rates, securities/instruments prices, market indexes, operational or financial conditions of companies or other factors. There may be time limitations on the exercise of options or other rights in securities/instruments transactions. Past performance is not necessarily a guide to future performance. Estimates of future performance are based on assumptions that may not be realized. Actual events may differ from those assumed and changes to any assumptions may have a material impact on any projections or estimates. Other events not taken into account may occur and may significantly affect the projections or estimates. Certain assumptions may have been made for modeling purposes only to simplify the presentation and/or calculation of any projections or estimates, and the Underwriters do not represent that any such assumptions will reflect actual future events. Accordingly, there can be no assurance that estimated returns or projections will be realized or that actual returns or performance results will not materially differ from those estimated herein. Some of the information contained in this document may be aggregated data of transactions in securities or other financial instruments executed by an Underwriter that has been compiled so as not to identify the underlying transactions of any particular customer.
Notwithstanding anything herein to the contrary, the Underwriters and each recipient hereof (and their employees, representatives, and other agents) may disclose to any and all persons, without limitation of any kind from the commencement of discussions, the U.S. federal and state income tax treatment and tax structure of the transaction and all materials of any kind (including opinions or other tax analyses) that are provided to it relating to the tax treatment and tax structure (as such terms are defined in Treasury Regulation 1.6011-4). For this purpose, “tax structure” is limited to facts relevant to the U.S. federal and state income tax treatment of the transaction and does not include information relating to the identity of the parties, their affiliates, agents or advisors. This authorization of tax disclosure is retroactively effective to the commencement of discussions with prospective investors regarding the transactions contemplated herein.
THE DISTRIBUTION OF THIS MATERIAL (A) IF MADE BY A PERSON WHO IS NOT AN AUTHORIZED PERSON UNDER THE FINANCIAL SERVICES AND MARKETS ACT 2000 (“FSMA”), IS BEING MADE ONLY TO, OR DIRECTED ONLY AT, PERSONS WHO (I) ARE OUTSIDE THE UNITED KINGDOM, OR (II) HAVE PROFESSIONAL EXPERIENCE IN MATTERS RELATING TO INVESTMENTS AND QUALIFY AS INVESTMENT PROFESSIONALS IN ACCORDANCE WITH ARTICLE 19(5) OF THE FINANCIAL SERVICES AND MARKETS ACT 2000 (FINANCIAL PROMOTION) ORDER 2005 (AS AMENDED, THE “FINANCIAL PROMOTION ORDER”), OR (III) ARE PERSONS FALLING WITHIN ARTICLE 49(2)(A) THROUGH (D) (“HIGH NET WORTH COMPANIES, UNINCORPORATED ASSOCIATIONS, ETC.”) OF THE FINANCIAL PROMOTION ORDER OR, (IV) ARE PERSONS TO WHOM THIS MATERIAL MAY OTHERWISE LAWFULLY BE COMMUNICATED OR DIRECTED; AND (B) IF MADE BY A PERSON WHO IS AN AUTHORIZED PERSON UNDER THE FSMA, IS BEING MADE ONLY TO, OR DIRECTED ONLY AT, PERSONS WHO (I) ARE OUTSIDE THE UNITED KINGDOM, OR (II) HAVE PROFESSIONAL EXPERIENCE OF PARTICIPATING IN UNREGULATED SCHEMES (AS DEFINED FOR PURPOSES OF THE FINANCIAL SERVICES AND MARKETS ACT 2000 (PROMOTION OF COLLECTIVE INVESTMENT SCHEMES) (EXEMPTIONS) ORDER 2001 (AS AMENDED, THE “PROMOTION OF COLLECTIVE INVESTMENT SCHEMES EXEMPTIONS ORDER”)) AND QUALIFY AS INVESTMENT PROFESSIONALS IN ACCORDANCE WITH ARTICLE 14(5) OF THE PROMOTION OF COLLECTIVE INVESTMENT SCHEMES EXEMPTIONS ORDER, OR (III) ARE PERSONS FALLING WITHIN ARTICLE 22(2)(A) THROUGH (D) (HIGH NET WORTH COMPANIES, UNINCORPORATED ASSOCIATIONS, ETC.) OF THE PROMOTION OF COLLECTIVE INVESTMENT SCHEMES EXEMPTIONS ORDER, OR (IV) ARE PERSONS TO WHOM THE ISSUING ENTITY MAY LAWFULLY BE PROMOTED IN ACCORDANCE WITH SECTION 4.12 OF THE FCA HANDBOOK CONDUCT OF BUSINESS SOURCEBOOK.
THE OFFERED CERTIFICATES HAVE NOT BEEN AND WILL NOT BE REGISTERED UNDER THE FINANCIAL INSTRUMENTS AND EXCHANGE LAW OF JAPAN, AS AMENDED (THE “FIEL”), AND DISCLOSURE UNDER THE FIEL HAS NOT BEEN AND WILL NOT BE MADE WITH RESPECT TO THE OFFERED CERTIFICATES. ACCORDINGLY, EACH OF MORGAN STANLEY & CO. LLC, BOFA SECURITIES, INC., WELLS FARGO SECURITIES, LLC, Academy Securities, Inc. AND Drexel Hamilton, LLC HAS REPRESENTED AND AGREED THAT IT HAS NOT, DIRECTLY OR INDIRECTLY, OFFERED OR SOLD AND WILL NOT, DIRECTLY OR INDIRECTLY, OFFER OR SELL ANY OFFERED CERTIFICATES IN JAPAN OR TO, OR FOR THE BENEFIT OF, ANY RESIDENT OF JAPAN (WHICH TERM AS USED IN THIS MATERIAL MEANS ANY PERSON RESIDENT IN JAPAN, INCLUDING ANY CORPORATION OR OTHER ENTITY ORGANIZED UNDER THE LAWS OF JAPAN) OR TO OTHERS FOR REOFFERING OR RE SALE, DIRECTLY OR INDIRECTLY, IN JAPAN OR TO, OR FOR THE BENEFIT OF, ANY RESIDENT OF JAPAN EXCEPT PURSUANT TO AN EXEMPTION FROM THE REGISTRATION REQUIREMENTS OF, AND OTHERWISE IN COMPLIANCE WITH, THE FIEL AND OTHER RELEVANT LAWS, REGULATIONS AND MINISTERIAL GUIDELINES OF JAPAN. AS PART OF THIS OFFERING OF THE OFFERED CERTIFICATES, THE UNDERWRITERS MAY OFFER THE OFFERED CERTIFICATES IN JAPAN TO UP TO 49 OFFEREES IN ACCORDANCE WITH THE ABOVE PROVISIONS.
© 2021 Morgan Stanley