| FREE WRITING PROSPECTUS | ||
| FILED PURSUANT TO RULE 433 | ||
| REGISTRATION FILE NO.: 333-259741-06 | ||
 |  |  |  |
BANK5 2023-5YR2
Free Writing Prospectus
Structural and Collateral Term Sheet
$675,072,360
(Approximate Total Mortgage Pool Balance)
$573,178,000
(Approximate Offered Certificates)
Morgan Stanley Capital I Inc.
as Depositor
Wells Fargo Bank, National Association
JPMorgan Chase Bank, National Association
Morgan Stanley Mortgage Capital Holdings LLC
Bank of America, National Association
as Sponsors and Mortgage Loan Sellers
Commercial Mortgage Pass-Through Certificates
Series 2023-5YR2
June 20, 2023
| MORGAN STANLEY Co-Lead Bookrunner Manager | J.P. MORGAN Co-Lead Bookrunner | BofA SECURITIES Co-Lead Bookrunner | WELLS FARGO SECURITIES Co-Lead Bookrunner |
Academy Securities, Inc. Co-Manager | Siebert Williams Shank Co-Manager | Drexel Hamilton Co-Manager |
STATEMENT REGARDING THIS FREE WRITING PROSPECTUS
The depositor has filed a registration statement (including a prospectus) with the SEC (File No. 333-259741) for the offering to which this communication relates. Before you invest, you should read the prospectus in that registration statement and other documents the depositor has filed with the SEC for more complete information about the depositor, the issuing entity and this offering. You may get these documents for free by visiting EDGAR on the SEC web site at www.sec.gov. Alternatively, the depositor or any underwriter or any dealer participating in the offering will arrange to send you the prospectus if you request it by calling toll free 1-866-718-1649 or by email to prospectus@ms.com.
| This is not a research report and was not prepared by any Underwriter’s research department. Please see additional important information and qualifications at the end of this Term Sheet. | ||
| T-1 | ||
| BANK5 2023-5YR2 |
Neither this Term Sheet nor anything contained herein shall form the basis for any contract or commitment whatsoever. The information contained herein is preliminary as of the date hereof. This Term Sheet is subject to change, completion or amendment from time to time. The information contained herein supersedes information in any other communication relating to the securities described herein; provided, that the information contained herein will be superseded by similar information delivered to you as part of the Preliminary Prospectus. The information contained herein should be reviewed only in conjunction with the entire Preliminary Prospectus. All of the information contained herein is subject to the same limitations and qualifications contained in the Preliminary Prospectus. The information contained herein does not contain all relevant information relating to the underlying mortgage loans or mortgaged properties. Such information is described in the Preliminary Prospectus. The information contained herein will be more fully described in the Preliminary Prospectus. The information contained herein should not be viewed as projections, forecasts, predictions or opinions with respect to value. Prior to making any investment decision, prospective investors are strongly urged to read the Preliminary Prospectus in its entirety. Neither the Securities and Exchange Commission nor any state securities commission has approved or disapproved of these securities or determined if this Term Sheet is truthful or complete. Any representation to the contrary is a criminal offense.
Wells Fargo Securities is the trade name for the capital markets and investment banking services of Wells Fargo & Company and its subsidiaries, including but not limited to Wells Fargo Securities, LLC, a member of the New York Stock Exchange, Financial Industry Regulatory Authority (“FINRA”), the National Futures Association (“NFA”) and the Securities Investor Protection Corporation (“SIPC”), Wells Fargo Prime Services, LLC, a member of FINRA, NFA and SIPC, and Wells Fargo Bank, National Association. Wells Fargo Securities, LLC and Wells Fargo Prime Services, LLC are distinct entities from affiliated banks and thrifts.
BofA Securities is the marketing name for the global banking and global markets businesses of Bank of America Corporation. Lending, derivatives, and other commercial banking activities are performed globally by banking affiliates of Bank of America Corporation, including Bank of America, N.A., member FDIC. Securities, strategic advisory, and other investment banking activities are performed globally by investment banking affiliates of Bank of America Corporation, including, in the United States, BofA Securities, Inc., which is a registered broker-dealer and member of FINRA and SIPC, and, in other jurisdictions, locally registered entities.
IMPORTANT NOTICE RELATING TO AUTOMATICALLY GENERATED EMAIL DISCLAIMERS
Any legends, disclaimers or other notices that may appear at the bottom of, or attached to, the email communication to which this Term Sheet may have been attached are not applicable to this Term Sheet and should be disregarded. Such legends, disclaimers or other notices have been automatically generated as a result of this Term Sheet having been sent via Bloomberg or another email system.
IMPORTANT NOTICE REGARDING THE CONDITIONS FOR THIS OFFERING OF ASSET-BACKED SECURITIES
THE ASSET-BACKED SECURITIES REFERRED TO IN THIS TERM SHEET ARE BEING OFFERED WHEN, AS AND IF ISSUED. IN PARTICULAR, YOU ARE ADVISED THAT THE ASSET-BACKED SECURITIES, AND THE ASSET POOL BACKING THEM, ARE SUBJECT TO MODIFICATION OR REVISION (INCLUDING, AMONG OTHER THINGS, THE POSSIBILITY THAT ONE OR MORE CLASSES OF SECURITIES MAY BE SPLIT, COMBINED OR ELIMINATED), AT ANY TIME PRIOR TO ISSUANCE OR AVAILABILITY OF A FINAL PROSPECTUS. AS A RESULT, YOU MAY COMMIT TO PURCHASE SECURITIES THAT HAVE CHARACTERISTICS THAT MAY CHANGE, AND YOU ARE ADVISED THAT ALL OR A PORTION OF THE SECURITIES MAY NOT BE ISSUED THAT HAVE THE CHARACTERISTICS DESCRIBED IN THIS TERM SHEET. OUR OBLIGATION TO SELL SECURITIES TO YOU IS CONDITIONED ON THE SECURITIES AND THE UNDERLYING TRANSACTION HAVING THE CHARACTERISTICS DESCRIBED IN THIS TERM SHEET. IF WE DETERMINE THAT THE FOREGOING CONDITION IS NOT SATISFIED IN ANY MATERIAL RESPECT, WE WILL NOTIFY YOU, AND NEITHER THE ISSUING ENTITY NOR ANY UNDERWRITER WILL HAVE ANY OBLIGATION TO YOU TO DELIVER ALL OR ANY PORTION OF THE SECURITIES WHICH YOU HAVE COMMITTED TO PURCHASE, AND THERE WILL BE NO LIABILITY BETWEEN US AS A CONSEQUENCE OF THE NON-DELIVERY.
| This is not a research report and was not prepared by any Underwriter’s research department. Please see additional important information and qualifications at the end of this Term Sheet. | ||
| T-2 | ||
| BANK5 2023-5YR2 | Structural Overview |
Offered Certificates
| Class | Expected Ratings (Fitch/KBRA/Moody’s)(1) | Approximate Initial Certificate Balance or Notional Amount(2) | Approximate Initial Credit Support(3) | Pass-Through Rate Description | Expected Weighted Average Life (Years)(4) | Expected Principal Window (Months)(4) | Certificate Principal UW NOI Debt Yield(5) | Certificate Principal to Value Ratio(6) | |
| Class A-1 | AAAsf/AAA(sf)/Aaa(sf) | $5,300,000 | 30.000% | (7) | 2.57 | 1 – 56 | 19.9% | 34.9% | |
| Class A-2-1(8) | AAAsf/AAA(sf)/Aaa(sf) | (8) (9) | 30.000% | (7)(8) | (9) | (9) | 19.9% | 34.9% | |
| Class A-3(8) | AAAsf/AAA(sf)/Aaa(sf) | (8) (9) | 30.000% | (7)(8) | (9) | (9) | 19.9% | 34.9% | |
| Class X-A | AAAsf/AAA(sf)/Aaa(sf) | $448,923,000 | (10) | N/A | Variable IO(11) | N/A | N/A | N/A | N/A |
| Class X-B | AA-sf/AAA(sf)/NR | $103,412,000 | (10) | N/A | Variable IO(11) | N/A | N/A | N/A | N/A |
| Class A-S(8) | AAAsf/AAA(sf)/Aa2(sf) | $76,958,000 | (8) | 18.000% | (7)(8) | 4.93 | 59 – 59 | 17.0% | 40.8% |
| Class B(8) | AA-sf/AA-(sf)/NR | $26,454,000 | (8) | 13.875% | (7)(8) | 4.93 | 59 – 60 | 16.1% | 42.9% |
| Class C(8) | A-sf/A-(sf)/NR | $20,843,000 | (8) | 10.625% | (7)(8) | 5.01 | 60 – 60 | 15.6% | 44.5% |
Privately Offered Certificates(12)
| Class | Expected Ratings (Fitch/KBRA/Moody’s)(1) | Approximate Initial Certificate Balance or Notional Amount(2) | Approximate Initial Credit Support(3) | Pass-Through Rate Description | Expected Weighted Average Life (Years)(4) | Expected Principal Window (Months)(4) | Certificate Principal UW NOI Debt Yield(5) | Certificate Principal to Value Ratio(6) | |
| Class A-2-2 | AAAsf/AAA(sf)/Aaa(sf) | (9) | 30.000% | (7) | (9) | (9) | 19.9% | 34.9% | |
| Class X-D | BBB-sf/BBB-(sf)/NR | $22,446,000 | (10) | N/A | Variable IO(11) | N/A | N/A | N/A | N/A |
| Class X-F | BB-sf/BB(sf)/NR | $14,430,000 | (10) | N/A | Variable IO(11) | N/A | N/A | N/A | N/A |
| Class X-G | B-sf/B(sf)/NR | $10,421,000 | (10) | N/A | Variable IO(11) | N/A | N/A | N/A | N/A |
| Class X-H | NR/NR/NR | $20,843,741 | (10) | N/A | Variable IO(11) | N/A | N/A | N/A | N/A |
| Class D | BBBsf/BBB(sf)/NR | $15,231,000 | 8.250% | (7) | 5.01 | 60 – 60 | 15.1% | 45.7% | |
| Class E | BBB-sf/BBB-(sf)/NR | $7,215,000 | 7.125% | (7) | 5.01 | 60 – 60 | 15.0% | 46.3% | |
| Class F | BB-sf/BB(sf)/NR | $14,430,000 | 4.875% | (7) | 5.01 | 60 – 60 | 14.6% | 47.4% | |
| Class G | B-sf/B(sf)/NR | $10,421,000 | 3.250% | (7) | 5.01 | 60 – 60 | 14.4% | 48.2% | |
| Class H | NR/NR/NR | $20,843,741 | 0.000% | (7) | 5.01 | 60 – 60 | 13.9% | 49.8% | |
Non-Offered Eligible Vertical Interest(12)
| Class | Expected Ratings (Fitch/KBRA/Moody’s)(1) | Approximate Initial VRR Interest Balance(2) | Approximate Initial Credit Support(3) | VRR Interest Rate Description | Expected Weighted Average Life (Years)(4) | Expected Principal Window (Months)(4) | Certificate Principal UW NOI Debt Yield(5) | Certificate Principal to Value Ratio(6) |
| Class RR(13) | NR/NR/NR | $26,738,617.99 | N/A | (14) | 4.90 | 1 – 60 | N/A | N/A |
| RR Interest | NR/NR/NR | $7,015,000.00 | N/A | (14) | 4.90 | 1 – 60 | N/A | N/A |
| (1) | Ratings shown are those of Fitch Ratings, Inc. (“Fitch”), Kroll Bond Rating Agency, LLC (“KBRA”) and Moody’s Investors Service, Inc. (“Moody’s”). Certain nationally recognized statistical rating organizations that were not hired by the depositor may use information they receive pursuant to Rule 17g-5 under the Securities Exchange Act of 1934, as amended, or otherwise to rate the certificates. There can be no assurance as to what ratings a non-hired nationally recognized statistical rating organization would assign. See “Risk Factors—Other Risks Relating to the Certificates—Nationally Recognized Statistical Rating Organizations May Assign Different Ratings to the Certificates; Ratings of the Certificates Reflect Only the Views of the Applicable Rating Agencies as of the Dates Such Ratings Were Issued; Ratings May Affect ERISA Eligibility; Ratings May Be Downgraded” and “Ratings” in the Preliminary Prospectus to be dated on or about the date hereof (the “Preliminary Prospectus”). Capitalized terms used but not defined herein have the meanings assigned to such terms in the Preliminary Prospectus. |
| (2) | Approximate, subject to a permitted variance of plus or minus 5% and further subject to the discussion in footnote (9) below. In addition, the notional amounts of the Class X-A, Class X-B, Class X-D, Class X-F, Class X-G and Class X-H certificates may vary depending upon the final pricing of the classes of principal balance certificates or trust components whose certificate or principal balances comprise such notional amounts, and, if as a result of such pricing the pass-through rate of any class of the Class X-A, Class X-B, Class X-D, Class X-F, Class X-G or Class X-H certificates, as applicable, would be equal to zero at all times, such class of certificates will not be issued on the closing date of this securitization. |
| (3) | The approximate initial credit support percentages set forth for the certificates are approximate and, for the Class A-1, Class A-2-1, Class A-2-2 and Class A-3 certificates, are presented in the aggregate, taking into account the principal balances of the Class A-2-1 and Class A-3 trust components. The approximate initial credit support percentage set forth for each class of the Class A-S, Class B and Class C certificates represents the approximate credit support for the underlying trust component with the same alphanumeric designation. The VRR Interest provides credit support only to the limited extent that it is allocated a portion of any losses incurred on the underlying mortgage loans, which such losses are allocated between it, on the one hand, and to the certificates, on the other hand, pro rata in accordance with their respective Percentage Allocation Entitlements (as defined below). See “Credit Risk Retention” in the Preliminary Prospectus. |
| This is not a research report and was not prepared by any Underwriter’s research department. Please see additional important information and qualifications at the end of this Term Sheet. | ||
| T-3 | ||
| BANK5 2023-5YR2 | Structural Overview |
| (4) | The Expected Weighted Average Life and Expected Principal Window during which distributions of principal would be received as set forth in the foregoing table with respect to each class of principal balance certificates and the VRR Interest are based on the assumptions set forth under “Yield and Maturity Considerations—Weighted Average Life” in the Preliminary Prospectus and on the assumptions that there are no prepayments, modifications or losses in respect of the mortgage loans and that there are no extensions or forbearances of maturity dates or anticipated repayment dates of the mortgage loans. |
| (5) | Certificate Principal UW NOI Debt Yield for any class of principal balance certificates shown in the table above is calculated as the product of (a) the weighted average UW NOI Debt Yield for the mortgage pool, multiplied by (b) a fraction, the numerator of which is the sum of the aggregate initial certificate balance of all the principal balance certificates and the initial principal balance of the VRR Interest, and the denominator of which is the sum of (x) the aggregate of the initial certificate balance of the subject class of principal balance certificates (or, with respect to the Class A-2-1, Class A-3, Class A-S, Class B or Class C certificates, the initial principal balance of the trust component with the same alphanumeric designation) and the initial certificate balances of all other classes of principal balance certificates, if any, that are senior to such class and (y) the outstanding principal balance of the VRR Interest, multiplied by the applicable VRR Interest Computation Percentage. The Certificate Principal UW NOI Debt Yields of the Class A-1, Class A-2-1, Class A-2-2 and Class A-3 certificates are calculated in the aggregate for those classes as if they were a single class. With respect to any class of principal balance certificates, the “VRR Interest Computation Percentage” is equal to a fraction, expressed as a percentage, the numerator of which is the total initial certificate balance of the subject class of principal balance certificates (or, with respect to the Class A-2-1, Class A-3, Class A-S, Class B or Class C certificates, the initial principal balance of the trust component with the same alphanumeric designation) and all other classes of principal balance certificates, if any, that are senior to such class, and the denominator of which is the sum of the aggregate initial certificate balance of all the principal balance certificates. |
| (6) | Certificate Principal to Value Ratio for any class of principal balance certificates shown in the table above is calculated as the product of (a) the weighted average Cut-off Date LTV Ratio of the mortgage pool, multiplied by (b) a fraction, the numerator of which is the sum of (x) the aggregate of the initial certificate balance of the subject class of principal balance certificates (or, with respect to the Class A-2-1, Class A-3, Class A-S, Class B or Class C certificates, the initial principal balance of the trust component with the same alphanumeric designation) and the initial certificate balances of all other classes of principal balance certificates, if any, that are senior to such class and (y) the outstanding principal balance of the VRR Interest, multiplied by the applicable VRR Interest Computation Percentage, and the denominator of which is the sum of the aggregate initial certificate balance of all the principal balance certificates and the initial principal balance of the VRR Interest. The Certificate Principal to Value Ratios of the Class A-1, Class A-2-1, Class A-2-2 and Class A-3 certificates are calculated in the aggregate for those classes as if they were a single class. |
| (7) | The pass-through rate for each class of the Class A-1, Class A-2-1, Class A-2-2, Class A-3, Class A-S, Class B, Class C, Class D, Class E, Class F, Class G and Class H certificates for any distribution date will be one of the following: (i) a fixed rate per annum, (ii) a variable rate per annum equal to the weighted average of the net mortgage interest rates on the mortgage loans for the related distribution date, (iii) a variable rate per annum equal to the lesser of (a) a fixed rate and (b) the weighted average of the net mortgage interest rates on the mortgage loans for the related distribution date or (iv) a variable rate per annum equal to the weighted average of the net mortgage interest rates on the mortgage loans for the related distribution date minus a specified percentage. For purposes of the calculation of the weighted average of the net mortgage interest rates on the mortgage loans for each distribution date, the mortgage interest rates will be adjusted as necessary to a 30/360 basis. |
| (8) | The Class A-2-1-1, Class A-2-1-2, Class A-2-1-X1, Class A-2-1-X2, Class A-3-1, Class A-3-2, Class A-3-X1, Class A-3-X2, Class A-S-1, Class A-S-2, Class A-S-X1, Class A-S-X2, Class B-1, Class B-2, Class B-X1, Class B-X2, Class C-1, Class C-2, Class C-X1 and Class C-X2 certificates are also offered certificates. Such classes of certificates, together with the Class A-2-1, Class A-3, Class A-S, Class B and Class C certificates, constitute the “Exchangeable Certificates”. The Class A-1, Class A-2-2, Class D, Class E, Class F, Class G and Class H certificates, together with the Exchangeable Certificates with a certificate balance, are referred to as the “principal balance certificates.” Each class of Exchangeable Certificates will have the certificate balance or notional amount and pass-through rate described below under “Exchangeable Certificates.” Each class of Class A-2-1, Class A-3, Class A-S, Class B and Class C Exchangeable Certificates will have the same ratings as the Class A-2-1, Class A-3, Class A-S, Class B and Class C certificates, respectively, shown in the table above. |
| (9) | The exact initial principal balances or notional amounts of the Class A-2-1, Class A-2-1-X1, Class A-2-X2, Class A-3, Class A-3-X1 and Class A-3-X2 trust components (and consequently, the exact aggregate initial certificate balances or notional amounts of the Exchangeable Certificates with an “A-2-1” or “A-3” designation) are unknown and will be determined based on the final pricing of the certificates. The exact initial certificate balance of the Class A-2-2 certificates is also unknown and will be determined based on the final pricing of the certificates. However, the initial principal or certificate balances, weighted average lives and principal windows of the Class A-2-1 and Class A-3 trust components and Class A-2-2 certificates are expected to be within the applicable ranges reflected in the chart below. The aggregate of the initial principal balances of the Class A-2-1 and Class A-3 trust components and the initial certificate balance of the Class A-2-2 certificates is expected to be approximately $443,623,000, subject to a variance of plus or minus 5%. The Class A-2-1-X1 and Class A-2-1-X2 trust components will have initial notional amounts equal to the initial principal balance of the Class A-2-1 trust component. The Class A-3-X1 and Class A-3-X2 trust components will have initial notional amounts equal to the initial principal balance of the Class A-3 trust component. In the event that the Class A-3 trust component is issued with an initial certificate balance of $443,623,000, the Class A-2-1 trust component (and, correspondingly, the Class A-2-1 Exchangeable Certificates) and the Class A-2-2 certificates will not be issued. In the event that the Class A-2-1 trust component is issued with the maximum principal balance (i.e., with an initial principal balance of $200,000,000), the Class A-2-2 certificates will not be issued. For purposes of the disclosure herein regarding the aggregate certificate balance of the offered certificates, it is assumed that the aggregate initial principal balance of the Class A-2-1 and Class A-3 trust components will be $443,623,000, and the initial certificate balance of the Class A-2-2 certificates will be $0. |
| Trust Component or Class of Certificates | Expected Range of Initial Principal Balance or Initial Certificate Balance | Expected Range of Weighted Average Life (Years) | Expected Range of Principal Window (Months) |
| Class A-2-1 trust component | $0 – $200,000,000 | N/A – 4.86 | N/A / 56 – 59 |
| Class A-2-2 certificates | $0 – $100,000,000 | N/A – 4.86 | N/A / 56 – 59 |
| Class A-3 trust component | $243,623,000 – $443,623,000 | 4.90 – 4.93 | 56 – 59 / 59 – 59 |
| (10) | The Class X-A, Class X-B, Class X-D, Class X-F, Class X-G and Class X-H certificates (collectively referred to as the “Class X certificates”) are notional amount certificates and will not be entitled to distributions of principal. The notional amount of the Class X-A certificates will be equal to the aggregate certificate or principal balance of the Class A-1 and Class A-2-2 certificates and the Class A-2-1 and Class A-3 trust components outstanding from time to time. The notional amount of the Class X-B certificates will be equal to the aggregate principal balance of the Class A-S and Class B trust components outstanding from time to time. The notional amount of the Class X-D certificates will be equal to the aggregate certificate balance of the Class D and Class E certificates. The notional amount of each class of the Class X-F, Class X-G and Class X-H certificates will be equal to the certificate balance of the class of principal balance certificates that, with the addition of “X-,” has the same alphabetical designation as the subject class of Class X certificates. |
| (11) | The pass-through rate for the Class X-A certificates for any distribution date will be a per annum rate equal to the excess, if any, of (a) the weighted average of the net mortgage interest rates on the mortgage loans for the related distribution date, over (b) the weighted average of the pass-through rates on the Class A-1 and Class A-2-2 certificates and the Class A-2-1, Class A-2-1-X1, Class A-2-1-X2, Class A-3, Class A-3-X1 and Class A-3-X2 trust components for the related distribution date, weighted on the basis of their respective certificate or principal balances or notional amounts outstanding immediately prior to that distribution date (but excluding trust components with a notional amount in the denominator of such weighted average calculation). The pass-through rate for |
| This is not a research report and was not prepared by any Underwriter’s research department. Please see additional important information and qualifications at the end of this Term Sheet. | ||
| T-4 | ||
| BANK5 2023-5YR2 | Structural Overview |
| the Class X-B certificates for any distribution date will be a per annum rate equal to the excess, if any, of (a) the weighted average of the net mortgage interest rates on the mortgage loans for the related distribution date, over (b) the weighted average of the pass-through rates on the Class A-S, Class A-S-X1, Class A-S-X2, Class B, Class B-X1 and Class B-X2 trust components for the related distribution date, weighted on the basis of their respective principal balances or notional amounts outstanding immediately prior to that distribution date (but excluding trust components with a notional amount in the denominator of such weighted average calculation). The pass-through rate for the Class X-D certificates for any distribution date will be a per annum rate equal to the excess, if any, of (a) the weighted average of the net mortgage interest rates on the mortgage loans for the related distribution date, over (b) the weighted average of the pass-through rates on the Class D and Class E certificates for the related distribution date, weighted on the basis of their respective certificate balances outstanding immediately prior to that distribution date. The pass-through rate for each class of the Class X-F, Class X-G and Class X-H certificates for any distribution date will be a per annum rate equal to the excess, if any, of (a) the weighted average of the net mortgage interest rates on the mortgage loans for the related distribution date, over (b) the pass-through rate for the related distribution date on the class of principal balance certificates that, with the addition of “X-,” has the same alphabetical designation as the subject class of Class X certificates. For purposes of the calculation of the weighted average of the net mortgage interest rates on the mortgage loans for each distribution date, the mortgage interest rates will be adjusted as necessary to a 30/360 basis. |
| (12) | Not offered pursuant to the Preliminary Prospectus or this Term Sheet. Information provided in this Term Sheet regarding the characteristics of these certificates and the VRR Interest is provided only to enhance your understanding of the offered certificates. The privately offered certificates also include the Class V and Class R certificates, which do not have a certificate balance, notional amount, credit support, pass-through rate, rating, assumed final distribution date or rated final distribution date, and which are not shown in the chart. The Class V certificates represent a beneficial ownership interest held through the grantor trust in a specified percentage of certain excess interest in respect of mortgage loans having anticipated repayment dates, if any. The Class R certificates represent the beneficial ownership of the residual interest in each of the real estate mortgage investment conduits, as further described in the Preliminary Prospectus. |
| (13) | The Class RR certificates will be certificated but will not be “certificates” for purposes of this Term Sheet. |
| (14) | Although they do not have a specified pass-through rate (other than for tax reporting purposes), the effective pass-through rate for each of the Class RR Certificates and the RR Interest will be a variable rate per annum equal to the weighted average of the net mortgage interest rates on the mortgage loans for the related distribution date (in each case adjusted, if necessary, to accrue on the basis of a 360-day year consisting of twelve 30-day months). |
| This is not a research report and was not prepared by any Underwriter’s research department. Please see additional important information and qualifications at the end of this Term Sheet. | ||
| T-5 | ||
| BANK5 2023-5YR2 | Structural Overview |
Issue Characteristics
| Offered Certificates: | $573,178,000 (approximate) monthly pay, multi-class, commercial mortgage pass-through certificates, consisting of 16 principal balance classes (Class A-1, Class A-2-1, Class A-2-1-1, Class A-2-1-2, Class A-3, Class A-3-1, Class A-3-2, Class A-S, Class A-S-1, Class A-S-2, Class B, Class B-1, Class B-2, Class C, Class C-1 and Class C-2) and 12 interest-only classes (Class A-2-1-X1, Class A-2-1-X2, Class A-3-X1, Class A-3-X2, Class X-A, Class X-B, Class A-S-X1, Class A-S-X2, Class B-X1, Class B-X2, Class C-X1 and Class C-X2) |
| Co-Lead Managers and Joint Bookrunners: | Morgan Stanley & Co. LLC, Wells Fargo Securities, LLC, J.P. Morgan Securities LLC and BofA Securities, Inc. |
| Co-Managers: | Academy Securities, Inc., Drexel Hamilton, LLC and Siebert Williams Shank & Co., LLC |
| Mortgage Loan Sellers: | Wells Fargo Bank, National Association, JPMorgan Chase Bank, National Association, Morgan Stanley Mortgage Capital Holdings LLC and Bank of America, National Association. |
| Rating Agencies: | Fitch, KBRA and Moody’s |
| Master Servicer: | Wells Fargo Bank, National Association |
| Special Servicer: | CWCapital Asset Management LLC |
| Trustee/Certificate Administrator/ Certificate Registrar/Custodian: | Computershare Trust Company, National Association |
| Operating Advisor: | Park Bridge Lender Services LLC |
| Asset Representations Reviewer: | Park Bridge Lender Services LLC |
| Initial Directing Certificateholder: | BIG Real Estate 5YR2, LLC or an affiliate thereof |
| Risk Retention Consultation Party: | Bank of America, National Association |
| U.S. Credit Risk Retention: | For a discussion on the manner in which the U.S. credit risk retention requirements will be addressed by Bank of America, National Association, as the retaining sponsor, see “Credit Risk Retention” in the Preliminary Prospectus. |
| EU/UK Risk Retention: | None of the sponsors, the depositor or the underwriters or their respective affiliates, or any other person, intends to retain a material net economic interest in the securitization constituted by the issue of the certificates, or to take any other action in respect of such securitization, in a manner prescribed or contemplated by the EU Securitization Regulation or the UK Securitization Regulation. In particular, no such person undertakes to take any action which may be required by any potential investor or certificateholder for the purposes of its compliance with any requirement of the EU Securitization Regulation or the UK Securitization Regulation. In addition, the arrangements described under “Credit Risk Retention” in the Preliminary Prospectus have not been structured with the objective of ensuring compliance by any person with any requirement of the EU Securitization Regulation or the UK Securitization Regulation. Consequently, the Offered Certificates may not be a suitable investment for investors that are subject to any requirement of the EU Securitization Regulation or the UK Securitization Regulation. See “Risk Factors—Other Risks Relating to the Certificates—EU Securitization Regulation and UK Securitization Regulation” in the Preliminary Prospectus. |
| Cut-off Date: | The mortgage loans will be considered part of the trust fund as of their respective cut-off dates. The cut-off date with respect to each mortgage loan is the respective due date for the monthly debt service payment that is due in July 2023 (or, in the case of any mortgage loan that has its first due date after July 2023, the date that would have been its due date in July 2023 under the terms of that mortgage loan if a monthly debt service payment were scheduled to be due in that month). |
| Expected Pricing Date: | Week of June 19, 2023 |
| Expected Closing Date: | July 11, 2023 |
| Determination Dates: | The 11th day of each month or, if the 11th day is not a business day, then the business day immediately following such 11th day. |
| Distribution Dates: | The 4th business day following each determination date. The first distribution date will be in August 2023. |
| Rated Final Distribution Date: | The distribution date in July 2056 |
| Interest Accrual Period: | Preceding calendar month |
| Payment Structure: | Sequential pay |
| Tax Treatment: | REMIC, except that the Exchangeable Certificates will evidence interests in a grantor trust |
| Optional Termination: | 1.00% clean-up call |
| Minimum Denominations: | $10,000 for each class of Offered Certificates (other than Class X-A and Class X-B certificates); $1,000,000 for the Class X-A and Class X-B certificates |
| Settlement Terms: | DTC, Euroclear and Clearstream |
| Legal/Regulatory Status: | Each class of Offered Certificates is expected to be eligible for exemptive relief under ERISA. Until the SEC adopts rules establishing a different creditworthiness standard, the Class A-1 certificates, the Class A-2-1 Exchangeable Certificates, the Class A-2-2 certificates, the Class A-3 Exchangeable Certificates, the Class X- |
| This is not a research report and was not prepared by any Underwriter’s research department. Please see additional important information and qualifications at the end of this Term Sheet. | ||
| T-6 | ||
| BANK5 2023-5YR2 | Structural Overview |
| A certificates, the Class X-B certificates, the Class A-S Exchangeable Certificates and the Class B Exchangeable Certificates will constitute “mortgage related securities” for purposes of SMMEA, so long as they are rated in one of the two highest rating categories by one of the rating agencies or another NRSRO, and the other classes of certificates will not constitute “mortgage related securities” for purposes of SMMEA. | |
| Analytics: | The certificate administrator is expected to make available all distribution date statements, CREFC® reports and supplemental notices received by it to certain modeling financial services as described in the Preliminary Prospectus. |
| Bloomberg Ticker: | BANK5 2023-5YR2<MTGE><GO> |
| Risk Factors: | THE CERTIFICATES INVOLVE CERTAIN RISKS AND MAY NOT BE SUITABLE FOR ALL INVESTORS. SEE THE “RISK FACTORS” SECTION OF THE PRELIMINARY PROSPECTUS. |
| This is not a research report and was not prepared by any Underwriter’s research department. Please see additional important information and qualifications at the end of this Term Sheet. | ||
| T-7 | ||
| BANK5 2023-5YR2 | Structural Overview |
Structural Overview
| Allocation Between the VRR Interest and the Certificates: | The aggregate amount available for distributions to the holders of the certificates and the VRR Interest on each distribution date (net of specified expenses of the issuing entity, including fees payable to, and costs and expenses reimbursable to, each applicable master servicer, primary servicer and special servicer, the certificate administrator, the trustee, the operating advisor, the asset representations reviewer and CREFC®) will be allocated between amounts available for distribution to the holders of the VRR Interest, on the one hand, and to the holders of the certificates (other than the Class V and Class R Certificates), on the other hand. The portion of such amount allocable to (a) the VRR Interest will at all times be the product of such amount multiplied by 5% and (b) the certificates will at all times be the product of such amount multiplied by the difference between 100% and the percentage set forth in clause (a) (each, the respective “Percentage Allocation Entitlement”). The Class RR Certificates and the RR Interest will collectively constitute an “eligible vertical interest” (as such term is defined in the Credit Risk Retention Rules), which is expected to be acquired and retained by certain of the sponsors as described under “Credit Risk Retention” in the Preliminary Prospectus. The Class RR Certificates and the RR Interest collectively comprise the “VRR Interest”. |
| Accrual: | Each class of Offered Certificates will accrue interest on a 30/360 basis. |
| Amount and Order of Distributions: | On each distribution date, the certificates’ Percentage Allocation Entitlement of funds available for distribution from the mortgage loans, net of (i) any yield maintenance charges and prepayment premiums and (ii) any excess interest, will be distributed in the following amounts and order of priority: First, to the Class A-1, Class A-2-2, Class X-A, Class X-B, Class X-D, Class X-F, Class X-G and Class X-H certificates and the Class A-2-1, Class A-2-1-X1, Class A-2-1-X2, Class A-3, Class A-3-X1 and Class A-3-X2 trust components, in respect of interest, up to an amount equal to, and pro rata in accordance with, the interest entitlements for those classes of certificates and trust components; Second, to the Class A-1 and Class A-2-2 certificates and the Class A-2-1 and Class A-3 trust components as follows, to the extent of applicable available funds allocated to principal: either (i)(a) first, to principal on (a) the Class A-1 certificates, (b) the Class A-2-1 trust component and the Class A-2-2 certificates, pro rata, and (c) the Class A-3 trust component, in that order, in each case until the certificate or principal balance of the applicable class of certificates or trust component has been reduced to zero, or (ii) if the certificate or principal balance of each class of principal balance certificates and trust components other than the Class A-1 and Class A-2-2 certificates, the Class A-2-1 and Class A-3 trust components has been reduced to zero as a result of the allocation of losses on the mortgage loans to those certificates and trust components, to principal on the Class A-1 and Class A-2-2 certificates and the Class A-2-1 and Class A-3 trust components, pro rata, without regard to the distribution priorities described above; Third, to the Class A-1 and Class A-2-2 certificates and the Class A-2-1 and Class A-3 trust components, first, up to an amount equal to, and pro rata based on, any previously unreimbursed losses on the mortgage loans allocable to principal that were previously borne by each such class or trust component and then in the amount of interest thereon; Fourth, to the Class A-S, Class A-S-X1 and Class A-S-X2 trust components, as follows: (a) to each such trust component in respect of interest, up to an amount equal to, and pro rata in accordance with, the interest entitlements for those trust components; (b) to the extent of applicable available funds allocable to principal remaining after distributions in respect of principal to each class of certificates or trust component with a higher priority (as set forth in prior enumerated clauses set forth above), to principal on the Class A-S trust component until its principal balance has been reduced to zero; and (c) to reimburse the Class A-S trust component, first, in the amount of any previously unreimbursed losses on the mortgage loans that were previously allocated thereto, then in the amount of interest thereon; Fifth, to the Class B, Class B-X1 and Class B-X2 trust components, as follows: (a) to each such trust component in respect of interest, up to an amount equal to, and pro rata in accordance with, the interest entitlements for those trust components; (b) to the extent of applicable available funds allocable to principal remaining after distributions in respect of principal to each class of certificates or trust component with a higher priority (as set forth in prior enumerated clauses set forth above), to principal on the Class B trust component until its principal balance has been reduced to zero; and (c) to reimburse the Class B trust component, first, in the amount of any previously unreimbursed losses on the mortgage loans that were previously allocated thereto, then in the amount of interest thereon; Sixth, to the Class C, Class C-X1 and Class C-X2 trust components, as follows: (a) to each such trust component in respect of interest, up to an amount equal to, and pro rata in accordance with, the interest entitlements for those trust components; (b) to the extent of applicable available funds allocable to principal remaining after distributions in respect of principal to each class of certificates or trust component with a higher priority (as set forth in prior enumerated clauses set forth above), to principal on the Class C trust component until its principal balance has been reduced to zero; and (c) to reimburse the Class C trust component, first, in the amount of any previously unreimbursed losses on the mortgage loans that were previously allocated thereto, then in the amount of interest thereon; Seventh, to the Class D, Class E, Class F, Class G and Class H certificates in the amounts and order of priority described in “Description of the Certificates—Distributions” in the Preliminary Prospectus; and Eighth, to the Class R certificates, any remaining amounts. |
| This is not a research report and was not prepared by any Underwriter’s research department. Please see additional important information and qualifications at the end of this Term Sheet. | ||
| T-8 | ||
| BANK5 2023-5YR2 | Structural Overview |
Principal and interest payable on each trust component will be distributed pro rata to the corresponding classes of Exchangeable Certificates representing interests therein in accordance with their Class Percentage Interests therein as described below under “Exchangeable Certificates.” | |
| Interest and Principal Entitlements: | The interest entitlement of each class of Offered Certificates on each distribution date generally will be the interest accrued during the related interest accrual period on the related certificate balance or notional amount at the related pass-through rate, net of any prepayment interest shortfalls allocated to that class for such distribution date as described below. If prepayment interest shortfalls arise from voluntary prepayments on serviced mortgage loans during any collection period, the applicable master servicer is required to make a limited compensating interest payment to offset those shortfalls. See “Description of the Certificates—Prepayment Interest Shortfalls” in the Preliminary Prospectus. The remaining amount of prepayment interest shortfalls will be allocated between the VRR Interest, on one hand, and the certificates, on the other hand, in accordance with their respective Percentage Allocation Entitlements. The prepayment interest shortfalls allocated to the certificates will be allocated among such classes of certificates (other than the Exchangeable Certificates) and trust components that are entitled to interest, on a pro rata basis, based on their respective amounts of accrued interest for the related distribution date, to reduce the interest entitlement on each such class of certificates and trust components. For any distribution date, prepayment interest shortfalls allocated to a trust component will be allocated among the related classes of Exchangeable Certificates, pro rata, in accordance with their respective class percentage interests for that distribution date. If a class of certificates or trust component receives less than the entirety of its interest entitlement on any distribution date, then the shortfall (excluding any shortfall due to prepayment interest shortfalls), together with interest thereon, will be added to its interest entitlement for the next succeeding distribution date. The aggregate principal distribution amount for each distribution date generally will be the aggregate amount of principal received or advanced in respect of the mortgage loans, net of any non-recoverable advances and interest thereon and any workout-delayed reimbursement amounts that are reimbursed to the applicable master servicer or the trustee during the related collection period. Non-recoverable advances and interest thereon are reimbursable from principal collections before reimbursement from other amounts. Workout-delayed reimbursement amounts will be reimbursable from principal collections. The certificates and the VRR Interest will be entitled to their respective Percentage Allocation Entitlements of the aggregate principal distribution amount. |
| Exchangeable Certificates: | Certificates of each class of Exchangeable Certificates may be exchanged for certificates of the corresponding classes of Exchangeable Certificates set forth next to such class in the table below, and vice versa. Following any exchange of certificates of one or more classes of Exchangeable Certificates (the applicable “Surrendered Classes”) for certificates of one or more classes of other Exchangeable Certificates (the applicable “Received Classes”), the Class Percentage Interests (as defined below) of the outstanding principal balances or notional amounts of the Corresponding Trust Components that are represented by the Surrendered Classes (and consequently their related certificate balances or notional amounts) will be decreased, and those of the Received Classes (and consequently their related certificate balances or notional amounts) will be increased. The dollar denomination of the certificates of each of the Received Classes must be equal to the dollar denomination of the certificates of each of the Surrendered Classes. No fee will be required with respect to any exchange of Exchangeable Certificates. |
| Surrendered Classes (or Received Classes) of Certificates | Received Classes (or Surrendered Classes) of Certificates | |
| Class A-2-1 | Class A-2-1-1, Class A-2-1-X1 | |
| Class A-2-1 | Class A-2-1-2, Class A-2-1-X2 | |
| Class A-3 | Class A-3-1, Class A-3-X1 | |
| Class A-3 | Class A-3-2, Class A-3-X2 | |
| Class A-S | Class A-S-1, Class A-S-X1 | |
| Class A-S | Class A-S-2, Class A-S-X2 | |
| Class B | Class B-1, Class B-X1 | |
| Class B | Class B-2, Class B-X2 | |
| Class C | Class C-1, Class C-X1 | |
| Class C | Class C-2, Class C-X2 |
| On the closing date, the issuing entity will issue the following “trust components,” each with the initial principal balance (or, if such trust component has an “X” suffix, notional amount) and pass-through rate set forth next to it in the table below. Each trust component with an “X” suffix will not be entitled to distributions of principal. |
| Trust Component | Initial Principal Balance or Notional Amount | Pass-Through Rate | |
| Class A-2-1 | See footnote (9) to the first table above under “Structural Overview” | Class A-2-1 certificate pass-through rate minus 1.00% | |
| Class A-2-1-X1 | Equal to Class A-2-1 trust component principal balance | 0.50% | |
| Class A-2-1-X2 | Equal to Class A-2-1 trust component principal balance | 0.50% | |
| Class A-3 | See footnote (9) to the first table above under “Structural Overview” | Class A-3 certificate pass-through rate minus 1.00% |
| This is not a research report and was not prepared by any Underwriter’s research department. Please see additional important information and qualifications at the end of this Term Sheet. | ||
| T-9 | ||
| BANK5 2023-5YR2 | Structural Overview |
| Class A-3-X1 | Equal to Class A-3 trust component principal balance | 0.50% | |
| Class A-3-X2 | Equal to Class A-3 trust component principal balance | 0.50% | |
| Class A-S | $76,958,000 | Class A-S certificate pass-through rate minus 1.00% | |
| Class A-S-X1 | Equal to Class A-S trust component principal balance | 0.50% | |
| Class A-S-X2 | Equal to Class A-S trust component principal balance | 0.50% | |
| Class B | $26,454,000 | Class B certificate pass-through rate minus 1.00% | |
| Class B-X1 | Equal to Class B trust component principal balance | 0.50% | |
| Class B-X2 | Equal to Class B trust component principal balance | 0.50% | |
| Class C | $20,843,000 | Class C certificate pass-through rate minus 1.00% | |
| Class C-X1 | Equal to Class C trust component principal balance | 0.50% | |
| Class C-X2 | Equal to Class C trust component principal balance | 0.50% |
| Each class of Exchangeable Certificates represents an undivided beneficial ownership interest in the trust components set forth next to it in the table below (the “Corresponding Trust Components”). Each class of Exchangeable Certificates has a pass-through rate equal to the sum of the pass-through rates of the Corresponding Trust Components and represents a percentage interest (the related “Class Percentage Interest”) in each Corresponding Trust Component, including principal and interest payable thereon (and reimbursements of losses allocable thereto), equal to (x) the certificate balance (or, if such class has an “X” suffix, notional amount) of such class of certificates, divided by (y) the principal balance of the Class A-2-1 trust component (if such class of Exchangeable Certificates has an “A-2-1” designation), the Class A-3 trust component (if such class of Exchangeable Certificates has an “A-3” designation), the Class A-S trust component (if such class of Exchangeable Certificates has an “A-S” designation), the Class B trust component (if such class of Exchangeable Certificates has a “B” designation), or the Class C trust component (if such class of Exchangeable Certificates has a “C” designation). |
| Group of Exchangeable Certificates | Class of Exchangeable Certificates | Corresponding Trust Components | |
| “Class A-2-1 Exchangeable Certificates” | Class A-2-1 | Class A-2-1, Class A-2-1-X1, Class A-2- 1-X2 | |
| Class A-2-1-1 | Class A-2-1, Class A-2-1-X2 | ||
| Class A-2-1-2 | Class A-2-1 | ||
| Class A-2-1-X1 | Class A-2-1-X1 | ||
| Class A-2-1-X2 | Class A-2-1-X1, Class A-2-1-X2 | ||
| “Class A-3 Exchangeable Certificates” | Class A-3 | Class A-3, Class A-3-X1, Class A-3-X2 | |
| Class A-3-1 | Class A-3, Class A-3-X2 | ||
| Class A-3-2 | Class A-3 | ||
| Class A-3-X1 | Class A-3-X1 | ||
| Class A-3-X2 | Class A-3-X1, Class A-3-X2 | ||
| “Class A-S Exchangeable Certificates” | Class A-S | Class A-S, Class A-S-X1, Class A-S-X2 | |
| Class A-S-1 | Class A-S, Class A-S-X2 | ||
| Class A-S-2 | Class A-S | ||
| Class A-S-X1 | Class A-S-X1 | ||
| Class A-S-X2 | Class A-S-X1, Class A-S-X2 | ||
| “Class B Exchangeable Certificates” | Class B | Class B, Class B-X1, Class B-X2 | |
| Class B-1 | Class B, Class B-X2 | ||
| Class B-2 | Class B | ||
| Class B-X1 | Class B-X1 | ||
| Class B-X2 | Class B-X1, Class B-X2 | ||
| “Class C Exchangeable Certificates” | Class C | Class C, Class C-X1, Class C-X2 | |
| Class C-1 | Class C, Class C-X2 | ||
| Class C-2 | Class C | ||
| Class C-X1 | Class C-X1 | ||
| Class C-X2 | Class C-X1, Class C-X2 |
| This is not a research report and was not prepared by any Underwriter’s research department. Please see additional important information and qualifications at the end of this Term Sheet. | ||
| T-10 | ||
| BANK5 2023-5YR2 | Structural Overview |
| The maximum certificate balance or notional amount of each class of Class A-2-1 Exchangeable Certificates, Class A-3 Exchangeable Certificates, Class A-S Exchangeable Certificates, Class B Exchangeable Certificates or Class C Exchangeable Certificates that could be issued in an exchange is equal to the principal balance of the Class A2-1, Class A-3, Class A-S, Class B or Class C trust component, respectively. The maximum certificate balances of Class A-2-1, Class A-3, Class A-S, Class B and Class C certificates (subject to the constraint on the aggregate of the initial principal balances of the Class A-2-1 and Class A-3 trust components and the initial certificate balance of the Class A-2-2 certificates discussed in footnote (9) to the first table above under “Structural Overview”) will be issued on the closing date, and the certificate balance or notional amount of each other class of Exchangeable Certificates will be equal to zero on the closing date. | |
| Each class of Class A-2-1 Exchangeable Certificates, Class A-3 Exchangeable Certificates, Class A-S Exchangeable Certificates, Class B Exchangeable Certificates and Class C Exchangeable Certificates will have a certificate balance or notional amount equal to its Class Percentage Interest multiplied by the principal balance of the Class A-2-1, Class A-3, Class A-S, Class B or Class C trust component, respectively. Each class of Class A-2-1 Exchangeable Certificates, Class A-3 Exchangeable Certificates, Class A-S Exchangeable Certificates, Class B Exchangeable Certificates and Class C Exchangeable Certificates with a certificate balance will have the same approximate initial credit support percentage, Expected Weighted Average Life, Expected Principal Window, Certificate Principal UW NOI Debt Yield and Certificate Principal to Value Ratio as the Class A-2-1, Class A-3, Class A-S, Class B or Class C certificates, respectively, shown above. | |
| Special Servicer Compensation: | The principal compensation to be paid to a special servicer in respect of its special servicing activities will be the special servicing fee, the workout fee and the liquidation fee. The special servicing fee for each distribution date is calculated based on the outstanding principal balance of each serviced mortgage loan that is a specially serviced mortgage loan (and any related serviced companion loan) or as to which the related mortgaged property has become an REO property at the special servicing fee rate, which will be a rate equal to the greater of 0.25% per annum and the per annum rate that would result in a special servicing fee for the related month of $3,500. The special servicing fee will be payable monthly, first, from liquidation proceeds, insurance and condemnation proceeds, and other collections in respect of the related specially serviced mortgage loan or REO property and, then, from general collections on all the mortgage loans and any REO properties. Each applicable special servicer will also be entitled to (i) liquidation fees generally equal to 1.0% (or, with respect to the Back Bay Whole Loan, 0.75%) (or, in any case, if such rate would result in an aggregate liquidation fee less than $25,000, then the liquidation fee rate will be equal to the lesser of (i) 3.00% and (ii) such rate as would result in an aggregate liquidation fee equal to $25,000) of liquidation proceeds and certain other collections in respect of each non-specially serviced loan with respect to which it acts as the enforcing servicer or each specially serviced mortgage loan (and any related serviced companion loan) or related REO property and of amounts received in respect of mortgage loan repurchases by the related mortgage loan sellers and (ii) workout fees generally equal to 1.0% (or, with respect to the Back Bay Whole Loan, 0.75%) of interest (other than post-ARD excess interest on mortgage loans with anticipated repayment dates and other than default interest) and principal payments made in respect of a rehabilitated mortgage loan (and any related serviced companion loan), subject to a floor of $25,000 with respect to any mortgage loan, whole loan or related REO property, and in the case of each of clause (i) and (ii), subject to certain adjustments and exceptions as described in the Preliminary Prospectus under “Pooling and Servicing Agreement—Servicing and Other Compensation and Payment of Expenses—Special Servicing Compensation”. With respect to any non-serviced mortgage loan, the related special servicer under the related other pooling and servicing agreement pursuant to which such mortgage loan is being serviced will be entitled to similar compensation as that described above with respect to such non-serviced mortgage loan under such other pooling and servicing agreement as further described in the Preliminary Prospectus, although any related fees may accrue at a different rate and there may be a higher (or no) cap on liquidation and workout fees. |
| Prepayment Premiums/Yield Maintenance Charges: | If any yield maintenance charge or prepayment premium is collected during any collection period with respect to any mortgage loan, then on the immediately succeeding distribution date, the certificate administrator will pay: (1) to the classes of certificates specified below, in the following amounts: (a) to the holders of each class of the Class A-1, Class A-2-1, Class A-2-1-1, Class A-2-1-2, Class A-2-2, Class A-3, Class A-3-1, Class A-3-2, Class A-S, Class A-S-1, Class A-S-2, Class B, Class B-1, Class B-2, Class C, Class C-1, Class C-2, Class D and Class E certificates, the product of (x) the certificates’ Percentage Allocation Entitlement of such yield maintenance charge or prepayment premium, (y) the related Base Interest Fraction for such class and the applicable principal prepayment, and (z) a fraction, the numerator of which is equal to the amount of principal distributed to such class for that distribution date, and the denominator of which is the total amount of principal distributed to the Class A-1, Class A-2-2, Class D and Class E certificates and the Class A-2-1 Exchangeable Certificates, the Class A-3 Exchangeable Certificates, the Class A-S Exchangeable Certificates, the Class B Exchangeable Certificates and the Class C Exchangeable Certificates for that distribution date, |
| This is not a research report and was not prepared by any Underwriter’s research department. Please see additional important information and qualifications at the end of this Term Sheet. | ||
| T-11 | ||
| BANK5 2023-5YR2 | Structural Overview |
| (b) to the holders of the Class A-2-1-X1 certificates, the product of (x) the certificates’ Percentage Allocation Entitlement of such yield maintenance charge or prepayment premium, (y) a fraction, the numerator of which is equal to the amount of principal distributed to the Class A-2-1-1 certificates for that distribution date, and the denominator of which is the total amount of principal distributed to the Class A-1, Class A-2-2, Class D and Class E certificates and the Class A-2-1 Exchangeable Certificates, the Class A-3 Exchangeable Certificates, the Class A-S Exchangeable Certificates, the Class B Exchangeable Certificates and the Class C Exchangeable Certificates for that distribution date, and (z) the difference between (1) the Base Interest Fraction for the Class A-2-1 certificates and the applicable principal prepayment and (2) the Base Interest Fraction for the Class A-2-1-1 certificates and the applicable principal prepayment, (c) to the holders of the Class A-2-1-X2 certificates, the product of (x) the certificates’ Percentage Allocation Entitlement of such yield maintenance charge or prepayment premium, (y) a fraction, the numerator of which is equal to the amount of principal distributed to the Class A-2-1-2 certificates for that distribution date, and the denominator of which is the total amount of principal distributed to the Class A-1, Class A-2-2, Class D and Class E certificates and the Class A-2-1 Exchangeable Certificates, the Class A-3 Exchangeable Certificates, the Class A-S Exchangeable Certificates, the Class B Exchangeable Certificates and the Class C Exchangeable Certificates for that distribution date, and (z) the difference between (1) the Base Interest Fraction for the Class A-2-1 certificates and the applicable principal prepayment and (2) the Base Interest Fraction for the Class A-2-1-2 certificates and the applicable principal prepayment, (d) to the holders of the Class A-3-X1 certificates, the product of (x) the certificates’ Percentage Allocation Entitlement of such yield maintenance charge or prepayment premium, (y) a fraction, the numerator of which is equal to the amount of principal distributed to the Class A-3-1 certificates for that distribution date, and the denominator of which is the total amount of principal distributed to the Class A-1, Class A-2-2, Class D and Class E certificates and the Class A-2-1 Exchangeable Certificates, the Class A-3 Exchangeable Certificates, the Class A-S Exchangeable Certificates, the Class B Exchangeable Certificates and the Class C Exchangeable Certificates for that distribution date, and (z) the difference between (1) the Base Interest Fraction for the Class A-3 certificates and the applicable principal prepayment and (2) the Base Interest Fraction for the Class A-3-1 certificates and the applicable principal prepayment, (e) to the holders of the Class A-3-X2 certificates, the product of (x) the certificates’ Percentage Allocation Entitlement of such yield maintenance charge or prepayment premium, (y) a fraction, the numerator of which is equal to the amount of principal distributed to the Class A-3-2 certificates for that distribution date, and the denominator of which is the total amount of principal distributed to the Class A-1, Class A-2-2, Class D and Class E certificates and the Class A-2-1 Exchangeable Certificates, the Class A-3 Exchangeable Certificates, the Class A-S Exchangeable Certificates, the Class B Exchangeable Certificates and the Class C Exchangeable Certificates for that distribution date, and (z) the difference between (1) the Base Interest Fraction for the Class A-3 certificates and the applicable principal prepayment and (2) the Base Interest Fraction for the Class A-3-2 certificates and the applicable principal prepayment, (f) to the holders of the Class A-S-X1 certificates, the product of (x) the certificates’ Percentage Allocation Entitlement of such yield maintenance charge or prepayment premium, (y) a fraction, the numerator of which is equal to the amount of principal distributed to the Class A-S-1 certificates for that distribution date, and the denominator of which is the total amount of principal distributed to the Class A-1, Class A-2-2, Class D and Class E certificates and the Class A-2-1 Exchangeable Certificates, the Class A-3 Exchangeable Certificates, the Class A-S Exchangeable Certificates, the Class B Exchangeable Certificates and the Class C Exchangeable Certificates for that distribution date, and (z) the difference between (1) the Base Interest Fraction for the Class A-S certificates and the applicable principal prepayment and (2) the Base Interest Fraction for the Class A-S-1 certificates and the applicable principal prepayment, (g) to the holders of the Class A-S-X2 certificates, the product of (x) the certificates’ Percentage Allocation Entitlement of such yield maintenance charge or prepayment premium, (y) a fraction, the numerator of which is equal to the amount of principal distributed to the Class A-S-2 certificates for that distribution date, and the denominator of which is the total amount of principal distributed to the Class A-1, Class A-2-2, Class D and Class E certificates and the Class A-2-1 Exchangeable Certificates, the Class A-3 Exchangeable Certificates, the Class A-S Exchangeable Certificates, the Class B Exchangeable Certificates and the Class C Exchangeable Certificates for that distribution date, and (z) the difference between (1) the Base Interest Fraction for the Class A-S certificates and the applicable principal prepayment and (2) the Base Interest Fraction for the Class A-S-2 certificates and the applicable principal prepayment, (h) to the holders of the Class B-X1 certificates, the product of (x) the certificates’ Percentage Allocation Entitlement of such yield maintenance charge or prepayment premium, (y) a fraction, the numerator of which is equal to the amount of principal distributed to the Class B-1 certificates for that distribution date, and the denominator of which is the total amount of principal distributed to the Class A-1, Class A-2-2, Class D and Class E certificates and the Class A-2-1 Exchangeable Certificates, the Class A-3 Exchangeable Certificates, the Class A-S Exchangeable Certificates, the Class B Exchangeable Certificates and the Class C Exchangeable Certificates for that distribution date, and (z) the difference between (1) the Base Interest Fraction for the Class B certificates and the applicable |
| This is not a research report and was not prepared by any Underwriter’s research department. Please see additional important information and qualifications at the end of this Term Sheet. | ||
| T-12 | ||
| BANK5 2023-5YR2 | Structural Overview |
| principal prepayment and (2) the Base Interest Fraction for the Class B-1 certificates and the applicable principal prepayment, (i) to the holders of the Class B-X2 certificates, the product of (x) the certificates’ Percentage Allocation Entitlement of such yield maintenance charge or prepayment premium, (y) a fraction, the numerator of which is equal to the amount of principal distributed to the Class B-2 certificates for that distribution date, and the denominator of which is the total amount of principal distributed to the Class A-1, Class A-2-2, Class D and Class E certificates and the Class A-2-1 Exchangeable Certificates, the Class A-3 Exchangeable Certificates, the Class A-S Exchangeable Certificates, the Class B Exchangeable Certificates and the Class C Exchangeable Certificates for that distribution date, and (z) the difference between (1) the Base Interest Fraction for the Class B certificates and the applicable principal prepayment and (2) the Base Interest Fraction for the Class B-2 certificates and the applicable principal prepayment, (j) to the holders of the Class C-X1 certificates, the product of (x) the certificates’ Percentage Allocation Entitlement of such yield maintenance charge or prepayment premium, (y) a fraction, the numerator of which is equal to the amount of principal distributed to the Class C-1 certificates for that distribution date, and the denominator of which is the total amount of principal distributed to the Class A-1, Class A-2-2, Class D and Class E certificates and the Class A-2-1 Exchangeable Certificates, the Class A-3 Exchangeable Certificates, the Class A-S Exchangeable Certificates, the Class B Exchangeable Certificates and the Class C Exchangeable Certificates for that distribution date, and (z) the difference between (1) the Base Interest Fraction for the Class C certificates and the applicable principal prepayment and (2) the Base Interest Fraction for the Class C-1 certificates and the applicable principal prepayment, (k) to the holders of the Class C-X2 certificates, the product of (x) the certificates’ Percentage Allocation Entitlement of such yield maintenance charge or prepayment premium, (y) a fraction, the numerator of which is equal to the amount of principal distributed to the Class C-2 certificates for that distribution date, and the denominator of which is the total amount of principal distributed to the Class A-1, Class A-2-2, Class D and Class E certificates and the Class A-2-1 Exchangeable Certificates, the Class A-3 Exchangeable Certificates, the Class A-S Exchangeable Certificates, the Class B Exchangeable Certificates and the Class C Exchangeable Certificates for that distribution date, and (z) the difference between (1) the Base Interest Fraction for the Class C certificates and the applicable principal prepayment and (2) the Base Interest Fraction for the Class C-2 certificates and the applicable principal prepayment, (l) to the holders of the Class X-A certificates, the excess, if any, of (x) the product of (1) the certificates’ Percentage Allocation Entitlement of such yield maintenance charge or prepayment premium and (2) a fraction, the numerator of which is equal to the total amount of principal distributed to the Class A-1 and Class A-2-2 certificates and the Class A-2-1 Exchangeable Certificates and the Class A-3 Exchangeable Certificates for that distribution date, and the denominator of which is the total amount of principal distributed to the Class A-1, Class A-2-2, Class D and Class E certificates and the Class A-2-1 Exchangeable Certificates, the Class A-3 Exchangeable Certificates, the Class A-S Exchangeable Certificates, the Class B Exchangeable Certificates and the Class C Exchangeable Certificates for that distribution date, over (y) the total amount of such yield maintenance charge or prepayment premium distributed to the Class A-1 and Class A-2-2 certificates and the Class A-2-1 Exchangeable Certificates and the Class A-3 Exchangeable Certificates as described above, (m) to the holders of the Class X-B certificates, the excess, if any, of (x) the product of (1) the certificates’ Percentage Allocation Entitlement of such yield maintenance charge or prepayment premium and (2) a fraction, the numerator of which is equal to the total amount of principal distributed to the Class A-S Exchangeable Certificates and the Class B Exchangeable Certificates for that distribution date, and the denominator of which is the total amount of principal distributed to the Class A-1, Class A-2-2, Class D and Class E certificates and the Class A-2-1 Exchangeable Certificates, the Class A-3 Exchangeable Certificates, the Class A-S Exchangeable Certificates, the Class B Exchangeable Certificates and the Class C Exchangeable Certificates for that distribution date, over (y) the total amount of such yield maintenance charge or prepayment premium distributed to the Class A-S Exchangeable Certificates and the Class B Exchangeable Certificates as described above, and (n) to the holders of the Class X-D certificates, any remaining portion of the certificates’ Percentage Allocation Entitlement of such yield maintenance charge or prepayment premium not distributed as described above in this clause (1), and |
| (2) to the VRR Interest (and, correspondingly, pro rata to the Class RR Certificates and the RR Interest based on their respective percentage interests in the VRR Interest), its Percentage Allocation Entitlement of such yield maintenance charge or prepayment premium. All yield maintenance charges and prepayment premiums referred to above will be net of any liquidation fees payable therefrom. Notwithstanding any of the foregoing in clause (1) to the contrary, if at any time the certificate balances of the principal balance certificates (other than the Control Eligible Certificates) have been reduced to zero as a result of the allocation of principal payments on the mortgage loans, the certificate administrator will be required to pay to the holders of each remaining class of principal balance certificates then entitled to distributions of principal on such distribution date the product of (a) the allocable portion of any yield maintenance charge or |
| This is not a research report and was not prepared by any Underwriter’s research department. Please see additional important information and qualifications at the end of this Term Sheet. | ||
| T-13 | ||
| BANK5 2023-5YR2 | Structural Overview |
| prepayment premium distributable on the subject distribution date (net of any liquidation fees payable therefrom) and (b) a fraction, the numerator of which is equal to the amount of principal distributed to such class for that distribution date, and the denominator of which is the total amount of principal distributed to all principal balance certificates for that distribution date. No yield maintenance charges or prepayment premiums will be distributed to the holders of the Class X-F, Class X-G, Class X-H, Class V or Class R Certificates. “Base Interest Fraction” means, with respect to any principal prepayment of any mortgage loan that provides for the payment of a yield maintenance charge or prepayment premium, and with respect to any class of principal balance certificates, a fraction (A) the numerator of which is the greater of (x) zero and (y) the difference between (i) the pass-through rate on that class, and (ii) the applicable discount rate and (B) the denominator of which is the difference between (i) the mortgage interest rate on the related mortgage loan and (ii) the applicable discount rate; provided, that: under no circumstances will the Base Interest Fraction be greater than one; if the discount rate referred to above is greater than or equal to both the mortgage interest rate on the related mortgage loan and the pass-through rate on that class, then the Base Interest Fraction will equal zero; and if the discount rate referred to above is greater than or equal to the mortgage interest rate on the related mortgage loan and is less than the pass-through rate on that class, then the Base Interest Fraction will be equal to 1.0. Consistent with the foregoing, the Base Interest Fraction is equal to: |
| (Pass-Through Rate – Discount Rate) | |||
| (Mortgage Rate – Discount Rate) |
| Realized Losses: | On each distribution date, immediately following the distributions to be made to the certificateholders on that date, the certificate administrator is required to calculate the amount, if any, by which (i) the aggregate stated principal balance of the mortgage loans, including any successor REO loans, expected to be outstanding immediately following that distribution date is less than (ii) the sum of the then aggregate certificate balance of the principal balance certificates and the principal balance of the VRR Interest after giving effect to distributions of principal on that distribution date. The certificates’ Percentage Allocation Entitlement of such amount will be applied to the Class H, Class G, Class F, Class E and Class D certificates and the Class C, Class B and Class A-S trust components, in that order, in each case until the related certificate or principal balance has been reduced to zero, and then to the Class A-1 and Class A-2-2 certificates and the Class A-2-1 and Class A-3 trust components, pro rata based upon their respective certificate or principal balances, until their respective certificate or principal balances have been reduced to zero. The VRR Interest’s Percentage Allocation Entitlement of such amount will be applied to the VRR Interest until the related VRR Interest balance has been reduced to zero. Any portion of such amount applied to the Class A-2-1, Class A-3, Class A-S, Class B or Class C trust component will reduce the certificate balance or notional amount of each class of certificates in the related group of Exchangeable Certificates by an amount equal to the product of (x) its certificate balance or notional amount, divided by the principal balance of such trust component prior to the applicable reduction, and (y) the amount applied to such trust component. |
| Serviced Whole Loans: | Each of the following mortgaged properties or portfolios of mortgaged properties secures a mortgage loan and one or more pari passu promissory notes and, in some cases, one or more generally subordinate promissory notes (each, a “serviced companion loan”) that will be serviced pursuant to the related intercreditor agreement and the pooling and servicing agreement for this transaction: Brandon Mall, Back Bay Office (prior to the securitization of the related promissory note designated Note A-4), Queens Crossing and 503-511 Broadway. With respect to each such mortgaged property or portfolio of mortgaged properties, the related mortgage loan, together with the related serviced companion loan(s), is referred to herein (for so long as it is serviced under the pooling and servicing agreement for this transaction) as a “serviced whole loan.” Each serviced companion loan is not part of the mortgage pool and may be contributed to one or more future securitization transactions (if not already securitized) or may be otherwise transferred at any time, subject to compliance with the related intercreditor agreement. See the tables below entitled “Mortgage Loans with Pari Passu Companion Loans” and “Mortgage Loans with Subordinate Debt,” as well as “Description of the Mortgage Pool—The Whole Loans” in the Preliminary Prospectus, for additional information regarding each such whole loan. With respect to the Back Bay Office whole loan (a “servicing shift whole loan”), the pooling and servicing agreement for this transaction will govern servicing of such whole loan until the securitization of the related lead servicing note (the promissory note designated Note A-4); however, servicing of such whole loan will generally be directed by the holder of the related control note (which is not included in this securitization), and such holder will have the right to replace the special servicer with respect to the related whole loan with or without cause. After the securitization of the related lead servicing note, such whole loan will cease to be a serviced whole loan and will be serviced pursuant to the pooling and servicing agreement for another securitization transaction (see “—Non-Serviced Whole Loans” below). |
| Non-Serviced Whole Loans: | Each of the following mortgaged properties or portfolios of mortgaged properties secures a mortgage loan (each, a “non-serviced mortgage loan”), one or more pari passu promissory notes and, in some cases, one or more generally subordinate promissory notes (each such promissory note, a “non-serviced companion loan”) that will be serviced pursuant to the related intercreditor agreement and the pooling and servicing agreement or trust and servicing agreement (referred to herein as a related “pooling and servicing agreement”) for another securitization transaction: Miracle Mile Shops, Back Bay Office (after the securitization of the related promissory note designated Note A-4), ICP/IRG Holdings Portfolio, One & Two Commerce Square, Heritage Plaza, 6330 |
| This is not a research report and was not prepared by any Underwriter’s research department. Please see additional important information and qualifications at the end of this Term Sheet. | ||
| T-14 | ||
| BANK5 2023-5YR2 | Structural Overview |
| West Loop South and 1201 Third Avenue. With respect to each such mortgaged property or portfolio of mortgaged properties, the related mortgage loan, together with the related non-serviced companion loan(s), is referred to herein (for so long as it is serviced under the pooling and servicing agreement for another securitization transaction) as a “non-serviced whole loan.” Each non-serviced companion loan is not part of the mortgage pool and may be contributed to one or more future securitization transactions (if not already securitized) or may be otherwise transferred at any time, subject to compliance with the related intercreditor agreement. Servicing of each non-serviced whole loan will generally be directed by the holder of the related control note (or, if such control note is included in a securitization, the directing certificateholder thereunder (or other party designated thereunder to exercise the rights of such control note)), and such holder will have the right to replace the special servicer with respect to the related whole loan with or without cause. See the tables below entitled “Mortgage Loans with Pari Passu Companion Loans” and “Mortgage Loans with Subordinate Debt,” as well as “Description of the Mortgage Pool—The Whole Loans” in the Preliminary Prospectus, for additional information regarding each such whole loan. | |
Directing Certificateholder/ Controlling Class: | The “Directing Certificateholder” will be (i) with respect to a servicing shift mortgage loan, the related Loan-Specific Directing Certificateholder, and (ii) with respect to each other mortgage loan, the Controlling Class Certificateholder (or its representative) selected by more than 50% (by certificate balance) of the Controlling Class Certificateholders; provided, that (1) absent that selection, (2) until a Directing Certificateholder is so selected or (3) upon receipt of a notice from a majority of the Controlling Class Certificateholders (by certificate balance) that a Directing Certificateholder is no longer designated, the Controlling Class Certificateholder that owns the largest aggregate certificate balance of the Controlling Class (or its representative) will be the Directing Certificateholder; provided, that (a) in the case of clause (3), if no one holder owns the largest aggregate certificate balance of the Controlling Class, then there will be no Directing Certificateholder until appointed in accordance with the terms of the pooling and servicing agreement, and (b) the certificate administrator and the other parties to the pooling and servicing agreement will be entitled to assume that the identity of the Directing Certificateholder has not changed until such parties receive written notice of a replacement of the Directing Certificateholder from a party holding the requisite interest in the Controlling Class (as confirmed by the certificate registrar), or the resignation of the then current Directing Certificateholder. As used herein, the term “Directing Certificateholder,” unless used in relation to a Servicing Shift Mortgage Loan, means the entity determined pursuant to clause (ii) of the definition of such term. The “Loan-Specific Directing Certificateholder” with respect to a servicing shift mortgage loan is the “controlling holder”, the “directing certificateholder”, the “directing holder”, “directing lender” or any analogous concept under the related intercreditor agreement. Prior to the securitization of the related lead servicing note, the Loan-Specific Directing Certificateholder with respect to a servicing shift mortgage loan will be the holder of the related control note. On and after the securitization of the related lead servicing note, there will be no Loan-Specific Directing Certificateholder under the PSA with respect to such servicing shift mortgage loan. The “Controlling Class” will be, as of any time of determination, the most subordinate class of Control Eligible Certificates then outstanding that has an aggregate certificate balance (as notionally reduced by any Cumulative Appraisal Reduction Amounts (as defined below) allocable to such class) at least equal to 25% of the initial certificate balance of that class; provided, that if at any time the certificate balances of the certificates other than the Control Eligible Certificates have been reduced to zero as a result of principal payments on the mortgage loans, then the Controlling Class will be the most subordinate class of Control Eligible Certificates that has a certificate balance greater than zero without regard to the application of the allocable portion of any Cumulative Appraisal Reduction Amounts. The Controlling Class as of the closing date will be the Class H certificates. The “Control Eligible Certificates” will be any of the Class F, Class G and Class H certificates. |
| Control Rights: | Prior to a Control Termination Event, the Directing Certificateholder will have certain consent and consultation rights under the pooling and servicing agreement with respect to certain major decisions and other matters. A “Control Termination Event” will occur when the Class F certificates have a certificate balance (taking into account the application of the allocable portion of any Cumulative Appraisal Reduction Amounts to notionally reduce the certificate balance thereof) of less than 25% of the initial certificate balance of that class; provided, that no Control Termination Event may occur with respect to a Loan-Specific Directing Certificateholder, and the term “Control Termination Event” will not be applicable to a Loan-Specific Directing Certificateholder; provided, further, that a Control Termination Event will be deemed not continuing in the event that the certificate balances of the principal balance certificates other than the Control Eligible Certificates have been reduced to zero as a result of principal payments on the mortgage loans. After the occurrence of a Control Termination Event but prior to the occurrence of a Consultation Termination Event, the Directing Certificateholder will not have any consent rights, but the Directing Certificateholder will have certain non-binding consultation rights under the pooling and servicing agreement with respect to certain major decisions and other matters. A “Consultation Termination Event” will occur when no class of Control Eligible Certificates has a certificate balance (without regard to the application of the allocable portion of any Cumulative Appraisal Reduction Amounts) at least equal to 25% of the initial certificate balance of that class; provided, that no Consultation Termination Event may occur with respect to a Loan-Specific Directing Certificateholder, and the term “Consultation Termination Event” will not be applicable to a Loan-Specific Directing Certificateholder; provided, further, that a Consultation Termination Event will be deemed not continuing in the event that the certificate balances of the principal balance certificates other than the Control |
| This is not a research report and was not prepared by any Underwriter’s research department. Please see additional important information and qualifications at the end of this Term Sheet. | ||
| T-15 | ||
| BANK5 2023-5YR2 | Structural Overview |
Eligible Certificates have been reduced to zero as a result of principal payments on the mortgage loans. After the occurrence of a Consultation Termination Event, the Directing Certificateholder will not have any consent or consultation rights, except with respect to any rights expressly set forth in the pooling and servicing agreement, and the operating advisor will retain certain non-binding consultation rights under the pooling and servicing agreement with respect to certain major decisions and other matters. Notwithstanding any proviso to, or any other contrary provision in, the definitions of “Control Termination Event” and “Consultation Termination Event”, a Control Termination Event and a Consultation Termination Event will each be deemed to have occurred with respect to any Excluded Loan with respect to the Directing Certificateholder or the holder of the majority of the Controlling Class, and neither the Directing Certificateholder nor any Controlling Class Certificateholder will have any consent or consultation rights with respect to the servicing of such Excluded Loan. An “Excluded Loan” means (a) with respect to the Directing Certificateholder or the holder of the majority of the Controlling Class, a mortgage loan or whole loan with respect to which, as of any date of determination, the Directing Certificateholder or the holder of the majority of the Controlling Class is a Borrower Party or (b) with respect to the Risk Retention Consultation Party or the holder of the majority of the VRR Interest, a mortgage loan or whole loan with respect to which, as of any date of determination, the Risk Retention Consultation Party or the holder of the majority of the VRR Interest is a Borrower Party. It is expected that there will be no Excluded Loans with respect to this securitization on the closing date. “Borrower Party” means a borrower, a mortgagor, a manager of a mortgaged property, the holder of a mezzanine loan that has been accelerated or as to which foreclosure or enforcement proceedings have been commenced against the equity collateral pledged to secure the related mezzanine loan, or any Borrower Party Affiliate. “Borrower Party Affiliate” means, with respect to a borrower, a mortgagor, a manager of a mortgaged property or the holder of a mezzanine loan that has been accelerated or as to which foreclosure or enforcement proceedings have been commenced against the equity collateral pledged to secure the related mezzanine loan, (a) any other person controlling or controlled by or under common control with such borrower, mortgagor, manager or mezzanine lender, as applicable, or (b) any other person owning, directly or indirectly, 25% or more of the beneficial interests in such borrower, mortgagor, manager or mezzanine lender, as applicable. For the purposes of this definition, “control” when used with respect to any specified person means the power to direct the management and policies of such person, directly or indirectly, whether through the ownership of voting securities, by contract or otherwise and the terms “controlling” and “controlled” have meanings correlative to the foregoing. Notwithstanding any of the foregoing to the contrary, if any mortgage loan is part of a whole loan, the Directing Certificateholder’s consent and/or consultation rights with respect thereto may be limited as described in the Preliminary Prospectus. In particular, with respect to each non-serviced whole loan and each servicing shift whole loan, the Directing Certificateholder (other than a Loan-Specific Directing Certificateholder) will only have certain consultation rights with respect to certain major decisions and other matters related to such whole loan, in each case only prior to a Consultation Termination Event, and the Loan-Specific Directing Certificateholder will be entitled to similar consent and/or consultation rights with respect to such whole loan. In addition, with respect to any serviced A/B whole loan, for so long as the holder of the related subordinate companion loan is the controlling note holder, the holder of such subordinate companion loan (rather than the Directing Certificateholder) will be entitled to exercise such consent and consultation rights with respect to such whole loan. | |
| Appraisal Reduction Amounts and Collateral Deficiency Amounts: | An “Appraisal Reduction Amount” generally will be created in the amount, if any, by which the principal balance of a required appraisal loan (which is a mortgage loan with respect to which certain defaults, modifications or insolvency events have occurred as further described in the Preliminary Prospectus) plus other amounts overdue or advanced in connection with such mortgage loan exceeds 90% of the appraised value of the related mortgaged property plus certain escrows and reserves (including letters of credit) held with respect to the mortgage loan. A mortgage loan will cease to be subject to an Appraisal Reduction Amount when it has been brought current for at least three consecutive months, no additional event of default is foreseeable in the reasonable judgment of the applicable special servicer and no other circumstances exist that would cause such mortgage loan or any related companion loan to be a specially serviced loan; however, a “Collateral Deficiency Amount” may exist with respect to any mortgage loan that is modified into an AB loan structure (an “AB Modified Loan”) and remains a corrected mortgage loan and, if so, will generally equal the excess of (i) the stated principal balance of such AB Modified Loan (taking into account the related junior note(s) and any pari passu notes included therein), over (ii) the sum of (in the case of a whole loan, solely to the extent allocable to the subject mortgage loan) (x) the most recent appraised value for the related mortgaged property or mortgaged properties, plus (y) solely to the extent not reflected or taken into account in such appraised value (or in the calculation of any related Appraisal Reduction Amount) and to the extent on deposit with, or otherwise under the control of, the lender as of the date of such determination, any capital or additional collateral contributed by the related borrower at the time the mortgage loan became (and as part of the modification related thereto) such AB Modified Loan for the benefit of the related mortgaged property or mortgaged properties (provided that in the case of an non-serviced mortgage loan, the amounts set forth in this clause (y) will be taken into account solely to the extent relevant information is received by the applicable special servicer), plus (z) any other escrows or reserves (in addition to any amounts set forth in the immediately preceding clause (y) and solely to the extent not reflected or taken into account in the calculation of any related Appraisal Reduction Amount) held by the lender in respect of such AB Modified Loan as of the date of such determination, which such excess, for the avoidance of doubt, will be |
| This is not a research report and was not prepared by any Underwriter’s research department. Please see additional important information and qualifications at the end of this Term Sheet. | ||
| T-16 | ||
| BANK5 2023-5YR2 | Structural Overview |
determined separately from and exclude any related Appraisal Reduction Amounts. As used herein, a “Cumulative Appraisal Reduction Amount” will be the sum of any Appraisal Reduction Amounts and any Collateral Deficiency Amounts. Any Appraisal Reduction Amount in respect of any non-serviced mortgage loan generally will be calculated in accordance with the other servicing agreement pursuant to which such mortgage loan is being serviced, which calculations are expected to be generally similar to those provided for in the pooling and servicing agreement for this transaction. If any mortgage loan is part of a whole loan, any Appraisal Reduction Amount or Collateral Deficiency Amount will (or effectively will) be calculated in respect of such whole loan taken as a whole and allocated, to the extent provided in the related intercreditor agreement and the related pooling and servicing agreement, first, to any related subordinate companion loan, and second, to the related mortgage loan and any pari passu companion loan on a pro rata basis by unpaid principal balance. Appraisal Reduction Amounts will proportionately reduce the interest portion of debt service advances required to be made in respect of the related mortgage loan. Appraisal Reduction Amounts and Collateral Deficiency Amounts (in each case, to the extent of the certificates’ Percentage Allocation Entitlement thereof) will be (i) taken into account in determining the identity of the controlling class entitled to appoint the Directing Certificateholder, the existence of a Control Termination Event and the allocation and/or exercise of voting rights for certain purposes (see “Directing Certificateholder/Controlling Class” above) and (ii) allocated to the following classes of certificates and trust components, in each case to notionally reduce their certificate balances or principal balances until the certificate balance or principal balance of each such class or trust component is notionally reduced to zero: the Class H, Class G, Class F, Class E and Class D certificates and the Class C, Class B and Class A-S trust components, in that order, and then pro rata to the Class A-1 and Class A-2-2 certificates and the Class A-2-1 and Class A-3 trust components. Appraisal Reduction Amounts and Collateral Deficiency Amounts allocated to the Class A-2-1, Class A-3, Class A-S, Class B or Class C trust component will be allocated to the corresponding classes of Exchangeable Certificates with certificate balances pro rata to notionally reduce their certificate balances in accordance with their Class Percentage Interests therein. | |
| Appraised-Out Class: | An “Appraised-Out Class” is any class of Control Eligible Certificates, the certificate balance of which (taking into account the application of the certificates’ Percentage Allocation Entitlement of any Appraisal Reduction Amounts or Collateral Deficiency Amounts to notionally reduce the certificate balance of such class) has been reduced to less than 25% of its initial certificate balance. Any Appraised-Out Class may not exercise any direction, control, consent and/or similar rights of the Controlling Class until such time, if any, as such class is reinstated as the Controlling Class, and the rights of the Controlling Class will be exercised by the next most senior class of Control Eligible Certificates that is not an Appraised-Out Class, if any, during such period. |
| Appraisal Remedy: | The holders of the majority (by certificate balance) of an Appraised-Out Class (such holders, the “Requesting Holders”) will have the right, at their sole expense, to require the applicable special servicer to order (or, with respect to a non-serviced mortgage loan, require the applicable master servicer to request from the applicable non-serviced special servicer) a second appraisal of any mortgage loan (or serviced whole loan) for which an appraisal reduction event has occurred or as to which there exists a Collateral Deficiency Amount. With respect to any serviced mortgage loan, the applicable special servicer will be required to use its reasonable best efforts to ensure that such appraisal is delivered within 30 days from receipt of the Requesting Holders’ written request and will be required to ensure that such appraisal is prepared on an “as-is” basis by an MAI appraiser. With respect to any non-serviced mortgage loan, the applicable master servicer will be required to use commercially reasonable efforts to obtain such second appraisal from the applicable non-serviced special servicer. In addition, the Requesting Holders of any Appraised-Out Class will have the right to challenge the Appraisal Reduction Amount and to require the applicable special servicer to order an additional appraisal of any serviced mortgage loan as to which there exists a Collateral Deficiency Amount if an event has occurred at, or with respect to, the related mortgaged property or mortgaged properties that would have a material effect on its or their appraised value, and such special servicer is required to use reasonable efforts to obtain an appraisal from an MAI appraiser reasonably acceptable to such special servicer within 30 days from receipt of the Requesting Holders’ written request. Upon receipt of such supplemental appraisal, the applicable master servicer (for Collateral Deficiency Amounts on non-serviced mortgage loans) and the applicable special servicer (for any serviced mortgage loans) will be required to determine, in accordance with the Servicing Standard, whether, based on its assessment of such supplemental appraisal, any recalculation of the applicable Appraisal Reduction Amount or Collateral Deficiency Amount is warranted and, if so warranted, such person will be required to recalculate such Appraisal Reduction Amount or Collateral Deficiency Amount, as applicable, based upon such supplemental appraisal as described above. If required by any such recalculation, the applicable Appraised-Out Class will be reinstated as the Controlling Class and each Appraised-Out Class will, if applicable, have its related certificate balance notionally restored to the extent required by such recalculation of the Appraisal Reduction Amount or Collateral Deficiency Amount, if applicable. |
| Sale of Defaulted Loans: | Under certain circumstances the applicable special servicer may be required to use reasonable efforts to solicit offers for a defaulted serviced mortgage loan (and any related companion loan (to the extent provided under the related intercreditor agreement) and/or related REO properties). The Directing Certificateholder will not have a right of first refusal to purchase a defaulted loan. If the applicable special servicer does not receive an offer at least equal to the outstanding principal balance plus all accrued and unpaid interest and outstanding costs and expenses and certain other amounts specified |
| This is not a research report and was not prepared by any Underwriter’s research department. Please see additional important information and qualifications at the end of this Term Sheet. | ||
| T-17 | ||
| BANK5 2023-5YR2 | Structural Overview |
in the pooling and servicing agreement (the “Par Purchase Price”), the applicable special servicer may purchase the defaulted loan or REO property at the Par Purchase Price or may accept the first cash offer received from any person that is determined to be a fair price for such defaulted loan or REO property. If multiple offers are received during the period designated by the applicable special servicer for receipt of offers, such special servicer is generally required to select the highest offer. The applicable special servicer will be required to determine whether any cash offer constitutes a fair price for any defaulted loan or REO property if the highest offeror is a person other than a party to the pooling and servicing agreement for this transaction (the “PSA”), the Directing Certificateholder, the Risk Retention Consultation Party, any sponsor, any Borrower Party, any independent contractor engaged by a special servicer, the trustee for the securitization of a related companion loan (with respect to a whole loan if it is a defaulted loan), any related companion loan holder or its representative, any holder of a related mezzanine loan or any known affiliate of any of the preceding entities (each, an “Interested Person”). If an offer is made by an Interested Person, the trustee will be required to determine (based upon the most recent appraisal conducted in accordance with the terms of the PSA) whether the offer constitutes a fair price for the defaulted loan or REO property unless (i) the offer is equal to or greater than the applicable Par Purchase Price and (ii) the offer is the highest offer received. Absent an offer at least equal to the Par Purchase Price, no offer from an Interested Person will constitute a fair price unless (x) it is the highest offer received and (y) at least two other offers are received from independent third parties. Neither the trustee nor any of its affiliates may make an offer for or purchase any specially serviced loan or REO property. Notwithstanding any of the foregoing to the contrary, the applicable special servicer is not required to accept the highest offer and may accept a lower offer for a defaulted loan or REO property if such special servicer determines, in accordance with the Servicing Standard (and subject to the requirements of any related intercreditor agreement), that a rejection of such offer would be in the best interests of the certificateholders, the VRR Interest owners and any related companion loan holders as a collective whole as if they constituted a single lender (and with respect to a serviced A/B whole loan, taking into account the subordinate nature of any related subordinate companion loan), so long as such lower offer was not made by such special servicer or any of its affiliates. If title to any mortgaged property is acquired by the trust fund, the applicable special servicer will generally be required to sell such mortgaged property prior to the close of the third calendar year beginning after the year of acquisition. The foregoing applies to mortgage loans serviced under the PSA. With respect to any non-serviced whole loan, if the special servicer under the applicable pooling and servicing agreement determines to sell the related controlling companion loan if it becomes a defaulted loan, then the applicable special servicer will be required to sell the related whole loan, including the related mortgage loan included in the BANK5 2023-5YR2 securitization trust and the related pari passu companion loan(s) (or, with respect to the Back Bay Office whole loan, certain of the related pari passu companion loans) and, under certain circumstances, any subordinate companion loan(s), as a single loan. In connection with any such sale, the special servicer under the applicable pooling and servicing agreement will be required to follow procedures substantially similar to those set forth above. | |
| Risk Retention Consultation Party: | A risk retention consultation party may be appointed by the holder or holders of more than 50% of the VRR Interest, by VRR Interest balance. The majority VRR Interest holder will have a continuing right to appoint, remove or replace the risk retention consultation party in its sole discretion. This right may be exercised at any time and from time to time. Except with respect to an Excluded Loan as to such party or the holder of the majority of the VRR Interest, the risk retention consultation party will be entitled to consult with the applicable special servicer, upon request of the risk retention consultation party, with respect to certain material servicing actions proposed by such special servicer; provided, that prior to the occurrence and continuance of a Consultation Termination Event, such mortgage loan must also be a specially serviced mortgage loan. |
| Appointment and Replacement of each Special Servicer: | The Directing Certificateholder will appoint the initial special servicer as of the closing date. Prior to the occurrence and continuance of a Control Termination Event, any special servicer may generally be replaced by the Directing Certificateholder with or without cause at any time. After the occurrence and during the continuance of a Control Termination Event and upon (a) the written direction of holders of principal balance certificates evidencing not less than 25% of the voting rights of all classes of certificates entitled to principal (taking into account the application of Cumulative Appraisal Reduction Amounts to notionally reduce the certificate balances of classes to which such Cumulative Appraisal Reduction Amounts are allocable) requesting a vote to replace the applicable special servicer with a replacement special servicer, (b) payment by such requesting holders to the certificate administrator of all reasonable fees and expenses to be incurred by the certificate administrator in connection with administering such vote and (c) delivery by such holders of a rating agency confirmation from each applicable rating agency, the certificate administrator will be required to promptly post such notice on its internet website and by mail and conduct the solicitation of votes of all certificates in such regard, which requisite affirmative votes must be received within 180 days of the posting of such notice. Upon the written direction of holders of at least 66 2/3% of a Certificateholder Quorum, the trustee will be required to immediately replace the applicable special servicer with a qualified replacement special servicer designated by such holders of certificates. After the occurrence and during the continuance of a Consultation Termination Event, if the operating advisor determines that the applicable special servicer is not performing its duties as required under the pooling and servicing agreement or is otherwise not acting in accordance with the Servicing Standard, the operating advisor may also recommend the replacement of such special servicer. The operating advisor’s recommendation to |
| This is not a research report and was not prepared by any Underwriter’s research department. Please see additional important information and qualifications at the end of this Term Sheet. | ||
| T-18 | ||
| BANK5 2023-5YR2 | Structural Overview |
replace such special servicer must be confirmed by an affirmative vote of holders of principal balance certificates evidencing at least a majority of the aggregate voting rights (taking into account the application of any Cumulative Appraisal Reduction Amounts to notionally reduce the respective certificate balances) of all principal balance certificates on an aggregate basis (which requisite affirmative vote must be received within 180 days of posting of the notice of the operating advisor’s recommendation to the certificate administrator’s website). A “Certificateholder Quorum” means, in connection with any solicitation of votes in connection with the replacement of a special servicer or the asset representations reviewer, the holders of certificates evidencing at least 50% of the aggregate voting rights (taking into account the application of realized losses and, other than with respect to the termination of the asset representations reviewer, any Cumulative Appraisal Reduction Amounts to notionally reduce the certificate balance of the certificates) of all classes of certificates entitled to principal on an aggregate basis. With respect to each serviced whole loan, any holder of a related pari passu companion loan, following a servicer termination event with respect to the applicable special servicer that affects such holder, will be entitled to direct the trustee (and the trustee will be required) to terminate such special servicer solely with respect to such serviced whole loan. A replacement special servicer will be selected by the trustee or, prior to a Control Termination Event, by the Directing Certificateholder; provided, that any successor special servicer appointed to replace the special servicer with respect to such whole loan cannot be the entity (or its affiliate) that was terminated at the direction of the holder of the related pari passu companion loan. Notwithstanding any of the foregoing to the contrary, with respect to each servicing shift whole loan and any serviced A/B whole loans as to which a subordinate companion loan holder is the related controlling note holder, the holder of the related control note will be entitled to replace the applicable special servicer with respect to such whole loan at any time, with or without cause, and while it is a serviced whole loan, no other party may replace the applicable special servicer for such whole loan unless there is a servicer termination event with respect thereto. With respect to any non-serviced whole loan, subject to conditions or restrictions in the applicable intercreditor agreement, the BANK5 2023-5YR2 trust, as holder of the related mortgage loan, has the right to terminate the applicable special servicer under the related pooling and servicing agreement if a servicer termination event occurs with respect to such special servicer that affects the trust in its capacity as such holder. Such rights may be exercised by the Directing Certificateholder prior to a Consultation Termination Event (or the applicable special servicer, following the occurrence and during the continuance of a Consultation Termination Event). The successor special servicer will be selected pursuant to the applicable pooling and servicing agreement by the related directing holder prior to a control termination event under such pooling and servicing agreement. | |
| Servicing Standard: | Each applicable master servicer and each applicable special servicer is obligated to service and administer the mortgage loans (and, if applicable, the serviced companion loans) in accordance with the definition of the “Servicing Standard” described in the Preliminary Prospectus and the terms of the pooling and servicing agreement, provided that each non-serviced mortgage loan, if any, will be serviced by another master servicer or special servicer under the pooling and servicing agreement with respect to the securitization of a related companion loan, which entities will be obligated to service and administer such non-serviced mortgage loan pursuant to a similar standard set forth in the related pooling and servicing agreement. |
| Excluded Special Servicer: | If a special servicer obtains knowledge that it has become a Borrower Party with respect to any mortgage loan (an “Excluded Special Servicer Loan”), such special servicer will be required to resign as special servicer of that Excluded Special Servicer Loan. Prior to the occurrence and continuance of a Control Termination Event, the Directing Certificateholder will be required to appoint (and may remove and replace with or without cause) a separate special servicer that is not a Borrower Party (an “Excluded Special Servicer”) with respect to any Excluded Special Servicer Loan, unless such Excluded Special Servicer Loan is also an Excluded Loan with respect to the Directing Certificateholder or the holder of the majority of the Controlling Class. At any time after the occurrence and during the continuance of a Control Termination Event, or if at any time the applicable Excluded Special Servicer Loan is also an Excluded Loan with respect to the Directing Certificateholder or if the holder of the majority of the Controlling Class or if the Directing Certificateholder is entitled to appoint the Excluded Special Servicer but does not so appoint a replacement special servicer within 30 days of notice of such resignation, the resigning special servicer will be required to use reasonable efforts to select the related Excluded Special Servicer. Any Excluded Special Servicer will be required to perform all of the obligations of the applicable special servicer and will be entitled to all special servicing compensation with respect to such Excluded Special Servicer Loan earned while the related mortgage loan is an Excluded Special Servicer Loan. |
| Liquidated Loan Waterfall: | On liquidation of any mortgage loan, all net liquidation proceeds related to the mortgage loan (but not any related companion loan) will be applied so that amounts allocated as a recovery of accrued and unpaid interest will not, in the first instance, include any delinquent interest that was not advanced as a result of Appraisal Reduction Amounts (or would not have been advanced in the absence of a non-recoverability determination) or accrued on the portion of the stated principal balance thereof equal to any related Collateral Deficiency Amount in effect from time to time and as to which no advance was made (collectively, the “Subordinated Interest Amount”). After the adjusted interest amount is so allocated, any remaining liquidation proceeds will be allocated to pay principal on the mortgage loan until the unpaid principal amount of the mortgage loan has been reduced to zero. Any remaining liquidation proceeds will then be allocated to pay the Subordinated Interest Amount. |
| Operating Advisor: | The operating advisor will be required to perform certain review duties if a Control Termination Event has occurred and is continuing, which will generally include a limited annual review of, and the preparation of a report regarding, certain actions of the applicable special servicer with respect to the resolution and/or liquidation |
| This is not a research report and was not prepared by any Underwriter’s research department. Please see additional important information and qualifications at the end of this Term Sheet. | ||
| T-19 | ||
| BANK5 2023-5YR2 | Structural Overview |
of specially serviced loans. The review and report generally will be based on any asset status reports and additional information delivered to the operating advisor by such special servicer. In addition, if a Control Termination Event has occurred and is continuing, the applicable special servicer must consult with the operating advisor (in addition to the Directing Certificateholder if no Consultation Termination Event has occurred and is continuing) in connection with major decisions with respect to mortgage loans. Furthermore, under certain circumstances, but only if a Consultation Termination Event has occurred and is continuing, the operating advisor may recommend the replacement of the applicable special servicer as described above under “—Appointment and Replacement of each Special Servicer”; however, the operating advisor will not have any rights or obligations with respect to a non-serviced whole loan. If a Consultation Termination Event has occurred and is continuing, the operating advisor may be removed and replaced without cause upon the affirmative direction of certificates owners holding not less than 75% of the voting rights of all certificates (taking into account the application of Cumulative Appraisal Reduction Amounts), following a proposal from certificate owners holding not less than 25% of the voting rights of all certificates (taking into account the application of Cumulative Appraisal Reduction Amounts). The certificateholders who initiate a vote on a termination and replacement of the operating advisor without cause must cause the payment of the fees and expenses incurred in the replacement. In addition, in the event there are no classes of certificates outstanding other than the Control Eligible Certificates, and the Class X-F, Class X-G, Class X-H, Class V and Class R certificates, then all of the rights and obligations of the operating advisor under the PSA will terminate without payment of any penalty or termination fee (other than any rights or obligations that accrued prior to the date of such termination (including accrued and unpaid compensation) and other than indemnification rights arising out of events occurring prior to such termination). See “Pooling and Servicing Agreement—The Operating Advisor—Termination of the Operating Advisor Without Cause” in the Preliminary Prospectus. | |
| Asset Representations Reviewer: | The asset representations reviewer will be required to review certain delinquent mortgage loans after a specified delinquency threshold has been met and the required percentage of certificateholders vote to direct a review as described below. The asset representations reviewer will be entitled to the Asset Representations Reviewer Fee with respect to such review. See “Pooling and Servicing Agreement—The Asset Representations Reviewer” in the Preliminary Prospectus. The certificate administrator will be required to notify certificateholders if the specified delinquency threshold has been met as described in the Preliminary Prospectus under “—The Asset Representations Reviewer”. If certificateholders evidencing not less than 5.0% of the voting rights request a vote to commence an asset review, and if subsequently (i) a majority of those certificateholders who cast votes and (ii) a majority of an Asset Review Quorum authorizes an asset review within 150 days of the request for a vote, the asset representations reviewer will be required to conduct an asset review of delinquent loans. The asset representations reviewer may be terminated and replaced without cause. Upon (i) the written direction of certificateholders evidencing not less than 25% of the voting rights (without regard to the application of any Cumulative Appraisal Reduction Amounts) requesting a vote to terminate and replace the asset representations reviewer with a proposed successor asset representations reviewer that is an eligible asset representations reviewer, and (ii) payment by such holders to the certificate administrator of the reasonable fees and expenses to be incurred by the certificate administrator in connection with administering such vote, the certificate administrator will be required to promptly provide notice to all certificateholders and the asset representations reviewer of such request by posting such notice on its internet website, and by mailing such notice to all certificateholders and the asset representations reviewer. Upon the written direction of certificateholders evidencing at least 75% of a Certificateholder Quorum (without regard to the application of any Cumulative Appraisal Reduction Amounts), the trustee will be required to terminate all of the rights and obligations of the asset representations reviewer under the pooling and servicing agreement (other than any rights or obligations that accrued prior to the date of such termination and other than indemnification rights arising out of events occurring prior to such termination) by written notice to the asset representations reviewer, and the proposed successor asset representations reviewer will be appointed. See “Pooling and Servicing Agreement—The Asset Representations Reviewer” in the Preliminary Prospectus. An “Asset Review Quorum” means, in connection with any solicitation of votes to authorize an Asset Review as described above, the holders of certificates evidencing at least 5.0% of the aggregate voting rights represented by all certificates that have voting rights. |
| Dispute Resolution Provisions: | The mortgage loan sellers will be subject to the dispute resolution provisions set forth in the PSA to the extent those provisions are triggered with respect to any mortgage loan sold to the depositor by a mortgage loan seller, and such mortgage loan seller will be obligated under the related mortgage loan purchase agreement to comply with all applicable provisions and to take part in any mediation or arbitration proceedings that may result. Generally, in the event that a Repurchase Request is not “Resolved” within 180 days after the related mortgage loan seller receives such Repurchase Request, then the enforcing servicer will be required to send a notice to the first certificateholder (or beneficial owner) to deliver a certificateholder repurchase request with respect to the mortgage loan (the “Initial Requesting Certificateholder”) (if any) and to the certificate administrator (which will be required to make such notice available to certificateholders and the VRR Interest owners via the certificate administrator’s website) indicating the enforcing servicer’s intended course of action with respect to the Repurchase Request. If (a) the enforcing servicer’s intended course of action with respect to the Repurchase Request does not involve pursuing further action to exercise rights against the related mortgage loan seller with respect to the Repurchase Request and the Initial Requesting Certificateholder, if any, or any other certificateholder, or certificate owner wishes to exercise its right to refer the matter to mediation (including non-binding arbitration) or arbitration, or (b) the enforcing servicer’s intended course of action is to pursue further action to exercise rights against the related mortgage loan seller with respect to the Repurchase Request but the |
| This is not a research report and was not prepared by any Underwriter’s research department. Please see additional important information and qualifications at the end of this Term Sheet. | ||
| T-20 | ||
| BANK5 2023-5YR2 | Structural Overview |
Initial Requesting Certificateholder, if any, or any other certificateholder or certificate owner does not agree with the dispute resolution method selected by the enforcing servicer, then the Initial Requesting Certificateholder, if any, or such other certificateholder or certificate owner may deliver a written notice to the enforcing servicer indicating its intent to exercise its right to refer the matter to either mediation or arbitration. “Resolved” means, with respect to a Repurchase Request, (i) that the related material defect or breach has been cured, (ii) the related mortgage loan has been repurchased in accordance with the related mortgage loan purchase agreement, (iii) a mortgage loan has been substituted for the related mortgage loan in accordance with the related mortgage loan purchase agreement, (iv) the applicable mortgage loan seller has made a loss of value payment, (v) a contractually binding agreement has been entered into between the enforcing servicer, on behalf of the issuing entity, and the related mortgage loan seller that settles the related mortgage loan seller’s obligations under the related mortgage loan purchase agreement, or (vi) the related mortgage loan is no longer property of the issuing entity as a result of a sale or other disposition in accordance with the pooling and servicing agreement. See “Pooling and Servicing Agreement—Dispute Resolution Provisions” in the Preliminary Prospectus. | |
| Investor Communications: | The certificate administrator is required to include on any Form 10-D any request received from a certificateholder to communicate with other certificateholders related to certificateholders exercising their rights under the terms of the PSA. Any certificateholder wishing to communicate with other certificateholders regarding the exercise of its rights under the terms of the PSA will be able to deliver a written request signed by an authorized representative of the requesting investor to the certificate administrator. |
| Deal Website: | The certificate administrator will be required to maintain a deal website which will include, among other items: (a) summaries of asset status reports prepared by a special servicer, (b) inspection reports, (c) appraisals, (d) various “special notices” described in the Preliminary Prospectus, (e) the “Investor Q&A Forum” and (f) a voluntary “Investor Registry”. Investors may access the deal website following execution of a certification and confidentiality agreement. |
| This is not a research report and was not prepared by any Underwriter’s research department. Please see additional important information and qualifications at the end of this Term Sheet. | ||
| T-21 | ||
| BANK5 2023-5YR2 | Collateral Overview |
| Mortgage Loan Sellers | No. of Mortgage Loans | No. of Mortgaged Properties | Aggregate Cut-off Date Balance | % of Pool(1) |
| Wells Fargo Bank, National Association | 6 | 7 | $302,530,088 | 44.8% |
| Morgan Stanley Mortgage Capital Holdings LLC | 8 | 13 | $135,510,718 | 20.1% |
| JPMorgan Chase Bank, National Association | 3 | 12 | $127,800,000 | 18.9% |
| Bank of America, National Association | 2 | 2 | $84,231,554 | 12.5% |
| Bank of America, National Association/JPMorgan Chase Bank, National Association | 1 | 1 | $25,000,000 | 3.7% |
| Total: | 20 | 35 | $675,072,360 | 100.0% |
| Pool Statistics | |
| Aggregate Cut-off Date Balance: | $675,072,360 |
| Number of Mortgage Loans: | 20 |
| Average Cut-off Date Balance per Mortgage Loan: | $33,753,618 |
| Number of Mortgaged Properties: | 35 |
| Average Cut-off Date Balance per Mortgaged Property: | $19,287,782 |
| Weighted Average Mortgage Rate: | 7.1861% |
| % of Pool Secured by 5 Largest Mortgage Loans: | 44.9% |
| % of Pool Secured by 10 Largest Mortgage Loans: | 74.1% |
| % of Pool Secured by ARD Loans: | 0.0% |
| Weighted Average Original Term to Maturity (months): | 60 |
| Weighted Average Remaining Term to Maturity (months): | 59 |
| Weighted Average Seasoning (months): | 1 |
| % of Pool Secured by Single Tenant Mortgaged Properties: | 9.7% |
| % of Pool Secured by Refinance Loans: | 80.3% |
| % of Pool Secured by Acquisition Loans: | 19.7% |
| Additional Debt | |
| % of Pool with Pari Passu Mortgage Debt: | 58.0% |
| % of Pool with Subordinate Debt: | 8.9% |
| % of Pool with Mezzanine Mortgage Debt: | 8.9% |
| Credit Statistics(2) | |
| Weighted Average UW NOI DSCR: | 1.88x |
| Weighted Average UW NOI Debt Yield: | 13.9% |
| Weighted Average UW NCF DSCR: | 1.78x |
| Weighted Average UW NCF Debt Yield: | 13.1% |
| Weighted Average Cut-off Date LTV Ratio(3): | 49.8% |
| Weighted Average Maturity Date LTV Ratio(3): | 49.3% |
Footnotes are set forth on the following page.
| This is not a research report and was not prepared by any Underwriter’s research department. Please see additional important information and qualifications at the end of this Term Sheet. | ||
| T-22 | ||
| BANK5 2023-5YR2 | Collateral Overview |
Amortization
| Weighted Average Original Amortization Term (months)(4): | 360 |
| Weighted Average Remaining Amortization Term (months)(4): | 359 |
| % of Pool Interest Only through Maturity: | 81.0% |
| % of Pool Amortizing Balloon: | 16.6% |
| % of Pool Interest Only, Amortizing Balloon: | 2.4% |
| Lockboxes | |
| % of Pool with Hard Lockboxes: | 81.7% |
| % of Pool with Soft Lockboxes: | 17.0% |
| % of Pool with Springing Lockboxes: | 1.4% |
| Reserves | |
| % of Pool Requiring Tax Reserves: | 68.5% |
| % of Pool Requiring Insurance Reserves: | 21.7% |
| % of Pool Requiring Replacement Reserves: | 80.7% |
| % of Pool Requiring TI/LC Reserves(5): | 80.3% |
| Call Protection | |
| % of Pool with lockout period, followed by defeasance until open period: | 62.5% |
| % of Pool with lockout period, followed by defeasance or the greater of a prepayment premium and yield maintenance until open period: | 18.8% |
| % of Pool with lockout period. The greater of a prepayment premium and yield maintenance, followed by defeasance or the greater of a prepayment premium and yield maintenance until open period: | 9.2% |
| % of Pool with lockout period. The greater of a prepayment premium and yield maintenance until open period: | 6.3% |
| % of Pool with no lockout period. Greater of a prepayment premium and yield maintenance, followed by defeasance or the greater of a prepayment premium and yield maintenance until open period: | 3.3% |
| (1) | Unless otherwise indicated, all references to “% of Pool” in this Term Sheet reflect a percentage of the aggregate principal balance of the mortgage pool as of the Cut-off Date, after application of all payments of principal due during or prior to July 2023. |
| (2) | With respect to any mortgage loan that is part of a whole loan, unless otherwise indicated, all LTV, DSCR and Debt Yield calculations in this Term Sheet include any related pari passu companion loans and exclude any subordinate companion loans and/or mezzanine loans, as applicable. Additionally, LTV, DSCR and Debt Yield figures in this Term Sheet are calculated for mortgage loans without regard to any additional indebtedness that may be incurred at a future date. For mortgaged properties securing residential cooperative mortgage loans all LTV, DSCR and Debt Yield calculations do not take into account any subordinate debt (whether or not secured by the related mortgaged property), that currently exists or is allowed under the terms of any mortgage loan. |
| (3) | The LTV ratios set forth in this Term Sheet are generally based on the “as-is” values of the related mortgaged properties; provided that the “as-is” value for a portfolio of mortgaged properties may include a premium relating to the valuation of the mortgaged properties as a whole rather than as the sum of individually valued mortgaged properties; provided, further, that such LTV ratios may be based on “as-stabilized”, “as complete” or other contingent values in certain cases in which reserves have been established at origination for the applicable condition or circumstance that is expected to result in stabilization provided, further, that such LTV ratios may have been calculated based on a principal balance that is net of a holdback or earnout reserve. See the definition of “Appraised Value” under “Description of the Mortgage Pool—Certain Calculations and Definitions” in the Preliminary Prospectus. |
| (4) | Excludes mortgage loans that provide for payments of interest only through the related maturity date or anticipated repayment date, as applicable. |
| (5) | Excludes multifamily, self storage, manufactured housing, and hospitality properties. |
| This is not a research report and was not prepared by any Underwriter’s research department. Please see additional important information and qualifications at the end of this Term Sheet. | ||
| T-23 | ||
| BANK5 2023-5YR2 | Characteristics of the Mortgage Loans |
| Top 10 Mortgage Loans(1) | |||||||||||||
| Loan No. | Mortgage Loan Seller | Property Name | City | State | Property Type | Cut-off Date Balance | % of Pool | SF/Rooms | Cut-off Date Balance per SF/Room | UW NCF DSCR | UW NOI Debt Yield | Cut-off Date LTV | Maturity Date LTV |
| 1 | BANA | Miracle Mile Shops | Las Vegas | NV | Retail | $67,000,000 | 9.9% | 503,484 | $844.12 | 1.96x | 14.0% | 38.6% | 38.6% |
| 2 | WFB | Brandon Mall | Brandon | FL | Retail | $65,000,000 | 9.6% | 659,882 | $183.37 | 2.33x | 19.2% | 54.7% | 54.7% |
| 3 | WFB | Back Bay Office | Boston | MA | Office | $60,000,000 | 8.9% | 1,283,670 | $370.03 | 2.55x | 16.3% | 33.7% | 33.7% |
| 4 | WFB | Park West Shopping Center | Peoria | AZ | Retail | $58,600,000 | 8.7% | 253,789 | $230.90 | 1.53x | 11.6% | 60.4% | 60.4% |
| 5 | WFB | Shops at Riverwalk & River Walk Corporate Center | Bakersfield | CA | Various | $52,455,546 | 7.8% | 313,317 | $167.42 | 1.58x | 12.8% | 44.2% | 41.9% |
| 6 | JPMCB | ICP/IRG Holdings Portfolio | Various | Various | Various | $52,200,000 | 7.7% | 4,662,982 | $38.60 | 1.39x | 10.7% | 58.5% | 58.5% |
| 7 | JPMCB | Alabama Hotel Portfolio | Various | AL | Hospitality | $38,500,000 | 5.7% | 361 | $106,648.20 | 2.08x | 17.1% | 59.7% | 59.7% |
| 8 | JPMCB | Queens Crossing | Flushing | NY | Mixed Use | $37,100,000 | 5.5% | 95,123 | $600.28 | 1.33x | 10.4% | 57.1% | 57.1% |
| 9 | MSMCH | 503-511 Broadway | New York | NY | Mixed Use | $36,000,000 | 5.3% | 121,164 | $478.69 | 1.39x | 10.5% | 38.7% | 38.7% |
| 10 | WFB | Norfolk Waterside Marriott | Norfolk | VA | Hospitality | $33,500,000 | 5.0% | 407 | $82,309.58 | 1.63x | 15.9% | 51.4% | 51.4% |
| Total/Wtd. Avg. | $500,355,546 | 74.1% | 1.83x | 14.0% | 49.2% | 48.9% | |||||||
| (1) | With respect to any mortgage loan that is part of a whole loan, unless otherwise indicated, all LTV, DSCR, Debt Yield and Balance per SF/Room calculations in this Term Sheet include any related pari passu companion loans and exclude any subordinate companion loans and/or mezzanine loans, as applicable. Additionally, LTV, DSCR, Debt Yield and Balance per SF/Room figures in this Term Sheet are calculated for mortgage loans without regard to any additional indebtedness that may be incurred at a future date. |
| This is not a research report and was not prepared by any Underwriter’s research department. Please see additional important information and qualifications at the end of this Term Sheet. | ||
| T-24 | ||
| BANK5 2023-5YR2 | Characteristics of the Mortgage Loans |
| Mortgage Loans with Pari Passu Companion Loans | ||||||||||||
| Loan No. | Mortgage Loan Seller | Property Name | Mortgage Loan Cut-off Date Balance | Aggregate Pari Passu Companion Loan Cut-off Date Balance | Combined Cut-off Date Balance | Lead Servicing Agreement | Master Servicer | Special Servicer | Control Rights | Combined UW NCF DSCR(1) | Combined UW NOI Debt Yield(1) | Combined Cut-off Date LTV(1) |
| 1 | BANA | Miracle Mile Shops | $67,000,000 | $358,000,000 | $425,000,000 | MIRA 2023-MILE | Midland | KeyBank | MIRA 2023-MILE | 1.96x | 14.0% | 38.6% |
| 2 | WFB | Brandon Mall | $65,000,000 | $56,000,000 | $121,000,000 | BANK5 2023-5YR2 | Wells Fargo | CW Capital | BANK5 2023-5YR2 | 2.33x | 19.2% | 54.7% |
| 3 | WFB | Back Bay Office | $60,000,000 | $415,000,000 | $475,000,000 | BANK5 2023-5YR2 | Wells Fargo(2) | CW Capital(2) | (2) | 2.55x | 16.3% | 33.7% |
| 6 | JPMCB | ICP/IRG Holdings Portfolio | $52,200,000 | $127,800,000 | $180,000,000 | BMARK 2023-V2 | Midland | 3650 | BMARK 2023-V2 | 1.39x | 10.7% | 58.5% |
| 8 | JPMCB | Queens Crossing | $37,100,000 | $20,000,000 | $57,100,000 | BANK5 2023-5YR2 | Wells Fargo | CW Capital | BANK5 2023-5YR2 | 1.33x | 10.4% | 57.1% |
| 9 | MSMCH | 503-511 Broadway | $36,000,000 | $22,000,000 | $58,000,000 | BANK5 2023-5YR2 | Wells Fargo | CW Capital | BANK5 2023-5YR2 | 1.39x | 10.5% | 38.7% |
| 13 | BANA/JPMCB | One & Two Commerce Square | $25,000,000 | $195,000,000 | $220,000,000 | BBCMS 2023-C20 | KeyBank(3) | LNR Partners(3) | (3) | 1.52x | 13.5% | 51.4% |
| 14 | MSMCH | Heritage Plaza | $22,000,000 | $150,000,000 | $172,000,000 | BMARK 2023-V2 | Midland(4) | 3650(4) | (4) | 1.54x | 12.7% | 33.0% |
| 15 | BANA | 6330 West Loop South | $17,231,554 | $32,315,407 | $49,546,961 | BBCMS 2023-C20 | KeyBank(5) | LNR Partners(5) | (5) | 1.20x | 11.4% | 62.2% |
| 17 | MSMCH | 1201 Third Avenue | $10,000,000 | $160,000,000 | $170,000,000 | BANK5 2023-5YR1 | Wells Fargo(6) | CW Capital(6) | (6) | 2.76x | 17.7% | 30.5% |
| (1) | DSCR, Debt Yield and LTV calculations include any related pari passu companion loans and exclude any subordinate companion loans and/or mezzanine loans, as applicable. |
| (2) | See “Description of the Mortgage Pool—The Whole Loans” in the Preliminary Prospectus in relation to the control rights under the Back Bay Office intercreditor agreement. The Back Bay Office whole loan will be serviced pursuant to the BANK5 2023-5YR2 pooling and servicing agreement until the securitization of the related promissory note A-4. |
| (3) | The One & Two Commerce Square controlling companion loan is currently held by BANA. The One & Two Commerce Square whole loan is expected to be serviced pursuant to the BBCMS 2023-C20 pooling and servicing agreement until the securitization of the related controlling pari passu companion loan. |
| (4) | The Heritage Plaza controlling companion loan is currently held by MSBNA. The Heritage Plaza whole loan will be serviced pursuant to the BMARK 2023-V2 pooling and servicing agreement until the securitization of the related controlling pari passu companion loan. |
| (5) | The 6330 West Loop South controlling companion loan is currently held by BANA. The 6330 West Loop South whole loan is expected to be serviced pursuant to the BBCMS 2023-C20 pooling and servicing agreement until the securitization of the related controlling pari passu companion loan. |
| (6) | The 1201 Third Avenue controlling companion loan is currently held by MSBNA. The 1201 Third Avenue whole loan is expected to be serviced pursuant to the BANK5 2023-5YR1 pooling and servicing agreement until the securitization of the related controlling pari passu companion loan. |
| Mortgage Loans with Subordinate Debt | |||||||||||
| Loan No. | Mortgage Loan Seller | Property Name | Mortgage Loan Cut-off Date Balance | Cut-off Date Balance per SF | Subordinate Debt Cut-off Date Balance | UW NCF DSCR | UW NOI Debt Yield | Cut-off Date LTV | Whole Loan UW NCF DSCR(1) | Whole Loan UW NOI Debt Yield(1) | Whole Loan Cut-off Date LTV(1) |
| 3 | WFB | Back Bay Office | $60,000,000 | $370.03 | $65,000,000 | 2.55x | 16.3% | 33.7% | 2.16x | 14.3% | 38.3% |
| (1) | Whole Loan UW NCF DSCR, Whole Loan UW NOI Debt Yield and Whole Loan Cut-off Date LTV figures shown above are calculated based on any related pari passu notes and any related subordinate note(s). |
| Mortgage Loans with Mezzanine Debt | |||||||||||
| Loan No. | Mortgage Loan Seller | Property Name | Mortgage Loan Cut-off Date Balance | Cut-off Date Balance per SF | Mezzanine Debt Cut-off Date Balance | UW NCF DSCR | UW NOI Debt Yield | Cut-off Date LTV | Total Debt UW NCF DSCR(1) | Total Debt UW NOI Debt Yield(1) | Total Debt Cut-off Date LTV(1) |
| 3 | WFB | Back Bay Office | $60,000,000 | $370.03 | $40,000,000 | 2.55x | 16.3% | 33.7% | 1.94x | 13.4% | 41.1% |
| (1) | Total Debt UW NCF DSCR, Total Debt UW NOI Debt Yield and Total Debt Cut-off Date LTV figures shown above are calculated based on any related pari passu notes, any related subordinate note(s) and the mezzanine debt. |
| This is not a research report and was not prepared by any Underwriter’s research department. Please see additional important information and qualifications at the end of this Term Sheet. | ||
| T-25 | ||
| BANK5 2023-5YR2 | Characteristics of the Mortgage Loans |
| Prior Securitization History(1) | ||||||||||||||
| Loan No. | Mortgage Loan Seller | Property Name | City | State | Property Type | Cut-off Date Balance | % of Pool | SF/Units | Cut-off Date Balance per SF/Unit | UW NCF DSCR | UW NOI Debt Yield | Cut-off Date LTV | Maturity Date LTV | Prior Securitization |
| 1 | BANA | Miracle Mile Shops | Las Vegas | NV | Retail | $67,000,000 | 9.9% | 503,484 | $844.12 | 1.96x | 14.0% | 38.6% | 38.6% | JPMBB 2013-C15 |
| 8 | JPMCB | Queens Crossing | Flushing | NY | Mixed Use | $37,100,000 | 5.5% | 95,123 | $600.28 | 1.33x | 10.4% | 57.1% | 57.1% | COMM 2014-UBS5 |
| 11 | WFB | The Read House | Chattanooga | TN | Hospitality | $32,974,542 | 4.9% | 242 | $136,258.44 | 1.73x | 16.5% | 49.6% | 47.2% | LCCM 2021-FL3 |
| 15 | BANA | 6330 West Loop South | Bellaire | TX | Office | $17,231,554 | 2.6% | 278,489 | $177.91 | 1.20x | 11.4% | 62.2% | 59.9% | MSC 2018-H3 |
| Total | $154,306,096 | 22.9% | ||||||||||||
| (1) | Includes mortgage loans for which all or a portion of the previously existing debt was most recently securitized in conduit securitizations, based on information provided by the related borrower or obtained through searches of a third-party database. The information has not otherwise been confirmed by the mortgage loan sellers. With respect to any mortgage loan that is part of a whole loan, unless otherwise indicated, all LTV, DSCR, Debt Yield and Cut-off Date Balance per SF/Unit calculations include any related pari passu companion loans and exclude any related subordinate companion loans and/or mezzanine loans, as applicable. |
| This is not a research report and was not prepared by any Underwriter’s research department. Please see additional important information and qualifications at the end of this Term Sheet. | ||
| T-26 | ||
| BANK5 2023-5YR2 | Characteristics of the Mortgage Loans |
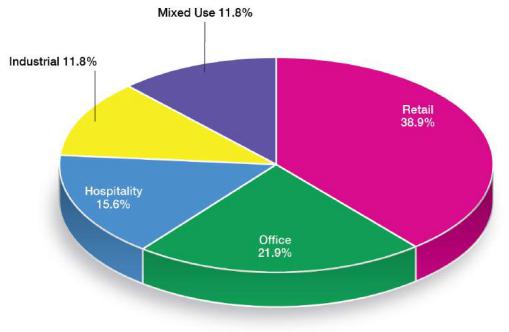
| Property Type Distribution(1) | ||||||||
| Property Type | Number of Mortgaged Properties | Aggregate Cut-off Date Balance | % of Pool | Wtd. Avg. Mortgage Rate | Wtd. Avg. UW NCF DSCR | Wtd. Avg. UW NOI Debt Yield | Wtd. Avg. Cut-off Date LTV | Wtd. Avg. Maturity Date LTV |
| Retail | 6 | $262,732,280 | 38.9% | 7.1177% | 1.85x | 14.4% | 49.9% | 49.3% |
| Anchored | 3 | $84,290,718 | 12.5% | 6.9867% | 1.54x | 11.8% | 58.3% | 57.8% |
| Regional Mall | 1 | $67,000,000 | 9.9% | 6.9911% | 1.96x | 14.0% | 38.6% | 38.6% |
| Super Regional Mall | 1 | $65,000,000 | 9.6% | 7.6200% | 2.33x | 19.2% | 54.7% | 54.7% |
| Shadow Anchored | 1 | $46,441,562 | 6.9% | 6.8350% | 1.58x | 12.8% | 44.2% | 41.9% |
| Office | 7 | $147,814,538 | 21.9% | 6.9950% | 1.98x | 14.4% | 41.4% | 41.0% |
| CBD | 4 | $117,000,000 | 17.3% | 6.8058% | 2.16x | 15.1% | 37.1% | 37.1% |
| Medical | 1 | $17,231,554 | 2.6% | 8.1800% | 1.20x | 11.4% | 62.2% | 59.9% |
| Suburban | 2 | $13,582,983 | 2.0% | 7.1220% | 1.47x | 11.6% | 52.2% | 51.2% |
| Hospitality | 6 | $104,974,542 | 15.6% | 7.5165% | 1.83x | 16.5% | 53.9% | 53.1% |
| Full Service | 3 | $78,420,542 | 11.6% | 7.5729% | 1.74x | 16.3% | 51.9% | 50.9% |
| Extended Stay | 3 | $26,554,000 | 3.9% | 7.3500% | 2.08x | 17.1% | 59.7% | 59.7% |
| Industrial | 13 | $79,951,000 | 11.8% | 7.1024% | 1.48x | 11.2% | 60.0% | 60.0% |
| Warehouse/Distribution | 11 | $63,508,000 | 9.4% | 7.0383% | 1.50x | 11.3% | 60.4% | 60.4% |
| Manufacturing/Warehouse | 1 | $13,311,000 | 2.0% | 7.3500% | 1.39x | 10.7% | 58.5% | 58.5% |
| Flex | 1 | $3,132,000 | 0.5% | 7.3500% | 1.39x | 10.7% | 58.5% | 58.5% |
| Mixed Use | 3 | $79,600,000 | 11.8% | 7.4151% | 1.38x | 10.6% | 49.1% | 49.1% |
| Retail/Office | 1 | $37,100,000 | 5.5% | 7.5500% | 1.33x | 10.4% | 57.1% | 57.1% |
| Office/Retail | 1 | $36,000,000 | 5.3% | 7.3600% | 1.39x | 10.5% | 38.7% | 38.7% |
| Office/Lab/R&D | 1 | $6,500,000 | 1.0% | 6.9500% | 1.61x | 12.4% | 60.7% | 60.7% |
| Total/Wtd. Avg. | 35 | $675,072,360 | 100.0% | 7.1861% | 1.78x | 13.9% | 49.8% | 49.3% |
| (1) | All numerical information concerning the mortgage loans is approximate and, in the case of mortgage loans secured by multiple properties, is based on allocated loan amounts with respect to such properties. All weighted average information regarding the mortgage loans reflects the weighting of the mortgage loans based on their outstanding principal balances as of the Cut-off Date or, in the case of mortgage loans secured by multiple properties, allocated loan amounts. The sum of numbers and percentages in columns may not match the “Total” due to rounding. With respect to any mortgage loan that is part of a whole loan, unless otherwise indicated, all LTV, DSCR and Debt Yield calculations include any related pari passu companion loans and exclude any related subordinate companion loans and/or mezzanine loans, as applicable. For mortgaged properties securing residential cooperative mortgage loans, the UW NCF DSCR and UW NOI Debt Yield for each such mortgaged property is calculated using underwritten net operating income or underwritten net cash flow, as applicable, for the related residential cooperative property which is the projected net operating income or net cash flow, as applicable, reflected in the most recent appraisal obtained by or otherwise in the possession of the related mortgage loan seller as of the Cut-off Date. LTV calculations are based upon the appraised value of the residential cooperative property determined as if such residential cooperative property is operated as a residential cooperative, inclusive of the amount of the underlying debt encumbering such residential cooperative property. The UW NCF DSCR, UW NOI Debt Yield and LTV calculations do not take into account any subordinate debt (whether or not secured by the related mortgaged property), that currently exits or is allowed under the terms of any mortgage loan. |
| This is not a research report and was not prepared by any Underwriter’s research department. Please see additional important information and qualifications at the end of this Term Sheet. | ||
| T-27 | ||
| BANK5 2023-5YR2 | Characteristics of the Mortgage Loans |
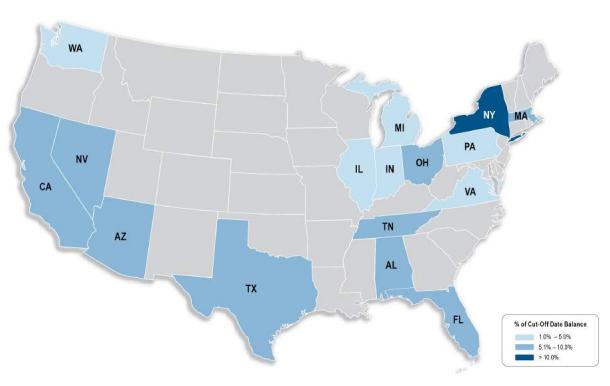
| Geographic Distribution(1) | ||||||||
| State or Other Jurisdiction | Number of Mortgaged Properties | Aggregate Cut-off Date Balance | % of Pool | Wtd. Avg. Mortgage Rate | Wtd. Avg. UW NCF DSCR | Wtd. Avg. UW NOI Debt Yield | Wtd. Avg. Cut-off Date LTV | Wtd. Avg. Maturity Date LTV |
| New York | 3 | $82,290,718 | 12.2% | 7.2859% | 1.42x | 10.9% | 47.2% | 46.9% |
| Nevada | 1 | $67,000,000 | 9.9% | 6.9911% | 1.96x | 14.0% | 38.6% | 38.6% |
| Florida | 1 | $65,000,000 | 9.6% | 7.6200% | 2.33x | 19.2% | 54.7% | 54.7% |
| Massachusetts | 1 | $60,000,000 | 8.9% | 6.2980% | 2.55x | 16.3% | 33.7% | 33.7% |
| Arizona | 1 | $58,600,000 | 8.7% | 7.2500% | 1.53x | 11.6% | 60.4% | 60.4% |
| Texas | 3 | $55,731,554 | 8.3% | 7.5070% | 1.38x | 11.9% | 50.3% | 49.2% |
| California | 2 | $52,455,546 | 7.8% | 6.8350% | 1.58x | 12.8% | 44.2% | 41.9% |
| California – Southern(2) | 2 | $52,455,546 | 7.8% | 6.8350% | 1.58x | 12.8% | 44.2% | 41.9% |
| Tennessee | 2 | $40,231,259 | 6.0% | 7.2039% | 1.71x | 15.6% | 51.6% | 49.7% |
| Ohio | 6 | $38,889,000 | 5.8% | 7.3500% | 1.39x | 10.7% | 58.5% | 58.5% |
| Alabama | 4 | $38,500,000 | 5.7% | 7.3500% | 2.08x | 17.1% | 59.7% | 59.7% |
| Virginia | 1 | $33,500,000 | 5.0% | 7.9150% | 1.63x | 15.9% | 51.4% | 51.4% |
| Michigan | 5 | $32,824,859 | 4.9% | 6.9874% | 1.52x | 11.3% | 59.9% | 59.9% |
| Pennsylvania | 1 | $25,000,000 | 3.7% | 7.7875% | 1.52x | 13.5% | 51.4% | 51.4% |
| Washington | 1 | $10,000,000 | 1.5% | 5.5850% | 2.76x | 17.7% | 30.5% | 30.5% |
| Indiana | 2 | $8,549,424 | 1.3% | 6.9444% | 1.54x | 12.3% | 65.3% | 65.3% |
| Illinois | 1 | $6,500,000 | 1.0% | 6.9500% | 1.61x | 12.4% | 60.7% | 60.7% |
| Total/Wtd. Avg. | 35 | $675,072,360 | 100.0% | 7.1861% | 1.78x | 13.9% | 49.8% | 49.3% |
| (1) | All numerical information concerning the mortgage loans is approximate and, in the case of mortgage loans secured by multiple properties, is based on allocated loan amounts with respect to such properties. All weighted average information regarding the mortgage loans reflects the weighting of the mortgage loans based on their outstanding principal balances as of the Cut-off Date or, in the case of mortgage loans secured by multiple properties, allocated loan amounts. The sum of numbers and percentages in columns may not match the “Total” due to rounding. With respect to any mortgage loan that is part of a whole loan, unless otherwise indicated, all LTV, DSCR and Debt Yield calculations include any related pari passu companion loans and exclude any related subordinate companion loans and/or mezzanine loans, as applicable. For mortgaged properties securing residential cooperative mortgage loans, the UW NCF DSCR and UW NOI Debt Yield for each such mortgaged property is calculated using underwritten net operating income or underwritten net cash flow, as applicable, for the related residential cooperative property which is the projected net operating income or net cash flow, as applicable, reflected in the most recent appraisal obtained by or otherwise in the possession of the related mortgage loan seller as of the Cut-off Date. LTV calculations are based upon the appraised value of the residential cooperative property determined as if such residential cooperative property is operated as a residential cooperative, inclusive of the amount of the underlying debt encumbering such residential cooperative property. |
| (2) | “California – Northern” includes zip codes above 93600, and “California – Southern” includes zip codes at or below 93600. |
| This is not a research report and was not prepared by any Underwriter’s research department. Please see additional important information and qualifications at the end of this Term Sheet. | ||
| T-28 | ||
| BANK5 2023-5YR2 | Collateral Statistics |
Collateral Statistics(1)
Cut-off Date Balance ($)
| No. of Mortgage Loans | Aggregate Cut-off Date Balance ($) | % of Pool | |||
| 6,500,000 - 10,000,000 | 4 | 32,410,718 | 4.8 | ||
| 10,000,001 - 20,000,000 | 2 | 33,731,554 | 5.0 | ||
| 20,000,001 - 30,000,000 | 3 | 75,600,000 | 11.2 | ||
| 30,000,001 - 40,000,000 | 5 | 178,074,542 | 26.4 | ||
| 40,000,001 - 60,000,000 | 4 | 223,255,546 | 33.1 | ||
| 60,000,001 - 67,000,000 | 2 | 132,000,000 | 19.6 | ||
| Total: | 20 | $675,072,360 | 100.0 | % | |
| Min: $6,500,000 | Max: $67,000,000 | Avg: $33,753,618 | |||
State or Other Jurisdiction(2)
| No. of Mortgaged Properties | Aggregate Cut-off Date Balance ($) | % of Pool |
| ||
| New York | 3 | 82,290,718 | 12.2 | ||
| Nevada | 1 | 67,000,000 | 9.9 | ||
| Florida | 1 | 65,000,000 | 9.6 | ||
| Massachusetts | 1 | 60,000,000 | 8.9 | ||
| Arizona | 1 | 58,600,000 | 8.7 | ||
| Texas | 3 | 55,731,554 | 8.3 | ||
| California | 2 | 52,455,546 | 7.8 | ||
| California – Southern(3) | 2 | 52,455,546 | 7.8 | ||
| Tennessee | 2 | 40,231,259 | 6.0 | ||
| Ohio | 6 | 38,889,000 | 5.8 | ||
| Alabama | 4 | 38,500,000 | 5.7 | ||
| Virginia | 1 | 33,500,000 | 5.0 | ||
| Michigan | 5 | 32,824,859 | 4.9 | ||
| Pennsylvania | 1 | 25,000,000 | 3.7 | ||
| Washington | 1 | 10,000,000 | 1.5 | ||
| Indiana | 2 | 8,549,424 | 1.3 | ||
| Illinois | 1 | 6,500,000 | 1.0 | ||
| Total: | 35 | $675,072,360 | 100.0 | % | |
Property Type(2)
| No. of Mortgaged Properties | Aggregate Cut-off Date Balance ($) | % of Pool | |||
| Retail | 6 | 262,732,280 | 38.9 | ||
| Anchored | 3 | 84,290,718 | 12.5 | ||
| Regional Mall | 1 | 67,000,000 | 9.9 | ||
| Super Regional Mall | 1 | 65,000,000 | 9.6 | ||
| Shadow Anchored | 1 | 46,441,562 | 6.9 | ||
| Office | 7 | 147,814,538 | 21.9 | ||
| CBD | 4 | 117,000,000 | 17.3 | ||
| Medical | 1 | 17,231,554 | 2.6 | ||
| Suburban | 2 | 13,582,983 | 2.0 | ||
| Hospitality | 6 | 104,974,542 | 15.6 | ||
| Full Service | 3 | 78,420,542 | 11.6 | ||
| Extended Stay | 3 | 26,554,000 | 3.9 | ||
| Industrial | 13 | 79,951,000 | 11.8 | ||
| Warehouse/ Distribution | 11 | 63,508,000 | 9.4 | ||
| Manufacturing/ Warehouse | 1 | 13,311,000 | 2.0 | ||
| Flex | 1 | 3,132,000 | 0.5 | ||
| Mixed Use | 3 | 79,600,000 | 11.8 | ||
| Retail/Office | 1 | 37,100,000 | 5.5 | ||
| Office/Retail | 1 | 36,000,000 | 5.3 | ||
| Office/Lab/R&D | 1 | 6,500,000 | 1.0 | ||
| Total: | 35 | $675,072,360 | 100.0 | % | |
Mortgage Rate (%)
| No. of Mortgage Loans | Aggregate Cut-off Date Balance ($) | % of Pool | |||
| 5.5850 - 6.4999 | 3 | 79,190,718 | 11.7 | ||
| 6.5000 - 6.9999 | 5 | 171,055,546 | 25.3 | ||
| 7.0000 - 7.4999 | 6 | 224,994,542 | 33.3 | ||
| 7.5000 - 8.1800 | 6 | 199,831,554 | 29.6 | ||
| Total: | 20 | $675,072,360 | 100.0 | % | |
| Min: 5.5850% | Max: 8.1800% | Wtd Avg: 7.1861% | |||
Original Term to Maturity or ARD (mos.)
| No. of Mortgage Loans | Aggregate Cut-off Date Balance ($) | % of Pool | |||
| 60 | 20 | 675,072,360 | 100.0 | ||
| Total: | 20 | $675,072,360 | 100.0 | % | |
| Min: 60 mos. | Max: 60 mos. | Wtd Avg: 60 mos. | |||
Remaining Term to Maturity or ARD (mos.)
| No. of Mortgage Loans | Aggregate Cut-off Date Balance ($) | % of Pool | |||
| 56 - 58 | 7 | 161,531,554 | 23.9 | ||
| 59 | 11 | 417,540,806 | 61.9 | ||
| 60 | 2 | 96,000,000 | 14.2 | ||
| Total: | 20 | $675,072,360 | 100.0 | % | |
| Min: 56 mos. | Max: 60 mos. | Wtd Avg: 59 mos. | |||
Original Amortization Term (mos.)
| No. of Mortgage Loans | Aggregate Cut-off Date Balance ($) | % of Pool | |||
| Interest Only | 15 | 546,720,000 | 81.0 | ||
| 360 | 5 | 128,352,360 | 19.0 | ||
| Total: | 20 | $675,072,360 | 100.0 | % | |
| Min: 360 mos. | Max: 360 mos. | Wtd Avg: 360 mos. | |||
Remaining Amortization Term (mos.)
| No. of Mortgage Loans | Aggregate Cut-off Date Balance ($) | % of Pool | |||
| Interest Only | 15 | 546,720,000 | 81.0 | ||
| 358 - 359 | 4 | 111,852,360 | 16.6 | ||
| 360 | 1 | 16,500,000 | 2.4 | ||
| Total: | 20 | $675,072,360 | 100.0 | % | |
| Min: 358 mos. | Max: 360 mos. | Wtd Avg: 359 mos. | |||
Mortgage Loan Sellers
| No. of Mortgage Loans | Aggregate Cut-off Date Balance ($) | % of Pool | |||
| WFB | 6 | 302,530,088 | 44.8 | ||
| MSMCH | 8 | 135,510,718 | 20.1 | ||
| JPMCB | 3 | 127,800,000 | 18.9 | ||
| BANA | 2 | 84,231,554 | 12.5 | ||
| BANA/JPMCB | 1 | 25,000,000 | 3.7 | ||
| Total: | 20 | $675,072,360 | 100.0 | % | |
Amortization Type
| No. of Mortgage Loans | Aggregate Cut-off Date Balance ($) | % of Pool | |||
| Interest Only | 15 | 546,720,000 | 81.0 | ||
| Amortizing Balloon | 4 | 111,852,360 | 16.6 | ||
| Interest Only, Amortizing Balloon | 1 | 16,500,000 | 2.4 | ||
| Total: | 20 | $675,072,360 | 100.0 | % | |
Cut-off Date LTV Ratio (%)
| No. of Mortgage Loans | Aggregate Cut-off Date Balance ($) | % of Pool | |||
| 30.5 - 40.0 | 5 | 195,000,000 | 28.9 | ||
| 40.1 - 50.0 | 3 | 94,620,806 | 14.0 | ||
| 50.1 - 55.0 | 3 | 123,500,000 | 18.3 | ||
| 55.1 - 60.0 | 3 | 127,800,000 | 18.9 | ||
| 60.1 - 66.5 | 6 | 134,151,554 | 19.9 | ||
| Total: | 20 | $675,072,360 | 100.0 | % | |
| Min: 30.5% | Max: 66.5% | Wtd Avg: 49.8% | |||
Maturity Date or ARD LTV Ratio (%)
| No. of Mortgage Loans | Aggregate Cut-off Date Balance ($) | % of Pool | |||
| 30.5 - 40.0 | 6 | 204,190,718 | 30.2 | ||
| 40.1 - 50.0 | 2 | 85,430,088 | 12.7 | ||
| 50.1 - 55.0 | 3 | 123,500,000 | 18.3 | ||
| 55.1 - 60.0 | 5 | 161,531,554 | 23.9 | ||
| 60.1 - 66.5 | 4 | 100,420,000 | 14.9 | ||
| Total: | 20 | $675,072,360 | 100.0 | % | |
| Min: 30.5% | Max: 66.5% | Wtd Avg: 49.3% | |||
UW NCF DSCR (x)
| No. of Mortgage Loans | Aggregate Cut-off Date Balance ($) | % of Pool | |||
| 1.20 - 1.49 | 5 | 159,031,554 | 23.6 | ||
| 1.50 - 1.59 | 5 | 164,775,546 | 24.4 | ||
| 1.60 - 1.74 | 4 | 101,574,542 | 15.0 | ||
| 1.75 - 1.99 | 2 | 76,190,718 | 11.3 | ||
| 2.00 - 2.49 | 2 | 103,500,000 | 15.3 | ||
| 2.50 - 2.76 | 2 | 70,000,000 | 10.4 | ||
| Total: | 20 | $675,072,360 | 100.0 | % | |
| Min: 1.20x | Max: 2.76x | Wtd Avg: 1.78x | |||
UW NOI Debt Yield (%)
| No. of Mortgage Loans | Aggregate Cut-off Date Balance ($) | % of Pool | |||
| 10.4 - 11.0 | 3 | 125,300,000 | 18.6 | ||
| 11.1 - 12.0 | 4 | 120,931,554 | 17.9 | ||
| 12.1 - 13.0 | 4 | 87,675,546 | 13.0 | ||
| 13.1 - 15.0 | 3 | 101,190,718 | 15.0 | ||
| 15.1 - 17.0 | 3 | 126,474,542 | 18.7 | ||
| 17.1 - 19.2 | 3 | 113,500,000 | 16.8 | ||
| Total: | 20 | $675,072,360 | 100.0 | % | |
| Min: 10.4% | Max: 19.2% | Wtd Avg: 13.9% | |||
| (1) | All numerical information concerning the mortgage loans is approximate. All weighted average information regarding the mortgage loans reflects the weighting of the mortgage loans based on their outstanding principal balances as of the Cut-off Date. The sum of numbers and percentages in columns may not match the “Total” due to rounding. With respect to any mortgage loan that is part of a whole loan, unless otherwise indicated, all LTV, DSCR and Debt Yield calculations include any related pari passu companion loans and exclude any related subordinate companion loans and/or mezzanine loans, as applicable. For mortgaged properties securing residential cooperative mortgage loans, the UW DSCR and UW NOI Debt Yield for each such mortgaged property is calculated using underwritten net operating income or underwritten net cash flow, as applicable, for the related residential cooperative property which is the projected net operating income or net cash flow, as applicable, reflected in the most recent appraisal obtained by or otherwise in the possession of the related mortgage loan seller as of the Cut-off Date. LTV calculations are based upon the appraised value of the residential cooperative property determined as if such residential cooperative property is operated as a residential cooperative, inclusive of the amount of the underlying debt encumbering such residential cooperative property. The UW NCF DSCR, UW NOI Debt Yield and LTV calculations do not take into account any subordinate debt (whether or not secured by the related mortgaged property), that currently exists or is allowed under the terms of any mortgage loan. |
| (2) | In the case of mortgage loans secured by multiple properties, cut-off date balance information is based on allocated loan amounts with respect to such properties. |
| (3) | “California – Northern” includes zip codes above 93600, and “California – Southern” includes zip codes at or below 93600 |
| This is not a research report and was not prepared by any Underwriter’s research department. Please see additional important information and qualifications at the end of this Term Sheet. | ||
| T-29 | ||
| Retail – Regional Mall | Loan #1 | Cut-off Date Balance: | $67,000,000 |
| 3663 South Las Vegas Boulevard | Miracle Mile Shops | Cut-off Date LTV: | 38.6% |
| Las Vegas, NV 89109 | UW NCF DSCR: | 1.96x | |
| UW NOI Debt Yield: | 14.0% |
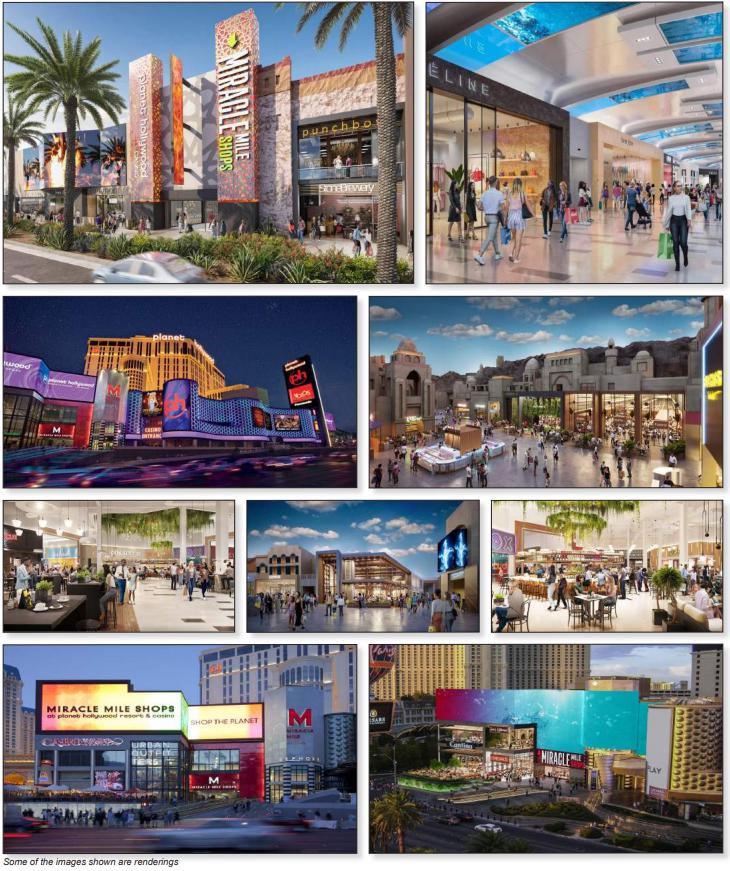
| This is not a research report and was not prepared by any Underwriter’s research department. Please see additional important information and qualifications at the end of this Term Sheet. | ||
| T-30 | ||
| Retail – Regional Mall | Loan #1 | Cut-off Date Balance: | $67,000,000 |
| 3663 South Las Vegas Boulevard | Miracle Mile Shops | Cut-off Date LTV: | 38.6% |
| Las Vegas, NV 89109 | UW NCF DSCR: | 1.96x | |
| UW NOI Debt Yield: | 14.0% |
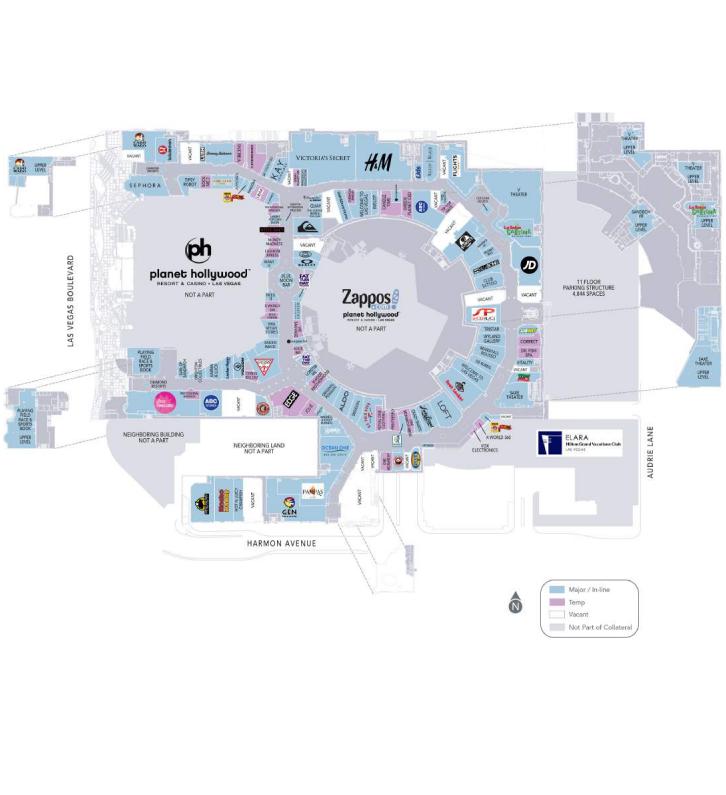
| This is not a research report and was not prepared by any Underwriter’s research department. Please see additional important information and qualifications at the end of this Term Sheet. | ||
| T-31 | ||
| Retail – Regional Mall | Loan #1 | Cut-off Date Balance: | $67,000,000 |
| 3663 South Las Vegas Boulevard | Miracle Mile Shops | Cut-off Date LTV: | 38.6% |
| Las Vegas, NV 89109 | UW NCF DSCR: | 1.96x | |
| UW NOI Debt Yield: | 14.0% |
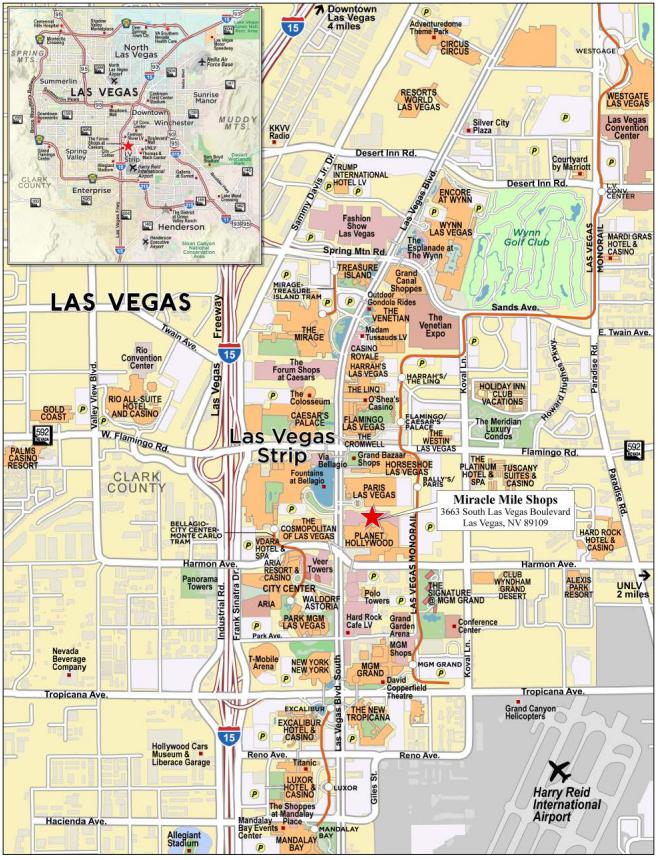
| This is not a research report and was not prepared by any Underwriter’s research department. Please see additional important information and qualifications at the end of this Term Sheet. | ||
| T-32 | ||
| Mortgage Loan No. 1 – Miracle Mile Shops |
| Mortgage Loan Information | Property Information | |||||
| Mortgage Loan Seller: | BANA | Single Asset/Portfolio: | Single Asset | |||
| Credit Assessment (Moody’s/Fitch/KBRA): | A1/AA-sf/A+ | Location: | Las Vegas, NV 89109 | |||
| Original Balance(1): | $67,000,000 | General Property Type: | Retail | |||
| Cut-off Date Balance(1): | $67,000,000 | Detailed Property Type: | Regional Mall | |||
| % of Initial Pool Balance: | 9.9% | Title Vesting: | Fee | |||
| Loan Purpose: | Refinance | Year Built/Renovated(7): | 2000 / 2007-2008; 2022-2023 | |||
| Borrower Sponsor: | Institutional Mall Investors LLC | Size: | 503,484 SF | |||
| Guarantor: | Institutional Mall Investors LLC | Cut-off Date Balance PSF(1): | $844 | |||
| Mortgage Rate(2): | 6.99105% | Maturity Date Balance PSF(1): | $844 | |||
| Note Date: | 6/6/2023 | Property Manager: | MCA Management Associates LLC | |||
| First Payment Date: | 7/6/2023 | (borrower-related) | ||||
| Maturity Date: | 6/6/2028 | |||||
| Original Term to Maturity: | 60 months | |||||
| Original Amortization Term: | 0 months | Underwriting and Financial Information | ||||
| IO Period: | 60 months | UW NOI: | $59,659,406 | |||
| Seasoning: | 1 month | UW NOI Debt Yield(1): | 14.0% | |||
| Prepayment Provisions(3): | L(25),DorYM1(28),O(7) | UW NOI Debt Yield at Maturity(1): | 14.0% | |||
| Lockbox/Cash Mgmt Status: | Hard/Springing | UW NCF DSCR(1): | 1.96x | |||
| Additional Debt Type(1)(4): | Pari Passu | Most Recent NOI: | $52,514,573 (3/31/2023 TTM) | |||
| Additional Debt Balance(1)(4): | $358,000,000 | 2nd Most Recent NOI: | $55,397,248 (12/31/2022) | |||
| Future Debt Permitted (Type): | No (NAP) | 3rd Most Recent NOI: | $44,031,083 (12/31/2021) | |||
| Reserves(5) | Most Recent Occupancy(8): | 85.3% (4/1/2023) | ||||
| Type | Initial | Monthly | Cap | 2nd Most Recent Occupancy: | 84.6% (12/31/2022) | |
| RE Taxes: | $0 | Springing | NAP | 3rd Most Recent Occupancy: | 84.0% (12/31/2021) | |
| Insurance: | $0 | Springing | NAP | Appraised Value (as of): | $1,100,000,000 (3/28/2023) | |
| Replacement Reserve: | $0 | Springing | $201,394 | Appraised Value PSF: | $2,185 | |
| TI/LC Reserve: | $0 | Springing | $1,006,968 | Cut-off Date LTV Ratio(1): | 38.6% | |
| Other Reserves(6): | $18,702,357 | Springing | NAP | Maturity Date LTV Ratio(1): | 38.6% | |
| Sources and Uses | ||||||
| Sources | Proceeds | % of Total | Uses | Proceeds | % of Total | |
| Whole Loan Amount(1): | $425,000,000 | 75.2% | Loan Payoff: | $542,477,253 | 95.9% | |
| Cash Equity Contribution: | $140,500,000 | 24.8% | Reserves: | $18,702,357 | 3.3% | |
| Closing Costs: | $4,320,390 | 0.8% | ||||
| Total Sources: | $565,500,000 | 100.0% | Total Uses: | $565,500,000 | 100.0% | |
| (1) | The Miracle Mile Shops Mortgage Loan (as defined below) is part of the Miracle Mile Shops Whole Loan (as defined below), which is evidenced by seven pari passu promissory notes with an aggregate original principal balance of $425,000,000. The Cut-off Date Balance PSF, Maturity Date Balance PSF, UW NOI Debt Yield, UW NOI Debt Yield at Maturity, UW NCF DSCR, Cut-off Date LTV Ratio and Maturity Date LTV Ratio numbers presented above are based on the aggregate principal balance of the promissory notes comprising the Miracle Mile Shops Whole Loan. |
| (2) | The related promissory notes have a component note sructure which, in the case of a prepayment, may result in an increased interest rate. See “Description of the Mortgage Pool—Certain Terms of the Mortgage Loans—Due Dates; Mortgage Rates; Calculations of Interest” in the prospectus. |
| (3) | Defeasance of the Miracle Mile Shops Whole Loan is permitted at any time after the earlier to occur of (a) one day after the end of the two-year period commencing on the closing date of the securitization of the last portion of the Miracle Mile Shops Whole Loan to be securitized and (b) June 6, 2026. The assumed defeasance lockout period of 25 payments is based on the closing date of this transaction in July 2023. |
| (4) | See “The Mortgage Loan” and “Additional Secured Indebtedness (not including trade debts)” below for further discussion of additional indebtedness. |
| (5) | See “Escrows and Reserves” below for further discussion of reserve information. |
| (6) | Other Reserves represents a TI Reserve ($10,024,691), Gap Rent Reserve ($8,677,666) and monthly springing Planet Hollywood Overlease Rent Reserve. |
| (7) | In January 2022, the borrower sponsor began an extensive renovation program at the Miracle Mile Shops Property (as defined below) to update the exterior entrances, facades, and interior common area. The renovations feature technology-based interactive elements, additional dining space and expanded entertainment offerings that are intended to increase visit frequency and dwell time. The renovation is scheduled to be substantially completed by summer of 2023. The borrower sponsor has provided a renovation project guaranty in the amount of $12,385,994 for all outstanding renovation expenditures. We cannot assure you the renovation will be completed as expected or at all. |
| (8) | Occupancy includes temporary tenants that represent 9.1% of total SF that have no rent associated and signed but not occupied tenants that represent 6.0% of total SF (and 8.1% of underwritten base rent). |
The Mortgage Loan. The largest mortgage loan (the “Miracle Mile Shops Mortgage Loan”) is part of a whole loan (the “Miracle Mile Shops Whole Loan”) that is evidenced by seven pari passu promissory notes in the aggregate original principal balance of $425,000,000 and secured by a first priority fee mortgage encumbering a 503,484 SF super regional mall located in Las Vegas, Nevada (the “Miracle Mile Shops Property”). The Miracle Mile Shops Whole Loan was co-originated by Goldman Sachs Bank USA, Bank of America, National Association and Morgan Stanley Bank, N.A. The Miracle Mile Shops Mortgage Loan is evidenced by the non-controlling Note A-3-C1 with an original principal balance of $67,000,000. The controlling Note A-1-S1 and non-controlling Note A-2-S1 in the aggregate original principal balance of $268,750,000 were contributed to MIRA 2023-MILE securitization trust. The remaining promissory notes (together with the notes contributed to MIRA 2023-MILE, the “Miracle Mile Shops Non-Serviced Pari Passu Companion Loans”) are currently held by Goldman Sachs Bank USA and Bank of America, National Association and are expected to be contributed to one or more future securitization transactions. The Miracle Mile Shops Whole Loan will be serviced pursuant to the trust and servicing agreement for the MIRA 2023-MILE securitization trust. See “Description of the Mortgage Pool—The Whole Loans—The Non-Serviced Pari Passu Whole Loans” and “Pooling and Servicing Agreement—Servicing of the Non-Serviced Mortgage Loans—Servicing of the Miracle Mile Shops Mortgage Loan” in the prospectus.
| This is not a research report and was not prepared by any Underwriter’s research department. Please see additional important information and qualifications at the end of this Term Sheet. | ||
| T-33 | ||
| Retail – Regional Mall | Loan #1 | Cut-off Date Balance: | $67,000,000 |
| 3663 South Las Vegas Boulevard | Miracle Mile Shops | Cut-off Date LTV: | 38.6% |
| Las Vegas, NV 89109 | UW NCF DSCR: | 1.96x | |
| UW NOI Debt Yield: | 14.0% |
| Miracle Mile Shops Whole Loan Summary | ||||
Note | Original Balance | Cut-off Date Balance | Note Holder | Controlling Piece |
| A-1-C1 | $25,000,000 | $25,000,000 | Goldman Sachs Bank USA | No |
| A-1-C2 | $25,000,000 | $25,000,000 | Goldman Sachs Bank USA | No |
| A-1-S1 | $162,500,000 | $162,500,000 | MIRA 2023-MILE | Yes |
| A-2-S1 | $106,250,000 | $106,250,000 | MIRA 2023-MILE | No |
| A-3-C1 | $67,000,000 | $67,000,000 | BANK5 2023-5YR2 | No |
| A-3-C2 | $29,250,000 | $29,250,000 | Bank of America, National Association | No |
| A-3-C3 | $10,000,000 | $10,000,000 | Bank of America, National Association | No |
| Total | $425,000,000 | $425,000,000 | ||
The Borrowers and the Borrower Sponsor. The borrowers are IMI Miracle Mall LLC and IMI Miracle Harmon LLC, each a Delaware limited liability company and single purpose entity with two independent directors. The borrower sponsor and non-recourse carveout guarantor is Institutional Mall Investors LLC (“IMI”). The non-recourse carveout guarantor’s aggregate liability with respect to any bankruptcy related non-recourse carveouts is limited to $100,000,000.
IMI is a co-investment venture owned by the California Public Employees Retirement System (“CalPERS”) and an affiliate of Miller Capital Advisory, Inc. (“MCA”). The borrower sponsor has an ownership interest in a portfolio that features regional and super regional shopping centers such as Ala Moana Center, Houston Galleria, Oakbrook Center, and Scottsdale Fashion Square. The portfolio focuses on fashion-oriented retail properties.
CalPERS is the nation’s largest public pension fund, serving more than 2 million members in the retirement system and more than 1.5 million members in its health program.
MCA is an Investment Advisor that manages property investments throughout the United States. Real estate investments under management totaled approximately $8.58 billion as of December 31, 2022.
The Property. The Miracle Mile Shops Property is a 503,484 SF regional mall located in Las Vegas, Nevada. The Miracle Mile Shops Property was constructed in 2000 by the Mills Corporation between the Planet Hollywood Resort and Casino (non-collateral), Elara by Hilton Grand Vacations (non-collateral), and the Bakkt Theater (formerly Zappo’s Theater) (non-collateral). The Miracle Mile Shops Property is centrally located on the Las Vegas Strip at the base of the pedestrian bridge to the Cosmopolitan and Aria properties and across the street from the Paris, Bellagio and MGM properties. Over 19,000 hotel rooms surround the Miracle Mile Shops Property. The Miracle Mile Shops Property includes an 11-story parking garage and provides 4,844 surface and garage parking spaces resulting in a ratio of approximately 9.6 parking spaces per 1,000 SF.
The Miracle Mile Shops Property is largely tourism and entertainment-focused with 25.8% of leased SF related to dining and 14.3% of leased SF related to theaters and other entertainment options. The remaining 59.9% of leased SF is retail-focused, with more than half leased to national brands, including Victoria’s Secret, H&M, Foot Locker, Lululemon, and Sephora. On average, non-temporary tenants have been at the property for approximately 11.5 years. Many of the top tenants have shown continued commitment to the Miracle Mile Shops Property as evidenced by Victoria’s Secret, Cabo Wabo, and Sephora, all of which have been at the property for at least 7 years. As of April 1, 2023, the Miracle Mile Shops Property was 85.3% leased to 118 tenants.
As of December 2022, the Miracle Mile Shops Property achieved comparable in-line sales of approximately $891 PSF, which represents an approximate 131% increase to 2020 comparable in-line sales ($385 PSF) and an approximate 5% increase to 2019 comparable in-line sales ($851 PSF). Sales have continued to trend upward in 2023, with the trailing 12-months ending March 2023 comparable in-line sales under 10,000 SF of approximately $904 PSF resulting in an occupancy cost of 17.0%.
In January 2022, the borrower sponsor began an extensive $54.5 million renovation to update the exterior entrances, facades, and interior common area. The renovations feature technology-based interactive elements, additional dining space and expanded entertainment offerings that are intended to increase visit frequency and dwell time. The borrower sponsor is adding new high-resolution screens at the exterior entrances, which along with interior digital displays, is projected by the borrower sponsor to increase annual revenue by approximately $3.9 million. There can be no assurance that such projections will be realized. The renovation is scheduled to be substantially completed by summer 2023. The lenders did not reserve any amounts for such renovation, however the borrower sponsor has provided a renovation project guaranty in the amount of $12,385,994 for all outstanding renovation expenditures. The mortgage loan documents require the renovation to be completed within twelve months of the loan origination date, otherwise any amounts for remaining costs are required to be reserved with the lender. We cannot assure you the renovations will be completed as expected or at all, or that the borrower sponsor’s projections of revenue from such renovations will be realized. Additionally, the borrower sponsor reportedly spent approximately $12 million to install a new central plant system in March 2022, which separated the Miracle Mile Shops Property’s mechanical systems from the non-collateral Planet Hollywood Resort and Casino and Elara by Hilton Grand Vacations with the goal of controlling utility costs.
| This is not a research report and was not prepared by any Underwriter’s research department. Please see additional important information and qualifications at the end of this Term Sheet. | ||
| T-34 | ||
| Retail – Regional Mall | Loan #1 | Cut-off Date Balance: | $67,000,000 |
| 3663 South Las Vegas Boulevard | Miracle Mile Shops | Cut-off Date LTV: | 38.6% |
| Las Vegas, NV 89109 | UW NCF DSCR: | 1.96x | |
| UW NOI Debt Yield: | 14.0% |
The following table contains sales history for the Miracle Mile Shops Property:
| Sales History(1) | ||||||
| 2018 | 2019 | 2020(2) | 2021 | 2022 | TTM March 2023 | |
| Gross Mall Sales | $285,908,810 | $288,210,194 | $124,167,031 | $241,503,825 | $258,160,688 | $256,177,352 |
| Sales PSF (Inline < 10,000 SF) | $819 | $851 | $385 | $817 | $891 | $904 |
| Occupancy Cost (Inline < 10,000 SF) | 18.8% | 19.2% | 32.4% | 13.2% | 16.7% | 17.0% |
| (1) | All sales information presented herein with respect to the Miracle Mile Shops Property is based upon information provided by the borrower sponsor. Because sales are self-reported, such information is not independently verified by the borrower sponsor. |
| (2) | Certain tenants were closed due to the COVID-19 pandemic. |
The following table contains anchor and major tenant sales history at the Miracle Mile Shops Property:
| Major Tenant Sales History(1) | ||||||
| Tenant | SF | 2019 Sales PSF | 2020 Sales PSF(2) | 2021 Sales PSF(2) | 2022 Sales PSF | March 2023 TTM Sales PSF |
| V Theater | 38,428 | $350 | $64 | $222 | $233 | $227 |
| Saxe Theater(3) | 22,398 | $342 | $61 | N/A | $54 | $95 |
| Victoria’s Secret | 20,872 | $618 | $246 | $383 | $380 | $361 |
| PH Race and Sports Book | 19,647 | N/A | N/A | N/A | N/A | N/A |
| H&M | 15,182 | $531 | $254 | $443 | $467 | $465 |
| Cabo Wabo | 11,457 | $1,497 | $629 | $1,209 | $1,414 | $1,488 |
| Gen Korean BBQ(4) | 10,447 | N/A | N/A | N/A | $301 | $447 |
| Pampas Churrascaria | 9,663 | $874 | $401 | $660 | $863 | $935 |
| (1) | All sales information presented herein with respect to the Miracle Mile Shops Property is based upon information provided by the borrower sponsor. Because sales are self-reported, such information is not independently verified by the borrower sponsor. |
| (2) | Certain tenants were closed due to the COVID-19 pandemic. |
| (3) | Saxe Theater re-opened in August 2022. 2020, 2022 and March 2023 TTM Sales PSF represent partial year operations. |
| (4) | Gen Korean BBQ had a lease start date of June 1, 2022. |
Major Tenants.
V Theater (38,428 SF, 7.6% of NRA, 3.2% of underwritten base rent). The V Theater is a multi-showroom complex comprised of four theaters, the Stripper 101 Studio, and two on-site bars. Space is available for private events and parties. V The Ultimate Variety Show, Zombie Burlesque, The Mentalist, Stripper 101, Popovich Comedy Pet Theater, The Jets 80's & 90's Experience, Piano Man, and Las Vegas Live Comedy Club all perform at the V Theater. V Theater occupies 38,428 SF at the Miracle Mile Shops Property under a lease expiring on December 31, 2028, with no extension options remaining. V Theater has been at the Miracle Mile Shops Property since 2004 and has renewed its lease multiple times, having a current lease expiration date of December 31, 2028. V Theater is currently paying a base rent of $43.65 PSF through the end of its lease term. V Theater reported sales at the Miracle Mile Shops Property of $227 PSF for the trailing-12 months ended March 31, 2023. Reported sales PSF were $222, $64 and $350 for 2021, 2020 and 2019, respectively.
Saxe Theater (22,398 SF, 4.4% of NRA, 2.4% of underwritten base rent). The Saxe Theater is a high-end performance space and includes a lounge on the main level with a fully stocked bar and seating areas. The Saxe Theater is designed with state-of-the-art lighting and sound systems, fiber optic video curtains and premium stadium seating, Saxe Theater is one of the most advanced theaters on the Las Vegas Strip today as well as home to high quality stage productions. Saxe Theater has been at the Miracle Mile Shops Property since 2010 with a current lease expiration date of December 31, 2028, with no extension options remaining. Saxe Theater is currently paying base rent of $62.51 PSF. Saxe Theater reported sales at the Miracle Mile Shops Property of $95 PSF for the trailing-12 months ended March 31, 2023. Saxe Theater reopened in August 2022 and therefore does not have a full 12 months of sales data.
Victoria’s Secret (20,872 SF, 4.1% of NRA, 4.4% of underwritten base rent). Victoria’s Secret & Co. (NYSE: VSCO) (“VS&Co”) (rated Ba3/BB- by Moody’s/S&P) is a Fortune 500 specialty retailer of modern, fashion-inspired collections including signature bras, panties, lingerie, casual sleepwear, athleisure and swim, as well as award-winning prestige fragrances and body care. VS&Co comprises two brands, Victoria’s Secret and PINK, founded in 1977 by Roy and Gaye Raymond. Victoria’s Secret employs over 30,000 associates across approximately 1,360 retail stores in approximately 70 countries. Victoria’s Secret has been at the Miracle Mile Shops Property since 2000 and currently occupies 20,872 SF at the Miracle Mile Shops Property under a lease expiring on January 31, 2026, with one five year extension option remaining. The lease provides for a current rental rate of $117.00 PSF through the end of the lease term. Victoria’s Secret reported sales at the Miracle Mile Shops Property of $361 PSF for the trailing-12 months ended March 31, 2023. Reported sales PSF were $383, $246 and $618 for 2021, 2020 and 2019, respectively.
| This is not a research report and was not prepared by any Underwriter’s research department. Please see additional important information and qualifications at the end of this Term Sheet. | ||
| T-35 | ||
| Retail – Regional Mall | Loan #1 | Cut-off Date Balance: | $67,000,000 |
| 3663 South Las Vegas Boulevard | Miracle Mile Shops | Cut-off Date LTV: | 38.6% |
| Las Vegas, NV 89109 | UW NCF DSCR: | 1.96x | |
| UW NOI Debt Yield: | 14.0% |
The following table presents certain information relating to the tenancy at the Miracle Mile Shops Property:
| Tenant Summary(1) | ||||||||||||
March 2023 TTM Sales(3) | ||||||||||||
| Tenant Name | Credit Rating (Fitch/ Moody’s/ S&P)(2) | Tenant SF | % of Total SF | Annual UW Total Rent | % of Annual Total UW Rent | Annual UW Total Rent PSF | Sales $ | Sales PSF | Occ Cost | Lease Expiration | Renewal Option | |
| V Theater(4) | NR/NR/NR | 38,428 | 7.6% | $1,853,611 | 3.2% | $48.24 | $8,710,593 | $227 | 21.3% | 12/31/2028 | None | |
| Saxe Theater(4)(5) | NR/NR/NR | 22,398 | 4.4% | $1,400,000 | 2.4% | $62.51 | $2,133,089 | $95 | 65.6% | 12/31/2028 | None | |
| Victoria's Secret | NR/Ba3/BB- | 20,872 | 4.1% | $2,562,929 | 4.4% | $122.79 | $7,533,653 | $361 | 34.0% | 1/31/2026 | 1 x 5 yr | |
| PH Race and Sports Book(6) | NR/NR/NR | 19,647 | 3.9% | $1,113,636 | 1.9% | $56.68 | NAV | NAV | NAV | 7/31/2045 | 1 x 20 yr | |
| H&M(7) | NR/NR/BBB | 15,182 | 3.0% | $1,483,092 | 2.6% | $97.69 | $7,054,828 | $465 | 21.0% | 1/31/2027 | 2 x 5 yr | |
| Rosa Mexicano(8) | NR/NR/NR | 12,150 | 2.4% | $2,987,191 | 5.1% | $245.86 | NAV | NAV | NAV | 11/30/2033 | 1 x 5 yr | |
| Subtotal/Wtd. Avg. | 128,677 | 25.6% | $11,400,459 | 19.6% | $88.60 | |||||||
| Remaining Tenants(9) | 300,654 | 59.7% | $46,676,022 | 80.4% | $155.25 | |||||||
| Vacant Space | 74,153 | 14.7% | $0 | 0.0% | $0.00 | |||||||
| Total/Wtd. Avg. | 503,484 | 100.0% | $58,076,481 | 100.0% | $151.35 | (10) | ||||||
| (1) | Information is based on the April 1, 2023 underwritten rent roll inclusive of rent steps through June 2024, signed but not occupied tenants, expense recoveries, overage rent and percent in lieu rent based on March 2023 trailing twelve month sales for certain tenants. |
| (2) | Certain ratings are those of the parent company whether or not the parent guarantees the lease. |
| (3) | All sales information presented herein with respect to the Miracle Mile Shops Property is based upon information provided by the borrowers. In certain instances, sales figures represent estimates because the tenants are not required to report, or otherwise may not have reported sales information on a timely basis. Further, because sales are self-reported, such information is not independently verified by the borrowers. |
| (4) | Each related lease includes a per diem rent abatement in the event of a future government shutdown of the leased premises. |
| (5) | Saxe Theater reopened in August 2022 and therefore does not have a full 12 months of sales data. |
| (6) | PH Race and Sports Book subleases approximately 3,500 SF to Chick-Fil-A. |
| (7) | H&M’s rent as shown is its contractual rent. According to the borrower sponsor, H&M exercised a co-tenancy clause in its lease in April 2023, due to the Miracle Mile Shops Property’s physical occupancy dropping below 85%. As a result, unless and until the Miracle Mile Shops Property achieves a physical occupancy (with tenants open and operating) of at least 85%, then H&M is permitted to (i) pay 5% of gross sales in lieu of the UW Base Rent and (ii) terminate its lease effective March 2024, instead of the original lease expiration of January 31, 2027. The estimated annual difference between such reduced rent and the UW Base Rent is approximately $1 million. The lender reserved $5,525,535 as a part of the gap rent reserve, which represents H&M’s contractual rent through the original lease expiration. We cannot assure you that the co-tenancy clause will be cured, that H&M will not terminate, or that the reserve funds will be sufficient to offset losses that might result from H&M’s reduced rent and vacancy. |
| (8) | Rosa Mexicano has signed a lease but is not yet in occupancy and is expected to open in November 2023. |
| (9) | Remaining tenants SF includes temporary tenants that have no rent associated. Remaining tenants Annual UW Total Rent includes approximately $3.2 million of CAM recoveries associated with the parking garage. |
| (10) | Wtd. Avg. Annual UW Total Rent PSF excludes temporary tenants and vacant space. |
| This is not a research report and was not prepared by any Underwriter’s research department. Please see additional important information and qualifications at the end of this Term Sheet. | ||
| T-36 | ||
| Retail – Regional Mall | Loan #1 | Cut-off Date Balance: | $67,000,000 |
| 3663 South Las Vegas Boulevard | Miracle Mile Shops | Cut-off Date LTV: | 38.6% |
| Las Vegas, NV 89109 | UW NCF DSCR: | 1.96x | |
| UW NOI Debt Yield: | 14.0% |
The following table presents certain information relating to the lease rollover schedule at the Miracle Mile Shops Property:
| Lease Rollover Schedule(1)(2) | ||||||||
| Year | # of Leases Rolling | SF Rolling | UW Rent PSF Rolling | Approx. % of Total SF Rolling | Approx. Cumulative % of SF Rolling | Total UW Rent Rolling | Approx. % of Total Rent Rolling | Approx. Cumulative % of Total Rent Rolling |
| MTM(3) / 2023(4) | 38 | 71,686 | $49.07 | 14.2% | 14.2% | $3,517,464 | 6.1% | 6.1% |
| 2024(4) | 23 | 59,152 | $174.84 | 11.7% | 26.0% | $10,342,383 | 17.8% | 23.9% |
| 2025 | 19 | 56,337 | $183.53 | 11.2% | 37.2% | $10,339,300 | 17.8% | 41.7% |
| 2026 | 10 | 45,475 | $143.63 | 9.0% | 46.2% | $6,531,542 | 11.2% | 52.9% |
| 2027 | 8 | 34,088 | $126.59 | 6.8% | 53.0% | $4,315,348 | 7.4% | 60.3% |
| 2028 | 8 | 65,300 | $80.92 | 13.0% | 65.9% | $5,284,047 | 9.1% | 69.4% |
| 2029 | 7 | 22,194 | $195.81 | 4.4% | 70.4% | $4,345,802 | 7.5% | 76.9% |
| 2030 | 5 | 12,473 | $184.46 | 2.5% | 72.8% | $2,300,812 | 4.0% | 80.9% |
| 2031 | 0 | 0 | $0.00 | 0.0% | 72.8% | $0 | 0.0% | 80.9% |
| 2032 | 6 | 20,617 | $159.19 | 4.1% | 76.9% | $3,281,994 | 5.7% | 86.5% |
| 2033 | 2 | 21,052 | $156.62 | 4.2% | 81.1% | $3,297,191 | 5.7% | 92.2% |
| 2034 & Beyond(5) | 3 | 20,957 | $215.71 | 4.2% | 85.3% | $4,520,598 | 7.8% | 100.0% |
| Vacant | 19 | 74,153 | $0.00 | 14.7% | 100.0% | $0 | 0.0% | 100.0% |
| Total/Wtd. Avg. | 148 | 503,484 | $151.35(6) | 100.0% | $58,076,481 | 100.0% | ||
| (1) | Information is based on the April 1, 2023 underwritten rent roll inclusive of rent steps through June 2024, signed but not occupied tenants, expense recoveries, overage rent and percent in lieu rent as of trailing twelve months ended March 2023 sales for certain tenants. |
| (2) | Certain tenants may have lease termination options that are exercisable prior to the originally stated expiration date of the related lease and are not considered in the rollover schedule. |
| (3) | Reflects leases with tenants that have passed the natural lease expiration date where tenant remains in occupancy on a month-to-month basis under the term of the existing lease. |
| (4) | Includes temporary tenants which sign license agreements typically for less than one year and have no rent associated to them. |
| (5) | 2034 and Beyond UW Total Rent includes approximately $3.2 million of CAM recoveries associated with the parking garage. |
| (6) | Wtd. Avg. UW Total Rent PSF Rolling excludes temporary tenants and vacant space. |
The Market. The Miracle Mile Shops Property is located in the central part of the Las Vegas Strip. Miracle Mile’s location and interconnected structure results in high foot traffic and has led the Miracle Mile Shops Property to rank #2 in the most visits PSF for super-regional malls in Nevada according to a third-party market report as of December 2022. The Miracle Mile Shops Property benefits from its convenient location near large casino resort hotels situated along the Las Vegas Strip Resort corridor, with a number of casinos located west of Interstate 15 on Flamingo Road including The Palms and Rio.
The Las Vegas visitor market set an all-time record in 2016, with 42.9 million visitors, with visitor volume exceeding 42.0 million through 2019, prior to the economic shutdown in 2020 due to COVID-19. Recently released statistics for 2022 report total visitor volume of 38.8 million, up from 32.2 million in 2021. Convention traffic set an all-time record in 2019 with 6.65 million attendees. Convention traffic has seen a return to Las Vegas with total attendance of 5.0 million in 2022 (up from 2.2 million in 2021). In addition to gaming and entertainment, Las Vegas draws visitors for major league sporting events, with the Golden Knights National Hockey League (NHL) team playing home games at T-Mobile Arena. Also, Las Vegas will host the 2024 Super Bowl and is being added to the FIA Formula One World Championship, with the Las Vegas Grand Prix scheduled for November 2023.
The Miracle Mile Shops Property is located in the Las Vegas retail market and the Southeast submarket. According to the appraisal, as of year end 2022, the Las Vegas retail market contained 30,367,000 SF of inventory, had an overall vacancy rate of 13.4%, and an average asking rent of $22.84 PSF. As of year end 2022, the Southeast submarket contained approximately 5,073,000 SF of retail supply, had an overall vacancy rate of 12.8%, and an average asking rent of $19.67 PSF.
Major employers in the area include MGM Resorts International, Caesars Entertainment Corp., Station Casinos Inc., Wynn Las Vegas LLC, Boyd Gaming Corp., Las Vegas Sands Corp, Bellagio LLC, The Valley Health System, Aria Resort & Casino and Mandalay Bay Resort & Casino. The 2022 population within a 5-, 7- and 10-mile radius of the Miracle Mile Shops Property was 385,558, 892,565 and 1,687,589, respectively. The 2022 average household income within the same radii was $62,255, $68,192 and $80,497, respectively.
| This is not a research report and was not prepared by any Underwriter’s research department. Please see additional important information and qualifications at the end of this Term Sheet. | ||
| T-37 | ||
| Retail – Regional Mall | Loan #1 | Cut-off Date Balance: | $67,000,000 |
| 3663 South Las Vegas Boulevard | Miracle Mile Shops | Cut-off Date LTV: | 38.6% |
| Las Vegas, NV 89109 | UW NCF DSCR: | 1.96x | |
| UW NOI Debt Yield: | 14.0% |
The following table presents certain information relating to the appraisal’s market rent conclusions for the Miracle Mile Shops Property:
| Market Rent Summary | |||
| Tenant Type | Market Rent (PSF) | Lease Term (Yrs) | Reimb. Method |
| Harmon Restaurant | $60.00 | 10 | Tax & Insurance |
| Restaurant – LV Blvd | $160.00 | 10 | Tax & Insurance |
| Specialty Restaurant MM | $65.00 | 10 | Tax & Insurance |
| Over 10,000 SF | $60.00 | 10 | Tax & Insurance |
| 6,001 - 10,000 SF | $65.00 | 10 | Net |
| 4,001 - 6,000 SF | $85.00 | 10 | Net |
| 2,001 - 4,000 SF | $90.00 | 10 | Net |
| 1,001 - 2,000 SF | $140.00 | 10 | Net |
| Less than 1,000 SF | $280.00 | 10 | Net |
The following table presents information regarding certain competitive properties to the Miracle Mile Shops Property:
| Competitive Retail Summary | |||||||
| Miracle Mile Shops | Harmon Corner | The Shops at Crystals | The Showcase | Forum Shops at Caesars | Grand Canal Shoppes | Fashion Show Mall | |
Year Built/ Renovated | 2000 / 2007-2008; 2022-2023 | 2012 / NAP | 2009 / NAP | 1996-2021 / 2003, 2018, 2021 | 1992 / 1997, 2004 | 1999 / 2007 | 1981 / 1983, 2003 |
| Total GLA (SF) | 503,484(1) | 88,500 | 270,000 | 500,000 | 671,000 | 809,000 | 1,883,000 |
| Distance to Property | N/A | Adjacent South | Adjacent Southwest | 0.5 miles South | 0.7 miles North | 1.0 miles North | 1.3 miles North |
| Occupancy % | 85.3%(1) | 95.0% | 94.0% | 98.0% | 98.5% | 85.0% | 96.0% |
| Rent PSF | $151.35(1) | $150.00 - $200.00 | $125.00 - $175.00 | $75.00 - $125.00 | $150.00 - $200.00 | $90.00 - $120.00 | $80.00 - $100.00 |
| Inline Sales PSF(2) | $904 | $1,000 - $1,200 | $1,200 - $1,400 | $500 - $1,000 | $1,400 - $1,700 | $1,000 - $1,200 | $900 - $1,000 |
Tenants/ Tenant Profile | V Theater Saxe Theater PH Race and Sports Book Victoria’s Secret H&M | Specialty center including upper- and lower-level restaurants | Multi-level upscale specialty retail center fronting Strip at CityCenter | Coca-Cola, Ross, Hard Rock Café, M&Ms, Burlington, Marshalls, Target | Upscale/themed center at Caesars with 1, 2 and 3 levels fronting Strip | Upscale/themed center 1-2 levels at Venetian Vacant anchor (Barney’s NY) | Nordstrom, Dillard’s, Neiman Marcus, Forever 21, Macy’s, Saks Fifth Avenue, Dick’s Sporting Goods |
Source: Appraisal, unless otherwise indicated.
| (1) | Information is based on the underwritten rent roll dated April 1, 2023. Occupancy includes temporary tenants that represent 9.1% of total SF that have no rent associated and signed but not occupied tenants that represent 6.0% of total SF (and 8.1% of underwritten base rent). Rent PSF excludes temporary tenants and vacant space. |
| (2) | The Miracle Mile Shops Property sales information is based on borrower sponsor’s provided information for TTM March 2023 and only includes tenants reporting sales. |
| This is not a research report and was not prepared by any Underwriter’s research department. Please see additional important information and qualifications at the end of this Term Sheet. | ||
| T-38 | ||
| Retail – Regional Mall | Loan #1 | Cut-off Date Balance: | $67,000,000 |
| 3663 South Las Vegas Boulevard | Miracle Mile Shops | Cut-off Date LTV: | 38.6% |
| Las Vegas, NV 89109 | UW NCF DSCR: | 1.96x | |
| UW NOI Debt Yield: | 14.0% |
Operating History and Underwritten Net Cash Flow. The following table presents certain information relating to the historical operating performance and Underwritten Net Cash Flow at the Miracle Mile Shops Property:
| Cash Flow Analysis | |||||||
| 2019 | 2020(1) | 2021 | 2022 | TTM 3/31/2023 | UW | UW PSF | |
| Base Rent(2) | $46,385,622 | $37,050,668 | $38,648,364 | $39,654,327 | $42,206,697 | $45,076,636 | $89.53 |
| Rent Steps(3) | $0 | $0 | $0 | $0 | $0 | $47,604 | $0.09 |
| Income from Vacant Units | $0 | $0 | $0 | $0 | $0 | $13,561,853 | $26.94 |
| Overage Rent(4) | $222,408 | $40,636 | $1,005,892 | $799,748 | $819,482 | $487,621 | $0.97 |
| Expense Reimbursement | $19,819,696 | $13,994,452 | $14,953,551 | $17,088,827 | $18,028,854 | $17,829,884 | $35.41 |
| Net Rental Income | $66,427,726 | $51,085,756 | $54,607,806 | $57,542,902 | $61,055,032 | $77,003,599 | $152.94 |
| Temp / Specialty Leasing Income | $6,199,669 | $3,839,548 | $3,806,968 | $5,163,138 | $5,403,781 | $6,092,100 | $12.10 |
| Other Income(5) | $5,301,363 | $5,965,683 | $7,039,779 | $11,133,966 | $8,231,665 | $12,711,509 | $25.25 |
| (Commercial Credit Loss) | ($80,829) | ($5,826,823) | ($696,493) | $3,427,229 | ($256,945) | $0 | $0.00 |
| (Vacancy & Credit Loss) | $0 | $0 | $0 | $0 | $0 | ($13,561,853) | ($26.94) |
| Effective Gross Income | $77,847,929 | $55,064,164 | $64,758,060 | $77,267,235 | $74,433,533 | $82,245,355 | $163.35 |
| Real Estate Taxes | $3,037,001 | $3,212,444 | $3,417,654 | $3,545,259 | $3,556,958 | $3,544,775 | $7.04 |
| Insurance | $325,551 | $431,518 | $468,106 | $511,082 | $529,888 | $700,209 | $1.39 |
| Ground Rent(6) | $153,224 | $155,678 | $159,125 | $165,490 | $167,123 | $172,110 | $0.34 |
| Other Operating Expenses(7) | $18,324,527 | $14,500,665 | $16,682,092 | $17,648,155 | $17,664,992 | $18,168,855 | $36.09 |
| Total Operating Expenses | $21,840,304 | $18,300,305 | $20,726,977 | $21,869,987 | $21,918,960 | $22,585,949 | $44.86 |
| Net Operating Income(8) | $56,007,625 | $36,763,859 | $44,031,083 | $55,397,248 | $52,514,573 | $59,659,406 | $118.49 |
| Replacement Reserves | $0 | $0 | $0 | $0 | $0 | $100,697 | $0.20 |
| TI/LC | $0 | $0 | $0 | $0 | $0 | $644,411 | $1.28 |
| Net Cash Flow | $56,007,625 | $36,763,859 | $44,031,083 | $55,397,248 | $52,514,573 | $58,914,298 | $117.01 |
| Occupancy %(9) | 93.0% | 88.9% | 84.0% | 84.6% | 85.3% | 85.8% | |
| NOI DSCR(10) | 1.86x | 1.22x | 1.46x | 1.84x | 1.74x | 1.98x | |
| NCF DSCR(10) | 1.86x | 1.22x | 1.46x | 1.84x | 1.74x | 1.96x | |
| NOI Debt Yield(10) | 13.2% | 8.7% | 10.4% | 13.0% | 12.4% | 14.0% | |
| NCF Debt Yield(10) | 13.2% | 8.7% | 10.4% | 13.0% | 12.4% | 13.9% | |
| (1) | The Miracle Mile Shops Property experienced a drop in Net Operating Income and Net Cash Flow due to the COVID-19 pandemic. |
| (2) | UW Base Rent is based on the underwritten rent roll dated April 1, 2023, with adjustments made for signed not occupied and tenants that have given notice to vacate. |
| (3) | Contractual Rent Steps were taken through June 2024. |
| (4) | UW Overage Rent is based on the terms of applicable leases using TTM March 2023 sales and contractual breakpoints, inclusive of breakpoint steps through June 2024. |
| (5) | UW Other Income includes borrower sponsor projected annualized income from the LED exterior and interior signage being installed with the current renovation which is expected to be complete by summer 2023 (approximately $3.9 million). We cannot assure you that the signage will be completed and operational as expected or at all, or that such projections will be realized. Additionally, UW Other Income includes contractual parking garage revenue plus the 2023 borrower sponsor’s budgeted transient parking income (approximately $8.4 million). |
| (6) | Ground Rent expense represents rent for a 2,400 SF portion of unit E013 that the borrowers lease from Planet Hollywood Resort and Casino through July 2025 (subject to two, 20-year extensions) pursuant to a reciprocal easement agreement. Borrowers’ rights under such reciprocal easement agreement are pledged as additional collateral for the Miracle Mile Shops Whole Loan. |
| (7) | Other Operating Expenses is inclusive of a management fee equal to 4.0% of Effective Gross Income. |
| (8) | The increase in UW Net Operating Income is driven by a combination of newly executed leases, increases to contractual parking revenue, and approximately $3.9 million of projected annual signage revenue that is expected as a result of the ongoing renovations. According to the borrower sponsor, between June 2021 and April 2023, the borrowers executed 8 new leases and 15 renewals, which together account for approximately 86,340 SF. The borrowers are currently in the process of installing the exterior signage and expects to be operational in the summer/fall of 2023. We cannot assure you that the renovations will be completed as expected or at all, or that such projections will be realized. |
| (9) | Occupancy includes temporary tenants. TTM 3/31/2023 occupancy is based on the underwritten rent roll dated April 1, 2023, and includes signed not occupied tenants. |
| (10) | Debt service coverage ratios and debt yields are based on the Miracle Mile Shops Whole Loan. |
Escrows and Reserves.
Real Estate Taxes – During a Cash Management Period (as defined below), the borrowers are required to deposit monthly to a real estate tax reserve 1/12 of the annual estimated real estate taxes.
Insurance – During a Cash Management Period, except if the Miracle Mile Shops Property is insured under an acceptable blanket policy, the borrowers are required to deposit monthly 1/12 of the annual estimated insurance premiums to the insurance reserve.
Replacement Reserve – During a Cash Management Period, the borrowers are required to deposit monthly an amount equal to approximately $8,391 to a reserve for replacements to the Miracle Mile Shops Property, subject to a cap of approximately $201,394.
TI/LC Reserve – During a Cash Management Period, the borrowers are required to deposit monthly an amount equal to $41,957 for future tenant improvements and leasing commissions, subject to a cap of $1,006,968.
TI Reserve – The Miracle Mile Shops Whole Loan documents provide for an upfront reserve of $10,024,691 for outstanding tenant improvement and leasing obligations.
| This is not a research report and was not prepared by any Underwriter’s research department. Please see additional important information and qualifications at the end of this Term Sheet. | ||
| T-39 | ||
| Retail – Regional Mall | Loan #1 | Cut-off Date Balance: | $67,000,000 |
| 3663 South Las Vegas Boulevard | Miracle Mile Shops | Cut-off Date LTV: | 38.6% |
| Las Vegas, NV 89109 | UW NCF DSCR: | 1.96x | |
| UW NOI Debt Yield: | 14.0% |
Gap Rent Reserve – The Miracle Mile Shops Whole Loan documents provide for an upfront reserve of $8,677,666 for outstanding gap rent obligations, including $5,525,535 which represents H&M’s (the fifth largest tenant), contractual rent through its original lease expiration, given H&M’s exercise of a co-tenancy clause in its lease in April 2023.
Planet Hollywood Overlease Rent Funds Reserve – During a Cash Management Period, the borrowers are required to deposit monthly an amount equal to 1/12 of the annual rent owed in connection with the borrowers’ lease of 2,400 SF from Planet Hollywood Resort and Casino.
Lockbox and Cash Management. The Miracle Mile Shops Whole Loan is structured with a hard lockbox and springing cash management. All rents from the Miracle Mile Shops Property are required to be deposited directly to the lockbox account and, so long as a Cash Management Period is not continuing, funds in the lockbox account will be transferred to the borrowers’ operating account. During a Cash Management Period, the borrowers will not have access to the funds in the lockbox account and such funds will be transferred to the lender-controlled cash management account and disbursed according to the Miracle Mile Shops Whole Loan documents. During a Cash Sweep Period (as defined below), all excess cash is required to be held by the lender as additional security for the Miracle Mile Shops Whole Loan; provided that excess cash will be disbursed at the direction of the borrowers in the event of shortfalls in certain monthly expense items.
A “Cash Management Period” will occur during the existence of any of: (i) an event of default, or (ii) when the debt yield falls below 10.5% at the end of any two consecutive calendar quarters (the “Cash Management Debt Yield Target”), provided the borrowers are permitted to make any prepayment or provide any credit support to achieve the Cash Management Debt Yield Target.
A “Cash Sweep Period” will occur during the existence of any of: (a) an event of default or (b) when the debt yield falls below 9.5% at the end of any two consecutive calendar quarters (the “Cash Sweep Debt Yield Target”), provided the borrowers are permitted to make any prepayment or provide any credit support to achieve the Cash Sweep Debt Yield Target.
Additional Secured Indebtedness (not including trade debts). In addition to the Miracle Mile Shops Mortgage Loan, the Miracle Mile Shops Property also secures the Miracle Mile Shops Non-Serviced Pari Passu Companion Loans, which have an aggregate Cut-off Date principal balance of $358,000,000. The Miracle Mile Shops Non-Serviced Pari Passu Companion Loans accrue interest at the same rate as the Miracle Mile Shops Mortgage Loan. The Miracle Mile Shops Mortgage Loan is entitled to payments of principal and interest on a pro rata and pari passu basis with the Miracle Mile Shops Non-Serviced Pari Passu Companion Loans. The holders of the Miracle Mile Shops Mortgage Loan and the Miracle Mile Shops Non-Serviced Pari Passu Companion Loans have entered into a co-lender agreement which sets forth the allocation of collections on the Miracle Mile Shops Whole Loan. See “Description of the Mortgage Pool—The Whole Loans—The Non-Serviced Pari Passu Whole Loans”.
Mezzanine Loan and Preferred Equity. None.
Release of Property. None.
Letter of Credit. None.
Right of First Offer/Right of First Refusal. None.
Ground Lease. None.
Terrorism Insurance. The borrowers are required to obtain and maintain property insurance and business interruption insurance for 24 months plus a 365-day extended period of indemnity. Such insurance is required to cover perils of terrorism and acts of terrorism; provided that the borrowers are permitted to maintain terrorism coverage with a licensed captive insurance company that is affiliated with the borrower sponsor if certain conditions set forth in the related Miracle Mile Shops Whole Loan documents are satisfied, and if the Terrorism Risk Insurance Program Reauthorization Act of 2015 is not in effect, the borrowers will only be required to pay for terrorism insurance through such captive insurance company a maximum of two times the annual insurance premiums payable for the Miracle Mile Shops Property at the time with respect to the property and business income or rental income insurance interruption policies (excluding the terrorism and earthquake components of such premiums). See “Risk Factors—Risks Relating to the Mortgage Loans—Terrorism Insurance May Not Be Available for All Mortgaged Properties” in the prospectus.
| This is not a research report and was not prepared by any Underwriter’s research department. Please see additional important information and qualifications at the end of this Term Sheet. | ||
| T-40 | ||
| Retail – Super Regional Mall | Loan #2 | Cut-off Date Balance: | $65,000,000 |
| 175, 459, 303-675, 686 & 901 | Brandon Mall | Cut-off Date LTV: | 54.7% |
| Brandon Town Center Drive | U/W NCF DSCR: | 2.33x | |
| Brandon, FL 33511 | U/W NOI Debt Yield: | 19.2% |

| This is not a research report and was not prepared by any Underwriter’s research department. Please see additional important information and qualifications at the end of this Term Sheet. | ||
| T-41 | ||
| Retail – Super Regional Mall | Loan #2 | Cut-off Date Balance: | $65,000,000 |
| 175, 459, 303-675, 686 & 901 | Brandon Mall | Cut-off Date LTV: | 54.7% |
| Brandon Town Center Drive | U/W NCF DSCR: | 2.33x | |
| Brandon, FL 33511 | U/W NOI Debt Yield: | 19.2% |
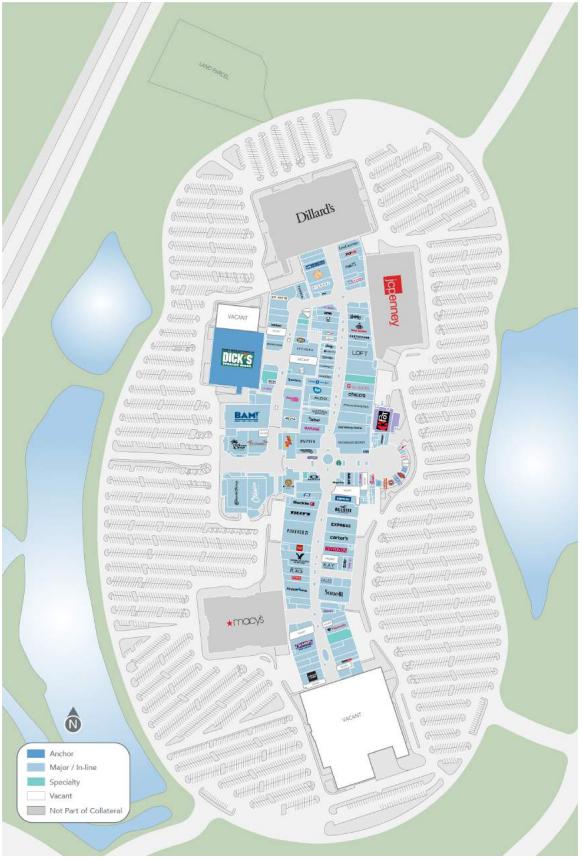
| This is not a research report and was not prepared by any Underwriter’s research department. Please see additional important information and qualifications at the end of this Term Sheet. | ||
| T-42 | ||
| Retail – Super Regional Mall | Loan #2 | Cut-off Date Balance: | $65,000,000 |
| 175, 459, 303-675, 686 & 901 | Brandon Mall | Cut-off Date LTV: | 54.7% |
| Brandon Town Center Drive | U/W NCF DSCR: | 2.33x | |
| Brandon, FL 33511 | U/W NOI Debt Yield: | 19.2% |
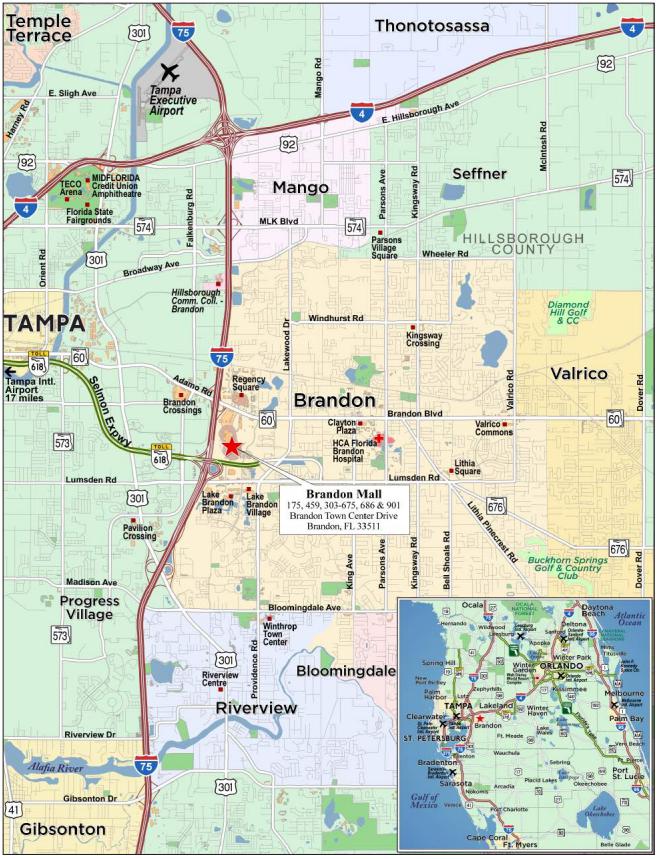
| This is not a research report and was not prepared by any Underwriter’s research department. Please see additional important information and qualifications at the end of this Term Sheet. | ||
| T-43 | ||
| Mortgage Loan No. 2 – Brandon Mall |
| Mortgage Loan Information | Property Information | |||||
| Mortgage Loan Seller: | WFB | Single Asset/Portfolio: | Single Asset | |||
| Credit Assessment (Fitch/Moody’s/KBRA): | NR/NR/NR | Location: | Brandon, FL 33511 | |||
| Original Balance(1): | $65,000,000 | General Property Type: | Retail | |||
| Cut-off Date Balance(1): | $65,000,000 | Detailed Property Type: | Super Regional Mall | |||
| % of Initial Pool Balance: | 9.6% | Title Vesting: | Fee | |||
| Loan Purpose: | Acquisition | Year Built/Renovated: | 1995/2022 | |||
| Borrower Sponsors: | NADG (US) LLLP and North American | Size(4): | 659,882 SF | |||
| Property Group | Cut-off Date Balance Per SF(1): | $183 | ||||
| Guarantors: | NADG (US) LLLP and North American | Maturity Date Balance Per SF(1): | $183 | |||
| Property Group | Property Manager: | Centrecorp Management Services, | ||||
| Mortgage Rate: | 7.6200% | LLLP | ||||
| Note Date: | 5/24/2023 | (borrower-related) | ||||
| First Payment Date: | 7/11/2023 | |||||
| Maturity Date: | 6/11/2028 | |||||
| Original Term to Maturity: | 60 months | |||||
| Original Amortization Term: | 0 months | |||||
| IO Period: | 60 months | |||||
| Seasoning: | 1 month | Underwriting and Financial Information | ||||
| Prepayment Provisions: | L(25),D(28),O(7) | UW NOI: | $23,219,535 | |||
| Lockbox/Cash Mgmt Status: | Hard/Springing | UW NOI Debt Yield(1): | 19.2% | |||
| Additional Debt Type(1)(2): | Pari Passu | UW NOI Debt Yield at Maturity(1): | 19.2% | |||
| Additional Debt Balance(1)(2): | $56,000,000 | UW NCF DSCR(1): | 2.33x | |||
| Future Debt Permitted (Type): | No (NAP) | Most Recent NOI: | $23,943,452 (3/31/2023 TTM) | |||
| Reserves(3) | 2nd Most Recent NOI: | $23,610,616 (12/31/2022) | ||||
| Type | Initial | Monthly | Cap | 3rd Most Recent NOI: | $21,968,288 (12/31/2021) | |
| RE Tax: | $2,223,137 | $317,591 | NAP | Most Recent Occupancy(5): | 70.4% (4/6/2023) | |
| Insurance: | $0 | Springing | NAP | 2nd Most Recent Occupancy(6): | 72.3% (12/31/2022) | |
| Replacement Reserve: | $4,000,000 | $10,998 | NAP | 3rd Most Recent Occupancy(6): | 92.1% (12/31/2021) | |
| TI/LC: | $4,000,000 | $109,980 | NAP | Appraised Value (as of): | $221,220,000 (3/16/2023) | |
| Gap Rent Reserve: | $136,312 | $0 | NAP | Appraised Value Per SF: | $335 | |
| Rent Concession Reserve: | $89,507 | $0 | NAP | Cut-off Date LTV Ratio(1): | 54.7% | |
| Existing TI/LC Reserve: | $947,920 | $0 | NAP | Maturity Date LTV Ratio(1): | 54.7% | |
| Sources and Uses | ||||||
| Sources | Proceeds | % of Total | Uses | Proceeds | % of Total | |
| Whole Loan Amount(1): | $121,000,000 | 51.6% | Purchase Price: | $220,000,000 | 93.9% | |
| Sponsor Equity: | $113,322,437 | 48.4% | Reserves: | $11,396,876 | 4.9%% | |
| Closing Costs: | $2,925,561 | 1.2%% | ||||
| Total Sources: | $234,322,437 | 100.0% | Total Uses: | $234,322,437 | 100.0% | |
| (1) | The Brandon Mall Mortgage Loan (as defined below) is part of the Brandon Mall Whole Loan (as defined below), which is comprised of two pari passu senior promissory notes with an aggregate original principal balance of $121,000,000. The Cut-off Date Balance Per SF, Maturity Date Balance Per SF, UW NCF DSCR, UW NOI Debt Yield, UW NOI Debt Yield at Maturity, Cut-off Date LTV Ratio and Maturity Date LTV Ratio presented above are based on the aggregate Cut-off Date principal balance of the Brandon Mall Whole Loan. |
| (2) | See “The Mortgage Loan” and “Additional Secured Indebtedness (not including trade debts)” sections below for further discussion of additional mortgage debt. |
| (3) | See “—Escrows and Reserves ” section below for further discussion of reserve requirements. |
| (4) | The Brandon Mall Property (as defined below) is part of a larger mall containing 1,155,045 SF. |
| (5) | As of April 6, 2023, the Brandon Mall Property was 70.4% leased and occupancy excluding the Sears Space (as defined below) was 86.8%. |
| (6) | The decrease in occupancy between 12/31/2021 and 12/31/2022 was due to Sears vacating the Brandon Mall Property in 2021. |
The Mortgage Loan. The second largest mortgage loan (the “Brandon Mall Mortgage Loan”) is part of a whole loan (the “Brandon Mall Whole Loan”) secured by the fee interest in a 659,882 square foot super regional mall located in Brandon, Florida (the “Brandon Mall Property”). The Brandon Mall Whole Loan has an original aggregate principal balance of $121,000,000 and is comprised of two pari passu notes. The Brandon Mall Mortgage Loan, with an original principal balance of $65,000,000 is evidenced by the controlling Note A-1. The non-controlling Note A-2 (the “Brandon Mall Serviced Pari Passu Companion Loan”), with an original principal balance of $56,000,000, is expected to be contributed to a future securitization trust. The Brandon Mall Whole Loan will be serviced under the pooling and servicing agreement for the BANK5 2023-5YR2 securitization trust. See “Description of the Mortgage Pool—The Whole Loans—The Serviced Pari Passu Whole Loans” and “Pooling and Servicing Agreement” in the prospectus.
| This is not a research report and was not prepared by any Underwriter’s research department. Please see additional important information and qualifications at the end of this Term Sheet. | ||
| T-44 | ||
| Retail – Super Regional Mall | Loan #2 | Cut-off Date Balance: | $65,000,000 |
| 175, 459, 303-675, 686 & 901 | Brandon Mall | Cut-off Date LTV: | 54.7% |
| Brandon Town Center Drive | U/W NCF DSCR: | 2.33x | |
| Brandon, FL 33511 | U/W NOI Debt Yield: | 19.2% |
| Whole Loan Summary | ||||
| Note | Original Balance | Cut-off Date Balance | Note Holder | Controlling Note |
| A-1 | $65,000,000 | $65,000,000 | BANK5 2023-5YR2 | Yes |
| A-2 | $56,000,000 | $56,000,000 | WFB | No |
| Total | $121,000,000 | $121,000,000 | ||
The Borrower and the Borrower Sponsors. The borrower is Brandon (Tampa) LP, a Delaware limited partnership with one independent director. The borrower is a joint venture between NADG Brandon LP (50.9%) and 14835514 Canada, Inc. (49.0%). Legal counsel to the borrower delivered a non-consolidation opinion in connection with the origination of the Brandon Mall Whole Loan. The borrower sponsors and non-recourse carveout guarantors of the Brandon Mall Whole Loan are NADG (US) LLLP and North American Property Group (“NAPG”). NAPG does not have any direct ownership in the borrower.
NADG (US) LLLP and NAPG are affiliates of North American Development Group (“NADG”). NADG was founded in 1977 and currently has $5.7 billion in assets under management including over 25 million SF of retail and mixed use space and 10,000 residential units. NADG has 14 offices across North America with over 300 professionals. NADG’s retail platform includes 65 properties ranging from outparcel pads to over 1.8 million SF mixed-used developments. NADG is a large private owner of retail properties in North America and partners with well-known tenant brands.
14835514 Canada, Inc. is an affiliate of Canadian Post Corporation Pension Plan, which is one of the largest single-employer sponsor pension plans in Canada and reported total assets of $29.6 billion (CAD) as of December 31, 2022.
The Property. The Brandon Mall Property is a one-story, Class A super regional mall totaling 659,882 owned square feet, located in Brandon, Florida. The Brandon Mall Property is part of a larger mall containing 1,155,045 SF, of which the remaining 495,163 square feet are not included in the collateral. The property is a traditional enclosed mall with multiple wings and entrances, containing a food court and department store anchors. Built in 1995 and most recently renovated in 2022, the property is situated on a 122.8-acre parcel and contains 2,897 parking spaces (4.4/1,000 SF). The collateral anchor tenant is Dick’s Sporting Goods and non-collateral anchors include JCPenney, Macy’s and Dillard’s. Additional notable tenants include Apple, Books-A-Million, Sephora, Abercrombie & Fitch, Forever 21, Victoria’s Secret, and The Cheesecake Factory. The collateral also includes a 124,552 SF vacant former Sears box (the “Sears Space”), which vacated the property in 2021, and a 6.8 acre parcel of undeveloped excess land. Between 2018 and 2022, the property averaged 87.2% occupancy (including the Sears Space) and 88.9% occupancy (excluding the Sears Space). As of April 6, 2023, the Brandon Mall Property was 70.4% leased to 156 tenants and occupancy excluding the Sears Space was 86.8%. See “Description of the Mortgage Pool – Mortgage Pool Characteristics – Property Types – Retail Properties” in the prospectus.
February 2023 TTM in-line sales PSF are $829 PSF, representing a 3.1% and 0.3% increase since 2021 and 2022, respectively. Excluding Apple, February 2023 TTM in-line sales PSF are $670 PSF, representing a 1.1% and 0.3% increase since 2021 and 2022, respectively. As of the February 2023 TTM, the in-line occupancy cost ratio is 11.1% including Apple and 13.8% excluding Apple. The table below provides an overview of the sales by tenancy type (partial year sales were excluded from the analysis).
Sales by Tenancy Type(1) | ||||||||
Tenancy Type | 2020 Sales | 2020 PSF | 2021 Sales | 2021 PSF | 2022 Sales | 2022 PSF | TTM Sales(2) | TTM PSF(2) |
| Major (> 10,000 SF) | 34,572,426 | $314 | 49,595,226 | $450 | 48,366,814 | $439 | 48,129,579 | $437 |
| Inline (< 10,000 SF) | 138,474,795 | $490 | 227,001,685 | $804 | 233,368,159 | $826 | 234,051,719 | $829 |
| Inline (< 10,000 SF) excluding Apple | 115,718,127 | $417 | 184,016,509 | $663 | 185,597,381 | $668 | 186,061,718 | $670 |
| Total Sales | $288,765,348 | $441 | $460,613,420 | $705 | $467,332,354 | $718 | $468,243,016 | $719 |
| (1) | Based on the underwritten rent roll dated April 6, 2023. |
| (2) | TTM is as of February 28, 2023. |
Major Tenants.
Dick’s Sporting Goods (“Dick’s”) (Fitch/Moody’s/S&P: NR/Baa3/BBB; 45,000 SF; 6.8% of NRA; 5.2% of underwritten base rent; January 31, 2028 lease expiration). Founded in 1948, Dick’s (NYSE: DKS) is a retailer serving athletes and outdoor enthusiasts. Today, the company operates over 850 Dick’s Sporting Goods, Golf Galaxy, Public Lands, Moosejaw, Going Going Gone! and Warehouse Sale stores. Dick’s has been a tenant at the property since 2007 and has no termination or extension options.
Victoria’s Secret (Fitch/Moody’s/S&P: NR/Ba3/BB-; 11,129 SF; 1.7% of NRA; 3.5% of underwritten base rent; January 31, 2028 lease expiration). Victoria’s Secret (NYSE: VSCO) is a Fortune 500 specialty retailer of modern, fashion-inspired collections including signature bras, panties, lingerie, casual sleepwear, athleisure and swim, fragrances and body care. Today Victoria’s Secret has more than 30,000 associates across approximately 1,360 retail stores in approximately 70 countries. Victoria’s Secret has been a tenant at the property since 2017 and does not have any extension or termination options.
The Cheesecake Factory (10,203 SF; 1.5% of NRA; 3.5% of underwritten base rent; January 31, 2028 lease expiration). In 1972, Evelyn and Oscar Overton opened the first Cheesecake Factory in Los Angeles, California. Today, the company has over 225 locations worldwide with more than 40,000 employees. The Cheesecake Factory has been a tenant at the property since 2006 and has 2, 5-year extension options and no termination options.
| This is not a research report and was not prepared by any Underwriter’s research department. Please see additional important information and qualifications at the end of this Term Sheet. | ||
| T-45 | ||
| Retail – Super Regional Mall | Loan #2 | Cut-off Date Balance: | $65,000,000 |
| 175, 459, 303-675, 686 & 901 | Brandon Mall | Cut-off Date LTV: | 54.7% |
| Brandon Town Center Drive | U/W NCF DSCR: | 2.33x | |
| Brandon, FL 33511 | U/W NOI Debt Yield: | 19.2% |
The following table presents a summary regarding the major tenants at the Brandon Mall Property:
| Tenant Summary | ||||||||||
| Tenant Name | Credit Rating (Fitch/Moody's/ S&P)(1) | Tenant SF | Approx. % of SF | Annual UW Rent(2)(3) | % of Total Annual UW Rent | Annual UW Rent PSF(2)(3) | Termination Option (Y/N) | Lease Expiration | Renewal Options | |
| Anchor Tenants | ||||||||||
| Dick’s | NR/Baa3/BBB | 45,000 | 6.8% | $925,036 | 5.2% | $20.56 | N | 1/31/2028 | None | |
| Total/Wtd. Avg. | 45,000 | 6.8% | $925,036 | 5.2% | $20.56 | |||||
| Major Tenants | ||||||||||
| The Cheesecake Factory | NR/NR/NR | 10,203 | 1.5% | $628,993 | 3.5% | $61.65 | N | 1/31/2028 | 2 x 5Yr | |
| Victoria's Secret | NR/Ba3/BB- | 11,129 | 1.7% | $626,674 | 3.5% | $56.31 | N | 1/31/2028 | None | |
| Books-A-Million | NR/NR/NR | 17,383 | 2.6% | $385,398 | 2.2% | $22.17 | N | 1/31/2028 | 1 x 5Yr | |
| Champs Sports | NR/NR/NR | 6,792 | 1.0% | $373,385 | 2.1% | $54.97 | N | 4/30/2025 | None | |
| Forever 21 | NR/NR/NR | 11,179 | 1.7% | $373,168 | (4) | 2.1% | $33.38(4) | Y(5) | MTM | None |
| American Eagle Outfitters | NR/NR/NR | 6,128 | 0.9% | $369,838 | 2.1% | $60.35 | N | MTM | None | |
| Aeropostale | NR/NR/NR | 3,081 | 0.5% | $358,800 | 2.0% | $116.46 | N | 1/31/2025 | None | |
| Foot Locker | NR/Ba1/BB+ | 5,517 | 0.8% | $346,150 | 2.0% | $62.74 | N | 6/30/2024 | None | |
| Zales Jewelers | NR/NR/NR | 1,620 | 0.2% | $341,592 | 1.9% | $210.86 | N | 6/30/2028 | None | |
| Total/Wtd. Avg. | 73,032 | 11.1% | $3,803,998 | 21.4% | $52.09 | |||||
| Non-Major Tenants | 346,606 | 52.5% | $13,008,497 | 73.3% | $37.53 | |||||
| Occupied Collateral Total | 464,638 | 70.4% | $17,737,531 | 100.0% | $38.17 | |||||
| Vacant Space | 195,244 | 29.6% | ||||||||
| Total/Wtd. Avg. | 659,882 | 100.0% | ||||||||
| (1) | Certain ratings are those of the parent company whether or not the parent guarantees the lease. |
| (2) | Annual UW Rent and Annual UW Rent PSF includes Percentage In-Lieu rents totaling $1,035,097. |
| (3) | Annual UW Rent and Annual UW Rent PSF includes $633,474 of rent steps through June 2024. |
| (4) | Forever 21’s Annual UW Rent and Annual UW Rent PSF represents Percentage In-Lieu based on the tenant’s 2022 sales. |
| (5) | Forever 21 has the right to terminate its lease if annual sales drop below $2,215,720 within 60 days of January 31st of each year. The tenant reported TTM 2/28/2023 sales of $3,109,737. |
The following table presents a summary of sales and occupancy costs for certain tenants at the Brandon Mall Property.
| Sales and Occupancy Cost Summary(1) | |||||
| 2020 Sales (PSF) | 2021 Sales (PSF) | 2022 Sales (PSF) | TTM 2/28/2023 Sales (PSF) | TTM Occupancy Cost | |
| Dick’s | $246 | $350 | $318 | $318 | 6.8% |
| The Cheesecake Factory | $890 | $1,281 | $1,348 | $1,356 | 6.8% |
| Victoria's Secret | $677 | $899 | $869 | $857 | 11.4% |
| Books-A-Million | $132 | $211 | $210 | $209 | 10.6% |
| Champs Sports | $529 | $733 | $600 | $573 | 17.0% |
| Forever 21 | $231 | $341 | $289 | $278 | 12.0% |
| American Eagle Outfitters | $519 | $754 | $673 | $672 | 15.0% |
| Aeropostale | NAV | $771 | $644 | $641 | 18.2% |
| Foot Locker | $930 | $1,140 | $1,089 | $1,072 | 10.1% |
| (1) | Information obtained from the borrower. |
| This is not a research report and was not prepared by any Underwriter’s research department. Please see additional important information and qualifications at the end of this Term Sheet. | ||
| T-46 | ||
| Retail – Super Regional Mall | Loan #2 | Cut-off Date Balance: | $65,000,000 |
| 175, 459, 303-675, 686 & 901 | Brandon Mall | Cut-off Date LTV: | 54.7% |
| Brandon Town Center Drive | U/W NCF DSCR: | 2.33x | |
| Brandon, FL 33511 | U/W NOI Debt Yield: | 19.2% |
The following table presents certain information relating to the lease rollover at the Brandon Mall Property:
| Lease Rollover Schedule(1)(2) | ||||||||
| Year | # of Leases Rolling | SF Rolling | Annual UW Rent PSF Rolling | Approx. % of Total SF Rolling | Approx. Cumulative % of SF Rolling | Total UW Rent Rolling | Approx. % of Total Rent Rolling | Approx. Cumulative % of Total Rent Rolling |
| MTM | 6 | 31,676 | $46.99 | 4.8% | 4.8% | $1,488,466 | 8.4% | 8.4% |
| 2023 | 25 | 43,654 | $15.87 | 6.6% | 11.4% | $692,689 | 3.9% | 12.3% |
| 2024 | 40 | 94,780 | $33.59 | 14.4% | 25.8% | $3,183,895 | 18.0% | 30.2% |
| 2025 | 30 | 66,949 | $45.40 | 10.1% | 35.9% | $3,039,267 | 17.1% | 47.4% |
| 2026 | 18 | 30,648 | $48.84 | 4.6% | 40.6% | $1,496,886 | 8.4% | 55.8% |
| 2027 | 14 | 33,158 | $51.55 | 5.0% | 45.6% | $1,709,275 | 9.6% | 65.5% |
| 2028 | 19 | 121,532 | $38.36 | 18.4% | 64.0% | $4,662,317 | 26.3% | 91.7% |
| 2029 | 3 | 5,916 | $36.19 | 0.9% | 64.9% | $214,123 | 1.2% | 92.9% |
| 2030 | 3 | 3,360 | $63.28 | 0.5% | 65.4% | $212,621 | 1.2% | 94.1% |
| 2031 | 3 | 13,892 | $23.34 | 2.1% | 67.5% | $324,196 | 1.8% | 96.0% |
| 2032 | 3 | 11,636 | $26.86 | 1.8% | 69.3% | $312,502 | 1.8% | 97.7% |
| 2033 | 3 | 7,437 | $53.96 | 1.1% | 70.4% | $401,292 | 2.3% | 100.0% |
| 2034 & Beyond | 0 | 0 | $0.00 | 0.0% | 70.4% | $0 | 0.0% | 100.0% |
| Vacant | 0 | 195,244 | $0.00 | 29.6% | 100.0% | $0 | 0.0% | 100.0% |
| Total/Wtd. Avg.(3) | 167 | 659,882 | $38.17 | 100.0% | $17,737,531 | 100.0% | ||
| (1) | Information is based on the underwritten rent roll as of April 6, 2023. |
| (2) | Certain tenants may have lease termination options that are exercisable prior to the stated expiration date of the subject lease or leases which are not considered in the lease rollover schedule. |
| (3) | Total/Wtd. Avg. Annual UW Rent PSF Rolling excludes vacant space. |
The Market. The Brandon Mall Property is located in Brandon, Florida, approximately 10.0 miles east of the Tampa central business district. According to a third party market research report, the property is located at the highly trafficked intersection of Interstate-75 and Brandon Boulevard, which had a daily traffic count of approximately 84,990 vehicles. The property is located in an area that benefits from a convergence of highway infrastructure that includes Interstate 75, State Road 60 and the Selmon Expressway. The area is suburban in nature and has experienced significant population and economic growth over the past 20 years as the Tampa MSA continues to expand. Between 2010 and 2022, the population within a 2-, 5- and 10- mile radius grew 23.3%, 23.2%, and 26.4%, respectively.
Within a one-, three- and five-mile radius of the Brandon Mall Property, the 2022 average household income was approximately $69,414, $78,069, and $81,816, respectively; and within the same radii, the 2022 estimated population was 12,872, 101,084, and 218,619, respectively.
According to a third party market research report, the property is situated within the East Tampa submarket of the larger Tampa/St. Petersburg retail market. As of May 2023, the submarket reported total inventory of approximately 14.9 million square feet with a 3.1% vacancy rate and average rents of $25.04 per square foot.
| This is not a research report and was not prepared by any Underwriter’s research department. Please see additional important information and qualifications at the end of this Term Sheet. | ||
| T-47 | ||
| Retail – Super Regional Mall | Loan #2 | Cut-off Date Balance: | $65,000,000 |
| 175, 459, 303-675, 686 & 901 | Brandon Mall | Cut-off Date LTV: | 54.7% |
| Brandon Town Center Drive | U/W NCF DSCR: | 2.33x | |
| Brandon, FL 33511 | U/W NOI Debt Yield: | 19.2% |
The following table presents certain information relating to comparable retail centers for the Brandon Mall Property:
Competitive Set | |||||
Property Name | Year Built/Renovated | Total NRA | Total Occupancy(1) | Anchor / Major Tenants | Distance to Brandon Mall Property |
| Brandon Mall | 1995/2022 | 659,882(2)(3) | 70.4%(2)(3)(4) | Macy’s, Dillard’s, JCPenney, Dick’s | |
| International Plaza and Bay Street | 2001/NAP | 855,281 | 97.8% | Nordstrom, Dillard’s, Neiman Marcus | 15.3 miles |
| Westshore Plaza | 1967/2001 | 1,093,846 | 88.0% | Dick’s, Macy’s, JCPenney, AMC 14 | 14.8 miles |
| Citrus Park Town Center | 1999/NAP | 619,158 | 91.0% | JCPenney, Macy’s, Dillard’s, Regal Cinemas, Dick’s | 25.2 miles |
| Westfield Countryside Mall | 1975/NAP | 724,220 | 88.0% | JCPenney, Macy’s, Dillard’s, CMX Cinemas, Whole Foods | 31.2 miles |
| Tyrone Square Mall | 1972/1998 | 711,556 | 90.0% | JCPenney, Macy’s, Dillard’s, Dick’s, DSW, PetSmart | 34.0 miles |
| The Mall at University Town Center | 2014/NAP | 886,000(1) | 98.8% | Dillard’s, Macy’s, Saks Fifth Avenue | 44.6 miles |
| Wtd. Avg. | 92.3%(5) | ||||
| Source: Appraisal, unless otherwise specified. |
| (1) | Based on a third party market research report, unless otherwise specified. |
| (2) | Based on the underwritten rent roll as of April 4, 2023. |
| (3) | Total NRA and Total Occupancy excludes non-collateral anchor tenants (Macy’s, Dillard’s, and JCPenney). |
| (4) | Excluding the Sears Space the property was 86.8% occupied. Total Occupancy including the non-collateral anchors and excluding the Sears Space was 93.1%. |
| (5) | Excludes the Brandon Mall Property. |
The following table presents information relating to the appraisal’s market rent conclusion for the Brandon Mall Property:
| Market Rent Summary | ||||
| Market Rent (PSF) | Lease Term (Yrs) | New Tenant Allowance PSF | Rent Increase Projection | |
| Shops/Inline 0-999 SF | $60.00 | 3 | $15.00 | 2.0% |
| Shops/Inline 1-3,000 SF | $38.00 | 5 | $20.00 | 2.0% |
| Shops/Inline 3-8,000 SF | $30.00 | 5 | $15.00 | 2.0% |
| Shops/Inline > 8,000 SF | $25.00 | 5 | $10.00 | 2.0% |
| Jewelry | $120.00 | 10 | $25.00 | 2.0% |
| Restaurant | $50.00 | 10 | $50.00 | Varies |
| Food Court | $140.00 | 5 | $25.00 | 2.0% |
| Kiosk | $350.00 | 3 | $0.00 | 2.0% |
| Anchor | $20.00 | 10 | $10.00 | Varies |
| ATM | $7,100 | 5 | $0.00 | 2.0% |
| Large Anchor (Sears) | $12.50 | 10 | $5.00 | None |
| Source: Appraisal. |
| This is not a research report and was not prepared by any Underwriter’s research department. Please see additional important information and qualifications at the end of this Term Sheet. | ||
| T-48 | ||
| Retail – Super Regional Mall | Loan #2 | Cut-off Date Balance: | $65,000,000 |
| 175, 459, 303-675, 686 & 901 | Brandon Mall | Cut-off Date LTV: | 54.7% |
| Brandon Town Center Drive | U/W NCF DSCR: | 2.33x | |
| Brandon, FL 33511 | U/W NOI Debt Yield: | 19.2% |
Operating History and Underwritten Net Cash Flow. The following table presents certain information relating to the historical operating performance and the Underwritten Net Cash Flow at the Brandon Mall Property:
| Cash Flow Analysis | ||||||||
| 2020 | 2021 | 2022 | 3/31/2023 TTM | UW | UW PSF | |||
| Base Rent | $17,425,925 | $16,116,863 | $17,637,209 | $17,512,573 | $17,737,531(1)(2) | $26.88 | ||
| Grossed Up Vacant Space | $0 | $0 | $0 | $0 | $3,861,046 | $5.85 | ||
| Gross Potential Rent | $17,425,925 | $16,116,863 | $17,637,209 | $17,512,573 | $21,598,577 | $32.73 | ||
| Other Income(3) | $228,518 | $295,780 | $439,119 | $459,494 | $459,494 | $0.70 | ||
| Percentage Rent | $213,614 | $2,102,120 | $2,338,675 | $2,516,930 | $2,203,179 | $3.34 | ||
| Specialty Leasing | $1,326,484 | $1,726,698 | $2,106,896 | $2,210,192 | $2,210,192 | $3.35 | ||
| Total Recoveries | $13,925,509 | $13,834,550 | $14,199,569 | $14,027,378 | $12,853,447 | $19.48 | ||
| Net Rental Income | $33,120,050 | $34,076,012 | $36,721,468 | $36,726,567 | $39,324,889 | $59.59 | ||
| Less Free Rent & Credit Loss | $4,508,571 | $1,730,075 | $1,368,804 | $808,256 | $0 | $0.00 | ||
| Less Vacancy | $0 | $0 | $0 | $0 | ($3,861,046) | ($5.85) | ||
| Effective Gross Income | $28,611,480 | $32,345,937 | $35,352,664 | $35,918,311 | $35,463,843 | $53.74 | ||
| Real Estate Taxes | $3,513,617 | $3,493,756 | $3,800,806 | $3,965,981 | $3,500,000 | $5.30 | ||
| Insurance | $209,159 | $677,746 | $618,915 | $606,215 | $1,293,363 | $1.96 | ||
| Management Fee | $1,144,459 | $1,293,837 | $1,414,107 | $1,465,109 | 1,063,915 | $1.61 | ||
| Other Expenses | $4,523,415 | $4,912,309 | $5,908,220 | $5,937,554 | $6,387,030 | $9.68 | ||
| Total Expenses | $9,390,649 | $10,377,649 | $11,742,048 | $11,974,859 | $12,244,308 | $18.56 | ||
| Net Operating Income | $19,220,830(4) | $21,968,288(4) | $23,610,616 | $23,943,452 | $23,219,535 | $35.19 | ||
| TI/LC | $0 | $0 | $0 | $0 | $1,319,764 | $2.00 | ||
| Capital Expenditures | $0 | $0 | $0 | $0 | $131,976 | $0.20 | ||
| Net Cash Flow | $19,220,830 | $21,968,288 | $23,610,616 | $23,943,452 | $21,767,794 | $32.99 | ||
| Occupancy % | 86.9% | 92.1% | 72.3% | 70.4% | (5) | 81.2% | (6) | |
| NOI DSCR(7) | 2.06x | 2.35x | 2.53x | 2.56x | 2.48x | |||
| NCF DSCR(7) | 2.06x | 2.35x | 2.53x | 2.56x | 2.33x | |||
| NOI Debt Yield(7) | 15.9% | 18.2% | 19.5% | 19.8% | 19.2% | |||
| NCF Debt Yield(7) | 15.9% | 18.2% | 19.5% | 19.8% | 18.0% | |||
| (1) | UW Base Rent includes Percentage In-Lieu rents totaling $1,035,097, which were underwritten based on TTM sales as of February 28, 2023. |
| (2) | UW Base Rent includes $633,474 of rent steps through June 2024. |
| (3) | Other Income includes janitorial, media revenue, termination fees, and other miscellaneous items. |
| (4) | The increase in Net Operating Income from 2020 to 2021 was driven by a decrease in free rent and credit loss. |
| (5) | Represents occupancy as of April 6, 2023. Occupancy excluding the Sears Space was 86.8%. |
| (6) | Represents the underwritten economic occupancy %. The Brandon Mall Property was 70.4% occupied as of April 6, 2023. |
| (7) | Debt service coverage ratios and debt yields are based on the Brandon Mall Whole Loan. |
Escrows and Reserves.
Real Estate Taxes – The loan documents require an upfront deposit of $2,223,137 and ongoing monthly deposits of $317,591 for real estate taxes.
Insurance – The loan documents do not require ongoing monthly insurance reserves; provided (i) no event of default is continuing, (ii) the borrower maintains insurance coverage for the Brandon Mall Property as part of blanket or umbrella coverage reasonably approved by the lender, and (iii) provides the lender with evidence of the renewals of the insurance policies and paid receipts for the payment of the insurance premiums no later than 10 business days prior to the expiration dates of the policies. If such conditions are not satisfied, the loan documents require ongoing monthly deposits in an amount equal to 1/12th of the insurance premiums that the lender reasonably estimates will be payable during the next ensuing 12 months.
Replacement Reserve – The loan documents require an upfront deposit of $4,000,000 and ongoing monthly deposits of $10,998 for replacement reserves.
TI/LC Reserve – The loan documents require an upfront deposit of $4,000,000 and ongoing monthly deposits of $109,980 for tenant improvements and leasing commissions reserves.
Gap Rent Reserve – The loan documents require an upfront deposit of $136,312 for gap rent related to Azteca D'Oro (0.8% NRA; 1.5% of underwritten base rent).
Rent Concession Reserve – The loan documents require an upfront deposit of $89,507 for outstanding rent concessions related to Popeyes (0.1% NRA; 0.5% of underwritten base rent).
| This is not a research report and was not prepared by any Underwriter’s research department. Please see additional important information and qualifications at the end of this Term Sheet. | ||
| T-49 | ||
| Retail – Super Regional Mall | Loan #2 | Cut-off Date Balance: | $65,000,000 |
| 175, 459, 303-675, 686 & 901 | Brandon Mall | Cut-off Date LTV: | 54.7% |
| Brandon Town Center Drive | U/W NCF DSCR: | 2.33x | |
| Brandon, FL 33511 | U/W NOI Debt Yield: | 19.2% |
Existing TI/LC Reserve – The loan documents require an upfront deposit of $947,920 for outstanding tenant improvements and leasing commissions related to 5 tenants.
Lockbox and Cash Management. The Brandon Mall Whole Loan is structured with a hard lockbox and springing cash management. The borrower is required to deposit all rents into a lender controlled lockbox account within one business day of receipt, and to direct all tenants to make direct rent deposits into the lockbox account. As long as a Cash Trap Event Period (as defined below) is not in effect, all funds in the lockbox account are required to be distributed to the borrower. During the continuance of a Cash Trap Event Period, all funds in the cash management account are required to be disbursed in accordance with the cash management waterfall set forth in the loan documents, with any excess funds required to be held as additional security in an excess cash flow subaccount controlled by the lender for so long as the Cash Trap Event Period continues.
A “Cash Trap Event Period” will commence upon the earlier of the following:
| (i) | the occurrence of an event of default under the loan documents; |
| (ii) | the net cash flow debt service coverage ratio (“NCF DSCR”) is below 1.50x (assuming a hypothetical 30-year amortization); |
| (iii) | the net cash flow debt yield (“NCF DY”) is below 12.0%; |
| (iv) | the occurrence of an Anchor Tenant Trigger (as defined below) with respect to two or more anchor tenants; or |
| (v) | tenants occupying less than or equal to 75% of the gross leasable square footage at the property (excluding the Sears Space) are open for business and operating at the property for more than 30 consecutive days (a “Gross Floor Area Trigger”). |
A Cash Trap Event Period will end upon the occurrence of the following:
| ● | with regard to clause (i), the cure of such event of default; |
| ● | with regard to clause (ii), the NCF DSCR being at least 1.55x for two consecutive calendar quarters; |
| ● | with regard to clause (iii), the NCF DY being at least 12.5% for two consecutive calendar quarters; |
| ● | with regard to clause (iv), 90 days following the date that an Anchor Tenant Trigger Cure (as defined below) occurred and no more than one Anchor Tenant Trigger is ongoing; or |
| ● | with regard to clause (v), 90 days following the date that the Gross Floor Area Trigger has ended. |
An “Anchor Tenant Trigger” will commence upon the occurrence of any of the following:
| (i) | if Macy’s, Dillard’s, JCPenney, and/or the largest replacement tenant (by leased square footage) occupying the Sears Space (each an “Anchor Tenant”) goes dark or fails to occupy all of its space (excluding due to casualty, condemnation or remodeling not to exceed 90 days); |
| (ii) | an Anchor Tenant vacates a majority of its space (excluding due to casualty, condemnation or remodeling not to exceed 90 days); |
| (iii) | an Anchor Tenant’s space being identified on a store closure list or otherwise announced for closure; |
| (iv) | an Anchor Tenant or its corporate parent files, as a debtor, or otherwise becomes involved, in a bankruptcy or similar insolvency proceeding; or |
| (v) | with respect to the Sears Space, until the Sears Space Releasing Conditions (as defined below) are met. For the avoidance of doubt, an Anchor Tenant Trigger is in effect with respect to the Sears Space as of the date hereof. |
An “Anchor Tenant Trigger Cure” will commence upon the occurrence of any of the following:
| ● | with regard to clauses (i-ii), such Anchor Tenant is occupying its space and has resumed normal business operations for at least 90 days or Replacement Anchor Conditions (as defined below) have been satisfied. |
| ● | with regard to clause (iii), the Anchor Tenant ceases to be identified on a store closure list or the applicable store closure list is reversed, is occupying their space and has resumed normal business operations for at least 90 days or the Replacement Anchor Conditions have been satisfied; |
| ● | with regard to clause (iv), (a) with respect to the Sears Space, (i) such Anchor Tenant or a replacement anchor tenant has assumed such lease, such assumption has been approved by the appropriate bankruptcy court having jurisdiction over such matter and such Anchor Tenant is no longer involved in any bankruptcy or insolvency proceeding or (ii) the Replacement Anchor Conditions have been satisfied and (b) with respect to the Macy’s space, the Dillard’s space, and the JCPenney space, Macy’s, Dillard’s, JC Penney, one or more third party tenants or owner/operators occupies and conducts business at the respective space during normal business hours (in substantially the same or better manner as such store was operating prior to its involvement in the bankruptcy or insolvency proceeding); or |
| ● | with regard to clause (v), the Sears Space Releasing Conditions are met; or |
| ● | with regard to clause (i-iv) and (v) (following the satisfaction of the Sears Space Releasing Conditions), at any time after 14 months have passed since the commencement of an Anchor Tenant Trigger, if (a) no event of default is continuing, (b) The NCF DSCR is at least 1.55x for two consecutive calendar quarters, (c) the NCF DY is at least 12.5% for two consecutive calendar quarters. |
“Replacement Anchor Conditions” means, with respect to the Macy’s space, the Dillard’s space, and the JCPenney’s space, lender has determined that a sufficient amount of the applicable Anchor Tenant space is occupied with one or more replacement anchor tenants sufficient enough to satisfy the majority of the co-tenancy or similar provisions of the leases at the property, each having been open for business for at least 90 consecutive days.
“Sears Space Releasing Conditions” means (i) the execution of a lease or leases for at least (a) 75,000 SF or (b) at least 50,000 SF of the Sears Space, provided such lease or leases have a gross rent of at least $20 per SF, with a term, terms and conditions reasonably satisfactory to lender, (ii) with respect to such replacement lease, the term of such lease has commenced, such replacement tenant is paying full, unabated rent (or borrower has funded a reserve for any rent abatement) and (iii) borrower (as landlord under the applicable lease), has completed all landlord obligations for tenant improvements, leasing expenses, or otherwise to such replacement tenant’s satisfaction.
Additional Secured Indebtedness (not including trade debts). The Brandon Mall Property also secures the Brandon Mall Serviced Pari Passu Companion Loan, which has a Cut-off Date principal balance of $56,000,000. The Brandon Mall Serviced Pari Passu Companion Loan accrues interest at the same rate as the Brandon Mall Mortgage Loan. The Brandon Mall Mortgage Loan is entitled to payments of principal and interest on a pro rata and pari passu basis with the Brandon Mall Serviced Pari Passu Companion Loan. The holders of the Brandon Mall Mortgage Loan and the Brandon Mall Serviced Pari Passu Companion Loan have entered into a co-lender agreement which sets forth the allocation of collections on the Brandon Mall Whole Loan. See “Description of the Mortgage Pool—The Whole Loans—The Serviced Pari Passu Whole Loans” in the prospectus.
| This is not a research report and was not prepared by any Underwriter’s research department. Please see additional important information and qualifications at the end of this Term Sheet. | ||
| T-50 | ||
| Retail – Super Regional Mall | Loan #2 | Cut-off Date Balance: | $65,000,000 |
| 175, 459, 303-675, 686 & 901 | Brandon Mall | Cut-off Date LTV: | 54.7% |
| Brandon Town Center Drive | U/W NCF DSCR: | 2.33x | |
| Brandon, FL 33511 | U/W NOI Debt Yield: | 19.2% |
Mezzanine Loan and Preferred Equity. Not permitted.
Release of Property. Not permitted.
Right of First Offer/Right of First Refusal. None.
Ground Lease. None.
Letter of Credit. None.
Terrorism Insurance. The loan documents require that the “all risk” insurance policy required to be maintained by the borrower provides coverage for terrorism in an amount equal to the full replacement cost of the property, as well as business interruption insurance covering no less than the 18-month period following the occurrence of a casualty event, together with a 6-month extended period of indemnity.
| This is not a research report and was not prepared by any Underwriter’s research department. Please see additional important information and qualifications at the end of this Term Sheet. | ||
| T-51 | ||
| Office – CBD | Loan #3 | Cut-off Date Balance: | $60,000,000 |
| 222 Berkeley and 500 Boylston Street | Back Bay Office | Cut-off Date LTV: | 33.7% |
| Boston, MA 02116 | UW NCF DSCR: | 2.55x | |
| UW NOI Debt Yield: | 16.3% |
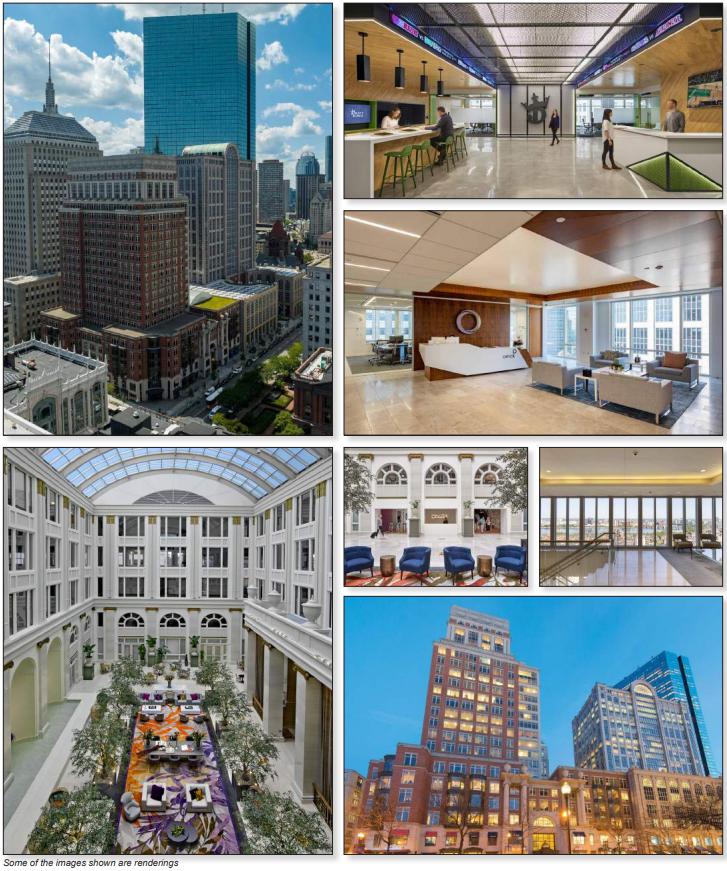
| This is not a research report and was not prepared by any Underwriter’s research department. Please see additional important information and qualifications at the end of this Term Sheet. | ||
| T-52 | ||
| Office – CBD | Loan #3 | Cut-off Date Balance: | $60,000,000 |
| 222 Berkeley and 500 Boylston Street | Back Bay Office | Cut-off Date LTV: | 33.7% |
| Boston, MA 02116 | UW NCF DSCR: | 2.55x | |
| UW NOI Debt Yield: | 16.3% |
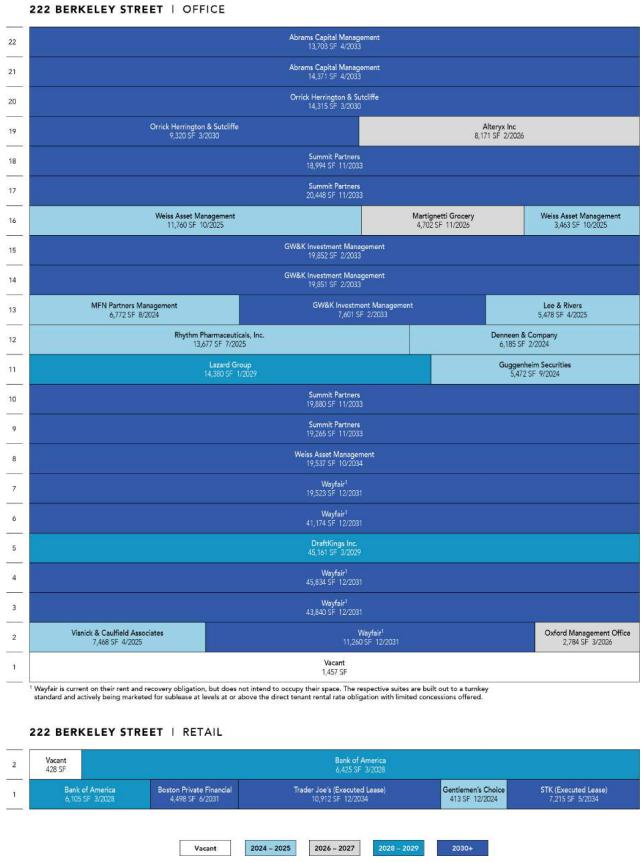
| This is not a research report and was not prepared by any Underwriter’s research department. Please see additional important information and qualifications at the end of this Term Sheet. | ||
| T-53 | ||
| Office – CBD | Loan #3 | Cut-off Date Balance: | $60,000,000 |
| 222 Berkeley and 500 Boylston Street | Back Bay Office | Cut-off Date LTV: | 33.7% |
| Boston, MA 02116 | UW NCF DSCR: | 2.55x | |
| UW NOI Debt Yield: | 16.3% |
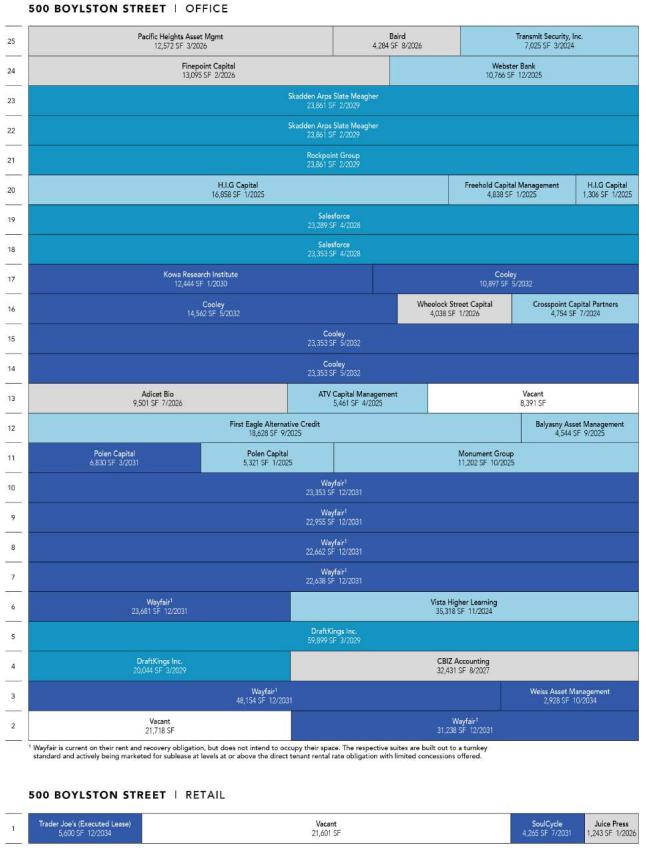
| This is not a research report and was not prepared by any Underwriter’s research department. Please see additional important information and qualifications at the end of this Term Sheet. | ||
| T-54 | ||
| Office – CBD | Loan #3 | Cut-off Date Balance: | $60,000,000 |
| 222 Berkeley and 500 Boylston Street | Back Bay Office | Cut-off Date LTV: | 33.7% |
| Boston, MA 02116 | UW NCF DSCR: | 2.55x | |
| UW NOI Debt Yield: | 16.3% |

| This is not a research report and was not prepared by any Underwriter’s research department. Please see additional important information and qualifications at the end of this Term Sheet. | ||
| T-55 | ||
| Mortgage Loan No. 3 – Back Bay Office |
| Mortgage Loan Information | Property Information | |||||
| Mortgage Loan Seller: | WFB | Single Asset/Portfolio: | Single Asset | |||
| Credit Assessment (Moody’s/Fitch/KBRA): | A2/AAA/A+ | Location: | Boston, MA 02116 | |||
| Original Balance(1): | $60,000,000 | General Property Type: | Office | |||
| Cut-off Date Balance(1): | $60,000,000 | Detailed Property Type: | CBD | |||
| % of Initial Pool Balance: | 8.9% | Title Vesting: | Fee | |||
| Loan Purpose: | Refinance | Year Built/Renovated: | 1987;1991/2016-2022 | |||
| Borrower Sponsors: | JPMorgan Chase Bank, N.A., J.P. | Size: | 1,283,670 SF | |||
| Morgan Investment Management Inc., | Cut-off Date Balance per SF(1): | $370 | ||||
| OMERS Administration Corporation, | Maturity Balance per SF(1): | $370 | ||||
| OPG Investment Holdings (US), LLC | Property Manager: | Oxford I Asset Management | ||||
| Guarantor: | OPG Investment Holdings (US), LLC | USA Inc. | ||||
| Mortgage Rate: | 6.2980%(2) | (borrower-affiliate) | ||||
| Note Date: | 6/7/2023 | |||||
| First Payment Date: | 8/6/2023 | |||||
| Maturity Date: | 7/6/2028 | |||||
| Original Term to Maturity: | 60 months | |||||
| Original Amortization Term: | 0 months | |||||
| IO Period: | 60 months | |||||
| Seasoning: | 0 months | |||||
| Prepayment Provisions(3): | L(24),DorYM1(29),O(7) | Underwriting and Financial Information | ||||
| Lockbox/Cash Mgmt Status: | Hard/Springing | UW NOI(6): | $77,460,640 | |||
| Additional Debt Type(1)(4): | Pari Passu / Subordinate / Mezzanine | UW NOI Debt Yield(1): | 16.3% | |||
| Additional Debt Balance(1)(4): | $415,000,000 / $65,000,000 / | UW NOI Debt Yield at Maturity(1): | 16.3% | |||
| $40,000,000 | UW NCF DSCR(1): | 2.55x | ||||
| Future Debt Permitted (Type): | No (NAP) | Most Recent NOI(6): | $63,014,340 (TTM 3/31/2023) | |||
| Reserves(5) | 2nd Most Recent NO: | $62,722,256 (12/31/2022) | ||||
| Type | Initial | Monthly | Cap | 3rd Most Recent NOI: | $61,539,300 (12/31/2021) | |
| RE Taxes: | $0 | Springing | NAP | Most Recent Occupancy: | 95.8% (3/31/2023) | |
| Insurance: | $0 | Springing | NAP | 2nd Most Recent Occupancy: | 96.8% (12/31/2022) | |
| Replacement Reserve: | $0 | Springing | NAP | 3rd Most Recent Occupancy: | 97.0% (12/31/2021) | |
| TI/LC Reserve: | $26,723,400 | Springing | NAP | Appraised Value (as of)(7): | $1,410,000,000 (10/19/2022) | |
| Outstanding TI/LC Reserve: | $21,283,070 | $0 | NAP | Cut-off Date LTV Ratio(1): | 33.7% | |
| Free Rent Concessions: | $9,854,159 | $0 | NAP | Maturity Date LTV Ratio(1): | 33.7% | |
| Sources and Uses | ||||||
| Sources | Proceeds | % of Total | Uses | Proceeds | % of Total | |
| Senior Loan Amount: | $475,000,000 | 76.4% | Loan Payoff(8): | $546,966,371 | 88.0% | |
| Subordinate Loan Amount: | $65,000,000 | 10.5% | Upfront Reserves: | $57,860,629 | 9.3% | |
| Mezzanine Loan Amount: | $40,000,000 | 6.4% | Closing Costs: | $16,756,604 | 2.7% | |
| Borrower Equity: | $41,583,604 | 6.7% | ||||
| Total Sources: | $621,583,604 | 100.0% | Total Uses: | $621,583,604 | 100.0% | |
| (1) | The Back Bay Office Mortgage Loan (as defined below) is part of the Back Bay Office Whole Loan (as defined below) with an original aggregate principal balance of $540,000,000. The Cut-off Date Balance per SF, Maturity Date Balance per SF, UW NOI Debt Yield, UW NOI Debt Yield at Maturity, UW NCF DSCR, Cut-off Date LTV Ratio and Maturity Date LTV Ratio numbers presented above are based on the Back Bay Office Senior Loan (as defined below). The Cut-off Date Balance per SF and Maturity Date Balance per SF, UW NOI Debt Yield, UW NOI Debt Yield at Maturity, UW NCF DSCR, Cut-off Date LTV Ratio and Maturity Date LTV Ratio based upon the Back Bay Office Whole Loan are $421, $421, 14.3%, 14.3%, 2.16x, 38.3% and 38.3%, respectively. The Cut-off Date Balance Per SF, Maturity Date Balance Per SF, UW NCF DSCR, UW NOI Debt Yield, UW NOI Debt Yield at Maturity, Cut-off Date LTV Ratio and Maturity Date LTV Ratio numbers based on the combined balance of the Back Bay Office Whole Loan and the Back Bay Office Mezzanine Loan (as defined below) (together, the “Back Bay Office Total Debt”) are $452, $452, 1.94x, 13.4%, 13.4%, 41.1%, and 41.1%, respectively. |
| (2) | Represents the interest rate on the Back Bay Office Senior Loan. The Back Bay Office Subordinate Companion Loan (as defined below) accrues interest at the rate of 8.2000% per annum. |
| (3) | Prepayment of the Back Bay Office Whole Loan is permitted, with (if prior to the open period) the payment of a fee equal to the greater of a yield maintenance premium and 1% of the unpaid principal balance, at any time after the earlier to occur of (a) the end of the two-year period commencing on the closing date of the securitization of the last promissory note representing a portion of the Back Bay Office Senior Loan to be securitized, other than Notes A-1 and A-2 and (b) June 7, 2026. The assumed prepayment lockout period of 24 payments is based on the closing date of this transaction in July 2023. In addition, the Back Bay Office Whole Loan may be defeased in whole at any time after the earlier to occur of (i) June 7, 2026 or (ii) the date that is two years from the closing date of the securitization that includes the last portion of the Back Bay Office Senior Loan to be securitized, other than Notes A-1 and A-2. |
| (4) | See “The Mortgage Loan”, “Additional Secured Indebtedness (not including trade debts)”, and “Mezzanine Loan and Preferred Equity” below for further discussion of additional debt. |
| (5) | See “Escrows and Reserves” below for further discussion of reserve requirements. |
| (6) | The increase from Most Recent NOI to UW NOI was primarily driven by six leases which began in October 2022 or later, representing 11.6% of the net rentable area, the rent average benefit for investment grade tenants and tenants included in a legal industry magazine listing of the top 100 law firms by revenues (“Top 100 Law Firms”), contractual rent steps, and an increase in recoveries. |
| (7) | The Appraised Value represents the Hypothetical As-Is Value assuming the planned leasing cost escrow of $67.6 million for leasing costs was fully funded. Due to the time passed since the appraisal date, the planned leasing cost escrow amount has been reduced to $57.8 million. All outstanding leasing costs at the time of loan origination were reserved upfront. The appraisal included a Market Value As-Is of $1,345,000,000 representing a 35.3% Cut-off Date LTV Ratio on the Back Bay Office Senior Loan, a 40.1% Cut-Off Date LTV Ratio on the Back Bay Office Whole Loan, and a 43.1% Cut-Off LTV Ratio on the Back Bay Office Total Debt. |
| (8) | Prior financing was originally $660,000,000 which was reduced by approximately $48.2 million of amortization prior to December 2022. In addition, in December 2022, the borrower executed an approximately $59.9 million paydown in conjunction with a short term loan extension of the maturity date of the prior mortgage loan. |
| This is not a research report and was not prepared by any Underwriter’s research department. Please see additional important information and qualifications at the end of this Term Sheet. | ||
| T-56 | ||
| Office – CBD | Loan #3 | Cut-off Date Balance: | $60,000,000 |
| 222 Berkeley and 500 Boylston Street | Back Bay Office | Cut-off Date LTV: | 33.7% |
| Boston, MA 02116 | UW NCF DSCR: | 2.55x | |
| UW NOI Debt Yield: | 16.3% |
The Mortgage Loan. The 3rd largest mortgage loan (the “Back Bay Office Mortgage Loan”) is part of a whole loan (the “Back Bay Office Whole Loan”) that is evidenced by 9 pari passu senior promissory notes in the aggregate original principal balance of $475,000,000 (collectively, the “Back Bay Office Senior Loan”), and two subordinate B-notes in the aggregate original principal balance of $65,000,000 (collectively the “Back Bay Office Subordinate Companion Loan”). The Back Bay Office Whole Loan was co-originated on June 7, 2023, by Wells Fargo Bank, National Association (“WFB”); Deutsche Bank AG, New York Branch (“DBNY”); Goldman Sachs Bank USA (“GS”), New York Life Insurance Company (“NY Life”), and Teachers Insurance and Annuity Association of America (“TIAA”). The Back Bay Office Whole Loan is secured by a first priority fee simple interest in two interconnected high rise office towers located in Boston, Massachusetts (the “Back Bay Office Property”). The Back Bay Office Mortgage Loan is evidenced by non-controlling Notes A-6 and Note A-7-B in the aggregate original principal balance of $60,000,000 being contributed by WFB. As shown in the “Back Bay Office Whole Loan Summary” table below, these are the first promissory notes to be securitized. The Back Bay Office Whole Loan will be serviced pursuant to the pooling and servicing agreement for the BANK5 2023-5YR2 securitization trust, until such time as Note A-4 is securitized, at which time it will be serviced pursuant to the pooling and servicing agreement for the securitization to which Note A-4 is contributed. The Back Bay Office Senior Loan pari passu notes other than those evidencing the Back Bay Office Mortgage Loan are referred to herein as the “Back Bay Office Pari Passu Companion Loans”. See “Description of the Mortgage Pool—The Whole Loans—The Back Bay Office Pari Passu-A/B Whole Loan” and “Pooling and Servicing Agreement“ and “Pooling and Servicing Agreement—Servicing of the Servicing Shift Mortgage Loans, the One & Two Commerce Square Whole Loan, the Heritage Plaza Whole Loan, the 6330 West Loop South Whole Loan and the 1201 Third Avenue Whole Loan” in the prospectus.
| Back Bay Office Whole Loan Summary | ||||
| Note | Original Balance | Cut-off Date Balance | Note Holder | Controlling Note |
| A-1 | $137,500,000 | $137,500,000 | NY Life | No(2) |
| A-2 | $100,000,000 | $100,000,000 | TIAA | No(2) |
| A-3(1) | $22,500,000 | $22,500,000 | DBNY | No |
| A-4(1) | $60,000,000 | $60,000,000 | DBNY | No(2) |
| A-5(1) | $30,000,000 | $30,000,000 | DBNY | No |
| A-6 | $50,000,000 | $50,000,000 | BANK5 2023-5YR2 | No |
| A-7-A(1) | $15,000,000 | $15,000,000 | WFB | No |
| A-7-B | $10,000,000 | $10,000,000 | BANK 2023-5YR2 | No |
| A-8(1) | $50,000,000 | $50,000,000 | GS | No |
| Total (Senior Loan) | $475,000,000 | $475,000,000 | ||
| B-1, B-2(3) | $65,000,000 | $65,000,000 | DBNY, WFB | Yes(2) |
| Total (Whole Loan) | $540,000,000 | $540,000,000 | ||
| (1) | Expected to be contributed to one or more future securitization transactions. |
| (2) | The Back Bay Office Whole Loan is a Pari Passu-A/B whole loan, and the controlling note as of the date hereof is the Note B-1. Upon the occurrence of certain trigger events specified in the co-lender agreement, however, control will generally shift first, to the Note A-1, then to the Note A-2 and then to the Note A-4, in each case, following certain trigger events under the co-lender agreement. See “Description of the Mortgage Pool—The Whole Loans—The Back Bay Office Pari Passu-AB Whole Loan” in the prospectus for more information regarding the manner in which control shifts under the Back Bay Office Whole Loan. |
| (3) | Expected to be sold to a third-party investor, which as of the date of this term sheet is expected to be an affiliate or a managed account of Affinius Capital Management LLC or another entity managed by Affinius Capital Management LLC. |
The Borrower and the Borrower Sponsors. The borrower is 500 Boylston & 222 Berkeley Owner (DE) LLC, a Delaware limited liability company and single purpose entity with two independent directors. The borrower sponsors are JPMorgan Chase Bank, N.A. (“JPMorgan”), J.P. Morgan Investment Management Inc., OMERS Administration Corporation, OPG Investment Holdings (US), LLC, and the non-recourse carveout guarantor is OPG Investment Holdings (US), LLC.
JPMorgan was founded in 1799 and has since expanded to over 100 global markets, $2.6 trillion assets under management, and more than 250,000 employees. J.P. Morgan Investment Management Inc. is a branch of the company that provides investment management services including financial planning, portfolio management, and investment advisory services. OMERS Administration Corporation (“OMERS”) is the Ontario Municipal Employees’ Retirement System. Founded in 1957, the pension plan serves active, deferred and retired municipal employees across Ontario, Canada. As of December 31, 2022, it has generated a reported $124.2 billion in net assets. The non-recourse carveout guarantor, is owned by OMERs and does not have an ownership interest in the borrower.
The Property. The Back Bay Office Property consists of two, LEED Platinum, Class A interconnected high rise office towers totaling 1,283,670 SF, which includes 1,214,965 SF of office space and 68,705 SF of retail space located in Boston, Massachusetts. The property is situated on two parcels totaling approximately 3.3 acres and spanning an entire city block. The Back Bay Office Properties were constructed in 1987 and 1991. The borrower purchased the assets in 2015 and spent approximately $192 million ($150 PSF) on renovations between 2016 and 2022. The renovation included approximately $133.5 million for leasing costs, $20.9 million for exterior/façade upgrades, $9.9 million for building system upgrades, $7.4 million on elevator upgrades and $6.1 million on lobby and restroom improvements. Amenities include an atrium, a courtyard, floor plates ranging from 14,000 to 100,000 SF, 12 to 13 foot ceiling heights, unobstructed views and a 1,000 space below-grade parking garage (1.28 spaces / 1,000 SF). Retail tenants at the Back Bay Office Property include SoulCycle, Bank of America, Juice Press, and STK and Trader Joe’s. STK and Trader Joe’s are not in occupancy, but are expected to open in December 2023 and June 2024, respectively. As of March 31, 2023, the property is 95.8% leased.
Major Tenants.
Wayfair (356,312 SF, 27.8% of NRA; 19.7% of underwritten base rent; December 31, 2031 lease expiration) Founded in 2002, Wayfair is a global home furnishing retailer with headquarters in Boston and Berlin. Wayfair offers more than 40 million products and serves 21.7 million active customers. The company employs more than 14,000 people across North America and Europe and reported $12 billion in net revenue for the 12-months ending March 31, 2023. Additionally, Wayfair operates 18 fulfillment and 38 delivery centers across the United States, Germany, Canada, and the United Kingdom.
Wayfair has been a tenant at the Back Bay Office Property since January 2020. The tenant is currently dark in all its space. As of the origination date, Wayfair remains current on all its lease obligations and has no contraction or termination options. Wayfair has subleased 19,523 SF of space on the 7th
| This is not a research report and was not prepared by any Underwriter’s research department. Please see additional important information and qualifications at the end of this Term Sheet. | ||
| T-57 | ||
| Office – CBD | Loan #3 | Cut-off Date Balance: | $60,000,000 |
| 222 Berkeley and 500 Boylston Street | Back Bay Office | Cut-off Date LTV: | 33.7% |
| Boston, MA 02116 | UW NCF DSCR: | 2.55x | |
| UW NOI Debt Yield: | 16.3% |
floor to Drift.com at $57.50 PSF, full-service gross, with a lease expiration of December 31, 2024. Wayfair is currently offering 156,476 SF of its remaining space for sublease. Wayfair has three 5-year renewal options and no termination options.
DraftKings Inc. (125,104 SF, 9.7% of NRA; 7.4% of underwritten base rent; March 31, 2029 lease expiration). DraftKings Inc. is a digital sports entertainment and gaming company with products that range from daily fantasy, regulated gaming and digital media. Founded in 2012, DraftKings Inc. is a multi-channel provider of sports betting and gaming technologies. DraftKings Inc. has been a tenant at the property since December 2017 and has two, 5-year renewal options. DraftKings Inc. has the right to terminate its lease as of the last day of the 7th lease year (March 10, 2026), with between 18 to 21 months written notice and the payment of a termination fee equal to three months of base rent for the period immediately following the termination date and the unamortized transaction costs.
Summit Partners (78,587 SF, 6.1% of NRA; 7.2% of underwritten base rent; November 30, 2033 lease expiration). Summit Partners is global alternative investment firm that currently manages more than $35 billion in assets. The tenant employs more than 115 investment professionals and targets the growth equity, fixed income and public equity sectors. Summit Partners has been a tenant at the Back Bay Office Property since 2002. The tenant has two 5-year renewal options and no termination option. Summit Partners is in a free rent period for 54,416 SF through November 2023, which was reserved in full at origination.
The following table presents certain information relating to the tenancy at the Back Bay Office Property:
| Tenant Summary(1) | |||||||||
| Tenant Name | Credit Rating (Fitch/Moody's/S&P)(2) | Tenant SF | % of Total SF | Annual UW Rent(3) | % of Total Annual UW Rent | Annual UW Rent PSF(3) | Lease Expiration | Term. Option (Y/N) | Renewal Options |
| Wayfair(4) | NR/NR/NR | 356,312 | 27.8% | $13,896,168 | 19.7% | $39.00 | 12/31/2031 | N | 3 x 5 year |
| DraftKings Inc. | NR/NR/NR | 125,104 | 9.7% | $5,222,581 | 7.4% | $41.75 | 3/31/2029 | Y(5) | 2 x 5 year |
| Summit Partners(6) | NR/NR/NR | 78,587 | 6.1% | $5,111,125 | 7.2% | $65.04 | 11/30/2033 | N | 2 x 5 year |
| Cooley | NR/NR/NR | 72,165 | 5.6% | $4,657,300 | 6.6% | $64.54 | 5/31/2032 | Y(7) | 1 x 5 year |
| Skadden Arps Slate Meagher | NR/NR/NR | 47,722 | 3.7% | $2,767,876 | 3.9% | $58.00 | 2/28/2029 | N | 2 x 5 year |
| GW&K Investment Management | NR/NR/NR | 47,304 | 3.7% | $3,474,006 | 4.9% | $73.44 | 2/28/2033 | N | 2 x 5 year |
| Salesforce(8) | NR/A2/A+ | 46,642 | 3.6% | $3,967,835 | 5.6% | $85.07 | 4/30/2028 | N | None |
| Subtotal/Wtd. Avg. | 773,836 | 60.3% | $39,096,890 | 55.3% | $50.52 | ||||
| Other Tenants(9) | 456,239 | 35.5% | $31,617,658 | 44.7% | $69.30 | ||||
| Occupied Collateral Total | 1,230,075 | 95.8% | $70,714,548 | 100.0% | $57.49 | ||||
| Vacant Space | 53,595 | 4.2% | |||||||
| Total/Wtd. Avg. | 1,283,670 | 100.0% | |||||||
| (1) | Information based on the underwritten rent roll. |
| (2) | Certain ratings are those of the parent company whether or not the parent guarantees the lease. |
| (3) | The Annual UW Rent and Annual UW Rent PSF shown above includes contractual rent steps through April 2024 totaling $1,362,984. |
| (4) | Wayfair is currently dark in all of its space. As of the origination date, Wayfair remains current on all its lease obligations. Wayfair has subleased 19,523 SF of space on the 7th floor to Drift.com at $57.50 PSF, full-service gross, with a lease expiration of December 31, 2024. The space is underwritten at the prime lease rent of $39.00 PSF. |
| (5) | DraftKings, Inc. has the right to terminate its lease as of the last day of the 7th lease year (March 10, 2026), with between 18 to 21 months written notice and the payment of a termination fee equal to three months of base rent for the period immediately following the termination date and the unamortized transaction costs. |
| (6) | Summit Partners is in a free rent period for 54,416 SF through November 2023, which was reserved in full at origination. |
| (7) | Cooley has the one time right to terminate its space on the 16th floor (14,562 SF) as of May 31, 2025 with between 12 to 18 months written notice and the payment of a termination fee equal to three months of net rent and operating costs for the period immediately following the termination option, plus the unamortized pro-rata extension transaction cost. |
| (8) | Salesforce has subleased 23,353 SF of its space to Providence Equity Partners, Aeris Partners at a rate of $80.97 PSF, co-terminous with the prime lease. |
| (9) | Other tenants includes two tenants (Trader Joe’s and STK), totaling 1.8% of net rentable area that have not yet taken occupancy. STK is expected to take occupancy in December 2023 and Trader Joe’s in June 2024. |
| This is not a research report and was not prepared by any Underwriter’s research department. Please see additional important information and qualifications at the end of this Term Sheet. | ||
| T-58 | ||
| Office – CBD | Loan #3 | Cut-off Date Balance: | $60,000,000 |
| 222 Berkeley and 500 Boylston Street | Back Bay Office | Cut-off Date LTV: | 33.7% |
| Boston, MA 02116 | UW NCF DSCR: | 2.55x | |
| UW NOI Debt Yield: | 16.3% |
The following table presents certain information relating to the lease rollover schedule at the Back Bay Office Property:
| Lease Rollover Schedule(1)(2) | ||||||||
| Year | # of Leases Rolling | SF Rolling | Annual UW Rent PSF Rolling(3) | % of Total SF Rolling | Cumulative % of SF Rolling | Annual UW Rent Rolling(3) | % of Annual Rent Rolling | Cumulative % of Annual Rent Rolling |
| MTM | 0 | 0 | $0.00 | 0.0% | 0.0% | $0 | 0.0% | 0.0% |
| 2023 | 0 | 0 | $0.00 | 0.0% | 0.0% | $0 | 0.0% | 0.0% |
| 2024 | 7 | 65,939 | $52.82 | 5.1% | 5.1% | $3,483,153 | 4.9% | 4.9% |
| 2025 | 14 | 120,770 | $67.81 | 9.4% | 14.5% | $8,190,004 | 11.6% | 16.5% |
| 2026 | 9 | 60,390 | $85.57 | 4.7% | 19.2% | $5,167,655 | 7.3% | 23.8% |
| 2027 | 1 | 32,431 | $37.00 | 2.5% | 21.8% | $1,199,947 | 1.7% | 25.5% |
| 2028 | 4 | 59,172 | $88.39 | 4.6% | 26.4% | $5,230,495 | 7.4% | 32.9% |
| 2029 | 8 | 211,067 | $49.93 | 16.4% | 42.8% | $10,538,835 | 14.9% | 47.8% |
| 2030 | 3 | 36,079 | $80.41 | 2.8% | 45.6% | $2,901,149 | 4.1% | 51.9% |
| 2031 | 15 | 371,905 | $42.27 | 29.0% | 74.6% | $15,720,982 | 22.2% | 74.1% |
| 2032 | 4 | 72,165 | $64.54 | 5.6% | 80.2% | $4,657,300 | 6.6% | 80.7% |
| 2033 | 11 | 153,965 | $70.45 | 12.0% | 92.2% | $10,847,334 | 15.3% | 96.1% |
| 2034 & Beyond | 6 | 46,192 | $60.13 | 3.6% | 95.8% | $2,777,695 | 3.9% | 100.0% |
| Vacant | 0 | 53,595 | $0.00 | 4.2% | 100.0% | $0 | 0.0% | 100.0% |
| Total/Wtd. Avg. | 82 | 1,283,670 | $57.49 | 100.0% | $70,714,548 | 100.0% | ||
| (1) | Information is based on the underwritten rent roll. |
| (2) | Certain tenants may have lease termination options that are exercisable prior to the originally stated expiration date of the related lease and are not considered in the lease rollover schedule |
| (3) | The Annual UW Rent and Annual UW Rent PSF shown above include straight-line rent averaging for certain investment grade and Top 100 Law Firm tenants (Bank of America, Orrick Herrington & Sutcliffe, Cooley, Salesforce and Webster Bank) through lease maturity totaling $521,804 and contractual rent steps through April 2024 totaling $1,362,984 . |
The Market. The Back Bay Office Property is situated in the Back Bay neighborhood of Boston. The property is located within 0.2 miles of Boston Public Garden and the adjacent Boston Commons, as well as 0.4 miles to Copley Square, which is home to Trinity Church and the Boston Public Library. The surrounding neighborhood primarily includes office, hospitality and multifamily space, with retail and dining options as well. The Back Bay Office Property is located approximately 0.4 miles from Interstate 90, and 0.3 miles to the Copley Transit station, providing access throughout the region. The Boston Logan International Airport is located 4.8 miles to the northeast.
According to a third-party market research report, the property is located in the Back Bay office submarket of the Boston market. As of May 2023, the Back Bay submarket reported total inventory of approximately 17.4 million SF with a 9.6% vacancy rate and average asking rent of $58.47 PSF.
The following table presents certain information relating to the appraisal’s market rent conclusions for the Back Bay Office Property:
| Market Rent Summary | ||
| Office | Retail | |
| Market Rent (PSF) | $60.00-$85.00 | $70.00 |
| Lease Term (Years) | 5-10 Yrs. | 5-10 Yrs. |
| Lease Type | NNN | NNN |
| Rent Increase Projection | 2.0%/annually | 2.0%/annually |
| Tenant Improvements – 5 Yrs. (New/Renewal) | $65 / $40 | $75 / $25 |
| Tenant Improvements – 10 Yrs. (New/Renewal) | $100 / $65 | $150 / $50 |
| Free Rent (Months) – 5 Yrs. (New/Renewal) | 4 / 3 | 3 / 1 |
| Free Rent (Months) – 10 Yrs. (New/Renewal) | 8 / 6 | 6 / 2 |
| This is not a research report and was not prepared by any Underwriter’s research department. Please see additional important information and qualifications at the end of this Term Sheet. | ||
| T-59 | ||
| Office – CBD | Loan #3 | Cut-off Date Balance: | $60,000,000 |
| 222 Berkeley and 500 Boylston Street | Back Bay Office | Cut-off Date LTV: | 33.7% |
| Boston, MA 02116 | UW NCF DSCR: | 2.55x | |
| UW NOI Debt Yield: | 16.3% |
The following table presents information relating to comparable office property sales for the Back Bay Office Property:
| Comparable Sales Summary | ||||||
| Property Name/Location | Year Built/Renovated | Total NRA (SF) | Occupancy | Sale Date | Sale Price | Sale Price PSF |
535 &545 Boylston Street Boston, MA | 1963/1995 | 184,222 | 95.0% | Feb-2022 | $148,000,000 | $803.38 |
2 Drydock Avenue Boston, MA | 2020/NAP | 234,749 | 70.0% | Dec-2021 | $234,500,000 | $998.94 |
1 Memorial Drive Cambridge, MA | 1986/2008 | 401,094 | 100.0% | Sep-2021 | $825,100,000 | $2,057.12 |
60 South Street Boston, MA | 2009/NAP | 220,000 | 99.0% | Aug-2021 | $210,000,000 | $954.55 |
60 State Street Boston, MA | 1978/NAP | 911,394 | 91.0% | Mar-2020 | $614,250,000 | $673.97 |
75 State Street Boston, MA | 1988/NAP | 840,929 | 97.0% | Sep-2019 | $635,000,000 | $755.12 |
100 Summer Street Boston, MA | 1974/1989 | 1,118,537 | 89.0% | Sep-2019 | $806,000,000 | $720.58 |
Source: Appraisal, unless otherwise indicated.
The following table presents information relating to comparable office leases for the Back Bay Office Property:
| Comparable Office Lease Summary | ||||||||
| Property Name/Location | Total SF | Year Built/Renovated | Tenant | Tenant SF | Lease Start Date | Term (Months) | Annual Base Rent (PSF) | Lease Type |
Back Bay Office Boston, MA | 1,283,670(1)(2) | 1987; 1991/2016-2022 | N/A | N/A | N/A | N/A | $57.49(1)(2) | |
John Hancock Tower 200 Clarendon Street Boston, MA | 1,589,000 | 1974/2003 | Versanis Bio, Inc. Berkshire Partners Locust Walk Partners | 5,190 90,436 7,819 | Jun-2023 Jan-2024 Jul-2022 | 60 48 88 | $80.00 $100.00 $82.00 | NNN Gross + TE NNN |
Prudential Center 111 Huntington Avenue Boston, MA | 1,112,124 | 2000/NAP | Foley & Lardner | 99,644 | Mar-2024 | 60 |
$96.90
| Gross + TE |
Prudential Tower 800 Boylston Street Boston, MA | 510,324 | 1965/2017 | Federal Home Loan Bank | 39,185 | Jan-2024 | 180 | $57.00 | Gross + TE |
One Exeter Plaza 699 Boylston Street Boston, MA | 210,921 | 1984/NAP | Cerulli Associates | 10,917 | Nov-2022 | 126 | $82.00 | Gross + TE |
101 Huntington 101 Huntington Avenue Boston, MA | 505,939 | 1972/2003 | Audax Management | 101,815 | Nov-2022 | 170 | $78.00 | Gross + TE |
855 Boylston Street 855 Boylston Street Boston, MA | 159,783 | 1985/NAP | Kessler Financial | 13,681 | Jan-2023 | 61 | $71.00 | Gross + TE |
10 St. James Avenue 10 St. James Avenue Boston, MA | 610,665 | 2001/NAP | Holland & Knight | 105,130 | Apr-2023 | 66 | $76.00 | Goss + TE |
Source: Appraisal, unless otherwise indicated.
| (1) | Information obtained from the underwritten rent roll. |
| (2) | Represents Annual UW Base Rent PSF for the occupied collateral. |
| This is not a research report and was not prepared by any Underwriter’s research department. Please see additional important information and qualifications at the end of this Term Sheet. | ||
| T-60 | ||
| Office – CBD | Loan #3 | Cut-off Date Balance: | $60,000,000 |
| 222 Berkeley and 500 Boylston Street | Back Bay Office | Cut-off Date LTV: | 33.7% |
| Boston, MA 02116 | UW NCF DSCR: | 2.55x | |
| UW NOI Debt Yield: | 16.3% |
Operating History and Underwritten Net Cash Flow. The following table presents certain information relating to the historical operating performance and Underwritten Net Cash Flow at the Back Bay Office Property:
| Cash Flow Analysis | |||||||
| 2020 | 2021 | 2022 | TTM 3/31/2023 | UW | UW PSF | ||
| Base Rent | $51,526,277 | $59,949,889 | $59,804,916 | $58,642,289 | $69,351,564 | $54.03 | |
| Rent Average Benefit | $0 | $0 | $0 | $0 | $521,804 | (1) | $0.41 |
| Contractual Rent Steps | $0 | $0 | $0 | $0 | $1,362,984 | (2) | $1.06 |
| Grossed Up Vacant Space | $0 | $0 | $0 | $0 | $4,911,403 | $3.83 | |
| Total Recoveries | $24,669,444 | $27,067,738 | $28,017,620 | $28,290,450 | $31,949,642 | $24.89 | |
| Parking Income | $4,277,967 | $3,974,586 | $5,904,009 | $6,480,000 | $6,779,209 | (3) | $5.28 |
| Other Income | $3,445,845 | $4,141,096 | $5,327,771 | $6,660,165 | $5,050,243 | $3.93 | |
| Less Bad Debt(4) | ($633,236) | ($359,541) | ($80,985) | ($80,987) | $0 | $0.00 | |
| Less Vacancy & Credit Loss | $0 | $0 | $0 | $0 | ($4,911,403) |
| ($3.83) |
| Effective Gross Income | $83,286,297 | $94,773,768 | $98,973,331 | $99,991,917 | $115,015,445 | $89.60 | |
| Real Estate Taxes | $17,837,010 | $18,300,580 | $19,464,281 | $19,349,454 | $20,753,029 | $16.17 | |
| Insurance | $975,928 | $517,100 | $596,971 | $750,184 | $951,899 | $0.74 | |
| Management Fee | $1,829,216 | $2,147,700 | $2,187,964 | $2,177,486 | $1,000,000 | $0.78 | |
| Other Operating Expenses | $11,389,865 | $12,269,088 | $14,001,859 | $14,700,453 | $14,849,878 |
| $11.57 |
| Total Expenses | $32,032,019 | $33,234,468 | $36,251,075 | $36,977,577 | $37,554,805 | $29.26 | |
| Net Operating Income | $51,254,278(5) | $61,539,300(5) | $62,722,256 | $63,014,340(6) | $77,460,640 | (6) | $60.34 |
| CapEx | $0 | $0 | $0 | $0 | $256,734 | $0.20 | |
| TI/LC | $0 | $0 | $0 | $0 | $0 |
| $0.00 |
| Net Cash Flow | $51,254,278 | $61,539,300 | $62,722,256 | $63,014,340 | $77,203,906 | $60.14 | |
| Occupancy % | 96.0% | 97.0% | 96.8% | 95.8% | 93.6% | ||
| NOI DSCR(7) | 1.69x | 2.03x | 2.07x | 2.08x | 2.55x | ||
| NCF DSCR(7) | 1.69x | 2.03x | 2.07x | 2.08x | 2.55x | ||
| NOI Debt Yield(7) | 10.8% | 13.0% | 13.2% | 13.3% | 16.3% | ||
| NCF Debt Yield(7) | 10.8% | 13.0% | 13.2% | 13.3% | 16.3% | ||
| (1) | Represents straight-line rent averaging through each tenant’s lease expiration for investment-grade and Top 100 Law Firm tenants (Bank of America, Orrick Herrington & Sutcliffe, Cooley, Salesforce, and Webster Bank). |
| (2) | Represents contractual rent steps through April 2024. |
| (3) | Parking income is based on the 2023 budget. |
| (4) | Bad Debt includes provisions made for COVID-19 abatements in 2020 and credits for unused provisions in 2021. |
| (5) | The increase in Net Operating Income from 2020 to 2021 was primarily driven by 10 tenants, representing 6.6% of net rentable area with leases that began in 2021, rent increases for tenants in place, and an increase in total recoveries. |
| (6) | The increase from TTM 3/31/2023 to UW Net Operating Income was primarily driven by six leases which began or renewed/extended in October 2022 or later, representing 11.6% of the net rentable area, the rent average benefit for investment grade and Top 100 Law Firm tenants, contractual rent steps, and an increase in recoveries. |
| (7) | Debt service coverage ratios and debt yields are based on the Back Bay Office Senior Loan and exclude the Back Bay Office Subordinate Companion Loan. |
Escrows and Reserves.
Real Estate Taxes – During the continuance of a Trigger Period (as defined below) the loan documents require an ongoing monthly deposit equal to 1/12th of the estimated annual tax expense for real estate taxes.
Insurance – During the continuance of a Trigger Period the loan documents require an ongoing monthly insurance reserve in an amount equal to 1/12 of the insurance premiums that the lender reasonably estimates will be payable during the next ensuing 12 months; unless the borrower maintains insurance coverage for the Back Bay Office Property as part of blanket or umbrella coverage reasonably approved by the lender.
Replacement Reserve – During the continuance of a Trigger Period, the loan documents require ongoing monthly deposits of $21,397 for replacement reserves.
TI/LC Reserve – The loan documents require an upfront deposit of $26,723,400 and ongoing monthly deposits of $213,969 for tenant improvements and leasing commissions, if the balance of the TI/LC Reserve drops below $15,000,000.
Existing TI/LC Reserve – The loan documents require an upfront deposit of $21,283,070 for existing tenant improvements and leasing commissions.
Free Rent Concession Reserve – The loan documents require an upfront deposit of $9,854,159 for outstanding free rent and gap rent.
Lockbox and Cash Management. The Back Bay Office Whole Loan is structured with a hard lockbox and springing cash management. The borrower and the property manager are required to direct the tenants to pay rent directly into the lockbox account, and to deposit any rents otherwise received in
| This is not a research report and was not prepared by any Underwriter’s research department. Please see additional important information and qualifications at the end of this Term Sheet. | ||
| T-61 | ||
| Office – CBD | Loan #3 | Cut-off Date Balance: | $60,000,000 |
| 222 Berkeley and 500 Boylston Street | Back Bay Office | Cut-off Date LTV: | 33.7% |
| Boston, MA 02116 | UW NCF DSCR: | 2.55x | |
| UW NOI Debt Yield: | 16.3% |
such account within two business days after receipt. Prior to a Trigger Period, the funds in the lockbox account will be transferred daily to the borrower’s operating account. During the continuance of a Trigger Period, the funds are required be transferred to a lender-controlled cash management account and applied in accordance with the cash flow waterfall as outlined in the Back Bay Office Whole Loan documents. If a Trigger Period is continuing due to a Lease Sweep Period (as defined below), funds remaining after the cash flow waterfall will be transferred to a lease sweep account. If a Trigger Period is continuing for a reason other than a Lease Sweep Period, funds will be transferred into an excess cash flow account as additional collateral for the Back Bay Office Whole.
A “Trigger Period” will commence upon the earliest of the following:
| (i) | the occurrence of an event of default; |
| (ii) | the net operating income debt yield (“NOI DY”) on the Back Bay Office Whole Loan plus the Back Bay Office Mezzanine Loan falling below 8.5%, or the NOI DY on the Back Bay Office Whole Loan falling below 9.1% (“Low Debt Yield Period”), tested quarterly; provided, however, that a Low Debt Yield Period will be deemed not to exist if, no later than 10 business days after the borrower’s receipt of notice of a Low Debt Yield Period, the borrower delivers either cash or a letter of credit in an amount which would reduce the Back Bay Office Whole Loan plus the Back Bay Office Mezzanine Loan outstanding balance or the Back Bay Office Whole Loan outstanding balance, to an amount which would produce a NOI DY equal to 8.5% or 9.1%, as applicable. |
| (iii) | an affiliated property manager becomes insolvent or a debtor in any bankruptcy or insolvency proceedings; |
| (iv) | the occurrence of a Back Bay Office Mezzanine Loan default; or |
| (v) | the commencement of a Lease Sweep Period. |
A Trigger Period will end upon the occurrence of the following:
| ● | with regard to clause (i), the cure of such event of default; |
| ● | with regard to clause (ii), the applicable NOI DY being above 8.5% or 9.1% as applicable, for one calendar quarter; |
| ● | with regard to clause (iii), the affiliated property manager has been replaced with a non-affiliated replacement manager under a replacement management agreement that has been approved by the lender, and the borrower has executed and delivered an assignment and subordination agreement that is satisfactory to the lender; |
| ● | with regard to clause (iv), receipt by the lender of a Back Bay Office Mezzanine Loan default revocation notice; or |
| ● | with regard to clause (v), the Lease Sweep Period has ended. |
A “Lease Sweep Period” will commence on the occurrence of any of the following:
| (i) | the earlier to occur of (a) twelve months prior to the earliest stated expiration of the Wayfair lease, or any replacement lease that individually or in the aggregate is at least 235,000 SF (“Lease Sweep Lease”), or (b) the date under a Lease Sweep Lease that the tenant is required to exercise its renewal option; |
| (ii) | the receipt of the borrower or the manager of notice from any tenant under a Lease Sweep Lease to terminate its lease; |
| (iii) | the date that a Lease Sweep Lease (or any material portion thereof) is surrendered, cancelled, or terminated; |
| (iv) | the date that any tenant (other than Wayfair and any investment grade tenant) under a Lease Sweep Lease discontinues, or gives notice it intends to, its business at the Back Bay Office Property; |
| (v) | a monetary or non-monetary default under a Lease Sweep Lease, that continues beyond applicable notice and cure periods; and |
| (vi) | a Lease Sweep Lease tenant insolvency proceeding. |
A Lease Sweep Period will end upon the following:
| ● | with regard to clauses (i) through (iv), the entirety of the Lease Sweep Lease space is leased to a satisfactory replacement tenant or tenants, and in the lender’s reasonable judgement sufficient funds have been accumulated in the lease sweep account to cover all anticipated leasing expenses, free rent periods, and/or rent abatements, and any shortfalls in required payments under the loan documents or operating expenses as a result of anticipated downtime prior to the commencement of payments under the lease or leases. Funds on deposit in the lease sweep account will not exceed $125 PSF of the lease sweep space, provided that all anticipated expenses will not, in lender’s reasonable judgement, exceed $125 PSF (“Replacement Lease”); |
| ● | with regard to clauses (i) through (vi), funds collected in the lease sweep account are equal to $75 PSF for tenant’s space (“Lease Sweep Deposit Amount”), unless the lender determines that anticipated leasing expenses will exceed the Lease Sweep Deposit Amount, in which case the sweep will continue until lender is satisfied there are sufficient funds in the lease sweep account ; |
| ● | with regard to clause (i), the tenant under of the Lease Sweep Space has irrevocably exercised its renewal or extension option with respect to all of its space, and sufficient funds have been accumulated to cover all anticipated leasing costs; |
| ● | with regard to clauses (ii) and (iii), such termination option is not validly exercised by the tenant or is otherwise validly and irrevocably waived in writing; |
| ● | with regard to clause (v), the date the default has been cured; or |
| ● | with regard to clause (vi), either; (a) the Lease Sweep Lease has been affirmed or assumed in the tenant insolvency, without modification of such lease or guaranty, in a manner reasonably satisfactory to the lender, pursuant to a final, non-appealable order of the bankruptcy court, and the tenant is in full occupancy and paying full unabated rent, and adequate assurance of the future performance under the Lease Sweep Lease, as determined by the lender, has been provided, or (b) the Lease Sweep Deposit Amount has been met. |
Additional Secured Indebtedness (not including trade debts). The Back Bay Office Property also secures the Back Bay Office Pari Passu Companion Loans, which have an aggregate Cut-off Date principal balance of $415,000,000 and the Back Bay Office Subordinate Companion Loan, which has an aggregate Cut-off Date principal balance of $65,000,000. The Back Bay Office Pari Passu Companion Loans and the Back Bay Office Subordinate Companion Loan are coterminous with the Back Bay Office Mortgage Loan. The Back Bay Office Pari Passu Companion Loans accrue interest at the same rate as the Back Bay Office Mortgage Loan and the Back Bay Office Subordinate Companion Loan accrues interest at the rate of 8.2000% per annum. The Back Bay Office Mortgage Loan and the Back Bay Office Pari Passu Companion Loans are each pari passu in right of payment and together are senior in right of payment to the Back Bay Office Subordinate Companion Loan. The holders of the Back Bay Office Mortgage Loan, the Back Bay Office Pari Passu Companion Loans and the Back Bay Office Subordinate Companion Loan have entered into a co-lender agreement which sets forth the allocation of collections on the Back Bay Office Whole Loan. See “Description of the Mortgage Pool—The Whole Loans—The Non-Serviced A/B Whole Loans—The Back Bay Pari Passu-A/B Whole Loan”.
| This is not a research report and was not prepared by any Underwriter’s research department. Please see additional important information and qualifications at the end of this Term Sheet. | ||
| T-62 | ||
| Office – CBD | Loan #3 | Cut-off Date Balance: | $60,000,000 |
| 222 Berkeley and 500 Boylston Street | Back Bay Office | Cut-off Date LTV: | 33.7% |
| Boston, MA 02116 | UW NCF DSCR: | 2.55x | |
| UW NOI Debt Yield: | 16.3% |
| Subordinate Note Summary | ||||||||
| B-Note Original Principal Balance | B-Note Interest Rate | Original Term (mos.) | Original Amort. Term (mos.) | Original IO Term (mos.) | Whole Loan UW NCF DSCR | Whole Loan UW NOI DY | Whole Loan Cutoff Date LTV | |
| Back Bay Office Subordinate Companion Loan | $65,000,000 | 8.2000% | 60 | 0 | 60 | 2.16x | 14.3% | 38.3% |
Mezzanine Loan and Preferred Equity. Concurrently with the origination of the Back Bay Office Whole Loan, RICP V Holdings, LLC (“Rockwood”) made a $40,000,000 mezzanine loan (the “Back Bay Office Mezzanine Loan”) to the sole member of the borrower, which is secured by the sole member’s ownership interest in the borrower. The Back Bay Office Mezzanine Loan is coterminous with the Back Bay Office Whole Loan. The Back Bay Office Mezzanine Loan accrues interest at a fixed per annum rate equal to 10.125% and is interest-only through the loan term, which is co-terminous with the Back Bay Office Whole Loan term. A mezzanine intercreditor agreement was executed at loan origination.
| Mezzanine Note Summary | ||||||||
| Mezzanine Original Principal Balance | Mezzanine Interest Rate | Original Term (mos.) | Original Amort. Term (mos.) | Original IO Term (mos.) | Total Debt UW NCF DSCR | Total Debt UW NOI DY | Total Debt Cutoff Date LTV | |
| Back Bay Office Mezzanine Loan | $40,000,000 | 10.1250% | 60 | 0 | 60 | 1.94x | 13.4% | 41.1% |
Release of Property. Not permitted.
Letter of Credit. None.
Right of First Offer/Right of First Refusal. None.
Ground Lease. None.
Terrorism Insurance. The Back Bay Office Whole Loan documents require that the “all risk” insurance policy required to be maintained by the borrower provides coverage for terrorism in an amount equal to the full replacement cost of the Back Bay Office Property, as well as business interruption insurance covering no less than the 24-month period following the occurrence of a casualty event, together with a 12-month extended period of indemnity. See “Risk Factors—Risks Relating to the Mortgage Loans—Terrorism Insurance May Not Be Available for All Mortgaged Properties” in the prospectus.
| This is not a research report and was not prepared by any Underwriter’s research department. Please see additional important information and qualifications at the end of this Term Sheet. | ||
| T-63 | ||
| Retail – Anchored | Loan #4 | Cut-off Date Balance: | $58,600,000 |
| 9712-9868 West Northern Avenue | Park West Shopping Center | Cut-off Date LTV: | 60.4% |
| Peoria, AZ 85345 | UW NCF DSCR: | 1.53x | |
| UW NOI Debt Yield: | 11.6% |
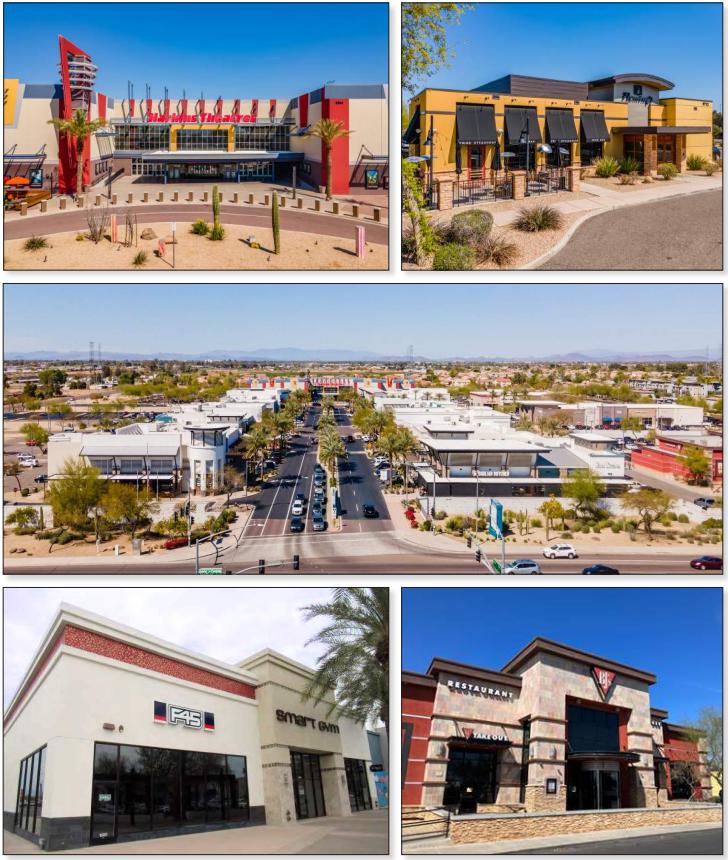
| This is not a research report and was not prepared by any Underwriter’s research department. Please see additional important information and qualifications at the end of this Term Sheet. | ||
| T-64 | ||
| Retail – Anchored | Loan #4 | Cut-off Date Balance: | $58,600,000 |
| 9712-9868 West Northern Avenue | Park West Shopping Center | Cut-off Date LTV: | 60.4% |
| Peoria, AZ 85345 | UW NCF DSCR: | 1.53x | |
| UW NOI Debt Yield: | 11.6% |
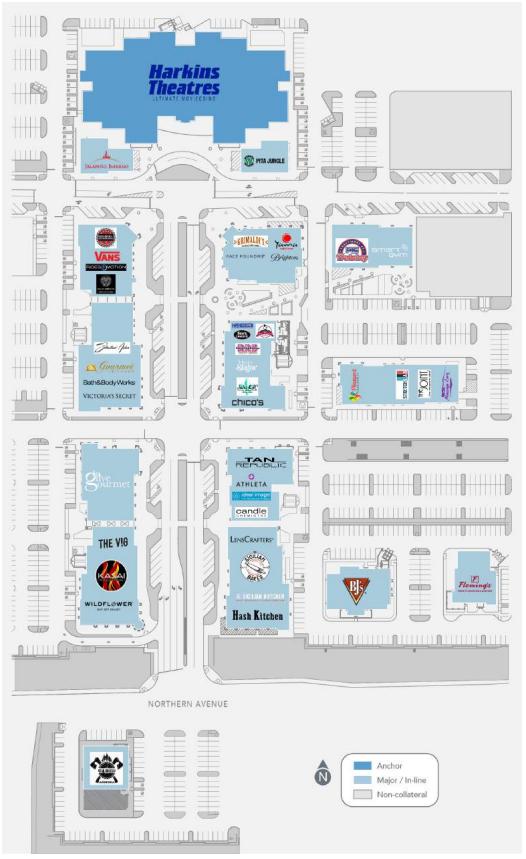
| This is not a research report and was not prepared by any Underwriter’s research department. Please see additional important information and qualifications at the end of this Term Sheet. | ||
| T-65 | ||
| Retail – Anchored | Loan #4 | Cut-off Date Balance: | $58,600,000 |
| 9712-9868 West Northern Avenue | Park West Shopping Center | Cut-off Date LTV: | 60.4% |
| Peoria, AZ 85345 | UW NCF DSCR: | 1.53x | |
| UW NOI Debt Yield: | 11.6% |
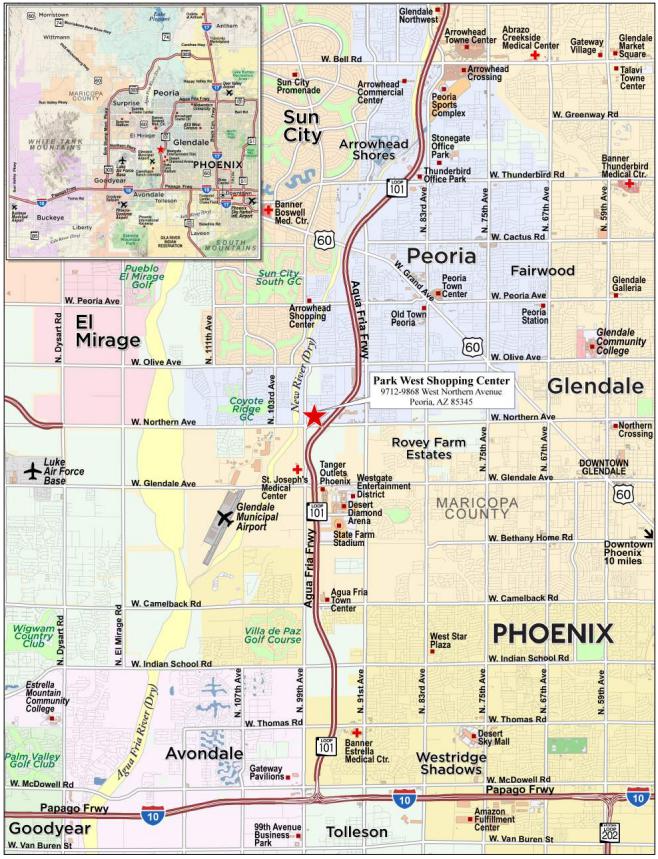
| This is not a research report and was not prepared by any Underwriter’s research department. Please see additional important information and qualifications at the end of this Term Sheet. | ||
| T-66 | ||
| Mortgage Loan No. 4 – Park West Shopping Center |
| Mortgage Loan Information | Property Information | |||||
| Mortgage Loan Seller: | WFB | Single Asset/Portfolio: | Single Asset | |||
| Credit Assessment (Fitch/Moody’s/KBRA): | NR/NR/NR | Location: | Peoria, AZ 85345 | |||
| Original Balance: | $58,600,000 | General Property Type: | Retail | |||
| Cut-off Date Balance: | $58,600,000 | Detailed Property Type: | Anchored | |||
| % of Initial Pool Balance: | 8.7% | Title Vesting: | Fee | |||
| Loan Purpose: | Refinance | Year Built/Renovated: | 2007/NAP | |||
| Borrower Sponsor: | Joshua Volen and Trevor Smith | Size: | 253,789 SF | |||
| Guarantor: | CIRE OpCo I, LLC | Cut-off Date Balance PSF: | $231 | |||
| Mortgage Rate: | 7.2500% | Maturity Date Balance PSF: | $231 | |||
| Note Date: | 6/1/2023 | Property Manager: | CIRE Investment Services, Inc. | |||
| First Payment Date: | 7/11/2023 | (borrower-related) | ||||
| Maturity Date: | 6/11/2028 | |||||
| Original Term to Maturity: | 60 months | Underwriting and Financial Information(3) | ||||
| Original Amortization Term: | 0 months | |||||
| IO Period: | 60 months | Underwriting and Financial Information | ||||
| Seasoning: | 1 month | UW NOI(2): | $6,779,021 | |||
| Prepayment Provisions: | L(25),D(28),O(7) | UW NOI Debt Yield: | 11.6% | |||
| Lockbox/Cash Mgmt Status: | Hard/In Place | UW NOI Debt Yield at Maturity: | 11.6% | |||
| Additional Debt Type: | No | UW NCF DSCR: | 1.53x | |||
| Additional Debt Balance: | NAP | Most Recent NOI(2): | $4,919,885 (2/28/2023 TTM) | |||
| Future Debt Permitted (Type): | No (NAP) | 2nd Most Recent NOI(3): | $4,630,650 (12/31/2022) | |||
| Reserves(1) | 3rd Most Recent NOI(3): | $3,147,828 (12/31/2021) | ||||
| Type | Initial | Monthly | Cap | Most Recent Occupancy: | 95.2% (5/1/2023) | |
| Taxes: | $53,674 | $53,674 | NAP | 2nd Most Recent Occupancy(4): | 93.7% (1/1/2023) | |
| Insurance: | $0 | Springing | NAP | 3rd Most Recent Occupancy(4): | 89.4% (1/1/2022) | |
| Replacement Reserves: | $0 | $4,008 | $144,283 | Appraised Value (as of)(5): | $97,100,000 (3/20/2023) | |
| Leasing Reserve: | $570,000 | $15,857 | $570,000 | Appraised Value PSF: | $383 | |
| Existing TI/LC Obligations: | $5,377,975 | $0 | NAP | Cut-off Date LTV Ratio(5): | 60.4% | |
| Rent Concession Reserve: | $333,080 | $0 | NAP | Maturity Date LTV Ratio(5): | 60.4% | |
| Sources and Uses | ||||||
| Sources | Proceeds | % of Total | Uses | Proceeds | % of Total | |
| Loan Amount: | $58,600,000 | 100.0% | Loan Payoff: | $34,271,704 | 58.5% | |
| Closing Costs: | $1,411,839 | 2.4% | ||||
| Upfront Reserves: | $6,334,729 | 10.8% | ||||
| Return of Equity: | $16,581,728 | 28.3% | ||||
| Total Sources: | $58,600,000 | 100.0% | Total Uses: | $58,600,000 | 100.0% | |
| (1) | See “Escrows and Reserves” below. |
| (2) | The increase from the Most Recent NOI to UW NOI was primarily driven by five tenants, representing 6.2% of net rentable area and 6.9% of underwritten base rent that opened in 2023, and seven tenants, representing 9.3% of net rentable area and 11.2% of underwritten base rent, that are expected to open by November 2023. |
| (3) | The increase from the 3rd Most Recent NOI to 2nd Most Recent NOI was primarily driven by a decrease in collection loss from 2021 to 2022 and an increase in occupancy from 89.4% to 93.7%. |
| (4) | Occupancy was provided by the borrower. |
| (5) | The Appraised Value represents the Hypothetical Market Value Assuming Harkins TI is paid. The Harkins TI is reserved upfront. The appraisal included a Market Value As-Is of $94.3 million, representing a 62.1% Cut-off Date loan to value ratio. |
The Mortgage Loan. The fourth largest mortgage loan (the “Park West Shopping Center Mortgage Loan”) is evidenced by a promissory note in the original principal amount of $58,600,000 and secured by the fee interest in a 253,789 SF anchored retail property located in Peoria, Arizona (the “Park West Shopping Center Property”).
The Borrower and the Borrower Sponsors. The borrower is Park West WFB, LLC, a Delaware limited liability company and single purpose entity with two independent directors. The borrower sponsors are Joshua Volen and Trevor Smith, and the non-recourse carveout guarantor is CIRE OpCo I, LLC.
Joshua Volen and Trevor Smith are the Principals and Co-Founders of CIRE Equity. CIRE Equity is a vertically integrated real estate private equity firm and investment platform. The company currently has approximately $718 million in assets under management and has invested in approximately 3.9 million square feet. The company acquires industrial, retail, office and multi-family properties in high-growth markets across the Western United States.
The Property. The Park West Shopping Center Property is a multi-tenant anchored retail center totaling 253,789 SF, located in Peoria, Arizona. Built in 2007, the property is situated on a 31.9-acre site and consists of 13 multi-tenant retail buildings and single-tenant pad buildings. The Park West Shopping Center Property is anchored by Harkins Theatre, a movie-theater, which has been located at the property since 2007. Additional tenants include several full-service restaurants, and national and regional tenants such as LOFT, Bath & Body Works, Lenscrafters, Victoria’s Secret, and Athleta. The property contains 1,948 surface parking spaces, resulting in a parking ratio of 7.7 spaces per 1,000 SF of rentable area. As of May 1, 2023, the Park West Shopping Center Property was 95.2% leased to 51 tenants, which includes seven tenants, totaling 9.3% of net rentable area, that have not yet taken occupancy.
| This is not a research report and was not prepared by any Underwriter’s research department. Please see additional important information and qualifications at the end of this Term Sheet. | ||
| T-67 | ||
| Retail – Anchored | Loan #4 | Cut-off Date Balance: | $58,600,000 |
| 9712-9868 West Northern Avenue | Park West Shopping Center | Cut-off Date LTV: | 60.4% |
| Peoria, AZ 85345 | UW NCF DSCR: | 1.53x | |
| UW NOI Debt Yield: | 11.6% |
The borrower purchased the Park West Shopping Center Property, along with adjacent vacant parcels, in 2017 for approximately $33.5 million, when the Park West Shopping Center Property was approximately 67.8% leased. The borrower has spent approximately $5.7 million on capital improvements between 2018 and 2022, including exterior renovations, monument signs, installation of a splash pad and playground equipment and asphalt repairs. Additionally the borrower has spent approximately $11.8 million on leasing costs since acquisition. Through April 2023, the borrower has signed 27 new leases since 2020.
Major Tenants.
Harkins Theatre (64,129 SF; 25.3% of NRA; 19.5% of underwritten base rent). Harkins Theatre (“Harkins”) is the largest independently owned theater company in the United States. Founded in 1933, Harkins currently operates 32 theaters in four states including Arizona, Colorado, California and Oklahoma. The tenant has been located at the Park West Shopping Center Property since 2007, and recently renewed for a 15-year term, expiring October 31, 2037, with no termination options. Harkins Amusement Enterprises, Inc., the parent of the tenant, is expected to execute a limited guaranty of $6 million, which will amortize on a straight-line basis beginning July 1, 2025, through the end of the lease term. However, this was not yet executed at the time of loan origination. The non-recourse carveout guarantor has provided a similar, limited guaranty of $6 million, amortizing beginning July 1, 2025, through the end of the lease term, until the limited corporate guaranty from Harkins is executed.
In conjunction with the renewal, Harkins is planning to complete a $9.0 million renovation, beginning in early 2024, which will include stadium seating with luxury recliner seats, a new beer and wine bar in the lobby, upgraded food and beverages, all new carpet and flooring throughout, upgrades to the Audiovisual equipment and technology upgrades. The borrower is contributing $3.5 million towards the renovation, which is reserved upfront. The renovation is expected to take place in phases, with portions of the tenant space offline as it is completed. As of February 2023, the tenant reported trailing 12-month sales of $372,595 per screen and an occupancy cost of 32.2%. The sales represented a 49.8% increase over 2021. Additionally, according to Harkins tracking data, for the period of January through April 2023, the theater drew 988 visitors per day, which is a 31% increase over the same period in 2022.
BJs Restaurant (9,000 SF; 3.5% of NRA; 4.4% of underwritten base rent). BJs Restaurant (“BJs”) is a restaurant chain that was founded in 1978 and specializes in deep dish pizza and craft beer. BJs has been a tenant since 2008 and has a lease expiration of December 31, 2028, with one five-year renewal option, and no termination options. As of February 2023, the tenant reported trailing 12-month sales of $1,101 PSF and an occupancy cost of 3.7%.
Smart Gym (8,925 SF; 3.5% of NRA; 2.8% of underwritten base rent). Smart Gym provides high-intensity group fitness classes coupled with a high-end boutique health club. It includes cardio equipment, tanning, personal training, Hydro Massage, and a full line of strength training equipment. Smart Gym has been a tenant since 2017 and has a lease expiration date of July 31, 2030. The tenant has no termination options and two five-year renewal options. As of February 2023, the tenant reports trailing 12-month sales of $84 PSF and an occupancy cost of 24.3%.
The following table presents certain information relating to the tenancy at the Park West Shopping Center Property:
| Tenant Summary | |||||||||
| Tenant Name | Credit Rating (Fitch/Moody's/ S&P)(1) | Tenant SF | Approx. % of SF | Annual UW Rent | % of Total Annual UW Rent(2) | Annual UW Rent PSF | Renewal Options | ||
| Termination Option (Y/N) | Lease Expiration | ||||||||
| Major Tenants | |||||||||
| Harkins Theatre | NR/NR/NR | 64,129 | 25.3% | $1,282,580 | 19.5% | $20.00 | N | 10/31/2037 | 3 x 5 years |
| BJs Restaurants | NR/NR/NR | 9,000 | 3.5% | $292,173 | 4.4% | $32.46 | N | 12/31/2028 | 1 x 5 years |
| Smart Gym | NR/NR/NR | 8,925 | 3.5% | $182,933 | 2.8% | $20.50 | N | 7/31/2030 | 2 x 5 years |
| Victoria’s Secret(3) | NR/Ba3/BB- | 7,679 | 3.0% | $199,654 | 3.0% | $26.00 | Y(4) | 1/31/2024 | None |
| OSI Flemings | NR/NR/NR | 7,289 | 2.9% | $139,089 | 2.1% | $19.08 | N | 4/30/2033 | 1 x 5 years |
| The Vig | NR/NR/NR | 7,073 | 2.8% | $226,336 | 3.4% | $32.00 | N | 5/31/2033 | 2 x 5 years |
| Kasai Japanese Steakhouse(5) | NR/NR/NR | 6,779 | 2.7% | $235,096 | 3.6% | $34.68 | N | 7/31/2032 | 2 x 5 years |
| The Cabin | NR/NR/NR | 6,505 | 2.6% | $161,263 | 2.5% | $24.79 | N | 1/31/2025 | 1 x 5 years |
| My Salon Suites | NR/NR/NR | 6,470 | 2.5% | $171,649 | 2.6% | $26.53 | N | 8/31/2030 | 2 x 5 years |
| Total/Wtd. Avg. | 123,849 | 48.8% | $2,890,773 | 43.9% | $23.34 | ||||
| Non-Major Tenants(6) | 117,808 | 46.4% | $3,689,217 | 56.1% | $31.32 | ||||
| Occupied Collateral Total | 241,657 | 95.2% | $6,579,990 | 100.0% | $27.23 | ||||
| Vacant Space | 12,132 | 4.8% | |||||||
| Total | 253,789 | 100.0% | $6,579,990 | 100.0% | $27.23 | ||||
| (1) | Certain ratings are those of the parent company whether or not the parent guarantees the lease. |
| (2) | % of Total Annual UW Rent does not include vacant space. |
| (3) | The tenant is currently paying abated rent due to the occurrence during prior ownership of a co-tenancy trigger related to the overall retail occupancy. The Annual UW Rent reflects the tenant’s abated rent. |
| (4) | The tenant has the right to terminate the lease at any time with 12 months’ written notice. |
| (5) | Kasai Japanese Steakhouse has signed a lease but is not yet in occupancy. The tenant space has been delivered and the lease began August 1, 2022, with opening expected to take place September 1, 2023. The tenant has no outs in its lease. |
| (6) | Non-Major Tenants includes six tenants (Bully Brew, Paramount Hair Extensions, LLC, Tan Republic, LOFT, Coastin Tiki Bar, and Jules & JC) totaling 6.6% of net rentable area that have not yet taken occupancy of their spaces. All six tenants are expected to take occupancy by November 2023. |
| This is not a research report and was not prepared by any Underwriter’s research department. Please see additional important information and qualifications at the end of this Term Sheet. | ||
| T-68 | ||
| Retail – Anchored | Loan #4 | Cut-off Date Balance: | $58,600,000 |
| 9712-9868 West Northern Avenue | Park West Shopping Center | Cut-off Date LTV: | 60.4% |
| Peoria, AZ 85345 | UW NCF DSCR: | 1.53x | |
| UW NOI Debt Yield: | 11.6% |
The following table presents a summary of sales and occupancy costs for certain Major Tenants at the Park West Shopping Center Property.
| Tenant Sales(1)(2) | |||
| 2021 Sales (PSF) | TTM 2/28/2023 Sales (PSF) | Occupancy Cost(3) | |
| Harkins Theatre(4) | $248,785 | $372,595 | 32.2% |
| BJs Restaurants | $953 | $1,101 | 3.7% |
| Smart Gym | $86 | $84 | 24.3% |
| Victoria’s Secret | $772 | $658(5) | 3.9% |
| OSI Flemings | $1,000 | $1,260(6) | 2.2% |
| The Vig(7) | NAV | NAV | NAV |
| Kasai Japanese Steakhouse(7) | NAV | NAV | NAV |
| The Cabin | $325 | $326(5) | 10.1% |
| (1) | Information obtained from the borrower. | |
| (2) | Tenants shown on the Tenant Summary table above and not included on the Tenant Sales table are not required to report sales. |
| (3) | Occupancy cost is based on underwritten base rent and reimbursements divided by most recent reported sales. |
| (4) | Represents sales per screen. |
| (5) | Represents trailing 12-month sales as of March 2023 |
| (6) | Represents 2022, 4-months annualized |
| (7) | The Vig recently opened, and Kasai Japanese Steakhouse has not yet opened for business. |
The following table presents certain information relating to the lease rollover schedule at the Park West Shopping Center Property:
| Lease Rollover Schedule(1)(2) | ||||||||
| Year | # of Leases Rolling | SF Rolling | UW Rent PSF Rolling | Approx. % of Total SF Rolling | Approx. Cumulative % of SF Rolling | Total UW Rent Rolling | Approx. % of Total Rent Rolling | Approx. Cumulative % of Total Rent Rolling |
| MTM | 0 | 0 | $0.00 | 0.0% | 0.0% | $0 | 0.0% | 0.0% |
| 2023 | 0 | 0 | $0.00 | 0.0% | 0.0% | $0 | 0.0% | 0.0% |
| 2024 | 6 | 21,210 | $23.67 | 8.4% | 8.4% | $502,051 | 7.6% | 7.6% |
| 2025 | 4 | 12,378 | $29.99 | 4.9% | 13.2% | $371,263 | 5.6% | 13.3% |
| 2026 | 2 | 7,390 | $37.51 | 2.9% | 16.1% | $277,194 | 4.2% | 17.5% |
| 2027 | 2 | 3,354 | $31.04 | 1.3% | 17.5% | $104,124 | 1.6% | 19.1% |
| 2028 | 6 | 20,860 | $33.91 | 8.2% | 25.7% | $707,360 | 10.8% | 29.8% |
| 2029 | 3 | 11,049 | $34.24 | 4.4% | 30.0% | $378,335 | 5.7% | 35.6% |
| 2030 | 6 | 30,302 | $30.27 | 11.9% | 42.0% | $917,279 | 13.9% | 49.5% |
| 2031 | 4 | 8,585 | $26.44 | 3.4% | 45.4% | $227,018 | 3.5% | 53.0% |
| 2032 | 9 | 30,119 | $33.09 | 11.9% | 57.2% | $996,752 | 15.1% | 68.1% |
| 2033 | 7 | 29,711 | $27.47 | 11.7% | 68.9% | $816,034 | 12.4% | 80.5% |
| 2034 & Beyond | 2 | 66,699 | $19.23 | 26.3% | 95.2% | $1,282,580 | 19.5% | 100.0% |
| Vacant | 0 | 12,132 | $0.00 | 4.8% | 0.0% | $0 | 0.0% | 100.0% |
| Total/Wtd. Avg. | 51 | 253,789 | $27.23(3) | 100.0% | 100.0% | $6,579,990 | 100.0% | |
| (1) | Information is based on the underwritten rent roll. |
| (2) | Certain tenants may have lease termination options that are exercisable prior to the originally stated expiration date of the related lease and are not considered in the rollover schedule. |
| (3) | Wtd. Avg. UW Rent PSF Rolling excludes vacant space. |
The Market. The Park West Shopping Center Property is located at the northeastern corner of West Northern Avenue and North 99th Avenue in Peoria, Arizona. The property is located approximately 0.4 miles from Arizona State Route 101, providing access throughout the region, and 19.7 miles from downtown Phoenix. The local area is approximately 75% developed, primarily with residential and commercial land and some shopping center uses. Peoria has seen strong population growth with an increase of 24.0% since 2010. The Park West Shopping Center Property is located approximately 2.7 miles from State Farm Stadium, home of the Arizona Cardinals football team. The property is also located 1.2 miles from the Desert Diamond Casino, with over 75,000 SF of entertainment space, 1,400 slot machines, electronic and live table games, three restaurants, and a food court. According to the appraisal, the estimated 2022 population within a three- and five-mile radius was approximately 78,603 and 309,583, respectively, and the average household income within the same radii was $69,849 and $69,950, respectively.
According to the appraisal, the Park West Shopping Center Property is located within the Northwest Phoenix/Glendale submarket of the Phoenix retail market. As of year-end 2022, the submarket reported total inventory of approximately 16.7 million SF with a 10.0% vacancy rate and average asking rent of $19.34 PSF. The appraiser concluded to market rents for the Park West Shopping Center Property ranging from $20.00 PSF for the theater, to $34.00 for full-service restaurant space (see table below).
| This is not a research report and was not prepared by any Underwriter’s research department. Please see additional important information and qualifications at the end of this Term Sheet. | ||
| T-69 | ||
| Retail – Anchored | Loan #4 | Cut-off Date Balance: | $58,600,000 |
| 9712-9868 West Northern Avenue | Park West Shopping Center | Cut-off Date LTV: | 60.4% |
| Peoria, AZ 85345 | UW NCF DSCR: | 1.53x | |
| UW NOI Debt Yield: | 11.6% |
The following table presents certain information relating to the appraisal’s market rent conclusion for the Park West Shopping Center Property:
| Market Rent Summary | |||
| Theater | Full-Service Restaurants | Shop Space | |
| Market Rent (PSF) | $20.00 | $34.00 | $31.20 |
| Lease Term (Years) | 15 | 10 | 10 |
Lease Type (Reimbursements) | Net | Net | Net |
| Tenant Improvements | $25.00 | $50.00 | $25.00 |
| Rent Increase Projection | 10.0% / 5 Yrs | 10.0% / 5 Yrs | 3.0% / Yr |
| Source: Appraisal. | |||
The table below presents certain information relating to comparable sales pertaining to the Park West Shopping Center Property identified by the appraisal:
| Comparable Sales | |||||||
Property Name | Location | Rentable Area (SF) | Year Built/Reno | Occupancy | Anchors | Sale Date | Sale Price (PSF) |
| Arcadia Fiesta | 3131 East Indian School Road Phoenix, AZ | 154,436 | 1959 / 2018 | 100.0% | Ross Dress for Less, Jo-Ann Fabrics, Ace Hardware, O’Reilly Auto Parts, The Tile Shop, and Tuesday Morning | 11/2021 | $269.69 |
| Biltmore Fashion Park | 2502 East Camelback Road Phoenix, AZ | 212,000 | 1963 / 2019 | 93.0% | Saks Fifth Avenue, Macy’s and flagship Life Time Fitness | 6/2022 | $886.79 |
| Falls at Ocotillo | 1025-1095 West Queen Creek Road Chandler, AZ | 72,258 | 2001 / NAP | 98.0% | Coldwell Banker Realty, Chase Bank, Arizona Pain Relief and Stone & Vine Urban Italian restaurant | 7/2022 | $332.14 |
| The Promenade Scottsdale | 16243 North Scottsdale Road Scottsdale, AZ | 574,057 | 2005 / 2017 | 97.0% | Living Spaces, Nordstrom Rack, Sacks Off Fifth, Michael’s, PetSmart, Putting World, Old Navy, Painted Tree Marketplace | 8/2022 | $313.56 |
| East Thunderbird Square | 14202-14344 North Scottsdale Road Scottsdale, AZ | 173,491 | 2001 / NAP | 90.0% | Goodwill, Spencers TV & Appliance, Salt Creek Home Furniture | 11/2022 | $576.40 |
Source: Appraisal.
| This is not a research report and was not prepared by any Underwriter’s research department. Please see additional important information and qualifications at the end of this Term Sheet. | ||
| T-70 | ||
| Retail – Anchored | Loan #4 | Cut-off Date Balance: | $58,600,000 |
| 9712-9868 West Northern Avenue | Park West Shopping Center | Cut-off Date LTV: | 60.4% |
| Peoria, AZ 85345 | UW NCF DSCR: | 1.53x | |
| UW NOI Debt Yield: | 11.6% |
Operating History and Underwritten Net Cash Flow. The following table presents certain information relating to the historical operating performance and Underwritten Net Cash Flow at the Park West Shopping Center Property:
| Cash Flow Analysis | |||||||||||
| 2020 | 2021 | 2022 | TTM 2/28/2023 | UW | UW PSF | ||||||
| Base Rent | $3,220,849 | $3,685,140 | $4,507,578 | $4,624,252 | $6,579,990 | $25.93 | |||||
| Grossed Up Vacant Space | $0 |
| $0 |
| $0 |
| $0 |
| $378,518 |
| $1.49 |
| Gross Potential Rent | $3,220,849 | $3,685,140 | $4,507,578 | $4,624,252 | $6,958,509 | $27.42 | |||||
| Other Income | $27,843 | $111,392 | $209,021 | $207,658 | $108,627 | $0.43 | |||||
| Percentage Rent | $373,835 | $763,844 | $579,005 | $778,777 | $518,411 | $2.04 | |||||
| Total Recoveries | $991,267 |
| $1,449,711 |
| $1,416,080 |
| $1,438,049 |
| $1,749,015 |
| $6.89 |
| Net Rental Income | $4,613,794 | $6,010,087 | $6,711,684 | $7,048,736 | $9,334,562 | $36.78 | |||||
| (Collection Loss) | ($855,454) | ($751,781) | $95,647 | $75,459 | $0 | $0.00 | |||||
| (Vacancy & Credit Loss) | $0 |
| $0 |
| $0 |
| $0 |
| ($378,518) | (1) | ($1.49) |
| Effective Gross Income | $3,758,340 | $5,258,306 | $6,807,331 | $7,124,195 | $8,956,044 | $35.29 | |||||
| Real Estate Taxes | $759,699 | $753,766 | $665,260 | $650,570 | $613,412 | $2.42 | |||||
| Insurance | $39,970 | $53,327 | $58,834 | $57,523 | $95,615 | $0.38 | |||||
| Management Fee | $124,856 | $239,421 | $276,898 | $296,902 | $268,681 | $1.06 | |||||
| Other Operating Expenses | $925,676 |
| $1,063,964 |
| $1,175,689 |
| $1,199,314 |
| $1,199,314 |
| $4.73 |
| Total Operating Expenses | $1,850,201 | $2,110,478 | $2,176,681 | $2,204,310 | $2,177,023 | $8.58 | |||||
| Net Operating Income | $1,908,139 | (2) | $3,147,828 | (2) | $4,630,650 | (2) | $4,919,885 | (3) | $6,779,021 | (3) | $26.71 |
| Replacement Reserves | $0 | $0 | $0 | $0 | $50,758 | $0.20 | |||||
| TI/LC | $0 |
| $0 |
| $0 |
| $0 |
| $133,279 | (4) | $0.53 |
| Net Cash Flow | $1,908,139 | $3,147,828 | $4,630,650 | $4,919,885 | $6,594,984 | $25.99 | |||||
| Occupancy % | 74.9% | (5) | 89.4% | (5) | 93.7% | (5) | 95.2% | (1) | 94.6% | (1) | |
| NOI DSCR | 0.44x | 0.73x | 1.08x | 1.14x | 1.57x | ||||||
| NCF DSCR | 0.44x | 0.73x | 1.08x | 1.14x | 1.53x | ||||||
| NOI Debt Yield | 3.3% | 5.4% | 7.9% | 8.4% | 11.6% | ||||||
| NCF Debt Yield | 3.3% | 5.4% | 7.9% | 8.4% | 11.3% | ||||||
| (1) | The underwritten economic vacancy is 5.4%. The Park West Shopping Center Property was 95.2% occupied as of May 1, 2023. |
| (2) | The increase in Net Operating Income from 2020 to 2021 was primarily driven by the increase in occupancy from 74.9% to 89.4%, an increase in total recoveries and a decrease in collection loss. The further increase in Net Operating Income from 2021 to 2022 was primarily driven by a decrease in collection loss and an increase in occupancy from 89.4% to 93.7% |
| (3) | The increase from TTM 2/28/2023 to UW Net Operating Income was primarily driven by five tenants, representing 6.2% of the net rentable area and 6.9% of underwritten base rent that opened in 2023, and seven tenants , representing 9.3% of net rentable area and 11.2% of underwritten base rent, that are expected to open by November 2023. |
| (4) | The UW TI/LC number includes a $57,000 credit for the $570,000 upfront TI/LC reserve. |
| (5) | The occupancy % for 2020, 2021 and 2022, represents the occupancy as of January 1, 2021, 2022, and 2023, respectively. |
Escrows and Reserves.
Real Estate Taxes – The loan documents require an upfront deposit of $53,674 and ongoing monthly deposits of $53,674 for real estate taxes.
Insurance – The loan documents require an ongoing monthly deposit into an insurance reserve equal to 1/12th of the insurance premiums that the lender reasonably estimates will be payable during the next ensuing 12 months; provided that no deposits are required if (i) no event of default is continuing, (ii) the borrower maintains insurance coverage for the Park West Shopping Center Property as part of blanket or umbrella coverage reasonably approved by the lender, and (iii) the borrower provides the lender with evidence of the renewals of the insurance policies and paid receipts for the payment of the insurance premiums no later than 10 business days prior to the expiration dates of the policies.
Replacement Reserve – The loan documents require ongoing monthly replacement reserve deposits of $4,008 subject to a cap of $144,283.
Leasing Reserve – The loan documents require an upfront deposit of $570,000 and ongoing monthly reserves of $15,857 for tenant improvements and leasing commissions reserves, subject to a cap of $570,000.
Existing TI/LC Obligations – The loan documents require an upfront deposit of $5,377,975 for outstanding tenant improvements and leasing commissions which includes $3.5 million for Harkins, as well as certain amounts for ten additional tenants.
Rent Concession Reserve – The loan documents require an upfront deposit of $333,080 for certain future rent credits, gap rent, or abatements related to nine tenants.
| This is not a research report and was not prepared by any Underwriter’s research department. Please see additional important information and qualifications at the end of this Term Sheet. | ||
| T-71 | ||
| Retail – Anchored | Loan #4 | Cut-off Date Balance: | $58,600,000 |
| 9712-9868 West Northern Avenue | Park West Shopping Center | Cut-off Date LTV: | 60.4% |
| Peoria, AZ 85345 | UW NCF DSCR: | 1.53x | |
| UW NOI Debt Yield: | 11.6% |
Lockbox and Cash Management. The Park West Shopping Center Mortgage Loan is structured with a hard lockbox and in place cash management. The borrower is required to deposit all rents within one business day of receipt, and to direct all tenants to make direct rent deposits into the lockbox account. On each monthly payment date, all funds in the lockbox account are required to be transferred to the cash management account and disbursed by the lender in accordance with the cash flow waterfall set forth in the loan documents. If a Cash Trap Event Period (as defined below) is not in effect, all excess funds will be disbursed to the borrower. During a Cash Trap Event Period, all excess funds in the cash management account will be held in an excess cash flow account as additional collateral for the Park West Shopping Center Mortgage Loan.
A “Cash Trap Event Period” will commence upon the earliest of the following:
| (i) | the occurrence of an event of default; |
| (ii) | the net cash flow debt service coverage ratio (“NCF DSCR”) falling below 1.15x, based on 30-year amortization, tested quarterly; or |
| (iii) | Harkins (a) going dark, vacating or failing to continuously operate its entire space, (b) becoming subject of a bankruptcy action or defaulting under its lease beyond applicable notice and cure periods; or (c) terminating its lease or giving written notice of its intent to terminate its lease, or the lease failing to be in effect. For the avoidance of doubt, in regards to clause (a), any temporary or partial disruption in continuous occupancy resulting from the renovation of the Harkins Theatre space planned to commence in 2024 will not be deemed a go dark trigger event so long as such renovation work is diligently prosecuted to completion. |
A Cash Trap Event Period will end upon the occurrence of the following:
| ● | with regard to clause (i), the cure of such event of default; |
| ● | with regard to clause (ii), the NCF DSCR being greater than or equal to 1.20x for two consecutive calendar quarters; and |
| ● | with regard to clause (iii)(a) above, (I) the borrower having entered into one or more replacement leases for at least 75% of the Harkins space, with each tenant being open for business, paying full, unabated rent, and all tenant leasing costs have been paid or reserved in full (a “Major Tenant Re-Tenanting Event”) or (II) Harkins has resumed its normal business operations in its entire space for a period of two consecutive calendar quarters; with respect to clause (iii)(b) above, either (I) a Major Tenant Re-Tenanting Event, (II) the dismissal of such bankruptcy or insolvency action and the related lease having been affirmed on terms satisfactory to the lender or (III) the subject default is cured and no other default under the lease occurs for a period of two consecutive calendar quarters; and with respect to clause (iii)(c) above either (I) a Major Tenant Re-Tenanting Event or (II) the tenant revokes any notification of termination or cancellation and delivers a tenant estoppel reasonably acceptable to the lender. |
Additional Secured Indebtedness (not including trade debts). None.
Mezzanine Loan and Preferred Equity. None.
Release of Property. None
Letter of Credit. None.
Right of First Offer/Right of First Refusal. None.
Ground Lease. None.
Terrorism Insurance. The loan documents require that the “all risk” insurance policy required to be maintained by the borrower provides coverage for terrorism in an amount equal to the full replacement cost of the Park West Shopping Center Property, as well as business interruption insurance covering no less than the 18-month period following the occurrence of a casualty event, together with a 6-month extended period of indemnity.
| This is not a research report and was not prepared by any Underwriter’s research department. Please see additional important information and qualifications at the end of this Term Sheet. | ||
| T-72 | ||
| Various - Various | Loan #5 | Cut-off Date Balance: | $52,455,546 |
| Various | Shops at Riverwalk & River Walk Corporate Center | Cut-off Date LTV: | 44.2% |
| Bakersfield, CA 93311 | UW NCF DSCR: | 1.58x | |
| UW NOI Debt Yield: | 12.8% |
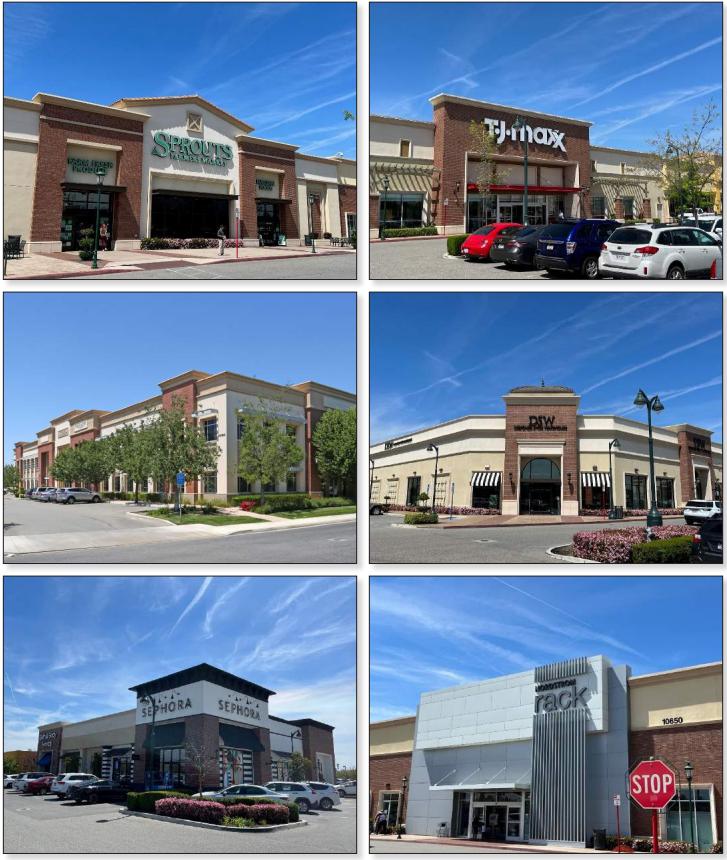
| This is not a research report and was not prepared by any Underwriter’s research department. Please see additional important information and qualifications at the end of this Term Sheet. | ||
| T-73 | ||
| Various - Various | Loan #5 | Cut-off Date Balance: | $52,455,546 |
| Various | Shops at Riverwalk & River Walk Corporate Center | Cut-off Date LTV: | 44.2% |
| Bakersfield, CA 93311 | UW NCF DSCR: | 1.58x | |
| UW NOI Debt Yield: | 12.8% |

| This is not a research report and was not prepared by any Underwriter’s research department. Please see additional important information and qualifications at the end of this Term Sheet. | ||
| T-74 | ||
| Various - Various | Loan #5 | Cut-off Date Balance: | $52,455,546 |
| Various | Shops at Riverwalk & River Walk Corporate Center | Cut-off Date LTV: | 44.2% |
| Bakersfield, CA 93311 | UW NCF DSCR: | 1.58x | |
| UW NOI Debt Yield: | 12.8% |
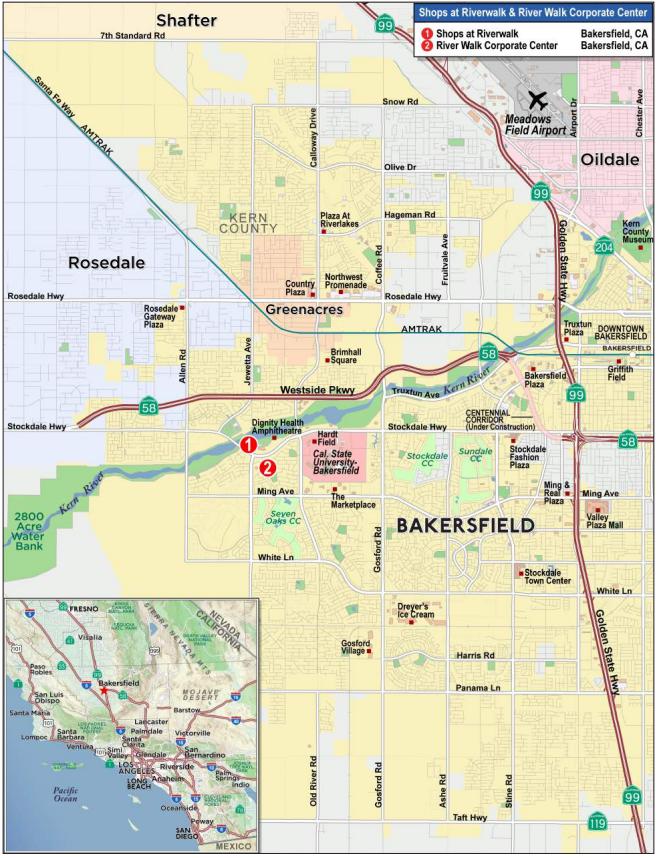
| This is not a research report and was not prepared by any Underwriter’s research department. Please see additional important information and qualifications at the end of this Term Sheet. | ||
| T-75 | ||
| Mortgage Loan No. 5 – Shops at Riverwalk & River Walk Corporate Center |
| Mortgage Loan Information | Property Information | |||||
| Mortgage Loan Seller: | WFB | Single Asset/Portfolio: | Portfolio | |||
| Credit Assessment (Fitch/Moody’s/KBRA): | NR/NR/NR | Location: | Bakersfield, CA 93311 | |||
| Original Balance: | $52,500,000 | General Property Type: | Various | |||
| Cut-off Date Balance: | $52,455,546 | Detailed Property Type: | Various | |||
| % of Initial Pool Balance: | 7.8% | Title Vesting: | Fee | |||
| Loan Purpose: | Refinance | Year Built/Renovated(2): | Various | |||
| Borrower Sponsors: | Castle & Cooke, Inc., Murdock Realty, LLC | Size(2): | 313,317 SF | |||
| and Westlake Wellbeing Properties, LLC | Cut-off Date Balance PSF: | $167 | ||||
| Guarantors: | Castle & Cooke, Inc., Murdock Realty, LLC | Maturity Date Balance PSF: | $159 | |||
| and Westlake Wellbeing Properties, LLC | Property Manager: | Castle & Cooke Commercial – | ||||
| Mortgage Rate: | 6.8350% | CA, Inc. (borrower- related) | ||||
| Note Date: | 5/19/2023 | |||||
| First Payment Date: | 7/11/2023 | |||||
| Maturity Date: | 6/11/2028 | |||||
| Original Term to Maturity: | 60 months | |||||
| Original Amortization Term: | 360 months | |||||
| IO Period: | 0 months | |||||
| Seasoning: | 1 month | Underwriting and Financial Information | ||||
| Prepayment Provisions: | L(25),D(31),O(4) | UW NOI: | $6,698,593 | |||
| Lockbox/Cash Mgmt Status: | Soft/Springing | UW NOI Debt Yield: | 12.8% | |||
| Additional Debt Type: | No | UW NOI Debt Yield at Maturity: | 13.5% | |||
| Additional Debt Balance: | NAP | UW NCF DSCR: | 1.58x | |||
| Future Debt Permitted (Type): | No (NAP) | Most Recent NOI: | $7,034,540 (2/28/2023 TTM) | |||
| Reserves(1) | 2nd Most Recent NOI(3): | $6,895,748 (12/31/2022) | ||||
| Type | Initial | Monthly | Cap | 3rd Most Recent NOI(3): | $6,178,716 (12/31/2021) | |
| RE Taxes: | $262,850 | $87,616 | NAP | Most Recent Occupancy(4): | 92.1% (Various) | |
| Insurance: | $0 | Springing | NAP | 2nd Most Recent Occupancy: | 96.0% (12/31/2022) | |
| Replacement Reserve: | $120,764 | $3,916 | $140,991 | 3rd Most Recent Occupancy: | 91.4% (12/31/2021) | |
| Leasing Reserve: | $1,750,000 | $26,110 | $1,500,000 | Appraised Value (as of)(2): | $118,710,000 (Various) | |
| Existing TI/LC Obligations: | $75,678 | $0 | NAP | Appraised Value PSF: | $379 | |
| Rent Concession Reserve: | $68,429 | $0 | NAP | Cut-off Date LTV Ratio: | 44.2% | |
| Outparcel Development Reserve: | Springing(1) | $0 | NAP | Maturity Date LTV Ratio: | 41.9% | |
| Sources and Uses | ||||||
| Sources | Proceeds | % of Total | Uses | Proceeds | % of Total | |
| Loan Amount(5): | $52,500,000 | 100.0% | Return of Equity(5): | $49,739,241 | 94.7% | |
| Upfront Reserves: | $2,277,721 | 4.3% | ||||
| Closing Costs: | $483,038 | 0.9% | ||||
| Total Sources: | $52,500,000 | 100.0% | Total Uses: | $52,500,000 | 100.00% | |
| (1) | See “Escrows and Reserves” below. |
| (2) | See the “Shops at Riverwalk & River Walk Corporate Center Properties Summary” table below for details regarding the individual properties |
| (3) | The increase in Net Operating Income from 2021 to 2022 was driven by 11 new and renewal leases (9.6% NRA; 11.8% of UW Base Rent) being signed between 2021 and 2022. |
| (4) | The Shops at Riverwalk Property (as defined below) was 90.9% leased as of April 30, 2023 and the River Walk Corporate Center Property (as defined below) was 100.0% leased as of July 1, 2023. |
| (5) | The Shops at Riverwalk & River Walk Corporate Center Mortgage Loan (as defined below) was used to partially pay off a credit facility secured by a number of properties, including the Shops at Riverwalk & River Walk Corporate Center Properties (as defined below). |
The Mortgage Loan. The fifth largest mortgage loan (the “Shops at Riverwalk & River Walk Corporate Center Mortgage Loan”) is evidenced by a single promissory note in the original principal amount of $52,500,000 and secured by the fee interests in a 269,759 SF shadow anchored retail property and a 43,558 SF single tenant suburban office property located in Bakersfield, California (the “Shops at Riverwalk & River Walk Corporate Center Properties”).
The Borrower and the Borrower Sponsor. The borrower is Castle & Cooke Riverwalk, LLC, a Delaware limited liability company and single purpose entity with one independent director. The borrower sponsors and non-recourse carveout guarantors are Castle & Cooke, Inc., Murdock Realty, LLC, and Westlake Wellbeing Properties, LLC.
Formed in 1851 by Samuel Northrup Castle and Amos Starr Cooke, Castle & Cooke began as a Hawaii merchant partnership and has transformed into a diverse family of companies. Castle & Cooke maintains a commercial portfolio totaling close to 2.6 million SF, including 831,000 SF of commercial properties in Hawaii, 1.7 million SF of commercial properties on the US mainland, 94 holes of golf courses on the US mainland, and a 269-key resort, in addition to close to 5,700 acres of undeveloped land in Hawaii and the US mainland and approximately 1,450 residential lots under development across Hawaii and the US mainland. David H. Murdock is a direct or indirect controlling shareholder in the sponsor entities. See “Description of the Mortgage Pool – Loan Purpose, Default History, Bankruptcy Issues and Other Proceedings” in the prospectus.
| This is not a research report and was not prepared by any Underwriter’s research department. Please see additional important information and qualifications at the end of this Term Sheet. | ||
| T-76 | ||
| Various - Various | Loan #5 | Cut-off Date Balance: | $52,455,546 |
| Various | Shops at Riverwalk & River Walk Corporate Center | Cut-off Date LTV: | 44.2% |
| Bakersfield, CA 93311 | UW NCF DSCR: | 1.58x | |
| UW NOI Debt Yield: | 12.8% |
The Properties. The Shops at Riverwalk & River Walk Corporate Center Properties comprise a 269,759 SF shadow anchored retail property (the “Shops at Riverwalk Property”) and a 43,558 SF suburban single tenant office property (the “River Walk Corporate Center Property”) located in Bakersfield, California. As of April 30, 2023, the portfolio is 92.1% leased to 43 tenants, with no tenant representing more than 13.9% of the portfolio net rentable area. The borrower developed both of the properties, which are adjacent to one another.
Shops at Riverwalk
The Shops at Riverwalk Property is a shadow anchored retail center located in Bakersfield, California totaling 269,759 SF. Built between 2005 and 2022, the property is situated on a 37.7-acre site and is shadow anchored by Target with collateral junior anchors including Sprouts Farmers Market, Nordstrom Rack, TJ Maxx, DSW and BevMo!. Additional tenants include Sephora, Athleta, Starbucks, and Wells Fargo. The property also includes 38,440 SF of office space. The property contains 2,596 surface parking spaces, resulting in a parking ratio of 9.6 spaces per 1,000 SF of net rentable area. As of April 30, 2023, the Shops at Riverwalk Property was 90.9% leased, and the property has averaged 94.1% occupancy since 2018.
River Walk Corporate Center
The River Walk Corporate Center Property is a two-story, suburban office building occupied by a single tenant totaling 43,558 SF, located in Bakersfield, California. The River Walk Corporate Center Property was built in 2008 and renovated in 2020, and is situated on a 2.7-acre site. The property includes 191 surface parking spaces (4.4 spaces per 1,000 SF). As of July 1, 2023, the property was 100.0% leased to the Department of General Services on behalf of the State of California.
The following table presents certain information relating to the Shops at Riverwalk & River Walk Corporate Center Properties:
| Shops at Riverwalk & River Walk Corporate Center Properties Summary | ||||||||
| Property Name / Location | Allocated Whole Loan Cut-off Date Balance | % of Portfolio Cut-off Date Balance | Occupancy(1) | Year Built/ Renovated(2) | Net Rentable Area (SF) (1) | As-Is Appraised Value(2) | Allocated Cut-off Date LTV | % of UW NOI |
Shops at Riverwalk Bakersfield, CA | $46,480,920 | 88.5% | 90.9% | 2005-2022/NAP | 269,759 | $105,100,000 | 44.2% | 86.9% |
River Walk Corporate Center Bakersfield, CA | $6,019,080 | 11.5% | 100.0% | 2008/2020 | 43,558 | $13,610,000 | 44.2% | 13.1% |
| Total | $52,500,000 | 100.0% | 92.1% | 313,317 | $118,710,000 | 100.0% | ||
| (1) | Information based on the underwritten rent roll. |
| (2) | Source: Appraisals. |
Major Tenants.
Department of General Services (43,558 SF; 13.9% of NRA; 19.2% of underwritten base rent; 10/31/2028 lease expiration). The Department of General Services leases 100% of the space at the River Walk Corporate Center Property on behalf of the State of California and its California Geologic Energy Management Division (“CalGEM”). CalGem prioritizes protecting public health, safety, and the environment in its oversight of the oil, natural gas, and geothermal industries, while working to help California achieve its climate change and clean energy goals. The tenant has been at the property since 2020, does not have any renewal options and may terminate its lease any time on or after October 31, 2024 with at least 60 days’ notice with no termination fee.
Nordstrom Rack (35,000 SF; 11.2% of NRA; 8.3% of underwritten base rent; 3/31/2025 lease expiration). Nordstrom Rack, which has been serving customers since 1973, is the off-price division of Nordstrom, Inc. Today, there are 359 stores across the United States and Canada. Nordstrom Rack has been a tenant at the Shops at Riverwalk Property since 2015 and has four, five-year renewal options remaining. The tenant does not have any termination options and is not required to report sales.
Sprouts Farmers Market (24,799 SF; 7.9% of NRA; 6.9% of underwritten base rent; 2/28/2030 lease expiration). Sprouts Farmers Market (“Sprouts”), which currently has more than 380 stores, was founded in 2002 and focuses on farm fresh produce and other healthy, affordable items. Sprouts has been a tenant at the Shops at Riverwalk Property since 2015 and has three, five-year renewal options remaining. The tenant does not have any termination options and is not required to report sales.
| This is not a research report and was not prepared by any Underwriter’s research department. Please see additional important information and qualifications at the end of this Term Sheet. | ||
| T-77 | ||
| Various - Various | Loan #5 | Cut-off Date Balance: | $52,455,546 |
| Various | Shops at Riverwalk & River Walk Corporate Center | Cut-off Date LTV: | 44.2% |
| Bakersfield, CA 93311 | UW NCF DSCR: | 1.58x | |
| UW NOI Debt Yield: | 12.8% |
The following table presents certain information relating to the tenancy at the Shops at Riverwalk & River Walk Corporate Center Properties:
| Tenant Summary | |||||||||
| Tenant Name | Credit Rating (Fitch/Moody's/ S&P)(1) | Tenant SF | Approx. % of SF | Annual UW Rent(2) | % of Total Annual UW Rent | Annual UW Rent PSF(2) | Renewal Options | ||
| Termination Option (Y/N) | Lease Expiration | ||||||||
| Major Tenants | |||||||||
| Department of General Services | AA/Aa2/AA- | 43,558 | 13.9% | $1,424,190 | 19.2% | $32.70 | Y(1) | 10/31/2028 | None |
| Nordstrom Rack | BB+/Ba1/BB+ | 35,000 | 11.2% | $611,450 | 8.3% | $17.47 | N | 3/31/2025 | 4 x 5 yr |
| Sprouts Farmers Market | NR/NR/NR | 24,799 | 7.9% | $510,611 | 6.9% | $20.59 | N | 2/28/2030 | 3 x 5 yr |
| TJ Maxx | NR/A2/A | 22,500 | 7.2% | $253,125 | 3.4% | $11.25 | N | 5/31/2025 | 3 x 5 yr |
| DSW | NR/NR/NR | 18,000 | 5.7% | $323,820 | 4.4% | $17.99 | N | 1/31/2026 | 2 x 5 yr |
| Total/Wtd. Avg. | 143,857 | 45.9% | $3,123,196 | 42.2% | $21.71 | ||||
| Non-Major Tenants | 144,864 | 46.2% | $4,279,149 | 57.8% | $29.54 | ||||
| Occupied Collateral Total | 288,721 | 92.1% | $7,402,345 | 100.0% | $25.64 | ||||
| Vacant Space | 24,596 | 7.9% | |||||||
| Total | 313,317 | 100.0% | |||||||
| (1) | Certain ratings are those of the parent company or government whether or not the parent guarantees the lease. |
| (2) | Department of General Services may terminate its lease at any time on or after October 31, 2024 with at least 60 days’ notice (with no termination fee required). |
The following table presents a summary of sales and occupancy costs for certain tenants at the Shops at Riverwalk & River Walk Corporate Center Properties.
| Tenant Sales(1)(2) | |||
| 2021 Sales (PSF) | 2022 Sales (PSF) | Occupancy Cost(3) | |
| T.J. Maxx | $463 | $788 | 2.2% |
| DSW | $223 | $234 | 10.6% |
| (1) | Information obtained from the borrower. |
| (2) | Tenants shown on the Tenant Summary table above and not included on the Tenant Sales table are not required to report sales. |
| (3) | Occupancy cost is based on underwritten base rent and reimbursements divided by most recent reported sales. |
The following table presents certain information relating to the lease rollover schedule at the Shops at Riverwalk & River Walk Corporate Center Properties:
| Lease Rollover Schedule(1)(2) | ||||||||
| Year | # of Leases Rolling | SF Rolling | UW Rent PSF Rolling(3) | Approx. % of Total SF Rolling | Approx. Cumulative % of SF Rolling | Total UW Rent Rolling | Approx. % of Total Rent Rolling | Approx. Cumulative % of Total Rent Rolling |
| MTM | 3 | 3,787 | $34.32 | 1.2% | 1.2% | $129,980 | 1.8% | 1.8% |
| 2023 | 1 | 3,410 | $33.00 | 1.1% | 2.3% | $112,530 | 1.5% | 3.3% |
| 2024 | 1 | 2,622 | $40.68 | 0.8% | 3.1% | $106,663 | 1.4% | 4.7% |
| 2025 | 7 | 73,554 | $19.28 | 23.5% | 26.6% | $1,418,440 | 19.2% | 23.9% |
| 2026 | 8 | 51,893 | $24.33 | 16.6% | 43.2% | $1,262,522 | 17.1% | 40.9% |
| 2027 | 6 | 23,437 | $31.94 | 7.5% | 50.7% | $748,546 | 10.1% | 51.0% |
| 2028 | 5 | 58,738 | $32.65 | 18.7% | 69.4% | $1,917,853 | 25.9% | 77.0% |
| 2029 | 1 | 9,113 | $15.36 | 2.9% | 72.3% | $140,000 | 1.9% | 78.8% |
| 2030 | 4 | 33,187 | $24.09 | 10.6% | 82.9% | $799,607 | 10.8% | 89.6% |
| 2031 | 1 | 6,057 | $21.82 | 1.9% | 84.8% | $132,160 | 1.8% | 91.4% |
| 2032 | 3 | 12,000 | $25.33 | 3.8% | 88.7% | $304,000 | 4.1% | 95.5% |
| 2033 | 3 | 10,923 | $30.22 | 3.5% | 92.1% | $330,044 | 4.5% | 100.0% |
| 2034 & Beyond | 0 | 0 | $0.00 | 0.0% | 92.1% | $0 | 0.0% | 100.0% |
| Vacant | 0 | 24,596 | $0.00 | 7.9% | 100.0% | $0 | 0.0% | 100.0% |
| Total/Wtd. Avg. | 43 | 313,317 | $25.64 | 100.0% | $7,402,345 | 100.0% | ||
| (1) | Information is based on the underwritten rent roll. |
| (2) | Certain tenants may have lease termination options that are exercisable prior to the originally stated expiration date of the related lease and are not considered in the lease rollover schedule. |
| (3) | Wtd. Avg. UW Rent PSF Rolling excludes vacant space. |
| This is not a research report and was not prepared by any Underwriter’s research department. Please see additional important information and qualifications at the end of this Term Sheet. | ||
| T-78 | ||
| Various - Various | Loan #5 | Cut-off Date Balance: | $52,455,546 |
| Various | Shops at Riverwalk & River Walk Corporate Center | Cut-off Date LTV: | 44.2% |
| Bakersfield, CA 93311 | UW NCF DSCR: | 1.58x | |
| UW NOI Debt Yield: | 12.8% |
The Market. The Shops at Riverwalk & River Walk Corporate Center Properties are located along Stockdale Highway in Bakersfield, California, approximately 111 miles south of Fresno and 115 miles north of Los Angeles. The properties are within one mile of State Route 58 and within six miles of State Routes 99, 204, and 178. Additionally, California State University, Bakersfield, which has a student body of approximately 10,000 students, is located approximately 0.5 miles from the properties. Mercy Hospital Southwest, which is adjacent to the properties, is a 78-bed hospital that is currently undergoing an expansion to include an additional 106-beds, expected to be completed in late 2023. Significant development in the immediate area consists of office uses along major arterials that are interspersed with multi-family complexes and single-family residential development removed from arterials. According to the appraisal, the estimated 2022 population within a three- and five-mile radius was approximately 92,814 and 245,114, respectively, and the average household income within the same radii was $123,660 and $107,083, respectively.
According to a third party market research report, the Shops at Riverwalk property is situated within the University Centre retail submarket within the greater Bakersfield market. As of May 2023, the submarket reported a total inventory of approximately 943,200 SF with a 4.4% vacancy rate and an average asking rent of $27.89 per SF. The appraiser concluded a market rent for the retail space ranging from $20.40 per SF to $60.00 per SF.
According to a third party market research report, the River Walk Corporate Center property is situated within the University Centre office submarket within the greater Bakersfield market. As of May 2023, the submarket reported a total inventory of approximately 2.5 million SF with a 10.3% vacancy rate and an average asking rent of $31.55 per SF. The appraiser concluded a market rent for the office space of $33.60 per SF.
The following table presents certain information relating to the appraisal’s market rent conclusion for the Shops at Riverwalk & River Walk Corporate Center Properties:
| Market Rent Summary | ||||||||
| Jr. Anchor | Pad | High Exposure | Low Exposure | Office | Drive-Through | Restaurant | River Walk Corporate Center | |
| Market Rent (PSF) | $20.40 | $43.80 | $42.00 | $36.00 | $24.00 | $60.00 | $33.00 | $33.60 |
| Lease Term (Years) | 15 | 5 | 5 | 5 | 5 | 10 | 10 | 10 |
| Lease Type (Reimbursements) | NNN | NNN | NNN | NNN | NNN | NNN | NNN | FSG |
| Rent Increase Projection | Various | 3% | 3% | 3% | 3% | 3% | 3% | 3% |
The table below presents certain information relating to comparable retail property sales pertaining to the Shops at Riverwalk Property:
| Comparable Sales | ||||||
Property Name | Location | Rentable Area (SF) | Anchors | Sale Date | Sale Price (PSF) | Appraiser’s Adjusted Sale Price (PSF) |
| Rocklin Crossings | 5436 Crossings Drive Rocklin, CA | 202,139 | Wal-Mart and Bass Pro | 1/2023 | $335.00 | $345.00 |
| Rock Creek Plaza | 2220 Sunset Boulevard Rocklin, CA | 81,184 | Safeway | 11/2022 | $382.00 | $371.00 |
| Park Place | 4640 Natomas Boulevard Sacramento, CA | 122,358 | Raley’s Supermarket | 12/2022 | $433.00 | $424.00 |
| River Park Crossing | 7497 North Blackstone Avenue Fresno, CA | 121,107 | Sprouts, Ross, Bed Bath & Beyond | 2/2022 | $294.00 | $335.00 |
| Ming Plaza | 3739 Ming Avenue Bakersfield, CA | 117,228 | Ross and dd’s Discounts | 2/2022 | $226.00 | $301.00 |
Source: Appraisal
| This is not a research report and was not prepared by any Underwriter’s research department. Please see additional important information and qualifications at the end of this Term Sheet. | ||
| T-79 | ||
| Various - Various | Loan #5 | Cut-off Date Balance: | $52,455,546 |
| Various | Shops at Riverwalk & River Walk Corporate Center | Cut-off Date LTV: | 44.2% |
| Bakersfield, CA 93311 | UW NCF DSCR: | 1.58x | |
| UW NOI Debt Yield: | 12.8% |
The table below presents certain information relating to comparable office property sales pertaining to the River Walk Corporate Center Property:
| Comparable Sales | ||||||
Property Name | Location | Rentable Area (SF) | Occupancy | Sale Date | Sale Price (PSF) | Appraiser’s Adjusted Sale Price (PSF) |
| Office Building | 500 North Santa Fe Street Visalia, CA | 32,741 | 100.0% | 9/2022 | $260.00 | $299.00 |
| Office Building | 564 West Herndon Avenue Clovis, CA | 33,000 | 100.0% | 5/2022 | $320.00 | $336.00 |
| The Brownstone | 7050 North Fresno Street Fresno, CA | 33,200 | 96.0% | 12/2021 | $262.00 | $314.00 |
| The Tower | 855 M Street Fresno, CA | 291,983 | 98.0% | 9/2021 | $329.00 | $313.00 |
| 4029 Coffee Road | 4029 Coffee Road Bakersfield, CA | 9,420 | 100.0% | 3/2022 | $284.00 | $298.00 |
| Medical Office Building | 500 South Chinowth Road Visalia, CA | 8,326 | 100.0% | 3/2022 | $360.00 | $342.00 |
Source: Appraisal
Operating History and Underwritten Net Cash Flow. The following table presents certain information relating to the historical operating performance and Underwritten Net Cash Flow at the Shops at Riverwalk & River Walk Corporate Center Properties:
| Cash Flow Analysis | |||||||
| 2020 | 2021 | 2022 | 2/28/2023 TTM | UW | UW PSF | ||
| Base Rent | $5,214,905 | $6,690,453 | $7,008,322 | $7,132,912 | $7,402,345 | (1) | $23.63 |
| Grossed Up Vacant Space | $0 | $0 | $0 | $0 | $715,170 | (2) | $2.28 |
| Gross Potential Rent | $5,214,905 | $6,690,453 | $7,008,322 | $7,132,912 | $8,117,515 | $25.91 | |
| Other Income | $0 | $3,583 | $0 | $0 | $0 | $0.00 | |
| Percentage Rent | $101,001 | $244,433 | $788,829 | $818,054 | $582,959 | $1.86 | |
| Total Recoveries | $1,865,297 | $2,076,987 | $2,121,787 | $2,204,782 | $2,266,033 |
| $7.23 |
| Net Rental Income | $7,181,203 | $9,015,456 | $9,918,938 | $10,155,748 | $10,966,507 | $35.00 | |
| (Vacancy & Credit Loss) | $0 | $0 | ($0) | $0 | ($857,589) | (2) | ($2.74) |
| Effective Gross Income | $7,181,203 | $9,015,456 | $9,918,938 | $10,155,748 | $10,108,918 | $32.26 | |
| Real Estate Taxes | $983,433 | $1,007,887 | $987,923 | $989,808 | $982,302 | $3.14 | |
| Insurance | $80,172 | $145,530 | $151,520 | $151,604 | $151,604 | $0.48 | |
| Management Fee | $0 | $0 | $0 | $0 | $303,268 | $0.97 | |
| Other Operating Expenses | $1,553,187 | $1,683,323 | $1,883,747 | $1,979,796 | $1,973,151 |
| $6.30 |
| Total Operating Expenses | $2,616,792 | $2,836,740 | $3,023,190 | $3,121,208 | $3,410,324 | $10.88 | |
| Net Operating Income | $4,564,411(3) | $6,178,716(3) | $6,895,748(3) | $7,034,540 | $6,698,593 | $21.38 | |
| Replacement Reserves | $0 | $0 | $0 | $0 | $46,998 | $0.15 | |
| TI/LC | $0 | $0 | $0 | $0 | $138,317 |
| $0.44 |
| Net Cash Flow | $4,564,411 | $6,178,716 | $6,895,748 | $7,034,540 | $6,513,279 | $20.79 | |
| Occupancy % | 91.1% | 91.4% | 96.0% | 92.1%(4) | 89.4% | (2) | |
| NOI DSCR | 1.11x | 1.50x | 1.67x | 1.71x | 1.63x | ||
| NCF DSCR | 1.11x | 1.50x | 1.67x | 1.71x | 1.58x | ||
| NOI Debt Yield | 8.7% | 11.8% | 13.1% | 13.4% | 12.8% | ||
| NCF Debt Yield | 8.7% | 11.8% | 13.1% | 13.4% | 12.4% | ||
| (1) | UW Base Rent includes $44,345 of rent steps through May 2024. |
| (2) | The underwritten economic vacancy is 10.6% and the actual economic vacancy is 8.8%. The Shops at Riverwalk & River Walk Corporate Center Properties were 92.1% occupied as of April 30, 2023. |
| (3) | The increase in Net Operating Income from 2020 to 2021 and 2021 to 2022 was driven by 19 new and renewal leases (30.1% NRA; 40.8% of UW Base Rent) being signed between 2020 and 2022. |
| (4) | Represents occupancy as of April 30, 2023. |
| This is not a research report and was not prepared by any Underwriter’s research department. Please see additional important information and qualifications at the end of this Term Sheet. | ||
| T-80 | ||
| Various - Various | Loan #5 | Cut-off Date Balance: | $52,455,546 |
| Various | Shops at Riverwalk & River Walk Corporate Center | Cut-off Date LTV: | 44.2% |
| Bakersfield, CA 93311 | UW NCF DSCR: | 1.58x | |
| UW NOI Debt Yield: | 12.8% |
Escrows and Reserves.
Real Estate Taxes – The loan documents require an upfront deposit of $262,850 and ongoing monthly deposits of $87,616 for real estate taxes.
Insurance – The loan documents do not require ongoing monthly insurance reserves; provided (i) no event of default is continuing, (ii) the borrower maintains insurance coverage for the Shops at Riverwalk & River Walk Corporate Center Properties as part of blanket or umbrella coverage reasonably approved by the lender, and (iii) the borrower provides the lender with evidence of the renewals of the insurance policies and paid receipts for the payment of the insurance premiums no later than 10 business days prior to the expiration dates of the policies. If such conditions are not satisfied, the loan documents require ongoing monthly deposits in an amount equal to 1/12th of the insurance premiums that the lender reasonably estimates will be payable during the next ensuing 12 months.
Replacement Reserve – The loan documents require an upfront deposit of $120,764 and ongoing monthly deposits of $3,916 for replacements subject to a cap of $140,991.
Leasing Reserve – The loan documents require an upfront deposit of $1,750,000 and ongoing monthly deposits of $26,110 for tenant improvements and leasing commissions reserves, subject to a cap of $1,500,000.
Existing TI/LC Obligations Reserve – The loan documents require an upfront deposit of $75,678 for outstanding tenant improvements and leasing commissions related to Handel’s Homemade Ice Cream ($14,778), The Lovesac Company ($47,700), and Bath & Body Works ($13,200).
Rent Concession Reserve – The loan documents require an upfront deposit of $68,429 for certain future rent credits or abatements related to tenant Handel’s Homemade Ice Cream and The Lovesac Company.
Outparcel Development Reserve – Prior to the commencement of certain outparcel building work that may be effected by the borrower, the loan documents require the borrower to deposit an amount equal to $150,000, representing the estimated cost to demolish any partially completed improvements on the outparcels and return the property substantially to the condition it was in prior to the commencement of the outparcel tenant work.
Lockbox and Cash Management. The Shops at Riverwalk & River Walk Corporate Center Mortgage Loan is structured with a soft lockbox and springing cash management. The borrower and the property manager are required to deposit all rents into the lockbox account within three business days after receipt. Upon the occurrence of a Cash Trap Event Period (as defined below), the borrower is required to direct all tenants to deposit rents directly into the deposit account and a cash management account is required to be established into which all funds in the lockbox account will be required to be deposited. During the continuance of a Cash Trap Event Period, all funds in the cash management account are required to be disbursed in accordance with the cash management waterfall set forth in the loan documents, with any excess funds required to be held as additional security in an excess cash flow subaccount controlled by the lender for so long as the Cash Trap Event Period continues.
A “Cash Trap Event Period” will commence upon the earliest of the following:
| (i) | the occurrence of an event of default; |
| (ii) | the net cash flow debt service coverage ratio (“NCF DSCR”) falling below 1.15x (tested quarterly); or |
| (iii) | the occurrence of a Major Tenant Event Period (as defined below) with respect to two Major Tenants (as defined below). |
A Cash Trap Event Period will end upon the occurrence of the following:
| ● | with regard to clause (i), the cure of such event of default; |
| ● | with regard to clause (ii), the NCF DSCR being greater than or equal to 1.20x for two consecutive calendar quarters; or |
| ● | with regard to clause (iii), a Major Tenant Event Period Cure (as defined below) occurs with respect to one Major Tenant Event Period, so long as no other Major Tenant Event Period has occurred with respect to another Major Tenant (as defined below) and has not been cured. |
An “Major Tenant Event Period” will commence upon the occurrence of any of the following:
| (i) | if Nordstrom Rack, Sprouts Farmers Market, TJ Maxx, or any replacement tenant (each a “Major Tenant”) fails to exercise its renewal option on or before the deadline in its lease, which is 12 months prior to the expiration for Nordstrom Rack and 6 months prior to the expiration for Sprouts Farmers Market and TJ Maxx; |
| (ii) | a Major Tenant goes dark, vacates, or otherwise fails to occupy the entirety of its space or fails to be open during customary business hours (excluding temporary cessation due to renovations, repairs or due to a temporary pandemic-related closure); |
| (iii) | a Major Tenant files, as a debtor, or otherwise becomes involved in a bankruptcy or similar insolvency proceeding; or |
| (iv) | a Major Tenant terminates or cancels it lease (or the lease fails to be in effect). |
A “Major Tenant Event Period Cure” will commence upon the occurrence of any of the following:
| ● | with regard to clauses (i-iv), the lender has received evidence that all or substantially all of the applicable Major Tenant space is leased to one or more satisfactory replacement tenants, and each such tenant is in occupancy, open for business, paying full, unabated rent (or the amount of any abatement has been deposited with the lender), and all tenant improvement costs and leasing commissions have been paid (or a sufficient sum to pay the same has been deposited with the lender); |
| ● | with regard solely to clause (i), the date on which the lender receives satisfactory evidence that the Major Tenant has extended the term of its lease pursuant to the terms of its lease or on terms reasonably acceptable to the lender; |
| ● | with regard solely to clause (ii), the date when the Major Tenant has resumed its normal business operations in all or substantially all of its space for a period of three consecutive calendar months. |
| ● | with regard solely to clause (iii), the applicable Major Tenant’s bankruptcy or insolvency proceeding has been terminated in a manner reasonably acceptable to the lender; or |
| ● | with regard solely to clause (iv), the applicable Major Tenant withdraws in writing such termination or cancellation and has resumed its normal business operations in its space and is open for business during customary hours for three consecutive calendar months. |
| This is not a research report and was not prepared by any Underwriter’s research department. Please see additional important information and qualifications at the end of this Term Sheet. | ||
| T-81 | ||
| Various - Various | Loan #5 | Cut-off Date Balance: | $52,455,546 |
| Various | Shops at Riverwalk & River Walk Corporate Center | Cut-off Date LTV: | 44.2% |
| Bakersfield, CA 93311 | UW NCF DSCR: | 1.58x | |
| UW NOI Debt Yield: | 12.8% |
Additional Secured Indebtedness (not including trade debts). None.
Mezzanine Loan and Preferred Equity. None.
Release of Property. There are two unimproved, non-income producing parcels eligible for free release from the Shops at Riverwalk & River Walk Corporate Center Properties, the value of each of which was excluded from the appraised value, upon satisfaction of various conditions, including compliance with REMIC related conditions.
Right of First Offer/Right of First Refusal. None.
Ground Lease. None.
Letter of Credit. None.
Terrorism Insurance. The loan documents require that the “all risk” insurance policy required to be maintained by the borrower provides coverage for terrorism in an amount equal to the full replacement cost of the Shops at Riverwalk & River Walk Corporate Center Properties, as well as business interruption insurance covering no less than the 18-month period following the occurrence of a casualty event, together with a 6-month extended period of indemnity.
| This is not a research report and was not prepared by any Underwriter’s research department. Please see additional important information and qualifications at the end of this Term Sheet. | ||
| T-82 | ||
| Various – Various | Loan #6 | Cut-off Date Balance: | $52,200,000 |
| Various | ICP/IRG Holdings Portfolio | Cut-off Date LTV: | 58.5% |
| Various | UW NCF DSCR: | 1.39x | |
| UW NOI Debt Yield: | 10.7% |
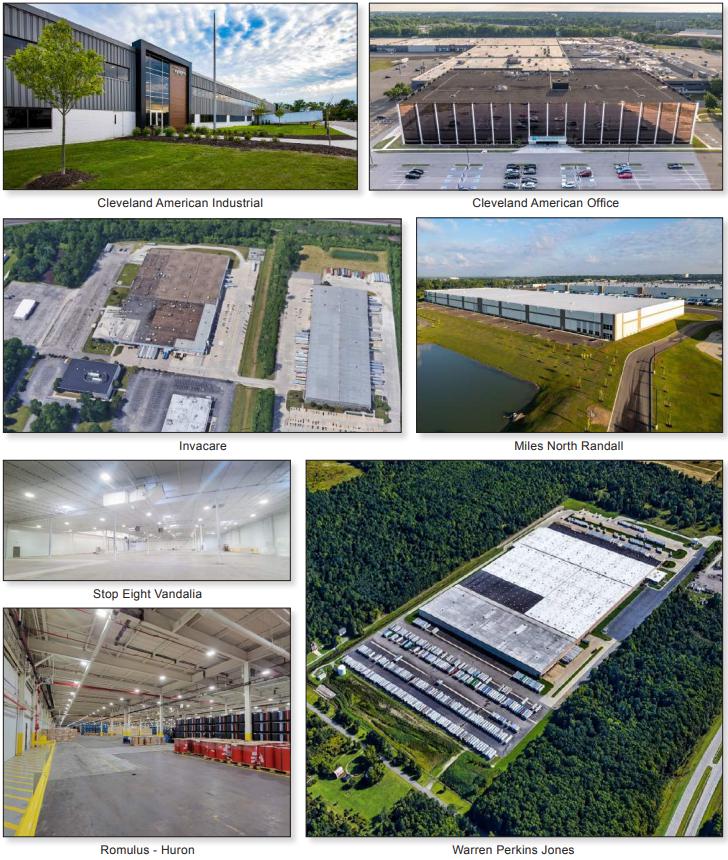
| This is not a research report and was not prepared by any Underwriter’s research department. Please see additional important information and qualifications at the end of this Term Sheet. | ||
| T-83 | ||
| Various – Various | Loan #6 | Cut-off Date Balance: | $52,200,000 |
| Various | ICP/IRG Holdings Portfolio | Cut-off Date LTV: | 58.5% |
| Various | UW NCF DSCR: | 1.39x | |
| UW NOI Debt Yield: | 10.7% |
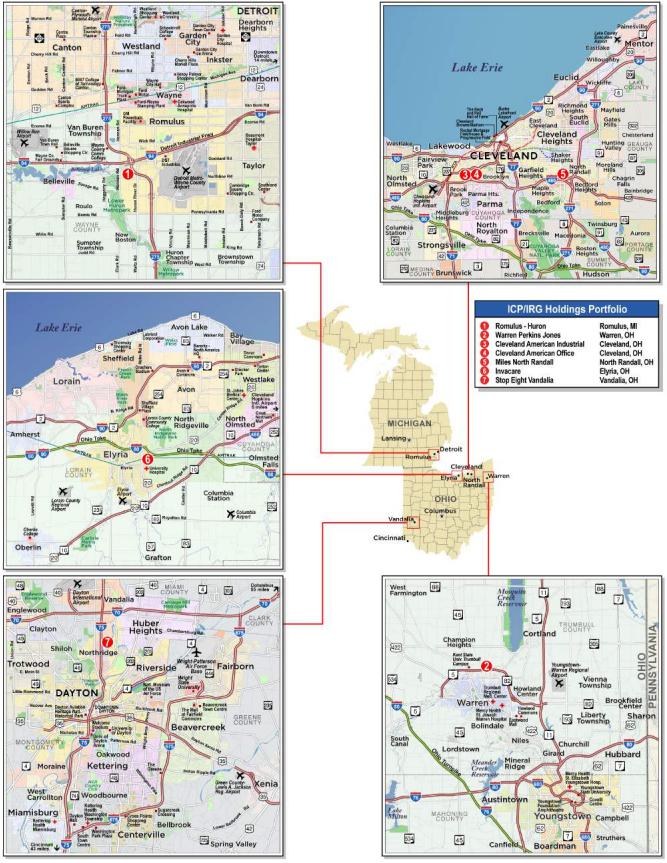
| This is not a research report and was not prepared by any Underwriter’s research department. Please see additional important information and qualifications at the end of this Term Sheet. | ||
| T-84 | ||
| Mortgage Loan No. 6 – ICP/IRG Holdings Portfolio |
| Mortgage Loan Information | Property Information | |||||
| Mortgage Loan Seller: | JPMCB | Single Asset/Portfolio: | Portfolio | |||
| Credit Assessment (Fitch/Moody’s/KBRA): | NR/NR/NR | Location: | Various | |||
| Original Balance(1): | $52,200,000 | General Property Type: | Various | |||
| Cut-off Date Balance(1): | $52,200,000 | Detailed Property Type: | Various | |||
| % of Initial Pool Balance: | 7.7% | Title Vesting: | Fee | |||
| Loan Purpose: | Refinance | Year Built/Renovated: | Various / Various | |||
| Borrower Sponsors: | Industrial Commercial Properties and | Size: | 4,662,982 SF | |||
| Industrial Realty Group | Cut-off Date Balance Per SF(1): | $39 | ||||
| Guarantors: | Holdings Ohio, LLC and Christopher | Maturity Date Balance Per SF(1): | $39 | |||
| Semarjian | Property Manager: | IRG Realty Advisors, LLC | ||||
| Mortgage Rate: | 7.3500% | (borrower-related) | ||||
| Note Date: | 4/20/2023 | |||||
| First Payment Date: | 6/1/2023 | |||||
| Maturity Date: | 5/1/2028 | |||||
| Original Term to Maturity: | 60 months | |||||
| Original Amortization Term: | 0 months | Underwriting and Financial Information | ||||
| IO Period: | 60 months | UW NOI: | $19,258,383 | |||
| Seasoning: | 2 months | UW NOI Debt Yield(1): | 10.7% | |||
| Prepayment Provisions: | L(24),YM1(2),DorYM1(28),O(6) | UW NOI Debt Yield at Maturity(1): | 10.7% | |||
| Lockbox/Cash Mgmt Status: | Hard/Springing | UW NCF DSCR(1): | 1.39x | |||
| Additional Debt Type(1)(2): | Pari Passu | Most Recent NOI: | $15,899,293 (1/31/2023 TTM) | |||
| Additional Debt Balance(1)(2): | $127,800,000 | 2nd Most Recent NOI: | $15,683,939 (12/31/2022) | |||
| Future Debt Permitted (Type): | No (NAP) | 3rd Most Recent NOI(5): | NAV | |||
| Reserves(3) | Most Recent Occupancy: | 94.2% (3/31/2023) | ||||
| Type | Initial | Monthly | Cap | 2nd Most Recent Occupancy: | 93.6% (12/31/2022) | |
| RE Tax: | $907,455 | $247,190 | NAP | 3rd Most Recent Occupancy(5): | NAV | |
| Insurance: | $0 | Springing | NAP | Appraised Value (as of): | $307,750,000 (Various) | |
| Replacement Reserve: | $0 | $58,287 | NAP | Appraised Value Per SF: | $66 | |
| TI/LC Reserve: | $3,000,000 | Springing | $1,830,000(4) | Cut-off Date LTV Ratio(1): | 58.5% | |
| Deferred Maintenance Reserve: | $851,224 | $0 | NAP | Maturity Date LTV Ratio(1): | 58.5% | |
| Sources and Uses | ||||||
| Sources | Proceeds | % of Total | Uses | Proceeds | % of Total | |
| Whole Loan Amount: | $180,000,000 | 100.0% | Existing Loan Payoff: | $132,024,335 | 73.3% | |
| Return of Equity: | $33,346,195 | 18.5% | ||||
| Closing Costs: | $9,870,791 | 5.5% | ||||
| Upfront Reserves: | $4,758,679 | 2.6% | ||||
| Total Sources: | $180,000,000 | 100.0% | Total Uses: | $180,000,000 | 100.0% | |
| (1) | The ICP/IRG Holdings Portfolio Mortgage Loan (as defined below) is part of the ICP/IRG Holdings Portfolio Whole Loan (as defined below), which is comprised of nine pari passu promissory notes with an aggregate original principal balance of $180,000,000. The Cut-off Date Balance Per SF, Maturity Date Balance Per SF, UW NOI Debt Yield, UW NOI Debt Yield at Maturity, UW NCF DSCR, Cut-off Date LTV Ratio and Maturity Date LTV Ratio presented above are based on the aggregate Cut-off Date principal balance of the ICP/IRG Holdings Portfolio Whole Loan. |
| (2) | See the “Mortgage Loan” and “Additional Secured Indebtedness (not including trade debts)” sections below for further discussion of additional mortgage debt. |
| (3) | See “Escrows and Reserves” below. |
| (4) | Excludes the initial deposit of $3,000,000. |
| (5) | Historical net operating income and occupancy prior to 2022 are not available as properties were in various stages of lease-up, renovation and re-positioning. |
The Mortgage Loan. The sixth largest mortgage loan (the “ICP/IRG Holdings Portfolio Mortgage Loan”) is part of a whole loan (the “ICP/IRG Holdings Portfolio Whole Loan”) comprised of nine pari passu promissory notes with an aggregate original principal balance of $180,000,000. The ICP/IRG Holdings Portfolio Whole Loan is secured by first priority mortgages encumbering the fee interests in a portfolio of six industrial properties and one office property totaling 4,662,982 SF located in Michigan and Ohio (each, individually, an “ICP/IRG Holdings Portfolio Individual Property”, and collectively, the “ICP/IRG Holdings Portfolio” or the “ICP/IRG Holdings Portfolio Properties”). The ICP/IRG Holdings Portfolio Whole Loan was co-originated by JPMorgan Chase Bank, National Association (“JPMCB”) and 3650 Real Estate Investment Trust 2 LLC (“3650 REIT”). The ICP/IRG Holdings Portfolio Mortgage Loan is comprised of the non-controlling notes A-2-B, A-2-C, A-2-D and A-2-E with an aggregate original principal balance of $52,200,000, which will be included in the BANK5 2023-5YR2 securitization trust. The remaining ICP/IRG Holdings Portfolio Whole Loan pari passu notes (the “ICP/IRG Holdings Portfolio Non-Serviced Pari Passu Companion Loans”) have been securitized or are currently held by 3650 REIT and are expected to be contributed to one or more future securitization transactions. The ICP/IRG Holdings Portfolio Whole Loan will be serviced pursuant to the pooling and servicing agreement for the Benchmark 2023-V2 trust. See “Description of the Mortgage Pool—The Whole Loans—The Non-Serviced Pari Passu Whole Loans” and “Pooling and Servicing Agreement—Servicing of the Non-Serviced Mortgage Loans” in the prospectus.
| This is not a research report and was not prepared by any Underwriter’s research department. Please see additional important information and qualifications at the end of this Term Sheet. | ||
| T-85 | ||
| Various – Various | Loan #6 | Cut-off Date Balance: | $52,200,000 |
| Various | ICP/IRG Holdings Portfolio | Cut-off Date LTV: | 58.5% |
| Various | UW NCF DSCR: | 1.39x | |
| UW NOI Debt Yield: | 10.7% |
| Whole Loan Summary | ||||
| Notes | Original Balance | Cut-off Date Balance | Note Holder | Controlling Piece |
| A-1-A-1 | $39,000,000 | $39,000,000 | Benchmark 2023-V2 | Yes |
| A-1-A-2 | $8,500,000 | $8,500,000 | 3650 REIT | No |
| A-1-B-1 | $30,000,000 | $30,000,000 | 3650 REIT | No |
| A-1-B-2 | $14,300,000 | $14,300,000 | 3650 REIT | No |
| A-2-A | $36,000,000 | $36,000,000 | Benchmark 2023-V2 | No |
| A-2-B | $3,200,000 | $3,200,000 | BANK5 2023-5YR2 | No |
| A-2-C | $25,000,000 | $25,000,000 | BANK5 2023-5YR2 | No |
| A-2-D | $15,000,000 | $15,000,000 | BANK5 2023-5YR2 | No |
| A-2-E | $9,000,000 | $9,000,000 | BANK5 2023-5YR2 | No |
| Total (Whole Loan) | $180,000,000 | $180,000,000 | ||
The Borrowers and the Borrower Sponsors. The borrowers are Holdings Cleveland American, LLC, Cleveland American, LLC, Miles North Randall, LLC, ICP Miles North Randall LLC, Stop Eight Vandalia LLC, SL Stop Eight Vandalia LLC, ICP Stop Eight Vandalia LLC, Holdings Warren Perkins Jones, LLC, ICP Warren Perkins Jones LLC, Holdings Romulus, LLC, Romulus Huron River Drive LLC, Elyria 1200 Taylor, LLC and ICP Elyria Taylor 1200 LLC, each a Delaware limited liability company structured to be a single purpose bankruptcy-remote entity having at least one independent director in its organizational structure. Legal counsel to the borrowers delivered a non-consolidation opinion in connection with the origination of the ICP/IRG Holdings Portfolio Whole Loan. The 13 borrowers own the ICP/IRG Holdings Portfolio Properties as follows: (i) the Romulus – Huron property is owned by Holdings Romulus, LLC and Romulus Huron River Drive LLC, as tenants in common; (ii) the Warren Perkins Jones property is owned by Holdings Warren Perkins Jones, LLC and ICP Warren Perkins Jones LLC, as tenants in common; (iii) the Cleveland American Industrial property is owned by Holdings Cleveland American, LLC and Cleveland American, LLC, as tenants in common; (iv) the Cleveland American Office property is owned by Holdings Cleveland American, LLC and Cleveland American, LLC, as tenants in common; (v) the Miles North Randall property is owned by Miles North Randall, LLC and ICP Miles North Randall LLC, as tenants in common; (vi) the Invacare property is owned by Elyria 1200 Taylor, LLC and ICP Elyria 1200 Taylor LLC, as tenants in common; and (vii) the Stop Eight Vandalia property is owned by Stop Eight Vandalia LLC, ICP Stop Eight Vandalia LLC, and SL Stop Eight Vandalia LLC, as tenants in common.
The borrower sponsors are Industrial Commercial Properties (“ICP”) and Industrial Realty Group (“IRG”). ICP is owned by Christopher Semarjian, who, together with Holdings Ohio, LLC, which is under the same common control with IRG, are the non-recourse carveout guarantors.
Founded in 1996, ICP is a real estate development company headquartered in Cleveland, Ohio, specializing in commercial and industrial rehabilitation, build-to-suits and economic redevelopment. ICP operates one of the largest privately-held commercial real estate portfolios in the United States. The portfolio’s diversity has expanded beyond its roots of industrial complexes, including former General Motors and Ford plants converted to multi-tenant industrial buildings and large-scale distribution centers. The portfolio now encompasses over 46.5 million SF of industrial and mixed-use developments, office parks, multi-family and repurposed shopping centers.
Founded in 1974, IRG is a nationwide real estate development and investment firm specializing in the acquisition, development and management of commercial and industrial real estate throughout the United States. IRG, through its affiliated partnerships and limited liability companies, operates a portfolio containing over 150 properties in 31 states with over 100 million SF of rentable space. The majority of the assets in IRG’s portfolio have been purchased below replacement cost permitting IRG to spend sufficient capital to modernize the existing facilities, while still being able to offer inexpensive leasing terms to tenants.
The Properties. The ICP/IRG Holdings Portfolio consists of six industrial properties and one single-tenant office property located across four Metropolitan Statistical Areas (“MSAs”) in Michigan and Ohio. The industrial properties in the ICP/IRG Holdings Portfolio are primarily comprised of multi-tenanted warehouse/distribution facilities. The ICP/IRG Holdings Portfolio Properties were constructed between 1956 and 2021 and the industrial properties have clear heights ranging from 19 feet to 44 feet. As of March 31, 2023, the ICP/IRG Holdings Portfolio was approximately 94.2% leased to a diverse array of 22 tenants with a weighted average remaining lease term of approximately 6.4 years.
The ICP/IRG Holdings Portfolio Properties were acquired via opportunistic value-add opportunities with sponsorship having subsequently invested significant capital in the renovation and repositioning of individual assets, ultimately driving increased occupancy and rents. In total, the ICP/IRG Holdings Portfolio Properties have benefited from approximately $57.7 million of capital expenditures since being acquired by the borrower sponsors. Capital expenditure projects on the ICP/IRG Holdings Portfolio Properties included roof and façade replacement, modernization for multi-tenant use, LED light installation, tenant buildouts, parking lot replacement and the addition of dock doors. In certain instances, the borrower sponsors took possession of under-utilized, single-tenant or entirely vacant properties, in each case repositioning the assets. The borrowers executed 17 leases totaling 1,829,315 SF over the preceding three years, indicating healthy demand for warehouse/distribution product at the related price point within their respective markets. Recent renovation, repositioning and re-tenanting has resulted in an approximately $8.0 million increase in base rent.
| This is not a research report and was not prepared by any Underwriter’s research department. Please see additional important information and qualifications at the end of this Term Sheet. | ||
| T-86 | ||
| Various – Various | Loan #6 | Cut-off Date Balance: | $52,200,000 |
| Various | ICP/IRG Holdings Portfolio | Cut-off Date LTV: | 58.5% |
| Various | UW NCF DSCR: | 1.39x | |
| UW NOI Debt Yield: | 10.7% |
The following table presents certain information relating to the individual ICP/IRG Holdings Portfolio Properties:
| Portfolio Summary | |||||||||
Property Name City, State | Property Subtype | Year Built / Renovated | GLA | Allocated Mortgage Loan Cut-off Date Balance | % of Allocated Mortgage Loan Cut-off Date Balance | Appraised Value | % of Appraised Value | UW NCF | % of UW NCF |
Romulus – Huron Romulus, MI | Manufacturing/ Warehouse | 1956 / NAP | 1,112,004 | $13,311,000 | 25.5% | $70,700,000 | 23.0% | $4,261,550 | 22.9% |
Warren Perkins Jones Warren, OH | Warehouse/ Distribution | 1982 / 2022 | 1,365,535 | $11,745,000 | 22.5% | $60,900,000 | 19.8% | $4,210,462 | 22.6% |
Cleveland American Industrial Cleveland, OH | Warehouse/ Distribution | 1978 / 2022 | 1,142,265 | $8,874,000 | 17.0% | $65,800,000 | 21.4% | $4,431,158 | 23.8% |
Cleveland American Office Cleveland, OH | (Office)/ Suburban | 1978 / 2020 | 344,355 | $7,569,000 | 14.5% | $46,600,000 | 15.1% | $2,955,777 | 15.9% |
Miles North Randall North Randall, OH | Warehouse/ Distribution | 2021 / NAP | 302,400 | $6,786,000 | 13.0% | $39,000,000 | 12.7% | $937,017 | 5.0% |
Invacare(1) Elyria, OH | Flex | 1972 / 2013 | 301,000 | $3,132,000 | 6.0% | $20,600,000 | 6.7% | $1,534,365 | 8.2% |
Stop Eight Vandalia Vandalia, OH | Warehouse/ Distribution | 1970 / 2020 | 95,423 | $783,000 | 1.5% | $4,150,000 | 1.3% | $310,292 | 1.7% |
| Total | 4,662,982 | $52,200,000 | 100.0% | $307,750,000 | 100.0% | $18,640,621 | 100.0% | ||
| (1) | Invacare Corporation and two affiliated companies filed for Chapter 11 bankruptcy in January 2023 in the United States Bankruptcy Court for the Southern District of Texas. Subsequently, the borrower and Invacare Corporation executed the Amended Lease (as defined below) expiring in April 2028 (the prior lease was scheduled to expire in April 2035), requiring base rent of approximately $1,505,000 (subject to consumer price index (“CPI”) based adjustments). UW NCF for the Invacare property is based on the Original Invacare Corporation Lease (as defined below), and the obligations under the Original Invacare Corporation Lease are covered under the Payment Guaranty (as defined below), including any amounts of rental payments under the Original Invacare Corporation Lease exceeding those rental payments required under the Amended Lease. See “—Payment Guaranty” below. |
Romulus – Huron (25.5% of Allocated Whole Loan Cut-off Date Balance): The Romulus – Huron property is an industrial manufacturing/warehouse property located in Romulus, Michigan. The borrower sponsors acquired the property in 2015 and invested approximately $3.4 million in capital expenditures between 2017 and 2022, adding 10 dock doors and installing a new sprinkler system. The borrower sponsors were able to significantly increase property-level NOI via accretive leasing to Renaissance (as defined below). The largest tenant at the Romulus – Huron property based on underwritten base rent, Renaissance Global Logistics, LLC (“Renaissance”) (826,604 SF; 17.7% of portfolio NRA; 15.0% of portfolio UW Base Rent), executed three triple net leases between 2021 and 2022. Renaissance is a supply chain and logistics solution provider specializing in warehousing and value-add services. Founded in 1998 as a global export operation, Renaissance is a subsidiary of James Group International, a privately-held, minority-owned leading global provider of logistics, supply chain management and e-commerce services. In addition to Renaissance, James Group International has two other subsidiaries: Five Crowns Trucking, which offers freight transportation services to customers, and Magnolia Automotive Services, a partnership with Toyota providing subassembly, sequencing and inventory management. In 2021, James Group International was ranked as the 18th largest minority-owned business in Detroit by a Detroit business publication. Renaissance has no renewal options and no termination options.
Warren Perkins Jones (22.5% of Allocated Whole Loan Cut-off Date Balance): The Warren Perkins Jones property is an industrial warehouse/distribution property located in Warren, Ohio. The borrower sponsors acquired the Warren Perkins Jones property in 2019 and spent approximately $10.5 million on capital expenditures to modernize the Warren Perkins Jones property for multi-tenant use, add 19 additional dock doors and install LED lighting. The largest tenant at the Warren Perkins Jones property based on underwritten base rent, The Step2 Company, LLC (“Step2”) (586,000 SF; 12.6% of portfolio NRA; 10.3% of portfolio UW Base Rent), became one of four tenants at the Warren Perkins Jones property after executing its 10.5-year lease in October 2019. Step2 is the largest American manufacturer of preschool and toddler toys and the world's largest rotational molder of plastics. Founded in 1991 with just five employees, Step2 has since grown to become an international business with 800+ full-time employees. Step2 has two large U.S. manufacturing plants in northern Ohio, one in Streetsboro and one in Perrysville. Step2 products are distributed to select retailers throughout the U.S., Canada, and over 70 other countries. Step2 has two, five-year renewal options remaining and a termination option with respect to any additionally leased Increments (as defined below).
Cleveland American Industrial and Cleveland American Office (collectively, 31.5% of Allocated Whole Loan Cut-off Date Balance): The Cleveland American Industrial and Cleveland American Office properties are located in Cleveland, Ohio and are directly adjacent to each other. The borrower sponsors acquired the properties from American Greetings in 2014. American Greetings was the sole occupant but had indicated it would be vacating the space as part of a near term consolidation strategy. The borrower sponsors subsequently invested approximately $41.8 million in capital expenditures to renovate the properties and convert/re-position the industrial component for multi-tenant use. Renovations were targeted towards general modernization, including roof and façade replacement, landscaping and tenant buildouts. The largest tenant based on underwritten base rent between both properties, Medical Mutual of Ohio (“Medical Mutual”) (354,822 SF; 7.6% of portfolio NRA; 15.1% of portfolio UW Base Rent), became the sole tenant in the Cleveland American Office property after executing a 16-year lease in May 2018. As an indication of its commitment to the space, Medical Mutual contributed approximately $44 PSF towards the buildout of its leased space, in addition to $42 PSF in borrower sponsor-funded tenant improvements. Medical Mutual is the oldest and largest health insurance company in Ohio, serving approximately 1.5 million members across the state. Founded in 1934 and based in Cleveland, Ohio, Medical Mutual employs approximately 2,800 people. The Medical Mutual network includes over 43,000 providers and 99% of Ohio hospitals. Medical Mutual has three, five-year renewal options remaining and no termination options.
| This is not a research report and was not prepared by any Underwriter’s research department. Please see additional important information and qualifications at the end of this Term Sheet. | ||
| T-87 | ||
| Various – Various | Loan #6 | Cut-off Date Balance: | $52,200,000 |
| Various | ICP/IRG Holdings Portfolio | Cut-off Date LTV: | 58.5% |
| Various | UW NCF DSCR: | 1.39x | |
| UW NOI Debt Yield: | 10.7% |
| Tenant Summary(1) | ||||||||||
| Tenant Name | Property | Credit Ratings (Moody’s/S&P/Fitch)(2) | Tenant SF | Approx. % of SF | Annual UW Base Rent(3) | % of Total Annual UW Base Rent(3) | Annual UW Base Rent PSF(3) | Lease Expiration | Termination Option (Y/N) | Renewal Options |
| Medical Mutual of Ohio(4) | Cleveland American Office | NR/NR/NR | 354,822 | 7.6% | $3,120,282 | 15.1% | $8.79 | 12/31/2035 | N | 3 x 5 yr |
| Renaissance Global Logistics, LLC(5) | Romulus – Huron | NR/NR/NR | 826,604 | 17.7% | $3,106,898 | 15.0% | $3.76 | Various | N | None |
| The Step2 Company, LLC(6) | Warren Perkins Jones | NR/NR/NR | 586,000 | 12.6% | $2,123,470 | 10.3% | $3.62 | 11/3/2030 | Y | 2 x 5 yr |
| Invacare Corporation(7) | Invacare | NR/NR/NR | 301,000 | 6.5% | $1,567,548 | 7.6% | $5.21 | 4/30/2035 | N | None |
| Home Depot U.S.A., Inc.(8) | Romulus – Huron | A2/A/A | 285,400 | 6.1% | $1,461,248 | 7.1% | $5.12 | 1/31/2025 | Y | 1 x 5 yr |
| Pipeline Packaging Co. | Miles North Randall | NR/NR/NR | 207,132 | 4.4% | $1,325,645 | 6.4% | $6.40 | 4/30/2029 | N | 2 x 5 yr |
| Inogen, Inc(9) | Cleveland American Industrial | NR/NR/NR | 93,634 | 2.0% | $1,223,029 | 5.9% | $13.06 | 9/30/2024 | N | 1 x 5 yr |
| The HC Companies, Inc. | Warren Perkins Jones | NR/NR/NR | 413,395 | 8.9% | $1,136,837 | 5.5% | $2.75 | 5/31/2030 | N | 1 x 5 yr |
| Hemasource, Inc. | Warren Perkins Jones | NR/NR/NR | 187,267 | 4.0% | $915,736 | 4.4% | $4.89 | 12/31/2033 | N | 2 x 5 yr |
| Berk Enterprises | Warren Perkins Jones | NR/NR/NR | 169,139 | 3.6% | $784,805 | 3.8% | $4.64 | 10/31/2025 | N | 1 x 5 yr |
| Ten Largest Tenants | 3,424,393 | 73.4% | $16,765,498 | 81.0% | $4.90 | |||||
| Remaining Occupied Tenants | 968,979 | 20.8% | $3,944,038 | 19.0% | $4.07 | |||||
| Total Occupied | 4,393,372 | 94.2% | $20,709,536 | 100.0% | $4.71 | |||||
| Vacant | 269,610 | 5.8% | ||||||||
| Total / Wtd. Avg. | 4,662,982 | 100.0% | ||||||||
| (1) | Based on the underwritten rent roll dated March 31, 2023. |
| (2) | In some instances, ratings provided are those of the parent company of the entity shown, whether or not the parent company guarantees the lease. |
| (3) | Annual UW Base Rent, % of Total Annual UW Base Rent and Annual UW Base Rent PSF are inclusive of contractual rent steps totaling $374,463 underwritten through April 2024. |
| (4) | Medical Mutual of Ohio is the sole tenant at the Cleveland American Office property and is also one of the tenants at the Cleveland American Industrial property. |
| (5) | Renaissance has various Lease Expiration dates, including (i) 370,514 SF expiring in August 2025, (ii) 185,870 SF expiring in October 2026 and (iii) 270,220 SF expiring in January 2027. Renaissance has no remaining termination options. |
| (6) | The Step2 Company, LLC has the option to exclusively lease additional space at the Warren Perkins Jones property in increments of at least 25,000 SF (each, an “Increment”), subject to the terms of its lease. In connection with the exercise of such option, both the landlord and tenant each have the right to terminate the lease up to 225,000 SF leased to The Step2 Company, LLC upon 30 days prior written notice, and the portion of the Increments so terminated, but no other portion of the leased premises, will expire on the last day of such 30 day period, provided, however, that the terminating party must terminate in increments of at least 25,000 SF of space. |
| (7) | Invacare Corporation and two affiliated companies filed for Chapter 11 bankruptcy in January 2023 in the United States Bankruptcy Court for the Southern District of Texas. Subsequently, the borrower and Invacare Corporation executed an amended and restated lease expiring in April 2028 (the prior lease was scheduled to expire in April 2035), requiring a base of approximately $1,505,000 (subject to CPI based adjustments). Under the Amended Lease, Invacare has the option to terminate its lease with respect to 50,000 SF (accounting for approximately 16.6% of the base rent under the terms of the Amended Lease) with 60 days’ notice. UW NCF for the Invacare property is based on the Original Invacare Corporation Lease, and the obligations under the Original Invacare Corporation Lease are covered under the Payment Guaranty, including any amounts under the Original Invacare Corporation Lease exceeding those required under the Amended Lease. See “—Payment Guaranty” below. |
| (8) | Home Depot U.S.A., Inc. has the right to terminate its lease with 30 days’ notice if it is required during the last two years of its lease term (or any extension of the lease term, if applicable) by applicable legal requirements to make alterations to or modifications of its space reasonably estimated to cost in excess of $100,000. |
| (9) | Inogen, Inc uses its leased space at the Cleveland American Industrial property for office use. |
| This is not a research report and was not prepared by any Underwriter’s research department. Please see additional important information and qualifications at the end of this Term Sheet. | ||
| T-88 | ||
| Various – Various | Loan #6 | Cut-off Date Balance: | $52,200,000 |
| Various | ICP/IRG Holdings Portfolio | Cut-off Date LTV: | 58.5% |
| Various | UW NCF DSCR: | 1.39x | |
| UW NOI Debt Yield: | 10.7% |
The following table presents certain information relating to the lease rollover at the ICP/IRG Holdings Portfolio Properties:
| Lease Rollover Schedule(1)(2) | ||||||||
| Year | # of Leases Rolling | SF Rolling | Annual UW Rent PSF Rolling | Approx. % of Total SF Rolling | Approx. Cumulative % of SF Rolling | Total UW Rent Rolling | Approx. % of Total Rent Rolling | Approx. Cumulative % of Total Rent Rolling |
| MTM & 2023 | 1 | 23,016 | $3.27 | 0.5% | 0.5% | $75,262 | 0.4% | 0.4% |
| 2024 | 2 | 184,080 | $7.63 | 3.9% | 4.4% | $1,403,921 | 6.8% | 7.1% |
| 2025 | 8 | 1,209,068 | $4.18 | 25.9% | 30.4% | $5,051,173 | 24.4% | 31.5% |
| 2026 | 1 | 185,870 | $3.79 | 4.0% | 34.4% | $704,447 | 3.4% | 34.9% |
| 2027 | 2 | 370,993 | $4.02 | 8.0% | 42.3% | $1,491,731 | 7.2% | 42.1% |
| 2028 | 0 | 0 | $0.00 | 0.0% | 42.3% | $0 | 0.0% | 42.1% |
| 2029 | 2 | 272,284 | $6.06 | 5.8% | 48.2% | $1,648,708 | 8.0% | 50.1% |
| 2030 | 3 | 1,066,644 | $3.35 | 22.9% | 71.0% | $3,568,980 | 17.2% | 67.3% |
| 2031 | 1 | 118,904 | $4.26 | 2.5% | 73.6% | $506,052 | 2.4% | 69.8% |
| 2032 | 1 | 38,706 | $5.88 | 0.8% | 74.4% | $227,591 | 1.1% | 70.9% |
| 2033 | 2 | 237,619 | $5.15 | 5.1% | 79.5% | $1,223,895 | 5.9% | 76.8% |
| 2034 & Thereafter(3) | 3 | 686,188 | $7.01 | 14.7% | 94.2% | $4,807,776 | 23.2% | 100.0% |
| Vacant | 0 | 269,610 | $0.00 | 5.8% | 100.0% | $0 | 0.0% | 100.0% |
| Total/Wtd. Avg.(4) | 26 | 4,662,982 | $4.71 | 100.0% | $20,709,536 | 100.0% | ||
| (1) | Information is based on the underwritten rent roll dated as of March 31, 2023. |
| (2) | Certain tenants may have lease termination options that are exercisable prior to the stated expiration date of the subject lease or leases which are not considered in the lease rollover schedule. |
| (3) | 2034 & Thereafter is inclusive of Invacare based on the terms of the Original Invacare Corporation Lease, the terms of which are covered under the Payment Guaranty. |
| (4) | Total/Wtd. Avg. Annual UW Rent PSF Rolling excludes vacant space. |
The Market. The ICP/IRG Holdings Portfolio is located across four different MSAs in Michigan and Ohio. The following highlights key statistics for each relevant market. In aggregate, weighted average in-place rents of $4.63 PSF are approximately 5.5% below market as compared to the appraisal weighted average portfolio concluded market rent of $4.90 PSF.
Cleveland - OH (50.5% of Allocated Whole Loan Cut-off Date Balance): According to the appraisal, the Cleveland - OH Warehouse Market had approximately 352.8 million SF of inventory, 95.8% occupancy and average asking rent of $5.66 PSF as of the second quarter of 2022. According to the appraisal, market conditions in the local industrial sector remain favorable with vacancy rates holding steady and market rents continuing to increase.
According to the appraisal, the Cleveland - OH Office Market had approximately 108.5 million SF of inventory, 91.9% occupancy and average asking rent of $19.18 PSF as of the second quarter of 2022. According to the appraisal, the office property is well located and in proximity to both employment centers and major demand generators, allowing it to remain in a competitive position in the market.
Detroit - MI (25.5% of Allocated Whole Loan Cut-off Date Balance): According to the appraisal, the Detroit - MI Warehouse Market had approximately 615.4 million SF of inventory, 95.5% occupancy and average asking rent of $8.15 PSF as of the second quarter of 2022. The market is currently experiencing high occupancy levels, and while new construction has increased, a good portion is owner/user related and speculative construction is experiencing good absorption.
Youngstown - OH (22.5% of Allocated Whole Loan Cut-off Date Balance): According to the appraisal, the Youngstown - OH Warehouse Market had approximately 70.1 million SF of inventory, 94.5% occupancy and average asking rent of $4.64 PSF as of the second quarter of 2022. Market conditions in the local industrial sector remain favorable with vacancy rates holding steady and market rents continuing to increase.
Dayton - OH (1.5% of Allocated Whole Loan Cut-off Date Balance): According to the appraisal, the Dayton - OH Warehouse Market had approximately 111.6 million SF of inventory, 96.0% occupancy and average asking rent of $5.38 PSF as of the second quarter of 2022.
| This is not a research report and was not prepared by any Underwriter’s research department. Please see additional important information and qualifications at the end of this Term Sheet. | ||
| T-89 | ||
| Various – Various | Loan #6 | Cut-off Date Balance: | $52,200,000 |
| Various | ICP/IRG Holdings Portfolio | Cut-off Date LTV: | 58.5% |
| Various | UW NCF DSCR: | 1.39x | |
| UW NOI Debt Yield: | 10.7% |
Operating History and Underwritten Net Cash Flow. The following table presents certain information relating to the historical operating performance and the Underwritten Net Cash Flow at the ICP/IRG Holdings Portfolio:
| Cash Flow Analysis(1)(2) | ||||
| 2022 | TTM 1/31/2023 | UW | UW PSF | |
| Base Rent(3) | $18,800,560 | $18,942,689 | $20,709,516 | $4.44 |
| Vacant Income | $0 | $0 | $1,478,785 | $0.32 |
| Gross Potential Rent | $18,800,560 | $18,942,689 | $22,188,301 | $4.76 |
| Reimbursements | $6,528,362 | $6,623,044 | $7,818,554 | $1.68 |
| Gross Potential Income | $25,328,922 | $25,565,733 | $30,006,855 | $6.44 |
| Vacancy / Credit Loss | $0 | $0 | ($2,134,964) | ($0.46) |
| Storage Income | $102,557 | $101,667 | $201,150 | $0.04 |
| Effective Gross Income | $25,431,479 | $25,667,400 | $28,073,041 | $6.02 |
| Total Expenses | $9,747,541 | $9,768,107 | $8,814,659 | $1.89 |
| Net Operating Income | $15,683,939 | $15,899,293 | $19,258,383 | $4.13 |
| TI/LC | $0 | $0 | $107,889 | $0.02 |
| Capital Expenditures | $0 | $0 | $509,872 | $0.11 |
| Net Cash Flow(4) | $15,683,939 | $15,899,293 | $18,640,621 | $4.00 |
| Occupancy %(5)(6) | 93.6% | 94.2% | 92.9% | |
| NOI DSCR(7) | 1.17x | 1.19x | 1.44x | |
| NCF DSCR(7) | 1.17x | 1.19x | 1.39x | |
| NOI Debt Yield(7) | 8.7% | 8.8% | 10.7% | |
| NCF Debt Yield(7) | 8.7% | 8.8% | 10.4% | |
| (1) | Certain items such as interest expense, interest income, lease cancellation income, depreciation, amortization, debt service payments and any other non-recurring items were excluded from the historical presentation and are not considered for the underwritten cash flow. |
| (2) | Historical net operating income and occupancy prior to 2022 is not available as properties were in various stages of lease-up, renovation and re-positioning. |
| (3) | UW Base Rent is based on the in-place rent roll dated March 31, 2023 and inclusive of contractual rent steps through April 2024, totaling approximately $374,463. |
| (4) | The increase in UW Net Cash Flow from 2022 Net Cash Flow is primarily attributable to significant renovation, repurposing and lease-up of the ICP/IRG Holdings Portfolio Properties resulting in approximately 657,218 SF in new leasing, as well as the associated burn-off of free rent. |
| (5) | TTM 1/31/2023 Occupancy % is based on the underwritten rent roll dated March 31, 2023. |
| (6) | UW Occupancy % represents economic occupancy. |
| (7) | Debt service coverage ratios and debt yields are based upon the aggregate balance of the ICP/IRG Holdings Portfolio Whole Loan. |
Escrows and Reserves. At loan origination, the borrowers deposited (i) $3,000,000 into a TI/LC reserve, (ii) $907,455 into a real estate tax reserve and (iii) $851,224 into a required repairs reserve.
Real Estate Taxes – On each monthly due date, the borrowers are required to deposit an amount equal to 1/12 of the estimated annual real estate taxes (initially $247,190) into the tax reserve account.
Insurance – On each monthly due date, the borrowers are required to deposit an amount equal to 1/12 of estimated insurance premiums into the insurance reserve account; provided, however, such insurance reserve has been conditionally waived so long as (i) the borrowers maintain a blanket policy in accordance with the ICP/IRG Holdings Portfolio Whole Loan documents and (ii) no event of default under the ICP/IRG Holdings Portfolio Whole Loan documents is continuing.
Replacement Reserves – On each monthly due date, the borrowers are required to deposit $58,287 into a replacement reserve.
TI/LC Reserves – On each monthly due date during the continuance of Cash Sweep Event (as defined below), the borrowers are required to deposit $116,575 into a TI/LC reserve, subject to a cap of $1,830,000 (excluding the initial deposit of $3,000,000).
Lockbox and Cash Management. The ICP/IRG Holdings Portfolio Whole Loan is structured with a hard lockbox and springing cash management. All funds in the lockbox accounts will be swept to an account designated by the borrower, unless a Cash Sweep Event is continuing, in which case such funds are required to be swept on each business day into a cash management account controlled by the lender, at which point, following payment of taxes and insurance, bank fees, debt service, required reserves and operating expenses, all funds are required to be deposited into an excess cash flow reserve (the “Excess Cash Flow”), except during the continuance of a Lease Sweep Period (as defined below), during which the Excess Cash Flow is required to be deposited into a lease sweep reserve, to be held by the lender as additional security for the ICP/IRG Holdings Portfolio Whole Loan and disbursed in accordance with the terms of the ICP/IRG Holdings Portfolio Whole Loan documents.
A “Cash Sweep Event” means (a) an event of default, (b) the bankruptcy or insolvency of any of the borrowers or the property manager, (c) if the debt service coverage ratio based on a trailing three-month period for the ICP/IRG Holdings Portfolio Whole Loan falls below 1.10x or (d) the commencement of a Lease Sweep Period.
A Cash Sweep Event may be cured upon the occurrence of the following: (i) with respect to clause (a) above, the acceptance by the lender of a cure of such event of default in accordance with the ICP/IRG Holdings Portfolio Whole Loan documents, (ii) with respect to clause (b) above solely with respect
| This is not a research report and was not prepared by any Underwriter’s research department. Please see additional important information and qualifications at the end of this Term Sheet. | ||
| T-90 | ||
| Various – Various | Loan #6 | Cut-off Date Balance: | $52,200,000 |
| Various | ICP/IRG Holdings Portfolio | Cut-off Date LTV: | 58.5% |
| Various | UW NCF DSCR: | 1.39x | |
| UW NOI Debt Yield: | 10.7% |
to the property manager, if the applicable individual borrower replaces such property manager with a “qualified manager” (as fully described in the ICP/IRG Holdings Portfolio Whole Loan documents) under a replacement management agreement acceptable to the lender within 60 days, (iii) with respect to clause (c) above, (x) if the debt service coverage ratio based on the trailing three-month period immediately preceding the date of such determination for one calendar quarter is not less than 1.10x or (y) the borrowers deliver to the lender cash or a letter of credit in an amount which, when applied to the outstanding principal balance of the ICP/IRG Holdings Portfolio Whole Loan, would be sufficient to achieve the applicable debt service coverage ratio required under the ICP/IRG Holdings Portfolio Whole Loan documents, or (iv) with respect to clause (d) above, the Lease Sweep Period has ended; provided, however, (A) no event of default has occurred and is continuing under the ICP/IRG Holdings Portfolio Whole Loan documents, (B) a Cash Sweep Event cure described in clauses (i) and (ii) above may occur no more than a total of four times in the aggregate during the term of the loan ICP/IRG Holdings Portfolio Whole Loan, (C) the borrowers have paid all of the lender’s reasonable expenses incurred in connection with such Cash Sweep Event cure including reasonable attorney’s fees and expenses, and (D) in no event may the borrowers cure a Cash Sweep Event caused by a bankruptcy action of any of the borrowers.
A “Lease Sweep Period” will commence on the first monthly due date following the occurrence of any of the following: (i) with respect to the lease for Medical Mutual of Ohio, the largest tenant by UW Base Rent, or its replacement, as more fully described in the ICP/IRG Holdings Portfolio Whole Loan documents (each such lease, a “Lease Sweep Lease”), the earlier to occur of (A) 12 months prior to the earliest stated expiration of a Lease Sweep Lease; or (B) upon the date required under a Lease Sweep Lease by which the tenant thereunder is required to give notice of its exercise of a renewal option thereunder, (ii) the date that a Lease Sweep Lease is surrendered, cancelled or terminated prior to its then current expiration date or the receipt by any borrower or the property manager of notice from any tenant under a Lease Sweep Lease of its intent to surrender, cancel or terminate such Lease Sweep Lease, (iii) the date that any tenant under a Lease Sweep Lease “goes dark” at its premises (the “Lease Sweep Space”) at the applicable ICP/IRG Holdings Portfolio Individual Property or gives notice that it intends to discontinue its business at its Lease Sweep Space at the applicable ICP/IRG Holdings Portfolio Individual Property, (iv) upon a default under a Lease Sweep Lease by the tenant thereunder beyond any applicable notice and cure period; or (v) the occurrence of a bankruptcy or insolvency of any tenant or its direct or indirect parent company (if any) under a Lease Sweep Lease.
A Lease Sweep Period will end if: (a) in the case of clauses (i), (ii), and (iii) above, the entirety of the Lease Sweep Space is leased pursuant to an Acceptable Replacement Lease (as defined below) and, in the lender’s judgment, sufficient funds have been accumulated in the lease sweep reserve (during the continuance of the subject Lease Sweep Period) to cover all anticipated approved Lease Sweep Space leasing expenses, free rent periods, and/or rent abatement periods set forth in all such Acceptable Replacement Lease(s) and any shortfalls in required payments under the ICP/IRG Holdings Portfolio Whole Loan documents or operating expenses as a result of any anticipated down time prior to the commencement of payments under such Acceptable Replacement Lease; (b) in the case of clause (i) (B) above, the date on which the subject tenant under the Lease Sweep Lease irrevocably exercises its renewal or extension option with respect to all of its Lease Sweep Space, and in the lender’s judgment, sufficient funds have been accumulated in the lease sweep reserve (during the continuance of the subject Lease Sweep Period) to cover all anticipated Lease Sweep Space leasing expenses approved by the lender, free rent periods and/or rent abatement periods in connection with such renewal or extension; (c) in the case of clause (iv) above, the date on which the subject default has been cured, and no other default under such Lease Sweep Lease occurs for a period of six consecutive months following such cure; and (d) in the case of clause (v) above, either (a) the applicable bankruptcy or insolvency proceeding has terminated and the applicable Lease Sweep Lease has been affirmed, assumed or assigned in a manner reasonably satisfactory to the lender or (b) the applicable Lease Sweep Lease has been assumed and assigned to a third party in a manner reasonably satisfactory to the lender.
Additional Secured Indebtedness (not including trade debts). In addition to the ICP/IRG Holdings Portfolio Mortgage Loan, the ICP/IRG Holdings Portfolio Properties also secure the ICP/IRG Holdings Portfolio Non-Serviced Pari Passu Companion Loans, which have an aggregate Cut-off Date principal balance of $127,800,000. The ICP/IRG Holdings Portfolio Non-Serviced Pari Passu Companion Loans accrue interest at the same rate as the ICP/IRG Holdings Portfolio Mortgage Loan. The ICP/IRG Holdings Portfolio Mortgage Loan is entitled to payments of principal and interest on a pro rata and pari passu basis with the ICP/IRG Holdings Portfolio Non-Serviced Pari Passu Companion Loans. The holders of the ICP/IRG Holdings Portfolio Mortgage Loan and the ICP/IRG Holdings Portfolio Non-Serviced Pari Passu Companion Loans have entered into a co-lender agreement which sets forth the allocation of collections on the ICP/IRG Holdings Portfolio Whole Loan. See “Description of the Mortgage Pool—The Whole Loans—The Non-Serviced Pari Passu Whole Loans” in the prospectus.
Mezzanine Loan and Preferred Equity. None permitted.
Release of Property. From and after (a) a Payment Guaranty Release Event (as defined below) and (b) (i) the second anniversary of the first monthly due date, if the borrowers have elected to prepay the ICP/IRG Holdings Portfolio Whole Loan or (ii) the date that is the earlier of (x) two years from the closing date of the securitization REMIC trust which holds the portion of the ICP/IRG Holdings Portfolio Whole Loan note last to be securitized and (y) the third anniversary of the first monthly due date, if the borrowers have elected to defease the ICP/IRG Holdings Portfolio Whole Loan, in connection with the release of an ICP/IRG Holdings Portfolio Individual Property, and provided that no event of default or Cash Sweep Event is continuing, the borrowers may obtain the release of an ICP/IRG Holdings Portfolio Individual Property upon the satisfaction of certain conditions, including, but not limited to, the following: (i) the amount of the outstanding principal balance of the ICP/IRG Holdings Portfolio Whole Loan to be defeased or prepaid equals or exceeds 115% of the loan amount allocated to the ICP/IRG Holdings Portfolio Individual Property being released, (ii) subsequent to such release, each borrower continues to be a special purpose entity pursuant to, and in accordance with, the ICP/IRG Holdings Portfolio Whole Loan documents, (iii) the borrowers deliver an insolvency opinion, (iv) the borrowers deliver a rating agency confirmation, (v) after giving effect to the release of the applicable ICP/IRG Holdings Portfolio Individual Property (including the portion of the ICP/IRG Holdings Portfolio Whole Loan defeased pursuant to the ICP/IRG Holdings Portfolio Whole Loan documents), the debt service coverage ratio for the remaining ICP/IRG Holdings Portfolio Properties based on the trailing 12-month period immediately preceding the release of the applicable ICP/IRG Holdings Portfolio Individual Property is equal to or greater than the greater of (x) 1.31x and (y) the debt service coverage ratio for all of the remaining ICP/IRG Holdings Portfolio Properties (including the remaining ICP/IRG Holdings Portfolio Individual Property requested to be released) immediately preceding such release, and (vi) the satisfaction of the customary REMIC requirements. See “Payment Guaranty” below for additional information.
The borrowers may also obtain the release of certain specified non-income producing release parcels without any required prepayment, defeasance, prepayment fee, yield maintenance premium or otherwise upon the satisfaction of certain conditions, including, but not limited to, satisfaction of customary REMIC requirements.
Real Estate Substitution. None.
Letter of Credit. None.
| This is not a research report and was not prepared by any Underwriter’s research department. Please see additional important information and qualifications at the end of this Term Sheet. | ||
| T-91 | ||
| Various – Various | Loan #6 | Cut-off Date Balance: | $52,200,000 |
| Various | ICP/IRG Holdings Portfolio | Cut-off Date LTV: | 58.5% |
| Various | UW NCF DSCR: | 1.39x | |
| UW NOI Debt Yield: | 10.7% |
Right of First Offer/Right of First Refusal. None.
Ground Lease. None.
Terrorism Insurance. The borrowers are required to maintain terrorism insurance in an amount equal to the full replacement cost of the ICP/IRG Holdings Portfolio Properties plus the cost of rental loss and/or business interruption coverage. For so long as TRIPRA is in effect and continues to cover both foreign and domestic acts, the lender must accept terrorism insurance with coverage against acts which are “certified” within the meaning of TRIPRA. See “Risk Factors—Risks Relating to the Mortgage Loans—Terrorism Insurance May Not Be Available for All Mortgaged Properties” in the prospectus.
Payment Guaranty. In January 2023, Invacare Corporation commenced voluntary Chapter 11 bankruptcy proceedings in the United States Bankruptcy Court for the Southern District of Texas. Concurrently, Invacare Corporation entered into a Restructuring Support Agreement (the “RSA”) with substantially all of its debt holders, including its term loan lender, all of the holders of convertible senior secured notes and holders of a majority of its convertible senior unsecured notes. The terms of the RSA were implemented through its proposed plan of reorganization, which was filed with the court. Subsequently, in May 2023, Invacare Corporation successfully emerged from Chapter 11 bankruptcy and concurrently executed an amended and restated lease with the borrowers with an initial lease term expiring in April 2028 and annual base rent of approximately $1,505,000 (subject to CPI based adjustments) (the “Amended Lease”). Additionally, in connection with the Amended Lease, Invacare has the option to terminate its lease with respect to 50,000 SF (accounting for approximately 16.6% of base rent under the terms of the Amended Lease) with 60 days’ notice.
In connection with the foregoing and simultaneously with loan origination, Holdings Ohio, LLC and Christopher Semarjian (together with Holdings Ohio, LLC, the “Payment Guarantors”) provided a payment guaranty of all rents due under the terms of the original Invacare Corporation lease (expiring in April 2035 and requiring annual base rent in the amount of $1,567,548) (the “Original Invacare Corporation Lease”) on a joint and several basis (the “Payment Guaranty”). The Payment Guarantors are personally liable for all rents due under the Original Invacare Corporation Lease, including any amount of rental payments under the Original Invacare Corporation Lease exceeding the rental payments required under the Amended Lease, in the amount of up to 10% of the outstanding principal balance of the ICP/IRG Holdings Portfolio Whole Loan, plus all related reasonable costs and expenses incurred by the lender (including reasonable attorneys’ fees and expenses). The obligations under the Payment Guaranty will terminate on the earlier of (i) the indefeasible payment in full of the debt in accordance with the ICP/IRG Holdings Portfolio Whole Loan documents, (ii) full and complete payment and performance of the guaranteed obligations and (iii) a Payment Guaranty Release Event (as defined below). For avoidance of doubt, the Amended Lease does not constitute an Acceptable Replacement Lease (based on the stated expiration date in April 2028) and the Payment Guarantors’ obligations under the Payment Guaranty remain effective. See “Description of the Mortgage Pool—Statistical Characteristics of the Mortgage Loans—Property Types—Industrial Properties” and “Description of the Mortgage Pool—Certain Terms of the Mortgage Loans—Single-Purpose Entity Covenants” in the prospectus for additional information.
A “Payment Guaranty Release Event” will occur, provided no event of default or Cash Sweep Event has occurred and is continuing, upon (i) the debt service coverage ratio based on a trailing three-month period for the ICP/IRG Holdings Portfolio Whole Loan being greater than or equal to 1.30x, and (ii) (a) court approval of Invacare Corporation’s assumption of the lease, or (b) in the event Invacare Corporation’s lease is rejected, an Acceptable Replacement Lease is entered into, the tenant is in occupancy and paying full unabated rent and there are no outstanding obligations with respect to such lease or such obligations have been reserved with the lender.
An “Acceptable Replacement Lease” means one or more replacement leases (i) with a third party independent tenant or tenants that are creditworthy in the lender’s reasonable discretion, (ii) with a weighted average initial term that extends at least two years beyond the maturity date of the ICP/IRG Holdings Portfolio Whole Loan, (iii) entered into in accordance with the ICP/IRG Holdings Portfolio Whole Loan documents, (iv) substantially in accordance with the standard form of lease approved by the lender (subject to any commercially reasonable changes made in the course of negotiations with the applicable tenant), and (v) on economic terms (e.g., base rent, additional rent and recoveries, tenant improvement allowances, etc.) at least as favorable to the landlord as those contained in the Invacare Corporation’s lease; provided that in the event such economic terms are not commercially reasonable for the market at such times such economic terms may be reduced to reflect market terms subject to the lender’s written approval.
| This is not a research report and was not prepared by any Underwriter’s research department. Please see additional important information and qualifications at the end of this Term Sheet. | ||
| T-92 | ||
| Hospitality – Various | Loan #7 | Cut-off Date Balance: | $38,500,000 |
| Various | Alabama Hotel Portfolio | Cut-off Date LTV: | 59.7% |
| Various, AL Various | UW NCF DSCR: | 2.08x | |
| UW NOI Debt Yield: | 17.1% |

| This is not a research report and was not prepared by any Underwriter’s research department. Please see additional important information and qualifications at the end of this Term Sheet. | ||
| T-93 | ||
| Hospitality – Various | Loan #7 | Cut-off Date Balance: | $38,500,000 |
| Various | Alabama Hotel Portfolio | Cut-off Date LTV: | 59.7% |
| Various, AL Various | UW NCF DSCR: | 2.08x | |
| UW NOI Debt Yield: | 17.1% |

| This is not a research report and was not prepared by any Underwriter’s research department. Please see additional important information and qualifications at the end of this Term Sheet. | ||
| T-94 | ||
| Mortgage Loan No. 7 – Alabama Hotel Portfolio |
| Mortgage Loan Information | Property Information | |||||
| Mortgage Loan Seller: | JPMCB | Single Asset/Portfolio: | Portfolio | |||
| Credit Assessment (Fitch/Moody’s/KBRA): | NR/NR/NR | Location(2): | Various, AL Various | |||
| Original Balance: | $38,500,000 | General Property Type: | Hospitality | |||
| Cut-off Date Balance: | $38,500,000 | Detailed Property Type(2): | Various | |||
| % of Initial Pool Balance: | 5.7% | Title Vesting: | Fee | |||
| Loan Purpose: | Acquisition | Year Built/Renovated(2): | Various / NAP | |||
| Borrower Sponsor: | HDC Capital Group | Size(2): | 361 Rooms | |||
| Guarantor: | Horse Island Partners, LLC | Cut-off Date Balance per Room: | $106,648 | |||
| Mortgage Rate: | 7.3500% | Maturity Date Balance per Room: | $106,648 | |||
| Note Date: | 5/8/2023 | Property Manager: | Schulte Hospitality Group, Inc. | |||
| First Payment Date: | 7/1/2023 | |||||
| Maturity Date: | 6/1/2028 | Underwriting and Financial Information | ||||
| Original Amortization Term: | 0 months | UW NOI: | $6,577,850 | |||
| IO Period: | 60 months | UW NOI Debt Yield: | 17.1% | |||
| Seasoning: | 1 month | UW NOI Debt Yield at Maturity: | 17.1% | |||
| Prepayment Provisions: | L(25),D(32),O(3) | UW NCF DSCR: | 2.08x | |||
| Lockbox/Cash Mgmt Status: | Hard/Springing | Most Recent NOI: | $6,594,865 (3/31/2023 TTM) | |||
| Additional Debt Type: | No | 2nd Most Recent NOI(3): | $6,269,680 (12/31/2022) | |||
| Additional Debt Balance: | NAP | 3rd Most Recent NOI(3)(4): | $5,007,688 (12/31/2021) | |||
| Future Debt Permitted (Type): | No (NAP) | Most Recent Occupancy: | 80.3% (3/31/2023) | |||
| Reserves(1) | 2nd Most Recent Occupancy: | 78.4% (12/31/2022) | ||||
| Type | Initial | Monthly | Cap | 3rd Most Recent Occupancy(4): | 80.1% (12/31/2021) | |
| RE Tax: | $305,595 | $45,666 | NAP | Appraised Value (as of)(2): | $64,500,000 (4/1/2023) | |
| Insurance: | $0 | Springing | NAP | Appraised Value per Room: | $178,670 | |
| Replacement Reserve: | $0 | 4% of Revenues | NAP | Cut-off Date LTV Ratio: | 59.7% | |
| PIP Reserve: | $1,000,000 | $0 | NAP | Maturity Date LTV Ratio: | 59.7% | |
| Sources and Uses | ||||||
| Sources | Proceeds | % of Total | Uses | Proceeds | % of Total | |
| Mortgage Loan Amount: | $38,500,000 | 57.9% | Purchase Price: | $64,234,000 | 96.7% | |
| Borrower Sponsor Equity: | $27,954,475 | 42.1% | Upfront Reserves: | $1,305,595 | 2.0% | |
| Closing Costs: | $914,880 | 1.4% | ||||
| Total Sources: | $66,454,475 | 100.0% | Total Uses: | $66,454,475 | 100.0% | |
| (1) | See “Escrows and Reserves” below for further discussion of reserve requirements. |
| (2) | See the “Alabama Hotel Portfolio Properties Schedule” table below for details regarding the individual properties. |
| (3) | The increase in 2nd Most Recent NOI from 3rd Most Recent NOI is primarily attributable to the delivery of the HGI Madison Property (as defined below) which opened in May 2021. |
| (4) | 3rd Most Recent NOI and 3rd Most Recent Occupancy are based on May 2021 through December 2021 (unannualized) for the HGI Madison Property which opened in May 2021. |
The Mortgage Loan. The seventh largest mortgage loan (the “Alabama Hotel Portfolio Mortgage Loan”) is evidenced by a promissory note in the original principal amount of $38,500,000 secured by fee mortgages encumbering three extended stay and one full service hospitality properties located in Madison, Opelika and Decatur, Alabama (each individually, an “Alabama Hotel Portfolio Property”, and collectively, the “Alabama Hotel Portfolio Properties”).
The Borrowers and the Borrower Sponsors. The borrowers are HDC 135 Graphics Dr LLC, HDC 145 Graphics Dr LLC, HDC 807 Island Way LLC and HDC 3150 Capps Way LLC, each a Delaware limited liability company. Each individual borrower is a single-purpose entity with one independent director in its organizational structure. Legal counsel to the borrowers delivered a non-consolidation opinion in connection with the origination of the Alabama Hotel Portfolio Mortgage Loan.
The borrower sponsor of the Alabama Hotel Portfolio Mortgage Loan is HDC Capital Group. HDC Capital Group is a private equity firm concentrated in the hotel acquisition and fund management arena. HDC Capital Group seeks out hotel assets within geographical destinations that provide value add and market share growth opportunities. The non-recourse carve-out guarantor for the Alabama Hotel Portfolio Mortgage Loan is Horse Island Partners, LLC, a Delaware limited liability company and affiliate of the borrowers and borrower sponsor.
The Alabama Hotel Portfolio Properties are managed by Schulte Hospitality Group, Inc, a third party property manager. Schulte Hospitality Group, Inc is a third generation hospitality manager with properties located throughout the continental United States and England. Schulte Hospitality Group, Inc manages over 30,000 hotel keys though over 200 hotels and 10,000 employees.
The Properties. The Alabama Hotel Portfolio Properties are comprised of four hotels located across three cities in Alabama, Madison, Opelika and Decatur, totaling 361 rooms: the Hilton Garden Inn Huntsville Madison Airport (the “HGI Madison Property”), Home2 Suites by Hilton Madison Huntsville Airport (the “Home2 Madison Property”), Home2 Suites by Hilton Opelika Auburn (the “Home2 Opelika Property”) and the Home2 Suites by Hilton Decatur Ingalls Harbor (the “Home2 Decatur Property”). The borrower sponsor purchased the Alabama Hotel Portfolio Properties for an aggregate purchase price of $64,234,000, contributing approximately $27.9 million in cash equity. The Alabama Hotel Portfolio Properties each benefit from a Hilton Worldwide affiliated flag, offering extended stay and full service accommodations for corporate, leisure and group guests. Each of the Alabama Hotel Portfolio
| This is not a research report and was not prepared by any Underwriter’s research department. Please see additional important information and qualifications at the end of this Term Sheet. | ||
| T-95 | ||
| Hospitality – Various | Loan #7 | Cut-off Date Balance: | $38,500,000 |
| Various | Alabama Hotel Portfolio | Cut-off Date LTV: | 59.7% |
| Various, AL Various | UW NCF DSCR: | 2.08x | |
| UW NOI Debt Yield: | 17.1% |
Properties were recently constructed, with completion dates ranging between 2017 and 2021, in certain instances, still ramping up from initial construction and the COVID-19 pandemic.
The following table presents certain information relating to the Alabama Hotel Portfolio Properties:
| Alabama Hotel Portfolio Properties Schedule | |||||||||
Property Name
| Property Sub-Type | Allocated Cut-Off Date Balance | % of Portfolio Cut-Off Date Balance | Year Built | Rooms |
Underwritten NCF |
% of Underwritten NCF | Appraised Value | % of Appraised Value |
| HGI Madison Property | Full Service | $11,946,000 | 31.0% | 2021 | 102 | $1,600,215 | 26.8% | $19,000,000 | 29.5% |
| Home2 Madison Property | Extended Stay | $10,289,000 | 26.7% | 2019 | 97 | $1,686,867 | 28.2% | $17,500,000 | 27.1% |
| Home2 Opelika Property | Extended Stay | $8,155,000 | 21.2% | 2017 | 81 | $1,416,930 | 23.7% | $14,000,000 | 21.7% |
| Home2 Decatur Property | Extended Stay | $8,110,000 | 21.1% | 2017 | 81 | $1,273,631 | 21.3% | $14,000,000 | 21.7% |
| Total | $38,500,000 | 100.0% | 361 | $5,977,642 | 100.0% | $64,500,000 | 100.0% | ||
HGI Madison Property (31.0% of allocated cut-off date balance): The HGI Madison Property is a four-story, 102-room, full service hotel built on a 2.85-acre site located along Graphics Drive in Madison, Alabama, approximately three miles northeast of the Huntsville International Airport. The HGI Madison Property was constructed in 2021 and features an outdoor swimming pool, restaurant/lounge, business center, fitness center, sundries shop, approximately 650 SF of meeting space and 114 surface parking spaces. The guestroom mix at the HGI Madison Property is comprised of 66 king rooms and 36 double queen rooms. Room amenities at the HGI Madison Property feature a work station, flat screen television, internet and coffee makers. The food and beverage offering at the HGI Madison Property is a 60-seat Garden Grille & Bar, open daily and available to guests and the public. According to the appraisal, the property segmentation at the HGI Madison Property is estimated to be 65% commercial, 20% meetings & groups and 15% leisure. See “The Market” herein.
The borrower sponsor purchased the HGI Madison Property for approximately $19.9 million (approximately $195,404 per key). The HGI Madison Property is subject to a franchise agreement with Hilton Franchise Holding LLC through May 31, 2041. In connection with the acquisition, the HGI Madison Property is subject to a property improvement plan which requires general repair and maintenance, generally required to be completed by May 8, 2025.
As of March 31, 2023, the HGI Madison Property had an occupancy, ADR and RevPAR of 78.6%, $139.52 and $109.68, respectively, representing a 30.5% increase in RevPAR relative to year end 2021.
Home2 Madison Property (26.7% of allocated cut-off date balance): The Home2 Madison Property is a four-story, 97-room, extended stay hotel built on a 2.75-acre site located along Graphics Drive in Madison, Alabama, approximately three miles northeast of the Huntsville International Airport. The Home2 Madison Property was constructed in 2019 and features an outdoor swimming pool, fitness center, complimentary breakfast area, guest laundry facilities, sundries shop, business center, approximately 832 SF of meeting space and 123 surface parking spaces. The guestroom mix at the Home2 Madison Property is comprised of 69 king rooms, 20 double queen rooms and eight suites. Room amenities at the Home2 Madison Property feature larger than market standard guestrooms, two nightstands, flat screen television and a kitchen inclusive of a full-sized refrigerator, microwave, dishwasher, coffee/tea maker and standard cookware. According to the appraisal, the property segmentation at the Home2 Madison Property is estimated to be 75% commercial, 20% leisure and 5% meeting & group. See “The Market” herein.
The borrower sponsor purchased the Home2 Madison Property for approximately $17.2 million (approximately $176,961 per key). The Home2 Madison Property is subject to a franchise agreement with Hilton Franchise Holding LLC through March 31, 2039. In connection with the acquisition, the Home2 Madison Property is subject to a property improvement plan which requires general repair and maintenance, generally required to be completed by May 8, 2025, except for certain safety related items which are required to be completed by November 8, 2023.
As of March 31, 2023, the Home2 Madison Property had an occupancy, ADR and RevPAR of 82.3%, $130.69 and $107.62, respectively, representing 6.2% increase in RevPAR relative to year end 2021.
Home2 Opelika Property (21.2% of allocated cut-off date balance): The Home2 Opelika Property is a four-story, 81-room, extended stay hotel built on a 2.09-acre site located along Capps Way in Opelika, Alabama, approximately six and a half miles east of Auburn University. The Home2 Opelika Property was constructed in 2017 and features an outdoor swimming pool, complimentary breakfast area, business center, fitness center, guest self-laundry, sundries shop, outdoor patio & barbecue area, approximately 960 SF of meeting space and 95 surface parking spaces. The guestroom mix at the Home2 Opelika Property is comprised of 56 king rooms, 17 double queen rooms and eight one-bedroom suites. Room amenities at the Home2 Opelika Property feature a work area, flat-screen television, internet and coffee maker. According to the appraisal, the property segmentation at the Home2 Opelika Property is estimated to be 55% commercial, 35% leisure and 10% meeting & group. See “The Market” herein.
The borrower sponsor purchased the Home2 Opelika Property for approximately $13.6 million (approximately $167,978 per key). The Home2 Opelika Property is subject to a franchise agreement with Hilton Franchise Holding LLC through May 31, 2038. In connection with the acquisition, the Home2 Opelika Property is subject to a property improvement plan which generally requires replacement of furniture, fixtures and equipment to be completed by May 8, 2025, except for certain safety related items which are required to be completed by November 8, 2023.
As of March 31, 2023, the Home2 Opelika Property had an occupancy, ADR and RevPAR of 78.4%, $144.57 and $113.32, respectively, representing a 21.9% increase in RevPAR relative to year end 2021.
Home2 Decatur Property (21.1% of allocated cut-off date balance): The Home2 Decatur Property is a four-story, 81-room, extended stay hotel built on a 1.90-acre site located along Island Way Northwest in Decatur, Alabama. The Home2 Decatur Property was constructed in 2017 and features an outdoor swimming pool, complimentary breakfast area, business center, fitness center, guest self-laundry, sundries shop, outdoor patio & barbeque area, approximately 575 SF of meeting space and 79 surface parking spaces. The guestroom mix at the Home2 Decatur Property is comprised of 56 king rooms, 17 double queen rooms and eight suites. Room amenities at the Home2 Decatur Property feature a work area, flat-screen television, internet, iron & ironing board, and coffee maker. Additionally, the guestrooms feature kitchens with appliances including a dishwasher, microwave, mid-size refrigerator,
| This is not a research report and was not prepared by any Underwriter’s research department. Please see additional important information and qualifications at the end of this Term Sheet. | ||
| T-96 | ||
| Hospitality – Various | Loan #7 | Cut-off Date Balance: | $38,500,000 |
| Various | Alabama Hotel Portfolio | Cut-off Date LTV: | 59.7% |
| Various, AL Various | UW NCF DSCR: | 2.08x | |
| UW NOI Debt Yield: | 17.1% |
and standard cookware. According to the appraisal, the property segmentation at the Home2 Decatur Property is estimated to be 80% commercial, 15% leisure and 5% meeting & group. See “The Market” herein.
The borrower sponsor purchased the Home2 Decatur Property for approximately $13.5 million (approximately $167,052 per key). The Home2 Decatur Property is subject to a franchise agreement with Hilton Franchise Holding LLC through May 31, 2038. In connection with the acquisition, the Home2 Decatur Property is subject to a property improvement plan which requires general repair and maintenance, generally required to be completed by May 8, 2025.
As of March 31, 2023, the Home2 Decatur Property had an occupancy, ADR and RevPAR of 82.0%, $137.78 and $112.91, respectively, representing a 9.6% increase in RevPAR relative to year end 2021.
The Market. The Alabama Hotel Portfolio is located across four different competitive markets in Alabama. The following highlights key statistics for each relevant market.
HGI Madison Property: The competitive market for the HGI Madison Property consists of five properties, which range in size from 88 to 187 rooms, with 656 total rooms (the “HGI Madison Property Competitive Market”). The HGI Madison Property Competitive Market is primarily comprised of demand from its proximity to the Huntsville International Airport and access to Interstate 565. The appraisal notes there is one additional proposed hotel expected to enter the HGI Madison Property Competitive Market, a 210 key Courtyard Marriott and Residence Inn by Marriot dual brand hotel expected to be delivered in October 2023. According to the appraisal, the newly developed property is not considered to be fully competitive given the differences in product-type, demand base and brand.
The following table presents the primary competitive properties to the HGI Madison Property:
| Competitive Property Summary(1) | ||||||||
| Property | Year Built | Rooms | Commercial | Group | Leisure | 2022 Occupancy | 2022 ADR | 2022 RevPAR |
| HGI Madison Property(2) | 2021 | 102 | 65% | 20% | 15% | 75.5% | $137.26 | $103.62 |
| Courtyard by Marriott Huntsville University Drive | 1987 | 149 | 60% | 25% | 15% | 70%-75% | $110-$120 | $75-$85 |
| Hilton Garden Inn Huntsville Space Center | 2005 | 101 | 60% | 25% | 15% | 75%-80% | $115-125 | $85-$95 |
| SpringHill Suites Huntsville West/Research Park | 2012 | 88 | 55% | 20% | 25% | 75%-80% | $115-125 | $85-$95 |
| Drury Inn & Suites Huntsville At the Space & Rocket Center | 2018 | 187 | 40% | 35% | 25% | 75%-80% | $120-$130 | $95-$105 |
| Hyatt Place Huntsville/Research Park | 2019 | 131 | 40% | 35% | 25% | 75%-80% | $125-$135 | $95-$105 |
| Total/Average | 758 | 52% | 28% | 20% | 76% | $124 | $94 | |
Source: Appraisal unless otherwise noted.
| (1) | 2022 competitive property figures represent the estimated 2022 metrics according to the appraisal. |
| (2) | HGI Madison Property 2022 Occupancy, 2022 ADR and 2022 RevPAR are based on the historical operating statements provided by the borrower sponsor. |
The following table presents certain information relating to the Occupancy, ADR and RevPAR of the HGI Madison Property and its competitive set:
| Historical Occupancy, ADR, RevPAR | |||||||||
| Competitive Set(1) | HGI Madison Property(2) | Penetration Factor | |||||||
| Year | Occupancy | ADR | RevPAR | Occupancy | ADR | RevPAR | Occupancy | ADR | RevPAR |
| 2021(3) | 69.6% | $114.71 | $79.86 | 64.8% | $129.82 | $84.07 | 93.1% | 113.2% | 105.3% |
| 2022 | 75.6% | $122.49 | $92.61 | 75.5% | $137.26 | $103.62 | 99.8% | 112.1% | 111.9% |
| 3/31/2023 TTM | 78.3% | $125.53 | $98.24 | 78.6% | $139.52 | $109.68 | 100.4% | 111.1% | 111.6% |
Source: Third party hospitality research reports unless otherwise noted.
| (1) | Competitive Set includes Courtyard by Marriott Huntsville University Drive, Hilton Garden Inn Huntsville Space Center, SpringHill Suites Huntsville West/Research Park, Drury Inn & Suites Huntsville At The Space & Rocket Center and Hyatt Place Huntsville/Research Park. |
| (2) | HGI Madison Property metrics are based on the historical operating statements provided by the borrower sponsor. |
| (3) | The HGI Madison Property was constructed in 2021. 2021 metrics are based on May 2021 through December 2021 (unannualized) for the HGI Madison Property. |
Home2 Madison Property: The competitive market for the Home2 Madison Property consists of four properties, which range in size from 64 to 140 rooms, with 420 total rooms (the “Home2 Madison Property Competitive Market”). The Home2 Madison Property Competitive Market is primarily comprised of demand from its proximity to the Huntsville International Airport and access to Interstate 565. The appraisal notes there is one additional proposed hotel expected to enter the Home2 Madison Property Competitive Market, a 210 key Courtyard Marriott and Residence Inn by Marriot dual brand hotel expected to be delivered in October 2023. According to the appraisal, the newly developed property is not considered to be fully competitive given the differences in product-type, demand base and brand.
| This is not a research report and was not prepared by any Underwriter’s research department. Please see additional important information and qualifications at the end of this Term Sheet. | ||
| T-97 | ||
| Hospitality – Various | Loan #7 | Cut-off Date Balance: | $38,500,000 |
| Various | Alabama Hotel Portfolio | Cut-off Date LTV: | 59.7% |
| Various, AL Various | UW NCF DSCR: | 2.08x | |
| UW NOI Debt Yield: | 17.1% |
The following table presents the primary competitive properties to the Home2 Madison Property:
| Competitive Property Summary(1) | ||||||||
| Property | Year Built | Rooms | Commercial | Group | Leisure | 2022 Occupancy | 2022 ADR | 2022 RevPAR |
| Home2 Madison Property(2) | 2019 | 97 | 75% | 5% | 20% | 81.4% | $127.49 | $103.73 |
| Hampton Inn Madison Huntsville Airport | 1998 | 140 | 55% | 15% | 30% | 70%-75% | $115-125 | $80-90 |
| Country Inn & Suites Madison | 2010 | 64 | 50% | 15% | 35% | 70%-75% | $100-$110 | $70-$80 |
| Holiday Inn Express & Suites Huntsville Airport | 2012 | 96 | 50% | 15% | 35% | 65%-70% | $110-$120 | $75-$85 |
| TownePlace Suites Huntsville West Redstone Gateway | 2017 | 120 | 50% | 15% | 35% | 80%-85% | $105-$115 | $85-$95 |
| Total/Average | 517 | 56% | 13% | 31% | 76% | $116 | $87 | |
Source: Appraisal unless otherwise noted.
| (1) | 2022 competitive property figures represent the estimated 2022 metrics according to the appraisal. |
| (2) | Home2 Madison Property 2022 Occupancy, 2022 ADR and 2022 RevPAR are based on the historical operating statements provided by the borrower sponsor. |
The following table presents certain information relating to the Occupancy, ADR and RevPAR of the Home2 Madison Property and its competitive set:
| Historical Occupancy, ADR, RevPAR | |||||||||
| Competitive Set(1) | Home2 Madison Property(2) | Penetration Factor | |||||||
| Year | Occupancy | ADR | RevPAR | Occupancy | ADR | RevPAR | Occupancy | ADR | RevPAR |
| 2021 | 70.1% | $106.82 | $74.83 | 87.7% | $115.60 | $101.37 | 125.2% | 108.2% | 135.5% |
| 2022 | 74.5% | $112.48 | $83.75 | 81.4% | $127.49 | $103.73 | 109.3% | 113.3% | 123.9% |
| 3/31/2023 TTM | 73.7% | $116.07 | $85.49 | 82.3% | $130.69 | $107.62 | 111.8% | 112.6% | 125.9% |
Source: Third party hospitality research reports unless otherwise noted.
| (1) | Competitive Set includes Hampton Inn Madison Huntsville Airport, Country Inn & Suites Madison, Holiday Inn Express & Suites Huntsville Airport and TownePlace Suites Huntsville West Redstone Gateway. |
| (2) | Home2 Madison Property metrics are based on the historical operating statements provided by the borrower sponsor. |
Home2 Opelika Property: The competitive market for the Home2 Opelika Property consists of four properties, which range in size from 74 to 87 rooms, with 326 total rooms (the “Home2 Opelika Property Competitive Market”). The Home2 Opelika Property Competitive Market is primarily comprised of demand from its proximity to Auburn University, which enrolls over 30,000 students and employs over 5,500 people, with additional demand generated from Opelika Industrial Park and Auburn Industrial Park. The appraisal notes there is no new proposed supply expected to enter the Home2 Opelika Property Competitive Market.
The following table presents the primary competitive properties to the Home2 Opelika Property:
| Competitive Property Summary(1) | ||||||||
| Property | Year Built | Rooms | Commercial | Group | Leisure | 2022 Occupancy | 2022 ADR | 2022 RevPAR |
| Home2 Opelika Property(2) | 2017 | 81 | 55% | 10% | 35% | 74.4% | $147.24 | $109.51 |
| Hampton Inn & Suites Opelika - I-85 - Auburn Area | 2008 | 83 | 60% | 15% | 25% | 70% - 75% | $135 - $145 | $95 - $105 |
| Holiday Inn Express & Suites Opelika Auburn | 2009 | 87 | 60% | 15% | 25% | 70% - 75% | $115 - $125 | $80 - $90 |
| Fairfield Inn & Suites Auburn Opelika | 2008 | 74 | 55% | 15% | 30% | 65% - 70% | $115 - $125 | $75 - $85 |
| La Quinta Inn & Suites by Wyndham Opelika Auburn | 2018 | 82 | 55% | 15% | 30% | 65% - 70% | $130 - $140 | $85 - $95 |
| Total/Average | 407 | 57% | 14% | 29% | 70% | $133 | $93 | |
Source: Appraisal unless otherwise noted.
| (1) | 2022 competitive property figures represent the estimated 2022 metrics according to the appraisal. |
| (2) | Home2 Opelika Property 2022 Occupancy, 2022 ADR and 2022 RevPAR are based on the historical operating statements provided by the borrower sponsor. |
The following table presents certain information relating to the Occupancy, ADR and RevPAR of the Home2 Opelika Property and its competitive set:
| Historical Occupancy, ADR, RevPAR | |||||||||
| Competitive Set(1) | Home2 Opelika Property(2) | Penetration Factor | |||||||
| Year | Occupancy | ADR | RevPAR | Occupancy | ADR | RevPAR | Occupancy | ADR | RevPAR |
| 2021 | 65.7% | $110.35 | $72.47 | 77.7% | $119.72 | $92.96 | 118.3% | 108.5% | 128.3% |
| 2022 | 68.5% | $129.70 | $88.88 | 74.4% | $147.24 | $109.51 | 108.5% | 113.5% | 123.2% |
| 3/31/2023 TTM | 68.3% | $134.17 | $91.65 | 78.4% | $144.57 | $113.32 | 114.8% | 107.8% | 123.7% |
Source: Third party hospitality research reports unless otherwise noted.
| (1) | Competitive Set includes Hampton Inn & Suites Opelika-I-85-Auburn Area, Fairfield Inn & Suites Auburn Opelika, Holiday Inn Express & Suites Opelika Auburn and La Quinta Inns & Suites Opelika Auburn. |
| (2) | Home2 Opelika Property metrics are based on the historical operating statements provided by the borrower sponsor. |
| This is not a research report and was not prepared by any Underwriter’s research department. Please see additional important information and qualifications at the end of this Term Sheet. | ||
| T-98 | ||
| Hospitality – Various | Loan #7 | Cut-off Date Balance: | $38,500,000 |
| Various | Alabama Hotel Portfolio | Cut-off Date LTV: | 59.7% |
| Various, AL Various | UW NCF DSCR: | 2.08x | |
| UW NOI Debt Yield: | 17.1% |
Home2 Decatur Property: The competitive market for the Home2 Decatur Property consists of four properties, which range in size from 60 to 113 rooms, with 346 total rooms (the “Home2 Decatur Property Competitive Market”). The Home2 Decatur Property Competitive Market is primarily comprised of commercial demand, drawn from the area’s industrial base and local commercial business. The appraisal notes there is one additional proposed hotel expected to enter the Home2 Decatur Property Competitive Market, an 80 key Fairfield Inn & Suites by Marriot Decatur hotel. Completion of this property is expected in October 2023.
The following table presents the primary competitive properties to the Home2 Decatur Property:
| Competitive Property Summary(1) | ||||||||
| Property | Year Built | Rooms | Commercial | Group | Leisure | 2022 Occupancy | 2022 ADR | 2022 RevPAR |
| Home2 Decatur Property(2) | 2017 | 81 | 80% | 5% | 15% | 82.5% | $134.06 | $110.54 |
| Hampton Inn Decatur | 1994 | 90 | 75% | 10% | 15% | 75% - 80% | $105 - $115 | $75 - $85 |
| Best Western River City Hotel | 1999 | 60 | 70% | 10% | 20% | 65% - 70% | $105 - $115 | $70 - $80 |
| Courtyard by Marriott Decatur | 2001 | 113 | 70% | 15% | 15% | 60% - 65% | $115 - $125 | $70 - $80 |
| Holiday Inn Express & Suites Decatur | 2016 | 83 | 80% | 10% | 10% | 65% - 70% | $115 - $125 | $80 - $90 |
| Total/Average | 427 | 75% | 10% | 15% | 70% | $120 | $84 | |
Source: Appraisal unless otherwise noted.
| (1) | 2022 competitive property figures represent the estimated 2022 metrics according to the appraisal. |
| (2) | Home2 Decatur Property 2022 Occupancy, 2022 ADR and 2022 RevPAR are based on the historical operating statements provided by the borrower sponsor. |
The following table presents certain information relating to the Occupancy, ADR and RevPAR of the Home2 Decatur Property and its competitive set:
| Historical Occupancy, ADR, RevPAR | |||||||||
| Competitive Set(1) | Home2 Decatur Property(2) | Penetration Factor | |||||||
| Year | Occupancy | ADR | RevPAR | Occupancy | ADR | RevPAR | Occupancy | ADR | RevPAR |
| 2021 | 61.6% | $105.54 | $64.99 | 85.3% | $120.70 | $103.01 | 138.5% | 114.4% | 158.5% |
| 2022 | 67.5% | $115.90 | $78.29 | 82.5% | $134.06 | $110.54 | 122.1% | 115.7% | 141.2% |
| 3/31/2023 TTM | 66.1% | $120.93 | $79.88 | 82.0% | $137.78 | $112.91 | 124.1% | 113.9% | 141.4% |
Source: Third party hospitality research reports unless otherwise noted.
| (1) | Competitive Set includes Hampton Inn Decatur, Best Western River City Hotel, Courtyard by Marriott Decatur and Holiday Inn Express & Suites Decatur. |
| (2) | Home2 Decatur Property metrics are based on the historical operating statements provided by the borrower sponsor. |
| This is not a research report and was not prepared by any Underwriter’s research department. Please see additional important information and qualifications at the end of this Term Sheet. | ||
| T-99 | ||
| Hospitality – Various | Loan #7 | Cut-off Date Balance: | $38,500,000 |
| Various | Alabama Hotel Portfolio | Cut-off Date LTV: | 59.7% |
| Various, AL Various | UW NCF DSCR: | 2.08x | |
| UW NOI Debt Yield: | 17.1% |
Operating History and Underwritten Net Cash Flow. The following table presents certain information relating to the historical operating performance and Underwritten Net Cash Flow of the Alabama Hotel Portfolio Properties:
| Cash Flow Analysis(1) | |||||||
| 2019(2)(3) | 2020(2) | 2021(2) | 2022 | 3/31/2023 TTM | UW | UW per Room | |
| Rooms Revenue | $6,947,793 | $7,132,441 | $11,321,044 | $14,036,203 | $14,582,207 | $14,582,207 | $40,394 |
| Other Income(4) | $90,689 | $113,270 | $244,755 | $424,840 | $423,003 | $423,003 | $1,172 |
| Departmental Revenue | $7,038,482 | $7,245,711 | $11,565,799 | $14,461,043 | $15,005,211 | $15,005,211 | $41,566 |
| Departmental Expense | |||||||
| Rooms Expense | $1,319,206 | $1,289,675 | $2,116,917 | $2,721,704 | $2,750,833 | $2,750,833 | $7,620 |
| Other Departmental Expenses | $289,351 | $260,844 | $186,151 | $327,199 | $328,384 | $328,384 | $910 |
| Total Departmental Expenses | $1,608,557 | $1,550,519 | $2,303,068 | $3,048,902 | $3,079,218 | $3,079,218 | $8,530 |
| Departmental Profit | $5,429,925 | $5,695,192 | $9,262,731 | $11,412,140 | $11,925,993 | $11,925,993 | $33,036 |
| Undistributed Expenses | |||||||
| Franchise Fee | $271,381 | $318,292 | $1,196,937 | $1,536,040 | $1,602,136 | $1,589,948 | $4,404 |
| Other Undistributed Expenses | $1,777,286 | $1,947,718 | $2,319,745 | $2,516,166 | $2,614,114 | $2,614,114 | $7,241 |
| Total Undistributed Expenses | $2,048,667 | $2,266,010 | $3,516,682 | $4,052,206 | $4,216,250 | $4,204,062 | $11,646 |
| Gross Operating Income | $3,381,258 | $3,429,182 | $5,746,049 | $7,359,934 | $7,709,743 | $7,721,931 | $21,390 |
| Management Fee | $211,154 | $217,371 | $346,974 | $433,831 | $450,085 | $450,156 | $1,247 |
| Total Other Fixed Expense | $275,344 | $378,546 | $391,387 | $656,423 | $664,794 | $693,924 | $1,922 |
| Net Operating Income | $2,894,760 | $2,833,265 | $5,007,688 | $6,269,680 | $6,594,865 | $6,577,850 | $18,221 |
| FF&E | $281,539 | $289,829 | $462,631 | $578,442 | $600,113 | $600,208 | $1,663 |
| Net Cash Flow | $2,613,221 | $2,543,436 | $4,545,057 | $5,691,238 | $5,994,752 | $5,977,642 | $16,559 |
| Occupancy % | 76.8% | 71.1% | 80.1% | 78.4% | 80.3% | 80.3% | |
| NOI DSCR | 1.01x | 0.99x | 1.75x | 2.19x | 2.30x | 2.29x | |
| NCF DSCR | 0.91x | 0.89x | 1.58x | 1.98x | 2.09x | 2.08x | |
| NOI Debt Yield | 7.5% | 7.4% | 13.0% | 16.3% | 17.1% | 17.1% | |
| NCF Debt Yield | 6.8% | 6.6% | 11.8% | 14.8% | 15.6% | 15.5% | |
| (1) | Certain items such as interest expense, interest income, depreciation, amortization, debt service payments and any other non-recurring items were excluded from the historical presentation and are not considered for the underwritten cash flow. |
| (2) | 2019 and 2020 exclude the HGI Madison Property which opened in May 2021. 2021 historical financials are based on May 2021 through December 2021 (unannualized) for the HGI Madison Property. |
| (3) | 2019 includes June 2019 through December 2019 (unannualized) for the Home2 Madison Property, which opened in May 2019. |
| (4) | Other Income is comprised of food & beverage revenue, internet fees, telephone and internet revenue, convenience store sales, pet fees and cancellation fees, among other miscellaneous items. |
Escrows and Reserves.
At loan origination, the borrowers deposited (i) $1,000,000 into a PIP reserve for the payment of costs associated with the property improvement plans at the Alabama Hotel Portfolio Properties and (ii) $305,595 into a real estate tax reserve.
Real Estate Taxes – On each monthly due date, the borrowers are required to deposit an amount equal to 1/12 of the estimated annual real estate taxes (initially $45,666) into the tax reserve account.
Insurance – On each monthly due date, the borrowers are required to deposit an amount equal to 1/12 of the estimated annual insurance premiums; provided, however, such insurance reserve has been conditionally waived so long as (i) the borrowers maintain a blanket policy in accordance with the Alabama Hotel Portfolio Mortgage Loan documents and (ii) no event of default under the Alabama Hotel Portfolio Mortgage Loan documents is continuing.
Replacement Reserves – On each monthly due date, the borrowers are required to deposit into the replacement reserve account an amount equal to 4% of the gross income from operations generated for the calendar month 2-months prior.
Lockbox and Cash Management. The Alabama Hotel Portfolio Mortgage Loan is structured with a hard lockbox and springing cash management. All funds in the lockbox accounts will be swept to an account designated by the borrowers, unless a Cash Sweep Event (as defined below) is continuing, in which case such funds are required to be swept on each business day into a cash management account controlled by the lender, at which point, following payment of taxes and insurance, bank fees, debt service, required reserves and operating expenses, all funds are required to be deposited into the excess cash flow reserve, to be held by the lender as additional security for the Alabama Hotel Portfolio Mortgage Loan and disbursed in accordance with the terms of the Alabama Hotel Portfolio Mortgage Loan documents.
| This is not a research report and was not prepared by any Underwriter’s research department. Please see additional important information and qualifications at the end of this Term Sheet. | ||
| T-100 | ||
| Hospitality – Various | Loan #7 | Cut-off Date Balance: | $38,500,000 |
| Various | Alabama Hotel Portfolio | Cut-off Date LTV: | 59.7% |
| Various, AL Various | UW NCF DSCR: | 2.08x | |
| UW NOI Debt Yield: | 17.1% |
A “Cash Sweep Event” means the occurrence of (a) an event of default under the Alabama Hotel Portfolio Mortgage Loan documents; (b) any bankruptcy action or insolvency of any borrower or the property manager; and (c) the debt yield based on the trailing 12-month period immediately preceding the date of such determination being less than 11.0% (a “Debt Yield Trigger Event”).
A Cash Sweep Event will be cured upon the occurrence of the following: (i) with respect to clause (a) above, the acceptance by the lender (in its reasonable discretion) of a cure of such event of default in accordance with the Alabama Hotel Portfolio Mortgage Loan documents; provided, however, that if (x) the lender applies for the appointment of a receiver pursuant to the Alabama Hotel Portfolio Mortgage Loan documents, (y) the lender declares the entire unpaid debt to be immediately due and payable, or (z) the lender commences a foreclosure action pursuant to the Alabama Hotel Portfolio Mortgage Loan documents, the lender is not obligated to accept such cure and may reject or accept such cure in its sole and absolute discretion; (ii) with respect to clause (b) above, solely with respect to the property manager, if the borrowers replace the property manager with a “Qualified Manager” (as fully described in the Alabama Hotel Portfolio Mortgage Loan documents) under a replacement management agreement within 90 days and (iii) with respect to clause (c) above, the achievement of a debt yield of 11.0% for two consecutive calendar quarters, based upon the trailing 12-month period immediately preceding the date of determination; provided, however, that any such Cash Sweep Event cure is subject to the following conditions, (A) no event of default has occurred and is continuing under the Alabama Hotel Portfolio Mortgage Loan documents, (B) a Cash Sweep Event caused by an event of default or any bankruptcy action of the property manager may be cured no more than a total of two times in the aggregate during the term of the Alabama Hotel Portfolio Mortgage Loan; (C) a Cash Sweep Event caused by a Debt Yield Trigger Event may be cured an unlimited number of times during the term of the Alabama Hotel Portfolio Mortgage Loan; (D) the borrowers have paid all of the lender’s reasonable expenses incurred in connection with such Cash Sweep Event cure including reasonable attorney’s fees and expenses; and (E) in no event may the borrowers cure a Cash Sweep Event caused by a bankruptcy action or insolvency of the borrowers.
Additional Secured Indebtedness (not including trade debts). None
Mezzanine Loan and Preferred Equity. None permitted.
Release of Property. The Alabama Hotel Portfolio Mortgage Loan documents permit the borrowers to obtain the release of any individual Alabama Hotel Portfolio Property on and after the earlier of (a) the second anniversary of the closing date of the BANK5 2023-5YR2 securitization and (b) July 1, 2027; provided that, among other conditions, (i) the borrower must defease or prepay a portion of the principal balance of the Alabama Hotel Portfolio Mortgage Loan equal to or in excess of 115% of the allocated loan amount for the individual Alabama Hotel Portfolio Mortgaged Property to be released; (ii) after giving effect to such release, the loan to value ratio, as determined by the lender does not exceed 59.7%; and (iii) after giving effect to such release, the debt service coverage ratio for the remaining Alabama Hotel Portfolio Properties (as calculated under the Alabama Hotel Portfolio Mortgage Loan documents) is equal to or greater than the greater of (x) 2.09x and (y) the debt service coverage ratio immediately preceding such release; and (iv) the borrower is required to convey the individual Alabama Hotel Portfolio Property being released to a person other than the borrower or an affiliate of the borrower. See “Description of the Mortgage Pool—Certain Terms of the Mortgage Loans—Releases; Partial Releases; Property Additions” in the prospectus.
Letter of Credit. None.
Right of First Offer/Right of First Refusal. None.
Ground Lease. None.
Terrorism Insurance. The borrowers are required to maintain terrorism insurance in an amount equal to the full replacement cost of the Alabama Hotel Portfolio Properties plus the cost of rental loss and/or business interruption coverage. For so long as TRIPRA is in effect and continues to cover both foreign and domestic acts, the lender must accept terrorism insurance with coverage against acts which are “certified” within the meaning of Terrorism Risk Insurance Program Reauthorization Act of 2015 (“TRIPRA”) . See “Risk Factors—Risks Relating to the Mortgage Loans—Terrorism Insurance May Not Be Available for All Mortgaged Properties” in the prospectus.
| This is not a research report and was not prepared by any Underwriter’s research department. Please see additional important information and qualifications at the end of this Term Sheet. | ||
| T-101 | ||
| Mixed Use – Retail/Office | Loan #8 | Cut-off Date Balance: | $37,100,000 |
| 38-25 Main Street | Queens Crossing | Cut-off Date LTV: | 57.1% |
| Flushing, NY 11354 | UW NCF DSCR: | 1.33x | |
| UW NOI Debt Yield: | 10.4% |
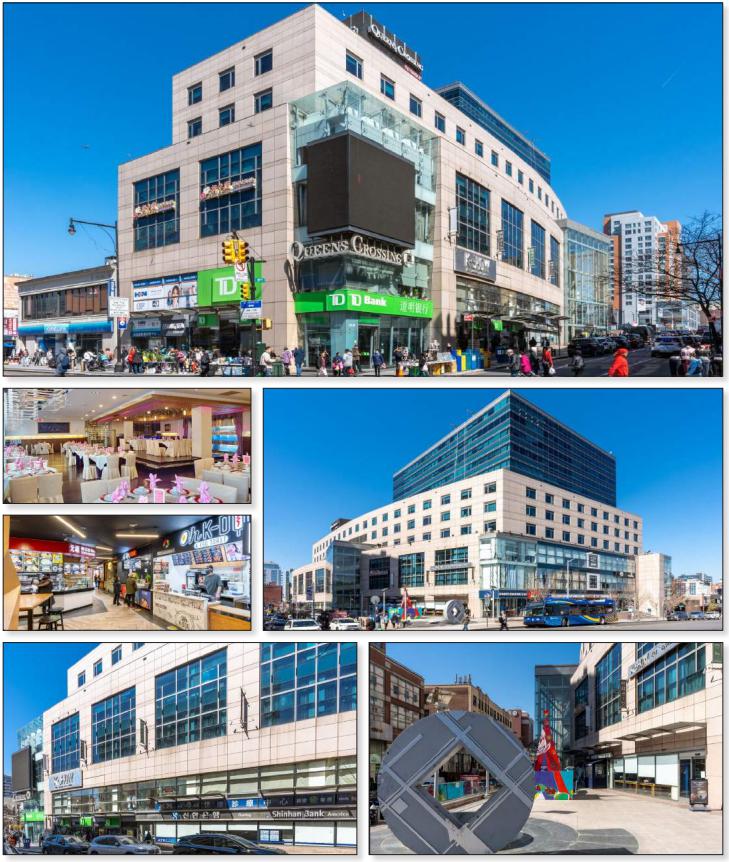
| This is not a research report and was not prepared by any Underwriter’s research department. Please see additional important information and qualifications at the end of this Term Sheet. | ||
| T-102 | ||
| Mixed Use – Retail/Office | Loan #8 | Cut-off Date Balance: | $37,100,000 |
| 38-25 Main Street | Queens Crossing | Cut-off Date LTV: | 57.1% |
| Flushing, NY 11354 | UW NCF DSCR: | 1.33x | |
| UW NOI Debt Yield: | 10.4% |
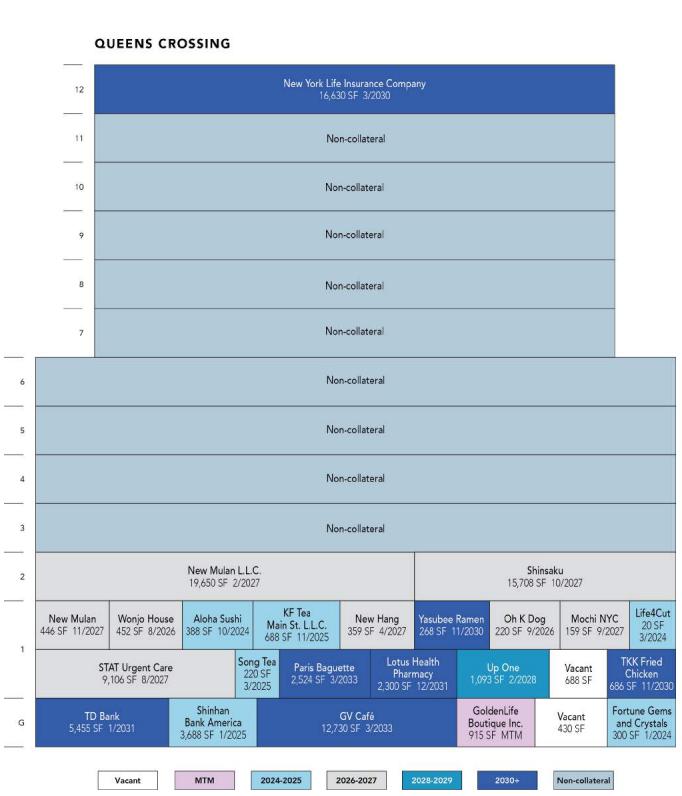
| This is not a research report and was not prepared by any Underwriter’s research department. Please see additional important information and qualifications at the end of this Term Sheet. | ||
| T-103 | ||
| Mixed Use – Retail/Office | Loan #8 | Cut-off Date Balance: | $37,100,000 |
| 38-25 Main Street | Queens Crossing | Cut-off Date LTV: | 57.1% |
| Flushing, NY 11354 | UW NCF DSCR: | 1.33x | |
| UW NOI Debt Yield: | 10.4% |
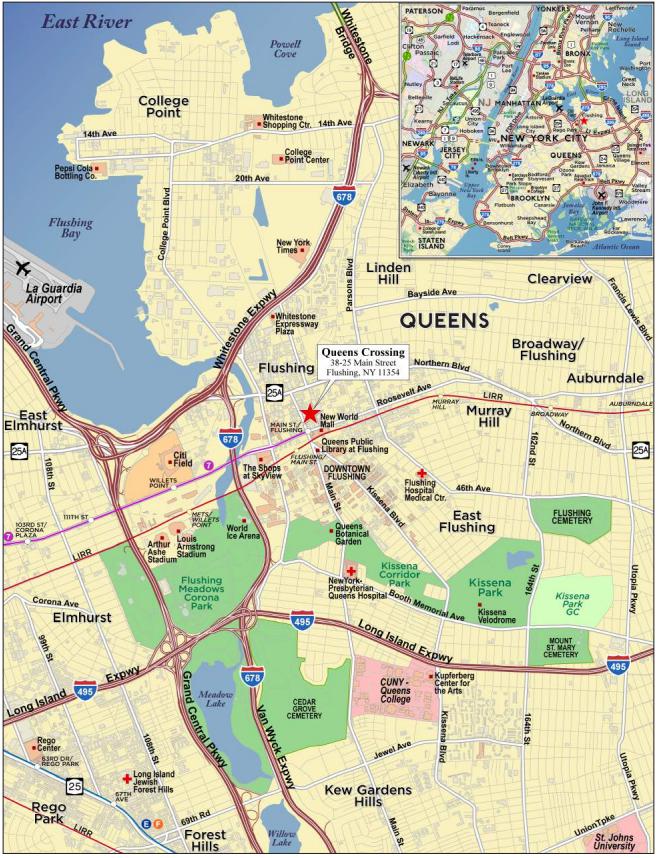
| This is not a research report and was not prepared by any Underwriter’s research department. Please see additional important information and qualifications at the end of this Term Sheet. | ||
| T-104 | ||
| Mortgage Loan No. 8 – Queens Crossing |
| Mortgage Loan Information | Property Information | |||||
| Mortgage Loan Seller: | JPMCB | Single Asset/Portfolio: | Single Asset | |||
| Credit Assessment (Fitch/Moody’s/KBRA): | NR/NR/NR | Location: | Flushing, NY 11354 | |||
| Original Balance(1): | $37,100,000 | General Property Type: | Mixed Use | |||
| Cut-off Date Balance(1): | $37,100,000 | Detailed Property Type(5): | Retail/Office | |||
| % of Initial Pool Balance: | 5.5% | Title Vesting: | Fee | |||
| Loan Purpose: | Refinance | Year Built/Renovated: | 2007 / NAP | |||
| Borrower Sponsor: | F&T Group | Size(5): | 95,123 SF | |||
| Guarantors: | Sunny Chiu, Michael Lee and | Cut-off Date Balance Per SF(1): | $600 | |||
| Christian Lee | Maturity Date Balance Per SF(1): | $600 | ||||
| Mortgage Rate: | 7.5500% | Property Manager: | Fultonex Property Management Corp. | |||
| Note Date: | 5/5/2023 | (borrower-related) | ||||
| First Payment Date: | 6/5/2023 | |||||
| Maturity Date: | 5/5/2028 | Underwriting and Financial 3) | ||||
| Original Term to Maturity: | 60 months | |||||
| Original Amortization Term: | 0 months | Underwriting and Financial Information | ||||
| IO Period: | 60 months | UW NOI: | $5,925,023 | |||
| Seasoning: | 2 months | UW NOI Debt Yield(1): | 10.4% | |||
| Prepayment Provisions(2): | L(26),D(30),O(4) | UW NOI Debt Yield at Maturity(1): | 10.4% | |||
| Lockbox/Cash Mgmt Status: | Hard/Springing | UW NCF DSCR(1): | 1.33x | |||
| Additional Debt Type(1)(3): | Pari Passu | Most Recent NOI: | $5,317,856 (12/31/2022) | |||
| Additional Debt Balance(1)(3): | $20,000,000 | 2nd Most Recent NOI: | $4,634,804 (12/31/2021) | |||
| Future Debt Permitted (Type): | No (NAP) | 3rd Most Recent NOI: | $4,293,791 (12/31/2020) | |||
| Reserves(4) | Most Recent Occupancy: | 98.8% (5/1/2023) | ||||
| Type | Initial | Monthly | Cap | 2nd Most Recent Occupancy: | 99.8% (12/31/2022) | |
| RE Taxes: | $415,000 | $85,000 | NAP | 3rd Most Recent Occupancy: | 99.0% (12/31/2021) | |
| Insurance: | $30,000 | $15,000 | NAP | Appraised Value (as of) (6): | $100,000,000 (4/11/2023) | |
| Replacement Reserve: | $2,246 | $2,246 | NAP | Appraised Value PSF(6): | $1,051 | |
| TI/LC Reserve: | $1,000,000 | Springing | $750,000 | Cut-off Date LTV Ratio(1) (6): | 57.1% | |
| Condo Assessments Reserve: | $0 | Springing | NAP | Maturity Date LTV Ratio(1) (6): | 57.1% | |
| Sources and Uses | ||||||
| Sources | Proceeds | % of Total | Uses | Proceeds | % of Total | |
| Whole Loan Amount: | $57,100,000 | 96.2% | Loan Payoff: | $57,100,000 | 96.2% | |
| Cash Equity: | $2,248,586 | 3.8% | Closing Costs: | $801,340 | 1.4% | |
| Upfront Reserves: | $1,447,246 | 2.4% | ||||
| Total Sources: | $59,348,586 | 100.0% | Total Uses: | $59,348,586 | 100.0% | |
| (1) | The Queens Crossing Mortgage Loan (as defined below) is part of the Queens Crossing Whole Loan (as defined below), which is comprised of three pari passu promissory notes with an aggregate original principal balance of $57,100,000. The Cut-off Date Balance Per SF, Maturity Date Balance Per SF, UW NOI Debt Yield, UW NOI Debt Yield at Maturity, UW NCF DSCR, Cut-off Date LTV Ratio and Maturity Date LTV Ratio presented above are based on the aggregate Cut-off Date principal balance of the Queens Crossing Whole Loan. |
| (2) | The lockout period will be at least 26 months beginning with and including the first payment date on June 5, 2023. Defeasance of the Queens Crossing Whole Loan is permitted after the date that is two years from the closing date of the securitization that includes the last note to be securitized. If the permitted defeasance date has not occurred by June 5, 2026, the Queens Crossing Whole Loan may be prepaid in whole at any time prior to the permitted defeasance date with the payment of a prepayment fee equal to the greater of 1.0% of the amount prepaid and a yield maintenance premium. The assumed lockout period of 26 payments is based on the anticipated closing date of the BANK5 2023-5YR2 securitization trust in July 2023. The actual lockout period may be longer. |
| (3) | See “The Mortgage Loan” and “Additional Secured Indebtedness (not including trade debts)” below for further discussion of additional mortgage debt. |
| (4) | See “Escrows and Reserves” below. |
| (5) | The Queens Crossing Property (as defined below) is comprised of 78,493 SF of retail space, 16,630 SF of office space and 401 sub-grade parking spaces. |
| (6) | The Appraised Value of $100,000,000 reflects an extraordinary assumption that the parking garage is leased at market levels as of the date of value. According to the appraisal, the parking garage is currently leased to an affiliate of the borrower at significantly below-market levels. The related lease expires in May 2030 and is terminable upon foreclosure |
The Mortgage Loan. The eighth largest mortgage loan (the “Queens Crossing Mortgage Loan”) is part of a whole loan comprised of three pari passu promissory notes with an aggregate outstanding principal balance as of the Cut-off Date of $57,100,000 (the “Queens Crossing Whole Loan”) secured by a first mortgage encumbering the borrower’s fee interest in a mixed-use center located in Flushing, New York (the “Queens Crossing Property”). The Queens Crossing Whole Loan was co-originated by JPMorgan Chase Bank, National Association (“JPMCB”) and Barclays Capital Real Estate Inc. (“Barclays”) on May 5, 2023. The Queens Crossing Mortgage Loan is evidenced by the controlling note A-1 and the non-controlling note A-2, with an aggregate original balance and outstanding principal balance as of the Cut-off Date of $37,100,000. The non-controlling note A-3 (the “Queens Crossing Serviced Pari Passu Companion Loan”), with an original and outstanding as of the Cut-off Date principal balance of $20,000,000, is held by Barclays and is expected to be contributed to a future securitization. The Queens Crossing Whole Loan will be serviced under the BANK5 2023-5YR2 pooling and servicing agreement. See “Description of the Mortgage Pool–The Whole Loans–The Serviced Pari Passu Whole Loans” and “Pooling and Servicing Agreement” in the prospectus.
| This is not a research report and was not prepared by any Underwriter’s research department. Please see additional important information and qualifications at the end of this Term Sheet. | ||
| T-105 | ||
| Mixed Use – Retail/Office | Loan #8 | Cut-off Date Balance: | $37,100,000 |
| 38-25 Main Street | Queens Crossing | Cut-off Date LTV: | 57.1% |
| Flushing, NY 11354 | UW NCF DSCR: | 1.33x | |
| UW NOI Debt Yield: | 10.4% |
| Queens Crossing Whole Loan Summary | ||||
Note | Original Balance | Cut-off Date Balance | Note Holder | Controlling Piece |
| A-1 | $20,000,000 | $20,000,000 | BANK5 2023-5YR2 | Yes |
| A-2 | $17,100,000 | $17,100,000 | BANK5 2023-5YR2 | No |
| A-3 | $20,000,000 | $20,000,000 | Barclays | No |
| Total (Whole Loan) | $57,100,000 | $57,100,000 | ||
The Borrower and the Borrower Sponsor. The borrower is QC Flushing LLC, a Delaware limited liability company structured to be a single purpose bankruptcy-remote entity having at least one independent director in its organizational structure. Legal counsel to the borrower delivered a non-consolidation opinion in connection with the origination of the Queens Crossing Whole Loan. The borrower sponsor is F&T Group (“F&T”) and the non-recourse carveout guarantors are Sunny Chiu, Michael Lee and Christian Lee, executives and key stakeholders in F&T. F&T developed the Queens Crossing Property in 2007 and previously occupied the office condominium units currently leased to New York Life Insurance Company. F&T is a developer, property owner, contractor and operator of residential and commercial real estate in the New York metropolitan area with a primary focus in Flushing, Queens. As a vertically integrated firm, F&T possesses experience in various aspects of mixed-use developments, including acquisitions, finance, project management, design, general contracting, construction management, sales and marketing, leasing and property management. F&T seeks to invest in assets and to create value through repositioning, development and focused management, leveraging its local knowledge and long-term relationships.
F&T’s projects in Flushing include the 330,000 SF, mixed-use development at One Fulton Square, as well as Flushing Commons—a formerly city-owned 5.5-acre parking structure being redeveloped into 1.8 million SF of residences, office space, retail, community facility space, parking and an open-air plaza. In the late 1990s, F&T established a real estate presence in China forming a partnership with J.P. Morgan Asset Management to fund and develop the World Trade Center in Nanjing, China. The World Trade Center was an approximately $800.0 million development totaling approximately 4.7 million SF.
The Property. The Queens Crossing Property is comprised of a portion of a 12-story mixed used condominium property, evidenced by the equity interest in 17 of 108 total condominium units. The Queens Crossing Property is located in Flushing, New York, and is comprised of six retail condominium units (78,493 SF; 85.0% of UW Base Rent), 10 office condominium units (16,630 SF; 15.0% of UW Base Rent) and one parking condominium unit (401 sub-grade parking spaces). The 91 remaining condominium units, largely comprised of medical and professional service offices that occupy the entirety of floors 3 through 11, are owned by unaffiliated third parties and do not serve as collateral for the Queens Crossing Whole Loan. The condominium units comprising the Queens Crossing Property are located on, and comprise the entirety of, floors 1 and 2 (primarily retail), floor 12 (office) and the below grade parking garage. The borrower owns approximately 40.2% of interest in the condominium regime. The condominium association is governed by a board consisting of five managers, designated by the declarant under the condominium declaration. The borrower, as the successor declarant under the condominium declaration, has the right to appoint all five managers to the board so long as the borrower owns at least one of the units in the condominium. See “Description of the Mortgage Pool—Mortgage Pool Characteristics—Condominium and Other Shared Interests” in the prospectus.
The Queens Crossing Property is situated one block north of the Flushing-Main subway station, which as of 2020, was ranked the 10th busiest station in NYC with 6.9 million riders, as well as the Long Island Railroad (Port Washington line). Additionally, the property is located approximately 3.3 miles from La Guardia Airport. Downtown Flushing has become a significant retail destination in the outer boroughs of New York City and is considered a prime retail area within the broader market.
As of May 1, 2023, the Queens Crossing Property was 98.8% leased to 22 tenants with a weighted average remaining lease term of 5.8 years. The Queens Crossing Property was built in 2007 by the borrower sponsor and offers an array of tenants drawing significant foot traffic, including medical office, financial and legal services, retail and a food hall. The multi-level retail space benefits from visibility along Main Street and 39th Avenue, one block south of the third busiest pedestrian intersection in New York City (Main and Roosevelt). The Queens Crossing Property office condominium is leased in its entirety to a single tenant, New York Life Insurance Company (“New York Life”). New York Life initially took occupancy in April 2020 after onset of the COVID-19 pandemic. The Queens Crossing Property includes 401 sub-grade parking spaces, currently master leased to an affiliate of the borrower sponsor. The parking garage is leased through May 2030 at a contractual rate of approximately $145.47 per space, a significant discount (approximately 49.4%) to the average of comparable parking leases as identified in the appraisal of $287.27 per space.
Major Tenants.
TD Bank (5,455 SF; 5.7% of NRA; 19.8% of underwritten base rent). As of the first quarter of 2023, TD Bank is the 10th largest U.S. bank by domestic deposits and the 10th largest U.S. bank by total assets. TD Bank has been at the property since 2008 and operates a traditional branch location offering customers a full range of retail, small business and commercial banking products and services. TD Bank extended its lease in November 2022 through January 2031 and has two, five-year extension options remaining. TD Bank is situated in prime ground floor retail space located on the corner of Main Street and 39th Avenue.
New York Life Insurance Company (16,630 SF; 17.5% of NRA; 15.0% of underwritten base rent). New York Life is the largest mutual insurer in the United States with over 175 years of operations. As of the second quarter of 2023, New York Life’s total assets under management was over $300 billion across a diverse portfolio featuring both debt and equity. Additionally, in 2022, New York Life was ranked 72nd on the Fortune 500 list of largest companies worldwide by total revenue. New York Life offers its clients a wide array of financial products such as life insurance, supplemental insurance, retirement income, investments and premier services for small businesses. New York Life took occupancy in April 2020, after onset of the COVID-19 pandemic, and has one, five-year extension option remaining. New York Life has a one-time termination option to vacate the entirety of its leased space in September 2027 with notice no later than September 2026. New York Life occupies the entirety of the 12th floor office condominium units.
STAT Urgent Care (9,106 SF; 9.6% of NRA; 13.9% of underwritten base rent). STAT Urgent Care provides convenient, flexible and reliable urgent care medical service within its 16 locations throughout the New York metro area. In addition to urgent care services, STAT Urgent Care offers telemedicine appointments in addition to a full-service after care department. STAT Urgent Care has been at the property since 2017 and has one, five-year extension option remaining. STAT Urgent Care currently subleases space to four subtenants that provide complementary services. The four subleases account for a total of 3,319 SF with a weighted average in-place rent of $122.09 per SF.
| This is not a research report and was not prepared by any Underwriter’s research department. Please see additional important information and qualifications at the end of this Term Sheet. | ||
| T-106 | ||
| Mixed Use – Retail/Office | Loan #8 | Cut-off Date Balance: | $37,100,000 |
| 38-25 Main Street | Queens Crossing | Cut-off Date LTV: | 57.1% |
| Flushing, NY 11354 | UW NCF DSCR: | 1.33x | |
| UW NOI Debt Yield: | 10.4% |
The following table presents certain information relating to the tenancy at the Queens Crossing Property:
| Tenant Summary(1) | ||||||||||
| Tenant Name | Credit Rating (Fitch/Moody’s/ S&P)(2) | Tenant SF | Approx. % of SF | Annual UW Rent(2) | % of Total Annual UW Rent | Annual UW Rent PSF(2) | Renewal Options | |||
| Type | Termination Option (Y/N) | Lease Expiration | ||||||||
| TD Bank | Retail | NR/Aa1/NR | 5,455 | 5.7% | $1,703,618 | 19.8% | $312.30 | N | 1/31/2031 | 2 x 5 yr |
| New York Life Insurance Company | Office | NR/Aaa/AA+ | 16,630 | 17.5% | $1,288,825 | 15.0% | $77.50 | Y(3) | 3/31/2030 | 1 x 5 yr |
| STAT Urgent Care(4) | Retail | NR/NR/NR | 9,106 | 9.6% | $1,192,396 | 13.9% | $130.95 | N | 8/31/2027 | 1 x 5 yr |
| New Mulan L.L.C.(5) | Retail | NR/NR/NR | 20,096 | 21.1% | $1,008,767 | 11.7% | $50.20 | N | Various(6) | 1 x 5 yr |
| GV Café | Retail | NR/NR/NR | 12,730 | 13.4% | $931,368 | 10.8% | $73.16 | N | 3/31/2033 | 1 x 5 yr |
| Shinhan Bank America | Retail | NR/A1/A | 3,688 | 3.9% | $508,230 | 5.9% | $137.81 | N | 1/31/2025 | 1 x 5 yr |
| Paris Baguette | Retail | NR/NR/NR | 2,524 | 2.7% | $431,554 | 5.0% | $170.98 | N | 3/31/2033 | 1 x 5 yr |
| Shinsaku | Retail | NR/NR/NR | 15,708 | 16.5% | $418,717 | 4.9% | $26.66 | N | 10/31/2027 | 1 x 5 yr |
| KF Tea Main St. L.L.C. | Retail | NR/NR/NR | 688 | 0.7% | $155,070 | 1.8% | $225.39 | N | 11/30/2025 | 2 x 5 yr |
| Lotus Health Pharmacy | Retail | NR/NR/NR | 2,300 | 2.4% | $147,600 | 1.7% | $64.17 | N | 12/12/2031 | None |
| Total/Wtd. Avg. | 88,925 | 93.5% | $7,786,145 | 90.4% | $87.56 | |||||
| Other Tenants | 5,080 | 5.3% | $822,087 | 9.6% | $161.83 | |||||
| Occupied Collateral Total | 94,005 | 98.8% | $8,608,232 | 100.0% | $91.57 | |||||
| Vacant Space | 1,118 | 1.2% | ||||||||
| Total | 95,123 | 100.0% | ||||||||
| (1) | Based on the underwritten rent roll dated May 1, 2023, inclusive of (i) rent steps through April 2024, (ii) $92,831 in straight-line rent for investment grade tenants through the term of the Queens Crossing Whole Loan and (iii) $91,465 in straight-line rent for New York Life through its one-time termination option in September 2027. |
| (2) | Certain ratings are those of the parent company whether or not the parent guarantees the lease. |
| (3) | New York Life Insurance Company has a one-time termination option to vacate the entirety of its leased space no earlier than September 2027 with notice provided no later than September 2026. |
| (4) | STAT Urgent Care currently subleases (i) approximately 1,663 SF to Golden Baby Medical Counseling Group Inc. at $124.99 PSF; (ii) 726 SF to Sherman-Abrams Laboratory, Inc. at $100.79 PSF; (iii) 480 SF to QK Pharmacy Inc. at $141.91 PSF and (iv) 450 SF to Royal National Products Corp. at $124.56 PSF. Annual UW Rent is based on the STAT Urgent Care prime lease rent inclusive of rent steps through August 2023. |
| (5) | New Mulan L.L.C. is an affiliate of the borrower sponsor, which has a non-controlling, minority interest in the tenant. |
| (6) | New Mulan L.L.C has 19,650 SF of space expiring in February 2027 and 446 SF of space expiring in November 2027. |
The following table presents certain information relating to the lease rollover schedule at the Queens Crossing Property:
| Lease Rollover Schedule(1)(2) | ||||||||
| Year | # of Leases Rolling | SF Rolling | UW Rent PSF Rolling | Approx. % of Total SF Rolling | Approx. Cumulative % of SF Rolling | Total UW Rent Rolling | Approx. % of Total Rent Rolling | Approx. Cumulative % of Total Rent Rolling |
| MTM | 1 | 915 | $59.02 | 1.0% | 1.0% | $54,000 | 0.6% | 0.6% |
| 2023 | 0 | 0 | $0.00 | 0.0% | 1.0% | $0 | 0.0% | 0.6% |
| 2024 | 3 | 708 | $134.12 | 0.7% | 1.7% | $94,958 | 1.1% | 1.7% |
| 2025 | 3 | 4,596 | $174.88 | 4.8% | 6.5% | $803,763 | 9.3% | 11.1% |
| 2026 | 2 | 672 | $218.75 | 0.7% | 7.2% | $146,998 | 1.7% | 12.8% |
| 2027 | 5 | 45,428 | $60.75 | 47.8% | 55.0% | $2,759,549 | 32.1% | 44.8% |
| 2028 | 1 | 1,093 | $82.34 | 1.1% | 56.2% | $90,000 | 1.0% | 45.9% |
| 2029 | 0 | 0 | $0.00 | 0.0% | 56.2% | $0 | 0.0% | 45.9% |
| 2030 | 3 | 17,584 | $82.17 | 18.5% | 74.6% | $1,444,825 | 16.8% | 62.7% |
| 2031 | 2 | 7,755 | $238.71 | 8.2% | 82.8% | $1,851,218 | 21.5% | 84.2% |
| 2032 | 0 | 0 | $0.00 | 0.0% | 82.8% | $0 | 0.0% | 84.2% |
| 2033 & Beyond | 2 | 15,254 | $89.35 | 16.0% | 98.8% | $1,362,921 | 15.8% | 100.0% |
| Vacant | 0 | 1,118 | $0.00 | 1.2% | 100.0% | $0 | 0.0% | 100.0% |
| Total/Wtd. Avg. | 22 | 95,123 | $91.57 | 100.0% | $8,608,232 | 100.0% | ||
| (1) | Based on the underwritten rent roll dated May 1, 2023 inclusive of (i) rent steps through April 2024, (ii) $92,831 in straight-line rent for investment grade tenants through the term of the Queens Crossing Whole Loan and (iii) $91,465 in straight-line rent for New York Life through its one-time termination option in September 2027. |
| (2) | Certain tenants may have lease termination options that are exercisable prior to the originally stated expiration date of the related lease and are not considered in the lease rollover schedule. |
The Market. The Queens Crossing Property is located within the Downtown Flushing neighborhood of Queens, a significant retail destination in the outer boroughs of New York City. The majority of the Downtown Flushing retail market is comprised of ground floor retail within the base of residential and office buildings along with freestanding structures. According to the appraisal, as of 2022, the number of households, total population and average household income within the Queens Crossing primary trade area (defined as the surrounding 1-mile) was 40,736, 112,590 and $64,976, respectively.
The Queens Crossing Property is located in the Downtown Flushing retail market in the north-central portion of the borough of Queens. The market is accessed by multiple major thoroughfares and consists largely of self-contained communities. The Queens Crossing Property is located on the Main
| This is not a research report and was not prepared by any Underwriter’s research department. Please see additional important information and qualifications at the end of this Term Sheet. | ||
| T-107 | ||
| Mixed Use – Retail/Office | Loan #8 | Cut-off Date Balance: | $37,100,000 |
| 38-25 Main Street | Queens Crossing | Cut-off Date LTV: | 57.1% |
| Flushing, NY 11354 | UW NCF DSCR: | 1.33x | |
| UW NOI Debt Yield: | 10.4% |
Street corridor which, according to the appraisal, is the prime retail/commercial corridor of the area. As of the first quarter of 2023, the Downtown Flushing retail market was comprised of 412 buildings and 4,276,879 SF of retail space with a vacancy rate of 3.5%, average rental rates of $87.10 per SF and a positive net absorption of 44,152 SF. According to the appraisal, there is currently no ongoing retail construction in the submarket.
The table below presents certain information relating to comparable retail leases pertaining to the Queens Crossing Property identified by the appraisal:
| Comparable Retail Leases | ||||||
Property Name | Location |
Tenant Name | Lease Size (SF) | Lease Date | Rent PSF | Lease Term (Yrs.) |
| Queens Crossing Property(1) | 38-25 Main Street, Flushing, NY | Various | 77,375 | Various | $94.60 | Various |
| Tangram | 133-33 39th Avenue, Flushing, NY | Taier Yu | 3,381 | March 2023 | $135.00 | 10 |
| Flushing Commons | 38-08 Union Street, Flushing, NY | Chinese BBQ Restaurant | 3,266 | August 2022 | $140.00 | 10 |
| 136-53 Roosevelt Avenue | 136-53 Roosevelt Avenue, Flushing, NY | KFC | 1,400 | April 2022 | $176.00 | 10 |
| 141-57 Northern Boulevard | 141-57 Northern Boulevard, Flushing, NY | Enson Market | 15,600 | January 2022 | $57.26 | 10 |
| 140-15 Sanford Ave. | 140-15 Sanford Ave., Flushing, NY | Lenox Hill Imaging | 9,000 | December 2021 | $58.89 | 10 |
| Tangram | 133-33 39th Avenue, Flushing, NY | Xiao Long Kan | 5,029 | November 2021 | $105.00 | 10 |
| 146-17 Northern Boulevard | 146-17 Northern Boulevard, Flushing, NY | Adult Daycare | 6,288 | June 2021 | $71.33 | 15 |
| 39-01 Main Street | 39-01 Main Street, Flushing, NY | Mix N Match | 1,000 | February 2021 | $175.00 | 5 |
| 171-50 Northern Boulevard | 171-50 Northern Boulevard, Flushing, NY | Popeyes | 5,000 | December 2020 | $75.00 | 10 |
| Flushing Commons | 38-08 Union Street, Flushing, NY | Empire Health | 4,990 | January 2020 | $132.00 | 5 |
| 37-19 Main Street | 37-19 Main Street, Flushing, NY | Offering | 2,500 | April 2023 | $240.00 | 10 |
| 36-63 Main Street | 36-63 Main Street, Flushing, NY | Offering | 10,000 | April 2023 | $150.00 | 10 |
Source: Appraisal.
| (1) | The Queens Crossing Property Lease Size (SF) and Rent PSF includes the occupied retail tenants at the Queens Crossing Property based on the underwritten rent roll dated May 1, 2023. |
The Queens Crossing Property is located in the Northeast Queens office market, which is the second largest office market in Queens. As of the first quarter of 2023, the Northeast Queens office market was comprised of 824 buildings and 14,286,488 SF with a vacancy rate of 2.3%, average rental rate of $40.80 per SF and a positive net absorption of 15,791 SF. According to the appraisal, Northeast Queens’ lack of higher-quality Class A office space should continue to push rents up in the long-term, cautiously pointing towards a stable long-term outlook for the market. There are currently two office properties under construction and one proposed office property, accounting for approximately 260,068 SF with an anticipated delivery by 2024.
The table below presents certain information relating to comparable office properties pertaining to the Queens Crossing Property identified by the appraisal:
| Comparable Office Leases | ||||||||
Property Name | Location |
Year Built | Tenant Name | Tenant Size (SF) | Rent PSF | Lease Date | Lease Term | Lease Type |
| Queens Crossing Property(1) | 38-25 Main Street, Flushing, NY | 2007 | New York Life Insurance Company | 16,630 | $77.50 | April 2020 | 10 | Mod. Gross |
| 133-38 Sanford Avenue | 133-38 Sanford Avenue, Flushing, NY | 2005 | Confidential Health Care | 12,000 | $80.00 | December 2022 | 10 | Mod. Gross |
| 135-28 37th Avenue | 135-28 37th Avenue, Flushing, NY | 1984 | Radnet | 9,000 | $56.00 | July 2022 | 10 | Mod. Gross |
| Flushing Commons | 38-08 Union Street, Flushing, NY | 2017 | Sanford Physical Therapy | 1,391 | $112.15 | June 2022 | 5 | Mod. Gross |
| Flushing Commons | 38-08 Union Street, Flushing, NY | 2017 | Confidential | 2,142 | $65.00 | April 2022 | 10 | Mod. Gross |
| 37-20 Prince Street | 37-20 Prince Street, Flushing, NY | 2008 | Amlotus Language/Career School | 3,024 | $53.45 | August 2021 | 5 | Mod. Gross |
| 39-07 Prince Street | 39-07 Prince Street, Flushing, NY | 2001 | Elite Planning Services | 1,696 | $53.77 | July 2021 | 3 | Mod. Gross |
Source: Appraisal.
| (1) | The Queens Crossing Property Tenant Size (SF), Rent PSF, Lease Date and Lease Term are based on the underwritten rent roll dated May 1, 2023. |
| This is not a research report and was not prepared by any Underwriter’s research department. Please see additional important information and qualifications at the end of this Term Sheet. | ||
| T-108 | ||
| Mixed Use – Retail/Office | Loan #8 | Cut-off Date Balance: | $37,100,000 |
| 38-25 Main Street | Queens Crossing | Cut-off Date LTV: | 57.1% |
| Flushing, NY 11354 | UW NCF DSCR: | 1.33x | |
| UW NOI Debt Yield: | 10.4% |
The following table presents certain information relating to the appraisal’s market rent conclusion for the Queens Crossing Property:
| Market Rent Summary | ||||||
Ground Floor: (TD Bank) Corner - Main & 39th | Ground Floor: (Shinhan Bank) 39th Ave. | Ground Floor (Large): (Tai Shan) 38th Ave. | Ground Floor (Small): 39th Ave. | Ground Floor (Small): In-line | 1st Floor: (Urgent Care) 39th Ave. | |
| Market Rent (PSF) | $250.00 | $125.00 | $70.00 | $400.00 | $75.00 | $125.00 |
| Lease Term (Years) | 10 | 10 | 10 | 5 | 5 | 10 |
| Lease Type (Reimbursements) | Mod. Gross | Mod. Gross | Mod. Gross | Mod. Gross | Mod. Gross | Mod. Gross |
| TI’s (New/Renewal) | $20.00 / $10.00 | $20.00 / $10.00 | $20.00 / $10.00 | $10.00 / $5.00 | $10.00 / $5.00 | $20.00 / $10.00 |
| LC’s (New/Renewal) | 4.00% / 2.0% | 4.00% / 2.0% | 4.00% / 2.0% | 4.88% / 2.4% | 4.88% / 2.4% | 4.00% / 2.0% |
| Rent Increase Projection | 3.0% / year | 3.0% / year | 3.0% / year | 3.0% / year | 3.0% / year | 3.0% / year |
Source: Appraisal.
| Market Rent Summary (continued) | ||||||
1st Floor: (Paris) 39th Ave. | 1st Floor: (Lotus) 38th Ave. | Food Court: (Small < 1,000 SF) | Food Court: (Large > 1,000 SF) | 2nd Floor: Restaurant | Office | |
| Market Rent (PSF) | $165.00 | $55.00 | $225.00 | $85.00 | $50.00 | $75.00 |
| Lease Term (Years) | 10 | 10 | 5 | 5 | 10 | 10 |
| Lease Type (Reimbursements) | Mod. Gross | Mod. Gross | Mod. Gross | Mod. Gross | Mod. Gross | Mod. Gross |
| TI’s (New/Renewal) | $20.00 / $10.00 | $20.00 / $10.00 | $0.00 / $0.00 | $0.00 / $0.00 | $20.00 / $10.00 | $40.00 / $20.00 |
| LC’s (New/Renewal) | 4.00% / 2.0% | 4.00% / 2.0% | 4.88% / 2.4% | 4.88% / 2.4% | 4.00% / 2.0% | 4.00% / 2.0% |
| Rent Increase Projection | 3.0% / year | 3.0% / year | 3.0% / year | 3.0% / year | 3.0% / year | 2.5% / year |
Source: Appraisal.
| This is not a research report and was not prepared by any Underwriter’s research department. Please see additional important information and qualifications at the end of this Term Sheet. | ||
| T-109 | ||
| Mixed Use – Retail/Office | Loan #8 | Cut-off Date Balance: | $37,100,000 |
| 38-25 Main Street | Queens Crossing | Cut-off Date LTV: | 57.1% |
| Flushing, NY 11354 | UW NCF DSCR: | 1.33x | |
| UW NOI Debt Yield: | 10.4% |
Operating History and Underwritten Net Cash Flow. The following table presents certain information relating to the historical operating performance and Underwritten Net Cash Flow at the Queens Crossing Property:
| Cash Flow Analysis | ||||||||
| 2019 | 2020 | 2021 | 2022 | UW(1) | UW PSF | |||
| Base Rent(2) | $8,470,054 | $6,734,811 | $6,953,798 | $7,771,503 | $8,608,232 | $90.50 | ||
| Grossed Up Vacant Space | $0 | $0 | $0 | $0 |
| $187,050 |
| $1.97 |
| Gross Potential Rent | $8,470,054 | $6,734,811 | $6,953,798 | $7,771,503 | $8,795,282 | $92.46 | ||
| Reimbursements | $0 | $0 | $0 | $0 | $429,068 | $4.51 | ||
| Gross Potential Income | $8,470,054 | $6,734,811 | $6,953,798 | $7,771,503 | $9,224,350 | $96.97 | ||
| (Vacancy) | $0 | $0 | $0 | $0 | ($368,974) | ($3.88) | ||
| Parking Income(3) | $339,000 | $348,276 | $357,828 | $367,668 |
| $700,000 |
| $7.36 |
| Effective Gross Income | $8,809,054 | $7,083,087 | $7,311,626 | $8,139,171 | $9,555,376 | $100.45 | ||
| Real Estate Taxes(4) | $416,102 | $420,364 | $459,319 | $500,564 | $ 1,236,587 | $13.00 | ||
| Insurance | $116,672 | $135,004 | $152,053 | $129,997 | $164,460 | $1.73 | ||
| Management Fee | $264,272 | $212,493 | $219,349 | $244,175 | $286,661 | $3.01 | ||
| Other Operating Expenses | $2,167,998 | $2,021,435 | $1,846,101 | 1,946,579 |
| $1,942,645 |
| $20.42 |
| Total Operating Expenses | $2,965,044 | $2,789,296 | $2,676,822 | $2,821,315 | $3,630,353 | $38.16 | ||
| Net Operating Income | $5,844,010 | $4,293,791 | $4,634,804 | $5,317,856 | $5,925,023 | $62.29 | ||
| Replacement Reserves | $0 | $0 | $0 | $0 | $26,948 | $0.28 | ||
| TI/LC | $0 | $0 | $0 | $0 |
| $90,246 |
| $0.95 |
| Net Cash Flow | $5,844,010 | $4,293,791 | $4,634,804 | $5,317,856 | $5,807,829 | $61.06 | ||
| Occupancy % | 100.0% | 99.5% | 99.0% | 98.8% | (5) | 96.0% | (5) | |
| NOI DSCR(6) | 1.34x | 0.98x | 1.06x | 1.22x | 1.36x | |||
| NCF DSCR(6) | 1.34x | 0.98x | 1.06x | 1.22x | 1.33x | |||
| NOI Debt Yield(6) | 10.2% | 7.5% | 8.1% | 9.3% | 10.4% | |||
| NCF Debt Yield(6) | 10.2% | 7.5% | 8.1% | 9.3% | 10.2% | |||
| (1) | Based on the underwritten rent roll dated May 1, 2023. |
| (2) | UW Base Rent is inclusive of (i) rent steps through April 2024, (ii) $92,831 in straight-line rent for investment grade tenants through the term of the Queens Crossing Whole Loan and (iii) $91,465 in straight-line rent for New York Life through its one-time termination option in September 2027. |
| (3) | The increase in UW Parking Income from 2022 Parking Income is attributable to increased contract rent under the borrower sponsor affiliated lease. Based on comparable parking leases identified by the appraisal, the current contractual parking rent is approximately 49.4% below market. |
| (4) | UW Real Estate Taxes are based on the average projected tax payments over the five-year loan term. The Queens Crossing Property is subject to an ICIP tax abatement with a current abatement of 64.1%. The tax abatement burns off in phases through 2032. |
| (5) | UW Occupancy % represents economic occupancy. Historical occupancies represent physical occupancies. 2022 Occupancy is based on the underwritten rent roll dated as of May 1, 2023. |
| (6) | Debt service coverage ratios and debt yields are based on the aggregate balance of the Queens Crossing Whole Loan. |
Escrows and Reserves.
At loan origination, the borrower deposited (i) $1,000,000 into a TI/LC reserve, (ii) $415,000 into a real estate tax reserve, (iii) $30,000 into an insurance reserve and (iv) $2,246 into a replacement reserve.
Real Estate Taxes – On each monthly due date, the borrower is required to deposit an amount equal to 1/12 of the estimated annual real estate taxes (initially $85,000) into a real estate tax reserve account.
Insurance – On each monthly due date, the borrower is required to deposit an amount equal to 1/12 of estimated insurance premiums (initially $15,000) into an insurance reserve account.
Replacement Reserves – On each monthly due date, the borrower is required to deposit $2,246 into a replacement reserve.
TI/LC Reserves – On each monthly due date, the borrower is required to deposit approximately $15,854 into a tenant improvements and leasing commissions reserve, provided that such deposits will not be required at any time that the amount in such reserve is at least $750,000.
Condo Assessments Reserve – On each monthly due date during a Cash Sweep Event (as defined below), the borrower is required to deposit into a condominium assessment reserve an amount at least equal to the aggregate amount of condominium assessments due from the borrower to the condominium association for the next ensuing one month period as determined by the lender.
Lockbox and Cash Management. The Queens Crossing Whole Loan is structured with a hard lockbox and springing cash management. All funds in the lockbox accounts will be swept to an account designated by the borrower, unless a Cash Sweep Event is continuing, in which case such funds are required to be swept on each business day into a cash management account controlled by the lender, at which point, following payment of taxes and insurance, bank fees, debt service, required reserves and operating expenses, all funds are required to be deposited into an excess cash flow reserve to be held by the lender as additional security for the Queens Crossing Whole Loan and disbursed in accordance with the terms of the Queens Crossing Whole Loan documents.
| This is not a research report and was not prepared by any Underwriter’s research department. Please see additional important information and qualifications at the end of this Term Sheet. | ||
| T-110 | ||
| Mixed Use – Retail/Office | Loan #8 | Cut-off Date Balance: | $37,100,000 |
| 38-25 Main Street | Queens Crossing | Cut-off Date LTV: | 57.1% |
| Flushing, NY 11354 | UW NCF DSCR: | 1.33x | |
| UW NOI Debt Yield: | 10.4% |
A “Cash Sweep Event” means the occurrence of (a) an event of default under the Queens Crossing Whole Loan documents, (b) any bankruptcy action against (x) the borrower or (y) any property manager that is affiliated with the borrower or guarantor, which for the avoidance of doubt, includes the current property manager, (c) DSCR Trigger Event (as defined below) or (d) a TD Bank Trigger Event (as defined below).
A Cash Sweep Event will be cured upon the occurrence of the following: (i) with respect to clause (a) above, the acceptance by the lender of a cure of such event of default in accordance with the Queens Crossing Whole Loan documents, (ii) with respect to clause (b)(y) above, (x) if the borrower replaces such property manager with a “qualified manager” (as fully described in the Queens Crossing Whole Loan documents) under a replacement management agreement acceptable to the lender or (y) if such bankruptcy action involves the filing of an involuntary petition against an affiliated property manager, and such affiliated property manager, the borrower, the guarantor or their respective affiliates do not collude with, or otherwise assist petitioning creditors for any insolvency petition against such affiliated property manager, if such involuntary petition is discharged, stayed or dismissed within 60 days of such filing without any adverse consequences to the Queens Crossing Whole Loan or the Queens Crossing Property as determined by the lender in its sole discretion, (iii) with respect to clause (b)(x) above, if such bankruptcy action involves the filing of an involuntary petition against the borrower, and such action is not consented to or colluded in by the borrower, guarantor or any of their affiliates, if such involuntary petition is discharged, stayed or dismissed within 60 days of such filing without any adverse consequences to the Queens Crossing Whole Loan or the Queens Crossing Property as determined by the lender in its sole discretion (iv) with respect to clause (c) above, the cure of such DSCR Trigger Event in accordance with the Queens Crossing Whole Loan documents, or (v) with respect to clause (d) above, the cure of such TD Bank Trigger Event; provided, however, (A) no event of default has occurred and is continuing under the Queens Crossing Whole Loan documents, (B) a Cash Sweep Event cure described in clauses (i) and (ii) above may occur no more than a total of four times in the aggregate during the term of the Queens Crossing Whole Loan, (C) the borrower has paid all of the lender’s reasonable out-of-pocket expenses incurred in connection with such Cash Sweep Event cure including reasonable out-of-pocket attorney’s fees and expenses, and (D) in no event may the borrower cure a Cash Sweep Event caused by a bankruptcy of the borrower, except as described in clause (iii) above.
A “TD Bank Trigger Event” means the occurrence of any of the following: (a) any bankruptcy action of TD Bank, (b) TD Bank "goes dark," vacates or abandons its premises at the Queens Crossing Property, or (c) TD Bank gives written notice of its intention to "go dark," vacate or abandon its premises at the Queens Crossing Property.
A TD Bank Trigger Event may be cured upon the occurrence of the following: (i) with respect to clause (a) above, (x) the borrower enters into a new lease or leases for at least 90% of the space demised to TD Bank in accordance with the Queens Crossing Whole Loan documents and the rent payable thereunder equals or exceeds the rent payable under the TD Bank lease or (y) TD Bank has assumed or affirmed the TD Bank lease in connection with such bankruptcy action without modification and otherwise in a manner reasonably acceptable to the lender and the lender receives an updated tenant estoppel certificate from TD Bank that is reasonably acceptable to the lender confirming, among other things, (1) the TD Bank lease is in full force and effect, (2) TD Bank is in physical occupancy of the space demised to TD Bank under its lease and is paying full contractual rent in an amount at least equal to the rent set forth in the TD Bank lease unless otherwise approved by the lender, and (3) there is no default by the borrower under the TD Bank lease beyond any applicable notice and/or cure periods; or (ii) with respect to clauses (b) or (c) above, (x) the borrower enters into a new lease or leases for at least 90% of the space demised to TD Bank in accordance with the Queens Crossing Whole Loan documents and the rent payable thereunder equals or exceeds the rent payable under the TD Bank lease, (y) TD Bank has no longer "gone dark", vacated or abandoned its premises at the Queens Crossing Property, or (z) TD Bank has rescinded its notice of its intention to "go dark", vacate or abandon its demised premises at the Queens Crossing Property in accordance with the Queens Crossing Whole Loan documents.
A “DSCR Trigger Event” means the occurrence of either: (i) that as of the date of determination, the debt service coverage ratio based on the trailing three month period immediately preceding the date of such determination is less than 1.10x, unless prior to the occurrence of, or simultaneously upon, such trigger event, the lender received either (x) an amount which, if used to reduce the outstanding principal balance of the Queens Crossing Whole Loan upon the occurrence of a DSCR Trigger Event, would be sufficient to cause the calculation of the debt service coverage ratio for such period to equal or exceed 1.10x (which may be in the form of a cash deposit or letter of credit) or (y) as of such date of determination, an amount, as determined by the lender, equal to the difference between the aggregate amount of excess cash flow which would be available during the next succeeding 12 month period (A) assuming that the Queens Crossing Property achieves and maintains a debt service coverage ratio of 1.15x throughout such 12 month period, and (B) assuming that the Queens Crossing Property achieves and maintains a debt service coverage ratio of 1.00x throughout such 12 month period (the “DSCR Sweep Avoidance Amount”); or (ii) the borrower prevented a DSCR Trigger Event from occurring in accordance with clause (i)(y) above and a DSCR Trigger Event continues on or after 12 months after the date on which the borrower deposited with the lender the DSCR Sweep Avoidance Amount; provided, however, it will not be a DSCR Trigger Event if the borrower has, at any time prior to the expiration of such 12 month period, deposited with the lender an additional DSCR Sweep Avoidance Amount at least 30 days prior to the expiration of such 12 month period.
Additional Secured Indebtedness (not including trade debts). In addition to the Queens Crossing Mortgage Loan, the Queens Crossing Property also secures the Queens Crossing Serviced Pari Passu Companion Loan, which has an aggregate Cut-off Date principal balance of $20,000,000. The Queens Crossing Serviced Pari Passu Companion Loan accrues interest at the same rate as the Queens Crossing Mortgage Loan. The Queens Crossing Mortgage Loan is entitled to payments of principal and interest on a pro rata and pari passu basis with the Queens Crossing Serviced Pari Passu Companion Loan. The holders of the Queens Crossing Mortgage Loan and the Queens Crossing Serviced Pari Passu Companion Loan have entered into a co-lender agreement which sets forth the allocation of collections on the Queens Crossing Whole Loan. See “Description of the Mortgage Pool—The Whole Loans—
The Serviced Pari Passu Whole Loans” in the prospectus.
Mezzanine Loan and Preferred Equity. None permitted.
Release of Property. The Queens Crossing Whole Loan documents permit the borrower to obtain the release of the condominium units that comprise all of the office space (currently occupied by New York Life) at the Queens Crossing Property ("Office Release Unit”) in connection with a transfer to an unaffiliated party on and after the earlier of (a) the second anniversary of the closing date of the securitization that includes the last promissory note to be securitized and (b) June 5, 2026; provided that, among other conditions: (i) the borrower prepays an amount of the principal balance of the Mortgage Loan that equals or exceeds $10,000,000 (which amount represents 125% of the amount of the Queens Crossing Whole Loan allocated to the Office Release Unit) (the “Release Amount”); (ii) after giving effect to such release, the loan to value ratio, as determined by the lender does not exceed 57.1%; (iii) after giving effect to the release of the Office Release Unit, the debt service coverage ratio for the then-remaining Queens Crossing Property is equal to or greater than the greater of (x) 1.30x and (y) the debt service coverage ratio immediately preceding such release of the Office Release Unit, (iv) the borrower provides evidence reasonably satisfactory to the lender that the release of the Office Release Unit will not constitute a default by the borrower under the applicable condominium documents; and (v) satisfaction of customary REMIC requirements.
| This is not a research report and was not prepared by any Underwriter’s research department. Please see additional important information and qualifications at the end of this Term Sheet. | ||
| T-111 | ||
| Mixed Use – Retail/Office | Loan #8 | Cut-off Date Balance: | $37,100,000 |
| 38-25 Main Street | Queens Crossing | Cut-off Date LTV: | 57.1% |
| Flushing, NY 11354 | UW NCF DSCR: | 1.33x | |
| UW NOI Debt Yield: | 10.4% |
Real Estate Substitution. None.
Letter of Credit. None.
Right of First Offer/Right of First Refusal. None.
Ground Lease. None.
Terrorism Insurance. The borrower is required to maintain terrorism insurance in an amount equal to the full replacement cost of the Queens Crossing Property plus the cost of rental loss and/or business interruption coverage. For so long as the Terrorism Risk Insurance Program Reauthorization Act of 2015 (“TRIPRA”) is in effect and continues to cover both foreign and domestic acts, the lender must accept terrorism insurance with coverage against acts which are “certified” within the meaning of TRIPRA. See “Risk Factors—Risks Relating to the Mortgage Loans—Terrorism Insurance May Not Be Available for All Mortgaged Properties” in the prospectus.
| This is not a research report and was not prepared by any Underwriter’s research department. Please see additional important information and qualifications at the end of this Term Sheet. | ||
| T-112 | ||
| Mixed Use – Office/Retail | Loan #9 | Cut-off Date Balance: | $36,000,000 |
| 503-511 Broadway | 503-511 Broadway | Cut-off Date LTV: | 38.7% |
| New York, NY 10012 | U/W NCF DSCR: | 1.39x | |
| U/W NOI Debt Yield: | 10.5% |
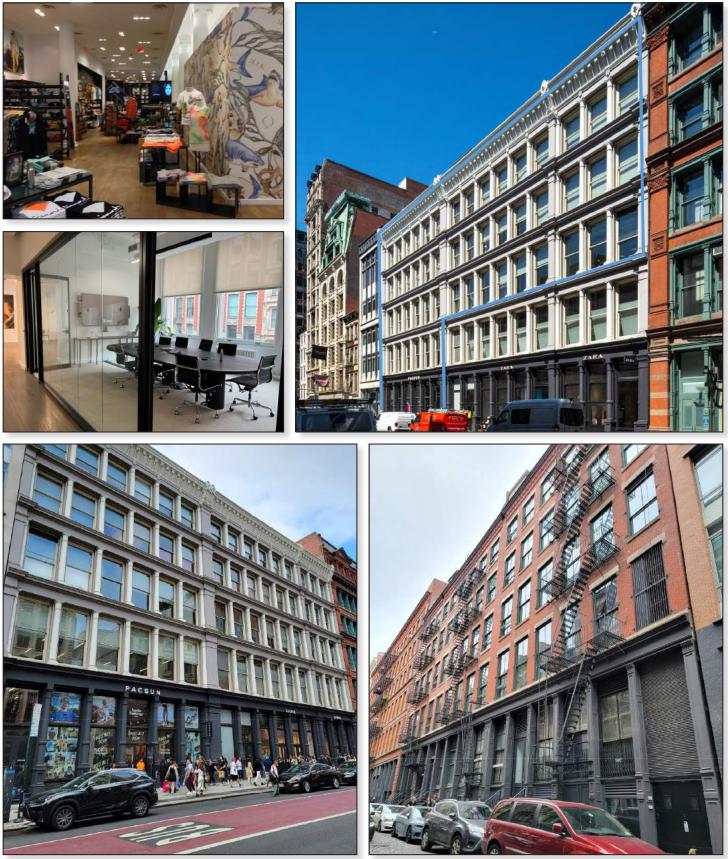
| This is not a research report and was not prepared by any Underwriter’s research department. Please see additional important information and qualifications at the end of this Term Sheet. | ||
| T-113 | ||
| Mixed Use – Office/Retail | Loan #9 | Cut-off Date Balance: | $36,000,000 |
| 503-511 Broadway | 503-511 Broadway | Cut-off Date LTV: | 38.7% |
| New York, NY 10012 | U/W NCF DSCR: | 1.39x | |
| U/W NOI Debt Yield: | 10.5% |

| This is not a research report and was not prepared by any Underwriter’s research department. Please see additional important information and qualifications at the end of this Term Sheet. | ||
| T-114 | ||
| Mixed Use – Office/Retail | Loan #9 | Cut-off Date Balance: | $36,000,000 |
| 503-511 Broadway | 503-511 Broadway | Cut-off Date LTV: | 38.7% |
| New York, NY 10012 | U/W NCF DSCR: | 1.39x | |
| U/W NOI Debt Yield: | 10.5% |
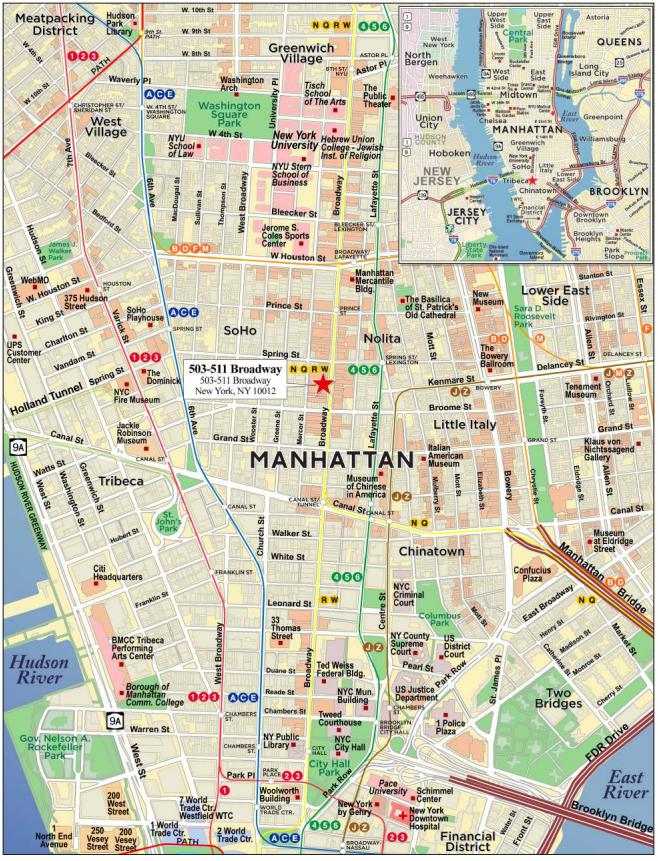
| This is not a research report and was not prepared by any Underwriter’s research department. Please see additional important information and qualifications at the end of this Term Sheet. | ||
| T-115 | ||
| Mortgage Loan No. 9 – 503-511 Broadway |
| Mortgage Loan Information | Mortgaged Property Information | |||||
| Mortgage Loan Seller: | MSMCH | Single Asset/Portfolio: | Single Asset | |||
| Credit Assessment (Fitch/Moody’s/KBRA): | NR/NR/NR | Location: | New York, NY 10012 | |||
| Original Balance(1): | $36,000,000 | General Property Type: | Mixed Use | |||
| Cut-off Date Balance(1): | $36,000,000 | Detailed Property Type: | Office/Retail | |||
| % of Initial Pool Balance: | 5.3% | Title Vesting: | Fee | |||
| Loan Purpose: | Refinance | Year Built/Renovated: | 1900 / 2020 | |||
| Borrower Sponsor: | HSR Corp. | Size: | 121,164 SF | |||
| Guarantor: | HSR Corp. | Cut-off Date Balance Per SF(1): | $479 | |||
| Mortgage Rate: | 7.3600% | Maturity Date Balance Per SF(1): | $479 | |||
| Note Date: | 6/7/2023 | Property Manager: | HSRC Management LLC | |||
| First Payment Date: | 8/1/2023 | (borrower-related) | ||||
| Maturity Date: | 7/1/2028 | |||||
| Original Term to Maturity: | 60 months | |||||
| Original Amortization Term: | 0 months | |||||
| IO Period: | 60 months | |||||
| Seasoning: | 0 months | |||||
| Prepayment Provisions: | L(24),D(29),O(7) | Underwriting and Financial Information | ||||
| Lockbox/Cash Mgmt Status: | Hard/In Place | UW NOI: | $6,112,078 | |||
| Additional Debt Type(1)(2): | Pari Passu | UW NOI Debt Yield(1): | 10.5% | |||
| Additional Debt Balance(1)(2): | $22,000,000 | UW NOI Debt Yield at Maturity(1): | 10.5% | |||
| Future Debt Permitted (Type): | No (NAP) | UW NCF DSCR: | 1.39x | |||
| Reserves(3) | Most Recent NOI: | $7,995,502 (12/31/2022) | ||||
| Type | Initial | Monthly | Cap | 2nd Most Recent NOI: | $8,608,459 (12/31/2021) | |
| RE Taxes: | $1,202,651 | $200,442 | NAP | 3rd Most Recent NOI: | $5,187,283 (12/31/2020) | |
| Insurance: | $32,796 | $16,398 | NAP | Most Recent Occupancy: | 79.4% (12/31/2022) | |
| Replacement Reserve: | $0 | $2,353 | NAP | 2nd Most Recent Occupancy: | 100.0% (12/31/2021) | |
| TI/LC Reserve: | $0 | $25,243 | $1,211,640 | 3rd Most Recent Occupancy: | 100.0% (12/31/2020) | |
| PacSun Free Rent Reserve: | $277,778 | $0 | NAP | Appraised Value (as of): | $150,000,000 (3/24/2023) | |
| PacSun TI Reserve: | $500,000 | $0 | NAP | Appraised Value per SF: | $1,238 | |
| Roof Leak Reserve: | $28,500 | $0 | NAP | Cut-off Date LTV Ratio(1): | 38.7% | |
| TI/LC Lease Up Reserve: | $3,500,000 | $0 | NAP | Maturity Date LTV Ratio(1): | 38.7% | |
| Sources and Uses | ||||||
| Sources | Proceeds | % of Total | Uses | Proceeds | % of Total | |
| Whole Loan Amount: | $58,000,000 | 89.3% | Loan Payoff: | $58,998,007 | 90.9% | |
| Borrower Equity: | $6,934,601 | 10.7% | Reserves: | $5,541,726 | 8.5% | |
| Closing Costs: | $394,868 | 0.6% | ||||
| Total Sources: | $64,934,601 | 100.0% | Total Uses: | $64,934,601 | 100.0% | |
| (1) | The 503-511 Broadway Mortgage Loan (as defined below) is part of the 503-511 Broadway Whole Loan (as defined below), which is comprised of three pari passu senior promissory notes with an aggregate original principal balance of $58,000,000. The Cut-off Date Balance Per SF, Maturity Date Balance Per SF, UW NCF DSCR, UW NOI Debt Yield, UW NOI Debt Yield at Maturity, Cut-off Date LTV Ratio and Maturity Date LTV Ratio numbers presented above are based on the aggregate Cut-off Date principal balance of the 503-511 Broadway Whole Loan. |
| (2) | See “The Mortgage Loan” and “Additional Secured Indebtedness (not including trade debts)” for a discussion of additional indebtedness. |
| (3) | See “Escrows and Reserves” below for further discussion of reserve requirements. |
The Mortgage Loan. The ninth largest mortgage loan (the “503-511 Broadway Mortgage Loan”) is part of a whole loan (the “503-511 Broadway Whole Loan”) evidenced by three pari passu promissory notes with an aggregate original principal balance of $58,000,000. The 503-511 Broadway Whole Loan is secured by a first priority fee mortgage encumbering a 121,164 SF mixed use Class A office/retail property located in New York, New York (the “503-511 Broadway Property”). The 503-511 Broadway Mortgage Loan is evidenced by the controlling Note A-1 and the non-controlling Note A-2-1 with an original aggregate principal balance of $36,000,000. The non-controlling Note A-2-2 with an original principal balance of $22,000,000 (the “503-511 Broadway Serviced Pari Passu Companion Loan”) is currently held by Morgan Stanley Bank, N.A. and is expected to be contributed to one or more future securitization transactions. The 503-511 Broadway Whole Loan will be serviced under the BANK5 2023-5YR2 pooling and servicing agreement. See “Description of the Mortgage Pool—The Whole Loans—The Serviced Pari Passu Whole Loans” and “Pooling and Servicing Agreement” in the prospectus.
| 503-511 Whole Loan Summary | ||||
| Note | Original Balance | Cut-off Date Balance | Note Holder | Controlling Note |
| A-1 | $35,000,000 | $35,000,000 | BANK5 2023-5YR2 | Yes |
| A-2-1 | $1,000,000 | $1,000,000 | BANK5 2023-5YR2 | No |
| A-2-2 | $22,000,000 | $22,000,000 | Morgan Stanley Bank, N.A. | No |
| Total | $58,000,000 | $58,000,000 | ||
| This is not a research report and was not prepared by any Underwriter’s research department. Please see additional important information and qualifications at the end of this Term Sheet. | ||
| T-116 | ||
| Mixed Use – Office/Retail | Loan #9 | Cut-off Date Balance: | $36,000,000 |
| 503-511 Broadway | 503-511 Broadway | Cut-off Date LTV: | 38.7% |
| New York, NY 10012 | U/W NCF DSCR: | 1.39x | |
| U/W NOI Debt Yield: | 10.5% |
The Borrower and the Borrower Sponsor. The borrower for the 503-511 Broadway Whole Loan is 507 Broadway LLC, a single-purpose, Delaware limited liability company with one independent director in its organizational structure. The borrower sponsor and non-recourse carveout guarantor is HSR Corp. Founded over 40 years ago, HSR Corp. and its affiliates are experienced in the acquisition, development, and management of prime real estate, the development and implementation of media business applications, and the manufacturing business in both the United States and China. HSR Corp.’s managing partners, William Fung, Steve Fung and Bruce Fung have over 100 years of combined experience owning, developing, financing and operating real estate across multiple asset types.
The Property. The 503-511 Broadway Property is a Class A, 5-story office and retail condominium unit totaling 121,164 SF located on the west side of Broadway between Spring Street and Broome Street in New York, New York. The ground floor of the 503-511 Broadway Property has 10,000 SF of retail space (8.3% of NRA, 22.3% of underwritten rent), while the rest of the 503-511 Broadway Property is office space (91.7% of NRA, 77.7% of underwritten rent). Built in 1900, the 503-511 Broadway Property was renovated in 1998, and from 2018-2022, the borrower spent approximately $8.9 million for basement, 2nd floor, and 3rd floor buildouts, façade restorations, and tenant improvements. As of December 31, 2022, the 503-511 Broadway Property was 79.4% occupied by three office tenants and one retail tenant. The 503-511 Broadway Property, along with the entire SoHo Cast Iron Historic District consisting of 26 blocks and 500 buildings, was given historical landmark status from the New York City Landmarks Preservation Commission (the “NYLCP”) in 1973 as an effort to preserve the city’s cultural and historic heritage of the brick, stone, mixed iron and masonry commercial construction of the post-Civil War period. As a result, the 503-511 Broadway Property requires additional approvals from the NYLCP in advance for any alteration, reconstruction, demolition, or new construction affecting the property.
The 503-511 Broadway Property is one of two units in a larger mixed-use condominium building totaling 168,652 SF. The borrower sponsor acquired the condominium building in 1982 and operated it a as a multi-tenant mixed use property until 2015, at which time the building was bifurcated into 2 condominium units to facilitate the sale of one of the new condominium units (the “Zara Condo Unit”), comprised of 45,000 SF (15,000 SF on each of the ground floor, second floor and lower level) to an affiliate of Zara. Zara currently operates a store in such condominium unit. The other condominium unit is comprised of the 503-511 Broadway Property (the “503-511 Broadway Condo Unit”). The 503-511 Broadway Condo Unit has a 73.23% interest in the common elements. The condominium building is governed by a board of three managers; one of whom is designated by the Zara Condo Unit, and two of whom are designated by the 503-511 Broadway Condo Unit. Board decisions are generally made by majority vote, however, the vote of the Zara Condo Unit is required for certain decisions, including, among other things, executing and recording a restatement of the condominium declaration and bylaws, certain amendments of the condominium documents, changing members of the board, borrowing money on behalf of the condominium involving repairs of common elements in excess of $50,000, compromising or settling condemnation awards, or appointing a managing agent. The 503-511 Broadway Condo Unit’s pro rata share of most common area expenses is 72.08%. The 503-511 Broadway Condo Unit’s pro rata share is 40% for sidewalk repairs, sidewalk bridges and planting located on the street level on the sidewalks, is 73.3% for façade, windows, general exterior repairs and scaffolding, and is 93.13% for the superintendent and the porter.
Major Tenants.
JRSK Inc. (56,494 SF, 46.6% of NRA, 45.5% of underwritten rent). 82 Mercer LLC (the “Away Tenant”) is a wholly owned subsidiary of JRSK Inc. d/b/a Away (“Away”), which is an American luggage and travel accessories retailer based in New York, New York. Away is a direct-to-consumer retailer, which allows the company to sell directly to consumers without third-party wholesalers or distributors. Founded in 2015, Away primarily sells products online, but also operates 12 stores in the United States, one store in Toronto, Canada, and one store in London, England. The Away Tenant expanded and relocated its headquarters to the 503-511 Broadway Property in 2018. The Away Tenant has a lease expiration date of November 30, 2029 and has no renewal options.
Bath & Body Works (25,000 SF, 20.6% of NRA, 25.5% of underwritten rent). Bath & Body Works (NYSE: BBWI) is an American specialty retail company specializing in the sale of soaps, lotions, fragrances, candles and more. Bath & Body Works was founded in 1963 and is based in Columbus, Ohio. As of January 28, 2023, Bath & Body Works merchandise was sold through 1,802 company-operated stores and e-commerce sites in the United States and Canada, and 427 stores and 31 e-commerce sites in more than 45 countries operating under franchise, license and wholesale arrangements. Bath & Body Works has been a tenant of office space at the 503-511 Broadway Property since 2000, has a lease expiration date of February 28, 2026, and has no renewal options.
Pacific Sunwear (10,000 SF, 8.3% of NRA, 22.3% of underwritten rent). Pacific Sunwear (“PacSun”) is an American retail clothing brand that sells lifestyle apparel, along with swimwear, footwear and accessories. As of 2022, PacSun operates approximately 400 stores in all 50 states and Puerto Rico. PacSun is headquartered in Anaheim, California and operates a distribution center in Groveport, Ohio. PacSun has been a tenant of the ground floor retail space at the 503-511 Broadway Property since 2020, has a lease expiration date of February 29, 2028, and has one, 5-year renewal option remaining. PacSun received free rent from November 2022 through October 2023. Remaining free rent was reserved for at origination.
| This is not a research report and was not prepared by any Underwriter’s research department. Please see additional important information and qualifications at the end of this Term Sheet. | ||
| T-117 | ||
| Mixed Use – Office/Retail | Loan #9 | Cut-off Date Balance: | $36,000,000 |
| 503-511 Broadway | 503-511 Broadway | Cut-off Date LTV: | 38.7% |
| New York, NY 10012 | U/W NCF DSCR: | 1.39x | |
| U/W NOI Debt Yield: | 10.5% |
The following table presents a summary regarding the tenants at the 503-511 Broadway Property:
| Tenant Summary(1) | |||||||||
| Tenant Name | Credit Ratings (Moody’s/S&P/Fitch)(2) | Tenant SF | Approx. % of SF | Annual UW Base Rent | % of Total Annual UW Base Rent | Annual UW Base Rent PSF | Lease Expiration | Termination Option (Y/N) | Renewal Options |
| Away Tenant | NR/NR/NR | 56,494 | 46.6% | $4,208,237 | 45.5% | $74.49 | 11/30/2029 | N | None |
| Bath & Body Works(3) | Ba2/BB/NR | 25,000 | 20.6% | $2,358,804 | 25.5% | $94.35 | 2/28/2026 | N | None |
| PacSun(4) | NR/NR/NR | 10,000 | 8.3% | $2,060,000 | 22.3% | $206.00 | 2/29/2028 | N | 1 x 5 year |
| Konrad(5) | NR/NR/NR | 4,670 | 3.9% | $622,427 | 6.7% | $133.28 | 12/31/2027 | N | 1 x 5 year |
| Subtotal/Wtd. Avg. | 96,164 | 79.4% | $9,249,468 | 100.0% | $96.18 | ||||
| Vacant Space | 25,000 | 20.6% | $0 | 0.0% | $0.00 | ||||
| Total/Wtd. Avg.(6) | 121,164 | 100.0% | $9,249,468 | 100.0% | $96.18 | ||||
| (1) | Information is based on the underwritten rent roll. |
| (2) | Certain ratings are those of the parent entity, whether or not the parent entity guarantees the lease. |
| (3) | Bath & Body Works currently occupies an additional 25,000 SF of office space that is currently dark and is being marketed for sublease. This space has been underwritten as vacant. |
| (4) | PacSun received free rent from November 2022 through October 2023. Remaining free rent was reserved for at origination. |
| (5) | Konrad is subleasing its space to DYDX Trading Inc. at an annual rent of $700,496 (approximately $150 PSF). The sublease is co-terminous with the prime lease. The space has been underwritten based on the prime lease. |
| (6) | Total/Wtd. Avg. Annual UW Base Rent PSF excludes vacant space. |
The following table presents certain information with respect to the lease rollover at the 503-511 Broadway Property:
| Lease Rollover Schedule(1) | ||||||||
| Year | # of Leases Rolling | SF Rolling | Annual UW Base Rent PSF Rolling | % of Total SF Rolling | Cumulative % of SF Rolling | Annual UW Base Rent Rolling | % of Annual UW Rent Rolling | Cumulative % of Annual UW Base Rent Rolling |
| 2023 | 0 | 0 | $0.00 | 0.0% | 0.0% | $0 | 0.0% | 0.0% |
| 2024 | 0 | 0 | $0.00 | 0.0% | 0.0% | $0 | 0.0% | 0.0% |
| 2025 | 0 | 0 | $0.00 | 0.0% | 0.0% | $0 | 0.0% | 0.0% |
| 2026 | 1 | 25,000 | $94.35 | 20.6% | 20.6% | $2,358,804 | 25.5% | 25.5% |
| 2027 | 1 | 4,670 | $133.28 | 3.9% | 24.5% | $622,427 | 6.7% | 32.2% |
| 2028 | 1 | 10,000 | $206.00 | 8.3% | 32.7% | $2,060,000 | 22.3% | 54.5% |
| 2029 & Beyond | 1 | 56,494 | $74.49 | 46.6% | 79.4% | $4,208,237 | 45.5% | 100.0% |
| Vacant | 0 | 25,000 | $0.00 | 20.6% | 100.0% | $0 | 0.0% | 100.0% |
| Total/Wtd. Avg. | 4 | 121,164 | $96.18 | 100.0% | $9,249,468 | 100.0% | ||
| (1) | Information is based on the underwritten rent roll. |
The Market. The 503-511 Broadway Property is located in New York, New York within the SoHo submarket of the New York office and retail markets. Since the 1970’s, the neighborhood has been the location of many artists’ lofts and art galleries and has also been known for its variety of shops ranging from trendy upscale boutiques to national and international chain store outlets. The 503-511 Broadway Property is located on the west side of Broadway between Spring Street and Broome Street, across the street from Bloomingdales. Public transportation options to the neighborhood include the N, R, Q, W, B, D, F, M and 6 subway lines. The nearest subway stations are the Spring Street station, serviced by the C/E trains located 2 blocks east of the 503-511 Broadway Property, the Prince Street station, serviced by the R/W trains located 1 block north of the 503-511 Broadway Property, and the Broadway-Lafayette station serviced by the B/D/F/M trains, located 3.5 blocks northeast of the 503-511 Broadway Property.
According to the appraisal, as of the fourth quarter of 2022, the vacancy rate in the SoHo office market was 14.1%, with average asking rents of $67.33 per SF and inventory of approximately 12.6 million SF. According to the appraisal, as of the fourth quarter of 2022, the vacancy rate in the New York office submarket was approximately 12.3%, with average asking rents of $57.13 per SF and inventory of approximately 975.9 million SF. According to the appraisal, as of the fourth quarter of 2022, the vacancy rate in the SoHo retail submarket was approximately 4.2%, with average asking rents of $127.25 per SF and inventory of approximately 5.8 million SF. According to the appraisal, as of the fourth quarter of 2022, the vacancy rate in the New York retail market was 4.1%, with average asking rents of $45.70 per SF and inventory of approximately 622.6 million SF. According to the appraisal, the 2023 estimated population and average household income within the 503-511 Broadway Property’s zip code are 22,126 and $200,399, respectively.
| This is not a research report and was not prepared by any Underwriter’s research department. Please see additional important information and qualifications at the end of this Term Sheet. | ||
| T-118 | ||
| Mixed Use – Office/Retail | Loan #9 | Cut-off Date Balance: | $36,000,000 |
| 503-511 Broadway | 503-511 Broadway | Cut-off Date LTV: | 38.7% |
| New York, NY 10012 | U/W NCF DSCR: | 1.39x | |
| U/W NOI Debt Yield: | 10.5% |
The following table presents certain information relating to the appraisal’s market rent conclusion for the 503-511 Broadway Property:
| Market Rent Summary | |||||||
| Category | Market Rent (PSF) | Reimbursements | Annual Escalation | Tenant Improvements PSF (New/Renewal) | Lease Term | Leasing Commissions (New) | Leasing Commissions (Renewal) |
| Upper Level Office: | $90.00 | Modified Gross | 3.0% per annum | $60.00 / $30.00 | 10 Years | 35.0% | 17.5% |
| Penthouse Office: | $145.00 | Modified Gross | 3.0% per annum | $60.00 / $30.00 | 10 Years | 35.0% | 17.5% |
| Lower Level Office: | $50.00 | Modified Gross | 3.0% per annum | $40.00 / $20.00 | 10 Years | 35.0% | 17.5% |
| Retail: | $200.00 | Modified Gross | 3.0% per annum | $50.00 / $25.00 | 10 Years | 35.0% | 17.5% |
Source: Appraisal
The following table presents recent leasing data at comparable office properties with respect to the 503-511 Broadway Property:
| Comparable Leases Summary | |||||||
| Property/Location | Year Built / Renovated | SF | Tenant Name | Tenant Size (SF) | Lease Date | Rent PSF | Lease Type |
503-511 Broadway (subject)(1) New York, NY | 1900 / 2020 | 121,164 | Away Tenant Bath & Body Works Konrad | 56,494 25,000 4,670 | Dec. 2018 Jan. 2016 Jul. 2017 | $74.49 $94.35 $133.28 | MG MG MG |
105 Wooster Street New York, NY | 1892 / 2004 | 55,459 | What Goes Around Comes Around | 4,500 | Jan. 2023 | $250.00 | MG |
530-536 Broadway New York, NY | 1900 / NAP | 195,672 | Armani Exchange | 5,447 | Sep. 2022 | $300.00 | MG |
514 Broadway New York, NY | 1900 / 2015 | 76,550 | Express Edit | 9,100 | Jul. 2022 | $168.75 | MG |
568 Broadway New York, NY | 1897 / 2013 | 305,398 | Athletic Propulsion Labs | 6,500 | May 2022 | $230.77 | MG |
490 Broadway New York, NY | 1857 / NAP | 28,829 | Paige Denim | 6,683 | Jun. 2022 | $79.00 | MG |
165 Mercer Street New York, NY | 1870 / 1990 | 25,475 | On Running | 9,053 | May 2022 | $85.00 | MG |
462 Broadway New York, NY | 1900 / 2018 | 141,050 | DoubleVerify Inc | 87,500 | Jan. 2022 | $75.00 | MG |
200 Lafayette Street New York, NY | 1900 / 2013 | 81,696 | Andreessen Horowitz | 33,560 | Dec. 2021 | $95.00 | MG |
Source: Appraisal, unless otherwise indicated.
| (1) | Information based on the underwritten rent roll other than year built / renovated and lease type. |
| This is not a research report and was not prepared by any Underwriter’s research department. Please see additional important information and qualifications at the end of this Term Sheet. | ||
| T-119 | ||
| Mixed Use – Office/Retail | Loan #9 | Cut-off Date Balance: | $36,000,000 |
| 503-511 Broadway | 503-511 Broadway | Cut-off Date LTV: | 38.7% |
| New York, NY 10012 | U/W NCF DSCR: | 1.39x | |
| U/W NOI Debt Yield: | 10.5% |
Operating History and Underwritten Net Cash Flow. The following table presents certain information relating to the historical operating performance and Underwritten Net Cash Flow at the 503-511 Broadway Property:
| Cash Flow Analysis | |||||||||||
| 2019(1) | 2020(1) | 2021 | 2022 | UW | UW PSF | ||||||
| Gross Potential Rent | $6,533,000 | $7,884,773 | $11,476,595 | $10,718,056 | $11,499,468(2) | $94.91 | |||||
| Reimbursements | $386,764 | $446,617 | $172,940 | $218,786 | $577,762 | $4.77 | |||||
| Less Vacancy & Credit Loss | $0 | $0 | $0 | $0 | ($2,423,426) | ($20.00) | |||||
| Effective Gross Income | $6,919,764 | $8,331,390 | $11,649,535 | $10,936,842 | $9,653,804 | $79.68 | |||||
| Real Estate Taxes | $2,247,917 | $2,309,582 | $2,088,322 | $1,878,623 | $2,419,702 | $19.97 | |||||
| Insurance | $126,177 | $133,819 | $139,069 | $165,203 | $196,778 | $1.62 | |||||
| Management Fee | $60,788 | $62,612 | $297,778 | $286,425 | $289,614 | $2.39 | |||||
| Other Operating Expenses | $724,702 | $638,094 | $515,907 | $611,090 | $635,631 | $5.25 | |||||
| Total Operating Expenses | $3,159,584 | $3,144,107 | $3,041,076 | $2,941,340 | $3,541,726 | $29.23 | |||||
| Net Operating Income | $3,760,180 | $5,187,283 | $8,608,459 | $7,995,502 | $6,112,078 | $50.44 | |||||
| Replacement Reserves | $0 | $0 | $0 | $0 | $24,233 | $0.20 | |||||
| TI/LC | $0 | $0 | $0 | $0 | $54,688 | $0.45 | |||||
| Net Cash Flow | $3,760,180 | $5,187,283 | $8,608,459 | $7,995,502 | $6,033,158 | $49.79 | |||||
| Occupancy % | 100.0% | (3) | 100.0% | (3) | 100.0% | (3) | 79.4% | (4) | 80.4% | (5) | |
| NOI DSCR(6) | 0.87x | 1.20x | 1.99x | 1.85x | 1.41x | ||||||
| NCF DSCR(6) | 0.87x | 1.20x | 1.99x | 1.85x | 1.39x | ||||||
| NOI Debt Yield(6) | 6.5% | 8.9% | 14.8% | 13.8% | 10.5% | ||||||
| NCF Debt Yield(6) | 6.5% | 8.9% | 14.8% | 13.8% | 10.4% | ||||||
| (1) | The 2019 and 2020 operating statements do not reflect stabilized operations. The 503-511 Broadway Property was repositioned after the sale of the Zara Condo Unit. In early 2018, the borrower leased the vacant office space on the lower level, second floor and third floor to the Away Tenant, and the space was delivered to the tenant in late 2018. The Away Tenant then received a rent credit equal to $585,083 for the lower level and $1,099,308 for the second floor space to be applied against the base rent for the first 14 months of the term, and a rent credit in the amount of $948,210 for the third floor space to be applied against the base rent for the first 5 months of the term. PacSun leased the ground floor retail space in February 2020. Additionally, during the COVID-19 pandemic, the tenants received rent relief totaling $1,316,961. The relief was in the form of both rent abatements and rent deferrals. The deferred rent was repaid in 2021 ($697,279), 2022 ($183,123) and in 2023 ($91,559). |
| (2) | Includes rent steps underwritten through May 1, 2024 totaling $255,142. |
| (3) | Sourced from borrower. |
| (4) | Sourced from the underwritten rent roll dated December 31, 2022. |
| (5) | UW Occupancy % represents economic occupancy. |
| (6) | Debt service coverage ratios and debt yields are based on the 503-511 Broadway Whole Loan. |
Escrows and Reserves.
Real Estate Taxes – The 503-511 Broadway Whole Loan documents provide for an upfront reserve of approximately $1,202,651 for real estate taxes and ongoing monthly reserves for real estate taxes in an amount equal to 1/12 of the real estate taxes that the lender estimates will be payable during the next twelve months (initially $200,442).
Insurance – The 503-511 Broadway Whole Loan documents provide for an upfront reserve of approximately $32,796 for insurance premiums. The borrower is not required to make deposits into a reserve for insurance premiums for the 503-511 Broadway Property so long as (i) no Excess Cash Sweep Event Period (as defined below) exists under the 503-511 Broadway Whole Loan documents, (ii) the liability and casualty policies covering the 503-511 Broadway Property are part of a blanket or umbrella policy approved by the lender in its reasonable discretion, and (iii) the borrower provides the lender with evidence of renewal of such insurance policies and paid receipts for the related insurance premiums no later than 10 days prior to the expiration dates of the policies. If any of conditions (i)-(iii) are not satisfied, the 503-511 Broadway Whole Loan documents provide for ongoing monthly deposits into a reserve for insurance premiums in an amount equal to 1/12 of the insurance premiums that the lender estimates will be payable for the renewal of coverage upon the expiration of the insurance policies (currently $16,398).
Replacement Reserve – The 503-511 Broadway Whole Loan documents provide for ongoing monthly deposits of approximately $2,353 into a reserve for capital expenditures.
TI/LC Reserve – The 503-511 Broadway Whole Loan documents provide for ongoing monthly deposits of approximately $25,243 into a reserve for future tenant improvements and leasing commissions, provided that such deposits will not be required at any time that the amount in such reserve is at least $1,211,640.
PacSun Free Rent Reserve – At origination, approximately $277,778 was required to be deposited into a reserve for rent concessions due under the lease with PacSun.
PacSun Tenant Improvement Reserve – At origination, approximately $500,000 was required to be deposited into a reserve for the outstanding tenant improvement allowance due under the lease with PacSun.
| This is not a research report and was not prepared by any Underwriter’s research department. Please see additional important information and qualifications at the end of this Term Sheet. | ||
| T-120 | ||
| Mixed Use – Office/Retail | Loan #9 | Cut-off Date Balance: | $36,000,000 |
| 503-511 Broadway | 503-511 Broadway | Cut-off Date LTV: | 38.7% |
| New York, NY 10012 | U/W NCF DSCR: | 1.39x | |
| U/W NOI Debt Yield: | 10.5% |
Roof Leak Reserve – At origination, $28,500 was required to be deposited into a reserve for roof leak damages incurred by the tenants Bath & Body Works and PacSun.
Away Tenant Letter of Credit – In the event that the Away Tenant has not renewed or extended its lease on terms and conditions reasonably approved by the lender at least six months prior to the maturity date of the 503-511 Broadway Whole Loan, the borrower is required to deposit with the lender a letter of credit meeting the requirements of the loan documents in the amount of $1,500,000 (the “Away Tenant LOC”), which Away Tenant LOC is required to be released if such lease is thereafter so renewed.
TI/LC Lease Up Reserve – At origination, approximately $3,500,000 was required to be deposited into a reserve for tenant improvements and leasing commissions with respect to the 503-511 Broadway Property. The borrower is permitted to substitute a letter of credit meeting the requirements of the loan documents in lieu of such reserve.
Lockbox and Cash Management. The 503-511 Broadway Whole Loan is structured with a hard lockbox and in place cash management. Rents from the 503-511 Broadway Property are required to be deposited into the lockbox account directly by the tenants, and any funds received by the borrower or property manager must be deposited within one business day of receipt. Funds in the lockbox account are required to be swept on each business day to a lender-controlled cash management account and disbursed, provided no event of default is continuing under the 503-511 Broadway Whole Loan documents (i) to make deposits into the real estate tax and insurance reserves as described above under “Escrows and Reserves,” (ii) to pay debt service on the 503-511 Broadway Whole Loan, (iii) to make deposits into the replacement reserve and TI/LC reserve as described above under “Escrows and Reserves”, (iv) if an Excess Cash Sweep Event Period (as defined below) exists, to pay operating expenses set forth in the lender-approved annual budget and lender-approved extraordinary expenses, and (v) to apply excess cash flow (a) if an Excess Cash Sweep Event Period exists, into an excess cash reserve to be held as additional collateral during the existence of such Excess Cash Sweep Event Period, and (b) otherwise, to be disbursed to the borrower.
An “Excess Cash Sweep Event Period” means the period (i) beginning upon the occurrence of an event of default under the 503-511 Broadway Whole Loan documents and ending when the event of default has been cured to the lender’s satisfaction; (ii) beginning upon a DSCR Event (as defined below) and ending when the debt service coverage ratio is at least 1.20x for any two consecutive calendar quarters during the term of the 503-511 Broadway Whole Loan; (iii) beginning when a Trigger Tenant Credit Event (as defined below) occurs, and ending when the Trigger Tenant Credit Event has been cured (as described below); or (iv) beginning when a Lease Expiration Event (as defined below) occurs and ending when the Lease Expiration Event has been cured (as described below).
“DSCR Event” means the debt service coverage ratio is less than 1.20x for any calendar quarter during the term of the 503-511 Broadway Whole Loan. Notwithstanding the preceding sentence, if the debt service coverage ratio for such period would be 1.20x or greater but for Bath & Body Works vacating its entire leased space, then no DSCR Event will be deemed to have occurred. The borrower may deliver to the lender cash or a letter of credit in an amount which, if applied to the outstanding principal balance of the 503-511 Broadway Whole Loan, would be sufficient to achieve a debt service coverage ratio of 1.20x, in order to cure a DSCR Event.
“Trigger Tenant Credit Event” means (x) the bankruptcy of any Trigger Tenant (as defined below) or any guarantor of any lease with a Trigger Tenant and/or (y) any Trigger Tenant ceases to do business open to the public at the 503-511 Broadway Property. A “Trigger Tenant Credit Event” will be cured, (i) in the case of clause (x) above, if either (1) the applicable lease is affirmed in bankruptcy or (2) the subject space is leased to a new replacement tenant on terms and conditions approved by the lender, in its reasonable discretion, and a tenant estoppel certificate evidencing that such new tenant is in occupancy, open for business to the public and paying full unabated rent and all tenant improvements and leasing commissions have been paid (to the extent due at the applicable date), is delivered to the lender (a “Replacement Tenant Cure”), and (ii) in the case of clause (y) above, if either (1) the applicable Trigger Tenant has re-opened for business and is in occupancy of all its space and paying its contractual rent at the 503-511 Broadway Property or (2) a Replacement Tenant Cure occurs.
“Trigger Tenant” means the Away Tenant, and any successor tenant approved by the lender.
“Lease Expiration Event” means with respect to any Trigger Tenant lease, the earlier of (a) the date such Trigger Tenant gives notice to vacate any portion or all of its leased premises or exercises any valid termination option under such Trigger Tenant lease or such Trigger Tenant lease otherwise terminates or ceases to be in full force and effect, and (b) the date which is 12 months prior to the expiration date set forth in such Trigger Tenant lease (unless the Trigger Tenant has renewed or extended its lease, on terms and conditions reasonably approved by the lender, prior to such date).
A Lease Expiration Event will be cured if either (1) the Trigger Tenant has extended or renewed its lease on terms and conditions approved by the lender in its reasonable discretion or (2) a Replacement Tenant Cure occurs.
Additional Secured Indebtedness (not including trade debts). In addition to the 503-511 Broadway Mortgage Loan, the 503-511 Broadway Property also secures the 503-511 Broadway Serviced Pari Passu Companion Loan, which has a Cut-off Date principal balance of $22,000,000. The 503-511 Broadway Serviced Pari Passu Companion Loan bears interest at the same rate as the 503-511 Broadway Mortgage Loan. The 503-511 Broadway Mortgage Loan and the 503-511 Broadway Serviced Pari Passu Companion Loan are pari passu in right of payment. The holders of the 503-511 Broadway Mortgage Loan and the 503-511 Broadway Serviced Pari Passu Companion Loan have entered into a co-lender agreement which sets forth the allocation of collections on the 503-511 Broadway Whole Loan. See “Description of the Mortgage Pool—The Whole Loans—The Serviced Pari Passu Whole Loans” in the prospectus.
Mezzanine Loan and Preferred Equity. None.
Release of Property. None.
Real Estate Substitution. None
Letter of Credit. None. However, the borrower (1) is required to post the Away Tenant LOC, in the circumstances described above under “Escrows and Reserves,” (2) has the right to substitute a letter of credit for the TI/LC Lease Up Reserve, and (3) has the right to deliver a letter of credit to cure an Excess Cash Sweep Event Period caused by a decline in debt service coverage ratio, as described above under “Lockbox and Cash Management.”
| This is not a research report and was not prepared by any Underwriter’s research department. Please see additional important information and qualifications at the end of this Term Sheet. | ||
| T-121 | ||
| Mixed Use – Office/Retail | Loan #9 | Cut-off Date Balance: | $36,000,000 |
| 503-511 Broadway | 503-511 Broadway | Cut-off Date LTV: | 38.7% |
| New York, NY 10012 | U/W NCF DSCR: | 1.39x | |
| U/W NOI Debt Yield: | 10.5% |
Right of First Offer/Right of First Refusal. None.
Ground Lease. None.
Terrorism Insurance. The borrower is required to obtain and maintain “all risk” property insurance that covers perils of terrorism and acts of terrorism in an amount equal to the full replacement cost of the 503-511 Broadway Property and business interruption insurance for 18 months with a 12-month extended period of indemnity; provided that for so long as the Terrorism Risk Insurance Act of 2002, as extended and modified by the Terrorism Risk Insurance Program Reauthorization Act of 2015 (“TRIPRA”) is in effect (including any extensions thereof or if another federal governmental program is in effect relating to “acts of terrorism” which provides substantially similar protections as TRIPRA), the lender is required to accept terrorism insurance which covers against “covered acts” as defined by TRIPRA (or such other program) as full compliance with the requirements above but only in the event that TRIPRA (or such other program) continues to cover both domestic and foreign acts of terrorism. See “Risk Factors—Risks Relating to the Mortgage Loans—Terrorism Insurance May Not Be Available for All Mortgaged Properties” in the prospectus.
| This is not a research report and was not prepared by any Underwriter’s research department. Please see additional important information and qualifications at the end of this Term Sheet. | ||
| T-122 | ||
| Hospitality – Full Service | Loan #10 | Cut-off Date Balance: | $33,500,000 |
| 235 East Main Street | Norfolk Waterside Marriott | Cut-off Date LTV: | 51.4% |
| Norfolk, VA 23510 | U/W NCF DSCR: | 1.63x | |
| U/W NOI Debt Yield: | 15.9% |

| This is not a research report and was not prepared by any Underwriter’s research department. Please see additional important information and qualifications at the end of this Term Sheet. | ||
| T-123 | ||
| Hospitality – Full Service | Loan #10 | Cut-off Date Balance: | $33,500,000 |
| 235 East Main Street | Norfolk Waterside Marriott | Cut-off Date LTV: | 51.4% |
| Norfolk, VA 23510 | U/W NCF DSCR: | 1.63x | |
| U/W NOI Debt Yield: | 15.9% |
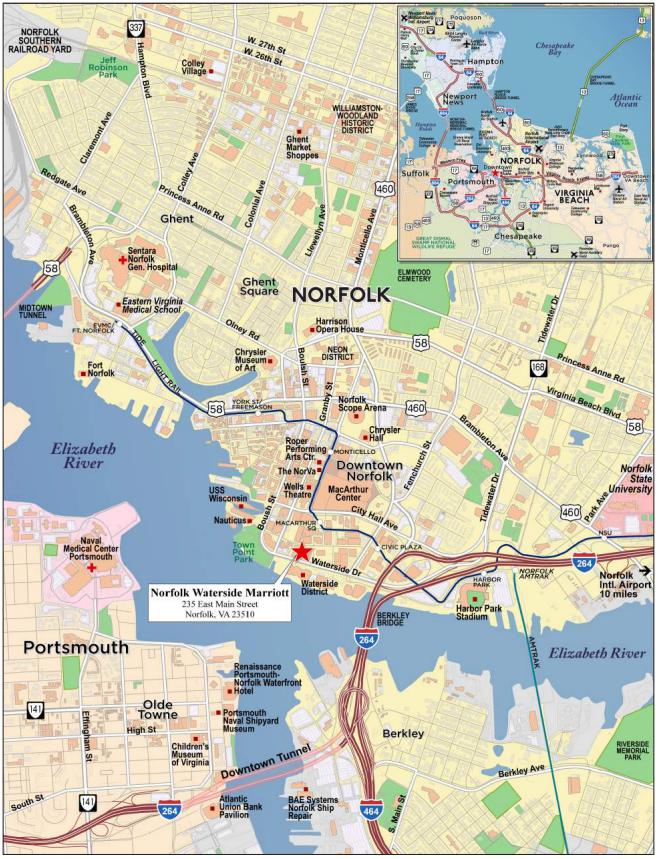
| This is not a research report and was not prepared by any Underwriter’s research department. Please see additional important information and qualifications at the end of this Term Sheet. | ||
| T-124 | ||
| Mortgage Loan No. 10 – Norfolk Waterside Marriott |
| Mortgage Loan Information | Property Information | |||||
| Mortgage Loan Seller: | WFB | Single Asset/Portfolio: | Single Asset | |||
| Credit Assessment (Fitch/Moody’s/KBRA): | NR/NR/NR | Location: | Norfolk, VA 23510 | |||
| Original Balance: | $33,500,000 | General Property Type: | Hospitality | |||
| Cut-off Date Balance: | $33,500,000 | Detailed Property Type: | Full Service | |||
| % of Initial Pool Balance: | 5.0% | Title Vesting: | Fee | |||
| Loan Purpose: | Refinance | Year Built/Renovated: | 1991/2019 | |||
| Borrower Sponsors: | J. Ryan Lingerfelt and Lingerfelt | Size: | 407 Rooms | |||
| Commonwealth Value Fund II, L.P. | Cut-off Date Balance per Room: | $82,310 | ||||
| Guarantors: | J. Ryan Lingerfelt and Lingerfelt | Maturity Date Balance per Room: | $82,310 | |||
| Commonwealth Value Fund II, L.P. | Property Manager: | Commonwealth Lodging | ||||
| Mortgage Rate: | 7.9150% | Management, LLC | ||||
| Note Date: | 6/9/2023 | (borrower-related) | ||||
| First Payment Date: | 7/11/2023 | |||||
| Maturity Date: | 6/11/2028 | |||||
| Original Term to Maturity: | 60 months | |||||
| Original Amortization Term: | 0 months | Underwriting and Financial Information | ||||
| IO Period: | 60 months | UW NOI: | $5,330,545 | |||
| Seasoning: | 1 month | UW NOI Debt Yield: | 15.9% | |||
| Prepayment Provisions: | L(25),D(28),O(7) | UW NOI Debt Yield at Maturity: | 15.9% | |||
| Lockbox/Cash Mgmt Status: | Soft/Springing | UW NCF DSCR: | 1.63x | |||
| Additional Debt Type: | No | Most Recent NOI: | $5,308,729 (4/30/2023 TTM) | |||
| Additional Debt Balance: | NAP | 2nd Most Recent NOI(3): | $4,923,404 (12/31/2022) | |||
| Future Debt Permitted (Type)(2): | Yes (Mezzanine) | 3rd Most Recent NOI(3): | $2,966,396 (12/31/2021) | |||
| Reserves(1) | Most Recent Occupancy(3): | 70.9% (4/30/2023) | ||||
| Type | Initial | Monthly | Cap | 2nd Most Recent Occupancy(3): | 67.9% (12/31/2022) | |
| RE Taxes: | $61,318 | $61,314 | NAP | 3rd Most Recent Occupancy(3): | 65.9% (12/31/2021) | |
| Insurance: | $0 | Springing | NAP | Appraised Value (as of) | $65,200,000 (4/20/2023) | |
| PIP Reserve: | $1,500,000 | $0 | NAP | Appraised Value per Room: | $160,197 | |
| FF&E Reserve: | $0 | $80,494 | NAP | Cut-off Date LTV Ratio: | 51.4% | |
| Seasonality Reserve: | $0 | $150,000 | $750,000 | Maturity Date LTV Ratio: | 51.4% | |
| Sources and Uses | ||||||
| Sources | Proceeds | % of Total | Uses | Proceeds | % of Total | |
| Original Loan Amount: | $33,500,000 | 90.7% | Loan Payoff: | $34,753,160 | 94.0% | |
| Sponsor Equity: | $3,453,563 | 9.3% | Upfront Reserves: | $1,561,318 | 4.2% | |
| Closing Costs: | $639,086 | 1.7% | ||||
| Total Sources: | $36,953,563 | 100.0% | Total Uses: | $36,953,563 | 100.0% | |
| (1) | See “—Escrows and Reserves – ” section below for further discussion of reserve requirements. |
| (2) | See “Mezzanine Loan and Preferred Equity” section below for further discussion of future debt permitted. |
| (3) | The increases in Occupancy and Net Operating Income from 2021 to 2022 were due to the effects of the novel coronavirus on the hospitality industry in 2020 and the subsequent recovery in 2021 and 2022. |
The Mortgage Loan. The tenth largest mortgage loan (the “Norfolk Waterside Marriott Mortgage Loan”) is evidenced by a promissory note in the original principal balance of $33,500,000 and secured by the fee interest in a 407-room full-service hotel located in Norfolk, Virginia, together with ancillary contractual interests in an adjacent convention center and ballroom (the “Norfolk Waterside Marriott Property”).
The Borrowers and the Borrower Sponsors. The borrowers are comprised of two tenants in common, LCP Waterside Hotel Owner, LLC and FCF Holdings I, LLC, each a Delaware limited liability company and single-purpose entity with one independent director. Legal counsel to the borrowers delivered a non-consolidation opinion in connection with the origination of the Norfolk Waterside Marriott Mortgage Loan.
The borrower sponsors and non-recourse carveout guarantors are J. Ryan Lingerfelt (“Ryan Lingerfelt”) and Lingerfelt Commonwealth Value Fund II, L.P. Ryan Lingerfelt is a principal and the President and Chief Investment Officer of Lingerfelt Commonwealth Partners (“Lingerfelt”). Headquartered in Richmond, VA, Lingerfelt is a vertically integrated real estate investment management firm. Since 2003, Lingerfelt has built, acquired and managed nearly 20 million SF of commercial real estate valued at $2.5 billion including medical and professional offices, industrial, data and call centers, emergency care centers, elderly housing and nursing homes, and hospitality, all located in the eastern United States.
The Property. The Norfolk Waterside Marriott Property is a 24-story, 407-room, full-service hotel located in Norfolk, Virginia. In addition to the fee interest in such hotel, the borrowers manage the first three floors of the convention center pursuant to an operating agreement with the City of Norfolk (the “Convention Center Operating Agreement”), and leases the fourth-floor ballroom space in the convention center pursuant to a lease with the Norfolk Redevelopment and Housing Authority (the “Premises Lease”). Built in 1991 and renovated in 2019, the property is operated under the Marriott flag with a franchise agreement expiring on November 17, 2042. The borrowers have invested approximately $17.6 million ($43,308/room) on capital expenditures at the property since 2018, with the majority, or about $26,000 per room, on guestroom renovations. Amenities at the Norfolk Waterside Marriott Property include Capo Capo Steak House, START breakfast restaurant, approximately 68,879 SF of meeting and ballroom space within the convention center,
| This is not a research report and was not prepared by any Underwriter’s research department. Please see additional important information and qualifications at the end of this Term Sheet. | ||
| T-125 | ||
| Hospitality – Full Service | Loan #10 | Cut-off Date Balance: | $33,500,000 |
| 235 East Main Street | Norfolk Waterside Marriott | Cut-off Date LTV: | 51.4% |
| Norfolk, VA 23510 | U/W NCF DSCR: | 1.63x | |
| U/W NOI Debt Yield: | 15.9% |
which is available to the borrowers pursuant to the Convention Center Operating Agreement and the Premises Lease, an indoor swimming pool, fitness center, business center and sundry shop. The Norfolk Waterside Marriott Property guestroom configuration consists of 216 king rooms, 181 queen rooms, 9 suites and one presidential suite. The guestrooms feature high-speed internet access, ergonomic workspaces, coffee/tea makers, and 24-hour room service. A “soft goods” property improvement plan (“PIP”) is expected to take place in 2026. While the borrowers do not have a budget for the PIP at the time of origination, the loan is structured with an initial PIP Reserve and a springing deposit to fund any additional costs (see “Escrow and Reserves” section below).
The borrowers manage the adjacent convention center pursuant to the Convention Center Operating Agreement with the City of Norfolk, which expires on November 16, 2057. Pursuant to the Convention Center Operating Agreement, the borrowers receive all revenue and incur all expenses related to the convention center. If the City of Norfolk were to build or finance another convention center that competes with the Norfolk Waterside Marriott Property, the borrowers have the right to terminate the Convention Center Operating Agreement.
The borrowers’ Premises Lease of the fourth-floor ballroom of the convention center with the Norfolk Redevelopment and Housing Authority expires on December 31, 2089. The annual rent is equal to $75,000 payable by the 20th day of each lease year, but only to the extent net revenues for the preceding year exceeded the sum of (a) the debt service on the Norfolk Waterside Marriott Mortgage Loan for the preceding year and (b) an equity return of 18% per annum on the initial cash equity contribution in the borrowers in their capacity as the tenant under the Premises Lease. Based on the calculation of annual rent, there is no rent due for 2023 and rent has not been payable under the Premises Lease since the lease commenced in March 1990.
The borrowers have access to 200 parking spaces under a main street parking agreement with the City of Norfolk. The borrowers pay $14 for each space used on a daily basis. The parking lease terminates when the Convention Center Operating Agreement expires or is terminated.
The following table presents historical occupancy, ADR, and RevPAR penetration rates of the Norfolk Waterside Marriott Property:
| Historical Occupancy, ADR, RevPAR(1) | |||||||||
| Competitive Set | Norfolk Waterside Marriott Property | Penetration Factor | |||||||
| Year | Occupancy | ADR | RevPAR | Occupancy | ADR | RevPAR | Occupancy | ADR | RevPAR |
| 12/31/2021 TTM | 43.1% | $97.21 | $41.95 | 46.5% | $103.07 | $47.91 | 107.9% | 106.0% | 114.2% |
| 12/31/2022 TTM | 60.1% | $122.44 | $73.56 | 65.3% | $131.71 | $85.98 | 108.7% | 107.6% | 116.9% |
| 4/30/2023 TTM | 66.4% | $130.92 | $86.90 | 70.9% | $146.51 | $103.87 | 106.8% | 111.9% | 119.5% |
Source: Third-party research report.
| (1) | According to a third party research report, the competitive set includes the Holiday Inn Virginia Beach Norfolk, Crowne Plaza Virginia Beach Town Center, Sheraton Hotel Norfolk Waterside, The Founders Inn & Spa, Tapestry Collection by Hilton, Delta Hotel Chesapeake Norfolk, Renaissance Portsmouth Norfolk Waterfront Hotel and Hilton Norfolk The Main. |
The Market. The Norfolk Waterside Marriott Property is located in downtown Norfolk at the southwest corner of Atlantic Street and East Main Street. The property is located approximately one quarter of a mile from I-264 and three miles north of Interstate 464, which provides access to Chesapeake, as well as connections to US 17, I-64, and the Chesapeake Expressway. The Norfolk International Airport is located less than ten miles northeast of the property. Amtrak passenger service is also offered approximately one mile east of the property next to Harbor Park Stadium. Major demand generators in the area include the Norfolk Naval Base, which is the world’s largest naval base and located 10.2 miles from the property, General Dynamics NASSCO, as well as several universities including Old Dominion University and Norfolk State University. The property’s 2022 demand segmentation was 30% corporate, 40% group and 30% leisure.
According to a third-party research report, the 2023 population within a one-, three- and five-mile radius of The Norfolk Waterside Marriott Property was 15,039, 134,778 and 274,284, respectively. The average household income for the same one-, three- and five-mile radius was $83,430, $63,977 and $69,565, respectively.
According to the appraisal, the property is located in the Norfolk/Portsmouth submarket. The appraisal did not identify any new hotels under construction or planned for near term development that are expected to directly compete with the Norfolk Waterside Marriott property.
The table below presents certain information relating to comparable sales pertaining to the Norfolk Waterside Marriott Property identified by the appraisal:
| Comparable Sales Summary | |||||
Property Name | Location | Year Built | Rooms | Sale Date | Sale Price / Room |
| Envue, Autograph Collection | 550 Avenue at Port Imperial, Weehawken, NJ | 2019 | 208 | 2/2023 | $242,308 |
| Hilton Hotel and Convention Center | 801 University Drive E, College Station, TX | 1985 | 303 | 11/2022 | $123,878 |
| Embassy Suites | 6100 Gateway East, El Paso, TX | 1976 | 184 | 10/2022 | $152,174 |
| Hotel Derek conv. to Autograph Collection | 2525 West Loop South, Houston, TX | 1979 | 312 | 10/2022 | $263,000 |
| Denver Airport Marriott at Gateway Park | 16455 E. 40th Circle, Aurora, CO | 1998 | 238 | 3/2022 | $144,269 |
Source: Appraisal
| This is not a research report and was not prepared by any Underwriter’s research department. Please see additional important information and qualifications at the end of this Term Sheet. | ||
| T-126 | ||
| Hospitality – Full Service | Loan #10 | Cut-off Date Balance: | $33,500,000 |
| 235 East Main Street | Norfolk Waterside Marriott | Cut-off Date LTV: | 51.4% |
| Norfolk, VA 23510 | U/W NCF DSCR: | 1.63x | |
| U/W NOI Debt Yield: | 15.9% |
Operating History and Underwritten Net Cash Flow. The following table presents certain information relating to the historical operating performance and Underwritten Net Cash Flow at the Norfolk Waterside Marriott Property:
| Cash Flow Analysis | |||||||||||
| 2020 | 2021 | 2022 | TTM (4/30/2023) | UW | UW per Room | ||||||
| Rooms Revenue | $6,014,921 | $11,837,177 | $14,445,367 | $15,403,605 | $15,403,605 | $37,847 | |||||
| Food & Beverage | $686,098 | $3,207,591 | $7,675,260 | $7,967,383 | $7,967,383 | $19,576 | |||||
| Parking Income | $59,790 | $55,051 | $132,422 | $132,558 | $132,558 | $326 | |||||
| Other Income | $108,272 | $112,081 | $103,968 | $102,255 | $102,255 | $251 | |||||
| Total Revenue | $6,869,081 | $15,211,900 | $22,357,017 | $23,605,801 | $23,605,801 | $58,000 | |||||
| Room Expense | $1,830,674 | $2,787,641 | $3,888,788 | $4,128,396 | $4,128,396 | $10,143 | |||||
| Food & Beverage Expense | $1,161,737 | $2,645,861 | $4,982,354 | $5,245,711 | $5,245,711 | $12,889 | |||||
| Other Department Expense | $265 | $2,234 | $2,842 | $4,181 | $4,181 | $10 | |||||
| Total Department Expenses | $2,992,676 | $5,435,735 | $8,873,984 | $9,378,288 | $9,378,288 | $23,042 | |||||
| Gross Operating Income | $3,876,405 | $9,776,165 | $13,483,034 | $14,227,513 | $14,227,513 | $34,957 | |||||
| Total Undistributed Expenses | $4,047,120 | $5,584,316 | $7,417,835 | $7,788,741 | $7,779,828 | $19,115 | |||||
| Gross Operating Profit | ($170,715) | $4,191,849 | $6,065,199 | $6,438,772 | $6,447,686 | $15,842 | |||||
| Property Taxes | $1,044,384 | $898,510 | $754,773 | $719,567 | $718,175 | $1,765 | |||||
| Insurance | $284,513 | $326,943 | $387,022 | $410,476 | $398,965 | $980 | |||||
| Total Operating Expenses | $8,368,692 | $12,245,504 | $17,433,613 | $18,297,072 | $18,275,256 | $44,902 | |||||
| Net Operating Income | ($1,499,611) | (1) | $2,966,396 | (1) | $4,923,404 | (1) | $5,308,729 | $5,330,545 | $13,097 | ||
| FF&E | $0 | $0 | $0 | $0 | $944,232 | $2,320 | |||||
| Net Cash Flow | ($1,499,611) | $2,966,396 | $4,923,404 | $5,308,729 | $4,386,313 | $10,777 | |||||
| Occupancy % | 36.7% | (1) | 65.9% | (1) | 67.9% | (1) | 70.9% | 70.9% | (2) | ||
| NOI DSCR | (0.56x) | 1.10x | 1.83x | 1.97x | 1.98x | ||||||
| NCF DSCR | (0.56x) | 1.10x | 1.83x | 1.97x | 1.63x | ||||||
| NOI Debt Yield | (4.5%) | 8.9% | 14.7% | 15.8% | 15.9% | ||||||
| NCF Debt Yield | (4.5%) | 8.9% | 14.7% | 15.8% | 13.1% | ||||||
| (1) | The increases in Occupancy and Net Operating Income from 2020 to 2021 and 2021 to 2022 were due to the effects of the novel coronavirus on the hospitality industry in 2020 and the subsequent recovery in 2021 and 2022. |
| (2) | UW occupancy of 70.9% is based on the TTM April 30, 2023 occupancy. |
Escrows and Reserves.
Real Estate Taxes – The loan documents require an upfront deposit of $61,318 and ongoing monthly deposits of $61,314 for real estate taxes.
Insurance – The loan documents do not require ongoing monthly insurance reserves; provided (i) no event of default is continuing, (ii) the borrowers maintain insurance coverage for the Norfolk Waterside Marriott Property as part of blanket or umbrella coverage reasonably approved by the lender, and (iii) the borrowers provide the lender with evidence of the renewals of the insurance policies and paid receipts for the payment of the insurance premiums no later than 10 business days prior to the expiration dates of the policies. If such conditions are not satisfied, the loan documents require ongoing monthly deposits in an amount equal to 1/12th of the insurance premiums that the lender reasonably estimates will be payable during the next ensuing 12 months.
PIP Reserve – The loan documents require an initial deposit of $1,500,000 for anticipated PIP work in 2026. If, at any time, any additional PIP work is required by the franchisor under the franchise agreement, within 15 days after receipt of notice from the franchisor with respect to such PIP work, the loan documents require a springing deposit in an amount equal to 100% of the estimated costs to complete such additional PIP work, as reasonably determined by the lender. Upon lender’s receipt of the budget for the PIP work estimated to commence in the calendar year 2026, upon 10 days’ notice to the borrowers, the borrowers are required to deposit such amount that the balance of the PIP reserve is equal to 100% of the lender’s estimated cost based on the budget.
FF&E Reserve – The loan documents require ongoing monthly deposits in an amount equal the greater of (i) the then-existing FF&E Reserve monthly deposit for the prior period or (ii) 1/12 of 4% of the underwritten revenue for the prior fiscal year, initially $80,494.
Seasonality Reserve – The loan documents require ongoing monthly deposits in an amount equal to 1/9th of the Seasonality Reserve Required Annual Balance (as defined below) to cover any debt service shortfalls in the months of January, February, and December, provided however, that the borrowers are only required to make these deposits if the funds on deposit in the Seasonality Reserve are less than $750,000 (the “Seasonality Reserve Required Annual Balance”). Initially, for the monthly payment dates occurring in July, August, September, October, and November 2023, the borrowers are required to deposit $150,000 into the Seasonality Reserve and in March, April, May, June, July, August, September, October, and November 2024, the borrowers are required to deposit $83,333.
| This is not a research report and was not prepared by any Underwriter’s research department. Please see additional important information and qualifications at the end of this Term Sheet. | ||
| T-127 | ||
| Hospitality – Full Service | Loan #10 | Cut-off Date Balance: | $33,500,000 |
| 235 East Main Street | Norfolk Waterside Marriott | Cut-off Date LTV: | 51.4% |
| Norfolk, VA 23510 | U/W NCF DSCR: | 1.63x | |
| U/W NOI Debt Yield: | 15.9% |
Lockbox and Cash Management. The Norfolk Waterside Marriott Loan is structured with a soft lockbox and springing cash management. The borrower and manager are required to cause all rents to be deposited into the deposit account within one business day of receipt. Upon the occurrence of a Cash Trap Event Period (as defined below), all amounts available in the deposit account are required to be transferred to a cash management account controlled by the lender and applied in accordance with the cash flow waterfall in the cash management agreement. During the continuance of a Cash Trap Event Period, all excess cash flow is required to be held by the lender as additional collateral.
A “Cash Trap Event Period” will commence upon the earlier of the following:
| (i) | an event of default; |
| (ii) | the net cash flow debt yield falling below 10.0%, tested quarterly; or |
| (iii) | upon a cancellation, termination or expiration of the franchise agreement. |
A Cash Trap Event Period will end upon the occurrence of the following:
| ● | with regard to clause (i), the cure of such event of default; |
| ● | with regard to clause (ii), upon the net cash flow debt yield being at least 10.5% for two consecutive calendar quarters; or |
| ● | with regard to clause (iii), the borrowers have entered into a replacement franchise agreement acceptable to the lender. |
Additional Secured Indebtedness (not including trade debts). None.
Mezzanine Loan and Preferred Equity. The loan documents permit future mezzanine financing, subject to satisfaction of certain conditions, including: (i) the combined loan-to-value ratio does not exceed 55%; (ii) the combined actual debt service coverage ratio is not less than 1.40x (based on amortizing payments due under the senior and mezzanine loans); (iii) the combined debt yield is not less than 11.0%; (iv) the mezzanine lender is an institutional lender acceptable to lender; (v) an intercreditor agreement in form and substance reasonably acceptable to lender and any applicable rating agency; (vi) a rating agency confirmation with respect to the proposed mezzanine financing; and (vii) at lender’s discretion, hard cash management may be required pursuant to the related cash management provisions of the loan documents.
Release of Property. None.
Letter of Credit. None.
Ground Lease. None.
Right of First Offer/Right of First Refusal. Marriott International, Inc., as franchisor, has a conditional Right of First Refusal (“ROFR”) to acquire the Norfolk Waterside Marriott Property if there is a transfer of the hotel or controlling direct or indirect interest in the borrowers to a competitor (generally, any person that exclusively develops, operates or franchises through or with a competitor of franchisor comprising at least 10 luxury hotels, 20 full-service hotels or 50 limited-service hotels). The ROFR is not extinguished by foreclosure or deed-in-lieu thereof, and if there is a transfer to a competitor by foreclosure, or if the franchisee or its affiliates become a competitor, the franchisor has the right to purchase the hotel upon notice to the franchisee. The franchisor comfort letter provides that, if the lender exercises remedies against the franchisee, the lender may appoint a lender affiliate to acquire the property and enter into a management or franchise agreement if it is not a competitor or competitor affiliate; provided, however, that a lender affiliate will not be deemed a competitor simply due to its ownership of multiple or competing hotels or having engaged managers to manage such other hotels.
Terrorism Insurance. The loan documents require that the “all risk” insurance policy required to be maintained by the borrower provides coverage for terrorism in an amount equal to the full replacement cost of the Norfolk Waterside Marriott Property, as well as business interruption insurance covering no less than the 18-month period following the occurrence of a casualty event, together with a 6-month extended period of indemnity. The loan documents provide that if TRIPRA or a successor statute is not in effect, the borrowers will not be required to spend on terrorism insurance more than two times the cost of the then-current all-risk coverage under a stand-alone all-risk policy (including property/casualty coverage and loss of rents/ business interruption coverage).
| This is not a research report and was not prepared by any Underwriter’s research department. Please see additional important information and qualifications at the end of this Term Sheet. | ||
| T-128 | ||
| Mortgage Loan No. 11 – The Read House |
| Mortgage Loan Information | Property Information | |||||
| Mortgage Loan Seller: | WFB | Single Asset/Portfolio: | Single Asset | |||
| Credit Assessment (Fitch/Moody’s/KBRA): | NR/NR/NR | Location: | Chattanooga, TN 37402 | |||
| Original Balance: | $33,000,000 | General Property Type: | Hospitality | |||
| Cut-off Date Balance: | $32,974,542 | Detailed Property Type: | Full Service | |||
| % of Initial Pool Balance: | 4.9% | Title Vesting: | Fee | |||
| Loan Purpose: | Refinance | Year Built/Renovated: | 1926; 1964/2019 | |||
| Borrower Sponsor: | Jonathan P. Weitz | Size: | 242 Rooms | |||
| Guarantor: | Jonathan P. Weitz | Cut-off Date Balance per Room: | $136,258 | |||
| Mortgage Rate: | 7.3060% | Maturity Date Balance per Room: | $129,774 | |||
| Note Date: | 6/6/2023 | Property Manager: | Avocet Hospitality Group, Inc. | |||
| First Payment Date: | 7/11/2023 | (borrower affiliate) | ||||
| Maturity Date: | 6/11/2028 | |||||
| Original Term to Maturity: | 60 months | Underwriting and Financial Information | ||||
| Original Amortization Term: | 360 months | UW NOI: | $5,428,011 | |||
| IO Period: | 0 months | UW NOI Debt Yield: | 16.5% | |||
| Seasoning: | 1 month | UW NOI Debt Yield at Maturity: | 17.3% | |||
| Prepayment Provisions: | L(25),D(31),O(4) | UW NCF DSCR: | 1.73x | |||
| Lockbox/Cash Mgmt Status: | Hard / Springing | Most Recent NOI: | $5,416,579 (3/31/2023 TTM) | |||
| Additional Debt Type: | No | 2nd Most Recent NOI(3): | $5,316,503 (12/31/2022) | |||
| Additional Debt Balance: | NAP | 3rd Most Recent NOI(3): | $3,892,021 (12/31/2021) | |||
| Future Debt Permitted (Type): | No (NAP) | Most Recent Occupancy: | 64.9% (3/31/2023) | |||
| Reserves | 2nd Most Recent Occupancy(3): | 63.7% (12/31/2022) | ||||
| Type | Initial | Monthly | Cap | 3rd Most Recent Occupancy(3): | 54.6% (12/31/2021) | |
| RE Taxes: | $206,340 | $51,586 | NAP | Appraised Value (as of): | $66,500,000 (5/10/2023) | |
| Insurance: | $13,866 | $13,889 | NAP | Appraised Value per Room: | $274,793 | |
| FF&E Reserves(1): | $0 | $61,315 | NAP | Cut-off Date LTV Ratio: | 49.6% | |
| Seasonality Reserve(2): | $360,000 | $72,000 | $360,000 | Maturity Date LTV Ratio: | 47.2% | |
| Sources and Uses | ||||||
| Sources | Proceeds | % of Total | Uses | Proceeds | % of Total | |
| Original Loan Amount: | $33,000,000 | 100.0% | Loan Payoff(4): | $26,290,561 | 79.7% | |
| Closing Costs: | $303,561 | 0.9% | ||||
| Upfront Reserves: | $580,226 | 1.8% | ||||
| Return of Equity: | $5,825,652 | 17.7% | ||||
| Total Sources: | $33,000,000 | 100.0% | Total Uses: | $33,000,000 | 100.0% | |
| (1) | The loan documents require ongoing monthly deposits in an amount equal to the greater of (i) the then-existing FF&E Reserve monthly deposit or (ii) 1/12 of 4% of the underwritten revenue for the prior fiscal year, initially $61,315. |
| (2) | The loan documents require an upfront deposit of $360,000 (the “Seasonality Reserve Required Annual Balance”). These funds may be used for disbursements to or for the payment of any part of any monthly payment amount due in February, March, or September, to the extent that there is insufficient cash flow from The Read House Property (as defined below) to make the monthly payment. On each monthly payment date occurring in April, May, June, July, and August, the borrower is required to deposit $72,000 into the Seasonality Reserve, provided however, that the borrower is only required to make these deposits if the funds on deposit in the Seasonality Reserve are less than the Seasonality Reserve Required Annual Balance. |
| (3) | The increase in NOI and Occupancy from the 3rd Most Recent period to the 2nd Most Recent period is primarily driven by the continuing recovery from the COVID-19 pandemic. |
| (4) | The loan proceeds were used to repay existing commercial mortgage-backed debt securitized in LCCM 2021-FL3. |
The Mortgage Loan. The eleventh largest mortgage loan (the “The Read House Mortgage Loan”) is evidenced by a promissory note in the original principal amount of $33,000,000 and secured by the fee interest in a 242-room full-service hotel located in Chattanooga, Tennessee (the “The Read House Property”).
The Borrower and the Borrower Sponsor. The borrower is Historic Read House Associates Property Owner, LLC, a single-purpose, Delaware limited liability company with one independent director. Legal counsel to the borrower delivered a non-consolidation opinion in connection with the origination of The Read House Mortgage Loan. The borrower sponsor and non-recourse guarantor is Jonathan P. Weitz.
Mr. Weitz is the founder and president of Avocet Hospitality Group (“Avocet”). The company was founded in 2006 and is headquartered in Charleston, South Carolina. Avocet has a current portfolio of four hotels and eight restaurants, located in South Carolina, Tennessee and Alabama.
The Property. The Read House Property is a 242-room, full-service hotel located in Chattanooga, Tennessee. The property consists of two buildings, The Historic Tower, built in 1926 featuring 140 guestrooms and the Manor Building, built in 1964 featuring 102 guestrooms. The two buildings are connected on the lobby level and fifth floor and are situated on a 1.4-acre site. The borrower invested approximately $26.9 million ($111,157/room) on a comprehensive renovation between 2017 and 2019 including complete renovations of all guest rooms, a reconfiguration of public spaces, the addition of Bridgeman’s Chophouse and the Bar & Billiards Room, restoration of the lobby and ballroom, and an overhaul of the pool and fitness center. Amenities at The Read House Property include multiple food and beverage outlets, approximately 16,216 SF of meeting and event space, an indoor swimming pool,
| This is not a research report and was not prepared by any Underwriter’s research department. Please see additional important information and qualifications at the end of this Term Sheet. | ||
| T-129 | ||
| Hospitality – Full Service | Loan #11 | Cut-off Date Balance: | $32,974,542 |
| 107 West Martin Luther King Boulevard | The Read House | Cut-off Date LTV: | 49.6% |
| Chattanooga, TN 37402 | U/W NCF DSCR: | 1.73x | |
| U/W NOI Debt Yield: | 16.5% |
fitness center, a library, concierge services, and a valet only parking garage with 89 spaces, that can fit an additional 30 valeted cars when needed (0.5 spaces per room total).
The Read House Property operates under a management agreement with Avocet Hospitality Group, Inc. an affiliate of the borrower, which had an original 2-year term beginning in 2017, automatically extending in one-year increments unless owner or manager give at least 90 days prior notice not to extend, with a management fee equal to 3.0% of gross revenues.
The Read House Property guestroom configuration consists of 131 king rooms and 111 queen rooms. The guestrooms feature flat-screen smart televisions, premium bedding, telephone, desk with chair, dresser, nightstands, lamps, lounge chair, mini-fridge, Keurig coffee makers and complimentary Wi-Fi.
The following table presents historical occupancy, ADR, and RevPAR penetration rates of The Read House Property:
| Historical Occupancy, ADR, RevPAR(1) | ||||||||||||
| Competitive Set | The Read House Property | Penetration Factor | ||||||||||
| Year | Occupancy | ADR | RevPAR | Occupancy | ADR | RevPAR | Occupancy | ADR | RevPAR | |||
| 4/30/2021 TTM | 39.0% | $127.33 | $49.60 | 40.2% | $171.48 | $68.99 | 103.3% | 134.7% | 139.1% | |||
| 4/30/2022 TTM | 57.9% | $160.11 | $92.76 | 58.5% | $190.45 | $111.33 | 100.9% | 118.9% | 120.0% | |||
| 4/30/2023 TTM | 68.6% | $160.28 | $109.92 | 64.1% | $189.36 | $121.36 | 93.4% | 118.1% | 110.4% | |||
Source: Third-party research report.
| (1) | According to a third-party research report, the competitive set includes Staybridge Suites Chattanooga Dwtn - Conv Ctnr, The Chattanoogan Hotel, Curio Collection by Hilton, DoubleTree by Hilton Hotel Chattanooga Downtown, Chattanooga Marriott Downtown, Hilton Garden Inn Chattanooga Downtown, Westin Chattanooga, Hotel Indigo Chattanooga – Downtown. |
The Market. The Read House Property is located in the downtown core of Chattanooga, Tennessee. It is located along Broad Street to the east, and two blocks west of Market Street, which are the two primary thoroughfares through downtown. The Read House Property is approximately 0.3 miles from the Chattanooga Convention Center and 0.7 miles from the University of Tennessee. The Riverfront District, which is 0.6 miles north of The Read House Property, is the prime location for tourist attractions in the city including The Tennessee Aquarium, IMAX 3-D Theater, Children’s Discovery Museum, and over 30 restaurants. Additionally, the Read House Property is within walking distance to Class A and B office buildings and approximately 8.1 miles from the Chattanooga Metropolitan Airport.
According to the appraisal, the 2022 population within a one-, three- and five-mile radius of The Read House Property was 12,143, 50,147 and 119,076, respectively. The 2022 average household income within the same one-, three- and five-mile radius was $49,886, $62,134 and $67,313, respectively.
The appraisal identified two competitive hotels that are currently under construction, the 148 room Hilton Tapestry Collection, which was deemed 100% competitive and a 184 room Embassy Suites, which is deemed 50% competitive. Both are expected to open in the first half of 2025 and are located within 0.5 miles of The Read House Property.
The table below presents certain information relating to comparable sales pertaining to The Read House Property identified by the appraisal:
| Comparable Sales Summary | |||||
Property Name | Location | Year Built | Rooms | Sale Date | Sale Price / Room |
| DoubleTree Chattanooga Downtown | 407 Chestnut Street Chattanooga, TN | 1974 | 186 | NAV | $182,796 |
| Moxy Chattanooga Downtown | 1220 King Street Chattanooga, TN | 2018 | 108 | 3/2023 | $212,963 |
| Staybridge Suites Chattanooga Downtown | 1300 Carter Street Chattanooga, TN | 2003 | 124 | 11/2022 | $153,226 |
| Cambria Hotel Nashville Downtown | 118 8th Avenue South Nashville, TN | 2018 | 255 | 7/2022 | $429,412 |
| Canopy by Hilton Atlanta Midtown | 1414 West Peachtree Street Northwest Atlanta, GA | 2018 | 176 | 7/2022 | $356,534 |
| Mansion on Forsyth Park | 700 Drayton Street Savannah, GA | 1879 | 149 | 6/2022 | $354,027 |
| Marriott Downtown Chattanooga | 2 Carter Street Chattanooga, TN | 1985 | 343 | 5/2021 | $169,825 |
| Hotel Indigo Chattanooga - Downtown | 300 West 6th Street Chattanooga, TN | 1966 | 117 | 5/2021 | $170,940 |
Source: Appraisal
| This is not a research report and was not prepared by any Underwriter’s research department. Please see additional important information and qualifications at the end of this Term Sheet. | ||
| T-130 | ||
| Hospitality – Full Service | Loan #11 | Cut-off Date Balance: | $32,974,542 |
| 107 West Martin Luther King Boulevard | The Read House | Cut-off Date LTV: | 49.6% |
| Chattanooga, TN 37402 | U/W NCF DSCR: | 1.73x | |
| U/W NOI Debt Yield: | 16.5% |
Operating History and Underwritten Net Cash Flow. The following table presents certain information relating to the historical operating performance and Underwritten Net Cash Flow at The Read House Property:
| Cash Flow Summary | |||||||||||
| 2020 | 2021 | 2022 | TTM (3/312023) | UW | UW per Room | ||||||
| Rooms Revenue | $4,688,150 | $8,967,597 | $10,665,513 | $10,812,836 | $10,812,836 | $44,681 | |||||
| Food & Beverage | $2,633,692 | $4,063,863 | $5,324,895 | $5,526,777 | $5,526,777 | $22,838 | |||||
| Parking Income | $303,898 | $683,624 | $825,271 | $847,943 | $847,943 | $3,504 | |||||
| Other Income | $792,335 | $952,334 | $1,137,021 | $1,206,871 | $1,206,871 | $4,987 | |||||
| Total Revenue | $8,418,075 | $14,667,418 | $17,952,700 | $18,394,427 | $18,394,427 | $76,010 | |||||
| Room Expense | $1,600,538 | $2,479,294 | $2,817,493 | $2,868,769 | $2,868,769 | $11,854 | |||||
| Food & Beverage Expense | $2,200,773 | $2,951,224 | $3,469,161 | $3,546,496 | $3,546,496 | $14,655 | |||||
| Other Department Expense | $665,000 | $1,089,134 | $1,493,277 | $1,553,150 | $1,553,150 | $6,418 | |||||
| Total Department Expenses | $4,466,311 | $6,519,652 | $7,779,931 | $7,968,415 | $7,968,415 | $32,927 | |||||
| Gross Operating Income | $3,951,764 | $8,147,766 | $10,172,769 | $10,426,012 | $10,426,012 | $43,083 | |||||
| Total Undistributed Expenses | $2,631,522 | $3,482,877 | $4,036,704 | $4,182,367 | $4,182,367 | $17,283 | |||||
| Gross Operating Profit | $1,320,242 | $4,664,889 | $6,136,065 | $6,243,645 | $6,243,645 | $25,800 | |||||
| Property Taxes | $717,900 | $611,703 | $609,438 | $608,871 | $609,438 | $2,518 | |||||
| Insurance | $121,050 | $118,097 | $162,065 | $170,728 | $158,729 | $656 | |||||
| Other Fixed Expenses(1) | $70,972 | $43,068 | $48,059 | $47,467 | $47,467 | $196 | |||||
| Total Operating Expenses | $8,007,755 | $10,775,397 | $12,636,197 | $12,977,848 | $12,966,416 | $53,580 | |||||
| Net Operating Income | $410,320(2) | $3,892,021(2) | $5,316,503(2) | $5,416,579 | $5,428,011 | $22,430 | |||||
| FF&E | $0 | $0 | $0 | $0 | $735,777 | $3,040 | |||||
| Net Cash Flow | $410,320 | $3,892,021 | $5,316,503 | $5,416,579 | $4,692,234 | $19,389 | |||||
| Occupancy % | 32.7% | (2) | 54.6% | (2) | 63.7% | (2) | 64.9 | % | 64.3 | % | |
| NOI DSCR | 0.15x | 1.43x | 1.96x | 1.99x | 2.00x | ||||||
| NCF DSCR | 0.15x | 1.43x | 1.96x | 1.99x | 1.73x | ||||||
| NOI Debt Yield | 1.2% | 11.8% | 16.1% | 16.4% | 16.5% | ||||||
| NCF Debt Yield | 1.2% | 11.8% | 16.1% | 16.4% | 14.2% | ||||||
| (1) | Other Fixed Expenses include franchise and excise taxes due to the Tennessee Department of Revenue. |
| (2) | The increase in Occupancy and Net Operating Income from 2020 to 2021, and the further increases in Occupancy and Net Operating Income in 2021 and 2022 were due to the effects of the novel coronavirus on the hospitality industry in 2020 and the subsequent recovery in 2021 and 2022. |
| This is not a research report and was not prepared by any Underwriter’s research department. Please see additional important information and qualifications at the end of this Term Sheet. | ||
| T-131 | ||
| Mortgage Loan No. 12 – Tenet Equity Industrial Portfolio |
| Mortgage Loan Information | Property Information | |||||
| Mortgage Loan Seller: | MSMCH | Single Asset/Portfolio: | Portfolio | |||
| Credit Assessment (Fitch/ Moody’s/KBRA): | NR/NR/NR | Location: | Various | |||
| Original Balance: | $28,600,000 | General Property Type: | Industrial | |||
| Cut-off Date Balance: | $28,600,000 | Detailed Property Type: | Warehouse/Distribution | |||
| % of Initial Pool Balance: | 4.2% | Title Vesting: | Fee | |||
| Loan Purpose: | Refinance | Year Built/Renovated: | Various / Various | |||
| Borrower Sponsor: | Tenet Equity Partners, Inc. | Size(5): | 616,415 SF | |||
| Guarantor: | Tenet Equity Partners, Inc. | Cut-off Date Balance PSF: | $46 | |||
| Mortgage Rate: | 6.7400% | Maturity Date/ARD Balance PSF: | $46 | |||
| Note Date: | 5/3/2023 | Property Manager: | Self-Managed | |||
| First Payment Date: | 7/1/2023 | |||||
| Maturity Date: | 6/1/2028 | |||||
| Original Term to Maturity/ARD: | 60 months | Underwriting and Financial Information | ||||
| Original Amortization Term: | 0 months | UW NOI: | $3,352,401 | |||
| IO Period: | 60 months | UW NOI Debt Yield: | 11.7% | |||
| Seasoning: | 1 month | UW NOI Debt Yield at Maturity/ARD: | 11.7% | |||
| Prepayment Provisions: | L(25),D(31),O(4) | UW NCF DSCR: | 1.61x | |||
| Lockbox/Cash Mgmt Status: | Soft/Springing | Most Recent NOI(6): | NAV | |||
| Additional Debt Type: | No | 2nd Most Recent NOI(6): | NAV | |||
| Additional Debt Balance: | NAP | 3rd Most Recent NOI(6): | NAV | |||
| Future Debt Permitted (Type): | No (NAP) | Most Recent Occupancy: | 100.0% (7/1/2023) | |||
| Reserves | 2nd Most Recent Occupancy: | 100.0% (12/31/2022) | ||||
| Type | Initial | Monthly | Cap | 3rd Most Recent Occupancy: | 100.0% (12/31/2021) | |
| RE Tax: | $0 | Springing(1) | NAP | Appraised Value (as of)(5)(7): | $46,970,000 (3/3/2023) | |
| Insurance: | $0 | Springing2) | NAP | Appraised Value PSF: | $76 | |
| Replacement Reserve: | $0 | Springing(3) | NAP | Cut-off Date LTV Ratio: | 60.9% | |
| TI/LC Reserve: | $0 | Springing(4) | NAP | Maturity Date/ARD LTV Ratio: | 60.9% | |
| Sources and Uses | ||||||
| Sources | Proceeds | % of Total | Uses | Proceeds | % of Total | |
| Loan Amount: | $28,600,000 | 100.0% | Loan Payoff: | $24,000,000 | 83.9% | |
| Return of Equity: | $3,347,254 | 11.7% | ||||
| Closing Costs: | $1,252,746 | 4.4% | ||||
| Total Sources: | $28,600,000 | 100.0% | Total Uses: | $28,600,000 | 100.0% | |
| (1) | Springing monthly deposits of 1/12th of the real estate taxes due during the ensuing 12 months are required if the following conditions are not satisfied: (i) no material default exists under the Creative Foam Lease (as defined below), (ii) Creative Foam Corporation is paying real estate taxes pursuant to the Creative Foam Lease and (iii) upon written request from the lender, the borrower provides written evidence that real estate taxes have been paid. |
| (2) | Springing monthly deposits of 1/12th of the insurance premiums payable for renewal of the insurance coverage upon expiration are required if the following conditions are not satisfied: either (A) (i) no event of default exists under the Tenet Equity Industrial Portfolio Mortgage Loan (as defined below), (ii) the liability and casualty policies maintained by the borrower are part of a blanket or umbrella policy approved by the lender in its reasonable discretion, and (iii) the borrower provides the lender with evidence of renewal of the insurance policies and paid receipts for the insurance premiums no later than 10 days prior to the expiration dates of the policies or (B) (i) no material default exists under the Creative Foam Lease and (ii) the borrower provides the lender with evidence that the insurance coverages required by the Tenet Equity Industrial Portfolio Mortgage Loan are being maintained by either the borrower or Creative Foam Corporation. |
| (3) | Springing monthly deposits of approximately $5,137 are required if a material default exists under the Creative Foam Lease. |
| (4) | Springing monthly deposits of approximately $11,794 are required if a material default exists under the Creative Foam Lease. |
| (5) | See “Tenet Equity Industrial Portfolio Properties Summary” table below for information regarding the individual Tenet Equity Industrial Portfolio Properties (as defined below). |
| (6) | Historical net operating income is not available as the borrower acquired the Tenet Equity Industrial Portfolio Properties in a sale-leaseback transaction in April 2022. |
| (7) | The appraisal concluded an As-Is Appraised Value based on the portfolio value of all six properties. Individual property appraised values were not provided and were allocated based on the Allocated Cut-Off Date Balance. |
The Mortgage Loan. The twelfth largest mortgage loan (the “Tenet Equity Industrial Portfolio Mortgage Loan”) is evidenced by a promissory note in the original principal amount of $28,600,000 and secured by the fee interests in six industrial properties located across three states (the “Tenet Equity Industrial Portfolio Properties”).
The Borrower and Borrower Sponsor. The borrower for the Tenet Equity Industrial Portfolio Mortgage Loan is Tenet Equity Funding SPE CF, LLC, a single-purpose Delaware limited liability company, wholly owned by Tenet Equity, LP, a Delaware limited partnership. The borrower sponsor and non-recourse carveout guarantor is Tenet Equity Partners, Inc., an internally managed REIT that targets the acquisition of single-tenant net lease real estate throughout the United States, primarily through sale-leaseback transactions with middle market companies. Tenet Equity Partners, Inc. currently holds a real estate portfolio comprised of 55 triple-net leased assets totaling over 2.4 million SF located across 19 states.
The Properties. The Tenet Equity Industrial Portfolio Properties comprise six single-tenant industrial properties totaling 616,415 SF and located across three states. Four properties are located in Michigan (the “300-310 N Alloy Drive Property”, the “55210 Rudy Road Property”, the “555 S Fenway Drive Property”, and the “1139 S Fenway Circle Property”), one property is located in Tennessee (the “2301 Denso Drive Property”), and one property is located in Indiana (the “405 N Industrial Drive Property”). The Tenet Equity Industrial Portfolio Properties are fully leased via a single master lease to Creative Foam Corporation, which was executed as part of a sale-leaseback transaction in 2022 and is scheduled to expire in May 2042 (the “Creative Foam
| This is not a research report and was not prepared by any Underwriter’s research department. Please see additional important information and qualifications at the end of this Term Sheet. | ||
| T-132 | ||
| Industrial – Warehouse/Distribution | Loan #12 | Cut-off Date Balance: | $28,600,000 |
| Various | Tenet Equity Industrial Portfolio | Cut-off Date LTV: | 60.9% |
| Various | UW NCF DSCR: | 1.61x | |
| UW NOI Debt Yield: | 11.7% |
Lease”). Creative Foam Corporation is a manufacturer and supplier of custom engineered die cut, formed foam, non-woven and multi-material component solutions to the transportation, healthcare, and wind-energy industries. Founded in 1969, Creative Foam Corporation is headquartered in Fenton, Michigan and has been in operation for over 50 years with 18 facilities throughout North America and Mexico, employing approximately 1,600 employees. Creative Foam Corporation has been at the Tenet Equity Industrial Portfolio Properties for over 30 years on average, with each location serving a separate function across the company’s transportation and healthcare divisions. The 300-310 N Alloy Drive Property, 555 S Fenway Drive Property, and 1139 S Fenway Circle Property comprise the Fenton Campus (43.6% of NRA), which houses Creative Foam Corporation’s corporate headquarters, as well as its engineering and development center, along with two transportation division plants. The 2301 Denso Drive Property and 55210 Rudy Road Property (49.1% of NRA) also serve Creative Foam Corporation’s transportation division, while the 405 N Industrial Drive Property (7.3% of NRA) serves the healthcare division. For year to date June 2022 Creative Foam Corporation reported approximately $243.0 million in net sales, a net loss of approximately $29.9 million, and an EBITDA (earnings before interest, taxes, depreciation, and amortization) of approximately $24.1 million.
The following table presents certain information relating to the Tenet Equity Industrial Portfolio Properties:
| Tenet Equity Industrial Portfolio Properties Summary | |||||||
Property Name City, State | Allocated Cut-Off Date Balance | % of Portfolio Cut-Off Date Balance | Year Built/ Renovated | Tenant NRSF | % of Portfolio NRSF | Appraised Value(1) | % of Portfolio Appraised Value(1) |
2301 Denso Drive Athens, TN | $7,256,717 | 25.4% | 1999/2008 | 153,100 | 24.8% | $11,917,762 | 25.4% |
300-310 N Alloy Drive Fenton, MI | $6,342,004 | 22.2% | 1993/1996 | 124,617 | 20.2% | $10,415,522 | 22.2% |
55210 Rudy Road Dowagiac, MI | $5,732,196 | 20.0% | 1979/NAP | 149,805 | 24.3% | $9,414,030 | 20.0% |
555 S Fenway Drive Fenton, MI | $5,732,196 | 20.0% | 1996/NAP | 31,267 | 5.1% | $9,414,030 | 20.0% |
405 N Industrial Drive Bremen, IN | $1,829,424 | 6.4% | 1998/2021 | 44,813 | 7.3% | $3,004,477 | 6.4% |
1139 S Fenway Circle Fenton, MI | $1,707,463 | 6.0% | 1986/NAP | 112,813 | 18.3% | $2,804,180 | 6.0% |
| Total/Wtd. Average | $28,600,000 | 100.0% | 616,415 | 100.0% | $46,970,000 | 100.0% | |
| (1) | The Appraised Value for each of the Tenet Equity Industrial Portfolio Properties was allocated using the Allocated Cut-Off Date Balance. |
The following table presents certain information relating to the leases at the Tenet Equity Industrial Portfolio Properties:
| Tenant Summary(1) | |||||||||
| Tenant Name | Credit Rating (Fitch/Moody's/S&P) | Tenant NRSF | Approx.% of NRSF | Annual UW Base Rent | Annual UW Base Rent PSF | % of Total Annual UW Base Rent | Lease Expiration | Renewal Option | Term. Option (Y/N) |
| Creative Foam Corporation | NR/NR/NR | 616,415 | 100.0% | $3,534,300 | $5.73 | 100.0% | 5/1/2042 | 4 x 5 year | N |
| Subtotal/Wtd. Avg. | 616,415 | 100.0% | $3,534,300 | $5.73 | 100.0% | ||||
| Vacant Space | 0 | 0.0% | $0 | $0.00 | 0.0% | ||||
| Total/Wtd. Avg. | 616,415 | 100.0% | $3,534,300 | $5.73 | 100.0% | ||||
| (1) | Information is based on the underwritten rent roll. |
| This is not a research report and was not prepared by any Underwriter’s research department. Please see additional important information and qualifications at the end of this Term Sheet. | ||
| T-133 | ||
| Industrial – Warehouse/Distribution | Loan #12 | Cut-off Date Balance: | $28,600,000 |
| Various | Tenet Equity Industrial Portfolio | Cut-off Date LTV: | 60.9% |
| Various | UW NCF DSCR: | 1.61x | |
| UW NOI Debt Yield: | 11.7% |
The following table presents certain information relating to the lease rollover schedule at the Tenet Equity Industrial Portfolio Properties:
| Lease Rollover Schedule(1) | ||||||||
| Year | # of Leases Rolling | SF Rolling | UW Base Rent PSF Rolling | Approx. % of Total SF Rolling | Approx. Cumulative % of SF Rolling | Total UW Base Rent Rolling | Approx. % of UW Base Rent Rolling | Approx. Cumulative % of UW Base Rent Rolling |
| MTM | 0 | 0 | $0.00 | 0.0% | 0.0% | $0 | 0.0% | 0.0% |
| 2023 | 0 | 0 | $0.00 | 0.0% | 0.0% | $0 | 0.0% | 0.0% |
| 2024 | 0 | 0 | $0.00 | 0.0% | 0.0% | $0 | 0.0% | 0.0% |
| 2025 | 0 | 0 | $0.00 | 0.0% | 0.0% | $0 | 0.0% | 0.0% |
| 2026 | 0 | 0 | $0.00 | 0.0% | 0.0% | $0 | 0.0% | 0.0% |
| 2027 | 0 | 0 | $0.00 | 0.0% | 0.0% | $0 | 0.0% | 0.0% |
| 2028 | 0 | 0 | $0.00 | 0.0% | 0.0% | $0 | 0.0% | 0.0% |
| 2029 | 0 | 0 | $0.00 | 0.0% | 0.0% | $0 | 0.0% | 0.0% |
| 2030 | 0 | 0 | $0.00 | 0.0% | 0.0% | $0 | 0.0% | 0.0% |
| 2031 | 0 | 0 | $0.00 | 0.0% | 0.0% | $0 | 0.0% | 0.0% |
| 2032 | 0 | 0 | $0.00 | 0.0% | 0.0% | $0 | 0.0% | 0.0% |
| 2033 | 0 | 0 | $0.00 | 0.0% | 0.0% | $0 | 0.0% | 0.0% |
| 2034 & Beyond | 1 | 616,415 | $5.73 | 100.0% | 100.0% | $3,534,300 | 100.0% | 100.0% |
| Vacant | 0 | 0 | $0.00 | 0.0% | 100.0% | $0 | 0.0% | 100.0% |
| Total/Wtd. Avg. | 1 | 616,415 | $5.73 | 100.0% | $3,534,300 | 100.0% | ||
| (1) | Information is based on the underwritten rent roll. |
The following table presents recent leasing data for tenants at comparable industrial properties with respect to the 1139 S Fenway Circle Property, 300-310 N Alloy Drive Property, and 555 S Fenway Drive Property:
| Comparable Industrial Lease Summary | |||||||
| Property Name/Location | Year Built / Renovated | Size (SF) | Tenant Name | Lease SF | Lease Term (Yrs) | Rent PSF | Reimbursements |
1139 S Fenway Circle Fenton, MI | 1986/NAP | 112,813(1) | Creative Foam Corporation(1) | 112,813(1) | 20(1) | $5.73(1) | NNN(1) |
300-310 N Alloy Drive Fenton, MI | 1993/1996 | 124,617(1) | Creative Foam Corporation(1) | 124,617(1) | 20(1) | $5.73(1) | NNN(1) |
555 S Fenway Drive Fenton, MI | 1996/NAP | 31,267(1) | Creative Foam Corporation(1) | 31,267(1) | 20(1) | $5.73(1) | NNN(1) |
Fowlerville Industrial Building Fowlerville, MI | 2018/NAP | 49,164 | CPK Investments LLC | 49,164 | 2 | $6.10 | NNN |
205 E Walker Road Saint Johns, MI | 1995/NAP | 54,154 | Triton Industries Inc | 54,154 | 5 | $5.75 | NNN |
Grand River West Lyon Township, MI | 2022/NAP | 108,515 | Herregan Distributors, Inc. | 46,600 | 7 | $7.95 | NNN |
U.S. Autoforce – Wixom Wixom, MI | 2021/NAP | 126,720 | U.S. Autoforce | 126,720 | 10.25 | $7.75 | NNN |
Fenton Industrial Building Fenton, MI | 1996/NAP | 50,000 | Prospective Tenant | 50,000 | NAP | $6.50 | NNN |
Source: Appraisal, unless otherwise noted.
| (1) | Information is based on the underwritten rent roll. |
| This is not a research report and was not prepared by any Underwriter’s research department. Please see additional important information and qualifications at the end of this Term Sheet. | ||
| T-134 | ||
| Industrial – Warehouse/Distribution | Loan #12 | Cut-off Date Balance: | $28,600,000 |
| Various | Tenet Equity Industrial Portfolio | Cut-off Date LTV: | 60.9% |
| Various | UW NCF DSCR: | 1.61x | |
| UW NOI Debt Yield: | 11.7% |
The following table presents recent leasing data for tenants at comparable industrial properties with respect to the 2301 Denso Drive Property:
| Comparable Industrial Lease Summary | |||||||
| Property Name/Location | Year Built / Renovated | Size (SF) | Tenant Name | Lease SF | Lease Term (Yrs) | Rent PSF | Reimbursements |
2301 Denso Drive Athens, TN | 1999/2008 | 153,100(1) | Creative Foam Corporation(1) | 153,100(1) | 20(1) | $5.73(1) | NNN(1) |
2677 Huntington Park Drive-Listing Loudon, TN | 2023/NAP | 195,360 | Asking | 195,360 | 5 | $6.37 | NNN |
1344 East 42nd Street – Building 5 Chattanooga, TN | 1993/NAP | 100,000 | Royal Chemical | 100,000 | 3.1 | $6.00 | NNN |
TA – 165 Anderson County, TN Andersonville, TN | 2022/NAP | 126,800 | SL America | 126,800 | 7 | $5.79 | NNN |
1394 Workman Chattanooga, TN | 1979/2006 | 100,000 | Swim Distributors of | 43,000 | 6.5 | $5.94 | NNN |
120 Flint Road Oak Ridge, TN | 1974/NAP | 56,700 | Katom | 56,700 | 2 | $6.25 | NNN |
Source: Appraisal, unless otherwise noted.
| (1) | Information is based on the underwritten rent roll. |
The following table presents recent leasing data for tenants at comparable industrial properties with respect to the 405 N Industrial Drive Property:
| Comparable Industrial Lease Summary | |||||||
| Property Name/Location | Year Built / Renovated | Size (SF) | Tenant Name | Lease SF | Lease Term (Yrs) | Rent PSF | Reimbursements |
405 N Industrial Drive Bremen, IN | 1998/2021 | 44,813(1) | Creative Foam Corporation(1) | 44,813(1) | 20(1) | $5.73(1) | NNN(1) |
Expressport Building I Fort Wayne, IN | 1997/NAP | 112,000 | Ellison Bakery | 32,000 | 7.2 | $5.40 | NNN |
Tower Automotive Operations Waterloo, IN | 1981/NAP | 23,250 | Tower Automotive Operations USA 1 | 23,250 | 3 | $4.13 | NNN |
Lexington Park Drive Warehouse Elkhart, IN | 1973/NAP | 40,544 | Patrick Industries | 40,544 | 5 | $5.00 | NNN |
Velko Hinge Munster, IN | 1984/2000 | 35,000 | Velko Hinge | 35,000 | 15 | $5.71 | NNN |
Mobile Climate Control Goshen, IN | 1979/2007 | 76,927 | Constant Transport | 24,677 | 3 | $4.25 | NNN |
Source: Appraisal, unless otherwise noted.
| (1) | Information is based on the underwritten rent roll. |
The following table presents recent leasing data for tenants at comparable industrial properties with respect to the 55210 Rudy Road Property:
| Comparable Industrial Lease Summary | |||||||
| Property Name/Location | Year Built / Renovated | Size (SF) | Tenant Name | Lease SF | Lease Term (Yrs) | Rent PSF | Reimbursements |
55210 Rudy Road Dowagiac, MI | 1979/NAP | 149,805(1) | Creative Foam Corporation(1) | 149,805(1) | 20(1) | $5.73(1) | NNN(1) |
Confidential Marysville, MI | 1943/1987 | 233,264 | Confidential | 233,264 | 1.7 | $4.78 | Absolute Net |
Magna Industrial Holland, MI | 1987/2022 | 406,120 | Magna | 406,120 | 10 | $4.98 | NNN |
Huntington Foam – Greenville, MI Greenville MI | 2001/2015 | 74,135 | Huntington Foam, LLC | 74,135 | 20.1 | $4.05 | Absolute Net |
Magna Mirrors – Alto, MI Alto, MI | 1982/1994 | 165,604 | Magna | 165,604 | 10 | $4.13 | NNN |
Alma Products Alma, MI | 1945/2015 | 276,085 | Alma Products | 276,085 | 15 | $4.50 | Absolute Net |
Source: Appraisal, unless otherwise noted.
| (1) | Information is based on the underwritten rent roll. |
| This is not a research report and was not prepared by any Underwriter’s research department. Please see additional important information and qualifications at the end of this Term Sheet. | ||
| T-135 | ||
| Industrial – Warehouse/Distribution | Loan #12 | Cut-off Date Balance: | $28,600,000 |
| Various | Tenet Equity Industrial Portfolio | Cut-off Date LTV: | 60.9% |
| Various | UW NCF DSCR: | 1.61x | |
| UW NOI Debt Yield: | 11.7% |
The following table presents information relating to the appraisal’s market rent conclusions for the Tenet Equity Industrial Portfolio Properties:
| Market Rent Summary | ||
| Property Name | MLA Category | Market Rent |
| 1139 S Fenway Circle | Industrial | $6.50 |
| 2301 Denso Drive | Warehouse | $5.75 |
| 300-310 N Alloy Drive | Industrial | $6.00 |
| 405 N Industrial Drive | Industrial | $5.00 |
| 55210 Rudy Road | Industrial | $4.50 |
| 555 S Fenway Drive | Industrial | $6.00 |
| Source: Appraisal. | ||
Underwritten Net Cash Flow. The following table presents certain information relating to the Underwritten Net Cash Flow at the Tenet Equity Industrial Portfolio Properties:
| Cash Flow Analysis(1) | ||
| UW | UW PSF | |
| Gross Potential Rent(2) | $3,534,300 | $5.73 |
| Other Income | $0 | $0.00 |
| Reimbursements | $103,683 | $0.17 |
| Less Vacancy & Credit Loss | ($181,899) | ($0.30) |
| Effective Gross Income | $3,456,083 | $5.61 |
| Real Estate Taxes | $0 | $0.00 |
| Insurance | $0 | $0.00 |
| Other Operating Expenses | $103,683 | $0.17 |
| Total Operating Expenses | $103,683 | $0.17 |
| Net Operating Income | $3,352,401 | $5.44 |
| Capital Expenditures | $61,642 | $0.10 |
| TI/LC | $141,524 | $0.23 |
| Net Cash Flow | $3,149,235 | $5.11 |
| Occupancy % | 94.9%(3) | |
| NOI DSCR | 1.72x | |
| NCF DSCR | 1.61x | |
| NOI Debt Yield | 11.7% | |
| NCF Debt Yield | 11.0% | |
| (1) | Historical net operating income is not available as the borrower acquired the Tenet Equity Industrial Portfolio Properties in a sale-leaseback transaction in April 2022. |
| (2) | Gross Potential Rent has been underwritten based on the underwritten rent roll. |
| (3) | UW Occupancy % represents economic occupancy. |
| This is not a research report and was not prepared by any Underwriter’s research department. Please see additional important information and qualifications at the end of this Term Sheet. | ||
| T-136 | ||
| Mortgage Loan No. 13 – One & Two Commerce Square |
| Mortgage Loan Information | Property Information | |||||
| Mortgage Loan Seller: | BANA/JPMCB | Single Asset/Portfolio: | Single Asset | |||
| Credit Assessment (Fitch/Moody’s/KBRA): | NR/NR/BBB | Location: | Philadelphia, PA 19103 | |||
| Original Balance(1): | $25,000,000 | General Property Type: | Office | |||
| Cut-off Date Balance(1): | $25,000,000 | Detailed Property Type: | CBD | |||
| % of Initial Pool Balance: | 3.7% | Title Vesting: | Fee | |||
| Loan Purpose: | Refinance | Year Built/Renovated: | 1987; 1992 / 2013 | |||
| Borrower Sponsor: | Brandywine Operating Partnership, L.P. | Size: | 1,896,143 SF | |||
| Guarantor: | Brandywine Operating Partnership, L.P. | Cut-off Date Balance PSF(1): | $116 | |||
| Mortgage Rate: | 7.78750% | Maturity Date Balance PSF(1): | $116 | |||
| Note Date: | 6/1/2023 | Property Manager: | BDN Management Inc. | |||
| First Payment Date: | 7/6/2023 | (borrower-related) | ||||
| Maturity Date: | 6/6/2028 | |||||
| Original Term to Maturity: | 60 months | |||||
| Original Amortization Term: | 0 months | Underwriting and Financial Information | ||||
| IO Period: | 60 months | UW NOI: | $29,698,092 | |||
| Seasoning: | 1 month | UW NOI Debt Yield(1): | 13.5% | |||
| Prepayment Provisions: | L(24),YM1(29),O(7) | UW NOI Debt Yield at Maturity(1): | 13.5% | |||
| Lockbox/Cash Mgmt Status(2): | Hard/Springing | UW NCF DSCR(1): | 1.52x | |||
| Additional Debt Type(1): | Pari Passu | Most Recent NOI: | $24,981,970 (4/30/2023 TTM) | |||
| Additional Debt Balance(1): | $195,000,000 | 2nd Most Recent NOI: | $24,399,000 (12/31/2022) | |||
| Future Debt Permitted (Type): | No (NAP) | 3rd Most Recent NOI: | $22,215,377 (12/31/2021) | |||
| Reserves | Most Recent Occupancy: | 76.4% (5/17/2023) | ||||
| Type | Initial | Monthly | Cap | 2nd Most Recent Occupancy: | 78.3% (12/31/2022) | |
| RE Tax(3): | $0 | Springing | NAP | 3rd Most Recent Occupancy: | 79.0% (12/31/2021) | |
| Insurance(3): | $0 | Springing | NAP | Appraised Value (as of): | $428,000,000 (3/30/2023) | |
| Replacement Reserves(3): | $0 | Springing | NAP | Appraised Value PSF: | $226 | |
| TI/LC Reserve(4): | $25,000,000 | Springing | $25,000,000 | Cut-off Date LTV Ratio(1): | 51.4% | |
| Upfront Leasing Reserves(5): | $11,112,904 | $0 | NAP | Maturity Date LTV Ratio(1): | 51.4% | |
| Sources and Uses | ||||||
| Sources | Proceeds | % of Total | Uses | Proceeds | % of Total | |
| Whole Loan Amount(1): | $220,000,000 | 89.9% | Loan Payoff: | $204,600,430 | 83.6% | |
| Borrower Sponsor Equity: | $24,825,039 | 10.1% | Reserves(4): | $36,112,904 | 14.8% | |
| Closing Costs: | $4,111,705 | 1.7% | ||||
| Total Sources: | $244,825,039 | 100.0% | Total Uses: | $244,825,039 | 100.0% | |
| (1) | The One & Two Commerce Square Mortgage Loan (as defined below) is part of the One & Two Commerce Square Whole Loan (as defined below) which is comprised of 13 pari passu promissory notes with an aggregate outstanding principal balance as of the Cut-off Date of $220,000,000. The Cut-off Date Balance PSF, Maturity Date Balance PSF, UW NOI Debt Yield, UW NOI Debt Yield at Maturity, UW NCF DSCR, Cut-off Date LTV Ratio and Maturity Date LTV Ratio presented above are based on the aggregate Cut-off Date principal balance of the One & Two Commerce Square Whole Loan. |
| (2) | Upon the occurrence of a Trigger Period (as defined below), all funds in the lockbox account are required to be swept into the cash management account controlled by the lender. A Trigger Period begins upon (i) an event of default, (ii) a bankruptcy action of the borrowers, (iii) the debt yield being less than 8.85% for two consecutive calendar quarters, or (iv) the debt service coverage ratio falls below 1.20x (based on a 30-year amortization schedule) for two consecutive calendar quarters. |
| (3) | During a Trigger Period the borrowers are required to deposit (i) 1/12th of the annual estimated tax payments, (ii) 1/12th of the annual estimated insurance premiums (if there is no blanket policy in place), and (iii) monthly replacement reserves equal to approximately $39,503. |
| (4) | The borrowers delivered a letter of credit in lieu of cash for the $25,000,000 upfront tenant improvement and leasing reserve. During the continuance of a Trigger Period, the borrowers will be required to deposit $237,018 on a monthly basis to the TI/LC Reserve. Additionally, when (i) the balance of the TI/LC Reserves is less than $15,000,000 and (ii) the TI/LC reserve occupancy falls below 85%, the One & Two Commerce Square Whole Loan will require a cash sweep until the balance returns to $25,000,000. Further, the non-recourse carveout guarantor has provided a guaranty for an additional $20,000,000 to the TI/LC Reserves, which guaranty will be reduced by any amounts contributed to the TI/LC Reserves after the loan origination date. |
| (5) | At origination, the borrowers deposited (i) $9,200,744 for outstanding tenant improvement allowances and outstanding leasing commissions, and (ii) $1,912,160 for outstanding free rent and gap rent obligations. |
Mortgage Loan. The thirteenth largest mortgage loan (the “One & Two Commerce Square Mortgage Loan”) is evidenced by thirteen pari passu promissory notes with an aggregate outstanding principal balance as of the Cut-off Date of $220,000,000 (the “One & Two Commerce Square Whole Loan”) and is secured by a first priority fee mortgage encumbering two office buildings with an aggregate of 1,896,143 SF located in Philadelphia, Pennsylvania (the “One & Two Commerce Square Property”). The One & Two Commerce Square Whole Loan was co-originated by Bank of America, National Association (“BANA”), JPMorgan Chase Bank, National Association (“JPMCB”) and Barclays Capital Real Estate Inc. (“Barclays”). The non-controlling Note A-3 (originated by BANA) and Note A-10-1 (originated by JPMCB), with an aggregate original principal balance of $25,000,000, will be included in the BANK5 2023-5YR2 securitization trust. The remaining notes are currently held by BANA, JPMCB and Barclays or their respective affiliates and are expected to be contributed to one or more future securitization trust(s). The One & Two Commerce Square Whole Loan will be serviced pursuant to the pooling and servicing agreement for the BBCMS 2023-C20 securitization, until the controlling Note A-1 is securitized, whereupon the One & Two Commerce Square Whole Loan will be serviced pursuant to the pooling and servicing agreement for the securitization to which the controlling Note A-1 is contributed. See “Description of the Mortgage Pool—The Whole Loans—The Non-Serviced Pari Passu Whole Loans” and “Pooling and Servicing Agreement—Servicing of the Non-Serviced Mortgage Loans” in the prospectus.
| This is not a research report and was not prepared by any Underwriter’s research department. Please see additional important information and qualifications at the end of this Term Sheet. | ||
| T-137 | ||
| Office – CBD | Loan #13 | Cut-off Date Balance: | $25,000,000 |
| 2001 and 2005 Market Street | One & Two Commerce Square | Cut-off Date LTV: | 51.4% |
| Philadelphia, PA 19103 | UW NCF DSCR: | 1.52x | |
| UW NOI Debt Yield: | 13.5% |
| One & Two Commerce Square Whole Loan Summary | ||||
Note | Original Balance | Cut-off Date Balance | Note Holder | Controlling Piece |
| A-1 | $30,833,333 | $30,833,333 | BANA | Yes |
| A-2 | $20,000,000 | $20,000,000 | BBCMS 2023-C20(1) | No |
| A-3 | $12,500,000 | $12,500,000 | BANK5 2023-5YR2 | No |
| A-4 | $10,000,000 | $10,000,000 | BBCMS 2023-C20(1) | No |
| A-5 | $30,000,000 | $30,000,000 | BBCMS 2023-C20(1) | No |
| A-6 | $25,000,000 | $25,000,000 | Barclays | No |
| A-7 | $10,000,000 | $10,000,000 | Barclays | No |
| A-8 | $8,333,333 | $8,333,333 | Barclays | No |
| A-9 | $30,000,000 | $30,000,000 | JPMCB | No |
| A-10-1 | $12,500,000 | $12,500,000 | BANK5 2023-5YR2 | No |
| A-10-2 | $12,500,000 | $12,500,000 | JPMCB | No |
| A-11 | $10,000,000 | $10,000,000 | JPMCB | No |
| A-12 | $8,333,333 | $8,333,333 | JPMCB | No |
| Total | $220,000,000 | $220,000,000 | ||
| (1) | The BBCMS 2023-C20 securitization is expected to close on or about July 11, 2023. |
The Borrowers and the Borrower Sponsor. The borrowers are Commerce Square Partners-Philadelphia Plaza, L.P. and Philadelphia Plaza – Phase II, LP, each a special purpose, bankruptcy remote entity and a Delaware limited partnership and Pennsylvania limited partnership respectively, each of which has a special purpose, bankruptcy remote Delaware limited liability company as its general partners. Each general partner has two independent directors acting with respect to itself, the borrowers and certain related TRS subsidiary entities. The borrowers are indirectly a joint venture between Brandywine Operating Partnership, L.P. and GIC.
The borrower sponsor and non-recourse carveout guarantor of the One & Two Commerce Square Whole Loan is Brandywine Operating Partnership, L.P. Brandywine Operating Partnership, L.P., is owned and controlled by Brandywine Realty Trust (“BRT”). BRT (NYSE: BDN / S&P: BBB-), a large publicly traded, full-service integrated real estate company in the United States with a market capitalization of approximately $760 million as of June 2023. Organized as a real estate investment trust, BRT owns, develops, leases and manages a portfolio of 165 urban, town center and transit-oriented properties totaling 23.0 million SF as of September 30, 2022, with a core focus in the Philadelphia, Austin and Washington, D.C. markets (excluding assets held for sale). BRT has completed over 6.3 million SF of ground-up new development in the Philadelphia market, with over 8 million additional SF in the pipeline.
GIC is a global investment firm established in 1981 to secure Singapore’s financial future. As the manager of Singapore’s foreign reserves, GIC is positioned across a wide range of asset classes and active strategies globally. These include equities, fixed income, real estate, private equity, venture capital, and infrastructure. Headquartered in Singapore, GIC has a global work force of over 1,900 people in 11 key financial cities and has investments in over 40 countries.
The Property. The One & Two Commerce Square Property is comprised of twin 40-story, multi-tenant, office buildings connected by an open-air courtyard with media wall and 48,725 SF of ground floor retail space. The One & Two Commerce Square Property was built on a 2.97-acre site, spanning an entire city block, in Philadelphia, Pennsylvania and totals 1,896,143 square feet of net rentable area.
The One & Two Commerce Square Property is a LEED-Silver certified building with terraces on the north and south sides of the building featuring unobstructed panoramic views of Philadelphia. Building amenities include a fitness center with locker rooms, conference facilities, Brandywine Experience (BEX) community lounge and work area. The One & Two Commerce Square Property features an underground parking garage, with parking for 519 vehicles.
Since 2015, the borrower sponsor has invested approximately $15 million at the One & Two Commerce Square Property in capital expenditures, including upgrading the building lobbies, updating the courtyard and courtyard fountain, modernizing the elevator systems and updating signage.
As of May 17, 2023, the One & Two Commerce Square Property was 76.4% leased to 91 tenants representing various industries including finance, law, insurance, pharmaceuticals, accounting, biotech and other. The largest tenant represents only 7.3% of net rentable area.
Major Tenants.
Price Water House Coopers LLP (138,413 SF; 7.3% of NRA; 9.4% of underwritten rent). Price Water House Coopers LLP (“PwC”) is an international professional services company that provides audit, tax, and advisory services with approximately 328,000 employees across the world. PwC has one of the largest professional services network in the world and is considered one of the Big Four accounting firms, along with Deloitte, EY and KPMG. PwC reported a gross revenue of $50.3 billion as for the trailing 12 months ending June 30, 2022.
PwC has been in occupancy at the One & Two Commerce Square Property since 1999, originally under a sublease, then under a direct lease commencing December 2013. PwC’s current lease has an expiration in April 2030, with three, five-year renewal options. PwC currently pays a base rent of $22.50 PSF, with $0.50 PSF annual increases. PwC occupies six floors of the One & Two Commerce Square Property. PwC subleases a portion of its space (23,037 SF) to the Jewish Federation of Greater Philadelphia, which is co- terminous with the prime lease. PwC has no existing contraction or termination options.
Stradley, Ronon, Stevens & Young (69,111 SF; 3.6% of NRA; 5.1% of underwritten rent). Stradley, Ronon, Stevens & Young (“Stradley Ronon”) is a law firm that provides legal services on corporate & securities, litigation, education, investment management, employment & labor, financial services, real
| This is not a research report and was not prepared by any Underwriter’s research department. Please see additional important information and qualifications at the end of this Term Sheet. | ||
| T-138 | ||
| Office – CBD | Loan #13 | Cut-off Date Balance: | $25,000,000 |
| 2001 and 2005 Market Street | One & Two Commerce Square | Cut-off Date LTV: | 51.4% |
| Philadelphia, PA 19103 | UW NCF DSCR: | 1.52x | |
| UW NOI Debt Yield: | 13.5% |
estate, tax, and others. Stradley Ronon has provided services in more than 230 markets, including 80 countries abroad with about 200 lawyers. Stradley Ronon was founded in Philadelphia and the One & Two Commerce Square Property serves as its headquarters.
Stradley Ronon has been in occupancy at the One & Two Commerce Square Property since 1988 and has expanded and renewed multiple times. Stradley Ronon currently occupies three floors under a lease dated November 2014 and expiring in December 2033, with two, five-year renewal options with 24 months’ notice. Stradley Ronon pays a base rent of $24.33 PSF, with a 2.5% annual increase. Stradley Ronon has no existing contraction options but does have a termination right with notice by February 1, 2029 and payment of a termination fee, which if exercised would be effective January 31, 2031.
Pond Lehocky Giordano Disability (66,315 SF; 3.5% of NRA; 3.8% of underwritten rent). Pond Lehocky Giordano Disability (“Pond Lehocky”) is a law firm in Pennsylvania that provides legal services on worker’s compensation, social security disability, long-term disability, short-term disability, and other legal needs. Pond Lehocky has grown rapidly since its inception and is now one of the largest workers’ compensation and disability firms in the United States, with over 200 employees, including more than 30 attorneys.
Pond Lehocky has been in occupancy at the One & Two Commerce Square Property for more than eight years and has a lease expiration in June 2028. Pond Lehocky pays a base rent of $19.13 PSF, with 3% annual increases. Pond Lehocky occupies portions of three floors of the One & Two Commerce Square Property and currently subleases a portion of its space (15,838 SF) to Morgan & Morgan Philadelphia, LLC through January 31, 2026. Pond Lehocky does not have any contraction or termination options.
The following table presents a summary regarding the major tenants at the One & Two Commerce Square Property:
| Tenant Summary(1) | |||||||||
| Tenant Name | Credit Rating (Moody’s/S&P/ Fitch)(2) | Tenant SF | Approx.% of SF | Annual UW Base Rent | Annual UW Base Rent PSF | % of Total Annual UW Base Rent | Lease Expiration | Renewal Option | Term. Option (Y/N) |
| PwC(3) | NR/NR/NR | 138,413 | 7.3% | $3,114,292 | $22.50 | 9.4% | 4/30/2030 | 3 x 5 yr | N |
| Stradley Ronon | NR/NR/NR | 69,111 | 3.6% | $1,681,471 | $24.33 | 5.1% | 12/31/2033 | 2 x 5 yr | Y(4) |
| Pond Lehocky(5) | NR/NR/NR | 66,315 | 3.5% | $1,268,937 | $19.13 | 3.8% | 6/30/2028 | 1 x 5 yr | N |
| Wolters Kluwer Health, Inc. | A3/BBB+/NR | 65,389 | 3.4% | $1,282,442 | $19.61 | 3.9% | 3/31/2029 | 1 x 5 yr | Y(6) |
| Jazz Pharmaceuticals, Inc. | NR/NR/NR | 59,672 | 3.1% | $1,496,323 | $25.08 | 4.5% | 4/30/2029 | 2 x 5 yr | Y(7) |
| Subtotal/Wtd. Avg. | 398,900 | 21.0% | $8,843,466 | $22.17 | 26.6% | ||||
| Other Tenants | 1,049,940 | 55.4% | $24,372,924 | $23.21 | 73.4% | ||||
| Vacant Space | 447,303 | 23.6% | $0 | $0.00 | 0.0% | ||||
| Total/Wtd. Avg.(8) | 1,896,143 | 100.0% | $33,216,390 | $22.93 | 100.0% | ||||
| (1) | Information is based on the underwritten rent roll dated May 17, 2023 and is inclusive of signed not occupied tenants, rent steps through June 2024 and straight-line rent steps through the lesser of the end of the loan term or the lease expiration date for investment grade tenants. |
| (2) | Ratings are those of the parent company whether or not the parent guarantees the lease. |
| (3) | PwC subleases a portion of its space (23,037 SF) to the Jewish Federation of Greater Philadelphia. The sublease is co-terminous with the PwC lease. |
| (4) | Stradley Ronon has a termination right for all of its leased space with notice by February 1, 2029 and payment of a termination fee, which if exercised would be effective January 31, 2031. |
| (5) | Pond Lehocky subleases a portion of its space (15,838 SF) to Morgan & Morgan Philadelphia, LLC. The sublease expires on January 31, 2026. |
| (6) | Wolters Kluwer Health, Inc. has a termination option for its space on March 31, 2026, with a notice no later than September 30, 2024 and payment of a termination fee. |
| (7) | Jazz Pharmaceuticals, Inc. has a termination option with 12 months’ notice and payment of a termination fee, which if exercised would be effective December 31, 2025. |
| (8) | Total/Wtd. Avg. Annual UW Base Rent PSF excludes vacant space. |
| This is not a research report and was not prepared by any Underwriter’s research department. Please see additional important information and qualifications at the end of this Term Sheet. | ||
| T-139 | ||
| Office – CBD | Loan #13 | Cut-off Date Balance: | $25,000,000 |
| 2001 and 2005 Market Street | One & Two Commerce Square | Cut-off Date LTV: | 51.4% |
| Philadelphia, PA 19103 | UW NCF DSCR: | 1.52x | |
| UW NOI Debt Yield: | 13.5% |
The following table presents certain information relating to the lease rollover at the One & Two Commerce Square Property:
| Lease Rollover Schedule(1)(2) | ||||||||
| Year | # of Leases Rolling | SF Rolling | Annual UW Rent PSF Rolling | Approx. % of Total SF Rolling | Approx. Cumulative % of SF Rolling | Total UW Rent Rolling | Approx. % of Total Rent Rolling | Approx. Cumulative % of Total Rent Rolling |
| 2023/MTM | 10 | 24,801 | $19.34 | 1.3% | 1.3% | $479,707 | 1.4% | 1.4% |
| 2024 | 20 | 186,068 | $23.11 | 9.8% | 11.1% | $4,299,229 | 12.9% | 14.4% |
| 2025 | 6 | 26,192 | $27.35 | 1.4% | 12.5% | $716,231 | 2.2% | 16.5% |
| 2026 | 10 | 66,416 | $26.56 | 3.5% | 16.0% | $1,764,139 | 5.3% | 21.9% |
| 2027 | 10 | 129,306 | $20.66 | 6.8% | 22.8% | $2,671,319 | 8.0% | 29.9% |
| 2028 | 13 | 152,682 | $20.90 | 8.1% | 30.9% | $3,190,880 | 9.6% | 39.5% |
| 2029 | 11 | 186,387 | $22.74 | 9.8% | 40.7% | $4,238,676 | 12.8% | 52.3% |
| 2030 | 9 | 216,908 | $22.53 | 11.4% | 52.1% | $4,887,917 | 14.7% | 67.0% |
| 2031 | 10 | 107,603 | $26.66 | 5.7% | 57.8% | $2,868,384 | 8.6% | 75.6% |
| 2032 | 2 | 44,057 | $18.32 | 2.3% | 60.1% | $807,124 | 2.4% | 78.0% |
| 2033 | 10 | 164,271 | $26.76 | 8.7% | 68.8% | $4,396,628 | 13.2% | 91.3% |
| 2034 & Beyond(3) | 13 | 144,149 | $20.09 | 7.6% | 76.4% | $2,896,158 | 8.7% | 100.0% |
| Vacant | 0 | 447,303 | $0.00 | 23.6% | 100.0% | $0 | 0.0% | 100.0% |
| Total/Wtd. Avg.(4) | 124 | 1,896,143 | $22.93 | 100.0% | $33,216,390 | 100.0% | ||
| (1) | Based on the underwritten rent roll dated May 17, 2023 and is inclusive of signed not occupied tenants, rent steps through June 2024 and straight-line rent steps through the lesser of the end of the loan term or the lease expiration date for investment grade tenants. |
| (2) | Certain tenants may have lease termination options that are exercisable prior to the stated expiration date of the subject lease or leases which are not considered in the lease rollover schedule. |
| (3) | 2034 & Beyond is inclusive of variance square footage attributable to storage space for which no UW Base Rent was attributed. |
| (4) | Total/Wtd. Avg. Annual UW Rent PSF Rolling excludes vacant space. |
The Market.
The One & Two Commerce Square Property is located in Philadelphia, Pennsylvania at the western edge of Center City, across the Schuylkill River from University City. The One & Two Commerce Square Property is approximately a 10-minute walk to the 30th Street Station, Philadelphia’s main transit hub, less than a half mile from Interstate 76 and in close proximity to Interstates 676 and 95. Center City Philadelphia is the commercial, financial and governmental core of the seventh largest metropolitan area in the U.S. According to a third-party data provider, the Philadelphia central business district office market is outperforming other major downtowns across the country, due to a number of factors including Philadelphia’s employment base driven by healthcare, education and government industries, along with high construction costs that have kept new office supply limited for decades.
The One & Two Commerce Square Property is located in the Philadelphia-Camden-Wilmington, PA-NJ-DE-MD metropolitan statistical area and the Market West office submarket. According to the appraisal, as of the fourth quarter of 2022, the Market West office submarket had an inventory of 28,770,887 SF, a total vacancy of 13.8% and an average asking rent of $35.01 PSF. The One & Two Commerce Square Property is considered a part of the trophy class of Philadelphia’s office market, which includes the top fifteen assets and top 19% of rentable area in the market.
The 2022 population within a 0.25-, 0.50- and one-mile radius of the One & Two Commerce Square Property was 11,141, 28,932 and 96,595, respectively. The 2022 average household income within the same radii was $143,878, $155,817 and $149,005, respectively.
| This is not a research report and was not prepared by any Underwriter’s research department. Please see additional important information and qualifications at the end of this Term Sheet. | ||
| T-140 | ||
| Office – CBD | Loan #13 | Cut-off Date Balance: | $25,000,000 |
| 2001 and 2005 Market Street | One & Two Commerce Square | Cut-off Date LTV: | 51.4% |
| Philadelphia, PA 19103 | UW NCF DSCR: | 1.52x | |
| UW NOI Debt Yield: | 13.5% |
The following table presents recent leasing data for office tenants at comparable office properties with respect to the One & Two Commerce Square Property:
| Comparable Office Leases | ||||||||||
Property Name Location | Year Built / Renovated | Occ. | Total NRA (SF) | Tenant | Lease Date/ Term (yrs.) |
Lease Size (SF) | Base Rent PSF | TIs (PSF) / Free Rent (mos.) | Reimb. | Escalations |
One & Two Commerce Square Philadelphia, PA | 1987; 1992 / 2013 | 76.4%(1) | 1,896,143(1) | PwC(1) | Dec-13 / 16.4(1) | 138,413(1) | $22.50(1) | NAP | NNN | $0.50 /yr |
| Two Liberty Place | 1990 / NAP | 89.7% | 951,372 | FWM Holdings | Feb-22 / 11.0 | 5,799 | $46.50 | $82.00 / 12 | Base Plus Electric | 2.25%/yr |
| 1735 Market Street | 1990 / NAP | 87.7% | 1,286,936 | UBS Wealth Management | Aug-22 / 11.0 | 22,825 | $35.00 | $90.00 / 12 | NNN | 2.50%/yr |
| 1717 Arch Street | 1990 / NAP | NAP | 1,029,413 | Metlife Investment Management | Apr-22 / 5.5 | 20,903 | $33.75 | $30.00 / 5 | NNN | 2.50%/yr |
| 1600 Market Street | 1980 / 1997 | 78.7% | 862,030 | Security Risk Advisors | Apr-21 / 11.4 | 21,687 | $35.25 | $75.00 / 16 | Base Plus Electric | 2.25%/yr |
| 1700 Market Street | 1969 / 2018 | 83.0% | 848,709 | CommonGrounds | Nov-19 / 11.0 | 62,461 | $33.00 | $70.00 / 10 | Base Plus Electric | 2.25%/yr |
| 2222 Market Street | 2023 / NAP | NAP | 308,000 | Morgan Lewis | Feb-23 / 21.0 | 308,000 | $44.95 | $90.00 / 12 | NNN | 2.0%/yr |
| 1650 Arch Street | 1974 / 2001 | NAP | 608,210 | GSA | Oct -22 / 17.0 | 106,748 | $28.39 | $65.00 / N/A | Base Plus Electric | 2.0%/yr |
| One Liberty Place | 1987 / NAP | 95.5% | 1,200,000 | JP Morgan Chase | Dec-22 / 11.0 | 33,172 | $42.64 | $70.00 / 12 | Base Plus Electric | 2.0%/yr |
Source: Appraisal, unless otherwise noted.
| (1) | Information is based on the underwritten rent roll dated May 17, 2023. |
The following table presents information relating to the appraisal’s market rent conclusion for the One & Two Commerce Square Property:
| Market Rent Summary | ||
| Category | Market Rent (PSF) | Lease Term (Yrs) |
| Low Rise (1-9) | $20.00 | 5.0 |
| Low Rise Large (1-9) | $19.00 | 10.0 |
| Mid Rise 1 (10-17) | $22.00 | 5.0 |
| Mid Rise 1 Large (10-17) | $21.00 | 10.0 |
| Mid Rise 2 (18-29) | $24.00 | 5.0 |
| Mid Rise 2 Large (18-29) | $23.00 | 10.0 |
| High Rise (30-41) | $27.00 | 5.0 |
| High Rise Large (30-41) | $26.00 | 10.0 |
| Interior Retail | $30.00 | 10.0 |
| Market Retail | $60.00 | 10.0 |
| This is not a research report and was not prepared by any Underwriter’s research department. Please see additional important information and qualifications at the end of this Term Sheet. | ||
| T-141 | ||
| Office – CBD | Loan #13 | Cut-off Date Balance: | $25,000,000 |
| 2001 and 2005 Market Street | One & Two Commerce Square | Cut-off Date LTV: | 51.4% |
| Philadelphia, PA 19103 | UW NCF DSCR: | 1.52x | |
| UW NOI Debt Yield: | 13.5% |
Operating History and Underwritten Net Cash Flow. The following table presents certain information relating to the historical operating performance and the Underwritten Net Cash Flow at the One & Two Commerce Square Property:
| Cash Flow Analysis(1) | ||||||||
| 2019 | 2020 | 2021(2) | 2022 | 2/28/2023 TTM | UW | UW PSF | ||
| In-Place Rent | $35,849,314 | $35,849,499 | $27,922,144 | $29,078,215 | $28,539,075 | $30,726,994 | $16.20 | |
| Rent Steps(3) | $0 | $0 | $0 | $0 | $0 | $1,457,943 | $0.77 | |
| Signed Not Occupied Rent | $0 | $0 | $0 | $0 | $0 | $779,311 | $0.41 | |
| Straight-line Rent Steps(3) | $0 | $0 | $0 | $0 | $0 | $252,142 | $0.13 | |
| Gross-Up Vacant Rent | $0 | $0 | $0 | $0 | $0 | $16,031,979 | $8.46 | |
| Expense Recoveries | $21,161,111 | $21,434,786 | $19,357,798 | $19,208,229 | $17,638,845 | $19,341,543 | $10.20 | |
| Gross Potential Income | $57,010,425 | $57,284,285 | $47,279,942 | $48,286,444 | $46,177,920 | $68,589,912 | $36.17 | |
| Other Income(4) | $2,605,775 | $1,970,590 | $1,466,313 | $2,465,179 | $2,625,239 | $2,532,306 | $1.34 | |
| Less Vacancy & Credit Loss | $0 | $0 | $0 | $0 | $0 | ($16,031,979) | ($8.46) | |
| Effective Gross Income | $59,616,200 | $59,254,875 | $48,746,255 | $50,751,623 | $48,803,159 | $55,090,239 | $29.05 | |
| Real Estate Taxes | $7,735,297 | $7,993,243 | $8,104,820 | $8,110,987 | $5,662,861 | $6,640,047 | $3.50 | |
| Insurance | $466,786 | $522,491 | $584,708 | $633,083 | $650,386 | $456,592 | $0.24 | |
| Other Expenses | $19,366,562 | $19,153,671 | $17,841,350 | $17,608,553 | $17,507,942 | $18,295,508 | $9.65 | |
| Total Expenses | $27,568,645 | $27,669,405 | $26,530,878 | $26,352,623 | $23,821,189 | $25,392,147 | $13.39 | |
| Net Operating Income | $32,047,555 | $31,585,470 | $22,215,377 | $24,399,000 | $24,981,970 | $29,698,092 | $15.66 | |
| Capital Expenditures | $0 | $0 | $0 | $0 | $0 | $474,036 | $0.25 | |
| TI/LC | $0 | $0 | $0 | $0 | $0 | $2,844,215 | $1.50 | |
| Net Cash Flow | $32,047,555 | $31,585,470 | $22,215,377 | $24,399,000 | $24,981,970 | $26,379,842 | $13.91 | |
| Occupancy % | 97.6% | 88.0% | 79.0% | 78.3% | 76.4% | (5) | 76.6%(5) | |
| NOI DSCR(6) | 1.84x | 1.82x | 1.28x | 1.40x | 1.44x | 1.71x | ||
| NCF DSCR(6) | 1.84x | 1.82x | 1.28x | 1.40x | 1.44x | 1.52x | ||
| NOI Debt Yield(6) | 14.6% | 14.4% | 10.1% | 11.1% | 11.4% | 13.5% | ||
| NCF Debt Yield(6) | 14.6% | 14.4% | 10.1% | 11.1% | 11.4% | 12.0% | ||
| (1) | Based on the underwritten rent roll dated May 17, 2023. |
| (2) | The decline in revenue and occupancy was driven by three major tenants which gave notice to vacate in 2019 which brought the occupancy from 97.6% to the low 70%’s. The borrower sponsor was able to quickly backfill some smaller tenants with various new leases before the major tenants vacated their space. The borrower sponsor has since shifted its leasing strategy focusing on smaller tenants. |
| (3) | Represents contractual rent steps taken through June 2024 and straight-line rent steps taken through the lesser of the end of the loan term or the lease expiration date for investment grade tenants. |
| (4) | Other Income includes parking income, termination fees, fitness center dues and other miscellaneous income. |
| (5) | TTM 2/28/2023 occupancy is per the underwritten rent roll dated May 17, 2023. UW Occupancy % represents economic occupancy. |
| (6) | Debt service coverage ratios and debt yields are based on the One & Two Commerce Square Whole Loan. |
| This is not a research report and was not prepared by any Underwriter’s research department. Please see additional important information and qualifications at the end of this Term Sheet. | ||
| T-142 | ||
| Mortgage Loan No. 14 – Heritage Plaza |
| Mortgage Loan Information | Property Information | |||||
| Mortgage Loan Seller: | MSMCH | Single Asset/Portfolio: | Single Asset | |||
| Credit Assessment (Fitch/Moody’s/KBRA): | NR/NR/NR | Location: | Houston, TX 77002 | |||
| Original Balance(1): | $22,000,000 | General Property Type: | Office | |||
| Cut-off Date Balance(1): | $22,000,000 | Detailed Property Type: | CBD | |||
| % of Initial Pool Balance: | 3.3% | Title Vesting: | Fee | |||
| Loan Purpose: | Refinance | Year Built/Renovated: | 1986 / 2021 | |||
| Borrower Sponsors: | (2) | Size: | 1,158,165 SF | |||
| Guarantor: | Brookfield Properties Investor LLC | Cut-off Date Balance Per SF(1): | $149 | |||
| Mortgage Rate: | 7.6300% | Maturity Date Balance Per SF(1): | $149 | |||
| Note Date: | 4/13/2023 | Property Manager: | Brookfield Properties (USA II) LLC | |||
| First Payment Date: | 6/6/2023 | (borrower-related) | ||||
| Maturity Date: | 5/6/2028 | |||||
| Original Term to Maturity: | 60 months | |||||
| Original Amortization Term: | 0 months | Underwriting and Financial Information | ||||
| IO Period: | 60 months | UW NOI: | $21,791,413 | |||
| Seasoning: | 2 months | UW NOI Debt Yield(1): | 12.7% | |||
| Prepayment Provisions: | YM1(26),DorYM1(27),O(7) | UW NOI Debt Yield at Maturity(1): | 12.7% | |||
| Lockbox/Cash Mgmt Status: | Hard/Springing | UW NCF DSCR(1): | 1.54x | |||
| Additional Debt Type(1): | Pari Passu | Most Recent NOI: | $27,788,349 (12/31/2022) | |||
| Additional Debt Balance(1): | $150,000,000 | 2nd Most Recent NOI: | $18,854,926 (12/31/2021) | |||
| Future Debt Permitted (Type)(3): | Yes (Mezzanine) | 3rd Most Recent NOI: | $27,869,748 (12/31/2020) | |||
| Reserves | Most Recent Occupancy: | 70.1% (2/23/2023) | ||||
| Type | Initial | Monthly | Cap | 2nd Most Recent Occupancy: | 87.2% (12/31/2022) | |
| RE Tax(4): | $0 | Springing | NAP | 3rd Most Recent Occupancy: | 89.8% (12/31/2021) | |
| Insurance(5): | $0 | Springing | NAP | Appraised Value (as of): | $521,800,000 (2/1/2023) | |
| Replacement Reserves: | $0 | $19,303 | $231,636 | ��� | Appraised Value Per SF: | $451 |
| TI/LC Reserves: | $5,000,000 | $144,771 | $10,000,000 | Cut-off Date LTV Ratio(1): | 33.0% | |
| Other Reserves: | $10,489,446(6) | $0 | NAP | Maturity Date LTV Ratio(1): | 33.0% | |
| Sources and Uses | ||||||
| Sources | Proceeds | % of Total | Uses | Proceeds | % of Total | |
| Whole Loan Amount: | $172,000,000 | 96.7% | Loan payoff | $156,217,116 | 87.9% | |
| Borrower Equity: | $5,793,688 | 3.3% | Reserves | $15,489,446 | 8.7% | |
| Closing Costs: | $6,087,126 | 3.4% | ||||
| Total Sources: | $177,793,688 | 100.0% | Total Uses: | $177,793,688 | 100.0% | |
| (1) | The Heritage Plaza Mortgage Loan (as defined below) is part of the Heritage Plaza Whole Loan (as defined below), which is comprised of nine pari passu promissory notes with an aggregate original principal balance of $172,000,000. The Cut-off Date Balance Per SF, Maturity Date Balance Per SF, UW NCF DSCR, UW NOI Debt Yield, UW NOI Debt Yield at Maturity, Cut-off Date LTV Ratio and Maturity Date LTV Ratio presented above are based on the aggregate Cut-off Date principal balance of the Heritage Plaza Whole Loan. |
| (2) | The borrower sponsors are AEW CPT REIT, LLC, AEW Core Property (U.S.), L.P., Brookfield Office Properties Inc. and Brookfield Property Partners, L.P. |
| (3) | The direct owner of the borrower is permitted to incur future mezzanine debt (secured by the direct ownership interests in the borrower) in connection with or following any permitted assumption, provided that among other conditions: (i) no event of default is continuing; (ii) the principal amount of the mezzanine loan may not exceed an amount which, when combined with the Heritage Plaza Whole Loan results in (a) a loan-to-value ratio greater than 33.00% or (b) a debt yield less than 12.67%; (iii) the mezzanine loan is co-terminous with the Heritage Plaza Whole Loan or is freely prepayable after the maturity date of the Heritage Plaza Whole Loan; (iv) the mezzanine loan is interest-only; (v) an intercreditor agreement is executed that is acceptable to the lender and the rating agencies; and (vi) if required by the lender following a securitization, a rating agency confirmation is delivered by each rating agency rating securities backed by the Heritage Plaza Whole Loan. . |
| (4) | Borrower is required to deposit on a monthly basis 1/12th of the annual estimated real estate taxes during a “Trigger Period”. A “Trigger Period” commences upon (i) the occurrence of an event of default; (ii) the debt service coverage ratio is less than 1.25x for any two consecutive fiscal quarters or (iii) certain events with respect to the tenants Deloitte (as defined below) and/or EOG Resources(as defined below). |
| (5) | Borrower is required to deposit on a monthly basis 1/12th of the annual estimated insurance premiums during a Trigger Period. Notwithstanding the foregoing the borrower’s obligation to pay such monthly deposits will be waived if the Heritage Plaza Property (as defined below) is covered by a blanket policy. |
| (6) | At loan origination, the borrower deposited into escrow $10,303,667 for outstanding landlord tenant improvement and leasing commission obligations due to various tenants, and $185,779 for free rent owed to various tenants through November 2023 to be applied on each monthly payment date to simulate the payment of tenant rent. |
| This is not a research report and was not prepared by any Underwriter’s research department. Please see additional important information and qualifications at the end of this Term Sheet. | ||
| T-143 | ||
| Office – CBD | Loan #14 | Cut-off Date Balance: | $22,000,000 |
| 1111 & 1200 Bagby Street | Heritage Plaza | Cut-off Date LTV: | 33.0% |
| Houston, TX 77002 | UW NCF DSCR: | 1.54x | |
| UW NOI Debt Yield: | 12.7% |
The Mortgage Loan. The fourteenth largest mortgage loan (the “Heritage Plaza Mortgage Loan”) is part of a whole loan (the “Heritage Plaza Whole Loan”) with an original principal balance of $172,000,000. The Heritage Plaza Whole Loan is secured by a first priority fee mortgage encumbering a 1,158,165 SF office property in Houston, Texas (the “Heritage Plaza Property”). The Heritage Plaza Whole Loan is comprised of nine pari passu promissory notes in the aggregate original principal balance of $172,000,000. The Heritage Plaza Whole Loan was originated by Morgan Stanley Bank, N.A. (“MSBNA”) and Goldman Sachs Bank USA (“GS”). The Bank of Montreal (“BMO”) purchased notes A-3-1 and A-3-2 from MSBNA. The non-controlling note A-1-1 with an original principal balance of $22,000,000, represents the Heritage Plaza Mortgage Loan and will be included in the BANK5 2023-5YR2 securitization trust. The remaining Heritage Plaza pari passu notes have been securitized or are currently held by MSBNA and BMO and are expected to be contributed to one or more future securitization transactions. The Heritage Plaza Whole Loan will be serviced pursuant to the pooling and servicing agreement for the Benchmark 2023-V2 securitization transaction until the controlling note A-1-2 is securitized, at which point it will be serviced pursuant to the pooling and servicing agreement for the securitization to which the controlling note A-1-2 is contributed. See “Description of the Mortgage Pool—The Whole Loans—The Non-Serviced Pari Passu Whole Loans” and “Pooling and Servicing Agreement—Servicing of the Non-Serviced Mortgage Loans” in the prospectus.
| Whole Loan Summary | ||||
| Notes | Original Balance | Cut-off Date Balance | Note Holder | Controlling Piece |
| A-1-1 | $22,000,000 | $22,000,000 | BANK5 2023-5YR2 | No |
| A-1-2 | $18,000,000 | $18,000,000 | MSBNA | Yes |
| A-2-1 | $20,000,000 | $20,000,000 | MSWF 2023-1 | No |
| A-2-2 | $5,000,000 | $5,000,000 | MSBNA | No |
| A-3-1 | $12,500,000 | $12,500,000 | BMO | No |
| A-3-2 | $7,500,000 | $7,500,000 | BMO | No |
| A-4 | $15,000,000 | $15,000,000 | MSBNA | No |
| A-5 | $40,000,000 | $40,000,000 | Benchmark 2023-V2 | No |
| A-6 | $32,000,000 | $32,000,000 | GS | No |
| Total (Whole Loan) | $172,000,000 | $172,000,000 | ||
The Borrowers and the Borrower Sponsors. The borrower is BOP Heritage LLC, a single-purpose Delaware limited liability company with one independent director in its organizational structure. The borrower is owned by a joint venture partnership between AEW Capital Management, L.P. and Brookfield Properties (an affiliate of two of the borrower sponsors). The borrower sponsors are AEW CPT REIT, LLC, AEW Core Property (U.S.), L.P., Brookfield Office Properties Inc. and Brookfield Property Partners, L.P., and the non-recourse carve-out guarantor is Brookfield Properties Investor LLC. The full recourse obligations of the non-recourse carveout guarantor for voluntary transfers of the Heritage Plaza Property or equity interests in the borrower made in violation of the Heritage Plaza Whole Loan documents only apply if a controlled subsidiary of Brookfield Office Properties Inc., Brookfield Property Partners, L.P., Brookfield Asset Management, Inc. or Brookfield Corporation is not the guarantor.
Brookfield Properties is an affiliate of Brookfield Property Partners, L.P., the public real estate vehicle of Brookfield Asset Management, Inc. Brookfield Property Partners, L.P. is a large global real estate company, with more than 800 managed properties and 330 million SF of managed space worldwide. Brookfield Property Partners, L.P. owns and operates properties in the world’s major markets, with a global portfolio that includes office, retail, multifamily, logistics, hospitality, and development opportunities.
AEW Capital Management, L.P., the investment manager to one of the borrower sponsors, is a real estate investment manager that actively manages portfolios in both the public and private real estate markets. The company and its affiliates manage real estate assets and securities on behalf of institutional and private investors across two regional offices in the U.S. and fourteen offices internationally.
The Property. The Heritage Plaza Property is a LEED Gold, 51-story, 1,158,165 SF office building and an adjacent parking garage situated on an approximately 3.28 acres site, located in Houston, Texas. The Heritage Plaza Property was built in 1986 and most recently renovated in 2021. The Heritage Plaza Property is the fifth tallest office building in Houston and the eighth tallest office building in the state of Texas. Amenities at the Heritage Plaza Property include a conference center, fitness center and sky lounge. The Heritage Plaza Property benefits from skybridge and street level access to the C. Baldwin Hotel, which provides direct accessibility to Houston’s downtown tunnel system. Additionally, the Heritage Plaza Property has a bus stop on every corner and has access to the METRORail a few blocks to the southeast. As of February 23, 2023, the Heritage Plaza Property was 70.1% leased to a diverse roster of 14 tenants.
Major Tenants.
EOG Resources Inc. (376,333 SF, 32.5% of NRA, 45.1% of underwritten rent). Founded in 1999, EOG Resources Inc. (“EOG Resources”) explores for, develops, produces and markets crude oil, natural gas and liquids and natural gas in the United States, Republic of Trinidad and Tobago and select other international areas. EOG Resources occupies approximately 376,333 SF across 26 units that expire in March 2035, with various renewal options.
Deloitte & Touche USA LLP (205,125 SF, 17.7% of NRA, 25.9% of underwritten rent). Founded in 1845, Deloitte & Touche USA LLP (“Deloitte”) is a multinational corporation that provides audit, consulting, tax and advisory services to Fortune 500 and a diverse suite of private companies across 150 countries and territories worldwide. Deloitte occupies approximately 205,125 SF across eight units that expire in February 2031, all of which have two, five-year renewal options. In the event that the landlord fails to substantially complete scheduled renovations on or before May 1, 2024, Deloitte may terminate its lease effective May 1, 2025 by providing written notice to the landlord on or before August 1, 2024.
Perella Weinberg Partners Group LP (63,446 SF, 5.5% of NRA, 9.3% of underwritten rent). Perella Weinberg Partners Group LP (“Perella Weinberg”) is a leading global independent investment banking firm. Perella Weinberg provides strategic, financial and tactical advice in connection with executing complex mergers, acquisitions, company sales, and corporate divestitures, including carve-outs, joint ventures, and spin-offs, and relating to takeover preparedness and defense. Perella Weinberg occupies approximately 63,446 SF across three units that expire in August 2027, all of which have two, five-year renewal options.
| This is not a research report and was not prepared by any Underwriter’s research department. Please see additional important information and qualifications at the end of this Term Sheet. | ||
| T-144 | ||
| Office – CBD | Loan #14 | Cut-off Date Balance: | $22,000,000 |
| 1111 & 1200 Bagby Street | Heritage Plaza | Cut-off Date LTV: | 33.0% |
| Houston, TX 77002 | UW NCF DSCR: | 1.54x | |
| UW NOI Debt Yield: | 12.7% |
The following table presents a summary regarding the major tenants at the Heritage Plaza Property:
| Tenant Summary(1) | |||||||||
| Tenant Name | Credit Rating (Fitch/ Moody’s/S&P)(2) | Tenant SF | Approx.% of SF | Annual UW Base Rent | Annual UW Base Rent PSF | % of Total Annual UW Base Rent | Lease Expiration | Renewal Option | Term. Option (Y/N) |
| EOG Resources(3) | NR/A3/A- | 376,333 | 32.5% | $10,152,179 | $26.98 | 45.1% | 3/31/2035 | Various | N |
| Deloitte (4) | NR/NR/NR | 205,125 | 17.7% | $5,827,305 | $28.41 | 25.9% | 2/28/2031 | 2x5 yr | Y |
| Perella Weinberg | NR/NR/NR | 63,446 | 5.5% | $2,094,987 | $33.02 | 9.3% | 8/31/2027 | 2x5 yr | N |
| Lime Rock Management LP(5) | NR/NR/NR | 56,984 | 4.9% | $1,823,488 | $32.00 | 8.1% | 3/31/2024 | 1x10 yr | N |
| S&P Global Inc. | A-/A3/NR | 28,560 | 2.5% | $828,240 | $29.00 | 3.7% | 2/28/2029 | 2x5 yr | N |
| Subtotal/Wtd. Avg. | 730,448 | 63.1% | $20,726,199 | $28.37 | 92.0% | ||||
| Other Tenants | 81,956 | 7.1% | $1,801,460 | $21.98 | 8.0% | ||||
| Vacant Space | 345,761 | 29.9% | $0 | $0.00 | 0.0% | ||||
| Total/Wtd. Avg.(6) | 1,158,165 | 100.0% | $22,527,660 | $27.73 | 100.0% | ||||
| (1) | Information is based on the underwritten rent roll. |
| (2) | Certain ratings are those of the parent entity, whether or not the parent entity guarantees the lease. |
| (3) | EOG Resources has one, 10-year option to extend for 25 leases totaling 374,347 SF and one, five-year renewal option for Suite 2625 totaling 1,986 SF. EOG Resources is in a free rent period as to approximately 15,683 SF of expansion space through August 2023. |
| (4) | In the event that the landlord fails to substantially complete scheduled renovations on or before May 1, 2024, Deloitte may terminate its lease effective May 1, 2025 by providing written notice to the landlord on or before August 1, 2024. |
| (5) | Lime Rock Management LP has the discretion to extend its leases for two, five-year terms. |
| (6) | Total/Wtd. Avg. Annual UW Rent PSF Rolling excludes vacant space. |
The following table presents certain information relating to the lease rollover at the Heritage Plaza Property:
| Lease Rollover Schedule(1)(2) | ||||||||
| Year | # of Leases Rolling | SF Rolling | Annual UW Rent PSF Rolling | Approx. % of Total SF Rolling | Approx. Cumulative % of SF Rolling | Total UW Rent Rolling | Approx. % of Total Rent Rolling | Approx. Cumulative % of Total Rent Rolling |
| MTM | 0 | 0 | $0.00 | 0.0% | 0.0% | $0 | 0.0% | 0.0% |
| 2023 | 0 | 0 | $0.00 | 0.0% | 0.0% | $0 | 0.0% | 0.0% |
| 2024 | 3 | 79,772 | $29.89 | 6.9% | 6.9% | $2,384,475 | 10.6% | 10.6% |
| 2025 | 3 | 31,146 | $12.51 | 2.7% | 9.6% | $389,510 | 1.7% | 12.3% |
| 2026 | 1 | 1,851 | $18.15 | 0.2% | 9.7% | $33,600 | 0.1% | 12.5% |
| 2027 | 1 | 63,446 | $33.02 | 5.5% | 15.2% | $2,094,987 | 9.3% | 21.8% |
| 2028 | 1 | 11,169 | $33.56 | 1.0% | 16.2% | $374,804 | 1.7% | 23.4% |
| 2029 | 3 | 43,562 | $29.17 | 3.8% | 19.9% | $1,270,799 | 5.6% | 29.1% |
| 2030 | 0 | 0 | $0.00 | 0.0% | 19.9% | $0 | 0.0% | 29.1% |
| 2031 | 1 | 205,125 | $28.41 | 17.7% | 37.7% | $5,827,305 | 25.9% | 54.9% |
| 2032 | 0 | 0 | $0.00 | 0.0% | 37.7% | $0 | 0.0% | 54.9% |
| 2033 | 0 | 0 | $0.00 | 0.0% | 37.7% | $0 | 0.0% | 54.9% |
| 2034 & Beyond | 1 | 376,333 | $26.98 | 32.5% | 70.1% | $10,152,179 | 45.1% | 100.0% |
| Vacant | 0 | 345,761 | $0.00 | 29.9% | 100.0% | $0 | 0.0% | 100.0% |
| Total/Wtd. Avg.(3) | 14 | 1,158,165 | $27.73 | 100.0% | $22,527,660 | 100.0% | ||
| (1) | Information is based on the underwritten rent roll as of February 23, 2023. |
| (2) | Certain tenants may have lease termination options that are exercisable prior to the stated expiration date of the subject lease or leases which are not considered in the lease rollover schedule. |
| (3) | Total/Wtd. Avg. Annual UW Rent PSF Rolling excludes vacant space. |
The Market. The Heritage Plaza Property is located within the Houston-The Woodlands-Sugar Land, Texas Metropolitan Statistical Area (the “MSA”). According to the appraisal, employment in the MSA is primarily weighted by professional services, construction, retail trade, manufacturing and transportation/utilities. The MSA is home to approximately 3.6 million employees with an unemployment rate of approximately 4.0%. Employers in the Houston metro include Exxon Mobil Corp., Shell Oil Co., Schlumberger Ltd., BP North America and Chevron Corp. The appraisal notes that Houston’s economy is advancing, with job growth in the past year two percentage points higher than the national average.
The Heritage Plaza Property is part of the Houston Office market and the central-business-district (“CBD”) office submarket. According to the appraisal, as of fiscal year end 2022, the Houston Office market contained 349,566,945 SF of space with a vacancy of 18.8% and average asking rents of $29.69 PSF. Furthermore, as of fiscal year end 2022, the CBD office submarket contained 52,086,429 SF of space with a vacancy of 24.2% and average asking rents of $40.96 PSF.
| This is not a research report and was not prepared by any Underwriter’s research department. Please see additional important information and qualifications at the end of this Term Sheet. | ||
| T-145 | ||
| Office – CBD | Loan #14 | Cut-off Date Balance: | $22,000,000 |
| 1111 & 1200 Bagby Street | Heritage Plaza | Cut-off Date LTV: | 33.0% |
| Houston, TX 77002 | UW NCF DSCR: | 1.54x | |
| UW NOI Debt Yield: | 12.7% |
The following table presents recent leasing data for office tenants at comparable office properties with respect to the Heritage Plaza Property:
| Comparable Office Lease Summary | ||||||
| Subject/Location | Year Built/Renovated | Tenant Name | Size (SF) | Lease Size (SF) | Lease Date | Rent PSF |
Heritage Plaza (subject)(1) Houston, TX | 1986/2021 | EOG Resources Inc. | 1,158,165 | 376,333 | October 2019 | $26.98 |
Hess Tower Houston, TX | 2008/NAP | Hess Corporation | 844,763 | 565,913 | July 2026 | $35.00 |
Wells Fargo Plaza Houston, TX | 1983/NAP | Clark Hill PLC | 1,721,242 | 18,368 | July 2023 | $24.50 |
Three Allen Center Houston, TX | 1980/2021 | Beacon Offshore Energy | 1,194,719 | 10,786 | April 2023 | $26.00 |
Two Allen Center Houston, TX | 1977/2021 | Control Risks Group, LLC | 991,535 | 8,034 | October 2022 | $26.00 |
JPMorgan Chase & Co. Houston, TX | 1981/2012 | KKR | 1,656,529 | 23,314 | October 2022 | $28.50 |
5 Houston Center Houston, TX | 2002/NAP | Rusty Hardin & Associates LLP | 580,875 | 17,154 | August 2022 | $29.00 |
Source: Appraisal, unless otherwise noted.
| (1) | Information obtained from the underwritten rent roll other than year built/renovated. |
The following table presents information relating to the appraisal’s market rent conclusion for the Heritage Plaza Property:
| Market Rent Summary | ||||
| Market Rent (PSF) | Lease Term (Months) | Lease Type (Reimbursements) | Rent Increase Projection | |
| Office Space: | $30.00 | 91 | NNN | $0.50/SF/Yr |
| Retail Space: | $20.00 | 65 | NNN | $0.50/SF/Yr |
| Storage Space: | $12.00 | 12 | Gross | None |
| Source: Appraisal. |
| This is not a research report and was not prepared by any Underwriter’s research department. Please see additional important information and qualifications at the end of this Term Sheet. | ||
| T-146 | ||
| Office – CBD | Loan #14 | Cut-off Date Balance: | $22,000,000 |
| 1111 & 1200 Bagby Street | Heritage Plaza | Cut-off Date LTV: | 33.0% |
| Houston, TX 77002 | UW NCF DSCR: | 1.54x | |
| UW NOI Debt Yield: | 12.7% |
Operating History and Underwritten Net Cash Flow. The following table presents certain information relating to the historical operating performance and the Underwritten Net Cash Flow at the Heritage Plaza Property:
| Cash Flow Analysis | ||||||
| 2019 | 2020 | 2021 | 2022 | UW | UW PSF | |
| Gross Potential Rent(1) | $25,062,016 | $24,475,586 | $19,575,796 | $25,031,771 | $32,580,624 | $28.13 |
| Reimbursements | $17,815,533 | $16,882,277 | $16,204,602 | $16,217,571 | $15,281,517 | $13.19 |
| Other Income(2) | $6,178,835 | $5,635,732 | $5,625,151 | $6,262,329 | $6,129,703 | $5.29 |
| Less Vacancy & Credit Loss | $0 | $0 | $0 | $0 | ($10,052,964) | ($8.68) |
| Effective Gross Income | $49,056,384 | $46,993,596 | $41,405,549 | $47,511,670 | $43,938,879 | $37.94 |
| Real Estate Taxes | $6,642,947 | $7,450,748 | $7,567,104 | $6,635,945 | $7,519,133 | $6.49 |
| Insurance | $647,929 | $711,257 | $911,600 | $780,665 | $1,286,507 | $1.11 |
| Other Expenses | $10,724,087 | $10,961,844 | $14,071,919 | $12,306,711 | $13,341,827 | $11.52 |
| Total Expenses | $18,014,964 | $19,123,848 | $22,550,623 | $19,723,321 | $22,147,467 | $19.12 |
| Net Operating Income | $31,041,420 | $27,869,748 | $18,854,926 | $27,788,349 | $21,791,413 | $18.82 |
| Capital Expenditures | $0 | $0 | $0 | $0 | $364,421 | $0.31 |
| TI/LC | $0 | $0 | $0 | $0 | $871,468 | $0.75 |
| Net Cash Flow | $31,041,420 | $27,869,748 | $18,854,926 | $27,788,349 | $20,555,523 | $17.75 |
| Occupancy % | 88.6% | 94.8% | 89.8% | 70.1% | 69.1%(3) | |
| NOI DSCR(4) | 2.33x | 2.09x | 1.42x | 2.09x | 1.64x | |
| NCF DSCR(4) | 2.33x | 2.09x | 1.42x | 2.09x | 1.54x | |
| NOI Debt Yield(4) | 18.0% | 16.2% | 11.0% | 16.2% | 12.7% | |
| NCF Debt Yield(4) | 18.0% | 16.2% | 11.0% | 16.2% | 12.0% | |
| (1) | Based on the underwritten rent roll dated as of February 23, 2023 inclusive of contractual rent steps through March 2024. Investment grade tenants, including EOG Resources Inc., GSO Capital Partners (Texas) and Sapient Corporation were underwritten to their respective straight line average rent. |
| (2) | Other Income includes parking revenue, sales tax, communication licensing fee, special areas rent, prior year OCR adjustment, late charges and energy brokerage. |
| (3) | Underwritten Occupancy represents economic occupancy; historical occupancies represent physical occupancies. 2022 Occupancy is based on the rent roll dated as of February 23, 2023. |
| (4) | Debt service coverage ratios and debt yields are based on the aggregate Cut-off Date balance of the Heritage Plaza Whole Loan. |
| This is not a research report and was not prepared by any Underwriter’s research department. Please see additional important information and qualifications at the end of this Term Sheet. | ||
| T-147 | ||
| Mortgage Loan No. 15 – 6330 West Loop South |
| Mortgage Loan Information | Property Information | |||||
| Mortgage Loan Seller: | BANA | Single Asset/Portfolio: | Single Asset | |||
| Credit Assessment (Moody’s/Fitch/KBRA): | NR/NR/NR | Location: | Bellaire, TX 77401 | |||
| Original Balance(1): | $17,250,000 | General Property Type: | Office | |||
| Cut-off Date Balance(1): | $17,231,554 | Detailed Property Type: | Medical | |||
| % of Initial Pool Balance: | 2.6% | Title Vesting: | Fee | |||
| Loan Purpose: | Refinance | Year Built/Renovated: | 1975 / 2008 | |||
| Borrower Sponsors: | Accesso Partners and Partners Group | Size: | 278,489 SF | |||
| Guarantors: | Investment Properties Holdings (US), LLLP | Cut-off Date Balance PSF(1): | $178 | |||
| and Investment Properties Holdings, LLLP | Maturity Date Balance PSF(1): | $171 | ||||
| Mortgage Rate: | 8.1800% | Property Manager: | Accesso Services LLC | |||
| Note Date: | 5/1/2023 | (borrower-related) | ||||
| First Payment Date: | 6/1/2023 | |||||
| Maturity Date: | 5/1/2028 | |||||
| Original Term to Maturity: | 60 months | |||||
| Original Amortization Term: | 360 months | Underwriting and Financial Information | ||||
| IO Period: | 0 months | UW NOI: | $5,672,425 | |||
| Seasoning: | 2 months | UW NOI Debt Yield(1): | 11.4% | |||
| Prepayment Provisions(2): | L(26),YM1(27),O(7) | UW NOI Debt Yield at Maturity(1): | 11.9% | |||
| Lockbox/Cash Mgmt Status(3): | Hard/Springing | UW NCF DSCR(1): | 1.20x | |||
| Additional Debt Type(1): | Pari Passu | Most Recent NOI: | $5,372,142 (2/28/2023 TTM) | |||
| Additional Debt Balance(1): | $32,315,407 | 2nd Most Recent NOI: | $5,349,921 (12/31/2022) | |||
| Future Debt Permitted (Type)(4): | Yes (Future Mezzanine) | 3rd Most Recent NOI: | $5,646,879 (12/31/2021) | |||
| Reserves | Most Recent Occupancy: | 92.0% (4/4/2023) | ||||
| Type | Initial | Monthly | Cap | 2nd Most Recent Occupancy: | 99.0% (12/31/2022) | |
| RE Tax: | $376,725 | $75,345 | NAP | 3rd Most Recent Occupancy: | 99.0% (12/31/2021) | |
| Insurance: | $12,796 | $1,894 | NAP | Appraised Value (as of): | $79,600,000 (3/29/2023) | |
| Replacement Reserves: | $0 | $3,481 | $125,320 | Appraised Value PSF: | $286 | |
| TI/LC Reserves(5): | $250,000 | Springing | $250,000 | Cut-off Date LTV Ratio(1): | 62.2% | |
| Other Reserves(6): | $6,347,744 | $11,411 | NAP | Maturity Date LTV Ratio(1): | 59.9% | |
| Sources and Uses | ||||||
| Sources | Proceeds | % of Total | Uses | Proceeds | % of Total | |
| Whole Loan Amount(1): | $49,600,000 | 85.0% | Loan Payoff: | $50,301,042 | 86.2% | |
| Borrower Sponsor Equity: | $8,768,140 | 15.0% | Reserves: | $6,987,265 | 12.0% | |
| Closing Costs: | $1,079,834 | 1.9% | ||||
| Total Sources: | $58,368,140 | 100.0% | Total Uses: | $58,368,140 | 100.0% | |
| (1) | The 6330 West Loop South Mortgage Loan (as defined below) is part of the 6330 West Loop South Whole Loan (as defined below), comprised of three pari passu promissory notes with an aggregate outstanding principal balance as of the Cut-off Date of $49,546,961. The Cut-off Date Balance PSF, Maturity Date Balance PSF, UW NOI Debt Yield, UW NOI Debt Yield at Maturity, UW NCF DSCR, Cut-off Date LTV Ratio and Maturity Date LTV Ratio presented above are based on the aggregate Cut-off Date principal balance of the 6330 West Loop South Whole Loan. |
| (2) | The lockout period will be at least 26 months beginning with and including the first payment date on June 1, 2023. Prepayment of the 6330 West Loop South Whole Loan (together with, if prior to the open period, a yield maintenance premium) is permitted two years from the closing date of the securitization that includes the last note to be securitized. The assumed lockout period is based on the expected BANK5 2023-5YR2 closing date in July 2023. The actual lockout period may be longer. |
| (3) | Upon the occurrence of a Cash Sweep Period (as defined below), all funds in the lockbox account are required to be swept into the cash management account controlled by the lender. A Cash Sweep Period begins upon (i) the debt service coverage ratio falling below 1.15x (tested quarterly), (ii) if the largest tenant, Texas Children's Health Plan, goes dark, vacates or gives notice of its intent to vacate, fails to exercise its renewal option, or Texas Children’s Health Plan or any guarantor under its lease defaults in the payment of rent or files or is the subject of any bankruptcy proceeding, or (iii) the November 2026 payment date (18 months prior to loan maturity), other than if the borrower has provided an excess cash security payment. |
| (4) | The 6330 West Loop South Whole Loan documents permit future mezzanine debt in connection with a sale of the mortgaged property to a third party and assumption of the 6330 West Loop South Mortgage Loan, subject to the satisfaction of certain conditions including, among others, (i) immediately after giving effect to such debt (x) the combined loan-to-value ratio may not exceed 62.31%, (y) the net cash flow debt yield is at least 10.79% and (z) the net cash flow debt service coverage ratio is at least 1.205x, (ii) execution of a subordination and intercreditor agreement reasonably acceptable to the lender, (iii) the mezzanine debt will be co-terminous with the 6330 West Loop South Whole Loan, and (iv) receipt of a rating agency confirmation from each applicable rating agency. |
| (5) | In the event the balance in the TI/LC reserve account falls below $250,000, the borrower will be required to deposit approximately $23,207 monthly until the balance in the TI/LC reserve account reaches the cap of $250,000. Termination or contraction fees will not be counted towards the reserve cap. |
| (6) | Other Reserves consist of a Free Rent Reserve ($918,109), an Outstanding TI Reserve ($5,429,635), and a monthly Texas Children’s Reserve ($11,411). The Free Rent Reserve is inclusive of $419,980 of parking rent abatements for the largest tenant, Texas Children's Health Plan, and the second largest tenant, Quiddity Engineering, LLC, $97,847 of free rent for Quiddity Engineering, LLC for July 2023 and $400,283 of base rent credit for Quiddity Engineering, LLC, which is the unused portion of their tenant improvement allowance. The Outstanding TI Reserve includes $5,358,390 of tenant improvement allowance for Texas Children’s Health Plan and $71,245 of tenant improvement allowance for Quiddity Engineering, LLC. Texas Children’s Health Plan has the option to apply up to $1,786,130 of their tenant improvement allowance as a base rent credit, with notice given by September 30, 2023. Additionally, Texas Children’s Health Plan receives free rent in January 2026 ($342,342), and the borrower is escrowing $11,411 monthly until January 2026 (Texas Children’s Reserve). |
Mortgage Loan. The fifteenth largest mortgage loan (the “6330 West Loop South Mortgage Loan”) is evidenced by three pari passu promissory notes with an aggregate outstanding principal balance as of the Cut-off Date of $49,546,961 (the “6330 West Loop South Whole Loan”) and is secured by a first priority fee mortgage encumbering a 278,489 SF medical office property located in Bellaire, Texas (the “6330 West Loop South Property”). The non-controlling Note A-2, with an original principal balance of $17,250,000, will be included in the BANK5 2023-5YR2 securitization trust. The remaining notes are currently held by BANA and expected to be contributed to one or more future securitization trust(s). The 6330 West Loop South Whole Loan will be serviced pursuant to the pooling and servicing agreement for the BBCMS 2023-C20 securitization, until the controlling Note A-1 is securitized, whereupon the 6330 West Loop South Loan will be serviced pursuant to the pooling and servicing agreement for the future securitization to which the controlling Note
| This is not a research report and was not prepared by any Underwriter’s research department. Please see additional important information and qualifications at the end of this Term Sheet. | ||
| T-148 | ||
| Office – Medical | Loan #15 | Cut-off Date Balance: | $17,231,554 |
| 6330 West Loop South | 6330 West Loop South | Cut-off Date LTV: | 62.2% |
| Bellaire, TX 77401 | UW NCF DSCR: | 1.20x | |
| UW NOI Debt Yield: | 11.4% |
A-1 is contributed. See “Description of the Mortgage Pool—The Whole Loans—The Non-Serviced Pari Passu Whole Loans” and “Pooling and Servicing Agreement—Servicing of the Non-Serviced Mortgage Loans” in the prospectus.
| 6330 West Loop South Whole Loan Summary | ||||
Note | Original Balance | Cut-off Date Balance | Note Holder | Controlling Piece |
| A-1 | $17,350,000 | $17,331,447 | BANA | Yes |
| A-2 | $17,250,000 | $17,231,554 | BANK5 2023-5YR2 | No |
| A-3 | $15,000,000 | $14,983,960 | BBCMS 2023-C20(1) | No |
| Total | $49,600,000 | $49,546,961 | ||
| (1) | The BBCMS 2023-C20 securitization is expected to close on or about July 11, 2023. |
The Borrower and the Borrower Sponsors. The borrower is BRI 1833 6330, LLC, a special purpose, bankruptcy remote entity and Delaware limited liability company with two independent directors. The non-recourse carve-out guarantors of the 6330 West Loop South Whole Loan are Investment Properties Holdings (US), LLLP and Investment Properties Holdings, LLLP, subsidiaries of Accesso Partners.
The borrower sponsors of the 6330 West Loop South Whole Loan are Accesso Partners and Partners Group. Accesso Partners is headquartered in Hallandale Beach, FL and has a current portfolio that includes 34 properties across 21 major U.S. cities and eight states. Since inception in 2003, Accesso Partners has owned and managed $3.2 billion in real estate investments comprised of more than 18 million SF of commercial office space and more than 800 residential units. Accesso Partners’ focus is on acquiring commercial office properties in Class A locations in the largest and fastest growing metropolitan cities and premier suburban markets throughout the U.S. Including the 6330 West Loop South Property, Accesso Partners has an ownership interest in and manages six office buildings totaling more than 1.5 million SF in Houston, TX.
Partners Group is an independent investment firm that is dedicated to private markets. Partners Group has over 1,600 employees, including more than 500 private markets investment professionals across 20 offices. Partners Group has invested over $185 billion in global private markets since 1996 and has $131 billion in assets under management. Partners Group’s private real estate arm has invested $26 billion across over 280 real estate developments and investments globally, including $17 billion in private real estate assets under management.
The Property. The 6330 West Loop South Property is a 14-story, multi-tenant, medical office building located on a 5.11-acre site in Bellaire, Texas. The 6330 West Loop South Property was developed in 1975, renovated in 2008 and totals 278,489 SF of net rentable area. As of April 4, 2023, the 6330 West Loop South Property was 92.0% leased to eight tenants, including medical, insurance, engineering, and logistics tenants. Four of the tenants currently use their space for medical office use including Bellaire Eye Consultants, PA on the first floor, Texas Children’s Health Plan on the third floor and two medical tenants on the sixth floor.
The 6330 West Loop South Property is a Class A, LEED-Silver certified building situated in a park-like setting that features finishes including oak paneling, granite flooring, concealed spline ceilings and full-height wood doors. Building amenities include a full-service fitness center with showers, 24-hour security, on-site management, conference room and attached covered parking. The 6330 West Loop South Property features a three and one-half-level secured concrete parking garage, with parking provided onsite for 921 vehicles (3.3 spaces per 1,000 SF) in both garage and surface spaces. Additionally, there is an on-site deli, Fresh Choice Cafe, that is leased to and operated by a third-party operator.
Since acquiring the 6330 West Loop South Property in 2010, the borrower sponsors have invested approximately $15 million into tenant improvements, leasing commissions and free rent and approximately $2 million into capital expenditures, including elevator modernization, restroom and corridor upgrades, parking upgrades, HVAC replacements, roof replacement and a full security system upgrade.
Major Tenants.
Texas Children’s Health Plan (178,613 SF, 64.1% of NRA, 70.6% of underwritten rent). Texas Children’s Health Plan, Inc., a Texas non-profit corporation (“TCHP”) is a subsidiary of Texas Children’s Hospital, which is rated “Aaa” by Moody’s and AA by Fitch. TCHP was founded in 1996 as the nation’s first health maintenance organization created just for children. TCHP covers kids, teens, pregnant women and adults who qualify for Medicaid or Children’s Health Insurance Program, with over 4,300 doctors, 6,800 specialists and 118 different hospitals across its network. Texas Children’s Hospital is the largest children’s hospital in the world and has more than 50 locations across the Houston area. The hospital location within the Texas Medical Center (located approximately six miles from the 6330 West Loop South Property) is the original and primary location. The 6330 West Loop South Property serves as the corporate headquarters and administrative location for TCHP.
TCHP has been in occupancy for more than seven years and has a lease expiration in October 2033, with two, five-year renewal options. The tenant pays a base rent of $21.50 PSF, with $0.50 PSF annual increases. TCHP occupies nine floors of the building and expanded its space and extended its lease in October 2021. In conjunction with the expansion and lease extension, the tenant received a $5,358,390 tenant improvement allowance ($30 PSF), which was escrowed at origination, and 11 months of free base rent, with one month still outstanding, which will be escrowed in monthly increments until January 2026.
The TCHP lease includes a contraction option and a termination option. The contraction option if exercised would be effective between January 31, 2028 and January 31, 2031, with a minimum of 12 months’ notice. The contraction option provides the tenant with a one-time right to contract either all of the second floor or all of the third floor (each, 20,027 SF). In addition to the 12-month notice period, the tenant must also pay a contraction fee equal to two months’ rent and reimbursements plus unamortized tenant improvements and leasing commissions, which is estimated to be $682,860 ($34.10 PSF) as of January 31, 2028. The termination option if exercised would be effective on January 31, 2031, with at least nine months’ notice. The termination option provides the tenant with a one-time right to terminate the lease with respect to all or a portion of the leased premises; however, the tenant may only terminate one or more full floors. Written notice of termination must be provided between January 31, 2030 and April 30, 2030, and the tenant must pay a termination fee equal to two months’ rent and reimbursements plus unamortized tenant improvements and leasing commissions, which is estimated to be $3,944,020 ($22.08 PSF) for the entire premises as of January 31, 2031.
| This is not a research report and was not prepared by any Underwriter’s research department. Please see additional important information and qualifications at the end of this Term Sheet. | ||
| T-149 | ||
| Office – Medical | Loan #15 | Cut-off Date Balance: | $17,231,554 |
| 6330 West Loop South | 6330 West Loop South | Cut-off Date LTV: | 62.2% |
| Bellaire, TX 77401 | UW NCF DSCR: | 1.20x | |
| UW NOI Debt Yield: | 11.4% |
TCHP has a right of first offer to purchase the 6330 West Loop South Property if the borrower markets the property for sale (the “TCHP ROFO”). The TCHP ROFO is not extinguished by foreclosure; however, the TCHP ROFO does not apply to foreclosure or deed-in-lieu thereof.
Quiddity Engineering, LLC (53,371 SF, 19.2% of NRA, 20.9% of underwritten rent). Quiddity Engineering, LLC (“Quiddity”) was founded in 1976 and is a full-service civil engineering firm with a vision of improving communities across Texas through innovative engineering. Quiddity currently serves every major metropolitan area in Texas, with more than 500 employees in 10 offices. The 6330 West Loop South Property serves as the company’s headquarters.
Quiddity has been in occupancy for more than seven years and currently pays base rent of $22.00 PSF, with $0.50 PSF annual increases. Quiddity has a lease expiration in October 2031, with one, 10-year or two, five-year renewal options. There are no contraction or termination options in the Quiddity lease. Quiddity occupies two full floors and space on two additional floors with its most recent expansion to Suite 640. With the expansion, Quiddity also extended its lease in 2021 for an additional five years and five months. In conjunction with the expansion and lease extension, the tenant received a tenant improvement allowance of $883,500 ($16.55 PSF), of which approximately $400,283 is unused and being applied as a base rent credit. The outstanding tenant improvement allowance was escrowed at origination. The tenant also received eight months of free base rent and has one month remaining (July 2023), which was escrowed at origination.
The following table presents a summary regarding the major tenants at the 6330 West Loop South Property:
| Tenant Summary(1) | |||||||||
| Tenant Name | Credit Rating (Fitch/ Moody's/S&P)(2) | Tenant SF | Approx.% of SF | Annual UW Base Rent | Annual UW Base Rent PSF | % of Total Annual UW Base Rent | Lease Expiration | Renewal Option | Term. Option (Y/N) |
| Texas Children’s Health Plan(3) | AA/Aaa/NR | 178,613 | 64.1% | $4,057,492 | $22.72 | 70.6% | 10/31/2033 | 2 x 5 yr | Y(4) |
| Quiddity Engineering, LLC(5) | NR/NR/NR | 53,371 | 19.2% | $1,200,848 | $22.50 | 20.9% | 10/31/2031 | 1 x 10 yr(6) | N |
| Bellaire Eye Consultants, PA | NR/NR/NR | 7,056 | 2.5% | $162,288 | $23.00 | 2.8% | 11/30/2030 | 1 x 5 yr | N |
| Bedrock Logistics, LLC | NR/NR/NR | 4,584 | 1.6% | $100,848 | $22.00 | 1.8% | 10/31/2024 | 1 x 5 yr | N |
| CCG Companies, Inc. | NR/NR/NR | 3,592 | 1.3% | $70,044 | $19.50 | 1.2% | 6/30/2029 | 1 x 5 yr | N |
| Subtotal/Wtd. Avg. | 247,216 | 88.8% | $5,591,519 | $22.62 | 97.3% | ||||
| Other Tenants(7) | 9,005 | 3.2% | $153,784 | $17.08 | 2.7% | ||||
| Vacant Space | 22,268 | 8.0% | $0 | $0.00 | 0.0% | ||||
| Total/Wtd. Avg.(8) | 278,489 | 100.0% | $5,745,303 | $22.42 | 100.0% | ||||
| (1) | Information is based on the underwritten rent roll. |
| (2) | Ratings are those of the parent company whether or not the parent guarantees the lease. |
| (3) | TCHP has $368,460 of parking rent abatement through April 2025 and $342,342 of free rent in January 2026. Additionally, TCHP has the option to apply up to $1,786,130 of its tenant improvement allowance as a base rent credit, with notice given by September 30, 2023. |
| (4) | The TCHP lease includes a contraction option and a termination option. The contraction option if exercised would be effective between January 31, 2028 and January 31, 2031, with a minimum of 12 months’ notice and payment of a contraction fee estimated to be $682,860 ($34.10 PSF) as of January 31, 2028. The contraction option provides the tenant with a one-time right to contract either all of the second floor or all of the third floor (each, 20,027 SF). The termination option if exercised would be effective on January 31, 2031, with at least nine months’ notice (provided between January 31, 2030 and April 30, 2030) and payment of a termination fee estimated to be $3,944,020 ($22.08 PSF) for the entire premises as of January 31, 2031. The termination option provides the tenant with a one-time right to terminate the lease with respect to all or a portion of the leased premises; however, the tenant may only terminate one or more full floors. |
| (5) | Quiddity has $51,520 of parking rent abatement through January 2024, $97,847 of free rent in July 2023 and $400,283 of base rent credit, which is the unused portion of its tenant improvement allowance. |
| (6) | Quiddity has one ten-year renewal option or two five-year renewal options. |
| (7) | Other Tenants includes a retail tenant, Fresh Choice Café (2,683 SF) paying $6.71 PSF. |
| (8) | Total/Wtd. Avg. Annual UW Base Rent PSF excludes vacant space. |
| This is not a research report and was not prepared by any Underwriter’s research department. Please see additional important information and qualifications at the end of this Term Sheet. | ||
| T-150 | ||
| Office – Medical | Loan #15 | Cut-off Date Balance: | $17,231,554 |
| 6330 West Loop South | 6330 West Loop South | Cut-off Date LTV: | 62.2% |
| Bellaire, TX 77401 | UW NCF DSCR: | 1.20x | |
| UW NOI Debt Yield: | 11.4% |
The following table presents certain information relating to the lease rollover at the 6330 West Loop South Property:
| Lease Rollover Schedule(1)(2) | ||||||||
| Year | # of Leases Rolling | SF Rolling | Annual UW Rent PSF Rolling | Approx. % of Total SF Rolling | Approx. Cumulative % of SF Rolling | Total UW Rent Rolling | Approx. % of Total Rent Rolling | Approx. Cumulative % of Total Rent Rolling |
| 2023 | 1 | 2,683 | $6.71 | 1.0% | 1.0% | $18,000 | 0.3% | 0.3% |
| 2024 | 2 | 7,606 | $22.00 | 2.7% | 3.7% | $167,332 | 2.9% | 3.2% |
| 2025 | 1 | 3,300 | $21.00 | 1.2% | 4.9% | $69,300 | 1.2% | 4.4% |
| 2026 | 0 | 0 | $0.00 | 0.0% | 4.9% | $0 | 0.0% | 4.4% |
| 2027 | 0 | 0 | $0.00 | 0.0% | 4.9% | $0 | 0.0% | 4.4% |
| 2028 | 0 | 0 | $0.00 | 0.0% | 4.9% | $0 | 0.0% | 4.4% |
| 2029 | 1 | 3,592 | $19.50 | 1.3% | 6.2% | $70,044 | 1.2% | 5.7% |
| 2030 | 1 | 7,056 | $23.00 | 2.5% | 8.7% | $162,288 | 2.8% | 8.5% |
| 2031 | 1 | 53,371 | $22.50 | 19.2% | 27.9% | $1,200,848 | 20.9% | 29.4% |
| 2032 | 0 | 0 | $0.00 | 0.0% | 27.9% | $0 | 0.0% | 29.4% |
| 2033 | 1 | 178,613 | $22.72 | 64.1% | 92.0% | $4,057,492 | 70.6% | 100.0% |
| 2034 & Beyond | 0 | 0 | $0.00 | 0.0% | 92.0% | $0 | 0.0% | 100.0% |
| Vacant | 0 | 22,268 | $0.00 | 8.0% | 100.0% | $0 | 0.0% | 100.0% |
| Total/Wtd. Avg.(3) | 8 | 278,489 | $22.42 | 100.0% | $5,745,303 | 100.0% | ||
| (1) | Information is based on the underwritten rent roll as of April 4, 2023. |
| (2) | Certain tenants may have lease termination options that are exercisable prior to the stated expiration date of the subject lease or leases which are not considered in the lease rollover schedule. |
| (3) | Total/Wtd. Avg. Annual UW Rent PSF Rolling excludes vacant space. |
The Market.
The 6330 West Loop South Property is located at 6330 West Loop South, at the intersection of Loop 610 and Bissonnet Street in Bellaire, Texas, approximately six miles from the Houston central business district and approximately six miles from Texas Medical Center. Primary access to the neighborhood is provided by Interstate 10, US Highway 59 and Loop 610. Loop 610 is a major traffic artery and traverses the area in a north-south direction circumnavigating the City of Houston.
Houston is the fourth largest city in the United States with a projected 1.0% annual population growth. Top employers in the Houston Metropolitan Statistical Area (“MSA”) include a mix of retailers, healthcare systems, and oil/gas companies including Walmart, Memorial Hermann Health System, H-E-B, The University of Texas MD Anderson Cancer Center, McDonald’s Corp., Houston Methodist, Kroger, United Airlines, Schlumberger, and Shell Oil Co.
The 6330 West Loop South Property is located in the Houston-The Woodlands-Sugar Land, TX MSA and the Bellaire submarket. According to the appraisal, as of the fourth quarter of 2022, the Bellaire office submarket had an inventory of 5,451,074 SF, a total vacancy of 18.2% and an average asking rent of $26.12 PSF. During the fourth quarter of 2022, the Bellaire office submarket experienced negative 54,068 SF of net absorption, bringing the year-to-date absorption to 54,440 SF. As of March 29, 2023, the Bellaire medical office submarket had an inventory of 1,900,000 SF, a total vacancy of 18.7% and an average asking rent of $26.73 PSF.
The estimated 2022 population within a one-, three- and five-mile radius of the 6330 West Loop South Property was 16,509, 229,247 and 520,009, respectively. The 2022 average household income within the same radii was $192,864, $142,705 and $129,439, respectively.
| This is not a research report and was not prepared by any Underwriter’s research department. Please see additional important information and qualifications at the end of this Term Sheet. | ||
| T-151 | ||
| Office – Medical | Loan #15 | Cut-off Date Balance: | $17,231,554 |
| 6330 West Loop South | 6330 West Loop South | Cut-off Date LTV: | 62.2% |
| Bellaire, TX 77401 | UW NCF DSCR: | 1.20x | |
| UW NOI Debt Yield: | 11.4% |
The following table presents recent leasing data for office tenants at comparable office properties with respect to the 6330 West Loop South Property:
| Comparable Office Leases(1) | ||||||||||||
Property Name Location | Year Built / Renovated | Property Subtype | Occ. | Total NRA (SF) | Dist. from Subject (miles) |
Tenant | Lease Date/ Term (yrs.) | Lease Size (SF) | Base Rent PSF | TIs (PSF) / Free Rent (mos.) | Reimb. | Steps |
6330 West Loop South Bellaire, TX | 1975 / 2008 | Medical | 92.0%(1) | 278,489(1) | - | TCHP; Quiddity (1) | Oct-21 / 12.0 Jan-22 / 9.0 (1) | 178,613 53,371 (1) | $22.72 $22.50 (1) | $30.00/11 $16.55/8 (1) | NNN NNN (1) | $0.50/yr $0.50/yr (1) |
Greenpark I 7515 Main Houston, TX | 1984 / 2011 | Medical | 74.0% | 135,000 | 3.2 | Oral & Maxillofacial Surgery Associates of Texas, PLLC | Oct-22 / 10.0 | 2,352 | $35.00 | $47.02/8 | Full Service | 3%/yr |
Houston Medical Plaza Professional Building 6655 Travis Houston, TX | 1983 / NAP | Medical | 80.0% | 129,642 | 3.4 | Re:Cognition Health Corporation | May-23 / 5.3 | 2,943 | $34.00 | $25.00/3 | Full Service | 3%/yr |
Phoenix Tower 3200 Southwest Freeway Houston, TX | 1984 / 2011 | Multi-Tenant | 85.0% | 662,480 | 2.3 | Gladiator Energy, LLC | Sep-21 / 3.3 | 4,687 | $20.00 | $0.00/4 | NNN | $0.50/yr |
Weslayan Tower 24 Greenway Houston, TX | 1981 / 2013 | Multi-Tenant | 88.0% | 509,997 | 1.8 | Goosehead Financial, LLC | Sep-22 / 6.7 | 15,475 | $19.00 | $55.00/8 | NNN | $0.50/yr |
Greenpark II 7505 Main Houston, TX | 1985 / NAP | Medical | 95.0% | 85,449 | 3.2 | Medical Center Dermatology | Oct-11 / 5.0 | 3,356 | $28.00 | N/A/0 | Base Year Stop | $1.00/yr |
Source: Appraisal, unless otherwise noted.
| (1) | Information is based on the underwritten rent roll and tenant leases. |
The following table presents information relating to the appraisal’s market rent conclusion for the 6330 West Loop South Property:
| Market Rent Summary | |||
| Category | Market Rent (PSF) | Lease Term (Yrs) | Rental Increase Projection |
| Office | $22.00 | 7.0 | $0.50/SF/Year |
| This is not a research report and was not prepared by any Underwriter’s research department. Please see additional important information and qualifications at the end of this Term Sheet. | ||
| T-152 | ||
| Office – Medical | Loan #15 | Cut-off Date Balance: | $17,231,554 |
| 6330 West Loop South | 6330 West Loop South | Cut-off Date LTV: | 62.2% |
| Bellaire, TX 77401 | UW NCF DSCR: | 1.20x | |
| UW NOI Debt Yield: | 11.4% |
Operating History and Underwritten Net Cash Flow. The following table presents certain information relating to the historical operating performance and the Underwritten Net Cash Flow at the 6330 West Loop South Property:
| Cash Flow Analysis | |||||||
| 2019 | 2020 | 2021 | 2022 | 2/28/2023 TTM | UW | UW PSF | |
| Gross Potential Rent(1) | $5,176,671 | $5,480,032 | $5,592,384 | $5,778,397 | $5,801,170 | $6,201,584 | $22.27 |
| Reimbursements | $2,697,490 | $2,839,711 | $2,821,151 | $3,315,767 | $3,315,636 | $3,462,804 | $12.43 |
| Other Income(2) | $372,120 | $367,402 | $317,334 | $137,993 | $169,571 | $362,182 | $1.30 |
| Less Vacancy & Credit Loss | $0 | $0 | $0 | ($352,469) | ($352,469) | ($848,348) | ($3.05) |
| Effective Gross Income | $8,246,281 | $8,687,145 | $8,730,869 | $8,879,688 | $8,933,908 | $9,178,222 | $32.96 |
| Real Estate Taxes | $879,129 | $938,142 | $914,724 | $915,043 | $920,468 | $989,675 | $3.55 |
| Insurance | $104,598 | $103,401 | $117,171 | $100,527 | $99,084 | $100,937 | $0.36 |
| Other Expenses | $1,931,022 | $1,981,294 | $2,052,095 | $2,514,197 | $2,542,214 | $2,415,186 | $8.67 |
| Total Expenses | $2,914,749 | $3,022,837 | $3,083,990 | $3,529,767 | $3,561,766 | $3,505,798 | $12.59 |
| Net Operating Income | $5,331,532 | $5,664,308 | $5,646,879 | $5,349,921 | $5,372,142 | $5,672,425 | $20.37 |
| Capital Expenditures | $0 | $0 | $0 | $0 | $0 | $41,773 | $0.15 |
| TI/LC | $389 | $284 | $0 | $0 | $0 | $278,488 | $1.00 |
| Net Cash Flow | $5,331,143 | $5,664,024 | $5,646,879 | $5,349,921 | $5,372,142 | $5,352,164 | $19.22 |
| Occupancy % | 97.0% | 97.0% | 99.0% | 99.0% | 92.0%(3) | 91.2%(3) | |
| NOI DSCR(4) | 1.20x | 1.28x | 1.27x | 1.20x | 1.21x | 1.28x | |
| NCF DSCR(4) | 1.20x | 1.28x | 1.27x | 1.20x | 1.21x | 1.20x | |
| NOI Debt Yield(4) | 10.8% | 11.4% | 11.4% | 10.8% | 10.8% | 11.4% | |
| NCF Debt Yield(4) | 10.8% | 11.4% | 11.4% | 10.8% | 10.8% | 10.8% | |
| (1) | UW Gross Potential Rent is based on the underwritten rent roll dated April 4, 2023 and includes straight-lined rent for TCHP ($217,312) and rent increases through May 1, 2024. |
| (2) | UW Other Income includes parking income which accounts for the abatement period for TCHP and Quiddity. Historical Other Income is net of abatements. All outstanding parking rent abatements were escrowed at origination. |
| (3) | 2/28/2023 TTM occupancy represents current occupancy as of the underwritten rent roll dated April 4, 2023. UW Occupancy % represents economic occupancy. |
| (4) | Debt service coverage ratios and debt yields are based on the 6330 West Loop South Whole Loan. |
| This is not a research report and was not prepared by any Underwriter’s research department. Please see additional important information and qualifications at the end of this Term Sheet. | ||
| T-153 | ||
| BANK5 2023-5YR2 |
This material was prepared by sales, trading, banking or other non-research personnel of one of the following: Morgan Stanley & Co. LLC, Morgan Stanley & Co. International Limited, Morgan Stanley Japan Limited and/or Morgan Stanley Dean Witter Asia Limited (together with their affiliates, hereinafter “Morgan Stanley”), Wells Fargo Securities, LLC (together with its affiliates, “Wells Fargo”), J.P. Morgan Securities LLC (together with its affiliates, “J.P. Morgan”), BofA Securities, Inc. (together with its affiliates, “BofA Securities”), Academy Securities, Inc. (together with its affiliates, “Academy”), Drexel Hamilton, LLC (together with its affiliates, “Drexel”) and Siebert Williams Shank & Co., LLC (together with its affiliates, “SWS” and, collectively with Morgan Stanley, Wells Fargo, J.P. Morgan, BofA Securities, Academy and Drexel, the “Underwriters”). This material was not produced by an Underwriter’s research analyst, although it may refer to an Underwriter’s research analyst or research report. Unless otherwise indicated, these views (if any) are the author’s and may differ from those of the fixed income or equity research departments of the Underwriters or others in those firms.
This material may have been prepared by or in conjunction with the respective trading desks of the Underwriters that may deal as principal in or own or act as market maker or liquidity provider for the securities/instruments (or related derivatives) mentioned herein. The trading desk may have accumulated a position in the subject securities/instruments based on the information contained herein. Trading desk materials are not independent of the proprietary interests of the Underwriters, which may conflict with your interests. Each of the Underwriters may also perform or seek to perform investment banking services for the issuers of the securities and instruments mentioned herein.
The information contained in this material is preliminary as of the date hereof. This material is subject to change, completion or amendment from time to time. The information in this material supersedes information in any other communication relating to the securities referred to in this material; provided, that the information in this material will be superseded by similar information delivered to you as part of a preliminary prospectus. This material is not a solicitation to participate in any trading strategy, and is not an offer to sell any security or instrument or a solicitation of an offer to buy or sell any security or instrument in any jurisdiction where an offer, solicitation or sale is not permitted. Unless otherwise set forth in this material, any securities referred to in this material may not have been registered under the U.S. Securities Act of 1933, as amended, and, if not, may not be offered or sold absent an exemption therefrom. Recipients are required to comply with any legal or contractual restrictions on their purchase, holding, sale, exercise of rights or performance of obligations under any securities/instruments transaction.
The securities/instruments discussed in this material may not be suitable for all investors. This material has been prepared and issued by the Underwriters for intended distribution to market professionals and institutional investor clients. Other recipients should seek independent investment advice prior to making any investment decision based on this material. This material does not provide individually tailored investment advice or offer tax, regulatory, accounting or legal advice. Prior to entering into any proposed transaction, recipients should determine, in consultation with their own investment, legal, tax, regulatory and accounting advisors, the economic risks and merits, as well as the legal, tax, regulatory and accounting characteristics and consequences, of the transaction. You should consider this material as only a single factor in making an investment decision.
The value of and income from investments may vary because of changes in interest rates, foreign exchange rates, default rates, prepayment rates, securities/instruments prices, market indexes, operational or financial conditions of companies or other factors. There may be time limitations on the exercise of options or other rights in securities/instruments transactions. Past performance is not necessarily a guide to future performance. Estimates of future performance are based on assumptions that may not be realized. Actual events may differ from those assumed and changes to any assumptions may have a material impact on any projections or estimates. Other events not taken into account may occur and may significantly affect the projections or estimates. Certain assumptions may have been made for modeling purposes only to simplify the presentation and/or calculation of any projections or estimates, and the Underwriters do not represent that any such assumptions will reflect actual future events. Accordingly, there can be no assurance that estimated returns or projections will be realized or that actual returns or performance results will not materially differ from those estimated herein. Some of the information contained in this document may be aggregated data of transactions in securities or other financial instruments executed by an Underwriter that has been compiled so as not to identify the underlying transactions of any particular customer.
Notwithstanding anything herein to the contrary, the Underwriters and each recipient hereof (and their employees, representatives, and other agents) may disclose to any and all persons, without limitation of any kind from the commencement of discussions, the U.S. federal and state income tax treatment and tax structure of the transaction and all materials of any kind (including opinions or other tax analyses) that are provided to it relating to the tax treatment and tax structure (as such terms are defined in Treasury Regulation 1.6011-4). For this purpose, "tax structure" is limited to facts relevant to the U.S. federal and state income tax treatment of the transaction and does not include information relating to the identity of the parties, their affiliates, agents or advisors. This authorization of tax disclosure is retroactively effective to the commencement of discussions with prospective investors regarding the transactions contemplated herein.
THE DISTRIBUTION OF THIS MATERIAL (A) IF MADE BY A PERSON WHO IS NOT AN AUTHORIZED PERSON UNDER THE FINANCIAL SERVICES AND MARKETS ACT 2000 (“FSMA”), IS BEING MADE ONLY TO, OR DIRECTED ONLY AT, PERSONS WHO (I) ARE OUTSIDE THE UNITED KINGDOM, OR (II) HAVE PROFESSIONAL EXPERIENCE IN MATTERS RELATING TO INVESTMENTS AND QUALIFY AS INVESTMENT PROFESSIONALS IN ACCORDANCE WITH ARTICLE 19(5) OF THE FINANCIAL SERVICES AND MARKETS ACT 2000 (FINANCIAL PROMOTION) ORDER 2005 (AS AMENDED, THE “FINANCIAL PROMOTION ORDER”), OR (III) ARE PERSONS FALLING WITHIN ARTICLE 49(2)(A) THROUGH (D) (“HIGH NET WORTH COMPANIES, UNINCORPORATED ASSOCIATIONS, ETC.”) OF THE FINANCIAL PROMOTION ORDER OR, (IV) ARE PERSONS TO WHOM THIS MATERIAL MAY OTHERWISE LAWFULLY BE COMMUNICATED OR DIRECTED; AND (B) IF MADE BY A PERSON WHO IS AN AUTHORIZED PERSON UNDER THE FSMA, IS BEING MADE ONLY TO, OR DIRECTED ONLY AT, PERSONS WHO (I) ARE OUTSIDE THE UNITED KINGDOM, OR (II) HAVE PROFESSIONAL EXPERIENCE OF PARTICIPATING IN UNREGULATED SCHEMES (AS DEFINED FOR PURPOSES OF THE FINANCIAL SERVICES AND MARKETS ACT 2000 (PROMOTION OF COLLECTIVE INVESTMENT SCHEMES) (EXEMPTIONS) ORDER 2001 (AS AMENDED, THE “PROMOTION OF COLLECTIVE INVESTMENT SCHEMES EXEMPTIONS ORDER”)) AND QUALIFY AS INVESTMENT PROFESSIONALS IN ACCORDANCE WITH ARTICLE 14(5) OF THE PROMOTION OF COLLECTIVE INVESTMENT SCHEMES EXEMPTIONS ORDER, OR (III) ARE PERSONS FALLING WITHIN ARTICLE 22(2)(A) THROUGH (D) (HIGH NET WORTH COMPANIES, UNINCORPORATED ASSOCIATIONS, ETC.) OF THE PROMOTION OF COLLECTIVE INVESTMENT SCHEMES EXEMPTIONS ORDER, OR (IV) ARE PERSONS TO WHOM THE ISSUING ENTITY MAY LAWFULLY BE PROMOTED IN ACCORDANCE WITH SECTION 4.12 OF THE FCA HANDBOOK CONDUCT OF BUSINESS SOURCEBOOK.
THE OFFERED CERTIFICATES HAVE NOT BEEN AND WILL NOT BE REGISTERED UNDER THE FINANCIAL INSTRUMENTS AND EXCHANGE LAW OF JAPAN, AS AMENDED (THE “FIEL”), AND DISCLOSURE UNDER THE FIEL HAS NOT BEEN AND WILL NOT BE MADE WITH RESPECT TO THE OFFERED CERTIFICATES. ACCORDINGLY, EACH OF MORGAN STANLEY & CO. LLC, WELLS FARGO SECURITIES, LLC, J.P. MORGAN SECURITIES LLC, BOFA SECURITIES, INC., Academy Securities, Inc., Drexel Hamilton, LLC AND Siebert Williams Shank & Co., LLC HAS REPRESENTED AND AGREED THAT IT HAS NOT, DIRECTLY OR INDIRECTLY, OFFERED OR SOLD AND WILL NOT, DIRECTLY OR INDIRECTLY, OFFER OR SELL ANY OFFERED CERTIFICATES IN JAPAN OR TO, OR FOR THE BENEFIT OF, ANY RESIDENT OF JAPAN (WHICH TERM AS USED IN THIS MATERIAL MEANS ANY PERSON RESIDENT IN JAPAN, INCLUDING ANY CORPORATION OR OTHER ENTITY ORGANIZED UNDER THE LAWS OF JAPAN) OR TO OTHERS FOR REOFFERING OR RESALE, DIRECTLY OR INDIRECTLY, IN JAPAN OR TO, OR FOR THE BENEFIT OF, ANY RESIDENT OF JAPAN EXCEPT PURSUANT TO AN EXEMPTION FROM THE REGISTRATION REQUIREMENTS OF, AND OTHERWISE IN COMPLIANCE WITH, THE FIEL AND OTHER RELEVANT LAWS, REGULATIONS AND MINISTERIAL GUIDELINES OF JAPAN. AS PART OF THIS OFFERING OF THE OFFERED CERTIFICATES, THE UNDERWRITERS MAY OFFER THE OFFERED CERTIFICATES IN JAPAN TO UP TO 49 OFFEREES IN ACCORDANCE WITH THE ABOVE PROVISIONS.
© 2023 Morgan Stanley