| FREE WRITING PROSPECTUS | ||
| FILED PURSUANT TO RULE 433 | ||
| REGISTRATION FILE NO.: 333-259741-07 | ||
 |  |  |  |
BANK5 2024-5YR5
Free Writing Prospectus
Structural and Collateral Term Sheet
$518,600,000
(Approximate Total Mortgage Pool Balance)
$457,016,000
(Approximate Offered Certificates)
Morgan Stanley Capital I Inc.
as Depositor
Morgan Stanley Mortgage Capital Holdings LLC
Wells Fargo Bank, National Association
JPMorgan Chase Bank, National Association
Bank of America, National Association
as Sponsors and Mortgage Loan Sellers
Commercial Mortgage Pass-Through Certificates
Series 2024-5YR5
January 25, 2024
| MORGAN STANLEY | J.P. MORGAN | BofA SECURITIES | WELLS FARGO SECURITIES |
| Co-Lead Bookrunner Manager | Co-Lead Bookrunner Manager | Co-Lead Bookrunner Manager | Co-Lead Bookrunner Manager |
| Academy Securities, Inc. Co-Manager | Siebert Williams Shank Co-Manager |
STATEMENT REGARDING THIS FREE WRITING PROSPECTUS
The depositor has filed a registration statement (including a prospectus) with the SEC (File No. 333-259741) for the offering to which this communication relates. Before you invest, you should read the prospectus in that registration statement and other documents the depositor has filed with the SEC for more complete information about the depositor, the issuing entity and this offering. You may get these documents for free by visiting EDGAR on the SEC web site at www.sec.gov. Alternatively, the depositor or any underwriter or any dealer participating in the offering will arrange to send you the prospectus if you request it by calling toll free 1-866-718-1649 or by email to prospectus@ms.com.
| This is not a research report and was not prepared by any Underwriter’s research department. Please see additional important information and qualifications at the end of this Term Sheet. |
| BANK5 2024-5YR5 |
Neither this Term Sheet nor anything contained herein shall form the basis for any contract or commitment whatsoever. The information contained herein is preliminary as of the date hereof. This Term Sheet is subject to change, completion or amendment from time to time. The information contained herein supersedes information in any other communication relating to the securities described herein; provided, that the information contained herein will be superseded by similar information delivered to you as part of the Preliminary Prospectus. The information contained herein should be reviewed only in conjunction with the entire Preliminary Prospectus. All of the information contained herein is subject to the same limitations and qualifications contained in the Preliminary Prospectus. The information contained herein does not contain all relevant information relating to the underlying mortgage loans or mortgaged properties. Such information is described in the Preliminary Prospectus. The information contained herein will be more fully described in the Preliminary Prospectus. The information contained herein should not be viewed as projections, forecasts, predictions or opinions with respect to value. Prior to making any investment decision, prospective investors are strongly urged to read the Preliminary Prospectus in its entirety. Neither the Securities and Exchange Commission nor any state securities commission has approved or disapproved of these securities or determined if this Term Sheet is truthful or complete. Any representation to the contrary is a criminal offense.
Wells Fargo Securities is the trade name for the capital markets and investment banking services of Wells Fargo & Company and its subsidiaries, including but not limited to Wells Fargo Securities, LLC, a member of the New York Stock Exchange, Financial Industry Regulatory Authority (“FINRA”), the National Futures Association (“NFA”) and the Securities Investor Protection Corporation (“SIPC”), Wells Fargo Prime Services, LLC, a member of FINRA, NFA and SIPC, and Wells Fargo Bank, National Association. Wells Fargo Securities, LLC and Wells Fargo Prime Services, LLC are distinct entities from affiliated banks and thrifts.
BofA Securities is the marketing name for the global banking and global markets businesses of Bank of America Corporation. Lending, derivatives, and other commercial banking activities are performed globally by banking affiliates of Bank of America Corporation, including Bank of America, N.A., member FDIC. Securities, strategic advisory, and other investment banking activities are performed globally by investment banking affiliates of Bank of America Corporation, including, in the United States, BofA Securities, Inc., which is a registered broker-dealer and member of FINRA and SIPC, and, in other jurisdictions, locally registered entities.
IMPORTANT NOTICE RELATING TO AUTOMATICALLY GENERATED EMAIL DISCLAIMERS
Any legends, disclaimers or other notices that may appear at the bottom of, or attached to, the email communication to which this Term Sheet may have been attached are not applicable to this Term Sheet and should be disregarded. Such legends, disclaimers or other notices have been automatically generated as a result of this Term Sheet having been sent via Bloomberg or another email system.
IMPORTANT NOTICE REGARDING THE CONDITIONS FOR THIS OFFERING OF ASSET-BACKED SECURITIES
THE ASSET-BACKED SECURITIES REFERRED TO IN THIS TERM SHEET ARE BEING OFFERED WHEN, AS AND IF ISSUED. IN PARTICULAR, YOU ARE ADVISED THAT THE ASSET-BACKED SECURITIES, AND THE ASSET POOL BACKING THEM, ARE SUBJECT TO MODIFICATION OR REVISION (INCLUDING, AMONG OTHER THINGS, THE POSSIBILITY THAT ONE OR MORE CLASSES OF SECURITIES MAY BE SPLIT, COMBINED OR ELIMINATED), AT ANY TIME PRIOR TO ISSUANCE OR AVAILABILITY OF A FINAL PROSPECTUS. AS A RESULT, YOU MAY COMMIT TO PURCHASE SECURITIES THAT HAVE CHARACTERISTICS THAT MAY CHANGE, AND YOU ARE ADVISED THAT ALL OR A PORTION OF THE SECURITIES MAY NOT BE ISSUED THAT HAVE THE CHARACTERISTICS DESCRIBED IN THIS TERM SHEET. OUR OBLIGATION TO SELL SECURITIES TO YOU IS CONDITIONED ON THE SECURITIES AND THE UNDERLYING TRANSACTION HAVING THE CHARACTERISTICS DESCRIBED IN THIS TERM SHEET. IF WE DETERMINE THAT THE FOREGOING CONDITION IS NOT SATISFIED IN ANY MATERIAL RESPECT, WE WILL NOTIFY YOU, AND NEITHER THE ISSUING ENTITY NOR ANY UNDERWRITER WILL HAVE ANY OBLIGATION TO YOU TO DELIVER ALL OR ANY PORTION OF THE SECURITIES WHICH YOU HAVE COMMITTED TO PURCHASE, AND THERE WILL BE NO LIABILITY BETWEEN US AS A CONSEQUENCE OF THE NON-DELIVERY.
| This is not a research report and was not prepared by any Underwriter’s research department. Please see additional important information and qualifications at the end of this Term Sheet. | ||
| 2 | ||
| BANK5 2024-5YR5 | Structural Overview |
Offered Certificates
| Class | Expected Ratings (Fitch/KBRA/Moody’s)(1) | Approximate Initial Certificate Balance or Notional Amount(2) | Approximate Initial Credit Support(3) | Pass-Through Rate Description | Expected Weighted Average Life (Years)(4) | Expected Principal Window (Months)(4) | Certificate Principal UW NOI Debt Yield(5) | Certificate Principal to Value Ratio(6) |
| Class A-2(8) | AAAsf/AAA(sf)/Aaa(sf) | (8)(9) | 30.000% | (7)(8) | (9) | (9) | 19.0% | 35.6% |
| Class A-3(8) | AAAsf/AAA(sf)/Aaa(sf) | (8)(9) | 30.000% | (7)(8) | (9) | (9) | 19.0% | 35.6% |
| Class X-A | AAAsf/AAA(sf)/Aaa(sf) | $363,020,000(10) | N/A | Variable IO(11) | N/A | N/A | N/A | N/A |
| Class X-B | A-sf/AAA(sf)/NR | $93,996,000(10) | N/A | Variable IO(11) | N/A | N/A | N/A | N/A |
| Class A-S(8) | AAAsf/AAA(sf)/Aa1(sf) | $48,618,000(8) | 20.625% | (7)(8) | 5.00 | 60 – 60 | 16.8% | 40.4% |
| Class B(8) | AA-sf/AA+(sf)/NR | $24,634,000(8) | 15.875% | (7)(8) | 5.00 | 60 – 60 | 15.8% | 42.8% |
| Class C(8) | A-sf/A+(sf)/NR | $20,744,000(8) | 11.875% | (7)(8) | 5.00 | 60 – 60 | 15.1% | 44.9% |
Privately Offered Certificates(13)
| Class | Expected Ratings (Fitch/KBRA/Moody’s)(1) | Approximate Initial Certificate Balance or Notional Amount(2) | Approximate Initial Credit Support(3) | Pass-Through Rate Description | Expected Weighted Average Life (Years)(4) | Expected Principal Window (Months)(4) | Certificate Principal UW NOI Debt Yield(5) | Certificate Principal to Value Ratio(6) | |
| Class X-D | BBBsf/BBB+(sf)/NR | $13,224,000 | (10)(12) | N/A | Variable IO(11) | N/A | N/A | N/A | N/A |
| Class D | BBBsf/BBB+(sf)/NR | $13,224,000 | (12) | 9.325% | (7) | 5.00 | 60 – 60 | 14.7% | 46.2% |
| Class E-RR | BBB-sf/BBB(sf)/NR | $6,872,000 | (12) | 8.000% | (7) | 5.00 | 60 – 60 | 14.5% | 46.8% |
| Class F-RR | BBsf/BBB-(sf)/NR | $7,779,000 | 6.500% | (7) | 5.00 | 60 – 60 | 14.2% | 47.6% | |
| Class G-RR | BB-sf/BB+(sf)/NR | $5,186,000 | 5.500% | (7) | 5.00 | 60 – 60 | 14.1% | 48.1% | |
| Class H-RR | B-sf/B+(sf)/NR | $9,723,000 | 3.625% | (7) | 5.00 | 60 – 60 | 13.8% | 49.1% | |
| Class J-RR | NR/NR/NR | $18,800,000 | 0.000% | (7) | 5.00 | 60 – 60 | 13.3% | 50.9% | |
| (1) | Ratings shown are those of Fitch Ratings, Inc. (“Fitch”), Kroll Bond Rating Agency, LLC (“KBRA”) and Moody’s Investors Service, Inc. (“Moody’s”). Certain nationally recognized statistical rating organizations that were not hired by the depositor may use information they receive pursuant to Rule 17g-5 under the Securities Exchange Act of 1934, as amended, or otherwise to rate the certificates. There can be no assurance as to what ratings a non-hired nationally recognized statistical rating organization would assign. See “Risk Factors—Other Risks Relating to the Certificates—Nationally Recognized Statistical Rating Organizations May Assign Different Ratings to the Certificates; Ratings of the Certificates Reflect Only the Views of the Applicable Rating Agencies as of the Dates Such Ratings Were Issued; Ratings May Affect ERISA Eligibility; Ratings May Be Downgraded” and “Ratings” in the Preliminary Prospectus to be dated on or about the date hereof (the “Preliminary Prospectus”). Capitalized terms used but not defined herein have the meanings assigned to such terms in the Preliminary Prospectus. |
| (2) | Approximate, subject to a permitted variance of plus or minus 5% and further subject to the discussion in footnote (9) below. In addition, the notional amounts of the Class X-A, Class X-B and Class X-D certificates may vary depending upon the final pricing of the classes of principal balance certificates or trust components whose certificate or principal balances comprise such notional amounts, and, if as a result of such pricing the pass-through rate of any class of the Class X-A, Class X-B or Class X-D certificates, as applicable, would be equal to zero at all times, such class of certificates will not be issued on the closing date of this securitization. |
| (3) | The approximate initial credit support percentages set forth for the certificates are approximate and, for the Class A-2 and Class A-3 certificates, are presented in the aggregate, taking into account the principal balances of the Class A-2 and Class A-3 trust components. The approximate initial credit support percentage set forth for each class of the Class A-S, Class B and Class C certificates represents the approximate credit support for the underlying trust component with the same alphanumeric designation. |
| (4) | The Expected Weighted Average Life and Expected Principal Window during which distributions of principal would be received as set forth in the foregoing table with respect to each class of principal balance certificates are based on the assumptions set forth under “Yield and Maturity Considerations—Weighted Average Life” in the Preliminary Prospectus and on the assumptions that there are no prepayments, modifications or losses in respect of the mortgage loans and that there are no extensions or forbearances of maturity dates or anticipated repayment dates of the mortgage loans. |
| (5) | Certificate Principal UW NOI Debt Yield for any class of principal balance certificates shown in the table above is calculated as the product of (a) the weighted average UW NOI Debt Yield for the mortgage pool, multiplied by (b) a fraction, the numerator of which is the aggregate initial certificate balance of all the principal balance certificates, and the denominator of which is the aggregate initial certificate balance of the subject class of principal balance certificates (or, with respect to the Class A-2, Class A-3, Class A-S, Class B or Class C certificates, the initial principal balance of the trust component with the same alphanumeric designation) and all other classes of principal balance certificates, if any, that are senior to such class. The Certificate Principal UW NOI Debt Yields of the Class A-2 and Class A-3 certificates are calculated in the aggregate for those classes as if they were a single class. |
| (6) | Certificate Principal to Value Ratio for any class of principal balance certificates shown in the table above is calculated as the product of (a) the weighted average Cut-off Date LTV Ratio of the mortgage pool, multiplied by (b) a fraction, the numerator of which is the aggregate initial certificate balance of the subject class of principal balance certificates (or, with respect to the Class A-2, Class A-3, Class A-S, Class B or Class C certificates, the initial principal balance of the trust component with the same alphanumeric designation) and all other classes of principal balance certificates, if any, that are senior to such class, and the denominator of which is the aggregate initial certificate balance of all the principal balance certificates. The Certificate Principal to Value Ratios of the Class A-2 and Class A-3 certificates are calculated in the aggregate for those classes as if they were a single class. |
| (7) | The pass-through rate for each class of the Class A-2, Class A-3, Class A-S, Class B, Class C, Class D, Class E-RR, Class F-RR, Class G-RR, Class H-RR and Class J-RR certificates for any distribution date will be one of the following: (i) a fixed rate per annum, (ii) a variable rate per annum equal to the weighted average of the net mortgage interest rates on the mortgage loans for the related distribution date, (iii) a variable rate per annum equal to the lesser of (a) a |
| This is not a research report and was not prepared by any Underwriter’s research department. Please see additional important information and qualifications at the end of this Term Sheet. | ||
| 3 | ||
| BANK5 2024-5YR5 | Structural Overview |
| fixed rate and (b) the weighted average of the net mortgage interest rates on the mortgage loans for the related distribution date or (iv) a variable rate per annum equal to the weighted average of the net mortgage interest rates on the mortgage loans for the related distribution date minus a specified percentage. For purposes of the calculation of the weighted average of the net mortgage interest rates on the mortgage loans for each distribution date, the mortgage interest rates will be adjusted as necessary to a 30/360 basis. |
| (8) | The Class A-2-1, Class A-2-2, Class A-2-X1, Class A-2-X2, Class A-3-1, Class A-3-2, Class A-3-X1, Class A-3-X2, Class A-S-1, Class A-S-2, Class A-S-X1, Class A-S-X2, Class B-1, Class B-2, Class B-X1, Class B-X2, Class C-1, Class C-2, Class C-X1 and Class C-X2 certificates are also offered certificates. Such classes of certificates, together with the Class A-2, Class A-3, Class A-S, Class B and Class C certificates, constitute the “Exchangeable Certificates”. The Class D, Class E-RR, Class F-RR, Class G-RR, Class H-RR and Class J-RR certificates, together with the Exchangeable Certificates with a certificate balance, are referred to as the “principal balance certificates.” Each class of Exchangeable Certificates will have the certificate balance or notional amount and pass-through rate described below under “Exchangeable Certificates.” Each class of Class A-2, Class A-3, Class A-S, Class B and Class C Exchangeable Certificates will have the same ratings as the Class A-2, Class A-3, Class A-S, Class B and Class C certificates, respectively, shown in the table above. |
| (9) | The exact initial principal balances or notional amounts of the Class A-2, Class A-2-X1, Class A-2-X2, Class A-3, Class A-3-X1 and Class A-3-X2 trust components (and consequently, the exact aggregate initial certificate balances or notional amounts of the Exchangeable Certificates with an “A-2” or “A-3” designation) are unknown and will be determined based on the final pricing of the certificates. However, the initial principal balances, weighted average lives and principal windows of the Class A-2 and Class A-3 trust components are expected to be within the applicable ranges reflected in the chart below. The aggregate initial principal balance of the Class A-2 and Class A-3 trust components is expected to be approximately $363,020,000, subject to a variance of plus or minus 5%. The Class A-2-X1 and Class A-2-X2 trust components will have initial notional amounts equal to the initial principal balance of the Class A-2 trust component. The Class A-3-X1 and Class A-3-X2 trust components will have initial notional amounts equal to the initial principal balance of the Class A-3 trust component. In the event that the Class A-3 trust component is issued with an initial certificate balance of $363,020,000, the Class A-2 trust component (and, correspondingly, the Class A-2 Exchangeable Certificates) will not be issued. |
| Trust Component | Expected Range of Initial Principal Balance | Expected Range of Weighted Average Life (Years) | Expected Range of Principal Window (Months) |
| Class A-2 trust component | $0 – $150,000,000 | N/A – 4.83 | N/A / 57 – 58 |
| Class A-3 trust component | $213,020,000 – $363,020,000 | 4.87 – 4.90 | 57 – 60 / 58 – 60 |
| (10) | The Class X-A, Class X-B and Class X-D certificates (collectively referred to as the “Class X certificates”) are notional amount certificates and will not be entitled to distributions of principal. The notional amount of the Class X-A certificates will be equal to the aggregate certificate or principal balance of the Class A-2 and Class A-3 trust components outstanding from time to time. The notional amount of the Class X-B certificates will be equal to the aggregate principal balance of the Class A-S, Class B and Class C trust components outstanding from time to time. The notional amount of the Class X-D certificates will be equal to the certificate balance of the Class D certificates. |
| (11) | The pass-through rate for the Class X-A certificates for any distribution date will be a per annum rate equal to the excess, if any, of (a) the weighted average of the net mortgage interest rates on the mortgage loans for the related distribution date, over (b) the weighted average of the pass-through rates on the Class A-2, Class A-2-X1, Class A-2-X2, Class A-3, Class A-3-X1 and Class A-3-X2 trust components for the related distribution date, weighted on the basis of their respective certificate or principal balances or notional amounts outstanding immediately prior to that distribution date (but excluding trust components with a notional amount in the denominator of such weighted average calculation). The pass-through rate for the Class X-B certificates for any distribution date will be a per annum rate equal to the excess, if any, of (a) the weighted average of the net mortgage interest rates on the mortgage loans for the related distribution date, over (b) the weighted average of the pass-through rates on the Class A-S, Class A-S-X1, Class A-S-X2, Class B, Class B-X1, Class B-X2, Class C, Class C-X1 and Class C-X2 trust components for the related distribution date, weighted on the basis of their respective principal balances or notional amounts outstanding immediately prior to that distribution date (but excluding trust components with a notional amount in the denominator of such weighted average calculation). The pass-through rate for the Class X-D certificates for any distribution date will be a per annum rate equal to the excess, if any, of (a) the weighted average of the net mortgage interest rates on the mortgage loans for the related distribution date, over (b) the pass-through rate on the Class D certificates for the related distribution date. For purposes of the calculation of the weighted average of the net mortgage interest rates on the mortgage loans for each distribution date, the mortgage interest rates will be adjusted as necessary to a 30/360 basis. |
| (12) | The approximate initial Certificate Balances of the Class D and Class E-RR certificates (and correspondingly, the initial notional amount of the Class X-D certificates) are based in part on the estimated ranges of initial certificate balances and estimated fair values described in “Credit Risk Retention” in the Preliminary Prospectus. The approximate initial certificate balances of the Class D and Class E-RR certificates are subject to change based on the final pricing of the certificates, with the ultimate initial certificate balances determined such that the fair value of the Class E-RR, Class F-RR, Class G-RR, Class H-RR and Class J-RR certificates will equal at least 5% of the fair value of all of the classes of certificates issued by the issuing entity (other than the Class R certificates). |
| (13) | Not offered pursuant to the Preliminary Prospectus or this Term Sheet. Information provided in this Term Sheet regarding the characteristics of these certificates is provided only to enhance your understanding of the offered certificates. The privately offered certificates also include the Class V and Class R certificates, which do not have a certificate balance, notional amount, credit support, pass-through rate, rating, assumed final distribution date or rated final distribution date, and which are not shown in the chart. The Class V certificates represent a beneficial ownership interest held through the grantor trust in certain excess interest in respect of mortgage loans having anticipated repayment dates, if any. The Class R certificates represent the beneficial ownership of the residual interest in each of the real estate mortgage investment conduits, as further described in the Preliminary Prospectus. |
| This is not a research report and was not prepared by any Underwriter’s research department. Please see additional important information and qualifications at the end of this Term Sheet. | ||
| 4 | ||
| BANK5 2024-5YR5 | Structural Overview |
Issue Characteristics
| Offered Certificates: | $457,016,000 (approximate) monthly pay, multi-class, commercial mortgage pass-through certificates, consisting of 15 principal balance classes (Class A-2, Class A-2-1, Class A-2-2, Class A-3, Class A-3-1, Class A-3-2, Class A-S, Class A-S-1, Class A-S-2, Class B, Class B-1, Class B-2, Class C, Class C-1 and Class C-2) and 12 interest-only classes (Class A-2-X1, Class A-2-X2, Class A-3-X1, Class A-3-X2, Class X-A, Class X-B, Class A-S-X1, Class A-S-X2, Class B-X1, Class B-X2, Class C-X1 and Class C-X2) |
| Co-Lead Managers and Joint Bookrunners: | Morgan Stanley & Co. LLC, Wells Fargo Securities, LLC, J.P. Morgan Securities LLC and BofA Securities, Inc. |
| Co-Managers: | Academy Securities, Inc. and Siebert Williams Shank & Co., LLC. |
| Mortgage Loan Sellers: | Morgan Stanley Mortgage Capital Holdings LLC, Wells Fargo Bank, National Association, JPMorgan Chase Bank, National Association and Bank of America, National Association. |
| Rating Agencies: | Fitch, KBRA and Moody’s |
| Master Servicer: | Wells Fargo Bank, National Association |
| Special Servicer: | K-Star Asset Management LLC |
| Trustee/Certificate Administrator/ Certificate Registrar/Custodian: | Computershare Trust Company, National Association |
| Operating Advisor: | Park Bridge Lender Services LLC |
| Asset Representations Reviewer: | Park Bridge Lender Services LLC |
| Initial Directing Certificateholder: | KKR Real Estate Credit Manager LLC or an affiliate thereof |
| U.S. Credit Risk Retention: | For a discussion on the manner in which the U.S. credit risk retention requirements will be addressed by Morgan Stanley Mortgage Capital Holdings LLC, as the retaining sponsor, see “Credit Risk Retention” in the Preliminary Prospectus. An economic interest in the credit risk of the mortgage pool in this transaction is expected to be retained as an “eligible horizontal residual interest” (as defined in Regulation RR) in the form of the Class E-RR, Class F-RR, Class G-RR, Class H-RR and Class J-RR Certificates. Morgan Stanley Mortgage Capital Holdings LLC, as “retaining sponsor” (as defined in Regulation RR), intends to satisfy the risk retention requirements through the purchase by KKR CMBS IIII Aggregator Category 2 L.P., a Delaware limited partnership, as a “third-party purchaser” (as defined in Regulation RR), of such classes of certificates. See “Credit Risk Retention” in the Preliminary Prospectus. |
| EU/UK Risk Retention: | None of the sponsors, the depositor or the underwriters or their respective affiliates, or any other person, intends to retain a material net economic interest in the securitization constituted by the issue of the certificates, or to take any other action in respect of such securitization, in a manner prescribed or contemplated by the EU Securitization Regulation or the UK Securitization Regulation. In particular, no such person undertakes to take any action which may be required by any potential investor or certificateholder for the purposes of its compliance with any requirement of the EU Securitization Regulation or the UK Securitization Regulation. In addition, the arrangements described under “Credit Risk Retention” in the Preliminary Prospectus have not been structured with the objective of ensuring compliance by any person with any requirement of the EU Securitization Regulation or the UK Securitization Regulation. Consequently, the Offered Certificates may not be a suitable investment for investors that are subject to any requirement of the EU Securitization Regulation or the UK Securitization Regulation. See “Risk Factors—Other Risks Relating to the Certificates—EU Securitization Regulation and UK Securitization Regulation” in the Preliminary Prospectus. |
| Cut-off Date: | The mortgage loans will be considered part of the trust fund as of their respective cut-off dates. The cut-off date with respect to each mortgage loan is the respective due date for the monthly debt service payment that is due in February 2024 (or, in the case of any mortgage loan that has its first due date after February 2024, the date that would have been its due date in February 2024 under the terms of that mortgage loan if a monthly debt service payment were scheduled to be due in that month). |
| Expected Pricing Date: | Week of January 29, 2024 |
| Expected Closing Date: | February 14, 2024 |
| Determination Dates: | The 11th day of each month or, if the 11th day is not a business day, then the business day immediately following such 11th day. |
| Distribution Dates: | The 4th business day following each determination date. The first distribution date will be in March 2024. |
| Rated Final Distribution Date: | The distribution date in February 2057 |
| Interest Accrual Period: | Preceding calendar month |
| Payment Structure: | Sequential pay |
| Tax Treatment: | REMIC, except that the Exchangeable Certificates will evidence interests in a grantor trust |
| Optional Termination: | 1.00% clean-up call |
| Minimum Denominations: | $10,000 for each class of Offered Certificates (other than Class X-A and Class X-B certificates); $1,000,000 for the Class X-A and Class X-B certificates |
| This is not a research report and was not prepared by any Underwriter’s research department. Please see additional important information and qualifications at the end of this Term Sheet. | ||
| 5 | ||
| BANK5 2024-5YR5 | Structural Overview |
| Settlement Terms: | DTC, Euroclear and Clearstream |
| Legal/Regulatory Status: | Each class of Offered Certificates is expected to be eligible for exemptive relief under ERISA. Until the SEC adopts rules establishing a different creditworthiness standard, the Class A-2 Exchangeable Certificates, the Class A-3 Exchangeable Certificates, the Class X-A certificates, the Class X-B certificates, the Class A-S Exchangeable Certificates and the Class B Exchangeable Certificates will constitute “mortgage related securities” for purposes of SMMEA, so long as they are rated in one of the two highest rating categories by one of the rating agencies or another NRSRO, and the other classes of certificates will not constitute “mortgage related securities” for purposes of SMMEA. |
| Analytics: | The certificate administrator is expected to make available all distribution date statements, CREFC® reports and supplemental notices received by it to certain modeling financial services as described in the Preliminary Prospectus. |
| Bloomberg Ticker: | BANK5 2024-5YR5<MTGE><GO> |
| Risk Factors: | THE CERTIFICATES INVOLVE CERTAIN RISKS AND MAY NOT BE SUITABLE FOR ALL INVESTORS. SEE THE “RISK FACTORS” SECTION OF THE PRELIMINARY PROSPECTUS. |
| This is not a research report and was not prepared by any Underwriter’s research department. Please see additional important information and qualifications at the end of this Term Sheet. | ||
| 6 | ||
| BANK5 2024-5YR5 | Structural Overview |
Structural Overview
| Accrual: | Each class of Offered Certificates will accrue interest on a 30/360 basis. |
| Amount and Order of Distributions: | On each distribution date, funds available for distribution from the mortgage loans, net of (i) any yield maintenance charges and prepayment premiums and (ii) any excess interest, will be distributed in the following amounts and order of priority: First, to the Class X-A, Class X-B and Class X-D certificates and the Class A-2, Class A-2-X1, Class A-2-X2, Class A-3, Class A-3-X1 and Class A-3-X2 trust components, in respect of interest, up to an amount equal to, and pro rata in accordance with, the interest entitlements for those classes of certificates and trust components; Second, to the Class A-2 and Class A-3 trust components as follows, to the extent of applicable available funds allocated to principal: either (i)(a) first, to principal on (a) the Class A-2 trust component, and (b) the Class A-3 trust component, in that order, in each case until the certificate or principal balance of the applicable class of certificates or trust component has been reduced to zero, or (ii) if the certificate or principal balance of each class of principal balance certificates and trust components other than the Class A-2 and Class A-3 trust components has been reduced to zero as a result of the allocation of losses on the mortgage loans to those certificates and trust components, to principal on the Class A-2 and Class A-3 trust components, pro rata, without regard to the distribution priorities described above; Third, to the Class A-2 and Class A-3 trust components, first, up to an amount equal to, and pro rata based on, any previously unreimbursed losses on the mortgage loans allocable to principal that were previously borne by each such class or trust component and then in the amount of interest thereon; Fourth, to the Class A-S, Class A-S-X1 and Class A-S-X2 trust components, as follows: (a) to each such trust component in respect of interest, up to an amount equal to, and pro rata in accordance with, the interest entitlements for those trust components; (b) to the extent of applicable available funds allocable to principal remaining after distributions in respect of principal to each class of certificates or trust component with a higher priority (as set forth in prior enumerated clauses set forth above), to principal on the Class A-S trust component until its principal balance has been reduced to zero; and (c) to reimburse the Class A-S trust component, first, in the amount of any previously unreimbursed losses on the mortgage loans that were previously allocated thereto, then in the amount of interest thereon; Fifth, to the Class B, Class B-X1 and Class B-X2 trust components, as follows: (a) to each such trust component in respect of interest, up to an amount equal to, and pro rata in accordance with, the interest entitlements for those trust components; (b) to the extent of applicable available funds allocable to principal remaining after distributions in respect of principal to each class of certificates or trust component with a higher priority (as set forth in prior enumerated clauses set forth above), to principal on the Class B trust component until its principal balance has been reduced to zero; and (c) to reimburse the Class B trust component, first, in the amount of any previously unreimbursed losses on the mortgage loans that were previously allocated thereto, then in the amount of interest thereon; Sixth, to the Class C, Class C-X1 and Class C-X2 trust components, as follows: (a) to each such trust component in respect of interest, up to an amount equal to, and pro rata in accordance with, the interest entitlements for those trust components; (b) to the extent of applicable available funds allocable to principal remaining after distributions in respect of principal to each class of certificates or trust component with a higher priority (as set forth in prior enumerated clauses set forth above), to principal on the Class C trust component until its principal balance has been reduced to zero; and (c) to reimburse the Class C trust component, first, in the amount of any previously unreimbursed losses on the mortgage loans that were previously allocated thereto, then in the amount of interest thereon; Seventh, to the Class D, Class E-RR, Class F-RR, Class G-RR, Class H-RR and Class J-RR certificates in the amounts and order of priority described in “Description of the Certificates—Distributions” in the Preliminary Prospectus; and Eighth, to the Class R certificates, any remaining amounts. Principal and interest payable on each trust component will be distributed pro rata to the corresponding classes of Exchangeable Certificates representing interests therein in accordance with their Class Percentage Interests therein as described below under “Exchangeable Certificates.” |
| Interest and Principal Entitlements: | The interest entitlement of each class of Offered Certificates on each distribution date generally will be the interest accrued during the related interest accrual period on the related certificate balance or notional amount at the related pass-through rate, net of any prepayment interest shortfalls allocated to that class for such distribution date as described below. If prepayment interest shortfalls arise from voluntary prepayments on serviced mortgage loans during any collection period, the applicable master servicer is required to make a limited compensating interest payment to offset those shortfalls. See “Description of the Certificates—Prepayment Interest Shortfalls” in the Preliminary Prospectus. The remaining amount of prepayment interest shortfalls will be allocated among the classes of certificates (other than the Exchangeable Certificates) and trust components that are entitled to interest, on a pro rata basis, based on their respective amounts of accrued interest for the related distribution date, to reduce the interest entitlement on each such class of certificates and trust components. For any distribution date, prepayment interest shortfalls allocated to a trust component will be allocated among the related classes of Exchangeable Certificates, pro rata, in accordance with their respective class percentage interests for that distribution date. If a class of certificates or trust component receives less than the entirety of its interest entitlement on any distribution date, then the shortfall (excluding |
| This is not a research report and was not prepared by any Underwriter’s research department. Please see additional important information and qualifications at the end of this Term Sheet. | ||
| 7 | ||
| BANK5 2024-5YR5 | Structural Overview |
any shortfall due to prepayment interest shortfalls), together with interest thereon, will be added to its interest entitlement for the next succeeding distribution date. The principal distribution amount for each distribution date generally will be the aggregate amount of principal received or advanced in respect of the mortgage loans, net of any non-recoverable advances and interest thereon and any workout-delayed reimbursement amounts that are reimbursed to the applicable master servicer or the trustee during the related collection period. Non-recoverable advances and interest thereon are reimbursable from principal collections before reimbursement from other amounts. Workout-delayed reimbursement amounts will be reimbursable from principal collections. | |
| Exchangeable Certificates: | Certificates of each class of Exchangeable Certificates may be exchanged for certificates of the corresponding classes of Exchangeable Certificates set forth next to such class in the table below, and vice versa. Following any exchange of certificates of one or more classes of Exchangeable Certificates (the applicable “Surrendered Classes”) for certificates of one or more classes of other Exchangeable Certificates (the applicable “Received Classes”), the Class Percentage Interests (as defined below) of the outstanding principal balances or notional amounts of the Corresponding Trust Components that are represented by the Surrendered Classes (and consequently their related certificate balances or notional amounts) will be decreased, and those of the Received Classes (and consequently their related certificate balances or notional amounts) will be increased. The dollar denomination of the certificates of each of the Received Classes must be equal to the dollar denomination of the certificates of each of the Surrendered Classes. No fee will be required with respect to any exchange of Exchangeable Certificates. |
| Surrendered Classes (or Received Classes) of Certificates | Received Classes (or Surrendered Classes) of Certificates | |
| Class A-2 | Class A-2-1, Class A-2-X1 | |
| Class A-2 | Class A-2-2, Class A-2-X2 | |
| Class A-3 | Class A-3-1, Class A-3-X1 | |
| Class A-3 | Class A-3-2, Class A-3-X2 | |
| Class A-S | Class A-S-1, Class A-S-X1 | |
| Class A-S | Class A-S-2, Class A-S-X2 | |
| Class B | Class B-1, Class B-X1 | |
| Class B | Class B-2, Class B-X2 | |
| Class C | Class C-1, Class C-X1 | |
| Class C | Class C-2, Class C-X2 |
| On the closing date, the issuing entity will issue the following “trust components,” each with the initial principal balance (or, if such trust component has an “X” suffix, notional amount) and pass-through rate set forth next to it in the table below. Each trust component with an “X” suffix will not be entitled to distributions of principal. |
| Trust Component | Initial Principal Balance or Notional Amount | Pass-Through Rate | |
| Class A-2 | See footnote (9) to the first table above under “Structural Overview” | Class A-2 certificate pass-through rate minus 1.00% | |
| Class A-2-X1 | Equal to Class A-2 trust component principal balance | 0.50% | |
| Class A-2-X2 | Equal to Class A-2 trust component principal balance | 0.50% | |
| Class A-3 | See footnote (9) to the first table above under “Structural Overview” | Class A-3 certificate pass-through rate minus 1.00% | |
| Class A-3-X1 | Equal to Class A-3 trust component principal balance | 0.50% | |
| Class A-3-X2 | Equal to Class A-3 trust component principal balance | 0.50% | |
| Class A-S | $48,618,000 | Class A-S certificate pass-through rate minus 1.00% | |
| Class A-S-X1 | Equal to Class A-S trust component principal balance | 0.50% | |
| Class A-S-X2 | Equal to Class A-S trust component principal balance | 0.50% | |
| Class B | $24,634,000 | Class B certificate pass-through rate minus 1.00% | |
| Class B-X1 | Equal to Class B trust component principal balance | 0.50% | |
| Class B-X2 | Equal to Class B trust component principal balance | 0.50% | |
| Class C | $20,744,000 | Class C certificate pass-through rate minus 1.00% | |
| Class C-X1 | Equal to Class C trust component principal balance | 0.50% | |
| Class C-X2 | Equal to Class C trust component principal balance | 0.50% |
| This is not a research report and was not prepared by any Underwriter’s research department. Please see additional important information and qualifications at the end of this Term Sheet. | ||
| 8 | ||
| BANK5 2024-5YR5 | Structural Overview |
| Each class of Exchangeable Certificates represents an undivided beneficial ownership interest in the trust components set forth next to it in the table below (the “Corresponding Trust Components”). Each class of Exchangeable Certificates has a pass-through rate equal to the sum of the pass-through rates of the Corresponding Trust Components and represents a percentage interest (the related “Class Percentage Interest”) in each Corresponding Trust Component, including principal and interest payable thereon (and reimbursements of losses allocable thereto), equal to (x) the certificate balance (or, if such class has an “X” suffix, notional amount) of such class of certificates, divided by (y) the principal balance of the Class A-2 trust component (if such class of Exchangeable Certificates has an “A-2” designation), the Class A-3 trust component (if such class of Exchangeable Certificates has an “A-3” designation), the Class A-S trust component (if such class of Exchangeable Certificates has an “A-S” designation), the Class B trust component (if such class of Exchangeable Certificates has a “B” designation), or the Class C trust component (if such class of Exchangeable Certificates has a “C” designation). |
| Group of Exchangeable Certificates | Class of Exchangeable Certificates | Corresponding Trust Components | |
| “Class A-2 Exchangeable Certificates” | Class A-2 | Class A-2, Class A-2-X1, Class A-2-X2 | |
| Class A-2-1 | Class A-2, Class A-2-X2 | ||
| Class A-2-2 | Class A-2 | ||
| Class A-2-X1 | Class A-2-X1 | ||
| Class A-2-X2 | Class A-2-X1, Class A-2-X2 | ||
| “Class A-3 Exchangeable Certificates” | Class A-3 | Class A-3, Class A-3-X1, Class A-3-X2 | |
| Class A-3-1 | Class A-3, Class A-3-X2 | ||
| Class A-3-2 | Class A-3 | ||
| Class A-3-X1 | Class A-3-X1 | ||
| Class A-3-X2 | Class A-3-X1, Class A-3-X2 | ||
| “Class A-S Exchangeable Certificates” | Class A-S | Class A-S, Class A-S-X1, Class A-S-X2 | |
| Class A-S-1 | Class A-S, Class A-S-X2 | ||
| Class A-S-2 | Class A-S | ||
| Class A-S-X1 | Class A-S-X1 | ||
| Class A-S-X2 | Class A-S-X1, Class A-S-X2 | ||
| “Class B Exchangeable Certificates” | Class B | Class B, Class B-X1, Class B-X2 | |
| Class B-1 | Class B, Class B-X2 | ||
| Class B-2 | Class B | ||
| Class B-X1 | Class B-X1 | ||
| Class B-X2 | Class B-X1, Class B-X2 | ||
| “Class C Exchangeable Certificates” | Class C | Class C, Class C-X1, Class C-X2 | |
| Class C-1 | Class C, Class C-X2 | ||
| Class C-2 | Class C | ||
| Class C-X1 | Class C-X1 | ||
| Class C-X2 | Class C-X1, Class C-X2 |
The maximum certificate balance or notional amount of each class of Class A-2 Exchangeable Certificates, Class A-3 Exchangeable Certificates, Class A-S Exchangeable Certificates, Class B Exchangeable Certificates or Class C Exchangeable Certificates that could be issued in an exchange is equal to the principal balance of the Class A-2, Class A-3, Class A-S, Class B or Class C trust component, respectively. The maximum certificate balances of Class A-2, Class A-3, Class A-S, Class B and Class C certificates (subject to the constraint on the aggregate of the initial principal balances of the Class A-2 and Class A-3 trust components discussed in footnote (9) to the first table above under “Structural Overview”) will be issued on the closing date, and the certificate balance or notional amount of each other class of Exchangeable Certificates will be equal to zero on the closing date. Each class of Class A-2 Exchangeable Certificates, Class A-3 Exchangeable Certificates, Class A-S Exchangeable Certificates, Class B Exchangeable Certificates and Class C Exchangeable Certificates will have a certificate balance or notional amount equal to its Class Percentage Interest multiplied by the principal balance of the Class A-2, Class A-3, Class A-S, Class B or Class C trust component, respectively. Each class of Class A-2 Exchangeable Certificates, Class A-3 Exchangeable Certificates, Class A-S Exchangeable Certificates, Class B Exchangeable Certificates and Class C Exchangeable Certificates with a certificate balance will have the same approximate initial credit support percentage, Expected Weighted Average Life, Expected Principal Window, Certificate Principal UW NOI Debt Yield and Certificate Principal to Value Ratio as the Class A-2, Class A-3, Class A-S, Class B or Class C certificates, respectively, shown above. | |
| Special Servicer Compensation: | The principal compensation to be paid to a special servicer in respect of its special servicing activities will be the special servicing fee, the workout fee and the liquidation fee. The special servicing fee for each distribution date is calculated based on the outstanding principal balance of each serviced mortgage loan that is a specially serviced mortgage loan (and any related serviced companion loan) or as to which the related mortgaged property has become an REO property at the special servicing fee rate, which will be a rate equal to the greater of 0.25% per annum and the per annum rate that would result in |
| This is not a research report and was not prepared by any Underwriter’s research department. Please see additional important information and qualifications at the end of this Term Sheet. | ||
| 9 | ||
| BANK5 2024-5YR5 | Structural Overview |
a special servicing fee for the related month of $3,500. The special servicing fee will be payable monthly, first, from liquidation proceeds, insurance and condemnation proceeds, and other collections in respect of the related specially serviced mortgage loan or REO property and, then, from general collections on all the mortgage loans and any REO properties. Each applicable special servicer will also be entitled to (i) liquidation fees generally equal to 1.0% (or, in any case, if such rate would result in an aggregate liquidation fee less than $25,000, then the liquidation fee rate will be equal to the lesser of (i) 3.00% and (ii) such rate as would result in an aggregate liquidation fee equal to $25,000) of liquidation proceeds and certain other collections in respect of each non-specially serviced loan with respect to which it acts as the enforcing servicer or each specially serviced mortgage loan (and any related serviced companion loan) or related REO property and of amounts received in respect of mortgage loan repurchases by the related mortgage loan sellers and (ii) workout fees generally equal to 1.0% of interest (other than post-ARD excess interest on mortgage loans with anticipated repayment dates and other than default interest) and principal payments made in respect of a rehabilitated mortgage loan (and any related serviced companion loan), subject to a floor of $25,000 with respect to any mortgage loan, whole loan or related REO property, and in the case of each of clause (i) and (ii), subject to certain adjustments and exceptions as described in the Preliminary Prospectus under “Pooling and Servicing Agreement—Servicing and Other Compensation and Payment of Expenses—Special Servicing Compensation”. With respect to any non-serviced mortgage loan, the related special servicer under the related other pooling and servicing agreement pursuant to which such mortgage loan is being serviced will be entitled to similar compensation as that described above with respect to such non-serviced mortgage loan under such other pooling and servicing agreement as further described in the Preliminary Prospectus, although any related fees may accrue at a different rate and there may be a higher (or no) cap on liquidation and workout fees. | |
| Prepayment Premiums/Yield Maintenance Charges: | If any yield maintenance charge or prepayment premium is collected during any collection period with respect to any mortgage loan, then on the immediately succeeding distribution date, the certificate administrator will pay: (a) to the holders of each class of the Class A-2, Class A-2-1, Class A-2-2, Class A-3, Class A-3-1, Class A-3-2, Class A-S, Class A-S-1, Class A-S-2, Class B, Class B-1, Class B-2, Class C, Class C-1, Class C-2 and Class D certificates, the product of (x) such yield maintenance charge or prepayment premium, (y) the related Base Interest Fraction for such class and the applicable principal prepayment, and (z) a fraction, the numerator of which is equal to the amount of principal distributed to such class for that distribution date, and the denominator of which is the YM Denominator for that distribution date, (b) to the holders of the Class A-2-X1 certificates, the product of (x) such yield maintenance charge or prepayment premium, (y) a fraction, the numerator of which is equal to the amount of principal distributed to the Class A-2-1 certificates for that distribution date, and the denominator of which is the YM Denominator for that distribution date, and (z) the difference between (1) the Base Interest Fraction for the Class A-2 certificates and the applicable principal prepayment and (2) the Base Interest Fraction for the Class A-2-1 certificates and the applicable principal prepayment, (c) to the holders of the Class A-2-X2 certificates, the product of (x) such yield maintenance charge or prepayment premium, (y) a fraction, the numerator of which is equal to the amount of principal distributed to the Class A-2-2 certificates for that distribution date, and the denominator of which is the YM Denominator for that distribution date, and (z) the difference between (1) the Base Interest Fraction for the Class A-2 certificates and the applicable principal prepayment and (2) the Base Interest Fraction for the Class A-2-2 certificates and the applicable principal prepayment, (d) to the holders of the Class A-3-X1 certificates, the product of (x) such yield maintenance charge or prepayment premium, (y) a fraction, the numerator of which is equal to the amount of principal distributed to the Class A-3-1 certificates for that distribution date, and the denominator of which is the YM Denominator for that distribution date, and (z) the difference between (1) the Base Interest Fraction for the Class A-3 certificates and the applicable principal prepayment and (2) the Base Interest Fraction for the Class A-3-1 certificates and the applicable principal prepayment, (e) to the holders of the Class A-3-X2 certificates, the product of (x) such yield maintenance charge or prepayment premium, (y) a fraction, the numerator of which is equal to the amount of principal distributed to the Class A-3-2 certificates for that distribution date, and the denominator of which is the YM Denominator for that distribution date, and (z) the difference between (1) the Base Interest Fraction for the Class A-3 certificates and the applicable principal prepayment and (2) the Base Interest Fraction for the Class A-3-2 certificates and the applicable principal prepayment, (f) to the holders of the Class A-S-X1 certificates, the product of (x) such yield maintenance charge or prepayment premium, (y) a fraction, the numerator of which is equal to the amount of principal distributed to the Class A-S-1 certificates for that distribution date, and the denominator of which is the YM Denominator for that distribution date, and (z) the difference between (1) the Base Interest Fraction for the Class A-S certificates and the applicable principal prepayment and (2) the Base Interest Fraction for the Class A-S-1 certificates and the applicable principal prepayment, (g) to the holders of the Class A-S-X2 certificates, the product of (x) such yield maintenance charge or prepayment premium, (y) a fraction, the numerator of which is equal to the amount of principal distributed to the Class A-S-2 certificates for that distribution date, and the denominator of which is the YM Denominator for that distribution date, and (z) the difference between (1) the Base Interest Fraction for the Class A-S certificates and |
| This is not a research report and was not prepared by any Underwriter’s research department. Please see additional important information and qualifications at the end of this Term Sheet. | ||
| 10 | ||
| BANK5 2024-5YR5 | Structural Overview |
the applicable principal prepayment and (2) the Base Interest Fraction for the Class A-S-2 certificates and the applicable principal prepayment, (h) to the holders of the Class B-X1 certificates, the product of (x) such yield maintenance charge or prepayment premium, (y) a fraction, the numerator of which is equal to the amount of principal distributed to the Class B-1 certificates for that distribution date, and the denominator of which is the YM Denominator for that distribution date, and (z) the difference between (1) the Base Interest Fraction for the Class B certificates and the applicable principal prepayment and (2) the Base Interest Fraction for the Class B-1 certificates and the applicable principal prepayment, (i) to the holders of the Class B-X2 certificates, the product of (x) such yield maintenance charge or prepayment premium, (y) a fraction, the numerator of which is equal to the amount of principal distributed to the Class B-2 certificates for that distribution date, and the denominator of which is the YM Denominator for that distribution date, and (z) the difference between (1) the Base Interest Fraction for the Class B certificates and the applicable principal prepayment and (2) the Base Interest Fraction for the Class B-2 certificates and the applicable principal prepayment, (j) to the holders of the Class C-X1 certificates, the product of (x) such yield maintenance charge or prepayment premium, (y) a fraction, the numerator of which is equal to the amount of principal distributed to the Class C-1 certificates for that distribution date, and the denominator of which is the YM Denominator for that distribution date, and (z) the difference between (1) the Base Interest Fraction for the Class C certificates and the applicable principal prepayment and (2) the Base Interest Fraction for the Class C-1 certificates and the applicable principal prepayment, (k) to the holders of the Class C-X2 certificates, the product of (x) such yield maintenance charge or prepayment premium, (y) a fraction, the numerator of which is equal to the amount of principal distributed to the Class C-2 certificates for that distribution date, and the denominator of which is the YM Denominator for that distribution date, and (z) the difference between (1) the Base Interest Fraction for the Class C certificates and the applicable principal prepayment and (2) the Base Interest Fraction for the Class C-2 certificates and the applicable principal prepayment, (l) to the holders of the Class X-A certificates, the excess, if any, of (x) the product of (1) such yield maintenance charge or prepayment premium and (2) a fraction, the numerator of which is equal to the total amount of principal distributed to the Class A-2 Exchangeable Certificates and the Class A-3 Exchangeable Certificates for that distribution date, and the denominator of which is the YM Denominator for that distribution date, over (y) the total amount of such yield maintenance charge or prepayment premium distributed to the Class A-2 Exchangeable Certificates and the Class A-3 Exchangeable Certificates as described above, (m) to the holders of the Class X-B certificates, the excess, if any, of (x) the product of (1) such yield maintenance charge or prepayment premium and (2) a fraction, the numerator of which is equal to the total amount of principal distributed to the Class A-S Exchangeable Certificates, the Class B Exchangeable Certificates and the Class C Exchangeable Certificates for that distribution date, and the denominator of which is the YM Denominator for that distribution date, over (y) the total amount of such yield maintenance charge or prepayment premium distributed to the Class A-S Exchangeable Certificates, the Class B Exchangeable Certificates and the Class C Exchangeable Certificates as described above, and (n) to the holders of the Class X-D certificates, any remaining portion of such yield maintenance charge or prepayment premium not distributed as described above. “YM Denominator” means, for any distribution date, the total amount of principal distributed to the Class D certificates and the Class A-2 Exchangeable Certificates, the Class A-3 Exchangeable Certificates, the Class A-S Exchangeable Certificates, the Class B Exchangeable Certificates and the Class C Exchangeable Certificates. All yield maintenance charges and prepayment premiums referred to above will be net of any liquidation fees payable therefrom. Notwithstanding any of the foregoing to the contrary, if at any time the certificate balances of the principal balance certificates (other than the Control Eligible Certificates) have been reduced to zero as a result of the allocation of principal payments on the mortgage loans, the certificate administrator will be required to pay to the holders of each remaining class of principal balance certificates then entitled to distributions of principal on such distribution date the product of (a) any yield maintenance charge or prepayment premium distributable on the subject distribution date (net of any liquidation fees payable therefrom) and (b) a fraction, the numerator of which is equal to the amount of principal distributed to such class for that distribution date, and the denominator of which is the total amount of principal distributed to all principal balance certificates for that distribution date. No yield maintenance charges or prepayment premiums will be distributed to the holders of the Class V or Class R Certificates. “Base Interest Fraction” means, with respect to any principal prepayment of any mortgage loan that provides for the payment of a yield maintenance charge or prepayment premium, and with respect to any class of principal balance certificates, a fraction (A) the numerator of which is the greater of (x) zero and (y) the difference between (i) the pass‑through rate on that class, and (ii) the applicable discount rate and (B) the denominator of which is the difference between (i) the mortgage interest rate on the related mortgage loan and (ii) the applicable discount rate; provided, that: under no circumstances will the Base Interest Fraction be greater than one; if the discount rate referred to above is greater than or equal to both the mortgage interest rate on the related mortgage loan and the pass‑through rate on that class, then the Base Interest Fraction will equal zero; and if the discount rate referred to above is greater than or equal to the mortgage interest rate on the related |
| This is not a research report and was not prepared by any Underwriter’s research department. Please see additional important information and qualifications at the end of this Term Sheet. | ||
| 11 | ||
| BANK5 2024-5YR5 | Structural Overview |
mortgage loan and is less than the pass‑through rate on that class, then the Base Interest Fraction will be equal to 1.0. Consistent with the foregoing, the Base Interest Fraction is equal to: |
| (Pass-Through Rate – Discount Rate) | |||
| (Mortgage Rate – Discount Rate) |
| Realized Losses: | On each distribution date, immediately following the distributions to be made to the certificateholders on that date, the certificate administrator is required to calculate the amount, if any, by which (i) the aggregate stated principal balance of the mortgage loans, including any successor REO loans, expected to be outstanding immediately following that distribution date is less than (ii) the then aggregate certificate balance of the principal balance certificates after giving effect to distributions of principal on that distribution date, which amount will be applied to the Class J-RR, Class H-RR, Class G-RR, Class F-RR, Class E-RR and Class D certificates and the Class C, Class B and Class A-S trust components, in that order, in each case until the related certificate or principal balance has been reduced to zero, and then to the Class A-2 and Class A-3 trust components, pro rata based upon their respective certificate or principal balances, until their respective certificate or principal balances have been reduced to zero. Any portion of such amount applied to the Class A-2, Class A-3, Class A-S, Class B or Class C trust component will reduce the certificate balance or notional amount of each class of certificates in the related group of Exchangeable Certificates by an amount equal to the product of (x) its certificate balance or notional amount, divided by the principal balance of such trust component prior to the applicable reduction, and (y) the amount applied to such trust component. |
| Serviced Whole Loans: | Each of the following mortgaged properties or portfolios of mortgaged properties secures a mortgage loan and one or more pari passu promissory notes and, in some cases, one or more generally subordinate promissory notes (each, a “serviced companion loan”) that will be serviced pursuant to the related intercreditor agreement and the pooling and servicing agreement for this transaction: 11755 Wilshire and Timber Creek Crossing. With respect to each such mortgaged property or portfolio of mortgaged properties, the related mortgage loan, together with the related serviced companion loan(s), is referred to herein (for so long as it is serviced under the pooling and servicing agreement for this transaction) as a “serviced whole loan.” Each serviced companion loan is not part of the mortgage pool and may be contributed to one or more future securitization transactions (if not already securitized) or may be otherwise transferred at any time, subject to compliance with the related intercreditor agreement. See the tables below entitled “Mortgage Loans with Pari Passu Companion Loans” and “Mortgage Loans with Subordinate Debt,” as well as “Description of the Mortgage Pool—The Whole Loans” in the Preliminary Prospectus, for additional information regarding each such whole loan. With respect to each “servicing shift whole loan”, the pooling and servicing agreement for this transaction will govern servicing of such whole loan until the securitization of the related lead servicing note; however, servicing of such whole loan will generally be directed by the holder of the related control note (which is not included in this securitization), and such holder will have the right to replace the special servicer with respect to the related whole loan with or without cause. After the securitization of the related lead servicing note, such whole loan will cease to be a serviced whole loan and will be serviced pursuant to the pooling and servicing agreement for another securitization transaction (see “—Non-Serviced Whole Loans” below). There will be no servicing shift mortgage loans related to the trust as of the Closing Date. |
| Non-Serviced Whole Loans: | Each of the following mortgaged properties or portfolios of mortgaged properties secures a mortgage loan (each, a “non-serviced mortgage loan”), one or more pari passu promissory notes and, in some cases, one or more generally subordinate promissory notes (each such promissory note, a “non-serviced companion loan”) that will be serviced pursuant to the related intercreditor agreement and the pooling and servicing agreement or trust and servicing agreement (referred to herein as a related “pooling and servicing agreement”) for another securitization transaction: Tysons Corner Center, Nvidia Santa Clara and 33 West State Street and 50 East State Street. With respect to each such mortgaged property or portfolio of mortgaged properties, the related mortgage loan, together with the related non-serviced companion loan(s), is referred to herein (for so long as it is serviced under the pooling and servicing agreement for another securitization transaction) as a “non-serviced whole loan.” Each non-serviced companion loan is not part of the mortgage pool and may be contributed to one or more future securitization transactions (if not already securitized) or may be otherwise transferred at any time, subject to compliance with the related intercreditor agreement. Servicing of each non-serviced whole loan will generally be directed by the holder of the related control note (or, if such control note is included in a securitization, the directing certificateholder thereunder (or other party designated thereunder to exercise the rights of such control note)), and such holder will have the right to replace the special servicer with respect to the related whole loan with or without cause. See the tables below entitled “Mortgage Loans with Pari Passu Companion Loans” and “Mortgage Loans with Subordinate Debt,” as well as “Description of the Mortgage Pool—The Whole Loans” in the Preliminary Prospectus, for additional information regarding each such whole loan. |
| Directing Certificateholder/ Controlling Class: | The “Directing Certificateholder” will be (i) with respect to a servicing shift mortgage loan, the related Loan-Specific Directing Certificateholder, and (ii) with respect to each other mortgage loan, the Controlling Class Certificateholder (or its representative) selected by more than 50% (by certificate balance) of the Controlling Class Certificateholders; provided, that (1) absent that selection, (2) until a Directing Certificateholder is so selected or (3) upon receipt of a notice from a majority of the Controlling Class Certificateholders (by certificate balance) that a Directing Certificateholder is no longer designated, the Controlling Class Certificateholder that |
| This is not a research report and was not prepared by any Underwriter’s research department. Please see additional important information and qualifications at the end of this Term Sheet. | ||
| 12 | ||
| BANK5 2024-5YR5 | Structural Overview |
owns the largest aggregate certificate balance of the Controlling Class (or its representative) will be the Directing Certificateholder; provided, that (a) in the case of clause (3), if no one holder owns the largest aggregate certificate balance of the Controlling Class, then there will be no Directing Certificateholder until appointed in accordance with the terms of the pooling and servicing agreement, and (b) the certificate administrator and the other parties to the pooling and servicing agreement will be entitled to assume that the identity of the Directing Certificateholder has not changed until such parties receive written notice of a replacement of the Directing Certificateholder from a party holding the requisite interest in the Controlling Class (as confirmed by the certificate registrar), or the resignation of the then current Directing Certificateholder. As used herein, the term “Directing Certificateholder,” unless used in relation to a Servicing Shift Mortgage Loan, means the entity determined pursuant to clause (ii) of the definition of such term. The “Loan-Specific Directing Certificateholder” with respect to a servicing shift mortgage loan is the “controlling holder”, the “directing certificateholder”, the “directing holder”, “directing lender” or any analogous concept under the related intercreditor agreement. Prior to the securitization of the related lead servicing note, the Loan-Specific Directing Certificateholder with respect to a servicing shift mortgage loan will be the holder of the related control note. On and after the securitization of the related lead servicing note, there will be no Loan-Specific Directing Certificateholder under the PSA with respect to such servicing shift mortgage loan. The “Controlling Class” will be, as of any time of determination, the most subordinate class of Control Eligible Certificates then outstanding that has an aggregate certificate balance (as notionally reduced by any Cumulative Appraisal Reduction Amounts (as defined below) allocable to such class) at least equal to 25% of the initial certificate balance of that class; provided, that if at any time the certificate balances of the certificates other than the Control Eligible Certificates have been reduced to zero as a result of principal payments on the mortgage loans, then the Controlling Class will be the most subordinate class of Control Eligible Certificates that has a certificate balance greater than zero without regard to any Cumulative Appraisal Reduction Amounts. The Controlling Class as of the closing date will be the Class J-RR certificates. The “Control Eligible Certificates” will be any of the Class E-RR, Class F-RR, Class G-RR, Class H-RR and Class J-RR certificates. | |
| Control Rights: | Prior to a Control Termination Event, the Directing Certificateholder will have certain consent and consultation rights under the pooling and servicing agreement with respect to certain major decisions and other matters. A “Control Termination Event” will occur when the Class E-RR certificates have a certificate balance (taking into account the application of any Cumulative Appraisal Reduction Amounts to notionally reduce the certificate balance thereof) of less than 25% of the initial certificate balance of that class; provided, that no Control Termination Event may occur with respect to a Loan-Specific Directing Certificateholder, and the term “Control Termination Event” will not be applicable to a Loan-Specific Directing Certificateholder; provided, further, that a Control Termination Event will be deemed not continuing in the event that the certificate balances of the principal balance certificates other than the Control Eligible Certificates have been reduced to zero as a result of principal payments on the mortgage loans. After the occurrence of a Control Termination Event but prior to the occurrence of a Consultation Termination Event, the Directing Certificateholder will not have any consent rights, but the Directing Certificateholder will have certain non-binding consultation rights under the pooling and servicing agreement with respect to certain major decisions and other matters. A “Consultation Termination Event” will occur when no class of Control Eligible Certificates has a certificate balance (without regard to the application of any Cumulative Appraisal Reduction Amounts) at least equal to 25% of the initial certificate balance of that class; provided, that no Consultation Termination Event may occur with respect to a Loan-Specific Directing Certificateholder, and the term “Consultation Termination Event” will not be applicable to a Loan-Specific Directing Certificateholder; provided, further, that a Consultation Termination Event will be deemed not continuing in the event that the certificate balances of the principal balance certificates other than the Control Eligible Certificates have been reduced to zero as a result of principal payments on the mortgage loans. After the occurrence of a Consultation Termination Event, the Directing Certificateholder will not have any consent or consultation rights, except with respect to any rights expressly set forth in the pooling and servicing agreement. If an Operating Advisor Consultation Event has occurred and is continuing, the operating advisor will have certain non-binding consultation rights under the PSA with respect to certain major decisions and other matters. Notwithstanding any proviso to, or any other contrary provision in, the definitions of “Control Termination Event”, “Consultation Termination Event” and “Operating Advisor Consultation Event”, a Control Termination Event, a Consultation Termination Event and a Operating Advisor Consultation Event will each be deemed to have occurred with respect to any Excluded Loan with respect to the Directing Certificateholder or the holder of the majority of the Controlling Class, and neither the Directing Certificateholder nor any Controlling Class Certificateholder will have any consent or consultation rights with respect to the servicing of such Excluded Loan. An “Excluded Loan” means, with respect to the Directing Certificateholder or the holder of the majority of the Controlling Class, a mortgage loan or whole loan with respect to which, as of any date of determination, the Directing Certificateholder or the holder of the majority of the Controlling Class is a Borrower Party. It is expected that there will be no Excluded Loans with respect to this securitization on the closing date. “Borrower Party” means a borrower, a mortgagor, a manager of a mortgaged property, the holder of a mezzanine loan that has been accelerated or as to which foreclosure or enforcement proceedings have been commenced against the equity collateral pledged to secure the related mezzanine loan, or any Borrower Party Affiliate. “Borrower Party Affiliate” means, with respect to a borrower, a mortgagor, a manager of a mortgaged property or the holder of a mezzanine loan that has been accelerated or as to which foreclosure or enforcement |
| This is not a research report and was not prepared by any Underwriter’s research department. Please see additional important information and qualifications at the end of this Term Sheet. | ||
| 13 | ||
| BANK5 2024-5YR5 | Structural Overview |
proceedings have been commenced against the equity collateral pledged to secure the related mezzanine loan, (a) any other person controlling or controlled by or under common control with such borrower, mortgagor, manager or mezzanine lender, as applicable, or (b) any other person owning, directly or indirectly, 25% or more of the beneficial interests in such borrower, mortgagor, manager or mezzanine lender, as applicable. For the purposes of this definition, “control” when used with respect to any specified person means the power to direct the management and policies of such person, directly or indirectly, whether through the ownership of voting securities, by contract or otherwise and the terms “controlling” and “controlled” have meanings correlative to the foregoing. Notwithstanding any of the foregoing to the contrary, if any mortgage loan is part of a whole loan, the Directing Certificateholder’s consent and/or consultation rights with respect thereto may be limited as described in the Preliminary Prospectus. In particular, with respect to each non-serviced whole loan and each servicing shift whole loan, the Directing Certificateholder (other than a Loan-Specific Directing Certificateholder) will only have certain consultation rights with respect to certain major decisions and other matters related to such whole loan, in each case only prior to a Consultation Termination Event, and the Loan-Specific Directing Certificateholder will be entitled to similar consent and/or consultation rights with respect to such whole loan. In addition, with respect to any serviced A/B whole loan, for so long as the holder of the related subordinate companion loan is the controlling note holder, the holder of such subordinate companion loan (rather than the Directing Certificateholder) will be entitled to exercise such consent and consultation rights with respect to such whole loan. | |
| Appraisal Reduction Amounts and Collateral Deficiency Amounts: | An “Appraisal Reduction Amount” generally will be created in the amount, if any, by which the principal balance of a required appraisal loan (which is a mortgage loan with respect to which certain defaults, modifications or insolvency events have occurred as further described in the Preliminary Prospectus) plus other amounts overdue or advanced in connection with such mortgage loan exceeds 90% of the appraised value of the related mortgaged property plus certain escrows and reserves (including letters of credit) held with respect to the mortgage loan. A mortgage loan will cease to be subject to an Appraisal Reduction Amount when it has been brought current for at least three consecutive months, no additional event of default is foreseeable in the reasonable judgment of the applicable special servicer and no other circumstances exist that would cause such mortgage loan or any related companion loan to be a specially serviced loan; however, a “Collateral Deficiency Amount” may exist with respect to any mortgage loan that is modified into an AB loan structure (an “AB Modified Loan”) and remains a corrected mortgage loan and, if so, will generally equal the excess of (i) the stated principal balance of such AB Modified Loan (taking into account the related junior note(s) and any pari passu notes included therein), over (ii) the sum of (in the case of a whole loan, solely to the extent allocable to the subject mortgage loan) (x) the most recent appraised value for the related mortgaged property or mortgaged properties, plus (y) solely to the extent not reflected or taken into account in such appraised value (or in the calculation of any related Appraisal Reduction Amount) and to the extent on deposit with, or otherwise under the control of, the lender as of the date of such determination, any capital or additional collateral contributed by the related borrower at the time the mortgage loan became (and as part of the modification related thereto) such AB Modified Loan for the benefit of the related mortgaged property or mortgaged properties (provided that in the case of an non-serviced mortgage loan, the amounts set forth in this clause (y) will be taken into account solely to the extent relevant information is received by the applicable special servicer), plus (z) any other escrows or reserves (in addition to any amounts set forth in the immediately preceding clause (y) and solely to the extent not reflected or taken into account in the calculation of any related Appraisal Reduction Amount) held by the lender in respect of such AB Modified Loan as of the date of such determination, which such excess, for the avoidance of doubt, will be determined separately from and exclude any related Appraisal Reduction Amounts. As used herein, a “Cumulative Appraisal Reduction Amount” will be the sum of any Appraisal Reduction Amounts and any Collateral Deficiency Amounts. Any Appraisal Reduction Amount in respect of any non-serviced mortgage loan generally will be calculated in accordance with the other servicing agreement pursuant to which such mortgage loan is being serviced, which calculations are expected to be generally similar to those provided for in the pooling and servicing agreement for this transaction. If any mortgage loan is part of a whole loan, any Appraisal Reduction Amount or Collateral Deficiency Amount will (or effectively will) be calculated in respect of such whole loan taken as a whole and allocated, to the extent provided in the related intercreditor agreement and the related pooling and servicing agreement, first, to any related subordinate companion loan, and second, to the related mortgage loan and any pari passu companion loan on a pro rata basis by unpaid principal balance. Appraisal Reduction Amounts will proportionately reduce the interest portion of debt service advances required to be made in respect of the related mortgage loan. Appraisal Reduction Amounts and Collateral Deficiency Amounts will be (i) taken into account in determining the identity of the controlling class entitled to appoint the Directing Certificateholder, the existence of a Control Termination Event or an Operating Advisor Consultation Event and the allocation and/or exercise of voting rights for certain purposes (see “Directing Certificateholder/Controlling Class” above) and (ii) allocated to the following classes of certificates and trust components, in each case to notionally reduce their certificate balances or principal balances until the certificate balance or principal balance of each such class or trust component is notionally reduced to zero: the Class J-RR, Class H-RR, Class G-RR, Class F-RR, Class E-RR and Class D certificates and the Class C, Class B and Class A-S trust components, in that order, and then pro rata to the Class A-2 and Class A-3 trust components. Appraisal Reduction Amounts and Collateral Deficiency Amounts allocated to the Class A-2, Class A-3, Class A-S, Class B or Class C trust component will be allocated to the corresponding classes of Exchangeable Certificates with certificate balances pro rata to notionally reduce their certificate balances in accordance with |
| This is not a research report and was not prepared by any Underwriter’s research department. Please see additional important information and qualifications at the end of this Term Sheet. | ||
| 14 | ||
| BANK5 2024-5YR5 | Structural Overview |
their Class Percentage Interests therein. | |
| Appraised-Out Class: | An “Appraised-Out Class” is any class of Control Eligible Certificates, the certificate balance of which (taking into account the application of any Appraisal Reduction Amounts or Collateral Deficiency Amounts to notionally reduce the certificate balance of such class) has been reduced to less than 25% of its initial certificate balance. Any Appraised-Out Class may not exercise any direction, control, consent and/or similar rights of the Controlling Class until such time, if any, as such class is reinstated as the Controlling Class, and the rights of the Controlling Class will be exercised by the next most senior class of Control Eligible Certificates that is not an Appraised-Out Class, if any, during such period. |
| Appraisal Remedy: | The holders of the majority (by certificate balance) of an Appraised-Out Class (such holders, the “Requesting Holders”) will have the right, at their sole expense, to require the applicable special servicer to order (or, with respect to a non-serviced mortgage loan, require the applicable master servicer to request from the applicable non-serviced special servicer) a second appraisal of any mortgage loan (or serviced whole loan) for which an appraisal reduction event has occurred or as to which there exists a Collateral Deficiency Amount. With respect to any serviced mortgage loan, the applicable special servicer will be required to use its reasonable best efforts to ensure that such appraisal is delivered within 30 days from receipt of the Requesting Holders’ written request and will be required to ensure that such appraisal is prepared on an “as-is” basis by an MAI appraiser. With respect to any non-serviced mortgage loan, the applicable master servicer will be required to use commercially reasonable efforts to obtain such second appraisal from the applicable non-serviced special servicer. In addition, the Requesting Holders of any Appraised-Out Class will have the right to challenge the Appraisal Reduction Amount and to require the applicable special servicer to order an additional appraisal of any serviced mortgage loan as to which there exists a Collateral Deficiency Amount if an event has occurred at, or with respect to, the related mortgaged property or mortgaged properties that would have a material effect on its or their appraised value, and such special servicer is required to use reasonable efforts to obtain an appraisal from an MAI appraiser reasonably acceptable to such special servicer within 30 days from receipt of the Requesting Holders’ written request. Upon receipt of such supplemental appraisal, the applicable master servicer (for any non-serviced mortgage loans) and the applicable special servicer (for any serviced mortgage loans) will be required to determine, in accordance with the Servicing Standard, whether, based on its assessment of such supplemental appraisal, any recalculation of the applicable Appraisal Reduction Amount or Collateral Deficiency Amount is warranted and, if so warranted, such person will be required to recalculate such Appraisal Reduction Amount or Collateral Deficiency Amount, as applicable, based upon such supplemental appraisal as described above. If required by any such recalculation, the applicable Appraised-Out Class will be reinstated as the Controlling Class and each Appraised-Out Class will, if applicable, have its related certificate balance notionally restored to the extent required by such recalculation of the Appraisal Reduction Amount or Collateral Deficiency Amount, if applicable. |
| Sale of Defaulted Loans: | Under certain circumstances the applicable special servicer may be required to use reasonable efforts to solicit offers for a defaulted serviced mortgage loan (and any related companion loan (to the extent provided under the related intercreditor agreement) and/or related REO properties). The Directing Certificateholder will not have a right of first refusal to purchase a defaulted loan. If the applicable special servicer does not receive an offer at least equal to the outstanding principal balance plus all accrued and unpaid interest and outstanding costs and expenses and certain other amounts specified in the pooling and servicing agreement (the “Par Purchase Price”), the applicable special servicer may purchase the defaulted loan or REO property at the Par Purchase Price or may accept the first cash offer received from any person that is determined to be a fair price for such defaulted loan or REO property. If multiple offers are received during the period designated by the applicable special servicer for receipt of offers, such special servicer is generally required to select the highest offer. The applicable special servicer will be required to determine whether any cash offer constitutes a fair price for any defaulted loan or REO property if the highest offeror is a person other than a party to the pooling and servicing agreement for this transaction (the “PSA”), the Directing Certificateholder, any sponsor, any Borrower Party, any independent contractor engaged by a special servicer, the trustee for the securitization of a related companion loan (with respect to a whole loan if it is a defaulted loan), any related companion loan holder or its representative, any holder of a related mezzanine loan or any known affiliate of any of the preceding entities (each, an “Interested Person”). If an offer is made by an Interested Person, the trustee will be required to determine (based upon the most recent appraisal conducted in accordance with the terms of the PSA) whether the offer constitutes a fair price for the defaulted loan or REO property unless (i) the offer is equal to or greater than the applicable Par Purchase Price and (ii) the offer is the highest offer received. Absent an offer at least equal to the Par Purchase Price, no offer from an Interested Person will constitute a fair price unless (x) it is the highest offer received and (y) at least two other offers are received from independent third parties. Neither the trustee nor any of its affiliates may make an offer for or purchase any specially serviced loan or REO property. Notwithstanding any of the foregoing to the contrary, the applicable special servicer is not required to accept the highest offer and may accept a lower offer for a defaulted loan or REO property if such special servicer determines, in accordance with the Servicing Standard (and subject to the requirements of any related intercreditor agreement), that a rejection of such offer would be in the best interests of the certificateholders and any related companion loan holders as a collective whole as if they constituted a single lender (and with respect to a serviced A/B whole loan, taking into account the subordinate nature of any related subordinate companion loan), so long as such lower offer was not made by such special servicer or any of its affiliates. If title to any mortgaged property is acquired by the trust fund, the applicable special servicer will generally be required to sell such mortgaged property prior to the close of the third calendar year beginning after the year of acquisition. |
| This is not a research report and was not prepared by any Underwriter’s research department. Please see additional important information and qualifications at the end of this Term Sheet. | ||
| 15 | ||
| BANK5 2024-5YR5 | Structural Overview |
The foregoing applies to mortgage loans serviced under the PSA. With respect to any non-serviced whole loan, if the special servicer under the applicable pooling and servicing agreement determines to sell the related controlling companion loan if it becomes a defaulted loan, then the applicable special servicer will be required to sell the related whole loan, including the related mortgage loan included in the BANK5 2024-5YR5 securitization trust and the related pari passu companion loan(s) and, under certain circumstances, any subordinate companion loan(s), as a single loan. In connection with any such sale, the special servicer under the applicable pooling and servicing agreement will be required to follow procedures substantially similar to those set forth above. | |
| Appointment and Replacement of each Special Servicer: | The Directing Certificateholder will appoint the initial special servicer as of the closing date. Prior to the occurrence and continuance of a Control Termination Event, any special servicer may generally be replaced by the Directing Certificateholder with or without cause at any time. After the occurrence and during the continuance of a Control Termination Event and upon (a) the written direction of holders of principal balance certificates evidencing not less than 25% of the voting rights of all classes of certificates entitled to principal (taking into account the application of Cumulative Appraisal Reduction Amounts to notionally reduce the certificate balances of classes to which such Cumulative Appraisal Reduction Amounts are allocable) requesting a vote to replace the applicable special servicer with a replacement special servicer, (b) payment by such requesting holders to the certificate administrator of all reasonable fees and expenses to be incurred by the certificate administrator in connection with administering such vote and (c) delivery by such holders of a rating agency confirmation from each applicable rating agency, the certificate administrator will be required to promptly post such notice on its internet website and by mail and conduct the solicitation of votes of all certificates in such regard, which requisite affirmative votes must be received within 180 days of the posting of such notice. Upon the written direction of holders of at least 66 2/3% of a Certificateholder Quorum, the trustee will be required to immediately replace the applicable special servicer with a qualified replacement special servicer designated by such holders of certificates. If the operating advisor determines, in its sole discretion exercised in good faith, that (i) the applicable special servicer is not performing its duties as required under the pooling and servicing agreement or is otherwise not acting in accordance with the Servicing Standard and (ii) the replacement of such special servicer would be in the best interests of the certificateholders as a collective whole, then the operating advisor will have the right to recommend the replacement of such special servicer. The operating advisor’s recommendation to replace such special servicer must be confirmed by an affirmative vote of holders of certificates representing at least a majority of a quorum of certificateholders (which, for this purpose, is the holders of certificates that (i) evidence at least 20% of the voting rights (taking into account the application of any Appraisal Reduction Amounts to notionally reduce the respective certificate balances) of all principal balance certificates on an aggregate basis and (ii) consist of at least three certificateholders or certificate owners that are not “affiliated with” (as defined in Regulation RR) each other). A “Certificateholder Quorum” means, in connection with any solicitation of votes in connection with the replacement of a special servicer or the asset representations reviewer, the holders of certificates evidencing at least 50% of the aggregate voting rights (taking into account the application of realized losses and, other than with respect to the termination of the asset representations reviewer, any Cumulative Appraisal Reduction Amounts to notionally reduce the certificate balance of the certificates) of all classes of certificates entitled to principal on an aggregate basis. With respect to each serviced whole loan, any holder of a related pari passu companion loan, following a servicer termination event with respect to the applicable special servicer that affects such holder, will be entitled to direct the trustee (and the trustee will be required) to terminate such special servicer solely with respect to such serviced whole loan. A replacement special servicer will be selected by the trustee or, prior to a Control Termination Event, by the Directing Certificateholder; provided, that any successor special servicer appointed to replace the special servicer with respect to such whole loan cannot be the entity (or its affiliate) that was terminated at the direction of the holder of the related pari passu companion loan. Notwithstanding any of the foregoing to the contrary, with respect to each servicing shift whole loan and any serviced A/B whole loans as to which a subordinate companion loan holder is the related controlling note holder, the holder of the related control note will be entitled to replace the applicable special servicer with respect to such whole loan at any time, with or without cause, and while it is a serviced whole loan, no other party may replace the applicable special servicer for such whole loan unless there is a servicer termination event with respect thereto. With respect to any non-serviced whole loan, subject to conditions or restrictions in the applicable intercreditor agreement, the BANK5 2024-5YR5 trust, as holder of the related mortgage loan, has the right to terminate the applicable special servicer under the related pooling and servicing agreement if a servicer termination event occurs with respect to such special servicer that affects the trust in its capacity as such holder. Such rights may be exercised by the Directing Certificateholder prior to a Consultation Termination Event (or the applicable special servicer, following the occurrence and during the continuance of a Consultation Termination Event). The successor special servicer will be selected pursuant to the applicable pooling and servicing agreement by the related directing holder prior to a control termination event under such pooling and servicing agreement. |
| Servicing Standard: | Each applicable master servicer and each applicable special servicer is obligated to service and administer the mortgage loans (and, if applicable, the serviced companion loans) in accordance with the definition of the “Servicing Standard” described in the Preliminary Prospectus and the terms of the pooling and servicing agreement, provided that each non-serviced mortgage loan, if any, will be serviced by another master servicer or special servicer under the pooling and servicing agreement with respect to the securitization of a related |
| This is not a research report and was not prepared by any Underwriter’s research department. Please see additional important information and qualifications at the end of this Term Sheet. | ||
| 16 | ||
| BANK5 2024-5YR5 | Structural Overview |
| companion loan, which entities will be obligated to service and administer such non-serviced mortgage loan pursuant to a similar standard set forth in the related pooling and servicing agreement. | |
| Excluded Special Servicer: | If a special servicer obtains knowledge that it has become a Borrower Party with respect to any mortgage loan (an “Excluded Special Servicer Loan”), such special servicer will be required to resign as special servicer of that Excluded Special Servicer Loan. Prior to the occurrence and continuance of a Control Termination Event, the Directing Certificateholder will be required to appoint (and may remove and replace with or without cause) a separate special servicer that is not a Borrower Party (an “Excluded Special Servicer”) with respect to any Excluded Special Servicer Loan, unless such Excluded Special Servicer Loan is also an Excluded Loan with respect to the Directing Certificateholder or the holder of the majority of the Controlling Class. At any time after the occurrence and during the continuance of a Control Termination Event, or if at any time the applicable Excluded Special Servicer Loan is also an Excluded Loan with respect to the Directing Certificateholder or the holder of the majority of the Controlling Class or if the Directing Certificateholder is entitled to appoint the Excluded Special Servicer but does not so appoint a replacement special servicer within 30 days of notice of such resignation, the resigning special servicer will be required to use reasonable efforts to select the related Excluded Special Servicer. Any Excluded Special Servicer will be required to perform all of the obligations of the applicable special servicer and will be entitled to all special servicing compensation with respect to such Excluded Special Servicer Loan earned while the related mortgage loan is an Excluded Special Servicer Loan. |
| Liquidated Loan Waterfall: | On liquidation of any mortgage loan, all net liquidation proceeds related to the mortgage loan (but not any related companion loan) will be applied so that amounts allocated as a recovery of accrued and unpaid interest will not, in the first instance, include any delinquent interest that was not advanced as a result of Appraisal Reduction Amounts (or would not have been advanced in the absence of a non-recoverability determination) or accrued on the portion of the stated principal balance thereof equal to any related Collateral Deficiency Amount in effect from time to time and as to which no advance was made (collectively, the “Subordinated Interest Amount”). After the adjusted interest amount is so allocated, any remaining liquidation proceeds will be allocated to pay principal on the mortgage loan until the unpaid principal amount of the mortgage loan has been reduced to zero. Any remaining liquidation proceeds will then be allocated to pay the Subordinated Interest Amount. |
| Operating Advisor: | The operating advisor will have certain review and consultation rights relating to the performance of the applicable special servicer and with respect to its actions taken in connection with the resolution and/or liquidation of specially serviced loans. With respect to each serviced mortgage loan or serviced whole loan, the operating advisor will be responsible for: ● reviewing the actions of the applicable special servicer with respect to any specially serviced loan; ● reviewing (i) all reports by the applicable special servicer made available to privileged persons that are posted on the certificate administrator’s website that are relevant to the operating advisor’s obligations under the PSA and (ii) each asset status report (after the occurrence and during the continuance of an Operating Advisor Consultation Event) and final asset status report; ● reviewing for accuracy and consistency with the PSA the mathematical calculations by the applicable special servicer and the corresponding application of the non-discretionary portion of the applicable formulas required to be utilized in connection with (1) any Appraisal Reduction Amount or Collateral Deficiency Amount (if such special servicer has calculated any such Appraisal Reduction Amount or Collateral Deficiency Amount) and (2) any net present value calculations used in the special servicer’s determination of what course of action to take in connection with the workout or liquidation of a specially serviced loan; and ● preparing an annual report (if any serviced mortgage loan or serviced whole loan was a specially serviced loan at any time during the prior calendar year or if the operating advisor was entitled to consult with the applicable special servicer with respect to any major decision during the prior calendar year) that sets forth whether the operating advisor believes, in its sole discretion exercised in good faith, that the applicable special servicer is operating in compliance with the Servicing Standard with respect to its performance of its duties under the PSA with respect to specially serviced loans (and, after the occurrence and continuance of an Operating Advisor Consultation Event, with respect to major decisions on non-specially serviced loans) during the prior calendar year on an “asset-level basis”. The operating advisor will be required to identify (1) which, if any, standards the operating advisor believes, in its sole discretion exercised in good faith, such special servicer has failed to comply with and (2) any material deviations from such special servicer’s obligations under the PSA with respect to the resolution or liquidation of any specially serviced loan or REO property (other than with respect to any REO property related to any non-serviced mortgage loan). In preparing any operating advisor annual report, the operating advisor will not be required to report on instances of non-compliance with, or deviations from, the Servicing Standard or the special servicer’s obligations under the PSA that the operating advisor determines, in its sole discretion exercised in good faith, to be immaterial. With respect to each serviced mortgage loan or serviced whole loan, after the operating advisor has received notice that an Operating Advisor Consultation Event has occurred and is continuing, in addition to the duties described above, the operating advisor will be required to perform the following additional duties: ● to consult (on a non-binding basis) with the applicable special servicer in respect of asset status reports; and ● to consult (on a non-binding basis) with the applicable special servicer with respect to major decisions processed by such special servicer. |
| This is not a research report and was not prepared by any Underwriter’s research department. Please see additional important information and qualifications at the end of this Term Sheet. | ||
| 17 | ||
| BANK5 2024-5YR5 | Structural Overview |
An “Operating Advisor Consultation Event” will occur when either (i) the aggregate certificate balance of the Class E-RR, Class F-RR, Class G-RR, Class H-RR and Class J-RR certificates (taking into account the application of any Cumulative Appraisal Reduction Amounts to notionally reduce the certificate balances of such classes) is 25% or less of the initial aggregate certificate balance of such portions of such classes or (ii) a Control Termination Event has occurred and is continuing. | |
| Asset Representations Reviewer: | The asset representations reviewer will be required to review certain delinquent mortgage loans after a specified delinquency threshold has been met and the required percentage of certificateholders vote to direct a review as described below. The asset representations reviewer will be entitled to the Asset Representations Reviewer Fee with respect to such review. See “Pooling and Servicing Agreement—The Asset Representations Reviewer” in the Preliminary Prospectus. The certificate administrator will be required to notify certificateholders if the specified delinquency threshold has been met as described in the Preliminary Prospectus under “—The Asset Representations Reviewer”. If certificateholders evidencing not less than 5.0% of the voting rights request a vote to commence an asset review, and if subsequently (i) a majority of those certificateholders who cast votes and (ii) a majority of an Asset Review Quorum authorizes an asset review within 150 days of the request for a vote, the asset representations reviewer will be required to conduct an asset review of delinquent loans. The asset representations reviewer may be terminated and replaced without cause. Upon (i) the written direction of certificateholders evidencing not less than 25% of the voting rights (without regard to the application of any Cumulative Appraisal Reduction Amounts) requesting a vote to terminate and replace the asset representations reviewer with a proposed successor asset representations reviewer that is an eligible asset representations reviewer, and (ii) payment by such holders to the certificate administrator of the reasonable fees and expenses to be incurred by the certificate administrator in connection with administering such vote, the certificate administrator will be required to promptly provide notice to all certificateholders and the asset representations reviewer of such request by posting such notice on its internet website, and by mailing such notice to all certificateholders and the asset representations reviewer. Upon the written direction of certificateholders evidencing at least 75% of a Certificateholder Quorum (without regard to the application of any Cumulative Appraisal Reduction Amounts), the trustee will be required to terminate all of the rights and obligations of the asset representations reviewer under the pooling and servicing agreement (other than any rights or obligations that accrued prior to the date of such termination and other than indemnification rights arising out of events occurring prior to such termination) by written notice to the asset representations reviewer, and the proposed successor asset representations reviewer will be appointed. See “Pooling and Servicing Agreement—The Asset Representations Reviewer” in the Preliminary Prospectus. An “Asset Review Quorum” means, in connection with any solicitation of votes to authorize an Asset Review as described above, the holders of certificates evidencing at least 5.0% of the aggregate voting rights represented by all certificates that have voting rights. |
| Dispute Resolution Provisions: | The mortgage loan sellers will be subject to the dispute resolution provisions set forth in the PSA to the extent those provisions are triggered with respect to any mortgage loan sold to the depositor by a mortgage loan seller, and such mortgage loan seller will be obligated under the related mortgage loan purchase agreement to comply with all applicable provisions and to take part in any mediation or arbitration proceedings that may result. Generally, in the event that a Repurchase Request is not “Resolved” within 180 days after the related mortgage loan seller receives such Repurchase Request, then the enforcing servicer will be required to send a notice to the first certificateholder (or beneficial owner) to deliver a certificateholder repurchase request with respect to the mortgage loan (the “Initial Requesting Certificateholder”) (if any) and to the certificate administrator (which will be required to make such notice available to certificateholders via the certificate administrator’s website) indicating the enforcing servicer’s intended course of action with respect to the Repurchase Request. If (a) the enforcing servicer’s intended course of action with respect to the Repurchase Request does not involve pursuing further action to exercise rights against the related mortgage loan seller with respect to the Repurchase Request and the Initial Requesting Certificateholder, if any, or any other certificateholder, or certificate owner wishes to exercise its right to refer the matter to mediation (including non-binding arbitration) or arbitration, or (b) the enforcing servicer’s intended course of action is to pursue further action to exercise rights against the related mortgage loan seller with respect to the Repurchase Request but the Initial Requesting Certificateholder, if any, or any other certificateholder or certificate owner does not agree with the dispute resolution method selected by the enforcing servicer, then the Initial Requesting Certificateholder, if any, or such other certificateholder or certificate owner may deliver a written notice to the enforcing servicer indicating its intent to exercise its right to refer the matter to either mediation or arbitration. “Resolved” means, with respect to a Repurchase Request, (i) that the related material defect or breach has been cured, (ii) the related mortgage loan has been repurchased in accordance with the related mortgage loan purchase agreement, (iii) a mortgage loan has been substituted for the related mortgage loan in accordance with the related mortgage loan purchase agreement, (iv) the applicable mortgage loan seller has made a loss of value payment, (v) a contractually binding agreement has been entered into between the enforcing servicer, on behalf of the issuing entity, and the related mortgage loan seller that settles the related mortgage loan seller’s obligations under the related mortgage loan purchase agreement, or (vi) the related mortgage loan is no longer property of the issuing entity as a result of a sale or other disposition in accordance with the pooling and servicing agreement. See “Pooling and Servicing Agreement—Dispute Resolution Provisions” in the Preliminary Prospectus. |
| Investor Communications: | The certificate administrator is required to include on any Form 10-D any request received from a certificateholder to communicate with other certificateholders related to certificateholders exercising their rights under the terms of the PSA. Any certificateholder wishing to communicate with other certificateholders regarding the exercise of its rights under the terms of the PSA will be able to deliver a written request signed by an |
| This is not a research report and was not prepared by any Underwriter’s research department. Please see additional important information and qualifications at the end of this Term Sheet. | ||
| 18 | ||
| BANK5 2024-5YR5 | Structural Overview |
| authorized representative of the requesting investor to the certificate administrator. | |
| Deal Website: | The certificate administrator will be required to maintain a deal website which will include, among other items: (a) summaries of asset status reports prepared by a special servicer, (b) inspection reports, (c) appraisals, (d) various “special notices” described in the Preliminary Prospectus, (e) the “Investor Q&A Forum” and (f) a voluntary “Investor Registry”. Investors may access the deal website following execution of a certification and confidentiality agreement. |
| This is not a research report and was not prepared by any Underwriter’s research department. Please see additional important information and qualifications at the end of this Term Sheet. | ||
| 19 | ||
| BANK5 2024-5YR5 | Collateral Overview |
| Mortgage Loan Sellers | No. of Mortgage Loans | No. of Mortgaged Properties | Aggregate Cut-off Date Balance | % of Pool(1) |
| Morgan Stanley Mortgage Capital Holdings LLC | 10 | 11 | $200,175,000 | 38.6% |
| Wells Fargo Bank, National Association | 5 | 5 | $150,775,000 | 29.1% |
| JPMorgan Chase Bank, National Association | 3 | 3 | $113,200,000 | 21.8% |
| Bank of America, National Association | 6 | 6 | $54,450,000 | 10.5% |
| Total: | 24 | 25 | $518,600,000 | 100.0% |
Pool Statistics
| Aggregate Cut-off Date Balance: | $518,600,000 |
| Number of Mortgage Loans: | 24 |
| Average Cut-off Date Balance per Mortgage Loan: | $21,608,333 |
| Number of Mortgaged Properties: | 25 |
| Average Cut-off Date Balance per Mortgaged Property: | $20,744,000 |
| Weighted Average Mortgage Rate: | 7.0252% |
| % of Pool Secured by 5 Largest Mortgage Loans: | 46.4% |
| % of Pool Secured by 10 Largest Mortgage Loans: | 73.5% |
| % of Pool Secured by ARD Loans: | 0.0% |
| Weighted Average Original Term to Maturity (months): | 60 |
| Weighted Average Remaining Term to Maturity (months): | 59 |
| Weighted Average Seasoning (months): | 1 |
| % of Pool Secured by Single Tenant Mortgaged Properties: | 14.2% |
| % of Pool Secured by Refinance Loans: | 92.6% |
| % of Pool Secured by Acquisition Loans: | 6.4% |
| % of Pool Secured by Recapitalization Loans: | 1.0% |
Additional Debt
| % of Pool with Pari Passu Mortgage Debt: | 43.3% |
| % of Pool with Subordinate Debt: | 0.0% |
| % of Pool with Mezzanine Mortgage Debt: | 9.6% |
Credit Statistics(2)
| Weighted Average UW NOI DSCR: | 1.88x |
| Weighted Average UW NOI Debt Yield: | 13.3% |
| Weighted Average UW NCF DSCR: | 1.80x |
| Weighted Average UW NCF Debt Yield: | 12.7% |
| Weighted Average Cut-off Date LTV Ratio(3): | 50.9% |
| Weighted Average Maturity Date LTV Ratio(3): | 50.9% |
Footnotes are set forth on the following page.
| This is not a research report and was not prepared by any Underwriter’s research department. Please see additional important information and qualifications at the end of this Term Sheet. | ||
| 20 | ||
| BANK5 2024-5YR5 | Collateral Overview |
Amortization
| Weighted Average Original Amortization Term (months)(4): | NAP |
| Weighted Average Remaining Amortization Term (months)(4): | NAP |
| % of Pool Interest Only through Maturity: | 100.0% |
| % of Pool Amortizing Balloon: | 0.0% |
| % of Pool Interest Only, Amortizing Balloon: | 0.0% |
Lockboxes
| % of Pool with Hard Lockboxes: | 74.9% |
| % of Pool with Springing Lockboxes: | 23.2% |
| % of Pool with No Lockboxes: | 1.9% |
Reserves
| % of Pool Requiring Tax Reserves: | 49.4% |
| % of Pool Requiring Insurance Reserves: | 20.9% |
| % of Pool Requiring Replacement Reserves: | 74.3% |
| % of Pool Requiring TI/LC Reserves(5): | 67.1% |
Call Protection
| % of Pool with lockout period, followed by defeasance until open period: | 59.6% |
| % of Pool with lockout period, followed by the greater of a prepayment premium and yield maintenance until open period: | 24.4% |
| % of Pool with lockout period, followed by defeasance or the greater of a prepayment premium and yield maintenance until open period: | 16.0% |
| (1) | Unless otherwise indicated, all references to “% of Pool” in this Term Sheet reflect a percentage of the aggregate principal balance of the mortgage pool as of the Cut-off Date, after application of all payments of principal due during or prior to February 2024. |
| (2) | With respect to any mortgage loan that is part of a whole loan, unless otherwise indicated, all LTV, DSCR and Debt Yield calculations in this Term Sheet include any related pari passu companion loans and exclude any subordinate companion loans and/or mezzanine loans, as applicable. Additionally, LTV, DSCR and Debt Yield figures in this Term Sheet are calculated for mortgage loans without regard to any additional indebtedness that may be incurred at a future date. For mortgaged properties securing residential cooperative mortgage loans all LTV, DSCR and Debt Yield calculations do not take into account any subordinate debt (whether or not secured by the related mortgaged property), that currently exists or is allowed under the terms of any mortgage loan. |
| (3) | The LTV ratios set forth in this Term Sheet are generally based on the “as-is” values of the related mortgaged properties; provided that the “as-is” value for a portfolio of mortgaged properties may include a premium relating to the valuation of the mortgaged properties as a whole rather than as the sum of individually valued mortgaged properties; provided, further, that such LTV ratios may be based on “as-stabilized”, “as complete” or other contingent values in certain cases in which reserves have been established at origination for the applicable condition or circumstance that is expected to result in stabilization provided, further, that such LTV ratios may have been calculated based on a principal balance that is net of a holdback or earnout reserve. See the definition of “Appraised Value” under “Description of the Mortgage Pool—Certain Calculations and Definitions” in the Preliminary Prospectus. |
| (4) | Excludes mortgage loans that provide for payments of interest only through the related maturity date or anticipated repayment date, as applicable. |
| (5) | Excludes multifamily, self storage, and hospitality properties. |
| This is not a research report and was not prepared by any Underwriter’s research department. Please see additional important information and qualifications at the end of this Term Sheet. | ||
| 21 | ||
| BANK5 2024-5YR5 | Characteristics of the Mortgage Loans |
| Top 10 Mortgage Loans(1) | |||||||||||||
| Loan No. | Mortgage Loan Seller | Property Name | City | State | Property Type | Cut-off Date Balance | % of Pool | SF/Rooms | Cut-off Date Balance per SF/Room | UW NCF DSCR | UW NOI Debt Yield | Cut-off Date LTV | Maturity Date LTV |
| 1 | JPMCB | Tysons Corner Center | McLean | VA | Retail | $51,500,000 | 9.9% | 1,793,638 | $395.84 | 2.00x | 13.7% | 39.4% | 39.4% |
| 2 | WFB | 11755 Wilshire | Los Angeles | CA | Office | $51,500,000 | 9.9% | 337,440 | $207.44 | 1.80x | 14.1% | 42.7% | 42.7% |
| 3 | JPMCB | Nvidia Santa Clara | Santa Clara | CA | Mixed Use | $50,000,000 | 9.6% | 551,233 | $235.83 | 2.01x | 14.1% | 41.5% | 41.5% |
| 4 | MSMCH | Sun Center Plaza | Columbus | OH | Retail | $47,500,000 | 9.2% | 308,391 | $154.03 | 1.30x | 10.1% | 67.9% | 67.9% |
| 5 | MSMCH | 33 West State Street and 50 East State Street | Trenton | NJ | Office | $40,000,000 | 7.7% | 473,622 | $190.02 | 1.50x | 11.3% | 65.1% | 65.1% |
| 6 | WFB | Center Of Waikiki | Honolulu | HI | Retail | $36,750,000 | 7.1% | 70,324 | $522.58 | 2.68x | 19.5% | 26.8% | 26.8% |
| 7 | WFB | Timber Creek Crossing | Dallas | TX | Retail | $31,625,000 | 6.1% | 474,026 | $121.30 | 1.61x | 10.2% | 61.1% | 61.1% |
| 8 | MSMCH | Element Hotel Detroit | Detroit | MI | Hospitality | $24,300,000 | 4.7% | 110 | $220,909.09 | 1.65x | 14.8% | 54.6% | 54.6% |
| 9 | MSMCH | Appling Farms Corporate Park | Memphis | TN | Industrial | $24,200,000 | 4.7% | 297,292 | $81.40 | 1.51x | 11.9% | 55.8% | 55.8% |
| 10 | BANA | The Haier Building | New York | NY | Mixed Use | $23,750,000 | 4.6% | 58,500 | $405.98 | 1.47x | 11.6% | 55.2% | 55.2% |
| Total/Wtd. Avg. | $381,125,000 | 73.5% | 1.78x | 13.2% | 50.0% | 50.0% | |||||||
| (1) | With respect to any mortgage loan that is part of a whole loan, unless otherwise indicated, all LTV, DSCR, Debt Yield and Balance per SF/Room calculations in this Term Sheet include any related pari passu companion loans and exclude any subordinate companion loans and/or mezzanine loans, as applicable. Additionally, LTV, DSCR, Debt Yield and Balance per SF/Room figures in this Term Sheet are calculated for mortgage loans without regard to any additional indebtedness that may be incurred at a future date. |
| This is not a research report and was not prepared by any Underwriter’s research department. Please see additional important information and qualifications at the end of this Term Sheet. | ||
| 22 | ||
| BANK5 2024-5YR5 | Characteristics of the Mortgage Loans |
| Mortgage Loans with Pari Passu Companion Loans | ||||||||||||
| Loan No. | Mortgage Loan Seller | Property Name | Mortgage Loan Cut-off Date Balance | Aggregate Pari Passu Companion Loan Cut-off Date Balance | Combined Cut-off Date Balance | Lead Servicing Agreement | Master Servicer | Special Servicer | Control Rights | Combined UW NCF DSCR(1) | Combined UW NOI Debt Yield(1) | Combined Cut-off Date LTV(1) |
| 1 | JPMCB | Tysons Corner Center | $51,500,000 | $658,500,000 | $710,000,000 | TYSN 2023-CRNR | Berkadia | Situs | TYSN 2023-CRNR | 2.00x | 13.7% | 39.4% |
| 2 | WFB | 11755 Wilshire | $51,500,000 | $18,500,000 | $70,000,000 | BANK5 2024-5YR5 | Wells Fargo | K-Star | BANK5 2024-5YR5 | 1.80x | 14.1% | 42.7% |
| 3 | JPMCB | Nvidia Santa Clara | $50,000,000 | $80,000,000 | $130,000,000 | BANK5 2023-5YR4 | Wells Fargo(2) | KeyBank | BANK5 2023-5YR4 | 2.01x | 14.1% | 41.5% |
| 5 | MSMCH | 33 West State Street and 50 East State Street | $40,000,000 | $50,000,000 | $90,000,000 | BMO 2024-5C3 | Wells Fargo | Greystone | BMO 2024-5C3 | 1.50x | 11.3% | 65.1% |
| 7 | WFB | Timber Creek Crossing | $31,625,000 | $25,875,000 | $57,500,000 | BANK5 2024-5YR5 | Wells Fargo | K-Star | BANK5 2024-5YR5 | 1.61x | 10.2% | 61.1% |
| (1) | DSCR, Debt Yield and LTV calculations include any related pari passu companion loans and exclude any subordinate companion loans and/or mezzanine loans, as applicable. |
| (2) | The primary servicer for the Nvidia Santa Clara mortgage loan is Midland Loan Services, a Division of PNC Bank, National Association. |
| Mortgage Loans with Mezzanine Debt | |||||||||||
| Loan No. | Mortgage Loan Seller | Property Name | Mortgage Loan Cut-off Date Balance | Cut-off Date Balance per SF | Mezzanine Debt Cut-off Date Balance | UW NCF DSCR | UW NOI Debt Yield | Cut-off Date LTV | Total Debt UW NCF DSCR(1) | Total Debt UW NOI Debt Yield(1) | Total Debt Cut-off Date LTV(1) |
| 3 | JPMCB | Nvidia Santa Clara | $50,000,000 | $235.83 | $50,500,000 | 2.01x | 14.1% | 41.5% | 1.26x | 10.2% | 57.6% |
| (1) | Total Debt UW NCF DSCR, Total Debt UW NOI Debt Yield and Total Debt Cut-off Date LTV figures shown above are calculated based on any related pari passu notes, any related subordinate note(s) and the mezzanine debt. |
| This is not a research report and was not prepared by any Underwriter’s research department. Please see additional important information and qualifications at the end of this Term Sheet. | ||
| 23 | ||
| BANK5 2024-5YR5 | Characteristics of the Mortgage Loans |
| Prior Securitization History(1) | ||||||||||||||
| Loan No. | Mortgage Loan Seller | Property Name | City | State | Property Type | Cut-off Date Balance | % of Pool | SF/Units | Cut-off Date Balance per SF/Unit | UW NCF DSCR | UW NOI Debt Yield | Cut-off Date LTV | Maturity Date LTV | Prior Securitization |
| 3 | JPMCB | Nvidia Santa Clara | Santa Clara | CA | Mixed Use | $50,000,000 | 9.6% | 551,233 | $235.83 | 2.01x | 14.1% | 41.5% | 41.5% | NCMS 2018-TECH |
| 10 | BANA | The Haier Building | New York | NY | Mixed Use | $23,750,000 | 4.6% | 58,500 | $405.98 | 1.47x | 11.6% | 55.2% | 55.2% | GSMS 2014-GC18 |
| 12 | MSMCH | Coral Walk | Cape Coral | FL | Retail | $20,250,000 | 3.9% | 115,753 | $174.94 | 1.31x | 10.5% | 67.5% | 67.5% | WFRBS 2014-LC14 |
| 14 | BANA | Sierra Commons Shopping Center | Palmdale | CA | Retail | $12,750,000 | 2.5% | 104,811 | $121.65 | 1.44x | 10.9% | 51.4% | 51.4% | WFRBS 2013-C17 |
| 18 | BANA | Westbank Village Shopping Center | Harvey | LA | Retail | $8,050,000 | 1.6% | 93,963 | $85.67 | 1.28x | 12.9% | 54.0% | 54.0% | COMM 2013-CR12 |
| 21 | BANA | US Storage Centers - Simi Valley, CA | Simi Valley | CA | Self Storage | $4,700,000 | 0.9% | 60,240 | $78.02 | 4.03x | 26.8% | 24.1% | 24.1% | MSBAM 2014-C15 |
| 23 | BANA | US Storage Centers - Harbor City Frampton, CA | Harbor City | CA | Self Storage | $3,400,000 | 0.7% | 47,543 | $71.51 | 4.61x | 31.0% | 21.7% | 21.7% | MSBAM 2014-C15 |
| 24 | BANA | US Storage Centers - Vernon, CA | Vernon | CA | Self Storage | $1,800,000 | 0.3% | 40,571 | $44.37 | 7.01x | 47.4% | 14.8% | 14.8% | MSBAM 2014-C15 |
| Total | $124,700,000 | 24.0% | ||||||||||||
| (1) | Includes mortgage loans for which all or a portion of the previously existing debt was most recently securitized in conduit securitizations, based on information provided by the related borrower or obtained through searches of a third-party database. The information has not otherwise been confirmed by the mortgage loan sellers. With respect to any mortgage loan that is part of a whole loan, unless otherwise indicated, all LTV, DSCR, Debt Yield and Cut-off Date Balance per SF/Unit calculations include any related pari passu companion loans and exclude any related subordinate companion loans and/or mezzanine loans, as applicable. |
| This is not a research report and was not prepared by any Underwriter’s research department. Please see additional important information and qualifications at the end of this Term Sheet. | ||
| 24 | ||
| BANK5 2024-5YR5 | Characteristics of the Mortgage Loans |
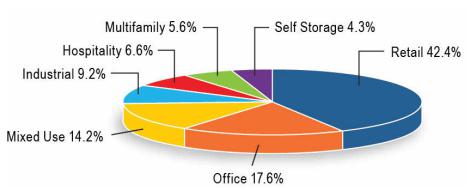
| Property Type Distribution(1) | ||||||||
| Property Type | Number of Mortgaged Properties | Aggregate Cut-off Date Balance | % of Pool | Wtd. Avg. Mortgage Rate | Wtd. Avg. UW NCF DSCR | Wtd. Avg. UW NOI Debt Yield | Wtd. Avg. Cut-off Date LTV | Wtd. Avg. Maturity Date LTV |
| Retail | 8 | $220,125,000 | 42.4% | 6.8984% | 1.75x | 12.8% | 51.7% | 51.7% |
| Anchored | 7 | $168,625,000 | 32.5% | 6.9894% | 1.67x | 12.5% | 55.4% | 55.4% |
| Super Regional Mall | 1 | $51,500,000 | 9.9% | 6.6006% | 2.00x | 13.7% | 39.4% | 39.4% |
| Office | 3 | $91,500,000 | 17.6% | 7.1665% | 1.67x | 12.9% | 52.5% | 52.5% |
| CBD | 3 | $91,500,000 | 17.6% | 7.1665% | 1.67x | 12.9% | 52.5% | 52.5% |
| Mixed Use | 2 | $73,750,000 | 14.2% | 7.1125% | 1.84x | 13.3% | 45.9% | 45.9% |
| Office/Lab | 1 | $50,000,000 | 9.6% | 6.8761% | 2.01x | 14.1% | 41.5% | 41.5% |
| Event Space/Office | 1 | $23,750,000 | 4.6% | 7.6100% | 1.47x | 11.6% | 55.2% | 55.2% |
| Industrial | 2 | $47,600,000 | 9.2% | 7.3007% | 1.70x | 13.6% | 48.7% | 48.7% |
| Flex | 1 | $24,200,000 | 4.7% | 7.0500% | 1.51x | 11.9% | 55.8% | 55.8% |
| R&D/Flex | 1 | $23,400,000 | 4.5% | 7.5600% | 1.89x | 15.4% | 41.3% | 41.3% |
| Hospitality | 2 | $34,300,000 | 6.6% | 7.6447% | 1.74x | 14.9% | 56.9% | 56.9% |
| Extended Stay | 2 | $34,300,000 | 6.6% | 7.6447% | 1.74x | 14.9% | 56.9% | 56.9% |
| Multifamily | 3 | $28,800,000 | 5.6% | 6.3711% | 1.42x | 9.3% | 62.2% | 62.2% |
| Mid Rise | 2 | $24,600,000 | 4.7% | 6.2979% | 1.44x | 9.4% | 61.1% | 61.1% |
| Garden | 1 | $4,200,000 | 0.8% | 6.8000% | 1.28x | 9.2% | 68.9% | 68.9% |
| Self Storage | 5 | $22,525,000 | 4.3% | 6.7159% | 3.41x | 23.3% | 34.2% | 34.2% |
| Self Storage | 5 | $22,525,000 | 4.3% | 6.7159% | 3.41x | 23.3% | 34.2% | 34.2% |
| Total/Wtd. Avg. | 25 | $518,600,000 | 100.0% | 7.0252% | 1.80x | 13.3% | 50.9% | 50.9% |
| (1) | All numerical information concerning the mortgage loans is approximate and, in the case of mortgage loans secured by multiple properties, is based on allocated loan amounts with respect to such properties. All weighted average information regarding the mortgage loans reflects the weighting of the mortgage loans based on their outstanding principal balances as of the Cut-off Date or, in the case of mortgage loans secured by multiple properties, allocated loan amounts. The sum of numbers and percentages in columns may not match the “Total” due to rounding. With respect to any mortgage loan that is part of a whole loan, unless otherwise indicated, all LTV, DSCR and Debt Yield calculations include any related pari passu companion loans and exclude any related subordinate companion loans and/or mezzanine loans, as applicable. For mortgaged properties securing residential cooperative mortgage loans, the UW NCF DSCR and UW NOI Debt Yield for each such mortgaged property is calculated using underwritten net operating income or underwritten net cash flow, as applicable, for the related residential cooperative property which is the projected net operating income or net cash flow, as applicable, reflected in the most recent appraisal obtained by or otherwise in the possession of the related mortgage loan seller as of the Cut-off Date. LTV calculations are based upon the appraised value of the residential cooperative property determined as if such residential cooperative property is operated as a residential cooperative, inclusive of the amount of the underlying debt encumbering such residential cooperative property. The UW NCF DSCR, UW NOI Debt Yield and LTV calculations do not take into account any subordinate debt (whether or not secured by the related mortgaged property), that currently exists or is allowed under the terms of any mortgage loan. |
| This is not a research report and was not prepared by any Underwriter’s research department. Please see additional important information and qualifications at the end of this Term Sheet. | ||
| 25 | ||
| BANK5 2024-5YR5 | Characteristics of the Mortgage Loans |

| Geographic Distribution(1) | ||||||||
| State or Other Jurisdiction | Number of Mortgaged Properties | Aggregate Cut-off Date Balance | % of Pool | Wtd. Avg. Mortgage Rate | Wtd. Avg. UW NCF DSCR | Wtd. Avg. UW NOI Debt Yield | Wtd. Avg. Cut-off Date LTV | Wtd. Avg. Maturity Date LTV |
| California | 6 | $124,150,000 | 23.9% | 6.9125% | 2.08x | 15.2% | 41.4% | 41.4% |
| California – Southern(2) | 5 | $74,150,000 | 14.3% | 6.9370% | 2.13x | 15.9% | 41.4% | 41.4% |
| California – Northern(2) | 1 | $50,000,000 | 9.6% | 6.8761% | 2.01x | 14.1% | 41.5% | 41.5% |
| Texas | 3 | $53,325,000 | 10.3% | 6.5885% | 1.62x | 11.3% | 61.9% | 61.9% |
| Virginia | 1 | $51,500,000 | 9.9% | 6.6006% | 2.00x | 13.7% | 39.4% | 39.4% |
| Ohio | 1 | $47,500,000 | 9.2% | 6.9700% | 1.30x | 10.1% | 67.9% | 67.9% |
| New Jersey | 3 | $45,125,000 | 8.7% | 7.2841% | 1.75x | 13.0% | 60.1% | 60.1% |
| New York | 2 | $37,250,000 | 7.2% | 7.2113% | 1.50x | 11.2% | 57.3% | 57.3% |
| Hawaii | 1 | $36,750,000 | 7.1% | 6.9760% | 2.68x | 19.5% | 26.8% | 26.8% |
| Michigan | 1 | $24,300,000 | 4.7% | 7.9800% | 1.65x | 14.8% | 54.6% | 54.6% |
| Tennessee | 1 | $24,200,000 | 4.7% | 7.0500% | 1.51x | 11.9% | 55.8% | 55.8% |
| Minnesota | 1 | $23,400,000 | 4.5% | 7.5600% | 1.89x | 15.4% | 41.3% | 41.3% |
| Florida | 1 | $20,250,000 | 3.9% | 7.2600% | 1.31x | 10.5% | 67.5% | 67.5% |
| Illinois | 1 | $11,100,000 | 2.1% | 6.0400% | 1.30x | 8.1% | 61.0% | 61.0% |
| Louisiana | 1 | $8,050,000 | 1.6% | 9.0430% | 1.28x | 12.9% | 54.0% | 54.0% |
| North Carolina | 1 | $7,500,000 | 1.4% | 6.9640% | 1.40x | 10.0% | 60.0% | 60.0% |
| Arizona | 1 | $4,200,000 | 0.8% | 6.8000% | 1.28x | 9.2% | 68.9% | 68.9% |
| Total/Wtd. Avg. | 25 | $518,600,000 | 100.0% | 7.0252% | 1.80x | 13.3% | 50.9% | 50.9% |
| (1) | All numerical information concerning the mortgage loans is approximate and, in the case of mortgage loans secured by multiple properties, is based on allocated loan amounts with respect to such properties. All weighted average information regarding the mortgage loans reflects the weighting of the mortgage loans based on their outstanding principal balances as of the Cut-off Date or, in the case of mortgage loans secured by multiple properties, allocated loan amounts. The sum of numbers and percentages in columns may not match the “Total” due to rounding. With respect to any mortgage loan that is part of a whole loan, unless otherwise indicated, all LTV, DSCR and Debt Yield calculations include any related pari passu companion loans and exclude any related subordinate companion loans and/or mezzanine loans, as applicable. For mortgaged properties securing residential cooperative mortgage loans, the UW NCF DSCR and UW NOI Debt Yield for each such mortgaged property is calculated using underwritten net operating income or underwritten net cash flow, as applicable, for the related residential cooperative property which is the projected net operating income or net cash flow, as applicable, reflected in the most recent appraisal obtained by or otherwise in the possession of the related mortgage loan seller as of the Cut-off Date. LTV calculations are based upon the appraised value of the residential cooperative property determined as if such residential cooperative property is operated as a residential cooperative, inclusive of the amount of the underlying debt encumbering such residential cooperative property. |
| (2) | “California – Northern” includes zip codes above 93600, and “California – Southern” includes zip codes at or below 93600. |
| This is not a research report and was not prepared by any Underwriter’s research department. Please see additional important information and qualifications at the end of this Term Sheet. | ||
| 26 | ||
| BANK5 2024-5YR5 | Collateral Statistics |
Collateral Statistics(1)
Cut-off Date Balance ($)
| No. of Mortgage Loans | Aggregate Cut-off Date Balance ($) | % of Pool | |||
| 1,800,000 - 10,000,000 | 8 | 44,775,000 | 8.6 | ||
| 10,000,001 - 20,000,000 | 4 | 49,050,000 | 9.5 | ||
| 20,000,001 - 30,000,000 | 5 | 115,900,000 | 22.3 | ||
| 30,000,001 - 40,000,000 | 3 | 108,375,000 | 20.9 | ||
| 40,000,001 - 50,000,000 | 2 | 97,500,000 | 18.8 | ||
| 50,000,001 - 51,500,000 | 2 | 103,000,000 | 19.9 | ||
| Total: | 24 | $518,600,000 | 100.0 | % | |
| Min: $1,800,000 | Max: $51,500,000 | Avg: $21,608,333 | |||
State or Other Jurisdiction(2)
| No. of Mortgaged Properties | Aggregate Cut-off Date Balance ($) | % of Pool |
| ||
| California | 6 | 124,150,000 | 23.9 | ||
| California – Southern(3) | 5 | 74,150,000 | 14.3 | ||
| California – Northern(3) | 1 | 50,000,000 | 9.6 | ||
| Texas | 3 | 53,325,000 | 10.3 | ||
| Virginia | 1 | 51,500,000 | 9.9 | ||
| Ohio | 1 | 47,500,000 | 9.2 | ||
| New Jersey | 3 | 45,125,000 | 8.7 | ||
| New York | 2 | 37,250,000 | 7.2 | ||
| Hawaii | 1 | 36,750,000 | 7.1 | ||
| Michigan | 1 | 24,300,000 | 4.7 | ||
| Tennessee | 1 | 24,200,000 | 4.7 | ||
| Minnesota | 1 | 23,400,000 | 4.5 | ||
| Florida | 1 | 20,250,000 | 3.9 | ||
| Illinois | 1 | 11,100,000 | 2.1 | ||
| Louisiana | 1 | 8,050,000 | 1.6 | ||
| North Carolina | 1 | 7,500,000 | 1.4 | ||
| Arizona | 1 | 4,200,000 | 0.8 | ||
| Total: | 25 | $518,600,000 | 100.0 | % | |
Property Type(2)
| No. of Mortgaged Properties | Aggregate Cut-off Date Balance ($) | % of Pool | ||
| Retail | 8 | 220,125,000 | 42.4 | |
| Anchored | 7 | 168,625,000 | 32.5 | |
| Super Regional Mall | 1 | 51,500,000 | 9.9 | |
| Office | 3 | 91,500,000 | 17.6 | |
| CBD | 3 | 91,500,000 | 17.6 | |
| Mixed Use | 2 | 73,750,000 | 14.2 | |
| Office/Lab | 1 | 50,000,000 | 9.6 | |
| Event Space/Office | 1 | 23,750,000 | 4.6 | |
| Industrial | 2 | 47,600,000 | 9.2 | |
| Flex | 1 | 24,200,000 | 4.7 | |
| R&D/Flex | 1 | 23,400,000 | 4.5 | |
| Hospitality | 2 | 34,300,000 | 6.6 | |
| Extended Stay | 2 | 34,300,000 | 6.6 | |
| Multifamily | 3 | 28,800,000 | 5.6 | |
| Mid Rise | 2 | 24,600,000 | 4.7 | |
| Garden | 1 | 4,200,000 | 0.8 | |
| Self Storage | 5 | 22,525,000 | 4.3 | |
| Self Storage | 5 | 22,525,000 | 4.3 | |
| Total: | 25 | $518,600,000 | 100.0 | % |
Mortgage Rate (%)
| No. of Mortgage Loans | Aggregate Cut-off Date Balance ($) | % of Pool | |||
| 6.0400 - 6.4999 | 2 | 42,725,000 | 8.2 | ||
| 6.5000 - 6.9999 | 13 | 248,725,000 | 48.0 | ||
| 7.0000 - 7.4999 | 4 | 135,950,000 | 26.2 | ||
| 7.5000 - 9.0430 | 5 | 91,200,000 | 17.6 | ||
| Total: | 24 | $518,600,000 | 100.0 | % | |
| Min: 6.0400% | Max: 9.0430% | Wtd Avg: 7.0252% | |||
Original Term to Maturity or ARD (mos.)
| No. of Mortgage Loans | Aggregate Cut-off Date Balance ($) | % of Pool | |||
| 60 | 24 | 518,600,000 | 100.0 | ||
| Total: | 24 | $518,600,000 | 100.0 | % | |
| Min: 60 mos. | Max: 60 mos. | Wtd Avg: 60 mos. | |||
Remaining Term to Maturity or ARD (mos.)
| No. of Mortgage Loans | Aggregate Cut-off Date Balance ($) | % of Pool | |||
| 57 - 58 | 7 | 224,050,000 | 43.2 | ||
| 59 | 10 | 114,425,000 | 22.1 | ||
| 60 | 7 | 180,125,000 | 34.7 | ||
| Total: | 24 | $518,600,000 | 100.0 | % | |
| Min: 57 mos. | Max: 60 mos. | Wtd Avg: 59 mos. | |||
Original Amortization Term (mos.)
| No. of Mortgage Loans | Aggregate Cut-off Date Balance ($) | % of Pool | |||
| Interest Only | 24 | 518,600,000 | 100.0 | ||
| Total: | 24 | $518,600,000 | 100.0 | % | |
| Min: NAP. | Max: NAP | Wtd Avg: NAP | |||
Remaining Amortization Term (mos.)
| No. of Mortgage Loans | Aggregate Cut-off Date Balance ($) | % of Pool | |||
| Interest Only | 24 | 518,600,000 | 100.0 | ||
| Total: | 24 | $518,600,000 | 100.0 | % | |
| Min: NAP | Max: NAP | Wtd Avg: NAP | |||
Mortgage Loan Sellers
| No. of Mortgage Loans | Aggregate Cut-off Date Balance ($) | % of Pool | |||
| MSMCH | 10 | 200,175,000 | 38.6 | ||
| WFB | 5 | 150,775,000 | 29.1 | ||
| JPMCB | 3 | 113,200,000 | 21.8 | ||
| BANA | 6 | 54,450,000 | 10.5 | ||
| Total: | 24 | $518,600,000 | 100.0% | ||
Amortization Type
| No. of Mortgage Loans | Aggregate Cut-off Date Balance ($) | % of Pool | ||
| Interest Only | 24 | 518,600,000 | 100.0 | |
| Total: | 24 | $518,600,000 | 100.0 | % |
Cut-off Date LTV Ratio (%)
| No. of Mortgage Loans | Aggregate Cut-off Date Balance ($) | % of Pool | ||
| 14.8 - 40.0 | 6 | 103,275,000 | 19.9 | |
| 40.1 - 50.0 | 3 | 124,900,000 | 24.1 | |
| 50.1 - 55.0 | 3 | 45,100,000 | 8.7 | |
| 55.1 - 60.0 | 3 | 55,450,000 | 10.7 | |
| 60.1 - 68.9 | 9 | 189,875,000 | 36.6 | |
| Total: | 24 | $518,600,000 | 100.0 | % |
| Min: 14.8% | Max: 68.9% | Wtd Avg: 50.9 | % | |
Maturity Date or ARD LTV Ratio (%)
| No. of Mortgage Loans | Aggregate Cut-off Date Balance ($) | % of Pool | ||
| 14.8 - 40.0 | 6 | 103,275,000 | 19.9 | |
| 40.1 - 50.0 | 3 | 124,900,000 | 24.1 | |
| 50.1 - 55.0 | 3 | 45,100,000 | 8.7 | |
| 55.1 - 60.0 | 3 | 55,450,000 | 10.7 | |
| 60.1 - 68.9 | 9 | 189,875,000 | 36.6 | |
| Total: | 24 | $518,600,000 | 100.0 | % |
| Min: 14.8% | Max: 68.9% | Wtd Avg: 50.9 | % | |
UW NCF DSCR (x)
| No. of Mortgage Loans | Aggregate Cut-off Date Balance ($) | % of Pool | ||
| 1.28 - 1.49 | 9 | 146,800,000 | 28.3 | |
| 1.50 - 1.59 | 3 | 77,700,000 | 15.0 | |
| 1.60 - 1.74 | 2 | 55,925,000 | 10.8 | |
| 1.75 - 1.99 | 3 | 84,900,000 | 16.4 | |
| 2.00 - 2.49 | 2 | 101,500,000 | 19.6 | |
| 2.50 - 7.01 | 5 | 51,775,000 | 10.0 | |
| Total: | 24 | $518,600,000 | 100.0 | % |
| Min: 1.28x | Max: 7.01x | Wtd Avg: 1.80x | ||
UW NOI Debt Yield (%)
| No. of Mortgage Loans | Aggregate Cut-off Date Balance ($) | % of Pool | ||
| 8.1 - 10.0 | 3 | 22,800,000 | 4.4 | |
| 10.1 - 11.0 | 5 | 125,625,000 | 24.2 | |
| 11.1 - 12.0 | 4 | 99,650,000 | 19.2 | |
| 12.1 - 14.0 | 2 | 59,550,000 | 11.5 | |
| 14.1 - 15.0 | 4 | 135,800,000 | 26.2 | |
| 15.1 - 47.4 | 6 | 75,175,000 | 14.5 | |
| Total: | 24 | $518,600,000 | 100.0 | % |
| Min: 8.1% | Max: 47.4% | Wtd Avg: 13.3% | ||
| (1) | All numerical information concerning the mortgage loans is approximate. All weighted average information regarding the mortgage loans reflects the weighting of the mortgage loans based on their outstanding principal balances as of the Cut-off Date. The sum of numbers and percentages in columns may not match the “Total” due to rounding. With respect to any mortgage loan that is part of a whole loan, unless otherwise indicated, all LTV, DSCR and Debt Yield calculations include any related pari passu companion loans and exclude any related subordinate companion loans and/or mezzanine loans, as applicable. For mortgaged properties securing residential cooperative mortgage loans, the UW DSCR and UW NOI Debt Yield for each such mortgaged property is calculated using underwritten net operating income or underwritten net cash flow, as applicable, for the related residential cooperative property which is the projected net operating income or net cash flow, as applicable, reflected in the most recent appraisal obtained by or otherwise in the possession of the related mortgage loan seller as of the Cut-off Date. LTV calculations are based upon the appraised value of the residential cooperative property determined as if such residential cooperative property is operated as a residential cooperative, inclusive of the amount of the underlying debt encumbering such residential cooperative property. The UW NCF DSCR, UW NOI Debt Yield and LTV calculations do not take into account any subordinate debt (whether or not secured by the related mortgaged property), that currently exists or is allowed under the terms of any mortgage loan. |
| (2) | In the case of mortgage loans secured by multiple properties, cut-off date balance information is based on allocated loan amounts with respect to such properties. |
| (3) | “California – Northern” includes zip codes above 93600, and “California – Southern” includes zip codes at or below 93600 |
| This is not a research report and was not prepared by any Underwriter’s research department. Please see additional important information and qualifications at the end of this Term Sheet. | ||
| 27 | ||
| Retail – Super Regional Mall | Loan #1 | Cut-off Date Balance: | $51,500,000 | |
| 1961 Chain Bridge Road | Tysons Corner Center | Cut-off Date LTV: | 39.4% | |
| McLean, VA 22102 | UW NCF DSCR: | 2.00x | ||
| UW NOI Debt Yield: | 13.7% |

| This is not a research report and was not prepared by any Underwriter’s research department. Please see additional important information and qualifications at the end of this Term Sheet. | ||
| 28 | ||
| Retail – Super Regional Mall | Loan #1 | Cut-off Date Balance: | $51,500,000 | |
| 1961 Chain Bridge Road | Tysons Corner Center | Cut-off Date LTV: | 39.4% | |
| McLean, VA 22102 | UW NCF DSCR: | 2.00x | ||
| UW NOI Debt Yield: | 13.7% |
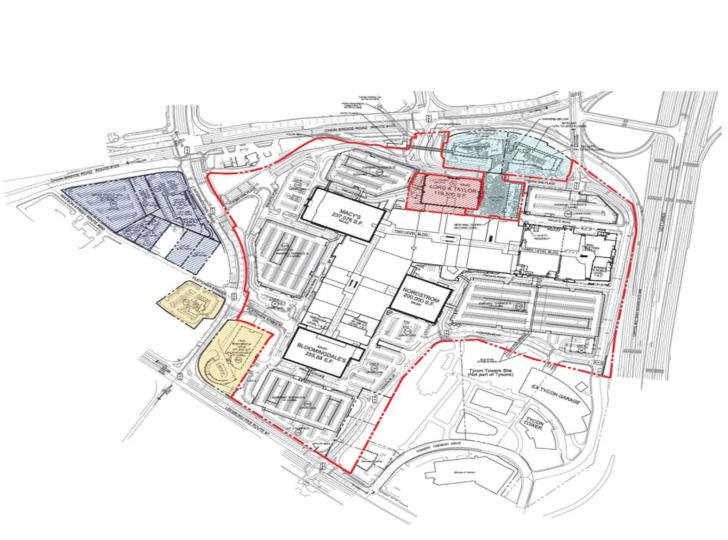
| This is not a research report and was not prepared by any Underwriter’s research department. Please see additional important information and qualifications at the end of this Term Sheet. | ||
| 29 | ||
| Retail – Super Regional Mall | Loan #1 | Cut-off Date Balance: | $51,500,000 | |
| 1961 Chain Bridge Road | Tysons Corner Center | Cut-off Date LTV: | 39.4% | |
| McLean, VA 22102 | UW NCF DSCR: | 2.00x | ||
| UW NOI Debt Yield: | 13.7% |
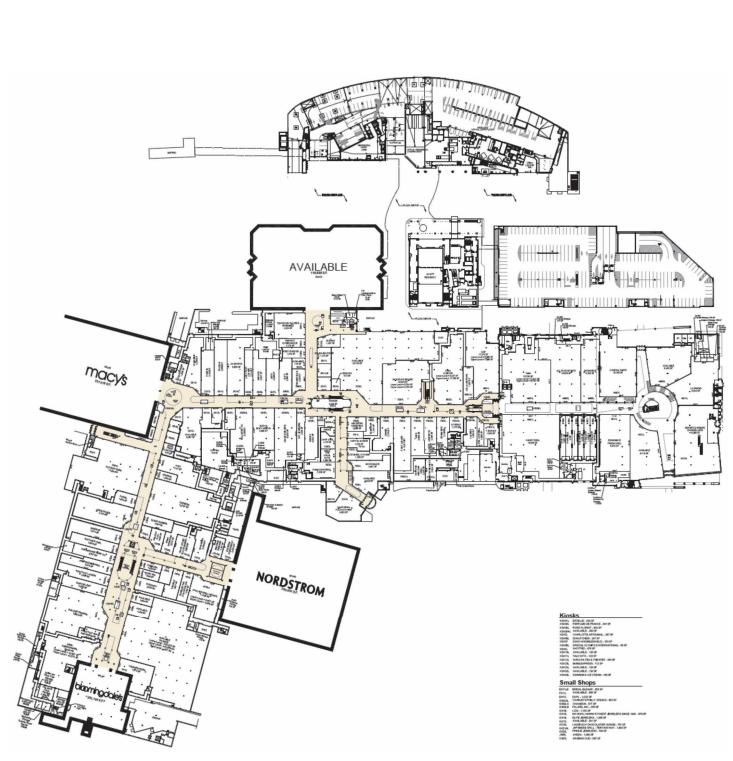
| This is not a research report and was not prepared by any Underwriter’s research department. Please see additional important information and qualifications at the end of this Term Sheet. | ||
| 30 | ||
| Retail – Super Regional Mall | Loan #1 | Cut-off Date Balance: | $51,500,000 | |
| 1961 Chain Bridge Road | Tysons Corner Center | Cut-off Date LTV: | 39.4% | |
| McLean, VA 22102 | UW NCF DSCR: | 2.00x | ||
| UW NOI Debt Yield: | 13.7% |

| This is not a research report and was not prepared by any Underwriter’s research department. Please see additional important information and qualifications at the end of this Term Sheet. | ||
| 31 | ||
| Retail – Super Regional Mall | Loan #1 | Cut-off Date Balance: | $51,500,000 | |
| 1961 Chain Bridge Road | Tysons Corner Center | Cut-off Date LTV: | 39.4% | |
| McLean, VA 22102 | UW NCF DSCR: | 2.00x | ||
| UW NOI Debt Yield: | 13.7% |
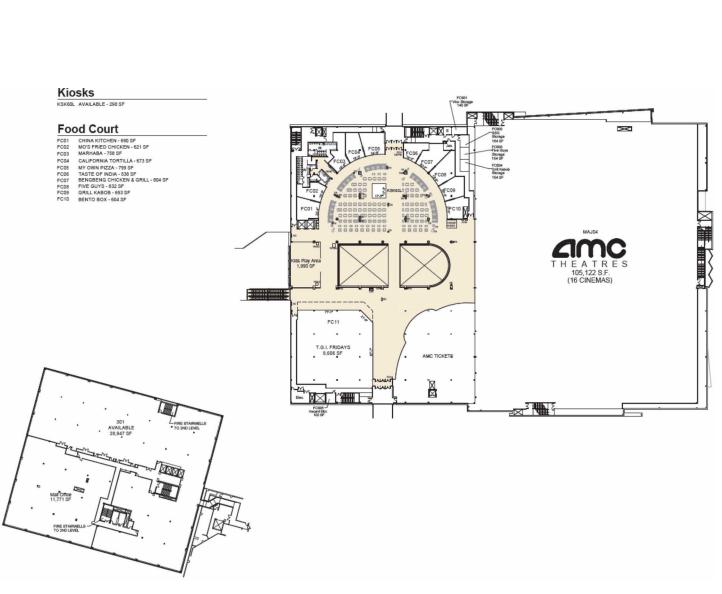
| This is not a research report and was not prepared by any Underwriter’s research department. Please see additional important information and qualifications at the end of this Term Sheet. | ||
| 32 | ||
| Retail – Super Regional Mall | Loan #1 | Cut-off Date Balance: | $51,500,000 | |
| 1961 Chain Bridge Road | Tysons Corner Center | Cut-off Date LTV: | 39.4% | |
| McLean, VA 22102 | UW NCF DSCR: | 2.00x | ||
| UW NOI Debt Yield: | 13.7% |
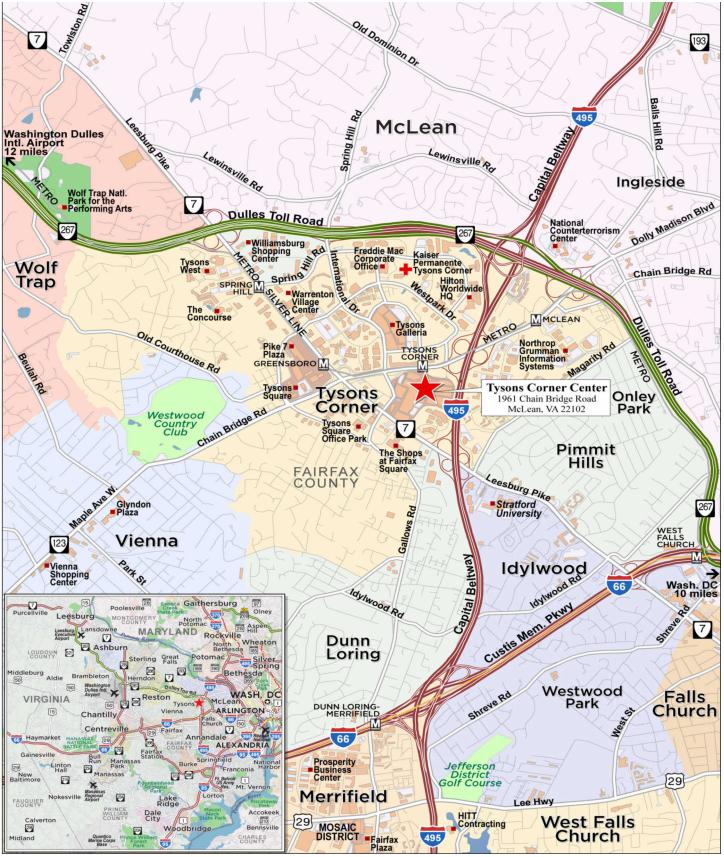
| This is not a research report and was not prepared by any Underwriter’s research department. Please see additional important information and qualifications at the end of this Term Sheet. | ||
| 33 | ||
| Mortgage Loan No. 1 – Tysons Corner Center |
| Mortgage Loan Information | Property Information | ||||||
| Mortgage Loan Seller: | JPMCB | Single Asset/Portfolio: | Single Asset | ||||
| Credit Assessment (Moody’s/Fitch/KBRA): | Aa3/AAsf/AA | Location: | McLean, VA 22102 | ||||
| Original Balance(1): | $51,500,000 | General Property Type: | Retail | ||||
| Cut-off Date Balance(1): | $51,500,000 | Detailed Property Type: | Super Regional Mall | ||||
| % of Initial Pool Balance: | 9.9% | Title Vesting: | Fee / Leasehold | ||||
| Loan Purpose: | Refinance | Year Built/Renovated: | 1968 / 1989; 2005 | ||||
| Borrower Sponsor(s): | The Macerich Partnership, L.P. | Size: | 1,793,638 SF | ||||
| and Alaska Permanent Fund | Cut-off Date Balance PSF(1): | $396 | |||||
| Corporation | Maturity Date Balance PSF(1): | $396 | |||||
| Guarantor: | The Macerich Partnership, L.P. | Property Manager: | MACW Property Management, LLC | ||||
| Mortgage Rate: | 6.60060% | (borrower-related) | |||||
| Note Date: | 12/4/2023 | ||||||
| First Payment Date: | 1/6/2024 | ||||||
| Maturity Date: | 12/6/2028 | ||||||
| Original Term to Maturity: | 60 months | ||||||
| Original Amortization Term: | 0 months | Underwriting and Financial Information | |||||
| IO Period: | 60 months | UW NOI(5): | $97,102,547 | ||||
| Seasoning: | 2 months | UW NOI Debt Yield(1): | 13.7% | ||||
| Prepayment Provisions(2): | L(26),DorYM1(27),O(7) | UW NOI Debt Yield at Maturity(1): | 13.7% | ||||
| Lockbox/Cash Mgmt Status: | Hard/Springing | UW NCF DSCR(1): | 2.00x | ||||
| Additional Debt Type(1): | Pari Passu | Most Recent NOI(5): | $85,531,322 (9/30/2023 TTM) | ||||
| Additional Debt Balance(1): | $658,500,000 | 2nd Most Recent NOI: | $84,604,983 (12/31/2022) | ||||
| Future Debt Permitted (Type): | No (NAP) | 3rd Most Recent NOI: | $83,536,276 (12/31/2021) | ||||
| Reserves(3) | Most Recent Occupancy: | 95.4% (11/1/2023) | |||||
| Type | Initial | Monthly | Cap | 2nd Most Recent Occupancy: | 88.9% (12/31/2022) | ||
| RE Taxes: | $0 | Springing | NAP | 3rd Most Recent Occupancy: | 88.6% (12/31/2021) | ||
| Insurance: | $0 | Springing | NAP | Appraised Value (as of): | $1,800,000,000 (10/5/2023) | ||
| Replacement Reserve: | $0 | Springing | $896,819 | Appraised Value PSF: | $1,004 | ||
| TI/LC Reserve: | $0 | Springing | $3,587,276 | Cut-off Date LTV Ratio(1): | 39.4% | ||
| Other Reserves(4): | $39,775,125 | $0 | NAP | Maturity Date LTV Ratio(1): | 39.4% | ||
| Sources and Uses | ||||||
| Sources | Proceeds | % of Total | Uses | Proceeds | % of Total | |
| Whole Loan Amount: | $710,000,000 | 100.0% | Loan Payoff: | $666,692,845 | 93.9% | |
| Reserves: | $39,775,125 | 5.6% | ||||
| Closing Costs: | $3,532,030 | 0.5% | ||||
| Total Sources: | $710,000,000 | 100.0% | Total Uses: | $710,000,000 | 100.0% | |
| (1) | The Tysons Corner Center Mortgage Loan (as defined below) is part of the Tysons Corner Center Whole Loan (as defined below) which is comprised of nineteen pari passu notes with an aggregate original principal balance and Cut-off Date Balance of $710,000,000. The Tysons Corner Center Whole Loan was co-originated by Deutsche Bank AG, New York Branch (“DBNY”), JPMorgan Chase Bank, National Association (“JPMCB”), Bank of Montreal (“BMO”), and Goldman Sachs Bank USA (“GSBI”). The Cut-off Date Balance PSF, Maturity Date Balance PSF, UW NOI Debt Yield, UW NOI Debt Yield at Maturity, UW NCF DSCR, Cut-off Date LTV Ratio and Maturity Date LTV Ratio in the chart above is based on the aggregate outstanding principal balance as of the Cut-off Date of the Tysons Corner Center Whole Loan. |
| (2) | The lockout period will be at least 26 payment dates beginning with and including the first payment date on January 6, 2024. Defeasance (or voluntary prepayment with yield maintenance) of the Tysons Corner Center Whole Loan in full (but not in part) is permitted at any time following the earlier to occur of (i) December 6, 2026 or (ii) the date that is two years from the closing date of the securitization that includes the last pari passu note to be securitized. The assumed lockout period of 26 payments is based on the expected BANK5 2024-5YR5 securitization closing date of February 2024. The actual lockout period may be longer. |
| (3) | See “Initial and Ongoing Reserves” below. |
| (4) | Other Reserves consists of an Outstanding TI/LC Reserve (Upfront: $30,769,199) and a Gap Rent Reserve (Upfront: $9,005,926). See “Escrows and Reserves” below. |
| (5) | The main driver in the increase from Most Recent NOI to UW NOI is recent lease up. |
The Mortgage Loan. The largest mortgage loan (the “Tysons Corner Center Mortgage Loan”) is part of a whole loan (the “Tysons Corner Center Whole Loan”) secured by the borrowers’ fee and leasehold interests, as applicable, in a 1,793,638 SF super regional mall located at 1961 Chain Bridge Road in McLean, Virginia (the “Tysons Corner Center Property”). The Tysons Corner Center Whole Loan is comprised of nineteen pari passu notes, with an aggregate outstanding principal balance as of the Cut-off Date of $710,000,000. The Tysons Corner Center Whole Loan was co-originated on December 4, 2023 by JPMCB, DBNY, BMO and GSBI and accrues interest at a fixed rate of 6.60060% per annum. The Tysons Corner Center Whole Loan has an initial term of five years and is interest-only for the full term. The scheduled maturity date of the Tysons Corner Center Whole Loan is on December 6, 2028. The Tysons Corner Center Mortgage Loan is evidenced by the non-controlling Notes A-3-2, A-3-3 and A-3-4-1 with an outstanding principal balance of $51,500,000 as of the Cut-off Date. The Tysons Corner Center Whole Loan will be serviced pursuant to the trust and servicing agreement for the TYSN 2023-CRNR transaction. See “Description of the Mortgage Pool—The Whole Loans—The Non-Serviced Pari Passu Whole Loans” and “Pooling and Servicing Agreement—Servicing of the Non-Serviced Mortgage Loans” in the prospectus.
| This is not a research report and was not prepared by any Underwriter’s research department. Please see additional important information and qualifications at the end of this Term Sheet. | ||
| 34 | ||
| Retail – Super Regional Mall | Loan #1 | Cut-off Date Balance: | $51,500,000 | |
| 1961 Chain Bridge Road | Tysons Corner Center | Cut-off Date LTV: | 39.4% | |
| McLean, VA 22102 | UW NCF DSCR: | 2.00x | ||
| UW NOI Debt Yield: | 13.7% |
The table below summarizes the promissory notes that comprise the Tysons Corner Center Whole Loan.
| Tysons Corner Center Whole Loan Summary | ||||
| Note | Original Balance | Cut-off Date Balance | Note Holder | Controlling Piece |
| A-1-1 | $176,080,000 | $176,080,000 | TYSN 2023-CRNR | Yes |
| A-1-2(1) | $30,000,000 | $30,000,000 | Benchmark 2024-V5 | No |
| A-1-3(2) | $20,000,000 | $20,000,000 | DBNY | No |
| A-1-4(1) | $10,000,000 | $10,000,000 | Benchmark 2024-V5 | No |
| A-1-5(3) | $10,000,000 | $10,000,000 | BMO 2024-5C3 | No |
| A-1-6(2) | $37,920,000 | $37,920,000 | DBNY | No |
| A-2-1 | $88,040,000 | $88,040,000 | TYSN 2023-CRNR | No |
| A-2-2(1) | $20,000,000 | $20,000,000 | Benchmark 2024-V5 | No |
| A-2-3-1(3) | $10,000,000 | $10,000,000 | BMO 2024-5C3 | No |
| A-2-3-2(2) | $10,000,000 | $10,000,000 | GSBI | No |
| A-2-4(1) | $13,960,000 | $13,960,000 | Benchmark 2024-V5 | No |
| A-3-1 | $88,040,000 | $88,040,000 | TYSN 2023-CRNR | No |
| A-3-2 | $20,000,000 | $20,000,000 | BANK5 2024-5YR5 | No |
| A-3-3 | $10,000,000 | $10,000,000 | BANK5 2024-5YR5 | No |
| A-3-4-1 | $21,500,000 | $21,500,000 | BANK5 2024-5YR5 | No |
| A-3-4-2(2) | $2,460,000 | $2,460,000 | JPMCB | No |
| A-4-1 | $88,040,000 | $88,040,000 | TYSN 2023-CRNR | No |
| A-4-2(3) | $30,000,000 | $30,000,000 | BMO 2024-5C3 | No |
| A-4-3(3) | $23,960,000 | $23,960,000 | BMO 2024-5C3 | No |
| Total | $710,000,000 | $710,000,000 | ||
| (1) | The Benchmark 2024-V5 securitization trust is expected to close on or about January 31, 2024. |
| (2) | Expected to be contributed to one or more future securitization transactions. |
| (3) | The BMO 2024-5C3 securitization trust is expected to close on or about February 14, 2024. |
The Borrowers and the Borrower Sponsors. The borrowers for the Tysons Corner Center Whole Loan are Tysons Corner Property Holdings LLC and Tysons Corner Holdings LLC, each a Delaware limited liability company and single purpose entity with two independent directors. Legal counsel to the borrowers delivered a non-consolidation opinion in connection with the origination of the Tysons Corner Center Whole Loan.
The borrowers are a 50/50 joint venture between the borrower sponsors, which are The Macerich Partnership, L.P., a subsidiary of The Macerich Company (“Macerich”) and the Alaska Permanent Fund Corporation. Macerich is a fully integrated, self-managed and self-administered real estate investment trust. The Macerich Partnership, L.P. is the non-recourse carveout guarantor. As a leading owner, operator and developer of retail real estate in densely populated U.S. markets, Macerich’s portfolio is concentrated in California, the Pacific Northwest, Phoenix/Scottsdale, and the metropolitan New York to Washington, D.C. corridor. Developing and managing properties that serve as community cornerstones, Macerich currently owns 47 million SF of real estate consisting primarily of interests in 44 regional town centers.
The Alaska Permanent Fund, a sovereign wealth fund, was established in 1976 by Alaskans to preserve and convert the State’s non-renewable oil and mineral wealth into a renewable financial resource for all generations of Alaskans. The Alaska Permanent Fund is managed by the Alaska Permanent Fund Corporation, which was created by the Alaska State Legislature in 1980 as an independent state entity tasked with the mission to manage and invest the assets of the Alaska Permanent Fund and other funds designated by law. As of November 30, 2023, the Alaska Permanent Fund Corporation managed assets worth $75.5 billion.
The Property. The Tysons Corner Center Property is a 1,793,638 SF, super-regional mall located 12.5 miles outside Washington D.C.
The Tysons Corner Center Property consists of one contiguous building and 10,059 parking spaces (for a parking ratio of 5.61 spaces per 1000 SF) situated on a 76.56 acre site in McLean, Virginia, and has 238 tenants. The Tysons Corner Center Property is anchored by Bloomingdale’s, Macy’s and Nordstrom which collectively generated approximately $239.9 million of sales in the September 2023 TTM while also increasing foot traffic at the Tysons Corner Center Property. The diversified in-line tenant base features large-format retailers and operators including Zara, Apple, Uniqlo, Victoria’s Secret, lululemon athletica, H&M, and Sephora contributing to total Tysons Corner Center Property sales in the September 2023 TTM of approximately $891.2 million. In-line stores smaller than 10,000 SF (excluding arcade and non-retail stores) generated approximately $495.4 million of sales in the September 2023 TTM, driving sales volume of $1,202 PSF at an occupancy cost of 16.1%.
The Tysons Corner Center Property was originally developed in 1968 and was subsequently expanded in 1989 and 2005. Since 2005, the borrower sponsor has invested approximately $352 million (with over $100 million invested in the last six years) in capital improvements, leasing capital, and operational upgrades to preserve the asset’s competitive positioning. Major capital initiatives include Apple’s relocation/renewal costing approximately $22.1 million, the repositioning of L.L. Bean’s former space, costing approximately $19.6 million through 2023, and ongoing operating capital improvements to the parking deck, HVAC, roof, vertical transportation, security equipment, and common areas. The borrower sponsor has also invested approximately $525 million to create a (non-collateral) 24/7 live-work-play-stay, mixed-use destination adjacent to the Tysons Corner Center Property. This non-collateral development project opened between 2014 and 2016 and includes a 22-story Class-A office tower, a 429-unit luxury apartment building, and a 300-key Hyatt.
| This is not a research report and was not prepared by any Underwriter’s research department. Please see additional important information and qualifications at the end of this Term Sheet. | ||
| 35 | ||
| Retail – Super Regional Mall | Loan #1 | Cut-off Date Balance: | $51,500,000 | |
| 1961 Chain Bridge Road | Tysons Corner Center | Cut-off Date LTV: | 39.4% | |
| McLean, VA 22102 | UW NCF DSCR: | 2.00x | ||
| UW NOI Debt Yield: | 13.7% |
The following table contains sales history for the Tysons Corner Center Property:
| Sales History(1) | ||||||
| 2019 | 2021 | 2022 | TTM September 2023 | |||
| Sales PSF (Inline < 10,000 SF) | $461,073,000 | $413,432,000 | $475,055,000 | $495,396,000 | ||
| Sales PSF (Inline < 10,000 SF, Excluding Apple) | $373,499,000 | $338,185,000 | $389,701,000 | $423,169,000 | ||
| Over 10,000 SF | $182,117,000 | $181,694,000 | $141,709,000 | $141,471,000 | ||
| Theaters & Arcades | $19,341,000 | $8,707,000 | $12,229,000 | $14,406,000 | ||
| Department Stores | $215,350,000 | $211,721,000 | $238,646,000 | $239,897,000 | ||
| Occupancy Cost (Inline < 10,000 SF)(2) | 17.0% | N/A | 15.9% | 16.1% | ||
| (1) | Information is as of September 30, 2023, as provided by the borrower sponsors, and only includes tenants reporting sales. |
| (2) | Occupancy Cost (Inline < 10,000 SF) was not calculated during periods affected by COVID due to incomplete sales reporting by tenants. |
Major Tenants. The three anchor tenants are Bloomingdale’s, Macy’s and Nordstrom.
Bloomingdale’s (252,754 SF; 14.1% of net rentable area (“NRA”), 1.0% of underwritten gross rent). Bloomingdale’s is a high-end department store chain founded in 1860 that currently offers clothes, accessories, shoes and furniture for men, women and children. Bloomingdale’s was acquired by Federated Department Stores in 1930, which acquired the Macy’s department store chain in 1994. Ultimately, Federated Department Stores was renamed Macy’s, Inc. (NYSE: M) in 2007. The chain has a total of 37 department stores and 23 outlet stores with the Bloomingdale’s nameplate in operation. Its headquarters and flagship store are located in New York City. The Bloomingdale’s lease expires July 22, 2028, and the tenant has one seven-year renewal option upon no less than 270 days’ prior written notice and has no termination options.
Nordstrom (201,000 SF; 11.2% of NRA; 0.2% of underwritten gross rent). Nordstrom (NYSE: JWN) is a fashion retailer offering clothing shoes and accessories for men, women and children. Founded in 1901 and headquartered in Seattle, Nordstrom has 370 stores across 40 states and Canada, which includes 122 full-line stores, 236 Nordstrom Rack locations, 7 Trunk Club clubhouses, two clearance stores and a Nordstrom local service concept. In fiscal year 2022, Nordstrom reported net sales of nearly $15.1 billion, an increase of 6.6% from fiscal year 2021. The Nordstrom at the Tysons Corner Center Property is reportedly in the top 15% of all Nordstrom locations, with the men’s department ranking as the highest performing across Nordstrom’s entire national fleet. Nordstrom’s lease expires in March 2025, and the tenant has 11, five-year renewal options exercisable upon no less than 9 months’ and no earlier than 24 months’ prior written notice and has no termination options.
Macy’s (237,076 SF; 13.2% of NRA; 0.1% of underwritten gross rent). Macy’s, Inc. (NYSE: M) is an American department store chain founded in 1858 that currently offers clothes, accessories, shoes and furniture for men, women and children. It operates more than 700 department stores under the nameplates Macy’s and Bloomingdale’s and over 160 specialty stores that include Bloomingdale’s The Outlet, Bluemercury and Macy’s Backstage. Macy’s Inc. operates stores in 43 states, the District of Columbia, Guam and Puerto Rico, as well as macys.com, bloomingdales.com and bluemercury.com. Macy’s Inc. has corporate offices in Cincinnati, Ohio and New York, New York. The Macy’s lease expires July 24, 2028, and the tenant has six, five-year renewal options upon no less than 270 days’ prior written notice and has no termination options.
| This is not a research report and was not prepared by any Underwriter’s research department. Please see additional important information and qualifications at the end of this Term Sheet. | ||
| 36 | ||
| Retail – Super Regional Mall | Loan #1 | Cut-off Date Balance: | $51,500,000 | |
| 1961 Chain Bridge Road | Tysons Corner Center | Cut-off Date LTV: | 39.4% | |
| McLean, VA 22102 | UW NCF DSCR: | 2.00x | ||
| UW NOI Debt Yield: | 13.7% |
The following table presents certain information relating to the tenants (of which, certain tenants may have cotenancy provisions) at the Tysons Corner Center Property:
| Tenant Summary(1) | |||||||||||
| Tenant Name | Credit Rating (Moody’s/S&P/Fitch)(2) | Tenant SF | % of Total SF | UW Gross Rent(3) | % of Total UW Gross Rent(3) | UW Gross Rent PSF(3) | Lease Expiration | Termination Option (Y/N) | Renewal Option | ||
| Anchors: | |||||||||||
| Bloomingdale’s(4) | Ba1/BB+/NR | 252,754 | 14.1% | $1,218,492 | 1.0% | $4.82 | 7/22/2028 | N | 1 x 7 years | ||
| Nordstrom(5) | NR/BB+/BBB- | 200,000 | 11.2% | $282,999 | 0.2% | $1.41 | 3/31/2025 | N | 11 x 5 years | ||
| Macy’s(6) | Ba1/BB+/NR | 237,076 | 13.2% | $94,786 | 0.1% | $0.40 | 7/24/2028 | N | 6 x 5 years | ||
| Major Tenants: | |||||||||||
| AMC Theatres(7) | Caa1/CCC+/NR | 105,122 | 5.9% | $4,589,627 | 3.6% | $43.66 | 9/30/2025 | N | 4 x 5 years | ||
| Primark(8) | NR/NR/NR | 50,186 | 2.8% | $2,922,512 | 2.3% | $58.23 | 5/31/2034 | Y | 3 x 5 years | ||
| In-line >10,000 SF | 306,089 | 17.1% | $32,775,526 | 26.0% | $107.08 | ||||||
| In-line <10,000 SF | 490,510 | 27.3% | $83,994,405 | 66.5% | $171.24 | ||||||
| Specialty Leasing | 65,118 | 3.6% | NAP | NAP | NAP | ||||||
| Office/Other | 4,661 | 0.3% | $357,065 | 0.3% | $76.61 | ||||||
| Total Occupied | 1,711,516 | 95.4% | $126,235,411 | 100.0% | $73.76 | ||||||
| Vacant | 82,122 | 4.6% | |||||||||
| Total | 1,793,638 | 100.0% | |||||||||
| (1) | Based on the underwritten rent roll dated November 1, 2023. |
| (2) | Certain ratings are those of the parent company whether or not the parent guarantees the lease. |
| (3) | UW Gross Rent, % of UW Gross Rent and UW Gross Rent PSF includes base rent, recoveries (fixed CAM, tax reimbursements, insurance, utility and other reimbursements) and percentage rent contribution. |
| (4) | Bloomingdale’s has one, seven-year renewal option upon no less than 270 days’ prior written notice. |
| (5) | Nordstrom has eleven, five-year renewal options exercisable upon no less than 9 months’ and no earlier than 24 months’ prior written notice. This includes Nordstrom’s anchor space of 200,000 SF. There is an additional 1,000 SF that is included in the In-line <10,000 SF numbers above. |
| (6) | Macy’s has six, five-year renewal options exercisable upon no less than 270 days’ prior written notice. |
| (7) | AMC Theatres has four, five-year renewal options exercisable upon at least 12 months’ prior written notice. |
| (8) | Primark (signed but not in occupancy) is expected to commence a ten-year lease on April 22, 2024. Primark has three, five-year renewal options exercisable. Primark has various options to terminate its lease (i) if it has not opened by a date determined by a formula specified in the lease, (ii) if the delivery date has not occurred in accordance with a formula specified in the lease or (iii) if the floor area is more than 3% less than specified in the lease. In addition, Primark has the right to terminate its lease effective as of the end of its fifth lease year if the tenant’s gross sales during its fourth lease year do not equal or exceed $23,000,000. Such termination right must be exercised by notice given at any time during the 90-day period following the end of the fourth lease year. At origination, $9,005,926 was deposited into a gap rent reserve for various tenants, including $1,170,894 for Primark. We cannot assure you that Primark will take occupancy or commence paying rent as expected, or at all. |
| Tenant Sales Per SF(1) | ||||
| 2019 | 2021 | 2022 | Q3 2023(2) | |
| Tenants < 10,000 SF and Open > 12 months | ||||
| Occupancy Cost(3) | 17.0% | N/A | 15.9% | 16.1% |
| Sales PSF(4) | $981 | $1,030 | $1,133 | $1,202 |
| (1) | All sales information presented above is based upon information provided by the borrower sponsor. In certain instances, sales figures represent estimates because the tenants are not required to report, or otherwise may not have reported sales information on a timely basis. Further, because sales are self-reported, such information is not independently verified by the borrower sponsor. |
| (2) | Sales PSF listed for this period reflects Sales PSF for the 12-month period ending September 2023. |
| (3) | Occupancy Cost was not calculated during periods affected by COVID due to incomplete sales reporting by tenants. |
| (4) | Based on sales per SF for all tenants open for 12 months or more. Excludes tenants >10,000 SF, arcades and non-retail stores. |
| This is not a research report and was not prepared by any Underwriter’s research department. Please see additional important information and qualifications at the end of this Term Sheet. | ||
| 37 | ||
| Retail – Super Regional Mall | Loan #1 | Cut-off Date Balance: | $51,500,000 | |
| 1961 Chain Bridge Road | Tysons Corner Center | Cut-off Date LTV: | 39.4% | |
| McLean, VA 22102 | UW NCF DSCR: | 2.00x | ||
| UW NOI Debt Yield: | 13.7% |
The following table presents certain information relating to tenants with the highest overall sales in order of their September 30, 2023 TTM sales.
| Top Tenants by Total Sales(1) | |||||||||
| Tenant Name | Tenant SF | % of Total SF | Lease Start Date | Base Rent | 2022 Sales | 2022 Sales PSF | 9/23 TTM Sales | 9/23 TTM Sales PSF | TTM Occ Cost(2) |
| Bloomingdale's | 252,754 | 14.1% | 11/27/1974 | $371,043 | $101,347,699 | $401 | $92,930,560 | $368 | 1.3% |
| Macy's | 237,076 | 13.2% | 7/25/1968 | $0 | $76,311,220 | $322 | $77,142,356 | $325 | 0.1% |
| Apple Store(2) | 5,181 | 0.3% | 5/19/2023 | $1,647,586 | $78,450,327 | $15,142 | $72,226,551 | $13,941 | 2.5% |
| Nordstrom | 200,000 | 11.2% | 3/4/1988 | $1 | $60,987,002 | $305 | $69,823,919 | $349 | 0.4% |
| Lenkersdorfer(3) | 2,400 | 0.1% | 5/1/1993 | $759,577 | $27,470,494 | $11,446 | $29,894,119 | $12,456 | 6.1% |
| ZARA | 21,062 | 1.2% | 11/3/2014 | $2,422,283 | $29,754,068 | $1,413 | $28,586,503 | $1,357 | 14.8% |
| SEPHORA | 7,088 | 0.4% | 4/12/2002 | $720,019 | $18,494,900 | $2,609 | $21,996,004 | $3,103 | 7.9% |
| Lucid Motors | 4,462 | 0.2% | 10/5/2021 | $585,986 | $10,639,089 | $2,384 | $20,409,158 | $4,574 | 5.0% |
| Uniqlo | 12,825 | 0.7% | 10/1/2016 | $1,813,910 | $17,480,115 | $1,363 | $19,811,305 | $1,545 | 10.7% |
| Lululemon Athletica | 6,999 | 0.4% | 9/7/2007 | $397,193 | $11,566,303 | $1,653 | $15,630,205 | $2,233 | 7.3% |
| (1) | All sales information presented herein with respect to the Tysons Corner Center Property is based upon information provided by the borrower sponsor. In certain instances, sales figures represent estimates because the tenants are not required to report, or otherwise may not have reported, sales information on a timely basis. Further, because sales are self-reported, such information is not independently verified by the borrower sponsor. |
| (2) | Apple reports sales based on a 5,181 SF sales floor. Apple leases 13,010 SF which includes storage space, a breakroom and other ancillary space. |
| (3) | SF and base rent reflects Lenkersdorfer's existing suite. Lenkersdorfer has executed a lease to expand into a 7,704 SF suite at an UW base rent of $1,329,864. |
The following table presents certain information relating to the lease rollover schedule at the Tysons Corner Center Property, based on initial expiration dates:
| Lease Rollover Schedule(1)(2) | ||||||||
| Year | # of Leases Rolling | SF Rolling | UW Base Rent PSF Rolling | Approx. % of Total SF Rolling | Approx. Cumulative % of SF Rolling | Total UW Base Rent Rolling | Approx. % of Base Rent Rolling | Approx. Cumulative % of Base Rent Rolling |
| MTM & 2023 | 6 | 12,809 | $66.95 | 0.7% | 0.7% | $857,511 | 1.1% | 1.1% |
| 2024 | 40 | 139,997 | $77.91 | 7.8% | 8.5% | $10,907,326 | 14.5% | 15.7% |
| 2025 | 33 | 417,137 | $31.86 | 23.3% | 31.8% | $13,290,259 | 17.7% | 33.4% |
| 2026 | 23 | 104,482 | $99.72 | 5.8% | 37.6% | $10,419,016 | 13.9% | 47.3% |
| 2027 | 20 | 53,367 | $113.61 | 3.0% | 40.6% | $6,063,018 | 8.1% | 55.3% |
| 2028 | 26 | 572,395 | $15.60 | 31.9% | 72.5% | $8,931,129 | 11.9% | 67.2% |
| 2029 | 7 | 18,224 | $85.59 | 1.0% | 73.5% | $1,559,846 | 2.1% | 69.3% |
| 2030 | 13 | 25,339 | $112.68 | 1.4% | 74.9% | $2,855,202 | 3.8% | 73.1% |
| 2031 | 8 | 32,012 | $68.80 | 1.8% | 76.7% | $2,202,582 | 2.9% | 76.1% |
| 2032 | 10 | 28,649 | $94.77 | 1.6% | 78.3% | $2,715,169 | 3.6% | 79.7% |
| 2033 | 11 | 67,584 | $82.16 | 3.8% | 82.1% | $5,552,422 | 7.4% | 87.1% |
| 2034 | 10 | 166,699 | $50.17 | 9.3% | 91.4% | $8,362,650 | 11.1% | 98.2% |
| 2035 & Beyond | 1 | 7,704 | $172.62 | 0.4% | 91.8% | $1,329,864 | 1.8% | 100.0% |
| Vacant | 0 | 82,122 | $0 | 4.6% | 96.4% | $0 | NAP | 100.0% |
| Specialty Leasing | 30 | 65,118 | $0 | 3.6% | 100.0% | $0 | NAP | 100.0% |
| Total/Wtd. Avg. | 238 | 1,793,638 | $43.85 | 100.0% | $75,045,995 | 100.0% | ||
| (1) | Based on the underwritten rent roll as of November 1, 2023. |
| (2) | Certain tenants may have lease termination options that are exercisable prior to the originally stated expiration date of the related lease and are not considered in the lease rollover schedule. |
| This is not a research report and was not prepared by any Underwriter’s research department. Please see additional important information and qualifications at the end of this Term Sheet. | ||
| 38 | ||
| Retail – Super Regional Mall | Loan #1 | Cut-off Date Balance: | $51,500,000 | |
| 1961 Chain Bridge Road | Tysons Corner Center | Cut-off Date LTV: | 39.4% | |
| McLean, VA 22102 | UW NCF DSCR: | 2.00x | ||
| UW NOI Debt Yield: | 13.7% |
The Market. The Tysons Corner Center Property is located in at the intersection of Chain Bridge Route 123 and the Capital Beltway/I-495 where 172,000 vehicles pass daily, with direct access to DC’s Metro Silver Line and positioned between Dulles International and Reagan International airports. The Tysons Corner Center Property’s total trade area is comprised of approximately 3.2 million people in 1.2 million households with an average household income exceeding $165,000 and an average net worth over $1.8 million. As the primary shopping destination of Fairfax County, the trade area in which the Tysons Corner Center Property is located has an affluent, dense and educated population, and is ranked as having the 5th highest median household income in the United States. Loudon County and Falls Church City also fall within the Tysons Corner Center Property’s trade area, and along with Fairfax County, represent three of the wealthiest counties in the United States.
Within the Fairfax County retail submarket, malls are the largest subtype, accounting for nearly 2.9 million SF. Rents are approximately $39.00/SF, which is a 3.7% increase from 2022. Vacancy in the retail submarket is 3.2%, which is near the same level it was a year ago. Vacancy has only fallen 0.1% during this time. During this period, 5,700 SF has been absorbed, and nothing has delivered. In the past three years, rents have increased a cumulative 7.4%.
As of year end 2022, the population within a 10-mile radius of the Tysons Corner Center Property had an aggregate retail sales level of $41.32 million, with average retail sales per household of $74,026. By comparison, the Washington D.C. metropolitan area had average sales per household of $71,488, while the Virginia and United States averages were $65,311 and $63,688, respectively.
As of 2022, Fairfax County had a population of 1,157,125, with 66% of households earning in excess of $100,000 and an average household net worth of $2.5 million. Within the Tysons Corner Center Property’s primary trade area, which had a population of 677,536 as of 2022, the average household income was $205,647, higher than Fairfax County overall and 27% higher than the greater Washington, DC metropolitan statistical area.
The following table presents certain information relating to the demographics of the Tysons Corner Center Property:
| Demographics Summary(1) | ||||||||
| Property Name | City, State | Whole Loan Cut-off Date Balance | 5-mile Population | 10-mile Population | 15-mile Population | 5-mile Avg Household Income | 10-mile Avg Household Income | 15-mile Avg Household Income |
| Tysons Corner Center | McLean, VA | $710,000,000 | 261,017 | 1,355,610 | 2,998,684 | $195,243 | $176,653 | $157,344 |
Source: Appraisal, unless otherwise indicated.
| (1) | Values are as of 2022. |
| This is not a research report and was not prepared by any Underwriter’s research department. Please see additional important information and qualifications at the end of this Term Sheet. | ||
| 39 | ||
| Retail – Super Regional Mall | Loan #1 | Cut-off Date Balance: | $51,500,000 | |
| 1961 Chain Bridge Road | Tysons Corner Center | Cut-off Date LTV: | 39.4% | |
| McLean, VA 22102 | UW NCF DSCR: | 2.00x | ||
| UW NOI Debt Yield: | 13.7% |
Operating History and Underwritten Net Cash Flow. The following table presents certain information relating to the historical operating performance and Underwritten Net Cash Flow at the Tysons Corner Center Property:
| Cash Flow Analysis | |||||||
| 2019 | 2020 | 2021 | 2022 | TTM 9/30/2023 | UW(1) | UW PSF | |
| Base Rent | $81,387,952 | $74,476,740 | $67,924,167 | $65,811,352 | $67,573,137 | $75,045,995 | $41.84 |
| Rent Steps | $0 | $0 | $0 | $0 | $0 | $1,503,149 | $0.84 |
| Gross Up Vacancy | $0 | $0 | $0 | $0 | $0 | $11,821,381 | $6.59 |
| Gross Potential Rent | $81,387,952 | $74,476,740 | $67,924,167 | $65,811,352 | $67,573,137 | $88,370,525 | $49.27 |
| Total Reimbursements | $52,106,283 | $49,321,594 | $42,341,921 | $42,773,913 | $43,726,608 | $46,509,747 | $25.93 |
| Total Gross Income | $133,494,235 | $123,798,334 | $110,266,088 | $108,585,265 | $111,299,745 | $134,880,271 | $75.20 |
| Other Income | $13,634,813 | $17,429,202 | $19,929,530 | $19,463,316 | $19,285,025 | $17,560,026 | $9.79 |
| (Vacancy / Credit Loss) | ($1,012,339) | ($11,043,533) | ($3,517,708) | ($600,363) | ($966,945) | $(11,821,381) | ($6.59) |
| Effective Gross Income | $146,116,709 | $130,184,003 | $126,677,910 | $127,448,218 | $129,617,825 | $140,618,916 | $78.40 |
| Management Fee | $2,161,973 | $2,024,225 | $1,881,995 | $1,892,939 | $1,930,258 | $1,000,000 | $0.56 |
| Real Estate Taxes | $24,846,557 | $25,853,243 | $24,151,845 | $23,490,194 | $23,317,982 | $24,033,263 | $13.40 |
| Insurance | $484,797 | $567,706 | $669,212 | $696,163 | $746,564 | $802,641 | $0.45 |
| Other Expenses(2) | $16,914,590 | $15,662,652 | $16,438,582 | $16,763,939 | $18,091,699 | $17,680,465 | $9.86 |
| Total Expenses | $44,407,917 | $44,107,826 | $43,141,634 | $42,843,235 | $44,086,503 | $43,516,369 | $24.26 |
| Net Operating Income(3) | $101,708,792 | $86,076,177 | $83,536,276 | $84,604,983 | $85,531,322 | $97,102,547 | $54.14 |
| Capital Expenditures | $0 | $0 | $0 | $0 | $0 | $358,728 | $0.20 |
| TI/LC | $0 | $0 | $0 | $0 | $0 | $1,793,638 | $1.00 |
| Net Cash Flow | $101,708,792 | $86,076,177 | $83,536,276 | $84,604,983 | $85,531,322 | $94,950,181 | $52.94 |
| Occupancy (%) | 92.8% | 90.6% | 88.6% | 88.9% | 95.4%(1) | 92.2%(4) | |
| NOI DSCR(5) | 2.14x | 1.81x | 1.76x | 1.78x | 1.80x | 2.04x | |
| NCF DSCR(5) | 2.14x | 1.81x | 1.76x | 1.78x | 1.80x | 2.00x | |
| NOI Debt Yield(5) | 14.3% | 12.1% | 11.8% | 11.9% | 12.0% | 13.7% | |
| NCF Debt Yield(5) | 14.3% | 12.1% | 11.8% | 11.9% | 12.0% | 13.4% | |
| (1) | Based on the underwritten rent roll as of November 1, 2023. |
| (2) | Other Expenses include general and administrative, repairs and maintenance, security, utility, marketing, other expenses and ground rent. |
| (3) | The main driver in the increase from TTM 9/30/2023 Net Operating Income to UW Net Operating Income is recent lease up. |
| (4) | The underwritten economic vacancy is 7.8%. The Tysons Corner Center Property was 95.4% occupied as of November 1, 2023. |
| (5) | Based on the Tysons Corner Center Whole Loan. |
Escrows and Reserves. At origination, the borrowers were required to deposit approximately $30,769,199 into an Outstanding TI/LC Reserve and $9,005,926 into a gap rent reserve.
Real Estate Taxes – During the continuance of a Trigger Period (as defined below), the borrowers are required to escrow 1/12th of the annual estimated tax payments payable during the next ensuing 12 months on a monthly basis.
Insurance – During the continuance of a Trigger Period, the borrowers are required to escrow 1/12th of the annual estimated insurance payments on a monthly basis, unless no event of default is continuing as to which the lender has initiated an enforcement action and the Tysons Corner Center Property is insured under a blanket policy meeting the requirements set forth in the related loan agreement (in which case, no insurance escrows will be required, notwithstanding the continuance of a Trigger Period).
Replacement Reserve – During the continuance of a Trigger Period, the borrowers are required to deposit monthly, with or on behalf of the lender, an amount equal to the gross leasable area of the Tysons Corner Center Property (excluding the non-collateral square footage and the premises leased or previously leased to (i) Nordstrom and (ii) Lord & Taylor, and any other tenant that is required to pay for all repairs and maintenance costs for its entire leased premises, roof and structural components) multiplied by $0.25 and divided by 12 (initially $37,367) into a replacement reserve account subject to a cap of 24 times the required monthly deposit (initially $896,819).
TI/LC Reserve – During the continuance of a Trigger Period, the borrowers are required to deposit monthly, with or on behalf of the lender, an amount equal to the gross leasable area of the Tysons Corner Center Property (excluding the non-collateral square footage and the premises leased or previously leased to (i) Nordstrom, (ii) Macy’s, (iii) Bloomingdales and (iv) Lord & Taylor) multiplied by $1.00 and divided by 12 (initially $149,740) into a leasing reserve account subject to a cap of 24 times the required monthly deposit (initially $3,587,276).
All deposits to all reserve funds listed above may be in the form of Credit Support. “Credit Support” means any one or more of (A) cash, (B) United States obligations, (C) other securities having a rating reasonably acceptable to the lender and for which a rating agency confirmation has been received and/or (D) a letter of credit satisfying certain conditions. In addition, the TI/LC reserve may be replaced by a guaranty of limited payment provided by the non-
| This is not a research report and was not prepared by any Underwriter’s research department. Please see additional important information and qualifications at the end of this Term Sheet. | ||
| 40 | ||
| Retail – Super Regional Mall | Loan #1 | Cut-off Date Balance: | $51,500,000 | |
| 1961 Chain Bridge Road | Tysons Corner Center | Cut-off Date LTV: | 39.4% | |
| McLean, VA 22102 | UW NCF DSCR: | 2.00x | ||
| UW NOI Debt Yield: | 13.7% |
recourse carveout guarantor, which will be reduced on a dollar-to-dollar basis by equity capital spent by the borrower on approved leasing expenses not duplicative of costs paid with funds in such reserve.
Lockbox and Cash Management. The Tysons Corner Center Whole Loan is structured with a hard lockbox and springing cash management. The borrowers are required to cause all tenants at the Tysons Corner Center Property to pay rents directly into a lockbox account controlled by the lender (the “Lockbox Account”), and to deposit any rents otherwise received by the borrowers or the property manager into the Lockbox Account within three business days after receipt. Prior to a Trigger Period, the borrowers may utilize the Lockbox Account as the borrowers’ operating account. During the continuance of a Trigger Period, the borrowers will no longer have access to the Lockbox Account, and all funds deposited into the Lockbox Account are required to be swept on a weekly basis and on the second business day prior to each monthly payment date into a deposit account controlled by the lender (the “Cash Management Account”), to be applied and disbursed in accordance with the loan documents, provided no Cut-off Event (as defined below) is continuing, to pay debt service, the reserves and escrows described above, budgeted operating expenses, lender-approved extraordinary expenses, and capital projects undertaken in accordance with the loan documents. During the continuance of a Trigger Period, any excess cash is required to be deposited into an eligible account (the “Excess Cash Flow Reserve Account”) and held by the lender as additional security for the Whole Loan; provided, that, funds on deposit in the Excess Cash Flow Reserve Account will be made available to the borrowers for the payment of certain property-level expenses and other uses as set forth in the Tysons Corner Center Whole Loan documents, including required REIT distributions in an amount up to $500,000. All sums remaining on deposit in the Excess Cash Flow Reserve Account will be disbursed to the borrowers on the earlier to occur of (i) payment in full of the debt or (ii) discontinuation of a Trigger Period. A “Cut-off Event” means the occurrence of an event of default and the earlier of (i) an enforcement action (which has not been cured) or (ii) the tendering of a deed in lieu of foreclosure.
A “Trigger Period” means a period commencing upon (i) an event of default under the Tysons Corner Center Whole Loan documents or (ii) the interest only debt service coverage ratio falling below 1.50x for two consecutive calculation dates (a “Low DSCR Period”). A “calculation date” means the 60th day following the end of each calendar quarter. A Trigger Period resulting from an event of default will end if the lender has waived or the borrowers have cured such event of default. A Trigger Period resulting from a Low DSCR Period will end if the borrowers have maintained an interest only debt service coverage ratio of at least 1.50x for two consecutive calculation dates. Upon the end of a Trigger Period, all remaining funds in the Cash Management Account will be disbursed to the borrowers except for funds that are required to be deposited into an account whether or not a Trigger Period is continuing. The borrowers may also cure a Trigger Period arising from a Low DSCR Period by (i) following the expiration of the lockout period, prepaying the Tysons Corner Center Whole Loan (together with payment of the prepayment fee) in an amount that would result in an interest only debt service coverage ratio of 1.50x or (ii) providing to the lender Credit Support in an amount which, if added to the underwritten net operating income of the Tysons Corner Center Property, would cause the interest only debt service coverage ratio to equal 1.50x.
Subordinate Debt. None.
Mezzanine Loan and Preferred Equity. None.
Release of Property. The borrowers are permitted to obtain the free release of (i) non-income producing and unimproved real property, (ii) non-income producing real property that is improved by structures that have been vacant and non-income producing continuously since the origination date and for at least three years prior to the date of release, (iii) future development parcels identified in the loan agreement (and which may be increased in size by not more than 15%) and (iv) a parcel identified in the loan agreement as the “L&T Parcel,” which was formerly occupied by a Lord & Taylor store (and which may be increased in size by not more than 15%). Such release is subject to various conditions, including, among others, (i) satisfaction of REMIC related conditions, (ii) except in the case of a release of the L&T Parcel, certification by the borrowers that the release will not materially and adversely affect the use, operations, economic value of, or revenue produced by (exclusive of the economic value or revenue lost attributable to the release parcel) the remaining improvements on the Tysons Corner Center Property, and (iii) the release parcel has been legally subdivided and constitutes a separate tax lot (or if not a separate tax lot, the release parcel owner is contractually obligated to pay its share of all taxes and other charges). Such release may be done by means of a lot line adjustment, plat, legal subdivision, vertical subdivision, condominium or any other means legally permitted.
Letter of Credit. None. However, the borrowers have the right to provide a letter of credit (i) to cure a Trigger Period arising from a Low DSCR Period as described above under “Lockbox and Cash Management”, and (ii) in lieu of making future cash deposits to the reserves, as described above under “Escrows and Reserves”.
Right of First Offer/Right of First Refusal. The lease for AMC Theaters provides that if the tenant’s lease is terminated following a casualty due to the borrower’s notifying AMC theaters that it is not obligated to, and will not, repair and rebuild, the borrower may not, for five years after the termination date, lease or sell or otherwise permit any portion of the entire premises for use as a movie theater without giving AMC a right of first refusal with respect to such movie theater.
Ground Lease. One of the two borrowers, Tysons Corner Property Holdings LLC, owns the fee interest in the Tysons Corner Center Property and ground leases it to the other borrower, Tysons Corner Holdings LLC, and the Tysons Corner Center Whole Loan is secured by both borrowers’ interests.
Terrorism Insurance. The borrowers are required to obtain and maintain property insurance for 100% of full replacement cost and business interruption insurance for 24 months plus a 12-month extended period of indemnity. Such insurance is required to cover perils of terrorism and acts of terrorism as required by the Terrorism Risk Insurance Program Reauthorization Act of 2019 (“TRIPRA”); however, if TRIPRA or any subsequent statute, extension, or reauthorization is no longer in effect, the borrowers will not be required to pay any annual insurance premiums solely with respect to such terrorism coverage in excess of 200% of the amount of the then annual premiums paid by the borrowers for all-risk coverage under a stand-alone all-risk policy. See “Risk Factors—Risks Relating to the Mortgage Loans—Terrorism Insurance May Not Be Available for All Mortgaged Properties” in the prospectus.
| This is not a research report and was not prepared by any Underwriter’s research department. Please see additional important information and qualifications at the end of this Term Sheet. | ||
| 41 | ||
| Office – CBD | Loan #2 | Cut-off Date Balance: | $51,500,000 | |
| 11755 Wilshire Boulevard | 11755 Wilshire | Cut-off Date LTV: | 42.7% | |
| Los Angeles, CA 90025 | UW NCF DSCR: | 1.80x | ||
| UW NOI Debt Yield: | 14.1% |
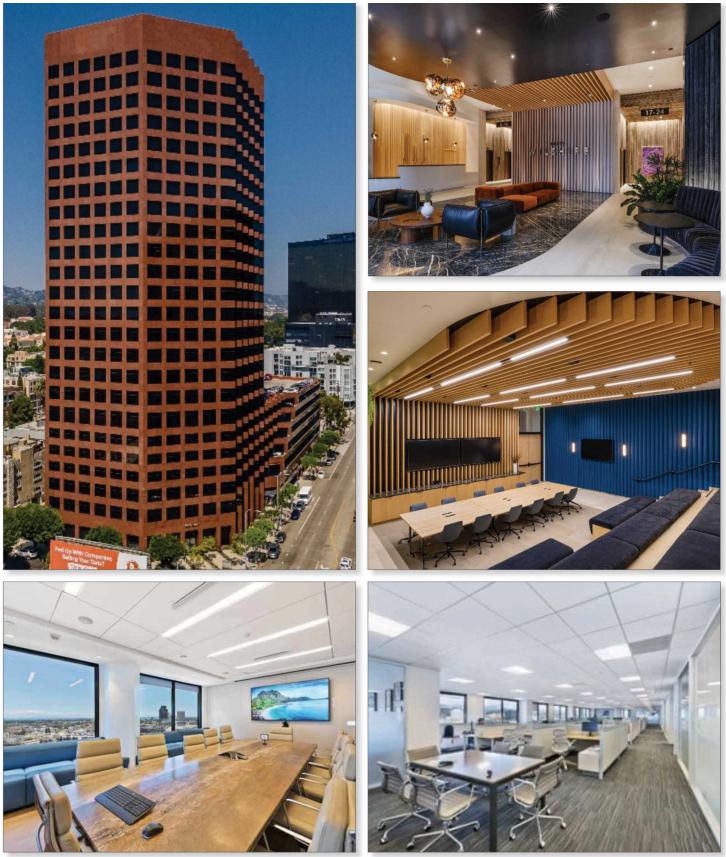
| This is not a research report and was not prepared by any Underwriter’s research department. Please see additional important information and qualifications at the end of this Term Sheet. | ||
| 42 | ||
| Office – CBD | Loan #2 | Cut-off Date Balance: | $51,500,000 | |
| 11755 Wilshire Boulevard | 11755 Wilshire | Cut-off Date LTV: | 42.7% | |
| Los Angeles, CA 90025 | UW NCF DSCR: | 1.80x | ||
| UW NOI Debt Yield: | 14.1% |

| This is not a research report and was not prepared by any Underwriter’s research department. Please see additional important information and qualifications at the end of this Term Sheet. | ||
| 43 | ||
| Office – CBD | Loan #2 | Cut-off Date Balance: | $51,500,000 | |
| 11755 Wilshire Boulevard | 11755 Wilshire | Cut-off Date LTV: | 42.7% | |
| Los Angeles, CA 90025 | UW NCF DSCR: | 1.80x | ||
| UW NOI Debt Yield: | 14.1% |
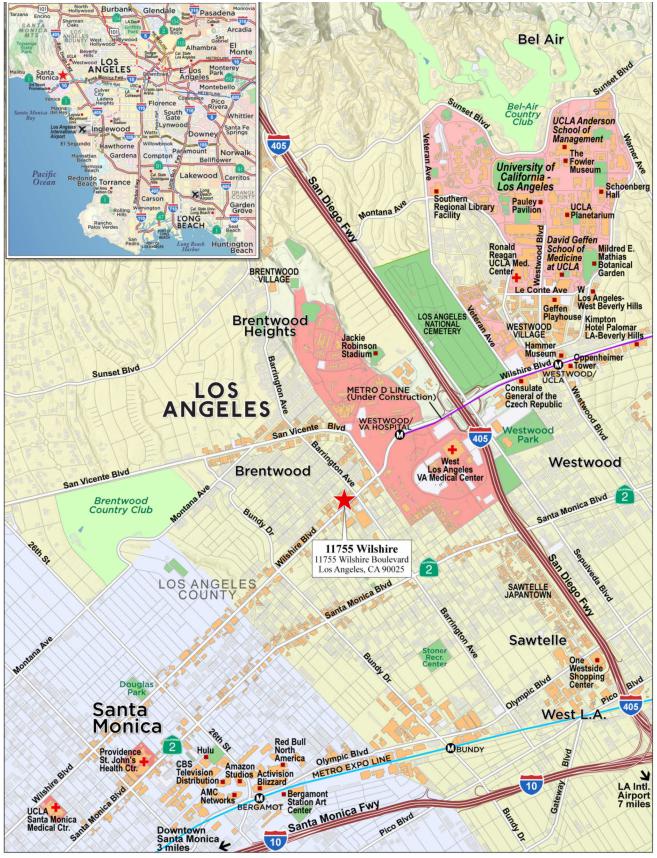
| This is not a research report and was not prepared by any Underwriter’s research department. Please see additional important information and qualifications at the end of this Term Sheet. | ||
| 44 | ||
| Mortgage Loan No. 2 – 11755 Wilshire |
| Mortgage Loan Information | Property Information | ||||||
| Mortgage Loan Seller: | WFB | Single Asset/Portfolio: | Single Asset | ||||
| Credit Assessment (Moody’s/Fitch/KBRA): | NR/NR/NR | Location: | Los Angeles, CA 90025 | ||||
| Original Balance(1): | $51,500,000 | General Property Type: | Office | ||||
| Cut-off Date Balance(1): | $51,500,000 | Detailed Property Type: | CBD | ||||
| % of Initial Pool Balance: | 9.9% | Title Vesting: | Fee | ||||
| Loan Purpose: | Refinance | Year Built/Renovated: | 1986; 2023-2024 | ||||
| Borrower Sponsor: | California State Teachers’ | Size: | 337,440 SF | ||||
| Retirement System | Cut-off Date Balance PSF(1): | $207 | |||||
| Guarantor(2): | NAP | Maturity Balance PSF(1): | $207 | ||||
| Mortgage Rate: | 7.0240% | Property Manager: | Avison Young-Southern California, | ||||
| Note Date: | 1/17/2024 | Ltd. | |||||
| First Payment Date: | 3/11/2024 | ||||||
| Maturity Date: | 2/11/2029 | ||||||
| Original Term to Maturity: | 60 months | ||||||
| Original Amortization Term: | 0 months | ||||||
| IO Period: | 60 months | Underwriting and Financial Information | |||||
| Seasoning: | 0 months | UW NOI(7): | $9,893,318 | ||||
| Prepayment Provisions(3): | L(24),D(29),O(7) | UW NOI Debt Yield(1): | 14.1% | ||||
| Lockbox/Cash Mgmt Status: | Hard/In Place | UW NOI Debt Yield at Maturity(1): | 14.1% | ||||
| Additional Debt Type(1)(4): | Pari Passu | UW NCF DSCR(1): | 1.80x | ||||
| Additional Debt Balance(1)(4): | $18,500,000 | Most Recent NOI(7): | $7,866,147 (10/31/2023 TTM) | ||||
| Future Debt Permitted (Type): | No (NAP) | 2nd Most Recent NOI: | $7,694,727 (12/31/2022) | ||||
| Reserves(5) | 3rd Most Recent NOI: | $7,501,648 (12/31/2021) | |||||
| Type | Initial | Monthly | Cap | Most Recent Occupancy: | 62.9% (1/9/2024) | ||
| RE Taxes: | $0 | Springing | NAP | 2nd Most Recent Occupancy: | 66.7% (12/31/2022) | ||
| Insurance: | $0 | Springing | NAP | 3rd Most Recent Occupancy: | 79.1% (12/31/2021) | ||
| Replacement Reserve: | $0 | $5,624 | $67,488 | Appraised Value (as of): | $164,000,000 (12/1/2023) | ||
| TI/LC Reserve: | $3,000,000(6) | $70,300 | NAP | Appraised Value PSF: | $486 | ||
| Existing TI/LC Reserve: | $330,575 | $0 | NAP | Cut-off Date LTV Ratio(1): | 42.7% | ||
| Outstanding Rent Concessions: | $777,560 | $0 | NAP | Maturity Date LTV Ratio(1): | 42.7% | ||
| Sources and Uses | ||||||
| Sources | Proceeds | % of Total | Uses | Proceeds | % of Total | |
| Whole Loan Amount: | $70,000,000 | 98.6% | Loan Payoff: | $65,915,624 | 92.9% | |
| Sponsor Equity: | $963,066 | 1.4% | Reserves: | $4,108,135 | 5.8% | |
| Closing Costs: | $939,307 | 1.3% | ||||
| Total Sources: | $70,963,066 | 100.0% | Total Uses: | $70,963,066 | 100.0% | |
| (1) | The 11755 Wilshire Mortgage Loan (as defined below) is part of the 11755 Wilshire Whole Loan (as defined below) with an original aggregate principal balance of $70,000,000. The Cut-off Date Balance PSF, Maturity Balance PSF, UW NOI Debt Yield, UW NOI Debt Yield at Maturity, UW NCF DSCR, Cut-off Date LTV Ratio and Maturity Date LTV Ratio numbers presented above are based on the 11755 Wilshire Whole Loan. |
| (2) | There is no non-recourse carveout guarantor or separate environmental indemnitor with respect to the 11755 Wilshire Whole Loan. |
| (3) | Prepayment of the 11755 Wilshire Whole Loan is permitted at any time after the earlier to occur of (a) the end of the two-year period commencing on the closing date of the securitization of the last promissory note representing a portion of the 11755 Wilshire Whole Loan to be securitized and (b) March 11, 2027. The assumed prepayment lockout period of 24 payments is based on the closing date of this transaction in February 2024. |
| (4) | See “The Mortgage Loan” below for further discussion of additional mortgage debt. |
| (5) | See “Escrows and Reserves” below for further discussion of reserve requirements. |
| (6) | The initial $3,000,000 TI/LC Reserve deposit may be used solely in connection with the Kinetic space. See “Escrows and Reserves” below for further discussion of reserve requirements. |
| (7) | The increase in NOI between 10/31/2023 TTM and UW is primarily due to the UW insurance premium being lower than the historical insurance expense. Additionally, WFB did not underwrite a free rent adjustment because all outstanding free rent was reserved at loan origination. See “Cash Flow Analysis” below. |
The Mortgage Loan. The second largest mortgage loan (the “11755 Wilshire Mortgage Loan”) is part of a whole loan (the “11755 Wilshire Whole Loan”) evidenced by two pari passu promissory notes in the aggregate original principal amount of $70,000,000 and secured by a first priority fee mortgage encumbering an office property located in Los Angeles, California (the “11755 Wilshire Property”). The controlling Note A-1, in the original principal amount of $51,500,000, represents the 11755 Wilshire Mortgage Loan and will be contributed to the BANK5 2024-5YR5 securitization trust. The non-controlling Note A-2, in the original principal amount of $18,500,000, is expected to be contributed to one or more future securitizations. The 11755 Wilshire Whole Loan will be serviced pursuant to the pooling and servicing agreement for the BANK5 2024-5YR5 securitization trust. See “Description of the Mortgage Pool—The Whole Loans—The Serviced Pari Passu Whole Loans” and “Pooling and Servicing Agreement—Servicing of the Serviced Mortgage Loans” in the prospectus.
| This is not a research report and was not prepared by any Underwriter’s research department. Please see additional important information and qualifications at the end of this Term Sheet. | ||
| 45 | ||
| Office – CBD | Loan #2 | Cut-off Date Balance: | $51,500,000 | |
| 11755 Wilshire Boulevard | 11755 Wilshire | Cut-off Date LTV: | 42.7% | |
| Los Angeles, CA 90025 | UW NCF DSCR: | 1.80x | ||
| UW NOI Debt Yield: | 14.1% |
| 11755 Wilshire Whole Loan Summary | ||||
| Note | Original Balance | Cut-off Date Balance | Note Holder | Controlling Note |
| A-1 | $51,500,000 | $51,500,000 | BANK5 2024-5YR5 | Yes |
| A-2 | $18,500,000 | $18,500,000 | WFB | No |
| Total | $70,000,000 | $70,000,000 | ||
The Borrower and the Borrower Sponsor. The borrower is CSHV Wilshire Landmark, LLC, a Delaware limited liability company and single purpose entity with two independent directors. The borrower sponsor is California State Teachers’ Retirement System (“CalSTRS”). There is no non-recourse carveout guarantor or separate environmental indemnitor with respect to the 11755 Wilshire Whole Loan.
Established by law in 1913, CalSTRS provides retirement benefits to California’s public school educators from prekindergarten through community college. Today, CalSTRS is the largest educator-only pension fund in the world and the second largest pension fund in the U.S. As of November 30, 2023, the market value of CalSTRS’s investment portfolio was approximately $317.8 billion, which includes a real estate portfolio valued at approximately $49.4 billion.
The Property. The 11755 Wilshire Property comprises a 24-story Class A, LEED Gold certified office building totaling 337,440 SF of net rentable area and a seven-level parking garage located in Los Angeles, California. Situated on a 1.2 acre site, the 11755 Wilshire Property was constructed in 1986 and the borrower has invested $33 million into the property since 2021, including $27 million towards renovations, which are expected to be completed in the first quarter of 2024. Renovations include upgrades to the lobby, tenant lounge, conference center, and façade, a new lobby café, and fitness center. The 11755 Wilshire Property has 833 parking spaces on site, resulting in a parking ratio of approximately 2.5 spaces per 1,000 SF. As of January 9, 2024, the property was 62.9% leased to 18 tenants.
Major Tenants.
Kinetic Content, LLC (52,405 SF, 15.5% of NRA; 26.5% of underwritten base rent). Founded in 2010, Kinetic Content, LLC (“Kinetic”) creates and produces media content for the global market. Kinetic partners with various networks including Netflix, Lifetime, Prime Video, Hulu, Bravo, E!, ABC, HBO Max, and Peacock. The company produces series for multiple platforms including Love Is Blind, The Ultimatum, and Perfect Match. In 2022, Kinetic was acquired by The North Road Company, a multi-genre studio that produces scripted, documentary and unscripted film and TV content for global markets. Kinetic has been at the property, which serves as its headquarters, since 2015 and the current lease expires on April 30, 2026. The tenant has one, 5-year renewal option and no termination options.
Oak View Group, LLC (18,890 SF, 5.6% of NRA; 9.2% of underwritten base rent). Oak View Group, LLC (“Oak View Group”) is the largest developer of sports and live entertainment venues worldwide. Founded in 2015 by Tim Leiweke and Irving Azoff, Oak View Group currently has over 30,000 employees, over 300 venues across the globe and over $5 billion committed to developing new areas in the next three years. Oak View Group is currently subleasing their space from Crystal Cruises through February 1, 2024, at which time their direct lease with the borrower commences. Oak View Group is currently marketing their space for sublease. The direct lease expires May 31, 2027 with one, 5-year renewal option and no termination options.
Semler Brossy Consulting Group LLC (18,890 SF, 5.6% of NRA; 8.6% of underwritten base rent). Semler Brossy Consulting Group LLC (“Semler Brossy”) is an independent consulting firm that partners with boards, compensation and human capital committees, and management teams to develop executive compensation and talent strategies. Semler Brossy serves a broad cross-section of companies across industries, from global corporations to smaller, privately held firms. Semler Brossy has been at the property, which serves as its headquarters, since 2014 and the tenant’s current lease expires April 30, 2031 with one, 5-year renewal option. The tenant has a one-time option to terminate its lease on April 30, 2028 with at least 12 months’ notice and by paying a termination fee of $1,042,557.
| This is not a research report and was not prepared by any Underwriter’s research department. Please see additional important information and qualifications at the end of this Term Sheet. | ||
| 46 | ||
| Office – CBD | Loan #2 | Cut-off Date Balance: | $51,500,000 | |
| 11755 Wilshire Boulevard | 11755 Wilshire | Cut-off Date LTV: | 42.7% | |
| Los Angeles, CA 90025 | UW NCF DSCR: | 1.80x | ||
| UW NOI Debt Yield: | 14.1% |
The following table presents certain information relating to the tenancy at the 11755 Wilshire Property:
| Tenant Summary(1) | ||||||||||
| Tenant Name | Credit Rating (Fitch/Moody's/ S&P) | Tenant SF | % of Total SF | Annual UW Rent(2) | % of Total Annual UW Rent | Annual UW Rent PSF(2) | Lease Expiration | Term. Option (Y/N) | Renewal Options | |
| Kinetic | NR/NR/NR | 52,405 | 15.5% | $3,427,749 | 26.5% | $65.41 | 4/30/2026 | N | 1 x 5 yr | |
| Oak View Group(3) | NR/NR/NR | 18,890 | 5.6% | $1,190,070 | 9.2% | $63.00 | 5/31/2027 | N | 1 x 5 yr | |
| Semler Brossy | NR/NR/NR | 18,890 | 5.6% | $1,114,416 | 8.6% | $58.99 | 4/30/2031 | Y(4) | 1 x 5 yr | |
| Intrepid Investment Bankers, LLC | NR/NR/NR | 18,461 | 5.5% | $1,253,300 | 9.7% | $67.89 | 6/30/2026 | N | 2 x 5 yr | |
| IBISWorld, Inc(5) | A-/A1/A- | 17,960 |
| 5.3% | $1,028,903 | 7.9% | $57.29 | 5/31/2032 | N | 1 x 5 yr |
| Subtotal/Wtd. Avg. | 126,606 | 37.5% | $8,014,437 | 61.9% | $63.30 | |||||
| Other Tenants | 85,580 | (6) | 25.4% | $4,930,078 | 38.1% | $57.61 | ||||
| Occupied Collateral Total | 212,186 | 62.9% | $12,944,515 | 100.0% | $61.01 | |||||
| Vacant Space | 125,254 |
| 37.1% | |||||||
| Total/Wtd. Avg. | 337,440 | (6) | 100.0% | |||||||
| (1) | Information based on the underwritten rent roll. |
| (2) | The Annual UW Rent and Annual UW Rent PSF shown above include contractual rent steps through January 2025 totaling $778,540. |
| (3) | Oak View Group is currently subleasing their space from Crystal Cruises, which vacated in July 2020 and is currently paying the sublease base rent of $41.15 PSF through February 1, 2024. Oak View Group signed a direct lease with the borrower that commences on February 1, 2024 and the base rent will increase to $63.00 PSF. Oak View Group is currently marketing its entire space for sublease. |
| (4) | Semler Brossy has a one time option to terminate its lease on April 30, 2028 with at least 12 months’ notice and by paying a termination fee of $1,042,557. |
| (5) | IBISWorld, Inc subleases its entire space to The Hartford Gold Group, LLC on a co-terminous sublease that expires May 31, 2032 at a rental rate of $36 PSF with 3% annual increases. |
| (6) | Other Tenants SF and Total SF includes Office of the Building (1,490 SF) and BOMA Adjustment (6,448 SF), which have no UW Rent associated with the space. |
The following table presents certain information relating to the lease rollover schedule at the 11755 Wilshire Property:
| Lease Rollover Schedule(1)(2) | |||||||||
| Year | # of Leases Rolling | SF Rolling | Annual UW Rent PSF Rolling(3) | % of Total SF Rolling | Cumulative % of SF Rolling | Annual UW Rent Rolling(3) | % of Annual Rent Rolling | Cumulative % of Annual Rent Rolling | |
| MTM | 1 | 1,489 | $43.89 | 0.4% | 0.4% | $65,359 | 0.5% | 0.5% | |
| 2024 | 1 | 7,350 | $58.75 | 2.2% | 2.6% | $431,824 | 3.3% | 3.8% | |
| 2025 | 5 | 23,837 | $67.17 | 7.1% | 9.7% | $1,601,118 | 12.4% | 16.2% | |
| 2026 | 6 | 107,860 | $64.72 | 32.0% | 41.6% | $6,980,375 | 53.9% | 70.1% | |
| 2027 | 2 | 20,515 | $63.41 | 6.1% | 47.7% | $1,300,781 | 10.0% | 80.2% | |
| 2028 | 0 | 0 | $0.00 | 0.0% | 47.7% | $0 | 0.0% | 80.2% | |
| 2029 | 0 | 0 | $0.00 | 0.0% | 47.7% | $0 | 0.0% | 80.2% | |
| 2030 | 0 | 0 | $0.00 | 0.0% | 47.7% | $0 | 0.0% | 80.2% | |
| 2031 | 1 | 18,890 | $58.99 | 5.6% | 53.3% | $1,114,416 | 8.6% | 88.8% | |
| 2032 | 1 | 17,960 | $57.29 | 5.3% | 58.6% | $1,028,903 | 7.9% | 96.7% | |
| 2033 | 1 | 6,347 | $66.45 | 1.9% | 60.5% | $421,739 | 3.3% | 100.0% | |
| 2034 | 0 | 0 | $0.00 | 0.0% | 60.5% | $0 | 0.0% | 100.0% | |
| 2035 & Beyond(4) | 2 | 7,938 | $0.00 | 2.4% | 62.9% | $0 | 0.0% | 100.0% | |
| Vacant | 0 | 125,254 | $0.00 | 37.1% | 100.0% | $0 | 0.0% | 100.0% | |
| Total/Wtd. Avg. | 20 | 337,440 | $61.01 | (5) | 100.0% | $12,944,515 | 100.0% | ||
| (1) | Information is based on the underwritten rent roll. |
| (2) | Certain tenants may have lease termination options that are exercisable prior to the originally stated expiration date of the related lease and are not considered in the rollover schedule. |
| (3) | The Annual UW Rent and Annual UW Rent PSF shown above include contractual rent steps through January 2025 totaling $778,540. |
| (4) | 2035 & Beyond includes Office of the Building (1,490 SF) and BOMA Adjustment (6,448 SF), which have no lease expirations or UW Rent associated with the space. |
| (5) | Total/Wtd. Avg. UW Rent PSF Rolling excludes vacant space. |
The Market. The 11755 Wilshire Property is in the Brentwood neighborhood within western Los Angeles at the northeast corner of Granville Avenue and Wilshire Boulevard, one of the main East/West thoroughfares in the area. The property is located 1.0 mile from I-405, which connects to the region’s major highways, and 10.4 miles north of Los Angeles International Airport.
According to the appraisal, the 2022 population and average household income within a one-, three- and five-mile radius of the 11755 Wilshire Property was 36,430, 233,533, and 491,449 and $176,159, $176,322, and $177,500, respectively.
| This is not a research report and was not prepared by any Underwriter’s research department. Please see additional important information and qualifications at the end of this Term Sheet. | ||
| 47 | ||
| Office – CBD | Loan #2 | Cut-off Date Balance: | $51,500,000 | |
| 11755 Wilshire Boulevard | 11755 Wilshire | Cut-off Date LTV: | 42.7% | |
| Los Angeles, CA 90025 | UW NCF DSCR: | 1.80x | ||
| UW NOI Debt Yield: | 14.1% |
According to a third party market research report, the property is located in the Brentwood submarket of the West Los Angeles office market. As of January 2024, the Brentwood submarket reported a total inventory of approximately 4.2 million SF with a 20.2% vacancy rate and average asking rent of $50.87 PSF.
The following table presents certain information relating to the appraisal’s market rent conclusions for the 11755 Wilshire Property:
| Market Rent Summary | ||||
| Retail | Floors 8-16 | Floors 17-20 | Floors 21-24 | |
| Market Rent (PSF) | $47.40 | $63.00 | $64.20 | $66.00 |
| Lease Term (Years) | 5 | 5 | 5 | 5 |
| Lease Type | NNN | FSG | FSG | FSG |
| Escalations | 3.5% annually | 3.5% annually | 3.5% annually | 3.5% annually |
| Tenant Improvements (New/Renewal) | $65 / $20 | $65 / $20 | $65 / $20 | $65 / $20 |
| Leasing Commissions (New/Renewal) | 6.0% / 3.0% | 6.0% / 3.0% | 6.0% / 3.0% | 6.0% / 3.0% |
| Free Rent (Months) (New/Renewal) | 5 / 2 | 5 / 2 | 5 / 2 | 5 / 2 |
| Source: Appraisal. | ||||
The following table presents information relating to comparable office property sales for the 11755 Wilshire Property:
| Comparable Sales Summary | ||||||
| Property Name/Location | Year Built/Renovated | Total NRA (SF) | Occupancy | Sale Date | Sale Price | Sale Price PSF |
1700 E. Walnut 1700 E. Walnut Avenue El Segundo, CA | 1986 / 2020 | 120,063 | 71.0% | Nov-2023 | $31,168,000 | $259.60 |
2050 Main 2050 Main Street Irvine, CA | 2007 / NAP | 314,074 | 70.0% | Oct-2023 | $57,500,000 | $183.08 |
Pen Factory 2701 Olympic Boulevard Santa Monica, CA | 1957 / 2017 | 219,571 | 100.0% | Aug-2023 | $165,505,000 | $753.77 |
Encino Executive Tower 16633 Ventura Boulevard Encino, CA | 1970 / 2016 | 193,344 | 88.5% | Jun-2023 | $39,226,500 | $202.88 |
555 Aviation 555 S. Aviation Boulevard El Segundo, CA | 1966 / 2015 | 259,754 | 100.0% | Jun-2022 | $205,500,000 | $791.13 |
Source: Appraisal.
The following table presents information relating to comparable office leases for the 11755 Wilshire Property:
| Property Name/Location | Year Built/ Renovated | Tenant | Lease Start Date | Term (Mos.) | Size (SF) | Annual Base Rent PSF | Lease Type |
11601 Wilshire Boulevard Los Angeles, CA | 1984 / 2017 | Vercap Management Charles Schwab Waters Kraus & Paul Engstom, Lipsocmb, and Lack Miradx | 4Q23 4Q23 Jul-23 2Q23 1Q23 | 63 127 65 65 76 | 1,670 4,880 20,333 6,024 | $66.00 $72.00 $66.00 $64.20 $62.04 | FSG FSG FSG FSG FSG |
725 Arizona Avenue Santa Monica, CA | 1990 / NAP | Gem Pack Berries | Oct-23 | 65 | 4,853 | $69.00 | FSG |
2001 Wilshire Boulevard Santa Monica, CA | 1980 / NAP | Kelly Bickle, M.D. Santa Monica Center for Oral Surgery | Sep-23 Oct-22 | 120 124 | 2,492 12,666 | $54.60 $54.60 | FSG FSG |
11620 Wilshire Boulevard Los Angeles, CA | 1976 / 2002 | Dr. Heidi Park | 4Q22 | 90 | 1,153 | $56.40 | FSG |
11766 Wilshire Boulevard Los Angeles, CA | 1990 / NAP | Financial Services Rosland Capital | 2Q23 2Q23 | 84 72 | 11,000 13,000 | $45.60 $42.00 | FSG FSG |
1620 26th Street Santa Monica, CA | 1991 / NAP | Snow Wolves | Jan-22 | 60 | 4,894 | $70.20 | FSG |
Source: Appraisal.
| This is not a research report and was not prepared by any Underwriter’s research department. Please see additional important information and qualifications at the end of this Term Sheet. | ||
| 48 | ||
| Office – CBD | Loan #2 | Cut-off Date Balance: | $51,500,000 | |
| 11755 Wilshire Boulevard | 11755 Wilshire | Cut-off Date LTV: | 42.7% | |
| Los Angeles, CA 90025 | UW NCF DSCR: | 1.80x | ||
| UW NOI Debt Yield: | 14.1% |
Operating History and Underwritten Net Cash Flow. The following table presents certain information relating to the historical operating performance and Underwritten Net Cash Flow at the 11755 Wilshire Property:
| Cash Flow Analysis | ||||||||
| 2020 | 2021 | 2022 | TTM 10/31/2023 | UW | UW PSF | |||
| Base Rent | $13,571,256 | $13,871,466 | $13,750,959 | $13,289,871 | $12,944,515 | (1) | $38.36 | |
| Grossed Up Vacant Space | $0 | $0 | $0 | $0 |
| $7,793,937 |
| $23.10 |
| Gross Potential Rent | $13,571,256 | $13,871,466 | $13,750,959 | $13,289,871 | $20,738,452 | $61.46 | ||
| Less: Free Rent Adjustment & Collection Loss | ($2,041,758) | ($1,531,653) | ($1,420,879) | ($2,386,961 | ) | $0 | $0.00 | |
| Recoveries | $566,880 | $333,881 | $856,326 | $815,544 | $407,615 | $1.21 | ||
| Other Income(2) | $1,309,021 | $1,542,198 | $1,731,916 | $1,828,207 |
| $1,993,871 |
| $5.91 |
| Net Rental Income | $13,405,399 | $14,215,892 | $14,918,322 | $13,546,661 | $23,139,939 | $68.57 | ||
| Less Vacancy & Credit Loss | $0 | $0 | $0 | $0 |
| ($7,793,937 | ) | ($23.10) |
| Effective Gross Income | $13,405,399 | $14,215,892 | $14,918,322 | $13,546,661 | $15,346,002 | $45.48 | ||
| Real Estate Taxes | $1,275,360 | $1,278,423 | $1,271,563 | $1,280,344 | $1,322,024 | $3.92 | ||
| Insurance | $368,484 | $693,421 | $835,598 | $907,359 | $156,807 | $0.46 | ||
| Management Fee | $479,546 | $480,785 | $540,215 | $489,582 | $552,456 | $1.64 | ||
| Other Operating Expenses | $3,656,723 | $4,261,616 | $4,576,219 | $3,003,229 |
| $3,421,397 |
| $10.14 |
| Total Expenses | $5,780,113 | $6,714,245 | $7,223,595 | $5,680,514 | $5,452,684 | $16.16 | ||
| Net Operating Income | $7,625,286 | $7,501,648 | $7,694,727 | $7,866,147 | (3) | $9,893,318 | (3) | $29.32 |
| CapEx | $0 | $0 | $0 | $0 | $67,488 | $0.20 | ||
| TI/LC | $0 | $0 | $0 | $0 |
| $843,600 |
| $2.50 |
| Net Cash Flow | $7,625,286 | $7,501,648 | $7,694,727 | $7,866,147 | $8,982,230 | $26.62 | ||
| Occupancy % | 85.0% | 79.1% | 66.7% | 68.0% | 62.4% | (4) | ||
| NOI DSCR(5) | 1.53x | 1.50x | 1.54x | 1.58x | 1.98x | |||
| NCF DSCR(5) | 1.53x | 1.50x | 1.54x | 1.58x | 1.80x | |||
| NOI Debt Yield(5) | 10.9% | 10.7% | 11.0% | 11.2% | 14.1% | |||
| NCF Debt Yield(5) | 10.9% | 10.7% | 11.0% | 11.2% | 12.8% | |||
| (1) | Annual UW Base Rent includes contractual rent steps through January 2025 totaling $778,540. |
| (2) | Other Income includes parking income, storage rent, antenna rent, tenant revenues, etc. |
| (3) | The increase in NOI between TTM 10/31/2023 and UW is primarily due to the UW insurance premium being lower than the historical insurance expense. The borrower voluntarily elects to carry earthquake insurance and pollution insurance, which totaled $792,799 at the time of loan origination. The loan documents do not require earthquake insurance or pollution coverage, therefore the expense was not underwritten. The UW NOI DSCR, NCF DSCR, NOI Debt Yield, NCF Debt Yield inclusive of the earthquake and pollution insurance would be 1.83x, 1.64x, 13.0%, and 11.7%, respectively. Additionally, WFB did not underwrite a Free Rent Adjustment because all outstanding free rent was reserved at loan origination. |
| (4) | The underwritten economic vacancy is 37.6%. The 11755 Wilshire Property was 62.9% leased as of January 9, 2024. |
| (5) | Debt service coverage ratios and debt yields are based on the 11755 Wilshire Whole Loan. |
Escrows and Reserves.
Real Estate Taxes – The loan documents do not require ongoing monthly tax reserves; provided no event of default is continuing, no Cash Trap Event Period (as defined below) is continuing, and the borrower provides proof of payment at least 25 business days prior to the delinquency date of such taxes. If such conditions are not satisfied, the loan documents require ongoing monthly tax reserves in an amount equal to 1/12 of the tax payments that the lender reasonably estimates will be payable during the next ensuing 12 months.
Insurance – The loan documents do not require ongoing monthly insurance reserves; provided no event of default is continuing, the borrower maintains insurance coverage for the 11755 Wilshire Property as part of blanket or umbrella coverage reasonably approved by the lender, and provides the lender with evidence of the renewals of the insurance policies and paid receipts for the payment of the insurance premiums no later than 20 business days prior to the expiration dates of the policies. If such conditions are not satisfied, the loan documents require ongoing monthly insurance reserves in an amount equal to 1/12 of the insurance premiums that the lender reasonably estimates will be payable during the next ensuing 12 months.
Replacement Reserve – The loan documents require ongoing monthly deposits of $5,624 for replacement reserves, subject to a cap of $67,488 ($0.20 PSF).
TI/LC Reserve – The loan documents require an upfront deposit of $3,000,000 for future tenant improvements and leasing commissions (“TI/LCs”) incurred solely in connection with the Kinetic space. The loan documents require ongoing monthly deposits of $70,300 for TI/LCs. Any amount remaining of the initial $3,000,000 deposit may be used for TI/LCs that may be incurred at the property upon the borrower’s delivery of evidence satisfactory to the lender that (i) the entire Kinetic space has either (A) been re-leased to Kinetic or (B) leased to one or more replacement tenants and (ii) all TI/LCs incurred in connection with the Kinetic space have been paid. In the event the Kinetic space is (i) partially renewed by Kinetic or (ii) partially re-tenanted, the lender is required to retain TI/LC reserve funds equal to $75.00 PSF of the Kinetic space not partially renewed or re-tenanted.
| This is not a research report and was not prepared by any Underwriter’s research department. Please see additional important information and qualifications at the end of this Term Sheet. | ||
| 49 | ||
| Office – CBD | Loan #2 | Cut-off Date Balance: | $51,500,000 | |
| 11755 Wilshire Boulevard | 11755 Wilshire | Cut-off Date LTV: | 42.7% | |
| Los Angeles, CA 90025 | UW NCF DSCR: | 1.80x | ||
| UW NOI Debt Yield: | 14.1% |
Existing TI/LC Reserve – The loan documents require an upfront deposit of $330,575 for existing TI/LCs related to Semler Brossy.
Outstanding Rent Concession Reserve – The loan documents require an upfront deposit of $777,560 for outstanding free rent, gap rent, and future rent credits related to IBISWorld, Inc, Mesa West Capital LLC, and Oak View Group.
Lockbox and Cash Management. The 11755 Wilshire Whole Loan is structured with a hard lockbox and in place cash management. The borrower and the property manager are required to direct the tenants to pay rent directly into the lockbox account, and to deposit any rents otherwise received in such account within five business days after receipt. On each business day, the lockbox bank is required to transfer amounts on deposit in the lockbox account into a lender controlled cash management account, which amounts are to be applied in accordance with the loan documents. If no Cash Trap Event Period exists, all excess cash flow will be disbursed to the borrower. During the continuance of a Cash Trap Event Period, excess cash flow is required to be held by the lender as additional collateral.
A “Cash Trap Event Period” will commence upon the earlier of the following:
| (i) | the occurrence of an event of default under the 11755 Wilshire Whole Loan; or |
| (ii) | the net cash flow debt service coverage ratio (“NCF DSCR”) on the 11755 Wilshire Whole Loan falling below 1.20x for 3 consecutive calendar months. |
A Cash Trap Event Period will end upon the occurrence of the following:
| ● | with regard to clause (i), the cure of such event of default; and |
| ● | with regard to clause (ii), the NCF DSCR being at least 1.20x (for 3 consecutive calendar months). |
Subordinate Debt. None.
Mezzanine Loan and Preferred Equity. None.
Release of Property. Not permitted.
Letter of Credit. None.
Right of First Offer/Right of First Refusal. None.
Ground Lease. None.
Terrorism Insurance. The 11755 Wilshire Whole Loan documents require that the “all risk” insurance policy required to be maintained by the borrower provides coverage for terrorism in an amount equal to the full replacement cost of the 11755 Wilshire Property, as well as business interruption insurance covering no less than the 18-month period following the occurrence of a casualty event, together with a 6-month extended period of indemnity (provided that if TRIPRA or a similar statute is not in effect, the borrower will not be obligated to pay terrorism insurance premiums in excess of two times the annual premium for the property and business interruption/rental loss insurance coverage). See “Risk Factors—Risks Relating to the Mortgage Loans—Terrorism Insurance May Not Be Available for All Mortgaged Properties” in the prospectus.
| This is not a research report and was not prepared by any Underwriter’s research department. Please see additional important information and qualifications at the end of this Term Sheet. | ||
| 50 | ||
| Mixed Use – Office/Lab | Loan #3 | Cut-off Date Balance: | $50,000,000 | |
| Various | Nvidia Santa Clara | Cut-off Date LTV: | 41.5% | |
| Santa Clara, CA 95050 | UW NCF DSCR: | 2.01x | ||
| UW NOI Debt Yield: | 14.1% |

| This is not a research report and was not prepared by any Underwriter’s research department. Please see additional important information and qualifications at the end of this Term Sheet. | ||
| 51 | ||
| Mixed Use – Office/Lab | Loan #3 | Cut-off Date Balance: | $50,000,000 | |
| Various | Nvidia Santa Clara | Cut-off Date LTV: | 41.5% | |
| Santa Clara, CA 95050 | UW NCF DSCR: | 2.01x | ||
| UW NOI Debt Yield: | 14.1% |

| This is not a research report and was not prepared by any Underwriter’s research department. Please see additional important information and qualifications at the end of this Term Sheet. | ||
| 52 | ||
| Mixed Use – Office/Lab | Loan #3 | Cut-off Date Balance: | $50,000,000 | |
| Various | Nvidia Santa Clara | Cut-off Date LTV: | 41.5% | |
| Santa Clara, CA 95050 | UW NCF DSCR: | 2.01x | ||
| UW NOI Debt Yield: | 14.1% |
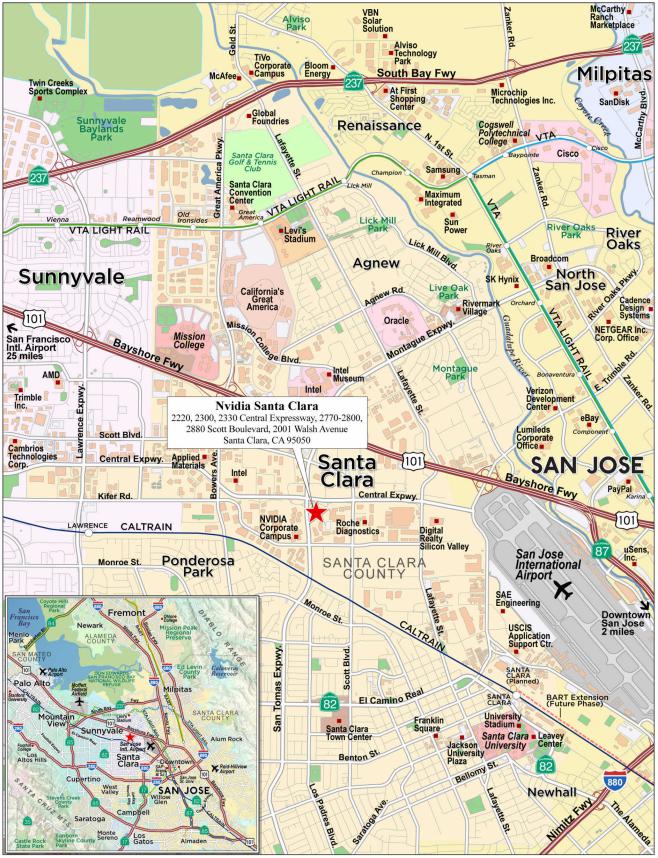
| This is not a research report and was not prepared by any Underwriter’s research department. Please see additional important information and qualifications at the end of this Term Sheet. | ||
| 53 | ||
| Mortgage Loan No. 3 – Nvidia Santa Clara |
| Mortgage Loan Information | Property Information | ||||||
| Mortgage Loan Seller: | JPMCB | Single Asset/Portfolio(2): | Single Asset | ||||
| Credit Assessment (Moody’s/Fitch/KBRA): | Baa2/BBB-sf/BBB- | Location: | Santa Clara, CA 95050 | ||||
| Original Balance(1): | $50,000,000 | General Property Type: | Mixed Use | ||||
| Cut-off Date Balance(1): | $50,000,000 | Detailed Property Type(2): | Office/Lab | ||||
| % of Initial Pool Balance: | 9.6% | Title Vesting: | Fee | ||||
| Loan Purpose: | Refinance | Year Built/Renovated(2): | 1996-1999; 2013 / 2015-2023 | ||||
| Borrower Sponsor: | Preylock Real Estate Holdings, | Size(2): | 551,233 SF | ||||
| LLC (DE) | Cut-off Date Balance Per SF(1): | $236 | |||||
| Guarantors: | Farshid Steve Shokouhi, Brett | Maturity Date Balance Per SF(1): | $236 | ||||
| Michael Lipman and Reitman | Property Manager: | Preylock Property Management, LLC | |||||
| 1994 Gift Trust U/A/D 9/27/1994 | (borrower–related) | ||||||
| Mortgage Rate: | 6.876115385% | ||||||
| Note Date: | 11/9/2023 | ||||||
| First Payment Date: | 1/1/2024 | ||||||
| Maturity Date: | 12/1/2028 | Underwriting and Financial 3) | |||||
| Original Term to Maturity: | 60 months | ||||||
| Original Amortization Term: | 0 months | Underwriting and Financial Information | |||||
| IO Period: | 60 months | UW NOI: | $18,338,337 | ||||
| Seasoning: | 2 months | UW NOI Debt Yield(1): | 14.1% | ||||
| Prepayment Provisions: | L(26),D(27),O(7) | UW NOI Debt Yield at Maturity(1): | 14.1% | ||||
| Lockbox/Cash Mgmt Status: | Hard/Springing | UW NCF DSCR(1): | 2.01x | ||||
| Additional Debt Type(1): | Pari Passu / Mezzanine | Most Recent NOI: | $16,913,723 (12/31/2022) | ||||
| Additional Debt Balance(1): | $80,000,000 / $50,500,000 | 2nd Most Recent NOI: | $17,254,670 (12/31/2021) | ||||
| Future Debt Permitted (Type): | No (NAP) | 3rd Most Recent NOI: | $15,656,636 (12/31/2020) | ||||
| Reserves(4) | Most Recent Occupancy: | 100.0% (2/1/2024) | |||||
| Type | Initial | Monthly | Cap | 2nd Most Recent Occupancy: | 100.0% (12/31/2023) | ||
| RE Taxes: | $439,564 | $226,510 | NAP | 3rd Most Recent Occupancy: | 100.0% (12/31/2022) | ||
| Insurance: | $0 | Springing | NAP | Appraised Value (as of)(3)(5): | $313,247,393 (4/20/2023) | ||
| Replacement Reserve: | $0 | Springing | NAP | Appraised Value PSF: | $568 | ||
| TI/LC Reserve: | $5,000,000 | Springing | NAP | Cut-off Date LTV Ratio(1)(3)(5): | 41.5% | ||
| Other Reserve: | $9,144,397 | $0 | NAP | Maturity Date LTV Ratio(1)(3)(5): | 41.5% | ||
| Sources and Uses | ||||||
| Sources | Proceeds | % of Total | Uses | Proceeds | % of Total | |
| Whole Loan Amount(1): | $130,000,000 | 68.8% | Loan Payoff(7): | $166,671,496 | 88.2% | |
| Mezzanine Loan Amount(6): | $50,500,000 | 26.7% | Upfront Reserves: | $14,583,961 | 7.7% | |
| Borrower Sponsor Equity | $8,487,293 | 4.5% | Closing Costs: | $7,731,836 | 4.1% | |
| Total Sources: | $188,987,293 | 100.0% | Total Uses: | $188,987,293 | 100.0% | |
| (1) | The Nvidia Santa Clara Mortgage Loan (as defined below) is part of the Nvidia Santa Clara Whole Loan (as defined below), which is evidenced by five pari passu notes with an aggregate outstanding principal balance of $130.0 million. Underwriting and Financial Information set forth above, including UW NOI Debt Yield, UW NOI Debt Yield at Maturity, UW NCF DSCR, Cut-off date LTV Ratio and Maturity Date LTV Ratio is calculated based on the outstanding balance of the Nvidia Santa Clara Whole Loan. |
| (2) | The Nvidia Santa Clara Property (as defined below) is comprised of a six-building campus across a contiguous 34.38-acre site. See “Building Summary” below for Year Built / Renovated and Size of the individual buildings comprising the Nvidia Santa Clara Property. There are no property releases permitted in accordance with the Nvidia Santa Clara Whole Loan documents. |
| (3) | The Appraised Value of $313,247,393 represents the “as-if-funded” appraised value based on the hypothetical assumption that the cost of the outstanding tenant improvement allowances have been fully escrowed and will be available to fund such tenant improvements. Upon origination of the Nvidia Santa Clara Whole Loan, $8,146,892.50 was reserved to fund all outstanding tenant improvements. Based on the “as-is” appraised value of $305,100,000, the Nvidia Santa Clara Whole Loan results in a Cut-off Date LTV Ratio and Maturity Date LTV Ratio of 42.6%. |
| (4) | See “Escrows and Reserves” below for further discussion of reserve information. |
| (5) | The appraisal also provides for a concluded “as dark” value of $184,400,000 as of April 20, 2023. Based on the “as dark” appraised value, the Nvidia Santa Clara Whole Loan results in a Cut-off Date LTV Ratio and LTV Ratio at Maturity of 70.5%. Additionally, the appraisal provides for a land value of $224,600,000. Based on the appraised land value, the Nvidia Santa Clara Whole Loan results in a Cut-off Date LTV Ratio and LTV Ratio at Maturity of 57.9%. |
| (6) | Concurrently with the funding of the Nvidia Santa Clara Whole Loan, JPMorgan Chase Bank, National Association funded a mezzanine loan in the amount of $50,500,000, (the “Nvidia Santa Clara Mezzanine Loan” and, together with the Nvidia Santa Clara Whole Loan, the “Nvidia Santa Clara Total Debt”), which was subsequently sold to, and is currently held by, a third-party lender. The Nvidia Santa Clara Total Debt results in a Cut-off Date LTV Ratio and LTV Ratio at Maturity of 57.6%. See “Mezzanine Loan and Preferred Equity” below. |
| (7) | The Loan Payoff amount is shown net of existing debt attributable to 2890 Scott Boulevard, a 75,000 square foot, non-collateral office building. The total Loan Payoff amount, including amounts attributable to 2890 Scott Boulevard, is $189,348,589. The existing debt was allocated amongst the Nvidia Santa Clara Properties and 2890 Scott Boulevard (non-collateral) based on net rentable area, and the assumed Loan Payoff amount for 2890 Scott Boulevard was excluded from the Loan Payoff amount as shown in the chart above. In connection with the origination of the Nvidia Santa Clara Whole Loan, the borrower sponsor invested a total of $17,912,200 of fresh equity to retire the existing loan (inclusive of the non-collateral 2890 Scott Boulevard parcel), fund upfront reserves and pay closing costs. |
| This is not a research report and was not prepared by any Underwriter’s research department. Please see additional important information and qualifications at the end of this Term Sheet. | ||
| 54 | ||
| Mixed Use – Office/Lab | Loan #3 | Cut-off Date Balance: | $50,000,000 | |
| Various | Nvidia Santa Clara | Cut-off Date LTV: | 41.5% | |
| Santa Clara, CA 95050 | UW NCF DSCR: | 2.01x | ||
| UW NOI Debt Yield: | 14.1% |
The Mortgage Loan. The third largest mortgage loan (the “Nvidia Santa Clara Mortgage Loan”) is part of a whole loan (the “Nvidia Santa Clara Whole Loan”) with an original principal balance of $130,000,000. The Nvidia Santa Clara Whole Loan is secured by a first priority fee interest encumbering a six-building, 551,233 square foot mixed-use office/lab campus located in Santa Clara, California (the “Nvidia Santa Clara Property”). The Nvidia Santa Clara Whole Loan is comprised of five pari passu promissory notes in the aggregate original principal balance of $130,000,000. Note A-2 along with note A-4, with an aggregate original principal balance of $50,000,000, represents the Nvidia Santa Clara Mortgage Loan and will be included in the BANK5 2024-5YR5 securitization trust. The remaining notes of the Nvidia Santa Clara Whole Loan have been contributed to various securitization trusts, as shown in the Nvidia Santa Clara Whole Loan Summary table below. The Nvidia Santa Clara Whole Loan will be serviced pursuant to the pooling and servicing agreement for the BANK5 2023-5YR4 transaction. See “Description of the Mortgage Pool—The Whole Loans—The Non-Serviced Pari Passu Whole Loans” and “Pooling and Servicing Agreement—Servicing of the Non-Serviced Mortgage Loans” in the prospectus.
| Nvidia Santa Clara Whole Loan Summary | ||||
Note | Original Balance | Cut-off Date Balance | Note Holder | Controlling Piece |
| A-1 | $50,000,000 | $50,000,000 | BANK5 2023-5YR4 | Yes |
| A-2 | $35,000,000 | $35,000,000 | BANK5 2024-5YR5 | No |
| A-3 | $20,000,000 | $20,000,000 | BANK5 2023-5YR4 | No |
| A-4 | $15,000,000 | $15,000,000 | BANK5 2024-5YR5 | No |
| A-5 | $10,000,000 | $10,000,000 | BMARK 2023-B40 | No |
| Total (Whole Loan) | $130,000,000 | $130,000,000 | ||
The Borrower and the Borrower Sponsor. The borrower for the Nvidia Santa Clara Whole Loan is Preylock Reitman Santa Clara II, LLC, a single purpose entity with two independent directors in its organization structure. Legal counsel to the borrower delivered a non-consolidation opinion in connection with the origination of the Nvidia Santa Clara Whole Loan. The borrower sponsor is Preylock Real Estate Holdings, LLC (DE). The non-recourse carveout guarantors are Farshid Steve Shokouhi, Brett Michael Lipman and Reitman 1994 Gift Trust U/A/D 9/27/1994. Founded by Steve Shokouhi and Brett Lipman in 2016, Preylock Real Estate Holdings (“Preylock”) is a Los Angeles-based real estate acquisition and management company with over $4.0 billion of assets under management. Preylock investors range from publicly traded corporations, insurance companies and sovereign wealth funds to high net worth individuals. Preylock acquires and manages strategically located assets with a long-term value thesis (tenant credit, asset positioning and geography). Preylock’s portfolio consists of approximately 3.0 million SF of office/lab space and 7.3 million SF of industrial/distribution facilities.
Brett Lipman is a Managing Partner and CEO of Preylock. Prior to founding Preylock, Mr. Lipman oversaw acquisitions for J.P. Morgan’s $65 billion Global Real Assets group. Mr. Lipman previously held positions at Highbridge Capital Management and as an investment banker within J.P. Morgan’s Mergers and Acquisitions group. Steve Shokouhi is a Managing Partner, President and COO of Preylock, where he oversees the day-to-day operations of all assets, including design, construction and development. He formerly ran a real estate family office in New York. Mr. Shokouhi received his MBA from Wharton School of Business.
The Property. The Nvidia Santa Clara Property consists of a six-building, mixed-use office/lab campus totaling 551,233 SF of net rentable area across a contiguous 34.38-acre site. The Nvidia Santa Clara Property is a mission critical facility for its sole tenant, Nvidia Corporation (NASDAQ: NVDA; Moody’s/S&P: A1/A+) (“Nvidia”), the sixth most valuable company globally, by market capitalization, as of January 2024. Although Nvidia is underwritten as the sole tenant, Futurewei Technologies, Inc. (“Futurewei”) is the prime lessee pursuant to a direct lease with the borrower sponsor with respect to three buildings comprising a portion of the Nvidia Santa Clara Property (2330 Central Expressway, 2220 Central Expressway and 2300 Central Expressway), totaling 31.1% of NRA, with respect to which Nvidia has entered into a sublease as the sublessee. Nvidia directly leases from the borrower sponsor with respect to the remaining three buildings, accounting for 68.9% of NRA. Per the consent to sublease encompassing all subleased space by Nvidia, Nvidia is required to assume all of Futurewei’s prime lease obligations and enter into a direct lease with the borrower on the same terms and conditions as the terminated prime lease (including with respect to prime rent payments) (a “Nvidia Prime Lease Guaranty”) in the event that any event occurs that might cause or permit the prime lease to be terminated (including, but not limited to, in the event that Futurewei defaults on its prime lease obligations) (a “Prime Lease Termination Event”). With respect to the 2220 Central Expressway building, the applicable sublease, as well as the related consent to sublease among the related borrower, as the landlord, Futurewei and Nvidia (“Consent to Sublease”), are fully executed, but Futurewei currently remains in possession of the premises. Nvidia is expected to take occupancy in June 2024, and not withstanding any proposed work or alterations to be constructed pursuant to the applicable sublease, Nvidia’s lease obligations with respect to 2220 Central Expressway will commence upon the earlier of (i) August 1, 2024, (ii) a Prime Lease Termination Event or (iii) written notice of such commencement from Nvidia or Futurewei.
The Nvidia Santa Clara Property is strategically located in Santa Clara, California and currently contains more than 257,925 SF of laboratory space (46.8% of NRA) which is primarily utilized for research and development (“R&D”) functions and directly supports Nvidia’s technology platform. The borrower sponsor plans to continue building out the R&D footprint at the Nvidia Santa Clara Property, providing for approximately $8.1 million in planned tenant improvements. The R&D operations at the Nvidia Santa Clara Property benefit from utilities provided by Silicon Valley Power, a non-profit energy provider owned by the city of Santa Clara, allowing for utility costs ranging from approximately 25% to 57% lower than neighboring communities. The R&D space is spread across all six buildings, varying in size, with approximately 293,308 SF of traditional office space (53.2% of NRA) which primarily supports R&D functions at the Nvidia Santa Clara Property. The Nvidia Santa Clara Property features 1,633 parking spaces resulting in an aggregate parking ratio of approximately 2.96 spaces per 1,000 SF.
The Nvidia Santa Clara Property, along with surrounding non-collateral buildings located along the San Thomas Expressway (known as “Nvidia Headquarters – East Campus”) are located alongside Nvidia’s newly constructed, non-collateral, Voyager and Endeavor buildings (known as “Nvidia Headquarters – West Campus” and, together with the Nvidia Headquarters – East Campus, the “Nvidia Headquarters”). The Voyager and Endeavor buildings, comprised of approximately 1.3 million SF collectively, were completed in 2022 and 2017, respectively. Nvidia constructed the Voyager and Endeavor buildings for approximately $920 million with construction spanning approximately 4 years for the Voyager building and 2 years for the Endeavor building. The Voyager and Endeavor buildings primarily house office, meeting and key corporate functions, with less R&D specific density. The Voyager and Endeavor buildings are connected to the Nvidia Headquarters – East Campus via a Nvidia constructed footbridge connecting the R&D functions at the Nvidia Headquarters – East Campus and the Voyager and Endeavor buildings.
| This is not a research report and was not prepared by any Underwriter’s research department. Please see additional important information and qualifications at the end of this Term Sheet. | ||
| 55 | ||
| Mixed Use – Office/Lab | Loan #3 | Cut-off Date Balance: | $50,000,000 | |
| Various | Nvidia Santa Clara | Cut-off Date LTV: | 41.5% | |
| Santa Clara, CA 95050 | UW NCF DSCR: | 2.01x | ||
| UW NOI Debt Yield: | 14.1% |
| Building Summary(1) | |||||||||||
| Building | Lease Type | Year Built / Renovated | Building SF(2) | Office(3) | R&D(3) | Electrical Power(3) | Annual UW Base Rent(2) | Annual UW Base Rent PSF(2) | Lease Expiration | Term. Option (Y/N) | Renewal Options |
| 2880 Scott Boulevard | Direct | 2013 / 2021 | 200,000 | 70.0% | 30.0% | 5,000 Amps | $7,035,460 | $35.18 | 9/30/2030 | N | 1 x 6 yr |
| 2770-2800 Scott Boulevard(4) | Direct | 1997 / 2021 | 99,800 | 20.0% | 80.0% | 4,000 Amps | $3,372,551 | $33.79 | 5/31/2028 | N | 1 x 8 yr |
| 2001 Walsh Avenue(5) | Direct | 1996 / 2021 | 80,051 | 5.0% | 95.0% | 4,000 Amps | $2,520,678 | $31.49 | 4/30/2029 | N | 1 x 8 yr |
| 2330 Central Expressway(6)(7)(8) | Subleased | 1999 / NAP | 62,522 | 70.0% | 30.0% | 3,000 Amps | $2,243,614 | $35.89 | 7/31/2027 | N | 2 x 5 yr |
| 2220 Central Expressway(6)(7)(9) | Subleased | 1999 / 2019 & 2020 | 62,522 | 85.0% | 15.0% | 3,000 Amps | $2,243,614 | $35.89 | 7/31/2027 | N | 2 x 5 yr |
| 2300 Central Expressway(6)(7)(8) | Subleased | 1999 / 2015 & 2020 | 46,338 | 70.0% | 30.0% | 2,000 Amps | $1,662,848 | $35.89 | 7/31/2027 | N | 2 x 5 yr |
| Total / Weighted Average | 551,233 | 53.2% | 46.8% | $19,078,765 | $34.61 | ||||||
| (1) | The named entity on all direct leases and subleases is the credit rated entity, Nvidia Corporation. |
| (2) | Based on the underwritten rent roll as of February 1, 2024 inclusive of straight line rent of $1,264,833 through the earlier of (i) the expiration date of the applicable lease or (ii) the maturity date of the Nvidia Santa Clara Whole Loan due to Nvidia’s investment grade rating. All underwritten metrics (inclusive of lease expiration dates) reflect the prime lease (which, in certain instances, is above the applicable sublease rent) due to the Nvidia Prime Lease Guaranty. See “The Property” above. |
| (3) | Office and R&D percentages along with Electrical Power are, according to the appraisal, dated August 13, 2023 and, in certain instances, may not account for ongoing R&D build-outs. |
| (4) | Nvidia’s lease with respect to 2770-2800 Scott Boulevard is subject to a free rent period commencing on April 1, 2026 and expiring on May 31, 2026. The borrower was required, at loan origination, to reserve a total of approximately $997,505 for free rent, which includes approximately $566,908 reserved for 2770-2800 Scott Boulevard. |
| (5) | Nvidia’s lease with respect to 2001 Walsh Avenue is subject to a free rent period commencing on March 1, 2027 and expiring on April 30, 2027. The borrower was required, at loan origination, to reserve a total of approximately $997,505 for free rent, which includes approximately $430,597 reserved for 2001 Walsh Avenue. |
| (6) | 2300 Central Expressway, 2220 Central Expressway and 2330 Central Expressway are leased to Futurewei under a single direct lease and Futurewei subleases all of its demised space to Nvidia pursuant to three separate subleases. |
| (7) | According to the applicable sublease agreements, Nvidia is subject to a rental rate of (i) $18.00 per square foot at 2330 Central Expressway, (ii) $34.18 per square foot at 2220 Central Expressway and (iii) $18.00 per square foot at 2300 Central Expressway, resulting in an aggregate sublease rent of $23.90 across all subleases. The Nvidia Prime Lease Guaranty applies to contractual rent payments in accordance with each applicable prime lease, including those instances where Futurewei’s direct leases call for rents in excess of the applicable sublease. |
| (8) | 2300 Central Expressway and 2330 Central Expressway are currently in Nvidia’s possession and in the process of build-out. Nvidia is expected to complete its build-out and begin physically occupying the space in the first quarter of 2024. |
| (9) | The sublease and Consent to Sublease for 2220 Central Expressway are fully executed, but Futurewei currently remains in possession of the premises. Nvidia is expected to take occupancy in June 2024, and notwithstanding any proposed work or alterations to be constructed pursuant to the applicable sublease, Nvidia’s lease obligations with respect to 2220 Central Expressway will commence upon the earlier of (i) August 1, 2024, (ii) a Prime Lease Termination Event or (iii) written notice of such commencement from Nvidia or Futurewei. We cannot assure you that Nvidia will occupy the space at 2220 Central Expressway as expected or at all. |
Since 2014, Nvidia has gradually expanded its footprint within the Nvidia Headquarters as space has become available, demonstrating continuous demand and ongoing investment in its overall footprint. In 2014, Nvidia signed its first, five-year lease at 2001 Walsh Avenue for 80,051 SF.
In 2017, Nvidia leased 99,800 SF of space at 2770-2800 Scott Boulevard and 200,000 SF of space at 2880 Scott Boulevard. In 2018, Nvidia subleased 75,000 SF of office space from Futurewei at 2890 Scott Boulevard (non-collateral parcel) which is comprised of 100% office space, with no R&D component.
In 2019, Huawei (the parent company to Futurewei) was forced to wind down its operations in the United States by the United States government. Following the news, Nvidia continued to expand its presence across the Nvidia Headquarters. In 2022, Nvidia subleased the remaining space occupied by Futurewei at the Nvidia Santa Clara Property across three buildings. Nvidia subleased a total of 108,860 SF of space across 2300 Central Expressway and 2330 Central Expressway. Nvidia subleased an additional 62,522 SF of space at 2220 Central Expressway and is anticipated to take possession of the space at the earlier of Futurewei’s departure or June 1, 2024. We cannot assure you that Nvidia will occupy the space at 2220 Central Expressway as expected or at all.
According to the borrower sponsor, Nvidia has invested over $7.0 million to date in capital improvements and has indicated further planned capital improvements of approximately $5.0 million over the next four years across its legacy buildings (2001 Walsh Avenue, 2770-2800 Scott Boulevard and 2880 Scott Boulevard), along with approximately $11.5 million of planned capital improvements into its three most recently subleased buildings (2220, 2300 & 2330 Central Expressway). Capital expenditures are primarily targeted towards the build out of additional lab space, resulting in a total completed and planned capital investment of approximately $23.5 million by Nvidia.
Major Tenants.
Nvidia (551,233 SF, 100.0% of NRA, 100.0% of underwritten base rent), the sixth most valuable company globally, by market capitalization, as of January 2024, with a market capitalization of approximately $1.393 trillion as of January 2024, is an international full-stack computing company with data-center-scale offerings focused on two operating segments: compute & networking and graphics. Nvidia was founded in California in April of 1993 and has been a pioneer in industrial digitalization since then. Originally focused on PC graphics, Nvidia has expanded to several other computationally intensive fields. Fueled by the sustained demand for 3D graphics and the scale of the gaming market, Nvidia’s invention of the graphics processing unit in 1999 sparked growth in computer design and ignited the modern era of computer graphics and architecture to create platforms for scientific computing, artificial intelligence, data science, autonomous vehicles, robotics, metaverse and 3D internet applications. Nvidia specializes in markets where its computing platforms can provide acceleration for applications. These platforms incorporate processors, interconnects, software, algorithms, systems, and services to deliver unique value.
As of the trailing-12 months ending January 29, 2023 (“January 2023”), reported revenue for Nvidia was approximately $26.97 billion, representing a slight increase from the trailing-twelve months ending January 30, 2022 revenue of $26.91 billion and resulting in a January 2023 net income of approximately $4.37 billion. Nvidia’s January 2023 revenue is comprised of four primary components: data center revenue (approximately $15.01 billion), gaming revenue (approximately $9.07 billion), professional visualization revenue (approximately $1.54 billion) and automotive revenue (approximately $903.0 million). Nvidia’s leases are structured with no termination options, renewal options varying between 5 and 8 years at each individual property and expire between July 2027 and September 2030 (see “Building Summary” above for a detailed description).
| This is not a research report and was not prepared by any Underwriter’s research department. Please see additional important information and qualifications at the end of this Term Sheet. | ||
| 56 | ||
| Mixed Use – Office/Lab | Loan #3 | Cut-off Date Balance: | $50,000,000 | |
| Various | Nvidia Santa Clara | Cut-off Date LTV: | 41.5% | |
| Santa Clara, CA 95050 | UW NCF DSCR: | 2.01x | ||
| UW NOI Debt Yield: | 14.1% |
The following table presents certain information relating to the sole tenant at the Nvidia Santa Clara Property:
| Tenant Summary(1)(2)(3)(4)(5) | |||||||||
| Tenant Name | Credit Rating (Fitch/Moody’s/ S&P) | Tenant SF | Approx. % of SF | Annual UW Rent | % of Total Annual UW Rent | Annual UW Rent PSF | Renewal Options(4) | ||
| Termination Option (Y/N) | Lease Expiration(4) | ||||||||
| Nvidia Corporation | NR/A1/A+ | 551,233 | 100.0% | $19,078,765 | 100.0% | $34.61 | N | Various | Various |
| Total/Wtd. Avg. | 551,233 | 100.0% | $19,078,765 | 100.0% | $34.61 | ||||
| Occupied Collateral Total | 551,233 | 100.0% | $19,078,765 | 100.0% | $34.61 | ||||
| Vacant Space | NAP | NAP | |||||||
| Total | 551,233 | 100.0% | |||||||
| (1) | Based on the underwritten rent roll as of February 1, 2024, inclusive of straight line rent of $1,264,833 through the earlier of (i) the expiration date of the applicable lease or (ii) the maturity date of the Nvidia Santa Clara Whole Loan due to Nvidia’s investment grade rating. All underwritten metrics (inclusive of lease expiration dates) reflect the prime lease (which, in certain instances, is above the applicable sublease rent) due to the Nvidia Prime Lease Guaranty. See “The Property” above. |
| (2) | The named entity on all direct leases and subleases is the credit rated entity, Nvidia Corporation. |
| (3) | The sublease and Consent to Sublease for 2220 Central Expressway are fully executed, but Futurewei currently remains in possession of the premises. Nvidia is expected to take occupancy in June 2024, and notwithstanding any proposed work or alterations to be constructed pursuant to the applicable sublease, Nvidia’s lease obligations with respect to 2220 Central Expressway will commence upon the earlier of (i) August 1, 2024, (ii) a Prime Lease Termination Event or (iii) written of such commencement from Nvidia or Futurewei. We cannot assure you that Nvidia will occupy the space at 2220 Central Expressway as expected or at all. |
| (4) | See “Building Summary” above for a detailed description. |
| (5) | Nvidia currently subleases a total of 171,382 SF of space at 2330 Central Expressway, 2220 Central Expressway and 2300 Central Expressway at an aggregate sublease rent of $23.90. 2300 Central Expressway and 2330 Central Expressway are currently in Nvidia’s possession and in the process of build-out. Nvidia is expected to complete its build-out and begin physically occupying the space in the first quarter of 2024. |
The following table presents certain information relating to the lease rollover schedule for the Nvidia Santa Clara Property based on initial lease expiration dates:
| Lease Rollover Schedule(1)(2)(3) | ||||||||
| Year | # of Leases Rolling | SF Rolling | UW Rent PSF Rolling | Approx. % of Total SF Rolling | Approx. Cumulative % of SF Rolling | Total UW Rent Rolling | Approx. % of Total Rent Rolling | Approx. Cumulative % of Total Rent Rolling |
| MTM | 0 | 0 | $0.00 | 0.0% | 0.0% | $0 | 0.0% | 0.0% |
| 2024 | 0 | 0 | $0.00 | 0.0% | 0.0% | $0 | 0.0% | 0.0% |
| 2025 | 0 | 0 | $0.00 | 0.0% | 0.0% | $0 | 0.0% | 0.0% |
| 2026 | 0 | 0 | $0.00 | 0.0% | 0.0% | $0 | 0.0% | 0.0% |
| 2027 | 3 | 171,382 | $35.89 | 31.1% | 31.1% | $6,150,076 | 32.2% | 32.2% |
| 2028 | 1 | 99,800 | $33.79 | 18.1% | 49.2% | $3,372,551 | 17.7% | 49.9% |
| 2029 | 1 | 80,051 | $31.49 | 14.5% | 63.7% | $2,520,678 | 13.2% | 63.1% |
| 2030 | 1 | 200,000 | $35.18 | 36.3% | 100.0% | $7,035,460 | 36.9% | 100.0% |
| 2031 | 0 | 0 | $0.00 | 0.0% | 100.0% | $0 | 0.0% | 100.0% |
| 2032 | 0 | 0 | $0.00 | 0.0% | 100.0% | $0 | 0.0% | 100.0% |
| 2033 | 0 | 0 | $0.00 | 0.0% | 100.0% | $0 | 0.0% | 100.0% |
| 2034 | 0 | 0 | $0.00 | 0.0% | 100.0% | $0 | 0.0% | 100.0% |
| 2035 & Beyond | 0 | 0 | $0.00 | 0.0% | 100.0% | $0 | 0.0% | 100.0% |
| Vacant | 0 | 0 | $0.00 | 0.0% | 100.0% | $0 | 0.0% | 100.0% |
| Total/Wtd. Avg. | 6 | 551,233 | $34.61 | 100.0% | $19,078,765 | 100.0% | ||
| (1) | Based on the underwritten rent roll as of February 1, 2024, inclusive of straight line rent of $1,264,833 through the earlier of (i) the expiration date of the applicable lease or (ii) the maturity date of the Nvidia Santa Clara Whole Loan due to Nvidia’s investment grade rating. All underwritten metrics (inclusive of lease expiration dates) reflect the prime lease (which, in certain instances, is above the applicable sublease rent) due to the Nvidia Prime Lease Guaranty. See “The Property” above. |
| (2) | The named entity on all direct leases and subleases is the credit rated entity, Nvidia Corporation. |
| (3) | The sublease and Consent to Sublease for 2220 Central Expressway are fully executed, but Futurewei currently remains in possession of the premises. Nvidia is expected to take occupancy in June 2024, and notwithstanding any proposed work or alterations to be constructed pursuant to the applicable sublease, Nvidia’s lease obligations with respect to 2220 Central Expressway will commence upon the earlier of (i) August 1, 2024, (ii) a Prime Lease Termination Event or (iii) written notice of such commencement from Nvidia or Futurewei. We cannot assure you that Nvidia will occupy the space at 2220 Central Expressway as expected or at all. |
The Market. The Nvidia Santa Clara Property is located in Santa Clara, California within the San Jose-Sunnyvale-Santa Clara metro area (“San Jose MSA”) approximately 1.2 miles east of the San Jose Mineta International Airport. The Nvidia Santa Clara Property is accessible from Highway 101, State Route 82, Lawrence Expressway and San Tomas Expressway. The immediate area surrounding the Nvidia Santa Clara Property is served by additional transportation facilities including an existing light rail line and the Guadalupe River and Coyote Creek trail systems. According to the appraisal, the San Jose MSA had a November 2022 population of approximately 2,019,900 and gross metropolitan product of approximately $305.4 billion, representing a 0.6% and 2.9% increase, respectively, over year-end 2021. Additionally, the appraisal indicates that employment within the San Jose MSA surpassed pre COVID-19 pandemic levels in 2022, with a total employment of approximately 1,159,700 and an unemployment rate of 2.7%. Furthermore, employment in the San Jose MSA predominantly consists of white collar jobs (73.9%), which is broken out between professional (36.3%), management/business/financial (22.1%), administrative support (7.9%) and sales and sales related (7.5%). According to the appraisal, the San Jose MSA is expected to outperform comparable national region metro areas in six of eight key economic indicators including gross metro product, total employment and population, among others.
| This is not a research report and was not prepared by any Underwriter’s research department. Please see additional important information and qualifications at the end of this Term Sheet. | ||
| 57 | ||
| Mixed Use – Office/Lab | Loan #3 | Cut-off Date Balance: | $50,000,000 | |
| Various | Nvidia Santa Clara | Cut-off Date LTV: | 41.5% | |
| Santa Clara, CA 95050 | UW NCF DSCR: | 2.01x | ||
| UW NOI Debt Yield: | 14.1% |
The Nvidia Santa Clara Property is located within the San Jose industrial market, which is driven by the growth of Silicon Valley’s technology-based economy. The growth of Silicon Valley’s technology-based economy over the past 30 years has supported increased demand for specific types of industrial real estate, such as data centers and flex properties catering to high-tech firms conducting R&D. Overall vacancy rates in the San Jose industrial market remain low compared to historical levels at 6.0%, which, according to the appraisal, is primarily due to low levels of new construction and the continuation of the long-term trend to re-purpose industrial sites for housing and other uses, resulting in a net reduction in industrial supply. Strong demand and tight supply have allowed rents in the San Jose industrial market to remain among the highest in the nation, second to only San Francisco. Competition from new supply is limited with approximately 3.2 million SF of industrial product under construction in the market.
Additionally, the Nvidia Santa Clara Property is located within the Central Santa Clara Flex/R&D submarket (the “Central Santa Clara R&D Submarket”). The Central Santa Clara R&D Submarket is a hub for data centers, given its proximity to many established technology based companies such as Alphabet/Google, Apple Inc., Tesla Motors Inc. and Meta Platforms Inc. The Central Santa Clara R&D Submarket is attractive to technology based companies in part due to lower utility costs provided by Silicon Valley Power, a non-profit energy provider owned by the city of Santa Clara, allowing for utility costs 25% to 57% below neighboring communities. According to the appraisal, the Central Santa Clara R&D Submarket has a current vacancy rate of 11.7% and triple net lease (“NNN”) Flex/R&D market rents of $29.07 per square foot. Currently, average asking rent is $34.64 per square foot for NNN R&D centric space in the Central Santa Clara R&D Submarket. From 2004 through year-end 2022, the Central Santa Clara R&D Submarket had a stagnant inventory of 3,950,584 SF.
The following table presents certain information relating to the appraisal’s market rent conclusions for the Nvidia Santa Clara Property:
| Market Rent Summary(1) | ||||
| 2001 Walsh Avenue | 2220-2330 Central Expressway | 2770-2800 Scott Boulevard | 2880 Scott Boulevard | |
| Market Rent (PSF) | $34.20 | $36.60 | $34.20 | $34.20 |
| Lease Term (Years) | 7.5 | 7.5 | 7.5 | 7.5 |
| Lease Type | NNN | NNN | NNN | NNN |
| Rent Increase Projection | 3.0% / Year | 3.0% / Year | 3.0% / Year | 3.0% / Year |
| (1) | Information obtained from the appraisal. |
The following table summarizes the comparable office leases in the surrounding market:
| Comparable Lease Summary(1) | ||||||||
| Property | Year Built | Tenant Name | Lease Start Date | Electrical Power | Term (yrs.) | Lease Type | Tenant Size (SF) | Base Rent PSF |
| Nvidia Santa Clara(2) | 1996-1999; 2013 | Nvidia Corporation | Various | Various | Various | NNN | 551,233(2) | $34.61(2) |
| 3050 Coronado Drive | 1977 | Keysight Technologies | Jul-22 | NAV | 10 | NNN | 23,100 | $36.00 |
| 541 East Trimble Road | 1985 | Comet Technologies | Jul-22 | 2,800 Amps | 10.5 | NNN | 90,974 | $31.20 |
| 455 Trimble Road | 1985 | XP Power | Jun-23 | 2,800 Amps | 12.5 | NNN | 80,125 | $30.60 |
| 3300 Olcott Street | 1979 | Gigamon, Inc. | Jun-23 | 3,000 Amps | 8 | NNN | 105,664 | $40.20 |
| 2740 Zanker Road | 2001 | Skyworks Solutions | Jul-23 | 2,000 Amps | 10.4 | NNN | 67,000 | $37.20 |
| 3151 Zanker Road | 2001 | NIO | Oct-23 | 4,000 Amps | 10 | NNN | 201,500 | $31.80 |
| 3410 Central Expressway | 1980 | Intuitive Surgical | Jan-24 | 4,000 Amps | 3.3 | NNN | 104,179 | $35.40 |
| 2811 Orchard Parkway | 1981 | Zebra Technologies | Aug-25 | 2,000 Amps | 3.5 | NNN | 84,560 | $36.96 |
| Weighted Average(3) | 94,638 | $34.45 | ||||||
| (1) | Information obtained from the appraisal unless otherwise stated. |
| (2) | Based on the underwritten rent roll as of February 1, 2024, inclusive of straight line rent of $1,264,833 through the earlier of (i) the expiration date of the applicable lease or (ii) the maturity date of the Nvidia Santa Clara Whole Loan due to Nvidia’s investment grade rating. All underwritten metrics reflect the prime lease (which, in certain instances, is above the applicable sublease rent) due to the Nvidia Prime Lease Guaranty. See “The Property” above. |
| (3) | Weighted average is calculated exclusive of the Nvidia Santa Clara Property. |
| This is not a research report and was not prepared by any Underwriter’s research department. Please see additional important information and qualifications at the end of this Term Sheet. | ||
| 58 | ||
| Mixed Use – Office/Lab | Loan #3 | Cut-off Date Balance: | $50,000,000 | |
| Various | Nvidia Santa Clara | Cut-off Date LTV: | 41.5% | |
| Santa Clara, CA 95050 | UW NCF DSCR: | 2.01x | ||
| UW NOI Debt Yield: | 14.1% |
Operating History and Underwritten Net Cash Flow. The following table presents certain information relating to the historical operating performance and Underwritten Net Cash Flow at the Nvidia Santa Clara Property:
| Cash Flow Analysis(1) | |||||
| 2020 | 2021 | 2022 | UW(2) | UW PSF | |
| Base Rent | $15,633,842 | $17,272,330 | $17,035,615 | $19,078,767 | $34.61 |
| Reimbursements | $4,097,021 | $4,171,655 | $3,489,712 | $4,704,256 | $8.53 |
| Vacancy | $0 | $0 | $0 | ($713,491) | ($1.29) |
| Effective Gross Income | $19,730,863 | $21,443,985 | $20,525,326 | $23,069,532 | $41.85 |
| Taxes | $2,586,020 | $2,611,653 | $2,067,959 | $2,691,206 | $4.88 |
| Insurance | $520,495 | $591,825 | $621,372 | $631,299 | $1.15 |
| Management Fee | $566,553 | $529,158 | $548,546 | $692,086 | $1.26 |
| Other Operating Expenses | $401,159 | $456,680 | $373,726 | $716,604 | $1.30 |
| Total Expenses | $4,074,227 | $4,189,315 | $3,611,603 | $4,731,195 | $8.58 |
| Net Operating Income | $15,656,636 | $17,254,670 | $16,913,723 | $18,338,337 | $33.27 |
| Capital Expenditures | $0 | $0 | $0 | $110,247 | $0.20 |
| TI/LC | $0 | $0 | $0 | $0 | $0.00 |
| Net Cash Flow | $15,656,636 | $17,254,670 | $16,913,723 | $18,228,091 | $33.07 |
| Occupancy % | 100.0% | 100.0% | 100.0% | 97.0%(3) | |
| NOI DSCR(4) | 1.73x | 1.90x | 1.87x | 2.02x | |
| NCF DSCR(4) | 1.73x | 1.90x | 1.87x | 2.01x | |
| NOI Debt Yield(4) | 12.0% | 13.3% | 13.0% | 14.1% | |
| NCF Debt Yield(4) | 12.0% | 13.3% | 13.0% | 14.0% | |
| (1) | Certain items such as interest expense, interest income, lease cancellation income, depreciation, amortization, debt service payments and any other non-recurring items were excluded from the historical presentation and are not considered for the underwritten cash flow. |
| (2) | Based on the underwritten rent roll as of February 1, 2024, inclusive of straight line rent of $1,264,833 through the earlier of (i) the expiration date of the applicable lease or (ii) the maturity date of the Nvidia Santa Clara Whole Loan due to Nvidia’s investment grade rating. All underwritten metrics reflect the prime lease (which, in certain instances, is above the applicable sublease rent) due to the Nvidia Prime Lease Guaranty. See “The Property” above. |
| (3) | The underwritten economic vacancy is 3.0%. The Nvidia Santa Clara Property was 100.0% occupied as of February 1, 2024. |
| (4) | NOI DSCR, NCF DSCR, NOI Debt Yield and NCF Debt Yield are based on the Nvidia Santa Clara Whole Loan. |
Escrows and Reserves.
At origination, the borrower deposited (i) $5,000,000 into a leasing reserve to cover any expenses incurred by the borrower in leasing space at the Nvidia Santa Clara Property, (ii) $8,146,892.50 into an outstanding TI reserve to cover outstanding tenant improvement and allowance obligations, borrower’s work and/or leasing commissions for tenants, (iii) $997,504.94 into a free rent reserve to cover outstanding free rent obligations and (iv) $439,563.72 into a tax reserve.
Real Estate Taxes – The borrower is required to deposit 1/12th of the annual estimated tax payments payable on a monthly basis, currently estimated to be approximately $226,510, into a tax reserve unless the following conditions are satisfied (the “Tax Reserve Waiver Conditions”): (i) no event of default has occurred or is continuing, (ii) the entire Nvidia Santa Clara Property is demised to a single Major Tenant (as defined below), in accordance with the Nvidia Santa Clara Whole Loan documents, (iii) the applicable tenant is currently paying all real estate taxes pursuant to its lease or all real estate taxes as additional rent directly to the borrower, (iv) all applicable leases are not in default of any of their lease obligations beyond applicable notice and cure periods, if any, and (v) no more than 30 days after the same have been paid, the borrower delivers to lender evidence that all real estate taxes have been paid for the corresponding period. For the avoidance of doubt, the Tax Reserve Waiver Conditions are not satisfied as of the loan origination date pursuant to the Nvidia Santa Clara Whole Loan documents and, consequently, the borrower is required to make monthly tax deposits under the Nvidia Santa Clara Whole Loan Documents until such time as the Tax Reserve Waiver Conditions are satisfied.
Insurance – The borrower is required to deposit 1/12 of the annual estimated insurance payments on a monthly basis, provided that the foregoing may be waived if, among other conditions set forth in the Nvidia Santa Clara Whole Loan documents, the Nvidia Santa Clara Property is insured under a blanket policy meeting the requirements set forth in the Nvidia Santa Clara Whole Loan documents.
Replacement Reserves – During a Cash Trap Event Period (as defined below), the borrower is required to deposit an amount equal to approximately $14,700 on a monthly basis.
TI/LC Reserves – During a Cash Trap Event Period, the borrower is required to deposit an amount equal to approximately $45,936 on a monthly basis.
A “Cash Trap Event Period” will commence upon the occurrence of (i) an event of default under the Nvidia Santa Clara Whole Loan documents, (ii) the debt service coverage ratio for the Nvidia Santa Clara Total Debt and Nvidia Santa Clara Whole Loan is less than 1.20x or 1.87x, respectively, based on the previous calendar quarter (“DSCR Trigger Period”), (iii) any bankruptcy action of a borrower, (iv) any bankruptcy action of an affiliated manager, (v) a Major Tenant Event Period (as defined below) or (vi) the occurrence or continuance of an event of default under the related mezzanine loan documents, and will expire upon the occurrence of the following: (a) with respect to clause (i) above, the acceptance by the lender of a cure of such event of default in accordance with the Nvidia Santa Clara Whole Loan documents; (b) with respect to clause (ii) above, upon the date on which the DSCR Trigger Period
| This is not a research report and was not prepared by any Underwriter’s research department. Please see additional important information and qualifications at the end of this Term Sheet. | ||
| 59 | ||
| Mixed Use – Office/Lab | Loan #3 | Cut-off Date Balance: | $50,000,000 | |
| Various | Nvidia Santa Clara | Cut-off Date LTV: | 41.5% | |
| Santa Clara, CA 95050 | UW NCF DSCR: | 2.01x | ||
| UW NOI Debt Yield: | 14.1% |
has been cured, or otherwise terminated; (c) with respect to clause (iii) above, upon the earlier to occur of dismissal or discharge of the applicable bankruptcy action pursuant to a final order of a court of competent jurisdiction, provided the applicable timeframe for any appeal of such order has expired and no appeal has been filed (provided such bankruptcy action was involuntary and there was no evidence of collusion related thereto); (d) with respect to clause (iv) above, upon the earlier to occur of (x) dismissal or discharge of the applicable bankruptcy action pursuant to a final order of a court of competent jurisdiction, (y) the lender’s receipt of evidence that all rental income at the Nvidia Santa Clara Property is being directly deposited by tenants into the deposit account and no portion of the revenue generated by the Nvidia Santa Clara Property is being paid to the applicable affiliated manager and (z) the replacement of such affiliated manager with a qualified manager in accordance with the Nvidia Santa Clara Whole Loan documents; (e) with respect to clause (v) above, a Major Tenant Event Period Cure (as defined below) or (f) with respect to clause (vi) above, the applicable mezzanine loan event of default has been waived or cured in accordance with the related mezzanine loan documents and no other mezzanine loan event of default is ongoing.
A “Major Lease” means (i) any Nvidia Lease (as defined below) (including, without limitation, any new or replacement lease with Nvidia or any affiliate of Nvidia), (ii) any lease which, individually or when aggregated with all other leases with the same tenant or its affiliate, either (A) accounts for 20% or more of the total rental income for the Nvidia Santa Clara Property or (B) demises 20% or more of the Nvidia Santa Clara Property's gross leasable area and (iii) any lease which contains any option, offer, right of first refusal or other similar entitlement to acquire all or any portion of the Nvidia Santa Clara Property. For the avoidance of doubt, any representation, warranties and/or covenants in accordance with the Nvidia Santa Clara Whole Loan documents relating to any “Major Lease” is to be deemed to include all documentation constituting the applicable lease (including, without limitation, any guaranty thereof).
A “Major Tenant” means, individually or collectively, any tenant pursuant to the Nvidia Lease, its successors and assigns, and any replacement tenant that enters into a Major Lease.
A “Nvidia Lease” means, individually or collectively, each Nvidia prime lease, the Futurewei prime lease, each Nvidia sublease and any instrument guaranteeing or providing credit support for any party thereto.
A “Major Tenant Event Period” means the occurrence of (i) a monetary default or material non-monetary default (including, without limitation, any non-monetary default that, pursuant to the terms of any Major Lease, gives rise to the right of a Major Tenant to terminate any Major Lease, abate rent, exercise self-help or take any other material remedial measure) by the borrower, as landlord, under any Major Lease to a Major Tenant, beyond any applicable notice and/or cure period, (ii) a Major Tenant “goes dark,” vacates or otherwise fails to occupy 50% or more of the aggregate of all Major Tenant space demised to the applicable Major Tenant or gives notice of its intent to commence any of the foregoing (other than in connection with or as a result of a permitted dark event in accordance with the Nvidia Santa Clara Whole Loan documents), (iii) a Major Tenant files, as a debtor, a voluntary petition under the bankruptcy code or any other creditors rights laws, or otherwise becomes involved, as a debtor, in a bankruptcy proceeding or other proceeding under creditors rights laws, (iv) a Major Tenant fails to renew or extend the term of any Major Lease, pursuant to the terms set forth in such Major Lease or otherwise on terms and conditions reasonably acceptable to the lender on or prior to the date that is 12 months prior to the date the Major Lease is scheduled to expire, (v) a downgrade, withdrawal or qualification of the long-term debt rating for any Major Tenant below “BBB-” by Fitch, “BBB-” by S&P or “Baa3” by Moody’s, (vi) a Major Tenant terminates or cancels any Major Lease, (vii) a Major Tenant gives written notice of an intent to terminate any Major Lease and the lender has a good faith commercially reasonable basis for determining that either (x) such Major Tenant actually intends to consummate the applicable termination, cancellation or surrender or (y) the borrower (or its affiliates) are negotiating an early termination of the applicable Major Lease with the applicable Major Tenant; or (viii) solely with respect to Nvidia, the occurrence of a Nvidia Public Relocation Announcement (as defined below) and will end upon the occurrence of the applicable cure events set forth in the Nvidia Santa Clara Whole Loan documents.
A “Major Tenant Event Period Cure” means any of the following: (1) with respect to clause (i) above, the lender’s receipt of reasonably satisfactory evidence that the subject default has been cured to such Major Tenant’s satisfaction, in accordance with the Nvidia Santa Clara Whole Loan documents; (2) with respect to clause (ii) above, the space demised under such Major Lease has been leased to replacement tenants (a “Major Tenant Re-Tenanting Event”) or such Major Tenant has resumed occupancy of such space or revoked its notice to go dark, in accordance with the Nvidia Santa Clara Whole Loan documents; (3) with respect to clause (iii) above, either a Major Tenant Re-Tenanting Event has occurred or the applicable bankruptcy or similar proceeding has terminated in accordance with the Nvidia Santa Clara Whole Loan documents; (4) with respect to clause (iv) above, either a Major Tenant Re-Tenanting Event has occurred or such Major Tenant renews or extends the term of such Major Lease pursuant to the terms set forth in such Major Lease in accordance with the Nvidia Santa Clara Whole Loan documents; (5) with respect to clause (v) above, either a Major Tenant Re-Tenanting Event has occurred or the long-term debt rating for the applicable Major Tenant is upgraded to “BBB-” or higher by Fitch, “BBB-” or higher by S&P and “Baa3” or higher by Moody’s; (6) with respect to clause (vi) above, a Major Tenant Re-Tenanting Event has occurred; (7) with respect to clause (vii) above, either a Major Tenant Re-Tenanting Event has occurred or the lender receives evidence (in a form reasonably acceptable to the lender) that the applicable Major Tenant no longer intends to terminate, cancel or surrender such Major Lease; (8) with respect to clauses (i), (iii), (vi) or (vii) above, which: (A) solely relates to the tenant pursuant to Futurewei’s prime lease in full force and effect and is fully subleased to Nvidia and (B) ultimately results in the termination, cancellation or surrender of Futurewei’s prime lease, such Major Tenant Event Period will be cured if the tenant under such Nvidia sublease(s) has entered into a direct lease with the borrower for the full space demised pursuant to Futurewei’s prime lease on the same terms as the terminated Futurewei prime lease or (9) with regard to clause (viii) above, either (A) Nvidia publicly rescinds the applicable Nvidia Public Relocation Announcement, (B) a Major Tenant Re-Tenanting Event occurs with respect to all Major Tenant space demised to Nvidia in accordance with the Nvidia Santa Clara Whole Loan documents or (C) (x) the entire Nvidia Santa Clara Property is leased or subleased to Nvidia pursuant to one or more lease(s) in accordance with the terms of the Nvidia Santa Clara Whole Loan documents and (y) each such lease has an expiration date that occurs at least five years after the maturity date of the Nvidia Santa Clara Whole Loan and does not have any early termination rights occurring on or before the date that is five years after the maturity date of the Nvidia Santa Clara Whole Loan.
A “Nvidia Public Relocation Announcement” means Nvidia publicly announcing its intention to consummate either of the following (i) abandon or discontinue operations at the Voyager and Endeavor buildings or (ii) to relocate its corporate headquarters outside of the Santa Clara market.
Lockbox and Cash Management. The Nvidia Santa Clara Whole Loan is structured with a hard lockbox and springing cash management. The borrower and property manager are required to direct the tenants to pay rent directly into the lockbox account, and to deposit any rents otherwise received in such account within two business days after receipt. During the continuance of a Cash Trap Event Period, all funds in the lockbox account are required to be swept on a daily basis to a lender-controlled cash management account. Funds in the cash management account are required to be applied to debt service and the reserves and escrows described above, with any excess funds (i) to be deposited into an excess cash flow reserve account held by the lender as cash collateral for the Nvidia Santa Clara Mortgage Loan; provided, that, if a Cash Trap Event Period is continuing solely due to the continuance of an
| This is not a research report and was not prepared by any Underwriter’s research department. Please see additional important information and qualifications at the end of this Term Sheet. | ||
| 60 | ||
| Mixed Use – Office/Lab | Loan #3 | Cut-off Date Balance: | $50,000,000 | |
| Various | Nvidia Santa Clara | Cut-off Date LTV: | 41.5% | |
| Santa Clara, CA 95050 | UW NCF DSCR: | 2.01x | ||
| UW NOI Debt Yield: | 14.1% |
event of default with respect to the mezzanine loan under the Nvidia Santa Clara Whole Loan documents, such excess funds will be transferred to a mezzanine collateral account to pay any other amount then due and payable under the related mezzanine loan or (ii) if no Cash Trap Event Period is continuing, disbursed to the borrower.
Subordinate Debt. None.
Mezzanine Loan and Preferred Equity. Concurrently with the funding of the Nvidia Santa Clara Whole Loan, JPMorgan Chase Bank, National Association funded a mezzanine loan in the amount of $50,500,000 to be secured by the mezzanine borrowers’ interests in the borrowers as collateral for the Nvidia Santa Clara Mezzanine Loan, which was subsequently sold to, and is currently held by, a third-party lender. The Nvidia Santa Clara Mezzanine Loan is coterminous with the Nvidia Santa Clara Whole Loan. The Nvidia Santa Clara Mezzanine Loan accrues interest at a rate of 10.5000% per annum to be paid as part of each monthly debt service payment amount and is interest-only through the loan term. A mezzanine intercreditor agreement was executed at loan origination.
| Mezzanine Original Principal Balance | Mezzanine Interest Rate | Loan Term (Original) | Amortization Term (Original) | IO Period | Total Debt U/W DSCR based on NOI/NCF | Total Debt U/W Debt Yield based on NOI/NCF | Total Debt Cut-off Date LTV Ratio(1)(2)(3) | Total Debt LTV Ratio at Maturity(1)(2)(3) | |
| Nvidia Santa Clara Mezzanine Loan | $50,500,000 | 10.50% | 60 | 0 | 60 | 1.27x / 1.26x | 10.2% / 10.1% | 57.6% | 57.6% |
| (1) | Based on the “as-is” appraised value of $305,100,000, the Nvidia Santa Clara Total Debt results in a Cut-off Date LTV Ratio and LTV Ratio at Maturity of 59.2%. |
| (2) | Based on the “as dark” appraised value of $184,400,000, the Nvidia Santa Clara Total Debt results in a Cut-off Date LTV Ratio and LTV Ratio at Maturity of 97.9%. |
| (3) | Based on the land appraised value of $224,600,000, the Nvidia Santa Clara Total Debt results in a Cut-off Date LTV Ratio and LTV Ratio at Maturity of 80.4%. |
Release of Property. Not permitted.
Real Estate Substitution. Not permitted.
Letter of Credit. None.
Right of First Offer/Right of First Refusal. None.
Ground Lease. None.
Terrorism Insurance. The borrower is required to obtain and maintain property insurance for 100% of full replacement cost and business interruption insurance for 18 months plus a six-month extended period of indemnity. Such insurance is required to cover perils of terrorism and acts of terrorism. If the Terrorism Risk Insurance Program Reauthorization Act of 2015 is not in effect, the borrower will only be required to pay for terrorism insurance a maximum of two times the annual insurance premiums payable for the Nvidia Santa Clara Property at the time with respect to the property and business income or rental income insurance interruption policies (excluding the terrorism and earthquake components of such premiums). See “Risk Factors—Risks Relating to the Mortgage Loans—Terrorism Insurance May Not Be Available for All Mortgaged Properties” in the prospectus.
| This is not a research report and was not prepared by any Underwriter’s research department. Please see additional important information and qualifications at the end of this Term Sheet. | ||
| 61 | ||
| Retail – Anchored | Loan #4 | Cut-off Date Balance: | $47,500,000 | |
| 3622 - 3680 West Dublin Granville Road | Sun Center Plaza | Cut-off Date LTV: | 67.9% | |
| Columbus, OH 43235 | UW NCF DSCR: | 1.30x | ||
| UW NOI Debt Yield: | 10.1% |

| This is not a research report and was not prepared by any Underwriter’s research department. Please see additional important information and qualifications at the end of this Term Sheet. | ||
| 62 | ||
| Retail – Anchored | Loan #4 | Cut-off Date Balance: | $47,500,000 | |
| 3622 - 3680 West Dublin Granville Road | Sun Center Plaza | Cut-off Date LTV: | 67.9% | |
| Columbus, OH 43235 | UW NCF DSCR: | 1.30x | ||
| UW NOI Debt Yield: | 10.1% |

| This is not a research report and was not prepared by any Underwriter’s research department. Please see additional important information and qualifications at the end of this Term Sheet. | ||
| 63 | ||
| Retail – Anchored | Loan #4 | Cut-off Date Balance: | $47,500,000 | |
| 3622 - 3680 West Dublin Granville Road | Sun Center Plaza | Cut-off Date LTV: | 67.9% | |
| Columbus, OH 43235 | UW NCF DSCR: | 1.30x | ||
| UW NOI Debt Yield: | 10.1% |

| This is not a research report and was not prepared by any Underwriter’s research department. Please see additional important information and qualifications at the end of this Term Sheet. | ||
| 64 | ||
| Mortgage Loan No. 4 – Sun Center Plaza |
| Mortgage Loan Information | Mortgaged Property Information | ||||||
| Mortgage Loan Seller: | MSMCH | Single Asset/Portfolio: | Single Asset | ||||
| Credit Assessment (Moody’s/Fitch/KBRA): | NR/NR/NR | Location: | Columbus, OH 43235 | ||||
| Original Balance: | $47,500,000 | General Property Type: | Retail | ||||
| Cut-off Date Balance: | $47,500,000 | Detailed Property Type: | Anchored | ||||
| % of Initial Pool Balance: | 9.2% | Title Vesting: | Fee | ||||
| Loan Purpose: | Refinance | Year Built/Renovated: | 1995/2022 | ||||
| Borrower Sponsors: | Schottenstein Realty LLC | Size: | 308,391 SF | ||||
| Guarantor: | Schottenstein Realty LLC | Cut-off Date Balance Per SF: | $154 | ||||
| Mortgage Rate: | 6.9700% | Maturity Date Balance Per SF: | $154 | ||||
| Note Date: | 11/14/2023 | Property Manager: | Schottenstein Property Group, LLC | ||||
| First Payment Date: | 1/1/2024 | (borrower-related) | |||||
| Maturity Date: | 12/1/2028 | ||||||
| Original Term to Maturity: | 60 months | Underwriting and Financial Information | |||||
| Original Amortization Term: | 0 months | UW NOI: | $4,798,280 | ||||
| IO Period: | 60 months | UW NOI Debt Yield: | 10.1% | ||||
| Seasoning: | 2 months | UW NOI Debt Yield at Maturity: | 10.1% | ||||
| Prepayment Provisions: | L(24),YM1(32),O(4) | UW NCF DSCR: | 1.30x | ||||
| Lockbox/Cash Mgmt Status: | Hard/Springing | Most Recent NOI: | $4,881,284 (6/30/2023 TTM) | ||||
| Additional Debt Type: | No | 2nd Most Recent NOI: | $4,225,858 (12/31/2022) | ||||
| Additional Debt Balance: | NAP | 3rd Most Recent NOI(2): | NAV | ||||
| Future Debt Permitted (Type): | No (NAP) | Most Recent Occupancy: | 100.0% (10/1/2023) | ||||
| Reserves(1) | 2nd Most Recent Occupancy: | 100.0% (12/31/2022) | |||||
| Type | Initial | Monthly | Cap | 3rd Most Recent Occupancy: | NAV | ||
| RE Taxes: | $0 | Springing | NAP | Appraised Value (as of): | $70,000,000 (10/9/2023) | ||
| Insurance: | $0 | Springing | NAP | Appraised Value per SF: | $227 | ||
| Replacement Reserve: | $46,259 | Springing | $46,259 | Cut-off Date LTV Ratio: | 67.9% | ||
| TI/LC Reserve: | $0 | Springing | $323,811 | Maturity Date LTV Ratio: | 67.9% | ||
| Sources and Uses | ||||||
| Sources | Proceeds | % of Total | Uses | Proceeds | % of Total | |
| Loan Amount: | $47,500,000 | 97.2% | Loan Payoff: | $45,922,940 | 94.0% | |
| Borrower Equity: | $1,377,761 | 2.8% | Closing Costs: | $2,908,562 | 6.0% | |
| Reserves: | $46,259 | 0.1% | ||||
| Total Sources: | $48,877,761 | 100.0% | Total Uses: | $48,877,761 | 100.0% | |
| (1) | See “Escrows and Reserves” below for further discussion of reserve information. |
| (2) | The borrower acquired the Sun Center Plaza Property (as defined below) in October 2021. As such, historical financials prior to 2022 are not available. |
The Mortgage Loan. The fourth largest mortgage loan (the “Sun Center Plaza Mortgage Loan”) is evidenced by a promissory note in the original principal amount of $47,500,000 and secured by a first priority fee mortgage encumbering a 308,391 SF anchored retail property located in Columbus, Ohio (the “Sun Center Plaza Property”).
The Borrower and the Borrower Sponsors. The borrower for the Sun Center Plaza Mortgage Loan is SR Sun Center LLC, a Delaware limited liability company with two independent directors in its organizational structure. The borrower is wholly owned by Schottenstein Realty LLC (“Schottenstein”), which is controlled and managed by Jay L. Schottenstein, Joseph A. Schottenstein and Kyle P. Kraner. The borrower sponsor and non-recourse carveout guarantor is Schottenstein, a fully integrated, self-managed owner and operator of power/big box, community and neighborhood shopping centers throughout the United States. Schottenstein owns interests in 80 retail properties in 23 states with approximately 11.5 million SF as well as industrial property and office space with approximately 1.6 million SF. It also owns and manages 534 apartment units in central Ohio. The borrower is affiliated with the borrower of the Coral Walk mortgage loan.
The Property. The Sun Center Plaza Property is comprised of a fee interest in a 308,391 SF anchored retail property on an approximately 32.16-acre site in Columbus, Ohio that includes 1,788 total parking spaces (5.8 per 1,000 SF). As of October 1, 2023, the Sun Center Plaza Property is 100.0% leased to 22 tenants and anchored by Whole Foods with no single tenant, other than Whole Foods, occupying more than 13.7% of net rentable area or comprising more than 10.9% of underwritten rent. The Sun Center Plaza Property was constructed in 1995 and acquired by the borrower sponsor in 2021. Since acquisition, the borrower sponsor has invested an additional $1.7 million in capital improvements, renovations and tenant improvements. Since 2021, the borrower sponsor has executed renewals with five tenants, totaling 54,637 SF of space (17.7% of NRA), as well as three new leases totaling 33,979 SF of space (11.0% of NRA). In addition to the collateral, the borrower sponsor also owns retail on a connected parcel at the northwestern portion of the shopping center, which is not collateral for the Sun Center Plaza Mortgage Loan. The surrounding outparcel buildings are also not collateral for the Sun Center Plaza Mortgage Loan and are not owned by the borrower sponsor.
| This is not a research report and was not prepared by any Underwriter’s research department. Please see additional important information and qualifications at the end of this Term Sheet. | ||
| 65 | ||
| Retail – Anchored | Loan #4 | Cut-off Date Balance: | $47,500,000 | |
| 3622 - 3680 West Dublin Granville Road | Sun Center Plaza | Cut-off Date LTV: | 67.9% | |
| Columbus, OH 43235 | UW NCF DSCR: | 1.30x | ||
| UW NOI Debt Yield: | 10.1% |
Major Tenants.
Whole Foods (74,901 SF, 24.3% of NRA, 15.2% of underwritten rent). Whole Foods is a United States supermarket chain that is known for its natural and organic selections. The company was founded in Austin, TX in 1980 and currently operates over 500 locations throughout the United States, Canada and the United Kingdom. In 2017, Whole Foods was fully acquired by Amazon. Whole Foods has anchored the Sun Center Plaza Property since 1996, has a lease expiration date of April 12, 2026, and has two, 5-year renewal options remaining.
PGA Tour Superstore (42,296 SF, 13.7% of NRA, 10.9% of underwritten rent). PGA Tour Superstore is a golf equipment and apparel retailer with over 50 locations throughout the United States. In addition to equipment and clothing sales, the company also offers putting greens and live golf simulators for equipment testing. This location is the only PGA Tour Superstore in Ohio. PGA Tour Superstore has been a tenant at the Sun Center Plaza Property since 2020, has a lease expiration date of January 31, 2031, and has three, 5-year renewal options remaining.
Ashley Furniture Homestore (41,916 SF, 13.6% of NRA, 11.1% of underwritten rent). Ashley Furniture Homestore is a private United States furniture manufacturer and retailer located in 123 different countries and operating more than 700 stores around the globe. Ashley Furniture Homestore occupies two separate suites at the Sun Center Plaza Property: (i) Ashley Furniture Homestore (31,516 SF, 10.2% of NRA, 10.3% of underwritten rent), which has a lease expiration date of September 30, 2025, and has one, 5-year renewal option remaining and (ii) Ashley Furniture Homestore Storage (10,400 SF, 3.4% of NRA, 0.8% of underwritten rent), which has a lease expiration date of December 31, 2024 and has no renewal options remaining.
Michaels (26,432 SF, 8.6% of NRA, 7.6% of underwritten rent). Michaels is a privately held chain of American and Canadian arts and craft stores. Founded in 1973 in Irving, TX, Michaels provides arts, crafts, framing, floral and wall decor, and merchandise for makers and do-it-yourself home decorators. Michaels operates 1,290 stores in 49 states and Canada. Michaels has been a tenant at the Sun Center Plaza Property since 2002, has a lease expiration date of February 29, 2028, and has one, 5-year renewal option remaining.
The following table presents a summary regarding the tenants at the Sun Center Plaza Property:
| Tenant Summary(1) | ||||||||||||
| Tenant Name | Credit Rating (Fitch/Moody’s/ S&P)(2) | Tenant SF | Approx.% of SF | Annual UW Base Rent | Annual UW Base Rent PSF | % of Total Annual UW Base Rent | Most Recent Sales(3) | |||||
| $ | PSF | Occ. Cost %(4) | Term. Option | Renewal Options | Lease Expiration | |||||||
| Whole Foods | NR/NR/NR | 74,901 | 24.3% | $823,911 | $11.00 | 15.2% | $41,407,594(5) | $552.83 | 3.4% | N | 2 x 5 yr | 4/12/2026 |
| PGA Tour Superstore | NR/NR/NR | 42,296 | 13.7% | $592,144 | $14.00 | 10.9% | $9,582,379(7) | $226.56 | 9.7% | N | 3 x 5 yr | 1/31/2031 |
| Ashley Furniture Homestore(6) | NR/NR/NR | 41,916 | 13.6% | $602,585 | $14.38 | 11.1% | $4,877,425(8) | $154.76 | 17.6% | N | Various | Various |
| Michaels | NR/NR/NR | 26,432 | 8.6% | $409,696 | $15.50 | 7.6% | NAV | NAV | NAV | N | 1 x 5 yr | 2/29/2028 |
| Ross Dress For Less | NR/NR/NR | 23,924 | 7.8% | $346,898 | $14.50 | 6.4% | NAV | NAV | NAV | N | 4 x 5 yr | 1/31/2033 |
| Subtotal/Wtd. Avg. | 209,469 | 67.9% | $2,775,234 | $13.25 | 51.2% | |||||||
| Other Tenants | 98,922 | 32.1% | $2,645,130 | $26.74 | 48.8% | |||||||
| Vacant Space | 0 | 0.0% | $0 | $0.00 | 0.0% | |||||||
| Total/Wtd. Avg. | 308,391 | 100.0% | $5,420,364 | $17.58 | 100.0% | |||||||
| (1) | Information is based on the underwritten rent roll dated October 1, 2023. |
| (2) | Certain ratings are those of the parent company, whether or not the parent company guarantees the lease. |
| (3) | Most Recent Sales are as of September 2023. |
| (4) | Occ. Cost % for Whole Foods, PGA Tour Superstore and Ashley Furniture Homestore represents Annual UW Base Rent plus Reimbursements of $594,602, $336,587 and $298,997, respectively, divided by Most Recent Sales. |
| (5) | Whole Foods Most Recent Sales represents eleven months of sales data from June 1, 2022 to April 30, 2023. |
| (6) | Ashley Furniture Homestore occupies two separate suites at the Sun Center Plaza Property: (i) Ashley Furniture Homestore (31,516 SF, 10.2% of NRA, 10.3% of underwritten rent), which has a lease expiration date of September 30, 2025, and has one, 5-year renewal option remaining and (ii) Ashley Furniture Homestore Storage (10,400 SF, 3.4% of NRA, 0.8% of underwritten rent), which has a lease expiration date of December 31, 2024, and has no renewal options remaining. Most Recent Sales for Ashley Furniture Homestore are based off of 31,516 SF. |
| (7) | PGA Tour Superstore Most Recent Sales represents twelve months of sales data from January 1, 2022 to December 31, 2022. |
| (8) | Ashley Furniture Homestore Most Recent Sales represents eight months of sales data from January 1, 2023 to August 31, 2023. |
| This is not a research report and was not prepared by any Underwriter’s research department. Please see additional important information and qualifications at the end of this Term Sheet. | ||
| 66 | ||
| Retail – Anchored | Loan #4 | Cut-off Date Balance: | $47,500,000 | |
| 3622 - 3680 West Dublin Granville Road | Sun Center Plaza | Cut-off Date LTV: | 67.9% | |
| Columbus, OH 43235 | UW NCF DSCR: | 1.30x | ||
| UW NOI Debt Yield: | 10.1% |
The following table presents certain information with respect to the lease rollover at the Sun Center Plaza Property:
| Lease Rollover Schedule(1) | ||||||||||
| Year | # of Leases Rolling | SF Rolling | Annual UW Rent PSF Rolling | Approx. % of Total SF Rolling | Approx. Cumulative % of SF Rolling | Annual UW Rent Rolling | Approx. % of Total Rent Rolling | Approx. Cumulative % of Total Rent Rolling | ||
| MTM | 0 | 0 | $0.00 | 0.0% | 0.0% | $0 | 0.0% | 0.0% | ||
| 2024 | 2 | 12,800 | $8.69 | 4.2% | 4.2% | $111,200 | 2.1% | 2.1% | ||
| 2025 | 3 | 42,478 | $20.07 | 13.8% | 17.9% | $852,659 | 15.7% | 17.8% | ||
| 2026 | 6 | 99,721 | $15.37 | 32.3% | 50.3% | $1,532,462 | 28.3% | 46.1% | ||
| 2027 | 2 | 13,485 | $30.71 | 4.4% | 54.6% | $414,168 | 7.6% | 53.7% | ||
| 2028 | 4 | 58,632 | $18.79 | 19.0% | 73.6% | $1,101,456 | 20.3% | 74.0% | ||
| 2029 | 3 | 11,655 | $29.19 | 3.8% | 77.4% | $340,177 | 6.3% | 80.3% | ||
| 2030 | 1 | 3,400 | $38.00 | 1.1% | 78.5% | $129,200 | 2.4% | 82.7% | ||
| 2031 | 1 | 42,296 | $14.00 | 13.7% | 92.2% | $592,144 | 10.9% | 93.6% | ||
| 2032 | 0 | 0 | $0.00 | 0.0% | 92.2% | $0 | 0.0% | 93.6% | ||
| 2033 | 1 | 23,924 | $14.50 | 7.8% | 100.0% | $346,898 | 6.4% | 100.0% | ||
| 2034 | 0 | 0 | $0.00 | 0.0% | 100.0% | $0 | 0.0% | 100.0% | ||
| 2035 & Beyond | 0 | 0 | $0.00 | 0.0% | 100.0% | $0 | 0.0% | 100.0% | ||
| Vacant | 0 | 0 | $0.00 | 0.0% | 100.0% | $0 | 0.0% | 100.0% | ||
| Total/Wtd. Avg. | 23 | 308,391 | $17.58 | 100.0% | $5,420,364 | 100.0% | ||||
| (1) | Information is based on the underwritten rent roll dated October 1, 2023. Certain tenants may have lease termination options that are not reflected in the Lease Rollover Schedule. |
The Market. The Sun Center Plaza Property is located in Columbus, Ohio within the Bethel Road submarket of the Columbus Metropolitan Statistical Area (“MSA”) market. The commute to downtown Columbus is about 20-minutes from the Sun Center Plaza Property, and the drive to John Glenn Columbus International Airport is about 40-minutes from the Sun Center Plaza Property. Major employers in the area include The Ohio State University, Ohio Health, JPMorgan Chase & Co., Nationwide, Nationwide Children's Hospital Inc., The Kroger Co., and the State of Ohio. Major thoroughfares include Sawmill Road, Dublin Granville Road, Martin Road, Federated Boulevard, Emerald Parkway, Dublin Road, Bridge Street, Bent Tree Boulevard, Snouffer Road, Smoky Row Road, McVey Boulevard, Lintrock Boulevard and US Highway 33. The Central Ohio Transit Authority is a public transit agency serving the Columbus metropolitan area, headquartered in Columbus, Ohio. It operates fixed-route buses, bus rapid transit, micro transit, and paratransit services. Overall, the primary mode of transportation in the area is the automobile. According to the appraisal, as of the third quarter of 2023, the vacancy rate in the Columbus MSA market was approximately 3.7%, with average asking rents of $15.38 per SF and inventory of approximately 123.4 million SF. According to the appraisal, as of the third quarter of 2023, the vacancy rate in the Bethel Road submarket was approximately 2.3%, with average asking rents of $17.52 per SF and inventory of approximately 7.9 million SF. According to the appraisal, the 2023 population within a one-, three- and five-mile radius of the Sun Center Plaza Property was 10,639, 94,873 and 237,667, respectively. The 2023 average household income within a one-, three- and five-mile radius of the Sun Center Plaza Property was $109,321, $127,196 and $136,572, respectively.
The following table presents certain information relating to the appraisal’s market rent conclusion for the Sun Center Plaza Property:
| Market Rent Summary | ||||||
| Tenant Type | Market Rent (PSF) | Reimbursements | Annual Escalation | Lease Term (Months) | Leasing Commissions (New) | Leasing Commissions (Renewal) |
| Inline Retail Space: | $30.00 | NNN | 2.0%/Year | 60 | 6.0% | 3.0% |
| Retail >20,000 SF Space: | $14.50 | NNN | 2.0%/Year | 84 | 6.0% | 3.0% |
| Grocery Space: | $14.00 | NNN | 0.0%/Year | 120 | 6.0% | 3.0% |
Source: Appraisal.
| This is not a research report and was not prepared by any Underwriter’s research department. Please see additional important information and qualifications at the end of this Term Sheet. | ||
| 67 | ||
| Retail – Anchored | Loan #4 | Cut-off Date Balance: | $47,500,000 | |
| 3622 - 3680 West Dublin Granville Road | Sun Center Plaza | Cut-off Date LTV: | 67.9% | |
| Columbus, OH 43235 | UW NCF DSCR: | 1.30x | ||
| UW NOI Debt Yield: | 10.1% |
The following table presents recent inline space leasing data at comparable retail properties with respect to the Sun Center Plaza Property:
| Comparable Leases Summary | |||||||
| Property/Location | Year Built / Renovated | SF | Tenant Name | Tenant Size (SF) | Lease Date | Rent PSF | Lease Type |
Sun Center Plaza (subject)(1) Columbus, OH | 1995 / 2022 | 308,391 | Old Navy Ulta Beauty | 15,000 11,880 | April 2021 Sept. 2017 | $26.62 $31.35 | NNN NNN |
8833 Lyra Drive Columbus, OH | 2023 / NAP | 11,850 | Kindbody Kura Sushi | 5,107 3,564 | August 2023 August 2023 | $46.50 $50.00 | NNN NNN |
Kroger Marketplace Centre 7509 Sawmill Road Dublin, OH | 2005 / NAP | 181,462 | Deka Lash | 1,500 | June 2023 | $23.00 | NNN |
Kingsdale Center 1765 Kingsdale Center Columbus, OH | 1959 / 1999 | 21,492 | Rejuvenation III Ltd. | 2,253 | January 2023 | $29.00 | NNN |
Source: Appraisal, unless otherwise indicated.
| (1) | Information based on the underwritten rent roll dated October 1, 2023, other than Year Built / Renovated. |
The following table presents recent greater than 20,000 SF tenant leasing data at comparable retail properties with respect to the Sun Center Plaza Property:
| Comparable Leases Summary | |||||||
| Property/Location | Year Built / Renovated | SF | Tenant Name | Tenant Size (SF) | Lease Date | Rent PSF | Lease Type |
Sun Center Plaza (subject)(1) 3622 – 3680 West Dublin Granville Road Columbus, OH | 1995 / 2022 | 308,391 | PGA Tour Superstore Ashley Furniture Homestore | 42,296 31,516 | July 2020 Oct. 2020 | $14.00 $17.80 | NNN NNN |
Sun Center (West Side) 3700 West Dublin Granville Road Columbus, OH | 2000 / NAP | 154,644 | Nordstrom Rack | 37,889 | June 2024 | $16.30 | NNN |
Easton Square 3826 Morse Road Columbus, OH | 1994 / NAP | 210,219 | Best Buy | 45,200 | April 2023 | $9.80 | NNN |
Belden Village 4100 Belden Village Street Northwest Canton, OH | 1971 / 2018 | 192,292 | Boot Barn | 12,000 | Dec. 2022 | $14.00 | NNN |
Waterstone Center 9691 Waterstone Boulevard Cincinnati, OH | 1996 / NAP | 157,181 | Ross Dress for Less | 25,302 | Oct. 2022 | $13.50 | NNN |
Parkway Centre North 1566-1656 Stringtown Road Grove City, OH | 2006 / NAP | 148,020 | Best Buy | 30,007 | April 2022 | $12.00 | NNN |
Source: Appraisal, unless otherwise indicated.
| (1) | Information based on the underwritten rent roll dated October 1, 2023, other than Year Built / Renovated. |
The following table presents recent grocery tenant leasing data at comparable retail properties with respect to the Sun Center Plaza Property:
| Comparable Leases Summary | |||||||
| Property/Location | Year Built / Renovated | SF | Tenant Name | Tenant Size (SF) | Lease Date | Rent PSF | Lease Type |
Sun Center Plaza (subject)(1) Columbus, OH | 1995 / 2022 | 308,391 | Whole Foods | 74,901 | April 2021 | $11.00 | NNN |
Whole Foods (Amazon) 2897 Radcliff Avenue Southeast Kentwood, MI | 2022 / NAP | 40,208 | Whole Foods | 40,208 | June 2022 | $17.40 | NNN |
Whole Foods 50 Wall Street Beachwood, OH | 2017 / NAP | 45,000 | Whole Foods | 45,000 | March 2018 | $19.00 | NNN |
Clay Terrace 14390 Clay Terrace Boulevard Carmel, IN | 2004 / NAP | 577,661 | Whole Foods | 30,127 | Nov. 2019 | $9.96 | NNN |
Kenwood Collection 5901 East Galbraith Road Cincinnati, OH | 2011 / 2018 | 265,024 | Whole Foods | 30,649 | April 2017 | $17.25 | Net |
Source: Appraisal, unless otherwise indicated.
| (1) | Information based on the underwritten rent roll dated October 1, 2023, other than Year Built / Renovated. |
| This is not a research report and was not prepared by any Underwriter’s research department. Please see additional important information and qualifications at the end of this Term Sheet. | ||
| 68 | ||
| Retail – Anchored | Loan #4 | Cut-off Date Balance: | $47,500,000 | |
| 3622 - 3680 West Dublin Granville Road | Sun Center Plaza | Cut-off Date LTV: | 67.9% | |
| Columbus, OH 43235 | UW NCF DSCR: | 1.30x | ||
| UW NOI Debt Yield: | 10.1% |
Operating History and Underwritten Net Cash Flow. The following table presents certain information relating to the historical operating performance and Underwritten Net Cash Flow at the Sun Center Plaza Property:
| Cash Flow Analysis(1) | ||||
| 2022 | TTM 6/30/2023 | UW | UW PSF | |
| Gross Potential Rent(2) | $4,834,200 | $5,116,071 | $5,420,364 | $17.58 |
| Reimbursements | $2,491,970 | $1,751,203 | $2,466,178 | $8.00 |
| Other Income | $17,047 | $58,691 | $49,488 | $0.16 |
| Less Vacancy & Credit Loss | $0 | $0 | ($394,327) | ($1.28) |
| Effective Gross Income | $7,343,217 | $6,925,964 | $7,541,702 | $24.46 |
| Real Estate Taxes | $2,307,504 | $1,185,671 | $1,880,000 | $6.10 |
| Insurance | $71,994 | $84,109 | $89,779 | $0.29 |
| Other Operating Expenses | $737,861 | $774,900 | $773,643 | $2.51 |
| Total Operating Expenses | $3,117,358 | $2,044,680 | $2,743,422 | $8.90 |
| Net Operating Income | $4,225,858 | $4,881,284 | $4,798,280 | $15.56 |
| Replacement Reserves | $0 | $0 | $46,259 | $0.15 |
| TI/LC | $0 | $0 | $400,745 | $1.30 |
| Net Cash Flow | $4,225,858 | $4,881,284 | $4,351,276 | $14.11 |
| Occupancy %(3) | 100.0% | 100.0% | 95.0% | |
| NOI DSCR | 1.26x | 1.45x | 1.43x | |
| NCF DSCR | 1.26x | 1.45x | 1.30x | |
| NOI Debt Yield | 8.9% | 10.3% | 10.1% | |
| NCF Debt Yield | 8.9% | 10.3% | 9.2% | |
| (1) | The borrower acquired the Sun Center Plaza Property in October 2021. As such, historical financials prior to 2022 are not available. |
| (2) | UW Gross Potential rent is based on the underwritten rent roll dated October 1, 2023, and Includes rent steps underwritten through November 2024 totaling $25,891. |
| (3) | UW Occupancy % represents economic occupancy. Historical occupancies represent physical occupancies. TTM 6/30/2023 occupancy is based on the underwritten rent roll dated October 1, 2023. |
Escrows and Reserves.
Real Estate Taxes – The borrower is not required to make deposits into a reserve for real estate taxes for the Sun Center Plaza Property so long as (x) no Cash Sweep Event Period (as defined below) is continuing, (y) the Schottenstein Condition (as defined below) is satisfied, and (z) taxes are paid when due as required by the loan documents (unless the borrower is then contesting such taxes in accordance with the loan documents) and the borrower provides to the lender, within ten days following request (or, if a Cash Sweep Event Period would then exist but for the borrower satisfying the Cash Flow Condition (as defined below), prior to the due date therefor), evidence of payment of real estate taxes with respect to the Sun Center Plaza Property. If such conditions are not satisfied, the Sun Center Plaza Mortgage Loan documents require ongoing monthly deposits into a reserve for real estate taxes in an amount equal to 1/12 of the real estate taxes that the lender estimates will be payable during the next twelve months for the Sun Center Plaza Property.
“Schottenstein Condition” means that the borrower is controlled, and at least 51% owned, by any of (i) Jay L. Schottenstein, Joseph Schottenstein, Jonathan Schottenstein, Jeffrey Schottenstein, Lori Schottenstein or their respective spouses and lineal descendants, (ii) any trusts or entities of which any of such persons are the sole beneficiaries or which are entirely owned or controlled (directly or indirectly) by any such persons (or majority owned and controlled, so long as the persons set forth in clauses (i) and (ii) above continue to own directly or indirectly 51% or more of, and control, the borrower); (iii) a private or public real estate investment trust sponsored and controlled by one or more of the persons set forth in clauses (i) and (ii) above; or (iv) a public offering of the non-recourse carveout guarantor or its affiliates, after which, such guarantor or its affiliates, as applicable, are controlled by one or more of the persons set forth in clauses (i) and (ii) above.
Insurance – The borrower is not required to make deposits into a reserve for insurance premiums for the Sun Center Plaza Property so long as either (x) if the liability and casualty policies covering the Sun Center Plaza Property are not part of a blanket or umbrella policy, (i) the Schottenstein Condition is satisfied, (ii) no Cash Sweep Event Period is continuing, (iii) the borrower provides the lender with evidence of payment of insurance premiums and certificates evidencing the insurance policies within the time frames required by the loan documents, and (iv) such insurance policies satisfy the applicable requirements under the Sun Center Plaza Mortgage Loan documents or (y) if the liability and casualty insurance policies covering the Sun Center Plaza Property are part of a blanket or umbrella policy approved by the lender in its reasonable discretion, (i) no event of default is continuing under the Sun Center Plaza Mortgage Loan documents and (ii) the borrower provides the lender with evidence of renewal of such insurance policies and paid receipts for the insurance premiums no later than 10 days prior to their expiration (subject to a cure period of 10 days after notice). If neither of conditions (x) nor (y) is satisfied, the Sun Center Plaza Mortgage Loan documents provide for ongoing monthly deposits into a reserve for insurance premiums in an amount equal to 1/12 of the insurance premiums that the lender estimates will be payable for the renewal of coverage upon the expiration of the insurance policies.
Replacement Reserve – At origination, approximately $46,259 was required to be deposited into a reserve for capital expenditures (the “Capital Expenditure Initial Deposit Amount”). The Sun Center Plaza Mortgage Loan documents provide for ongoing monthly deposits of approximately $3,855 into such reserve, provided that such deposits will not be required so long as (i) the Schottenstein Condition is satisfied, (ii) no event of default is continuing under the Sun Center Plaza Mortgage Loan documents and (iii) on each monthly payment date occurring during the calendar month of January throughout the term of the
| This is not a research report and was not prepared by any Underwriter’s research department. Please see additional important information and qualifications at the end of this Term Sheet. | ||
| 69 | ||
| Retail – Anchored | Loan #4 | Cut-off Date Balance: | $47,500,000 | |
| 3622 - 3680 West Dublin Granville Road | Sun Center Plaza | Cut-off Date LTV: | 67.9% | |
| Columbus, OH 43235 | UW NCF DSCR: | 1.30x | ||
| UW NOI Debt Yield: | 10.1% |
Sun Center Plaza Mortgage Loan, the borrower deposits with the lender an amount equal to the difference between the Capital Expenditure Initial Deposit Amount and the then current balance of the replacement reserve, if any.
Rollover Reserve – The Sun Center Plaza Mortgage Loan documents provide for ongoing monthly deposits of approximately $26,984 into a reserve (that is not currently in place) for future tenant improvement and leasing commission expenses, provided that so long as (i) the Schottenstein Condition is satisfied and (ii) no event of default is continuing under the Sun Center Plaza Mortgage Loan documents, such deposits will not be required at any time that they would cause the amount in such reserve to exceed approximately $323,811. Notwithstanding the foregoing, no deposits into a reserve for future tenant improvement and leasing commission expenses will be required so long as (i) the Schottenstein Condition is satisfied and (ii) the debt service coverage ratio is greater than or equal to 1.10x.
Major Tenant Reserve – If a Cash Sweep Event Period exists as a result of a Major Tenant Lease Expiration Event (as defined below) or a Major Tenant Rent Termination Event (as defined below), excess cash flow is required to be deposited into a Major Tenant Reserve in the amount described under “Lockbox and Cash Management” below, to be used for expenses of re-letting the space leased to the applicable Major Tenant (as defined below).
Lockbox and Cash Management. The Sun Center Plaza Mortgage Loan is structured with a hard lockbox and springing cash management. The borrower is required to establish and maintain a lockbox account for the benefit of the lender, to direct all tenants to send all payments of rents at the Sun Center Plaza Property directly into the lockbox account, and to deposit any funds received by the borrower or property manager into the lockbox account within two business days of receipt. If no Cash Sweep Event Period exists, all funds in the lockbox account will be transferred to the borrower’s account. Upon the occurrence of a Cash Sweep Event Period, the lender is required to establish a lender-controlled cash management account. During a Cash Sweep Event Period, all funds in the lockbox account are required to be swept to the cash management account and, provided no event of default is continuing under the Sun Center Plaza Mortgage Loan documents, applied on each monthly payment date: (i) to make the monthly deposits into the real estate tax reserve and insurance reserve, if any, as described above under “Escrows and Reserves,” (ii) to pay debt service on the Sun Center Plaza Mortgage Loan, (iii) to make the monthly deposit into the capital expenditure reserve, if any, as described above under “Escrows and Reserves,” (iv) to make the monthly deposit into the rollover reserve, if any, as described above under “Escrows and Reserves,” (v) to pay operating expenses set forth in the lender-approved annual budget and lender-approved extraordinary expenses, (vi) if a Cash Sweep Event Period exists as a result of a Major Tenant Lease Expiration Event or a Major Tenant Rent Termination Event, to deposit all remaining amounts into the Major Tenant Reserve until the aggregate amount therein equals $1,498,020; provided, that the borrower may deposit cash or letters of credit in such amount (less the amount of any excess cash flow previously so deposited), into such account in which case no further deposits will be required, and (vii) to deposit any remainder into an excess cash flow reserve to be held as additional security for the Sun Center Plaza Mortgage Loan during such Cash Sweep Event Period.
“Cash Flow Condition” means the deposit with the lender of cash or a letter of credit in the amount of $1,498,020.
“Cash Sweep Event Period” means a period:
| (i) | commencing upon a monetary event of default under the Sun Center Plaza Mortgage Loan documents, and ending upon the cure, if applicable, of such monetary event of default; |
| (ii) | commencing upon any voluntary bankruptcy or insolvency filing of the borrower or the non-recourse carveout guarantor that has not been dismissed, settled or cured within 180 days (and in the case of the non-recourse carveout guarantor, it has not been replaced by a replacement guarantor reasonably satisfactory to the lender within 30 days following demand of replacement by the lender), and ending upon any voluntary bankruptcy or insolvency filing of the borrower or the non-recourse carveout guarantor being dismissed, settled and cured and the borrower or the non-recourse carveout guarantor, as applicable, having emerged from bankruptcy; or |
| (iii) | commencing upon the occurrence of a DSCR Event (as defined below) and ending upon the date the debt service coverage ratio is equal to or greater than 1.10x for the four immediately preceding consecutive quarters; or |
| (iv) | commencing upon a Major Tenant Lease Expiration Event and ending upon either (1) Major Tenant (a) has renewed or extended its lease upon the terms and conditions set forth therein or terms and conditions reasonably acceptable to the lender and (b) is in occupancy of its entire space, open for business and paying full contractual rent as confirmed by a tenant estoppel in form and substance substantially similar to the estoppel delivered to the lender by the Major Tenant at origination (the “Original Estoppel”), or (2) the borrower has re-let 80% or more of the applicable Major Tenant space at then market rents (as reasonably determined by the borrower) and otherwise, upon terms and conditions acceptable to the lender, the tenant(s) under the replacement lease(s) are in occupancy of their entire space, open for business and paying full contractual rent (with no free rent or leasing costs remaining) as confirmed by tenant estoppel certificates in form and substance reasonably acceptable to the lender (a “Re-Tenanting Event”); or |
| (v) | commencing upon a Major Tenant Rent Termination Event and ending upon either (1) Major Tenant (a) is in occupancy of its entire space, open for business, and paying full contractual rent as confirmed by a tenant estoppel executed by the Major Tenant in form and substance substantially similar to the Original Estoppel and (b) has paid to the borrower all unpaid accrued or deferred rent or (2) a Re-Tenanting Event has occurred. |
“DSCR Event” means the date (the “DSCR Failure Date”) upon which the debt service coverage ratio has been less than 1.10x for four consecutive quarters; provided that a DSCR Event will not occur if, within 5 business days of notice from the lender of such event, the borrower (i) deposits with the lender either cash or one or more letters of credit in an amount that if applied to the Sun Center Plaza Mortgage Loan would result in a debt service coverage ratio of 1.10x (a “DSCR Deposit”) or (ii) delivers to the lender a partial payment guaranty executed by the non-recourse carveout guarantor for the DSCR Deposit, provided further that on each one-year anniversary (the “DSCR Anniversary”) of the DSCR Failure Date that the DSCR is less than 1.10x for four (4) consecutive quarters, a DSCR Event will be deemed to have occurred unless, within five business days of the DSCR Anniversary, the borrower makes an additional DSCR Deposit or delivers a new partial payment guaranty in the aggregate amount of all DSCR Deposits required as of such date.
“Major Tenant” means Whole Food Market Group, Inc. (“Whole Foods”), or any tenant under a lease demising all or a portion of the space leased by Whole Foods.
“Major Tenant Lease Expiration Event” means the failure of the Major Tenant to renew its lease on or before the applicable renewal date upon the terms and conditions set forth therein or terms and conditions reasonably acceptable to the lender; provided that a Major Tenant Lease Expiration Event will not be deemed to have occurred if the Cash Flow Condition has been satisfied.
| This is not a research report and was not prepared by any Underwriter’s research department. Please see additional important information and qualifications at the end of this Term Sheet. | ||
| 70 | ||
| Retail – Anchored | Loan #4 | Cut-off Date Balance: | $47,500,000 | |
| 3622 - 3680 West Dublin Granville Road | Sun Center Plaza | Cut-off Date LTV: | 67.9% | |
| Columbus, OH 43235 | UW NCF DSCR: | 1.30x | ||
| UW NOI Debt Yield: | 10.1% |
“Major Tenant Rent Termination Event” means (i) the date the Major Tenant gives notice to vacate or exercises any valid termination option under its lease, (ii) the Major Tenant canceling or terminating its lease, (iii) the date upon which the Major Tenant has “gone dark” in, or vacated (whether or not such tenant is continuing to pay rent) all or substantially all of its space, other than in connection with a temporary closure resulting from a casualty, condemnation or remodeling, which temporary closure may not exceed 90 days (or such longer period as expressly permitted under the lease) and/or (iv) the Major Tenant otherwise fails to pay the rent due under its lease (in whole or in part), which failure continues beyond any applicable rights of offset, grace or cure set forth in the lease; provided that a Major Tenant Rent Termination Event will not be deemed to have occurred if the Cash Flow Condition has been satisfied.
Subordinate Debt. None.
Mezzanine Loan and Preferred Equity. Not permitted.
Release of Property. Not permitted.
Letter of Credit. None. However, the borrower may provide a letter of credit to prevent a DSCR Event or to fund certain reserves as described above under “Lockbox and Cash Management.”
Right of First Offer/Right of First Refusal. None.
Ground Lease. None.
Terrorism Insurance. The borrower is required to obtain and maintain an “all risk” property insurance policy that covers perils of terrorism and acts of terrorism in an amount equal to the “full replacement cost” of the Sun Center Plaza Property together with 18 months of business income insurance with a six month extended period of indemnity. For so long as the Terrorism Risk Insurance Act of 2002, as amended and modified by the Terrorism Risk Insurance Program Reauthorization Act of 2015 (“TRIPRA”) (including any extensions thereof or if another federal governmental program is in effect relating to "acts of terrorism" which provides substantially similar protections) is in effect, the lender is required to accept terrorism insurance which covers against “covered acts” as defined by TRIPRA (or such other program), so long as TRIPRA (or such other program) continues to cover both domestic and foreign acts of terrorism; provided that if TRIPRA or a similar or subsequent statute is not in effect, then, provided that terrorism insurance is commercially available, the borrower will be required to carry terrorism insurance, but will not be required to pay more than two times the amount of the insurance premiums that are payable at such time in respect of the property and rental loss and/or business income insurance required by the loan documents (without giving effect to the cost of terrorism components of such insurance). See “Risk Factors—Risks Relating to the Mortgage Loans—Terrorism Insurance May Not Be Available for All Mortgaged Properties” in the prospectus.
| This is not a research report and was not prepared by any Underwriter’s research department. Please see additional important information and qualifications at the end of this Term Sheet. | ||
| 71 | ||
| Office – CBD | Loan #5 | Cut-off Date Balance: | $40,000,000 | |
| Various | 33 West State Street and 50 East State Street | Cut-off Date LTV: | 65.1% | |
| Trenton, NJ 08608 | UW NCF DSCR: | 1.50x | ||
| UW NOI Debt Yield: | 11.3% |
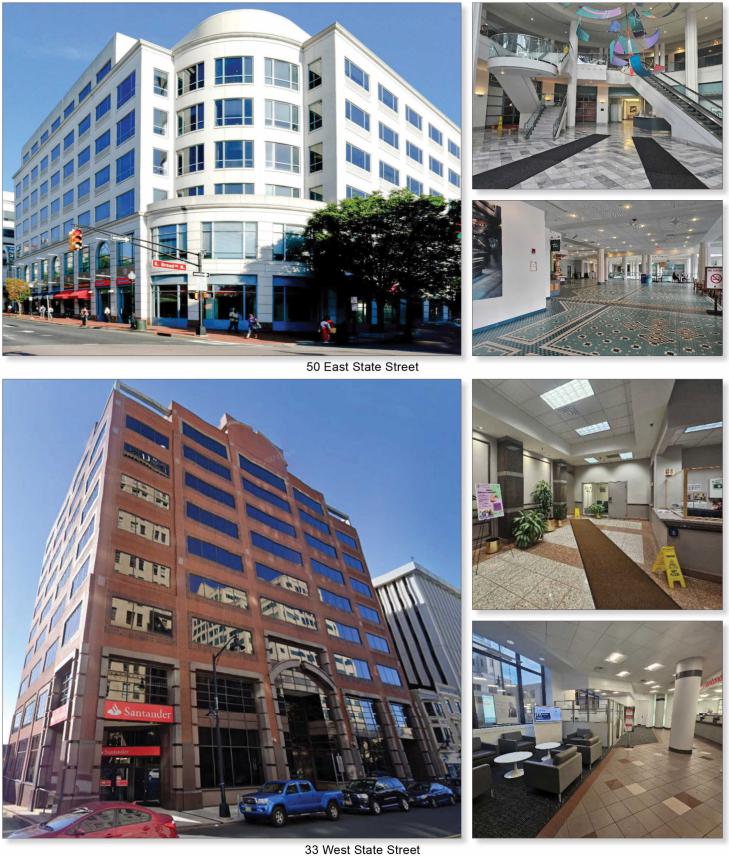
| This is not a research report and was not prepared by any Underwriter’s research department. Please see additional important information and qualifications at the end of this Term Sheet. | ||
| 72 | ||
| Office – CBD | Loan #5 | Cut-off Date Balance: | $40,000,000 | |
| Various | 33 West State Street and 50 East State Street | Cut-off Date LTV: | 65.1% | |
| Trenton, NJ 08608 | UW NCF DSCR: | 1.50x | ||
| UW NOI Debt Yield: | 11.3% |
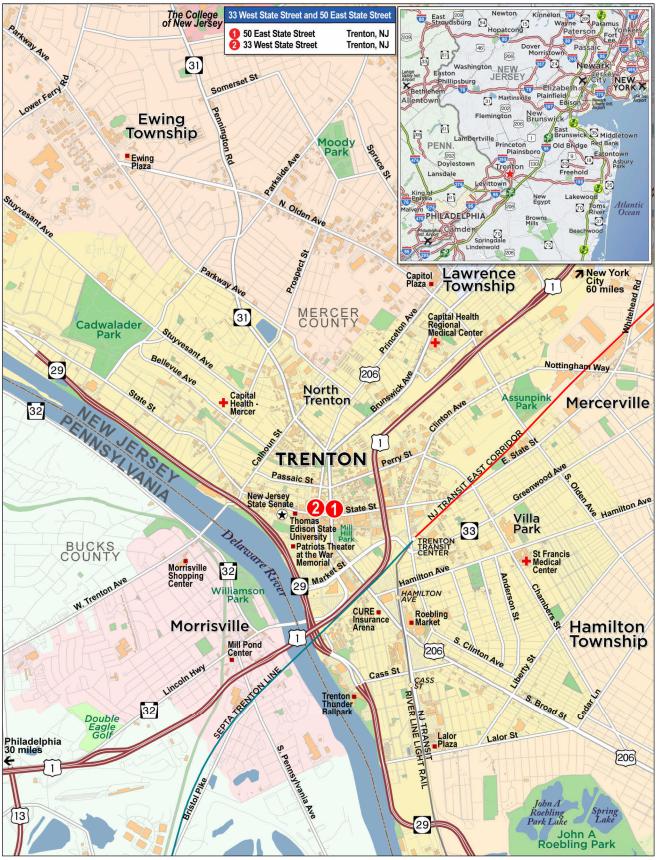
| This is not a research report and was not prepared by any Underwriter’s research department. Please see additional important information and qualifications at the end of this Term Sheet. | ||
| 73 | ||
| Mortgage Loan No. 5 – 33 West State Street and 50 East State Street |
| Mortgage Loan Information | Property Information | ||||||
| Mortgage Loan Seller: | MSMCH | Single Asset/Portfolio: | Portfolio | ||||
| Credit Assessment (Moody’s/Fitch/KBRA): | NR/NR/NR | Location: | Trenton, NJ 08608 | ||||
| Original Balance(1): | $40,000,000 | General Property Type: | Office | ||||
| Cut-off Date Balance(1): | $40,000,000 | Detailed Property Type: | CBD | ||||
| % of Initial Pool Balance: | 7.7% | Title Vesting: | Fee | ||||
| Loan Purpose: | Refinance | Year Built/Renovated(5): | Various/NAP | ||||
| Borrower Sponsor: | Muddy Puddles LLC | Size: | 473,622 SF | ||||
| Guarantors: | Simon Glick, Seymour Pluchenik and | Cut-off Date Balance Per SF(1): | $190 | ||||
| Menashe Frankel | Maturity Date Balance Per SF(1): | $190 | |||||
| Mortgage Rate: | 7.3500% | Property Manager: | Ten to Five Management LLC | ||||
| Note Date: | 1/17/2024 | (borrower-related) | |||||
| First Payment Date: | 3/6/2024 | ||||||
| Maturity Date: | 2/6/2029 | ||||||
| Original Term to Maturity: | 60 months | Underwriting and Financial Information | |||||
| Original Amortization Term: | 0 months | UW NOI(6): | $10,174,057 | ||||
| IO Period: | 60 months | UW NOI Debt Yield(1): | 11.3% | ||||
| Seasoning: | 0 months | UW NOI Debt Yield at Maturity(1): | 11.3% | ||||
| Prepayment Provisions: | L(24),D(29),O(7) | UW NCF DSCR(1): | 1.50x | ||||
| Lockbox/Cash Mgmt Status: | Hard/In Place | Most Recent NOI(6): | $13,276,204 (10/31/2023 TTM) | ||||
| Additional Debt Type(1)(2): | Pari Passu | 2nd Most Recent NOI(6): | $9,129,723 (12/31/2022) | ||||
| Additional Debt Balance(1)(2): | $50,000,000 | 3rd Most Recent NOI: | $8,995,912 (12/31/2021) | ||||
| Future Debt Permitted (Type): | No (NAP) | Most Recent Occupancy: | 93.7% (12/12/2023) | ||||
| Reserves(3) | 2nd Most Recent Occupancy: | 96.1% (12/31/2022) | |||||
| Type | Initial | Monthly | Cap | 3rd Most Recent Occupancy: | 96.8% (12/31/2021) | ||
| RE Tax: | $267,288 | $267,288 | NAP | Appraised Value (as of)(7): | $138,300,000 (11/28/2023) | ||
| Insurance: | $78,813 | $15,763 | NAP | Appraised Value Per SF: | $292 | ||
| Replacement Reserves: | $0 | $7,894 | NAP | Cut-off Date LTV Ratio(1): | 65.1% | ||
| TI/LC Reserves(4): | $20,000,000 | $0 | NAP | Maturity Date LTV Ratio(1): | 65.1% | ||
| Sources and Uses | ||||||
| Sources | Proceeds | % of Total | Uses | Proceeds | % of Total | |
| Whole Loan Amount(1): | $90,000,000 | 100.0% | Loan payoff(8) | $59,062,024 | 65.6% | |
| Reserves | $20,346,101 | 22.6% | ||||
| Return of Equity | $9,027,121 | 10.0% | ||||
| Closing Costs: | $1,564,754 | 1.7% | ||||
| Total Sources: | $90,000,000 | 100.0% | Total Uses: | $90,000,000 | 100.0% | |
| (1) | The 33 West State Street and 50 East State Street Mortgage Loan (as defined below) is part of the 33 West State Street and 50 East State Street Whole Loan (as defined below), which is comprised of two pari passu promissory notes with an aggregate original principal balance of $90,000,000. The Cut-off Date Balance Per SF, Maturity Date Balance Per SF, UW NCF DSCR, UW NOI Debt Yield, UW NOI Debt Yield at Maturity, Cut-off Date LTV Ratio and Maturity Date LTV Ratio presented above are based on the aggregate Cut-off Date principal balance of the 33 West State Street and 50 East State Street Whole Loan. |
| (2) | See “The Mortgage Loan” below. |
| (3) | See “Escrows and Reserves” below for further discussion of reserve requirements. |
| (4) | The State of New Jersey’s leases at each of the 50 East State Street Property (as defined below) and the 33 West State Street Property (as defined below) require the related borrower to perform certain improvement work and to spend, in connection with such work, an aggregate tenant improvement allowance of $20,000,000. Should the sum of the borrower’s expenditures for or in connection with such improvements in the aggregate equal less than $20,000,000, then the State of New Jersey will either receive a rent credit equaling the difference between such expenditures and $20,000,000, or, at the State of New Jersey’s sole discretion, apply the rent credit towards additional refurbishment work by the borrower at either the 50 East State Street Property and/or the 33 West State Street Property. At origination of the 33 West State Street and 50 East State Street Mortgage Loan, $20,000,000 was reserved for the cost of performing such improvement work. |
| (5) | See the “Portfolio Summary” chart below. |
| (6) | The increase from 2nd Most Recent NOI to Most Recent NOI and subsequent decrease to UW NOI are primarily attributable to the one-time holdover rent associated with the State of New Jersey’s leases. |
| (7) | The 50 East State Street Property has an appraised value of $82,800,000 and the 33 West State Street Property has an appraised value of $55,500,000. |
| (8) | Loan Payoff represents the full loan payoff of the prior CMBS debt securitized in UBSBB 2012-C2, which was paid off by the borrower via cash and an intercompany loan prior to the origination of the 33 West State Street and 50 East State Street Whole Loan. |
The Mortgage Loan. The fifth largest mortgage loan (the “33 West State Street and 50 East State Street Mortgage Loan”) is part of a whole loan (the “33 West State Street and 50 East State Street Whole Loan”) with an original principal balance of $90,000,000. The 33 West State Street and 50 East State Street Whole Loan is secured by a first priority mortgage encumbering the borrower’s fee interest in two office properties totaling 473,622 SF, each located in Trenton, New Jersey (collectively, the “33 West State Street and 50 East State Street Properties”). The 33 West State Street and 50 East State Street Whole Loan is comprised of two pari passu promissory notes in the aggregate original principal balance of $90,000,000. The 33 West State Street and 50 East State Street Whole Loan was co-originated by Morgan Stanley Bank, N.A. (“MSBNA”) and Citi Real Estate Funding Inc. (“CREFI”). The non-controlling note A-2 with an original principal balance of $40,000,000, represents the 33 West State Street and 50 East State Street Mortgage Loan and will be included in the BANK5 2024-5YR5 securitization trust. The controlling 33 West State Street and 50 East State Street pari passu note is currently held by
| This is not a research report and was not prepared by any Underwriter’s research department. Please see additional important information and qualifications at the end of this Term Sheet. | ||
| 74 | ||
| Office – CBD | Loan #5 | Cut-off Date Balance: | $40,000,000 | |
| Various | 33 West State Street and 50 East State Street | Cut-off Date LTV: | 65.1% | |
| Trenton, NJ 08608 | UW NCF DSCR: | 1.50x | ||
| UW NOI Debt Yield: | 11.3% |
CREFI and is expected to be contributed to the BMO 2024-5C3 securitization. The 33 West State Street and 50 East State Street Whole Loan is expected to be serviced pursuant to the pooling and servicing agreement for the BMO 2024-5C3 securitization. See “Description of the Mortgage Pool—The Whole Loans—The Non-Serviced Pari Passu Whole Loans” and “Pooling and Servicing Agreement—Servicing of the Non-Serviced Mortgage Loans” in the prospectus.
| Whole Loan Summary | ||||
| Notes | Original Balance | Cut-off Date Balance | Note Holder | Controlling Piece |
| A-1 | $50,000,000 | $50,000,000 | BMO 2024-5C3(1) | Yes |
| A-2 | $40,000,000 | $40,000,000 | BANK5 2024-5YR5 | No |
| Total | $90,000,000 | $90,000,000 | ||
| (1) | The BMO 2024-5C3 securitization is expected to close on or before the Closing Date. |
The Borrower and the Borrower Sponsor. The borrower is 33-50 State Street LLC, a Delaware limited liability company and single-purpose entity having at least one independent director in its organizational structure. Legal counsel to the borrower delivered a non-consolidation opinion in connection with the origination of the 33 West State Street and 50 East State Street Whole Loan. The borrower sponsor is Muddy Puddles LLC and the non-recourse carveout guarantors are Simon Glick, Seymour Pluchenik and Menashe Frankel. Simon Glick oversees Glick Family Investments, which is a family office, based in New York that specializes in real estate and private equity investments.
The Properties. The 33 West State Street and 50 East State Street Properties consist of two office properties located at 50 East State Street and 33 West State Street within two blocks of each other, in Trenton, New Jersey, which collectively total 473,622 SF.
50 East State Street Property
The 50 East State Street property is comprised of a seven-story office building totaling 305,885 SF located at 50 East State Street, Trenton, New Jersey (the “50 East State Street Property”). The 50 East State Street Property was built in 1989 and is situated on an approximately 1.90-acre site. The 50 East State Street Property features six elevators, 14’ ceiling heights and 14 surface parking spaces, resulting in a parking ratio of approximately 0.05 spaces per 1,000 SF. The State of New Jersey occupies 246,138 SF of space at the 50 East State Street Property and has access to 304 of the 310 parking spaces at the 33 West State Street Property described below. As of December 12, 2023, the 50 East State Street Property was 90.5% occupied by 14 tenants.
33 West State Street Property
The 33 West State Street property is comprised of a nine-story office building totaling 167,737 SF located at 33 West State Street, Trenton, New Jersey (the “33 West State Street Property”). The 33 West State Street Property was built in 1986 and is situated on an approximately 0.77-acre site. The 33 West State Street Property features six elevators, 14’ ceiling heights and a 310-space parking garage, resulting in a parking ratio of approximately 1.85 spaces per 1,000 SF. As of December 12, 2023, the 33 West State Street Property was 99.6% occupied by the State of New Jersey and Santander Sovereign Bank (“Santander”). The State of New Jersey occupies the entirety of the 163,480 square foot office component at the 33 West State Street Property with Santander occupying 3,583 SF of ground floor retail space.
The following table presents certain information relating to the 33 West State Street and 50 East State Street Properties.
| Portfolio Summary | ||||||||||
| Property Name | City, State | Year Built / Renovated | Tenant SF(1) | Occupancy | (1) | Allocated Whole Loan Cut-off Date Balance | % of Allocated Whole Loan Cut-off Date Balance | Appraised Value | UW NOI(1) | % of UW NOI |
| 50 East State Street | Trenton, NJ | 1989 / NAP | 305,885 | 90.5% | $54,000,000 | 60.0% | $82,800,000 | $5,785,098 | 56.9% | |
| 33 West State Street | Trenton, NJ | 1986 / NAP | 167,737 | 99.6% |
| $36,000,000 | 40.0% | $55,500,000 | $4,388,959 | 43.1% |
| Total/Wtd. Avg. | 473,622 | 93.7% | $90,000,000 | 100.0% | $138,300,000 | $10,174,057 | 100.0% | |||
Source: Appraisals, unless otherwise noted.
| (1) | Information is based on the underwritten rent roll dated December 12, 2023. |
Major Tenants.
State of New Jersey (409,618 SF; 86.5% of NRA; 92.0% of underwritten base rent): The State of New Jersey leases 246,138 SF of space at the 50 East State Street Property and 163,480 SF of space at the 33 West State Street Property. The space leased to the State of New Jersey at the 50 East State Street Property is occupied by various divisions of the Department of Children and Families on the second through seventh floors. The space leased to the State of New Jersey at the 33 West State Street Property is occupied by the Department of Property Management and Construction on the 8th and 9th floors, the Office of Management and Budget on the 6th, 7th, and 2nd floors, the Department of Revenue on the 3rd and 5th floors, the Secretary of State (Staff) Elections on the 4th floor, and the State of New Jersey Economic office on the first floor. The State of New Jersey has been in occupancy at the 33 West State Street and 50 East State Street Properties since they were built in 1986 and 1989 and has a current lease term through October 2038 with no renewal options. The State of New Jersey may terminate its lease at either or both of the 50 East State Street Property and the 33 West State Street Property at any time if either (x) appropriations have not been made by the state legislature for payment of its rent pursuant to its respective lease or (y) the State of New Jersey Leasing and Space Utilization Committee rejects the State of New Jersey’s respective lease.
TD Bank (6,218 SF; 1.3% of NRA; 1.4% of underwritten base rent): TD Bank (NYSE: TD) is one of the ten largest banks in the U.S., providing over ten million customers with a full range of retail, small business and commercial banking products and services at more than 1,100 locations throughout the
| This is not a research report and was not prepared by any Underwriter’s research department. Please see additional important information and qualifications at the end of this Term Sheet. | ||
| 75 | ||
| Office – CBD | Loan #5 | Cut-off Date Balance: | $40,000,000 | |
| Various | 33 West State Street and 50 East State Street | Cut-off Date LTV: | 65.1% | |
| Trenton, NJ 08608 | UW NCF DSCR: | 1.50x | ||
| UW NOI Debt Yield: | 11.3% |
Northeast, MidAtlantic, Metro D.C., the Carolinas and Florida. TD Bank has been a tenant at the 50 East State Street Property since November 2002 and has a current lease term through June 2028 with one, five-year renewal option and no termination options.
Kicks USA (6,161 SF; 1.3% of NRA; 1.2% of underwritten base rent): Founded in 2002, Kicks USA is a sportswear and sneaker retailer operating in New Jersey, New York, Pennsylvania and Maryland. Kicks USA has been a tenant at the 50 East State Street Property since October 2015 and has a current lease term through December 2025 with two, five-year renewal options and no termination options.
The following table presents a summary regarding the major tenants at the 33 West State Street and 50 East State Street Properties:
| Tenant Summary(1) | ||||||||||
| Tenant Name | Property | Credit Rating (Moodys/S&P/ Fitch)(2) | Tenant SF | Approx.% of SF | Annual UW Base Rent(3) | Annual UW Base Rent PSF(3) | % of Total Annual UW Base Rent(3) | Lease Expiration | Renewal Option | Term. Option (Y/N) |
| State of New Jersey(4) | Various | A1/A/A+ | 409,618 | 86.5% | $9,585,038 | $23.40 | 92.0% | 10/31/2038 | None | N |
| TD Bank | 50 East State Street | Aa2/AA-/AA- | 6,218 | 1.3% | $150,476 | $24.20 | 1.4% | 6/30/2028 | 1x5 yr | N |
| Kicks USA | 50 East State Street | NR/NR/NR | 6,161 | 1.3% | $123,220 | $20.00 | 1.2% | 12/31/2025 | 2x5 yr | N |
| Santander Sovereign Bank | 33 West State Street | Baa2/BBB+/NR | 3,583 | 0.8% | $96,812 | $27.02 | 0.9% | 6/30/2029 | 1x5 yr | N |
| Metro PCS of Pennsylvania, LLC | 50 East State Street | NR/NR/NR | 3,110 | 0.7% | $96,410 | $31.00 | 0.9% | 7/31/2026 | None | N |
| USA Vein Clinics of New Jersey LLC(5) | 50 East State Street | NR/NR/NR | 4,087 | 0.9% | $83,784 | $20.50 | 0.8% | 1/31/2033 | 2x5 yr | N |
| Express Management Holdings LLC | 50 East State Street | NR/NR/NR | 2,538 | 0.5% | $60,444 | $23.82 | 0.6% | 4/30/2027 | None | N |
| Walgreens Eastern Co., Inc. | 50 East State Street | NR/NR/NR | 2,190 | 0.5% | $40,953 | $18.70 | 0.4% | 12/31/2027 | 2x5 yr | Y |
Bosphorus Enterprises, Inc. (Cricket Wireless) | 50 East State Street | NR/NR/NR | 2,195 | 0.5% | $40,498 | $18.45 | 0.4% | 12/31/2028 | 1x5 yr | N |
| Jersey Health Examiners, P.A | 50 East State Street | A-/A3/NR | 1,250 | 0.3% | $31,875 | $25.50 | 0.3% | 10/31/2024 | 2x5 yr | N |
| Subtotal/Wtd. Avg. | 440,950 | 93.10% | $10,309,509 | $23.38 | 98.9% | |||||
| Other Tenants | 3,003 | 0.6% | $111,188 | $37.03 | 1.1% | |||||
| Vacant Space | 29,669 | 6.3% | $0 | $0.00 | 0.0% | |||||
| Total/Wtd. Avg.(6) | 473,622 | 100.0% | $10,420,696 | $23.47 | 100.0% | |||||
| (1) | Information is based on the underwritten rent rolls dated December 12, 2023. |
| (2) | Certain ratings are those of the parent entity, whether or not the parent entity guarantees the lease. |
| (3) | Annual UW Base Rent, Annual UW Base Rent PSF and % of Total Annual UW Base Rent include straight-line rent steps of $163,847 for the State of New Jersey and contractual rent steps through December 12, 2024 totaling $6,967. |
| (4) | The State of New Jersey leases 246,138 SF of space at the 50 East State Street Property and 163,480 SF of space at the 33 West State Street Property. Pursuant to its leases, the State of New Jersey pays approximately $5,661,174 in annual average rent for its space at the 50 East State Street Property and $3,760,017 in annual average rent for its space at the 33 West State Street Property. The State of New Jersey may terminate its lease at either or both of the 50 East State Street Property and the 33 West State Street Property at any time if either (x) appropriations have not been made by the state legislature for payment of its rent pursuant to its respective lease or (y) the State of New Jersey Leasing and Space Utilization Committee rejects the State of New Jersey’s respective lease. |
| (5) | USA Vein Clinics of New Jersey LLC may terminate its lease in August 2027, August 2029 or August 2031 by providing at least 180 days’ prior notice and payment of an early termination fee equal to any pre-paid leasing commission(s) and reimbursement to the borrower for any unamortized portion of construction costs paid for by the borrower (50% if terminated in August 2027, 30% if terminated in August 2029, and 10% if terminated in August 2031). |
| (6) | Total/Wtd. Avg. Annual UW Base Rent PSF Rolling excludes vacant space. |
| This is not a research report and was not prepared by any Underwriter’s research department. Please see additional important information and qualifications at the end of this Term Sheet. | ||
| 76 | ||
| Office – CBD | Loan #5 | Cut-off Date Balance: | $40,000,000 | |
| Various | 33 West State Street and 50 East State Street | Cut-off Date LTV: | 65.1% | |
| Trenton, NJ 08608 | UW NCF DSCR: | 1.50x | ||
| UW NOI Debt Yield: | 11.3% |
The following table presents certain information relating to the lease rollover at the 33 West State Street and 50 East State Street Properties:
| Lease Rollover Schedule(1)(2) | ||||||||
| Year | # of Leases Rolling | SF Rolling | Annual UW Rent PSF Rolling(3) | Approx. % of Total SF Rolling | Approx. Cumulative % of SF Rolling | Total UW Rent Rolling(3) | Approx. % of UW Rent Rolling(3) | Approx. Cumulative % of UW Rent Rolling(3) |
| 2024 & MTM(4) | 4 | 3,890 | $26.61 | 0.8% | 0.8% | $103,505 | 1.0% | 1.0% |
| 2025 | 1 | 6,161 | $20.00 | 1.3% | 2.1% | $123,220 | 1.2% | 2.2% |
| 2026 | 2 | 3,472 | $30.01 | 0.7% | 2.9% | $104,210 | 1.0% | 3.2% |
| 2027 | 2 | 4,728 | $21.45 | 1.0% | 3.9% | $101,397 | 1.0% | 4.1% |
| 2028 | 3 | 8,414 | $26.47 | 1.8% | 5.6% | $222,731 | 2.1% | 6.3% |
| 2029 | 1 | 3,583 | $27.02 | 0.8% | 6.4% | $96,812 | 0.9% | 7.2% |
| 2030 | 0 | 0 | $0.00 | 0.0% | 6.4% | $0 | 0.0% | 7.2% |
| 2031 | 0 | 0 | $0.00 | 0.0% | 6.4% | $0 | 0.0% | 7.2% |
| 2032 | 0 | 0 | $0.00 | 0.0% | 6.4% | $0 | 0.0% | 7.2% |
| 2033 | 1 | 4087 | $20.50 | 0.9% | 7.2% | $83,784 | 0.8% | 8.0% |
| 2034 | 0 | 0 | $0.00 | 0.0% | 7.2% | $0 | 0.0% | 8.0% |
| 2035 & Beyond | 2 | 409,618 | $23.40 | 86.5% | 93.7% | $9,585,038 | 92.0% | 100.0% |
| Vacant | 0 | 29,669 | $0.00 | 6.3% | 100.0% | $0 | 0.0% | 100.0% |
| Total/Wtd. Avg.(5) | 16 | 473,622 | $23.47 | 100.0% | $10,420,696 | 100.0% | ||
| (1) | Information is based on the underwritten rent rolls dated December 12, 2023. |
| (2) | Certain tenants may have lease termination options that are exercisable prior to the stated expiration date of the subject lease or leases which are not considered in the lease rollover schedule. |
| (3) | Annual UW Rent PSF Rolling, Total UW Rent Rolling, Approx. % of UW Rent Rolling and Approx. Cumulative % of UW Rent Rolling include straight-line rent steps of $163,847 for the State of New Jersey and contractual rent steps through December 12, 2024, totaling $6,967. |
| (4) | Includes two MTM tenants. |
| (5) | Total/Wtd. Avg. Annual UW Rent PSF Rolling excludes vacant space. |
The Market. The 33 West State Street and 50 East State Street Properties are located within two blocks of each other at 50 East State Street and 33 West State Street in Trenton, New Jersey and are part of the Trenton-Princeton, New Jersey Metropolitan Statistical Area (“Trenton MSA”). The 33 West State Street and 50 East State Street Properties are located approximately 33.0 miles northeast of Philadelphia and 60.3 miles southwest of New York City. The 33 West State Street and 50 East State Street Properties have nearby access to U.S. Routes 1 and 206, which provide immediate access to main highways connecting Trenton to area suburbs including Interstates 95, 195 and 295 and U.S. Route 1.
According to the appraisals, the 33 West State Street and 50 East State Street Properties are located in the Trenton Office submarket of the Trenton MSA. As of the third quarter of 2023, the Trenton Office submarket had a total office inventory of 29,814,783 SF, a vacancy rate of 10.2%, and average asking rent of $23.28 per square foot with no new deliveries within the past year.
The following table presents recent leasing data for office tenants at comparable office properties with respect to the 33 West State Street and 50 East State Street Properties:
| Comparable Office Lease Summary | |||||
| Subject/Location | Tenant Name | Size (SF) | Lease Size (SF) | Lease Date | Rent PSF |
| 33 West State Street and 50 East State Street | Various | Various | 473,622(1) | Various | $23.47(1) |
| Tower Center 1 | HCL | 40,732 | 565,913 | Aug-23 | $31.50 |
| Tower Center 1 | Confidential | 26,770 | 18,368 | May-21 | $29.50 |
| Van Nest Office Park | Caplin Steriles USA | 1,492 | 10,786 | Oct-23 | $17.00 |
| 200 Princeton South Corporate Center | Berkley Insurance | 15,561 | 8,034 | Oct-22 | $30.50 |
| Princeton Forrestal Center | MRM | 16,306 | 23,314 | Aug-22 | $32.00 |
| The Commons | Bristol-Myers Squibb | 118,110 | 17,154 | Mar-21 | $35.00 |
Source: Appraisals, unless otherwise noted.
| (1) | Information obtained from the underwritten rent rolls dated December 12, 2023. |
| This is not a research report and was not prepared by any Underwriter’s research department. Please see additional important information and qualifications at the end of this Term Sheet. | ||
| 77 | ||
| Office – CBD | Loan #5 | Cut-off Date Balance: | $40,000,000 | |
| Various | 33 West State Street and 50 East State Street | Cut-off Date LTV: | 65.1% | |
| Trenton, NJ 08608 | UW NCF DSCR: | 1.50x | ||
| UW NOI Debt Yield: | 11.3% |
Operating History and Underwritten Net Cash Flow. The following table presents certain information relating to the historical operating performance and the Underwritten Net Cash Flow at the 33 West State Street and 50 East State Street Properties:
| Cash Flow Analysis | |||||||
| 2020 | 2021 | 2022(1) | 10/31/2023 TTM(1) | UW(1) | UW PSF | ||
| Gross Potential Rent(2) | $9,324,936 | $9,202,916 | $9,447,806 | $13,155,241 | $11,475,742 | $24.23 | |
| Reimbursements | $5,869,897 | $6,033,941 | $6,289,863 | $6,612,451 | $6,500,018 | $13.72 | |
| Other Income(3) | $559,629 | $561,522 | $566,195 | $559,425 | $530,865 | $1.12 | |
| Less Vacancy & Credit Loss | $0 | $0 | $0 | $0 | ($1,056,551) |
| ($2.23) |
| Effective Gross Income | $15,754,462 | $15,798,379 | $16,303,864 | $20,327,117 | $17,450,074 | $36.84 | |
| Real Estate Taxes | $2,914,906 | $2,927,366 | $2,879,833 | $2,890,513 | $2,932,671 | $6.19 | |
| Insurance | $120,955 | $131,134 | $145,851 | $153,634 | $180,143 | $0.38 | |
| Other Expenses(4) | $3,640,977 | $3,743,967 | $4,148,457 | $4,006,766 | $4,163,202 |
| $8.79 |
| Total Expenses | $6,676,838 | $6,802,467 | $7,174,141 | $7,050,913 | $7,276,016 | $15.36 | |
| Net Operating Income | $9,077,625 | $8,995,912 | $9,129,723 | $13,276,204 | $10,174,057 | $21.48 | |
| Capital Expenditures | $0 | $0 | $0 | $0 | $94,724 | $0.20 | |
| TI/LC | $0 | $0 | $0 | $0 | $50,330 |
| $0.11 |
| Net Cash Flow | $9,077,625 | $8,995,912 | $9,129,723 | $13,276,204 | $10,029,003 | $21.18 | |
| Occupancy % | 96.0% | 96.8% | 96.1% | 93.7% | 94.1% | (5) | |
| NOI DSCR(6) | 1.35x | 1.34x | 1.36x | 1.98x | 1.52x | ||
| NCF DSCR(6) | 1.35x | 1.34x | 1.36x | 1.98x | 1.50x | ||
| NOI Debt Yield(6) | 10.1% | 10.0% | 10.1% | 14.8% | 11.3% | ||
| NCF Debt Yield(6) | 10.1% | 10.0% | 10.1% | 14.8% | 11.1% | ||
| (1) | The increase in Net Operating Income from 2022 to TTM 10/31/2023 and subsequent decrease in Net Operating Income from TTM 10/31/2023 to Underwritten are primarily attributable to the one-time holdover rent associated with the State of New Jersey’s leases. |
| (2) | Based on the underwritten rent roll dated as of December 12, 2023, UW Gross Potential Rent is inclusive of straight-line rent steps of $163,847 for the State of New Jersey and contractual rent steps through December 12, 2024, totaling $6,967. |
| (3) | Other Income includes $507,552 in parking income, and the remainder is from miscellaneous income. |
| (4) | Other Expenses consist of management fee, payroll and benefits, contract services, repairs and maintenance, utilities, general and administrative payroll and benefits, cleaning, repairs and maintenance, utilities, general and administrative and parking expenses. |
| (5) | Represents Economic Occupancy. |
| (6) | Debt service coverage ratios and debt yields are based on the aggregate Cut-off Date balance of the 33 West State Street and 50 East State Street Whole Loan. |
Escrows and Reserves.
At origination of the 33 West State Street and 50 East State Street Whole Loan, the borrower deposited approximately (i) $267,288 into a reserve account for real estate taxes, (ii) $78,813 into a reserve account for insurance premiums, and (iii) $20,000,000 into a reserve account for tenant improvements and leasing commissions.
Tax Reserve – The borrower is required to deposit into a real estate tax reserve, on a monthly basis, 1/12 of the taxes that the lender reasonably estimates will be payable over the next-ensuing 12-month period (initially estimated to be approximately $267,288).
Insurance Reserve – The borrower is required to deposit into an insurance reserve, on a monthly basis, 1/12 of the amount, which will be sufficient to pay the insurance premiums due for the renewal of coverage afforded by such policies (initially estimated to be approximately $15,763).
Replacement Reserve – The borrower is required to deposit into a replacement reserve, on a monthly basis, approximately $7,894.
TI / LC Reserve – If at any time any Specified Tenant (as defined below) requires that the borrower provide a refurbishment allowance and/or rent credit, the borrower is required to deposit the full amount of such refurbishment allowance and/or rent credit into the reserve account for tenant improvements and leasing commissions.
Lockbox and Cash Management. The 33 West State Street and 50 East State Street Whole Loan is structured with a hard lockbox and in place cash management. The borrower is required to, and is required to cause the property manager to, immediately deposit all revenue directly into a lender approved lockbox account. Within five business days of the execution of the lockbox account agreement, the borrower is required to deliver a notice to all tenants at the 33 West State Street and 50 East State Street Properties directing them to remit all payments due under the applicable lease directly to the lender-controlled lockbox. All funds deposited into the lockbox are required to be transferred on each business day to the cash management account, to be applied and disbursed in accordance with the 33 West State Street and 50 East State Street Whole Loan documents, and all excess cash flow funds remaining in the cash management account after the application of such funds will (i) to the extent that a Trigger Period (as defined below) has occurred and is continuing, be deposited in the excess cash flow account, and (ii) to the extent no Trigger Period exists, be disbursed to the borrower. Upon an event of default under the 33 West Street and 50 East State Street Whole Loan documents, the lender may apply funds to the debt in such priority as it may determine.
| This is not a research report and was not prepared by any Underwriter’s research department. Please see additional important information and qualifications at the end of this Term Sheet. | ||
| 78 | ||
| Office – CBD | Loan #5 | Cut-off Date Balance: | $40,000,000 | |
| Various | 33 West State Street and 50 East State Street | Cut-off Date LTV: | 65.1% | |
| Trenton, NJ 08608 | UW NCF DSCR: | 1.50x | ||
| UW NOI Debt Yield: | 11.3% |
A “Specified Tenant” means, as applicable, the State of New Jersey, together with any successor and/or assigns thereof, (i) any other lessee(s) of the Specified Tenant space (or any portion thereof) and (ii) any guarantor(s) of the applicable related Specified Tenant lease(s).
A “Trigger Period” means a period (A) commencing upon the earliest of (i) the occurrence and continuance of an event of default, (ii) the debt service coverage ratio being less than 1.25x, and (iii) the occurrence of a Specified Tenant Trigger Period (as defined below), and (B) expiring upon (x) with regard to any Trigger Period commenced pursuant to clause (i) above, the cure (if applicable) of such event of default, (y) with regard to any Trigger Period commenced pursuant to clause (ii) above, the date that the debt service coverage ratio is equal to or greater than 1.25x for two consecutive calendar quarters, and (z) with regard to any Trigger Period commenced pursuant to clause (iii) above, a Specified Tenant Trigger Period ceasing to exist.
A “Specified Tenant Trigger Period” means a period (A) commencing upon the first to occur of (i) a Specified Tenant being in monetary or material non-monetary default under the applicable Specified Tenant lease beyond any applicable notice and cure periods, (ii) a Specified Tenant failing to be in actual, physical possession of the Specified Tenant space (or applicable portion thereof), (iii) other than in connection with a permitted dark event, Specified Tenant failing to be open for business during customary hours and/or “going dark” in the Specified Tenant space (or applicable portion thereof), (iv) a Specified Tenant giving notice that it is terminating its lease for all or any portion of the Specified Tenant space (or applicable portion thereof), (v) any termination or cancellation of any Specified Tenant lease (including, without limitation, rejection in any bankruptcy or similar insolvency proceeding) and/or any Specified Tenant lease failing to otherwise be in full force and effect, (vi) any bankruptcy or similar insolvency of Specified Tenant, and (vii) a Specified Tenant failing to extend or renew the applicable Specified Tenant lease for a minimum renewal term of five years on or prior to the earlier to occur of (1) twelve months prior to the expiration of the then applicable term of the applicable Specified Tenant lease and (2) the date required under a Specified Tenant lease by which the tenant thereunder is required to give notice of its exercise of a renewal option thereunder, in each case, in accordance with the applicable terms and conditions thereof and the 33 West State Street and 50 East State Street Whole Loan documents; and (B) expiring upon the first to occur of the lender’s receipt of evidence reasonably acceptable to the lender of (1) the satisfaction of the applicable Specified Tenant Cure Conditions (as defined below), or (2) the borrower leasing the entire Specified Tenant space (or applicable portion thereof) pursuant to one or more leases in accordance with the applicable terms and conditions of the 33 West State Street and 50 East State Street Whole Loan documents, the applicable tenant(s) under such lease(s) being in actual, physical occupancy of the space demised under its lease, all contingencies to effectiveness of such lease have expired or been satisfied, each such lease has commenced and a rent commencement date has been established.
“Specified Tenant Cure Conditions” means each of the following, as applicable (i) the applicable Specified Tenant has cured all defaults under the applicable Specified Tenant lease, (ii) the applicable Specified Tenant is in actual, physical possession of the Specified Tenant space (or applicable portion thereof) and open for business during customary hours and not “dark” in the Specified Tenant space (or applicable portion thereof) (unless the sole reason the applicable Specified Tenant is not open for business or “dark” is an ongoing permitted dark event with respect to said applicable Specified Tenant lease), (iii) the applicable Specified Tenant has revoked or rescinded all termination or cancellation notices with respect to the applicable Specified Tenant lease and has re-affirmed the applicable Specified Tenant lease as being in full force and effect, (iv) in the event the Specified Tenant Trigger Period is due to the applicable Specified Tenant’s failure to extend or renew the applicable Specified Tenant lease in accordance with clause (vii) of the definition of “Specified Tenant Trigger Period”, the applicable Specified Tenant has renewed or extended the applicable Specified Tenant lease in accordance with the terms thereof and the 33 West State Street and 50 East State Street Whole Loan documents for a minimum renewal term of five years, (v) with respect to any applicable bankruptcy or insolvency proceedings involving the applicable Specified Tenant and/or the applicable Specified Tenant lease, the applicable Specified Tenant has affirmed the applicable Specified Tenant lease pursuant to final, non-appealable order of a court of competent jurisdiction, and (vi) the applicable Specified Tenant is paying full, unabated rent under the applicable Specified Tenant lease (unless (x) such non-payment of rent is solely the result of an abatement thereunder and (y) in connection with the foregoing abatement, the borrower has deposited cash into a reserve account with the lender in an amount equal to the total unabated rent that would otherwise be due and payable during all remaining unexpired abatement periods if no such abatement was in place).
Subordinate Debt. None.
Mezzanine Loan and Preferred Equity. Not permitted.
Release of Property. Not permitted.
Ground Lease. None.
Right of First Offer/Right of First Refusal. None.
Letter of Credit. None.
Terrorism Insurance. The 33 West State Street and 50 East State Street Whole Loan documents require that the “all risk” insurance policy required to be maintained by the borrower provide coverage for terrorism in an amount not less than 100% of the full replacement cost of the 33 West State Street and 50 East State Street Properties. The 33 West State Street and 50 East State Street Whole Loan documents also require business income/loss of rents insurance for a period of no less than the 18-month period commencing at the time of loss, together with a six month extended period of indemnity. Notwithstanding the foregoing, for so long as the Terrorism Risk Insurance Act of 2002, as extended and modified by the Terrorism Risk Insurance Program Reauthorization Act of 2015 (“TRIPRA”), is in effect (including any extensions thereof or if another federal governmental program is in effect relating to “acts of terrorism” which provides substantially similar protections as TRIPRA) and covers both domestic and foreign acts of terrorism, the lender is required to accept terrorism insurance which insures against “covered acts” as defined by TRIPRA (or such other program). See “Risk Factors—Risks Relating to the Mortgage Loans—Terrorism Insurance May Not Be Available for All Mortgaged Properties” in the prospectus.
| This is not a research report and was not prepared by any Underwriter’s research department. Please see additional important information and qualifications at the end of this Term Sheet. | ||
| 79 | ||
| Retail - Anchored | Loan #6 | Cut-off Date Balance: | $36,7500,000 | |
| 2280 Kalakaua Avenue, | Center Of Waikiki | Cut-off Date LTV: | 26.8% | |
| 325 and 333 Seaside Avenue | UW NCF DSCR: | 2.68x | ||
| Honolulu, HI 96815 | UW NOI Debt Yield: | 19.5% |
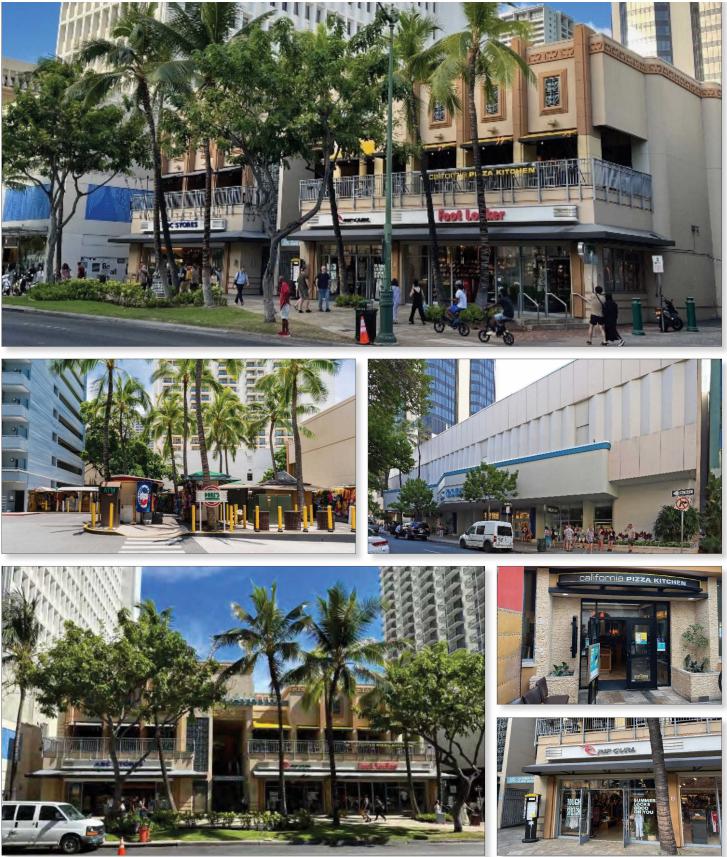
| This is not a research report and was not prepared by any Underwriter’s research department. Please see additional important information and qualifications at the end of this Term Sheet. | ||
| 80 | ||
| Retail - Anchored | Loan #6 | Cut-off Date Balance: | $36,7500,000 | |
| 2280 Kalakaua Avenue, | Center Of Waikiki | Cut-off Date LTV: | 26.8% | |
| 325 and 333 Seaside Avenue | UW NCF DSCR: | 2.68x | ||
| Honolulu, HI 96815 | UW NOI Debt Yield: | 19.5% |

| This is not a research report and was not prepared by any Underwriter’s research department. Please see additional important information and qualifications at the end of this Term Sheet. | ||
| 81 | ||
| Retail - Anchored | Loan #6 | Cut-off Date Balance: | $36,7500,000 | |
| 2280 Kalakaua Avenue, | Center Of Waikiki | Cut-off Date LTV: | 26.8% | |
| 325 and 333 Seaside Avenue | UW NCF DSCR: | 2.68x | ||
| Honolulu, HI 96815 | UW NOI Debt Yield: | 19.5% |

| This is not a research report and was not prepared by any Underwriter’s research department. Please see additional important information and qualifications at the end of this Term Sheet. | ||
| 82 | ||
| Mortgage Loan No. 6 – Center Of Waikiki |
| Mortgage Loan Information | Property Information | ||||||
| Mortgage Loan Seller: | WFB | Single Asset/Portfolio: | Single Asset | ||||
| Credit Assessment (Moody’s/Fitch/KBRA): | AAA/NR/AA | Location: | Honolulu, HI 96815 | ||||
| Original Balance: | $36,750,000 | General Property Type: | Retail | ||||
| Cut-off Date Balance: | $36,750,000 | Detailed Property Type: | Anchored | ||||
| % of Initial Pool Balance: | 7.1% | Title Vesting: | Fee | ||||
| Loan Purpose: | Refinance | Year Built/Renovated: | 1970; 1991; 2006 / 2020 | ||||
| Borrower Sponsor: | California Drive-In Theatres, Inc. | Size: | 70,324 SF | ||||
| Guarantor: | California Drive-In Theatres, Inc. | Cut-off Date Balance PSF: | $523 | ||||
| Mortgage Rate: | 6.9760% | Maturity Date Balance PSF: | $523 | ||||
| Note Date: | 12/7/2023 | Property Manager: | Avalon Commercial LLC; Elite Parking | ||||
| First Payment Date: | 1/11/2024 | Services, LLC (Parking) | |||||
| Maturity Date: | 12/11/2028 | ||||||
| Original Term to Maturity: | 60 months | ||||||
| Original Amortization Term: | 0 months | ||||||
| IO Period: | 60 months | Underwriting and Financial Information | |||||
| Seasoning: | 2 months | UW NOI: | $7,151,620 | ||||
| Prepayment Provisions: | L(26),D(27),O(7) | UW NOI Debt Yield: | 19.5% | ||||
| Lockbox/Cash Mgmt Status: | Springing/Springing | UW NOI Debt Yield at Maturity: | 19.5% | ||||
| Additional Debt Type: | No | UW NCF DSCR: | 2.68x | ||||
| Additional Debt Balance: | NAP | Most Recent NOI: | $5,966,211 (9/30/2023 TTM) | ||||
| Future Debt Permitted (Type): | No (NAP) | 2nd Most Recent NOI(2): | $5,454,353 (12/31/2022) | ||||
| Reserves(1) | 3rd Most Recent NOI(2): | $6,060,052 (12/31/2021) | |||||
| Type | Initial | Monthly | Cap | Most Recent Occupancy(3): | 66.8% (12/1/2023) | ||
| RE Taxes: | $0 | Springing | NAP | 2nd Most Recent Occupancy(3): | 64.3% (12/31/2022) | ||
| Insurance: | $0 | Springing | NAP | 3rd Most Recent Occupancy(3): | 74.9% (12/31/2021) | ||
| Replacement Reserve: | $0 | $2,600 | NAP | Appraised Value (as of): | $137,200,000 (10/26/2023) | ||
| TI/LC Reserve: | $0 | $13,186 | NAP | Appraised Value PSF: | $1,951 | ||
| Outstanding TI/LC Reserve: | $50,000 | $0 | NAP | Cut-off Date LTV Ratio: | 26.8% | ||
| Gap Rent Reserve: | $209,328 | $0 | NAP | Maturity Date LTV Ratio: | 26.8% | ||
| Sources and Uses | |||||||
| Sources | Proceeds | % of Total | Uses | Proceeds | % of Total | ||
| Mortgage Loan Amount: | $36,750,000 | 99.7% | Loan Payoff: | $36,245,877 | 98.3% | ||
| Borrower Sponsor Equity: | $127,699 | 0.3% | Reserves: | $259,328 | 0.7% | ||
| Closing Costs: | $372,494 | 1.0% | |||||
| Total Sources: | $36,877,699 | 100.0% | Total Uses: | $36,877,699 | 100.0% | ||
| (1) | See “Escrows and Reserves” below. |
| (2) | The decrease in NOI between 2021 and 2022 was primarily due to the impact of COVID 19. |
| (3) | Occupancy was provided by the borrower and does not include occupancy of: Duke’s Lane Marketplace (as defined below) which consist of 89 kiosk stalls and is 79.8% occupied by kiosk count, and Waikiki Parking Garage (as defined below). |
The Mortgage Loan. The sixth largest mortgage loan (the “Center of Waikiki Mortgage Loan”) is evidenced by a promissory note in the original principal amount of $36,750,000 and secured by the fee interest in three retail buildings totaling 70,324 SF, an outdoor marketplace and one parking garage located in Honolulu, HI (the “Center of Waikiki Property”).
The Borrower and the Borrower Sponsors. The borrower is Center of Waikiki, LLC, a Delaware limited liability company and single purpose entity with one independent director. Legal counsel to the borrower delivered a non-consolidation opinion in connection with the origination of Center of Waikiki Mortgage Loan. The borrower sponsor and non-recourse carveout guarantor is California Drive-In Theatres, Inc. (“CDIT”). CDIT is a vertically integrated real estate private equity firm and investment platform.
William Forman, who pioneered the concept of drive-in movies, founded CDIT in 1946. Forman’s grandson, Christopher Forman, has been CEO since 1994 and CDIT has subsequently diversified the company’s assets into commercial real estate properties. Today, CDIT owns a real estate portfolio comprised of approximately 45 properties operated and managed by Robertson Properties Group, the company’s real estate division, with more than half of the assets currently unencumbered.
The Property. The Center of Waikiki Property consists of three retail buildings totaling 70,324 SF of net rentable area, one outdoor marketplace and one parking garage located in Honolulu, HI. The sponsor developed the properties, which range in size from 15,543 SF to 28,916 SF, between 1970 and 2006. The collateral consists of three storefront retail buildings, an outdoor marketplace (“Duke’s Lane Marketplace”), and a 10-story parking garage (“Waikiki Parking Garage”) with 433 parking spaces (6.16 spaces per 1,000 SF). As of December 1, 2023, the property was 66.8% physically occupied by eight tenants excluding Duke’s Lane Marketplace, and 79.6% economically occupied including Duke’s Lane Marketplace.
| This is not a research report and was not prepared by any Underwriter’s research department. Please see additional important information and qualifications at the end of this Term Sheet. | ||
| 83 | ||
| Retail - Anchored | Loan #6 | Cut-off Date Balance: | $36,7500,000 | |
| 2280 Kalakaua Avenue, | Center Of Waikiki | Cut-off Date LTV: | 26.8% | |
| 325 and 333 Seaside Avenue | UW NCF DSCR: | 2.68x | ||
| Honolulu, HI 96815 | UW NOI Debt Yield: | 19.5% |
The property includes a 15,543 square foot space which was formerly occupied by an IMAX Theater that has been vacant since 2003. When excluding this static vacancy, the property is 85.7% physically occupied.
Duke’s Lane Marketplace is currently 79.8% occupied by various retail carts. The kiosk leases are signed with initial 12-month terms that then become month-to-month thereafter, with tenants paying a flat monthly base rent as well as a share of the total common area maintenance (“CAM”) costs to operate the marketplace. Since 2015, the average occupancy (by number of carts) at Duke’s Lane has been approximately 89.3%, as the closure and redevelopment of the International Market Place in 2013, which was previously a similar open-air marketplace with various independent retail stalls, removed any significant concentration of direct competition for outdoor kiosk retailers.
Major Tenants.
Ross Dress for Less (A2/BBB+ by Moody’s/S&P; 19,605 SF; 27.9% of NRA; 12.8% of underwritten base rent). Ross Dress for Less (“Ross” ) is an operator of discount retail stores. The company operates through off-price retail apparel and home fashion store banners such as Ross Dress for Less and dd’s discounts. Headquartered in Dublin, California, Ross offers men, women, and kid’s apparel, fashion and lifestyle accessories, footwear, jewelry, gourmet food and cookware, bed and bath products, toys, home accessories, garden decor, furniture, luggage, and sporting goods. It primarily operates through a network of stores in the US. Ross has been a tenant since 2012 and has a lease expiration date of January 31, 2028, with two, 5-year renewal options and no termination options.
California Pizza Kitchen (7,241 SF; 10.3% of NRA; 2.5% of underwritten base rent). Founded in 1985, California Pizza Kitchen has over 200 locations worldwide offering a range of Californian cuisine. California Pizza Kitchen has been a tenant since 2006 and has a lease expiration date of April 30, 2024 with no renewal options. As of September 2023, the tenant reported trailing 12-month sales of $491 PSF and an underwritten occupancy cost of 4.9%. California Pizza Kitchen is currently paying percentage in lieu of rent equal to 11% sales for the remainder of its term ($54 PSF based on T12 sales ending September 30, 2023). California Pizza Kitchen was underwritten on the base rent of $24.17 PSF.
Foot Locker (Ba3/BB by Moody’s/S&P; 7,091 SF; 10.1% of NRA; 21.6% of underwritten base rent). Headquartered in New York, New York, Foot Locker offers athletic footwear, apparel, and accessories, and currently has over 2,600 locations worldwide. Foot Locker carries many major athletic footwear and apparel brands including Nike, adidas, Reebok, New Balance, Under Armour, Vans, Converse, Champion, and many more. Foot Locker has been a tenant since 2006 and has a lease expiration of January 31, 2027, with no renewal and no termination options. As of September 2023, the tenant reported trailing 12-month sales of $695 PSF and an underwritten occupancy cost of 30.7%. Foot Locker is currently marketing its entire space for sublease, but is open and operational.
The following table presents certain information relating to the tenancy at the Center of Waikiki Property:
| Tenant Summary | ||||||||||||
| Tenant Name | Credit Rating (Fitch/Moody's/ S&P)(1) | Tenant SF | Approx. % of SF | Annual UW Rent | % of Total Annual UW Rent(2) | Annual UW Rent PSF | Termination Option (Y/N) | Lease Expiration | Renewal Options | |||
| Major Tenants | ||||||||||||
| Ross Dress for Less | NR/A2/BBB+ | 19,605 | 27.9% | $897,738 | 12.8% | $45.79 | N | 1/31/2028 | 2 x 5 years | |||
| California Pizza Kitchen | NR/NR/NR | 7,241 | 10.3% | $175,000 | (3) | 2.5% | $24.17 | (3) | N | 4/30/2024 | None | |
| Foot Locker(4) | NR/Ba3/BB | 7,091 | 10.1% | $1,515,931 | 21.6% | $213.78 | N | 1/31/2027 | None | |||
| ABC Stores | NR/NR/NR | 6,445 | 9.2% | $1,354,710 | 19.3% | $210.20 | N | 7/31/2033 | None | |||
| Rip Curl | NR/NR/NR | 2,461 | 3.5% | $653,892 | 9.3% | $265.70 | Y(5) | 1/31/2032 | 1 x 5 years | |||
| Central Pacific Bank | NR/NR/NR | 2,057 | 2.9% | $339,405 | 4.8% | $165.00 | N | 2/28/2029 | 1 x 5 years | |||
| Total/Wtd. Avg. | 44,900 | 63.8% | $4,936,676 | 70.5% | $109.95 | |||||||
| Non-Major Tenants(6) | 2,051 | (7) | 2.9% | $2,065,823 | 29.5% | $1,007.23 | (8) | |||||
| Occupied Collateral Total | 46,951 | (7) | 66.8% | $7,002,499 | 100.0% | $149.14 | (8) | |||||
| Vacant Space | 23,373 | (7) | 33.2% | |||||||||
| Total | 70,324 | (7) | 100.0% | |||||||||
| (1) | Credit ratings are those of the parent company, whether or not the parent company guarantees the lease. |
| (2) | % of Total Annual UW Rent does not include vacant space. |
| (3) | California Pizza Kitchen is currently paying percent in lieu of rent equal to 11% of sales for the remainder of its term ($54 PSF based on T12 sales ending September 30, 2023). California Pizza Kitchen was underwritten on the base rent of $24.17 PSF. |
| (4) | Foot Locker is currently marketing its entire space for sublease, but is open and operational. |
| (5) | The tenant has the one time right to terminate the lease on 1/31/2027 if gross sales for 2025 do not exceed $750,000 with notice by 1/31/2026 and a payment of an early termination fee equal to $121,437. Sales for the T12 period ending September 30, 2023 total $2.6 million. |
| (6) | Non-Major Tenants Annual UW Rent includes month to month kiosk tenants of Duke’s Lane Marketplace. |
| (7) | There is no SF attributable to the kiosk tenants at the Duke’s Lane Marketplace. |
| (8) | Annual UW Rent PSF includes the Annual UW Rent from the Duke’s Lane Marketplace tenants. |
| This is not a research report and was not prepared by any Underwriter’s research department. Please see additional important information and qualifications at the end of this Term Sheet. | ||
| 84 | ||
| Retail - Anchored | Loan #6 | Cut-off Date Balance: | $36,7500,000 | |
| 2280 Kalakaua Avenue, | Center Of Waikiki | Cut-off Date LTV: | 26.8% | |
| 325 and 333 Seaside Avenue | UW NCF DSCR: | 2.68x | ||
| Honolulu, HI 96815 | UW NOI Debt Yield: | 19.5% |
The following table presents a summary of sales and occupancy costs for certain Major Tenants at the Center of Waikiki Property:
| Tenant Sales(1) | |||||
2020 Sales (PSF) |
2021 Sales (PSF) | 2022 Sales (PSF) | TTM 9/30/2023 Sales (PSF) (2) | Occupancy Cost(2) | |
| Ross Dress for Less | NAV | NAV | NAV | NAV | NAV |
| California Pizza Kitchen | $275 | $421 | $513 | $491 | 4.9% |
| Footlocker | $238 | $473 | $557 | $695 | 30.7% |
| ABC Stores | NAV | NAV | NAV | NAV | NAV |
| Rip Curl | $273 | $800 | $789 | $1,047 | 25.4% |
| Central Pacific Bank | NAV | NAV | NAV | NAV | NAV |
| (1) | Information obtained from the borrower. |
| (2) | Occupancy cost is based on underwritten base rent and reimbursements divided by most recent reported sales. |
The following table presents certain information relating to the lease rollover schedule at the Center of Waikiki Property:
| Lease Rollover Schedule(1)(2) | |||||||||
| Year | # of Leases Rolling | SF Rolling | UW Rent PSF Rolling | Approx. % of Total SF Rolling | Approx. Cumulative % of SF Rolling | Total UW Rent Rolling | Approx. % of Total Rent Rolling | Approx. Cumulative % of Total Rent Rolling | |
| MTM(3) | 71 | 0 | $23,572.60 | (3) | 0.0% | 0.0% | $1,673,654 | 23.9% | 23.9% |
| 2024 | 1 | 7,241 | $24.17 | 10.3% | 10.3% | $175,000 | 2.5% | 26.4% | |
| 2025 | 0 | 0 | $0.00 | 0.0% | 10.3% | $0 | 0.0% | 26.4% | |
| 2026 | 0 | 0 | $0.00 | 0.0% | 10.3% | $0 | 0.0% | 26.4% | |
| 2027 | 1 | 7,091 | $213.78 | 10.1% | 20.4% | $1,515,931 | 21.6% | 48.0% | |
| 2028 | 2 | 20,469 | $51.71 | 29.1% | 49.5% | $1,058,442 | 15.1% | 63.2% | |
| 2029 | 2 | 3,244 | $175.98 | 4.6% | 54.1% | $570,870 | 8.2% | 71.3% | |
| 2030 | 0 | 0 | $0.00 | 0.0% | 54.1% | $0 | 0.0% | 71.3% | |
| 2031 | 0 | 0 | $0.00 | 0.0% | 54.1% | $0 | 0.0% | 71.3% | |
| 2032 | 1 | 2,461 | $265.70 | 3.50% | 57.6% | $653,892 | 9.3% | 80.7% | |
| 2033 | 1 | 6,445 | $210.20 | 9.2% | 66.8% | $1,354,710 | 19.3% | 100.0% | |
| 2034 | 0 | 0 | $0.00 | 0.0% | 66.8% | $0 | 0.0% | 100.0% | |
| 2035 & Beyond | 0 | 0 | $0.00 | 0.0% | 66.8% | $0 | 0.0% | 100.0% | |
| Vacant | 0 | 23,373 | $0.00 | 33.2% | 100.0% | $0 | 0.0% | 100.0% | |
| Total/Wtd. Avg. | 79 | 70,324 | $149.14 | (4) | 100.0% | $7,002,499 | 100.0% | ||
| (1) | Information is based on the underwritten rent roll. |
| (2) | Certain tenants may have lease termination options that are exercisable prior to the originally stated expiration date of the related lease and are not considered in the rollover schedule. |
| (3) | MTM tenants represent kiosk tenants at the Duke’s Lane Marketplace. There is no SF attributable to these tenants. UW Rent PSF Rolling represents annual rent per kiosk. |
| (4) | Wtd. Avg. UW Rent PSF Rolling excludes vacant space and includes the UW rent from the Duke’s Lane Marketplace tenants. |
The Market. The Center of Waikiki Property is located in Honolulu, Hawaii, at the intersection of Kalakaua Avenue and Dukes Lane, approximately 2.0 miles from Interstate Highway 1. The property is less than approximately a quarter mile from the Waikiki Beach and less than a mile from several hotels including Sheraton Princess Kaiulani, Sheraton Waikiki Beach Resort, The Laylow Autograph Collection and The Royal Hawaiian. The surrounding area is largely characterized by retail and hotel offerings. Major employers in the area include the State of Hawaii, the U.S. federal government, local government entities, The Queen’s Health Systems, Hawaii Pacific Health and Kaiser Foundation Health Plan.
According to the appraisal, the estimated 2022 population within a three- and five-mile radius was 189,832 and 283,431, respectively, and the average household income within the same radii was $107,649 and $113,368, respectively.
According to the appraisal, the Center of Waikiki Property is located within the Waikiki submarket of the Honolulu retail market. As of the third quarter of 2023, the submarket reported total inventory of approximately 2.3 million SF with a 7.43% vacancy rate and average asking rent of $67.44 PSF. The appraisal concluded to market rents for the Center of Waikiki Property ranging from $45.00 PSF to $204.00 PSF.
| This is not a research report and was not prepared by any Underwriter’s research department. Please see additional important information and qualifications at the end of this Term Sheet. | ||
| 85 | ||
| Retail - Anchored | Loan #6 | Cut-off Date Balance: | $36,7500,000 | |
| 2280 Kalakaua Avenue, | Center Of Waikiki | Cut-off Date LTV: | 26.8% | |
| 325 and 333 Seaside Avenue | UW NCF DSCR: | 2.68x | ||
| Honolulu, HI 96815 | UW NOI Debt Yield: | 19.5% |
The following table presents certain information relating to the appraisal’s market rent conclusion for the Center of Waikiki Property:
| Market Rent Summary | ||||
2280 Kalakaua - 1st Floor |
2280 Kalakaua - 2nd Floor | 333 Seaside - Shop | 333 Seaside - Anchor | |
| Market Rent (PSF) | $204.00 | $75.00 | $180.00 | $45.00 |
| Lease Term (Years) | 10 | 10 | 5 | 10 |
Lease Type (Reimbursements) | NNN | NNN | NNN | NNN |
| Tenant Improvements | $25.00 | $25.00 | $25.00 | $35.00 |
| Rent Increase Projection | 3% Annual | 3% Annual | 3% Annual | 10% Midterm |
Source: Appraisal.
The table below presents certain information relating to comparable sales pertaining to the Center of Waikiki Property as identified by the appraisal:
| Comparable Sales | |||||||
Property Name | Location | Rentable Area (SF) | Year Built | Occupancy | Anchors | Sale Date | Sale Price (PSF) |
| 352 Lewers Street | 352 Lewers Street Honolulu, HI 96815 | 2,260 | 1988 | 0% | NAP | May 2021 | $2,096.49 |
| Hokulani Waikiki | 2181 Kalakaua Avenue Honolulu, HI 96815 | 11,417 | 1967 | 100% | NAP | Oct. 2019 | $5,045.11 |
| ABC Marketplace | 1827-1831 Ala Moana Boulevard Honolulu, HI 96815 | 7,243 | 1941 | 100% | NAP | Dec. 2018 | $1,380.64 |
| 280 Beach Walk | 280 Beach Walk Honolulu, HI 96815 | 30,691 | 2009 | 94.5% | NAP | Sep. 2018 | $1,780.65 |
| 413 Seaside Avenue | 413 Seaside Avenue Honolulu, HI 96815 | 5,689 | 1943 | 100% | NAP | Mar. 2023 | $1,098.61 |
Source: Appraisal.
The table below presents certain information relating to comparable rents pertaining to the Center of Waikiki Property as identified by the appraisal:
| Comparable Lease Summary | |||||||
Property Name | Tenant Name | Lease Area (SF) | Lease Date | Lease Term (Years) | Base Rent (PSF) | Reimbursements | |
Waikiki Marketplace 2310 Kuhio Avenue Honolulu, HI | Listing | 1,412 | NAV | Negotiable | $144 | NNN | |
The Laylow Hotel Ground Floor Retail 2299 Kuhio Avenue Honolulu, HI | Undisclosed | 4,371 | Nov-22 | 5 | $156 | NNN | |
The Royal Hawaiian Hotel Ground Floor Retail 2259 Kalakaua Avenue Honolulu, HI | Listing Listing | 635 1,041 | NAV NAV | Negotiable | $72 $180 | NNN | |
Royal Hawaiian Shopping Center 2201 Kalakaua Avenue Honolulu, HI | Crystal Jeans Royal Waikiki L&L Kate Spade | 496 599 1,014 | Dec-23 Apr-23 Feb-23 | 4.9 4.92 10.1 | $150 $168 $204 | NNN | |
Anaha 1108 Auahi Street Honolulu, HI | Istanbul Restaurant We Are Iconic Island Brew Coffeehouse Han No Daidokoro | 2,162 1,246 1,168 2,217 | Jun-20 Apr-20 Aug-19 Feb-19 | 9.66 7.83 11.45 10.97 | $85 $86 $72 $89 | NNN/Fixed CAM | |
Source: Appraisal.
| This is not a research report and was not prepared by any Underwriter’s research department. Please see additional important information and qualifications at the end of this Term Sheet. | ||
| 86 | ||
| Retail - Anchored | Loan #6 | Cut-off Date Balance: | $36,7500,000 | |
| 2280 Kalakaua Avenue, | Center Of Waikiki | Cut-off Date LTV: | 26.8% | |
| 325 and 333 Seaside Avenue | UW NCF DSCR: | 2.68x | ||
| Honolulu, HI 96815 | UW NOI Debt Yield: | 19.5% |
Operating History and Underwritten Net Cash Flow. The following table presents certain information relating to the historical operating performance and Underwritten Net Cash Flow at the Center of Waikiki Property:
| Cash Flow Analysis | |||||||||||
| 2020 | 2021 | 2022 | TTM 9/30/2023 | UW | UW PSF | ||||||
| Base Rent | $7,144,392 | $5,830,606 | $5,039,279 | $5,615,003 | $7,002,499 | (1) | $99.57 | ||||
| Grossed Up Vacant Space | $0 | $0 | $0 | $0 | $1,798,611 | $25.58 | |||||
| Parking/Garage/Other | $798,289 | (2) | $1,029,655 | (2) | $1,665,250 | (2) | $1,677,762 | (2) | $1,677,762 | (2) | $23.86 |
| Gross Potential Rent | $7,942,681 | $6,860,261 | $6,704,529 | $7,292,765 | $10,478,872 | $149.01 | |||||
| Other Income | $422,437 | $209,226 | $235,118 | $236,962 | $47,069 | $0.67 | |||||
| Percentage Rent | $0 | $231,324 | $262,862 | $232,967 | $234,468 | $3.33 | |||||
| Total Recoveries | $1,724,926 |
| $1,469,249 |
| $1,524,639 |
| $1,522,706 |
| $1,676,665 |
| $23.84 |
| Net Rental Income | $10,090,044 | $8,770,060 | $8,727,148 | $9,285,400 | $12,437,074 | $176.85 | |||||
| (Vacancy & Credit Loss) | $0 |
| $0 |
| $0 |
| $0 |
| ($1,798,611) | (3) | ($25.58) |
| Effective Gross Income | $10,090,044 | $8,770,060 | $8,727,148 | $9,285,400 | $10,638,463 | $151.28 | |||||
| Real Estate Taxes | $1,166,450 | $1,215,235 | $1,319,143 | $1,350,032 | $1,384,501 | $19.69 | |||||
| Insurance | $184,122 | $221,263 | $226,807 | $204,255 | $222,691 | $3.17 | |||||
| Management Fee | $178,384 | $152,350 | $262,249 | $277,155 | $391,796 | $5.57 | |||||
| Other Operating Expenses | $1,203,515 |
| $1,121,160 |
| $1,464,597 |
| $1,487,747 |
| $1,487,855 |
| $21.16 |
| Total Operating Expenses | $2,732,471 | $2,710,008 | $3,272,795 | $3,319,189 | $3,486,843 | $49.58 | |||||
| Net Operating Income | $7,357,573 | (4) | $6,060,052 | (4) | $5,454,353 | (4) | $5,966,211 | (4) | $7,151,620 | (4) | $101.70 |
| Replacement Reserves | $0 | $0 | $0 | $0 | $31,199 | $0.44 | |||||
| TI/LC | $0 |
| $0 |
| $0 |
| $0 |
| $158,229 |
| $2.25 |
| Net Cash Flow | $7,357,573 | $6,060,052 | $5,454,353 | $5,966,211 | $6,962,193 | $99.00 | |||||
| Occupancy % | 77.9% | 74.9% | 64.3% | 70.6% | 79.6% | (5) | |||||
| NOI DSCR | 2.83x | 2.33x | 2.10x | 2.30x | 2.75x | ||||||
| NCF DSCR | 2.83x | 2.33x | 2.10x | 2.30x | 2.68x | ||||||
| NOI Debt Yield | 20.0% | 16.5% | 14.8% | 16.2% | 19.5% | ||||||
| NCF Debt Yield | 20.0% | 16.5% | 14.8% | 16.2% | 18.9% | ||||||
| (1) | Base rent includes contracts in place including rent steps through November 2024 totaling $130,530. |
| (2) | Parking/Garage/Other income includes monthly, transient, validations, and overflow parking income from the parking garage, late fees, and other miscellaneous income. |
| (3) | The underwritten economic vacancy is 20.4%. The Center of Waikiki Property was 66.8% physically occupied as of December 1, 2023. |
| (4) | The decreases in Net Operating Income from 2020 to 2021 and 2022 were primarily driven by the impact from COVID 19. The increase in NOI between TTM 9/30/2023 to UW is primarily due to 12 new and renewal leases (53.2% NRA and 37.2% of underwritten base rent) with lease commencement dates between November 2022 and October 2024 as well as underwritten rent steps through November 2024 totaling $130,530. |
| (5) | Occupancy reflects economic occupancy. |
Escrows and Reserves.
Real Estate Taxes – The loan documents do not require an ongoing monthly deposit into a real estate tax reserve; provided (i) no event of default is continuing, (ii) no Cash Trap Event Period (as defined below) is continuing, and (iii) borrower provides proof of payment of the real estate taxes. If such conditions are not satisfied, the loan documents require an ongoing monthly deposit into a real estate tax reserve equal to 1/12th of the real estate taxes that the lender reasonably estimates will be payable during the following 12 months.
Insurance – The loan documents do not require an ongoing monthly deposit into an insurance reserve; provided (i) no event of default is continuing, (ii) the borrower maintains insurance coverage for the Center of Waikiki Property as part of blanket or umbrella coverage reasonably approved by the lender, and (iii) the borrower provides the lender with evidence of the renewals of the insurance policies and paid receipts for the payment of the insurance premiums no later than seven business days prior to the expiration dates of the policies. If such conditions are not satisfied, the loan documents require an ongoing monthly deposit into an insurance reserve equal to 1/12th of the insurance premiums that the lender reasonably estimates will be payable during the following 12 months.
Replacement Reserve – The loan documents require ongoing monthly replacement reserve deposits of $2,600 ($0.20/sf per year for the retail buildings and $50/space per year for the parking garage) for replacement reserves.
TI/LC Reserve – The loan documents require an ongoing monthly deposit of $13,186 for leasing reserves. The leasing reserve may be reduced in the event that the borrower enters into a new lease or renews the existing lease beyond December 11, 2029, for the following spaces at the Center of Waikiki Property: the Ross Dress for Less space (19,605 SF), which will reduce the monthly deposit by $3,676, the Footlocker space (7,091 SF), which will reduce the monthly deposit by $1,330, the California Pizza Kitchen Space (7,241 SF), which will reduce the monthly deposit by $1,208, and the vacant space adjacent to the California Pizza Kitchen Space (which lease may be for the vacant space only or include both the vacant space and the California Pizza
| This is not a research report and was not prepared by any Underwriter’s research department. Please see additional important information and qualifications at the end of this Term Sheet. | ||
| 87 | ||
| Retail - Anchored | Loan #6 | Cut-off Date Balance: | $36,7500,000 | |
| 2280 Kalakaua Avenue, | Center Of Waikiki | Cut-off Date LTV: | 26.8% | |
| 325 and 333 Seaside Avenue | UW NCF DSCR: | 2.68x | ||
| Honolulu, HI 96815 | UW NOI Debt Yield: | 19.5% |
Kitchen Space), which will reduce the monthly deposit by $1,065. If all of the above were satisfied, the leasing reserve monthly deposit would be equal to $5,907.
Outstanding TI/LC– The loan documents require an upfront deposit of $50,000 for outstanding tenant improvements related to Rip Curl.
Gap Rent Reserve– The loan documents require an upfront deposit of $209,328 gap rent for the tenant not yet in occupancy related to Slice of Waikiki. The tenant represents 10 months of underwritten rent and CAM based on the estimated commencement date of October 1, 2024.
Lockbox and Cash Management. The Center of Waikiki Mortgage Loan is structured with a springing lockbox and springing cash management. Within 30 days of written notice from the lender that a Cash Trap Event Period has commenced, the borrower is required to open a lockbox account controlled by the lender and to cause all rents to be deposited directly into the account. If no Cash Trap Event Period exists, all funds on deposit in the lockbox account will be transferred to an account designated by the borrower. During the continuance of a Cash Trap Event Period, funds in the deposit account are required to be transferred to a lender controlled cash management account to be applied according to the cash management agreement, and excess cash flow is required to be held by the lender as additional collateral.
A “Cash Trap Event Period” will commence upon the earlier of the following:
| (i) | the occurrence of an event of default; or |
| (ii) | the net operating income debt service coverage ratio (based on a hypothetical 30-year amortization schedule) (the “NOI DSCR”) being less than 1.35x (tested quarterly). |
A Cash Trap Event Period will end upon the occurrence of the following:
| ● | the cure (if applicable) of such event of default; or |
| ● | upon the date that the NOI DSCR is equal to or greater than 1.35x for one calendar quarter. |
Subordinate Debt. None.
Mezzanine Loan and Preferred Equity. None.
Release of Property. None.
Letter of Credit. None.
Right of First Offer/Right of First Refusal. None.
Ground Lease. None.
Terrorism Insurance. The loan documents require that the “all risk” insurance policy required to be maintained by the borrower provides coverage for terrorism in an amount equal to the full replacement cost of the Center of Waikiki Property, as well as business interruption insurance covering no less than the 18-month period following the occurrence of a casualty event, together with a 6-month extended period of indemnity. The loan documents provide that if TRIPRA or a successor statute is not in effect, the borrower will not be required to spend on terrorism insurance more than twice the cost of the then-current all-risk coverage under a stand-alone all-risk policy (including property/casualty coverage and loss of rents/ business interruption coverage).
| This is not a research report and was not prepared by any Underwriter’s research department. Please see additional important information and qualifications at the end of this Term Sheet. | ||
| 88 | ||
| Retail – Anchored | Loan #7 | Cut-off Date Balance: | $31,625,000 | |
| 6176 Retail Road | Timber Creek Crossing | Cut-off Date LTV: | 61.1% | |
| Dallas, TX 75231 | UW NCF DSCR: | 1.61x | ||
| UW NOI Debt Yield: | 10.2% |

| This is not a research report and was not prepared by any Underwriter’s research department. Please see additional important information and qualifications at the end of this Term Sheet. | ||
| 89 | ||
| Retail – Anchored | Loan #7 | Cut-off Date Balance: | $31,625,000 | |
| 6176 Retail Road | Timber Creek Crossing | Cut-off Date LTV: | 61.1% | |
| Dallas, TX 75231 | UW NCF DSCR: | 1.61x | ||
| UW NOI Debt Yield: | 10.2% |
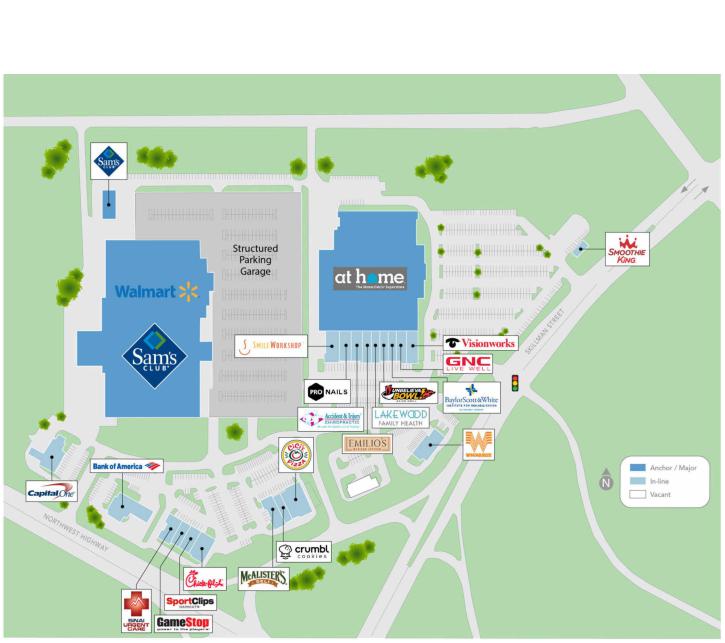
| This is not a research report and was not prepared by any Underwriter’s research department. Please see additional important information and qualifications at the end of this Term Sheet. | ||
| 90 | ||
| Retail – Anchored | Loan #7 | Cut-off Date Balance: | $31,625,000 | |
| 6176 Retail Road | Timber Creek Crossing | Cut-off Date LTV: | 61.1% | |
| Dallas, TX 75231 | UW NCF DSCR: | 1.61x | ||
| UW NOI Debt Yield: | 10.2% |
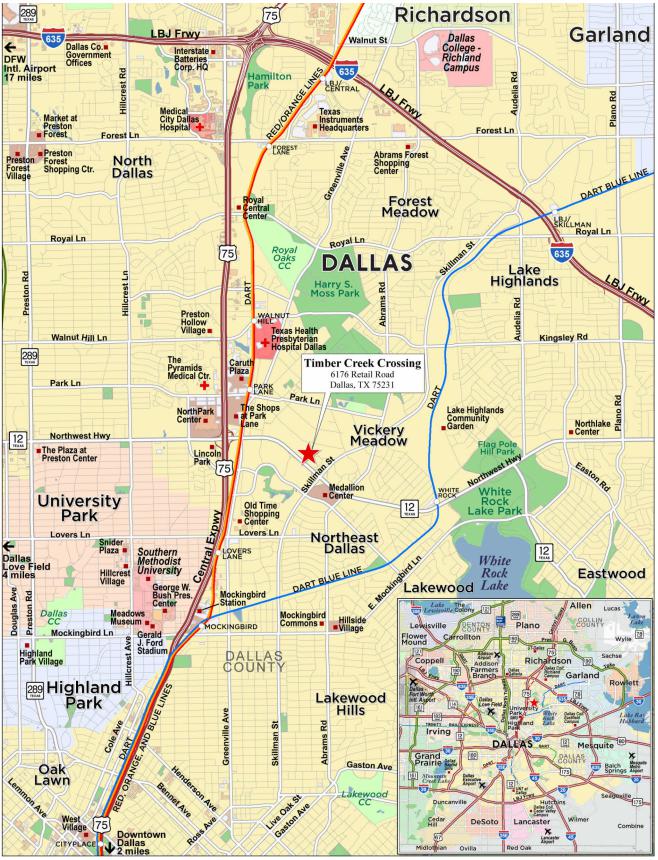
| This is not a research report and was not prepared by any Underwriter’s research department. Please see additional important information and qualifications at the end of this Term Sheet. | ||
| 91 | ||
| Mortgage Loan No. 7 – Timber Creek Crossing |
| Mortgage Loan Information | Property Information | ||||||
| Mortgage Loan Seller: | WFB | Single Asset/Portfolio: | Single Asset | ||||
| Credit Assessment (Moody’s/Fitch/KBRA): | NR/NR/NR | Location: | Dallas, TX 75231 | ||||
| Original Balance(1): | $31,625,000 | General Property Type: | Retail | ||||
| Cut-off Date Balance(1): | $31,625,000 | Detailed Property Type: | Anchored | ||||
| % of Initial Pool Balance: | 6.1% | Title Vesting: | Fee | ||||
| Loan Purpose: | Refinance | Year Built/Renovated: | 2011/NAP | ||||
| Borrower Sponsor: | Goldman Sachs Asset | Size: | 474,026 SF | ||||
| Management, L.P. | Cut-off Date Balance PSF(1): | $121 | |||||
| Guarantor(2): | NAP | Maturity Date Balance PSF(1): | $121 | ||||
| Mortgage Rate: | 6.1750% | Property Manager: | Connected Management Services LLC | ||||
| Note Date: | 1/19/2024 | ||||||
| First Payment Date: | 3/11/2024 | ||||||
| Maturity Date: | 2/11/2029 | ||||||
| Original Term to Maturity: | 60 months | Underwriting and Financial Information | |||||
| Original Amortization Term: | 0 months | UW NOI: | $5,860,282 | ||||
| IO Period: | 60 months | UW NOI Debt Yield(1): | 10.2% | ||||
| Seasoning: | 0 months | UW NOI Debt Yield at Maturity(1): | 10.2% | ||||
| Prepayment Provisions(3): | L(24),DorYM3(29),O(7) | UW NCF DSCR: | 1.61x | ||||
| Lockbox/Cash Mgmt Status: | Hard/Springing | Most Recent NOI: | $5,934,657 (11/30/2023 TTM) | ||||
| Additional Debt Type(1)(4): | Pari Passu | 2nd Most Recent NOI(6): | $5,579,301 (12/31/2022) | ||||
| Additional Debt Balance(1)(4): | $25,875,000 | 3rd Most Recent NOI(6): | $4,672,618 (12/31/2021) | ||||
| Future Debt Permitted (Type): | No (NAP) | Most Recent Occupancy: | 99.5% (11/1/2023) | ||||
| Reserves(5) | 2nd Most Recent Occupancy: | 100.0% (12/31/2022) | |||||
| Type | Initial | Monthly | Cap | 3rd Most Recent Occupancy: | 77.3% (12/31/2021) | ||
| RE Taxes: | $0 | Springing | NAP | Appraised Value (as of): | $94,100,000 (8/25/2023) | ||
| Insurance: | $0 | Springing | NAP | Appraised Value PSF(1): | $199 | ||
| Replacement Reserves: | $0 | Springing | NAP | Cut-off Date LTV Ratio(1): | 61.1% | ||
| TI/LC Reserve: | $700,000 | Springing | NAP | Maturity Date LTV Ratio(1): | 61.1% | ||
| Sources and Uses | ||||||
| Sources | Proceeds | % of Total | Uses | Proceeds | % of Total | |
| Whole Loan Amount: | $57,500,000 | 97.4% | Loan Payoff: | $53,313,100 | 90.3% | |
| Sponsor Equity: | $1,554,484 | 2.6% | Closing Costs: | $5,041,384 | 8.5% | |
| Upfront Reserves: | $700,000 | 1.2% | ||||
| Total Sources: | $59,054,484 | 100.0% | Total Uses: | $59,054,484 | 100.0% | |
| (1) | The Timber Creek Crossing Mortgage Loan (as defined below) is part of the Timber Creek Crossing Whole Loan (as defined below) with an original aggregate principal balance of $57,500,000. The Cut-off Date Balance PSF, Maturity Date Balance PSF, UW NOI Debt Yield, UW NOI Debt Yield at Maturity, UW NCF DSCR, Cut-off Date LTV Ratio and Maturity Date LTV Ratio numbers presented above are based on the Timber Creek Crossing Whole Loan. |
| (2) | There is no non-recourse carveout guarantor or separate environmental indemnitor with respect to the Timber Creek Crossing Whole Loan. |
| (3) | Prepayment of the Timber Creek Crossing Whole Loan is permitted at any time after the earlier to occur of (a) the end of the two-year period commencing on the closing date of the securitization of the last promissory note representing a portion of the Timber Creek Crossing Whole Loan to be securitized and (b) January 19, 2027. The assumed prepayment lockout period of 24 payments is based on the closing date of this transaction in February 2024. |
| (4) | See “The Mortgage Loan” below for further discussion of additional mortgage debt. |
| (5) | See “Escrows and Reserves” below. |
| (6) | The increase in 3rd Most Recent NOI to 2nd Most Recent NOI was primarily driven by the increase in occupancy from 77.3% to 100.0% due to At Home’s (21.9% of NRA and 21.7% of UW base rent) lease commencing in February 2022. |
The Mortgage Loan. The seventh largest mortgage loan (the “Timber Creek Crossing Mortgage Loan”) is part of a whole loan (the “Timber Creek Crossing Whole Loan”) evidenced by two pari passu promissory notes in the aggregate original principal amount of $57,500,000 and secured by a first priority fee mortgage encumbering a grocery anchored retail center in Dallas, TX (the “Timber Creek Crossing Property”). The Timber Creek Crossing Whole Loan was co-originated by Wells Fargo Bank, National Association (“WFB”) and Citi Real Estate Funding Inc. (“CREFI”). The controlling Note A-1, originated by WFB, in the original principal amount of $31,625,000, represents the Timber Creek Crossing Mortgage Loan and will be contributed to the BANK5 2024-5YR5 securitization trust. The non-controlling Note A-2, originated by CREFI, in the original principal amount of $25,875,000, is expected to be contributed to one or more future securitizations. The Timber Creek Crossing Whole Loan will be serviced pursuant to the pooling and servicing agreement for the BANK5 2024-5YR5 securitization trust. See “Description of the Mortgage Pool—The Whole Loans—The Serviced Pari Passu Whole Loans” and “Pooling and Servicing Agreement” in the prospectus.
| This is not a research report and was not prepared by any Underwriter’s research department. Please see additional important information and qualifications at the end of this Term Sheet. | ||
| 92 | ||
| Retail – Anchored | Loan #7 | Cut-off Date Balance: | $31,625,000 | |
| 6176 Retail Road | Timber Creek Crossing | Cut-off Date LTV: | 61.1% | |
| Dallas, TX 75231 | UW NCF DSCR: | 1.61x | ||
| UW NOI Debt Yield: | 10.2% |
| Timber Creek Crossing Whole Loan Summary | ||||
| Note | Original Balance | Cut-off Date Balance | Note Holder | Controlling Note |
| A-1 | $31,625,000 | $31,625,000 | BANK5 2024-5YR5 | Yes |
| A-2 | $25,875,000 | $25,875,000 | CREFI | No |
| Total | $57,500,000 | $57,500,000 | ||
The Borrower and the Borrower Sponsor. The borrower is Timber Creek Owner LP, a Delaware limited partnership and single purpose entity with two independent directors. There is no non-recourse carveout guarantor or separate environmental indemnitor with respect to the Timber Creek Crossing Whole Loan. The borrower is owned and controlled by Goldman Sachs Asset Management, L.P.
Goldman Sachs Asset Management (“GSAM”) is the primary investing area within Goldman Sachs (A+/A2/A+ by Fitch/Moody’s/S&P) and delivers investment and advisory services for global institutions, financial advisors and individuals. As of December 31, 2022, GSAM managed more than $2 trillion in assets under supervision worldwide.
The Property. The Timber Creek Crossing Property is an anchored retail center totaling 474,026 SF, located in Dallas, TX. Built in 2011, the property is situated on a 43.9-acre site and consists of 10 multi-tenant retail buildings. The Timber Creek Crossing Property is anchored by a dual-branded Walmart / Sam’s Club. Four tenants (Walmart / Sam’s Club, Bank of America, Capital One and Whataburger) totaling 325,822 SF (68.7% of NRA; 55.1% of underwritten base rent) own their improvements and ground lease the underlying land from the borrowers. Additional tenants include At Home, Chick-Fil-A and Great American Hero. The property contains 2,498 surface parking spaces, resulting in a parking ratio of 5.27 spaces per 1,000 SF of net rentable area. Investment grade tenancy comprises 68.1% of net rentable area and 53.1% of underwritten base rent. As of November 1, 2023, the Timber Creek Crossing Property was 99.5% occupied by 22 tenants and has averaged 95.4% occupancy since 2011.
Major Tenants.
Walmart / Sam’s Club (AA/Aa/AA by F/M/S&P; 314,413 SF; 66.3% of NRA; 42.7% of underwritten base rent). Walmart is an American multinational retail corporation operating a chain of supercenters, discount department stores and grocery stores. Founded in 1962 and headquartered in Bentonville, Arkansas, Walmart operates approximately 10,500 stores and clubs in 19 countries and eCommerce websites. Walmart is the parent company of Sam’s Club, which was founded by Sam Walton in 1983 and is the membership warehouse division of the company. The tenant has been located at the property since June 2010. The tenant owns its improvements and leases the underlying land from the borrower on a ground lease expiring on May 31, 2030, with 15, five-year renewal options, and no termination options.
At Home (103,640 SF; 21.9% of NRA; 21.7% of underwritten base rent). At Home is an American chain of home furnishing stores. Founded in 1979 and headquartered in Dallas, Texas, At Home operates approximately 262 stores across 40 states. At Home has been a tenant since February 2022 and has a lease expiration of February 28, 2037, with two, five-year renewal options, and no termination options.
Bank of America (AA-/A1/A- by F/M/S&P; 4,330 SF; 0.9% of NRA; 6.1% of underwritten base rent). Bank Of America is an American multinational investment bank and financial services holding company headquartered in Charlotte, North Carolina. Bank of America has been a tenant since April 2011 and has a lease expiration of March 31, 2031, with six, five-year renewal options, and no termination options.
The following table presents certain information relating to the tenancy at the Timber Creek Crossing Property:
| Tenant Summary | |||||||||||
| Tenant Name | Credit Rating (Fitch/Moody's/ S&P)(1) | Tenant SF | Approx. % of SF | Annual UW Rent(2) | % of Total Annual UW Rent(3) | Annual UW Rent PSF(2) | Termination Option (Y/N) | Lease Expiration | Renewal Options | ||
| Major Tenants | |||||||||||
| Walmart / Sam's Club | AA/Aa2/AA | 314,413 | (4) | 66.3% | $2,518,783 | 42.7% | $8.01 | N | 5/31/2030 | 15 x 5 years | (5) |
| At Home | NR/NR/NR | 103,640 | 21.9% | $1,277,843 | 21.7% | $12.33 | N | 2/28/2037 | 2 x 5 years | ||
| Bank of America | AA-/A1/A- | 4,330 | (4) | 0.9% | $360,988 | 6.1% | $83.37 | N | 3/31/2031 | 6 x 5 years | |
| Lakewood Medical Center | NR/NR/NR | 4,149 | 0.9% | $85,760 | 1.5% | $20.67 | N | 1/31/2024 | 1 x 5 years | ||
| Chick-fil-A | NR/NR/NR | 4,040 | 0.9% | $173,518 | 2.9% | $42.95 | N | 2/28/2027 | 4 x 5 years | ||
| Total/Wtd. Avg. | 430,572 | 90.8% | $4,416,891 | 74.9% | $10.26 | ||||||
| Non-Major Tenants | 41,081 | 8.7% | $1,478,317 | 25.1% | $35.99 | ||||||
| Occupied Collateral Total | 471,653 | 99.5% | $5,895,208 | 100.0% | $12.50 | ||||||
| Vacant Space | 2,373 | 0.5% | |||||||||
| Total | 474,026 | 100.0% | |||||||||
| (1) | Certain ratings are those of the parent company whether or not the parent guarantees the lease. |
| (2) | The Annual UW Rent and Annual UW Rent PSF shown above include straight-line rent averaging for certain investment grade tenants (Walmart / Sam’s Club and Bank of America) through lease maturity totaling $101,432 and contractual rent steps through June 2024 totaling $6,827. See “Underwritten Net Cash Flow” below. |
| (3) | % of Total Annual UW Rent does not include vacant space. |
| (4) | Tenant owns its improvements and ground leases the underlying land from the borrower. |
| (5) | As provided in its lease, the tenant has created a leasehold condominium comprised of three units: (i) the Walmart store and its adjacent parking area, (ii) the Sam’s Club store and its adjacent parking area, and (iii) a fuel station. If the tenant exercises its right to renew its lease term, the tenant may do so either as to the entirety of its leased premises, the Walmart store only (which may, but does not have to, include the fuel station) or the Sam’s Club store (which must include the fuel station). |
| This is not a research report and was not prepared by any Underwriter’s research department. Please see additional important information and qualifications at the end of this Term Sheet. | ||
| 93 | ||
| Retail – Anchored | Loan #7 | Cut-off Date Balance: | $31,625,000 | |
| 6176 Retail Road | Timber Creek Crossing | Cut-off Date LTV: | 61.1% | |
| Dallas, TX 75231 | UW NCF DSCR: | 1.61x | ||
| UW NOI Debt Yield: | 10.2% |
The following table presents certain information relating to the lease rollover schedule at the Timber Creek Crossing Property:
| Lease Rollover Schedule(1)(2) | |||||||||
| Year | # of Leases Rolling | SF Rolling | UW Rent PSF Rolling | Approx. % of Total SF Rolling | Approx. Cumulative % of SF Rolling | Total UW Rent Rolling | Approx. % of Total Rent Rolling | Approx. Cumulative % of Total Rent Rolling | |
| MTM | 0 | 0 | $0.00 | 0.0% | 0.0% | $0 | 0.0% | 0.0% | |
| 2024 | 3 | 6,113 | $28.21 | 1.3% | 1.3% | $172,437 | 2.9% | 2.9% | |
| 2025 | 1 | 1,835 | $27.01 | 0.4% | 1.7% | $49,567 | 0.8% | 3.8% | |
| 2026 | 4 | 10,721 | $33.78 | 2.3% | 3.9% | $362,152 | 6.1% | 9.9% | |
| 2027 | 5 | 13,222 | $35.86 | 2.8% | 6.7% | $474,184 | 8.0% | 18.0% | |
| 2028 | 2 | 6,518 | $47.69 | 1.4% | 8.1% | $310,835 | 5.3% | 23.2% | |
| 2029 | 1 | 1,050 | $34.10 | 0.2% | 8.3% | $35,805 | 0.6% | 23.8% | |
| 2030 | 1 | 314,413 | $8.01 | 66.3% | 74.7% | $2,518,783 | 42.7% | 66.6% | |
| 2031 | 1 | 4,330 | $83.37 | 0.9% | 75.6% | $360,988 | 6.1% | 72.7% | |
| 2032 | 3 | 9,811 | $33.90 | 2.1% | 77.6% | $332,615 | 5.6% | 78.3% | |
| 2033 | 0 | 0 | $0.00 | 0.0% | 77.6% | $0 | 0.0% | 78.3% | |
| 2034 | 0 | 0 | $0.00 | 0.0% | 77.6% | $0 | 0.0% | 78.3% | |
| 2035 & Beyond | 1 | 103,640 | $12.33 | 21.9% | 99.5% | $1,277,843 | 21.7% | 100.0% | |
| Vacant | 0 | 2,373 | $0.00 | 0.5% | 100.0% | $0 | 0.0% | 100.0% | |
| Total/Wtd. Avg. | 22 | 474,026 | $12.50 | (3) | 100.0% | 0.0% | $5,895,208 | 100.0% | |
| (1) | Information is based on the underwritten rent roll. |
| (2) | Certain tenants may have lease termination options that are exercisable prior to the originally stated expiration date of the related lease and are not considered in the lease rollover schedule. |
| (3) | Wtd. Avg. UW Rent PSF Rolling excludes vacant space. |
The Market. The Timber Creek Crossing Property is located in Dallas, TX, approximately six miles north of downtown Dallas. The property is inside the loop, within Interstate 635, at the intersection of Northwest Highway and Skillman. The property is proximate to some of Dallas’s most densely populated neighborhoods, including Highland Park, The Park Cities, University Park, Preston Hollow, and Lakewood. Major employers in the area include Walmart Inc., American Airlines, Baylor Scott & White Health, Lockheed Martin, UT Southwestern Medical Center, AT&T, Medical City Healthcare, Bank of America Corp., Texas Instruments Inc and JPMorgan Chase & Co. According to the appraisal, the estimated 2023 population within a three- and five-mile radius was 161,735 and 426,744, respectively, and the average household income within the same radii was $152,659 and $136,486, respectively.
According to a third party market research report, the Timber Creek Crossing Property is located within the Upper Greenville submarket of the Dallas-Fort Worth retail market. As of January 2024, the submarket reported total inventory of approximately 5.6 million SF with a 2.3% vacancy rate and average asking rent of $26.18 PSF. The appraisal concluded to market rents for the Timber Creek Crossing Property ranging from $8.00 PSF for the Anchor space to $75.75 for Smoothie King space (see table below).
The following table presents certain information relating to the appraisal’s market rent conclusion for the Timber Creek Crossing Property:
| Market Rent Summary | ||||||
| Anchor Space | Junior Anchor Space | In-Line Space | Branch Bank Space | Fast Food Space | Smoothie King Space | |
| Market Rent (PSF) | $8.00 | $12.50 | $35.00 | $65.00 | $45.00 | $75.75 |
| Lease Term (Years) | 20 | 15 | 5 | 20 | 10 | 5 |
Lease Type (Reimbursements) | NNN | NNN | NNN | NNN | NNN | NNN |
| Tenant Improvements | $2.00 | $5.00 | $25.00 | $40.00 | $40.00 | $40.00 |
| Rent Increase Projection | 2.5% / Yr | 2.5% / Yr | 2.5% / Yr | 2.5% / Yr | 2.5% / Yr | 2.5% / Yr |
Source: Appraisal.
| This is not a research report and was not prepared by any Underwriter’s research department. Please see additional important information and qualifications at the end of this Term Sheet. | ||
| 94 | ||
| Retail – Anchored | Loan #7 | Cut-off Date Balance: | $31,625,000 | |
| 6176 Retail Road | Timber Creek Crossing | Cut-off Date LTV: | 61.1% | |
| Dallas, TX 75231 | UW NCF DSCR: | 1.61x | ||
| UW NOI Debt Yield: | 10.2% |
The table below presents certain information relating to comparable sales pertaining to the Timber Creek Crossing Property identified by the appraisal:
| Comparable Sales | |||||||
Property Name | Location | Rentable Area (SF) | Year Built/ Renovated | Occupancy | Anchors | Sale Date | Sale Price (PSF) |
The Shops at Chisholm Trail Ranch | 5649 Sierra Springs Lane Fort Worth, TX | 213,416 | 2020 / NAP | 97.0% | Tuesday Morning, Five Below, Famous Footwear, Pet Supplies Plus, James Avery and Crumbl Cookies | 11/2022 | $281.14 |
| Park West Plaza | 2220, 2240, 2300, 2304 Coit Road and 3911, 3921 West Park Boulevard Plano, TX | 191,103 | 1983 / NAP | 98.0% | Elliot’s Hardware | 9/2022 | $170.53 |
| Northcrest Village | 3044 Old Denton Road Carrollton, TX | 136,962 | 1986 / NAP | 85.0% | Aldi and Ace Mart | 4/2022 | $191.60 |
| Shops at Arbor Walk | 10515 North Mopac Expressway Austin, TX | 309,010 | 2006 / NAP | 99.0% | JoAnns, PGA Superstore, Natural Grocers, DSW and Marshalls | 4/2023 | $163.43 |
Northwest Crossing Centre | 13238 Northwest Freeway Houston, TX | 161,292 | 1993 / 2010 | 79.0% | Planet Fitness, Dollar Tree, Rainbow and Dress Barn | 1/2023 | $224.02 |
| Market Square at Eldridge | 2660 Eldridge Parkway South Houston, TX | 256,956 | 2008 / NAP | 98.0% | Home Goods, TJ Maxx, Old Navy, Michaels and Burlington | 7/2022 | $227.67 |
| Glade Parks Town Center | 2701 Rio Grande Boulevard Euless, TX | 559,457 | 2014 / 2018 | 93.0% | Old Navy, DSW, Carters, DXL, Ulta, Bath & Body Works and Cavender's | 7/2022 | $200.19 |
Source: Appraisal.
| This is not a research report and was not prepared by any Underwriter’s research department. Please see additional important information and qualifications at the end of this Term Sheet. | ||
| 95 | ||
| Retail – Anchored | Loan #7 | Cut-off Date Balance: | $31,625,000 | |
| 6176 Retail Road | Timber Creek Crossing | Cut-off Date LTV: | 61.1% | |
| Dallas, TX 75231 | UW NCF DSCR: | 1.61x | ||
| UW NOI Debt Yield: | 10.2% |
Operating History and Underwritten Net Cash Flow. The following table presents certain information relating to the historical operating performance and Underwritten Net Cash Flow at the Timber Creek Crossing Property:
| Cash Flow Analysis | ||||||||||
| 2020 | 2021 | 2022 | TTM 11/30/2023 | UW | UW PSF | |||||
| Base Rent | $5,159,946 | $4,405,400 | $5,545,448 | $5,840,293 | $5,786,949 | $12.21 | ||||
| Rent Steps | $0 | $0 | $0 | $0 | $6,827 | (1) | $0.01 | |||
| Rent Average Benefit | $0 | $0 | $0 | $0 | $101,432 | (2) | $0.21 | |||
| Grossed Up Vacant Space | $0 | $0 |
| $0 |
| $0 |
| $106,785 |
| $0.23 |
| Gross Potential Rent | $5,159,946 | $4,405,400 | $5,545,448 | $5,840,293 | 6,001,993 | $12.66 | ||||
| Other Income | $26,170 | $917,181 | $39,858 | $46,346 | $46,346 | $0.10 | ||||
| Total Recoveries | $934,550 | $646,750 |
| $1,034,747 |
| $944,224 |
| $1,218,803 |
| $2.57 |
| Net Rental Income | $6,120,666 | $5,969,331 | $6,620,053 | $6,830,863 | $7,267,142 | $15.33 | ||||
| (Vacancy & Credit Loss) | $0 | $0 |
| $0 |
| $0 |
| ($194,770) | (3) | ($0.41) |
| Effective Gross Income | $6,120,666 | $5,969,331 | $6,620,053 | $6,830,863 | $7,072,372 | $14.92 | ||||
| Real Estate Taxes | $463,555 | $654,221 | $443,422 | $237,766 | $543,068 | $1.15 | ||||
| Insurance | $71,487 | $66,523 | $44,828 | $30,170 | $35,282 | $0.07 | ||||
| Management Fee | $121,029 | $100,524 | $92,578 | $135,977 | $141,447 | $0.30 | ||||
| Other Operating Expenses | $423,865 | $475,445 |
| $459,924 |
| $492,293 |
| $492,293 |
| $1.04 |
| Total Operating Expenses | $1,079,936 | $1,296,713 | $1,040,752 | $896,206 | $1,212,090 | $2.56 | ||||
| Net Operating Income | $5,040,730 | $4,672,618 | (4) | $5,579,301 | (4) | $5,934,657 | $5,860,282 | $12.36 | ||
| Replacement Reserves | $0 | $0 | $0 | $0 | $71,104 | $0.15 | ||||
| TI/LC | $0 | $0 |
| $0 |
| $0 |
| $0 | (5) | $0.00 |
| Net Cash Flow | $5,040,730 | $4,672,618 | $5,579,301 | $5,934,657 | $5,789,178 | $12.21 | ||||
| Occupancy % | 78.1% | 77.3% | (4) | 100.0% | (4) | 99.5% | (3) | 96.8% | (3) | |
| NOI DSCR | 1.40x | 1.30x | 1.55x | 1.65x | 1.63x | |||||
| NCF DSCR | 1.40x | 1.30x | 1.55x | 1.65x | 1.61x | |||||
| NOI Debt Yield | 8.8% | 8.1% | 9.7% | 10.3% | 10.2% | |||||
| NCF Debt Yield | 8.8% | 8.1% | 9.7% | 10.3% | 10.1% | |||||
| (1) | Represents contractual rent steps through June 2024. |
| (2) | Represents straight-line rent averaging for certain investment grade tenants (Walmart / Sam’s Club and Bank of America) through lease maturity. |
| (3) | The underwritten economic vacancy is 3.2%. The Timber Creek Crossing Property was 99.5% occupied as of November 1, 2023. |
| (4) | The increase in Net Operating Income from 2021 to 2022 was primarily driven by the increase in occupancy from 77.3% to 100.0% due to At Home’s (21.9% of NRA and 21.7% of UW base rent) lease commencing in February 2022. |
| (5) | TI/LC’s were not underwritten due to a $700,000 upfront TI/LC reserve. |
Escrows and Reserves.
Real Estate Taxes – The loan documents do not require ongoing monthly tax reserves; provided no Cash Sweep Period (as defined below) is continuing. If such condition is not satisfied, the loan documents require ongoing monthly tax reserves in an amount equal to 1/12th of the tax payments that the lender reasonably estimates will be payable during the next ensuing 12 months.
Insurance – The loan documents do not require ongoing monthly deposits into an insurance reserve; provided no Cash Sweep Period is continuing, no event of default is continuing, the borrower maintains insurance coverage for the Timber Creek Crossing Property as part of blanket or umbrella coverage reasonably approved by the lender and provides the lender with evidence of the renewals of the insurance policies and the insurance premiums are current and paid in a timely manner. If such conditions are not satisfied, the loan documents require ongoing monthly insurance reserves equal to 1/12th of the insurance premiums that the lender reasonably estimates will be payable during the next ensuing 12 months.
Replacement Reserve – The loan documents do not require ongoing monthly replacement reserve deposits; provided no Cash Sweep Period is continuing. If such condition is not satisfied, the loan documents require ongoing monthly replacement reserves of approximately $7,900.
Leasing Reserve – The loan documents require an upfront deposit of $700,000 for tenant improvements and leasing commissions. Upon the occurrence and continuance of a Cash Sweep Period, the loan documents require ongoing monthly reserves of approximately $39,502 for tenant improvements and leasing commissions.
Lockbox and Cash Management. The Timber Creek Crossing Mortgage Loan is structured with a hard lockbox and springing cash management. The borrower is required to deposit all rents into a lender controlled lockbox account within two business days of receipt, and to direct all tenants to make direct rent deposits into the lockbox account. As long as a Cash Sweep Period is not in effect, all funds in the lockbox account are required to be distributed to the borrower periodically. During the continuance of a Cash Sweep Period, all funds in the lockbox will be required to be transferred periodically to a lender
| This is not a research report and was not prepared by any Underwriter’s research department. Please see additional important information and qualifications at the end of this Term Sheet. | ||
| 96 | ||
| Retail – Anchored | Loan #7 | Cut-off Date Balance: | $31,625,000 | |
| 6176 Retail Road | Timber Creek Crossing | Cut-off Date LTV: | 61.1% | |
| Dallas, TX 75231 | UW NCF DSCR: | 1.61x | ||
| UW NOI Debt Yield: | 10.2% |
controlled cash management account to be disbursed in accordance with the cash management waterfall set forth in the loan documents, with any excess funds required to be held as additional security in an excess cash flow subaccount controlled by the lender for so long as the Cash Sweep Period continues.
A “Cash Sweep Period” will commence upon the earliest of the following:
| (i) | the occurrence of an event of default; |
| (ii) | the net operating income debt service coverage ratio (“NOI DSCR”) falling below 1.20x for two consecutive calendar quarters, tested quarterly; or |
| (iii) | the occurrence of a Major Tenant Trigger Event (as defined below). |
A Cash Sweep Period will end upon the occurrence of the following:
| ● | with regard to clause (i), the cure of such event of default; |
| ● | with regard to clause (ii), (a) the NOI DSCR being greater than or equal to 1.20x for two consecutive calendar quarters or (b) the borrower posts cash or a letter of credit which if applied to the balance would cause the NOI DSCR to be greater than or equal to 1.20x; and |
| ● | with regard to clause (iii), a Major Tenant Trigger Event Cure (as defined below). |
A “Major Tenant Trigger Event” will commence upon the occurrence of any of the following:
| (i) | Walmart / Sam’s Club or At Home (each a “Major Tenant”) going dark in 50% or more of their space for more than 90 days (excluding government mandated closures and closures due to damage, alterations or renovations) in the Walmart, Sam’s Club or At Home spaces; |
| (ii) | a Major Tenant becoming the subject of a bankruptcy action (unless the tenant assumes the lease during such proceeding with no modifications other than as reasonably acceptable to lender); |
| (iii) | A Major Tenant being in monetary or material non-monetary default under its lease beyond applicable notice and cure periods; or |
| (iv) | A Major Tenant failing to renew the applicable lease by the earlier of the renewal notice date under the lease or 12 months prior to the lease expiration. |
A “Major Tenant Trigger Event Cure” will commence upon the occurrence of any of the following:
| ● | with respect to clause (i), (iii), or (iv) above, the borrower having entered into one or more replacement leases for substantially all of the applicable Major Tenant space, with no outstanding tenant improvements, tenant improvement allowances or leasing commissions (unless any outstanding amounts have been reserved) and such replacement tenant is paying full unabated rent (provided, if the replacement tenant has taken occupancy of the leased premises, any outstanding rent concessions may be reserved with the lender until full unabated rent has commenced); |
| ● | with respect to clause (i) above, the Major Tenant has resumed its normal business operations in at least 50% of its space; |
| ● | with respect to clause (ii) above, the dismissal of such bankruptcy or the Major Tenant is no longer insolvent or subject to any bankruptcy proceedings; |
| ● | with respect to clause (iii) above, the Major Tenant has not been in monetary or material non-monetary default under its lease for three consecutive calendar months; |
| ● | with respect to clause (iv) above, the borrower enters into an extension or renewal with the Major Tenant and there are no outstanding tenant improvements, tenant improvement allowances, leasing commissions or future rent credits or abatements (unless any such outstanding amounts have been reserved with the lender); |
| ● | with respect to clauses (i)-(iv) above triggered by Walmart / Sam’s Club, the borrower delivers to the lender cash or a letter of credit in the amount of $3,500,000 to be held as additional collateral for the loan, which may be used by the borrower for qualified leasing expenses; or |
| ● | with respect to clauses (i)-(iv) above triggered by At Home, the borrower delivers to the lender cash or a letter of credit in the amount of $1,500,000 to be held as additional collateral for the loan, which may be used by the borrower for qualified leasing expenses. |
Subordinate Debt. None.
Mezzanine Loan and Preferred Equity. None.
Release of Property. None.
Letter of Credit. None.
Right of First Offer/Right of First Refusal. Walmart has a Right of First Refusal (“ROFR”) and Right of First Offer (“ROFO”) to purchase its leased fee parcel if the borrower receives a bona fide offer that includes all or any portion of Walmart’s leased premises that it is otherwise willing to accept. The ROFR and ROFO are not extinguished by foreclosure. The ROFR and ROFO do not apply to sales or transfers of the premises to a party that is related or affiliated with the borrower or to a transfer, sale, conveyance or sale-leaseback transaction by the borrower for financing or investment purposes.
Ground Lease. None.
Terrorism Insurance. The loan documents require that the “all risk” insurance policy required to be maintained by the borrower provides coverage for terrorism in an amount equal to the full replacement cost of the Timber Creek Crossing Property, as well as business interruption insurance covering no less than the 12-month period following the occurrence of a casualty event, together with a 6-month extended period of indemnity. See “Risk Factors—Risks Relating to the Mortgage Loans—Terrorism Insurance May Not Be Available for All Mortgaged Properties” in the prospectus.
| This is not a research report and was not prepared by any Underwriter’s research department. Please see additional important information and qualifications at the end of this Term Sheet. | ||
| 97 | ||
| Hospitality – Extended Stay | Loan #8 | Cut-off Date Balance: | $24,300,000 | |
| 33 John R Street | Element Hotel Detroit | Cut-off Date LTV: | 54.6% | |
| Detroit, MI 48226 | UW NCF DSCR: | 1.65x | ||
| UW NOI Debt Yield: | 14.8% |

| This is not a research report and was not prepared by any Underwriter’s research department. Please see additional important information and qualifications at the end of this Term Sheet. | ||
| 98 | ||
| Hospitality – Extended Stay | Loan #8 | Cut-off Date Balance: | $24,300,000 | |
| 33 John R Street | Element Hotel Detroit | Cut-off Date LTV: | 54.6% | |
| Detroit, MI 48226 | UW NCF DSCR: | 1.65x | ||
| UW NOI Debt Yield: | 14.8% |

| This is not a research report and was not prepared by any Underwriter’s research department. Please see additional important information and qualifications at the end of this Term Sheet. | ||
| 99 | ||
| Mortgage Loan No. 8 – Element Hotel Detroit |
| Mortgage Loan Information | Property Information | ||||||
| Mortgage Loan Seller: | MSMCH | Single Asset/Portfolio: | Single Asset | ||||
| Credit Assessment (Moody’s/Fitch/KBRA): | NR/NR/NR | Location: | Detroit, MI 48226 | ||||
| Original Balance: | $24,300,000 | General Property Type: | Hospitality | ||||
| Cut-off Date Balance: | $24,300,000 | Detailed Property Type: | Extended Stay | ||||
| % of Initial Pool Balance: | 4.7% | Title Vesting: | Fee | ||||
| Loan Purpose: | Refinance | Year Built/Renovated: | 1925/2018 | ||||
| Borrower Sponsors: | Stacy L. Fox, David Di Rita and | Size: | 110 Rooms | ||||
| James Van Dyke | Cut-off Date Balance Per Room: | $220,909 | |||||
| Guarantors: | Stacy L. Fox, David Di Rita and | Maturity Date Balance Per Room: | $220,909 | ||||
| James Van Dyke | Property Manager: | Azul Hospitality Group, Inc. | |||||
| Mortgage Rate: | 7.9800% | ||||||
| Note Date: | 1/9/2024 | ||||||
| First Payment Date: | 3/1/2024 | ||||||
| Maturity Date: | 2/1/2029 | ||||||
| Original Term to Maturity: | 60 months | Underwriting and Financial Information | |||||
| Original Amortization Term: | 0 months | UW NOI: | $3,606,246 | ||||
| IO Period: | 60 months | UW NOI Debt Yield: | 14.8% | ||||
| Seasoning: | 0 months | UW NOI Debt Yield at Maturity: | 14.8% | ||||
| Prepayment Provisions: | L(24),D(31),O(5) | UW NCF DSCR: | 1.65x | ||||
| Lockbox/Cash Mgmt Status: | Hard/Springing | Most Recent NOI: | $3,649,240 (10/31/2023 TTM) | ||||
| Additional Debt Type(1): | Yes (New Markets Tax Credits Loan) | 2nd Most Recent NOI(3): | $4,024,035 (12/31/2022) | ||||
| Additional Debt Balance: | (1) | 3rd Most Recent NOI(3): | $1,631,950 (12/31/2021) | ||||
| Future Debt Permitted (Type): | No (NAP) | Most Recent Occupancy: | 70.9% (10/31/2023) | ||||
| Reserves(2) | 2nd Most Recent Occupancy(3): | 71.7% (12/31/2022) | |||||
| Type | Initial | Monthly | Cap | 3rd Most Recent Occupancy(3): | 58.0% (12/31/2021) | ||
| RE Tax: | $34,030 | $17,015 | NAP | Appraised Value (as of): | $44,500,000 (11/13/2023) | ||
| Insurance: | $32,325 | $10,775 | NAP | Appraised Value Per Room: | $404,545 | ||
| FF&E Reserve: | $0 | $30,877 | NAP | Cut-off Date LTV Ratio: | 54.6% | ||
| PIP Reserve: | $0 | Springing | NAP | Maturity Date LTV Ratio: | 54.6% | ||
| Sources and Uses | ||||||
| Sources | Proceeds | % of Total | Uses | Proceeds | % of Total | |
| Mortgage Loan Amount: | $24,300,000 | 100.0% | Loan Payoff: | $20,161,460 | 83.0% | |
| Reserves: | $66,355 | 0.3% | ||||
| Closing Costs: | $886,909 | 3.6% | ||||
| Return of Equity: | $3,185,276 | 13.1% | ||||
| Total Sources: | $24,300,000 | 100.0% | Total Uses: | $24,300,000 | 100.0% | |
| (1) | See “Mezzanine Loan and Preferred Equity” below for further discussion. |
| (2) | See “Escrows and Reserves” below for further discussion of reserve requirements. |
| (3) | The increase in Occupancy and NOI from 2021 to 2022 was primarily due to the effect of the novel coronavirus on the hospitality industry in 2020, and the continued recovery in 2021 and 2022. |
The Mortgage Loan. The eighth largest mortgage loan (the “Element Hotel Detroit Mortgage Loan”) is evidenced by a promissory note in the original principal amount of $24,300,000 and secured by a fee mortgage encumbering an extended stay hospitality property located in Detroit, Michigan (the “Element Hotel Detroit Property”).
The Borrower and the Borrower Sponsors. The borrower for the Element Hotel Detroit Mortgage Loan is Metropolitan Building SPE LLC, a single-purpose, Delaware limited liability company with one independent director in its organizational structure. The non-recourse carve-out guarantors and borrower sponsors of the Element Hotel Detroit Mortgage Loan are Stacy L. Fox, David Di Rita and James Van Dyke, who own 35%, 30%, and 25% of Roxbury Manager, LLC, respectively. Vince Dattilo owns the other 10% of Roxbury Manager, LLC. Roxbury Manager, LLC owns approximately 56.3% of the borrower.
Roxbury Manager, LLC is an affiliate of The Roxbury Group, a Detroit-based real estate development and investment firm founded in 2005 by principals Stacy Fox and David Di Rita. The Roxbury Group specializes in complex real estate and economic development projects, principally in the City of Detroit and has played a role in the redevelopment of Detroit’s downtown and neighboring districts. The Roxbury Group owns a 136-key hotel that occupies the David Whitney Building one block west of the Element Hotel Detroit Property, which is presently being reflagged from an Aloft to the Autograph Collection, both of which are Marriott brands, as is the Element Hotel Detroit Property. Roxbury has developed over one million SF of properties, including a number of other historic high rise buildings like the David Whitney and the Element at the Metropolitan, as well as new construction projects. Their development portfolio includes nearly 500 multi-family residential units, as well as retail, office, governmental, and other hospitality properties.
| This is not a research report and was not prepared by any Underwriter’s research department. Please see additional important information and qualifications at the end of this Term Sheet. | ||
| 100 | ||
| Hospitality – Extended Stay | Loan #8 | Cut-off Date Balance: | $24,300,000 | |
| 33 John R Street | Element Hotel Detroit | Cut-off Date LTV: | 54.6% | |
| Detroit, MI 48226 | UW NCF DSCR: | 1.65x | ||
| UW NOI Debt Yield: | 14.8% |
Stacy Fox was appointed by Governor Rick Snyder in 2013 to serve as Deputy Emergency Manager of the City of Detroit, where she helped to guide Detroit through its municipal bankruptcy. Stacy Fox served as a member of the executive committee of the Downtown Detroit Partnership for more than ten years and was the founding chair of its Stakeholders Committee. In 2016, she was recognized by a business publication as one of Michigan’s 100 most influential women.
David Di Rita has over 30 years of corporate, legal and transactional experience and is actively involved in the real estate development and advisory work for The Roxbury Group. Prior to The Roxbury Group, David Di Rita was a corporate and transactional attorney and real estate executive, who held senior positions at Tower Automotive, Visteon Corporation and Johnson Controls, as well as associate and of-counsel positions at both Dickinson Wright and Foley & Lardner. David Di Rita serves on the Board of Directors for the downtown Detroit Business Improvement Zone and is the President of the Detroit Entertainment District Association.
James Van Dyke serves as Executive Vice President of The Roxbury Group, overseeing development and asset management activity, identifying, analyzing and implementing new projects as well as managing asset strategy for the company's portfolio. He has focused on promoting Roxbury's commitment to local workforce development and mixed-income housing solutions.
The Property. The Element Hotel Detroit Property is a 110-room, extended stay hospitality property built on a 0.17-acre site in Detroit, Michigan. The hotel building was originally an office building erected in 1925 to accommodate wholesale and retail jewelry businesses anchoring Detroit’s then jewelry district and was built in the neo-Gothic style. After having been vacant since 1979, the building was acquired by the borrower sponsor in 2016 for $500,000. The borrower sponsor undertook a $32.5 million two-year restoration of the building to its original neo-gothic style and conversion to hotel use prior to opening the hotel in January 2019. Under a certified historic rehabilitation plan, the renovation preserved many of the building’s original features, including decorative staircases, terrazzo flooring and an ornate vaulted ceiling in the lobby. Featured amenities include approximately 2,817 SF of meeting space, full breakfast service, bicycle rental, a fitness center, a guest laundry room, a sundries shop, ice machines, and kitchens in all suites. The Element Hotel Detroit Property also includes a 13th floor rooftop lounge known as The Monarch Club at Metropolitan encompassing a 150-seat upscale cocktail bar, penthouse lounge, and three outdoor terraces each with tables, firepits and views of the Detroit skyline. A second English-pub style restaurant is under development, to be located on the ground floor and named The Lone Goat, and is expected to open in April 2024. Another ground floor retail space is sublet by Somerset Collection Merchants Association, Inc. and used as a rotating concierge sales space by approximately 180 retailers from the upscale Somerset Collections Mall in Troy, Michigan.
The guestroom mix at the Element Hotel Detroit Hotel Property is comprised of 41 studio bedrooms with king beds, 21 bedrooms with king beds, 20 bedrooms with two queen beds, 19 studio bedrooms with two queen beds, and nine one-bedroom suites. Guestrooms are accessible via two passenger elevators, and room amenities feature a mini-fridge, microwave and sink, while the studios and one-bedroom guest rooms are outfitted with a refrigerator, sink, microwave, dishwasher and two burner cooktops.
The Element Hotel Detroit Property is currently subject to a franchise agreement expiring January 31, 2039 with Westin Hotel Management, L.P., which is wholly owned by Marriott International, Inc.
According to the appraisal, the property segmentation at the Element Hotel Detroit Property is estimated at 42% commercial, 26% leisure and 17% meeting and group.
The Market. The Element Hotel Detroit Property is located in Detroit, Michigan, approximately 8.2 miles northwest of the Windsor International Airport and approximately 21.6 miles northeast of the Detroit Metropolitan Wayne County Airport. The Element Hotel Detroit Property is situated just southeast of the Grand Circus with frontage on John R and Farmer Streets in downtown Detroit’s sports and entertainment district, within walking distance of attractions like Campus Martius, Corktown, the Detroit Tigers’ Comerica Park, the Detroit Lions’ Ford Field, and Little Caesars Arena, home to the Detroit Pistons and the Detroit Red Wings, all of which are within 0.6 miles of the Element Hotel Detroit Property. Downtown Detroit was selected to host the NFL draft in 2024, and the NCAA men’s basketball Final Four tournament in 2027. Major employers in the City of Detroit include Ford Motor Co., General Motors Corp., Chrysler Group LLC, Quicken Loans, Comerica Bank, Ally Bank and Rocket Mortgage.
According to the appraisal, the estimated 2023 population within a two-, five-, and ten-mile radius of the Element Hotel Detroit Property was 41,017, 211,030, and 874,348, respectively. According to the appraisal, the 2023 average household income within the same radii was $57,325, $48,590, and $55,881, respectively.
According to the appraisal, a new 158 room Cambria Suites hotel that competes with the Element Hotel Detroit Property opened in May 2023. Six other new hotels are expected to open in 2024, and according to the appraisal, some of them may compete with the Element Hotel Detroit Property.
The following table presents the primary competitive properties to the Element Hotel Detroit Property:
| Competitive Property Summary(1) | |||||||||
| Property | Year Built | Rooms | Commercial | Group | Leisure | Extended Stay | 2022 Occupancy | 2022 ADR | 2022 RevPAR |
| Element Hotel Detroit (subject) | 1925 | 110 | 42% | 17% | 26% | 15% | 72% | $272.74 | $195.59 |
| Courtyard Detroit Downtown | 1978 | 260 | 40% | 28% | 30% | 2% | 50%-55% | $175-$180 | $90-$95 |
| The Atheneum Suite Hotel | 1992 | 173 | 30% | 35% | 33% | 2% | 45%-50% | $150-$155 | $70-$75 |
| Hotel Indigo Detroit Downtown | 2000 | 241 | 45% | 15% | 38% | 2% | 50%-55% | $240-$245 | $120-$125 |
| Trumbull and Porter Hotel | 1999 | 143 | 40% | 15% | 45% | 0% | 45%-50% | $145-$150 | $65-$70 |
| Hilton Garden Inn Detroit Downtown | 2004 | 198 | 38% | 16% | 44% | 2% | 65%-70% | $200-$205 | $130-$135 |
| Subtotal/Average | 1,125 | 39% | 21% | 36% | 3% | 55% | $201 | $110 | |
Source: Appraisal.
| (1) | The variances between the underwriting, the appraisal and industry report data with respect to occupancy, ADR and RevPAR are attributable in part to variances in reporting methodologies and/or timing differences. |
| This is not a research report and was not prepared by any Underwriter’s research department. Please see additional important information and qualifications at the end of this Term Sheet. | ||
| 101 | ||
| Hospitality – Extended Stay | Loan #8 | Cut-off Date Balance: | $24,300,000 | |
| 33 John R Street | Element Hotel Detroit | Cut-off Date LTV: | 54.6% | |
| Detroit, MI 48226 | UW NCF DSCR: | 1.65x | ||
| UW NOI Debt Yield: | 14.8% |
The following table presents certain information relating to the Occupancy, ADR and RevPAR of the Element Hotel Detroit Property and its competitive set:
| Historical Occupancy, ADR, RevPAR(1)(2) | |||||||||
| Competitive Set | Element Hotel Detroit Property | Penetration Factor | |||||||
| Year | Occupancy | ADR | RevPAR | Occupancy | ADR | RevPAR | Occupancy | ADR | RevPAR |
| 12/31/2020 | 27.6% | $139.59 | $38.48 | 53.8% | $161.88 | $87.04 | 195.0% | 116.0% | 226.2% |
| 12/31/2021 | 37.7% | $167.14 | $62.93 | 58.0% | $199.07 | $115.40 | 154.0% | 119.1% | 183.4% |
| 12/31/2022 | 52.6% | $193.16 | $101.59 | 71.7% | $278.54 | $199.75 | 136.4% | 144.2% | 196.6% |
| 11/30/2023 TTM | 47.4% | $208.33 | $98.85 | 69.8% | $293.03 | $204.50 | 147.1% | 140.7% | 206.9% |
Source: Industry Report.
| (1) | The competitive set includes Courtyard Detroit Downtown, The Atheneum Suite Hotel, Hotel Indigo Detroit Downtown, Trumbull and Porter Hotel and Hilton Garden Inn Detroit Downtown. |
| (2) | The variances between the underwriting, the appraisal and the industry report data with respect to Occupancy, ADR and RevPAR at the Element Hotel Detroit Property are attributable in part to variances in reporting methodologies and/or timing differences. |
Operating History and Underwritten Net Cash Flow. The following table presents certain information relating to the historical operating performance and the Underwritten Net Cash Flow at the Element Hotel Detroit Property:
| Cash Flow Analysis | |||||||
| 2019(1) | 2020(1) | 2021(1) | 2022(1) | 10/31/2023 TTM | UW | UW per Room | |
| Occupancy(2) | 73.4% | 42.9% | 58.0% | 71.7% | 70.9% | 70.9% | |
| ADR(2) | $201.90 | $173.60 | $199.24 | $272.70 | $290.75 | $290.75 | |
| RevPAR(2) | $148.25 | $74.43 | $115.50 | $195.59 | $206.06 | $206.06 | |
| Room Revenue | $5,625,914 | $2,996,365 | $4,637,357 | $7,853,078 | $8,273,182 | $8,273,182 | $75,210.75 |
| Food & Beverage Revenue | $332,940 | $108,005 | $175,972 | $267,242 | $269,644 | $269,644 | $2,451.31 |
| Other Departmental Income: | $485,539 | $160,820 | $470,268 | $636,368 | $653,911 | $653,911 | $5,944.65 |
| Miscellaneous Income: | $7,820 | $2,156 | $4,913 | $20,852 | $66,317 | $66,317 | $602.88 |
| Total Revenue | $6,452,213 | $3,267,346 | $5,288,510 | $8,777,540 | $9,263,054 | $9,263,054 | $84,209.58 |
| Room Expense | $1,491,391 | $620,516 | $968,574 | $1,467,881 | $1,446,349 | $1,446,349 | $13,148.63 |
| Food & Beverage Expense | $222,227 | $56,050 | $72,342 | $143,297 | $134,318 | $134,318 | $1,221.07 |
| Real Estate Taxes(3) | $252,000 | $134,611 | $203,005 | $209,997 | $194,506 | $332,882 | $3,026.20 |
| Insurance | $48,479 | $56,648 | $59,012 | $68,424 | $98,316 | $125,530 | $1,141.18 |
| Other Expenses | $2,613,461 | $1,702,932 | $2,353,627 | $2,863,906 | $3,740,325 | $3,617,729 | $32,888.45 |
| Total Expenses | $4,627,558 | $2,570,757 | $3,656,560 | $4,753,505 | $5,613,814 | $5,656,808 | $51,425.53 |
| Net Operating Income | $1,824,655 | $696,589 | $1,631,950 | $4,024,035 | $3,649,240 | $3,606,246 | $32,784.05 |
| FF&E | $258,080 | $130,694 | $211,540 | $351,102 | $370,522 | $370,522 | $3,368.38 |
| Net Cash Flow | $1,566,575 | $565,895 | $1,420,410 | $3,672,933 | $3,278,718 | $3,235,724 | $29,415.67 |
| NOI DSCR | 0.93x | 0.35x | 0.83x | 2.05x | 1.86x | 1.83x | |
| NCF DSCR | 0.80x | 0.29x | 0.72x | 1.87x | 1.67x | 1.65x | |
| NOI Debt Yield | 7.5% | 2.9% | 6.7% | 16.6% | 15.0% | 14.8% | |
| NCF Debt Yield | 6.4% | 2.3% | 5.8% | 15.1% | 13.5% | 13.3% | |
| (1) | The decrease in Occupancy and Net Operating Income from 2019 to 2020, and the increase in Occupancy and NOI from 2020 to 2021, and from 2021 to 2022 was primarily due to the effect of the novel coronavirus on the hospitality industry in 2020, and the continued recovery in 2021 and 2022. |
| (2) | The variances between the underwriting, the appraisal, and the industry report data with respect to Occupancy, ADR and RevPAR at the Element Hotel Detroit Property are attributable in part to variances in reporting methodologies and/or timing differences. |
| (3) | UW Real Estate Taxes are equal to the five-year average of anticipated tax payments for 2024 through 2028, reflecting tax abatements due to an obsolete property rehabilitation (“OPRA”) exemption. The OPRA exemption expires December 30, 2031. The transfer of the OPRA to the borrower by its sole member, which previously owned the Element Hotel Detroit Property, is a post-closing obligation of the borrower. Any transfer of the benefits of the OPRA exemption, including to the borrower, and to the issuing entity if it took title to the Element Hotel Detroit Property through a foreclosure, deed-in-lieu or other enforcement action, requires the consent of the State of Michigan and the City of Detroit. We cannot assure you that such consent would be obtained, or the abatement will continue. See “Description of the Mortgage Pool—Real Estate and Other Tax Considerations” in the prospectus. |
Escrows and Reserves.
Real Estate Taxes–- The Element Hotel Detroit Mortgage Loan documents provide for an upfront reserve of approximately $34,030 for real estate taxes and ongoing monthly reserves for real estate taxes in an amount equal to 1/12 of the real estate taxes that the lender estimates will be payable during the next twelve months (initially $17,015).
| This is not a research report and was not prepared by any Underwriter’s research department. Please see additional important information and qualifications at the end of this Term Sheet. | ||
| 102 | ||
| Hospitality – Extended Stay | Loan #8 | Cut-off Date Balance: | $24,300,000 | |
| 33 John R Street | Element Hotel Detroit | Cut-off Date LTV: | 54.6% | |
| Detroit, MI 48226 | UW NCF DSCR: | 1.65x | ||
| UW NOI Debt Yield: | 14.8% |
Insurance–- The Element Hotel Detroit Mortgage Loan documents provide for an upfront reserve of approximately $32,325 for insurance premiums and ongoing monthly reserves for insurance premiums in an amount equal to 1/12 of the insurance premiums that the lender estimates will be payable for the renewal of the insurance coverage (currently $10,775); provided, however, that such monthly reserves for insurance premiums will not be required as long as (i) no event of default has occurred and is continuing, (ii) the liability and casualty insurance coverage for the Element Hotel Detroit Property is included in a blanket or umbrella policy approved by the lender in its reasonable discretion, and (iii) the borrower provides the lender with certificates of insurance evidencing the insurance policies and paid receipts for insurance premiums no later than 10 days prior to the expiration dates of the policies.
FF&E Reserve–- The Element Hotel Detroit Mortgage Loan documents provide for ongoing monthly reserves for furniture, fixtures and equipment (“FF&E”) in an amount equal to the greater of (i) 1/12 of 4% of the operating income for the Element Hotel Detroit Property for the preceding calendar year (approximately $30,877 for 2024) and (ii) the amount of the deposit required by the franchisor on account of FF&E under the franchise agreement. The monthly deposit is required to be adjusted annually by the lender in January of each calendar year based on the foregoing.
PIP Reserve–- On the date that any new PIP is imposed by the related franchisor, the borrower is required to deposit 125% of the sum required to pay for such new PIP into such reserve.
Lockbox and Cash Management. The Element Hotel Detroit Mortgage Loan is structured with a hard lockbox and springing cash management. At origination, the borrower and property manager were required to direct credit card companies and credit card banks to deposit all credit card receipts with respect to the Element Hotel Detroit Property into a lockbox account controlled by the lender. If, notwithstanding the foregoing direction, the borrower or property manager receives any hotel or other rents from the Element Hotel Detroit Property, it is required to deposit such amounts into the lockbox account within one business day of receipt. In the absence of a Cash Sweep Period (as defined below), the funds in the lockbox account will be swept each business day into an account controlled by the borrower. If a Cash Sweep Period is continuing, all funds in the lockbox account are required to be swept to a lender-controlled cash management account, and applied, provided that no event of default is continuing under the Element Hotel Detroit Mortgage Loan, (i) to fund the required tax and insurance reserves deposits, if any, as described above under “Escrows and Reserves,” (ii) to fund the payment of debt service on the Element Hotel Detroit Mortgage Loan, (iii) to pay monthly operating expenses referenced in the lender-approved annual budget, and other expenses approved by the lender, (iv) to fund the required monthly deposit into the FF&E reserve, as described above under “Escrows and Reserves,” (v) to fund any deposit required for a new property improvement plan as described above under “Escrows and Reserves,” and (vi) to disburse the remainder into an excess cash flow sweep account to be held as additional collateral for the Element Hotel Detroit Mortgage Loan during the continuance of such Cash Sweep Period.
A “Cash Sweep Period” will commence upon:
| (i) | the occurrence of an event of default and continue until the cure (if applicable) of such event of default; |
| (ii) | the date that the debt service coverage ratio as of the end of the immediately preceding calendar quarter falls below 1.30x (based upon the trailing 12-month period) and continue until such time as the debt service coverage ratio has been at least 1.30x for two consecutive calendar quarters (based upon the trailing 12-month period); |
| (iii) | Either (x) there is a default by the borrower under the franchise agreement or (y) the Element Hotel Detroit Property is not being operated or maintained in accordance with the franchisor’s standards, resulting in the borrower and/or franchisee no longer being in good standing with the franchisor, and in each case such default is not cured within 30 days of such notice, and continue until either (A) the Franchise Agreement Cure Conditions (as defined below) are satisfied or (B) the date on which either (I) the borrower enters into a Replacement Franchise Agreement (as defined below) with a Qualified Franchisor (as defined below) with an expiration date at least three years after the maturity date of the Element Hotel Detroit Mortgage Loan, and delivers to the lender a satisfactory comfort letter relating thereto; or (II) the related franchise agreement has been extended for a period at least three years after the maturity date of the Element Hotel Detroit Mortgage Loan, and in the case of each of (I) and (II), the lender has received reasonably acceptable evidence (which may include, without limitation, a duly executed comfort letter or estoppel certificate from the franchisor) that the replacement or extended franchise agreement is in full force and effect with no defaults thereunder, and if there is a new PIP, the borrower has made the required deposit into the PIP reserve (the conditions in this clause (B), a “Replacement/Extension Cure”); or |
| (iv) | the date that is the earlier to occur of (x) the date either the franchisor or the borrower gives notice to terminate the franchise agreement or (y) the date the franchise agreement is terminated, and continue until either (A) the Franchise Agreement Cure Conditions are satisfied or (B) a Replacement/Extension Cure occurs; or |
| (v) | any cancellation of the franchise agreement (including without limitation, rejection in a bankruptcy or insolvency proceeding) and continue until either (A) the Franchise Agreement Cure Conditions are satisfied; or (B) a Replacement/Extension Cure occurs; or |
| (vi) | any bankruptcy or similar insolvency of the franchisor and continue until either (A) the Franchise Agreement Cure Conditions are satisfied or (B) a Replacement/Extension Cure occurs; or |
| (vii) | the Element Hotel Detroit Property failing to be operated, flagged and/or branded pursuant to the franchise agreement and continue until either (A) the Franchise Agreement Cure Conditions are satisfied or (B) a Replacement/Extension Cure occurs; or |
| (viii) | any permit applicable to the franchise agreement ceasing to be in full force and effect and continue until either (A) the Franchise Agreement Cure Conditions are satisfied or (B) a Replacement/Extension Cure occurs. |
“Franchise Agreement Cure Conditions” means each of the following: (i) the lender has received reasonably acceptable evidence (which may include, without limitation, a duly executed comfort letter or estoppel certificate from the franchisor) that (I) the franchise agreement is in full force and effect with no defaults thereunder and (II) the borrower or the franchisee, as applicable, is in good standing with the franchisor, (ii) the franchisor has irrevocably rescinded the applicable notice of termination in writing and the lender has received evidence reasonably acceptable to the lender (which may include, without limitation, a duly executed comfort letter or estoppel certificate from the franchisor) that the franchise agreement is in full force and effect with no defaults thereunder, (iii) with respect to any applicable bankruptcy or insolvency proceedings involving the franchisor and/or franchise agreement (if
| This is not a research report and was not prepared by any Underwriter’s research department. Please see additional important information and qualifications at the end of this Term Sheet. | ||
| 103 | ||
| Hospitality – Extended Stay | Loan #8 | Cut-off Date Balance: | $24,300,000 | |
| 33 John R Street | Element Hotel Detroit | Cut-off Date LTV: | 54.6% | |
| Detroit, MI 48226 | UW NCF DSCR: | 1.65x | ||
| UW NOI Debt Yield: | 14.8% |
any), such entity is no longer insolvent or subject to any bankruptcy or insolvency proceedings and, in the case of franchisor, has affirmed such franchise agreement pursuant to a final, non-appealable order of a court of competent jurisdiction, (iv) the Element Hotel Detroit Property continues to be operated, “flagged” and branded pursuant to the franchise agreement and (v) all permits applicable to the franchise agreement are in full force and effect.
A “Qualified Franchisor” means a reputable and experienced franchisor possessing experience in flagging hotel properties similar in size, scope, use and value as the Element Hotel Detroit Property and approved by the lender.
A “Replacement Franchise Agreement” means a franchise, trademark and license agreement with a Qualified Franchisor that is either substantially the same in form and substance as the franchise agreement in effect on the loan origination date, or otherwise reasonably acceptable to the lender.
Subordinate Debt. None.
Mezzanine Loan and Preferred Equity. The Element Hotel Detroit Property is subject to a New Markets Tax Credit Arrangement pursuant to which the prior owner of the Element Hotel Detroit Property, an affiliate of the borrower, received two qualified low-income community investment loans (“QLICI Loans”). At origination one of such QLICI Loans was repaid in full and the other was partially repaid, resulting in a remaining QLICI Loan amount of $1,386,000. The QLICI Loan is secured by the equity interests in the borrower held by the borrower’s sole member. The lender under the QLICI Loan has entered into a subordination and standstill agreement with the lender under the Element Hotel Detroit Mortgage Loan. See “Description of the Mortgage Pool—Additional Indebtedness—Other Unsecured Indebtedness” in the prospectus.
Release of Property. Not permitted.
Letter of Credit. None.
Right of First Offer/Right of First Refusal. None.
Ground Lease. None.
Terrorism Insurance. The Element Hotel Detroit Mortgage Loan documents require that the “all risk” insurance policy required to be maintained by the borrower provide coverage for terrorism in an amount not less than 100% of the full replacement cost of the Element Hotel Detroit Property. The Element Hotel Detroit Mortgage Loan documents also require business income/loss of rents insurance for a period of no less than the 18-month period commencing at the time of loss, together with a twelve-month extended period of indemnity. Notwithstanding the foregoing, for so long as the Terrorism Risk Insurance Act of 2002, as extended and modified by the Terrorism Risk Insurance Program Reauthorization Act of 2015 (“TRIPRA”) is in effect (including any extensions thereof or if another federal governmental program is in effect relating to “acts of terrorism” which provides substantially similar protections as TRIPRA), and covers both domestic and foreign acts of terrorism, the lender is required to accept terrorism insurance which insures against “covered acts” as defined by TRIPRA (or such other program). See “Risk Factors—Risks Relating to the Mortgage Loans—Terrorism Insurance May Not Be Available for All Mortgaged Properties” in the prospectus.
| This is not a research report and was not prepared by any Underwriter’s research department. Please see additional important information and qualifications at the end of this Term Sheet. | ||
| 104 | ||
| Industrial – Flex | Loan #9 | Cut-off Date Balance: | $24,200,000 | |
| 6916, 6935, 6936, 6949, 6972, 6991 | Appling Farms Corporate Park | Cut-off Date LTV: | 55.8% | |
| and 7005 Appling Farms Parkway | UW NCF DSCR: | 1.51x | ||
| Memphis, TN 38133 | UW NOI Debt Yield: | 11.9% |
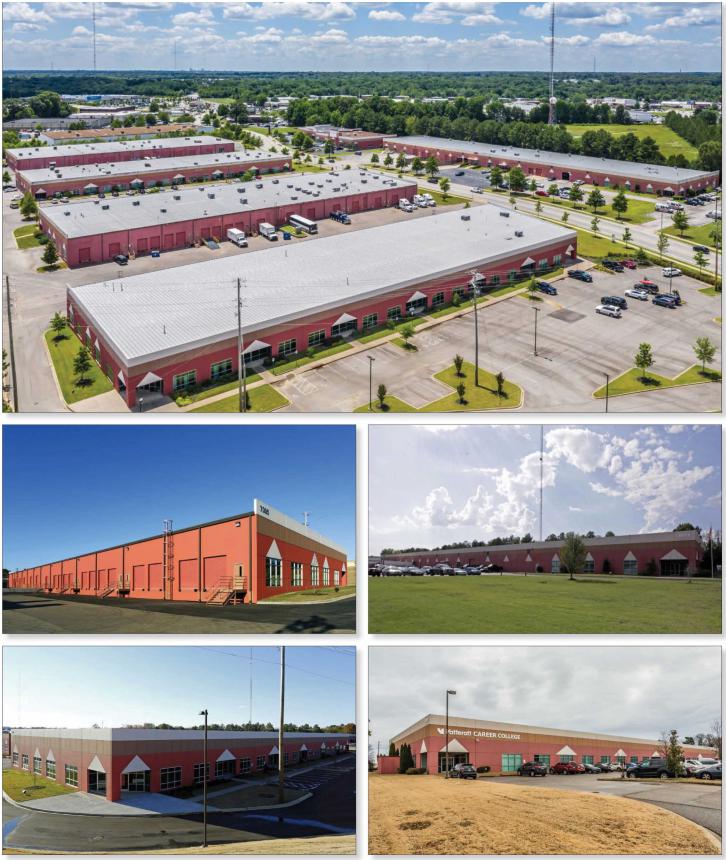
| This is not a research report and was not prepared by any Underwriter’s research department. Please see additional important information and qualifications at the end of this Term Sheet. | ||
| 105 | ||
| Industrial – Flex | Loan #9 | Cut-off Date Balance: | $24,200,000 | |
| 6916, 6935, 6936, 6949, 6972, 6991 | Appling Farms Corporate Park | Cut-off Date LTV: | 55.8% | |
| and 7005 Appling Farms Parkway | UW NCF DSCR: | 1.51x | ||
| Memphis, TN 38133 | UW NOI Debt Yield: | 11.9% |
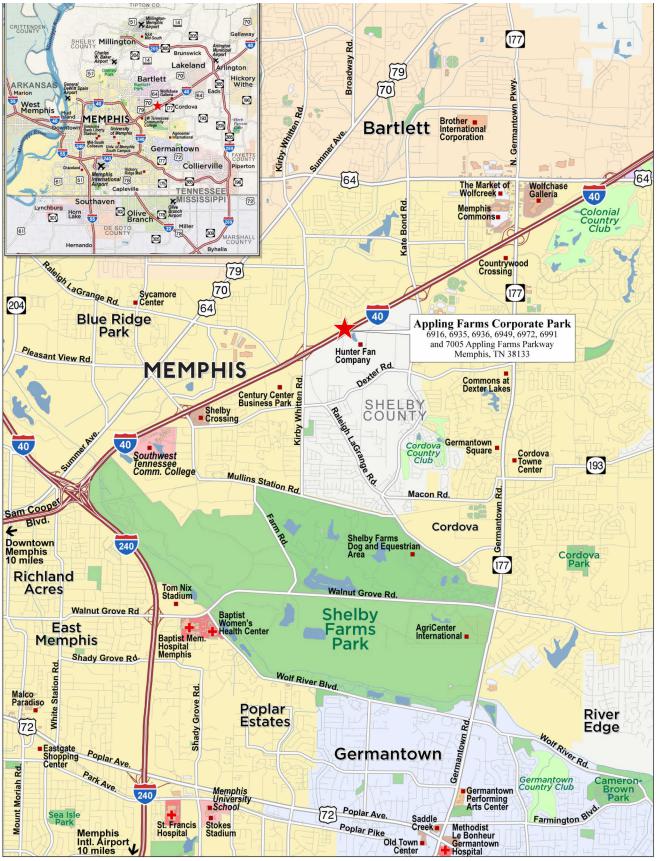
| This is not a research report and was not prepared by any Underwriter’s research department. Please see additional important information and qualifications at the end of this Term Sheet. | ||
| 106 | ||
Mortgage Loan No. 9 – Appling Farms Corporate Park |
| Mortgage Loan Information | Property Information | ||||||
| Mortgage Loan Seller: | MSMCH | Single Asset/Portfolio: | Single Asset | ||||
| Credit Assessment (Moody’s/Fitch/KBRA): | NR/NR/NR | Location: | Memphis, TN 38133 | ||||
| Original Balance: | $24,200,000 | General Property Type: | Industrial | ||||
| Cut-off Date Balance: | $24,200,000 | Detailed Property Type: | Flex | ||||
| % of Initial Pool Balance: | 4.7% | Title Vesting: | Fee | ||||
| Loan Purpose: | Refinance | Year Built/Renovated: | 2003-2015/ NAP | ||||
| Borrower Sponsor: | David Curtis Wegener | Size: | 297,292 SF | ||||
| Guarantors: | (1) | Cut-off Date Balance PSF: | $81 | ||||
| Mortgage Rate: | 7.0500% | Maturity Date Balance PSF: | $81 | ||||
| Note Date: | 12/18/2023 | Property Manager: | Colliers Management Services - | ||||
| First Payment Date: | 2/1/2024 | Memphis, LLC | |||||
| Maturity Date: | 1/1/2029 | ||||||
| Original Term to Maturity: | 60 months | ||||||
| Original Amortization Term: | 0 months | ||||||
| IO Period: | 60 months | Underwriting and Financial Information | |||||
| Seasoning: | 1 month | UW NOI: | $2,886,218 | ||||
| Prepayment Provisions: | L(23),YM1(30),O(7) | UW NOI Debt Yield: | 11.9% | ||||
| Lockbox/Cash Mgmt Status: | Springing/Springing | UW NOI Debt Yield at Maturity: | 11.9% | ||||
| Additional Debt Type: | No | UW NCF DSCR: | 1.51x | ||||
| Additional Debt Balance: | NAP | Most Recent NOI: | $2,565,570 (9/30/2023 T-9 Annualized) | ||||
| Future Debt Permitted (Type): | No (NAP) | 2nd Most Recent NOI: | $1,911,172(12/31/2022) | ||||
| Reserves(2) | 3rd Most Recent NOI: | $1,417,501(12/31/2021) | |||||
| Type | Initial | Monthly | Cap | Most Recent Occupancy: | 97.0% (10/1/2023) | ||
| RE Tax: | $39,236 | $39,236 | NAP | 2nd Most Recent Occupancy: | 85.2% (12/31/2022) | ||
| Insurance: | $0 | Springing | NAP | 3rd Most Recent Occupancy: | 64.1% (12/31/2021) | ||
| Deferred Maintenance: | $1,438 | $0 | NAP | Appraised Value (as of): | $43,400,000 (11/6/2023) | ||
| Replacement Reserve: | $0 | $3,716 | NAP | Appraised Value PSF: | $146 | ||
| TI/LC Reserve: | $0 | $24,774 | $594,584 | Cut-off Date LTV Ratio: | 55.8% | ||
| Other Reserves: | $335,015 | $0 | NAP | Maturity Date LTV Ratio: | 55.8% | ||
| Sources and Uses | ||||||
| Sources | Proceeds | % of Total | Uses | Proceeds | % of Total | |
| Mortgage Loan Amount: | $24,200,000 | 99.2% | Loan Payoff: | $22,845,983 | 93.7% | |
| Borrower Equity: | $185,444 | 0.8% | Closing Costs: | $1,163,771 | 4.8% | |
| Reserves: | $375,689 | 1.5% | ||||
| Total Sources: | $24,385,444 | 100.0% | Total Uses: | $24,385,444 | 100.0% | |
| (1) | The non-recourse carveout guarantors for the Appling Farms Corporate Park Mortgage Loan (as defined below) are David Curtis Wegener and D. Curtis Wegener, Trustee of The Alexander Holdings Trust U/A Dated November 1, 2010. |
| (2) | See “Escrows and Reserves” below for further discussion of reserve requirements, |
The Mortgage Loan. The ninth largest mortgage loan (the “Appling Farms Corporate Park Mortgage Loan”) is evidenced by a promissory note in the original principal amount of $24,200,000 and secured by a first priority fee mortgage encumbering a 297,292 SF industrial property located in Memphis, Tennessee (the “Appling Farms Corporate Park Property”).
The Borrower and Borrower Sponsor. The borrower is Appling Farms Corporate Park, LLC, a single-purpose Delaware limited liability company with one independent director. The borrower is owned by Trinity Appling Industrial Investors LLC (36.0%) and Trinity CI 2022 LLC (20.0%), as well as Alexander Holdings Trust (TN) Irrevocable Trust (44.0%), which is also the managing member. The borrower sponsor is David Curtis Wegener and the non-recourse carveout guarantors are David Curtis Wegener and D. Curtis Wegener, Trustee of The Alexander Holdings Trust U/A Dated November 1, 2010. David Curtis Wegener is the founder and president of Industrial Capital Holdings, a developer and manager of small and medium light industrial assets throughout the Memphis metropolitan statistical area that was founded in 1998. The company reports a current portfolio of nearly 1.0 million SF of space (including the collateral) under management, as well as another 160,000 SF of space currently under construction.
The Property. The Appling Farms Corporate Park Property consists of seven industrial flex buildings comprising 297,292 SF in a 22.98 acre site in Memphis, Tennessee that includes 531 total parking spaces (1.8 per 1,000 SF of gross building area). The Appling Farms Corporate Park Property was constructed by the borrower sponsor in phases between 2003 and 2015, with buildings ranging in size from 13,547 SF to 72,695 SF and clear heights ranging from 18 to 20 feet. Three buildings are single-tenant occupied, totaling 79,547 SF (26.8% of NRA), while the remaining four buildings are multi-tenant occupied. The Appling Farms Corporate Park Property is 97.0% leased to 23 tenants. The Appling Farms Corporate Park Property’s largest tenant is uLab Systems, a teledentistry company that manufactures orthodontic aligners. The tenant has been in place since 2020 and occupies the entirety of 7005 Appling Farms Parkway, which is its national headquarters and main manufacturing and distribution facility. Since its initial occupancy, the tenant has expanded twice, most recently in 2022, and now operates under three coterminous leases that are scheduled to expire in August 2027. No other tenant occupies more than 8.4% of NRA or 6.5% of underwritten rent.
| This is not a research report and was not prepared by any Underwriter’s research department. Please see additional important information and qualifications at the end of this Term Sheet. | ||
| 107 | ||
| Industrial – Flex | Loan #9 | Cut-off Date Balance: | $24,200,000 | |
| 6916, 6935, 6936, 6949, 6972, 6991 | Appling Farms Corporate Park | Cut-off Date LTV: | 55.8% | |
| and 7005 Appling Farms Parkway | UW NCF DSCR: | 1.51x | ||
| Memphis, TN 38133 | UW NOI Debt Yield: | 11.9% |
Major Tenants.
uLab Systems (50,000 SF, 16.8% of NRA, 19.8% of underwritten rent). uLab Systems is a teledentistry company that manufactures orthodontic aligners. The company, founded in 2015, provides software and scanning equipment to orthodontic practices, as well as manufacturing and shipping of the final products. The Appling Farms Corporate Park Property is the tenant’s national headquarters where it manufactures, packages and ships products throughout the United States. uLab Systems has been a tenant at the Appling Farms Corporate Park Property since 2020, operates under three coterminous leases that are scheduled to expire on August 31, 2027, and has one, 3-year renewal option remaining.
Acadian Ambulance Service (25,054 SF, 8.4% of NRA, 6.0% of underwritten rent). Acadian Ambulance Service is a private ambulance company that was founded in Louisiana in 1971. The company has since grown to a fleet of over 600 ground ambulances, helicopters and fixed-wing airplanes and operates throughout Louisiana, Texas, Tennessee and Mississippi. The company operates two locations in Tennessee, with the Appling Farms Corporate Park Property as its only base in the Memphis metropolitan statistical area. Acadian Ambulance Service has been a tenant at the Appling Farms Corporate Park Property since 2011, has a lease expiration of December 31, 2024, and has no renewal options remaining.
Trane Supply (25,041 SF, 8.4% of NRA, 6.5% of underwritten rent). Trane Supply is an HVAC manufacturer and service company that offers repairs and maintenance, energy services and solutions, contracting, controls and building automation and equipment rental. The company is a subsidiary of Trane Technologies. Trane Supply has been a tenant at the Appling Farms Corporate Park Property since 2021, has a lease expiration of December 31, 2028, and has no renewal options remaining.
The following table presents certain information relating to the leases at the Appling Farms Corporate Park Property:
| Tenant Summary(1) | |||||||||
| Tenant Name | Credit Rating (Fitch/ Moody’s/S&P)(2) | Tenant SF | Approx.% of SF | Annual UW Base Rent | Annual UW Base Rent PSF | % of Total Annual UW Base Rent | Lease Expiration | Renewal Option | Term. Option (Y/N) |
| uLab Systems | NR/NR/NR | 50,000 | 16.8% | $625,000 | $12.50 | 19.8% | 8/31/2027 | 1 x 3 yr | N |
| Acadian Ambulance Service | NR/NR/NR | 25,054 | 8.4% | $189,158 | $7.55 | 6.0% | 12/31/2024 | None | N |
| Trane Supply(3) | NR/NR/NR | 25,041 | 8.4% | $206,588 | $8.25 | 6.5% | 12/31/2028 | None | N |
| Rivian | NR/NR/NR | 16,000 | 5.4% | $175,400 | $10.96 | 5.5% | 11/30/2026 | 2 x 5 yr | N |
| Johnson Controls | NR/NR/NR | 14,500 | 4.9% | $174,000 | $12.00 | 5.5% | 10/31/2026 | 1 x 3 yr | N |
| Subtotal/Wtd. Avg. | 130,595 | 43.9% | $1,370,146 | $10.49 | 43.3% | ||||
| Other Tenants | 157,797 | 53.1% | $1,791,033 | $11.35 | 56.7% | ||||
| Vacant Space | 8,900 | 3.0% | $0 | $0.00 | 0.0% | ||||
| Total/Wtd. Avg. | 297,292 | 100.0% | $3,161,179 | $10.96(4) | 100.0% | ||||
| (1) | Information is based on the underwritten rent roll. |
| (2) | Ratings are those of the parent company whether or not the parent guarantees the lease. |
| (3) | Trane Supply includes 7,500 SF of expansion space. The borrower is expected to deliver the expansion space to the tenant by February 29, 2024. If the delivery conditions are not satisfied by such date, then the tenant may elect to terminate its lease of the expansion space and continue to lease only the original premises. |
| (4) | Total/Wtd. Avg Annual UW Base Rent PSF excludes vacant space. |
| This is not a research report and was not prepared by any Underwriter’s research department. Please see additional important information and qualifications at the end of this Term Sheet. | ||
| 108 | ||
| Industrial – Flex | Loan #9 | Cut-off Date Balance: | $24,200,000 | |
| 6916, 6935, 6936, 6949, 6972, 6991 | Appling Farms Corporate Park | Cut-off Date LTV: | 55.8% | |
| and 7005 Appling Farms Parkway | UW NCF DSCR: | 1.51x | ||
| Memphis, TN 38133 | UW NOI Debt Yield: | 11.9% |
The following table presents certain information relating to the lease rollover schedule at the Appling Farms Corporate Park Property:
| Lease Rollover Schedule(1) | |||||||||
| Year | # of Leases Rolling | SF Rolling | UW Base Rent PSF Rolling | Approx. % of Total SF Rolling | Approx. Cumulative % of SF Rolling | Total UW Base Rent Rolling | Approx. % of Total Rent Rolling | Approx. Cumulative % of Total Rent Rolling | |
| MTM | 0 | 0 | $0.00 | 0.0% | 0.0% | $0 | 0.0% | 0.0% | |
| 2024 | 3 | 41,325 | $9.00 | 13.9% | 13.9% | $371,876 | 11.8% | 11.8% | |
| 2025 | 1 | 13,547 | $11.85 | 4.6% | 18.5% | $160,532 | 5.1% | 16.8% | |
| 2026 | 3 | 35,850 | $11.50 | 12.1% | 30.5% | $412,263 | 13.0% | 29.9% | |
| 2027 | 6 | 97,487 | $11.80 | 32.8% | 63.3% | $1,150,643 | 36.4% | 66.3% | |
| 2028 | 4 | 51,088 | $9.74 | 17.2% | 80.5% | $497,639 | 15.7% | 82.0% | |
| 2029 | 3 | 30,000 | $11.29 | 10.1% | 90.6% | $338,563 | 10.7% | 92.7% | |
| 2030 | 3 | 19,095 | $12.03 | 6.4% | 97.0% | $229,664 | 7.3% | 100.0% | |
| 2031 | 0 | 0 | $0.00 | 0.0% | 97.0% | $0 | 0.0% | 100.0% | |
| 2032 | 0 | 0 | $0.00 | 0.0% | 97.0% | $0 | 0.0% | 100.0% | |
| 2033 | 0 | 0 | $0.00 | 0.0% | 97.0% | $0 | 0.0% | 100.0% | |
| 2034 | 0 | 0 | $0.00 | 0.0% | 97.0% | $0 | 0.0% | 100.0% | |
| 2035 & Beyond | 0 | 0 | $0.00 | 0.0% | 97.0% | $0 | 0.0% | 100.0% | |
| Vacant | 0 | 8,900 | $0.00 | 3.0% | 100.0% | $0 | 0.0% | 100.0% | |
| Total/Wtd. Avg. | 23 | 297,292 | $10.96 | (2) | 100.0% | $3,161,179 | 100.0% | ||
| (1) | Information is based on the underwritten rent roll. |
| (2) | Total/Wtd. Avg Annual UW Base Rent PSF Rolling excludes vacant space. |
The Market. The Appling Farms Corporate Park Property is located in Memphis, Tennessee within the Memphis TN-MS-AR Metropolitan Statistical Area, the Memphis market and the Northeast Memphis submarket. Memphis is a transportation hub, home to the second largest cargo airport in the world, the Memphis International Airport. The Memphis TN-MS-AR Metropolitan Statistical Area is the commercial and cultural hub of the Mid-South region of the United States. The area comprises eight counties in three states: Tennessee, Mississippi, and Arkansas. The city has the third largest rail center in the U.S. behind Chicago and St. Louis. The city is home to a number of Fortune 500 company headquarters, including FedEx, AutoZone and International Paper. According to the appraisal, as of the third quarter of 2023, the vacancy rate in the Memphis market was approximately 6.9%, with average asking rents of $4.69 PSF and inventory of approximately 327.5 million SF. According to the appraisal, as of the third quarter of 2023, the vacancy rate in the Northeast Memphis submarket was approximately 3.9%, with average asking rents of $8.73 PSF and inventory of approximately 16.5 million SF. According to the appraisal, the 2022 population within a one-, three- and five-mile radius of the Appling Farms Corporate Park Property was 5,578, 72,812 and 184,415, respectively. The 2022 average household income within the same radii was $59,940, $72,671 and $90,691, respectively.
The following table presents certain information relating to the appraisal’s market rent conclusions for the Appling Farms Corporate Park Property:
| Market Rent Summary | |||
| Category | Market Rent (PSF) | Lease Term (Yrs) | Rental Increase Projection |
| Flex Industrial | $12.00 | 5 | 3% per annum |
| 6972 Building | $8.25 | 5 | 3% per annum |
| Source: Appraisal. |
| This is not a research report and was not prepared by any Underwriter’s research department. Please see additional important information and qualifications at the end of this Term Sheet. | ||
| 109 | ||
| Industrial – Flex | Loan #9 | Cut-off Date Balance: | $24,200,000 | |
| 6916, 6935, 6936, 6949, 6972, 6991 | Appling Farms Corporate Park | Cut-off Date LTV: | 55.8% | |
| and 7005 Appling Farms Parkway | UW NCF DSCR: | 1.51x | ||
| Memphis, TN 38133 | UW NOI Debt Yield: | 11.9% |
The following table presents comparable industrial leases with respect to the Appling Farms Corporate Park Property:
| Comparable Industrial Lease Summary | |||||||
| Property Name/Location | Year Built | Total SF | Tenant Name | Lease SF | Lease Term (Mos.) | Rent PSF | Lease Type |
Appling Farms Corporate Park (1) Memphis, TN | 2003-2015 | 297,292 | uLab Systems | 50,000 | 73 | $12.50 | NNN |
Shelby Oaks 1662 North Shelby Oaks Drive Memphis, TN | 1979 | 13,125 | Crosslink Memphis, Inc. | 3,750 | 60 | $9.50 | NNN |
Shelby Oaks Distribution Center 1710 Shelby Oaks Drive North Memphis, TN | 1983 | 82,500 | AnovoRX | 22,500 | 60 | $8.00 | NNN |
Flex Building 6419 Shelby View Drive Memphis, TN | 1999 | 145,650 | Confidential | 20,000 | 55 | $7.00 | NNN |
Flex Building 3215 Appling Road Bartlett, TN | 1984 | 47,415 | Confidential | 15,506 | 36 | $10.30 | NNN |
Trinity Ridge Business Center B 7730 Trinity Road Memphis, TN | 2000 | 35,100 | Securitas Electronic Security | 4,830 | 62 | $14.86 | NNN |
Century Center Building D 1680 Century Center Memphis, TN | 1995 | 77,925 | Confidential | 4,051 | 85 | $12.50 | NNN |
Source: Appraisal, unless otherwise noted.
| (1) | Information is based on the underwritten rent roll. |
Operating History and Underwritten Net Cash Flow. The following table presents certain information relating to the historical operating performance and Underwritten Net Cash Flow at the Appling Farms Corporate Park Property:
| Cash Flow Analysis(1) | ||||||||
| 2020 | 2021 | 2022 | 9/30/2023 9 Months Ann. |
| UW | UW PSF | ||
| Gross Potential Rent(2)(3) | $1,632,107 | $1,881,630 | $2,298,170 | $2,836,002 | $3,267,979 | $10.99 | ||
| Reimbursement | $387,978 | $443,963 | $613,328 | $757,032 | $833,016 | $2.80 | ||
| Other Income | $6,463 | $33,700 | $0 | $726 | $0 | $0.00 | ||
| Less Vacancy & Credit Loss | $0 | $0 | $0 | $0 |
| ($205,050) |
| ($0.69) |
| Effective Gross Income | $2,026,548 | $2,359,293 | $2,911,499 | $3,593,761 | $3,895,946 | $13.10 | ||
| Real Estate Taxes | $473,302 | $433,534 | $428,510 | $457,153 | $457,153 | $1.54 | ||
| Insurance | $61,400 | $61,400 | $63,415 | $62,896 | $60,297 | $0.20 | ||
| Other Operating Expenses | $385,390 | $446,858 | $508,402 | $508,142 |
| $492,277 |
| $1.66 |
| Total Operating Expenses | $920,092 | $941,792 | $1,000,326 | $1,028,191 | $1,009,727 | $3.40 | ||
| Net Operating Income(3) | $1,106,457 | $1,417,501 | $1,911,172 | $2,565,570 | $2,886,218 | $9.71 | ||
| Capital Expenditures | $0 | $0 | $0 | $0 | $44,594 | $0.15 | ||
| TI/LC | $0 | $0 | $0 | $0 |
| $224,878 |
| $0.76 |
| Net Cash Flow | $1,106,457 | $1,417,501 | $1,911,172 | $2,565,570 | $2,616,746 | $8.80 | ||
| Occupancy % | 59.5% | 64.1% | 85.2% | 97.0% | (4) | 95.0% | (5) | |
| NOI DSCR | 0.64x | 0.82x | 1.10x | 1.48x | 1.67x | |||
| NCF DSCR | 0.64x | 0.82x | 1.10x | 1.48x | 1.51x | |||
| NOI Debt Yield | 4.6% | 5.9% | 7.9% | 10.6% | 11.9% | |||
| NCF Debt Yield | 4.6% | 5.9% | 7.9% | 10.6% | 10.8% | |||
| (1) | 2020 through 2022 cash flows include only six of the seven collateral buildings. The Rivian building (building 6936) was previously owned by a different entity that also included operations from other properties that are not part of the collateral. Separate financial information for the Rivian building was not available until January 2023. |
| (2) | UW Gross Potential Rent is based on the rent roll as of October 1, 2023 and includes rent steps of $65,679 through December 2024. |
| (3) | The increase in Gross Potential Rent from 9/30/2023 9 Months Ann. to UW is primarily due to (i) rent steps of $65,679, (ii) gross up of vacant space ($106,800) and (iii) new tenants at the Appling Farms Corporate Park Property ($88,051). The increase in Net Operating Income from 9/30/2023 9 Months Ann. to UW is primarily due to (i) rent steps of $65,679 and (ii) new tenants at the Appling Farms Corporate Park Property ($88,051). |
| (4) | 9/30/2023 9 Months Ann. Occupancy % is based on the underwritten rent roll as of October 1, 2023. |
| (5) | UW Occupancy % represents economic occupancy. |
| This is not a research report and was not prepared by any Underwriter’s research department. Please see additional important information and qualifications at the end of this Term Sheet. | ||
| 110 | ||
| Industrial – Flex | Loan #9 | Cut-off Date Balance: | $24,200,000 | |
| 6916, 6935, 6936, 6949, 6972, 6991 | Appling Farms Corporate Park | Cut-off Date LTV: | 55.8% | |
| and 7005 Appling Farms Parkway | UW NCF DSCR: | 1.51x | ||
| Memphis, TN 38133 | UW NOI Debt Yield: | 11.9% |
Escrows and Reserves.
Real Estate Taxes - The borrower made an upfront deposit of $39,236 into a reserve for real estate taxes and the Appling Farms Corporate Park Mortgage Loan documents provide for ongoing monthly deposits into such reserve in an amount equal to 1/12th of the real estate taxes that the lender estimates will be payable during the next twelve months (initially $39,236).
Insurance –The Appling Farms Corporate Park Mortgage Loan documents provide for ongoing monthly deposits into a reserve for insurance premiums in an amount equal to 1/12th of the insurance premiums that the lender estimates will be payable for the renewal of coverage upon the expiration of the insurance policies. Notwithstanding the foregoing, the borrower is not required to make monthly deposits into a reserve for insurance premiums for the Appling Farms Corporate Park Property so long as (i) no event of default under the Appling Farms Corporate Park Mortgage Loan documents has occurred and is continuing, (ii) the borrower provides reasonably satisfactory evidence that all insurance coverage required under the Appling Farms Corporate Park Mortgage Loan documents are being maintained through one or more blanket policies meeting the requirements of such loan documents, and (iii) the borrower provides the lender with paid receipts for the related insurance premiums no later than 20 days prior to the expiration dates of the policies.
Deferred Maintenance Reserve – The Appling Farms Corporate Park Mortgage Loan documents provide for an upfront deposit of $1,438 for deferred maintenance.
Replacement Reserve – The Appling Farms Corporate Park Mortgage Loan documents provide for ongoing monthly deposits of approximately $3,716 into a reserve for future capital expenditures.
Rollover Reserve – The Appling Farms Corporate Park Mortgage Loan documents provide for ongoing monthly deposits of approximately $24,774 into a reserve for future tenant improvement and/or leasing commission expenses; provided that such deposits will not be required at any time that the amount in such reserve is at least $594,584.
Outstanding TI Reserves – The Appling Farms Corporate Park Mortgage Loan documents provide for an upfront deposit of (i) $105,000 into a reserve for tenant improvements for the tenant Pathway Precision Manufacturing, (ii) $150,000 into a reserve for tenant improvements for the tenant US Med-Equip, (iii) $20,000 into a reserve for tenant improvements for the tenant Trane Supply, and (iv) $20,000 into a reserve for tenant improvements for the tenant Kaeser Compressors Inc.
Outstanding Free Rent Reserves – The Appling Farms Corporate Park Mortgage Loan documents provide for an upfront deposit of (i) $16,428 into a reserve for free rent for the tenant Pathway Precision Manufacturing, (ii) $16,617 into a reserve for free rent for the tenant US Med-Equip, and (iii) $6,970 into a reserve for free rent for the tenant Trane Supply.
Lockbox and Cash Management. The Appling Farms Corporate Park Mortgage Loan is structured with a springing lockbox and springing cash management. Upon the first occurrence of a Cash Sweep Period (as defined below), the borrower is required to enter into a deposit account control agreement with the lender and the lockbox bank, to establish and maintain a lockbox account for the benefit of the lender, to direct all tenants to send all payments of rents at the Appling Farms Corporate Park Property directly into the lockbox account, and to deposit any rents received by the borrower or property manager into the lockbox account within one business day of receipt. In addition, upon the first occurrence of a Cash Sweep Period, the lender has the right to establish a lender-controlled cash management account, and during a Cash Sweep Period, all funds in the lockbox account are required to be swept to such cash management account, and, provided no event of default is continuing, applied on each monthly payment date: (i) to make the monthly deposits into the real estate tax reserve and insurance reserve, if any, as described above under “Escrows and Reserves,” (ii) to pay debt service on the Appling Farms Corporate Park Mortgage Loan, (iii) to make the monthly deposits into the replacement reserve and rollover reserve, if any, as described above under “Escrows and Reserves,” (iv) if a Cash Sweep Period is continuing, to pay operating expenses set forth in the borrower’s annual budget, and (v) to deposit any remainder into an excess cash flow reserve to be held as additional security for the Appling Farms Corporate Park Mortgage Loan during such Cash Sweep Period.
A “Cash Sweep Period” will commence upon:
| a) | the occurrence of an event of default and will continue until the cure of the event of default to the lender’s sole satisfaction; or |
| b) | the debt service coverage ratio (based on the trailing twelve months operating statement and current in-place rent roll) as of the end of any calendar quarter falls below 1.10x and will continue until such time as the debt service coverage ratio (on the same basis) has been at least 1.10x for two consecutive calendar quarters; or |
| c) | the occurrence of a Tenant Credit Event (as defined below) and will continue until a Tenant Credit Cure Event (as defined below) occurs. |
"Tenant Credit Event" means the date on which any of the following events occur: (a) the earlier to occur of (y) the date that is six months prior to the expiration of any of the Tenant Credit Leases (as defined below) and (z) the first date of the tenant’s notice period in any of the Tenant Credit Leases, in either case if the tenant has not previously renewed or extended the applicable lease(s) on Approved Lease Terms (as defined below) (and no replacement tenant(s) has entered into a replacement lease(s), as applicable, on Approved Lease Terms) (a "Lease Expiration Event"), (b) the tenant under a Tenant Credit Lease "goes dark" or vacates any of its space or gives notice of its intent to "go dark" or vacate any of its space, (c) the tenant under a Tenant Credit Lease files (or gives notice of its intent to file) a voluntary bankruptcy or insolvency petition or is the subject of an involuntary bankruptcy or insolvency petition, or (d) the tenant exercises any early termination option (if applicable) under any of the Credit Tenant Leases.
"Tenant Credit Cure Event" means either: (a) if the Cash Sweep Period was triggered by a Lease Expiration Event, either (I) the tenant renews or extends the applicable Tenant Credit Lease(s) on Approved Lease Terms, or (II) tenant and/or a replacement tenant(s) has entered into a replacement lease(s) on Approved Lease Terms either (y) for the full subject space (all three spaces leased as of the origination date under the Tenant Credit Leases) or (z) for any two of the three spaces leased as of the origination date by the tenant under the Tenant Credit Leases, and in either instance, the borrower provides evidence satisfactory to the lender that the debt service coverage ratio for the Appling Farms Corporate Park Property is at least 1.10x; (b) if the Cash Sweep Period was triggered by the tenant under a Tenant Credit Lease "going dark" or vacating any of its space, either (I) the tenant is in occupancy of all of its applicable spaces, open and operating its business therein and paying full unabated rent, and all of its Tenant Credit Leases are in full force and effect (and not terminated), or (II) a replacement tenant(s) has entered into a replacement lease(s) on Approved Lease Terms either (y) for the full subject space (all three spaces leased as of the origination date under the Tenant Credit Leases) or (z) for any two of the three subject spaces
| This is not a research report and was not prepared by any Underwriter’s research department. Please see additional important information and qualifications at the end of this Term Sheet. | ||
| 111 | ||
| Industrial – Flex | Loan #9 | Cut-off Date Balance: | $24,200,000 | |
| 6916, 6935, 6936, 6949, 6972, 6991 | Appling Farms Corporate Park | Cut-off Date LTV: | 55.8% | |
| and 7005 Appling Farms Parkway | UW NCF DSCR: | 1.51x | ||
| Memphis, TN 38133 | UW NOI Debt Yield: | 11.9% |
leased as of the origination date by the tenant under the Tenant Credit Leases, and in either instance, the borrower provides evidence satisfactory to the lender that the debt service coverage ratio for the Appling Farms Corporate Park Property is at least 1.10x, (c) in the event of a bankruptcy or insolvency event, either (I) all of the Tenant Credit Leases have been reaffirmed on Approved Lease Terms, or (II) a replacement tenant(s) has entered into a replacement lease(s) on Approved Lease Terms either (y) for the full subject space (all three spaces leased as of the origination date under the Tenant Credit Leases) or (z) for any two of the three spaces leased as of the origination date under the Tenant Credit Leases, and in either instance, the borrower provides evidence satisfactory to the lender that the debt service coverage ratio for the Appling Farms Corporate Park Property is at least 1.10x, (d) if the Cash Sweep Period was triggered by a tenant under a Tenant Credit Lease giving notice of its intent to "go dark", vacate any of its space, or file a voluntary bankruptcy or insolvency petition by a specified date, such tenant has not "gone dark", vacated any of its space or filed a voluntary bankruptcy or insolvency petition, as applicable, on or prior to the date that is 30 days after the date specified in such notice, or (e) if the Cash Sweep Period was triggered by the tenant exercising any early termination option (if applicable) under any of its Credit Tenant Lease(s), the tenant withdraws in writing its exercise of an early termination option and such withdrawal is expressly permitted under the terms of the applicable lease(s) or otherwise accepted by the borrower.
"Tenant Credit Lease" means any lease with uLabs Systems pursuant to which such tenant occupies any portion of the Appling Farms Corporate Park Property, or any lease with any tenant that replaces any of the same.
"Approved Lease Terms" means that (i) a lease (or lease renewal of a Tenant Credit Lease) has been entered into after having been given prior written approval by the lender; (ii) the tenant (if other than the existing tenant) has been approved by the lender; (iii) the tenant has taken (or in the case of the existing tenant, is continuing) occupancy of all of the applicable space and the tenant is open and operating its business therein; (iv) the tenant is paying full unabated base monthly rent; and (v) the borrower has delivered to the lender an estoppel from such tenant confirming items (iii) and (iv) above.
Subordinate Debt. None.
Mezzanine Loan and Preferred Equity. Not permitted.
Release of Property. Not permitted.
Ground Lease. None.
Right of First Offer/Right of First Refusal. The tenant Collisionworx, which leases a full building at the Appling Farms Corporate Park Property located at 6916 Appling Farms Parkway, has under its lease “the option to purchase the premises at a purchase price of $2,400,000, subject to a contingency of the existing lender releasing the property.” The tenant entered into a subordination, non-disturbance and attornment agreement with the lender pursuant to which (i) the tenant agreed that if it exercises such purchase option, title will not be conveyed to the tenant until such time as all obligations secured by the deed of trust with respect to the Appling Farms Corporate Park Mortgage Loan have been fully satisfied, or if the loan documents so provide, the Appling Farms Corporate Park Mortgage Loan is fully defeased and (ii) the tenant acknowledged that nothing in such agreement will be construed to waive or modify the prepayment restrictions in the Appling Farms Corporate Park Mortgage Loan documents.
Letter of Credit. None.
Terrorism Insurance. The Appling Farms Corporate Park Mortgage Loan documents require that the “all risk” insurance policy required to be maintained by the borrower provide coverage for terrorism in an amount not less than 100% of the full replacement cost of the Appling Farms Corporate Park Property. The Appling Farms Corporate Park Mortgage Loan documents also require business income/loss of rents insurance for a period of no less than the 18-month period commencing at the time of loss, together with a six month extended period of indemnity. Notwithstanding the foregoing, for so long as the Terrorism Risk Insurance Act of 2002, as extended and modified by the Terrorism Risk Insurance Program Reauthorization Act of 2015 (“TRIPRA”), is in effect (including any extensions thereof or if another federal governmental program is in effect relating to “acts of terrorism” which provides substantially similar protections as TRIPRA) and covers both domestic and foreign acts of terrorism, the lender is required to accept terrorism insurance which insures against “covered acts” as defined by TRIPRA (or such other program). See “Risk Factors—Risks Relating to the Mortgage Loans—Terrorism Insurance May Not Be Available for All Mortgaged Properties” in the prospectus.
| This is not a research report and was not prepared by any Underwriter’s research department. Please see additional important information and qualifications at the end of this Term Sheet. | ||
| 112 | ||
| Mixed Use – Event Space/Office | Loan #10 | Cut-off Date Balance: | $23,750,000 | |
| 1356 Broadway | The Haier Building | Cut-off Date LTV: | 55.2% | |
| New York, NY 10018 | UW NCF DSCR: | 1.47x | ||
| UW NOI Debt Yield: | 11.6% |

| This is not a research report and was not prepared by any Underwriter’s research department. Please see additional important information and qualifications at the end of this Term Sheet. | ||
| 113 | ||
| Mixed Use – Event Space/Office | Loan #10 | Cut-off Date Balance: | $23,750,000 | |
| 1356 Broadway | The Haier Building | Cut-off Date LTV: | 55.2% | |
| New York, NY 10018 | UW NCF DSCR: | 1.47x | ||
| UW NOI Debt Yield: | 11.6% |
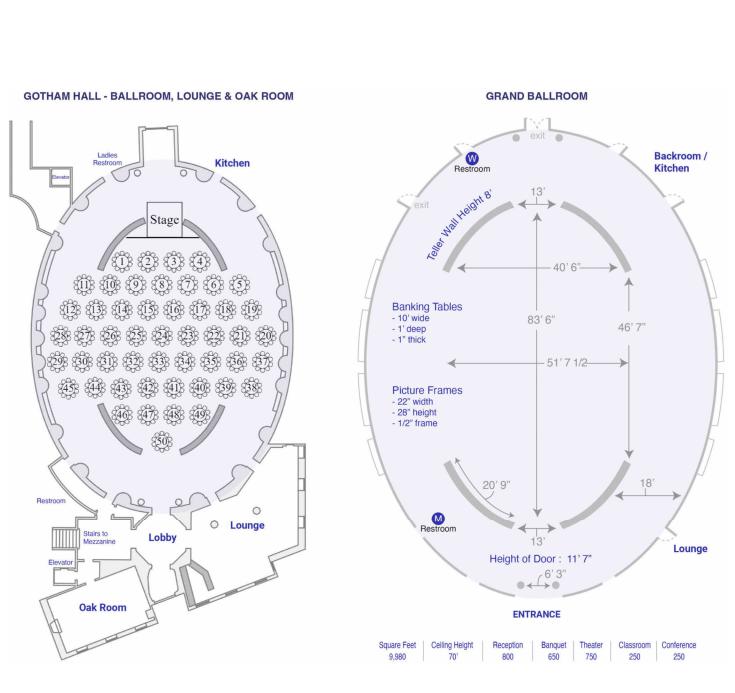
| This is not a research report and was not prepared by any Underwriter’s research department. Please see additional important information and qualifications at the end of this Term Sheet. | ||
| 114 | ||
| Mixed Use – Event Space/Office | Loan #10 | Cut-off Date Balance: | $23,750,000 | |
| 1356 Broadway | The Haier Building | Cut-off Date LTV: | 55.2% | |
| New York, NY 10018 | UW NCF DSCR: | 1.47x | ||
| UW NOI Debt Yield: | 11.6% |
| This is not a research report and was not prepared by any Underwriter’s research department. Please see additional important information and qualifications at the end of this Term Sheet. | ||
| 115 | ||
| Mortgage Loan No. 10 – The Haier Building |
| Mortgage Loan Information | Property Information | ||||||
| Mortgage Loan Seller: | BANA | Single Asset/Portfolio: | Single Asset | ||||
| Credit Assessment (Moody’s/Fitch/KBRA): | NR/NR/NR | Location: | New York, NY 10018 | ||||
| Original Balance: | $23,750,000 | General Property Type: | Mixed Use | ||||
| Cut-off Date Balance: | $23,750,000 | Detailed Property Type: | Event Space/Office | ||||
| % of Initial Pool Balance: | 4.6% | Title Vesting: | Fee | ||||
| Loan Purpose: | Refinance | Year Built/Renovated: | 1924/2015 | ||||
| Borrower Sponsors: | Jack Dushey and Michael Jemal | Size: | 58,500 SF | ||||
| Guarantors: | Jack Dushey and Michael Jemal | Cut-off Date Balance PSF: | $406 | ||||
| Mortgage Rate: | 7.6100% | Maturity Date Balance PSF: | $406 | ||||
| Note Date: | 12/20/2023 | Property Manager: | Jenel Management Corp. | ||||
| First Payment Date: | 2/1/2024 | (borrower-related) | |||||
| Maturity Date: | 1/1/2029 | ||||||
| Original Term to Maturity: | 60 months | ||||||
| Original Amortization Term: | 0 months | ||||||
| IO Period: | 60 months | Underwriting and Financial Information | |||||
| Seasoning: | 1 month | UW NOI: | $2,761,254 | ||||
| Prepayment Provisions: | L(25),D(28),O(7) | UW NOI Debt Yield: | 11.6% | ||||
| Lockbox/Cash Mgmt Status: | Hard/Springing | UW NOI Debt Yield at Maturity: | 11.6% | ||||
| Additional Debt Type: | No | UW NCF DSCR: | 1.47x | ||||
| Additional Debt Balance: | NAP | Most Recent NOI: | $2,322,406 (9/30/2023 TTM) | ||||
| Future Debt Permitted (Type): | No (NAP) | 2nd Most Recent NOI: | $2,438,869 (12/31/2022) | ||||
| Reserves(1) | 3rd Most Recent NOI: | $3,096,874 (12/31/2021) | |||||
| Type | Initial | Monthly | Cap | Most Recent Occupancy: | 100.0% (12/15/2023) | ||
| RE Taxes: | $265,694 | $132,847 | NAP | 2nd Most Recent Occupancy: | 100.0% (12/31/2022) | ||
| Insurance: | $0 | Springing | NAP | 3rd Most Recent Occupancy: | 100.0% (12/31/2021) | ||
| Deferred Maintenance: | $63,750 | $0 | NAP | Appraised Value (as of): | $43,000,000 (12/4/2023) | ||
| Replacement Reserve: | $42,000 | $1,323 | NAP | Appraised Value PSF: | $735 | ||
| TI/LC Reserve: | $0 | $4,875 | $117,000 | Cut-off Date LTV Ratio: | 55.2% | ||
| Free Rent Reserve: | $40,000 | $0 | NAP | Maturity Date LTV Ratio: | 55.2% | ||
| Sources and Uses | ||||||
| Sources | Proceeds | % of Total | Uses | Proceeds | % of Total | |
| Mortgage Loan Amount: | $23,750,000 | 99.8% | Loan Payoff: | $23,097,001 | 97.1% | |
| Borrower Sponsor Equity: | $40,076 | 0.2% | Reserves: | $411,444 | 1.7% | |
| Closing Costs: | $281,631 | 1.2% | ||||
| Total Sources: | $23,790,076 | 100.0% | Total Uses: | $23,790,076 | 100.0% | |
| (1) | See “Escrows and Reserves” below for further discussion of reserve information. |
The Mortgage Loan. The tenth largest mortgage loan (“The Haier Building Mortgage Loan”) is evidenced by a single promissory note in the original principal amount of $23,750,000 and secured by a first priority fee mortgage encumbering a 58,500 SF mixed use property located in New York, New York (“The Haier Building Property”).
The Borrower and the Borrower Sponsors. The borrower is Haier America Building, LLC, a Delaware limited liability company and single purpose entity with one independent director. The borrower sponsors and non-recourse carveout guarantors are Jack Dushey and Michael Jemal.
Jack Dushey and Michael Jemal acquired The Haier Building Property in 2001 and have managed it through Jack Dushey’s management company, Jenel Management Corp., for the past 22 years. Jenel Management Corp. is a private real estate investment group based in New York City. The company owns and manages over ninety properties, totaling more than 3 million SF, which include urban high-street retail, hotel, and other mixed-use properties. The portfolio currently has assets under management of approximately $2 billion. Michael Jemal was the former Chairman, President, and CEO of Haier America. Mr. Jemal established Haier America in 1999 as the sales and marketing arm of the Western Hemisphere for the global home appliance company. Michael Jemal left Haier America and founded W Appliance Company in 2012, the first branch of what would become Equity Brands. Mr. Jemal continues to serve as Equity Brands’ President and CEO. Michael Jemal is also an active real estate investor with ownership interest in a portfolio of 30 properties. Mr. Jemal’s ownership interest in the properties holds a current value of approximately $79 million.
The Property. The Haier Building Property is a 7-story (including below ground basement), mixed use building located on the entire northern block of West 36th Street between Broadway and 6th Avenue in Midtown Manhattan. The Haier Building Property was developed in 1924 and most recently renovated in 2015. The steel frame building was designed in a classical revival style with Corinthian-style columns atop rusticated stone blocks, limestone façade, and ten-foot brass doors. New York City Landmarks Preservation Commission designated the building’s exterior and ground floor as designated landmarks in 1992. Additionally, the building was added to the National Register of Historic Places in 2005. The Haier Building Property contains 58,500 SF of net rentable area and is 100.0% leased to two tenants: Gotham Hall LLC (dba Gotham Hall) (“Gotham Hall”) and W Appliance Company, Michael
| This is not a research report and was not prepared by any Underwriter’s research department. Please see additional important information and qualifications at the end of this Term Sheet. | ||
| 116 | ||
| Mixed Use – Event Space/Office | Loan #10 | Cut-off Date Balance: | $23,750,000 | |
| 1356 Broadway | The Haier Building | Cut-off Date LTV: | 55.2% | |
| New York, NY 10018 | UW NCF DSCR: | 1.47x | ||
| UW NOI Debt Yield: | 11.6% |
Jemal (dba Equity Brands) (“Equity Brands”). Gotham Hall leases the lower level through the fifth floor and operates its space as a luxury event venue. Equity Brands leases the entire 6th floor and utilizes its space as showroom and office space.
The Haier Building Property served as Greenwich Savings Bank (and its successors’) headquarters from 1924 until 2001. In 2002, after The Haier Building Property was acquired by the Haier Group Corporation and borrower sponsors, Haier America Trading took occupancy leasing 53% of the total NRA as its US headquarters. The remaining prior bank space and lower-level floors (47% of total NRA) were repurposed into event space and leased to Gotham Hall. In 2014, Gotham Hall took over the majority of Haier America Trading’s space expanding to 47,000 SF (80.3% of total NRA) and the remaining 11,500 SF (19.7% of total NRA) was leased to Equity Brands, an affiliate of the borrower sponsor.
Major Tenants.
Gotham Hall LLC (dba Gotham Hall) (47,000 SF, 80.3% of NRA, 86.2% of underwritten base rent): Gotham Hall is a luxury event venue that hosts a wide variety of events including fundraising galas, concerts, television and film production, celebrity hosted balls, corporate events, concerts, fashion shows, and weddings. Gotham Hall occupies a total of 47,000 SF of NRA across the ground floor, basement, and upper mezzanine levels. The primary entrance to Gotham Hall is on Broadway with double brass doors leading to the ground floor which holds the 9,980 SF grand ballroom with 70-foot ceiling heights, marble flooring, floor-to-ceiling columns, and a 3,000 SF stained-glass skylight. The ground floor also includes several smaller event spaces which are used for VIP areas, registration, catering, and bridal suites. Additional event space is found on the balcony and two mezzanine levels which overlook the ballroom. Gotham Hall also leases the basement level which is home to several dressing and meeting rooms used for bridal parties, event planners, and supporting staff and also includes a prep kitchen and storage areas.
Gotham Hall originally took occupancy in 2002, renewed in 2013 and expanded and extended its lease in 2014. In January 2022, Gotham Hall extended its lease early through January 2040, adding an additional 7 years of lease term. Annual base rent is currently $69.31 PSF and increases to $71.31 PSF in January 2024 and $73.37 PSF in January 2025, with fixed annual increases of $50,000 beginning in January 2029 through December 31, 2032. From 2033 through 2040, such tenant pays an annual fixed rent of $85.11 PSF. The lease has no renewal options and no early termination options. Gotham Hall has invested approximately $4 million into their space over the years for improvements including new HVAC systems, lighting, sound, bathroom and elevator upgrades, and buildout of the basement.
W Appliance Company, Michael Jemal (dba Equity Brands) (11,500 SF, 19.7% of NRA, 13.8% of underwritten base rent): W Appliance Company is a subsidiary of Equity Brands, which was founded in 2012 by Michael Jemal, one of the borrower sponsors and guarantors for The Haier Building Mortgage Loan. Equity Brands is a designer and developer of merchandising for licensed brands such as Betty Crocker, Black + Decker, got milk?, and Pioneer Woman. Equity Brands offers these heritage brands end-to-end solutions including merchandising design, development, marketing, photography, graphic design, and advertising. Additionally, Equity Brands develops in-house private label brands for manufactured consumer goods including ANY (air conditioners), Commercial Chef (cookware), Commercial Care (irons), and Comfty (office chairs), among others.
Equity Brands is headquartered at The Haier Building Property and occupies the entirety of the building’s 6th floor, which is improved with both standard office and showroom space and accessible via a private entrance on 6th Avenue. Equity Brands originally took occupancy in 2014 and recently executed a new 10-year lease in December 2023, which expires on December 31, 2033. Annual base rent is currently $48.00 PSF and increases to $52.80 PSF in January 2029. The lease has no renewal options and no early termination options. Michael Jemal is an additional named tenant under the lease, and he is individually liable for the lease obligations. As of September 30, 2023, Equity Brands had net sales of $102 million and earnings of $6.7 million.
The following table presents certain information relating to the tenancy at The Haier Building Property:
| Tenant Summary(1) | |||||||||||
| Tenant Name | Credit Rating (Fitch/Moody’s/S&P) | Tenant SF | Approx. % of SF | Annual UW Rent | % of Total Annual UW Rent | Annual UW Rent PSF | Lease Expiration | Renewal Options | Term. Option (Y/N) | ||
| Gotham Hall | NR/NR/NR | 47,000 | 80.3% | $3,448,291 | 86.2 | % | $73.37 | 1/31/2040 | None | N | |
| Equity Brands | NR/NR/NR | 11,500 | 19.7% | $552,000 |
| 13.8 | % | $48.00 | 12/31/2033 | None | N |
| Subtotal/Wtd. Avg. | 58,500 | 100.0% | $4,000,291 | 100.0 | % | $68.38 | |||||
| Vacant Space | 0 | 0.0% | $0 |
| 0.0% |
| $0.00 | ||||
| Total/Wtd. Avg. | 58,500 | 100.0% | $4,000,291 | 100.0% | $68.38 | ||||||
| (1) | Information is based on the underwritten rent roll dated December 15, 2023 and is inclusive of rent steps through January 2025. |
| This is not a research report and was not prepared by any Underwriter’s research department. Please see additional important information and qualifications at the end of this Term Sheet. | ||
| 117 | ||
| Mixed Use – Event Space/Office | Loan #10 | Cut-off Date Balance: | $23,750,000 | |
| 1356 Broadway | The Haier Building | Cut-off Date LTV: | 55.2% | |
| New York, NY 10018 | UW NCF DSCR: | 1.47x | ||
| UW NOI Debt Yield: | 11.6% |
The following table presents certain information relating to the lease rollover schedule at The Haier Building Property:
| Lease Rollover Schedule(1) | ||||||||
| Year | # of Leases Rolling | SF Rolling | UW Rent PSF Rolling | Approx. % of Total SF Rolling | Approx. Cumulative % of Total SF Rolling | Total UW Rent Rolling | Approx. % of Rent Rolling | Approx. Cumulative % of UW Rent Rolling |
| MTM / 2024 | 0 | 0 | $0.00 | 0.0% | 0.0% | $0 | 0.0% | 0.0% |
| 2025 | 0 | 0 | $0.00 | 0.0% | 0.0% | $0 | 0.0% | 0.0% |
| 2026 | 0 | 0 | $0.00 | 0.0% | 0.0% | $0 | 0.0% | 0.0% |
| 2027 | 0 | 0 | $0.00 | 0.0% | 0.0% | $0 | 0.0% | 0.0% |
| 2028 | 0 | 0 | $0.00 | 0.0% | 0.0% | $0 | 0.0% | 0.0% |
| 2029 | 0 | 0 | $0.00 | 0.0% | 0.0% | $0 | 0.0% | 0.0% |
| 2030 | 0 | 0 | $0.00 | 0.0% | 0.0% | $0 | 0.0% | 0.0% |
| 2031 | 0 | 0 | $0.00 | 0.0% | 0.0% | $0 | 0.0% | 0.0% |
| 2032 | 0 | 0 | $0.00 | 0.0% | 0.0% | $0 | 0.0% | 0.0% |
| 2033 | 1 | 11,500 | $48.00 | 19.7% | 19.7% | $552,000 | 13.8% | 13.8% |
| 2034 | 0 | 0 | $0.00 | 0.0% | 19.7% | $0 | 0.0% | 13.8% |
| 2035 & Beyond | 1 | 47,000 | $73.37 | 80.3% | 100.0% | $3,448,291 | 86.2% | 100.0% |
| Vacant | 0 | 0 | $0.00 | 0.0% | 100.0% | $0 | 0.0% | 100.0% |
| Total/Wtd. Avg. | 2 | 58,500 | $68.38 | 100.0% | $4,000,291 | 100.0% | ||
| (1) | Information is based on the underwritten rent roll dated December 15, 2023 and is inclusive of rent steps through January 2025. |
The Market. The Haier Building Property is located on West 36th Street between Broadway and Sixth Avenue in the Midtown Manhattan market and the Time Square South submarket. The Haier Building Property has access to public transportation with The Port Authority Bus Terminal, Penn Station, and Grand Central Terminal, all within walking distance. Nearby subway stops include access to the 1, 2 and 3 trains at 34th Street-Penn Station and access to the F, B, D, M, N, Q, R, and W trains at 34th Street-Herald Square. The Haier Building Property is situated in close proximity to both the LIRR and NJ Transit at Penn Station. Nearby transportation also includes the Times Square Subway Station and MTA Buses. The Times Square/42nd Street/Eighth Avenue interlinked subway stations offer access to 12 different subway lines (A, C, E, N, Q, R, W, 1, 2, 3, 7 and Shuttle to Grand Central Terminal). The Haier Building Property is also situated in close proximity to Herald Square, Madison Square Garden, Hulu Theatre and the Empire State Building.
According to the appraisal, there are several similar Manhattan properties with former banking buildings converted to event space including National City Bank Building at 55 Wall Street, the former Bowery Building at 110 East 42nd Street, and the former Bowery Savings Bank at 130 Bowery. All three are single tenant properties with the tenants responsible for all ongoing expenses which are not reimbursed but paid directly. The single tenant leases above ranged from $43.51 PSF to $133.00 PSF and average $81.50 PSF as compared to Gotham Hall’s current base rent of $69.31 PSF. The appraisal also utilized six comparable office leases in the immediate area which range in size from 3,673 SF to 30,002 SF. The competitive office properties have adjusted rents ranging from $43.84 PSF to $53.06 PSF. The appraisal concluded a market rent of $48.00 PSF, in-line with Equity Brand’s current base rent of $48.00 PSF.
According to the appraisal, the 2022 population within a 1-, 3- and 5-mile radius of The Haier Building Property was 207,889, 1,307,729 and 2,716,991, respectively. The 2022 average household income within the same radii was $186,177, $178,072 and $150,586, respectively.
The table below presents certain information relating to comparable banquet/catering facilities pertaining to The Haier Building Property:
| Summary of Comparable Banquet/Catering Properties(1) | |||
| Name and Location | Ballroom Size (SF) | Reception (Capacity) | Banquet (Capacity) |
| Gotham Hall | 9,980 | 950 | 575 |
| Cipriani 42nd Street | 12,000 | 1,800 | 850 |
| Cipriani Wall Street | 13,275 | 2,000 | 900 |
| The Pierre at 2 East 61st Street | 7,508 | 1,500 | 800 |
| Plaza Hotel at 768 5th Avenue | 4,800 | 600 | 500 |
| Capitale at 130 Bowery | 15,000 | 1,500 | 700 |
| Mandarin Oriental Hotel at 80 Columbus Circle | 6,000 | 750 | 550 |
| Pier Sixty at 60 Chelsea Piers | 20,000 | 2,000 | 1,200 |
| Ziegfeld Ballroom at 141 West 54th Street | 9,000 | 1,300 | 900 |
| (1) | Information is based on data provided by the website of each comparable property. |
| This is not a research report and was not prepared by any Underwriter’s research department. Please see additional important information and qualifications at the end of this Term Sheet. | ||
| 118 | ||
| Mixed Use – Event Space/Office | Loan #10 | Cut-off Date Balance: | $23,750,000 | |
| 1356 Broadway | The Haier Building | Cut-off Date LTV: | 55.2% | |
| New York, NY 10018 | UW NCF DSCR: | 1.47x | ||
| UW NOI Debt Yield: | 11.6% |
Operating History and Underwritten Net Cash Flow. The following table presents certain information relating to the historical operating performance and Underwritten Net Cash Flow at The Haier Building Property:
| Cash Flow Analysis | |||||||||
| 2019 |
2020 | 2021 | 2022 | 9/30/2023 TTM |
UW |
| UW PSF | ||
| Gross Potential Rent(1) | $3,080,071 | $3,320,000 | $3,407,688 | $3,441,467 | $3,448,504 | $4,000,291 | $68.38 | ||
| Expense Reimbursements(2) | $671,647 | $729,906 | $714,601 | $712,194 | $756,997 | $762,646 | $13.04 | ||
| Net Rental Income | $3,751,718 | $4,049,906 | $4,122,289 | $4,153,661 | $4,205,501 | $4,762,937 | $81.42 | ||
| (Vacancy & Credit Loss) | $0 | $0 | $0 | $0 | $0 | ($238,147) | ($4.07) | ||
| Other Income(3) | $1,250,000 | $1,250,000 | $731,680 | $0 | $0 |
| $0 |
| $0.00 |
| Effective Gross Income | $5,001,718 | $5,299,906 | $4,853,969 | $4,153,661 | $4,205,501 | $4,524,790 | $77.35 | ||
| Real Estate Taxes | $1,342,387 | $1,459,812 | $1,429,202 | $1,424,389 | $1,626,445 | $1,525,291 | $26.07 | ||
| Insurance | $57,763 | $65,951 | $78,031 | $83,076 | $70,616 | $58,501 | $1.00 | ||
| Other operating expenses | $205,117 | $250,495 | $249,862 | $207,327 | $186,034 |
| $179,744 |
| $3.07 |
| Total Operating Expenses | $1,605,267 | $1,776,258 | $1,757,095 | $1,714,792 | $1,883,095 | $1,763,536 | $30.15 | ||
| Net Operating Income | $3,396,451 | $3,523,648 | $3,096,874 | $2,438,869 | $2,322,406 | $2,761,254 | $47.20 | ||
| Replacement Reserves | $0 | $0 | $0 | $0 | $0 | $15,875 | $0.27 | ||
| TI/LC | $0 | $0 | $0 | $0 | $0 |
| $58,500 |
| $1.00 |
| Net Cash Flow | $3,396,451 | $3,523,648 | $3,096,874 | $2,438,869 | $2,322,406 | $2,686,879 | $45.93 | ||
| Occupancy % | 100.0% | 100.0% | 100.0% | 100.0% | 100.0% | (4) | 95.0% | (5) | |
| NOI DSCR | 1.85x | 1.92x | 1.69x | 1.33x | 1.27x | 1.51x | |||
| NCF DSCR | 1.85x | 1.92x | 1.69x | 1.33x | 1.27x | 1.47x | |||
| NOI Debt Yield | 14.3% | 14.8% | 13.0% | 10.3% | 9.8% | 11.6% | |||
| NCF Debt Yield | 14.3% | 14.8% | 13.0% | 10.3% | 9.8% | 11.3% | |||
| (1) | UW Gross Potential Rent is based on the underwritten rent roll dated December 15, 2023 and includes rent steps through January 1, 2025. |
| (2) | Gotham Hall reimburses 50% of Real Estate Taxes. Both tenants pay utilities directly. |
| (3) | Other Income in 2019 and 2020 is related to branding and naming rights agreement. Haier America Trading previously held the naming rights on the building and their name is still present on the building exterior, however, the branding lease expired in August of 2021. The borrower has not yet released the naming rights to the building and is exploring potential options, including a potential renewal with Haier America Trading. No income from the branding lease has been underwritten. |
| (4) | Represents occupancy per the underwritten rent roll dated December 15, 2023. |
| (5) | Based on 5.0% underwritten vacancy. |
Escrows and Reserves.
Real Estate Taxes – At origination, the borrower deposited approximately $265,694 for real estate taxes. On a monthly basis, the borrower is required to escrow 1/12th of the annual estimated tax payments, which currently equates to approximately $132,847.
Insurance – If there is no approved blanket policy in place, the borrower is required to escrow 1/12th of the annual estimated insurance payments on a monthly basis.
Deferred Maintenance – At origination, the borrower deposited $63,750 for immediate repairs, which represents 125% of the estimated cost of the repairs.
Replacement Reserve – At origination, the borrower deposited $42,000 for replacement reserves. On a monthly basis, the borrower is required to escrow approximately $1,323 for replacement reserves.
TI/LC Reserve – The borrower is required to make monthly deposits into the TI/LC reserve in an amount equal to $4,875, subject to a cap of $117,000.
Free Rent Reserve – At origination, the borrower deposited $40,000 into a free rent reserve to cover the remaining rent credit due to Gotham Hall. Gotham Hall is entitled to a $10,000 annual credit in connection with its 2014 lease expansion and extension of which $40,000 remains currently outstanding.
Lockbox and Cash Management. The Haier Building Mortgage Loan is structured with a hard lockbox and springing cash management. All rents from The Haier Building Property are required to be deposited directly to the lockbox account and, so long as a Cash Sweep Period (as defined below) is not continuing, the borrower is permitted to use the lockbox account as the borrower’s operating account. During a Cash Sweep Period, the borrower will not have access to the funds in the lockbox account, and such funds will be transferred to the lender-controlled cash management account and disbursed according to The Haier Building Mortgage Loan documents. During a Cash Sweep Period, all excess cash is required to be held by the lender as additional security for The Haier Building Mortgage Loan; provided that so long as no event of default exists, excess cash will be available to the borrower to fund shortfalls in debt service on The Haier Building Mortgage Loan, shortfalls in required reserve deposits, qualified leasing expenses, operating expenses and capital expenditures set forth in the annual budget, extraordinary expenses, payment of default interest or late fees and certain other amounts as set forth in The Haier Building Mortgage Loan documents.
| This is not a research report and was not prepared by any Underwriter’s research department. Please see additional important information and qualifications at the end of this Term Sheet. | ||
| 119 | ||
| Mixed Use – Event Space/Office | Loan #10 | Cut-off Date Balance: | $23,750,000 | |
| 1356 Broadway | The Haier Building | Cut-off Date LTV: | 55.2% | |
| New York, NY 10018 | UW NCF DSCR: | 1.47x | ||
| UW NOI Debt Yield: | 11.6% |
A “Cash Sweep Period” will commence upon the earlier to occur of (i) an event of default under the loan documents, (ii) beginning on April 1, 2024, the debt service coverage ratio falling below 1.15x on a trailing 12 month basis (tested quarterly) (“DSCR Trigger”), or (iii) a Tenant Trigger Event (as defined below), and will terminate upon (a) with respect to clause (i) above, the cure of such event of default, (b) with respect to clause (ii) above, the debt service coverage ratio being at least 1.25x on a trailing 12 month basis (tested quarterly for two consecutive quarters), and (c) with respect to clause (iii) above, the occurrence of a Tenant Trigger Event Cure (as defined below). Notwithstanding, the borrower may post cash or an acceptable letter of credit or utilize excess cash (in an amount necessary which if drawn and hypothetically applied to reduce principal) to achieve a debt service coverage ratio above the DSCR Trigger of 1.25x in order to avoid a Cash Sweep Period.
A “Tenant Trigger Event” will occur in the event Equity Brands or Gotham Hall (i) vacates or gives notice of its intention to vacate, (ii) fails to satisfy the renewal criteria in accordance with The Haier Building Mortgage Loan documents, (iii) terminates or gives notice of its intention to terminate its lease, (iv) fails to pay any fixed rent due and payable and such failure continues for 45 consecutive days after the expiration of any notice and cure periods, (v) has “gone dark” for more than 60 days (120 days if due to force majeure), or (vi) is the subject of any bankruptcy action.
A “Tenant Trigger Event Cure” will occur upon (a) with respect to clauses (i), (ii) and (iii) of the definition of Tenant Trigger Event, the borrower satisfies the replacement lease criteria or renewal criteria in accordance with The Haier Building Mortgage Loan documents, (b) with respect to clause (iv) of the definition of Tenant Trigger Event, the borrower provides evidence that the tenant is current in all of its fixed rent monetary obligations, (c) with respect to clause (v) of the definition of Tenant Trigger Event, the borrower provides evidence that the tenant is in physical occupancy of its space and open for business or (d) with respect to clause (vi) of the definition of Tenant Trigger Event, such bankruptcy action is dismissed.
Subordinate Debt. None.
Mezzanine Loan and Preferred Equity. None.
Release of Property. None.
Letter of Credit. None.
Purchase Option/Right of First Offer/Right of First Refusal. The non-recourse carveout guarantors together, maintain the right to purchase The Haier Building Property from the related borrower at any time prior to April 1, 2035 for a purchase price of $38 million through March 2028, increasing to $41 million in April 2028 and increasing an additional $1 million per year up to $47 million in 2034. However, such right is fully subordinate to the lien of The Haier Building Mortgage Loan and such right will not be in force or effect in connection with a foreclosure or conveyance in lieu of foreclosure exercised by the lender. Additionally, any exercise of such right without the consent of the lender, would constitute a prohibited transfer and result in full recourse to the non-recourse carveout guarantors.
Ground Lease. None.
Terrorism Insurance. The borrower is required to obtain and maintain property insurance and business interruption insurance for 12 months plus a 6-month extended period of indemnity. Such insurance is required to cover perils of terrorism and acts of terrorism. See “Risk Factors—Risks Relating to the Mortgage Loans—Terrorism Insurance May Not Be Available for All Mortgaged Properties” in the prospectus.
| This is not a research report and was not prepared by any Underwriter’s research department. Please see additional important information and qualifications at the end of this Term Sheet. | ||
| 120 | ||
| Mortgage Loan No. 11 – Seagate Shakopee |
| Mortgage Loan Information | Property Information | ||||||
| Mortgage Loan Seller: | WFB | Single Asset/Portfolio: | Single Asset | ||||
| Credit Assessment (Moody’s/Fitch/KBRA): | A1/NR/NR | Location: | Shakopee, MN 55379 | ||||
| Original Balance: | $23,400,000 | General Property Type: | Industrial | ||||
| Cut-off Date Balance: | $23,400,000 | Detailed Property Type: | R&D/Flex | ||||
| % of Initial Pool Balance: | 4.5% | Title Vesting: | Fee | ||||
| Loan Purpose: | Acquisition | Year Built/Renovated: | 1999/NAP | ||||
| Borrower Sponsor: | Joshua Volen and Trevor Smith | Size: | 405,146 SF | ||||
| Guarantor: | CIRE OpCo I, LLC | Cut-off Date Balance PSF: | $58 | ||||
| Mortgage Rate: | 7.5600% | Maturity Balance PSF: | $58 | ||||
| Note Date: | 12/27/2023 | Property Manager: | Self-Managed | ||||
| First Payment Date: | 2/11/2024 | ||||||
| Maturity Date: | 1/11/2029 | Underwriting and Financial Information | |||||
| Original Term to Maturity: | 60 months | UW NOI: | $3,595,313 | ||||
| Original Amortization Term: | 0 months | UW NOI Debt Yield: | 15.4% | ||||
| IO Period: | 60 months | UW NOI Debt Yield at Maturity: | 15.4% | ||||
| Seasoning: | 1 month | UW NCF DSCR: | 1.89x | ||||
| Prepayment Provisions: | L(25),D(31),O(4) | Most Recent NOI(3): | NAV | ||||
| Lockbox/Cash Mgmt Status: | Hard/In Place | 2nd Most Recent NOI(3): | NAV | ||||
| Additional Debt Type: | No | 3rd Most Recent NOI(3): | NAV | ||||
| Additional Debt Balance: | NAP | Most Recent Occupancy: | 100.0% (2/1/2024) | ||||
| Future Debt Permitted (Type): | No (NAP) | 2nd Most Recent Occupancy: | 100.0% (12/31/2023) | ||||
| Reserves | 3rd Most Recent Occupancy: | 100.0% (12/31/2022) | |||||
| Type | Initial | Monthly | Cap | Appraised Value (as of): | $56,720,000 (12/27/2023) | ||
| RE Taxes(1): | $0 | Springing | NAP | Appraised Value PSF: | $140 | ||
| Insurance(2): | $0 | Springting | NAP | Cut-off Date LTV Ratio: | 41.3% | ||
| Replacement Reserve: | $0 | $5,065 | $182,316 | Maturity Date LTV Ratio: | 41.3% | ||
| Sources and Uses | ||||||
| Sources | Proceeds | % of Total | Uses | Proceeds | % of Total | |
| Loan Amount: | $23,400,000 | 63.4% | Purchase Price: | $36,000,000 | 97.5% | |
| Borrower Equity: | $13,524,572 | 36.6% | Closing Costs: | $924,572 | 2.5% | |
| Total Sources: | $36,924,572 | 100.0% | Total Uses: | $36,924,572 | 100.0% | |
| (1) | No monthly real estate tax reserves are required provided no event of default exists, the borrower or tax paying tenant provides proof of payment at least 15 days prior to the delinquency date, the lease is in full force and effect, the tax paying tenant is in occupancy and open for business, and no material adverse change have occurred with respect to the applicable tax paying tenant’s ability to make timely tax payments. If such conditions are not satisfied, monthly reserves of 1/12th of estimated taxes are required. |
| (2) | No monthly insurance premium reserves are required provided no event of default exists, and the borrower maintains insurance coverage as part of blanket or umbrella coverage, and provides evidence of the renewals of the insurance policies and paid receipts for the payment of the insurance premiums no later than 10 business days prior to the expiration dates of the policies. If such conditions are not satisfied, monthly reserves of 1/12th of estimated insurance premiums are required. |
| (3) | Historical financial information is not available as the property was acquired at origination in a sale/leaseback transaction, and prior to that was owner-occupied since construction and, therefore, did not operate under a lease. |
The Mortgage Loan. The eleventh largest mortgage loan (the “Seagate Shakopee Mortgage Loan”) is evidenced by a promissory note in the original principal amount of $23,400,000 and secured by a first priority fee mortgage encumbering a 405,146 SF industrial property located in Shakopee, Minnesota (the “Seagate Shakopee Property”).
The Borrower and the Borrower Sponsor. The borrower is 1280 Disc Drive, LLC, a Delaware limited liability company with one independent director. The non-recourse carveout guarantor of the Seagate Shakopee Mortgage Loan is CIRE OpCo I, LLC, and the borrower sponsors are Joshua Volen and Trevor Smith.
Joshua Volen and Trevor Smith are Principals and Co-Founders of CIRE Equity, a private real estate investment firm based in San Diego, California. Founded in 2010, CIRE Equity had $924 million in assets under management across approximately 5.4 million SF as of June 30, 2023.
The Property. The Seagate Shakopee Property is a two-story, research and development (“R&D”) facility totaling 405,146 SF and is situated on approximately 28.6-acres in Shakopee, Minnesota. The Seagate Shakopee Property was built in 1999 and is 100.0% leased to Seagate Technology LLC (“Seagate”). The Seagate Shakopee Property features 137,750 SF (34.0% of NRA) of clean room and lab space, including 21,292 SF of class 100 and 4,366 SF of class 10,000 clean rooms, 121,544 SF (30.0% of NRA) of office space, and 4,051 (1.0% of NRA) of warehouse space. The property also includes an employee cafeteria, a fitness room, meeting spaces, and large gathering spaces totaling approximately 129,647 SF (32.0% of NRA) and 12,154 SF (3.0% of NRA) of storage space. The Seagate Shakopee Property has 1,401 parking spaces on site, resulting in a parking ratio of approximately 3.46 spaces per 1,000 SF. The borrower purchased the Seagate Shakopee Property in a sale-leaseback transaction for $36,000,000 in December 2023.
| This is not a research report and was not prepared by any Underwriter’s research department. Please see additional important information and qualifications at the end of this Term Sheet. | ||
| 121 | ||
| Industrial – R&D/Flex | Loan #11 | Cut-off Date Balance: | $23,400,000 | |
| 1280 Disc Drive | Seagate Shakopee | Cut-off Date LTV: | 41.3% | |
| Shakopee, MN 55379 | UW NCF DSCR: | 1.89x | ||
| UW NOI Debt Yield: | 15.4% |
Sole Tenant.
Seagate. (BB+/Ba2/BB: F/M/S&P; 405,146 SF; 100.0% of NRA; 100.0% of underwritten base rent) – The Seagate Shakopee Property is leased to Seagate Technology LLC with the lease being guaranteed by Seagate Technology Holdings plc (“Seagate”). Founded in 1979, Seagate is a provider of data storage technology and infrastructure solutions. Seagate’s principal product is hard disk drives. Seagate also produces a range of data storage products including solid state drives, solid state hybrid drives, storage subsystems, and an edge-to-cloud mass data platform that includes data transfer shuttles and a storage-as-a-service cloud. Seagate has over 40,000 employees and uses the Seagate Shakopee Property as its R&D location for hard drive design and testing.
Seagate has occupied the property since 1999. The lease commenced in December 2023 and has an expiration in January 2034 with no termination options and two, 5-year renewal options. The lease is guaranteed by the tenant’s parent company, Seagate, an Irish public limited company. Seagate subleases 9,336 SF to Luminar Technologies, Inc. through approximately February 2024 (the “Luminar Technologies Sublease”).
The following table presents certain information relating to the tenancy at the Seagate Shakopee Property:
| Tenant Summary | |||||||||
| Tenant Name | Credit Rating (Fitch/Moody’s/S&P)(1) | Tenant SF | % of Total SF | Annual UW Rent(1) | % of Total Annual UW Rent | Annual UW Rent PSF(1) | Lease Expiration | Term. Option (Y/N) | Renewal Option |
| Seagate | BB+/Ba2/BB | 405,146 | 100.0% | $3,970,431 | 100.0% | $9.80 | 1/31/2034 | None | 2 x 5-yr |
| Subtotal/Wtd. Avg. | 405,146 | 100.0% | $3,970,431 | 100.0% | $9.80 | ||||
| Vacant Space | 0 | 0.0% | $0 | 0.0% | $0.00 | ||||
| Total/Wtd. Avg. | 405,146 | 100.0% | $3,970,431 | 100.0% | $9.80 | ||||
| (1) | The lease is guaranteed by Seagate Technology Holdings plc, an Irish public limited company. |
The following table presents certain information relating to the lease rollover schedule at the Seagate Shakopee Property:
| Lease Rollover Schedule(1) | ||||||||
| Year | # of Leases Rolling | SF Rolling | Annual UW Rent PSF Rolling | Approx. % of Total SF Rolling | Approx. Cumulative % of SF Rolling | Total UW Rent Rolling | Approx. % of Total Rent Rolling | Approx. Cumulative % of Total Rent Rolling |
| 2024 | 0 | 0 | $0.00 | 0.0% | 0.0% | $0 | 0.0% | 0.0% |
| 2025 | 0 | 0 | $0.00 | 0.0% | 0.0% | $0 | 0.0% | 0.0% |
| 2026 | 0 | 0 | $0.00 | 0.0% | 0.0% | $0 | 0.0% | 0.0% |
| 2027 | 0 | 0 | $0.00 | 0.0% | 0.0% | $0 | 0.0% | 0.0% |
| 2028 | 0 | 0 | $0.00 | 0.0% | 0.0% | $0 | 0.0% | 0.0% |
| 2029 | 0 | 0 | $0.00 | 0.0% | 0.0% | $0 | 0.0% | 0.0% |
| 2030 | 0 | 0 | $0.00 | 0.0% | 0.0% | $0 | 0.0% | 0.0% |
| 2031 | 0 | 0 | $0.00 | 0.0% | 0.0% | $0 | 0.0% | 0.0% |
| 2032 | 0 | 0 | $0.00 | 0.0% | 0.0% | $0 | 0.0% | 0.0% |
| 2033 | 0 | 0 | $0.00 | 0.0% | 0.0% | $0 | 0.0% | 0.0% |
| 2034 | 1 | 405,146 | $9.80 | 100.0% | 100.0% | $3,970,431 | 100.0% | 100.0% |
| 2035 & Beyond | 0 | 0 | $0.00 | 0.0% | 100.0% | $0 | 0.0% | 100.0% |
| Vacant | 0 | 0 | $0.00 | 0.0% | 100.0% | $0 | 0.0% | 100.0% |
| Total/Wtd. Avg. | 1 | 405,146 | $9.80 | 100.0% | $3,970,431 | 100.0% | ||
| (1) | Information is based on the underwritten rent roll. |
The Market. The Seagate Shakopee Property is located in Shakopee, Minnesota within the Minneapolis-St. Paul-Bloomington, MN-WI Metropolitan Statistical Area (the “Twin Cities MSA”). The Twin Cities MSA experienced annual population growth of approximately 1.0% year-over-year between 2010 and 2023. The property is located approximately 25 miles southwest of the Minneapolis central business district and 30 miles southwest of the St. Paul central business district. Primary access to the neighborhood is provided by U.S. Route 169, with secondary access provided by Highway 101 and Canterbury Road. U.S. Route 169 provides key access to the Minneapolis and St. Paul urban centers, as well as the metro suburbs ringing the Twin Cities. U.S. Large-scale industrial properties are also prevalent in this area, with Shutterfly, Bayer CropScience, Cyxtera MP2 Data Center, Amazon, and FedEx all having a presence in the neighborhood.
According to a third party market research report, the Seagate Shakopee Property is located in the Southwest Industrial submarket of the Minneapolis/St. Paul market. As of January 2024, the submarket had an inventory of approximately 81.4 million SF, a vacancy rate of 4.7% and an asking rent of $8.68 PSF. The appraisal concluded a market rent of $10.00 PSF per year for the Seagate Shakopee Property.
According to the appraisal, the 2023 population and average household income within a one-, three- and five-mile radius of the Seagate Shakopee Property was 7,023, 42,823, and 98,149 and $112,651, $130,867 and $160,301, respectively.
| This is not a research report and was not prepared by any Underwriter’s research department. Please see additional important information and qualifications at the end of this Term Sheet. | ||
| 122 | ||
| Industrial – R&D/Flex | Loan #11 | Cut-off Date Balance: | $23,400,000 | |
| 1280 Disc Drive | Seagate Shakopee | Cut-off Date LTV: | 41.3% | |
| Shakopee, MN 55379 | UW NCF DSCR: | 1.89x | ||
| UW NOI Debt Yield: | 15.4% |
The following table presents certain information relating to the appraisal’s market rent conclusions for the Seagate Shakopee Property:
| Market Rent Summary | |
| Office | |
| Market Rent (PSF) | $10.00 |
| Lease Term (Years) | 10 |
| Lease Type | Net |
| Rent Increase Projection | 3% per annum |
| Tenant Improvements (New/Renewal) | $10 / $2 |
| Leasing Commissions (New/Renewal) | 6.0% / 3.0% |
| Free Rent (Months) | 3 |
| Source: Appraisal. | ||
The table below presents certain information relating to comparable sales pertaining to the Seagate Shakopee Property identified by the appraisal:
| Comparable Sales | ||||||
Property Name/Location | Location | Year Built/ Renovated | Rentable Area (SF) | Occupancy | Sale Date | Sale Price (PSF) |
Seagate Shakopee Property 1280 Disc Drive | Shakopee, MN | 1999 / NAP | 405,146 | 100% | Dec-23 | $89 |
Kiewit 1450 and 1550 Mike Fahey Street | Omaha, NE | 2021 / NAP | 233,862 | 100% | Apr-23 | $516 |
City Centre Professional Building 1625 Radio Drive | Woodbury, MN | 2007 / NAP | 52,057 | 100% | Feb-23 | $251 |
Cincinnati Children’s Vernon Place 2905 Vernon Place | Cincinnati, OH | 2017 / NAP | 317,000 | 100% | Dec-22 | $246 |
New Brighton Office Center 119 14th Street NW | New Brighton, MN | 2007 / NAP | 116,011 | 100% | Sep-22 | $159 |
Crosstown Corporate Center 6385 Old Shady Oak Road | Eden Prairie, MN | 1999 / NAP | 59,953 | 97% | Mar-22 | $195 |
Shutterfly – Minneapolis Corporate Office 11000 Viking Drive | Eden Prairie, MN | 2003 / 2022 | 142,165 | 100% | Feb-22 | $269 |
| Source: | Appraisal. |
| This is not a research report and was not prepared by any Underwriter’s research department. Please see additional important information and qualifications at the end of this Term Sheet. | ||
| 123 | ||
| Industrial – R&D/Flex | Loan #11 | Cut-off Date Balance: | $23,400,000 | |
| 1280 Disc Drive | Seagate Shakopee | Cut-off Date LTV: | 41.3% | |
| Shakopee, MN 55379 | UW NCF DSCR: | 1.89x | ||
| UW NOI Debt Yield: | 15.4% |
The following table presents certain information relating to comparable industrial leases for the Seagate Shakopee Property:
| Comparable Industrial Leases | ||||||||
| Property Name/Location | Year Built/ Renovated | Total SF | Tenant | Lease Start Date | Term (years) | Size (SF) | Annual Base Rent PSF | Lease Type |
Seagate Shakopee Property 1280 Disc Drive Shakopee, MN | 1999 / NAP | 405,146(1) | Seagate(1) | Dec-23(1) | 120(1) | 405,146(1) | $9.80(1) | NNN(1) |
Veritas 2815 N Cleveland Avenue Roseville, MN | 2001 / NAP | 136,125 | Veritas | Nov-17 | 15.1 | 136,125 | $15.46 | Net |
Thrivent Lutheran HQ 600 Portland Avenue South Minneapolis, MN | 2020 / NAP | 261,638 | Confidential Office | Jan-21 | 20.0 | 261,638 | $22.23 | Net |
Xcel Energy HQ 401 Nicollet Avenue Minneapolis, MN | 2016 / NAP | 210,523 | Xcel Energy | Apr-16 | 15.0 | 210,523 | $28.90 | Net |
New Brighton Office Center 119 14th Street NW New Brighton, MN | 2007 / NAP | 116,011 | Confidential Office Confidential Office Confidential Office Confidential Office | Aug-22 Jul-20 Jul-20 Apr-20 | 7.0 5.4 10.6 10.0 | 5,748 11,157 10,298 | $14.00 $12.55 $13.66 $12.48 | NNN NNN NNN NNN |
Shutterfly - Minneapolis Corporate Office 11000 Viking Drive Eden Prairie, MN | 2003 / NAP | 142,165 | Shutterfly LLC | Aug-21 | 15.0 | 142,165 | $18.75 | Net |
Excelsior Crossings A&B 9350 & 9380 Excelsior Boulevard Hopkins, MN | 2008 / NAP | 508,590 | Confidential Office Confidential Office | Dec-18 Oct-18 | 10.5 13.0 | 73,231 59,547 | $18.00 $18.00 | NNN NNN |
Trenton Commerce Center 5905 Trenton Lane North Plymouth, MN | 1996 / 2015 | 100,384 | TE Connectivity | Mar-15 | 11.0 | 100,384 | $6.76 | NNN |
SRS Distribution 3311 Terminal Drive Eagan, MN | 1984 / NAP | 29,916 | SRS Distribution Inc. | May-24 | 10.0 | 29,916 | $12.03 | NNN |
| Source: | Appraisal. |
| (1) | Information obtained from the underwritten rent roll. |
| This is not a research report and was not prepared by any Underwriter’s research department. Please see additional important information and qualifications at the end of this Term Sheet. | ||
| 124 | ||
| Industrial – R&D/Flex | Loan #11 | Cut-off Date Balance: | $23,400,000 | |
| 1280 Disc Drive | Seagate Shakopee | Cut-off Date LTV: | 41.3% | |
| Shakopee, MN 55379 | UW NCF DSCR: | 1.89x | ||
| UW NOI Debt Yield: | 15.4% |
Underwritten Net Cash Flow. The following table presents certain information relating to the Underwritten Net Cash Flow at the Seagate Shakopee Property:
| Cash Flow Analysis(1) | ||
| UW | UW PSF | |
| Gross Potential Rent(2) | $3,970,431 | $9.80 |
| Total Recoveries | $3,355,322 | $8.28 |
| Less Vacancy & Credit Loss | ($198,522) | ($0.49) |
| Effective Gross Income | $7,127,231 | $17.59 |
| Real Estate Taxes | $1,283,744 | $3.17 |
| Insurance | $211,200 | $0.52 |
| Management Fee | $213,817 | $0.53 |
| Other Operating Expenses | $1,823,157 | $4.50 |
| Total Expenses | $3,531,918 | $8.72 |
| Net Operating Income | $3,595,313 | $8.87 |
| CapEx | $60,772 | $0.15 |
| TI/LC | $141,801 | $0.35 |
| Net Cash Flow | $3,392,740 | $8.37 |
| Occupancy % | 95.0%(2) | |
| NOI DSCR | 2.00x | |
| NCF DSCR | 1.89x | |
| NOI Debt Yield | 15.4% | |
| NCF Debt Yield | 14.5% | |
| (1) | Historical financial information and occupancy is not available as the property was acquired at origination in a sale/leaseback transaction, and prior to that was owner-occupied since construction and, therefore, did not operate under a lease. | |
| (2) | Represents UW economic vacancy of 5.0%. The Seagate Shakopee Property was 100.0% occupied as of February 1, 2024. |
| This is not a research report and was not prepared by any Underwriter’s research department. Please see additional important information and qualifications at the end of this Term Sheet. | ||
| 125 | ||
| Mortgage Loan No. 12 – Coral Walk |
| Mortgage Loan Information | Mortgaged Property Information | ||||||
| Mortgage Loan Seller: | MSMCH | Single Asset/Portfolio: | Single Asset | ||||
| Credit Assessment (Moody’s/Fitch/KBRA): | NR/NR/NR | Location: | Cape Coral, FL 33909 | ||||
| Original Balance: | $20,250,000 | General Property Type: | Retail | ||||
| Cut-off Date Balance: | $20,250,000 | Detailed Property Type: | Anchored | ||||
| % of Initial Pool Balance: | 3.9% | Title Vesting: | Fee | ||||
| Loan Purpose: | Refinance | Year Built/Renovated: | 2007/NAP | ||||
| Borrower Sponsor: | Schottenstein Realty LLC | Size: | 115,753 SF | ||||
| Guarantor: | Schottenstein Realty LLC | Cut-off Date Balance Per SF: | $175 | ||||
| Mortgage Rate: | 7.2600% | Maturity Date Balance Per SF: | $175 | ||||
| Note Date: | 11/14/2023 | Property Manager: | Schottenstein Property Group, LLC | ||||
| First Payment Date: | 1/1/2024 | (borrower-related) | |||||
| Maturity Date: | 12/1/2028 | ||||||
| Original Term to Maturity: | 60 months | ||||||
| Original Amortization Term: | 0 months | Underwriting and Financial Information | |||||
| IO Period: | 60 months | UW NOI: | $2,134,843 | ||||
| Seasoning: | 2 months | UW NOI Debt Yield: | 10.5% | ||||
| Prepayment Provisions: | L(24),YM1(32),O(4) | UW NOI Debt Yield at Maturity: | 10.5% | ||||
| Lockbox/Cash Mgmt Status: | Hard/Springing | UW NCF DSCR: | 1.31x | ||||
| Additional Debt Type: | No | Most Recent NOI: | $2,050,388 (6/30/2023 TTM) | ||||
| Additional Debt Balance: | NAP | 2nd Most Recent NOI: | $1,825,153 (12/31/2022) | ||||
| Future Debt Permitted (Type): | No (NAP) | 3rd Most Recent NOI: | $1,678,543 (12/31/2021) | ||||
| Reserves | Most Recent Occupancy: | 100.0% (10/1/2023) | |||||
| Type | Initial | Monthly | Cap | 2nd Most Recent Occupancy: | 100.0% (12/31/2022) | ||
| RE Taxes(1): | $0 | Springing | NAP | 3rd Most Recent Occupancy: | 80.1% (12/31/2021) | ||
| Insurance(1): | $0 | Springing | NAP | Appraised Value (as of): | $30,000,000 (9/30/2023) | ||
| Replacement Reserve(2): | $21,993 | Springing | $21,993 | Appraised Value per SF: | $259 | ||
| TI/LC Reserve(3): | $0 | Springing | $136,589 | Cut-off Date LTV Ratio: | 67.5% | ||
| Pokemoto Gap Rent Reserve: | $21,983 | $0 | NAP | Maturity Date LTV Ratio: | 67.5% | ||
| Sources and Uses | ||||||
| Sources | Proceeds | % of Total | Uses | Proceeds | % of Total | |
| Mortgage Loan Amount: | $20,250,000 | 100.0% | Loan Payoff: | $16,092,747 | 79.5% | |
| Return of Equity: | $2,726,841 | 13.5% | ||||
| Closing Costs: | $1,386,436 | 6.8% | ||||
| Reserves: | $43,976 | 0.2% | ||||
| Total Sources: | $20,250,000 | 100.0% | Total Uses: | $20,250,000 | 100.0% | |
| (1) | RE Taxes monthly reserves are springing during a tax trigger period as defined in the loan documents and Insurance monthly reserves are springing during an insurance trigger period as defined in the loan documents (unless a blanket policy meeting the requirements of the loan documents is obtained.) |
| (2) | Replacement Reserve monthly deposits are not required unless the following three conditions are not satisfied: (i) no event of default is continuing, (ii) the Schottenstein condition, as defined in the loan documents, remains satisfied and (iii) annually, on each monthly payment date occurring during the month of January throughout the term of the Mortgage Loan (as defined below), the borrower deposits with the lender an amount equal to the difference between the initial amount deposited in the Replacement Reserve and the then current balance of the Replacement Reserve, if any. |
| (3) | TI/LC Reserve monthly deposits are not required unless the following two conditions are not satisfied (i) the Schottenstein condition, as defined in the loan documents, remains satisfied and (ii) the debt service coverage ratio is no less than 1.10x. |
The Mortgage Loan. The twelfth largest mortgage loan (the “Coral Walk Mortgage Loan”) is evidenced by a promissory note in the original principal amount of $20,250,000 and secured by a first priority fee mortgage encumbering a 115,753 SF anchored retail property located in Cape Coral, Florida (the “Coral Walk Property”).
The Borrower and the Borrower Sponsor. The borrower for the Coral Walk Mortgage Loan is Coral Walk FL LLC, a Delaware limited liability company with two independent directors in its organizational structure. The borrower is wholly owned by Schottenstein Realty LLC (“Schottenstein”), which is controlled and managed by Jay L. Schottenstein, Joseph A. Schottenstein and Kyle P. Kraner. The borrower sponsor and non-recourse carveout guarantor is Schottenstein, a fully integrated, self-managed owner and operator of power/big box, community and neighborhood shopping centers throughout the United States. Schottenstein owns interests in 80 retail properties in 23 states with approximately 11.5 million SF as well as industrial property and office space with approximately 1.6 million SF. It also owns and manages 534 apartment units in central Ohio. The borrower is affiliated with the borrower of the Sun Center Plaza mortgage loan.
The Property. The Coral Walk Property is comprised of a fee interest in a 115,753 SF anchored retail property on an approximately 21.01-acre site in Cape Coral, Florida that includes 856 total parking spaces (7.4 per 1,000 SF). As of October 1, 2023, the Coral Walk Property is 100.0% leased to 18 tenants and two outparcel ground lease tenants, Olive Garden (7,458 SF) and Chili’s Grill and Bar (5,667 SF). The Coral Walk Property is anchored by Burlington (40,178 SF) and Sprouts Farmers Market (20,450 SF) and also shadow anchored by a corporate owned Super Target (non-collateral) and is adjacent to an outparcel Chick-fil-A, which is also not part of the collateral. Excluding the two largest tenants, Burlington and Sprouts Farmers Market, no other tenant makes up more than 6.4% of SF or 7.2% of underwritten rent. Sixteen total tenants, representing 79.5% of SF, have been in place for at least five years.
| This is not a research report and was not prepared by any Underwriter’s research department. Please see additional important information and qualifications at the end of this Term Sheet. | ||
| 126 | ||
| Retail – Anchored | Loan #12 | Cut-off Date Balance: | $20,250,000 | |
| 1760-1910 Northeast Pine Island Road | Coral Walk | Cut-off Date LTV: | 67.5% | |
| Cape Coral, FL 33909 | UW NCF DSCR: | 1.31x | ||
| UW NOI Debt Yield: | 10.5% |
Major Tenants.
Burlington (40,178 SF, 34.7% of NRA, 22.0% of underwritten rent). Burlington is a United States department store that was founded in New Jersey in 1972. The company operates over 1,000 locations throughout the United States, Mexico and China. Burlington has been a tenant at the Coral Walk Property since 2018, has a lease expiration date of February 28, 2029, and has four, 5-year renewal options remaining.
Sprouts Farmers Market (20,450 SF, 17.7% of NRA, 16.4% of underwritten rent). Sprouts Farmers Market is a natural and organic supermarket grocer that was founded in 2002. Sprouts Farmers Market has over 380 locations throughout the United States. Sprouts Farmers Market has been a tenant at the Coral Walk Property since 2022, has a lease expiration date of October 31, 2037, and has four, 5-year renewal options remaining.
The following table presents a summary regarding the tenants at the Coral Walk Property:
| Tenant Summary(1) | ||||||||||||
| Tenant Name | Credit Rating (Fitch/Moody’s/ S&P)(2) | Tenant SF | Approx.% of SF | Annual UW Base Rent | Annual UW Base Rent PSF | % of Total Annual UW Base Rent | Most Recent Sales(3) | |||||
| $ | PSF | Occ. Cost % | Term. Option | Renewal Options | Lease Expiration | |||||||
| Burlington | NR/NR/BB+ | 40,178 | 34.7% | $522,312 | $13.00 | 22.0% | NAV | NAV | NAV | N | 4 x 5 yr | 2/28/2029 |
| Sprouts Farmers Market | NR/NR/NR | 20,450 | 17.7% | $388,550 | $19.00 | 16.4% | NAV | NAV | NAV | N | 4 x 5 yr | 10/31/2037 |
| Olive Garden | NR/NR/NR | 7,458 | 6.4% | $152,460 | $20.44 | 6.4% | NAV | NAV | NAV | N | 3 x 5 yr | 3/31/2031 |
| Direct Flooring | NR/NR/NR | 7,068 | 6.1% | $135,423 | $19.16 | 5.7% | $800,659(4) | $113.28 | 24.2%(5) | N | None | 4/28/2028 |
| Chili's Grill and Bar | NR/B1/BB- | 5,667 | 4.9% | $159,500 | $28.15 | 6.7% | NAV | NAV | NAV | N | 6 x 5 yr | 3/31/2028 |
| Subtotal/Wtd. Avg. | 80,821 | 69.8% | $1,358,245 | $16.81 | 57.2% | |||||||
| Other Tenants | 34,932 | 30.2% | $1,017,142 | $29.12 | 42.8% | |||||||
| Vacant Space | 0 | 0.0% | $0 | $0.00 | 0.0% | |||||||
| Total/Wtd. Avg. | 115,753 | 100.0% | $2,375,387 | $20.52 | 100.0% | |||||||
| (1) | Information is based on the underwritten rent roll dated October 1, 2023. |
| (2) | Certain ratings are those of the parent company whether or not the parent company guarantees the lease. |
| (3) | Most Recent Sales are as of September 2023. |
| (4) | Direct Flooring Most Recent Sales represent two months’ worth of sales. |
| (5) | Occ. Cost % for Direct Flooring represents Annual UW Base Rent plus Reimbursements of $58,625 divided by Most Recent Sales. |
The following table presents certain information with respect to the lease rollover at the Coral Walk Property:
| Lease Rollover Schedule(1) | ||||||||
| Year | # of Leases Rolling | SF Rolling | Annual UW Rent PSF Rolling | Approx. % of Total SF Rolling | Approx. Cumulative % of SF Rolling | Annual UW Rent Rolling | Approx. % of Total Rent Rolling | Approx. Cumulative % of Total Rent Rolling |
| MTM | 0 | 0 | $0.00 | 0.0% | 0.0% | $0 | 0.0% | 0.0% |
| 2024 | 1 | 1,672 | $25.00 | 1.4% | 1.4% | $41,800 | 1.8% | 1.8% |
| 2025 | 3 | 7,658 | $19.50 | 6.6% | 8.1% | $149,296 | 6.3% | 8.0% |
| 2026 | 4 | 7,881 | $29.84 | 6.8% | 14.9% | $235,200 | 9.9% | 17.9% |
| 2027 | 5 | 13,901 | $33.75 | 12.0% | 26.9% | $469,214 | 19.8% | 37.7% |
| 2028 | 3 | 15,135 | $24.71 | 13.1% | 40.0% | $373,955 | 15.7% | 53.4% |
| 2029 | 1 | 40,178 | $13.00 | 34.7% | 74.7% | $522,312 | 22.0% | 75.4% |
| 2030 | 0 | 0 | $0.00 | 0.0% | 74.7% | $0 | 0.0% | 75.4% |
| 2031 | 1 | 7,458 | $20.44 | 6.4% | 81.1% | $152,460 | 6.4% | 81.8% |
| 2032 | 0 | 0 | $0.00 | 0.0% | 81.1% | $0 | 0.0% | 81.8% |
| 2033 | 0 | 0 | $0.00 | 0.0% | 81.1% | $0 | 0.0% | 81.8% |
| 2034 | 1 | 1,420 | $30.00 | 1.2% | 82.3% | $42,600 | 1.8% | 83.6% |
| 2035 & Beyond | 1 | 20,450 | $19.00 | 17.7% | 100.0% | $388,550 | 16.4% | 100.0% |
| Vacant | 0 | 0 | $0.00 | 0.0% | 100.0% | $0 | 0.0% | 100.0% |
| Total/Wtd. Avg.(2) | 20 | 115,753 | $20.52 | 100.0% | $2,375,387 | 100.0% | ||
| (1) | Information is based on the underwritten rent roll dated October 1, 2023. Certain tenants may have lease termination options that are not reflected in the Lease Rollover Schedule. |
| (2) | Total/Wtd. Avg. Annual UW Rent PSF Rolling excludes vacant space. |
The Market. The Coral Walk Property is located in Cape Coral, Florida within the Cape Coral submarket of the Southwest Florida market. The Cape Coral-Fort Myers, FL metropolitan statistical area (“MSA”) is comprised of Lee County in southwestern Florida. Lee County is on the Gulf Coast of Florida, midway between Miami and Tampa. Highways serving the MSA include Interstate 75, U.S. Route 41, and State Routes 78, 82, and 93. The region is home to Southwest Florida International Airport, approximately 15.7 miles southeast of the city’s central business district, and a general aviation facility, Page
| This is not a research report and was not prepared by any Underwriter’s research department. Please see additional important information and qualifications at the end of this Term Sheet. | ||
| 127 | ||
| Retail – Anchored | Loan #12 | Cut-off Date Balance: | $20,250,000 | |
| 1760-1910 Northeast Pine Island Road | Coral Walk | Cut-off Date LTV: | 67.5% | |
| Cape Coral, FL 33909 | UW NCF DSCR: | 1.31x | ||
| UW NOI Debt Yield: | 10.5% |
Field. Both facilities are designated foreign trade zones. Lee County is home to notable companies, such as Hertz, Chico’s FAS, and 21st Century Oncology. Cape Coral is in the western portion of the county, approximately 9.2 miles west of Fort Myers and approximately 82.9 miles south of Sarasota. Cape Coral is bordered by North Fort Myers and Fort Myers to the east. According to the appraisal, as of the third quarter of 2023, the vacancy rate in the Southwest Florida market was approximately 3.2%, with average asking rents of $22.69 PSF and inventory of approximately 84.3 million SF. According to the appraisal, as of the third quarter of 2023, the vacancy rate in the Cape Coral submarket was approximately 1.8%, with average asking rents of $19.75 PSF and inventory of approximately 9.9 million SF. According to the appraisal, the 2022 population within a one-, three- and five-mile radius of the Coral Walk Property was 8,308, 63,189 and 149,398, respectively. The 2022 average household income within the same radii was $69,229, $74,681 and $76,966, respectively.
The following table presents certain information relating to the appraisal’s market rent conclusion for the Coral Walk Property:
| Market Rent Summary | ||||
| Tenant Type | Market Rent (PSF) | Reimbursements | Annual Escalation | Lease Term (Yrs) |
| Inline: | $22.00 | NNN | 3.0%/Year | 5 |
| Pad: | $29.00 | NNN | 3.0%/Year | 5 |
| Junior Anchor: | $15.00 | NNN | 3.0%/Year | 5 |
| Ground Lease Pad: | $29.00 | NNN | 3.0%/Year | 5 |
Source: Appraisal.
The following table presents recent tenant leasing data at comparable retail properties with respect to the Coral Walk Property:
| Comparable Leases Summary | |||||||
| Property/Location | Year Built / Renovated | SF | Tenant Name | Tenant Size (SF) | Lease Date | Rent PSF | Lease Type |
Coral Walk (subject)(1) Cape Coral, FL | 2007 | 115,753 | Olive Garden Direct Flooring | 7,458 7,068 | April 2023 May 2023 | $20.44 $19.16 | NNN NNN |
The Towers Plaza I 2612 Santa Barbara Boulevard Cape Coral, FL | 2008 | 25,000 | Pineapple Picasso | 1,853 | May 2023 | $20.00 | NNN |
AT&T and Heartland Dental 2529 Santa Barbara Boulevard Cape Coral, FL | 2016 | 4,800 | Alliance Mobile, Inc. | 2,200 | April 2023 | $33.00 | NNN |
Alico Shopping Center 12251 Itec Park Drive Fort Myers, FL | 2023 | 16,285 | Noire Nail bar | 2,261 | March 2023 | $30.00 | NNN |
Pine Island Crossing 1751 Northeast Pine Island Road Cape Coral, FL | 1999 | 21,454 | Massage Envy | 1,920 | Feb. 2023 | $24.00 | NNN |
Pine Island Plaza 900 Southwest Pine Island Road Cape Coral, FL | 2008 | 46,885 | Confidential | 900 | Dec. 2022 | $25.00 | NNN |
Casa Blanca Modern Mexican & Tequila Bar 9510 Marketplace Road Fort Myers, FL | 2005 | 8,106 | Casa Blanca Modern Mexican & Tequila Bar | 8,106 | November 2022 | $29.61 | NNN |
Source: Appraisal, unless otherwise indicated.
| (1) | Information based on the underwritten rent roll dated October 1, 2023 other than Year Built / Renovated. |
The following table presents recent anchor tenant leasing data at comparable retail properties with respect to the Coral Walk Property:
| Comparable Leases Summary | |||||||
| Property/Location | Year Built | SF | Tenant Name | Tenant Size (SF) | Lease Date | Rent PSF | Lease Type |
Coral Walk (subject)(1) Cape Coral, FL | 2007 | 115,753 | Burlington Sprouts Farmers Market | 40,178 20,450 | March 2018 Oct. 2022 | $13.00 $19.00 | NNN NNN |
Englewood Square Shopping Center 425 South Indiana Avenue Englewood, FL | 1983 | 74,454 | Bealls Outlet | 26,000 | Nov. 2022 | $12.00 | NNN |
Shops at Surfside 2336 Surfside Boulevard Cape Coral, FL | 2007 | 117,566 | Hope Chest | 24,000 | Oct. 2022 | $13.00 | NNN |
Florida Motor Sports 6329 Naples Boulevard Naples, FL | 2007 | 29,413 | Sportsman’s Warehouse, Inc. | 29,413 | Sept. 2022 | $18.46 | MG |
Source: Appraisal, unless otherwise indicated.
| (1) | Information based on the underwritten rent roll dated October 1, 2023 other than Year Built. |
| This is not a research report and was not prepared by any Underwriter’s research department. Please see additional important information and qualifications at the end of this Term Sheet. | ||
| 128 | ||
| Retail – Anchored | Loan #12 | Cut-off Date Balance: | $20,250,000 | |
| 1760-1910 Northeast Pine Island Road | Coral Walk | Cut-off Date LTV: | 67.5% | |
| Cape Coral, FL 33909 | UW NCF DSCR: | 1.31x | ||
| UW NOI Debt Yield: | 10.5% |
Operating History and Underwritten Net Cash Flow. The following table presents certain information relating to the historical operating performance and Underwritten Net Cash Flow at the Coral Walk Property:
| Cash Flow Analysis | ||||||
| 2020 | 2021 | 2022 | 6/30/2023 TTM | UW(1) | UW PSF | |
| Gross Potential Rent | $1,920,843 | $1,878,664 | $1,982,486 | $2,180,237 | $2,375,387 | $20.52 |
| Reimbursement | $556,525 | $567,934 | $584,107 | $629,906 | $710,909 | $6.14 |
| Discounts Concessions | $753 | $3,657 | ($5,356) | ($15,170) | $0 | $0.00 |
| Other Income | $8,439 | $2,252 | $1,673 | $2,498 | $2,498 | $0.02 |
| Less Vacancy & Credit Loss | ($61,320) | ($38,771) | $0 | $0 | ($154,315) | ($1.33) |
| Effective Gross Income | $2,425,240 | $2,413,736 | $2,562,910 | $2,797,471 | $2,934,479 | $25.35 |
| Real Estate Taxes | $364,284 | $386,655 | $388,523 | $386,297 | $426,000 | $3.68 |
| Insurance | $18,283 | $23,005 | $25,284 | $26,530 | $29,627 | $0.26 |
| Other Operating Expenses | $338,297 | $325,533 | $323,950 | $334,256 | $344,008 | $2.97 |
| Total Operating Expenses | $720,864 | $735,193 | $737,757 | $747,083 | $799,636 | $6.91 |
| Net Operating Income | $1,704,376 | $1,678,543 | $1,825,153 | $2,050,388 | $2,134,843 | $18.44 |
| Capital Expenditures | $0 | $0 | $0 | $0 | $21,993 | $0.19 |
| TI/LC | $0 | $0 | $0 | $0 | $157,177 | $1.36 |
| Net Cash Flow | $1,704,376 | $1,678,543 | $1,825,153 | $2,050,388 | $1,955,674 | $16.90 |
| Occupancy %(2) | 79.2% | 80.1% | 100.0% | 100.0% | 95.0% | |
| NOI DSCR | 1.14x | 1.13x | 1.22x | 1.38x | 1.43x | |
| NCF DSCR | 1.14x | 1.13x | 1.22x | 1.38x | 1.31x | |
| NOI Debt Yield | 8.4% | 8.3% | 9.0% | 10.1% | 10.5% | |
| NCF Debt Yield | 8.4% | 8.3% | 9.0% | 10.1% | 9.7% | |
| (1) | UW Gross Potential rent is based on the underwritten rent roll dated October 1, 2023 and includes rent steps underwritten through November 2024 totaling $29,374. |
| (2) | UW Occupancy % represents economic occupancy. Historical occupancies represent physical occupancies. 6/30/2023 TTM Occupancy % is based on the underwritten rent roll dated October 1, 2023. |
| This is not a research report and was not prepared by any Underwriter’s research department. Please see additional important information and qualifications at the end of this Term Sheet. | ||
| 129 | ||
| Mortgage Loan No. 13 – 2361 Morris Avenue |
| Mortgage Loan Information | Property Information | ||||||
| Mortgage Loan Seller: | MSMCH | Single Asset/Portfolio: | Single Asset | ||||
| Credit Assessment (Fitch/Moody’s/DBRSM): | NR/NR/NR | Location: | Bronx, NY 10468 | ||||
| Original Balance: | $13,500,000 | General Property Type: | Multifamily | ||||
| Cut-off Date Balance: | $13,500,000 | Detailed Property Type: | Mid Rise | ||||
| % of Initial Pool Balance: | 2.6% | Title Vesting: | Fee | ||||
| Loan Purpose: | Refinance | Year Built/Renovated: | 2023/NAP | ||||
| Borrower Sponsor: | Leah Waldman | Size: | 45 Units | ||||
| Guarantor: | Leah Waldman | Cut-off Date Balance per Unit: | $300,000 | ||||
| Mortgage Rate: | 6.5100% | Maturity Date Balance per Unit: | $300,000 | ||||
| Note Date: | 1/23/2024 | Property Manager: | Self-Managed | ||||
| First Payment Date: | 3/1/2024 | ||||||
| Maturity Date: | 2/1/2029 | ||||||
| Original Term to Maturity: | 60 months | ||||||
| Original Amortization Term: | 0 months | ||||||
| IO Period: | 60 months | Underwriting and Financial Information(2) | |||||
| Seasoning: | 0 months | UW NOI(1): | $1,399,301 | ||||
| Prepayment Provisions: | L(24),D(32),O(4) | UW NOI Debt Yield(1): | 10.4% | ||||
| Lockbox/Cash Mgmt Status: | Springing/Springing | UW NOI Debt Yield at Maturity(1): | 10.4% | ||||
| Additional Debt Type: | No | UW NCF DSCR(1): | 1.56x | ||||
| Additional Debt Balance: | NAP | Most Recent NOI: | NAV | ||||
| Future Debt Permitted (Type): | No (NAP) | 2nd Most Recent NOI: | NAV | ||||
| Reserves | 3rd Most Recent NOI: | NAV | |||||
| Type | Initial | Monthly | Cap | Most Recent Occupancy(1)(3): | 97.8% (1/16/2024) | ||
| RE Taxes: | $0 | $16,330 | NAP | 2nd Most Recent Occupancy(2): | NAV | ||
| Insurance: | $14,150 | $2,830 | NAP | 3rd Most Recent Occupancy(2): | NAV | ||
| Replacement Reserve: | $0 | $938 | NAP | Appraised Value (as of)(3): | $22,100,000 (10/25/2023) | ||
| Prepaid Rent Reserve: | $112,834 | $0 | NAP | Appraised Value per Unit(3): | $491,111 | ||
| 421-a (Unabated Tax) Reserve: | $190,249 | $0 | NAP | Cut-off Date LTV Ratio(3): | 61.1% | ||
| Holdback Funds Reserve:(1) | $1,884,000 | $0 | NAP | Maturity Date LTV Ratio(3): | 61.1% | ||
| Sources and Uses | ||||||
| Sources | Proceeds | % of Total | Uses | Proceeds | % of Total | |
| Loan Amount: | $13,500,000 | 100.0% | Loan Payoff: | $8,208,886 | 60.8% | |
| Closing Costs: | $510,142 | 3.8% | ||||
| Return of Equity: | $2,579,739 | 19.1% | ||||
| Reserves: | $2,201,233 | 16.3% | ||||
| Total Sources: | $13,500,000 | 100.0% | Total Uses: | $13,500,000 | 100.0% | |
| (1) | The 2361 Morris Avenue Property (as defined below) is currently 82.2% leased. There are currently eight vacant units: one market rate unit and seven affordable units. Tenants have been identified for the seven vacant affordable units and the borrower is expected to execute direct leases with the tenants if and when their CityFHEPS (as defined below) vouchers are approved. If these leases are executed, occupancy will increase to 97.8%. The 2361 Morris Avenue Mortgage Loan (as defined below) was underwritten assuming 95.0% occupancy and that the vacant units that are assumed to be occupied are leased at rents that were approved by the New York City Department of Housing Preservation and Development in January 2023. Without such assumptions, in place NOI would be $1,205,624, in place NCF would be $1,194,374, in place NOI Debt Yield and NOI Debt Yield at Maturity would be 8.9%, and in place NCF DSCR would be 1.34x. See “Cash Flow Analysis” below. At origination, $1,884,000 was deposited in a Holdback Funds Reserve. Funds in the Holdback Funds Reserve are required to be disbursed to the borrower if on or prior to January 23, 2025, the borrower satisfies the following conditions, among others; (i) no event of default is continuing, (ii) the borrower has submitted to the lender evidence to the lender’s satisfaction that at least 95% of the residential apartments at the 2361 Morris Avenue Property (including both affordable units and any market rate units) are tenanted pursuant to executed leases with tenants that are in occupancy and pursuant to which the term of each lease covered by any prepaid rents has expired, and (iii) after giving effect to the disbursement of the Holdback Funds Reserve the debt yield of the 2361 Morris Avenue Mortgage Loan, as determined by the lender, would be at least 10.3%. If the Holdback Funds Reserve has not been disbursed by the lender by January 23, 2025, the lender is required to apply the funds in such reserve to prepay the 2361 Morris Avenue Mortgage Loan, and the borrower is required to pay a prepayment fee equal to the greater of (i) 1.00% of the amount prepaid and (ii) a yield maintenance premium. In addition, real estate taxes were underwritten assuming a 421-a exemption which the borrower is in the process of applying for has been granted. Real estate taxes for the 2023/2024 fiscal year are estimated to be $190,249. Based on estimated real estate taxes, in place NOI Debt Yield and NOI Debt Yield at Maturity would be 7.6% and in place NCF DSCR would be 1.13x. |
| (2) | Historical operating information is not available because the 2361 Morris Avenue Property was constructed in 2023. |
| (3) | The borrower is in the process of applying for a 421-a tax exemption, which has not been approved. The appraisal calculates the net present value of such 421-a exemption to be $4,893,196, and adds such value to the capitalized value set forth in the appraisal. If such net present value were to be subtracted from the appraised value, the appraised value would be $17,206,804, which would result in a Cut-off Date LTV Ratio and Maturity Date LTV Ratio of 78.5%. There can be no assurance that a 421-a exemption will be approved, or of what the appraised value or actual value of the 2361 Morris Avenue Property would be if the exemption were not approved. In addition, the appraised value includes the present value of overage rent (above market rent) obtained from the CityFHEPS program to be $923,144. If such present value were also deducted, the appraised value would be $16,283,660, which would result in a Cut-off Date LTV Ratio and Maturity Date LTV Ratio of 82.9%. There can be no assurance as to what the appraised value or actual value of the 2361 Morris Avenue Property would be if it were not rented pursuant to the CityFHEPS program. The appraisal assumes occupancy of 96.5%, while occupancy as of January 16, 2024 was 82.2%. With the tenants that have been identified for the seven vacant affordable units, occupancy as of January 16, 2024 would be 98.7%. |
The Mortgage Loan. The thirteenth largest mortgage loan (the “2361 Morris Avenue Mortgage Loan”) is evidenced by a promissory note in the original principal amount of $13,500,000. The 2361 Morris Avenue Mortgage Loan is secured by a first priority fee mortgage encumbering a multifamily property located in Bronx, New York (the “2361 Morris Avenue Property”).
| This is not a research report and was not prepared by any Underwriter’s research department. Please see additional important information and qualifications at the end of this Term Sheet. | ||
| 130 | ||
| Multifamily – Mid Rise | Loan #13 | Cut-off Date Balance: | $13,500,000 | |
| 2361 Morris Avenue | 2361 Morris Avenue | Cut-off Date LTV: | 61.1% | |
| Bronx, NY 10468 | U/W NCF DSCR: | 1.56x | ||
| U/W NOI Debt Yield: | 10.4% |
The Borrower and the Borrower Sponsor. The borrower for the 2361 Morris Avenue Mortgage Loan is 2359M LLC, a single-purpose New York limited liability company. The borrower is owned by Bronx JW 2 LLC (51% manager), Zev Mayer (30%), and Israel Perlmuter (19%). The sole member of Bronx JW 2 LLC is Leah Waldman. Leah Waldman is the borrower sponsor and non-recourse carveout guarantor for the 2361 Morris Avenue Mortgage Loan. Leah Waldman is the co-founder of Skyrock Capital LLC. Founded in 2002, Skyrock Capital LLC has a real estate portfolio of over two million SF, comprised of high-rise office buildings, shopping centers, residential and luxury apartment buildings, and waterfront luxury developments in various stages of development in New York, New Jersey, Maryland, and Connecticut.
The Property. The 2361 Morris Avenue Property is a seven-story, 45-unit mid rise multifamily apartment complex situated on a 0.12 acre (5,088 SF) site in the Fordham Heights neighborhood of the Bronx, New York. The borrower acquired the site in January 2022 for a purchase price of approximately $2,500,095. At acquisition, the site was comprised of two separate lots: one was improved with a two-family home, and the other was a vacant lot. The borrower subsequently combined the two separate lots into a single parcel, demolished the existing structure, and began the redevelopment of the site. Construction commenced on June 1, 2022, and the 2361 Morris Avenue Property was completed in 2023 at a cost of approximately $15,100,000. The apartment unit mix is comprised of 19 studios and 26 one-bedroom units. The studio units range in size from approximately 279-370 SF with an average unit size of 338 SF. The one-bedroom units range in size from approximately 435-517 SF with an average unit size of 465 SF. Each unit is equipped with an electric oven/range combination and a refrigerator/freezer. The 2361 Morris Avenue Property contains one passenger elevator and common area laundry. The Certificate of Occupancy for the 2361 Morris Avenue Property was issued on August 7, 2023, and the 2361 Morris Avenue Property is currently 82.2% leased. There are currently eight vacant units: one market rate unit and seven affordable units. Tenants have been identified for the seven vacant affordable units and the borrower expects to execute direct leases with the tenants if and when their CityFHEPS vouchers are approved. Once these leases are executed, occupancy will increase to 97.8% based on unit count.
The 2361 Morris Avenue Property is expected to benefit from a 35-year 421-a tax exemption, which the borrower is in the process of applying for. In conjunction with the 421-a tax exemption, the borrower was required to designate at least 30% of the units as affordable housing reserved for tenancy earning up to 130% of area median income. The borrower has designated 44 units as affordable units. The borrower filed the Application for Certification of Eligibility for Tax Exemption Pursuant to Real Property Tax Law 421-a on January 11, 2024 and has communicated to the lender that it anticipates that a Certificate of Eligibility will be issued within two to three months. After the Certificate of Eligibility is issued, the borrower anticipates that it will submit a final application to the New York City Department of Finance. If the final application is approved and the tax exemption is implemented, the 2361 Morris Avenue Property would benefit from a 35-year exemption that is expected to apply as follows: Any increase in the assessed value due to the recently completed renovation would be 100% exempt the first 25 years. During years 26-35, the tax exemption would be reduced to 97.8%, based on the actual percentage of the affordable units. All of the units would be required to be rent stabilized units during the 35-year term of the tax exemption and would be regulated by the New York City Department of Housing and Community Renewal. There can be no assurance as to the timing of the application process for the 421-a tax exemption or that a 421-a tax exemption will be granted as expected or at all.
In addition, the borrower is utilizing New York City Family Homelessness and Eviction Supplement (“CityFHEPS”), a rental assistance program administered by the New York City Department of Social Services to help tenants find and keep housing, in order to lease the 2361 Morris Avenue Property. The tenants must qualify for individual vouchers under the program. Eligible families can participate in the CityFHEPS program for up to five years, and they must reapply annually. If families still need help after the initial five-year period, they can apply for an extension. Landlord participation in this program is voluntary and landlords can opt out when tenants vacate. The tenants participating in the CityFHEPS program pay no more than 30% of their income as rent with the subsidy payments covering the remaining portion of the rent, but many families will have their entire rent covered by the CityFHEPS program. Tenants may lose eligibility for the CityFHEPS program in a variety of circumstances. See “Description of the Mortgage Pool—Property Types—Multifamily Properties” in the prospectus for further information.
The following table presents detailed information with respect to the units at the 2361 Morris Avenue Property:
| Apartment Unit Mix(1) | ||||||||
| Unit Mix / Type | Total Units | Leased Units(2) | % Leased(2) | Average SF per Unit | Monthly Average Rent per Unit(3)(4) | Monthly Average Rent PSF(3)(4) | ||
| Studio | 19 | 18 | 94.7% | 338 | $2,924 | $8.68 | ||
| One Bedroom | 26 | 26 | 100.0% | 465 | $3,126 | $6.73 | ||
| Total/Average | 45 | 44 | 97.8% | 411 | $3,043 | $7.38 | ||
| (1) | Information is based on the borrower rent roll dated January 16, 2024. |
| (2) | The 2361 Morris Avenue Property is currently 82.2% leased. There are currently eight vacant units: one market rate unit (studio) and seven affordable units (four studios and three one bedrooms). Tenants have been identified for the seven vacant affordable units and the borrower is expected to execute direct leases with the tenants if and when their CityFHEPS vouchers are approved. If these leases are executed, occupancy will increase to 97.8%. |
| (3) | Excludes one vacant market rate studio unit. |
| (4) | Monthly Average Rent Per Unit has been underwritten based on the contractual rent in place which is equal to the legal regulated rents for the 2361 Morris Avenue Property that were approved by the New York City Department of Housing Preservation and Development in January 2023. |
The Market. The 2361 Morris Avenue Property is located along the western side of Morris Avenue between 183rd Street and 184th Street in the Fordham Heights neighborhood of the Bronx, New York, in the Bronx County apartment submarket of the New York City multifamily market. The 2361 Morris Avenue Property is located 0.7 miles from Fordham University and 1.4 miles from the Bronx Zoo. The primary commercial corridors within the immediate area include Grand Concourse, Fordham Road, Webster Avenue and Jerome Avenue. The 2361 Morris Avenue Property is situated two blocks west of Grand Concourse and two blocks east of Jerome Avenue. National retailers within a few blocks from the 2361 Morris Avenue Property include Target, Marshalls, PC Richards, Foot Locker, Family Dollar and the Salvation Army. Public transportation is provided by both the MTA and Metro North. The neighborhood is serviced by several subway lines including the 4, B and D lines along with several bus routes along Jerome Avenue, Grand Concourse and Fordham Road.
According to the appraisal, as of the third quarter of 2023, the vacancy rate in the Bronx County apartment submarket was approximately 4.1%, with average asking rents of $2,081 per unit and inventory of approximately 40,724 units. According to the appraisal, as of the third quarter of 2023, the vacancy rate in the New York City multifamily market was approximately 3.5%, with average asking rents of $4,136 per unit and inventory of approximately 483,817
| This is not a research report and was not prepared by any Underwriter’s research department. Please see additional important information and qualifications at the end of this Term Sheet. | ||
| 131 | ||
| Multifamily – Mid Rise | Loan #13 | Cut-off Date Balance: | $13,500,000 | |
| 2361 Morris Avenue | 2361 Morris Avenue | Cut-off Date LTV: | 61.1% | |
| Bronx, NY 10468 | U/W NCF DSCR: | 1.56x | ||
| U/W NOI Debt Yield: | 10.4% |
units. According to the appraisal, the estimated 2022 population within the 2361 Morris Avenue Property’s zip code was 76,484. The estimated 2022 average household income within the same zip code was $54,842.
According to the appraisal, the majority of the population seeking rental housing in the Bronx is eligible for rent subsidies under Section 8 and the CityFHEPS programs and/or meet the requirements for affordable housing under the 421a tax exemption program. As such, the appraisal opines that the majority of new housing product that has been developed in the Bronx is built for the sole purpose of providing affordable housing. Maximizing the number of affordable units in new developments with construction commencement dates prior to June 15, 2022 allows the developer to maximize the amount of tax savings over the tax exemption period while also allowing the developer to achieve maximum rental revenue through New York City sponsored rent subsidy programs.
The following table presents certain information relating to comparable multifamily rental properties to the 2361 Morris Avenue Property:
| Comparable Rental Properties(1) | ||||
| Property | Year Built | # Units | Unit Mix | Average Monthly Rent per Unit |
2361 Morris Avenue (subject property)(2) Bronx, NY | 2023 | 45 | Studio 1BR | $2,924 $3,126 |
548 East 183rd Street Bronx, NY | 1912 | 32 | Studio 1BR | $2,378 $2,457 |
1182 Ogden Avenue Bronx, NY | 2022 | 21 | 1BR | $2,400 |
2851 University Avenue Bronx, NY | 2019 | 18 | Studio 1BR | $2,159 $2,185 |
3029 & 3031 Bronxwood Avenue Bronx, NY | 2022 | 16 | Studio 1BR | $2,200 $2,235 |
3168 Villa Avenue Bronx, NY | 2023 | 44 | Studio 1BR 2BR | $2,249 $2,289 $2,567 |
| Source: Appraisal, unless otherwise indicated. | ||
| (1) | Comparable Rental Properties are market comparable properties with the Section 8 voucher program. |
| (2) | Based on the borrower rent roll dated January 16, 2024. |
The following table presents certain information relating to the appraisal’s market rent conclusion for the 2361 Morris Avenue Property:
| Market Rent Summary | |||||
| Unit Type | Units | CityFHEPS Subsidy (Tenant Payment + Max Subsidy) | AMI Limits per421A Monthly Rent (130% AMI) | Rent Utilized | Rent Utilized $ |
| Studio | 18 | $3,040 | $2,924 | 130% of AMI | $2,924 |
| 1 BR | 26 | $3,346 | $3,126 | 130% of AMI | $3,126 |
| Source: Appraisal. | ||
| This is not a research report and was not prepared by any Underwriter’s research department. Please see additional important information and qualifications at the end of this Term Sheet. | ||
| 132 | ||
| Multifamily – Mid Rise | Loan #13 | Cut-off Date Balance: | $13,500,000 | |
| 2361 Morris Avenue | 2361 Morris Avenue | Cut-off Date LTV: | 61.1% | |
| Bronx, NY 10468 | U/W NCF DSCR: | 1.56x | ||
| U/W NOI Debt Yield: | 10.4% |
Operating History and Underwritten Net Cash Flow. The following table presents information relating to (i) in place net cash flow at the 2361 Morris Avenue Property and (ii) Underwritten Net Cash Flow for the 2361 Morris Avenue Property assuming the seven vacant affordable housing units are leased at the legal regulated rents for the 2361 Morris Avenue Property that were approved by the New York City Department of Housing Preservation and Development:
| Cash Flow Analysis | |||||
| In Place 83% | 95% UW | UW per Unit | |||
| Gross Potential Rent(1) | $1,633,728 | $1,633,728 | $36,305.07 | ||
| Other Income(2) | $13,500 | $13,500 | $300.00 | ||
| Discounts Concessions | $0 | $0 | $0.00 | ||
| Vacancy & Credit Loss | ($282,029) | (3) | ($82,361) | (4) | ($1,830.25) |
| Effective Gross Income | $1,365,200 | $1,564,867 | $34,774.81 | ||
| Real Estate Taxes(5) | $4,176 | $4,176 | $92.80 | ||
| Insurance | $32,969 | $32,969 | $732.64 | ||
| Other Expenses | $122,431 |
| $128,421 |
| $2,853.80 |
| Total Expenses | $159,576 | $165,566 | $3,679.24 | ||
| Net Operating Income | $1,205,624 | $1,399,301 | $31,095.57 | ||
| Capital Expenditures | $11,250 |
| $11,250 |
| $250.00 |
| Net Cash Flow | $1,194,374 | $1,388,051 | $30,845.57 | ||
| Occupancy % | 82.2% | (3) | 95.0% | (4) | |
| NOI DSCR | 1.35x | 1.57x | |||
| NCF DSCR | 1.34x | 1.56x | |||
| NOI Debt Yield | 8.9% | 10.4% | |||
| NCF Debt Yield | 8.8% | 10.3% | |||
| (1) | UW Gross Potential Rent has been underwritten based on the contractual rent in place which is equal to the legal regulated rents for the 2361 Morris Avenue Property that were approved by the New York City Department of Housing Preservation and Development in January 2023. | |
| (2) | Other Income is comprised of laundry income and has been underwritten based on the appraisal. |
| (3) | Vacancy has been underwritten at 17.1% based on the rent roll dated January 16, 2024. There are currently eight vacant units: one market rate unit and seven affordable units. Tenants have been identified for the seven vacant affordable units and the borrower is expected to execute direct leases with the tenants if and when their CityFHEPS vouchers are approved. Without these leases, the 2361 Morris Avenue is currently 82.2% occupied as of January 16, 2024. If these leases are executed, occupancy will increase to 97.8%. |
| (4) | Vacancy has been underwritten at 5.0% assuming the legal regulated rents for the 2361 Morris Avenue Property that were approved by the New York City Department of Housing Preservation and Development for such vacant units in January 2023. |
| (5) | Real Estate Taxes were underwritten assuming the 421-a exemption, which the borrower is in the process of applying for has been granted. Real Estate Taxes for the 2023/2024 fiscal year are estimated to be $190,249. Based on estimated real estate taxes, ”In Place 83%” NOI DSCR, NCF DSCR, NOI Debt Yield and NCF Debt Yield would be 1.14x, 1.13x, 7.6% and 7.5% and “95% UW” NOI DSCR, NCF DSCR, NOI Debt Yield and NCF Debt Yield would be 1.36x, 1.35x, 9.0% and 8.9%. |
| This is not a research report and was not prepared by any Underwriter’s research department. Please see additional important information and qualifications at the end of this Term Sheet. | ||
| 133 | ||
| Mortgage Loan No. 14 – Sierra Commons Shopping Center |
| Mortgage Loan Information | Property Information | ||||||
| Mortgage Loan Seller: | BANA | Single Asset/Portfolio: | Single Asset | ||||
| Credit Assessment (Moody’s/Fitch/KBRA): | NR/NR/NR | Location: | Palmdale, CA 93551 | ||||
| Original Balance: | $12,750,000 | General Property Type: | Retail | ||||
| Cut-off Date Balance: | $12,750,000 | Detailed Property Type: | Anchored | ||||
| % of Initial Pool Balance: | 2.5% | Title Vesting(2): | Leasehold | ||||
| Loan Purpose: | Refinance | Year Built/Renovated: | 1994 / NAP | ||||
| Borrower Sponsor: | Align REI | Size: | 104,811 SF | ||||
| Guarantor: | James Howard | Cut-off Date Balance PSF: | $122 | ||||
| Mortgage Rate: | 6.9250% | Maturity Date Balance PSF: | $122 | ||||
| Note Date: | 12/22/2023 | Property Manager(3): | AMG II, LLC d/b/a Colliers | ||||
| First Payment Date: | 2/1/2024 | ||||||
| Maturity Date: | 1/1/2029 | ||||||
| Original Term to Maturity: | 60 months | ||||||
| Original Amortization Term: | 0 months | Underwriting and Financial Information | |||||
| IO Period: | 60 months | UW NOI: | $1,392,389 | ||||
| Seasoning: | 1 month | UW NOI Debt Yield: | 10.9% | ||||
| Prepayment Provisions: | L(25),D(28),O(7) | UW NOI Debt Yield at Maturity: | 10.9% | ||||
| Lockbox/Cash Mgmt Status: | Hard/Springing | UW NCF DSCR: | 1.44x | ||||
| Additional Debt Type: | No | Most Recent NOI: | $1,913,218 (10/31/2023 TTM) | ||||
| Additional Debt Balance: | NAP | 2nd Most Recent NOI: | $1,762,684 (12/31/2022) | ||||
| Future Debt Permitted (Type): | No (NAP) | 3rd Most Recent NOI: | $1,796,539 (12/31/2021) | ||||
| Reserves | Most Recent Occupancy: | 100.0% (12/1/2023) | |||||
| Type | Initial | Monthly | Cap | 2nd Most Recent Occupancy: | 100.0% (12/31/2022) | ||
| RE Taxes: | $91,608 | $30,536 | NAP | 3rd Most Recent Occupancy: | 100.0% (12/31/2021) | ||
| Insurance(1): | $0 | Springing | NAP | Appraised Value (as of): | $24,800,000 (10/24/2023) | ||
| Replacement Reserve: | $0 | $1,747 | NAP | Appraised Value PSF: | $237 | ||
| TI/LC Reserve: | $0 | $6,250 | $225,000 | Cut-off Date LTV Ratio: | 51.4% | ||
| Ground Rent Reserve(2): | $65,120 | $16,300 | $195,520 | Maturity Date LTV Ratio: | 51.4% | ||
| Sources and Uses | ||||||
| Sources | Proceeds | % of Total | Uses | Proceeds | % of Total | |
| Loan Amount: | $12,750,000 | 100.0% | Loan Payoff: | $11,421,902 | 89.6% | |
| Closing Costs: | $700,055 | 5.5% | ||||
| Equity Distribution: | $471,315 | 3.7% | ||||
| Reserves: | $156,728 | 1.2% | ||||
| Total Sources: | $12,750,000 | 100.0% | Total Uses: | $12,750,000 | 100.0% | |
| (1) | The borrower is required to deposit 1/12 of the annual estimated insurance premiums unless a blanket policy is in place. |
| (2) | The Sierra Commons Shopping Center Property (as defined below) is subject to a ground lease with an initial 25-year term through 2038 with options that fully extend to 2075. The rental rate of the ground lease is $825 per year through June 30, 2025, after which it will increase to $391,041 per year and will remain at that level through June 30, 2050. Annual ground rent of $391,041 was underwritten through the Sierra Commons Shopping Center Mortgage Loan (as defined below) term. The borrower deposited an up-front escrow of $65,120 at loan origination and, if certain conditions set forth in the loan documents are not met, is required to deposit on-going payments of $16,300, capped at $195,520, which is equivalent to the first ground lease rental payment due December 30th, 2025. The monthly payments for the ground rent reserve will be suspended so long as (i) no event of default has occurred or is continuing under the ground lease or Sierra Commons Shopping Center Mortgage Loan, (ii) the borrower provides evidence of ground rent payment, and (iii) the balance in the ground rent reserve equals or exceeds $195,520. The Sierra Commons Shopping Center Mortgage Loan is full recourse to the guarantor if the ground lease is terminated, cancelled, or otherwise ceases to exist. |
| (3) | AMG II, LLC d/b/a Colliers manages the Sierra Commons Shopping Center Property (as defined below) under a sub-management agreement between Progression Payson SPE, LLC and AMG II, LLC d/b/a Colliers. Progression Payson SPE, LLC is a borrower sponsor-related entity that handles the asset management of the borrower sponsor's real estate portfolio whereby the entity assigns property management duties to Colliers. |
The Mortgage Loan. The fourteenth largest mortgage loan (the “Sierra Commons Shopping Center Mortgage Loan”) is evidenced by a single promissory note in the original principal amount of $12,750,000 and secured by a first priority leasehold mortgage encumbering a 104,811 SF retail property located in Palmdale, California (the “Sierra Commons Shopping Center Property”).
The Borrower and the Borrower Sponsor. The borrower is Sierra Commons SPE, LLC, a limited liability company and single purpose entity. The borrower sponsor is Align REI and the non-recourse carveout guarantor is James Howard.
James Howard is the founder of Align REI, a Los Angeles-based real estate investment firm focused on retail properties throughout the Southwestern United States. Align REI's portfolio includes seven anchored shopping centers (including the Sierra Commons Shopping Center Property), with a total market value of $160.5 million, and net equity of $64.1 million. Mr. Howard is an experienced professional with investment expertise gained through over $4 billion of completed transactions. Mr. Howard has previously led teams at investment advisors Bentall Kennedy (now BentallGreenOak), Cornerstone (now MassMutual Barings), and MetLife Real Estate Investments. Mr. Howard oversees acquisitions, financing, leasing, asset management and corporate strategy, and manages a portfolio of over 1.1 million SF of anchored shopping centers.
| This is not a research report and was not prepared by any Underwriter’s research department. Please see additional important information and qualifications at the end of this Term Sheet. | ||
| 134 | ||
| Retail – Anchored | Loan # 14 | Cut-off Date Balance: | $12,750,000 | |
| 39626 10th Street West | Sierra Commons Shopping Center | Cut-off Date LTV: | 51.4% | |
| Palmdale, CA 93551 | UW NCF DSCR: | 1.44x | ||
| UW NOI Debt Yield: | 10.9% |
The Property. The Sierra Commons Shopping Center Property is a 104,811 SF anchored retail property located in Palmdale, California. The Sierra Commons Shopping Center Property was built in 1994 and is situated on a 9.49-acre parcel. The Sierra Commons Shopping Center Property is anchored by Ashley Furniture HomeStore, Michaels Stores, Inc. and BevMo!, and the in-line tenancy is a diverse mix of national and regional retailers including Jared, Chronic Tacos, Handel's Homemade Ice Cream, The Coffee Bean & Tea Leaf and Jersey Mike's Subs. The Sierra Commons Shopping Center Property was 100.0% leased as of December 1, 2023 and has averaged 100.0% occupancy since 2019.
The Sierra Commons Shopping Center Property was acquired by the borrower sponsor in 2014 when it was 89% leased, and the borrower sponsor has since increased occupancy to 100.0%. All in-place tenants have been at the Sierra Commons Shopping Center Property for a weighted average lease term of 17 years. Eight tenants totaling 88,623 SF (84.6% NRA) have been at the Sierra Commons Shopping Center Property for more than 14 years. All the anchor tenants have been at the Sierra Commons Shopping Center Property since 2009.
Major Tenants.
Ashley Furniture HomeStore (42,787 SF, 40.8% of NRA, 22.1% of underwritten base rent). Ashley Furniture HomeStore (“Ashley”) is an American furniture store chain and a part of Ashley Furniture Industries. The first Ashley opened in Anchorage, Alaska in 1997. The company operates 1,000 locations, and Ashley Furniture-branded products are sold through more than 6,000 retail partners worldwide. Ashley has been a tenant at the Sierra Commons Shopping Center Property since 2009 and, in 2020, extended its lease for five years through June 30, 2025. Ashley is currently paying $10.21 PSF in base rent and has no renewal options. Such tenant is in negotiations with the borrower sponsor for a new lease in 2025 with rents expected between $15.00 and $20.00 PSF. We cannot assure you that this lease will be signed as expected or at all.
Michaels Stores, Inc. (21,300 SF, 20.3% of NRA, 20.8% of underwritten base rent). Michaels Stores, Inc. (“Michaels”) is the largest arts and crafts retail chain in the world. Michaels sells a variety of arts and crafts products, including scrapbooking, beading, knitting, rubber stamping, home decor items, floral items, kids' crafts, paints, framing, greenery and many seasonal items. Michaels also offers a variety of classes, demonstrations, and family-focused events to inspire its customers with product ideas and information. As of January 2023, there were 1,159 Michaels stores in 49 out of 50 states in the United States, and Canada, with approximately $5.362 billion in sales for fiscal 2020. The stores were taken private in April 2021, when the parent company, The Michaels Companies, was acquired by venture capital firm Apollo Global Management. Michaels has been a tenant at the Sierra Commons Shopping Center Property since 2007 and, in 2022, extended its lease for five years through February 28, 2027. Michaels is currently paying $19.36 PSF in base rent and has two, 5-year renewal options remaining, with 180 to 365 months’ notice at fixed rents.
BevMo! (10,096 SF, 9.6% of NRA, 11.5% of underwritten base rent). Beverages & More, Inc. (“BevMo!”) retails alcoholic and non-alcoholic beverages in the western United States and also operates BevMo.com, a website that enables customers to purchase items for home or office. BevMo! was founded in 1994 and is based in Concord, California. BevMo! operates as a subsidiary of BevMo Holdings, LLC. As of January 2023, Beverages & More, Inc. operated 166 stores within California, Arizona, and Washington. BevMo! has been a tenant at the Sierra Commons Shopping Center Property since 2007 and, in 2023, extended its lease for five years through January 31, 2028. BevMo! is currently paying $22.50 PSF in base rent and has one, 5-year renewal option, with six months' notice at fixed rents.
The following table presents certain information relating to the tenancy at the Sierra Commons Shopping Center Property:
| Tenant Summary(1) | |||||||||
| Tenant Name | Credit Rating (Fitch/ Moody’s/ S&P) | Tenant SF | % of Total SF | Annual UW Rent | % of Total Annual UW Rent | Annual UW Rent PSF | Lease Expiration |
Term. Options | Renewal Option |
| Major Tenants | |||||||||
| Ashley Furniture HomeStore | NR/NR/NR | 42,787 | 40.8% | $436,855 | 22.1% | $10.21 | 6/30/2025 | N | None(2) |
| Michaels Stores, Inc. | NR/NR/NR | 21,300 | 20.3% | $412,368 | 20.8% | $19.36 | 2/28/2027 | N | 2, 5-year |
| BevMo! | NR/NR/NR | 10,096 | 9.6% | $227,160 | 11.5% | $22.50 | 1/31/2028 | N | 1, 5-year |
| Turner's Outdoorsman | NR/NR/NR | 7,000 | 6.7% | $56,980 | 2.9% | $8.14 | 11/30/2027 | N | 4, 5-year |
| Jared | NR/NR/NR | 6,000 | 5.7% | $279,510 | 14.1% | $46.59 | 1/31/2027 | N | 4, 5-year |
| Major Tenants Subtotal/Wtd. Avg. | 87,183 | 83.2% | $1,412,873 | 71.4% | $16.21 | ||||
| Other Tenants(3) | 17,628 | 16.8% | $565,794 | 28.6% | $32.10 | ||||
| Occupied Collateral Total / Wtd. Avg. | 104,811 | 100.0% | $1,978,667 | 100.0% | $18.88 | ||||
| Vacant Space | 0 | 0.0% | $0 | 0.0% | $0.00 | ||||
| Total/Wtd. Avg. | 104,811 | 100.0% | $1,978,667 | 100.0% | $18.88 | ||||
| (1) | Based on the underwritten rent roll dated December 1, 2023, inclusive of rent steps through November 2024. |
| (2) | Ashley is currently in negotiations with the borrower sponsor for a new lease in 2025 with rents expected between $15.00 and $20.00 PSF. We cannot assure you that this lease will be signed as expected or at all. |
| (3) | Includes $27,012 of UW Rent from the cell tower tenant, New Cingular Wireless, which has no associated SF. |
| This is not a research report and was not prepared by any Underwriter’s research department. Please see additional important information and qualifications at the end of this Term Sheet. | ||
| 135 | ||
| Retail – Anchored | Loan # 14 | Cut-off Date Balance: | $12,750,000 | |
| 39626 10th Street West | Sierra Commons Shopping Center | Cut-off Date LTV: | 51.4% | |
| Palmdale, CA 93551 | UW NCF DSCR: | 1.44x | ||
| UW NOI Debt Yield: | 10.9% |
The following table presents certain information relating to the lease rollover schedule at the Sierra Commons Shopping Center Property:
| Lease Rollover Schedule(1)(2) | ||||||||
| Year | # of Leases Rolling | SF Rolling | UW Rent PSF Rolling | Approx. % of Total SF Rolling | Approx. Cumulative % of SF Rolling | Total UW Rent Rolling | Approx. % of Total Rent Rolling | Approx. Cumulative % of Total Rent Rolling |
| MTM / 2024 | 0 | 0 | $0.00 | 0.0% | 0.0% | $0 | 0.0% | 0.0% |
| 2025 | 2 | 44,987 | $12.07 | 42.9% | 42.9% | $543,183 | 27.5% | 27.5% |
| 2026 | 2 | 2,300 | $43.84 | 2.2% | 45.1% | $100,825 | 5.1% | 32.5% |
| 2027 | 3 | 34,300 | $21.83 | 32.7% | 77.8% | $748,858 | 37.8% | 70.4% |
| 2028 | 4 | 16,584 | $21.97 | 15.8% | 93.7% | $364,326 | 18.4% | 88.8% |
| 2029(3) | 1 | 0 | $0.00 | 0.0% | 93.7% | $27,012 | 1.4% | 90.2% |
| 2030 | 0 | 0 | $0.00 | 0.0% | 93.7% | $0 | 0.0% | 90.2% |
| 2031 | 0 | 0 | $0.00 | 0.0% | 93.7% | $0 | 0.0% | 90.2% |
| 2032 | 0 | 0 | $0.00 | 0.0% | 93.7% | $0 | 0.0% | 90.2% |
| 2033 | 1 | 2,000 | $39.00 | 1.9% | 95.6% | $78,000 | 3.9% | 94.1% |
| 2034 | 0 | 0 | $0.00 | 0.0% | 95.6% | $0 | 0.0% | 94.1% |
| 2035 & Beyond | 1 | 4,640 | $25.10 | 4.4% | 100.0% | $116,463 | 5.9% | 100.0% |
| Vacant | 0 | 0 | $0.00 | 0.0% | 100.0% | $0 | 0.0% | 100.0% |
| Total/Wtd. Avg. | 14 | 104,811 | $18.88 | 100.0% | $1,978,667 | 100.0% | ||
| (1) | Based on the underwritten rent roll dated December 1, 2023, inclusive of rent steps through November 2024. |
| (2) | Certain tenants may have lease termination options that are exercisable prior to the originally stated expiration date of the related lease and are not considered in the rollover schedule. |
| (3) | Includes $27,012 of UW Rent from the cell tower tenant, New Cingular Wireless, which has no associated SF. |
The Market. The Sierra Commons Shopping Center Property is located in Palmdale, California, within the Los Angeles retail market and the Antelope Valley submarket. The Sierra Commons Shopping Center Property is located less than four miles from Downtown Palmdale, 64 miles north of Pasadena, and 63 miles north of Los Angeles. The Sierra Commons Shopping Center Property is situated across the street from the Antelope Valley Mall, with frontage at the intersection of 10th Street West and Rancho Vista Boulevard and proximate to the Antelope Valley (14) Freeway. Antelope Valley Mall is a one million SF shopping mall anchored by Macy's, Dillard's, JCPenney, and Dick's Sporting Goods. Other stores near the Sierra Commons Shopping Center Property include Target, Lowe's Home Improvement, Best Buy, Trader Joe's, PetSmart, and TJ Maxx.
According to a third party market report, the Los Angeles retail market had inventory of 450 million SF, vacancy of 5.4%, and average asking rents of $35.68 PSF as of the second quarter of 2023. The Antelope Valley submarket had inventory of 16.4 million SF, vacancy of 5.4%, and average asking rents of $24.79 PSF as of the second quarter of 2023. According to the appraisal, the 2023 population within a 1-, 3- and 5-mile radius of the Sierra Commons Shopping Center Property was 7,416, 56,463, and 134,934, respectively. The 2023 average household income within the same radii was $114,266, $99,065, and $97,569, respectively.
| This is not a research report and was not prepared by any Underwriter’s research department. Please see additional important information and qualifications at the end of this Term Sheet. | ||
| 136 | ||
| Retail – Anchored | Loan # 14 | Cut-off Date Balance: | $12,750,000 | |
| 39626 10th Street West | Sierra Commons Shopping Center | Cut-off Date LTV: | 51.4% | |
| Palmdale, CA 93551 | UW NCF DSCR: | 1.44x | ||
| UW NOI Debt Yield: | 10.9% |
The following table presents recent in-line leasing data at comparable properties with respect to the Sierra Commons Shopping Center Property:
| Comparable In-line Retail Leases | |||||||
Property City/State | Year Built | Total NRA (SF) |
Tenant | Lease Date / Term (yrs) | Lease Size (SF) | Base Rent PSF | Escalations |
Sierra Commons Shopping Center Palmdale, CA | 1994 | 104,811(1) | Handel's Homemade Ice Cream(1) | Nov-22 / 11.0(1) | 2,000(1) | $39.00(1) | $42.90 PSF In Year 5(1) |
Amargosa Commons Palmdale, CA | 2003 | 172,992 | European Wax Centers | Feb-22 / 5.0 | 2,500 | $30.00 | 3.0% Annual |
Palmdale Marketplace Palmdale, CA | 1991 | 540,372 | The Joint Chiropractic Adventure Dental O’Reilly Auto Parts | Jan-22 / 5.0 Jan-22 / 10.0 Mar-21 / 10.0 | 1,000 3,903 7,038 | $36.00 $25.20 $17.00 | Flat 3.0% Annual 8.0% every 5 yrs |
Rancho Vista Plaza Palmdale, CA | 1991 | 165,438 | Martha Flores Salon | Feb-22 / 3.0 | 975 | $30.00 | 3.0% Annual |
Lancaster Commerce Center Lancaster, CA | 1984 | 551,773 | Its Boba Time | Jan-21 / 5.0 | 1,496 | $45.60 | 3.0% Annual |
Palmdale Gateway Palmdale, CA | 1986 | 176,000 | Super Kids Dental | Apr-23 / 10.0 | 3,094 | $16.20 | 3.0% Annual |
Palmdale Place Palmdale, CA | 1986 | 164,000 | Meechy's Cheesecakes Olive Support Services | Feb-22 / 5.0 Jan-22 / 5.0 | 900 1,000 | $21.00 $21.00 | 3.0% Annual 3.0% Annual |
47th Street Pavilion Palmdale, CA | 2008 | 301,310 | Chipotle GNC Rolling Crab | Jan-22 / 9.0 Dec-21 / 5.0 Aug-20 / 6.0 | 2,328 1,134 1,439 | $42.00 $24.00 $24.00 | 3.0% Annual 3.0% Annual 3.0% Annual |
Source: Appraisal.
| (1) | Information obtained from the underwritten rent roll dated December 1, 2023. |
The following table presents certain information relating to the appraisal’s market rent conclusions for the Sierra Commons Shopping Center Property:
| Category |
SF | Market Rent (PSF) | Lease Term (Yrs) | Rental Increase Projection |
| Shop | 4,988 | $16.20 | 5.0 | 3% per annum |
| Shop | 7,000 | $15.00 | 5.0 | 3% per annum |
| Shop | 4,640 | $24.00 | 5.0 | 3% per annum |
| Shop | 8,000 | $39.00 | 5.0 | 3% per annum |
| Shop | 6,000 | $45.00 | 5.0 | 3% per annum |
| Anchor (Ashley) | 42,787 | $15.00 | 10.0 | None |
| Subanchor | 10,096 | $21.00 | 10.0 | None |
| Subanchor | 21,300 | $18.00 | 10.0 | None |
| Source: Appraisal. | ||
| This is not a research report and was not prepared by any Underwriter’s research department. Please see additional important information and qualifications at the end of this Term Sheet. | ||
| 137 | ||
| Retail – Anchored | Loan # 14 | Cut-off Date Balance: | $12,750,000 | |
| 39626 10th Street West | Sierra Commons Shopping Center | Cut-off Date LTV: | 51.4% | |
| Palmdale, CA 93551 | UW NCF DSCR: | 1.44x | ||
| UW NOI Debt Yield: | 10.9% |
Operating History and Underwritten Net Cash Flow. The following table presents certain information relating to the historical operating performance and Underwritten Net Cash Flow at the Sierra Commons Shopping Center Property:
| Cash Flow Analysis | ||||||||
| 2020 | 2021 | 2022 | TTM October 2023 | UW | UW PSF | |||
| Gross Potential Rent(1) | $1,708,146 | $1,767,486 | $1,799,771 | $1,972,963 | $1,951,655 | $18.62 | ||
| Expense Reimbursement | $660,594 | $734,715 | $746,487 | $756,225 |
| $763,174 |
| $7.28 |
| Net Rental Income | $2,368,740 | $2,502,201 | $2,546,258 | $2,729,188 | $2,714,829 | $25.90 | ||
| (Vacancy & Credit Loss) | $0 | $0 | $0 | $0 | ($135,741) | ($1.30) | ||
| Other Income(2) | $36,190 | $35,864 | $33,652 | $33,291 |
| $34,822 |
| $0.33 |
| Effective Gross Income | $2,404,930 | $2,538,065 | $2,579,910 | $2,762,479 | $2,613,910 | $24.94 | ||
| Real Estate Taxes | $326,944 | $331,354 | $336,273 | $339,325 | $352,337 | $3.36 | ||
| Ground Rent(3) | $825 | $825 | $825 | $825 | $391,041 | $3.73 | ||
| Insurance | $31,057 | $34,488 | $38,185 | $61,112 | $39,720 | $0.38 | ||
| Other Operating Expenses | $437,142 | $374,861 | $441,944 | $447,998 |
| $438,423 |
| $4.18 |
| Total Operating Expenses | $795,968 | $741,527 | $817,227 | $849,260 | $1,221,521 | $11.65 | ||
| Net Operating Income | $1,608,962 | $1,796,539 | $1,762,684 | $1,913,218 | $1,392,389 | $13.28 | ||
| Replacement Reserves | $0 | $0 | $0 | $0 | 20,962 | $0.20 | ||
| TI/LC | $0 | $0 | $0 | $0 |
| 81,726 |
| $0.78 |
| Net Cash Flow | $1,608,962 | $1,796,539 | $1,762,684 | $1,913,218 | $1,289,701 | $12.31 | ||
| Occupancy % | 100.0% | 100.0% | 100.0% | 100.0% | (4) | 95.0% | (5) | |
| NOI DSCR | 1.80x | 2.01x | 1.97x | 2.14x | 1.56x | |||
| NCF DSCR | 1.80x | 2.01x | 1.97x | 2.14x | 1.44x | |||
| NOI Debt Yield | 12.6% | 14.1% | 13.8% | 15.0% | 10.9% | |||
| NCF Debt Yield | 12.6% | 14.1% | 13.8% | 15.0% | 10.1% | |||
| (1) | UW Gross Potential Rent is based on the underwritten rent roll dated December 1, 2023, inclusive of rent steps through November 2024. Historical operating statements included deferred rent from 2020 that was paid in 2021 and TTM October 2023. | |
| (2) | UW Other Income includes TNT Fireworks rental income and cell tower income. |
| (3) | The Sierra Commons Shopping Center Property consists of a leasehold interest under a ground lease. The rental rate of the ground lease is $825 per year through June 30, 2025, after which it will increase to $391,041 per year and remain at that level through June 30, 2050. Ground rent of $391,041 was underwritten through the Sierra Commons Shopping Center Mortgage Loan term |
| (4) | Represents occupancy per the underwritten rent roll dated December 1, 2023. |
| (5) | Assumes economic vacancy of 5.0%. |
| This is not a research report and was not prepared by any Underwriter’s research department. Please see additional important information and qualifications at the end of this Term Sheet. | ||
| 138 | ||
| Mortgage Loan No. 15 – Klein Square |
| Mortgage Loan Information | Property Information | ||||||
| Mortgage Loan Seller: | JPMCB | Single Asset/Portfolio: | Single Asset | ||||
| Credit Assessment (Moody’s/Fitch/KBRA): | NR/NR/NR | Location: | Spring, TX 77379 | ||||
| Original Balance: | $11,700,000 | General Property Type: | Retail | ||||
| Cut-off Date Balance: | $11,700,000 | Detailed Property Type: | Anchored | ||||
| % of Initial Pool Balance: | 2.3% | Title Vesting: | Fee | ||||
| Loan Purpose: | Refinance | Year Built/Renovated: | 1978 / 1999 | ||||
| Borrower Sponsor: | Williamsburg Enterprises Ltd. | Size: | 79,963 SF | ||||
| Guarantor: | Khaled Salem | Cut-off Date Balance PSF: | $146 | ||||
| Mortgage Rate: | 7.5000% | Maturity Date Balance PSF: | $146 | ||||
| Note Date: | 1/19/2024 | Property Manager: | WE Property Management LLC | ||||
| First Payment Date: | 3/1/2024 | (borrower-related) | |||||
| Maturity Date: | 2/1/2029 | ||||||
| Original Term to Maturity: | 60 months | ||||||
| Original Amortization Term: | 0 months | ||||||
| IO Period: | 60 months | ||||||
| Seasoning: | 0 months | Underwriting and Financial Information(5) | |||||
| Prepayment Provisions: | L(25),YM1(32),O(3) | UW NOI(6): | $1,320,974 | ||||
| Lockbox/Cash Mgmt Status: | Hard/Springing | UW NOI Debt Yield: | 11.3% | ||||
| Additional Debt Type: | No | UW NOI Debt Yield at Maturity: | 11.3% | ||||
| Additional Debt Balance: | NAP | UW NCF DSCR: | 1.36x | ||||
| Future Debt Permitted (Type): | No (NAP) | Most Recent NOI(6): | $783,336 (10/31/2023 TTM) | ||||
| 2nd Most Recent NOI: | $975,066 (12/31/2022) | ||||||
| Reserves | 3rd Most Recent NOI: | $950,813 (12/31/2021) | |||||
| Type | Initial | Monthly | Cap | Most Recent Occupancy(6): | 100.0% (1/11/2024) | ||
| RE Tax: | $17,610 | $17,097 | NAP | 2nd Most Recent Occupancy(6): | 88.2% (10/31/2023) | ||
| Insurance(1): | $0 | Springing | NAP | 3rd Most Recent Occupancy: | 80.0% (12/31/2022) | ||
| Replacement Reserves: | $1,066 | $1,066 | NAP | Appraised Value (as of)(7): | $18,390,000 (12/6/2023) | ||
| TI/LC Reserve(2): | $0 | $6,664 | $239,889 | Appraised Value PSF: | $230 | ||
| Deferred Maintenance Reserve: | $34,318 | $0 | NAP | Cut-off Date LTV Ratio(7): | 63.6% | ||
| Other Reserves(3)(4): | $1,399,655 | $0 | NAP | Maturity Date LTV Ratio(7): | 63.6% | ||
| Sources and Uses | ||||||
| Sources | Proceeds | % of Total | Uses | Proceeds | % of Total | |
| Loan Amount: | $11,700,000 | 100.0% | Loan Payoff: | $9,114,081 | 77.9% | |
| Closing Costs: | $1,097,791 | 9.4% | ||||
| Reserves: | $1,452,649 | 12.4% | ||||
| Return of Equity: | $35,479 | 0.3% | ||||
| Total Sources: | $11,700,000 | 100.0% | Total Uses: | $11,700,000 | 100.0% | |
| (1) | The mortgage loan documents do not require monthly insurance reserves as long as (i) no event of default is continuing, (ii) the insurance policies maintained by the borrower are part of a blanket or umbrella policy approved by the lender in its reasonable discretion and (iii) the lender is provided with paid receipts for the payment of the insurance premiums no later than 30 days prior to the expiration of the policies. |
| (2) | Monthly TI/LC reserve deposits in the amount of $6,664 will commence on the payment date in February 2025. |
| (3) | At loan origination, the borrower deposited (i) $640,000 into escrow for an accretive leasing reserve (the “Accretive Leasing Reserve”), (ii) $616,843 for outstanding tenant improvements attributable to two tenants and (iii) $142,812 for outstanding free rent attributable to five tenants through October 2024 to be applied on each monthly payment date. |
| (4) | Provided no event of default has occurred and is continuing, upon (i) the lender’s receipt of a fully executed NNN lease for the PetCo space (5,043 SF) with (a) a term of at least 10 years, (b) contractual base rent equal to $30.00 PSF and a tenant improvement allowance equal to or less than the stated base rent and (c) a tenant acceptable to the lender; (ii) achievement of a debt service coverage ratio as determined by the lender of at least 1.36x and (iii) the lender’s receipt of an estoppel which confirms, among other things, (a) the lease is in full force and effect, (b) there is no default under such lease, (c) the tenant is paying full contractual rent (unless an amount equal to any free rent or gap rent has been transferred from the Accretive Leasing Reserve account to the free rent reserve account (as described herein)), (d) there are no outstanding tenant improvements, landlord obligations or leasing commissions relating to such lease (unless an amount equal to any tenant improvements, landlord obligations and leasing commissions have been transferred from the Accretive Leasing Reserve account to the outstanding tenant improvement reserve account (as described herein)) and (e) the tenant has no unexpired termination options remaining, the lender will be required to (1) first, transfer an amount equal to any free rent credit, gap rent, tenant improvement, leasing commission and/or landlord obligations from the Accretive Leasing Reserve account to each of the free rent reserve account and outstanding tenant improvement reserve account, and (2) second, disburse any remaining Accretive Leasing Reserve funds to the lockbox account. |
| (5) | Underwriting and Financial Information presented above assumes that (i) the Wag N Wash lease (as contemplated by the letter of intent negotiated with the borrower) has been executed and the tenant is paying a contractual rental rate of $30.00 PSF (with the borrower sponsor having terminated the PetCo lease with respect to the related space) and (ii) the lender has released all amounts attributable to the Accretive Leasing Reserve with amounts in excess of the associated TI/LC and free rent obligations released to the borrower sponsor. Assuming a scenario in which (i) PetCo remains in occupancy at a contractual rental rate of $15.00 PSF and (ii) the Accretive Leasing Reserve is applied to reduce the outstanding Mortgage Loan balance (resulting in a net Mortgage Loan balance of $11.06 million), the resulting UW NOI Debt Yield, UW NOI Debt Yield at Maturity, Cut-off Date LTV Ratio and Maturity Date LTV Ratio are 11.3%, 11.3%, 60.9% and 60.9%, respectively. Based on the current outstanding Mortgage Loan balance of $11.7 million, assuming PetCo remains in occupancy, the resulting UW NCF DSCR would be 1.28x. |
| (6) | The increase in UW NOI and Most Recent Occupancy from Most Recent NOI and 2nd Most Recent Occupancy % is primarily attributable to (i) 9,264 SF of new leasing and (ii) lender assumption that Wag N Wash executes the lease as contemplated above at the higher base rent. |
| (7) | The Appraised Value of $18,390,000 represents the “as-if-funded” appraised value based on the hypothetical assumptions that (i) Wag N Wash executes a lease for the space currently occupied by PetCo on the terms set forth in the negotiated letter of intent and (ii) the cost of the outstanding tenant improvement and free rent allowances have been fully escrowed and will be available to fund such tenant improvements. At loan origination, $640,000 was reserved to fund the anticipated tenant improvement allowance and free rent set forth in Wag N Wash’s negotiated letter of intent. Based on the “as-is” appraised value of $18,160,000 (which assumes the PetCo lease remains in place), the resulting Cut-off Date LTV Ratio and Maturity Date LTV Ratio would be 60.9% (assuming the Accretive Leasing Reserve is applied to reduce the outstanding Mortgage Loan balance resulting in a net Mortgage Loan balance of $11.06 million). |
| This is not a research report and was not prepared by any Underwriter’s research department. Please see additional important information and qualifications at the end of this Term Sheet. | ||
| 139 | ||
| Retail - Anchored | Loan #15 | Cut-off Date Balance: | $11,700,000 | |
| 16812 Stuebner Airline Road | Klein Square | Cut-off Date LTV: | 63.6% | |
| Spring, TX 77379 | UW NCF DSCR: | 1.36x | ||
| UW NOI Debt Yield: | 11.3% |
The Mortgage Loan. The fifteenth largest mortgage loan (the “Klein Square Mortgage Loan”) is evidenced by a single promissory note in the original principal amount of $11,700,000 and secured by the fee interest in an anchored retail property located in Spring, Texas (the “Klein Square Property”).
The Borrower and the Borrower Sponsor. The borrower is WE 51B Stueb Dixie LLC, a Texas limited liability company structured to be a single-purpose entity. The borrower is 100% owned by WE 51 Stueb Dixie LLC, a Texas limited liability company, which is controlled by Khaled Salem, the non-recourse carveout guarantor of the Klein Square Mortgage Loan.
The borrower sponsor is Williamsburg Enterprises Ltd., a fully-integrated real estate investment firm that specializes in acquisition, development, management and leasing which was founded by Khaled Salem. The firm is headquartered in Houston, Texas and the majority of the firm’s assets are currently located in Texas. Williamsburg Enterprises Ltd. currently has a retail portfolio with over 1,000,000 SF and an industrial portfolio with over 400,000 SF.
The Property. The Klein Square Property is an anchored retail center located in Spring, Texas totaling 79,963 SF. Built in 1978 and renovated in 1999, the property is situated on a 5.58-acre site and is anchored by Ross Dress for Less. Other tenants include Five Below, Dollar Tree and several health and beauty tenants, among others. The Klein Square Property consists of one, 1-story building and contains 253 parking spaces resulting in a parking ratio of 3.16 spaces per 1,000 SF. As of January 11, 2024, the Klein Square Property was 100.0% leased to 17 tenants, including three tenants totaling 17.9% of NRA that have not yet taken occupancy. The borrower sponsor has successfully renewed 7,252 SF (9.1% of NRA) of associated with leases otherwise scheduled to expire in 2023-2024 at contractual rental rates resulting in a weighted average premium of 17.9% from the prior in-place rents (excluding re-leasing spread attributable to Wag N Wash).
Major Tenants.
Ross Dress for Less (21,580 SF; 27.0% of NRA; 12.6% of underwritten base rent). Ross Dress for Less is a chain of 1,693 stores offering first-quality, in-season, name brand and designer apparel, accessories, footwear and home fashions targeted to primarily middle-income households. Ross Dress for Less is part of Ross Stores, Inc, which operates an additional 322 dd’s Discounts stores that primarily offer closeout merchandise. Ross Dress for Less has been a tenant since October 2020, and has a lease expiration date in January 2031 with four, 5-year renewal options remaining. The tenant reported trailing 12-month sales as of April 30, 2023 of approximately $6.9 million ($319 PSF) representing an annual average occupancy cost of approximately 4.2% (based on underwritten base rent).
Five Below (11,192 SF; 14.0% of NRA; 14.9% of underwritten base rent). Five Below is an American chain of specialty discount stores that sells products that cost up to $5, plus a small assortment of products from $6 to $10. Five Below operates through Leisure, Fashion, Home and Party and Snack segments. Five Below opened 189 net new stores between October 2022 and October 2023. Five Below has been a tenant since April 2023, and has a lease expiration date in April 2033. The tenant has no renewal options and is not required to report sales.
Dollar Tree (10,002 SF; 12.5% of NRA; 7.7% of underwritten base rent). Dollar Tree is an operator of discount variety stores that has served North America for more than thirty years under the Dollar Tree, Family Dollar and Dollar Tree Canada brands. The company operates more than 15,000 stores across 48 states and five Canadian provinces. Dollar Tree has been a tenant since October 2019, and has a lease expiration date in January 2030 with three, 5-year renewal options remaining. The tenant is not required to report sales. Dollar Tree has the right to terminate its lease without penalty or premium, effective 30 days from the delivery of the required termination notice, in the event its gross sales from the premises aggregate less than $1,150,000 between the period beginning on the first day of October 2023 and ending on the last day of September 2024, as described in more detail under “Tenant Summary” below. The appraisal’s concluded market rent for junior anchor space is $22.50 PSF which represents a premium of approximately 104.5% to Dollar Tree’s current in place rent of $11.00 PSF.
| This is not a research report and was not prepared by any Underwriter’s research department. Please see additional important information and qualifications at the end of this Term Sheet. | ||
| 140 | ||
| Retail - Anchored | Loan #15 | Cut-off Date Balance: | $11,700,000 | |
| 16812 Stuebner Airline Road | Klein Square | Cut-off Date LTV: | 63.6% | |
| Spring, TX 77379 | UW NCF DSCR: | 1.36x | ||
| UW NOI Debt Yield: | 11.3% |
The following table presents certain information relating to the tenancy at the Klein Square Property:
| Tenant Summary | |||||||||
| Tenant Name | Credit Rating (Fitch/Moody's/ S&P) | Tenant SF | Approx. % of SF | Annual UW Rent(1) | % of Total Annual UW Rent | Annual UW Rent PSF(1) | Termination Option (Y/N) | Lease Expiration | Renewal Options |
| Major Tenants | |||||||||
| Ross Dress for Less | NR/A2/BBB+ | 21,580 | 27.0% | $179,761 | 12.6% | $8.33 | N | 1/31/2031 | 4 x 5 yr |
| Five Below | NR/NR/NR | 11,192 | 14.0% | $212,648 | 14.9% | $19.00 | N | 4/30/2033 | None |
| Dollar Tree(2) | NR/Baa2/BBB | 10,002 | 12.5% | $110,000 | 7.7% | $11.00 | Y | 1/31/2030 | 3 x 5 yr |
| Daiso(3) | NR/NR/NR | 8,183 | 10.2% | $184,118 | 12.9% | $22.50 | N | 5/31/2034 | 4 x 5 yr |
| Beauty Empire | NR/NR/NR | 7,000 | 8.8% | $122,850 | 8.6% | $17.55 | N | 1/31/2026 | None |
| Wag N Wash(4)(5) | NR/NR/NR | 5,043 | 6.3% | $151,290 | 10.6% | $30.00 | Y | 10/31/2034 | 4 x 5 yr |
| Total/Wtd. Avg. | 63,000 | 78.8% | $960,667 | 67.3% | $15.25 | ||||
| Non-Major Tenants(6) | 16,963 | 21.2% | $467,039 | 32.7% | $27.53 | ||||
| Occupied Collateral Total | 79,963 | 100.0% | $1,427,706 | 100.0% | $17.85 | ||||
| Vacant Space | 0 | 0.0% | |||||||
| Total | 79,963 | 100.0% | |||||||
| (1) | Annual UW Rent and Annual UW Rent PSF include (i) contractual rent steps through October 2025 and (ii) straight-line average rent over the loan term for Ross Dress for Less due to the investment grade nature of the tenant. |
| (2) | Dollar Tree has the right to terminate its lease without penalty or premium, effective 30 days from the delivery of the required termination notice, in the event its gross sales from the premises aggregate less than $1,150,000 between the period beginning on the first day of October 2023 and ending on the last day of September 2024 (the “Sales Measurement Period”); provided, (i) the tenant is required to deliver written notice of its election to terminate no later than 90 days following the end of the Sales Measurement Period, and (ii) that during the Sales Measurement Period, the tenant did not violate the related operating requirements under its lease. Notwithstanding the foregoing, if the termination date would otherwise fall during the months of October, November or December, the termination date will be extended automatically until the immediately following January 31. |
| (3) | Daiso has executed its lease but is not yet in occupancy or paying rent. Daiso is expected to take occupancy in June 2024. The tenant has no termination option in its lease and all leasing costs and free rent were reserved at origination. There can be no assurance such tenant will take occupancy as expected or at all. |
| (4) | The borrower has negotiated a letter of intent with Wag N Wash to backfill 5,043 SF of space currently occupied by PetCo (current annual base rent of $15.00 PSF) which is scheduled to expire in February 2027. The borrower has the right to terminate the PetCo lease with 120 days’ notice and the borrower intends to exercise such termination option upon the execution of the Wag N Wash lease. According to the borrower sponsor, the Wag N Wash lease is expected to commence in November 2024, with an initial term of 10-years and annual base rent of $30.00 PSF. At loan origination, the borrower deposited $640,000 into escrow for an Accretive Leasing Reserve to be held pending, among other conditions execution of the Wag N Wash lease. There can be no assurance that Wag N Wash will execute the lease or take occupancy as expected or at all. |
| (5) | According to the negotiated letter of intent, Wag N Wash will have the right to terminate its lease upon six months’ written notice to the landlord and the reimbursement to the landlord of the unamortized tenant allowance and leasing commissions, if its gross sales in its fifth lease year do not equal or exceed $1,500,000. Such termination option notice must be given within 60 days following the end of the fifth lease year. If such notice is not delivered within the 60-day period following the end of the fifth lease year, then the related termination option will become null and void. |
| (6) | Non-Major Tenants includes one tenant (M Cute Lashes) totaling 1.4% of NRA and 2.2% of underwritten rent, that is not yet in occupancy. M Cute Lashes is expected to open in June 2024. The tenant has no termination option in its lease and all leasing costs were reserved upfront. There can be no assurance such tenant will take occupancy as expected or at all. |
The following table presents certain information relating to the lease rollover schedule at the Klein Square Property:
| Lease Rollover Schedule(1)(2) | ||||||||
| Year | # of Leases Rolling | SF Rolling | UW Rent PSF Rolling | Approx. % of Total SF Rolling | Approx. Cumulative % of SF Rolling | Total UW Rent Rolling | Approx. % of Total Rent Rolling | Approx. Cumulative % of Total Rent Rolling |
| 2024 | 0 | 0 | $0.00 | 0.0% | 0.0% | $0 | 0.0% | 0.0% |
| 2025 | 0 | 0 | $0.00 | 0.0% | 0.0% | $0 | 0.0% | 0.0% |
| 2026 | 5 | 14,200 | $21.82 | 17.8% | 17.8% | $309,888 | 21.7% | 21.7% |
| 2027 | 2 | 2,700 | $32.59 | 3.4% | 21.1% | $88,000 | 6.2% | 27.9% |
| 2028 | 1 | 1,371 | $28.00 | 1.7% | 22.8% | $38,388 | 2.7% | 30.6% |
| 2029 | 4 | 5,692 | $26.99 | 7.1% | 30.0% | $153,613 | 10.8% | 41.3% |
| 2030 | 1 | 10,002 | $11.00 | 12.5% | 42.5% | $110,000 | 7.7% | 49.0% |
| 2031 | 1 | 21,580 | $8.33 | 27.0% | 69.5% | $179,761 | 12.6% | 61.6% |
| 2032 | 0 | 0 | $0.00 | 0.0% | 69.5% | $0 | 0.0% | 61.6% |
| 2033 | 1 | 11,192 | $19.00 | 14.0% | 83.5% | $212,648 | 14.9% | 76.5% |
| 2034 | 2 | 13,226 | $25.36 | 16.5% | 100.0% | $335,408 | 23.5% | 100.0% |
| 2035 & Beyond | 0 | 0 | $0.00 | 0.0% | 100.0% | $0 | 0.0% | 100.0% |
| Vacant | 0 | 0 | $0.00 | 0.0% | 100.0% | $0 | 0.0% | 100.0% |
| Total/Wtd. Avg. | 17 | 79,963 | $17.85 | 100.0% | $1,427,706 | 100.0% | ||
| (1) | Information is based on the underwritten rent roll, including execution of the Wag N Wash Lease consistent with the terms noted above. |
| (2) | Certain tenants may have lease termination options that are exercisable prior to the originally stated expiration date of the related lease and are not considered in the rollover schedule. |
| This is not a research report and was not prepared by any Underwriter’s research department. Please see additional important information and qualifications at the end of this Term Sheet. | ||
| 141 | ||
| Retail - Anchored | Loan #15 | Cut-off Date Balance: | $11,700,000 | |
| 16812 Stuebner Airline Road | Klein Square | Cut-off Date LTV: | 63.6% | |
| Spring, TX 77379 | UW NCF DSCR: | 1.36x | ||
| UW NOI Debt Yield: | 11.3% |
The Market. The Klein Square Property is located in the Far North submarket of the Houston market. The average household income within a 3-mile radius is $129,386, and as of 2023, there were 37,399 households and 103,104 people within the same radius. The local market area’s employment is reportedly concentrated in the finance/insurance/real estate, transportation/utilities, public administration, information, agriculture/mining, wholesale trade and manufacturing sectors. The Far North submarket commands a higher average rental rate than the overall Houston market and, according to the appraisal, is considered to be an upper tier submarket as compared to other submarkets in the overall Houston area. The area has seen positive absorption for the last 12 months.
According to the appraisal, as of the third quarter of 2023, vacancy in the Far North submarket was 5.8% and average asking rent was $21.55 PSF, NNN. According to a third party market data provider, the retail market in the area is approaching stabilized levels and the overall market is exhibiting improving leasing rates.
The following table presents certain information relating to the appraisal’s market rent conclusion for the Klein Square Property:
| Market Rent Summary | ||||
| Anchor | Junior Anchor | In Line | End Cap | |
| Market Rent (PSF) | $8.50 | $22.50 | $28.00 | $35.00 |
| Lease Term (Years) | 5 | 5 | 5 | 5 |
| Lease Type (Reimbursements) | NNN | NNN | NNN | NNN |
| Tenant Improvements | $2.00 | $10.00 | $10.00 | $10.00 |
| Leasing Commissions | 5.0% | 5.0% | 5.0% | 5.0% |
| Rent Increase Projection | None | 3% / year | 3% / year | 3% / year |
| Source: Appraisal. |
The table below presents certain information relating to comparable sales pertaining to the Klein Square Property identified by the appraisal:
| Comparable Sales(1) | |||||
Property Name | Location | Rentable Area (SF) |
Occupancy | Sale Date | Sale Price (PSF) |
| Klein Square | 16812 Stuebner Airline Road, Spring, TX | 79,963 | 100% | NAP | $229.98(2) |
| Easton Commons Plaza Shopping Center | 8470 Highway 6 North, Houston, TX | 227,962 | 67% | Sep-23 | $165.82 |
| Westchase Plaza & Sunridge Shopping Center | 3700 & 3800 S Gessner Rd, Houston, TX | 93,757 | 78% | Jul-23 | $175.28 |
| Northwest Crossing Centre | 13238 Northwest Freeway, Houston, TX | 161,292 | 79% | Jan-23 | $224.02 |
| Long Point Shopping Center | 7824 and 7846 Long Point Road, Houston, TX | 85,681 | 67% | Sep-22 | $242.76 |
| Westchase Center | 9749 Westheimer Road, Houston, TX | 118,626 | 93% | Jul-22 | $238.14 |
| Kingwood Glen | 19300 West Lake Houston Parkway, Humble, TX | 103,397 | 97% | Jun-22 | $315.12 |
| (1) | Information obtained from the appraisal. |
| (2) | Based on the As-If Funded value provided by the appraisal. |
| This is not a research report and was not prepared by any Underwriter’s research department. Please see additional important information and qualifications at the end of this Term Sheet. | ||
| 142 | ||
| Retail - Anchored | Loan #15 | Cut-off Date Balance: | $11,700,000 | |
| 16812 Stuebner Airline Road | Klein Square | Cut-off Date LTV: | 63.6% | |
| Spring, TX 77379 | UW NCF DSCR: | 1.36x | ||
| UW NOI Debt Yield: | 11.3% |
Operating History and Underwritten Net Cash Flow. The following table presents certain information relating to the historical operating performance and Underwritten Net Cash Flow at the Klein Square Property:
| Cash Flow Analysis | |||||
| 2021 | 2022 | 10/31/2023 TTM | UW(1)(2) | UW PSF | |
| Gross Potential Rent | $1,047,970 | $903,417 | $825,585 | $1,427,706 | $17.85 |
| Reimbursements | $319,686 | $432,437 | $372,440 | $397,837 | $4.98 |
| Other Income | $7,547 | $5,444 | $5,530 | $300 | $0.00 |
| Less Vacancy & Credit Loss | $0 | $0 | $0 | ($91,277) | ($1.14) |
| Effective Gross Income | $1,375,204 | $1,341,299 | $1,203,555 | $1,734,566 | $21.69 |
| Real Estate Taxes | $224,338 | $177,513 | $190,429 | $205,161 | $2.57 |
| Insurance | $38,653 | $49,703 | $82,840 | $81,219 | $1.02 |
| Other Expenses | $161,399 | $139,017 | $146,950 | $127,212 | $1.59 |
| Total Expenses | $424,391 | $366,233 | $420,219 | $413,592 | $5.17 |
| Net Operating Income | $950,813 | $975,066 | $783,336 | $1,320,974 | $16.52 |
| Capital Expenditures | $0 | $0 | $0 | $12,794 | $0.16 |
| TI/LC | $0 | $0 | $0 | $96,380 | $1.21 |
| Net Cash Flow(3) | $950,813 | $975,066 | $783,336 | $1,211,800 | $15.15 |
| Occupancy %(3) | 100.0% | 80.0% | 88.2% | 95.0%(4) | |
| NOI DSCR | 1.07x | 1.10x | 0.88x | 1.48x | |
| NCF DSCR | 1.07x | 1.10x | 0.88x | 1.36x | |
| NOI Debt Yield | 8.1% | 8.3% | 6.7% | 11.3% | |
| NCF Debt Yield | 8.1% | 8.3% | 6.7% | 10.4% | |
| (1) | UW Gross Potential Rent includes contractual rent steps through December 2024 as well as straight-line rent averaging credit over the remaining lease term for Ross Dress for Less due to the investment grade nature of the tenant. UW Rent includes two tenants (Daiso and M Cute Lashes) totaling 11.6% of NRA and 15.1% of underwritten rent, that are not yet in occupancy. Both Daiso and M Cute Lashes are expected to open in June 2024. Neither tenant has an out in its lease and all leasing costs were reserved upfront. There can be no assurance such tenants will take occupancy as expected or at all. |
| (2) | UW Gross Potential Rent includes Wag N Wash, which has negotiated a letter of intent to backfill 5,043 SF of space currently occupied by PetCo with an annual base rent of $15.00 PSF. According to the borrower sponsor, the Wag N Wash lease is expected to commence in November 2024 with an initial term of 10-years and annual base rent of $30.00 PSF. At loan origination, the borrower deposited $640,000 into escrow for an Accretive Leasing Reserve to be held pending, among other conditions, execution of the Wag N Wash lease. There can be no assurance that Wag N Wash will sign its lease or take occupancy as expected or at all. |
| (3) | The increase in UW Net Cash Flow from 10/31/2023 TTM Net Cash Flow is primarily attributable to (i) 9,264 SF of new leasing and (ii) lender assumption that Wag N Wash executes the lease as contemplated above at the higher base rent. |
| (4) | The underwritten economic vacancy is 5.0%. The Klein Square Property was 100.0% occupied as of January 11, 2024. |
| This is not a research report and was not prepared by any Underwriter’s research department. Please see additional important information and qualifications at the end of this Term Sheet. | ||
| 143 | ||
| BANK5 2024-5YR5 |
This material was prepared by sales, trading, banking or other non-research personnel of one of the following: Morgan Stanley & Co. LLC, Morgan Stanley & Co. International Limited, Morgan Stanley Japan Limited and/or Morgan Stanley Dean Witter Asia Limited (together with their affiliates, hereinafter “Morgan Stanley”), Wells Fargo Securities, LLC (together with its affiliates, “Wells Fargo”), J.P. Morgan Securities LLC (together with its affiliates, “J.P. Morgan”), BofA Securities, Inc. (together with its affiliates, “BofA Securities”), Academy Securities, Inc. (together with its affiliates, “Academy”) and Siebert Williams Shank & Co., LLC (together with its affiliates, “SWS” and, collectively with Morgan Stanley, Wells Fargo, J.P. Morgan, BofA Securities and Academy, the “Underwriters”). This material was not produced by an Underwriter’s research analyst, although it may refer to an Underwriter’s research analyst or research report. Unless otherwise indicated, these views (if any) are the author’s and may differ from those of the fixed income or equity research departments of the Underwriters or others in those firms.
This material may have been prepared by or in conjunction with the respective trading desks of the Underwriters that may deal as principal in or own or act as market maker or liquidity provider for the securities/instruments (or related derivatives) mentioned herein. The trading desk may have accumulated a position in the subject securities/instruments based on the information contained herein. Trading desk materials are not independent of the proprietary interests of the Underwriters, which may conflict with your interests. Each of the Underwriters may also perform or seek to perform investment banking services for the issuers of the securities and instruments mentioned herein.
The information contained in this material is preliminary as of the date hereof. This material is subject to change, completion or amendment from time to time. The information in this material supersedes information in any other communication relating to the securities referred to in this material; provided, that the information in this material will be superseded by similar information delivered to you as part of a preliminary prospectus. This material is not a solicitation to participate in any trading strategy, and is not an offer to sell any security or instrument or a solicitation of an offer to buy or sell any security or instrument in any jurisdiction where an offer, solicitation or sale is not permitted. Unless otherwise set forth in this material, any securities referred to in this material may not have been registered under the U.S. Securities Act of 1933, as amended, and, if not, may not be offered or sold absent an exemption therefrom. Recipients are required to comply with any legal or contractual restrictions on their purchase, holding, sale, exercise of rights or performance of obligations under any securities/instruments transaction.
The securities/instruments discussed in this material may not be suitable for all investors. This material has been prepared and issued by the Underwriters for intended distribution to market professionals and institutional investor clients. Other recipients should seek independent investment advice prior to making any investment decision based on this material. This material does not provide individually tailored investment advice or offer tax, regulatory, accounting or legal advice. Prior to entering into any proposed transaction, recipients should determine, in consultation with their own investment, legal, tax, regulatory and accounting advisors, the economic risks and merits, as well as the legal, tax, regulatory and accounting characteristics and consequences, of the transaction. You should consider this material as only a single factor in making an investment decision.
The value of and income from investments may vary because of changes in interest rates, foreign exchange rates, default rates, prepayment rates, securities/instruments prices, market indexes, operational or financial conditions of companies or other factors. There may be time limitations on the exercise of options or other rights in securities/instruments transactions. Past performance is not necessarily a guide to future performance. Estimates of future performance are based on assumptions that may not be realized. Actual events may differ from those assumed and changes to any assumptions may have a material impact on any projections or estimates. Other events not taken into account may occur and may significantly affect the projections or estimates. Certain assumptions may have been made for modeling purposes only to simplify the presentation and/or calculation of any projections or estimates, and the Underwriters do not represent that any such assumptions will reflect actual future events. Accordingly, there can be no assurance that estimated returns or projections will be realized or that actual returns or performance results will not materially differ from those estimated herein. Some of the information contained in this document may be aggregated data of transactions in securities or other financial instruments executed by an Underwriter that has been compiled so as not to identify the underlying transactions of any particular customer.
Notwithstanding anything herein to the contrary, the Underwriters and each recipient hereof (and their employees, representatives, and other agents) may disclose to any and all persons, without limitation of any kind from the commencement of discussions, the U.S. federal and state income tax treatment and tax structure of the transaction and all materials of any kind (including opinions or other tax analyses) that are provided to it relating to the tax treatment and tax structure (as such terms are defined in Treasury Regulation 1.6011-4). For this purpose, "tax structure" is limited to facts relevant to the U.S. federal and state income tax treatment of the transaction and does not include information relating to the identity of the parties, their affiliates, agents or advisors. This authorization of tax disclosure is retroactively effective to the commencement of discussions with prospective investors regarding the transactions contemplated herein.
THE DISTRIBUTION OF THIS MATERIAL (A) IF MADE BY A PERSON WHO IS NOT AN AUTHORIZED PERSON UNDER THE FINANCIAL SERVICES AND MARKETS ACT 2000 (“FSMA”), IS BEING MADE ONLY TO, OR DIRECTED ONLY AT, PERSONS WHO (I) ARE OUTSIDE THE UNITED KINGDOM, OR (II) HAVE PROFESSIONAL EXPERIENCE IN MATTERS RELATING TO INVESTMENTS AND QUALIFY AS INVESTMENT PROFESSIONALS IN ACCORDANCE WITH ARTICLE 19(5) OF THE FINANCIAL SERVICES AND MARKETS ACT 2000 (FINANCIAL PROMOTION) ORDER 2005 (AS AMENDED, THE “FINANCIAL PROMOTION ORDER”), OR (III) ARE PERSONS FALLING WITHIN ARTICLE 49(2)(A) THROUGH (D) (“HIGH NET WORTH COMPANIES, UNINCORPORATED ASSOCIATIONS, ETC.”) OF THE FINANCIAL PROMOTION ORDER OR, (IV) ARE PERSONS TO WHOM THIS MATERIAL MAY OTHERWISE LAWFULLY BE COMMUNICATED OR DIRECTED; AND (B) IF MADE BY A PERSON WHO IS AN AUTHORIZED PERSON UNDER THE FSMA, IS BEING MADE ONLY TO, OR DIRECTED ONLY AT, PERSONS WHO (I) ARE OUTSIDE THE UNITED KINGDOM, OR (II) HAVE PROFESSIONAL EXPERIENCE OF PARTICIPATING IN UNREGULATED SCHEMES (AS DEFINED FOR PURPOSES OF THE FINANCIAL SERVICES AND MARKETS ACT 2000 (PROMOTION OF COLLECTIVE INVESTMENT SCHEMES) (EXEMPTIONS) ORDER 2001 (AS AMENDED, THE “PROMOTION OF COLLECTIVE INVESTMENT SCHEMES EXEMPTIONS ORDER”)) AND QUALIFY AS INVESTMENT PROFESSIONALS IN ACCORDANCE WITH ARTICLE 14(5) OF THE PROMOTION OF COLLECTIVE INVESTMENT SCHEMES EXEMPTIONS ORDER, OR (III) ARE PERSONS FALLING WITHIN ARTICLE 22(2)(A) THROUGH (D) (HIGH NET WORTH COMPANIES, UNINCORPORATED ASSOCIATIONS, ETC.) OF THE PROMOTION OF COLLECTIVE INVESTMENT SCHEMES EXEMPTIONS ORDER, OR (IV) ARE PERSONS TO WHOM THE ISSUING ENTITY MAY LAWFULLY BE PROMOTED IN ACCORDANCE WITH SECTION 4.12 OF THE FCA HANDBOOK CONDUCT OF BUSINESS SOURCEBOOK.
THE OFFERED CERTIFICATES HAVE NOT BEEN AND WILL NOT BE REGISTERED UNDER THE FINANCIAL INSTRUMENTS AND EXCHANGE LAW OF JAPAN, AS AMENDED (THE “FIEL”), AND DISCLOSURE UNDER THE FIEL HAS NOT BEEN AND WILL NOT BE MADE WITH RESPECT TO THE OFFERED CERTIFICATES. ACCORDINGLY, EACH OF MORGAN STANLEY & CO. LLC, WELLS FARGO SECURITIES, LLC, J.P. MORGAN SECURITIES LLC, BOFA SECURITIES, INC., ACADEMY SECURITIES, INC. AND SIEBERT WILLIAMS SHANK & cO. llc HAS REPRESENTED AND AGREED THAT IT HAS NOT, DIRECTLY OR INDIRECTLY, OFFERED OR SOLD AND WILL NOT, DIRECTLY OR INDIRECTLY, OFFER OR SELL ANY OFFERED CERTIFICATES IN JAPAN OR TO, OR FOR THE BENEFIT OF, ANY RESIDENT OF JAPAN (WHICH TERM AS USED IN THIS MATERIAL MEANS ANY PERSON RESIDENT IN JAPAN, INCLUDING ANY CORPORATION OR OTHER ENTITY ORGANIZED UNDER THE LAWS OF JAPAN) OR TO OTHERS FOR REOFFERING OR RESALE, DIRECTLY OR INDIRECTLY, IN JAPAN OR TO, OR FOR THE BENEFIT OF, ANY RESIDENT OF JAPAN EXCEPT PURSUANT TO AN EXEMPTION FROM THE REGISTRATION REQUIREMENTS OF, AND OTHERWISE IN COMPLIANCE WITH, THE FIEL AND OTHER RELEVANT LAWS, REGULATIONS AND MINISTERIAL GUIDELINES OF JAPAN. AS PART OF THIS OFFERING OF THE OFFERED CERTIFICATES, THE UNDERWRITERS MAY OFFER THE OFFERED CERTIFICATES IN JAPAN TO UP TO 49 OFFEREES IN ACCORDANCE WITH THE ABOVE PROVISIONS.
| This is not a research report and was not prepared by any Underwriter’s research department. Please see additional important information and qualifications at the end of this Term Sheet. | ||
| 144 | ||