Exhibit 99.2

www.huntcompaniesfinancetrust.com Hunt Companies Finance Trust Q1 2019 Earnings Supplemental May 2019
Disclaimer This presentation, any related webcast/conference call, and other oral statements made by our representatives from time to time may constitute forward - looking statements within the meaning of Section 27A of the Securities Act of 1933, as amended, and Section 21E of the Securities Exchange Act of 1934, as amended, which reflect the current views of Hunt Companies Finance Trust, Inc. (NYSE: HCFT) (“HCFT” or the “Company”) with respect to, among other things, the Company’s operations and financial performance. You can identify these forward - looking statements by the use of words such as “outlook,” “indicator,” “believes,” “expects,” “potential,” “continues,” “may,” “will,” “should,” “seeks,” “approximately,” “predicts,” “projects,” “intends,” “plans,” “estimates,” “anticipates” or the negative version of these words or other comparable words. Such forward - looking statements are subject to various risks and uncertainties. Accordingly, there are or will be important factors that could cause actual outcomes or results to differ materially from those indicated in these statements. The Company believes these factors include but are not limited to those described under the section entitled “Risk Factors” in its Annual Report for fiscal year 2018 on Form 10 - K and other periodic filings with the Securities and Exchange Commission (“SEC”), when evaluating these forward - looking statements. Additional information concerning these and other risk factors are contained in our 2018 Form 10 - K which is available on the SEC’s website at www.sec.gov . These factors should not be construed as exhaustive and should be read in conjunction with the other cautionary statements that are included in this presentation and in the filings. The Company assumes no obligation to update or supplement forward - looking statements that become untrue because of subsequent events or circumstances. This presentation includes non - GAAP financial measures within the meaning of Item 10(e) of Regulation S - K, as promulgated by the SEC. While we believe the non - GAAP information included in this presentation provides supplemental information to assist investors in analyzing our financials and to assist investors in comparing our results with other peer issuers, these measures are not in accordance with GAAP, and they should not be considered a substitute for, or superior to, our financial information calculated in accordance with GAAP. Our GAAP financial results and the reconciliations from these results should be carefully evaluated . 2
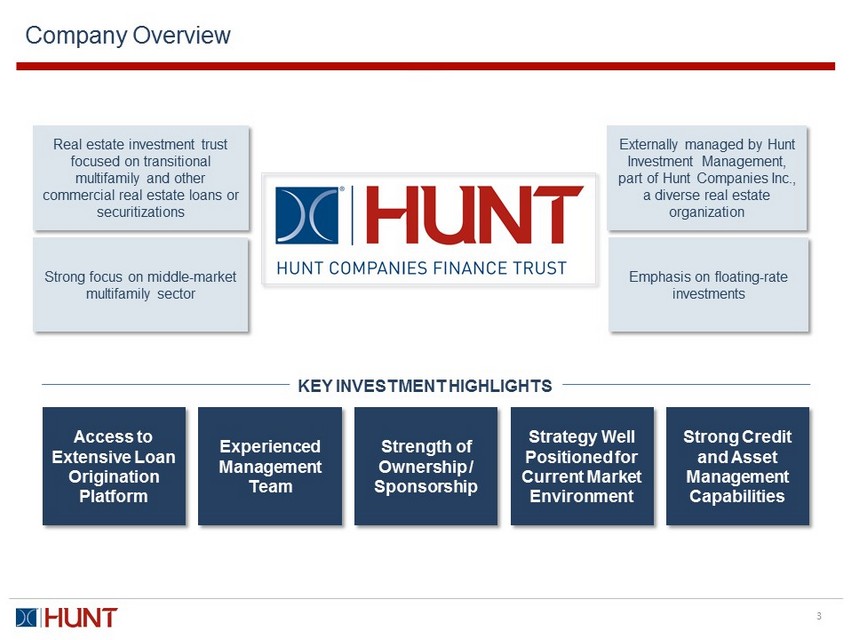
Company Overview 3 Strength of Ownership / Sponsorship Access to Extensive Loan Origination Platform Experienced Management Team Real estate investment trust focused on transitional multifamily and other commercial real estate loans or securitizations Externally managed by Hunt Investment Management, part of Hunt Companies Inc., a diverse real estate organization Strong focus on middle - market multifamily sector Emphasis on floating - rate investments Strategy Well Positioned for Current Market Environment KEY INVESTMENT HIGHLIGHTS Strong Credit and Asset Management Capabilities

Strategic Transition 4 Hunt has made significant progress in its strategic transition of HCFT since becoming the Manager in Q1 2018 ✔ Hunt acquired 9.5% of outstanding common shares at book value ✔ C apped expense reimbursements to the Manager ✔ Disposed of all of the Company’s legacy RMBS, multifamily MBS, and derivative positions and redeployed capital into the new floating rate commercial mortgage loan strategy. As of 3/31, 99% of the investment portfolio consisted of floating rate commercial mortgage loans ✔ Acquired Hunt CMT Equity, LLC, which included a commercial mortgage loan portfolio financed through Hunt CRE 2017 - FL1, loan participations, and lending licenses ✔ Closed Hunt CRE 2018 - FL2, a $285 million commercial real estate CLO transaction Continue to reinvest the Company’s available capital in furtherance of the commercial floating rate strategy Achieve a sustainable and competitive dividend yield as a % of book value Remaining Steps ✔ Improved capital structure via successful refinance of 8.75% Preferred Stock
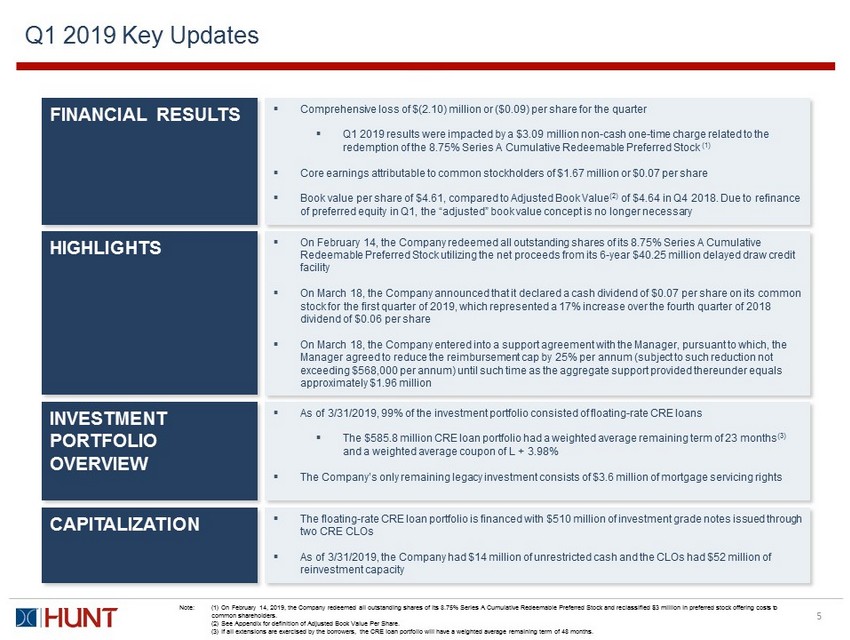
Q1 2019 Key Updates 5 FINANCIAL RESULTS ▪ Comprehensive loss of $(2.10) million or ($0.09) per share for the quarter ▪ Q1 2019 results were impacted by a $3.09 million non - cash one - time charge related to the redemption of the 8.75% Series A Cumulative Redeemable Preferred Stock (1) ▪ Core earnings attributable to common stockholders of $1.67 million or $0.07 per share ▪ Book value per share of $4.61, compared to Adjusted Book Value (2) of $4.64 in Q4 2018. Due to refinance of preferred equity in Q1, the “adjusted” book value concept is no longer necessary HIGHLIGHTS ▪ On February 14, the Company redeemed all outstanding shares of its 8.75% Series A Cumulative Redeemable Preferred Stock utilizing the net proceeds from its 6 - year $40.25 million delayed draw credit facility ▪ On March 18 , the Company announced that it declared a cash dividend of $0.07 per share on its common stock for the first quarter of 2019, which represented a 17% increase over the fourth quarter of 2018 dividend of $0.06 per share ▪ On March 18 , the Company entered into a support agreement with the Manager, pursuant to which, the Manager agreed to reduce the reimbursement cap by 25% per annum (subject to such reduction not exceeding $568,000 per annum) until such time as the aggregate support provided thereunder equals approximately $1.96 million INVESTMENT PORTFOLIO OVERVIEW ▪ As of 3/31/2019, 99% of the investment portfolio consisted of floating - rate CRE loans ▪ The $585.8 million CRE loan portfolio had a weighted average remaining term of 23 months (3) and a weighted average coupon of L + 3.98% ▪ The Company’s only remaining legacy investment consists of $3.6 million of mortgage servicing rights CAPITALIZATION ▪ The floating - rate CRE loan portfolio is financed with $510 million of investment grade notes issued through two CRE CLOs ▪ As of 3/31/2019, the Company had $14 million of unrestricted cash and the CLOs had $52 million of reinvestment capacity Note: (1) On February 14, 2019, the Company redeemed all outstanding shares of its 8.75% Series A Cumulative Redeemable Preferred S toc k and reclassified $3 million in preferred stock offering costs to common shareholders. (2) See Appendix for definition of Adjusted Book Value Per Share . (3) If all extensions are exercised by the borrowers, the CRE loan portfolio will have a weighted average remaining term of 48 months.

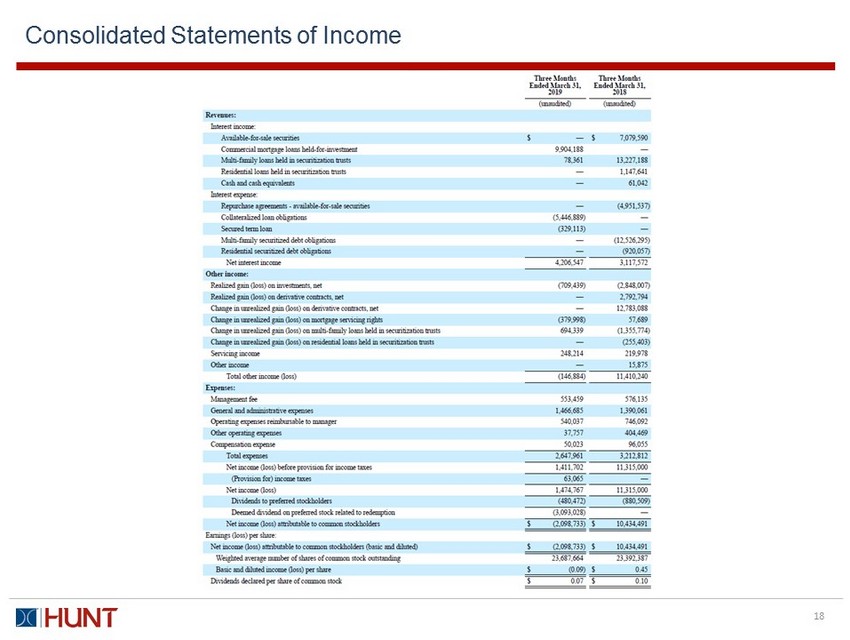
Q1 2019 Earnings Summary 6 Summary Income Statement (thousands) Three Months Ended March 31, 2019 Net interest income $4,207 Total other income (loss) (147) Operating expenses (2,648) Preferred dividends (480) (Provision for) benefit from income taxes 63 Deemed dividend on preferred stock related to redemption (3,093) Net income attributable to common stockholders $(2,099) Reclassification adjustment for net gain (loss) included in net income 0 Comprehensive income attributable to common stockholders $(2,099) Weighted average shares outstanding during the period 23,687,664 Net income per share $(0.09) Comprehensive income per share $(0.09) GAAP Comprehensive Income to Core Earnings Reconciliation (thousands) Three Months Ended March 31, 2019 Comprehensive income attributable to common stockholders $(2,099) Adjustments: Net economic losses (gains) attributable to legacy assets (1) 15 Unrealized losses (gains) on mortgage servicing rights 380 Recognized compensation expense related to restricted stock 4 Adjustment for consolidated securities 3 Adjustment for one - time charges (2) 338 Adjustment provision for (benefit from) income taxes (63) Adjustment for deemed dividend related to preferred stock redemptions 3,093 Core earnings (3) $1,671 Weighted average shares outstanding during the period 23,687,664 Core earnings per share $0.07 Dividends per share $0.07 Note: (1) Net economic losses (gains) includes unrealized gains/losses and realized gains/losses attributable to legacy assets. (2) Charges relates to professional fees paid in connection with a Q4 one - time tax expense. (3) See Appendix for definition of Core E arnings per the Management Agreement .
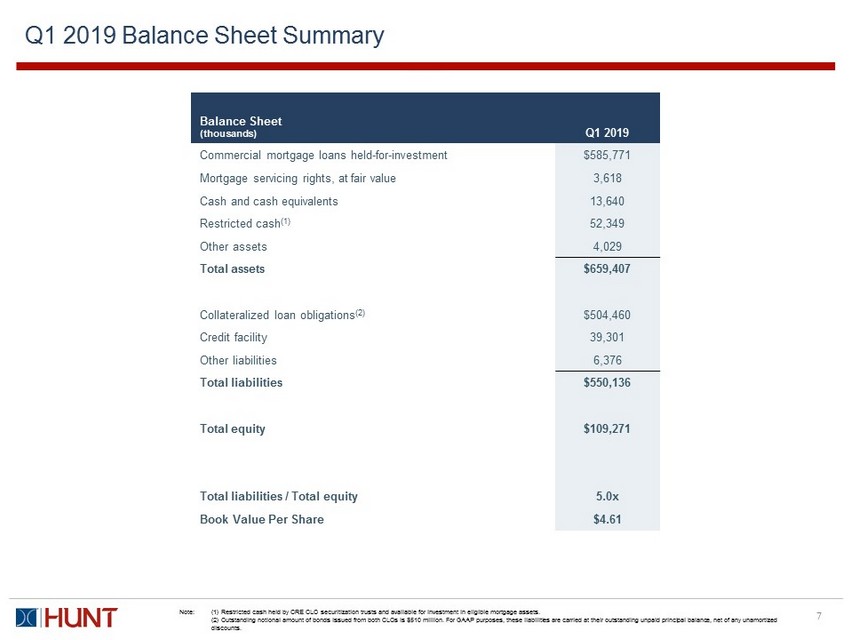
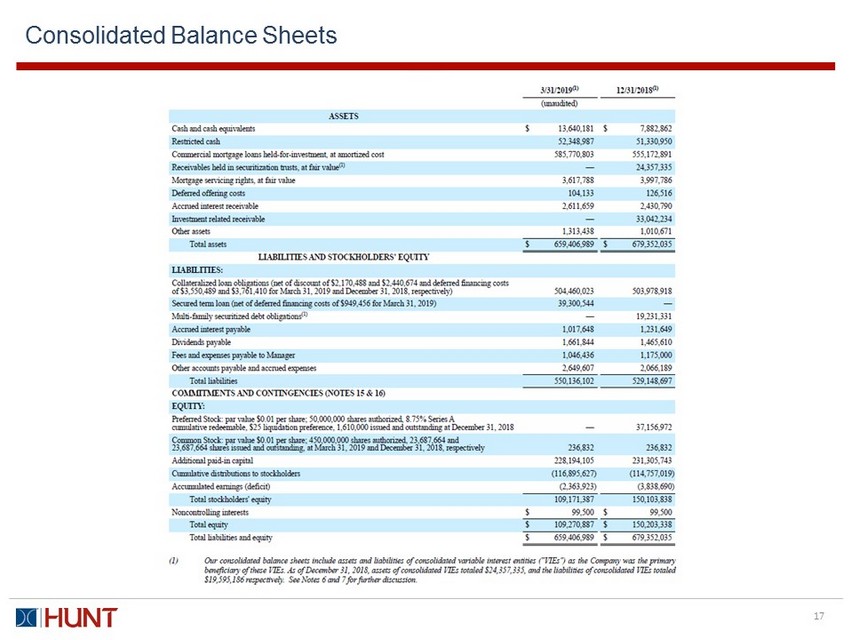
Q1 2019 Balance Sheet Summary 7 Balance Sheet (thousands) Q1 2019 Commercial mortgage loans held - for - investment $585,771 Mortgage servicing rights, at fair value 3,618 Cash and cash equivalents 13,640 Restricted cash (1) 52,349 Other assets 4,029 Total assets $659,407 Collateralized loan obligations (2) $504,460 Credit facility 39,301 Other liabilities 6,376 Total liabilities $550,136 Total equity $109,271 Total liabilities / Total equity 5.0x Book Value Per Share $4.61 Note: (1) Restricted cash held by CRE CLO securitization trusts and available for investment in eligible mortgage assets. (2) Outstanding notional amount of bonds issued from both CLOs is $510 million. For GAAP purposes, these liabilities are carr ied at their outstanding unpaid principal balance, net of any unamortized discounts.
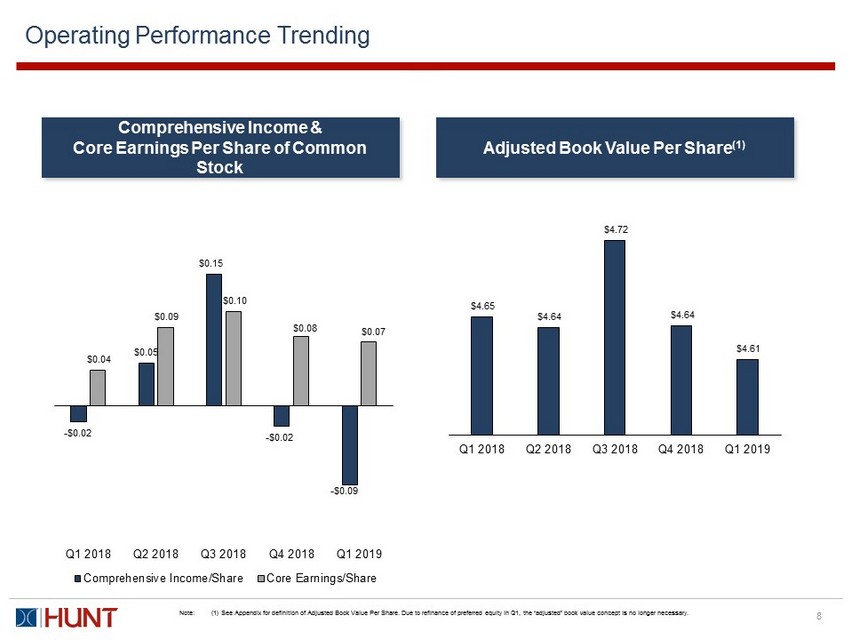
Operating Performance Trending 8 Comprehensive Income & Core Earnings Per Share of Common Stock Adjusted Book Value Per Share (1) Note: (1) See Appendix for definition of Adjusted Book Value Per Share. Due to refinance of preferred equity in Q1, the “adjusted” book value concept is no longer necessary. - $0.02 $0.05 $0.15 - $0.02 - $0.09 $0.04 $0.09 $0.10 $0.08 $0.07 Q1 2018 Q2 2018 Q3 2018 Q4 2018 Q1 2019 Comprehensive Income/Share Core Earnings/Share $4.65 $4.64 $4.72 $4.64 $4.61 Q1 2018 Q2 2018 Q3 2018 Q4 2018 Q1 2019
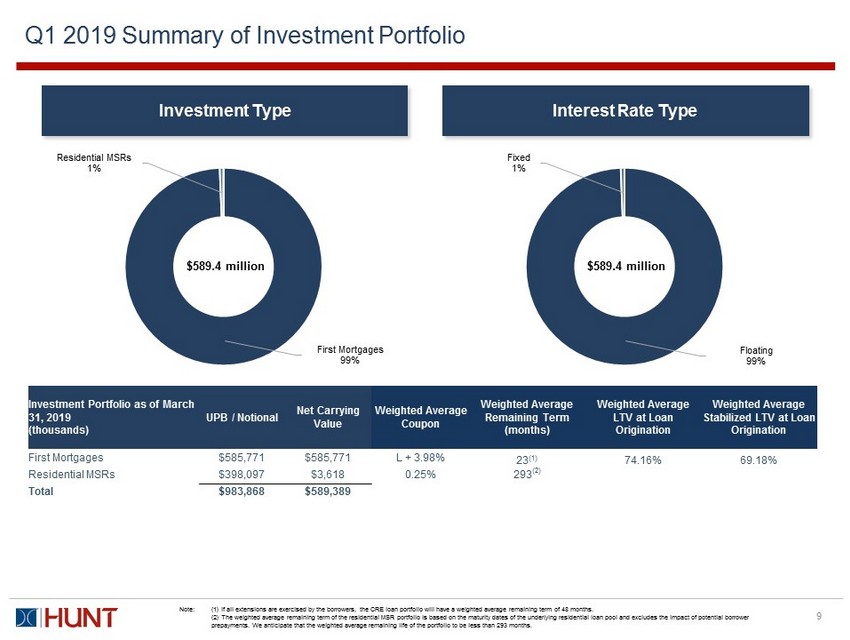
Q1 2019 Summary of Investment Portfolio 9 Floating 99% Fixed 1% First Mortgages 99% Residential MSRs 1% Investment Portfolio as of March 31 , 2019 (thousands) UPB / Notional Net Carrying Value Weighted Average Coupon Weighted Average Remaining Term (months) Weighted Average LTV at Loan Origination Weighted Average Stabilized LTV at Loan Origination First Mortgages $ 585,771 $ 585,771 L + 3.98% 23 (1 ) 74.16% 69.18% Residential MSRs $398,097 $3,618 0.25% 293 (2) Total $983,868 $589,389 Note: (1) If all extensions are exercised by the borrowers, the CRE loan portfolio will have a weighted average remaining term of 48 months. (2) The weighted average remaining term of the residential MSR portfolio is based on the maturity dates of the underlying res ide ntial loan pool and excludes the impact of potential borrower prepayments. We anticipate that the weighted average remaining life of the portfolio to be less than 293 months. Investment Type Interest Rate Type $589.4 million $589.4 million
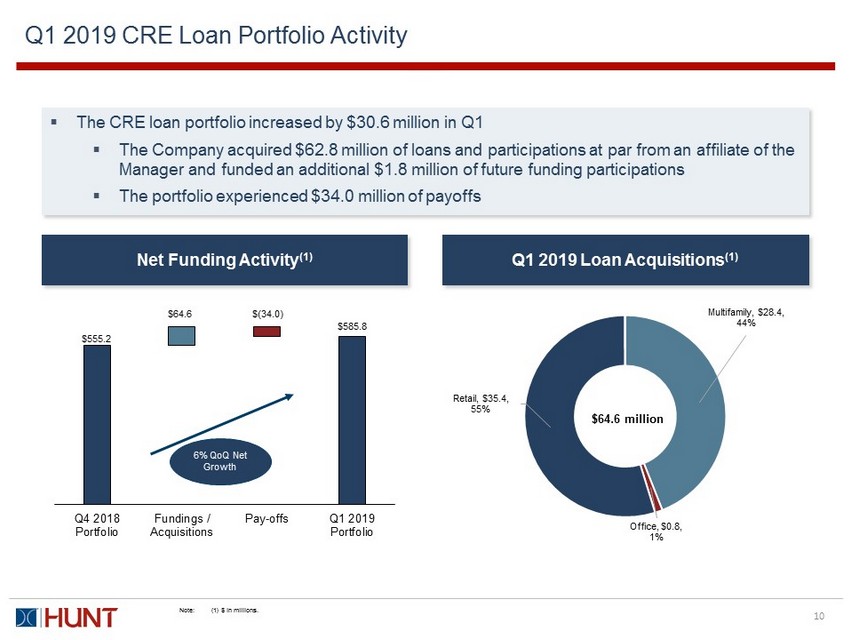
Q1 2019 CRE Loan Portfolio Activity 10 $555.2 $64.6 $(34.0) $585.8 Q4 2018 Portfolio Fundings / Acquisitions Pay-offs Q1 2019 Portfolio Multifamily , $28.4 , 44% Office , $0.8 , 1% Retail , $35.4 , 55% Net Funding Activity (1) Q1 2019 Loan Acquisitions (1) ▪ The CRE loan portfolio increased by $30.6 million in Q1 ▪ The Company acquired $62.8 million of loans and participations at par from an affiliate of the Manager and funded an additional $1.8 million of future funding participations ▪ The portfolio experienced $34.0 million of payoffs 6% QoQ Net Growth $64.6 million Note: (1) $ In millions.
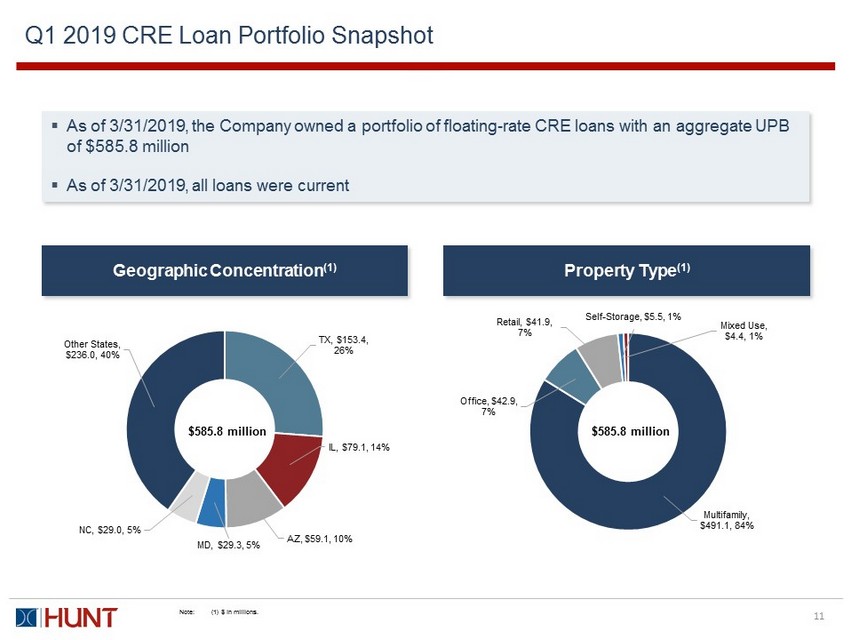
Q1 2019 CRE Loan Portfolio Snapshot 11 TX , $153.4 , 26% IL , $79.1 , 14% AZ , $59.1 , 10% MD , $29.3 , 5% NC , $29.0 , 5% Other States , $236.0 , 40% Geographic Concentration (1) Multifamily , $491.1 , 84% Office , $42.9 , 7% Retail , $41.9 , 7% Self - Storage , $5.5 , 1% Mixed Use , $4.4 , 1% Property Type (1) ▪ As of 3/31/2019, the Company owned a portfolio of floating - rate CRE loans with an aggregate UPB of $585.8 million ▪ As of 3/31/2019, all loans were current $585.8 million $585.8 million Note: (1) $ In millions.
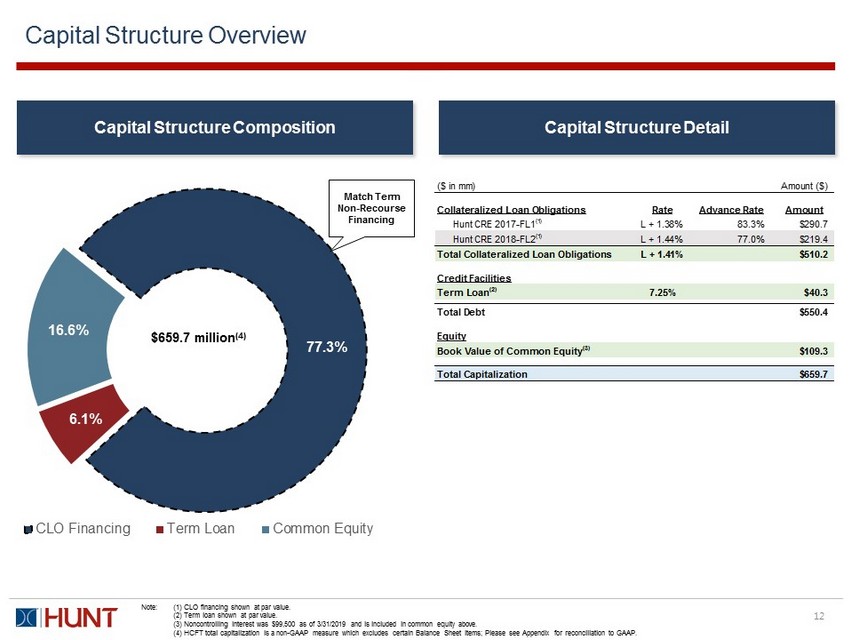
77.3% 6.1% 16.6% CLO Financing Term Loan Common Equity $659.7 million (4) Capital Structure Overview 12 Capital Structure Composition Capital Structure Detail Note: (1) CLO financing shown at par value. (2) Term loan shown at par value. (3) Noncontrolling interest was $99,500 as of 3/31/2019 and is included in common equity above. (4) HCFT total capitalization is a non - GAAP measure which excludes certain Balance Sheet items; Please see Appendix for reconcil iation to GAAP. Match Term Non - Recourse Financing ($ in mm) Amount ($) Collateralized Loan Obligations Rate Advance Rate Amount Hunt CRE 2017-FL1(1) L + 1.38% 83.3% $290.7 Hunt CRE 2018-FL2(1) L + 1.44% 77.0% $219.4 Total Collateralized Loan Obligations L + 1.41% $510.2 Credit Facilities Term Loan(2) 7.25% $40.3 Total Debt $550.4 Equity Book Value of Common Equity(3) $109.3 Total Capitalization $659.7
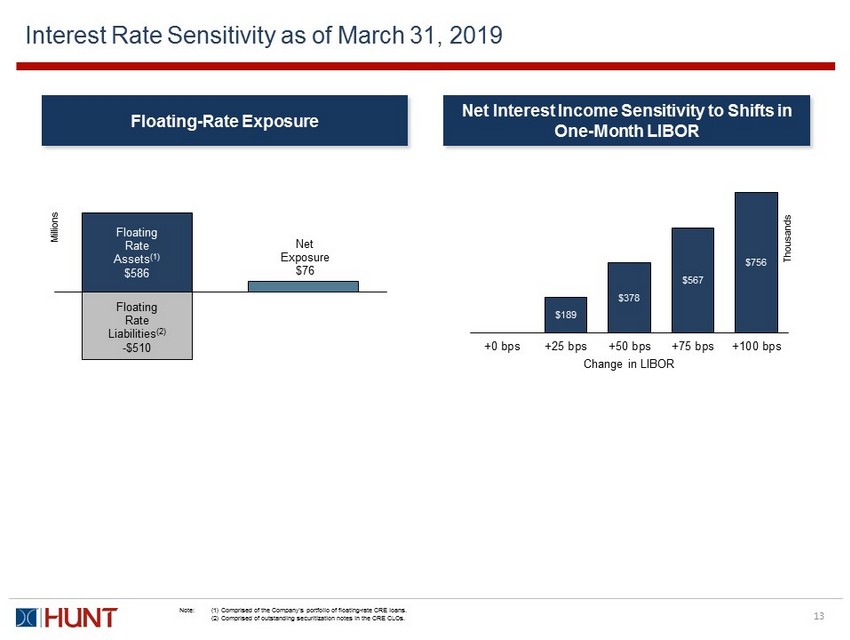
Interest Rate Sensitivity as of March 31, 2019 13 Floating Rate Assets (1) $586 Floating Rate Liabilities (2) - $510 Net Exposure $76 $189 $378 $567 $756 +0 bps +25 bps +50 bps +75 bps +100 bps Thousands Change in LIBOR Floating - Rate Exposure Net Interest Income Sensitivity to Shifts in One - Month LIBOR Millions Note: (1) Comprised of the Company’s portfolio of floating - rate CRE loans. (2) Comprised of outstanding securitization notes in the CRE CLOs.
14 Appendix
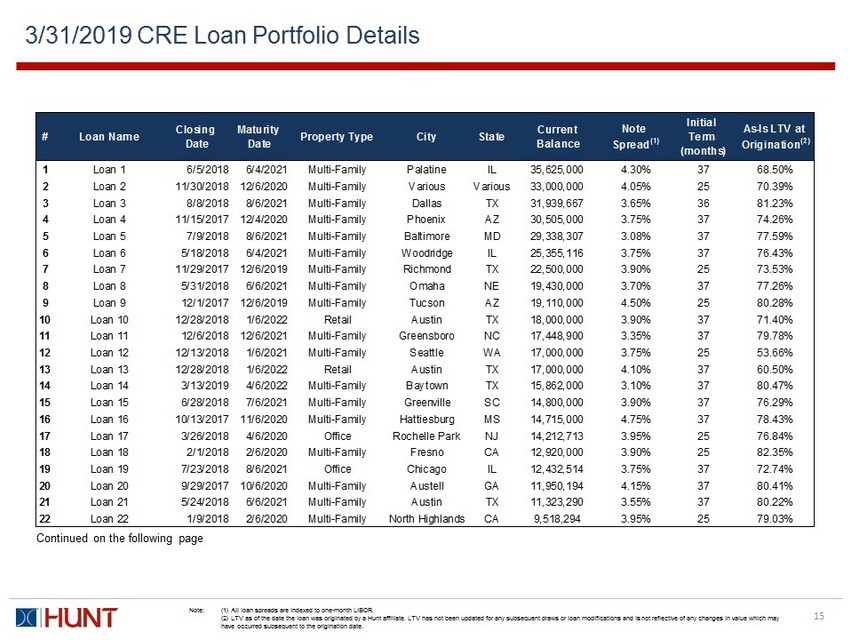
3/31/2019 CRE Loan Portfolio Details 15 Continued on the following page Note: (1) All loan spreads are indexed to one - month LIBOR. (2) LTV as of the date the loan was originated by a Hunt affiliate. LTV has not been updated for any subsequent draws or loan mo difications and is not reflective of any changes in value which may have occurred subsequent to the origination date. # Loan Name Closing Date Maturity Date Property Type City State Current Balance Note Spread (1) Initial Term (months) As-Is LTV at Origination (2) 1 Loan 1 6/5/2018 6/4/2021 Multi-Family Palatine IL 35,625,000 4.30% 37 68.50% 2 Loan 2 11/30/2018 12/6/2020 Multi-Family Various Various 33,000,000 4.05% 25 70.39% 3 Loan 3 8/8/2018 8/6/2021 Multi-Family Dallas TX 31,939,667 3.65% 36 81.23% 4 Loan 4 11/15/2017 12/4/2020 Multi-Family Phoenix AZ 30,505,000 3.75% 37 74.26% 5 Loan 5 7/9/2018 8/6/2021 Multi-Family Baltimore MD 29,338,307 3.08% 37 77.59% 6 Loan 6 5/18/2018 6/4/2021 Multi-Family Woodridge IL 25,355,116 3.75% 37 76.43% 7 Loan 7 11/29/2017 12/6/2019 Multi-Family Richmond TX 22,500,000 3.90% 25 73.53% 8 Loan 8 5/31/2018 6/6/2021 Multi-Family Omaha NE 19,430,000 3.70% 37 77.26% 9 Loan 9 12/1/2017 12/6/2019 Multi-Family Tucson AZ 19,110,000 4.50% 25 80.28% 10 Loan 10 12/28/2018 1/6/2022 Retail Austin TX 18,000,000 3.90% 37 71.40% 11 Loan 11 12/6/2018 12/6/2021 Multi-Family Greensboro NC 17,448,900 3.35% 37 79.78% 12 Loan 12 12/13/2018 1/6/2021 Multi-Family Seattle WA 17,000,000 3.75% 25 53.66% 13 Loan 13 12/28/2018 1/6/2022 Retail Austin TX 17,000,000 4.10% 37 60.50% 14 Loan 14 3/13/2019 4/6/2022 Multi-Family Baytown TX 15,862,000 3.10% 37 80.47% 15 Loan 15 6/28/2018 7/6/2021 Multi-Family Greenville SC 14,800,000 3.90% 37 76.29% 16 Loan 16 10/13/2017 11/6/2020 Multi-Family Hattiesburg MS 14,715,000 4.75% 37 78.43% 17 Loan 17 3/26/2018 4/6/2020 Office Rochelle Park NJ 14,212,713 3.95% 25 76.84% 18 Loan 18 2/1/2018 2/6/2020 Multi-Family Fresno CA 12,920,000 3.90% 25 82.35% 19 Loan 19 7/23/2018 8/6/2021 Office Chicago IL 12,432,514 3.75% 37 72.74% 20 Loan 20 9/29/2017 10/6/2020 Multi-Family Austell GA 11,950,194 4.15% 37 80.41% 21 Loan 21 5/24/2018 6/6/2021 Multi-Family Austin TX 11,323,290 3.55% 37 80.22% 22 Loan 22 1/9/2018 2/6/2020 Multi-Family North Highlands CA 9,518,294 3.95% 25 79.03%
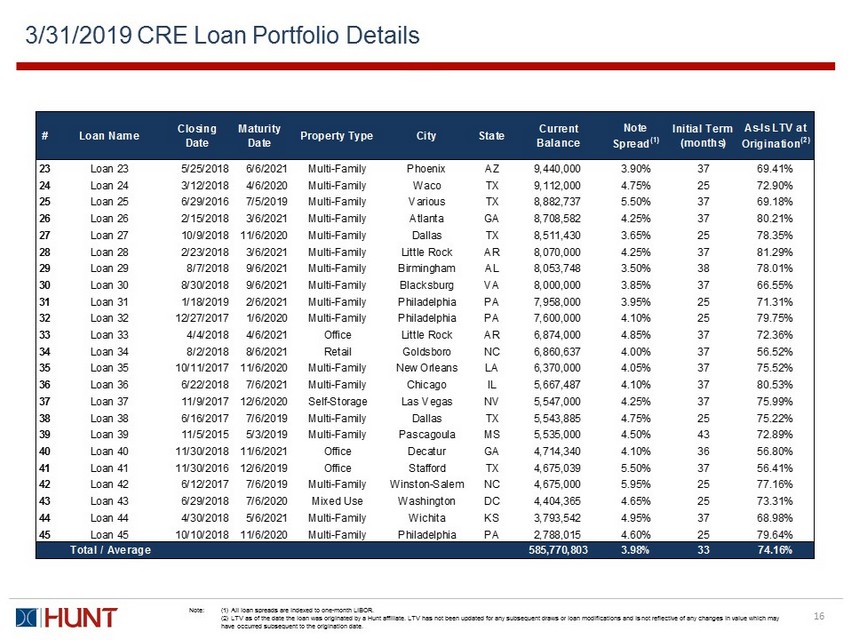
3/31/2019 CRE Loan Portfolio Details 16 Note: (1) All loan spreads are indexed to one - month LIBOR. (2) LTV as of the date the loan was originated by a Hunt affiliate. LTV has not been updated for any subsequent draws or loan mo difications and is not reflective of any changes in value which may have occurred subsequent to the origination date. # Loan Name Closing Date Maturity Date Property Type City State Current Balance Note Spread (1) Initial Term (months) As-Is LTV at Origination (2) 23 Loan 23 5/25/2018 6/6/2021 Multi-Family Phoenix AZ 9,440,000 3.90% 37 69.41% 24 Loan 24 3/12/2018 4/6/2020 Multi-Family Waco TX 9,112,000 4.75% 25 72.90% 25 Loan 25 6/29/2016 7/5/2019 Multi-Family Various TX 8,882,737 5.50% 37 69.18% 26 Loan 26 2/15/2018 3/6/2021 Multi-Family Atlanta GA 8,708,582 4.25% 37 80.21% 27 Loan 27 10/9/2018 11/6/2020 Multi-Family Dallas TX 8,511,430 3.65% 25 78.35% 28 Loan 28 2/23/2018 3/6/2021 Multi-Family Little Rock AR 8,070,000 4.25% 37 81.29% 29 Loan 29 8/7/2018 9/6/2021 Multi-Family Birmingham AL 8,053,748 3.50% 38 78.01% 30 Loan 30 8/30/2018 9/6/2021 Multi-Family Blacksburg VA 8,000,000 3.85% 37 66.55% 31 Loan 31 1/18/2019 2/6/2021 Multi-Family Philadelphia PA 7,958,000 3.95% 25 71.31% 32 Loan 32 12/27/2017 1/6/2020 Multi-Family Philadelphia PA 7,600,000 4.10% 25 79.75% 33 Loan 33 4/4/2018 4/6/2021 Office Little Rock AR 6,874,000 4.85% 37 72.36% 34 Loan 34 8/2/2018 8/6/2021 Retail Goldsboro NC 6,860,637 4.00% 37 56.52% 35 Loan 35 10/11/2017 11/6/2020 Multi-Family New Orleans LA 6,370,000 4.05% 37 75.52% 36 Loan 36 6/22/2018 7/6/2021 Multi-Family Chicago IL 5,667,487 4.10% 37 80.53% 37 Loan 37 11/9/2017 12/6/2020 Self-Storage Las Vegas NV 5,547,000 4.25% 37 75.99% 38 Loan 38 6/16/2017 7/6/2019 Multi-Family Dallas TX 5,543,885 4.75% 25 75.22% 39 Loan 39 11/5/2015 5/3/2019 Multi-Family Pascagoula MS 5,535,000 4.50% 43 72.89% 40 Loan 40 11/30/2018 11/6/2021 Office Decatur GA 4,714,340 4.10% 36 56.80% 41 Loan 41 11/30/2016 12/6/2019 Office Stafford TX 4,675,039 5.50% 37 56.41% 42 Loan 42 6/12/2017 7/6/2019 Multi-Family Winston-Salem NC 4,675,000 5.95% 25 77.16% 43 Loan 43 6/29/2018 7/6/2020 Mixed Use Washington DC 4,404,365 4.65% 25 73.31% 44 Loan 44 4/30/2018 5/6/2021 Multi-Family Wichita KS 3,793,542 4.95% 37 68.98% 45 Loan 45 10/10/2018 11/6/2020 Multi-Family Philadelphia PA 2,788,015 4.60% 25 79.64% Total / Average 585,770,803 3.98% 33 74.16%
Consolidated Balance Sheets 17
Consolidated Statements of Income 18
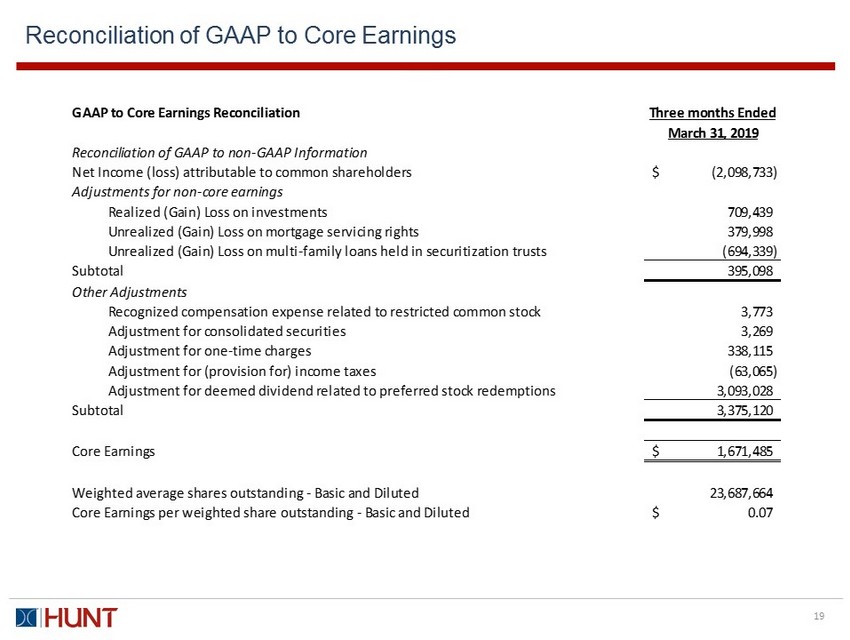
Reconciliation of GAAP to Core Earnings 19 GAAP to Core Earnings Reconciliation Three months Ended March 31, 2019 Reconciliation of GAAP to non-GAAP Information Net Income (loss) attributable to common shareholders (2,098,733)$ Adjustments for non-core earnings Realized (Gain) Loss on investments 709,439 Unrealized (Gain) Loss on mortgage servicing rights 379,998 Unrealized (Gain) Loss on multi-family loans held in securitization trusts (694,339) Subtotal 395,098 Other Adjustments Recognized compensation expense related to restricted common stock 3,773 Adjustment for consolidated securities 3,269 Adjustment for one-time charges 338,115 Adjustment for (provision for) income taxes (63,065) Adjustment for deemed dividend related to preferred stock redemptions 3,093,028 Subtotal 3,375,120 Core Earnings 1,671,485$ Weighted average shares outstanding - Basic and Diluted 23,687,664 Core Earnings per weighted share outstanding - Basic and Diluted 0.07$
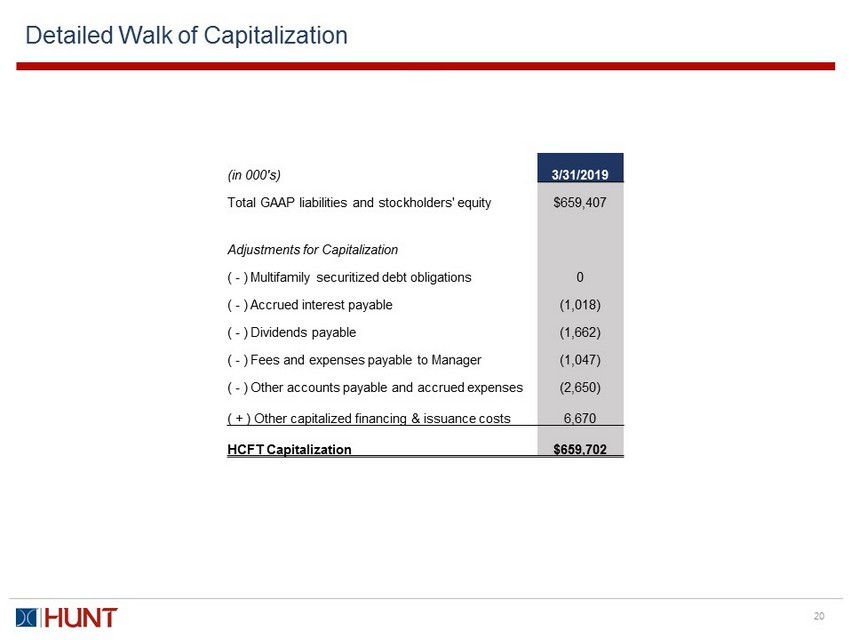
Detailed Walk of Capitalization 20 (in 000's) 3/31/2019 Total GAAP liabilities and stockholders' equity $659,407 Adjustments for Capitalization ( - ) Multifamily securitized debt obligations 0 ( - ) Accrued interest payable (1,018) ( - ) Dividends payable (1,662) ( - ) Fees and expenses payable to Manager (1,047) ( - ) Other accounts payable and accrued expenses (2,650) ( + ) Other capitalized financing & issuance costs 6,670 HCFT Capitalization $659,702
Key Definitions “ Adjusted Book Value Per Share ” means a non - GAAP metric of common stockholders’ equity per share calculated as: a) total stockholders’ equity computed in accordance with GAAP less the value of the issued and outstanding preferred stock at its stated liquidation preference of $25.00 per share, divided by b) the weighted average number of shares of common stock issued and outstanding during the period. “ Core Earnings ” means the net income (loss) attributable to the holders of Common Shares or, without duplication, owners of the Company’s Subsidiaries, computed in accordance with GAAP, including realized losses not otherwise included in GAAP net income (loss) and excluding (i) non - cash equity compensation expense, (ii) incentive compensation payable to the Manager, (iii) depreciation and amortization, (iv) any unrealized gains or losses or other similar non - cash items that are included in net income for the applicable reporting period, regardless of whether such items are included in other comprehensive income or loss, or in net income, and (v) one - time events pursuant to changes in GAAP and certain material non - cash income or expense items after discussions Hunt Investment Management, LLC and the Company’s board of directors and approval by a majority of the Company’s independent directors. “ Stockholder’s Equity ” means: (a) the sum of the net proceeds from any issuances of the Company’s equity securities (excluding preferred securities solely for purposes of Incentive Compensation but including preferred securities for all other purposes of this Agreement) since inception (allocated on a pro rata daily basis for such issuances during the fiscal quarter of any such issuance; plus (b) the Company’s retained earnings at the end of such fiscal quarter (without taking into account any non - cash equity compensation expense or other non - cash items described below incurred in current or prior periods); less (c) any amount that the Company pays for repurchases of its Common Shares; and (d) excluding (i) any unrealized gains, losses or other non - cash items that have impacted the Company’s Stockholders’ Equity as reported in the Company’s financial statements prepared in accordance with GAAP, regardless of whether such items are included in other comprehensive income or loss, or in net income, and (ii) adjustments relating to one - time events pursuant to changes in GAAP and certain other noncash charges after discussions between the Hunt Investment Management, LLC and the Company’s board of directors and approval by a majority of the Company’s independent directors. 21

22