UNITED STATES
SECURITIES AND EXCHANGE COMMISSION
Washington, D.C. 20549
FORM N-CSR
CERTIFIED SHAREHOLDER REPORT OF REGISTERED MANAGEMENT
INVESTMENT COMPANIES
Investment Company Act File number 811-22698
KraneShares Trust
(Exact name of registrant as specified in charter)
280 Park Avenue
32nd Floor
New York, New York 10017
(Address of principal executive offices) (Zip code)
Jonathan Krane
KraneShares Trust
280 Park Avenue
32nd Floor
New York, New York 10017
(Name and address of agent for service)
Copy to:
Stacy L. Fuller
K&L Gates LLP
1601 K Street NW
Washington, DC 20006-1600
Registrant’s telephone number, including area code: (855) 857-2638
Date of fiscal year end: March 31, 2021
Date of reporting period: March 31, 2021
| Item 1. | Reports to Stockholders. |
A copy of the report transmitted to stockholders pursuant to Rule 30e-1 under the Investment Company Act, as amended [17 CFR § 270.30e-1], are attached hereto.
| | Annual Report KFA Large Cap Quality Dividend Index ETF KFA Small Cap Quality Dividend Index ETF KFA Dynamic Fixed Income ETF KFA Value Line® Dynamic Core Equity Index ETF KFA Mount Lucas Index Strategy ETF March 31, 2021 | | |
Table of Contents
The Funds file their complete schedules of Fund holdings with the Securities and Exchange Commission (the “Commission”) for the first and third quarters of each fiscal year as an exhibit to its reports on Form N-PORT within sixty days after the end of the period. The Funds’ Form N-PORT are available on the Commission’s website at http://www.sec.gov, and may be reviewed and copied at the Commission’s Public Reference Room in Washington, DC. Information on the operation of the Public Reference Room may be obtained by calling 1-800-SEC-0330.
A description of the policies and procedures that KraneShares Trust uses to determine how to vote proxies relating to Fund securities, as well as information relating to how the Funds voted proxies relating to Fund securities during the most recent 12-month year ended June 30, are available (i) without charge, upon request, by calling 855-857-2638; and (ii) on the Commission’s website at http://www.sec.gov.
Fund shares may only be purchased or redeemed from a Fund in large Creation Unit aggregations. Investors who cannot transact in Creation Units of a Fund’s shares must buy or sell Fund shares in the secondary market at their market price, which may be at a premium or discount to a Fund’s net asset value, with the assistance of a broker. In doing so, the investor may incur brokerage commissions and may pay more than net asset value when buying Fund shares and receive less than net asset value when selling Fund shares.
Shareholder Letter (Unaudited)
Dear Shareholders:
We are pleased to provide you with the Annual Report for KFA Funds exchange-traded funds (“ETFs”) for the 12-month period ended March 31, 2021. Despite recent market volatility, we are encouraged by the long-term prospects for our differentiated, high-conviction investment strategies. Thank you for investing with us.
For the period, the ETFs delivered the following returns*:
Fund | | Return* | | Underlying
Index Return** |
KFA Large Cap Quality Dividend Index ETF (KLCD) | | 48.30 | % | | 49.26 | % |
KFA Small Cap Quality Dividend Index ETF(KSCD) | | 39.27 | % | | 40.21 | % |
KFA Dynamic Fixed Income ETF (KDFI) | | 5.79 | % | | 11.65 | % |
KFA Value Line® Dynamic Core Equity Index ETF (KVLE) | | 15.46 | %^ | | 15.22 | %^ |
KFA Mount Lucas Index Strategy ETF (KMLM) | | 10.20 | %^ | | 10.45 | %^ |
As the US economy reopens following the coronavirus pandemic, we believe that investing in diversifying stock and bond strategies is an important way to help manage portfolio risk while benefiting from improving market conditions.
Jonathan Krane, CEO
March 31, 2020
* Returns based on change in net asset value since inception (less than one-year period) as of March 31, 2021
^ Return period since Fund inception (less than one-year period)
** The underlying indexes and their definitions are as follows:
The Underlying Index for the KFA Large Cap Quality Dividend Index ETF is the Russell 1000 Dividend Select Equal Weight Index. The Russell 1000 Dividend Select Equal Weight Index is designed to measure the performance of US companies that have successfully increased their dividend payments over a period of ten years. On a quarterly basis the highest-ranking companies based on momentum are selected and equally weighted to form the final index, capturing the large cap domestic market. The index is designed to provide a benchmark for investors looking to capture a concentrated portfolio of constituents demonstrating increased dividends and positive momentum.
The Underlying Index for the KFA Small Cap Quality Dividend Index ETF is the Russell 2000 Dividend Select Equal Weight Index. The Russell 2000 Dividend Select Equal Weight Index is designed to measure the performance of US companies that have successfully increased their dividend payments over a period of ten years. On a quarterly basis the highest-ranking companies based on momentum are selected and equally weighted to form the final index, capturing the small cap domestic market. The index is designed to provide a benchmark for investors looking to capture a concentrated portfolio of constituents demonstrating increased dividends and positive momentum.
The Underlying Index for the KFA Dynamic Fixed Income ETF is the FTSE US High-Yield Treasury Rotation Index. The FTSE US High-Yield Treasury Rotation Index is designed to provide a benchmark for investors looking to capture risk-managed exposure to High-Yield credit and US Treasuries. The FTSE US High-Yield Treasury Rotation Index rotates between the following three sub-indexes: FTSE US Treasury 1-5 Years Index, FTSE US Treasury 7-10 Years Index, and the FTSE US High-Yield Market BB/B Rated Capped Custom Index. During quarterly reviews, the cumulative quarterly return of these three indexes is compared and the index with the highest return across that period receives the full allocation for the coming quarter.
1
Shareholder Letter (Unaudited) (concluded)
The Underlying Index for the KFA Value Line® Dynamic Core Equity Index ETF is the 3D/L Value Line® Dynamic Core Equity Index. The 3D/L Value Line® Dynamic Core Equity Index introduces a market adaptive approach to investing in US large cap companies. The strategy seeks to capture quality US companies based on a three-factor process that selects stocks with high dividend yields and are the highest rated among Value Line®’s Safety™ and Timeliness™ Ranking Systems. Careful quantitative modelling, that incorporates a unique set of risk management tools, adjusts the beta of the overall portfolio based on the market environment. The index is rebalanced monthly.
The Underlying Index for the KFA Mount Lucas Index Strategy ETF is the KFA MLM Index. The KFA MLM Index is a diversified trend following portfolio of commodity, currency, and global fixed income futures contracts traded on US and foreign exchanges. The performance data for the index is a representation of the MLM Index from 1/1/1988 to 12/31/2004, the MLM Index EV (“EV”), with enhanced Execution and Volatility characteristics, from 1/1/2005 to 11/30/2020, and, using the same methodology as the “EV,” the KFA MLM Index from 12/1/2020 on.
2
Management Discussion of Fund Performance (Unaudited)
KFA Large Cap Quality Dividend Index ETF
The KFA Large Cap Quality Dividend Index ETF (the “Fund”) seeks to provide investment results that, before fees and expenses, correlate generally to the price and yield performance of the Russell 1000 Dividend Select Equal Weight Index (the ‘‘Underlying Index’’).
The Underlying Index is designed to measure the performance of US companies that have successfully increased their dividend payments over a period of ten years. On a quarterly basis the highest-ranking companies based on momentum are selected and equally weighted to form the final index, capturing the large cap domestic market.
Global equity markets continued their upward trend in the second half of 2020, powered by growth and technology stocks as pandemic-induced trends favorable to the internet sector persisted worldwide. In 2021, vaccine availability turbocharged a global economic recovery, leading to a cyclical/value rotation that placed considerable pressure on growth stocks. This downside pressure was compounded by the March wind-down of leveraged bets. Meanwhile, the yield on the 10-Year US Treasury bond increased by nearly 0.75% in the first three months of 2021 from 0.92% to 1.64% despite no action from the US Federal Reserve (the Fed), and accompanied by a rise in inflation in the United States.
Dividend paying large cap stocks gained for the period. The large cap stocks included in the Russell 1000 Index enjoyed a strong rebound from their March 2020 lows and the dividend paying stocks within the index were not left behind in that rebound. The Fund also benefitted from the continued rotation to value stocks seen at the end of 2020 and beginning of 2021. Companies in the industrial and financial sectors contributed the most to the Fund’s performance for the period on the resumption of normal economic activity and speculation of rising interest rates, respectively.
We see two potential catalysts for the US dividend-paying equity market in the year to come:
• A continuation of the rotation into value/cyclical stocks seen in the first quarter of 2021.
• An improving economy powered by vaccine distribution and the subsequent relaxation of pandemic restrictions on economic activity.
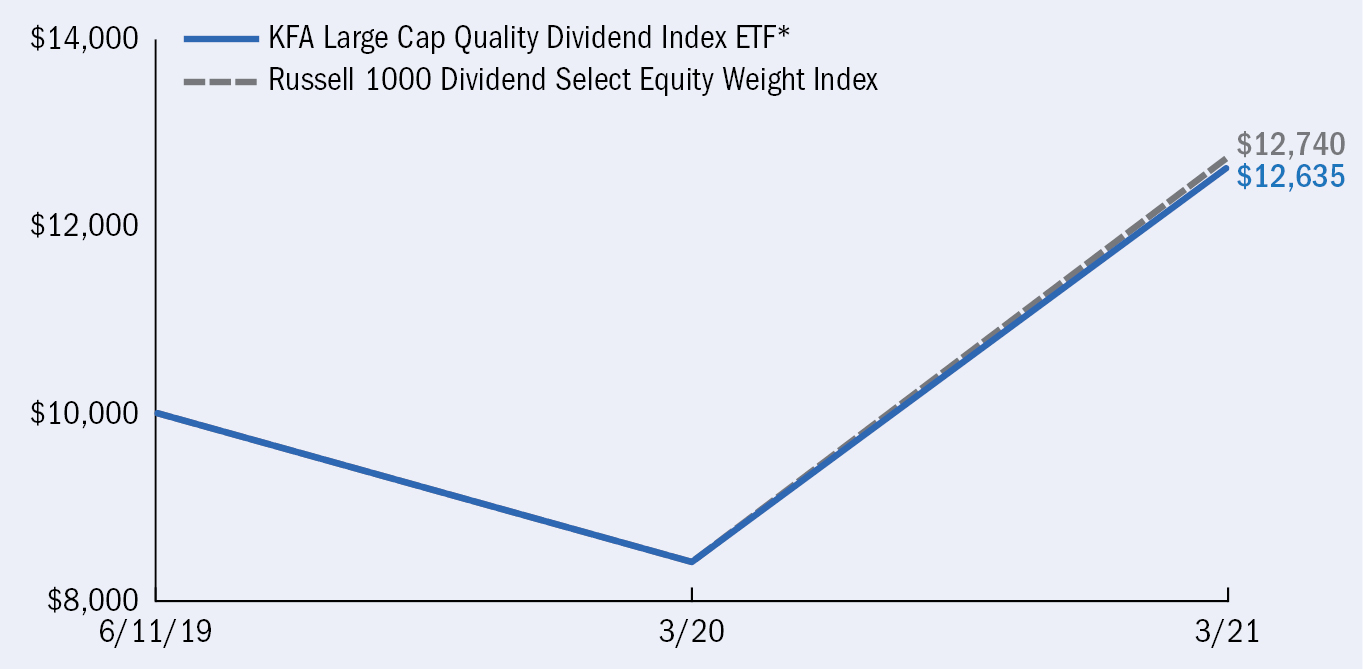
For the one-year period ending on March 31, 2021 (the “reporting period”), the NAV of the Fund increased by 48.30%, while the Underlying Index increased by 49.26%.
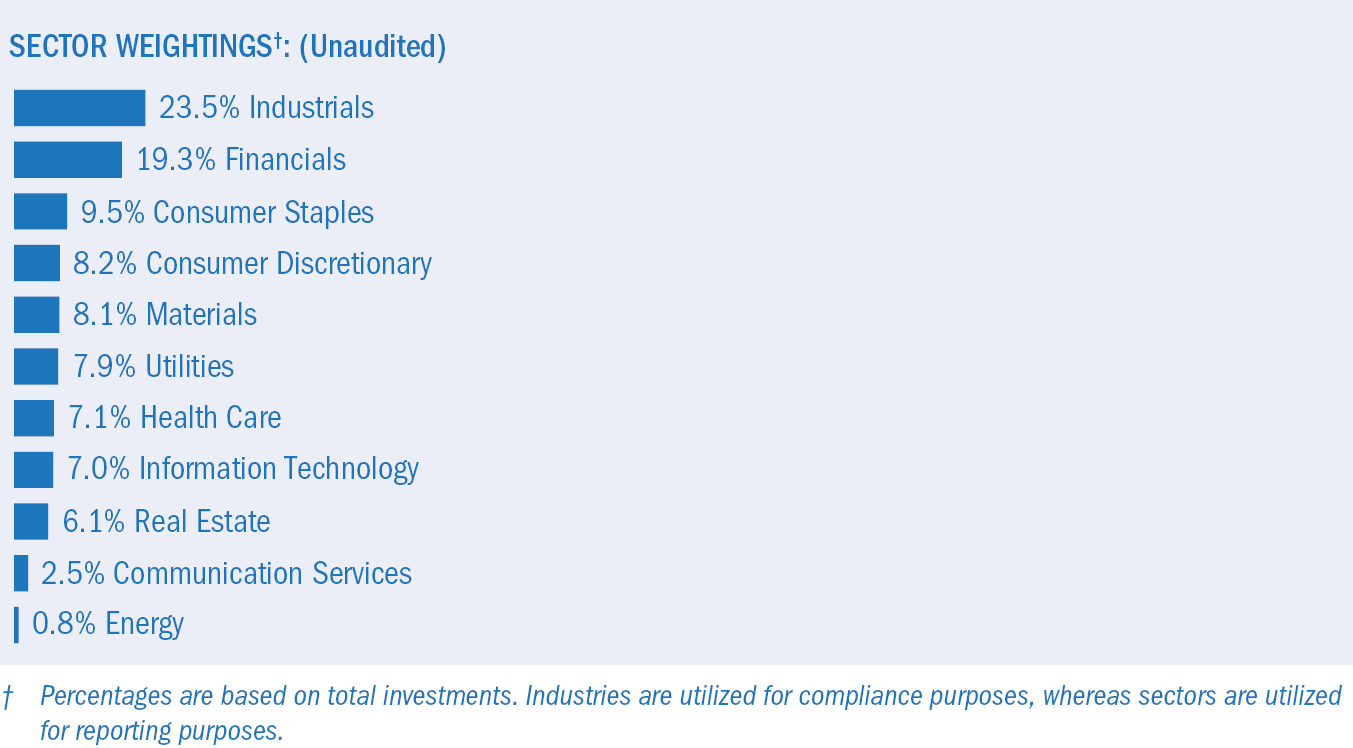
At the end of the reporting period, the Fund held 23.44% of the portfolio in the Industrials sector, 19.27% in the Financials sector, and 9.55% in the Consumer Staples sector, which represent the Fund’s top three sector weightings.
3
Management Discussion of Fund Performance (Unaudited) (continued)
KFA Large Cap Quality Dividend Index ETF (concluded)
Growth of a $10,000 Investment‡
(at Net Asset Value)‡
AVERAGE TOTAL RETURN FOR THE PERIOD ENDED MARCH 31, 2021*
| | One Year
Return | | Annualized
Inception to Date |
| | | Net Asset
Value | | Market
Price^ | | Net Asset
Value | | Market
Price^ |
KFA Large Cap Quality Dividend Index ETF | | 48.30 | % | | 48.72 | %‡ | | 13.85 | %‡ | | 14.12 | %‡ |
Russell 1000 Dividend Select Equal Weight Index | | N/A | | | 49.26 | %‡ | | N/A | | | 14.35 | %‡ |
Russell 1000 Index | | N/A | | | 60.59 | %‡ | | N/A | | | 22.64 | %‡ |
| * | The Fund commenced operations on June 11, 2019. |
| ^ | Beginning December 23, 2020, market price returns are based on the official closing price of an ETF share or, if the official closing price isn’t available, the midpoint between the national best bid and national best offer (“NBBO”) as of the time the ETF calculates current NAV per share. Prior to that date, market price returns were based on the midpoint between the Bid and Ask price. NAVs are calculated using prices as of 4:00 PM Eastern Time. |
The performance data quoted herein represents past performance and the return and value of an investment in the Fund will fluctuate so that, when redeemed, may be worth less than its original cost. Current performance may be lower or higher than the performance data quoted. Past performance is no guarantee of future performance and should not be considered as a representation of the future results of the Fund. For performance data current to the most recent month end, please call (855-857-2638) or visit www.kraneshares.com. The Fund’s performance assumes the reinvestment of all dividends and all capital gains. Index returns assume reinvestment of dividends and, unlike a Fund’s returns, do not reflect any fees or expenses. If such fees and expenses were included in the index returns, the performance would have been lower. As stated in the Fund’s prospectus, the Fund’s operating expense ratio is 0.42%. Please note that one cannot invest directly in an unmanaged index. There are no assurances that the Fund will meet its stated objectives. The Fund’s holdings and allocations are subject to change and should not be considered recommendations to buy individual securities. For further information on the Fund’s objectives, risks, and strategies, see the Fund’s prospectus. Returns shown do not reflect the deduction of taxes that a shareholder would pay on Fund distributions or the redemption of Fund shares.
See definition of comparative indices on pages 1 thru 2.
4
Management Discussion of Fund Performance (Unaudited) (continued)
KFA Small Cap Quality Dividend Index ETF
The KFA Small Cap Quality Dividend Index ETF (the “Fund”) seeks to provide investment results that, before fees and expenses, correlate generally to the price and yield performance of the Russell 2000 Dividend Select Equal Weight Index (the ‘‘Underlying Index’’).
The Underlying Index is designed to measure the performance of US companies that have successfully increased their dividend payments over a period of ten years. On a quarterly basis the highest-ranking companies based on momentum are selected and equally weighted to form the final index, capturing the small cap domestic market.
Global equity markets continued their upward trend in the second half of 2020, powered by growth and technology stocks as pandemic-induced trends favorable to the internet sector persisted worldwide. In 2021, vaccine availability turbocharged a global economic recovery, leading to a cyclical/value rotation that placed considerable pressure on growth stocks. This downside pressure was compounded by the March wind-down of leveraged bets. Meanwhile, the yield on the 10-Year US Treasury bond increased by nearly 0.75% in the first three months of 2021 from 0.92% to 1.64% despite no action from the US Federal Reserve (the Fed), and accompanied by a rise in inflation in the United States.
Dividend paying small cap stocks gained for the period though did not see significant momentum until late 2020 when the Russell 2000 began to rebound strongly from its pandemic lows. The unprecedented fiscal stimulus pursued by the US benefitted smaller companies the most, many of which saw the brunt of the impact from the COVID-19 pandemic. The Fund also benefitted from the continued rotation to value stocks seen at the end of 2020 and beginning of 2021. Regional banks and automotive retail companies contributed the most to the Fund’s performance for the period on early 2021 speculation of rising interest rates and surging demand for automobiles.
We see two potential catalysts for the US dividend-paying equity market in the year to come:
• A continuation of the rotation into value/cyclical stocks seen in the first quarter of 2021.
• An improving economy powered by vaccine distribution and the subsequent relaxation of pandemic restrictions on economic activity.
For the one-year period ending on March 31, 2021 (the “reporting period”), the NAV of the Fund increased by 39.27%, while the Underlying Index increased by 40.21%.
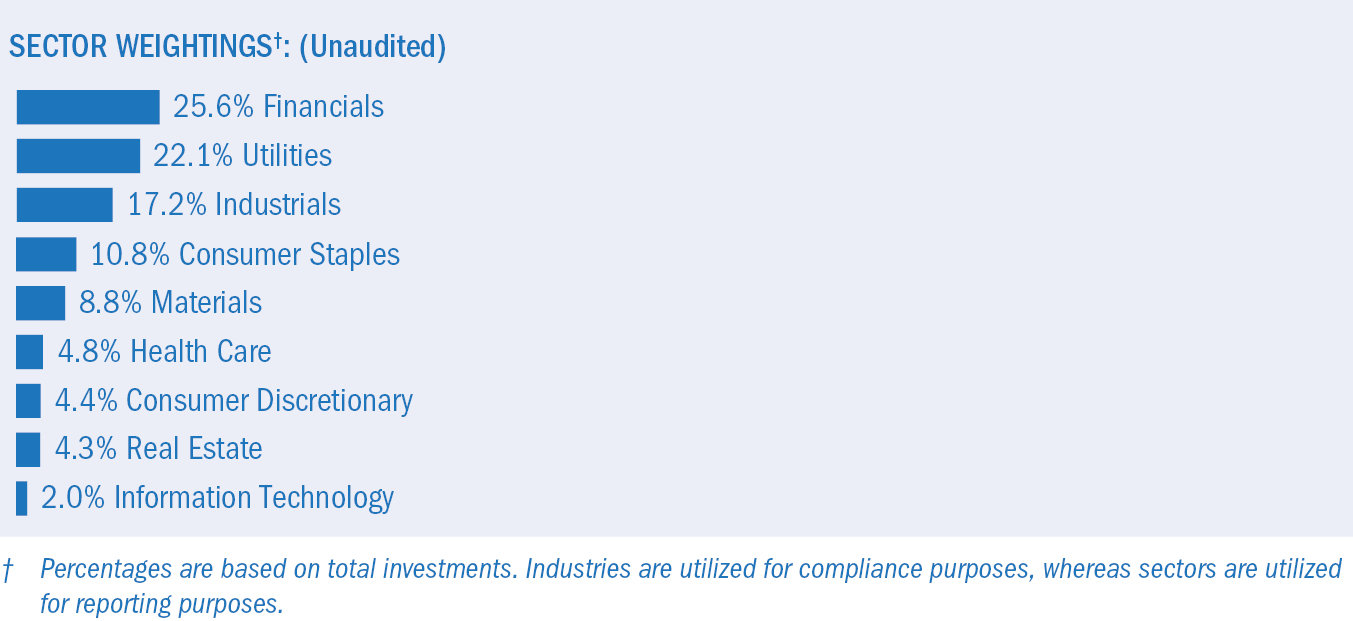
At the end of the reporting period, the Fund held 25.54% of the portfolio in the Financials sector, 22.07% in the Utilities sector, and 17.18% in the Industrials sector, which represent the Fund’s top three sector weightings.
5
Management Discussion of Fund Performance (Unaudited) (continued)
KFA Small Cap Quality Dividend Index ETF (concluded)
Growth of a $10,000 Investment‡
(at Net Asset Value)‡

AVERAGE TOTAL RETURN FOR THE PERIOD ENDED MARCH 31, 2021*
| | One Year
Return | | Annualized
Inception to Date |
| | | Net Asset
Value | | Market
Price^ | | Net Asset
Value | | Market
Price^ |
KFA Small Cap Quality Dividend Index ETF | | 39.27 | % | | 41.47 | %‡ | | 9.03 | %‡ | | 9.45 | %‡ |
Russell 2000 Dividend Select Equal Weight Index | | N/A | | | 40.21 | %‡ | | N/A | | | 9.71 | %‡ |
Russell 2000 Index | | N/A | | | 94.85 | %‡ | | N/A | | | 25.08 | %‡ |
| * | The Fund commenced operations on June 11, 2019. |
| ^ | Beginning December 23, 2020, market price returns are based on the official closing price of an ETF share or, if the official closing price isn’t available, the midpoint between the national best bid and national best offer (“NBBO”) as of the time the ETF calculates current NAV per share. Prior to that date, market price returns were based on the midpoint between the Bid and Ask price. NAVs are calculated using prices as of 4:00 PM Eastern Time. |
The performance data quoted herein represents past performance and the return and value of an investment in the Fund will fluctuate so that, when redeemed, may be worth less than its original cost. Current performance may be lower or higher than the performance data quoted. Past performance is no guarantee of future performance and should not be considered as a representation of the future results of the Fund. For performance data current to the most recent month end, please call (855-857-2638) or visit www.kraneshares.com. The Fund’s performance assumes the reinvestment of all dividends and all capital gains. Index returns assume reinvestment of dividends and, unlike a Fund’s returns, do not reflect any fees or expenses. If such fees and expenses were included in the index returns, the performance would have been lower. As stated in the Fund’s prospectus, the Fund’s operating expense ratio is 0.52%. Please note that one cannot invest directly in an unmanaged index. There are no assurances that the Fund will meet its stated objectives. The Fund’s holdings and allocations are subject to change and should not be considered recommendations to buy individual securities. For further information on the Fund’s objectives, risks, and strategies, see the Fund’s prospectus. Returns shown do not reflect the deduction of taxes that a shareholder would pay on Fund distributions or the redemption of Fund shares.
See definition of comparative indices on pages 1 thru 2.
6
Management Discussion of Fund Performance (Unaudited) (continued)
KFA Dynamic Fixed Income ETF
The KFA Dynamic Fixed Income ETF (the “Fund”) seeks to provide investment results that, before fees and expenses, track the price and yield performance of a the FTSE US High-Yield Treasury Rotation Index (the “Underlying Index”).
The Underlying Index is designed to provide a benchmark for investors looking to capture risk-managed exposure to High-Yield credit and US Treasuries.
Global bond markets saw strong issuance in the second half of 2020 as corporations sought to take advantage of an extremely low-rate environment. In the US, high yield issuance rose 30% to $570 billion as downgraded issuers attempted to shore up their finances in the fallout from the coronavirus pandemic. However, investment grade issuance was even stronger in 2020, rising +54% to $2.01 trillion. By the end of the year, high yield spreads returned to their pre-pandemic level in the US and continued to fall in 2021 amid an improving economic situation, ending the period lower than they had been at the beginning of the pandemic.
US high yield bonds have made a remarkable comeback from their pandemic lows as issuance soared during the second half of 2020. The Fund rotated into treasuries in the second quarter of 2020 following the extreme downdraft in high yield bonds in the first quarter of 2020 before rotating back into high yield for the remainder of the period. For the three quarters during which the Fund was invested in high yield, it outperformed the average return among the three asset classes included in the rotation model (short duration treasuries, medium duration treasuries, and high yield bonds).
We see three potential catalysts for the US high yield bond market in the year to come:
• Moody’s forecasts an increase of 7% in high yield issuance in the US in 2021, compared to a 16% decrease for investment grade.1
• Moody’s forecasts the high yield default rate in the US to drop below 5% in June compared to nearly 6% in March and remain below 5% for the remainder of 2021, improving the risk profile of high yield securities.1
• The rise in inflation expected for 2021 may reduce nominal debt and thereby improve the repayment capacity for many high yield issuers.
For the one-year period ending on March 31, 2021 (the “reporting period”), the NAV of the Fund increased by 5.79%, while the Underlying Index increased by 11.65%.
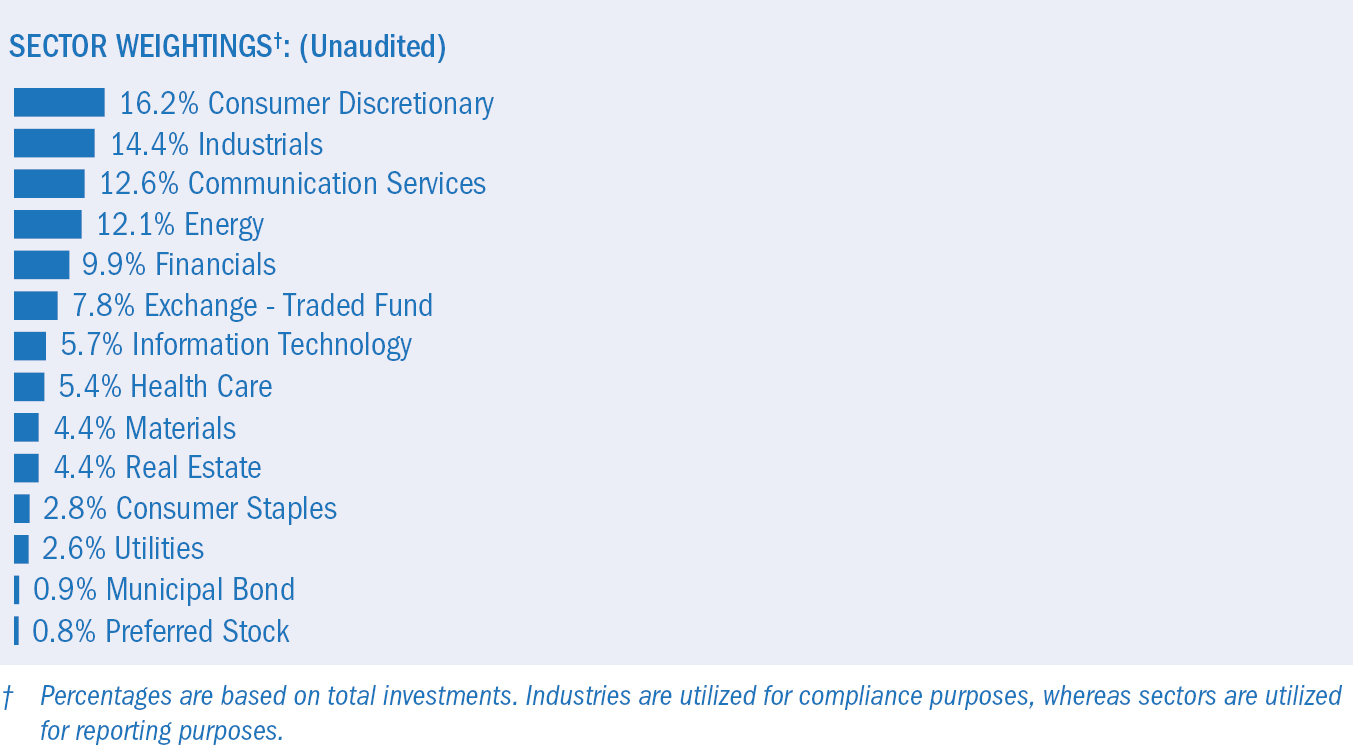
At the end of the reporting period, the Fund held 75.21% of the portfolio in the Industrials sector, 10.87% in the Financials sector, and 3.06% in the Utilities sector, which represent the Fund’s top three sector weightings.
Citations:
1 Moody’s Investor Service.
7
Management Discussion of Fund Performance (Unaudited) (continued)
KFA Dynamic Fixed Income ETF (concluded)
Growth of a $10,000 Investment‡
(at Net Asset Value)‡

AVERAGE TOTAL RETURN FOR THE PERIOD ENDED MARCH 31, 2021*
| | One Year
Return | | Annualized
Inception to Date |
| | | Net Asset
Value | | Market
Price^ | | Net Asset
Value | | Market
Price^ |
KFA Dynamic Fixed Income ETF | | 5.79 | % | | 6.89 | %‡ | | -7.53 | %‡ | | -7.40 | %‡ |
FTSE US High-Yield Treasury Rotation Index | | N/A | | | 11.65 | %‡ | | N/A | | | -1.80 | %‡ |
| * | The Fund commenced operations on December 6, 2019. |
| ^ | Beginning December 23, 2020, market price returns are based on the official closing price of an ETF share or, if the official closing price isn’t available, the midpoint between the national best bid and national best offer (“NBBO”) as of the time the ETF calculates current NAV per share. Prior to that date, market price returns were based on the midpoint between the Bid and Ask price. NAVs are calculated using prices as of 4:00 PM Eastern Time. |
The performance data quoted herein represents past performance and the return and value of an investment in the Fund will fluctuate so that, when redeemed, may be worth less than its original cost. Current performance may be lower or higher than the performance data quoted. Past performance is no guarantee of future performance and should not be considered as a representation of the future results of the Fund. For performance data current to the most recent month end, please call (855-857-2638) or visit www.kraneshares.com. The Fund’s performance assumes the reinvestment of all dividends and all capital gains. Index returns assume reinvestment of dividends and, unlike a Fund’s returns, do not reflect any fees or expenses. If such fees and expenses were included in the index returns, the performance would have been lower. As stated in the Fund’s prospectus, the Fund’s operating expense ratio is 0.46%. Please note that one cannot invest directly in an unmanaged index. There are no assurances that the Fund will meet its stated objectives. The Fund’s holdings and allocations are subject to change and should not be considered recommendations to buy individual securities. For further information on the Fund’s objectives, risks, and strategies, see the Fund’s prospectus. Returns shown do not reflect the deduction of taxes that a shareholder would pay on Fund distributions or the redemption of Fund shares.
See definition of comparative indices on pages 1 thru 2.
8
Management Discussion of Fund Performance (Unaudited) (continued)
KFA Value Line® Dynamic Core Equity Index ETF
The KFA Value Line® Dynamic Core Equity Index ETF (the “Fund”) seeks to provide investment results that, before fees and expenses, track the price and yield performance of the 3D/L Value Line® Dynamic Core Equity Index (the “Underlying Index”).
The Underlying Index is designed to capture quality US companies based on a three-factor process that selects stocks with high dividend yields that are the highest rated among Value Line®’s Safety™ and Timeliness™ Ranking Systems.
Global equity markets continued their upward trend in the second half of 2020, powered by growth and technology stocks as pandemic-induced trends favorable to the internet sector persisted worldwide. In 2021, vaccine availability turbocharged a global economic recovery, leading to a cyclical/value rotation that placed considerable pressure on growth stocks. This downside pressure was compounded by the March wind-down of leveraged bets. Meanwhile, the yield on the 10-Year US Treasury bond increased by nearly 0.75% in the first three months of 2021 from 0.92% to 1.64% despite no action from the US Federal Reserve (the Fed), and accompanied by a rise in inflation in the United States.
From inception on November 23, 2020, the investment strategy performed well against comparable beta benchmarks due mainly to the continued rotation towards value stocks and away from some growth names. Global reopening and increased vaccinations also gave a strong tailwind for equities in general. The strategy particularly benefited from strength in Financial, Utilities and Industrials. The Fund’s focused selection of consumer staples stocks also benefited the Fund avoiding the sectors decline in broad benchmarks during the period.
We see two potential catalysts for the US dividend-paying equity market in the year to come:
• A continuation of the rotation into value/cyclical stocks seen in the first quarter of 2021.
• An improving economy powered by vaccine distribution and the subsequent relaxation of pandemic restrictions on economic activity.
From inception (November 23, 2020) through the Fund’s fiscal year ending on March 31, 2021 (the “reporting period”), the NAV of the Fund increased by 15.46% while the Underlying Index increased by 15.22%.
At the end of the reporting period, the Fund held 22.51% of the portfolio in the Industrials sector, 20.56% in the Utilities sector, and 20.44% in the Financials sector, which represent the Fund’s top three sector weightings.
9
Management Discussion of Fund Performance (Unaudited) (continued)
KFA Value Line® Dynamic Core Equity Index ETF (concluded)
Growth of a $10,000 Investment‡
(at Net Asset Value)‡

AVERAGE TOTAL RETURN FOR THE PERIOD ENDED MARCH 31, 2021*
| | Cumulative
Inception to Date |
| | | Net Asset
Value | | Market
Price^ |
KFA Value Line® Dynamic Core Equity Index ETF | | 15.46 | % | | 12.92 | %‡ |
3D/L Value Line® Dynamic Core Equity Index | | N/A | | | 15.22 | %‡ |
| * | The Fund commenced operations on November 23, 2020. |
| ^ | Beginning December 23, 2020, market price returns are based on the official closing price of an ETF share or, if the official closing price isn’t available, the midpoint between the national best bid and national best offer (“NBBO”) as of the time the ETF calculates current NAV per share. Prior to that date, market price returns were based on the midpoint between the Bid and Ask price. NAVs are calculated using prices as of 4:00 PM Eastern Time. |
The performance data quoted herein represents past performance and the return and value of an investment in the Fund will fluctuate so that, when redeemed, may be worth less than its original cost. Current performance may be lower or higher than the performance data quoted. Past performance is no guarantee of future performance and should not be considered as a representation of the future results of the Fund. For performance data current to the most recent month end, please call (855-857-2638) or visit www.kraneshares.com. The Fund’s performance assumes the reinvestment of all dividends and all capital gains. Index returns assume reinvestment of dividends and, unlike a Fund’s returns, do not reflect any fees or expenses. If such fees and expenses were included in the index returns, the performance would have been lower. As stated in the Fund’s prospectus, the Fund’s operating expense ratio is 0.56%. Please note that one cannot invest directly in an unmanaged index. There are no assurances that the Fund will meet its stated objectives. The Fund’s holdings and allocations are subject to change and should not be considered recommendations to buy individual securities. For further information on the Fund’s objectives, risks, and strategies, see the Fund’s prospectus. Returns shown do not reflect the deduction of taxes that a shareholder would pay on Fund distributions or the redemption of Fund shares.
See definition of comparative indices on pages 1 thru 2.
10
Management Discussion of Fund Performance (Unaudited) (continued)
KFA Mount Lucas Index Strategy ETF
The KFA Mount Lucas Index Strategy ETF (the “Fund”) seeks to provide investment results that, before fees and expenses, exceeds that of the KFA MLM Index (the “Index”) over a complete market cycle.
The Index consists of a portfolio of twenty-two liquid futures contracts traded on U.S. and foreign exchanges. The Index includes futures contracts on 11 commodities, 6 currencies, and 5 global bond markets. These three baskets are weighted by their relative historical volatility, and within each basket, the constituent markets are equal dollar weighted.
Global commodity markets mostly have rebounded from their pandemic lows. Increased activity in commodity markets driven by supply chain issues, geopolitical tensions, and the reopening of economies globally benefitted trend-following commodities futures trading strategies. Oil and metals have led the commodity rebound as copper prices have risen 13% year-to-date and West Texas Intermediate (WTI)1 crude has surged nearly 22% over the same period.
We see two potential catalysts for the commodities futures market in the year to come:
• Continued supply chain bottlenecks, reopening of economies and continued shifts towards renewable energy policies could affect prices in the coming year.
• Inflationary pressures and supporting data could see more investors allocate to commodities as a hedge as the asset class traditionally rises on inflation expectations and could be a driver of returns this year.
From inception (December 1, 2020) through the Fund’s fiscal year ending on March 31, 2021 (the “reporting period”), the NAV of the Fund increased by 10.20%, while the Underlying Index increased by 10.45%.
At the end of the reporting period, the Fund’s largest exposure in each of its three respective asset classes (fixed income, currencies, commodities) were the 10-Year Japanese Government Bond (short) at 26.77% of NAV, the British Pound (long) at 16.51% of NAV, and heating oil at 7.21% of NAV.
1 WTI - West Texas Intermediate, which is the type of oil the futures contract is based on.
11
Management Discussion of Fund Performance (Unaudited) (concluded)
KFA Mount Lucas Index Strategy ETF (concluded)
Growth of a $10,000 Investment‡
(at Net Asset Value)‡

AVERAGE TOTAL RETURN FOR THE PERIOD ENDED MARCH 31, 2021*
| | Cumulative
Inception to Date |
| | | Net Asset
Value | | Market
Price^ |
KFA Mount Lucas Index Strategy ETF | | 10.20 | % | | 10.40 | %‡ |
KFA MLM Index | | N/A | | | 10.45 | %‡ |
| * | The Fund commenced operations on December 1, 2020. |
| ^ | Beginning December 23, 2020, market price returns are based on the official closing price of an ETF share or, if the official closing price isn’t available, the midpoint between the national best bid and national best offer (“NBBO”) as of the time the ETF calculates current NAV per share. Prior to that date, market price returns were based on the midpoint between the Bid and Ask price. NAVs are calculated using prices as of 4:00 PM Eastern Time. |
The performance data quoted herein represents past performance and the return and value of an investment in the Fund will fluctuate so that, when redeemed, may be worth less than its original cost. Current performance may be lower or higher than the performance data quoted. Past performance is no guarantee of future performance and should not be considered as a representation of the future results of the Fund. For performance data current to the most recent month end, please call (855-857-2638) or visit www.kraneshares.com. The Fund’s performance assumes the reinvestment of all dividends and all capital gains. Index returns assume reinvestment of dividends and, unlike a Fund’s returns, do not reflect any fees or expenses. If such fees and expenses were included in the index returns, the performance would have been lower. As stated in the Fund’s prospectus, the Fund’s operating expense ratio is 0.90%. Please note that one cannot invest directly in an unmanaged index. There are no assurances that the Fund will meet its stated objectives. The Fund’s holdings and allocations are subject to change and should not be considered recommendations to buy individual securities. For further information on the Fund’s objectives, risks, and strategies, see the Fund’s prospectus. Returns shown do not reflect the deduction of taxes that a shareholder would pay on Fund distributions or the redemption of Fund shares.
See definition of comparative indices on pages 1 thru 2.
12
Schedule of Investments March 31, 2021
KFA Large Cap Quality Dividend Index ETF
| | Shares | | Value |
COMMON STOCK — 99.8%‡ | | | | | |
UNITED STATES — 99.8% | | | | | |
Communication Services — 2.6% | | | | | |
Comcast, Cl A | | 7,443 | | $ | 402,741 |
John Wiley & Sons, Cl A | | 7,764 | | | 420,809 |
Verizon Communications | | 7,342 | | | 426,937 |
| | | | | | 1,250,487 |
Consumer Discretionary — 8.1% | | | | | |
Gentex | | 11,692 | | | 417,054 |
NIKE, Cl B | | 3,054 | | | 405,846 |
Polaris | | 3,133 | | | 418,256 |
Pool | | 1,203 | | | 415,324 |
Starbucks | | 3,895 | | | 425,607 |
Target | | 2,274 | | | 450,411 |
Thor Industries | | 3,241 | | | 436,692 |
Tractor Supply | | 2,568 | | | 454,741 |
Williams-Sonoma | | 3,166 | | | 567,347 |
| | | | | | 3,991,278 |
Consumer Staples — 9.5% | | | | | |
Altria Group | | 9,046 | | | 462,793 |
Archer-Daniels-Midland | | 7,220 | | | 411,540 |
Brown-Forman, Cl B | | 5,901 | | | 406,992 |
Casey’s General Stores | | 1,978 | | | 427,624 |
Colgate-Palmolive | | 5,461 | | | 430,490 |
Ingredion | | 4,540 | | | 408,237 |
Kroger | | 11,625 | | | 418,384 |
Nu Skin Enterprises, Cl A | | 7,923 | | | 419,047 |
Philip Morris International | | 4,816 | | | 427,372 |
Sysco | | 4,924 | | | 387,716 |
Walgreens Boots Alliance | | 8,662 | | | 475,544 |
| | | | | | 4,675,739 |
The accompanying notes are an integral part of the financial statements.
13
Schedule of Investments March 31, 2021
KFA Large Cap Quality Dividend Index ETF (continued)
| | Shares | | Value |
COMMON STOCK (continued) | | | | | |
Energy — 0.8% | | | | | |
Exxon Mobil | | 6,733 | | $ | 375,903 |
Financials — 19.2% | | | | | |
American Financial Group | | 3,673 | | | 419,089 |
Ameriprise Financial | | 1,824 | | | 423,989 |
Arthur J Gallagher | | 3,256 | | | 406,251 |
BlackRock, Cl A | | 572 | | | 431,265 |
BOK Financial | | 4,402 | | | 393,187 |
Chubb | | 2,362 | | | 373,125 |
Comerica | | 5,933 | | | 425,634 |
Cullen/Frost Bankers | | 3,705 | | | 402,956 |
Discover Financial Services | | 4,195 | | | 398,483 |
Erie Indemnity, Cl A | | 1,756 | | | 387,918 |
Evercore, Cl A | | 3,342 | | | 440,275 |
JPMorgan Chase | | 2,706 | | | 411,935 |
KeyCorp | | 20,079 | | | 401,178 |
Lincoln National | | 7,007 | | | 436,326 |
MarketAxess Holdings | | 796 | | | 396,344 |
Mercury General | | 6,582 | | | 400,251 |
People’s United Financial | | 22,528 | | | 403,251 |
PNC Financial Services Group | | 2,376 | | | 416,774 |
Raymond James Financial | | 3,503 | | | 429,328 |
T Rowe Price Group | | 2,355 | | | 404,118 |
Travelers | | 2,681 | | | 403,222 |
US Bancorp | | 7,936 | | | 438,940 |
Webster Financial | | 6,968 | | | 384,007 |
| | | | | | 9,427,846 |
Health Care — 7.1% | | | | | |
AmerisourceBergen, Cl A | | 3,881 | | | 458,230 |
Johnson & Johnson | | 2,626 | | | 431,583 |
McKesson | | 2,312 | | | 450,932 |
Medtronic | | 3,486 | | | 411,801 |
STERIS | | 2,314 | | | 440,771 |
Stryker | | 1,698 | | | 413,599 |
UnitedHealth Group | | 1,158 | | | 430,857 |
West Pharmaceutical Services | | 1,509 | | | 425,206 |
| | | | | | 3,462,979 |
Industrials — 23.4% | | | | | |
A O Smith | | 6,539 | | | 442,102 |
Caterpillar | | 1,899 | | | 440,321 |
CSX | | 4,551 | | | 438,807 |
Cummins | | 1,550 | | | 401,620 |
Donaldson | | 6,990 | | | 406,538 |
Eaton | | 3,024 | | | 418,159 |
Emerson Electric | | 4,531 | | | 408,787 |
FedEx | | 1,507 | | | 428,048 |
Graco | | 6,148 | | | 440,320 |
Honeywell International | | 1,993 | | | 432,621 |
Hubbell, Cl B | | 2,288 | | | 427,604 |
The accompanying notes are an integral part of the financial statements.
14
Schedule of Investments March 31, 2021
KFA Large Cap Quality Dividend Index ETF (continued)
| | Shares | | Value |
COMMON STOCK (continued) | | | | | |
Industrials (continued) | | | | | |
JB Hunt Transport Services | | 2,621 | | $ | 440,512 |
Lincoln Electric Holdings | | 3,458 | | | 425,127 |
MSA Safety | | 2,610 | | | 391,552 |
MSC Industrial Direct, Cl A | | 4,774 | | | 430,567 |
Norfolk Southern | | 1,611 | | | 432,586 |
PACCAR | | 4,354 | | | 404,574 |
Parker-Hannifin | | 1,380 | | | 435,293 |
Regal Beloit | | 2,928 | | | 417,767 |
Republic Services, Cl A | | 4,330 | | | 430,186 |
Robert Half International | | 5,384 | | | 420,329 |
Ryder System | | 5,673 | | | 429,162 |
Snap-on | | 1,876 | | | 432,868 |
Toro | | 4,198 | | | 432,982 |
Trinity Industries | | 14,009 | | | 399,116 |
United Parcel Service, Cl B | | 2,472 | | | 420,215 |
Waste Management | | 3,444 | | | 444,345 |
| | | | | | 11,472,108 |
Information Technology — 7.0% | | | | | |
Analog Devices | | 2,705 | | | 419,491 |
Broadcom | | 913 | | | 423,322 |
Broadridge Financial Solutions | | 2,829 | | | 433,120 |
KLA | | 1,356 | | | 448,022 |
Littelfuse | | 1,589 | | | 420,195 |
Microchip Technology | | 2,736 | | | 424,682 |
Texas Instruments | | 2,403 | | | 454,143 |
Xilinx | | 3,398 | | | 421,012 |
| | | | | | 3,443,987 |
Materials — 8.1% | | | | | |
Albemarle | | 2,856 | | | 417,290 |
AptarGroup | | 3,092 | | | 438,044 |
Avery Dennison | | 2,320 | | | 426,068 |
Celanese, Cl A | | 2,783 | | | 416,921 |
Eastman Chemical | | 3,569 | | | 393,018 |
Nucor | | 6,457 | | | 518,303 |
Scotts Miracle-Gro | | 1,986 | | | 486,511 |
Steel Dynamics | | 8,971 | | | 455,368 |
Westlake Chemical | | 4,616 | | | 409,855 |
| | | | | | 3,961,378 |
Real Estate — 6.1% | | | | | |
Camden Property Trust† | | 4,079 | | | 448,323 |
CubeSmart† | | 11,510 | | | 435,423 |
Federal Realty Investment Trust† | | 3,894 | | | 395,046 |
Iron Mountain† | | 11,389 | | | 421,507 |
Mid-America Apartment Communities† | | 3,118 | | | 450,115 |
Omega Healthcare Investors† | | 10,929 | | | 400,329 |
UDR† | | 9,829 | | | 431,100 |
| | | | | | 2,981,843 |
The accompanying notes are an integral part of the financial statements.
15
Schedule of Investments March 31, 2021
KFA Large Cap Quality Dividend Index ETF (concluded)
| | Shares | | Value |
COMMON STOCK (continued) | | | | | |
Utilities — 7.9% | | | | | |
DTE Energy | | 3,301 | | $ | 439,495 |
Duke Energy | | 4,583 | | | 442,397 |
Edison International | | 6,949 | | | 407,212 |
Evergy | | 7,308 | | | 435,045 |
National Fuel Gas | | 8,322 | | | 416,017 |
NextEra Energy | | 5,708 | | | 431,582 |
Public Service Enterprise Group | | 7,182 | | | 432,428 |
Southern | | 7,045 | | | 437,917 |
UGI | | 9,869 | | | 404,728 |
| | | | | | 3,846,821 |
TOTAL UNITED STATES | | | | | 48,890,369 |
TOTAL COMMON STOCK
(Cost $43,404,576) | | | | | 48,890,369 |
| | | | | | |
TOTAL INVESTMENTS — 99.8%
(Cost $43,404,576) | | | | | 48,890,369 |
OTHER ASSETS LESS LIABILITIES — 0.2% | | | | | 106,753 |
NET ASSETS — 100% | | | | $ | 48,997,122 |
‡ Industries are utilized for compliance purposes, whereas sectors are utilized for reporting.
† Real Estate Investment Trust
Cl — Class
As of March 31, 2021, all of the Fund’s investments were considered Level 1 of the fair value hierarchy, in accordance with the authoritative guidance under U.S. GAAP.
For the year ended March 31, 2021, there have been no transfers in or out of Level 3.
The accompanying notes are an integral part of the financial statements.
16
Schedule of Investments March 31, 2021
KFA Small Cap Quality Dividend ETF
| | Shares | | Value |
COMMON STOCK — 99.7%‡ | | | | | |
UNITED STATES — 99.7% | | | | | |
Consumer Discretionary — 4.4% | | | | | |
Churchill Downs | | 3,584 | | $ | 815,073 |
Lithia Motors, Cl A | | 2,230 | | | 869,901 |
| | | | | | 1,684,974 |
Consumer Staples — 10.7% | | | | | |
Andersons | | 30,497 | | | 835,008 |
Calavo Growers | | 10,100 | | | 784,164 |
Lancaster Colony | | 4,554 | | | 798,590 |
Universal | | 15,598 | | | 920,126 |
WD-40 | | 2,619 | | | 801,885 |
| | | | | | 4,139,773 |
Financials — 25.5% | | | | | |
Atlantic Union Bankshares | | 21,660 | | | 830,878 |
BancFirst | | 12,063 | | | 852,733 |
Bar Harbor Bankshares | | 27,229 | | | 801,077 |
Bryn Mawr Bank | | 19,975 | | | 909,062 |
Columbia Banking System | | 17,591 | | | 757,996 |
International Bancshares | | 17,169 | | | 796,985 |
Northwest Bancshares | | 56,429 | | | 815,399 |
PROG Holdings | | 18,006 | | | 779,480 |
Stock Yards Bancorp | | 15,349 | | | 783,720 |
United Bankshares | | 20,832 | | | 803,699 |
Washington Trust Bancorp | | 16,228 | | | 837,852 |
WesBanco | | 23,871 | | | 860,788 |
| | | | | | 9,829,669 |
Health Care — 4.8% | | | | | |
Ensign Group | | 10,189 | | | 956,136 |
National HealthCare | | 11,259 | | | 877,188 |
| | | | | | 1,833,324 |
The accompanying notes are an integral part of the financial statements.
17
Schedule of Investments March 31, 2021
KFA Small Cap Quality Dividend ETF (concluded)
| | Shares | | Value |
COMMON STOCK (continued) | | | | | |
Industrials — 17.1% | | | | | |
Applied Industrial Technologies | | 8,961 | | $ | 816,974 |
Franklin Electric | | 10,941 | | | 863,683 |
GATX | | 8,675 | | | 804,520 |
Healthcare Services Group | | 28,910 | | | 810,347 |
Hillenbrand | | 16,945 | | | 808,446 |
Lindsay | | 5,310 | | | 884,752 |
Matthews International, Cl A | | 21,099 | | | 834,465 |
Standex International | | 8,268 | | | 790,173 |
| | | | | | 6,613,360 |
Information Technology — 2.0% | | | | | |
Badger Meter | | 8,435 | | | 785,045 |
| | | | | | |
Materials — 8.8% | | | | | |
Balchem | | 6,767 | | | 848,650 |
HB Fuller | | 14,474 | | | 910,559 |
Quaker Chemical | | 3,125 | | | 761,781 |
Sensient Technologies | | 11,015 | | | 859,170 |
| | | | | | 3,380,160 |
Real Estate — 4.3% | | | | | |
National Health Investors† | | 11,822 | | | 854,494 |
Universal Health Realty Income Trust† | | 12,130 | | | 822,172 |
| | | | | | 1,676,666 |
Utilities — 22.1% | | | | | |
ALLETE | | 12,971 | | | 871,521 |
Artesian Resources, Cl A | | 21,395 | | | 842,535 |
Avista | | 18,916 | | | 903,239 |
California Water Service Group | | 15,727 | | | 886,059 |
Chesapeake Utilities | | 7,275 | | | 844,482 |
Middlesex Water | | 11,629 | | | 918,924 |
New Jersey Resources | | 20,738 | | | 826,824 |
SJW Group | | 13,286 | | | 836,885 |
South Jersey Industries | | 31,315 | | | 707,093 |
Spire | | 11,727 | | | 866,508 |
| | | | | | 8,504,070 |
TOTAL UNITED STATES | | | | | 38,447,041 |
TOTAL COMMON STOCK
(Cost $33,201,488) | | | | | 38,447,041 |
TOTAL INVESTMENTS — 99.7%
(Cost $33,201,488) | | | | | 38,447,041 |
OTHER ASSETS LESS LIABILITIES — 0.3% | | | | | 111,858 |
NET ASSETS — 100% | | | | $ | 38,558,899 |
‡ Industries are utilized for compliance purposes, whereas sectors are utilized for reporting.
† Real Estate Investment Trust
Cl — Class
As of March 31, 2021, all of the Fund’s investments were considered Level 1 of the fair value hierarchy, in accordance with the authoritative guidance under U.S. GAAP.
For the year ended March 31, 2021, there have been no transfers in or out of Level 3.
The accompanying notes are an integral part of the financial statements.
18
Schedule of Investments March 31, 2021
KFA Dynamic Fixed Income ETF
| | Face Amount | | Value |
CORPORATE OBLIGATIONS — 87.9% | | | | | | |
Communication Services — 12.2% | | | | | | |
AMC Networks | | | | | | |
5.000%, 04/01/2024 | | $ | 25,000 | | $ | 25,312 |
CCO Holdings | | | | | | |
5.125%, 05/01/2027(A) | | | 186,000 | | | 196,661 |
5.000%, 02/01/2028(A) | | | 124,000 | | | 131,149 |
4.750%, 03/01/2030(A) | | | 125,000 | | | 129,531 |
4.500%, 08/15/2030(A) | | | 129,000 | | | 131,477 |
4.500%, 05/01/2032(A) | | | 200,000 | | | 202,500 |
4.250%, 02/01/2031(A) | | | 200,000 | | | 200,444 |
Clear Channel Worldwide Holdings | | | | | | |
5.125%, 08/15/2027(A) | | | 200,000 | | | 201,310 |
CommScope | | | | | | |
8.250%, 03/01/2027(A) | | | 105,000 | | | 112,350 |
6.000%, 03/01/2026(A) | | | 200,000 | | | 211,194 |
CommScope Technologies | | | | | | |
6.000%, 06/15/2025(A) | | | 77,000 | | | 78,544 |
CSC Holdings | | | | | | |
7.500%, 04/01/2028(A) | | | 105,000 | | | 115,794 |
6.500%, 02/01/2029(A) | | | 105,000 | | | 116,025 |
5.875%, 09/15/2022 | | | 93,000 | | | 98,199 |
5.750%, 01/15/2030(A) | | | 305,000 | | | 321,240 |
4.625%, 12/01/2030(A) | | | 124,000 | | | 121,968 |
3.375%, 02/15/2031(A) | | | 100,000 | | | 94,250 |
Diamond Sports Group | | | | | | |
5.375%, 08/15/2026(A) | | | 143,000 | | | 102,926 |
DISH DBS | | | | | | |
7.750%, 07/01/2026 | | | 265,000 | | | 291,897 |
5.875%, 11/15/2024 | | | 186,000 | | | 194,658 |
5.875%, 07/15/2022 | | | 100,000 | | | 104,450 |
The accompanying notes are an integral part of the financial statements.
19
Schedule of Investments March 31, 2021
KFA Dynamic Fixed Income ETF (continued)
| | Face Amount | | Value |
CORPORATE OBLIGATIONS (continued) | | | | | | |
Communication Services (continued) | | | | | | |
Embarq | | | | | | |
7.995%, 06/01/2036 | | $ | 150,000 | | $ | 172,692 |
Frontier Communications | | | | | | |
5.000%, 05/01/2028(A) | | | 100,000 | | | 101,750 |
Gray Television | | | | | | |
7.000%, 05/15/2027(A) | | | 105,000 | | | 114,188 |
4.750%, 10/15/2030(A) | | | 100,000 | | | 99,125 |
iHeartCommunications | | | | | | |
4.750%, 01/15/2028(A) | | | 100,000 | | | 100,750 |
Level 3 Financing | | | | | | |
4.625%, 09/15/2027(A) | | | 124,000 | | | 127,617 |
4.250%, 07/01/2028(A) | | | 93,000 | | | 94,052 |
3.625%, 01/15/2029(A) | | | 100,000 | | | 96,875 |
Lumen Technologies | | | | | | |
7.600%, 09/15/2039 | | | 246,000 | | | 281,670 |
7.500%, 04/01/2024 | | | 105,000 | | | 117,689 |
5.800%, 03/15/2022 | | | 90,000 | | | 93,150 |
5.625%, 04/01/2025 | | | 46,000 | | | 49,622 |
Match Group Holdings II | | | | | | |
4.625%, 06/01/2028(A) | | | 124,000 | | | 126,698 |
Netflix | | | | | | |
6.375%, 05/15/2029 | | | 200,000 | | | 248,000 |
5.875%, 11/15/2028 | | | 125,000 | | | 151,196 |
4.875%, 06/15/2030(A) | | | 100,000 | | | 115,154 |
4.875%, 04/15/2028 | | | 62,000 | | | 70,488 |
4.375%, 11/15/2026 | | | 93,000 | | | 103,904 |
Nexstar Broadcasting | | | | | | |
5.625%, 07/15/2027(A) | | | 124,000 | | | 130,353 |
Scripps Escrow II | | | | | | |
3.875%, 01/15/2029(A) | | | 40,000 | | | 39,300 |
Sinclair Television Group | | | | | | |
4.125%, 12/01/2030(A) | | | 100,000 | | | 96,250 |
Sirius XM Radio | | | | | | |
5.500%, 07/01/2029(A) | | | 150,000 | | | 162,188 |
5.000%, 08/01/2027(A) | | | 62,000 | | | 65,041 |
4.625%, 07/15/2024(A) | | | 100,000 | | | 103,010 |
4.125%, 07/01/2030(A) | | | 93,000 | | | 93,107 |
Sprint | | | | | | |
7.875%, 09/15/2023 | | | 95,000 | | | 108,538 |
7.625%, 02/15/2025 | | | 150,000 | | | 178,281 |
7.625%, 03/01/2026 | | | 196,000 | | | 240,087 |
7.125%, 06/15/2024 | | | 228,000 | | | 262,485 |
Sprint Capital | | | | | | |
8.750%, 03/15/2032 | | | 150,000 | | | 221,813 |
6.875%, 11/15/2028 | | | 250,000 | | | 315,243 |
The accompanying notes are an integral part of the financial statements.
20
Schedule of Investments March 31, 2021
KFA Dynamic Fixed Income ETF (continued)
| | Face Amount | | Value |
CORPORATE OBLIGATIONS (continued) | | | | | | |
Communication Services (continued) | | | | | | |
TEGNA | | | | | | |
5.000%, 09/15/2029 | | $ | 124,000 | | $ | 128,682 |
T-Mobile USA | | | | | | |
6.000%, 04/15/2024 | | | 205,000 | | | 206,538 |
United States Cellular | | | | | | |
6.700%, 12/15/2033 | | | 125,000 | | | 151,399 |
Univision Communications | | | | | | |
6.625%, 06/01/2027(A) | | | 93,000 | | | 99,317 |
5.125%, 02/15/2025(A) | | | 180,000 | | | 181,800 |
Windstream Escrow | | | | | | |
7.750%, 08/15/2028(A) | | | 85,000 | | | 86,381 |
Zayo Group Holdings | | | | | | |
4.000%, 03/01/2027(A) | | | 100,000 | | | 98,400 |
| | | | | | | 8,414,712 |
Consumer Discretionary — 15.7% | | | | | | |
1011778 BC ULC/New Red Finance Inc | | | | | | |
4.375%, 01/15/2028(A) | | | 124,000 | | | 124,585 |
4.000%, 10/15/2030(A) | | | 175,000 | | | 168,875 |
3.875%, 01/15/2028(A) | | | 185,000 | | | 186,987 |
Adient Global Holdings | | | | | | |
4.875%, 08/15/2026(A) | | | 100,000 | | | 102,625 |
American Axle & Manufacturing | | | | | | |
6.250%, 04/01/2025 | | | 150,000 | | | 154,500 |
American Builders & Contractors Supply | | | | | | |
4.000%, 01/15/2028(A) | | | 100,000 | | | 100,000 |
Aramark Services | | | | | | |
6.375%, 05/01/2025(A) | | | 186,000 | | | 197,160 |
Bed Bath & Beyond | | | | | | |
5.165%, 08/01/2044 | | | 50,000 | | | 45,551 |
Boyd Gaming | | | | | | |
8.625%, 06/01/2025(A) | | | 105,000 | | | 116,760 |
6.000%, 08/15/2026 | | | 180,000 | | | 187,412 |
Boyne USA | | | | | | |
7.250%, 05/01/2025(A) | | | 75,000 | | | 77,962 |
Brookfield Residential Properties | | | | | | |
6.250%, 09/15/2027(A) | | | 100,000 | | | 104,375 |
Caesars Entertainment | | | | | | |
6.250%, 07/01/2025(A) | | | 274,000 | | | 291,481 |
Carnival | | | | | | |
11.500%, 04/01/2023(A) | | | 200,000 | | | 229,250 |
10.500%, 02/01/2026(A) | | | 150,000 | | | 176,809 |
7.625%, 03/01/2026(A) | | | 300,000 | | | 322,290 |
Churchill Downs | | | | | | |
5.500%, 04/01/2027(A) | | | 100,000 | | | 104,520 |
Ford Motor | | | | | | |
9.625%, 04/22/2030 | | | 75,000 | | | 104,665 |
9.000%, 04/22/2025 | | | 105,000 | | | 127,167 |
The accompanying notes are an integral part of the financial statements.
21
Schedule of Investments March 31, 2021
KFA Dynamic Fixed Income ETF (continued)
| | Face Amount | | Value |
CORPORATE OBLIGATIONS (continued) | | | | | | |
Consumer Discretionary (continued) | | | | | | |
8.500%, 04/21/2023 | | $ | 105,000 | | $ | 117,075 |
4.750%, 01/15/2043 | | | 124,000 | | | 124,918 |
Ford Motor Credit | | | | | | |
5.113%, 05/03/2029 | | | 150,000 | | | 160,725 |
4.687%, 06/09/2025 | | | 200,000 | | | 212,265 |
1.048%, VAR ICE LIBOR USD 3 Month+0.810%, 04/05/2021 | | | 305,000 | | | 305,000 |
Gap | | | | | | |
8.875%, 05/15/2027(A) | | | 100,000 | | | 116,750 |
General Motors Financial | | | | | | |
5.750%, VAR ICE LIBOR USD 3 Month+3.598%‡ | | | 300,000 | | | 314,640 |
Goodyear Tire & Rubber | | | | | | |
5.000%, 05/31/2026 | | | 112,000 | | | 115,148 |
Hanesbrands | | | | | | |
5.375%, 05/15/2025(A) | | | 124,000 | | | 131,207 |
Hilton Domestic Operating | | | | | | |
4.000%, 05/01/2031(A) | | | 250,000 | | | 250,000 |
Hilton Worldwide Finance | | | | | | |
4.875%, 04/01/2027 | | | 155,000 | | | 161,781 |
Installed Building Products | | | | | | |
5.750%, 02/01/2028(A) | | | 180,000 | | | 188,100 |
KFC Holding | | | | | | |
5.250%, 06/01/2026(A) | | | 100,000 | | | 103,058 |
L Brands | | | | | | |
7.500%, 06/15/2029 | | | 62,000 | | | 70,441 |
6.875%, 11/01/2035 | | | 100,000 | | | 119,179 |
6.750%, 07/01/2036 | | | 150,000 | | | 177,000 |
6.694%, 01/15/2027 | | | 150,000 | | | 169,875 |
6.625%, 10/01/2030(A) | | | 200,000 | | | 226,625 |
Lennar | | | | | | |
4.750%, 11/29/2027 | | | 105,000 | | | 120,553 |
LGI Homes | | | | | | |
6.875%, 07/15/2026(A) | | | 100,000 | | | 104,375 |
Live Nation Entertainment | | | | | | |
4.750%, 10/15/2027(A) | | | 124,000 | | | 124,930 |
Macy’s | | | | | | |
8.375%, 06/15/2025(A) | | | 300,000 | | | 332,163 |
Mattel | | | | | | |
6.750%, 12/31/2025(A) | | | 12,000 | | | 12,617 |
5.875%, 12/15/2027(A) | | | 100,000 | | | 109,782 |
MDC Holdings | | | | | | |
6.000%, 01/15/2043 | | | 150,000 | | | 189,319 |
Methanex | | | | | | |
5.125%, 10/15/2027 | | | 75,000 | | | 76,688 |
MGM Resorts International | | | | | | |
6.000%, 03/15/2023 | | | 100,000 | | | 107,125 |
5.750%, 06/15/2025 | | | 132,000 | | | 143,880 |
5.500%, 04/15/2027 | | | 186,000 | | | 199,857 |
The accompanying notes are an integral part of the financial statements.
22
Schedule of Investments March 31, 2021
KFA Dynamic Fixed Income ETF (continued)
| | Face Amount | | Value |
CORPORATE OBLIGATIONS (continued) | | | | | | |
Consumer Discretionary (continued) | | | | | | |
NCL | | | | | | |
10.250%, 02/01/2026(A) | | $ | 100,000 | | $ | 117,330 |
5.875%, 03/15/2026(A) | | | 75,000 | | | 76,004 |
Newell Brands | | | | | | |
4.700%, 04/01/2026 | | | 93,000 | | | 102,845 |
Penske Automotive Group | | | | | | |
3.500%, 09/01/2025 | | | 100,000 | | | 102,355 |
Reynolds Group Issuer | | | | | | |
4.000%, 10/15/2027(A) | | | 150,000 | | | 147,000 |
Royal Caribbean Cruises | | | | | | |
11.500%, 06/01/2025(A) | | | 114,000 | | | 132,953 |
10.875%, 06/01/2023(A) | | | 100,000 | | | 115,030 |
Scientific Games International | | | | | | |
8.250%, 03/15/2026(A) | | | 100,000 | | | 107,250 |
Service International | | | | | | |
5.125%, 06/01/2029 | | | 100,000 | | | 107,320 |
3.375%, 08/15/2030 | | | 100,000 | | | 97,605 |
Six Flags Entertainment | | | | | | |
4.875%, 07/31/2024(A) | | | 75,000 | | | 75,722 |
Staples | | | | | | |
7.500%, 04/15/2026(A) | | | 167,000 | | | 176,185 |
Taylor Morrison Communities | | | | | | |
5.125%, 08/01/2030(A) | | | 195,000 | | | 207,188 |
Tenneco | | | | | | |
5.000%, 07/15/2026 | | | 350,000 | | | 329,875 |
Tesla | | | | | | |
5.300%, 08/15/2025(A) | | | 274,000 | | | 284,302 |
Travel + Leisure | | | | | | |
6.625%, 07/31/2026(A) | | | 311,000 | | | 353,094 |
6.600%, 10/01/2025 | | | 178,000 | | | 199,360 |
4.250%, 03/01/2022 | | | 124,000 | | | 125,318 |
Williams Scotsman International | | | | | | |
4.625%, 08/15/2028(A) | | | 100,000 | | | 101,750 |
Wynn Las Vegas | | | | | | |
5.500%, 03/01/2025(A) | | | 100,000 | | | 105,650 |
Yum! Brands | | | | | | |
7.750%, 04/01/2025(A) | | | 105,000 | | | 114,975 |
4.750%, 01/15/2030(A) | | | 100,000 | | | 105,730 |
| | | | | | | 10,792,891 |
Consumer Staples — 2.7% | | | | | | |
Albertsons | | | | | | |
5.875%, 02/15/2028(A) | | | 124,000 | | | 131,849 |
4.875%, 02/15/2030(A) | | | 150,000 | | | 154,200 |
4.625%, 01/15/2027(A) | | | 93,000 | | | 96,389 |
B&G Foods | | | | | | |
5.250%, 04/01/2025 | | | 75,000 | | | 77,063 |
The accompanying notes are an integral part of the financial statements.
23
Schedule of Investments March 31, 2021
KFA Dynamic Fixed Income ETF (continued)
| | Face Amount | | Value |
CORPORATE OBLIGATIONS (continued) | | | | | | |
Consumer Staples (continued) | | | | | | |
JBS USA LUX | | | | | | |
6.500%, 04/15/2029(A) | | $ | 250,000 | | $ | 282,375 |
5.500%, 01/15/2030(A) | | | 85,000 | | | 94,073 |
Lamb Weston Holdings | | | | | | |
4.875%, 11/01/2026(A) | | | 93,000 | | | 96,255 |
Performance Food Group | | | | | | |
5.500%, 10/15/2027(A) | | | 100,000 | | | 104,576 |
Post Holdings | | | | | | |
5.750%, 03/01/2027(A) | | | 100,000 | | | 105,176 |
4.625%, 04/15/2030(A) | | | 100,000 | | | 100,190 |
Primo Water Holdings | | | | | | |
5.500%, 04/01/2025(A) | | | 100,000 | | | 102,780 |
Spectrum Brands | | | | | | |
5.750%, 07/15/2025 | | | 8,000 | | | 8,250 |
United Rentals North America | | | | | | |
4.000%, 07/15/2030 | | | 200,000 | | | 203,550 |
US Foods | | | | | | |
6.250%, 04/15/2025(A) | | | 100,000 | | | 107,200 |
Vector Group | | | | | | |
5.750%, 02/01/2029(A) | | | 200,000 | | | 206,250 |
| | | | | | | 1,870,176 |
Energy — 11.8% | | | | | | |
Antero Resources | | | | | | |
5.625%, 06/01/2023 | | | 150,000 | | | 150,507 |
Apache | | | | | | |
5.100%, 09/01/2040 | | | 200,000 | | | 195,500 |
4.750%, 04/15/2043 | | | 50,000 | | | 46,375 |
4.375%, 10/15/2028 | | | 406,000 | | | 404,782 |
Buckeye Partners | | | | | | |
3.950%, 12/01/2026 | | | 75,000 | | | 74,134 |
Cheniere Energy | | | | | | |
4.625%, 10/15/2028(A) | | | 100,000 | | | 104,017 |
Cheniere Energy Partners | | | | | | |
5.625%, 10/01/2026 | | | 100,000 | | | 104,570 |
4.500%, 10/01/2029 | | | 100,000 | | | 104,000 |
Comstock Resources | | | | | | |
9.750%, 08/15/2026 | | | 75,000 | | | 81,562 |
Continental Resources | | | | | | |
5.750%, 01/15/2031(A) | | | 100,000 | | | 112,986 |
4.375%, 01/15/2028 | | | 100,000 | | | 105,605 |
Energy Transfer | | | | | | |
6.625%, VAR ICE LIBOR USD 3 Month+4.155%‡ | | | 211,000 | | | 186,735 |
EQM Midstream Partners | | | | | | |
6.500%, 07/01/2027(A) | | | 100,000 | | | 108,725 |
6.500%, 07/15/2048 | | | 100,000 | | | 99,750 |
The accompanying notes are an integral part of the financial statements.
24
Schedule of Investments March 31, 2021
KFA Dynamic Fixed Income ETF (continued)
| | Face Amount | | Value |
CORPORATE OBLIGATIONS (continued) | | | | | | |
Energy (continued) | | | | | | |
4.750%, 01/15/2031(A) | | $ | 200,000 | | $ | 194,000 |
4.125%, 12/01/2026 | | | 88,000 | | | 87,340 |
4.000%, 08/01/2024 | | | 6,000 | | | 6,103 |
Equities | | | | | | |
8.500%, 02/01/2030 | | | 100,000 | | | 127,530 |
7.625%, 02/01/2025 | | | 100,000 | | | 115,088 |
3.900%, 10/01/2027 | | | 100,000 | | | 102,093 |
Genesis Energy | | | | | | |
7.750%, 02/01/2028 | | | 175,000 | | | 175,053 |
GFL Environmental | | | | | | |
3.750%, 08/01/2025(A) | | | 150,000 | | | 152,250 |
Kerr-McGee | | | | | | |
7.125%, 10/15/2027 | | | 25,000 | | | 26,317 |
MEG Energy | | | | | | |
7.125%, 02/01/2027(A) | | | 400,000 | | | 419,000 |
5.875%, 02/01/2029(A) | | | 400,000 | | | 401,000 |
Murphy Oil | | | | | | |
7.050%, 05/01/2029 | | | 300,000 | | | 303,219 |
6.875%, 08/15/2024 | | | 250,000 | | | 255,625 |
NuStar Logistics | | | | | | |
6.375%, 10/01/2030 | | | 75,000 | | | 81,000 |
6.000%, 06/01/2026 | | | 16,000 | | | 17,249 |
Occidental Petroleum | | | | | | |
8.875%, 07/15/2030 | | | 100,000 | | | 126,100 |
7.150%, 05/15/2028 | | | 640,000 | | | 697,600 |
6.450%, 09/15/2036 | | | 350,000 | | | 386,444 |
6.375%, 09/01/2028 | | | 124,000 | | | 136,103 |
5.316%, 10/10/2036(B) | | | 246,000 | | | 124,107 |
2.700%, 08/15/2022 | | | 62,000 | | | 62,023 |
PBF Holding | | | | | | |
9.250%, 05/15/2025(A) | | | 85,000 | | | 86,672 |
PDC Energy | | | | | | |
5.750%, 05/15/2026 | | | 50,000 | | | 51,863 |
Petroleos Mexicanos | | | | | | |
6.500%, 03/13/2027 | | | 200,000 | | | 209,000 |
Seven Generations Energy | | | | | | |
5.375%, 09/30/2025(A) | | | 56,000 | | | 58,055 |
Southwestern Energy | | | | | | |
7.750%, 10/01/2027 | | | 70,000 | | | 74,813 |
Sunoco | | | | | | |
5.500%, 02/15/2026 | | | 100,000 | | | 102,729 |
Targa Resources Partners | | | | | | |
6.500%, 07/15/2027 | | | 100,000 | | | 108,668 |
5.875%, 04/15/2026 | | | 100,000 | | | 104,688 |
4.875%, 02/01/2031(A) | | | 348,000 | | | 352,611 |
TerraForm Power Operating | | | | | | |
5.000%, 01/31/2028(A) | | | 250,000 | | | 269,763 |
4.750%, 01/15/2030(A) | | | 75,000 | | | 77,873 |
The accompanying notes are an integral part of the financial statements.
25
Schedule of Investments March 31, 2021
KFA Dynamic Fixed Income ETF (continued)
| | Face Amount | | Value |
CORPORATE OBLIGATIONS (continued) | | | | | | |
Energy (continued) | | | | | | |
Topaz Solar Farms | | | | | | |
5.750%, 09/30/2039(A) | | $ | 98,517 | | $ | 112,400 |
Western Midstream Operating | | | | | | |
6.500%, 02/01/2050 | | | 75,000 | | | 81,094 |
5.300%, 02/01/2030 | | | 224,000 | | | 242,760 |
4.500%, 03/01/2028 | | | 50,000 | | | 51,418 |
4.000%, 07/01/2022 | | | 150,000 | | | 153,754 |
WPX Energy | | | | | | |
4.500%, 01/15/2030 | | | 98,000 | | | 105,525 |
| | | | | | | 8,118,178 |
Financials — 9.5% | | | | | | |
Ally Financial | | | | | | |
5.750%, 11/20/2025 | | | 62,000 | | | 70,475 |
American Express | | | | | | |
3.622%, VAR ICE LIBOR USD 3 Month+3.428%‡ | | | 50,000 | | | 49,937 |
AmTrust Financial Services | | | | | | |
6.125%, 08/15/2023 | | | 500,000 | | | 500,271 |
Brookfield Property REIT | | | | | | |
5.750%, 05/15/2026(A) | | | 100,000 | | | 102,875 |
CIT Group | | | | | | |
5.000%, 08/01/2023 | | | 124,000 | | | 134,540 |
4.750%, 02/16/2024 | | | 100,000 | | | 108,750 |
Citigroup | | | | | | |
5.950%, VAR ICE LIBOR USD 3 Month+4.068%‡ | | | 296,000 | | | 310,543 |
5.900%, VAR ICE LIBOR USD 3 Month+4.230%‡ | | | 31,000 | | | 32,768 |
4.672%, VAR ICE LIBOR USD 3 Month+4.478%‡ | | | 190,000 | | | 190,425 |
Citizens Financial Group | | | | | | |
4.154%, VAR ICE LIBOR USD 3 Month+3.960%‡ | | | 10,000 | | | 9,953 |
Compass Group Diversified Holdings | | | | | | |
8.000%, 05/01/2026(A) | | | 75,000 | | | 78,457 |
Depository Trust & Clearing | | | | | | |
3.351%, VAR ICE LIBOR USD 3 Month+3.167%‡(A) | | | 95,000 | | | 93,100 |
Freedom Mortgage | | | | | | |
8.250%, 04/15/2025(A) | | | 75,000 | | | 78,094 |
Genworth Holdings | | | | | | |
7.625%, 09/24/2021 | | | 1,414,000 | | | 1,451,117 |
Goldman Sachs Capital III | | | | | | |
6.130%, VAR ICE LIBOR USD 3 Month+0.770%‡ | | | 105,000 | | | 100,537 |
Greystar Real Estate Partners | | | | | | |
5.750%, 12/01/2025(A) | | | 186,000 | | | 191,115 |
Jefferies Group MTN | | | | | | |
4.500%, 11/29/2028 | | | 30,000 | | | 29,970 |
JPMorgan Chase | | | | | | |
5.150%, VAR ICE LIBOR USD 3 Month+3.250%‡ | | | 20,000 | | | 20,688 |
4.005%, VAR ICE LIBOR USD 3 Month+3.800%‡ | | | 75,000 | | | 75,143 |
The accompanying notes are an integral part of the financial statements.
26
Schedule of Investments March 31, 2021
KFA Dynamic Fixed Income ETF (continued)
| | Face Amount | | Value |
CORPORATE OBLIGATIONS (continued) | | | | | | |
Financials (continued) | | | | | | |
JPMorgan Chase Financial MTN | | | | | | |
6.500%, 07/30/2021(C) | | $ | 266,000 | | $ | 266,000 |
MGIC Investment | | | | | | |
5.250%, 08/15/2028 | | | 401,000 | | | 417,541 |
Morgan Stanley | | | | | | |
4.051%, VAR ICE LIBOR USD 3 Month+3.810%‡ | | | 20,000 | | | 20,000 |
3.851%, VAR ICE LIBOR USD 3 Month+3.610%‡ | | | 40,000 | | | 40,060 |
MSCI | | | | | | |
4.000%, 11/15/2029(A) | | | 100,000 | | | 102,846 |
3.875%, 02/15/2031(A) | | | 100,000 | | | 102,180 |
Navient MTN | | | | | | |
6.750%, 06/25/2025 | | | 180,000 | | | 195,525 |
6.500%, 06/15/2022 | | | 300,000 | | | 314,823 |
6.125%, 03/25/2024 | | | 100,000 | | | 105,607 |
5.500%, 01/25/2023 | | | 224,000 | | | 232,400 |
OneMain Finance | | | | | | |
8.875%, 06/01/2025 | | | 105,000 | | | 116,319 |
6.875%, 03/15/2025 | | | 90,000 | | | 102,368 |
6.625%, 01/15/2028 | | | 160,000 | | | 181,330 |
5.375%, 11/15/2029 | | | 155,000 | | | 164,881 |
4.000%, 09/15/2030 | | | 100,000 | | | 97,250 |
PNC Financial Services Group | | | | | | |
6.750%, VAR ICE LIBOR USD 3 Month+3.678%‡ | | | 20,000 | | | 20,286 |
Quicken Loans | | | | | | |
5.250%, 01/15/2028(A) | | | 186,000 | | | 195,765 |
Radian Group | | | | | | |
4.875%, 03/15/2027 | | | 124,000 | | | 130,045 |
Truist Financial | | | | | | |
4.950%, VAR US Treas Yield Curve Rate T Note Const Mat 5 Yr+4.605%‡ | | | 75,000 | | | 81,281 |
| | | | | | | 6,515,265 |
Health Care — 5.3% | | | | | | |
Avantor Funding | | | | | | |
4.625%, 07/15/2028(A) | | | 150,000 | | | 156,654 |
Bausch Health | | | | | | |
6.125%, 04/15/2025(A) | | | 248,000 | | | 254,250 |
5.250%, 01/30/2030(A) | | | 257,000 | | | 258,031 |
5.250%, 02/15/2031(A) | | | 150,000 | | | 149,283 |
Bausch Health Americas | | | | | | |
8.500%, 01/31/2027(A) | | | 105,000 | | | 116,484 |
Catalent Pharma Solutions | | | | | | |
5.000%, 07/15/2027(A) | | | 135,000 | | | 141,412 |
CHS | | | | | | |
8.000%, 03/15/2026(A) | | | 150,000 | | | 162,195 |
5.625%, 03/15/2027(A) | | | 120,000 | | | 126,216 |
The accompanying notes are an integral part of the financial statements.
27
Schedule of Investments March 31, 2021
KFA Dynamic Fixed Income ETF (continued)
| | Face Amount | | Value |
CORPORATE OBLIGATIONS (continued) | | | | | | |
Health Care (continued) | | | | | | |
DaVita | | | | | | |
4.625%, 06/01/2030(A) | | $ | 118,000 | | $ | 120,024 |
3.750%, 02/15/2031(A) | | | 140,000 | | | 134,148 |
HCA | | | | | | |
5.875%, 02/01/2029 | | | 65,000 | | | 75,725 |
5.875%, 02/15/2026 | | | 295,000 | | | 338,144 |
5.625%, 09/01/2028 | | | 86,000 | | | 98,900 |
5.375%, 02/01/2025 | | | 150,000 | | | 167,327 |
3.500%, 09/01/2030 | | | 124,000 | | | 125,432 |
IQVIA | | | | | | |
5.000%, 05/15/2027(A) | | | 100,000 | | | 105,579 |
Jaguar Holding II | | | | | | |
5.000%, 06/15/2028(A) | | | 124,000 | | | 129,146 |
Legacy LifePoint Health | | | | | | |
6.750%, 04/15/2025(A) | | | 100,000 | | | 106,250 |
MEDNAX | | | | | | |
6.250%, 01/15/2027(A) | | | 150,000 | | | 160,395 |
Molina Healthcare | | | | | | |
4.375%, 06/15/2028(A) | | | 100,000 | | | 102,896 |
Par Pharmaceutical | | | | | | |
7.500%, 04/01/2027(A) | | | 145,000 | | | 154,164 |
Tenet Healthcare | | | | | | |
5.125%, 11/01/2027(A) | | | 150,000 | | | 156,855 |
4.875%, 01/01/2026(A) | | | 186,000 | | | 193,321 |
4.625%, 07/15/2024 | | | 100,000 | | | 101,675 |
| | | | | | | 3,634,506 |
Industrials — 14.0% | | | | | | |
ADT Security | | | | | | |
4.125%, 06/15/2023 | | | 224,000 | | | 232,680 |
AECOM | | | | | | |
5.875%, 10/15/2024 | | | 105,000 | | | 117,973 |
5.125%, 03/15/2027 | | | 105,000 | | | 114,240 |
Allied Universal Holdco | | | | | | |
6.625%, 07/15/2026(A) | | | 124,000 | | | 131,500 |
Allison Transmission | | | | | | |
3.750%, 01/30/2031(A) | | | 70,000 | | | 67,812 |
Altera Infrastructure | | | | | | |
8.500%, 07/15/2023(A) | | | 215,000 | | | 194,038 |
American Airlines | | | | | | |
11.750%, 07/15/2025(A) | | | 150,000 | | | 185,437 |
Beacon Roofing Supply | | | | | | |
4.875%, 11/01/2025(A) | | | 137,000 | | | 140,082 |
Boeing | | | | | | |
8.625%, 11/15/2031 | | | 165,000 | | | 234,364 |
Brink’s | | | | | | |
4.625%, 10/15/2027(A) | | | 100,000 | | | 102,467 |
Colfax | | | | | | |
6.000%, 02/15/2024(A) | | | 124,000 | | | 127,844 |
The accompanying notes are an integral part of the financial statements.
28
Schedule of Investments March 31, 2021
KFA Dynamic Fixed Income ETF (continued)
| | Face Amount | | Value |
CORPORATE OBLIGATIONS (continued) | | | | | | |
Industrials (continued) | | | | | | |
Cornerstone Building Brands | | | | | | |
6.125%, 01/15/2029(A) | | $ | 100,000 | | $ | 106,500 |
Delta Air Lines 2015-1 Class B Pass-Through Trust | | | | | | |
4.250%, 07/30/2023 | | | 43,014 | | | 43,959 |
Fortress Transportation and Infrastructure Investors | | | | | | |
6.750%, 03/15/2022(A) | | | 75,000 | | | 75,094 |
Herc Holdings | | | | | | |
5.500%, 07/15/2027(A) | | | 100,000 | | | 106,420 |
Howmet Aerospace | | | | | | |
6.875%, 05/01/2025 | | | 85,000 | | | 98,494 |
5.125%, 10/01/2024 | | | 100,000 | | | 109,990 |
Icahn Enterprises | | | | | | |
6.250%, 05/15/2026 | | | 124,000 | | | 129,890 |
5.250%, 05/15/2027 | | | 100,000 | | | 103,250 |
4.750%, 09/15/2024 | | | 93,000 | | | 96,574 |
MasTec | | | | | | |
4.500%, 08/15/2028(A) | | | 75,000 | | | 77,812 |
Mauser Packaging Solutions Holding | | | | | | |
5.500%, 04/15/2024(A) | | | 124,000 | | | 125,932 |
MPH Acquisition Holdings | | | | | | |
5.750%, 11/01/2028(A) | | | 200,000 | | | 196,120 |
Navistar International | | | | | | |
9.500%, 05/01/2025(A) | | | 101,000 | | | 110,974 |
Nielsen Finance | | | | | | |
5.875%, 10/01/2030(A) | | | 300,000 | | | 324,000 |
5.625%, 10/01/2028(A) | | | 100,000 | | | 105,125 |
5.000%, 04/15/2022(A) | | | 46,000 | | | 46,009 |
Pitney Bowes | | | | | | |
7.250%, 03/15/2029(A) | | | 200,000 | | | 197,782 |
PowerTeam Services | | | | | | |
9.033%, 12/04/2025(A) | | | 100,000 | | | 111,030 |
Prime Security Services Borrower | | | | | | |
6.250%, 01/15/2028(A) | | | 124,000 | | | 129,083 |
5.750%, 04/15/2026(A) | | | 100,000 | | | 107,923 |
Sabre GLBL | | | | | | |
7.375%, 09/01/2025(A) | | | 100,000 | | | 108,975 |
Sensata Technologies | | | | | | |
4.375%, 02/15/2030(A) | | | 150,000 | | | 157,337 |
Sensata Technologies BV | | | | | | |
4.000%, 04/15/2029(A) | | | 300,000 | | | 305,409 |
Signature Aviation US Holdings | | | | | | |
5.375%, 05/01/2026(A) | | | 100,000 | | | 102,000 |
4.000%, 03/01/2028(A) | | | 100,000 | | | 101,692 |
Spirit AeroSystems | | | | | | |
7.500%, 04/15/2025(A) | | | 75,000 | | | 80,625 |
The accompanying notes are an integral part of the financial statements.
29
Schedule of Investments March 31, 2021
KFA Dynamic Fixed Income ETF (continued)
| | Face Amount | | Value |
CORPORATE OBLIGATIONS (continued) | | | | | | |
Industrials (continued) | | | | | | |
SSL Robotics | | | | | | |
9.750%, 12/31/2023(A) | | $ | 88,000 | | $ | 98,956 |
Summit Materials | | | | | | |
5.250%, 01/15/2029(A) | | | 50,000 | | | 52,300 |
Teekay | | | | | | |
9.250%, 11/15/2022(A) | | | 2,575,000 | | | 2,587,875 |
TransDigm | | | | | | |
8.000%, 12/15/2025(A) | | | 105,000 | | | 114,345 |
6.500%, 05/15/2025 | | | 100,000 | | | 101,875 |
6.375%, 06/15/2026 | | | 155,000 | | | 160,231 |
6.250%, 03/15/2026(A) | | | 180,000 | | | 190,782 |
5.500%, 11/15/2027 | | | 200,000 | | | 206,750 |
Triumph Group | | | | | | |
8.875%, 06/01/2024(A) | | | 100,000 | | | 112,520 |
United Rentals North America | | | | | | |
5.250%, 01/15/2030 | | | 105,000 | | | 114,023 |
4.875%, 01/15/2028 | | | 124,000 | | | 130,618 |
3.875%, 11/15/2027 | | | 153,000 | | | 158,546 |
3.875%, 02/15/2031 | | | 401,000 | | | 403,831 |
WESCO Distribution | | | | | | |
7.250%, 06/15/2028(A) | | | 85,000 | | | 95,115 |
7.125%, 06/15/2025(A) | | | 100,000 | | | 109,350 |
XPO Logistics | | | | | | |
6.250%, 05/01/2025(A) | | | 62,000 | | | 66,421 |
| | | | | | | 9,609,974 |
Information Technology — 5.5% | | | | | | |
Avaya | | | | | | |
6.125%, 09/15/2028(A) | | | 150,000 | | | 159,570 |
Booz Allen Hamilton | | | | | | |
3.875%, 09/01/2028(A) | | | 75,000 | | | 75,394 |
BY Crown Parent | | | | | | |
4.250%, 01/31/2026(A) | | | 100,000 | | | 103,375 |
CDW | | | | | | |
3.250%, 02/15/2029 | | | 75,000 | | | 74,062 |
Change Healthcare Holdings | | | | | | |
5.750%, 03/01/2025(A) | | | 93,000 | | | 94,800 |
EMC | | | | | | |
3.375%, 06/01/2023 | | | 124,000 | | | 127,768 |
Gartner | | | | | | |
4.500%, 07/01/2028(A) | | | 115,000 | | | 118,594 |
Go Daddy Operating | | | | | | |
5.250%, 12/01/2027(A) | | | 93,000 | | | 97,185 |
Microchip Technology | | | | | | |
4.250%, 09/01/2025(A) | | | 100,000 | | | 104,461 |
NCR | | | | | | |
6.125%, 09/01/2029(A) | | | 300,000 | | | 317,625 |
5.000%, 10/01/2028(A) | | | 124,000 | | | 125,240 |
The accompanying notes are an integral part of the financial statements.
30
Schedule of Investments March 31, 2021
KFA Dynamic Fixed Income ETF (continued)
| | Face Amount | | Value |
CORPORATE OBLIGATIONS (continued) | | | | | | |
Information Technology (continued) | | | | | | |
NortonLifeLock | | | | | | |
5.000%, 04/15/2025(A) | | $ | 100,000 | | $ | 101,330 |
Open Text Holdings | | | | | | |
4.125%, 02/15/2030(A) | | | 224,000 | | | 227,067 |
Rackspace Technology Global | | | | | | |
5.375%, 12/01/2028(A) | | | 452,000 | | | 459,605 |
Seagate HDD Cayman | | | | | | |
3.125%, 07/15/2029(A) | | | 75,000 | | | 72,437 |
SS&C Technologies | | | | | | |
5.500%, 09/30/2027(A) | | | 300,000 | | | 319,200 |
Switch | | | | | | |
3.750%, 09/15/2028(A) | | | 75,000 | | | 73,854 |
Veritas US | | | | | | |
7.500%, 09/01/2025(A) | | | 100,000 | | | 104,000 |
Western Digital | | | | | | |
4.750%, 02/15/2026 | | | 241,000 | | | 265,690 |
Xerox | | | | | | |
4.375%, 03/15/2023 | | | 114,000 | | | 119,273 |
Xerox Holdings | | | | | | |
5.000%, 08/15/2025(A) | | | 620,000 | | | 644,025 |
| | | | | | | 3,784,555 |
Materials — 4.4% | | | | | | |
Ball | | | | | | |
4.875%, 03/15/2026 | | | 100,000 | | | 111,831 |
2.875%, 08/15/2030 | | | 200,000 | | | 192,650 |
Blue Cube Spinco | | | | | | |
10.000%, 10/15/2025 | | | 125,000 | | | 131,875 |
CF Industries | | | | | | |
5.375%, 03/15/2044 | | | 75,000 | | | 88,969 |
5.150%, 03/15/2034 | | | 150,000 | | | 171,446 |
Chemours | | | | | | |
7.000%, 05/15/2025 | | | 104,000 | | | 106,964 |
5.750%, 11/15/2028(A) | | | 250,000 | | | 263,229 |
Element Solutions | | | | | | |
3.875%, 09/01/2028(A) | | | 50,000 | | | 49,380 |
Freeport-McMoRan | | | | | | |
5.450%, 03/15/2043 | | | 100,000 | | | 120,064 |
5.250%, 09/01/2029 | | | 200,000 | | | 218,704 |
4.375%, 08/01/2028 | | | 100,000 | | | 106,075 |
4.125%, 03/01/2028 | | | 124,000 | | | 130,349 |
Hudbay Minerals | | | | | | |
6.125%, 04/01/2029(A) | | | 100,000 | | | 106,750 |
NOVA Chemicals | | | | | | |
5.250%, 06/01/2027(A) | | | 125,000 | | | 131,171 |
Novelis | | | | | | |
5.875%, 09/30/2026(A) | | | 100,000 | | | 104,680 |
4.750%, 01/30/2030(A) | | | 100,000 | | | 103,011 |
The accompanying notes are an integral part of the financial statements.
31
Schedule of Investments March 31, 2021
KFA Dynamic Fixed Income ETF (continued)
| | Face Amount | | Value |
CORPORATE OBLIGATIONS (continued) | | | | | | |
Materials (continued) | | | | | | |
Owens-Brockway Glass Container | | | | | | |
6.625%, 05/13/2027(A) | | $ | 100,000 | | $ | 108,712 |
TPC Group | | | | | | |
10.500%, 08/01/2024(A) | | | 50,000 | | | 45,176 |
Tronox | | | | | | |
6.500%, 05/01/2025(A) | | | 93,000 | | | 99,743 |
4.625%, 03/15/2029(A) | | | 300,000 | | | 300,375 |
Tronox Finance | | | | | | |
5.750%, 10/01/2025(A) | | | 200,000 | | | 208,626 |
United States Steel | | | | | | |
6.875%, 08/15/2025 | | | 60,000 | | | 61,188 |
| | | | | | | 2,960,968 |
Real Estate — 4.3% | | | | | | |
Cushman & Wakefield US Borrower | | | | | | |
6.750%, 05/15/2028(A) | | | 150,000 | | | 162,187 |
Diversified Healthcare Trust | | | | | | |
9.750%, 06/15/2025 | | | 100,000 | | | 113,200 |
Howard Hughes | | | | | | |
4.375%, 02/01/2031(A) | | | 100,000 | | | 97,937 |
4.125%, 02/01/2029(A) | | | 100,000 | | | 97,772 |
Iron Mountain | | | | | | |
5.625%, 07/15/2032(A) | | | 150,000 | | | 156,750 |
5.250%, 03/15/2028(A) | | | 150,000 | | | 155,813 |
5.250%, 07/15/2030(A) | | | 103,000 | | | 106,275 |
4.875%, 09/15/2027(A) | | | 124,000 | | | 126,868 |
4.875%, 09/15/2029(A) | | | 162,000 | | | 164,017 |
IStar | | | | | | |
4.750%, 10/01/2024 | | | 124,000 | | | 129,010 |
Kennedy-Wilson | | | | | | |
5.875%, 04/01/2024 | | | 205,000 | | | 207,007 |
Lamar Media | | | | | | |
3.750%, 02/15/2028 | | | 124,000 | | | 123,845 |
Outfront Media Capital | | | | | | |
5.000%, 08/15/2027(A) | | | 75,000 | | | 75,750 |
Park Intermediate Holdings | | | | | | |
5.875%, 10/01/2028(A) | | | 100,000 | | | 106,025 |
Realogy Group | | | | | | |
9.375%, 04/01/2027(A) | | | 350,000 | | | 387,619 |
SBA Communications | | | | | | |
3.875%, 02/15/2027 | | | 118,000 | | | 120,620 |
Service Properties Trust | | | | | | |
4.350%, 10/01/2024 | | | 124,000 | | | 123,273 |
Uniti Group | | | | | | |
7.875%, 02/15/2025(A) | | | 150,000 | | | 162,300 |
VICI Properties | | | | | | |
4.125%, 08/15/2030(A) | | | 310,000 | | | 312,697 |
| | | | | | | 2,928,965 |
The accompanying notes are an integral part of the financial statements.
32
Schedule of Investments March 31, 2021
KFA Dynamic Fixed Income ETF (continued)
| | Face Amount/Shares | | Value |
CORPORATE OBLIGATIONS (continued) | | | | | | |
Utilities — 2.5% | | | | | | |
AmeriGas Partners | | | | | | |
5.875%, 08/20/2026 | | $ | 100,000 | | $ | 110,040 |
Calpine | | | | | | |
5.125%, 03/15/2028(A) | | | 100,000 | | | 100,465 |
5.000%, 02/01/2031(A) | | | 125,000 | | | 121,850 |
4.500%, 02/15/2028(A) | | | 229,000 | | | 230,924 |
Clearway Energy Operating | | | | | | |
4.750%, 03/15/2028(A) | | | 75,000 | | | 78,029 |
Emera | | | | | | |
6.750%, VAR ICE LIBOR USD 3 Month+5.440%, 06/15/2076 | | | 99,000 | | | 112,514 |
FirstEnergy | | | | | | |
7.375%, 11/15/2031 | | | 120,000 | | | 160,465 |
4.400%, 07/15/2027 | | | 100,000 | | | 107,500 |
3.400%, 03/01/2050 | | | 100,000 | | | 87,000 |
NextEra Energy Operating Partners | | | | | | |
4.250%, 07/15/2024(A) | | | 124,000 | | | 130,510 |
NRG Energy | | | | | | |
6.625%, 01/15/2027 | | | 75,000 | | | 78,000 |
5.250%, 06/15/2029(A) | | | 100,000 | | | 107,000 |
PG&E | | | | | | |
5.250%, 07/01/2030 | | | 75,000 | | | 79,616 |
Vistra Operations | | | | | | |
5.625%, 02/15/2027(A) | | | 85,000 | | | 88,348 |
5.500%, 09/01/2026(A) | | | 124,000 | | | 128,495 |
| | | | | | | 1,720,756 |
TOTAL CORPORATE OBLIGATIONS
(Cost $59,714,441) | | | | | | 60,350,946 |
| | | | | | | |
EXCHANGE — TRADED FUNDS — 7.6% | | | | | | |
IShares IBoxx High Yield Corporate Bond ETF | | | 29,600 | | | 2,580,528 |
SPDR Bloomberg Barclays High Yield Bond ETF | | | 24,225 | | | 2,635,680 |
TOTAL EXCHANGE – TRADED FUNDS
(Cost $5,113,466) | | | | | | 5,216,208 |
| | | | | | | |
MUNICIPAL BOND — 0.9% | | | | | | |
Puerto Rico — 0.9% | | | | | | |
GDB Debt Recovery Authority of Puerto Rico, RB 7.500%, 08/20/2040 | | | 750,097 | | | 630,082 |
TOTAL MUNICIPAL BOND
(Cost $562,841) | | | | | | 630,082 |
The accompanying notes are an integral part of the financial statements.
33
Schedule of Investments March 31, 2021
KFA Dynamic Fixed Income ETF (continued)
| | Shares/Face Amount | | Value |
PREFERRED STOCK — 0.7% | | | | | | |
Financials — 0.7% | | | | | | |
Bank of America‡ | | | 10,000 | | $ | 250,000 |
Bank of America‡ | | | 930 | | | 23,045 |
Wells Fargo‡ | | | 9,600 | | | 245,088 |
TOTAL PREFERRED STOCK
(Cost $518,349) | | | | | | 518,133 |
| | | | | | | |
CONVERTIBLE BOND — 0.2% | | | | | | |
Financials — 0.2% | | | | | | |
New York Mortgage Trust
6.250%, 01/15/2022 | | $ | 124,000 | | | 125,938 |
TOTAL CONVERTIBLE BOND
(Cost $125,370) | | | | | | 125,938 |
| | | | | | | |
TOTAL INVESTMENTS — 97.3%
(Cost $66,034,467) | | | | | | 66,841,307 |
OTHER ASSETS LESS LIABILITIES — 2.7% | | | | | | 1,847,754 |
NET ASSETS — 100% | | | | | $ | 68,689,061 |
‡ Perpetual security with no stated maturity date.
(A) Securities sold within the terms of a private placement memorandum, exempt from registration under section 144A of the Securities Act of 1933, as amended, and may be sold only to dealers in that program or other “accredited investors.” The total market value of such securities as of March 31, 2021 was $33,393,500 and represented 48.6% of the Net Assets of the Fund.
(B) The rate reported on the Schedule of Investments is the effective yield at time of purchase.
(C) Variable or floating rate security, the interest rate of which adjusts periodically based on changes in current interest rates and prepayments on the underlying pool of assets.
ETF — Exchange-Traded Fund
ICE — Intercontinental Exchange
LIBOR — London Interbank Offered Rate
MTN — Medium Term Note
RB — Revenue Bond
REIT — Real Estate Investment Trust
SPDR — Standard & Poor’s Depository Receipt
ULC — Unlimited Liability Company
USD — United States Dollar
VAR — Variable Rate
The accompanying notes are an integral part of the financial statements.
34
Schedule of Investments March 31, 2021
KFA Dynamic Fixed Income ETF (concluded)
The following summarizes the market value of the Fund’s investments used as of March 31, 2021, based on the inputs used to value them:
Investments in Securities | | Level 1 | | Level 2 | | Level 3 | | Total |
Corporate Obligations | | $ | — | | $ | 60,350,946 | | $ | — | | $ | 60,350,946 |
Exchange — Traded Funds | | | 5,216,208 | | | — | | | — | | | 5,216,208 |
Municipal Bond | | | — | | | 630,082 | | | — | | | 630,082 |
Preferred Stock | | | 518,133 | | | — | | | — | | | 518,133 |
Convertible Bond | | | — | | | 125,938 | | | — | | | 125,938 |
Total Investments in Securities | | $ | 5,734,341 | | $ | 61,106,966 | | $ | — | | $ | 66,841,307 |
For the year ended March 31, 2021, there have been no transfers in or out of Level 3.
Amounts designated as “—” are $0 or have been rounded to $0.
The accompanying notes are an integral part of the financial statements.
35
Schedule of Investments March 31, 2021
KFA Value Line® Dynamic Core Equity Index ETF
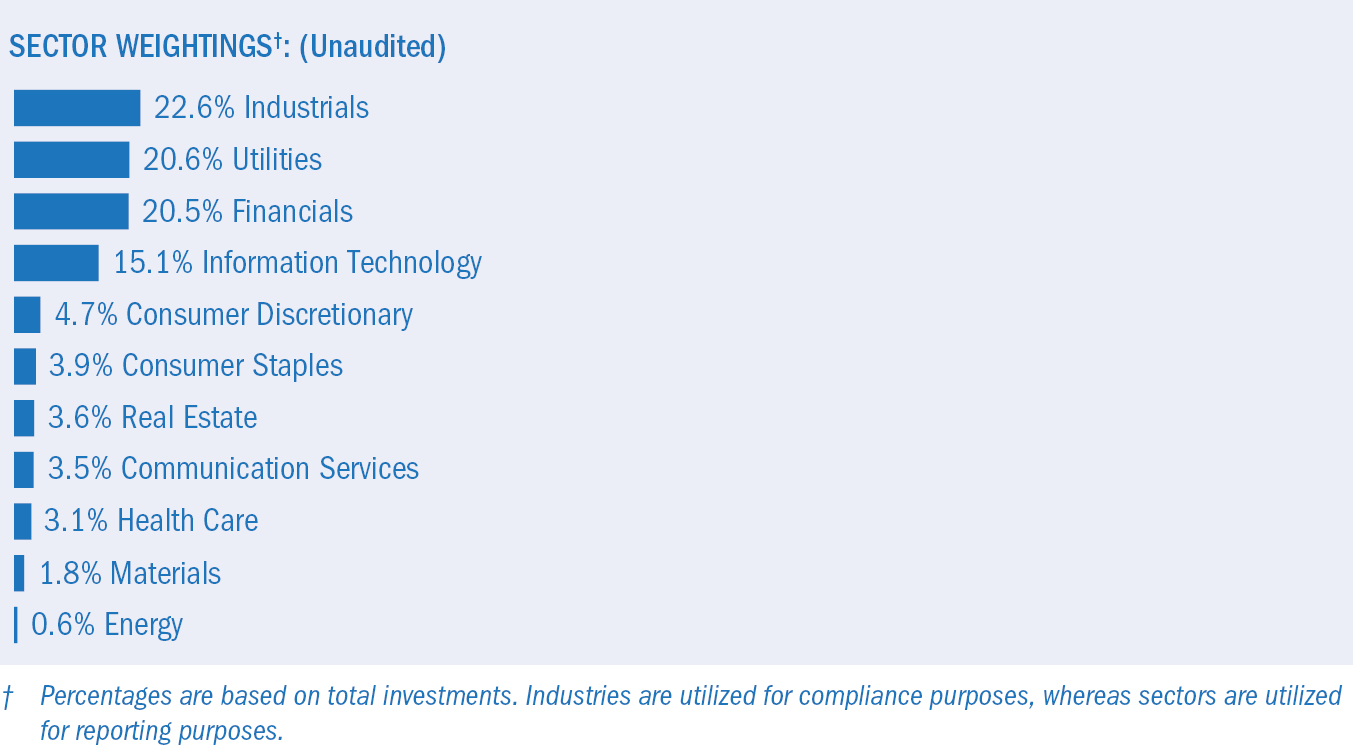
| | Shares | | Value |
COMMON STOCK — 99.6%‡ | | | | | |
UNITED STATES — 99.6% | | | | | |
Communication Services — 3.5% | | | | | |
AT&T | | 17,069 | | $ | 516,679 |
Omnicom Group | | 149 | | | 11,048 |
Verizon Communications | | 6,033 | | | 350,819 |
| | | | | | 878,546 |
Consumer Discretionary — 4.7% | | | | | |
Amazon.com* | | 35 | | | 108,293 |
Genuine Parts | | 106 | | | 12,253 |
Home Depot | | 393 | | | 119,963 |
Lowe’s | | 2,562 | | | 487,241 |
McDonald’s | | 2,053 | | | 460,159 |
| | | | | | 1,187,909 |
Consumer Staples — 3.9% | | | | | |
Coca-Cola | | 10,150 | | | 535,006 |
PepsiCo | | 2,971 | | | 420,248 |
Walgreens Boots Alliance | | 529 | | | 29,042 |
| | | | | | 984,296 |
Energy — 0.5% | | | | | |
Chevron | | 1,320 | | | 138,323 |
Financials — 20.4% | | | | | |
Aflac | | 7,731 | | | 395,673 |
Bank of Hawaii | | 4,234 | | | 378,901 |
Bank of New York Mellon | | 8,756 | | | 414,071 |
BlackRock, Cl A | | 585 | | | 441,067 |
CNA Financial | | 4,459 | | | 199,005 |
Discover Financial Services | | 207 | | | 19,663 |
Goldman Sachs Group | | 225 | | | 73,575 |
Hartford Financial Services Group | | 7,114 | | | 475,144 |
JPMorgan Chase | | 4,375 | | | 666,006 |
The accompanying notes are an integral part of the financial statements.
36
Schedule of Investments March 31, 2021
KFA Value Line® Dynamic Core Equity Index ETF (continued)
| | Shares | | Value |
COMMON STOCK (continued) | | | | | |
Financials (continued) | | | | | |
M&T Bank | | 2,440 | | $ | 369,928 |
Morgan Stanley | | 5,552 | | | 431,168 |
PNC Financial Services Group | | 2,357 | | | 413,441 |
Progressive | | 4,454 | | | 425,847 |
US Bancorp | | 8,392 | | | 464,162 |
| | | | | | 5,167,651 |
Health Care — 3.1% | | | | | |
Bristol-Myers Squibb | | 5,995 | | | 378,465 |
Gilead Sciences | | 6,367 | | | 411,499 |
Johnson & Johnson | | 23 | | | 3,780 |
| | | | | | 793,744 |
Industrials — 22.5% | | | | | |
3M | | 2,309 | | | 444,898 |
Caterpillar | | 1,484 | | | 344,095 |
Cummins | | 1,385 | | | 358,867 |
Deere | | 1,054 | | | 394,344 |
Emerson Electric | | 4,499 | | | 405,900 |
FedEx | | 1,597 | | | 453,612 |
General Dynamics | | 2,400 | | | 435,744 |
Hubbell, Cl B | | 1,501 | | | 280,522 |
Illinois Tool Works | | 1,941 | | | 429,970 |
Lockheed Martin | | 1,257 | | | 464,461 |
MSC Industrial Direct, Cl A | | 4,527 | | | 408,290 |
Snap-on | | 1,812 | | | 418,101 |
United Parcel Service, Cl B | | 2,717 | | | 461,863 |
Watsco | | 1,495 | | | 389,821 |
| | | | | | 5,690,488 |
Information Technology — 15.1% | | | | | |
Apple | | 9,449 | | | 1,154,195 |
Avnet | | 9,286 | | | 385,462 |
Cisco Systems | | 10,188 | | | 526,822 |
Corning | | 10,631 | | | 462,555 |
International Business Machines | | 3,550 | | | 473,073 |
Juniper Networks | | 15,243 | | | 386,105 |
Paychex | | 4,187 | | | 410,409 |
PayPal Holdings* | | 50 | | | 12,142 |
| | | | | | 3,810,763 |
Materials — 1.8% | | | | | |
Packaging Corp of America | | 2,717 | | | 365,382 |
Sonoco Products | | 1,349 | | | 85,392 |
| | | | | | 450,774 |
Real Estate — 3.6% | | | | | |
Camden Property Trust† | | 3,494 | | | 384,026 |
Federal Realty Investment Trust† | | 3,456 | | | 350,611 |
Mid-America Apartment Communities† | | 1,269 | | | 183,193 |
| | | | | | 917,830 |
The accompanying notes are an integral part of the financial statements.
37
Schedule of Investments March 31, 2021
KFA Value Line® Dynamic Core Equity Index ETF (concluded)
| | Shares | | Value |
COMMON STOCK (continued) | | | | | |
Utilities — 20.5% | | | | | |
Avista | | 4,895 | | $ | 233,736 |
Black Hills | | 2,815 | | | 187,958 |
DTE Energy | | 931 | | | 123,953 |
Entergy | | 3,698 | | | 367,840 |
Evergy | | 6,628 | | | 394,565 |
Hawaiian Electric Industries | | 9,651 | | | 428,794 |
MDU Resources Group | | 11,989 | | | 378,972 |
New Jersey Resources | | 9,619 | | | 383,510 |
NiSource | | 1,019 | | | 24,568 |
Northwest Natural Holding | | 7,080 | | | 381,966 |
NorthWestern | | 6,125 | | | 399,350 |
OGE Energy | | 11,356 | | | 367,480 |
Pinnacle West Capital | | 3,453 | | | 280,902 |
PPL | | 11,138 | | | 321,220 |
Southern | | 2,896 | | | 180,015 |
Spire | | 5,144 | | | 380,090 |
UGI | | 8,869 | | | 363,718 |
| | | | | | 5,198,637 |
TOTAL UNITED STATES | | | | | 25,218,961 |
TOTAL COMMON STOCK
(Cost $22,814,376) | | | | | 25,218,961 |
| | | | | | |
TOTAL INVESTMENTS — 99.6%
(Cost $22,814,376) | | | | | 25,218,961 |
OTHER ASSETS LESS LIABILITIES — 0.4% | | | | | 95,691 |
NET ASSETS — 100% | | | | $ | 25,314,652 |
‡ Industries are utilized for compliance purposes, whereas sectors are utilized for reporting.
* Non-income producing security.
† Real Estate Investment Trust
Cl — Class
As of March 31, 2021, all of the Fund’s investments were considered Level 1 of the fair value hierarchy, in accordance with the authoritative guidance under U.S. GAAP.
For the period ended March 31, 2021, there have been no transfers in or out of Level 3.
The accompanying notes are an integral part of the financial statements.
38
Consolidated Schedule of Investments March 31, 2021
KFA Mount Lucas Index Strategy ETF

| | Shares | | Value |
EXCHANGE — TRADED FUND — 78.8% | | | | | |
Schwab Short-Term U.S. Treasury ETF‡ | | 444,450 | | $ | 22,804,730 |
TOTAL EXCHANGE — TRADED FUND
(Cost $22,834,235) | | | | | 22,804,730 |
TOTAL INVESTMENTS — 78.8%
(Cost $22,834,235) | | | | | 22,804,730 |
OTHER ASSETS LESS LIABILITIES — 21.2% | | | | | 6,118,553 |
NET ASSETS — 100% | | | | $ | 28,923,283 |
A list of the open futures contracts held by the Fund at March 31, 2021, is as follows:
Description | | Number of
Contracts | | Expiration
Date | | Notional
Amount | | Value | | Unrealized
Appreciation/
(Depreciation) |
Long Contracts | | | | | | | | | | | | | | | | |
AUDUSD Currency | | 60 | | Jun-2021 | | $ | 4,643,057 | | | $ | 4,560,900 | | | $ | (82,157 | ) |
British Pound | | 54 | | Jun-2021 | | | 4,703,804 | | | | 4,651,088 | | | | (52,716 | ) |
CAD Currency | | 59 | | Jun-2021 | | | 4,706,032 | | | | 4,694,630 | | | | (11,402 | ) |
Copper^ | | 19 | | Jul-2021 | | | 1,934,437 | | | | 1,900,238 | | | | (34,200 | ) |
Corn^ | | 72 | | May-2021 | | | 1,951,225 | | | | 2,031,300 | | | | 80,075 | |
Euro | | 28 | | Jun-2021 | | | 4,181,642 | | | | 4,109,700 | | | | (71,942 | ) |
Gasoline^ | | 24 | | May-2021 | | | 1,881,529 | | | | 1,969,229 | | | | 87,700 | |
Live Cattle^ | | 41 | | Jul-2021 | | | 1,953,660 | | | | 2,015,560 | | | | 61,900 | |
NY Harbor ULSD^ | | 25 | | May-2021 | | | 1,882,915 | | | | 1,861,440 | | | | (21,475 | ) |
Soybean^ | | 28 | | May-2021 | | | 1,932,062 | | | | 2,011,450 | | | | 79,388 | |
Wheat^ | | 59 | | May-2021 | | | 1,934,212 | | | | 1,823,100 | | | | (111,113 | ) |
WTI Crude Oil^ | | 32 | | May-2021 | | | 1,925,760 | | | | 1,893,760 | | | | (32,000 | ) |
| | | | | | | | 33,630,335 | | | | 33,522,395 | | | | (107,942 | ) |
Short Contracts | | | | | | | | | | | | | | | | |
Canadian 10-Year Bond | | (67) | | Jun-2021 | | | (7,551,209 | ) | | | (7,398,416 | ) | | | 188,521 | |
Euro-Bund | | (36) | | Jun-2021 | | | (7,337,384 | ) | | | (7,230,988 | ) | | | (7,093 | ) |
Gold^ | | (11) | | Jul-2021 | | | (1,900,672 | ) | | | (1,887,160 | ) | | | 13,512 | |
Japanese 10-Year Bond | | (5) | | Jun-2021 | | | (6,924,562 | ) | | | (6,825,920 | ) | | | (8,922 | ) |
Japanese Yen | | (40) | | Jun-2021 | | | (4,601,460 | ) | | | (4,517,750 | ) | | | 83,710 | |
Long Gilt 10-Year Bond | | (41) | | Jul-2021 | | | (7,410,033 | ) | | | (7,211,754 | ) | | | 68,591 | |
Natural Gas^ | | (49) | | May-2021 | | | (1,305,587 | ) | | | (1,306,830 | ) | | | (1,243 | ) |
Sugar No. 11^ | | 106 | | May-2021 | | | 1,998,539 | | | | 1,753,494 | | | | (245,045 | ) |
Swiss Franc | | (31) | | Jun-2021 | | | (4,149,581 | ) | | | (4,105,563 | ) | | | 44,019 | |
U.S. 10-Year Treasury Note | | (55) | | Jun-2021 | | | (7,378,596 | ) | | | (7,201,563 | ) | | | 177,034 | |
| | | | | | | | (46,560,545 | ) | | | (45,932,450 | ) | | | 313,084 | |
| | | | | | | $ | (12,930,210 | ) | | $ | (12,410,055 | ) | | $ | 205,142 | |
^ Security is held by the KFA MLM Index Subsidiary, Ltd. as of March 31, 2021.
The accompanying notes are an integral part of the financial statements.
39
Consolidated Schedule of Investments March 31, 2021
KFA Mount Lucas Index Strategy ETF (concluded)
‡ For financial information on the Schwab Short-Term U.S. Treasury ETF, please go to the Securities Exchange Commission’s website at http://www.sec.gov.
AUD — Australian Dollar
CAD — Canadian Dollar
ETF — Exchange-Traded Fund
ULSD — Ultra-Low Sulfur Diesel
USD — U.S. Dollar
The following summarizes the market value of the Fund’s investments and other financial instruments used as of March 31, 2021, based on the inputs used to value them:
Investments in Securities | | Level 1 | | Level 2 | | Level 3 | | Total |
Exchange — Traded Fund | | $ | 22,804,730 | | $ | — | | $ | — | | $ | 22,804,730 |
Total Investments in Securities | | $ | 22,804,730 | | $ | — | | $ | — | | $ | 22,804,730 |
Other Financial Instruments | | Level 1 | | Level 2 | | Level 3 | | Total |
Futures Contracts* | | | | | | | | | | | | | | |
Unrealized Appreciation | | $ | 884,450 | | | $ | — | | $ | — | | $ | 884,450 | |
Unrealized Depreciation | | | (679,308 | ) | | | — | | | — | | | (679,308 | ) |
Total Other Financial Instruments | | $ | 205,142 | | | $ | — | | $ | — | | $ | 205,142 | |
* Futures Contracts are valued at the unrealized appreciation/(depreciation) on the instrument.
For the period ended March 31, 2021, there have been no transfers in or out of Level 3.
Amounts designated as “—” are $0 or have been rounded to $0.
The accompanying notes are an integral part of the financial statements.
40
Statements of Assets and Liabilities
March 31, 2021
| | KFA Large
Cap Quality
Dividend
Index ETF | | KFA Small
Cap Quality
Dividend
Index ETF | | KFA Dynamic
Fixed
Income ETF | | KFA Value
Line®
Dynamic Core
Equity
Index ETF |
Assets: | | | | | | | | | | | | | |
Investments at Value | | $ | 48,890,369 | | $ | 38,447,041 | | $ | 66,841,307 | | | $ | 25,218,961 |
Cash and Cash Equivalents | | | 56,157 | | | 58,740 | | | 1,440,770 | | | | 60,613 |
Receivable for Investment Securities Sold | | | 3,060,922 | | | 2,853,538 | | | — | | | | — |
Dividend and Interest Receivable | | | 68,248 | | | 73,293 | | | 869,470 | | | | 46,631 |
Reclaim Receivable | | | 845 | | | — | | | — | | | | — |
Total Assets | | | 52,076,541 | | | 41,432,612 | | | 69,151,547 | | | | 25,326,205 |
| | | | | | | | | | | | | | |
Liabilities: | | | | | | | | | | | | | |
Payable for Investment Securities Purchased | | | — | | | — | | | 436,722 | | | | — |
Payable for Capital Shares Redeemed | | | 3,062,316 | | | 2,856,210 | | | — | | | | — |
Payable for Management Fees | | | 17,046 | | | 17,460 | | | 25,687 | | | | 11,500 |
Payable for Trustees’ Fee | | | 57 | | | 43 | | | 77 | | | | 53 |
Total Liabilities | | | 3,079,419 | | | 2,873,713 | | | 462,486 | | | | 11,553 |
Net Assets | | $ | 48,997,122 | | $ | 38,558,899 | | $ | 68,689,061 | | | $ | 25,314,652 |
| | | | | | | | | | | | | | |
Net Assets Consist of: | | | | | | | | | | | | | |
Paid-in Capital | | $ | 44,267,666 | | $ | 35,963,938 | | $ | 74,692,972 | | | $ | 22,604,254 |
Total Distributable Earnings/(Loss) | | | 4,729,456 | | | 2,594,961 | | | (6,003,911 | ) | | | 2,710,398 |
Net Assets | | $ | 48,997,122 | | $ | 38,558,899 | | $ | 68,689,061 | | | $ | 25,314,652 |
Outstanding Shares of Beneficial Interest (unlimited authorization — no par value) | | | 1,600,002 | | | 1,350,002 | | | 3,200,002 | | | | 1,100,002 |
Net Asset Value, Offering and Redemption Price Per Share | | $ | 30.62 | | $ | 28.56 | | $ | 21.47 | | | $ | 23.01 |
Cost of Investments | | $ | 43,404,576 | | $ | 33,201,488 | | $ | 66,034,467 | | | $ | 22,814,376 |
Amounts designated as “—” are $0 or have been rounded to $0.
The accompanying notes are an integral part of the financial statements.
41
Consolidated Statements of Assets and Liabilities (concluded)
March 31, 2021
| | KFA Mount
Lucas Index
Strategy ETF |
Assets: | | | |
Investments at Value | | $ | 22,804,730 |
Cash and Cash Equivalents | | | 1,850,898 |
Cash Collateral on Future Contracts | | | 3,851,077 |
Foreign Currency at Value | | | 226,705 |
Variation Margin Receivable on Future Contracts | | | 401,165 |
Total Assets | | | 29,134,575 |
| | | | |
Liabilities: | | | |
Variation Margin Payable on Future Contracts | | | 189,128 |
Payable for Management Fees | | | 22,099 |
Payable for Trustees’ Fee | | | 65 |
Total Liabilities | | | 211,292 |
Net Assets | | $ | 28,923,283 |
| | | | |
Net Assets Consist of: | | | |
Paid-in Capital | | $ | 26,611,366 |
Total Distributable Earnings | | | 2,311,917 |
Net Assets | | $ | 28,923,283 |
Outstanding Shares of Beneficial Interest (unlimited authorization – no par value) | | | 1,050,002 |
Net Asset Value, Offering and Redemption Price Per Share | | $ | 27.55 |
Cost of Investments | | $ | 22,834,235 |
Cost of Foreign Currency | | $ | 224,930 |
The accompanying notes are an integral part of the financial statements.
42
Statements of Operations
For the year or period ended March 31, 2021
| | KFA Large
Cap Quality
Dividend
Index ETF | | KFA Small
Cap Quality
Dividend
Index ETF | | KFA Dynamic
Fixed
Income ETF | | KFA Value
Line®
Dynamic Core
Equity
Index ETF(1) |
Investment Income: | | | | | | | | | | | | | | |
Dividend Income | | $ | 1,026,467 | | | $ | 708,252 | | $ | 110,307 | | | $ | 220,340 |
Interest Income | | | 98 | | | | 48 | | | 2,028,754 | | | | 1 |
Less: Foreign Taxes Withheld | | | (1,903 | ) | | | — | | | — | | | | — |
Total Investment Income | | | 1,024,662 | | | | 708,300 | | | 2,139,061 | | | | 220,341 |
| | | | | | | | | | | | | | | |
Expenses: | | | | | | | | | | | | | | |
Management Fees† | | | 179,934 | | | | 152,172 | | | 223,900 | | | | 37,428 |
Trustees’ Fees | | | 3,626 | | | | 2,288 | | | 3,785 | | | | 230 |
Other Fees | | | 1,605 | | | | 923 | | | 1,365 | | | | — |
Net Expenses | | | 185,165 | | | | 155,383 | | | 229,050 | | | | 37,658 |
Net Investment Income | | | 839,497 | | | | 552,917 | | | 1,910,011 | | | | 182,683 |
| | | | | | | | | | | | | | | |
Net Realized Gain (Loss) on: | | | | | | | | | | | | | | |
Investments | | | 6,439,707 | | | | 961,605 | | | (3,207,049 | ) | | | 199,509 |
Net Realized Gain (Loss) on Investments | | | 6,439,707 | | | | 961,605 | | | (3,207,049 | ) | | | 199,509 |
| | | | | | | | | | | | | | | |
Net Change in Unrealized Appreciation (Depreciation) on: | | | | | | | | | | | | | | |
Investments | | | 10,154,471 | | | | 9,522,470 | | | 3,879,833 | | | | 2,404,585 |
Net Change in Unrealized Appreciation on Investments | | | 10,154,471 | | | | 9,522,470 | | | 3,879,833 | | | | 2,404,585 |
Net Realized and Unrealized Gain on Investments | | | 16,594,178 | | | | 10,484,075 | | | 672,784 | | | | 2,604,094 |
Net Increase in Net Assets Resulting from Operations | | $ | 17,433,675 | | | $ | 11,036,992 | | $ | 2,582,795 | | | $ | 2,786,777 |
(1) Commenced operations on November 23, 2020.
† See Note 3 in Notes to Financial Statements.
Amounts designated as “—” are $0 or have been rounded to $0.
The accompanying notes are an integral part of the financial statements.
43
Consolidated Statements of Operations (concluded)
For the year or period ended March 31, 2021
| | KFA Mount
Lucas Index
Strategy ETF(1) |
Investment Income: | | | | |
Dividend Income | | $ | 23,100 | |
Interest Income | | | 232 | |
Total Investment Income | | | 23,332 | |
| | | | | |
Expenses: | | | | |
Management Fees† | | | 79,292 | |
Trustees’ Fees | | | 364 | |
Net Expenses | | | 79,656 | |
Net Investment Loss | | | (56,324 | ) |
| | | | | |
Net Realized Gain (Loss) on: | | | | |
Investments | | | (121 | ) |
Futures Contracts | | | 2,192,143 | |
Foreign Currency Translations | | | (1,193 | ) |
Net Realized Gain on Investments, Foreign Currency Translations and Futures Contracts | | | 2,190,829 | |
| | | | | |
Net Unrealized Appreciation (Depreciation) on: | | | | |
Investments | | | (29,505 | ) |
Futures Contracts | | | 205,142 | |
Foreign Currency Translations | | | 1,775 | |
Net Unrealized Appreciation on Investments, Foreign Currency Translations and Futures Contracts | | | 177,412 | |
Net Realized and Unrealized Gain on Investments, Foreign Currency Translations and Futures Contracts | | | 2,368,241 | |
Net Increase in Net Assets Resulting from Operations | | $ | 2,311,917 | |
(1) Commenced operations on December 1, 2020.
† See Note 3 in Notes to Financial Statements.
The accompanying notes are an integral part of the financial statements.
44
Statements of Changes in Net Assets
| | KFA Large Cap Quality
Dividend Index ETF |
| | | Year Ended
March 31,
2021 | | Period Ended
March 31,
2020(1) |
Operations: | | | | | | | | |
Net Investment Income | | $ | 839,497 | | | $ | 647,554 | |
Net Realized Gain (Loss) on Investments | | | 6,439,707 | | | | (4,803,438 | ) |
Net Change in Unrealized Appreciation (Depreciation) on Investments | | | 10,154,471 | | | | (4,668,678 | ) |
Net Increase (Decrease) in Net Assets Resulting from Operations | | | 17,433,675 | | | | (8,824,562 | ) |
| | | | | | | | | |
Distributions: | | | (912,095 | ) | | | (406,126 | ) |
| | | | | | | | | |
Capital Share Transactions:(2) | | | | | | | | |
Issued | | | 10,187,153 | | | | 55,597,961 | |
Redeemed | | | (18,937,151 | ) | | | (5,141,733 | ) |
Increase (Decrease) in Net Assets from Capital Share Transactions | | | (8,749,998 | ) | | | 50,456,228 | |
Total Increase in Net Assets | | | 7,771,582 | | | | 41,225,540 | |
| | | | | | | | | |
Net Assets: | | | | | | | | |
Beginning of Year/Period | | | 41,225,540 | | | | — | |
End of Year/Period | | $ | 48,997,122 | | | $ | 41,225,540 | |
| | | | | | | | | |
Share Transactions: | | | | | | | | |
Issued | | | 350,000 | | | | 2,150,002 | |
Redeemed | | | (700,000 | ) | | | (200,000 | ) |
Net Increase (Decrease) in Shares Outstanding from Share Transactions | | | (350,000 | ) | | | 1,950,002 | |
(1) Commenced operations on June 11, 2019.
(2) Includes transaction costs related to creations and redemptions.
Amounts designated as “—” are $0 or have been rounded to $0.
The accompanying notes are an integral part of the financial statements.
45
Statements of Changes in Net Assets (continued)
| | KFA Small Cap Quality
Dividend Index ETF |
| | | Year Ended
March 31,
2021 | | Period Ended
March 31,
2020(1) |
Operations: | | | | | | | | |
Net Investment Income | | $ | 552,917 | | | $ | 327,356 | |
Net Realized Gain (Loss) on Investments | | | 961,605 | | | | (1,602,361 | ) |
Net Change in Unrealized Appreciation (Depreciation) on Investments | | | 9,522,470 | | | | (4,276,917 | ) |
Net Increase (Decrease) in Net Assets Resulting from Operations | | | 11,036,992 | | | | (5,551,922 | ) |
| | | | | | | | | |
Distributions: | | | (538,857 | ) | | | (215,973 | ) |
| | | | | | | | | |
Capital Share Transactions:(2) | | | | | | | | |
Issued | | | 17,790,082 | | | | 32,045,018 | |
Redeemed | | | (14,722,406 | ) | | | (1,284,035 | ) |
Increase in Net Assets from Capital Share Transactions | | | 3,067,676 | | | | 30,760,983 | |
Total Increase in Net Assets | | | 13,565,811 | | | | 24,993,088 | |
| | | | | | | | | |
Net Assets: | | | | | | | | |
Beginning of Year/Period | | | 24,993,088 | | | | — | |
End of Year/Period | | $ | 38,558,899 | | | $ | 24,993,088 | |
| | | | | | | | | |
Share Transactions: | | | | | | | | |
Issued | | | 750,000 | | | | 1,250,002 | |
Redeemed | | | (600,000 | ) | | | (50,000 | ) |
Net Increase in Shares Outstanding from Share Transactions | | | 150,000 | | | | 1,200,002 | |
(1) Commenced operations on June 11, 2019.
(2) Includes transaction costs related to creations and redemptions.
Amounts designated as “—” are $0 or have been rounded to $0.
The accompanying notes are an integral part of the financial statements.
46
Statements of Changes in Net Assets (continued)
| | KFA Dynamic
Fixed Income ETF |
| | | Year Ended
March 31,
2021 | | Period Ended
March 31,
2020(1) |
Operations: | | | | | | | | |
Net Investment Income | | $ | 1,910,011 | | | $ | 310,230 | |
Net Realized Loss on Investments | | | (3,207,049 | ) | | | (3,380,489 | ) |
Net Change in Unrealized Appreciation (Depreciation) on Investments | | | 3,879,833 | | | | (3,072,993 | ) |
Net Increase (Decrease) in Net Assets Resulting from Operations | | | 2,582,795 | | | | (6,143,252 | ) |
| | | | | | | | | |
Distributions: | | | (1,893,337 | ) | | | (276,930 | ) |
| | | | | | | | | |
Capital Share Transactions:(2) | | | | | | | | |
Issued | | | 41,504,696 | | | | 52,799,288 | |
Redeemed | | | (19,884,199 | ) | | | — | |
Increase in Net Assets from Capital Share Transactions | | | 21,620,497 | | | | 52,799,288 | |
Total Increase in Net Assets | | | 22,309,955 | | | | 46,379,106 | |
| | | | | | | | | |
Net Assets: | | | | | | | | |
Beginning of Year/Period | | | 46,379,106 | | | | — | |
End of Year/Period | | $ | 68,689,061 | | | $ | 46,379,106 | |
| | | | | | | | | |
Share Transactions: | | | | | | | | |
Issued | | | 1,950,000 | | | | 2,200,002 | |
Redeemed | | | (950,000 | ) | | | — | |
Net Increase in Shares Outstanding from Share Transactions | | | 1,000,000 | | | | 2,200,002 | |
(1) Commenced operations on December 6, 2019.
(2) Includes transaction costs related to creations and redemptions.
Amounts designated as “—” are $0 or have been rounded to $0.
The accompanying notes are an integral part of the financial statements.
47
Statements of Changes in Net Assets (continued)
| | KFA Value
Line® Dynamic
Core Equity
Index ETF |
| | | Period Ended
March 31,
2021(1) |
Operations: | | | | |
Net Investment Income | | $ | 182,683 | |
Net Realized Gain on Investments and Foreign Currency Translations | | | 199,509 | |
Net Unrealized Appreciation (Depreciation) on Investments and Foreign Currency Translations | | | 2,404,585 | |
Net Increase in Net Assets Resulting from Operations | | | 2,786,777 | |
| | | | | |
Distributions: | | | (54,791 | ) |
| | | | | |
Capital Share Transactions:(2) | | | | |
Issued | | | 23,604,970 | |
Redeemed | | | (1,022,304 | ) |
Increase in Net Assets from Capital Share Transactions | | | 22,582,666 | |
Total Increase in Net Assets | | | 25,314,652 | |
| | | | | |
Net Assets: | | | | |
Beginning of Period | | | — | |
End of Period | | $ | 25,314,652 | |
| | | | | |
Share Transactions: | | | | |
Issued | | | 1,150,002 | |
Redeemed | | | (50,000 | ) |
Net Increase in Shares Outstanding from Share Transactions | | | 1,100,002 | |
(1) Commenced operations on November 23, 2020.
(2) Includes transaction costs related to creations and redemptions.
Amounts designated as “—” are $0 or have been rounded to $0.
The accompanying notes are an integral part of the financial statements.
48
Consolidated Statement of Changes in Net Assets (concluded)
| | KFA Mount
Lucas Index
Strategy ETF |
| | | Period Ended
March 31,
2021(1) |
Operations: | | | | |
Net Investment Loss | | $ | (56,324 | ) |
Net Realized Gain on Investments, Futures Contracts, and Foreign Currency Translations | | | 2,190,829 | |
Net Unrealized Appreciation (Depreciation) on Investments, Futures Contracts, and Foreign Currency Translations | | | 177,412 | |
Net Increase in Net Assets Resulting from Operations | | | 2,311,917 | |
| | | | | |
Capital Share Transactions:(2) | | | | |
Issued | | | 26,611,366 | |
Increase in Net Assets from Capital Share Transactions | | | 26,611,366 | |
Total Increase in Net Assets | | | 28,923,283 | |
| | | | | |
Net Assets: | | | | |
Beginning of Period | | | — | |
End of Period | | $ | 28,923,283 | |
| | | | | |
Share Transactions: | | | | |
Issued | | | 1,050,002 | |
Net Increase in Shares Outstanding from Share Transactions | | | 1,050,002 | |
(1) Commenced operations on December 1, 2020.
(2) Includes transaction costs related to creations and redemptions.
Amounts designated as “—” are $0 or have been rounded to $0.
The accompanying notes are an integral part of the financial statements.
49
Financial Highlights/Consolidated Financial Highlights
Selected Per Share Data & Ratios
For the Years/Periods Ended March 31
For a Share Outstanding Throughout Each Period
| | Net Asset
Value,
Beginning
of Period
($) | | Net
Investment
Income
(Loss)
($)* | | Net
Realized
and
Unrealized
Gain (Loss)
on
Investments
($) | | Total
from
Operations
($) | | Distribution
from Net
Investment
Income
($) | | Distribution
from
Capital
Gains
($) | | Return
of
Capital
($) |
KFA Large Cap Quality Dividend Index ETF(1) |
2021 | | 21.14 | | 0.49 | | 9.67 | | 10.16 | | (0.68) | | — | | — |
2020 | | 25.00 | | 0.38 | | (4.04) | | (3.66) | | (0.20) | | — | | — |
KFA Small Cap Quality Dividend Index ETF(1) |
2021 | | 20.83 | | 0.44 | | 7.69 | | 8.13 | | (0.40) | | — | | — |
2020 | | 25.00 | | 0.35 | | (4.33) | | (3.98) | | (0.16) | | (0.03) | | — |
KFA Dynamic Fixed Income ETF(2) |
2021 | | 21.08 | | 0.81 | | 0.38 | | 1.19 | | (0.80) | | — | | — |
2020 | | 25.00 | | 0.34 | | (4.01) | | (3.67) | | (0.25) | | — | | — |
KFA Value Line® Dynamic Core Equity Index ETF(3) |
2021 | | 20.00 | | 0.20 | | 2.88 | | 3.08 | | (0.07) | | — | | — |
KFA Mount Lucas Index Strategy ETF(4) |
2021 | | 25.00 | | (0.06) | | 2.61 | | 2.55 | | — | | — | | — |
* Per share data calculated using average shares method.
** Total return is based on the change in net asset value of a share during the year or period and assumes reinvestment of dividends and distributions at net asset value. Total return is for the period indicated and periods of less than one year have not been annualized. The return shown does not reflect the deduction of taxes that a shareholder would pay on Fund distributions or the redemption of Fund shares. Excludes effects of standard creation and redemption transaction fees associated with creation units.
† Annualized.
†† Portfolio turnover rate is for the period indicated and periods of less than one year have not been annualized. Excludes effect of in-kind transfers.
(1) Commenced operations on June 11, 2019.
(2) Commenced operations on December 6, 2019.
(3) Commenced operations on November 23, 2020.
(4) Commenced operations on December 1, 2020.
Amounts designated as “—” are $0 or have been rounded to $0.
The accompanying notes are an integral part of the financial statements.
50
Total from
Distributions
($) | |
Net
Asset
Value,
End of
Period
($)
| | Total
Return
(%)** | | Net Assets
End of
Period
($)(000) | | Ratio of
Expenses to
Average Net
Assets
(%) | | Ratio of
Expenses to
Average Net
Assets
(Excluding
Waivers)
(%) | | Ratio of Net
Investment
Income (Loss) to
Average Net
Assets
(%) | | Portfolio
Turnover
(%) |
| | | | | | | | | | | | | | | |
(0.68) | | 30.62 | | 48.30 | | 48,997 | | 0.41 | | 0.41 | | 1.86 | | 142 |
(0.20) | | 21.14 | | (14.80) | | 41,226 | | 0.42† | | 0.42† | | 1.85† | | 72†† |
| | | | | | | | | | | | | | | |
(0.40) | | 28.56 | | 39.27 | | 38,559 | | 0.51 | | 0.51 | | 1.81 | | 126 |
(0.19) | | 20.83 | | (16.09) | | 24,993 | | 0.52† | | 0.52† | | 1.75† | | 59†† |
| | | | | | | | | | | | | | | |
(0.80) | | 21.47 | | 5.79 | | 68,689 | | 0.46 | | 0.46 | | 3.83 | | 147 |
(0.25) | | 21.08 | | (14.77) | | 46,379 | | 0.46† | | 0.46† | | 4.78† | | 292†† |
| | | | | | | | | | | | | | | |
(0.07) | | 23.01 | | 15.46 | | 25,315 | | 0.55† | | 0.55† | | 2.68† | | 55†† |
| | | | | | | | | | | | | | | |
— | | 27.55 | | 10.20 | | 28,923 | | 0.89† | | 0.89† | | (0.63)† | | —†† |
The accompanying notes are an integral part of the financial statements.
51
Notes to Financial Statements/Consolidated Notes to Financial Statements
1. ORGANIZATION
KraneShares Trust (the “Trust”) is a Delaware Statutory Trust formed on February 3, 2012. The Trust is registered under the Investment Company Act of 1940, as amended, as an open-end management investment company. As of March 31, 2021, the Trust had twenty four operational series. The financial statements herein and the related notes pertain to the following 5 series: KFA Large Cap Quality Dividend Index ETF, KFA Small Cap Quality Dividend Index ETF, KFA Dynamic Fixed Income ETF, KFA Value Line® Dynamic Core Equity Index ETF and KFA Mount Lucas Index Strategy ETF (each, a “Fund” and collectively, the “Funds”). Each of the Funds is a non-diversified Fund, as defined under Section 5(b)(1) of the Investment Company Act of 1940. Krane Funds Advisors, LLC (“Krane” or the ‘‘Adviser’’), a Delaware limited liability company, serves as the investment adviser for the Funds and is subject to the supervision of the Board of Trustees (the ‘‘Board’’). The Adviser is responsible for managing the investment activities of the Funds, the Funds’ business affairs and other administrative matters. The Adviser may use sub-advisers (each, a “Sub-Adviser” or collectively, the “Sub-Advisers”) to perform the day-to-day management of the Funds.
China International Capital Corporation (USA) Holdings Inc., a wholly-owned, indirect subsidiary of China International Capital Corporation Limited owns a majority stake in Krane. Central Huijin Investment Limited, a mainland Chinese-domiciled entity, and HKSCC Nominees Limited, currently holds approximately 40.2% and 30.7%, respectively, of the shares of China International Capital Corporation Limited. Central Huijin Investment Limited is a wholly-owned subsidiary of China Investment Corporation, which is a mainland Chinese sovereign wealth fund. KFA One Holdings, LLC, located at 280 Park Avenue 32nd Floor, New York, New York, 10017, holds the remaining equity interests in Krane and Jonathan Krane, through his equity interests in KFA One Holdings, LLC, beneficially owns more than 10% of the equity interests in Krane.
The KFA MLM Index Subsidiary, Ltd. is a wholly-owned subsidiary of the KFA Mount Lucas Index Strategy ETF (the “Subsidiary”). The Subsidiary is organized under the laws of the Cayman Islands as an exempt limited company. Information regarding the KFA Mount Lucas Index Strategy ETF and its subsidiary has been consolidated in the Consolidated Schedule of Investments, Consolidated Statement of Assets and Liabilities, Consolidated Statement of Operations, Consolidated Statement of Changes in Net Assets and Consolidated Financial Highlights.
Shares of the Funds are listed and traded on the NYSE Arca, Inc. (“NYSE Arca”), (the “Exchange”). Market prices for Fund shares (“Shares”) may be different from their net asset value (“NAV”). The Funds issue and redeem Shares on a continuous basis at NAV only in large blocks of Shares, typically 50,000 Shares or multiples thereof, called “Creation Units”. This does not mean, however, that individual investors will be able to redeem and purchase Shares directly with the series of the Trust. Only Authorized Participants can redeem and purchase Creation Units of Shares directly. Each Fund will issue and redeem Shares for a basket of securities and/or a balancing cash amount. Individual shares trade in the secondary market at market prices that change throughout the day.
52
Notes to Financial Statements/Consolidated Notes to Financial Statements (continued)
The investment objective of each Fund in the table below is to seek investment results that generally correspond (before fees and expenses) to its respective index listed below (each, an “Underlying Index”):
KraneShares Funds | | Index |
KFA Large Cap Quality Dividend Index ETF | | Russell 1000 Dividend Select Equal Weight Index |
KFA Small Cap Quality Dividend Index ETF | | Russell 2000 Dividend Select Equal Weight Index |
KFA Dynamic Fixed Income ETF | | FTSE US High-Yield Treasury Rotation Index |
KFA Value Line® Core Dynamic Equity Index ETF | | 3D/L Value Line® Dynamic Core Equity Index |
The KFA Mount Lucas Index Strategy ETF seeks to provide a total return that, before fees and expenses, exceeds that of the KFA MLM Index over a complete market cycle. The KFA Mount Lucas Index Strategy ETF is actively managed and does not track an index.
2. SIGNIFICANT ACCOUNTING POLICIES
The following is a summary of the significant accounting policies followed by the Funds. The Funds are investment companies that apply the accounting and reporting guidance issued in Topic 946 by the U.S. Financial Accounting Standards Board (“FASB”).
USE OF ESTIMATES — The preparation of financial statements in conformity with U.S. generally accepted accounting principles (“U.S. GAAP”) requires management to make estimates and assumptions that affect the reported amounts of assets and liabilities and disclosure of contingent assets and liabilities at the date of the financial statements and the reported amounts of increases and decreases in net assets from operations during the reporting period. Actual results could differ from those estimates, and could have a material impact to the Funds.
SECURITY VALUATION — The NAV per share of each Fund is computed by dividing the value of the net assets of a Fund (i.e., the value of its total assets less total liabilities and withholdings) by the total number of shares of a Fund outstanding, rounded to the nearest cent. Expenses and fees, including without limitation, the management, administration and distribution fees, are accrued daily and taken into account for purposes of determining NAV. The NAV per share for each Fund normally is calculated by the Administrator and determined as of the regularly scheduled close of the regular trading session on the NYSE (ordinarily 4:00 p.m., Eastern Time) on each day that the Exchange is open.
Securities listed on a securities exchange (i.e. exchange-traded equity securities), market or automated quotation system for which quotations are readily available (except for securities traded on NASDAQ), including securities traded over the counter, are valued by the Fund’s independent pricing agents at the last reported sale price on the primary exchange or market (foreign or domestic) on which they are traded (or at the time as of which the Fund’s NAV is calculated if a security’s exchange is normally open at that time). If there is no such reported sale, such securities are valued at the most recently reported bid price. For securities traded on NASDAQ, the NASDAQ Official Closing Price will be used. If a security price cannot be obtained from an independent, third-party pricing agent, the Fund seeks to obtain bid and ask prices from two broker-dealers who make a market in the portfolio instrument and determines the average of the two.
If available, debt securities are priced based upon valuations provided by independent third-party pricing agents. Such values generally reflect the last reported sales price if the security is actively traded. The third-party pricing agents may also value debt securities at an evaluated bid price by employing methodologies that utilize actual market transactions, broker-supplied valuations, or
53
Notes to Financial Statements/Consolidated Notes to Financial Statements (continued)
other methodologies designed to identify the market value for such securities. Debt obligations with remaining maturities of sixty days or less may be valued at their amortized cost, which approximates market value.
The prices for foreign securities are reported in local currency and converted to U.S. dollars using currency exchange rates. The exchange rates used for valuation are captured as of the close of the London Stock Exchange each day normally at 4:00 p.m. Greenwich Mean Time.
The value of a swap contract is equal to the obligation (or rights) under the swap contract, which will generally be equal to the net amounts to be paid or received under the contract based upon the relative values of the positions held by each party to the contract as determined by the applicable independent, third party pricing agent. Exchange-traded options are valued at the last reported sales price on the exchange on which they are listed. If there is no such reported sale on the valuation date, long positions are valued at the most recent bid price, and short positions are valued at the most recent ask price. Futures are valued at the settlement price established by the board of trade on which they are traded. Over-the-Counter (“OTC”) options are valued based upon prices determined by the applicable independent, third party pricing agent. Foreign currency forward contracts are valued at the current day’s interpolated foreign exchange rate, as calculated using the current day’s spot rate and the 30-, 60-, 90- and 180-day forward rates provided by an independent pricing agent. As of and during the year ended March 31, 2021, the Funds did not hold swaps, options or forward foreign currency contracts.
Investments in open-end investment companies that do not trade on an exchange are valued at the end of day NAV per share. Investments in open-end investment companies that trade on an exchange are valued in the same manner as other exchange-traded equity securities (described above).
Securities for which market prices are not ‘‘readily available,’’ or are not deemed to reflect current market values, or are debt securities where no evaluated price is available from the Trust’s third-party pricing agents pursuant to established methodologies, are fair valued in accordance with the Trust’s valuation policies and procedures approved by the Board of Trustees. Some of the more common reasons that may necessitate that a security be valued using ‘‘fair value’’ pricing may include, but are not limited to: the security’s trading has been halted or suspended; the security’s primary trading market is temporarily closed; or the security has not been traded for an extended period of time.
In addition, a Fund may fair value its securities if an event that may materially affect the value of a Fund’s securities that trade outside of the United States (a ‘‘Significant Event’’) has occurred between the time of the security’s last close and the time that a Fund calculates its NAV. A Significant Event may relate to a single issuer or to an entire market sector, country or region. Events that may be Significant Events may include: government actions, natural disasters, armed conflict, acts of terrorism and significant market fluctuations. If Krane becomes aware of a Significant Event that has occurred with respect to a portfolio instrument or group of portfolio instruments after the closing of the exchange or market on which the portfolio instrument or portfolio instruments principally trade, but before the time at which a Fund calculates its NAV, it will notify the Administrator and may request that an ad hoc meeting of the Fair Valuation Committee be called.
With respect to trade-halted securities, the Trust typically will fair value a trade-halted security by adjusting the security’s last market close price by the security’s sector performance, as measured by a predetermined index, unless Krane recommends and the Trust’s Fair Valuation Committee determines to make additional adjustments.
54
Notes to Financial Statements/Consolidated Notes to Financial Statements (continued)
Fair value pricing involves subjective judgments and it is possible that a fair value determination for a security is materially different than the value that could actually be realized upon the sale of the security or that another fund that uses market quotations or its own fair value procedures to price the same securities. In addition, fair value pricing could result in a difference between the prices used to calculate a Fund’s NAV and the prices used by the Underlying Index. This may adversely affect a Fund’s ability to track the Underlying Index.
Trading in securities on many foreign exchanges is normally completed before the close of business on each Business Day. In addition, securities trading in a particular country or countries may not take place on each Business Day or may take place on days that are not Business Days. Changes in valuations on certain securities may occur at times or on days on which a Fund’s NAV is not calculated and on which Fund shares do not trade and sales and redemptions of shares do not occur. As a result, the value of a Fund’s portfolio securities and the net asset value of its shares may change on days when share purchases or sales cannot occur. Fund shares are purchased or sold on a national securities exchange at market prices, which may be higher or lower than NAV. Transactions in Fund shares will be priced at NAV only if shares are purchased or redeemed directly from a Fund in Creation Units. No secondary sales will be made to brokers or dealers at a concession by the Distributor or by a Fund. Purchases and sales of shares in the secondary market, which will not involve a Fund, will be subject to customary brokerage commissions and charges.
In accordance with the authoritative guidance on fair value measurements and disclosure under U.S. GAAP, the Funds disclose the fair value of their investments in a hierarchy that prioritizes the inputs to valuation techniques used to measure the fair value. The objective of a fair value measurement is to determine the price that would be received to sell an asset or paid to transfer a liability in an orderly transaction between market participants at the measurement date (an exit price). Accordingly, the fair value hierarchy gives the highest priority to quoted prices (unadjusted) in active markets for identical assets or liabilities (Level 1) and the lowest priority to unobservable inputs (Level 3). The three levels of the fair value hierarchy are described below:
Level 1 — Unadjusted quoted prices in active markets for identical, unrestricted assets or liabilities that the Funds have the ability to access at the measurement date.
Level 2 — Other significant observable inputs (including quoted prices in non-active markets, quoted prices for similar investments, fair value of investments for which the Funds have the ability to fully redeem tranches at net asset value as of the measurement date or within the near term, and short-term investments valued at amortized cost).
Level 3 — Significant unobservable inputs (including the Funds’ own assumptions in determining the fair value of investments, broker quotes, fair value of investments for which the Funds do not have the ability to fully redeem tranches at net asset value as of the measurement date or within the near term).
Investments are classified within the level of the lowest significant input considered in determining fair value. Investments classified within Level 3 whose fair value measurement considers several inputs may include Level 1 or Level 2 inputs as components of the overall fair value measurement. For details of the investment classification, refer to each Fund’s Schedule of Investments.
FEDERAL INCOME TAXES — It is each Fund’s intention to qualify or continue to qualify as a regulated investment company for federal income tax purposes by complying with the appropriate provisions of
55
Notes to Financial Statements/Consolidated Notes to Financial Statements (continued)
Subchapter M of the Internal Revenue Code of 1986, as amended, and to distribute annually all or substantially all of its taxable income and gains to shareholders. Accordingly, no provisions for federal income taxes have been made in the financial statements.
The Funds evaluate tax positions taken or expected to be taken in the course of preparing the Funds’ tax returns to determine whether it is “more-likely-than-not” (i.e., greater than 50 percent) that each tax position will be sustained upon examination by a taxing authority based on the technical merits of the position. Tax positions not deemed to meet the more-likely-than-not threshold are recorded as a tax benefit or expense in the current year. The Funds did not record any tax provisions in the current period. However, management’s conclusions regarding tax positions may be subject to review and adjustment at a later date based on factors including, but not limited to, examination by tax authorities (i.e., the last three tax year ends, as applicable), on-going analysis of and changes to tax laws, regulations and interpretations thereof.
As of March 31, 2021, management of the Funds has reviewed all open tax years since inception and concluded that there is no tax liability resulting from unrecognized tax benefits relating to uncertain income tax positions taken or expected to be taken in future tax returns. The Funds are also not aware of any tax positions for which it is reasonably possible that the total amounts of unrecognized tax benefits will significantly change in the next 12 months.
SECURITY TRANSACTIONS AND INVESTMENT INCOME — Security transactions are accounted for on the trade date for financial reporting purposes. Costs used in determining realized gains and losses on the sale of investment securities are based on specific identification. Dividend income is recorded, net of any applicable withholding tax, on the ex-dividend date, or for certain foreign securities, when the information becomes available to the Funds. Interest income is recognized on the accrual basis from the settlement date and includes the amortization of premiums and the accretion of discount calculated using the effective interest method.
FOREIGN CURRENCY — The books and records of the Funds are maintained in U.S. dollars. Investment securities and other assets and liabilities denominated in a foreign currency are translated into U.S. dollars on the date of valuation. Purchases and sales of investment securities, income and expenses are translated into U.S. dollars at the relevant rates of exchange prevailing on the respective dates of such transactions. The Funds do not isolate that portion of realized or unrealized gains and losses resulting from changes in the foreign exchange rate from fluctuations arising from changes in the market prices of the securities. The Funds report certain foreign-currency-related transactions as components of realized gains for financial reporting purposes, whereas such components are treated as ordinary income for Federal income tax purposes.
INVESTMENTS IN REAL ESTATE INVESTMENT TRUSTS (“REITs”) — With respect to the Funds, dividend income is recorded based on the income included in distributions received from REIT investments using published REIT reclassifications, including some management estimates when actual amounts are not available. Distributions received in excess of these estimated amounts are recorded as a reduction of the cost of investments or reclassified to capital gains. The actual amounts of income, return of capital, and capital gains are only determined by each REIT after its fiscal year end, and may differ from the estimated amounts.
MASTER LIMITED PARTNERSHIPS — The Funds may invest in master limited partnerships (“MLPs”). MLPs are limited partnerships or limited liability companies, whose partnership units or limited liability interests are listed and traded on a U.S. securities exchange, and are treated as publicly traded partnerships for federal income tax purposes. To qualify to be treated as a partnership for
56
Notes to Financial Statements/Consolidated Notes to Financial Statements (continued)
tax purposes, a MLP must receive at least 90% of its income from qualifying sources as set forth in Section 7704(d) of the Internal Revenue Code of 1986, as amended (the “Code”). These qualifying sources include activities such as the exploration, development, mining, production, processing, refining, transportation, storage and marketing of mineral or natural resources. MLPs generally have two classes of owners, the general partner and limited partners. MLPs that are formed as limited liability companies generally have two analogous classes of owners, the managing member and the members. For purposes of this section, references to general partners also apply to managing members and references to limited partners also apply to members. The general partner is typically owned by a major energy company, an investment fund, the direct management of the MLP or is an entity owned by one or more of such parties. The general partner may be structured as a private or publicly traded corporation or other entity. The general partner typically controls the operations and management of the MLP through an equity interest of as much as 2% in the MLP plus, in many cases, ownership of common units and subordinated units. Limited partners own the remainder of the MLP through ownership of common units and have a limited role in the MLP’s operations and management.
FUTURES — The KFA Mount Lucas Index Strategy ETF will utilize the Subsidiary for purposes of investing in commodities futures contracts that are the same as or similar to those included in the Index. Initial margin deposits of cash or securities are made upon entering into futures contracts. The contracts are marked-to-market daily and the resulting changes in value are accounted for as unrealized gains and losses. Variation margin payments are paid or received, depending upon whether unrealized gains or losses are incurred. When contracts are closed, the Fund records a realized gain or loss equal to the difference between the proceeds from (or cost of) the closing transaction and the amount invested in the contract. As of March 31, 2021, the KFA Mount Lucas Index Strategy ETF had open futures contracts. Refer to the Fund’s Consolidated Schedule of Investments for details regarding open futures contracts as of March 31, 2021.
For the period ended March 31, 2021, the average monthly notional amount of futures contracts for the KFA Mount Lucas Index Strategy ETF was as follows:
KFA Mount Lucas Index Strategy ETF | | | |
Average Monthly Notional Value Long | | $ | 50,041,088 |
Average Monthly Notional Value Short | | $ | 24,819,774 |
DIVIDENDS AND DISTRIBUTIONS TO SHAREHOLDERS — The Funds distribute their net investment income at least annually. Any net realized capital gains are distributed annually. All distributions are recorded on the ex-dividend date.
CASH OVERDRAFT CHARGES — Per the terms of an agreement with Brown Brothers Harriman & Co. (“BBH”), the Funds’ Custodian, if a Fund has a cash overdraft on a given day, it will be assessed an overdraft charge of LIBOR plus 2.00%. Cash overdraft charges are included in “Interest Expense” on the Statements of Operations.
SECURITIES LENDING — The Funds may lend securities from their portfolios to brokers, dealers and other financial institutions. In connection with such loans, a Fund remains the beneficial owner of the loaned securities and continues to receive payments in amounts approximately equal to the interest, dividends or other distributions payable on the loaned securities. A Fund also has the right to terminate a loan at any time. A Fund does not have the right to vote on securities while they are on loan. Loans of portfolio securities will not exceed 33 1/3% of the value of a Fund’s total assets (including the value of all assets received as collateral for the loan). A Fund will receive collateral
57
Notes to Financial Statements/Consolidated Notes to Financial Statements (continued)
consisting of cash in the form of U.S. dollars, foreign currency, or securities issued or fully guaranteed by the U.S. Government which will be maintained at all times in an amount equal to at least 102% on domestic securities and 105% on international securities of the current market value of the loaned securities. If the collateral consists of cash, a Fund will reinvest the cash and pay the borrower a pre-negotiated fee or “rebate” from any return earned on the investment. Should the borrower of the securities fail financially, a Fund may experience delays in recovering the loaned securities or exercising its rights in the collateral. In a loan transaction, a Fund will also bear the risk of any decline in value of securities acquired with cash collateral. Krane and a sub-adviser are subject to potential conflicts of interest because the compensation paid to them increases in connection with any net income received by a Fund from a securities lending program. Each Fund pays Krane 10% of any net monthly income received from the investment of cash collateral and loan fees received from borrowers in respect of each securities loan (net of any amounts paid to the custodian and/or securities lending agent or rebated to borrowers) (see Note 3). There were no securities on loan as of March 31, 2021.
CREATION UNITS — The Funds issue and redeem Shares at NAV and only in large blocks of Shares (each block of Shares for a Fund is a Creation Unit of 50,000 Shares, or multiples thereof).
Except when aggregated in Creation Units, Shares are not redeemable securities of a Fund. Shares of a Fund may only be purchased or redeemed by certain Authorized Participants. An Authorized Participant is either (i) a broker-dealer or other participant in the clearing process through the Continuous Net Settlement System of the National Securities Clearing Corporation or (ii) a Depository Trust Company (‘‘DTC’’) participant and, in each case, must have executed a Participant Agreement with the Distributor. Most retail investors will not qualify as Authorized Participants or have the resources to buy and sell whole Creation Units. Therefore, they will be unable to purchase or redeem the Shares directly from a Fund. Rather, most retail investors will purchase Shares in the secondary market with the assistance of a broker and will be subject to customary brokerage commissions or fees when buying or selling Shares. If a Creation Unit is purchased or redeemed for cash, a higher transaction fee may be charged.
The following table discloses Creation Unit breakdown for the year ended March 31, 2021:
KraneShares Funds | | Creation
Unit
Shares | | Standard
Transaction
Fee – Subscriptions | | Value at
March 31,
2021 | | Standard
Transaction
Fee – Redemptions | | Maximum
Variable
Transaction
Fee* |
KFA Large Cap Quality Dividend Index ETF | | 50,000 | | $ | 700 | | $ | 1,531,000 | | $ | 700 | | 2.00 | % |
KFA Small Cap Quality Dividend Index ETF | | 50,000 | | | 350 | | | 1,428,000 | | | 350 | | 2.00 | % |
KFA Dynamic Fixed Income ETF | | 50,000 | | | 500 | | | 1,073,500 | | | 500 | | 2.00 | % |
KFA Value Line® Dynamic Core Equity Index ETF | | 50,000 | | | 400 | | | 1,150,500 | | | 400 | | 2.00 | % |
KFA Mount Lucas Index Strategy ETF | | 50,000 | | | 500 | | | 1,377,500 | | | 500 | | 2.00 | % |
* As a percentage of the Creation Unit(s) purchased/redeemed.
58
Notes to Financial Statements/Consolidated Notes to Financial Statements (continued)
CASH AND CASH EQUIVALENTS — Idle cash and currency balances may be swept into various overnight sweep accounts and are classified as cash equivalents on the Statement of Assets and Liabilities. These amounts, at times, may exceed United States federally insured limits. Amounts swept are available on the next business day.
3. DERIVATIVES TRANSACTIONS
The following tables are KFA Mount Lucas Index Strategy ETF exposure by type of risk on derivatives held throughout the period.
The fair value of derivative instruments as of March 31, 2021, was as follows:
Consolidated Statement of Assets and Liabilities Location | | Asset
Derivatives | | Liability
Derivatives |
Commodities Risk
Futures contracts | | Unrealized appreciation/(depreciation) on futures contracts* | | $ | 322,575 | | $ | (445,075 | ) |
Interest Rate Risk
Futures contracts | | Unrealized appreciation/(depreciation) on futures contracts* | | | 365,555 | | | (8,922 | ) |
Foreign Exchange Risk
Futures contracts | | Unrealized appreciation/(depreciation) on futures contracts* | | | 196,320 | | | (225,311 | ) |
| | | | | $ | 884,450 | | $ | (679,308 | ) |
* Unrealized appreciation (depreciation) on Futures Contracts is included in distributable earnings (loss).
The effect of derivative instruments on the Consolidated Statement of Operations for the period ended March 31, 2021, was as follows:
The amount of realized gain (loss) on derivatives recognized in income:
| | Net Realized
Gain/(Loss)* | | Change in
Unrealized
Appreciation/
(Depreciation)** | | Total |
Commodities Risk | | | | | | | | | | | |
Futures contracts | | $ | 2,045,118 | | $ | (122,500 | ) | | $ | 1,922,618 | |
Interest Risk | | | | | | | | | | | |
Futures contracts | | | 142,040 | | | 356,633 | | | | 498,673 | |
Foreign Exchange Risk | | | | | | | | | | | |
Futures contracts | | | 4,985 | | | (28,991 | ) | | | (24,006 | ) |
| | | $ | 2,192,143 | | $ | 205,142 | | | $ | 2,397,285 | |
* Futures contracts are included in net realized gain on Futures Contracts.
** Futures contracts are included in change in unrealized depreciation on Futures Contracts.
4. RELATED PARTY TRANSACTIONS
INVESTMENT ADVISORY AGREEMENT — The Adviser serves as investment adviser to each Fund pursuant to an Investment Advisory Agreement between the Trust on behalf of each Fund and the Adviser (the “Agreement”). Under the Agreement, Krane is responsible for reviewing, supervising and administering each Fund’s investment program and the general management and administration of the Trust. In addition to these services, to the extent a Fund engages in securities lending, Krane will: (i) assist the securities lending agent of the Fund (the “Agent”) to determine which securities
59
Notes to Financial Statements/Consolidated Notes to Financial Statements (continued)
are available for loan, (ii) monitor the Agent’s activities to ensure that securities loans are effected in accordance with Krane’s instructions and in accordance with applicable procedures and guidelines adopted by the Board, (iii) make recommendations to the Board regarding the Fund’s participation in securities lending; (iv) prepare appropriate periodic reports for, and seek appropriate periodic approvals from, the Board with respect to securities lending activities, (v) respond to Agent inquiries concerning the Agent’s activities, and (vi) such other related duties as Krane deems necessary or appropriate. The Board of Trustees of the Trust supervises Krane and establishes policies that Krane must follow in its management activities.
The Agreement requires the Adviser to pay all operating expenses of the Funds, except: (a) interest and taxes (including, but not limited to, income, excise, transaction, transfer and withholding taxes); (b) expenses of the Funds incurred with respect to the acquisition and disposition of portfolio securities and the execution of portfolio transactions, including brokerage commissions and short sale dividend or interest expense; (c) expenses incurred in connection with any distribution plan adopted by the Trust in compliance with Rule 12b-1 under the Investment Company Act, including distribution fees; (d) “Acquired Fund Fees and Expenses” (as defined by Form N-1A under the 1940 Act); (e) litigation expenses; (f) the compensation payable to the Adviser under the Agreement; (g) compensation and expenses of the Independent Trustees (including any fees of independent legal counsel to the Independent Trustees); and (h) any expenses determined to be extraordinary expenses by the Board. In addition, under the Agreement, while the fees and expenses related to the Funds’ securities lending-related activities reduce the gross revenues and income of the Funds from such activities, they are not fees and expenses for which Krane is responsible.
Each Agreement provides that each Fund pays a unitary (or unified) fee to the Adviser for advisory and management services provided to the Fund, subject to the exceptions noted herein. In this context, there exists a risk that a Trust service provider will seek recourse against the Trust if it is not timely paid by Krane for the fees and expenses for which it is responsible, which could materially adversely affect the Funds. Pursuant to the Agreement between the Trust and the Adviser, the Funds below pay the Adviser a fee, which is calculated daily and paid monthly, at the following annual rates, based on a percentage of the average daily net assets of each Fund. In addition, as compensation for the services provided by the Adviser in connection with any securities lending-related activities, each Fund pays the Adviser 10% of the monthly investment income received from the investment of cash collateral and loan fees received from borrowers in respect to securities loans (net of any amounts paid to the custodian and/or securities lending agent or rebated to borrowers), if any included on the Statements of Operations as “Security Lending Fees”. During the period, none of the Funds engaged in securities lending.
KraneShares Funds | | Management
Fee |
KFA Large Cap Quality Dividend Index ETF | | 0.40% |
KFA Small Cap Quality Dividend Index ETF | | 0.50% |
KFA Dynamic Fixed Income ETF | | 0.45% |
KFA Value Line® Dynamic Core Equity Index ETF | | 0.55% |
KFA Mount Lucas Index Strategy ETF | | 0.89% |
60
Notes to Financial Statements/Consolidated Notes to Financial Statements (continued)
The Adviser and each Sub-Adviser bear all of their own costs associated with providing these advisory services. As part of its agreement with the Trust, the Adviser has contractually agreed to pay all operating expenses of the Funds, including the cost of index licensing fees, transfer agency, custody, fund administration, legal, audit and other services, except as set forth above and as otherwise indicated in those agreements.
SUB-ADVISORY AGREEMENTS — SkyRock Investment Management, LLC (“SkyRock”) serves as the sub-adviser to the KFA Dynamic Fixed Income ETF and is responsible for the day-to-day management of the Fund, subject to the supervision by the Adviser and the Board. For the services SkyRock provides to KFA Dynamic Fixed Income ETF, the Adviser pays SkyRock a fee equal to 33.33% of the sum of: (i) the total gross management fee due to Krane from the Fund under the terms of the Advisory Agreement minus (ii) any applicable fee waivers from time to time entered into between the Fund and Krane.
3D/L Capital Management, LLC (“3D/L”) (formerly, Lee Capital Management, LP) serves as the Sub-Adviser of the KFA Value Line® Dynamic Core Equity Index ETF. 3D/L provides non-discretionary sub-advisory services to the Fund, which will includes research and portfolio modeling services related to the Fund’s investments and the monitoring of such investments. For the services 3D/L provides to the Fund, the Adviser pays 3D/L a fee equal to 25% of the sum of: (i) the total gross advisory fee due to Krane from the Fund under the terms of the Advisory Agreement minus (ii) any applicable fee waivers from time to time entered into between the Fund and Krane.
Mount Lucas Index Advisers LLC (“MLIA”) serves as the Sub-Adviser of the KFA Mount Lucas Index Strategy ETF. For the services MLIA provides to the Fund, the Adviser pays MLIA a fee equal to 32% of the the sum of: (i) the total gross advisory fee due to Krane from the Fund under the terms of the Advisory Agreement minus (ii) any applicable fee waivers from time to time entered into between the Fund and Krane.
DISTRIBUTION AGREEMENT — SEI Investments Distribution Co. (the “Distributor”), a wholly-owned subsidiary of SEI Investments Company, and an affiliate of the administrator, serves as the Funds’ distributor of Creation Units pursuant to a Distribution Agreement. The Distributor does not maintain any secondary market in Fund shares.
The Trust has adopted a Distribution and Service Plan (“Plan”) pursuant to Rule 12b-1 under the 1940 Act. In accordance with its Plan, each Fund is authorized to pay an amount up to 0.25% of its average daily net assets each year for certain distribution-related activities. For the year ended March 31, 2021, no fees were charged under the Plan, since no such fees are currently paid by the Funds and the Board of Trustees has not currently approved the commencement of any payments under the Plan. Fees would only be charged under the Plan upon approval by the Board.
ADMINISTRATOR, CUSTODIAN AND TRANSFER AGENT — SEI Investments Global Funds Services (the “Administrator”) serves as the Funds’ Administrator pursuant to an Administration Agreement. BBH serves as the Funds’ Custodian and Transfer Agent pursuant to a Custodian and Transfer Agent Agreement.
5. BASIS FOR CONSOLIDATION FOR THE KFA MOUNT LUCAS INDEX STRATEGY ETF
The Consolidated Schedule of Investments, Consolidated Statement of Assets and Liabilities, Consolidated Statement of Operations, Consolidated Statement of Changes in Net Assets and the Consolidated Financial Highlights of the KFA Mount Lucas Index Strategy ETF include the accounts
61
Notes to Financial Statements/Consolidated Notes to Financial Statements (continued)
of the Fund’s Subsidiary. All intercompany accounts and transactions have been eliminated in consolidation for the Fund. The Subsidiary has a fiscal year end of March 31 for financial statement consolidation purposes.
The Subsidiary is classified as a controlled foreign corporation under the Internal Revenue Code of 1986 (“IRC”). The Subsidiary’s taxable income is included in the calculation of the Fund’s taxable income. Net losses of the Subsidiary are not deductible by the Fund either in the current period or carried forward to future periods.
The KFA Mount Lucas Index Strategy ETF’s investment in the Subsidiary may not exceed 25% of the value of its total assets.
A summary of the investments in the Subsidiary is as follows:
KraneShares Funds | | Inception
Date Of
Subsidiary | | Subsidiary
Net Assets at
March 31,
2021 | | % of Total
Net Assets at
March 31,
2021 |
KFA MLM Index Subsidiary, Ltd. | | December 1, 2020 | | $ | 2,647,618 | | 9.15 | % |
6. INVESTMENT TRANSACTIONS
For the year ended March 31, 2021, the purchases and sales of investments in securities excluding in-kind transactions, long-term U.S. Government and short-term securities were:
KraneShares Funds | | Purchases | | Sales and
Maturities |
KFA Large Cap Quality Dividend Index ETF | | $ | 66,642,862 | | $ | 63,582,569 |
KFA Small Cap Quality Dividend Index ETF | | | 41,354,775 | | | 38,454,244 |
KFA Dynamic Fixed Income ETF | | | 89,273,261 | | | 17,062,060 |
KFA Value Line® Dynamic Core Equity Index ETF | | | 11,238,462 | | | 11,241,742 |
KFA Mount Lucas Index Strategy ETF | | | 22,834,235 | | | — |
During the year ended March 31, 2021, the purchases or sales of long-term U.S. government securities were:
KraneShares Funds | | Purchases | | Sales and
Maturities |
KFA Dynamic Fixed Income ETF | | $ | 39,975,426 | | $ | 39,832,267 |
For the year ended March 31, 2021, in-kind transactions associated with creations and redemptions were:
KraneShares Funds | | Purchases | | Sales and
Maturities | | Realized
Gain/(Loss) |
KFA Large Cap Quality Dividend Index ETF | | $ | 10,407,047 | | $ | 18,917,738 | | $ | 2,398,923 |
KFA Small Cap Quality Dividend Index ETF | | | 17,892,019 | | | 14,770,830 | | | 2,156,821 |
KFA Dynamic Fixed Income ETF | | | — | | | 19,344,325 | | | 273,187 |
KFA Value Line® Dynamic Core Equity Index ETF | | | 23,641,631 | | | 1,023,036 | | | 21,588 |
62
Notes to Financial Statements/Consolidated Notes to Financial Statements (continued)
7. TAX INFORMATION
The amount and character of income and capital gain distributions to be paid, if any, are determined in accordance with Federal income tax regulations, which may differ from U.S. GAAP. As a result, net investment income (loss) and net realized gain (loss) on investment transactions for a reporting period may differ significantly from distributions during such period. These book/tax differences may be temporary or permanent. The permanent differences primarily consist of foreign currency translation, investments in publicly traded partnerships, and perpetual bond adjustments. The permanent differences that are credited or charged to Paid-in-Capital and Distributable Earnings are redemption-in-kind transactions. To the extent these differences are permanent in nature, they are charged or credited to distributable earnings (loss) or paid-in capital, as appropriate, in the period that the differences arise.
KraneShares Funds | | Distributable
Earnings/(Loss) | | Paid-in
Capital |
KFA Large Cap Quality Dividend Index ETF | | $ | (2,401,016 | ) | | $ | 2,401,016 |
KFA Small Cap Quality Dividend Index ETF | | | (2,081,677 | ) | | | 2,081,677 |
KFA Dynamic Fixed Income ETF | | | (273,187 | ) | | | 273,187 |
KFA Value Line® Dynamic Core Equity Index ETF | | | (21,588 | ) | | | 21,588 |
KFA Mount Lucas Index Strategy ETF | | | — | | | | — |
The tax character of dividends and distributions paid during the year or period ended March 31, 2021 and March 31, 2020 were as follows:
KraneShares Funds | | Ordinary
Income | | Long-Term
Capital Gain | | Totals |
KFA Large Cap Quality Dividend Index ETF | | | | | | | | | |
2021 | | $ | 912,095 | | $ | — | | $ | 912,095 |
2020 | | | 406,126 | | | — | | | 406,126 |
KFA Small Cap Quality Dividend Index ETF | | | | | | | | | |
2021 | | $ | 538,857 | | $ | — | | $ | 538,857 |
2020 | | | 215,973 | | | — | | | 215,973 |
KFA Dynamic Fixed Income ETF | | | | | | | | | |
2021 | | $ | 1,893,337 | | $ | — | | $ | 1,893,337 |
2020 | | | 276,930 | | | — | | | 276,930 |
KFA Value Line® Dynamic Core Equity Index ETF | | | | | | | | | |
2021 | | $ | 54,791 | | $ | — | | $ | 54,791 |
KFA Mount Lucas Index Strategy ETF | | | | | | | | | |
2021 | | $ | — | | $ | — | | $ | — |
63
Notes to Financial Statements/Consolidated Notes to Financial Statements (continued)
As of March 31, 2021, the components of tax basis distributable earnings (accumulated losses) were as follows:
| | KFA Large Cap
Quality Dividend
Index ETF | | KFA Small Cap
Quality Dividend
Index ETF | | KFA Dynamic
Fixed
Income ETF |
Undistributed Ordinary Income | | $ | 162,836 | | | $ | 158,158 | | | $ | 41,241 | |
Capital Loss Carryforwards | | | (901,773 | ) | | | (2,692,351 | ) | | | (6,842,577 | ) |
Unrealized Appreciation on Investments and Foreign Currency | | | 5,468,393 | | | | 5,129,154 | | | | 787,650 | |
Other Temporary Differences | | | — | | | | — | | | | 9,775 | |
Total Distributable Earnings/(Loss) | | $ | 4,729,456 | | | $ | 2,594,961 | | | $ | (6,003,911 | ) |
| | KFA Value
Line® Dynamic
Core Equity
Index ETF | | KFA Mount
Lucas Index
Strategy ETF |
Undistributed Ordinary Income | | $ | 339,479 | | $ | 2,162,292 | |
Undistributed Long-Term Capital Gain | | | — | | | 43,456 | |
Unrealized Appreciation on Investments and Foreign Currency | | | 2,370,918 | | | 141,518 | |
Other Temporary Differences | | | 1 | | | (35,349 | ) |
Total Distributable Earnings | | $ | 2,710,398 | | $ | 2,311,917 | |
The Funds have capital losses carry forward as follows:
KraneShares Funds | | Short-Term
Loss | | Long-Term
Loss | | Total |
KFA Large Cap Quality Dividend Index ETF | | $ | 901,773 | | $ | — | | $ | 901,773 |
KFA Small Cap Quality Dividend Index ETF | | | 2,647,538 | | | 44,813 | | | 2,692,351 |
KFA Dynamic Fixed Income ETF | | | 6,842,577 | | | — | | | 6,842,577 |
During the year ended March 31, 2021, KFA Large Cap Quality Dividend Index ETF utilized $4,056,236 of capital loss carryforwards to offset capital gains.
The federal tax cost and aggregate gross unrealized appreciation and depreciation on investments held by the Funds at March 31, 2021, were as follows:
KraneShares Funds | | Federal
Tax Cost | | Aggregated
Gross
Unrealized
Appreciation | | Aggregated
Gross
Unrealized
Depreciation | | Net
Unrealized
Appreciation |
KFA Large Cap Quality Dividend Index ETF | | $ | 43,421,976 | | $ | 5,759,738 | | $ | (291,345 | ) | | $ | 5,468,393 |
KFA Small Cap Quality Dividend Index ETF | | | 33,317,887 | | | 5,738,690 | | | (609,536 | ) | | | 5,129,154 |
KFA Dynamic Fixed Income ETF | | | 66,053,657 | | | 1,223,044 | | | (435,394 | ) | | | 787,650 |
KFA Value Line® Dynamic Core Equity Index ETF | | | 22,848,044 | | | 2,437,763 | | | (66,845 | ) | | | 2,370,918 |
KFA Mount Lucas Index Strategy ETF | | | 22,844,588 | | | 181,373 | | | (39,858 | ) | | | 141,515 |
64
Notes to Financial Statements/Consolidated Notes to Financial Statements (continued)
8. CONCENTRATION OF RISKS
As with all ETFs, shareholders of the Funds are subject to the risk that their investment could lose money. Each Fund is subject to certain of the principal risks noted below, any of which may adversely affect a Fund’s NAV, trading price, yield, total return and ability to meet its investment objective. A more complete description of principal risks is included in each Fund’s prospectus under the heading “Principal Risks”. The following risks pertain to all Funds, unless otherwise noted.
CASH AND CASH EQUIVALENTS RISK — The Fund may hold cash or cash equivalents. Generally, such positions offer less potential for gain than other investments. Holding cash or cash equivalents, even strategically, may lead to missed investment opportunities. This is particularly true when the market for other investments in which the Fund may invest is rapidly rising. If the Fund holds cash uninvested it will be subject to the credit risk of the depositing institution holding the cash.
COMMODITY RISK (KFA Mount Lucas Index Strategy ETF) — The Fund’s and the Subsidiary’s significant investment exposure to the commodities markets and/or a particular sector of the commodities markets may subject the Fund and the Subsidiary to greater volatility than investments in traditional securities. The commodities markets are impacted by a variety of factors, including market movements, resource availability, commodity price volatility, speculation in the commodities markets, domestic and foreign political and economic events and policies, trade policies and tariffs, war, acts of terrorism, changes in domestic or foreign interest rates and/or investor expectations concerning interest rates, domestic and foreign inflation rates and investment and trading activities in commodities.
Prices of various commodities may also be affected by factors such as drought, floods, weather, livestock disease, embargoes, tariffs and other regulatory developments. The prices of commodities can also fluctuate widely due to supply and demand disruptions in major producing or consuming regions. To the extent the Fund focuses its investments in a particular commodity in the commodities market, the Fund will be more susceptible to risks associated with the particular commodity. No active trading market may exist for certain commodities investments. Because the Fund’s and the Subsidiary’s performance is linked to the performance of potentially volatile commodities, investors should be willing to assume the risks of significant fluctuations in the value of the Fund’s shares.
COMMODITY-LINKED DERIVATIVES RISK (KFA Mount Lucas Index Strategy ETF) — The value of a commodity-linked derivative investment typically is based upon the price movements of a physical commodity and may be affected by changes in overall market movements, volatility of the Index, changes in interest rates, or factors affecting a particular industry or commodity, such as drought, floods, weather, embargoes, tariffs and international economic, political and regulatory developments. Investments in commodity-linked derivatives may be subject to greater volatility than non-derivative based investments. Commodity-linked derivatives also may be subject to credit and interest rate risks that in general affect the values of debt securities.
COMMODITY POOL REGISTRATION RISK (KFA Mount Lucas Index Strategy ETF) — Under amended regulations promulgated by the CFTC, the Fund and the Subsidiary will be considered commodity pools upon commencement of operations, and therefore each will be subject to regulation under the Commodity Exchange Act and CFTC rules. Krane will register as a commodity pool operator and will manage the Fund and the Subsidiary in accordance with CFTC rules, as well as the rules that apply to registered investment companies. Commodity pools are subject to additional laws, regulations and enforcement policies, all of which may potentially increase compliance costs and may affect the operations and financial performance of the Fund and the Subsidiary. Additionally, positions in
65
Notes to Financial Statements/Consolidated Notes to Financial Statements (continued)
futures and other contracts may have to be liquidated at disadvantageous times or prices to prevent the Fund from exceeding any applicable position limits established by the CFTC. Such actions may subject the Fund to substantial losses.
CONCENTRATION RISK (KFA Large Cap Quality Dividend Index ETF, KFA Small Cap Quality Dividend Index ETF, KFA Value Line® Dynamic Core Equity Index ETF and KFA Mount Lucas Index Strategy ETF) — Because the Fund’s assets are expected to be concentrated in an industry or group of industries to the extent that the Underlying Index concentrates in a particular industry or group of industries, the Fund is subject to loss due to adverse occurrences that may affect that industry or group of industries or sector. Market conditions, interest rates, and economic, regulatory, or financial developments could significantly affect a single industry or a group of related industries, and the securities of companies in that industry or group of industries could react similarly to these or other developments. Depending on the composition of each Fund’s Underlying Index, the Fund may be subject to principal risks, as outlined in each Funds’ prospectus. Each Fund may have significant exposure to other industries or sectors.
CURRENCY RISK (KFA Mount Lucas Index Strategy ETF) — To the extent that the Fund is exposed directly or indirectly to foreign currencies, including through its investments, or invests in securities or other instruments denominated in or indexed to foreign currencies, changes in currency exchange rates could adversely impact investment gains or add to investment losses. Currency exchange rates may fluctuate significantly over short periods of time and can be affected unpredictably by intervention, or failure to intervene, by U.S. or foreign governments or central banks or by currency controls or political developments in the U.S. or abroad.
DERIVATIVES RISK — The use of derivatives (including swaps, futures, forwards, structured notes and options) may involve leverage, which includes risks that are different from, and greater than, the risks associated with investing directly in a reference asset, because a small investment in a derivative can result in a large impact on the Fund and may cause the Fund to be more volatile. In addition, derivatives can be illiquid and imperfectly correlate with the reference asset, resulting in unexpected returns that could materially adversely affect the Fund. Certain derivatives (such as swaps and options) are bi-lateral agreements that expose the Fund to counterparty risk, which is the risk of loss in the event that the counterparty to an agreement fails to perform under it. In that case, the Fund may suffer losses potentially equal to, or greater than, the full value of the derivative if the counterparty fails to perform its obligations. Counterparty risks are compounded by the fact that there are only a limited number of ways available to invest in certain reference assets and, therefore, there may be few counterparties to swaps or options based on those reference assets. Investments in derivatives may expose the Fund to leverage, which may cause the Fund to be more volatile than if it had not been leveraged. Many derivatives are subject to segregation requirements that require the Fund to segregate the market or notional value of the derivatives, which could impede the portfolio management of the Fund.
DIVIDEND RISK (KFA Large Cap Quality Dividend Index ETF, KFA Small Cap Quality Dividend Index ETF and KFA Value Line® Dynamic Core Equity Index ETF) — There is no guarantee that issuers of the stocks held by the Fund will declare dividends in the future or that, if declared, such dividends will remain at current levels or increase over time.
66
Notes to Financial Statements/Consolidated Notes to Financial Statements (continued)
ETF RISK. As an ETF, the Fund is subject to the following risks:
Authorized Participants Concentration Risk. The Fund has a limited number of financial institutions that may act as Authorized Participants. To the extent they cannot or are otherwise unwilling to engage in creation and redemption transactions with the Fund and no other Authorized Participant steps in, shares of the Fund may trade like closed-end fund shares at a significant discount to net asset value (“NAV”) and may face delisting from the Exchange.
Cash Transactions Risk (KFA Mount Lucas Index Strategy ETF). Like other ETFs, the Fund sells and redeems its shares only in large blocks called Creation Units and only to “Authorized Participants.” Unlike many other ETFs, however, the Fund expects to effect its creations and redemptions at least partially or fully for cash, rather than in-kind securities. Thus, an investment in the Fund may be less tax-efficient than an investment in other ETFs as the Fund may recognize a capital gain that it could have avoided by making redemptions in-kind. As a result, the Fund may pay out higher capital gains distributions than ETFs that redeem in-kind. Further, paying redemption proceeds in cash rather than through in-kind delivery of portfolio securities may require the Fund to dispose of or sell portfolio investments to obtain the cash needed to distribute redemption proceeds at an inopportune time.
International Closed Market Trading Risk (KFA Mount Lucas Index Strategy ETF). Because certain of the Fund’s investments trade in markets that are closed when the Fund and Exchange are open, there are likely to be deviations between current pricing of an underlying security and stale pricing, resulting in the Fund trading at a discount or premium to NAV greater than those incurred by other ETFs.
Premium/Discount Risk. There may be times when the market price of the Fund’s shares is more than the NAV intra-day (at a premium) or less than the NAV intra-day (at a discount). As a result, shareholders of the Fund may pay more than NAV when purchasing shares and receive less than NAV when selling Fund shares. This risk is heightened in times of market volatility or periods of steep market declines. In such market conditions, market or stop loss orders to sell Fund shares may be executed at prices well below NAV.
Secondary Market Trading Risk. Investors buying or selling shares in the secondary market will normally pay brokerage commissions, which are often a fixed amount and may be a significant proportional cost for investors buying or selling relatively small amounts of shares. Secondary market trading is subject to bid-ask spreads and trading in Fund shares may be halted by the Exchange because of market conditions or other reasons. If a trading halt occurs, a shareholder may temporarily be unable to purchase or sell shares of the Fund. In addition, although the Fund’s shares are listed on the Exchange, there can be no assurance that an active trading market for shares will develop or be maintained or that the Fund’s shares will continue to be listed.
EQUITY SECURITIES RISK (KFA Large Cap Quality Dividend Index ETF, KFA Small Cap Quality Dividend Index ETF and KFA Value Line® Dynamic Core Equity Index ETF) — The values of equity securities are subject to factors such as market fluctuations, changes in interest rates and perceived trends in stock prices. Equity securities are subject to volatile changes in value and their values may be more volatile than other asset classes. In the event of liquidation, equity securities are generally subordinate in rank to debt and other securities of the same issuer.
67
Notes to Financial Statements/Consolidated Notes to Financial Statements (continued)
FIXED INCOME SECURITIES RISK (KFA Dynamic Fixed Income ETF and KFA Mount Lucas Index Strategy ETF) — Fixed income securities are subject to credit risk and interest rate risk. Credit risk refers to the possibility that the issuer of a security will not make timely interest payments or repay the principal of the debt issued (i.e., it defaults on its obligations). Event risk refers to the risk that an unexpected event could interfere with an issuer’s ability to make timely interest or principal payments or that causes market speculation about the issuer’s ability to make such payments, which could cause the credit quality and market value of an issuer’s bonds and/or other debt securities to decline significantly. Interest rate risk refers to fluctuations in the value of a debt resulting from changes in the level of interest rates. When interest rates go up, the prices of most debt instruments go down; and when interest rates go down, the prices of most debt instruments go up. Debt instruments with longer durations tend to be more sensitive to interest rate changes, typically making them more volatile. The current low-interest-rate environment heightens the risks associated with rising interest rates. Maturity risk refers to the value of the Fund’s fixed income investments is also dependent on their maturity. Generally, the longer the maturity of a fixed income security, the greater its sensitivity to changes in interest rates.
Pay-In-Kind and Step-Up Coupon Securities Risk. A pay-in-kind security pays no interest in cash to its holder during its life. Similarly, a step-up coupon security is a debt security that may not pay interest for a specified period of time and then, after the initial period, may pay interest at a series of different rates. Accordingly, pay-in-kind and step-up coupon securities will be subject to greater fluctuations in market value in response to changing interest rates than debt obligations of comparable maturities that make current, periodic distribution of interest in cash.
Perpetual Bonds Risk. Perpetual bonds offer a fixed return with no maturity date. Because they never mature, perpetual bonds can be more volatile than other types of bonds that have a maturity date and may be more sensitive to changes in interest rates. If market interest rates rise significantly, the interest rate paid by a perpetual bond may be much lower than the prevailing interest rate. Perpetual bonds are also subject to credit risk with respect to the issuer. In addition, because perpetual bonds may be callable after a set period of time, there is the risk that the issuer may recall the bond, which may require the Fund to reinvest the proceeds in lower yielding securities.
Prepayment and Extension Risk. When interest rates decline, borrowers tend to refinance their loans and the loans that back mortgage-backed and other asset-backed securities suffer a higher rate of prepayment. This could cause a decrease in the Fund’s income and share price. Conversely, when interest rates rise, borrowers tend to repay their loans less quickly, which will generally increase the Fund’s sensitivity to interest rates and its potential for price declines.
Subordinated Obligations Risk. Payments under some bonds may be structurally subordinated to other existing and future liabilities and obligations of the issuer. Claims of creditors of subordinated debt will have less priority as to the assets of the issuer and its creditors who seek to enforce the terms of the bond. Certain bonds may not contain any restrictions on the ability to incur additional unsecured indebtedness.
FOREIGN INVESTMENTS RISK (KFA Mount Lucas Index Strategy ETF) — Investments in non-U.S. instruments may involve risk of loss due to foreign currency fluctuations and political or economic instability. Foreign markets also may have clearance and settlement procedures that make it difficult for the Fund to buy and sell securities. These factors could result in a loss to the Fund by causing the Fund to be unable to dispose of an investment or to miss an attractive investment opportunity, or by causing the Fund’s assets to be uninvested for some period of time.
68
Notes to Financial Statements/Consolidated Notes to Financial Statements (continued)
FUTURES STRATEGY RISK (KFA Mount Lucas Index Strategy ETF) — The use of futures contracts is subject to special risk considerations. The primary risks associated with the use of futures contracts include: (a) an imperfect correlation between the change in market value of the reference asset and the price of the futures contract; (b) possible lack of a liquid secondary market for a futures contract and the resulting inability to close a futures contract when desired; (c) losses caused by unanticipated market movements, which are potentially unlimited; (d) the inability to predict correctly the direction of market prices, interest rates, currency exchange rates and other economic factors; and (e) if the Fund has insufficient cash, it may have to sell securities or financial instruments from its portfolio to meet daily variation margin requirements, which may lead to the Fund selling securities or financial instruments at a loss.
As a futures contract the Fund owns approaches its settlement date, the Fund may sell that futures contract and reinvest the proceeds in a similar contract with a more distant settlement date. This process is referred to as “rolling” a futures contract. The successful use of such a strategy depends upon the Adviser’s skill and experience. Although the Fund will attempt to roll from an expiring futures contract to another contract that the Adviser believes will generate the greatest yield for the Fund, the Fund nevertheless may incur a cost to “roll” the contract. In a commodity futures market where current month expiring contracts trade at a lower price than next month’s contract, a situation referred to as “contango,” then, absent the impact of the overall movement in commodity prices, the Fund may experience an adverse impact because it would be selling less expensive contracts and buying more expense contracts. In the event of a prolonged period of contango, and absent the impact of rising or falling commodity prices, there could be a significant negative impact on the Fund when it “rolls” its futures contract positions.
GEOGRAPHIC FOCUS RISK (KFA Mount Lucas Index Strategy ETF) — The Fund’s investments will be focused in a particular country, countries, or region and therefore the Fund may be susceptible to adverse market, political, regulatory, and geographic events affecting that country, countries or region. Such geographic focus also may subject the Fund to a higher degree of volatility than a more geographically diversified fund.
European Union Risk. Recently, new concerns have emerged in regard to the economic and political stability of the European Union. These concerns have led to downward pressure on the earnings of certain European issuers and on European financial markets. Secessionist movements in various member countries to leave the European Union may have an adverse effect on the economies of those member countries and on the European Union as a whole. The economies of the European Union are dependent to a significant extent on those of certain key trading partners, including China, the United States, and other European countries. A reduction in spending on products and services exported from the European Union, or volatility in the financial markets of member countries, may have an adverse impact on the broader European Union economy and could adversely affect the Fund.
HIGH YIELD SECURITIES RISK (KFA Dynamic Fixed Income ETF) — Securities that are rated below investment grade (or “junk bonds”) are subject to greater risk of loss of income and principal than highly rated securities because their issuers may be more likely to default. Junk bonds are inherently speculative. The prices of high yield securities are likely to be more volatile than those of highly rated securities, and the secondary market for them is generally less liquid than that for highly rated securities.
69
Notes to Financial Statements/Consolidated Notes to Financial Statements (continued)
HIGH PORTFOLIO TURNOVER RISK (KFA Dynamic Fixed Income ETF, KFA Value Line® Dynamic Core Equity Index ETF and KFA Mount Lucas Index Strategy ETF) — The Fund may incur high turnover rates, which may increase the Fund’s brokerage commission costs and negatively impact the Fund’s performance. Such portfolio turnover also may generate net short-term capital gains.
INVESTMENT IN INVESTMENT COMPANIES RISK — The Fund may invest in other investment companies, including those advised, sponsored or otherwise serviced by the Adviser, the Sub-Adviser and/or their affiliates. The Fund will indirectly be exposed to the risks of investments by such funds. Moreover, the Fund will incur its pro rata share of the underlying fund’s expenses. The Adviser and the Sub-Adviser are subject to conflicts of interest in allocating Fund assets to investment companies that are advised, sponsored or otherwise serviced by the Adviser and the Sub-Adviser and/or their affiliates. To the extent that the Fund invests in investment companies or other pooled investment vehicles that are not registered pursuant to the 1940 Act, including foreign investment companies, it will not enjoy the protections of the U.S. law.
LARGE CAPITALIZATION COMPANY RISK (KFA Large Cap Quality Dividend Index ETF, and KFA Value Line® Dynamic Core Equity Index ETF) — Investments in large capitalization companies may go in and out of favor based on market and economic conditions and may underperform other market segments. Some large capitalization companies may be unable to respond quickly to new competitive challenges and attain the high growth rate of successful smaller companies, especially during extended periods of economic expansion. As such, returns on investments in stocks of large capitalization companies could trail the returns on investments in stocks of small and mid-capitalization companies.
LIQUIDITY RISK (KFA Dynamic Fixed Income ETF and KFA Mount Lucas Index Strategy ETF) — Certain of the Fund’s investments are subject to liquidity risk, which exists when an investment is or becomes difficult to purchase or sell at a reasonable time or price. If a transaction is particularly large or if the relevant market is or becomes illiquid, it may not be possible to initiate a transaction or liquidate, which may cause the Fund to suffer significant losses and difficulties in meeting redemptions. If a number of securities held by the Fund halt trading, it may have a cascading effect and cause the Fund to halt trading. Volatility in market prices will increase the risk of the Fund being subject to a trading halt.
MANAGEMENT RISK — Because the Fund may not fully replicate the Underlying Index and may hold less than the total number of securities in the Underlying Index, the Fund is subject to management risk. This is the risk that Krane or its sub-adviser’s security selection process, which is subject to a number of constraints, may not produce the intended results.
MARKET RISK — The values of the Funds’ holdings could decline generally or could underperform other investments. In addition, there is a risk that policy changes by the U.S. Government, Federal Reserve, and/or other government actors could cause increased volatility in global financial markets, negative sentiment and higher levels of Fund redemptions, which could have a negative impact on the Fund and could result in losses. Geopolitical and other risks, including environmental and public health risks may add to instability in world economics and markets generally. Changes in value may be temporary or may last for extended periods. Further, the Funds are susceptible to the risk that certain investments may be difficult or impossible to sell at a favorable time or price. Market developments may cause the Funds’ investments to become less liquid and subject to erratic price movements. Such market developments may also cause the Funds to encounter difficulties in timely honoring redemptions, especially if market events cause an increased incidence of shareholder redemptions.
70
Notes to Financial Statements/Consolidated Notes to Financial Statements (continued)
MOMENTUM RISK (KFA Large Cap Quality Dividend Index ETF, KFA Small Cap Quality Dividend Index ETF and KFA Dynamic Fixed Income ETF) — Momentum investing entails investing in securities that exhibit persistence in certain performance indicators. These securities may be more volatile than a broad cross-section of securities and momentum may indicate that the performance indicator being measured is peaking. The Fund may experience losses if the price of securities exhibiting momentum stops, turns or otherwise behaves differently than predicted.
NON-DIVERSIFIED FUND RISK — The Fund is non-diversified and may concentrate its investments to a greater extent than a diversified fund. Changes in the market value of a single portfolio holding could cause greater fluctuations in the Fund’s share price than would occur in a diversified fund. This may increase the Fund’s volatility and cause the performance of a single portfolio holding or a relatively small number of portfolio holdings to have a greater impact on the Fund’s performance.
PASSIVE INVESTMENT RISK (KFA Large Cap Quality Dividend Index ETF, KFA Small Cap Quality Dividend Index ETF, KFA Dynamic Fixed Income ETF and KFA Value Line® Dynamic Core Equity Index ETF) — The Fund is not actively managed, does not seek to “beat” the Underlying Index and does not take temporary defensive positions when markets decline. Therefore, the Fund may not sell a security due to current or projected underperformance of a security, industry or sector. There is no guarantee that the Underlying Index will create the desired exposure. The Underlying Index may not contain an appropriate mix of securities, but the Fund’s investment objective and principal investment strategies impose limits on the Fund’s ability to invest in securities not included in the Underlying Index.
PRIVATELY-ISSUED SECURITIES RISK (KFA Dynamic Fixed Income ETF) — The Fund may invest in privately-issued securities, including those that are normally purchased pursuant to Rule 144A or Regulation S promulgated under the Securities Act of 1933, as amended (the “Securities Act”). Privately-issued securities are securities that have not been registered under the Securities Act and as a result are subject to legal restrictions on resale. Privately-issued securities are not traded on established markets and may be less liquid, difficult to value and subject to wide fluctuations in value. Delay or difficulty in selling such securities may result in a loss to the Fund. In addition, transaction costs may be higher for privately-issued securities than for more liquid securities. The Fund may have to bear the expense of registering privately-issued securities for resale and the risk of substantial delays in effecting the registration.
QUALITY FACTOR RISK (KFA Large Cap Quality Dividend Index ETF and KFA Small Cap Quality Dividend Index ETF) — The Fund uses appreciating annual dividends as a measurement of quality. This style of investing is subject to the risk that the past performance of these companies does not continue and that the returns on such securities are less than returns on other styles of investing or the overall stock market. In addition, there may be periods when quality dividend investing is out of favor and during which the investment performance of a fund using a quality dividend strategy may suffer.
RANKING RISK — (KFA Value Line® Dynamic Core Equity Index ETF) The Fund uses the Value Line® Timeliness and Safety™ Ranking Systems in selecting securities. This is subject to the risk that the rankings may not be accurate and that the performance of these companies may not continue. The returns on these securities may be less than returns on other companies or the overall stock market. In addition, there may be periods when companies highly ranked by Value Line® are out of favor and during which the investment performance of the Fund may suffer.
71
Notes to Financial Statements/Consolidated Notes to Financial Statements (continued)
REGULATORY RISK (KFA Mount Lucas Index Strategy ETF) — The Fund is subject to the risk that a change in U.S. law and related regulations will impact the way the Fund operates, increase the particular costs of the Fund’s operations and/or change the competitive landscape. Additional legislative or regulatory changes could occur that may materially and adversely affect the Fund.
SECTOR RISK (KFA Value Line® Dynamic Core Equity Index ETF) — From time to time, based on market or economic conditions, the Fund may have significant positions in one or more sectors of the market. To the extent the Fund invests more heavily in particular sectors, its performance will be especially sensitive to developments that significantly affect those sectors. Individual sectors may be more volatile, and may perform differently, than the broader market. The industries that constitute a sector may all react in the same way to economic, political or regulatory events.
SECURITIES LENDING RISK (KFA Large Cap Quality Dividend Index ETF, KFA Small Cap Quality Dividend Index ETF, KFA Dynamic Fixed Income ETF and KFA Value Line® Dynamic Core Equity Index ETF) — To the extent a Fund lends its securities, it may be subject to the following risks: (1) borrowers of the Funds’ securities typically provide collateral in the form of cash that is reinvested in securities; (2) the securities in which the collateral is invested may not perform sufficiently to cover the return collateral payments owed to borrowers; (3) delays may occur in the recovery of securities from borrowers, which could interfere with the Funds’ ability to vote proxies or to settle transactions; and (4) there is the risk of possible loss of rights in the collateral should the borrower fail financially.
SHORT SALES RISK (KFA Mount Lucas Index Strategy ETF) — Short sales, at least theoretically, present a risk of unlimited loss on an individual security basis, since the Fund may be required to buy the security sold short at a time when the security has appreciated in value, and there is potentially no limit to the amount of such appreciation. Because the Fund may invest the proceeds of a short sale, another effect of short selling on the Fund is leverage, in that it amplifies changes in the Fund’s net asset value since it increases the exposure of the Fund to the market. The Fund may not always be able to close out a short position at a favorable time or price. If the Fund covers its short sale at an unfavorable price, the cover transaction is likely to reduce or eliminate any gain, or cause a loss to the Fund. When the Fund is selling a security short, it must maintain a segregated account of cash or high-grade securities equal to the margin requirement. As a result, the Fund may maintain high levels of cash or other liquid assets (such as U.S. Treasury bills, money market instruments, certificates of deposit, high quality commercial paper and long equity positions). The Fund may utilize the collateral obtained from securities lending for this cash. The need to maintain cash or other liquid assets in segregated accounts could limit the Fund’s ability to pursue other opportunities as they arise.
SMALL AND MID-CAPITALIZATION COMPANY RISK (KFA Small Cap Quality Dividend Index ETF) — Investing in the securities of small and medium capitalization companies involves greater risk and the possibility of greater price volatility than investing in larger capitalization companies and more established companies. Since small and medium-sized companies may have limited operating histories, product lines and financial resources, the securities of these companies may lack sufficient market liquidity and can be sensitive to expected changes in interest rates, borrowing costs and earnings.
SUBSIDIARY INVESTMENT RISK (KFA Mount Lucas Index Strategy ETF) — By investing in the Subsidiary, the Fund is indirectly exposed to the risks associated with the Subsidiary’s investments. Since the Subsidiary is organized under the law of the Cayman Islands and is not registered with the SEC under the Investment Company Act of 1940, as amended (the “1940 Act”), the Fund will not receive all
72
Notes to Financial Statements/Consolidated Notes to Financial Statements (continued)
of the protections offered to shareholders of registered investment companies. Changes in the laws of the United States and/or the Cayman Islands could result in the inability of the Fund and/or the Subsidiary to operate as intended, which may negatively affect the Fund and its shareholders.
TAX RISK — In order to qualify for the favorable tax treatment generally available to regulated investment companies, the Fund must satisfy certain income, asset diversification and distribution requirements each year. If the Fund were to fail to qualify as a regulated investment company, it would be taxed in the same manner as an ordinary corporation, and distributions to its shareholders would not be deductible by the Fund in computing its taxable income, which would adversely affect the Fund’s performance.
TRACKING ERROR RISK (KFA Large Cap Quality Dividend Index ETF, KFA Small Cap Quality Dividend Index ETF, KFA Dynamic Fixed Income ETF and KFA Value Line® Dynamic Core Equity Index ETF) — The Fund’s return may not match or achieve a high degree of correlation with the return of the Underlying Index. This may be due to, among other factors, the Fund holding cash under certain circumstances in lieu of Underlying Index securities, such as when the Fund is subject to delays converting U.S. dollars into a foreign currency to purchase foreign securities. The Fund may not be able to invest in certain components of the Underlying Index due to legal restrictions imposed by foreign governments or other regulatory reasons. In addition, securities included in the Underlying Index may be suspended from trading. To the extent that the Fund employs a representative sampling strategy or calculates its NAV based on fair value prices and the value of the Underlying Index is based on securities’ closing prices on local foreign markets, the Fund’s ability to track the Underlying Index may be adversely affected. Changes in currency exchange rates or delays in converting currencies may also cause tracking error.
U.S. GOVERNMENT OBLIGATIONS RISK (KFA Mount Lucas Index Strategy ETF) — Obligations of U.S. Government agencies and authorities receive varying levels of support and may not be backed by the full faith and credit of the U.S. Government, which could affect the Fund’s ability to recover should they default. No assurance can be given that the U.S. Government will provide financial support to its agencies and authorities if it is not obligated by law to do so. Additionally, market prices and yields of securities supported by the full faith and credit of the U.S. government may decline or be negative for short or long periods of time.
VALUATION RISK — Independent market quotations for the non-U.S. securities held by the Funds may not be readily available and such securities may be fair valued. Fair valuation is subjective and different market participants may assign different prices to the same security. As a result, there is a risk that the Funds may not be able to sell a security at the price assigned to the security by the Fund. In addition, the securities in which the Funds invest may trade on days that the Funds do not price their shares; as a result, the value of Fund shares may change on days when investors cannot purchase or sell their holdings.
9. OTHER
At March 31, 2021, all shares issued by the Funds were in Creation Unit aggregations to Authorized Participants through primary market transactions (e.g., transactions directly with the Funds). However, the individual shares that make up those Creation Units are traded on the NYSE Arca Exchange (e.g., secondary market transactions). Some of those individual shares have been bought and sold by persons that are not Authorized Participants. Each Authorized Participant has entered into an agreement with the Funds’ Distributor.
73
Notes to Financial Statements/Consolidated Notes to Financial Statements (concluded)
10. INDEMNIFICATIONS
In the normal course of business, the Funds enter into contracts that provide general indemnifications. The Funds’ maximum exposure under these arrangements is dependent on future claims that may be made against the Funds and, therefore, cannot be established; however, based on experience, the risk of loss from such claims is considered remote.
11. SUBSEQUENT EVENTS
The Funds have evaluated the need for additional disclosures and/or adjustments resulting from subsequent events. Based on this evaluation, no additional disclosures or adjustments were required to the financial statements as of the date the financial statements were issued.
74
Report of Independent Registered Public Accounting Firm
To the Shareholders and Board of Trustees
KraneShares Trust:
Opinion on the Financial Statements
We have audited the accompanying statements of assets and liabilities and the consolidated statement of assets and liabilities of the funds listed in the Appendix, five of the funds comprising KraneShares Trust (collectively, the Funds), including the schedules of investments and the consolidated schedule of investments, as of March 31, 2021, the related statements of operations and consolidated statement of operations for the year or period then ended listed in the Appendix, the statements of changes in net assets and the consolidated statement of changes in net assets for each of the years or periods in the two year period then ended listed in the Appendix, and the related notes and consolidated notes (collectively, the financial statements) and the financial highlights and consolidated financial highlights (collectively the financial highlights) for each of the years or periods in the five year period then ended listed in the Appendix. In our opinion, the financial statements and financial highlights present fairly, in all material respects, the financial position of each of the Funds as of March 31, 2021, the results of its operations for the year or period then ended listed in the Appendix, the changes in its net assets for each of the years or periods in the two year period then ended listed in the Appendix, and the financial highlights for each of the years or periods in the five year period then ended listed in the Appendix, in conformity with U.S. generally accepted accounting principles.
Basis for Opinion
These financial statements and financial highlights are the responsibility of the Funds’ management. Our responsibility is to express an opinion on these financial statements and financial highlights based on our audits. We are a public accounting firm registered with the Public Company Accounting Oversight Board (United States) (PCAOB) and are required to be independent with respect to the Company in accordance with the U.S. federal securities laws and the applicable rules and regulations of the Securities and Exchange Commission and the PCAOB.
We conducted our audits in accordance with the standards of the PCAOB. Those standards require that we plan and perform the audits to obtain reasonable assurance about whether the financial statements and financial highlights are free of material misstatement, whether due to error or fraud. Our audits included performing procedures to assess the risks of material misstatement of the financial statements and financial highlights, whether due to error or fraud, and performing procedures that respond to those risks. Such procedures included examining, on a test basis, evidence regarding the amounts and disclosures in the financial statements and financial highlights. Such procedures also included confirmation of securities owned as of March 31, 2021, by correspondence with the custodian, transfer agent, and brokers or by other appropriate auditing procedures when replies from brokers were not received. Our audits also included evaluating the accounting principles used and significant estimates made by management, as well as evaluating the overall presentation of the financial statements and financial highlights. We believe that our audits provide a reasonable basis for our opinion.

We have served as the auditor of one or more KraneShares investment companies since 2017.
Philadelphia, Pennsylvania
May 28, 2021
75
Report of Independent Registered Public Accounting Firm (concluded)
Appendix
Funds with commencement of operations during the year ended March 31, 2020:
KFA Large Cap Quality Dividend Index ETF
KFA Small Cap Quality Dividend Index ETF
Statement of operations for the year ended March 31, 2021
Statements of changes in net assets and the financial highlights for the year ended March 31, 2021 and the period from June 11, 2019 (commencement of operations) through March 31, 2020
KFA Dynamic Fixed Income ETF
Statement of operations for the year ended March 31, 2021
Statements of changes in net assets and the financial highlights for the year ended March 31, 2021 and the period from December 6, 2019 (commencement of operations) through March 31, 2020
Funds with commencement of operations during the year ended March 31, 2021:
KFA Value Line® Dynamic Core Equity Index ETF
Statements of operations and changes in net assets and the financial highlights for the period from November 23, 2020 (commencement of operations) through March 31, 2021
KFA Mount Lucas Index Strategy ETF
Consolidated statement of assets and liabilities and the consolidated schedule of investments, as of March 31, 2021
Consolidated statements of operations and changes in net assets and the consolidated financial highlights for the period from December 1, 2020 (commencement of operations) through March 31, 2021
76
Trustees and Officers of the Trust (Unaudited)
March 31, 2021
Set forth below are the names, addresses, years of birth, positions with the Trust, terms of office and lengths of time served; the principal occupations for the last five years; number of Funds in fund complex overseen; and other directorships outside the fund complex of each of the persons currently serving as Trustees and Officers of the Trust. The Trust’s Statement of Additional Information (“SAI”) includes additional information about the Trustees and Officers. The SAI may be obtained without charge, upon request, by calling 1-855-857-2638. The following chart lists Trustees and Officers as of March 31, 2021.
Name, Address
(Year of Birth) | | Position(s) Held
with Funds | | Principal
Occupation(s) During
the Past 5 Years | | Number of
Funds in
Trust
Overseen by
Trustee | | Other
Directorships
Held by
Trustee |
Interested Trustee2 | | | | | | | | |
Jonathan Krane1
(1968)
280 Park Avenue
32nd Floor New York,
New York, 10017 | | Trustee and Chairman of the Board, No set term; served since 2012 | | Chief Executive Officer of Krane Funds Advisors, LLC from 2011 to present. Chief Executive of Krane Portfolio Advisors, LLC from 2018 to present. | | 28 | | None |
| | | | | | | | | |
Independent Trustees2 | | | | | | | | |
Patrick P. Campo
(1970)
280 Park Avenue
32nd Floor New York,
New York, 10017 | | Trustee, No set term; served since 2017 | | From 2019 to present, Director of Research, and from 2013 to 2019, Director of Long Short Equity, Titan Advisors. | | 28 | | None |
| | | | | | | | | |
John Ferguson
(1966)
280 Park Avenue
32nd Floor New York,
New York, 10017 | | Trustee, No set term; served since 2012 | | Chief Operating Officer of Shrewsbury River Capital from 2017 to 2020. Chief Operating Officer of Kang Global Investors LP (hedge fund adviser) from 2014 to 2016. President of Alden Global Capital, LLC (hedge fund adviser) from 2012 to 2014 (formerly, Chief Operating Officer from 2011 to 2012). Senior Managing Director and Chief Operating Officer of K2 Advisors, L.L.C. from 2005 to 2011. | | 28 | | None |
77
Trustees and Officers of the Trust (Unaudited) (continued)
March 31, 2021
Name, Address
(Year of Birth) | | Position(s) Held
with Funds | | Principal
Occupation(s) During
the Past 5 Years | | Number of
Funds in
Trust
Overseen by
Trustee | | Other
Directorships
Held by
Trustee |
Independent Trustees2 | | | | | | | | |
Matthew Stroyman
(1968)
280 Park Avenue
32nd Floor New York,
New York, 10017 | | Trustee, No set term; served since 2012 | | Founder and President of BlackRidge Ventures from 2018 to present (principal investment activities and strategic advisory services in a variety of industries to clients and partners that include institutional investment firms, family offices and high net-worth individuals). Co-Founder, President and Chief Operating Officer of Arcturus (real estate asset and investment management services firm) from 2007 to 2017. | | 28 | | None |
Name, Address
(Year of Birth) | | Position(s) Held
with Funds | | Principal
Occupation(s) During
the Past 5 Years | | Number of
Funds in
Trust
Overseen by
Officer | | Other
Directorships
Held by
Officer |
Officers2 | | | | | | | | |
Jonathan Krane
(1968)
280 Park Avenue
32nd Floor New York,
New York, 10017 | | Principal Executive Officer and Principal Financial Officer, No set term; served since 2012 | | Chief Executive Officer of Krane Funds Advisors, LLC from 2011 to present. Chief Executive of Krane Portfolio Advisors, LLC from 2018 to present. | | 28 | | None |
| | | | | | | | | |
Jennifer Tarleton
(formerly Krane)
(1966)
280 Park Avenue
32nd Floor New York,
New York, 10017 | | Vice President and Secretary, No set term; served since 2012 | | Vice President of Krane Funds Advisors, LLC from 2011 to present. | | 28 | | None |
| | | | | | | | | |
78
Trustees and Officers of the Trust (Unaudited) (concluded)
March 31, 2021
Name, Address
(Year of Birth) | | Position(s) Held
with Funds | | Principal
Occupation(s) During
the Past 5 Years | | Number of
Funds in
Trust
Overseen by
Officer | | Other
Directorships
Held by
Officer |
Officers2 | | | | | | | | |
Michael Quain
(1957)
280 Park Avenue
32nd Floor New York,
New York, 10017 | | Chief Compliance Officer and Anti-Money Laundering Officer, No set term; served since June 2015 | | Principal/President of Quain Compliance Consulting, LLC from 2014 to present. First Vice President of Aberdeen Asset Management Inc. from May 2013 to September 2013. | | 28 | | None |
Eric Olsen3
(1970)
SEI Investments Company
One Freedom Valley
Drive Oaks, PA 19456 | | Assistant Treasurer, No set term; served since 2021 | | Director of Accounting, SEI Investments Global Fund Services (March 2021 to present); Deputy Head of Fund Operations, Traditional Assets, Aberdeen Standard Investments (August 2013 to February 2021). | | 28 | | None |
David Adelman
(1964)
280 Park Avenue
32nd Floor New York,
New York, 10017 | | Assistant Secretary, No set term; served since 2021 | | Managing Director and the General Counsel, Krane Fund Advisors, LLC from 2021. Partner, Reed Smith LLP from 2015 to 2021. | | 28 | | None |
Jonathan Shelon
(1974)
280 Park Avenue
32nd Floor New York,
New York, 10017 | | Assistant Secretary, No set term; served since 2019 | | Chief Operating Officer, Krane Funds Advisors, LLC from 2015 to present. Chief Operating Officer, CICC Wealth Management (USA) LLC from 2018 to present. Chief Investment Officer of Specialized Strategies, J.P. Morgan from 2011 to 2015. | | 28 | | None |
| 1 | Mr. Krane is an “interested” person of the Trust, as that term is defined in the 1940 Act, by virtue of his ownership and controlling interest in the Adviser. |
| 2 | Each Trustee serves until his or her successor is duly elected or appointed and qualified. |
| 3 | These officers of the Trust also serve as officers of one or more funds for which SEI Investments Company or an affiliate acts as investment manager, administrator or distributor. |
79
Liquidity Risk Management Program (Unaudited)
March 31, 2021
Consistent with Rule 22e-4 under the Investment Company Act of 1940, as amended, the Trust, on behalf of its separate series (“Funds”), has established a liquidity risk management program (the “Program”). The Program is designed to assess and manage each Fund’s liquidity risk. Liquidity risk is defined as the risk that a Fund could not meet requests to redeem its shares without significant dilution of remaining shareholders. The Board has designated a cross-functional committee, which is composed of Krane Funds Advisors, LLC (“Krane”) compliance and capital markets personnel and the Trust’s Chief Compliance Officer, to administer the Program (the “Program Administrator”). The Program Administrator is responsible for implementing and monitoring the Program to assess and review, on an ongoing basis, the Funds’ liquidity risk.
The Program includes a number of elements that support the management and assessment of liquidity risk, including an annual assessment of the Funds’ liquidity risk factors and the periodic classification (or re-classification, as necessary,) of the Funds’ investments into buckets (highly liquid, moderately liquid, less liquid and illiquid) based on the number of days that it is reasonably expected to convert them into cash, in current market conditions, without significantly changing their value. In conducting its assessment, the Program Administrator utilizes information about each Fund’s investment strategy, its flows, the efficacy of its arbitrage mechanism (as indicated by the premiums and/or discounts and bid-ask spreads of its shares), the characteristics of the Fund’s shareholders and the Fund’s ability to honor redemptions in kind.
At a meeting of the Board in May 2020, the Program Administrator provided the Board with a written report that addressed the operation of the Program and assessed its adequacy and effectiveness of implementation from June 1, 2019 through December 31, 2019 (the “Annual Report”). In the Annual Report, the Program Administrator confirmed that the Program is reasonably designed to assess and manage each Fund’s liquidity risk and that the Program has been implemented and operated effectively. In addition, at subsequent quarterly meetings of the Board, the Program Administrator provided the Board with a summary of each Fund’s liquidity profile during the preceding quarter and the operation of the Program with respect thereto.
80
Approval of Investment Advisory Agreements (Unaudited)
KFA Mount Lucas Index Strategy ETF
At a meeting held on November 19, 2020, the Board of Trustees (the “Board”) of KraneShares Trust (the “Trust”), including a majority of the Trustees who are not “interested persons” of the Trust, as that term is defined in the Investment Company Act of 1940, as amended (the “Independent Trustees”), approved:
• the existing investment advisory agreement (the “KFA Agreement”) between Krane Funds Advisors, LLC (“Krane”) and the Trust on behalf of the following separate series of the Trust (collectively, the “Fund”):
• KFA Mount Lucas Index Strategy ETF (“KMLM”);
• a new investment advisory agreement (the “CFC Agreement”) between Krane and KFA MLM Index (“KMLM CFC”), a wholly-owned subsidiary of KMLM;
• a sub-advisory agreement (the “KMLM Sub-Advisory Agreement”) between Krane, on behalf of KMLM, and Mount Lucas Index Advisers LLC (“Mount Lucas” or “Sub-Adviser”);
• a sub-advisory agreement (the “CFC Sub-Advisory Agreement”) between Krane, on behalf of KMLM CFC, and Mount Lucas.
The KFA Agreement and the CFC Agreement are collectively referred to herein as the “Advisory Agreements.” The KMLM Sub-Advisory Agreement and the CFC Sub-Advisory Agreement are collectively referred to collectively herein as the “Sub-Advisory Agreements,” and the Sub-Advisory Agreements and the Advisory Agreements are collectively referred to as the “Agreements.”
In advance of the meeting, and at a separate meeting of the Independent Trustees in executive session held on November 17, 2020, the Board received and considered information provided by Krane in response to the Independent Trustees’ written request related to the Board’s consideration of the Advisory Agreements. The Board also considered, in response to a separate written request to the Sub-Adviser, information provided by Mount Lucas with respect to the Sub-Advisory Agreements. The Board noted that it considers information at each of its regularly scheduled meetings related to, among other matters, the services provided by Krane to the Trust and that it anticipates it will consider similar information with respect to the services provided by the Sub-Adviser with respect to KMLM and KMLM CFC. The Independent Trustees also noted that they receive additional information from Krane outside of the regularly scheduled Board meetings and at executive sessions held by the Independent Trustees. As a result, the Board considered that its evaluation process with respect to Krane and the Sub-Adviser will be an ongoing one.
In evaluating the Agreements, the Board considered, among other matters: (1) the nature, extent, and quality of the services to be provided to KMLM and KMLM CFC by Krane and to each of KMLM and KMLM CFC by the Sub-Adviser; (2) the proposed compensation to be paid under each Agreement; (3) the estimated costs of the services to be provided by Krane and the Sub-Adviser and the profitability expectations of Krane and the Sub-Adviser with respect to their relationship with KMLM; (4) the extent to which economies of scale could be realized as KMLM grows and whether the unitary fee charged under the KFA Agreement will enable investors in KMLM to share in any such economies of scale; and (5) other benefits Krane and the Sub-Adviser anticipate they may receive from their respective relationship with KMLM and KMLM CFC.
81
Approval of Investment Advisory Agreements (Unaudited) (continued)
Nature, Extent and Quality of Services
Based on written and oral reports received by the Board prior to and at the November 17, 2020 executive session of the Independent Trustees and the November 19, 2020 meeting of the Board, the Board considered the nature, quality, and extent of the overall services to be provided by Krane and the Sub-Adviser under the Agreements. The Board considered the responsibilities of Krane under the Advisory Agreements, including its obligation to oversee the services provided by the Sub-Adviser. The Board also discussed the nature, quality and extent of services to be provided by Mount Lucas under the KMLM Sub-Advisory Agreement and the KMLM CFC Sub-Advisory Agreement.
The Board took note of the qualifications, background and responsibilities of Krane’s senior personnel that will provide services to KMLM. The Board recognized that Krane invested significant time and effort in structuring the Trust and KMLM, assessing or working with the Sub-Adviser to assess KMLM’s market appeal and investment strategy, and arranging service providers for the Trust. The Board considered that Krane established a securities lending program for the benefit of KMLM and certain other series of the Trust. The Board noted that Krane continually evaluates its existing compliance and operational staff, and that it has consistently sought to retain and add, as appropriate, qualified and experienced staff in these areas as its business has grown. The Board also considered the financial condition of Krane and its current ownership structure. The Board noted that Krane is part of a larger family of investment management firms with significant resources, including administrative resources utilized by Krane.
The Board considered that Krane is responsible for establishing and monitoring the investment program for series of the Trust, and that Krane will continually monitor the investment program and performance of KMLM, whose portfolio will be managed, on a day-to-day basis, by the Sub-Adviser. The Board noted the time and effort spent by Krane and, as applicable, the Sub-Adviser to develop KMLM’s investment program and to continually monitor its performance. The Board also considered Mount Lucas’s significant experience in using managed futures.
Investment Performance
The Board noted that, because KMLM has not yet commenced investment operations, it has no investment performance. Once KMLM commences operations, however, the Board noted that it will receive regular reports regarding its performance relative to a broad Morningstar peer group, as well as a select group of competitors identified by Krane and/or the Sub-Adviser. The Board also considered that at its regular meetings it will receive information regarding KMLM’s tracking error against the performance of its identified underlying index. The Board considered the proposed underlying index for KMLM. The Board discussed its experience with Krane’s management of existing operational series of the Trust that pursue different investment strategies.
Compensation
The Board considered that pursuant to the KFA Agreement, Krane will enter into a unitary advisory fee arrangement for KMLM. Under the unitary fee arrangement, Krane will be responsible for paying most of the expenses incurred by KMLM, including those of its principal service providers and fees payable to the Sub-Adviser. The Board reviewed and considered the fees proposed to be paid by KMLM in light of the nature, quality and extent of the services provided or obtained by Krane.
The Board noted Krane’s representation that KMLM offers unique investment exposure to Mount Lucas and its experience in using managed futures for shareholders and potential investors in registered funds.
82
Approval of Investment Advisory Agreements (Unaudited) (continued)
Although the Board received information regarding the fees proposed to be paid to the Sub-Adviser under the Sub-Advisory Agreements, the Board noted the arm’s-length nature of the relationship between Krane and the Sub-Adviser with respect to the negotiation of subadvisory fee rates. The Board also considered that Krane (and not KMLM) pays the Sub-Adviser’s fees.
Costs and Profitability
The Board considered the estimated cost of Krane’s services with respect to KMLM and KMLM CFC. The Board noted that, because KMLM has not yet launched, it was difficult to estimate how profitable it would be to Krane. The Independent Trustees received information from Krane regarding its financial stability and its overall profitability and discussed with Krane’s management how launching KMLM would likely impact such profitability. The Board considered information previously provided by Krane regarding the cost of its services and its profitability with respect to the existing operational series of the Trust. The Board noted Krane’s commitment to KMLM, including its proposal to implement a unitary fee structure under which it will bear many of KMLM’s expenses.
Although it reviewed information from the Sub-Adviser regarding the likely costs and profitability of providing services to KMLM and KMLM CFC, the Board noted the arm’s-length nature of the relationship between Krane and the Sub-Adviser with respect to the negotiation of the subadvisory fee rates. The Board considered that Krane, and not KMLM, was responsible for paying the subadvisory fees under each Sub-Advisory Agreement.
Economies of Scale
The Board considered whether Krane would realize economies of scale with respect to its services to the KMLM and KMLM CFC as they grow larger, including the extent to which this would be reflected in the fees to be paid to Krane. The Board noted that the proposed advisory fee does not include breakpoints, and that it was not possible—before the commencement of investment operations — to accurately evaluate potential economies of scale. The Board also noted that Krane continues to reinvest a portion of its profits in its business, including through the addition of compliance and operations personnel, as appropriate, and that any economies of scale could be shared with KMLM in this manner. Based on these and other considerations, including that KMLM and KMLM CFC are newly organized, the Board considered economies of scale not to be a material factor in its consideration of the Agreements.
Conclusion
The Board did not identify any single factor as being of paramount importance, and different Trustees may have given different weight to different factors in their review of the Agreements. The Board reviewed a memorandum from Independent Trustee counsel discussing the legal standards and judicial precedent applicable to its consideration of the Agreements. The Board noted that, as with other series of the Trust, it will continue to monitor KMLM at its regular meetings, during executive sessions of the Independent Trustees and outside of the Board meetings. Based on its review, including consideration of each of the factors referenced above, the Board determined, in the exercise of its reasonable business judgment, that the advisory arrangements, as outlined in the Agreements, were reasonable in light of the factors considered by the Board.
83
Approval of Investment Advisory Agreements (Unaudited) (continued)
KFA Value Line® Dynamic Core Equity Index ETF
At a meeting on September 8, 2020, the Board of Trustees (“Board”) of KraneShares Trust (“Trust”), including a majority of the Trustees who are not “interested persons” of the Trust, as that term is defined in the Investment Company Act of 1940, as amended (the “Independent Trustees”), approved the existing investment advisory agreement (“Advisory Agreement”) between Krane Funds Advisors, LLC (“Krane”) and the Trust with respect to KraneShares Value Line® Dynamic Core Equity Index ETF (“KVLE”), a newly formed series of the Trust. The Board, including a majority of the Independent Trustees, also approved a proposed subadvisory agreement, between Krane and Lee Capital Management LP (“LCM”) with respect to KVLE (the “Subadvisory Agreement” and, together with the Advisory Agreement, the “Agreements”).
In advance of the meeting, and at a separate meeting of the Independent Trustees in executive session, the Board received and considered (i) information provided by Krane in response to the Independent Trustees’ written request relating to the Board’s consideration of the Advisory Agreement; and (ii) information provided by LCM in response to the Independent Trustees’ written request relating to the Board’s consideration of the Subadvisory Agreement. The Board also considered that its evaluation process with respect to Krane is an ongoing one and, as a result, the Board considers information at each of its regularly scheduled meeting related to, among other matters, the services provided by Krane to each operational series of the Trust. The Board also receives additional information from Krane outside of the regularly scheduled Board meetings and at executive sessions of the Independent Trustees.
In evaluating the Agreements, the Board considered, among other matters: (1) the nature, extent, and quality of the services to be provided by Krane and LCM; (2) the proposed compensation to be paid by KVLE under the Agreements; (3) the estimated costs of the services to be provided by Krane and Krane’s profitability expectations with respect to its services to KVLE; (4) the extent to which economies of scale could be realized by Krane as KVLE grows and whether the Agreements would enable investors to share in the benefits of economies of scale; and (5) other benefits Krane and LCM anticipate that they may receive from their relationship with the Trust and KVLE.
Nature, Extent, and Quality of Services
Based on the written and oral reports received prior to and at the executive session of the Independent Trustees and the meeting of the Board held on September 8, 2020, the Board considered the nature, quality, and extent of the overall services to be provided by Krane and LCM under the Agreements. Among other things, the Board considered the personnel, experience and resources of Krane, and Krane’s ability to provide or obtain such services as may be necessary to manage KVLE. The Board took note of the qualifications, background and responsibilities of Krane’s senior personnel who will provide services to KVLE. The Board recognized that Krane invested significant time and effort in structuring KVLE, including assessing the market appeal of KVLE’s investment strategy, and arranging service providers for the Trust. The Board also considered the financial condition of Krane and noted that Krane is part of a large family of investment management firms with significant resources.
The Board considered that Krane will be responsible for establishing and monitoring KVLE’s investment program and for the day-to-day investment activities of KVLE, subject to the Board’s oversight. The Board considered that Krane’s portfolio managers currently successfully manage a number of other series of the Trust and noted the Krane has established a securities lending program
84
Approval of Investment Advisory Agreements (Unaudited) (continued)
in which KVLE may participate. The Board took note of Krane’s ongoing commitment to evaluating and supporting its compliance and operational staff and that it continually seeks to retain qualified staff in these areas as its business grows.
The Board considered that, under the terms of the Subadvisory Agreement, LCM will provide nondiscretionary advice in connection with the management of KVLE. The Board considered Krane’s work with LCM related to the use of Value Line® rankings in connection with developing the underlying index for KVLE and the overlay provided by LCM with respect to the use of such rankings. The Board noted the significant experience of members of LCM’s management team responsible for the KVLE strategy and considered that KVLE will benefit from LCM’s proprietary quantitative investment process and how LCM will monitor the underlying index in connection with the overlay.
Investment Performance
The Board noted that, because KVLE has not yet commenced investment operations, it has no investment performance. The Board considered that, once KVLE commences operations, the Board will receive regular reports regarding the performance of KVLE relative to its peer funds, including tracking error compared to its peer funds. The Board also considered its experience with Krane’s management of existing operational series of the Trust that pursue different investment strategies and Krane’s significant experience in managing portfolios with various investment objectives. The Board noted the performance of a collective investment trust managed by LCM that follows an investment strategy similar to that proposed for KVLE and considered hypothetical backtested index returns for KVLE’s underlying index.
Compensation
The Board reviewed and considered the compensation proposed to be received by Krane under the Advisory Agreement in light of the nature, quality, and extent of the services to be provided to KVLE. The Board received written presentations from Krane prior to and at its September 8, 2020 meeting and the Independent Trustees had the opportunity to ask questions of senior representatives of Krane at that meeting and at the executive session of the Independent Trustees held immediately following such meeting. The Board considered that Krane proposed to enter into a unitary advisory fee arrangement with the Trust on behalf of KVLE, under which Krane, and not KVLE, will be responsible for paying many of KVLE’s expenses, including those of KVLE’s principal service providers.
The Board noted that the proposed unitary fee rate for KVLE was in line with the total expense ratio of the peer group funds identified by Krane. In its evaluation of the proposed fees compared to other market participants, the Board considered Krane’s representations regarding the competitive marketplace for KVLE and how KVLE will be differentiated from its competitors, including through access to LCM’s proprietary quantitative process and risk management model.
The Board considered the compensation paid to Krane by other advisory clients, including existing operational series of the Trust, as compared to KVLE and recognized that Krane may receive additional compensation if KVLE participates in the securities lending-related program established by Krane. The Board took note that it was not possible to estimate what such compensation might amount to and that such compensation would be monitored to ensure it is appropriate in light of the services to be provided by Krane.
85
Approval of Investment Advisory Agreements (Unaudited) (continued)
Although the Board received information regarding the fees paid to LCM under the Subadvisory Agreement, the Board noted the arm’s-length nature of the relationship between Krane and LCM with respect to the negotiation of subadvisory fee rates. The Board also considered that Krane (and not KVLE) will pay LCM’s fees.
Costs and Profitability
The Board considered the estimated cost of services and profitability of Krane with respect to KVLE. The Board noted that, because KVLE has not yet launched, it is difficult to estimate how profitable the services provided to KVLE under the Advisory Agreement will be to Krane. The Independent Trustees received information from Krane regarding its financial stability and its profitability and had an opportunity in executive session to pose questions to Krane’s chief executive officer (“CEO”) related to, among other things, Krane’s profitability, its broader business strategy, and how KVLE will fit into the suite of products offered by Krane.
The Board considered information from Krane and LCM regarding KVLE’s projected assets over the initial period of the Agreements. The Board also considered information previously provided by Krane regarding the cost of its services and profitability with respect to the existing operational series of the Trust and the similarities and differences between those series and KVLE. The Board noted that KVLE will pay a unitary fee and that, under the terms of the Advisory Agreement, Krane will bear many of KVLE’s expenses as well as the risk that KVLE fails to raise assets adequate to cover such costs.
Although the Board received information from LCM related to its use of third party systems and service providers, the Board did not specifically consider information regarding the costs of such services or profits that LCM projects it will realize from its relationship with KVLE. The Board noted the arm’s-length nature of the relationship between Krane and LCM with respect to the negotiation of the subadvisory fee rate on behalf of KVLE, and considered that Krane, and not KVLE, is responsible for paying LCM’s fees under the Subadvisory Agreement.
Other Benefits
The Board considered the extent to which Krane could derive ancillary benefits from KVLE’s operations, including potential benefits to Krane as a result of its ability to use KVLE’s assets to engage in soft-dollar transactions and that Krane could potentially benefit from any trades that KVLE conducts through a broker-dealer affiliated with the majority owner of Krane. The Board did not observe any other potential benefits to be realized by Krane from its relationship with KVLE.
Economies of Scale
The Board considered whether Krane would realize economies of scale with respect to its services to KVLE as KVLE’s assets grow, including the extent to which this would be reflected in the level of fees to be paid by KVLE to Krane. The Board noted that it is difficult, before the commencement of investment operations, to accurately evaluate potential economies of scale. The Board took note, however, that Krane consistently reinvests a portion of its profits in its business, including through the addition of compliance, operations and sales personnel, as appropriate, and that such reinvestment benefits each series of the Trust. Based on these and other considerations, including that KVLE is newly organized and has not yet commenced operations, the Board considered economies of scale not to be a material factor in its consideration of the Advisory Agreement.
86
Approval of Investment Advisory Agreements (Unaudited) (concluded)
Conclusion
The Board did not identify any single factor as being of paramount importance, and different Trustees may have given different weight to different factors. The Board reviewed a memorandum from Independent Trustee counsel discussing the legal standards applicable to its consideration of the Agreements and the Independent Trustees met in executive session with Krane’s CEO and Independent Trustee counsel to address such standards and recent developments in this area of the law, to consider Krane’s financial stability and strategic initiatives, and to address how KVLE and other strategic initiatives would impact Krane’s business and staffing. The Board noted that, once KVLE becomes operational, the Board will monitor KVLE at its regular meetings, during executive sessions of the Independent Trustees, and outside of the Board meetings. Based on its review, including consideration of each of the factors referenced above, the Board determined, in the exercise of its reasonable business judgment, that the advisory arrangements, as outlined in the Agreements, were reasonable.
87
Disclosure of Fund Expenses (Unaudited)
As a shareholder of a Fund, you incur two types of costs: (1) transaction costs, including brokerage expenses; and (2) ongoing costs. All Exchange Traded Funds (“ETFs”) have operating expenses. As a shareholder of an ETF, your investment is affected by these ongoing costs, which include (among others) costs for ETF management, administrative services, commissions, and shareholder reports like this one. It is important for you to understand the impact of these costs on your investment returns. In addition, a shareholder is responsible for brokerage fees as a result of their investment in the Fund.
Operating expenses such as these are deducted from an ETF’s gross income and directly reduce its final investment return. These expenses are expressed as a percentage of the ETF’s average net assets; this percentage is known as the ETF’s expense ratio.
The following examples use the expense ratio and are intended to help you understand the ongoing costs (in dollars) of investing in your Fund and to compare these costs with those of other funds. The examples are based on an investment of $1,000 made at the beginning of the period shown and held for the entire period (October 1, 2020 to March 31, 2021).
The table on the next page illustrates your Fund’s costs in two ways:
Actual Fund Return. This section helps you to estimate the actual expenses that your Fund incurred over the period. The “Expenses Paid During Period” column shows the actual dollar expense cost incurred by a $1,000 investment in the Fund, and the “Ending Account Value” number is derived from deducting that expense cost from the Fund’s gross investment return.
You can use this information, together with the actual amount you invested in the Fund, to estimate the expenses you paid over that period. Simply divide your actual account value by $1,000 to arrive at a ratio (for example, an $8,600 account value divided by $1,000 = 8.6), then multiply that ratio by the number shown for your Fund under “Expenses Paid During Period.”
Hypothetical 5% Return. This section helps you compare your Fund’s costs with those of other funds. It assumes that the Fund had an annual 5% return before expenses during the year, but that the expense ratio (Column 3) for the period is unchanged. This example is useful in making comparisons because the Securities and Exchange Commission requires all funds to make this 5% calculation. You can assess your Fund’s comparative cost by comparing the hypothetical result for your Fund in the “Expenses Paid During Period” column with those that appear in the same charts in the shareholder reports for other funds.
NOTE: Because the return is set at 5% for comparison purposes — NOT your Fund’s actual return — the account values shown may not apply to your specific investment.
Please note that the expenses shown in the table are meant to highlight your ongoing costs only and do not reflect any transactional costs, including brokerage commissions on the purchases and sale of Fund shares. Therefore, the expense examples are useful in comparing ongoing costs only, and will not help you determine the relative total costs of owning different funds. If these transactional costs had been included, your costs would have been higher.
88
Disclosure of Fund Expenses (Unaudited) (concluded)
| | Beginning
Account
Value
10/1/2020 | | Ending
Account
Value
3/31/2021 | | Annualized
Expense
Ratios | | Expenses
Paid During
Period(1) |
KFA Large Cap Quality Dividend Index |
ETFActual Fund Return | | $ | 1,000.00 | | $ | 1,188.90 | | 0.41 | % | | $ | 2.24 |
Hypothetical 5% Return | | | 1,000.00 | | | 1,022.89 | | 0.41 | | | | 2.07 |
| | | | | | | | | | | | | |
KFA Small Cap Quality Dividend Index ETF |
Actual Fund Return | | $ | 1,000.00 | | $ | 1,352.50 | | 0.51 | % | | $ | 2.99 |
Hypothetical 5% Return | | | 1,000.00 | | | 1,022.39 | | 0.51 | | | | 2.57 |
| | | | | | | | | | | | | |
KFA Dynamic Fixed Income ETF |
Actual Fund Return | | $ | 1,000.00 | | $ | 1,058.30 | | 0.46 | % | | $ | 2.36 |
Hypothetical 5% Return | | | 1,000.00 | | | 1,022.64 | | 0.46 | | | | 2.32 |
| | | | | | | | | | | | | |
KFA Value Line® Dynamic Core Equity Index ETF |
Actual Fund Return(2) | | $ | 1,000.00 | | $ | 1,154.60 | | 0.55 | % | | $ | 2.08 |
Hypothetical 5% Return | | | 1,000.00 | | | 1,022.19 | | 0.55 | | | | 2.77 |
| | | | | | | | | | | | | |
KFA Mount Lucas Index Strategy ETF |
Actual Fund Return(3) | | $ | 1,000.00 | | $ | 1,101.60 | | 0.89 | % | | $ | 3.07 |
Hypothetical 5% Return | | | 1,000.00 | | | 1,020.49 | | 0.89 | | | | 4.48 |
| (1) | Expenses are equal to the Fund’s annualized expense ratio multiplied by the average account value over the period, multiplied by 182/365 (to reflect the one-half year period) unless otherwise indicated. |
| (2) | Expenses are equal to Fund’s annualized expense ratio multiplied by the average account value over the period, multiplied by 128/365 (to reflect the period from 11/23/20 – 3/31/21). |
| (3) | Expenses are equal to Fund’s annualized expense ratio multiplied by the average account value over the period, multiplied by 120/365 (to reflect the period from 12/1/20 – 3/31/21). |
89
Notice to the Shareholders (Unaudited)
For shareholders that do not have a March 31, 2021 tax year end, this notice is for informational purposes only. For shareholders with a March 31, 2021 tax year end, please consult your tax advisor as to the pertinence of this notice. For the fiscal year ended March 31, 2021, the Funds are designating the following items with regard to distributions paid during the year.
Return of
Capital(1) | | Long-Term
Capital
Gain
Distributions | | Ordinary
Income
Distributions | | Total
Distributions | | Qualifying
for
Corporate
Dividends
Received
Deduction(2) | | Qualifying
Dividend
Income(3) | | U.S.
Government
Interest(4) | | Interest
Related
Dividends(5) | | Short Term
Capital
Gain
Dividends(6) | | Foreign
Tax
Credit |
KFA Large Cap Quality Dividend Index ETF | |
0.00% | | 0.00 | % | | 100.00 | % | | 100.00 | % | | 100.00 | % | | 100.00 | % | | 0.00 | % | | 0.02 | % | | 0.00 | % | | 0.00 | % |
KFA Small Cap Quality Dividend Index ETF | |
0.00% | | 0.00 | % | | 100.00 | % | | 100.00 | % | | 100.00 | % | | 99.89 | % | | 0.00 | % | | 0.02 | % | | 0.00 | % | | 0.00 | % |
KFA Dynamic Fixed Income ETF | |
0.00% | | 0.00 | % | | 100.00 | % | | 100.00 | % | | 0.00 | % | | 0.00 | % | | 2.41 | % | | 88.55 | % | | 0.00 | % | | 0.00 | % |
KFA Value Line® Dynamic Core Equity Index ETF | |
0.00% | | 0.00 | % | | 100.00 | % | | 100.00 | % | | 48.17 | % | | 37.78 | % | | 0.00 | % | | 0.00 | % | | 0.00 | % | | 0.00 | % |
KFA Mount Lucas Index Strategy ETF | |
0.00% | | 0.00 | % | | 0.00 | % | | 0.00 | % | | 0.00 | % | | 0.00 | % | | 0.00 | % | | 0.00 | % | | 0.00 | % | | 0.00 | % |
| (1) | Return of capital is a payment received from the fund that is not considered to be taxable income. The return of capital distribution is considered to be a return of the investor’s original investment and reduces the investor’s cost basis in the fund. |
| (2) | Qualifying dividends represent dividends which qualify for the corporate dividends received deduction and is reflected as a percentage of ordinary income distributions (the total of short term capital gain and net investment income distributions). |
| (3) | The percentage in this column represents the amount of “Qualifying Dividend Income” as created by the Jobs and Growth Relief Reconciliation Act of 2003 and is reflected as a percentage of ordinary income distributions (the total of short term capital gain and net investment income distributions). It is the intention of each of the aforementioned funds to designate the maximum amount permitted by law. |
| (4) | “U.S. Government Interest” represents the amount of interest that was derived from U.S. Government obligations and distributed during the fiscal year. Generally, interest from direct U.S. Government obligations is exempt from state income tax. However, for shareholders who are residents of California, Connecticut and New York, the statutory threshold requirements were not satisfied to permit exemption of these amounts from state income. |
| (5) | The percentage in this column represents the amount of “Interest Related Dividends” and is reflected as a percentage of ordinary income distributions that is exempt from U.S. withholding tax when paid for foreign investors. |
| (6) | The percentage in this column represents the amount of “Short Term Capital Gain Dividends” and is reflected as a percentage of short term capital gain distributions that is exempt from U.S. withholding tax when paid for foreign investors. |
90
Supplemental Information (Unaudited)
Net asset value, or “NAV”, is the price per Share at which the Funds issue and redeem Shares to Authorized Participants. It is calculated in accordance with the policies described in Note 2 in Notes to Financial Statements. The “Market Price” of the Funds generally is determined using the midpoint between the highest bid and the lowest offer on the stock exchange on which the Shares of the Funds are listed for trading, as of the time that the Funds’ NAV is calculated. The Funds’ Market Price may be at, above or below their NAV. The NAV of the Funds will fluctuate with changes in the market value of their holdings. The Market Price of the Funds will fluctuate in accordance with changes in their NAV, as well as market supply and demand of Fund Shares.
Premiums or discounts are the differences (expressed as a percentage) between the NAV and Market Price of the Funds on a given day, generally at the time NAV is calculated. A premium is the amount that the Funds are trading above the reported NAV, expressed as a percentage of the NAV. A discount is the amount that the Funds are trading below the reported NAV, expressed as a percentage of the NAV. Shareholders may pay more than NAV when they buy Fund Shares and receive less than NAV when they sell those Shares, because Shares are bought and sold at Market Price.
Further information regarding premiums and discounts is available on the Funds’ website at http://kfafunds.com. The premium and discount information contained on the website represents past performance and cannot be used to predict future results.
91
Adopted December 18, 2020
PRIVACY NOTICE
KRANE SHARES TRUST
FACTS | WHAT DOES KRANE SHARES TRUST DO WITH YOUR PERSONAL INFORMATION? |
| | |
Why? | Financial companies choose how they share your personal information. Federal law gives consumers the right to limit some, but not all sharing. Federal law also requires us to tell you how we collect, share, and protect your personal information. Please read this notice carefully to understand what we do. |
| | |
What? | The types of personal information we collect and share depends on the product or service that you have with us. This information can include: • Social Security number and wire transfer instructions • account transactions and transaction history • investment experience and purchase history When you are no longer our customer, we may continue to share your information as described in this notice. |
| | |
How? | All financial companies need to share customers’ personal information to run their everyday business. In the section below, we list the reasons financial companies can share their customers’ personal information; the reasons Krane Shares Trust chooses to share; and whether you can limit this sharing. |
Reasons we can share
your personal information: | Does Krane Shares Trust
share information? | Can you limit this sharing? |
For our everyday business purposes — such as to process your transactions, maintain your account(s), respond to court orders and legal investigations, or report to credit bureaus. | YES | NO |
For our marketing purposes — to offer our products and services to you. | NO | We don’t share |
For joint marketing with other financial companies. | NO | We don’t share |
92
Privacy Notice (concluded)
Reasons we can share
your personal information: | Does Krane Shares Trust
share information? | Can you limit this sharing? |
For our affiliates’ everyday business purposes — information about your transactions and records. | NO | We don’t share |
For our affiliates’ everyday business purposes — information about your credit worthiness. | NO | We don’t share |
For nonaffiliates to market to you | NO | We don’t share |
QUESTIONS? | | Call 1-212-933-0393 |
What we do: | |
How does Krane Shares Trust protect my personal information? | To protect your personal information from unauthorized access and use, we use security measures that comply with federal law. These measures include computer safeguards and secured files and buildings. Our service providers are held accountable for adhering to strict policies and procedures to prevent any misuse of your nonpublic personal information. |
How does Krane Shares Trust collect my personal information? | We collect your personal information, for example, when you open an account We also collect your personal information from others, such as credit bureaus, affiliates, or other companies. |
Why can’t I limit all sharing? | Federal law gives you the right to limit only: • sharing for affiliates’ everyday business purposes — information about your creditworthiness. • affiliates from using your information to market to you. • sharing for nonaffiliates to market to you. State laws and individual companies may give you additional rights to limit sharing. |
Definitions | |
Affiliates | Companies related by common ownership or control. They can be financial and nonfinancial companies. |
Nonaffiliates | Companies not related by common ownership or control. They can be financial and nonfinancial companies. • Krane Shares Trust does not share with nonaffiliates so they can market to you. |
Joint marketing | A formal agreement between nonaffiliated financial companies that together market financial products or services to you. • Krane Shares Trust does not jointly market. |
93

KraneShares Trust:
280 Park Avenue 32nd Floor
New York, NY 10017
1-855-857-2638
http://kfafunds.com
Investment Adviser:
Krane Funds Advisors, LLC
280 Park Avenue 32nd Floor
New York, NY 10017
Distributor:
SEI Investments Distribution Co.
One Freedom Valley Drive
Oaks, PA 19456
Administrator:
SEI Investments Global Funds Services
One Freedom Valley Drive
Oaks, PA 19456
This information must be preceded or accompanied by a current prospectus for the Funds described.
KraneShares Trust:
280 Park Avenue 32nd Floor
New York, NY 10017
KRS-AR-002-0200
The Registrant has adopted a code of ethics that applies to the Registrant's principal executive officer, principal financial officer, controller or principal accounting officer or any person who performs a similar function. During the period covered by the report, there were no amendments to the code of ethics, and the Registrant did not grant any waivers from a provision of the code of ethics.
| Item 3. | Audit Committee Financial Expert. |
(a) (1) The Registrant’s Board of Trustees has determined that the Registrant has an audit committee financial expert serving on the audit committee.
(a) (2) The audit committee financial expert, John Ferguson, is an independent trustee as defined in Form N-CSR Item 3 (a) (2).
| Item 4. | Principal Accountant Fees and Services. |
Fees billed by KPMG LLP (“KPMG”) related to the Registrant.
KPMG billed the Registrant aggregate fees for services rendered to the Registrant for the last two fiscal years as follows:
| | 2021 | 2020 |
| | | All fees and
services to
the
Registrant
that were
pre-approved | All fees and
services to
service
affiliates that
were
pre-approved | All other fees and services
to service
affiliates that
did not
require pre-
approval | All fees and
services to
the
Registrant
that were
pre-approved | All fees and
services to
service
affiliates that
were pre-
approved | All other fees
and services
to service
affiliates that
did not
require pre-
approval |
| (a) | Audit Fees | $440,800 | $0 | N/A | $312,400 | $0 | N/A |
| (b) | Audit-Related Fees | $0 | $0 | N/A | $0 | $0 | N/A |
| (c) | Tax Fees(1) | $75,455 | $0 | N/A | $67,658 | $0 | N/A |
| (d) | All Other Fees | $0 | $0 | N/A | $0 | $0 | N/A |
Notes:
(1) These services included tax return preparation and tax compliance for the Funds.
(e)(1) Pursuant to the requirements of the Sarbanes Act, the SEC adopted Rule 2-01 under Regulation S-X, which, among other things, requires a fund’s audit committee to pre-approve certain audit and non-audit services that are provided by its independent auditors in order to ensure the auditors’ independence. The Registrant’s Board of Trustees has established an Audit Committee that has been charged with, among other things, assisting the Board of Trustees in its oversight of: the Registrant’s independent auditors; preapproving all audit and non-audit services provided by the Registrant’s independent auditors; the integrity of the Funds’ financial statements; the independent auditors’ qualifications and independence; and the use of appropriate accounting principles.
(e)(2) Percentage of fees billed applicable to non-audit services approved pursuant to the “de minimis” exception of Rule 2-01(c)(7)(i)(C) were as follows for KPMG:
| | 2021 | 2020 |
Audit-Related Fees | 0% | 0% |
Tax Fees | 0% | 0% |
All Other Fees | 0% | 0% |
(f) Not applicable.
(g) The aggregate non-audit fees and services billed by KPMG for the last two fiscal years were $0 and $0, respectively.
(h) During the past fiscal year, all non-audit services provided by the Registrant’s principal accountant to either the Registrant's investment adviser or to entities controlling, controlled by, or under common control with the Registrant’s investment adviser that provides ongoing services to the Registrant were pre-approved by the Audit Committee of the Registrant's Board of Trustees. Included in the audit committee’s pre-approval was the review and consideration as to whether the provision of these non-audit services is compatible with maintaining the principal accountant’s independence.
| Items 5. | Audit Committee of Listed Registrants. |
The Registrant has a separately-designated standing Audit Committee, which is composed of the Registrant's Independent Trustees, Messrs. Patrick Campo, John Ferguson and Matthew Stroyman.
| Item 6. | Schedule of Investments |
Schedule of Investments is included as part of the Report to Shareholders filed under Item 1 of this form.
| Item 7. | Disclosure of Proxy Voting Policies and Procedures for Closed-End Management Investment Companies. |
Not applicable to open-end management investment companies.
| Item 8. | Portfolio Managers of Closed-End Management Investment Companies |
Not applicable to open-end management investment companies.
| Item 9. | Purchases of Equity Securities by Closed-End Management Company and Affiliated Purchasers. |
Not applicable to open-end management investment companies.
| Item 10. | Submission of Matters to a Vote of Security Holders. |
There have been no changes to the procedures by which shareholders may recommend nominees to the Registrant’s Board of Trustees during the period covered by this report.
| Item 11. | Controls and Procedures. |
(a) The Registrant’s principal executive and principal financial officers, or persons performing similar functions, have concluded that the Registrant’s disclosure controls and procedures (as defined in Rule 30a-3(c) under the Act (17 CFR § 270.30a-3(c)) as of a date within 90 days of the filing date of the report, are effective based on the evaluation of these controls and procedures required by Rule 30a-3(b) under the Act (17 CFR § 270.30a-3(b)) and Rules 13a-15(b) or 15d-15(b) under the Exchange Act of 1934 (17 CFR § 240.13a-15(b) or § 240.15d-15(b)).
(b) There has been no change in the Registrant’s internal control over financial reporting (as defined in Rule 30a-3(d) under the 1940 Act (17 CFR § 270.30a-3(d)) that occurred during the most recent fiscal half-year period covered by this report that has materially affected, or is reasonably likely to materially affect, the Registrant’s internal control over financial reporting.
| Item 12. | Disclosure of Securities Lending Activities for Closed-End Management Investment Companies. |
Not applicable to open-end management investment companies.
SIGNATURES
Pursuant to the requirements of the Securities Exchange Act of 1934 and the Investment Company Act of 1940, the Registrant has duly caused this report to be signed on its behalf by the undersigned, thereunto duly authorized.
| | KraneShares Trust |
| | |
| By: | /s/ Jonathan Krane |
| | Jonathan Krane |
| | Principal Executive Officer |
Date: June 9, 2021
Pursuant to the requirements of the Securities Exchange Act of 1934 and the Investment Company Act of 1940, this report has been signed below by the following persons on behalf of the registrant and in the capacities and on the dates indicated.
| By: | /s/ Jonathan Krane |
| | Jonathan Krane |
| | Principal Executive Officer |
Date: June 9, 2021
| By: | /s/ Jonathan Krane |
| | Jonathan Krane |
| | Principal Financial Officer |
Date: June 9, 2021