UNITED STATES
SECURITIES AND EXCHANGE COMMISSION
Washington, D.C. 20549
FORM N-CSRS
CERTIFIED SHAREHOLDER REPORT OF REGISTERED MANAGEMENT
INVESTMENT COMPANIES
Investment Company Act File Number 811-22698
KraneShares Trust
(Exact name of registrant as specified in charter)
280 Park Avenue, 32nd Floor
New York, New York 10017
(Address of principal executive offices) (Zip code)
Jonathan Krane
KraneShares Trust
280 Park Avenue, 32nd Floor
New York, New York 10017
(Name and address of agent for service)
Copy to:
Stacy L. Fuller
K&L Gates LLP
1601 K Street NW
Washington, DC 20006-1600
Registrant’s telephone number, including area code: (212) 933-0393
Date of fiscal year end: March 31, 2025
Date of reporting period: September 30, 2024
Form N-CSRS is to be used by management investment companies to file reports with the Commission not later than 10 days after the transmission to stockholders of any report that is required to be transmitted to stockholders under Rule 30e-1 under the Investment Company Act of 1940 (17 CFR 270.30e-1). The Commission may use the information provided on Form N-CSR in its regulatory, disclosure review, inspection, and policymaking roles.
A registrant is required to disclose the information specified by Form N-CSRS, and the Commission will make this information public. A registrant is not required to respond to the collection of information contained in Form N-CSRS unless the Form displays a currently valid Office of Management and Budget (“OMB”) control number. Please direct comments concerning the accuracy of the information collection burden estimate and any suggestions for reducing the burden to Secretary, Securities and Exchange Commission, 100 F Street, NE, Washington, DC 20549-1090. The OMB has reviewed this collection of information under the clearance requirements of 44 U.S.C. § 3507.
Item 1. Reports to Stockholders.
| (a) | A copy of the report transmitted to stockholders pursuant to Rule 30e-1 under the Investment Company Act of 1940, as amended (the “Act”) [17 CFR § 270.30e-1], is attached hereto. |
KraneShares CSI China Internet ETF
Principal Listing Exchange: NYSE Arca
Semi-Annual Shareholder Report - September 30, 2024
This semi-annual shareholder report contains important information about KraneShares CSI China Internet ETF (the "Fund") for the period from April 1, 2024 to September 30, 2024. You can find additional information about the Fund at https://kraneshares.com/kweb/. You can also request this information by contacting us at 1-855-857-2638.
What were the Fund costs for the last six months?
(based on a hypothetical $10,000 investment)
| Fund Name | Costs of a $10,000 investment | Costs paid as a percentage of a $10,000 investment |
|---|
| KraneShares CSI China Internet ETF | $41 | 0.70% |
Key Fund Statistics as of September 30, 2024
| Total Net Assets | Number of Holdings | Total Advisory Fees Paid | Portfolio Turnover Rate |
|---|
| $7,208,815,734 | 33 | $17,873,683 | 25% |
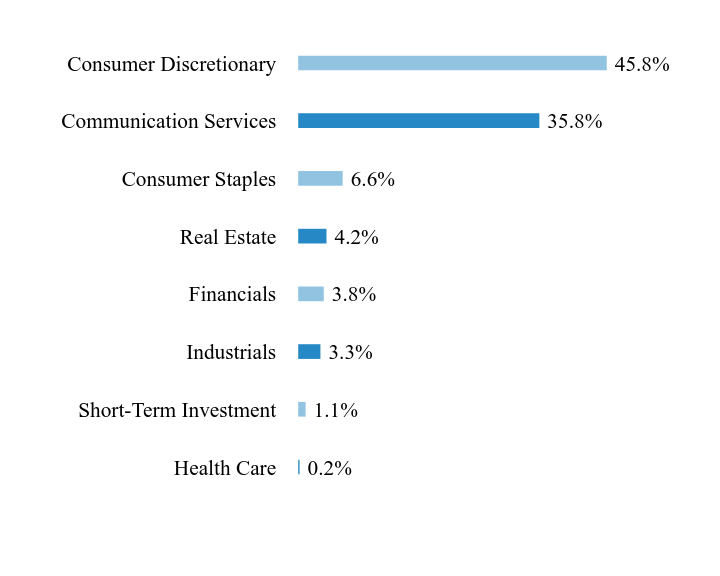
What did the Fund invest in?
Sector WeightingsFootnote Reference*
| Value | Value |
|---|
| Health Care | 0.2% |
| Short-Term Investment | 1.1% |
| Industrials | 3.3% |
| Financials | 3.8% |
| Real Estate | 4.2% |
| Consumer Staples | 6.6% |
| Communication Services | 35.8% |
| Consumer Discretionary | 45.8% |
| Footnote | Description |
Footnote* | Percentages are calculated based on total net assets. |
| Holding Name | | | Percentage of Total Net AssetsFootnote Reference(A) |
|---|
| Alibaba Group Holding | | | 11.0% |
| Tencent Holdings | | | 9.9% |
| Meituan, Cl B | | | 9.1% |
| JD.com, Cl A | | | 7.2% |
| PDD Holdings ADR | | | 6.3% |
| KE Holdings ADR | | | 4.2% |
| Trip.com Group | | | 4.1% |
| Baidu, Cl A | | | 3.7% |
| Bilibili, Cl Z | | | 3.6% |
| Kuaishou Technology, Cl B | | | 3.6% |
| Footnote | Description |
Footnote(A) | Short-Term Investments are not shown in the top ten chart. |
There were no material changes during the reporting period.
For additional information about the Fund, including its prospectus, financial information, holdings, and proxy voting information, visit https://kraneshares.com/kweb/.
You may have consented to receive one copy of a shareholder report at your address if you and one or more individuals in your home have multiple accounts at the same address. This practice is commonly called “householding” and is intended to reduce expenses. If you wish to change your householding status or receive individual copies of your shareholder report, please contact us at (855) 857 2638 or your financial intermediary.
KraneShares Bosera MSCI China A 50 Connect Index ETF
Principal Listing Exchange: NYSE Arca
Semi-Annual Shareholder Report - September 30, 2024
This semi-annual shareholder report contains important information about KraneShares Bosera MSCI China A 50 Connect Index ETF (the "Fund") for the period from April 1, 2024 to September 30, 2024. You can find additional information about the Fund at https://kraneshares.com/kba/. You can also request this information by contacting us at 1-855-857-2638.
What were the Fund costs for the last six months?
(based on a hypothetical $10,000 investment)
| Fund Name | Costs of a $10,000 investment | Costs paid as a percentage of a $10,000 investment |
|---|
| KraneShares Bosera MSCI China A 50 Connect Index ETF | $31 | 0.56% |
Key Fund Statistics as of September 30, 2024
| Total Net Assets | Number of Holdings | Total Advisory Fees Paid | Portfolio Turnover Rate |
|---|
| $186,361,118 | 86 | $488,363 | 19% |
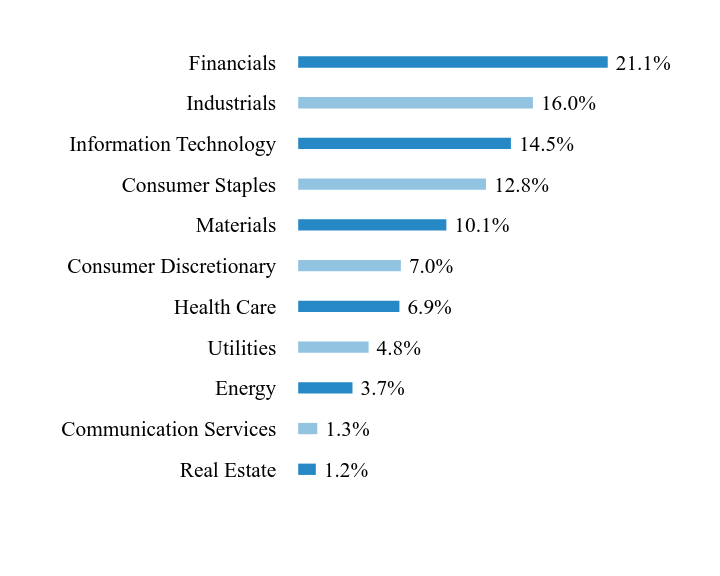
What did the Fund invest in?
Sector WeightingsFootnote Reference*
| Value | Value |
|---|
| Real Estate | 1.2% |
| Communication Services | 1.3% |
| Energy | 3.7% |
| Utilities | 4.8% |
| Health Care | 6.9% |
| Consumer Discretionary | 7.0% |
| Materials | 10.1% |
| Consumer Staples | 12.8% |
| Information Technology | 14.5% |
| Industrials | 16.0% |
| Financials | 21.1% |
| Footnote | Description |
Footnote* | Percentages are calculated based on total net assets. |
| Holding Name | | | Percentage of Total Net Assets |
|---|
| Kweichow Moutai, Cl A | | | 6.9% |
| Contemporary Amperex Technology, Cl A | | | 6.5% |
| Zijin Mining Group, Cl A | | | 5.6% |
| Foxconn Industrial Internet, Cl A | | | 4.6% |
| Wanhua Chemical Group, Cl A | | | 4.3% |
| Luxshare Precision Industry, Cl A | | | 4.3% |
| BYD, Cl A | | | 3.7% |
| China Yangtze Power, Cl A | | | 3.7% |
| China Merchants Bank, Cl A | | | 3.4% |
| Hygon Information Technology, Cl A | | | 3.3% |
There were no material changes during the reporting period.
For additional information about the Fund, including its prospectus, financial information, holdings, and proxy voting information, visit https://kraneshares.com/kba/.
You may have consented to receive one copy of a shareholder report at your address if you and one or more individuals in your home have multiple accounts at the same address. This practice is commonly called “householding” and is intended to reduce expenses. If you wish to change your householding status or receive individual copies of your shareholder report, please contact us at (855) 857 2638 or your financial intermediary.
KraneShares MSCI All China Index ETF
Principal Listing Exchange: NYSE Arca
Semi-Annual Shareholder Report - September 30, 2024
This semi-annual shareholder report contains important information about KraneShares MSCI All China Index ETF (the "Fund") for the period from April 1, 2024 to September 30, 2024. You can find additional information about the Fund at https://kraneshares.com/kall/. You can also request this information by contacting us at 1-855-857-2638.
What were the Fund costs for the last six months?
(based on a hypothetical $10,000 investment)
| Fund Name | Costs of a $10,000 investment | Costs paid as a percentage of a $10,000 investment |
|---|
| KraneShares MSCI All China Index ETF | $28 | 0.49% |
Key Fund Statistics as of September 30, 2024
| Total Net Assets | Number of Holdings | Total Advisory Fees Paid | Portfolio Turnover Rate |
|---|
| $8,061,664 | 203 | $15,919 | 1% |
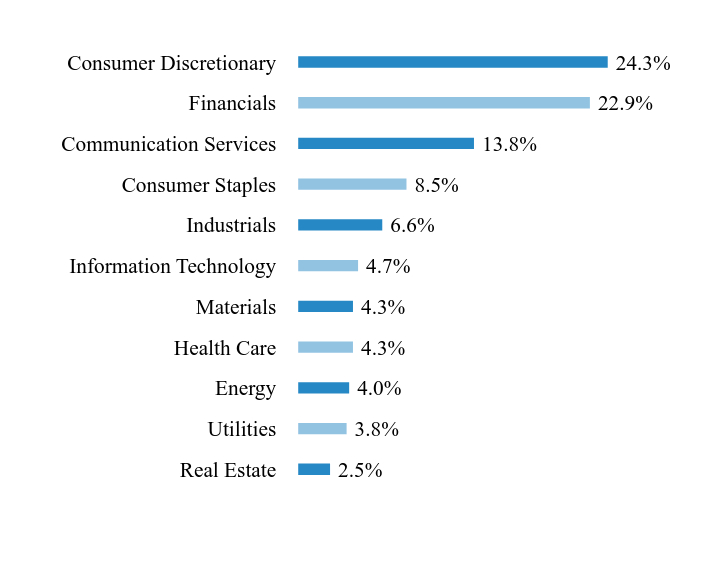
What did the Fund invest in?
Sector WeightingsFootnote Reference*
| Value | Value |
|---|
| Real Estate | 2.5% |
| Utilities | 3.8% |
| Energy | 4.0% |
| Health Care | 4.3% |
| Materials | 4.3% |
| Information Technology | 4.7% |
| Industrials | 6.6% |
| Consumer Staples | 8.5% |
| Communication Services | 13.8% |
| Financials | 22.9% |
| Consumer Discretionary | 24.3% |
| Footnote | Description |
Footnote* | Percentages are calculated based on total net assets. |
| Holding Name | | | Percentage of Total Net Assets |
|---|
| Tencent Holdings | | | 9.0% |
| Alibaba Group Holding | | | 5.8% |
| Meituan, Cl B | | | 3.1% |
| Kweichow Moutai, Cl A | | | 2.5% |
| PDD Holdings ADR | | | 2.2% |
| China Construction Bank, Cl H | | | 2.0% |
| JD.com, Cl A | | | 1.6% |
| Contemporary Amperex Technology, Cl A | | | 1.4% |
| BYD, Cl H | | | 1.4% |
| Xiaomi, Cl B | | | 1.4% |
There were no material changes during the reporting period.
For additional information about the Fund, including its prospectus, financial information, holdings, and proxy voting information, visit https://kraneshares.com/kall/.
You may have consented to receive one copy of a shareholder report at your address if you and one or more individuals in your home have multiple accounts at the same address. This practice is commonly called “householding” and is intended to reduce expenses. If you wish to change your householding status or receive individual copies of your shareholder report, please contact us at (855) 857 2638 or your financial intermediary.
KraneShares MSCI One Belt One Road Index ETF
Principal Listing Exchange: NYSE Arca
Semi-Annual Shareholder Report - September 30, 2024
This semi-annual shareholder report contains important information about KraneShares MSCI One Belt One Road Index ETF (the "Fund") for the period from April 1, 2024 to September 30, 2024. You can find additional information about the Fund at https://kraneshares.com/obor/. You can also request this information by contacting us at 1-855-857-2638.
What were the Fund costs for the last six months?
(based on a hypothetical $10,000 investment)
| Fund Name | Costs of a $10,000 investment | Costs paid as a percentage of a $10,000 investment |
|---|
| KraneShares MSCI One Belt One Road Index ETF | $42 | 0.79% |
Key Fund Statistics as of September 30, 2024
| Total Net Assets | Number of Holdings | Total Advisory Fees Paid | Portfolio Turnover Rate |
|---|
| $3,548,410 | 133 | $14,467 | 12% |
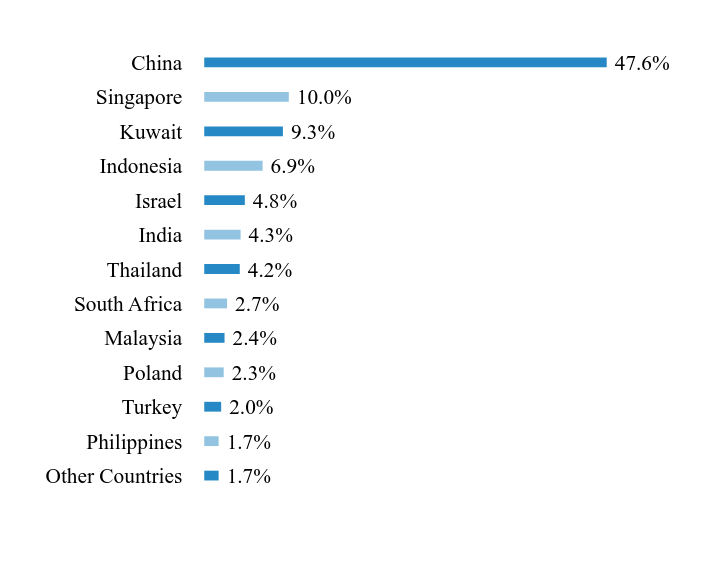
What did the Fund invest in?
Country WeightingsFootnote Reference*
| Value | Value |
|---|
| Other Countries | 1.7% |
| Philippines | 1.7% |
| Turkey | 2.0% |
| Poland | 2.3% |
| Malaysia | 2.4% |
| South Africa | 2.7% |
| Thailand | 4.2% |
| India | 4.3% |
| Israel | 4.8% |
| Indonesia | 6.9% |
| Kuwait | 9.3% |
| Singapore | 10.0% |
| China | 47.6% |
| Footnote | Description |
Footnote* | Percentages are calculated based on total net assets. |
| Holding Name | | | Percentage of Total Net Assets |
|---|
| Kuwait Finance House | | | 9.3% |
| Oversea-Chinese Banking | | | 7.4% |
| China Yangtze Power, Cl A | | | 5.2% |
| PTT | | | 4.2% |
| China Petroleum & Chemical, Cl H | | | 2.5% |
| KGHM Polska Miedz | | | 2.3% |
| Elbit Systems | | | 2.1% |
| Beijing-Shanghai High Speed Railway, Cl A | | | 2.1% |
| Impala Platinum Holdings | | | 2.1% |
| Turk Hava Yollari AO | | | 1.8% |
There were no material changes during the reporting period.
For additional information about the Fund, including its prospectus, financial information, holdings, and proxy voting information, visit https://kraneshares.com/obor/.
You may have consented to receive one copy of a shareholder report at your address if you and one or more individuals in your home have multiple accounts at the same address. This practice is commonly called “householding” and is intended to reduce expenses. If you wish to change your householding status or receive individual copies of your shareholder report, please contact us at (855) 857 2638 or your financial intermediary.
KraneShares Emerging Markets Consumer Technology Index ETF
Principal Listing Exchange: NYSE Arca
Semi-Annual Shareholder Report - September 30, 2024
This semi-annual shareholder report contains important information about KraneShares Emerging Markets Consumer Technology Index ETF (the "Fund") for the period from April 1, 2024 to September 30, 2024. You can find additional information about the Fund at https://kraneshares.com/kemq/. You can also request this information by contacting us at 1-855-857-2638.
What were the Fund costs for the last six months?
(based on a hypothetical $10,000 investment)
| Fund Name | Costs of a $10,000 investment | Costs paid as a percentage of a $10,000 investment |
|---|
| KraneShares Emerging Markets Consumer Technology Index ETF | $35 | 0.60% |
Key Fund Statistics as of September 30, 2024
| Total Net Assets | Number of Holdings | Total Advisory Fees Paid | Portfolio Turnover Rate |
|---|
| $17,376,254 | 53 | $46,123 | 22% |
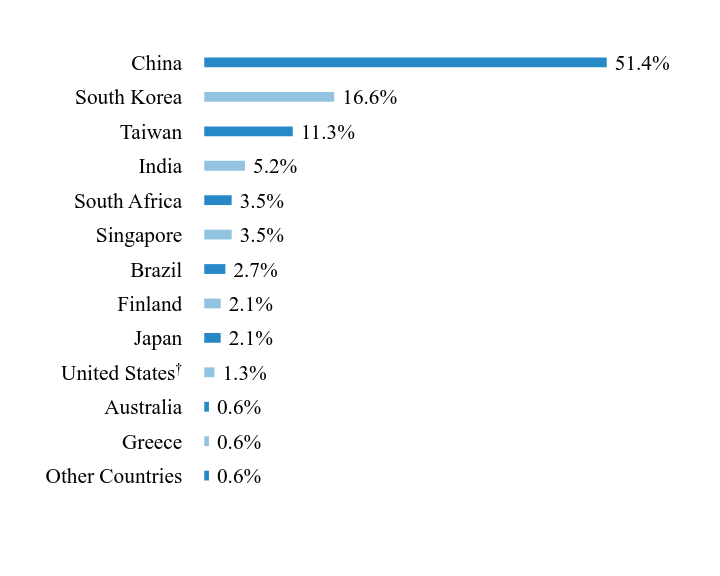
What did the Fund invest in?
Country WeightingsFootnote Reference*
| Value | Value |
|---|
| Other Countries | 0.6% |
| Greece | 0.6% |
| Australia | 0.6% |
United StatesFootnote Reference† | 1.3% |
| Japan | 2.1% |
| Finland | 2.1% |
| Brazil | 2.7% |
| Singapore | 3.5% |
| South Africa | 3.5% |
| India | 5.2% |
| Taiwan | 11.3% |
| South Korea | 16.6% |
| China | 51.4% |
| Footnote | Description |
Footnote* | Percentages are calculated based on total net assets. |
Footnote† | This security, or a portion thereof, was purchased with cash collateral held from securities on loan. |
| Holding Name | | | Percentage of Total Net AssetsFootnote Reference(A) |
|---|
| JD.com, Cl A | | | 4.7% |
| Meituan, Cl B | | | 4.1% |
| PDD Holdings ADR | | | 4.1% |
| Alibaba Health Information Technology | | | 3.9% |
| Alibaba Group Holding | | | 3.9% |
| NetEase | | | 3.6% |
| Naspers, Cl N | | | 3.5% |
| Sea ADR | | | 3.5% |
| Tencent Holdings | | | 3.4% |
| Bilibili, Cl Z | | | 3.4% |
| Footnote | Description |
Footnote(A) | Short-Term Investments are not shown in the top ten chart. |
There were no material changes during the reporting period.
For additional information about the Fund, including its prospectus, financial information, holdings, and proxy voting information, visit https://kraneshares.com/kemq/.
You may have consented to receive one copy of a shareholder report at your address if you and one or more individuals in your home have multiple accounts at the same address. This practice is commonly called “householding” and is intended to reduce expenses. If you wish to change your householding status or receive individual copies of your shareholder report, please contact us at (855) 857 2638 or your financial intermediary.
KraneShares MSCI China Clean Technology Index ETF
Principal Listing Exchange: NYSE Arca
Semi-Annual Shareholder Report - September 30, 2024
This semi-annual shareholder report contains important information about KraneShares MSCI China Clean Technology Index ETF (the "Fund") for the period from April 1, 2024 to September 30, 2024. You can find additional information about the Fund at https://kraneshares.com/kgrn/. You can also request this information by contacting us at 1-855-857-2638.
What were the Fund costs for the last six months?
(based on a hypothetical $10,000 investment)
| Fund Name | Costs of a $10,000 investment | Costs paid as a percentage of a $10,000 investment |
|---|
| KraneShares MSCI China Clean Technology Index ETF | $44 | 0.79% |
Key Fund Statistics as of September 30, 2024
| Total Net Assets | Number of Holdings | Total Advisory Fees Paid | Portfolio Turnover Rate |
|---|
| $59,990,088 | 44 | $209,879 | 20% |
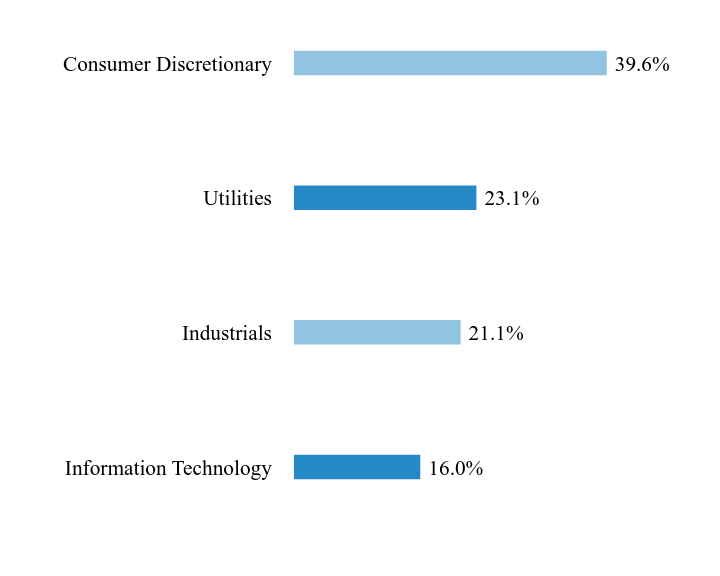
What did the Fund invest in?
Sector WeightingsFootnote Reference*
| Value | Value |
|---|
| Information Technology | 16.0% |
| Industrials | 21.1% |
| Utilities | 23.1% |
| Consumer Discretionary | 39.6% |
| Footnote | Description |
Footnote* | Percentages are calculated based on total net assets. |
| Holding Name | | | Percentage of Total Net Assets |
|---|
| Li Auto, Cl A | | | 9.0% |
| BYD, Cl H | | | 7.8% |
| Contemporary Amperex Technology, Cl A | | | 7.5% |
| XPeng, Cl A | | | 6.6% |
| NIO, Cl A | | | 6.5% |
| China Yangtze Power, Cl A | | | 5.0% |
| Kingdee International Software Group | | | 4.9% |
| Xinyi Solar Holdings | | | 3.7% |
| China Longyuan Power Group, Cl H | | | 3.6% |
| Beijing-Shanghai High Speed Railway, Cl A | | | 3.6% |
There were no material changes during the reporting period.
For additional information about the Fund, including its prospectus, financial information, holdings, and proxy voting information, visit https://kraneshares.com/kgrn/.
You may have consented to receive one copy of a shareholder report at your address if you and one or more individuals in your home have multiple accounts at the same address. This practice is commonly called “householding” and is intended to reduce expenses. If you wish to change your householding status or receive individual copies of your shareholder report, please contact us at (855) 857 2638 or your financial intermediary.
KraneShares Electric Vehicles and Future Mobility Index ETF
Principal Listing Exchange: NYSE Arca
Semi-Annual Shareholder Report - September 30, 2024
This semi-annual shareholder report contains important information about KraneShares Electric Vehicles and Future Mobility Index ETF (the "Fund") for the period from April 1, 2024 to September 30, 2024. You can find additional information about the Fund at https://kraneshares.com/kars/. You can also request this information by contacting us at 1-855-857-2638.
What were the Fund costs for the last six months?
(based on a hypothetical $10,000 investment)
| Fund Name | Costs of a $10,000 investment | Costs paid as a percentage of a $10,000 investment |
|---|
| KraneShares Electric Vehicles and Future Mobility Index ETF | $37 | 0.73% |
Key Fund Statistics as of September 30, 2024
| Total Net Assets | Number of Holdings | Total Advisory Fees Paid | Portfolio Turnover Rate |
|---|
| $87,796,405 | 54 | $297,808 | 18% |
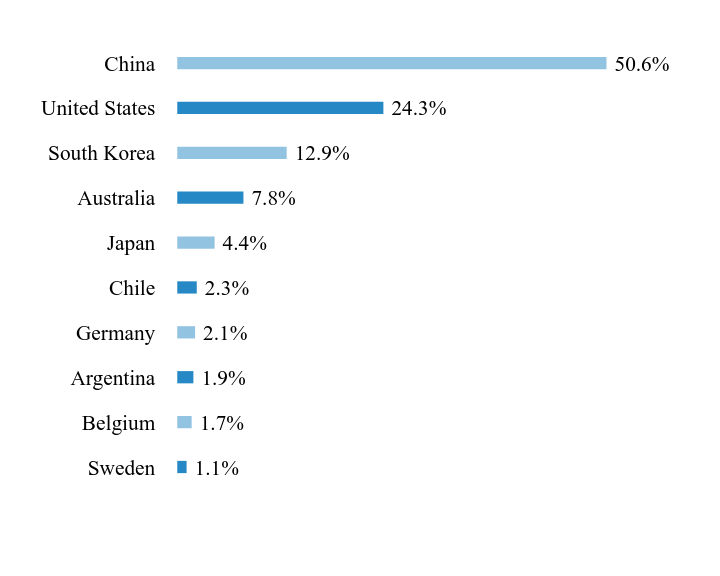
What did the Fund invest in?
Country WeightingsFootnote Reference*
| Value | Value |
|---|
| Sweden | 1.1% |
| Belgium | 1.7% |
| Argentina | 1.9% |
| Germany | 2.1% |
| Chile | 2.3% |
| Japan | 4.4% |
| Australia | 7.8% |
| South Korea | 12.9% |
| United States | 24.3% |
| China | 50.6% |
| Footnote | Description |
Footnote* | Percentages are calculated based on total net assets. |
| Holding Name | | | Percentage of Total Net AssetsFootnote Reference(A) |
|---|
| Contemporary Amperex Technology, Cl A | | | 4.8% |
| BYD, Cl A | | | 4.2% |
| Li Auto, Cl A | | | 4.1% |
| XPeng, Cl A | | | 3.9% |
| Samsung SDI | | | 3.8% |
| Tesla | | | 3.6% |
| Panasonic Holdings | | | 3.6% |
| Albemarle | | | 3.5% |
| NIO ADR | | | 3.5% |
| Geely Automobile Holdings | | | 3.2% |
| Footnote | Description |
Footnote(A) | Short-Term Investments are not shown in the top ten chart. |
There were no material changes during the reporting period.
For additional information about the Fund, including its prospectus, financial information, holdings, and proxy voting information, visit https://kraneshares.com/kars/.
You may have consented to receive one copy of a shareholder report at your address if you and one or more individuals in your home have multiple accounts at the same address. This practice is commonly called “householding” and is intended to reduce expenses. If you wish to change your householding status or receive individual copies of your shareholder report, please contact us at (855) 857 2638 or your financial intermediary.
KraneShares MSCI All China Health Care Index ETF
Principal Listing Exchange: NYSE Arca
Semi-Annual Shareholder Report - September 30, 2024
This semi-annual shareholder report contains important information about KraneShares MSCI All China Health Care Index ETF (the "Fund") for the period from April 1, 2024 to September 30, 2024. You can find additional information about the Fund at https://kraneshares.com/kure/. You can also request this information by contacting us at 1-855-857-2638.
What were the Fund costs for the last six months?
(based on a hypothetical $10,000 investment)
| Fund Name | Costs of a $10,000 investment | Costs paid as a percentage of a $10,000 investment |
|---|
| KraneShares MSCI All China Health Care Index ETF | $35 | 0.65% |
Key Fund Statistics as of September 30, 2024
| Total Net Assets | Number of Holdings | Total Advisory Fees Paid | Portfolio Turnover Rate |
|---|
| $47,495,307 | 61 | $134,972 | 11% |
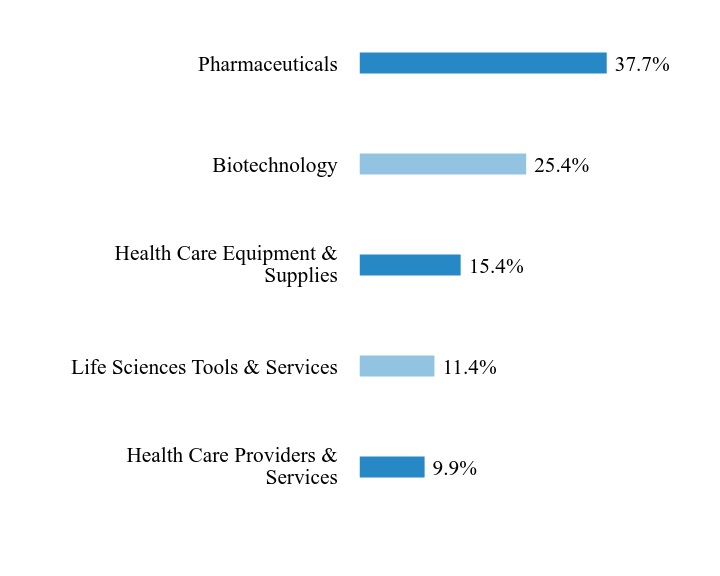
What did the Fund invest in?
Industry WeightingsFootnote Reference*
| Value | Value |
|---|
| Health Care Providers & Services | 9.9% |
| Life Sciences Tools & Services | 11.4% |
| Health Care Equipment & Supplies | 15.4% |
| Biotechnology | 25.4% |
| Pharmaceuticals | 37.7% |
| Footnote | Description |
Footnote* | Percentages are calculated based on total net assets. |
| Holding Name | | | Percentage of Total Net Assets |
|---|
| Shenzhen Mindray Bio-Medical Electronics, Cl A | | | 8.3% |
| Jiangsu Hengrui Pharmaceuticals, Cl A | | | 7.8% |
| BeiGene | | | 7.0% |
| Wuxi Biologics Cayman | | | 4.3% |
| Innovent Biologics | | | 4.1% |
| CSPC Pharmaceutical Group | | | 3.5% |
| Aier Eye Hospital Group, Cl A | | | 3.4% |
| Zhangzhou Pientzehuang Pharmaceutical, Cl A | | | 3.4% |
| WuXi AppTec, Cl A | | | 3.1% |
| Akeso | | | 2.9% |
There were no material changes during the reporting period.
For additional information about the Fund, including its prospectus, financial information, holdings, and proxy voting information, visit https://kraneshares.com/kure/.
You may have consented to receive one copy of a shareholder report at your address if you and one or more individuals in your home have multiple accounts at the same address. This practice is commonly called “householding” and is intended to reduce expenses. If you wish to change your householding status or receive individual copies of your shareholder report, please contact us at (855) 857 2638 or your financial intermediary.
KraneShares Asia Pacific High Income USD Bond ETF
Principal Listing Exchange: NYSE Arca
Semi-Annual Shareholder Report - September 30, 2024
This semi-annual shareholder report contains important information about KraneShares Asia Pacific High Income USD Bond ETF (the "Fund") for the period from April 1, 2024 to September 30, 2024. You can find additional information about the Fund at https://kraneshares.com/khyb/. You can also request this information by contacting us at 1-855-857-2638. This semi-annual shareholder report describes changes to the Fund that occurred during the reporting period.
What were the Fund costs for the last six months?
(based on a hypothetical $10,000 investment)
| Fund Name | Costs of a $10,000 investment | Costs paid as a percentage of a $10,000 investment |
|---|
| KraneShares Asia Pacific High Income USD Bond ETF | $36 | 0.69% |
Key Fund Statistics as of September 30, 2024
| Total Net Assets | Number of Holdings | Total Advisory Fees Paid | Portfolio Turnover Rate |
|---|
| $18,790,000 | 74 | $54,268 | 74% |
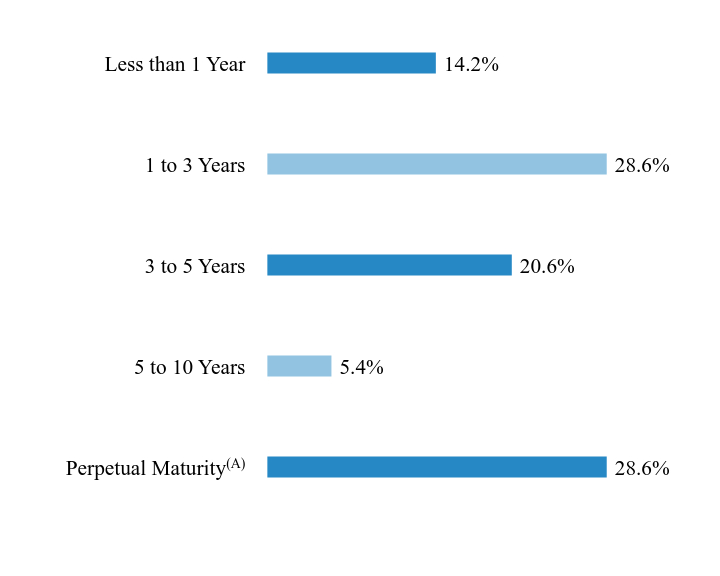
What did the Fund invest in?
Maturity WeightingsFootnote Reference*
| Value | Value |
|---|
Perpetual MaturityFootnote Reference(A) | 28.6% |
| 5 to 10 Years | 5.4% |
| 3 to 5 Years | 20.6% |
| 1 to 3 Years | 28.6% |
| Less than 1 Year | 14.2% |
| Footnote | Description |
Footnote* | Percentages are calculated based on total net assets. |
Footnote(A) | Perpetual security with no stated maturity date. |
| Holding Name | Coupon Rate | Maturity Date | Percentage of Total Net Assets |
|---|
| India Cleantech Energy | 4.700% | 08/10/26 | 3.0% |
| NWD Finance BVI, H15T5Y + 7.889% | 5.250% | —Footnote Reference(A) | 2.7% |
| Yanlord Land HK | 5.125% | 05/20/26 | 2.2% |
| Mong Duong Finance Holdings BV | 5.125% | 05/07/29 | 2.2% |
| Petron, H15T5Y + 7.574% | 5.950% | —Footnote Reference(A) | 2.1% |
| Magnum Holdings | 5.375% | 10/31/26 | 2.1% |
| Krung Thai Bank, H15T5Y + 3.530% | 4.400% | —Footnote Reference(A) | 2.1% |
| Greentown China Holdings | 5.650% | 07/13/25 | 2.1% |
| Fortune Star BVI | 5.950% | 10/19/25 | 2.1% |
| Greentown China Holdings | 4.700% | 04/29/25 | 2.1% |
| Footnote | Description |
Footnote(A) | Perpetual security with no stated maturity date. |
This is a summary of material changes made to the Fund since April 1, 2024:
· Effective August 1, 2024, the name of the Fund changed from the “KraneShares Asia Pacific High Income Bond ETF” to the “KraneShares Asia Pacific High Income USD Bond ETF”.
For additional information about the Fund, including its prospectus, financial information, holdings, and proxy voting information, visit https://kraneshares.com/khyb/.
You may have consented to receive one copy of a shareholder report at your address if you and one or more individuals in your home have multiple accounts at the same address. This practice is commonly called “householding” and is intended to reduce expenses. If you wish to change your householding status or receive individual copies of your shareholder report, please contact us at (855) 857 2638 or your financial intermediary.
KraneShares MSCI Emerging Markets ex China Index ETF
Principal Listing Exchange: NYSE Arca
Semi-Annual Shareholder Report - September 30, 2024
This semi-annual shareholder report contains important information about KraneShares MSCI Emerging Markets ex China Index ETF (the "Fund") for the period from April 1, 2024 to September 30, 2024. You can find additional information about the Fund at https://kraneshares.com/kemx/. You can also request this information by contacting us at 1-855-857-2638.
What were the Fund costs for the last six months?
(based on a hypothetical $10,000 investment)
| Fund Name | Costs of a $10,000 investment | Costs paid as a percentage of a $10,000 investment |
|---|
| KraneShares MSCI Emerging Markets ex China Index ETF | $13 | 0.24% |
Key Fund Statistics as of September 30, 2024
| Total Net Assets | Number of Holdings | Total Advisory Fees Paid | Portfolio Turnover Rate |
|---|
| $78,873,331 | 294 | $88,785 | 2% |
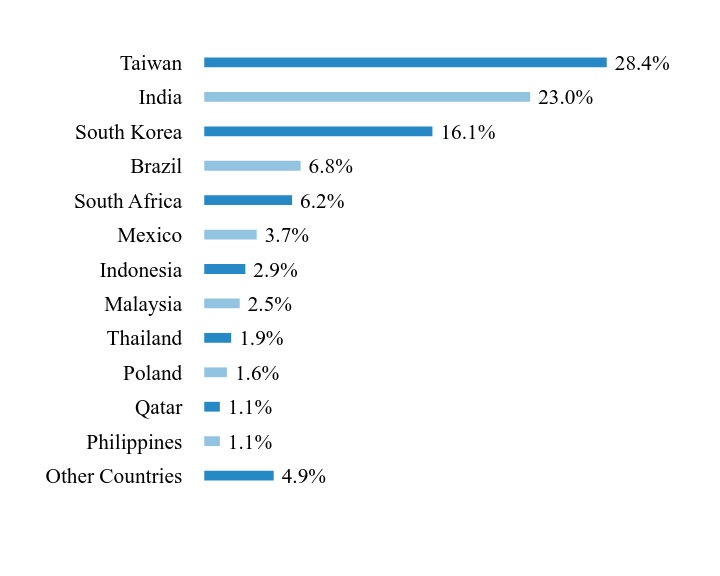
What did the Fund invest in?
Country WeightingsFootnote Reference*
| Value | Value |
|---|
| Other Countries | 4.9% |
| Philippines | 1.1% |
| Qatar | 1.1% |
| Poland | 1.6% |
| Thailand | 1.9% |
| Malaysia | 2.5% |
| Indonesia | 2.9% |
| Mexico | 3.7% |
| South Africa | 6.2% |
| Brazil | 6.8% |
| South Korea | 16.1% |
| India | 23.0% |
| Taiwan | 28.4% |
| Footnote | Description |
Footnote* | Percentages are calculated based on total net assets. |
| Holding Name | | | Percentage of Total Net Assets |
|---|
| Taiwan Semiconductor Manufacturing | | | 11.6% |
| Samsung Electronics | | | 3.9% |
| Infosys ADR | | | 2.2% |
| Hon Hai Precision Industry | | | 1.7% |
| SK Hynix | | | 1.5% |
| ICICI Bank | | | 1.5% |
| Naspers, Cl N | | | 1.4% |
| Bharti Airtel | | | 1.4% |
| HDFC Bank | | | 1.4% |
| Tata Consultancy Services | | | 1.2% |
There were no material changes during the reporting period.
For additional information about the Fund, including its prospectus, financial information, holdings, and proxy voting information, visit https://kraneshares.com/kemx/.
You may have consented to receive one copy of a shareholder report at your address if you and one or more individuals in your home have multiple accounts at the same address. This practice is commonly called “householding” and is intended to reduce expenses. If you wish to change your householding status or receive individual copies of your shareholder report, please contact us at (855) 857 2638 or your financial intermediary.
KraneShares Value Line® Dynamic Dividend Equity Index ETF
Principal Listing Exchange: NYSE Arca
Semi-Annual Shareholder Report - September 30, 2024
This semi-annual shareholder report contains important information about KraneShares Value Line® Dynamic Dividend Equity Index ETF (the "Fund") for the period from April 1, 2024 to September 30, 2024. You can find additional information about the Fund at https://kraneshares.com/kvle/. You can also request this information by contacting us at 1-855-857-2638.
What were the Fund costs for the last six months?
(based on a hypothetical $10,000 investment)
| Fund Name | Costs of a $10,000 investment | Costs paid as a percentage of a $10,000 investment |
|---|
KraneShares Value Line® Dynamic Dividend Equity Index ETF | $30 | 0.56% |
Key Fund Statistics as of September 30, 2024
| Total Net Assets | Number of Holdings | Total Advisory Fees Paid | Portfolio Turnover Rate |
|---|
| $33,171,693 | 88 | $86,685 | 44% |
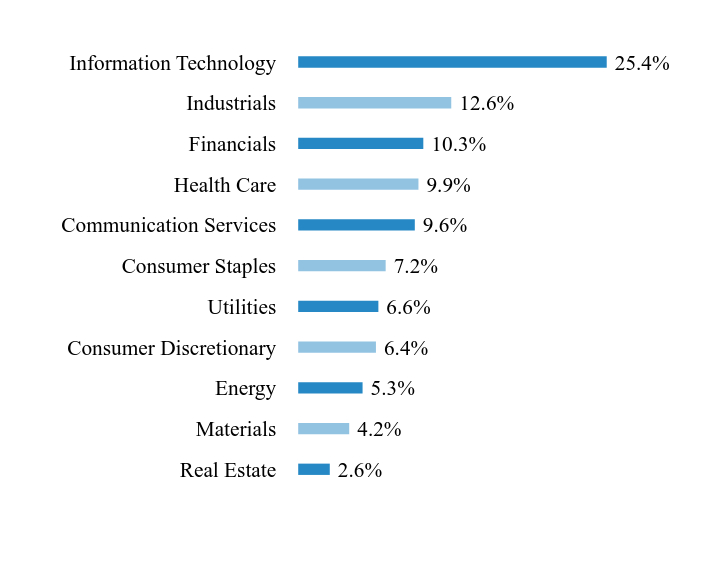
What did the Fund invest in?
Sector WeightingsFootnote Reference*
| Value | Value |
|---|
| Real Estate | 2.6% |
| Materials | 4.2% |
| Energy | 5.3% |
| Consumer Discretionary | 6.4% |
| Utilities | 6.6% |
| Consumer Staples | 7.2% |
| Communication Services | 9.6% |
| Health Care | 9.9% |
| Financials | 10.3% |
| Industrials | 12.6% |
| Information Technology | 25.4% |
| Footnote | Description |
Footnote* | Percentages are calculated based on total net assets. |
| Holding Name | | | Percentage of Total Net Assets |
|---|
| NVIDIA | | | 7.9% |
| Microsoft | | | 5.8% |
| Apple | | | 5.2% |
| Alphabet, Cl C | | | 3.5% |
| Amazon.com | | | 2.9% |
| Meta Platforms, Cl A | | | 2.7% |
| Home Depot | | | 2.3% |
| Cisco Systems | | | 2.0% |
| Texas Instruments | | | 1.8% |
| Goldman Sachs Group | | | 1.8% |
There were no material changes during the reporting period.
For additional information about the Fund, including its prospectus, financial information, holdings, and proxy voting information, visit https://kraneshares.com/kvle/.
You may have consented to receive one copy of a shareholder report at your address if you and one or more individuals in your home have multiple accounts at the same address. This practice is commonly called “householding” and is intended to reduce expenses. If you wish to change your householding status or receive individual copies of your shareholder report, please contact us at (855) 857 2638 or your financial intermediary.
KraneShares Mount Lucas Managed Futures Index Strategy ETF
Principal Listing Exchange: NYSE Arca
Semi-Annual Shareholder Report - September 30, 2024
This semi-annual shareholder report contains important information about KraneShares Mount Lucas Managed Futures Index Strategy ETF (the "Fund") for the period from April 1, 2024 to September 30, 2024. You can find additional information about the Fund at https://kfafunds.com/kmlm/. You can also request this information by contacting us at 1-855-857-2638. This semi-annual shareholder report describes changes to the Fund that occurred during the reporting period.
What were the Fund costs for the last six months?
(based on a hypothetical $10,000 investment)
| Fund Name | Costs of a $10,000 investment | Costs paid as a percentage of a $10,000 investment |
|---|
| KraneShares Mount Lucas Managed Futures Index Strategy ETF | $45 | 0.90% |
Key Fund Statistics as of September 30, 2024
| Total Net Assets | Number of Holdings | Total Advisory Fees Paid | Portfolio Turnover Rate |
|---|
| $372,045,544 | 27 | $1,406,963 | 0% |
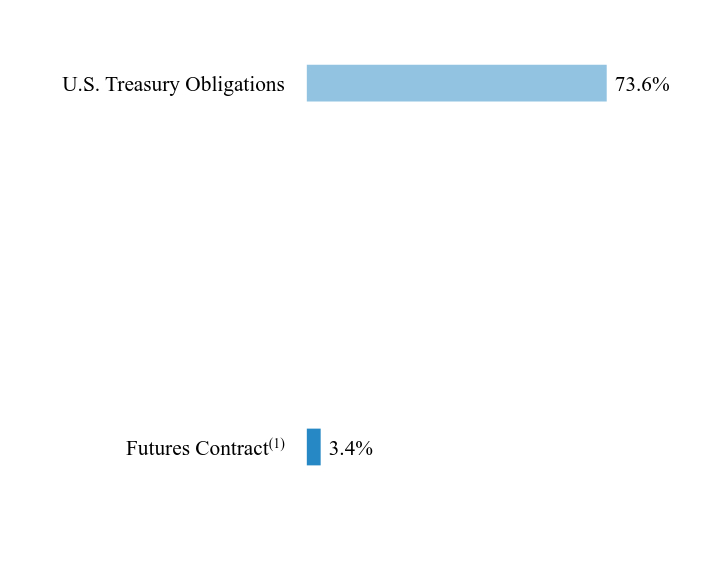
What did the Fund invest in?
Asset WeightingsFootnote Reference*
| Value | Value |
|---|
Futures ContractFootnote Reference(1) | 3.4% |
| U.S. Treasury Obligations | 73.6% |
| Footnote | Description |
Footnote* | Percentages are calculated based on total net assets. |
Footnote(1) | At market value. |
| Holding Name | | | Percentage of Total Net Assets |
|---|
| U.S. Treasury Bill, 5.18%, 10/3/2024 | | | 14.8% |
| U.S. Treasury Bill, 5.17%, 10/15/2024 | | | 14.7% |
| U.S. Treasury Bill, 5.08%, 10/29/2024 | | | 14.7% |
| U.S. Treasury Bill, 4.97%, 11/5/2024 | | | 14.7% |
| U.S. Treasury Bill, 4.58%, 11/29/2024 | | | 14.7% |
AUD Currency - Futures ContractFootnote Reference(1) | | | 0.6% |
NY Harbor ULSD - Futures ContractFootnote Reference(1) | | | 0.5% |
Soybean - Futures ContractFootnote Reference(1) | | | 0.5% |
Corn - Futures ContractFootnote Reference(1) | | | 0.4% |
| Footnote | Description |
Footnote(1) | At market value. |
This is a summary of material changes made to the Fund since April 1, 2024:
· Effective August 1, 2024, the name of the Fund changed from the “KFA Mount Lucas Managed Futures Index Strategy ETF” to the “KraneShares Mount Lucas Managed Futures Index Strategy ETF”.
For additional information about the Fund, including its prospectus, financial information, holdings, and proxy voting information, visit https://kfafunds.com/kmlm/.
You may have consented to receive one copy of a shareholder report at your address if you and one or more individuals in your home have multiple accounts at the same address. This practice is commonly called “householding” and is intended to reduce expenses. If you wish to change your householding status or receive individual copies of your shareholder report, please contact us at (855) 857 2638 or your financial intermediary.
KraneShares SSE STAR Market 50 Index ETF
Principal Listing Exchange: NYSE Arca
Semi-Annual Shareholder Report - September 30, 2024
This semi-annual shareholder report contains important information about KraneShares SSE STAR Market 50 Index ETF (the "Fund") for the period from April 1, 2024 to September 30, 2024. You can find additional information about the Fund at https://kraneshares.com/kstr/. You can also request this information by contacting us at 1-855-857-2638.
What were the Fund costs for the last six months?
(based on a hypothetical $10,000 investment)
| Fund Name | Costs of a $10,000 investment | Costs paid as a percentage of a $10,000 investment |
|---|
| KraneShares SSE STAR Market 50 Index ETF | $48 | 0.89% |
Key Fund Statistics as of September 30, 2024
| Total Net Assets | Number of Holdings | Total Advisory Fees Paid | Portfolio Turnover Rate |
|---|
| $26,618,585 | 51 | $98,334 | 12% |
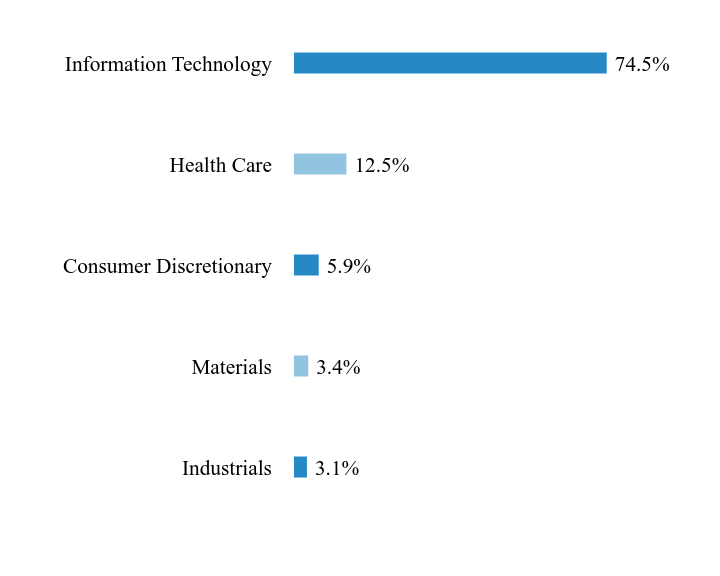
What did the Fund invest in?
Sector WeightingsFootnote Reference*
| Value | Value |
|---|
| Industrials | 3.1% |
| Materials | 3.4% |
| Consumer Discretionary | 5.9% |
| Health Care | 12.5% |
| Information Technology | 74.5% |
| Footnote | Description |
Footnote* | Percentages are calculated based on total net assets. |
| Holding Name | | | Percentage of Total Net Assets |
|---|
| Hygon Information Technology, Cl A | | | 8.8% |
| Beijing Kingsoft Office Software, Cl A | | | 5.7% |
| Montage Technology, Cl A | | | 5.6% |
| Cambricon Technologies, Cl A | | | 5.5% |
| Shenzhen Transsion Holdings, Cl A | | | 4.5% |
| Advanced Micro-Fabrication Equipment China, Cl A | | | 4.2% |
| Shanghai United Imaging Healthcare, Cl A | | | 3.9% |
| Beijing Roborock Technology, Cl A | | | 3.3% |
| Jinko Solar, Cl A | | | 3.2% |
| SUPCON Technology, Cl A | | | 2.9% |
There were no material changes during the reporting period.
For additional information about the Fund, including its prospectus, financial information, holdings, and proxy voting information, visit https://kraneshares.com/kstr/.
You may have consented to receive one copy of a shareholder report at your address if you and one or more individuals in your home have multiple accounts at the same address. This practice is commonly called “householding” and is intended to reduce expenses. If you wish to change your householding status or receive individual copies of your shareholder report, please contact us at (855) 857 2638 or your financial intermediary.
KraneShares Hang Seng TECH Index ETF
Principal Listing Exchange: NYSE Arca
Semi-Annual Shareholder Report - September 30, 2024
This semi-annual shareholder report contains important information about KraneShares Hang Seng TECH Index ETF (the "Fund") for the period from April 1, 2024 to September 30, 2024. You can find additional information about the Fund at https://kraneshares.com/ktec/. You can also request this information by contacting us at 1-855-857-2638.
What were the Fund costs for the last six months?
(based on a hypothetical $10,000 investment)
| Fund Name | Costs of a $10,000 investment | Costs paid as a percentage of a $10,000 investment |
|---|
| KraneShares Hang Seng TECH Index ETF | $41 | 0.69% |
Key Fund Statistics as of September 30, 2024
| Total Net Assets | Number of Holdings | Total Advisory Fees Paid | Portfolio Turnover Rate |
|---|
| $12,626,822 | 29 | $24,008 | 30% |
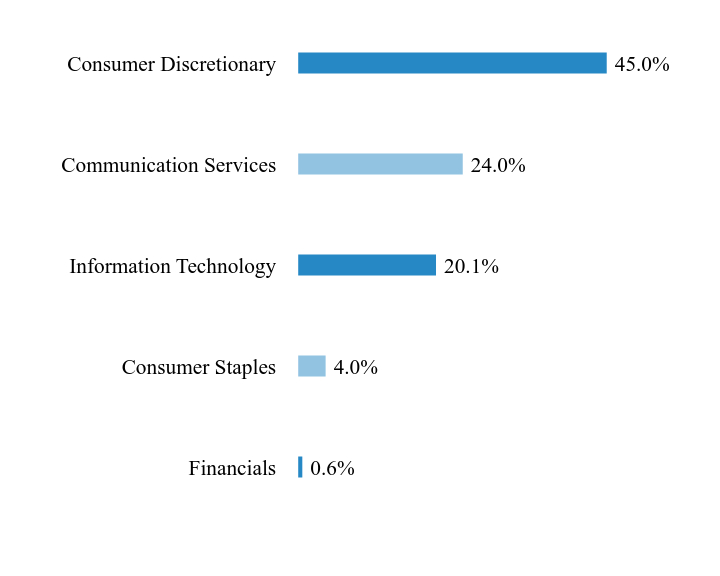
What did the Fund invest in?
Sector WeightingsFootnote Reference*
| Value | Value |
|---|
| Financials | 0.6% |
| Consumer Staples | 4.0% |
| Information Technology | 20.1% |
| Communication Services | 24.0% |
| Consumer Discretionary | 45.0% |
| Footnote | Description |
Footnote* | Percentages are calculated based on total net assets. |
| Holding Name | | | Percentage of Total Net Assets |
|---|
| JD.com, Cl A | | | 9.9% |
| Meituan, Cl B | | | 9.0% |
| Alibaba Group Holding | | | 8.5% |
| Tencent Holdings | | | 7.4% |
| Xiaomi, Cl B | | | 7.3% |
| Kuaishou Technology, Cl B | | | 4.4% |
| Li Auto, Cl A | | | 4.2% |
| Lenovo Group | | | 4.1% |
| XPeng, Cl A | | | 4.1% |
| Trip.com Group | | | 4.0% |
There were no material changes during the reporting period.
For additional information about the Fund, including its prospectus, financial information, holdings, and proxy voting information, visit https://kraneshares.com/ktec/.
You may have consented to receive one copy of a shareholder report at your address if you and one or more individuals in your home have multiple accounts at the same address. This practice is commonly called “householding” and is intended to reduce expenses. If you wish to change your householding status or receive individual copies of your shareholder report, please contact us at (855) 857 2638 or your financial intermediary.
KraneShares Dynamic Emerging Markets Strategy ETF
Principal Listing Exchange: NYSE Arca
Semi-Annual Shareholder Report - September 30, 2024
This semi-annual shareholder report contains important information about KraneShares Dynamic Emerging Markets Strategy ETF (the "Fund") for the period from April 1, 2024 to September 30, 2024. You can find additional information about the Fund at https://kraneshares.com/kem/. You can also request this information by contacting us at 1-855-857-2638.
What were the Fund costs for the last six months?
(based on a hypothetical $10,000 investment)
| Fund Name | Costs of a $10,000 investment | Costs paid as a percentage of a $10,000 investment |
|---|
| KraneShares Dynamic Emerging Markets Strategy ETF | $6 | 0.11% |
Key Fund Statistics as of September 30, 2024
| Total Net Assets | Number of Holdings | Total Advisory Fees Paid | Portfolio Turnover Rate |
|---|
| $5,081,514 | 2 | $2,164 | 1% |
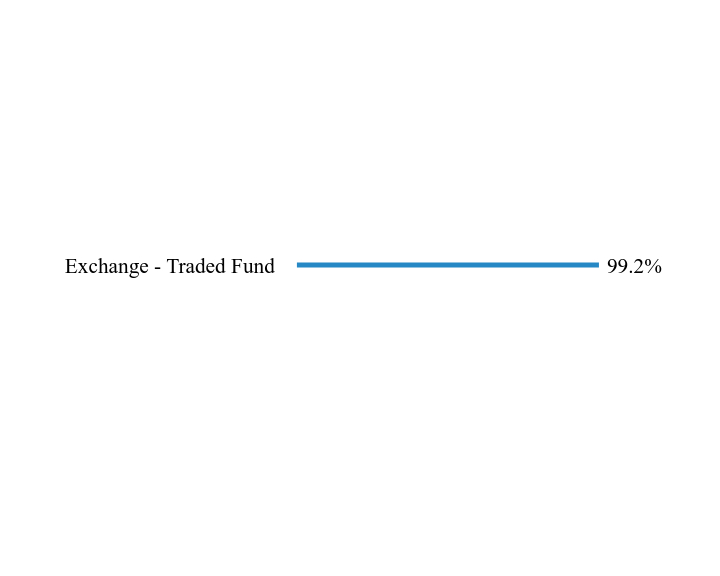
What did the Fund invest in?
Asset WeightingsFootnote Reference*
| Value | Value |
|---|
| Exchange - Traded Fund | 99.2% |
| Footnote | Description |
Footnote* | Percentages are calculated based on total net assets. |
| Holding Name | | | Percentage of Total Net Assets |
|---|
KraneShares MSCI All China Index ETFFootnote Reference** | | | 58.9% |
KraneShares MSCI Emerging Markets ex China Index ETFFootnote Reference** | | | 40.3% |
| Footnote | Description |
Footnote** | Affiliated |
There were no material changes during the reporting period.
For additional information about the Fund, including its prospectus, financial information, holdings, and proxy voting information, visit https://kraneshares.com/kem/.
You may have consented to receive one copy of a shareholder report at your address if you and one or more individuals in your home have multiple accounts at the same address. This practice is commonly called “householding” and is intended to reduce expenses. If you wish to change your householding status or receive individual copies of your shareholder report, please contact us at (855) 857 2638 or your financial intermediary.
KraneShares Global Luxury Index ETF
Principal Listing Exchange: NYSE Arca
Semi-Annual Shareholder Report - September 30, 2024
This semi-annual shareholder report contains important information about KraneShares Global Luxury Index ETF (the "Fund") for the period from April 1, 2024 to September 30, 2024. You can find additional information about the Fund at https://kraneshares.com/klxy/. You can also request this information by contacting us at 1-855-857-2638.
What were the Fund costs for the last six months?
(based on a hypothetical $10,000 investment)
| Fund Name | Costs of a $10,000 investment | Costs paid as a percentage of a $10,000 investment |
|---|
| KraneShares Global Luxury Index ETF | $34 | 0.69% |
Key Fund Statistics as of September 30, 2024
| Total Net Assets | Number of Holdings | Total Advisory Fees Paid | Portfolio Turnover Rate |
|---|
| $2,532,190 | 28 | $8,354 | 30% |
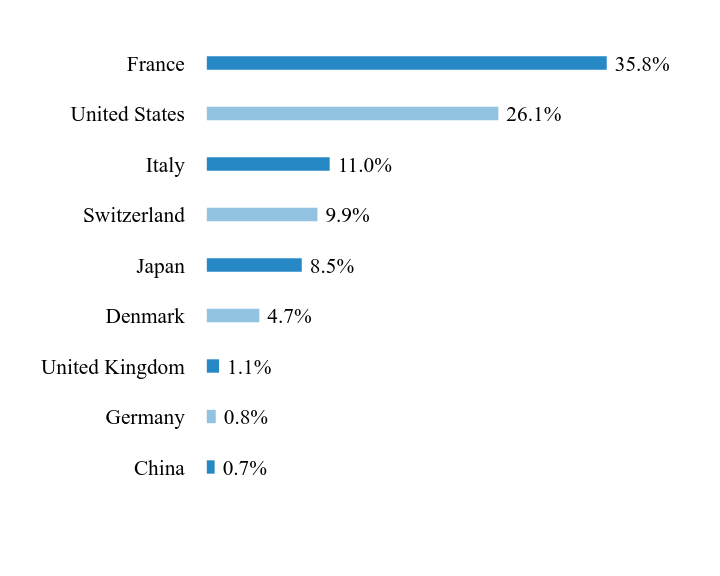
What did the Fund invest in?
Country WeightingsFootnote Reference*
| Value | Value |
|---|
| China | 0.7% |
| Germany | 0.8% |
| United Kingdom | 1.1% |
| Denmark | 4.7% |
| Japan | 8.5% |
| Switzerland | 9.9% |
| Italy | 11.0% |
| United States | 26.1% |
| France | 35.8% |
| Footnote | Description |
Footnote* | Percentages are calculated based on total net assets. |
| Holding Name | | | Percentage of Total Net Assets |
|---|
| LVMH Moet Hennessy Louis Vuitton | | | 9.2% |
| L'Oreal | | | 8.4% |
| Hermes International | | | 8.1% |
| Cie Financiere Richemont, Cl A | | | 7.8% |
| EssilorLuxottica | | | 6.5% |
| Kao | | | 5.1% |
| Deckers Outdoor | | | 4.7% |
| Pandora | | | 4.7% |
| Ferrari | | | 4.4% |
| Moncler | | | 4.1% |
There were no material changes during the reporting period.
For additional information about the Fund, including its prospectus, financial information, holdings, and proxy voting information, visit https://kraneshares.com/klxy/.
You may have consented to receive one copy of a shareholder report at your address if you and one or more individuals in your home have multiple accounts at the same address. This practice is commonly called “householding” and is intended to reduce expenses. If you wish to change your householding status or receive individual copies of your shareholder report, please contact us at (855) 857 2638 or your financial intermediary.
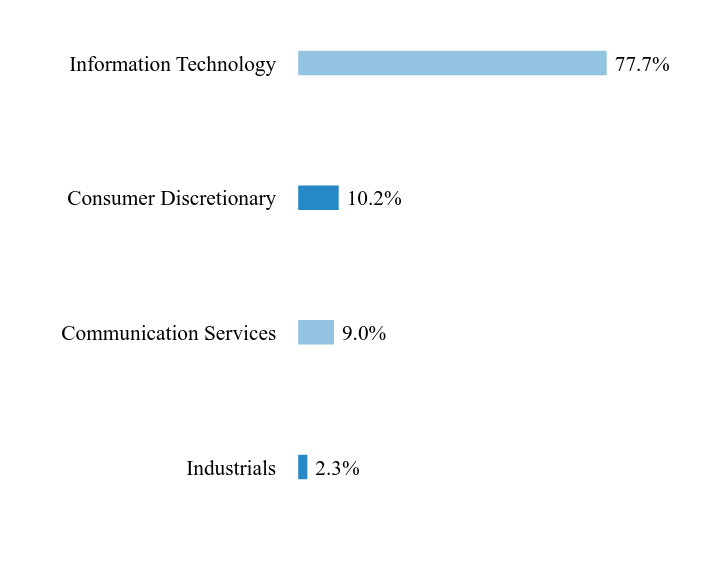
KraneShares Artificial Intelligence and Technology ETF
Principal Listing Exchange: The NASDAQ Stock Market, LLC
Semi-Annual Shareholder Report - September 30, 2024
This semi-annual shareholder report contains important information about KraneShares Artificial Intelligence and Technology ETF (the "Fund") for the period from July 17, 2024 (commencement of operations) to September 30, 2024. You can find additional information about the Fund at https://kraneshares.com/agix/. You can also request this information by contacting us at 1-855-857-2683.
What were the Fund costs for the last six months?
(based on a hypothetical $10,000 investment)
| Fund Name | Costs of a $10,000 investmentFootnote Reference* | Costs paid as a percentage of a $10,000 investment |
|---|
| KraneShares Artificial Intelligence and Technology ETF | $21 | 0.99% |
| Footnote | Description |
Footnote* | Costs shown not annualized. If the Fund had been open for the semi-annual period, costs shown would have been higher for the period ended. |
Key Fund Statistics as of September 30, 2024
| Total Net Assets | Number of Holdings | Total Advisory Fees Paid | Portfolio Turnover Rate |
|---|
| $5,081,872 | 39 | $8,597 | 8% |
What did the Fund invest in?
Sector WeightingsFootnote Reference*
| Value | Value |
|---|
| Industrials | 2.3% |
| Communication Services | 9.0% |
| Consumer Discretionary | 10.2% |
| Information Technology | 77.7% |
| Footnote | Description |
Footnote* | Percentages are calculated based on total net assets. |
| Holding Name | | | Percentage of Total Net Assets |
|---|
| Microsoft | | | 7.6% |
| NVIDIA | | | 7.3% |
| Apple | | | 5.8% |
| Amazon.com | | | 5.1% |
| Meta Platforms, Cl A | | | 4.3% |
| Broadcom | | | 3.6% |
| Taiwan Semiconductor Manufacturing ADR | | | 3.4% |
| Alphabet, Cl A | | | 3.3% |
| Tesla | | | 3.1% |
| Oracle | | | 2.5% |
There were no material changes during the reporting period.
For additional information about the Fund, including its prospectus, financial information, holdings, and proxy voting information, visit https://kraneshares.com/agix/.
You may have consented to receive one copy of a shareholder report at your address if you and one or more individuals in your home have multiple accounts at the same address. This practice is commonly called “householding” and is intended to reduce expenses. If you wish to change your householding status or receive individual copies of your shareholder report, please contact us at (855) 857 2638 or your financial intermediary.
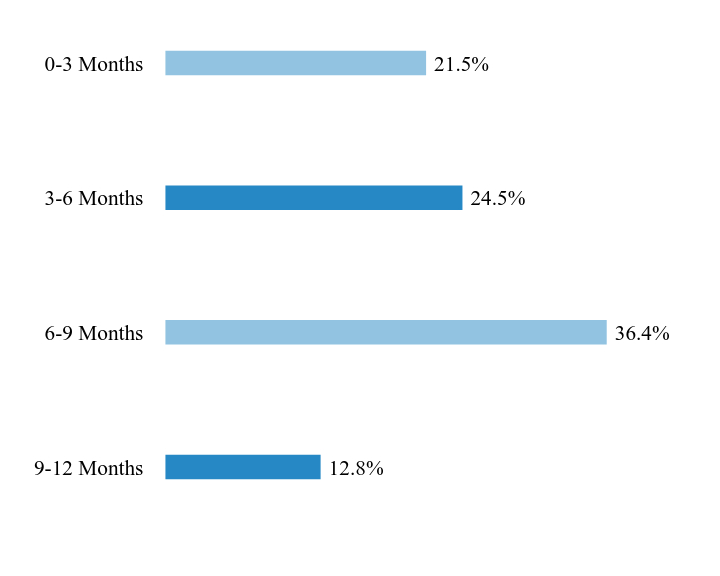
KraneShares Sustainable Ultra Short Duration Index ETF
Principal Listing Exchange: NYSE Arca
Semi-Annual Shareholder Report - September 30, 2024
This semi-annual shareholder report contains important information about KraneShares Sustainable Ultra Short Duration Index ETF (the "Fund") for the period from July 25, 2024 (commencement of operations) to September 30, 2024. You can find additional information about the Fund at https://kraneshares.com/kcsh/. You can also request this information by contacting us at 1-855-857-2638.
What were the Fund costs for the last six months?
(based on a hypothetical $10,000 investment)
| Fund Name | Costs of a $10,000 investmentFootnote Reference* | Costs paid as a percentage of a $10,000 investment |
|---|
| KraneShares Sustainable Ultra Short Duration Index ETF | $4 | 0.20% |
| Footnote | Description |
Footnote* | Costs shown not annualized. If the Fund had been open for the semi-annual period, costs shown would have been higher for the period ended. |
Key Fund Statistics as of September 30, 2024
| Total Net Assets | Number of Holdings | Total Advisory Fees Paid | Portfolio Turnover Rate |
|---|
| $299,965,645 | 257 | $57,044 | 0% |
What did the Fund invest in?
Maturity WeightingsFootnote Reference*
| Value | Value |
|---|
| 9-12 Months | 12.8% |
| 6-9 Months | 36.4% |
| 3-6 Months | 24.5% |
| 0-3 Months | 21.5% |
| Footnote | Description |
Footnote* | Percentages are calculated based on total net assets. |
| Holding Name | | | Percentage of Total Net Assets |
|---|
| Bank of Nova Scotia | | | 1.0% |
| Morgan Stanley | | | 0.9% |
| GLP Capital | | | 0.8% |
| Bank of Montreal | | | 0.8% |
| Thermo Fisher Scientific | | | 0.8% |
| Regions Financial | | | 0.8% |
| JPMorgan Chase | | | 0.8% |
| AutoZone | | | 0.8% |
| Apple | | | 0.7% |
| Bank of America | | | 0.7% |
There were no material changes during the reporting period.
For additional information about the Fund, including its prospectus, financial information, holdings, and proxy voting information, visit https://kraneshares.com/kcsh/.
You may have consented to receive one copy of a shareholder report at your address if you and one or more individuals in your home have multiple accounts at the same address. This practice is commonly called “householding” and is intended to reduce expenses. If you wish to change your householding status or receive individual copies of your shareholder report, please contact us at (855) 857 2638 or your financial intermediary.
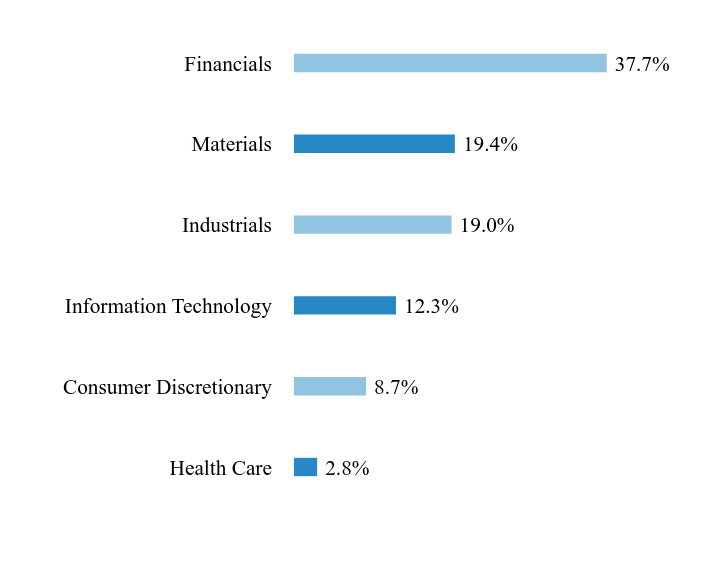
KraneShares China Alpha Index ETF
Principal Listing Exchange: NYSE Arca
Semi-Annual Shareholder Report - September 30, 2024
This semi-annual shareholder report contains important information about KraneShares China Alpha Index ETF (the "Fund") for the period from August 27, 2024 (commencement of operations) to September 30, 2024. You can find additional information about the Fund at https://kraneshares.com/kcai/. You can also request this information by contacting us at 1-855-857-2638.
What were the Fund costs for the last six months?
(based on a hypothetical $10,000 investment)
| Fund Name | Costs of a $10,000 investmentFootnote Reference* | Costs paid as a percentage of a $10,000 investment |
|---|
| KraneShares China Alpha Index ETF | $8 | 0.78% |
| Footnote | Description |
Footnote* | Costs shown not annualized. If the Fund had been open for the semi-annual period, costs shown would have been higher for the period ended. |
Key Fund Statistics as of September 30, 2024
| Total Net Assets | Number of Holdings | Total Advisory Fees Paid | Portfolio Turnover Rate |
|---|
| $8,815,812 | 38 | $4,525 | 119% |
What did the Fund invest in?
Sector WeightingsFootnote Reference*
| Value | Value |
|---|
| Health Care | 2.8% |
| Consumer Discretionary | 8.7% |
| Information Technology | 12.3% |
| Industrials | 19.0% |
| Materials | 19.4% |
| Financials | 37.7% |
| Footnote | Description |
Footnote* | Percentages are calculated based on total net assets. |
| Holding Name | | | Percentage of Total Net Assets |
|---|
| Zhongji Innolight, Cl A | | | 3.9% |
| Aluminum Corp of China, Cl A | | | 3.5% |
| Foxconn Industrial Internet, Cl A | | | 3.5% |
| COSCO SHIPPING Holdings, Cl A | | | 3.3% |
| Weichai Power, Cl A | | | 3.3% |
| Chongqing Changan Automobile, Cl A | | | 3.2% |
| Zijin Mining Group, Cl A | | | 3.2% |
| Zhongjin Gold, Cl A | | | 3.1% |
| Fuyao Glass Industry Group, Cl A | | | 3.1% |
| NAURA Technology Group, Cl A | | | 3.1% |
There were no material changes during the reporting period.
For additional information about the Fund, including its prospectus, financial information, holdings, and proxy voting information, visit https://kraneshares.com/kcai/.
You may have consented to receive one copy of a shareholder report at your address if you and one or more individuals in your home have multiple accounts at the same address. This practice is commonly called “householding” and is intended to reduce expenses. If you wish to change your householding status or receive individual copies of your shareholder report, please contact us at (855) 857 2638 or your financial intermediary.
(b) Not applicable to the Registrant.
Item 2. Code of Ethics.
Not applicable for semi-annual report.
Item 3. Audit Committee Financial Expert.
Not applicable for semi-annual report.
Item 4. Principal Accountant Fees and Services.
Not applicable for semi-annual report.
Item 5. Audit Committee of Listed Registrants.
(a) Not applicable to the Registrant.
(b) Not applicable to the Registrant.
Item 6. Investments.
(a) The Schedules of Investments and Consolidated Schedules of Investments are included as part of the Registrant’s financial statements, which is included under Item 7.
(b) Not applicable to the Registrant.
Item 7. Financial Statements and Financial Highlights for Open-End Management Investment Companies.
Financial statements and financial highlights are filed herein.
| |  |
| | Semi-Annual Financials and Other Information
KraneShares CSI China Internet ETF KraneShares Bosera MSCI China A 50 Connect Index ETF KraneShares MSCI All China Index ETF KraneShares MSCI One Belt One Road Index ETF KraneShares Emerging Markets Consumer Technology Index ETF KraneShares MSCI China Clean Technology Index ETF KraneShares Electric Vehicles and Future Mobility Index ETF KraneShares MSCI All China Health Care Index ETF KraneShares Asia Pacific High Income USD Bond ETF (formerly, KraneShares Asia Pacific High Income Bond ETF) KraneShares MSCI Emerging Markets ex China Index ETF KraneShares Value Line® Dynamic Dividend Equity Index ETF KraneShares Mount Lucas Managed Futures Index Strategy ETF (formerly, KFA Mount Lucas Managed Futures Index Strategy ETF) KraneShares SSE STAR Market 50 Index ETF KraneShares Hang Seng TECH Index ETF KraneShares Dynamic Emerging Markets Strategy ETF KraneShares Global Luxury Index ETF KraneShares Artificial Intelligence and Technology ETF KraneShares Sustainable Ultrashort Duration Index ETF KraneShares China Alpha Index ETF September 30, 2024 | | |
Table of Contents
Fund shares may only be purchased or redeemed from a Fund in Creation Unit aggregations. Investors who cannot transact in Creation Units of a Fund’s shares must buy or sell Fund shares in the secondary market at their market price, which may be at a premium or discount to a Fund’s net asset value, with the assistance of a broker. In doing so, the investor may incur brokerage commissions and may pay more than net asset value when buying Fund shares and receive less than net asset value when selling Fund shares.
Schedule of Investments (Unaudited) September 30, 2024
KraneShares CSI China Internet ETF
| | | Shares | | | Value | |
| COMMON STOCK — 99.7%‡ | | | | | | | | |
| CHINA — 99.7% | | | | | | | | |
| Communication Services — 35.8% | | | | | | | | |
| Autohome ADR | | | 2,708,620 | | | $ | 88,355,185 | |
| Baidu, Cl A* | | | 19,703,884 | | | | 267,876,427 | |
| Bilibili, Cl Z* | | | 10,440,864 | | | | 260,500,733 | |
| China Literature* | | | 18,864,400 | | | | 78,687,681 | |
| iQIYI ADR* | | | 12,106,846 | | | | 34,625,580 | |
| JOYY ADR | | | 1,358,256 | | | | 49,223,197 | |
| Kanzhun ADR | | | 11,102,117 | | | | 192,732,751 | |
| Kingsoft | | | 35,493,600 | | | | 135,028,758 | |
| Kuaishou Technology, Cl B* | | | 36,579,500 | | | | 258,305,192 | |
| NetEase | | | 12,929,605 | | | | 250,518,900 | |
| Tencent Holdings | | | 12,473,875 | | | | 713,985,816 | |
| Tencent Music Entertainment Group ADR | | | 16,577,202 | | | | 199,755,284 | |
| Weibo ADR | | | 3,658,567 | | | | 36,878,355 | |
| Zx*(A) | | | 7,918,800 | | | | 11,458,939 | |
| | | | | | | | 2,577,932,798 | |
| Consumer Discretionary — 45.8% | | | | | | | | |
| Alibaba Group Holding | | | 55,977,064 | | | | 792,723,146 | |
| JD.com, Cl A | | | 23,998,240 | | | | 516,267,260 | |
| Meituan, Cl B* | | | 29,490,048 | | | | 653,014,248 | |
| PDD Holdings ADR* | | | 3,353,671 | | | | 452,108,387 | |
| TAL Education Group ADR* | | | 18,605,596 | | | | 220,290,257 | |
| Tongcheng Travel Holdings | | | 51,155,000 | | | | 131,452,050 | |
| Trip.com Group* | | | 4,712,950 | | | | 297,915,475 | |
| Vipshop Holdings ADR | | | 15,094,420 | | | | 237,435,227 | |
| | | | | | | | 3,301,206,050 | |
| Consumer Staples — 6.6% | | | | | | | | |
| Alibaba Health Information Technology*(A) | | | 241,702,000 | | | | 166,476,434 | |
| East Buy Holding*(A) | | | 18,569,000 | | | | 47,238,293 | |
| JD Health International* | | | 48,002,950 | | | | 216,299,098 | |
| Ping An Healthcare and Technology*(A) | | | 25,063,900 | | | | 46,788,098 | |
| | | | | | | | 476,801,923 | |
| Financials — 3.8% | | | | | | | | |
| Lufax Holding ADR | | | 8,430,975 | | | | 29,424,102 | |
| Qifu Technology ADR | | | 5,963,664 | | | | 177,776,824 | |
| ZhongAn Online P&C Insurance, Cl H*(A) | | | 32,008,700 | | | | 65,356,676 | |
| | | | | | | | 272,557,602 | |
| Health Care — 0.2% | | | | | | | | |
| YSB*(A) | | | 14,130,400 | | | | 14,298,673 | |
The accompanying notes are an integral part of the financial statements.
Schedule of Investments (Unaudited) September 30, 2024
KraneShares CSI China Internet ETF (concluded)
| | | Shares | | | Value | |
| COMMON STOCK (continued) | | | | | | | | |
| Industrials — 3.3% | | | | | | | | |
| Full Truck Alliance ADR | | | 26,404,657 | | | $ | 237,905,960 | |
| | | | | | | | | |
| Real Estate — 4.2% | | | | | | | | |
| KE Holdings ADR | | | 15,304,104 | | | | 304,704,711 | |
| TOTAL CHINA | | | | | | | 7,185,407,717 | |
| | | | | | | | | |
TOTAL COMMON STOCK
(Cost $6,649,169,069) | | |
| | | |
7,185,407,717 | |
| | | | | | | | | |
| SHORT-TERM INVESTMENT — 1.1% | | | | | | | | |
| Invesco Government & Agency Portfolio, Cl Institutional, 4.840%(B)(C) | | | 77,951,273 | | | | 77,951,273 | |
TOTAL SHORT-TERM INVESTMENT
(Cost $77,951,273) | | |
| | | |
77,951,273 | |
| | | | | | | | | |
TOTAL INVESTMENTS — 100.8%
(Cost $6,727,120,342) | | |
| | | |
7,263,358,990 | |
| OTHER ASSETS LESS LIABILITIES – (0.8)% | | | | | | | (54,543,256 | ) |
| NET ASSETS - 100% | | | | | | $ | 7,208,815,734 | |
| ‡ | Industries are utilized for compliance purposes, whereas sectors are utilized for reporting. |
| * | Non-income producing security. |
| (A) | Certain securities or partial positions of certain securities are on loan at September 30, 2024. |
| (B) | The rate shown is the 7-day effective yield as of September 30, 2024. |
| (C) | This security was purchased with cash collateral held from securities on loan. The total value of such security as of September 30, 2024 was $77,951,273. |
As of September 30, 2024, all of the Fund’s investments were considered Level 1 of the fair value hierarchy, in accordance with the authoritative guidance on fair value measurements and disclosure under U.S. generally accepted accounting principles.
See “Glossary” for abbreviations.
The accompanying notes are an integral part of the financial statements.
Schedule of Investments (Unaudited) September 30, 2024
KraneShares Bosera MSCI China A 50 Connect Index ETF
| | | Shares | | | Value | |
| COMMON STOCK — 99.4%‡ | | | | | | | | |
| CHINA — 99.4% | | | | | | | | |
| Communication Services — 1.3% | | | | | | | | |
| China United Network Communications, Cl A | | | 1,889,500 | | | $ | 1,444,396 | |
| Focus Media Information Technology, Cl A | | | 858,102 | | | | 866,851 | |
| | | | | | | | 2,311,247 | |
| Consumer Discretionary — 7.0% | | | | | | | | |
| BYD, Cl A | | | 160,700 | | | | 7,056,321 | |
| Haier Smart Home, Cl A | | | 559,700 | | | | 2,571,118 | |
| Midea Group, Cl A | | | 309,600 | | | | 3,364,674 | |
| | | | | | | | 12,992,113 | |
| Consumer Staples — 12.8% | | | | | | | | |
| Foshan Haitian Flavouring & Food, Cl A | | | 194,642 | | | | 1,339,673 | |
| Inner Mongolia Yili Industrial Group, Cl A | | | 267,312 | | | | 1,110,322 | |
| Kweichow Moutai, Cl A | | | 52,789 | | | | 13,184,710 | |
| Luzhou Laojiao, Cl A | | | 61,846 | | | | 1,322,876 | |
| Muyuan Foods, Cl A* | | | 229,545 | | | | 1,518,897 | |
| Shanxi Xinghuacun Fen Wine Factory, Cl A | | | 51,216 | | | | 1,601,834 | |
| Wuliangye Yibin, Cl A | | | 162,979 | | | | 3,784,404 | |
| | | | | | | | 23,862,716 | |
| Energy — 3.7% | | | | | | | | |
| China Petroleum & Chemical, Cl A | | | 1,610,440 | | | | 1,601,546 | |
| China Shenhua Energy, Cl A | | | 327,347 | | | | 2,039,297 | |
| PetroChina, Cl A | | | 1,071,300 | | | | 1,380,713 | |
| Shaanxi Coal Industry, Cl A | | | 481,116 | | | | 1,895,963 | |
| | | | | | | | 6,917,519 | |
| Financials — 21.1% | | | | | | | | |
| Agricultural Bank of China, Cl A | | | 4,994,107 | | | | 3,425,191 | |
| Bank of China, Cl A | | | 2,060,700 | | | | 1,472,213 | |
| Bank of Communications, Cl A | | | 2,302,599 | | | | 2,434,646 | |
| Bank of Ningbo, Cl A | | | 387,418 | | | | 1,422,652 | |
| China Merchants Bank, Cl A | | | 1,210,167 | | | | 6,503,309 | |
| China Pacific Insurance Group, Cl A | | | 401,514 | | | | 2,243,175 | |
| CITIC Securities, Cl A | | | 718,421 | | | | 2,792,117 | |
| East Money Information, Cl A | | | 926,031 | | | | 2,686,008 | |
| Industrial & Commercial Bank of China, Cl A | | | 3,690,526 | | | | 3,258,836 | |
| Industrial Bank, Cl A | | | 1,218,722 | | | | 3,355,614 | |
| Ping An Bank, Cl A | | | 1,138,467 | | | | 1,986,194 | |
| Ping An Insurance Group of China, Cl A | | | 631,398 | | | | 5,150,495 | |
| Shanghai Pudong Development Bank, Cl A | | | 1,721,946 | | | | 2,492,383 | |
| | | | | | | | 39,222,833 | |
| Health Care — 6.9% | | | | | | | | |
| Jiangsu Hengrui Pharmaceuticals, Cl A | | | 679,875 | | | | 5,080,617 | |
The accompanying notes are an integral part of the financial statements.
Schedule of Investments (Unaudited) September 30, 2024
KraneShares Bosera MSCI China A 50 Connect Index ETF (continued)
| | | Shares | | | Value | |
| COMMON STOCK (continued) | | | | | | | | |
| Health Care (continued) | | | | | | | | |
| Shenzhen Mindray Bio-Medical Electronics, Cl A | | | 129,253 | | | $ | 5,411,205 | |
| Zhangzhou Pientzehuang Pharmaceutical, Cl A | | | 64,350 | | | | 2,376,720 | |
| | | | | | | | 12,868,542 | |
| Industrials — 16.0% | | | | | | | | |
| Beijing-Shanghai High Speed Railway, Cl A | | | 3,815,100 | | | | 3,292,521 | |
| China CSSC Holdings, Cl A | | | 347,500 | | | | 2,073,982 | |
| China State Construction Engineering, Cl A | | | 3,233,458 | | | | 2,855,233 | |
| Contemporary Amperex Technology, Cl A | | | 341,755 | | | | 12,300,196 | |
| COSCO SHIPPING Holdings, Cl A | | | 991,430 | | | | 2,225,481 | |
| CRRC, Cl A | | | 1,890,000 | | | | 2,206,326 | |
| NARI Technology, Cl A | | | 624,115 | | | | 2,467,514 | |
| SF Holding, Cl A | | | 374,159 | | | | 2,404,702 | |
| | | | | | | | 29,825,955 | |
| Information Technology — 14.5% | | | | | | | | |
| BOE Technology Group, Cl A | | | 6,652,745 | | | | 4,249,072 | |
| Foxconn Industrial Internet, Cl A | | | 2,384,300 | | | | 8,581,729 | |
| Hygon Information Technology, Cl A | | | 418,410 | | | | 6,174,532 | |
| Luxshare Precision Industry, Cl A | | | 1,296,650 | | | | 8,051,897 | |
| | | | | | | | 27,057,230 | |
| Materials — 10.1% | | | | | | | | |
| Wanhua Chemical Group, Cl A | | | 628,799 | | | | 8,204,715 | |
| Zijin Mining Group, Cl A | | | 4,123,692 | | | | 10,688,314 | |
| | | | | | | | 18,893,029 | |
| Real Estate — 1.2% | | | | | | | | |
| China Merchants Shekou Industrial Zone Holdings, Cl A | | | 602,500 | | | | 1,054,578 | |
| Poly Developments and Holdings Group, Cl A | | | 795,977 | | | | 1,254,475 | |
| | | | | | | | 2,309,053 | |
| Utilities — 4.8% | | | | | | | | |
| China National Nuclear Power, Cl A | | | 1,243,400 | | | | 1,980,941 | |
| China Yangtze Power, Cl A | | | 1,611,070 | | | | 6,917,427 | |
| | | | | | | | 8,898,368 | |
| TOTAL CHINA | | | | | | | 185,158,605 | |
| | | | | | | | | |
TOTAL COMMON STOCK
(Cost $156,577,733) |
|
|
|
|
|
|
185,158,605 |
|
The accompanying notes are an integral part of the financial statements.
Schedule of Investments (Unaudited) September 30, 2024
KraneShares Bosera MSCI China A 50 Connect Index ETF (concluded)
| | | Number of Rights | | | Value | |
| RIGHTS — 0.0% | | | | | | | | |
| CHINA — 0.0% | | | | | | | | |
| Health Care — 0.0% | | | | | | | | |
| Kangmei Pharma‡‡*(A) | | | 61,390 | | | $ | — | |
| TOTAL CHINA | | | | | | | — | |
| | | | | | | | | |
TOTAL RIGHTS
(Cost $–) | | | | | | | — | |
| | | | | | | | | |
TOTAL INVESTMENTS — 99.4%
(Cost $156,577,733) | | | | | | | 185,158,605 | |
| OTHER ASSETS LESS LIABILITIES – 0.6% | | | | | | | 1,202,513 | |
| NET ASSETS - 100% | | | | | | $ | 186,361,118 | |
| ‡ | Industries are utilized for compliance purposes, whereas sectors are utilized for reporting. |
| * | Non-income producing security. |
| (A) | Level 3 security in accordance with fair value hierarchy. |
| ‡‡ | Expiration date not available. |
The following summarizes the market value of the Fund’s investments used as of September 30, 2024, based on the inputs used to value them:
| Investments in Securities | | Level 1 | | | Level 2 | | | Level 3^ | | | Total | |
| Common Stock | | | | | | | | | | | | | | | | |
| China | | $ | 185,158,605 | | | $ | — | | | $ | — | | | $ | 185,158,605 | |
| Total Common Stock | | | 185,158,605 | | | | — | | | | — | | | | 185,158,605 | |
| Rights | | | — | | | | — | | | | — | ‡‡ | | | — | |
| Total Investments in Securities | | $ | 185,158,605 | | | $ | — | | | $ | — | | | $ | 185,158,605 | |
| ^ | A reconciliation of Level 3 investments, including certain disclosures related to significant inputs used in valuing Level 3 investments is only presented when the Fund has over 1% of Level 3 investments at the end of the period in relation to net assets. |
| ‡‡ | Security or securities with a market value of $0. |
Amounts designated as “—” are $0 or have been rounded to $0.
See “Glossary” for abbreviations.
The accompanying notes are an integral part of the financial statements.
Schedule of Investments (Unaudited) September 30, 2024
KraneShares MSCI All China Index ETF
| | | Shares | | | Value | |
| COMMON STOCK — 99.7%‡ | | | | | | | | |
| CHINA — 99.4% | | | | | | | | |
| Communication Services — 13.8% | | | | | | | | |
| Autohome ADR | | | 456 | | | $ | 14,875 | |
| Baidu, Cl A* | | | 5,750 | | | | 78,172 | |
| Bilibili, Cl Z* | | | 1,100 | | | | 27,445 | |
| Focus Media Information Technology, Cl A | | | 25,000 | | | | 25,255 | |
| iQIYI ADR* | | | 2,365 | | | | 6,764 | |
| Kanzhun ADR | | | 1,050 | | | | 18,228 | |
| Kingsoft | | | 12,600 | | | | 47,934 | |
| Kuaishou Technology, Cl B* | | | 6,300 | | | | 44,487 | |
| NetEase | | | 4,400 | | | | 85,253 | |
| Tencent Holdings | | | 12,658 | | | | 724,525 | |
| Tencent Music Entertainment Group ADR | | | 3,190 | | | | 38,439 | |
| | | | | | | | 1,111,377 | |
| Consumer Discretionary — 24.3% | | | | | | | | |
| Alibaba Group Holding | | | 33,224 | | | | 470,504 | |
| ANTA Sports Products | | | 4,000 | | | | 48,638 | |
| BYD, Cl A | | | 2,000 | | | | 87,820 | |
| BYD, Cl H | | | 3,000 | | | | 109,610 | |
| China Tourism Group Duty Free, Cl A | | | 2,000 | | | | 22,061 | |
| Chongqing Changan Automobile, Cl A | | | 24,338 | | | | 51,746 | |
| Fuyao Glass Industry Group, Cl A | | | 7,100 | | | | 59,043 | |
| Geely Automobile Holdings | | | 20,000 | | | | 31,361 | |
| Great Wall Motor, Cl H | | | 14,500 | | | | 27,068 | |
| Guangzhou Automobile Group, Cl H | | | 22,000 | | | | 8,639 | |
| H World Group ADR | | | 681 | | | | 25,333 | |
| Haier Smart Home, Cl A | | | 17,200 | | | | 73,358 | |
| Huayu Automotive Systems, Cl A | | | 4,000 | | | | 10,248 | |
| JD.com, Cl A | | | 5,822 | | | | 125,243 | |
| Li Auto, Cl A* | | | 3,100 | | | | 43,143 | |
| Li Ning | | | 6,500 | | | | 16,485 | |
| Meituan, Cl B* | | | 11,166 | | | | 247,250 | |
| New Oriental Education & Technology Group | | | 5,000 | | | | 39,910 | |
| NIO, Cl A* | | | 4,720 | | | | 34,242 | |
| PDD Holdings ADR* | | | 1,330 | | | | 179,297 | |
| SAIC Motor, Cl A | | | 10,157 | | | | 21,232 | |
| Shenzhou International Group Holdings | | | 3,300 | | | | 29,973 | |
| TAL Education Group ADR* | | | 2,520 | | | | 29,837 | |
| TravelSky Technology, Cl H | | | 6,000 | | | | 8,929 | |
| Trip.com Group* | | | 1,400 | | | | 88,497 | |
| Vipshop Holdings ADR | | | 1,609 | | | | 25,310 | |
| Yum China Holdings | | | 1,055 | | | | 47,496 | |
| | | | | | | | 1,962,273 | |
The accompanying notes are an integral part of the financial statements.
Schedule of Investments (Unaudited) September 30, 2024
KraneShares MSCI All China Index ETF (continued)
| | | Shares | | | Value | |
| COMMON STOCK (continued) | | | | | | | | |
| Consumer Staples — 8.5% | | | | | | | | |
| Alibaba Health Information Technology* | | | 22,000 | | | $ | 15,153 | |
| Anhui Gujing Distillery, Cl A | | | 1,200 | | | | 34,810 | |
| China Mengniu Dairy | | | 12,000 | | | | 28,890 | |
| China Resources Beer Holdings | | | 6,000 | | | | 26,263 | |
| Foshan Haitian Flavouring & Food, Cl A | | | 5,133 | | | | 35,329 | |
| Guangdong Haid Group, Cl A | | | 4,300 | | | | 29,504 | |
| Henan Shuanghui Investment & Development, Cl A | | | 4,600 | | | | 17,805 | |
| Inner Mongolia Yili Industrial Group, Cl A | | | 6,700 | | | | 27,829 | |
| Jiangsu Yanghe Distillery, Cl A | | | 1,400 | | | | 19,842 | |
| Kweichow Moutai, Cl A | | | 800 | | | | 199,810 | |
| Luzhou Laojiao, Cl A | | | 2,000 | | | | 42,780 | |
| Muyuan Foods, Cl A* | | | 7,502 | | | | 49,641 | |
| New Hope Liuhe, Cl A* | | | 11,800 | | | | 17,552 | |
| Shanxi Xinghuacun Fen Wine Factory, Cl A | | | 1,460 | | | | 45,663 | |
| Tingyi Cayman Islands Holding | | | 12,000 | | | | 17,334 | |
| Want Want China Holdings | | | 20,000 | | | | 13,750 | |
| Wuliangye Yibin, Cl A | | | 2,800 | | | | 65,016 | |
| | | | | | | | 686,971 | |
| Energy — 4.0% | | | | | | | | |
| China Oilfield Services, Cl H | | | 14,000 | | | | 12,887 | |
| China Petroleum & Chemical, Cl A | | | 40,800 | | | | 40,574 | |
| China Petroleum & Chemical, Cl H | | | 84,500 | | | | 52,653 | |
| China Shenhua Energy, Cl H | | | 10,000 | | | | 45,124 | |
| PetroChina, Cl A | | | 19,600 | | | | 25,261 | |
| PetroChina, Cl H | | | 59,984 | | | | 48,960 | |
| Shaanxi Coal Industry, Cl A | | | 10,400 | | | | 40,984 | |
| Shanxi Lu’an Environmental Energy Development, Cl A | | | 6,700 | | | | 16,897 | |
| Yankuang Energy Group, Cl H | | | 27,300 | | | | 38,591 | |
| | | | | | | | 321,931 | |
| Financials — 22.9% | | | | | | | | |
| Agricultural Bank of China, Cl A | | | 76,600 | | | | 52,536 | |
| Agricultural Bank of China, Cl H | | | 91,397 | | | | 43,066 | |
| Bank of Beijing, Cl A | | | 24,600 | | | | 20,527 | |
| Bank of China, Cl A | | | 30,400 | | | | 21,718 | |
| Bank of China, Cl H | | | 210,396 | | | | 99,408 | |
| Bank of Communications, Cl A | | | 38,200 | | | | 40,391 | |
| Bank of Communications, Cl H | | | 37,000 | | | | 28,390 | |
| Bank of Hangzhou, Cl A | | | 12,400 | | | | 24,982 | |
| Bank of Jiangsu, Cl A | | | 19,400 | | | | 23,284 | |
| Bank of Nanjing, Cl A | | | 12,300 | | | | 19,244 | |
| Bank of Ningbo, Cl A | | | 6,300 | | | | 23,134 | |
| Bank of Shanghai, Cl A | | | 16,304 | | | | 18,380 | |
| China CITIC Bank, Cl H | | | 28,000 | | | | 17,880 | |
| China Construction Bank, Cl A | | | 10,500 | | | | 11,897 | |
The accompanying notes are an integral part of the financial statements.
Schedule of Investments (Unaudited) September 30, 2024
KraneShares MSCI All China Index ETF (continued)
| | | Shares | | | Value | |
| COMMON STOCK (continued) | | | | | | | | |
| Financials (continued) | | | | | | | | |
| China Construction Bank, Cl H | | | 209,000 | | | $ | 158,213 | |
| China Everbright Bank, Cl A | | | 48,100 | | | | 24,742 | |
| China Galaxy Securities, Cl H | | | 33,500 | | | | 31,311 | |
| China Life Insurance, Cl H | | | 20,483 | | | | 41,190 | |
| China Merchants Bank, Cl A | | | 15,600 | | | | 83,833 | |
| China Merchants Bank, Cl H | | | 11,500 | | | | 57,074 | |
| China Merchants Securities, Cl A | | | 8,300 | | | | 23,055 | |
| China Minsheng Banking, Cl A | | | 44,600 | | | | 25,618 | |
| China Minsheng Banking, Cl H | | | 38,500 | | | | 15,712 | |
| China Pacific Insurance Group, Cl A | | | 6,300 | | | | 35,197 | |
| China Pacific Insurance Group, Cl H | | | 9,400 | | | | 33,885 | |
| CITIC Securities, Cl A | | | 13,845 | | | | 53,808 | |
| CITIC Securities, Cl H | | | 7,000 | | | | 18,519 | |
| East Money Information, Cl A | | | 13,700 | | | | 39,738 | |
| Everbright Securities, Cl A | | | 9,000 | | | | 24,755 | |
| GF Securities, Cl A | | | 8,800 | | | | 20,998 | |
| Guosen Securities, Cl A | | | 9,500 | | | | 16,058 | |
| Guotai Junan Securities, Cl A(A) | | | 7,300 | | | | 15,333 | |
| Haitong Securities, Cl A(A) | | | 11,000 | | | | 15,163 | |
| Huatai Securities, Cl A | | | 10,400 | | | | 26,154 | |
| Huatai Securities, Cl H | | | 8,000 | | | | 12,895 | |
| Huaxia Bank, Cl A | | | 16,200 | | | | 17,198 | |
| Industrial & Commercial Bank of China, Cl A | | | 58,600 | | | | 51,745 | |
| Industrial & Commercial Bank of China, Cl H | | | 144,441 | | | | 86,283 | |
| Industrial Bank, Cl A | | | 17,500 | | | | 48,184 | |
| Industrial Securities, Cl A | | | 24,169 | | | | 23,552 | |
| New China Life Insurance, Cl A | | | 3,500 | | | | 23,214 | |
| New China Life Insurance, Cl H | | | 4,800 | | | | 14,986 | |
| Orient Securities, Cl A | | | 12,300 | | | | 19,526 | |
| People’s Insurance Group of China, Cl H | | | 47,452 | | | | 22,665 | |
| PICC Property & Casualty, Cl H | | | 25,510 | | | | 37,834 | |
| Ping An Bank, Cl A | | | 17,391 | | | | 30,341 | |
| Ping An Insurance Group of China, Cl A | | | 8,900 | | | | 72,600 | |
| Ping An Insurance Group of China, Cl H | | | 16,500 | | | | 106,531 | |
| Qifu Technology ADR | | | 500 | | | | 14,905 | |
| Shanghai Pudong Development Bank, Cl A | | | 25,000 | | | | 36,186 | |
| Shenwan Hongyuan Group, Cl A | | | 28,700 | | | | 23,457 | |
| | | | | | | | 1,847,295 | |
| Health Care — 4.0% | | | | | | | | |
| Beijing Tong Ren Tang, Cl A | | | 1,844 | | | | 11,082 | |
| Changchun High-Tech Industry Group, Cl A | | | 1,200 | | | | 18,842 | |
| CSPC Pharmaceutical Group | | | 39,520 | | | | 30,782 | |
| Genscript Biotech* | | | 12,000 | | | | 21,536 | |
| Guangzhou Baiyunshan Pharmaceutical Holdings, Cl A | | | 2,800 | | | | 12,266 | |
The accompanying notes are an integral part of the financial statements.
Schedule of Investments (Unaudited) September 30, 2024
KraneShares MSCI All China Index ETF (continued)
| | | Shares | | | Value | |
| COMMON STOCK (continued) | | | | | | | | |
| Health Care (continued) | | | | | | | | |
| Huadong Medicine, Cl A | | | 2,580 | | | $ | 12,899 | |
| Innovent Biologics* | | | 2,500 | | | | 15,159 | |
| Jiangsu Hengrui Pharmaceuticals, Cl A | | | 4,916 | | | | 36,737 | |
| Shanghai Fosun Pharmaceutical Group, Cl A | | | 3,400 | | | | 13,442 | |
| Shanghai Pharmaceuticals Holding, Cl A | | | 6,600 | | | | 19,945 | |
| Shenzhen Mindray Bio-Medical Electronics, Cl A | | | 1,000 | | | | 41,865 | |
| Sinopharm Group, Cl H | | | 5,600 | | | | 14,996 | |
| Wuxi Biologics Cayman* | | | 16,000 | | | | 36,048 | |
| Yunnan Baiyao Group, Cl A | | | 1,840 | | | | 16,037 | |
| Zhangzhou Pientzehuang Pharmaceutical, Cl A | | | 600 | | | | 22,161 | |
| | | | | | | | 323,797 | |
| Industrials — 6.6% | | | | | | | | |
| AECC Aviation Power, Cl A | | | 3,400 | | | | 20,059 | |
| China Eastern Airlines, Cl A* | | | 21,400 | | | | 12,659 | |
| China Energy Engineering, Cl A | | | 69,737 | | | | 24,014 | |
| China Merchants Port Holdings | | | 15,998 | | | | 25,499 | |
| China Railway Group, Cl H | | | 23,000 | | | | 12,081 | |
| China Southern Airlines, Cl A* | | | 20,100 | | | | 18,783 | |
| CITIC | | | 20,780 | | | | 24,559 | |
| Contemporary Amperex Technology, Cl A | | | 3,100 | | | | 111,573 | |
| COSCO SHIPPING Holdings, Cl A | | | 21,420 | | | | 48,082 | |
| Daqin Railway, Cl A | | | 13,600 | | | | 13,331 | |
| Fosun International | | | 15,000 | | | | 9,617 | |
| Metallurgical Corp of China, Cl A | | | 35,600 | | | | 16,990 | |
| Power Construction Corp of China, Cl A | | | 20,400 | | | | 16,440 | |
| Sany Heavy Industry, Cl A | | | 11,800 | | | | 31,832 | |
| SF Holding, Cl A | | | 3,900 | | | | 25,065 | |
| Shanghai International Airport, Cl A | | | 1,800 | | | | 9,881 | |
| Shanghai International Port Group, Cl A | | | 15,000 | | | | 13,931 | |
| Weichai Power, Cl A | | | 15,088 | | | | 34,213 | |
| Zhejiang Chint Electrics, Cl A | | | 3,300 | | | | 10,722 | |
| Zhuzhou CRRC Times Electric, Cl H | | | 2,700 | | | | 10,671 | |
| Zoomlion Heavy Industry Science and Technology, Cl A | | | 14,100 | | | | 15,271 | |
| ZTO Express Cayman | | | 1,200 | | | | 30,265 | |
| | | | | | | | 535,538 | |
| Information Technology — 4.7% | | | | | | | | |
| BOE Technology Group, Cl A | | | 41,900 | | | | 26,761 | |
| Iflytek, Cl A | | | 2,800 | | | | 17,779 | |
| Kingdee International Software Group* | | | 14,000 | | | | 16,221 | |
| Lenovo Group | | | 28,000 | | | | 38,211 | |
| LONGi Green Energy Technology, Cl A | | | 8,429 | | | | 21,148 | |
| Luxshare Precision Industry, Cl A | | | 10,274 | | | | 63,799 | |
| Sunny Optical Technology Group | | | 2,600 | | | | 19,247 | |
| Unigroup Guoxin Microelectronics, Cl A | | | 2,019 | | | | 17,993 | |
The accompanying notes are an integral part of the financial statements.
Schedule of Investments (Unaudited) September 30, 2024
KraneShares MSCI All China Index ETF (continued)
| | | Shares | | | Value | |
| COMMON STOCK (continued) | | | | | | | | |
| Information Technology (continued) | | | | | | | | |
| Xiaomi, Cl B* | | | 37,400 | | | $ | 108,336 | |
| Yonyou Network Technology, Cl A* | | | 4,625 | | | | 7,600 | |
| Zhongji Innolight, Cl A | | | 1,000 | | | | 22,127 | |
| ZTE, Cl H | | | 6,600 | | | | 17,079 | |
| | | | | | | | 376,301 | |
| Materials — 4.3% | | | | | | | | |
| Anhui Conch Cement, Cl A | | | 4,600 | | | | 17,181 | |
| Anhui Conch Cement, Cl H | | | 6,000 | | | | 17,651 | |
| Baoshan Iron & Steel, Cl A | | | 24,900 | | | | 24,691 | |
| China National Building Material, Cl H | | | 16,000 | | | | 7,045 | |
| China Northern Rare Earth Group High-Tech, Cl A | | | 9,200 | | | | 27,119 | |
| CMOC Group, Cl H | | | 48,000 | | | | 47,150 | |
| Ganfeng Lithium Group, Cl A | | | 2,720 | | | | 13,397 | |
| Inner Mongolia BaoTou Steel Union, Cl A* | | | 56,000 | | | | 13,843 | |
| Rongsheng Petrochemical, Cl A | | | 10,950 | | | | 16,193 | |
| Shandong Hualu Hengsheng Chemical, Cl A | | | 4,740 | | | | 17,738 | |
| Tianqi Lithium, Cl A | | | 2,040 | | | | 10,260 | |
| Wanhua Chemical Group, Cl A | | | 2,500 | | | | 32,621 | |
| Zhejiang Huayou Cobalt, Cl A | | | 2,104 | | | | 8,871 | |
| Zhejiang NHU, Cl A | | | 6,132 | | | | 19,775 | |
| Zijin Mining Group, Cl A | | | 17,000 | | | | 44,063 | |
| Zijin Mining Group, Cl H | | | 12,000 | | | | 27,283 | |
| | | | | | | | 344,881 | |
| Real Estate — 2.5% | | | | | | | | |
| China Merchants Shekou Industrial Zone Holdings, Cl A | | | 8,000 | | | | 14,003 | |
| China Overseas Land & Investment | | | 14,839 | | | | 30,413 | |
| China Resources Land | | | 12,214 | | | | 45,051 | |
| China Vanke, Cl A* | | | 9,143 | | | | 12,698 | |
| China Vanke, Cl H* | | | 21,700 | | | | 20,813 | |
| Country Garden Holdings*(A) | | | 79,612 | | | | 2,983 | |
| KE Holdings ADR | | | 1,875 | | | | 37,331 | |
| Longfor Group Holdings | | | 8,500 | | | | 16,458 | |
| Poly Developments and Holdings Group, Cl A | | | 14,500 | | | | 22,852 | |
| | | | | | | | 202,602 | |
| Utilities — 3.8% | | | | | | | | |
| China Gas Holdings | | | 13,200 | | | | 12,287 | |
| China Longyuan Power Group, Cl H | | | 14,000 | | | | 12,707 | |
| China Resources Gas Group | | | 6,700 | | | | 27,042 | |
| China Resources Power Holdings | | | 12,000 | | | | 32,597 | |
| China Yangtze Power, Cl A | | | 18,700 | | | | 80,292 | |
| ENN Energy Holdings | | | 2,482 | | | | 19,188 | |
| Guangdong Investment | | | 14,000 | | | | 9,426 | |
| Huadian Power International, Cl A | | | 44,400 | | | | 38,001 | |
The accompanying notes are an integral part of the financial statements.
Schedule of Investments (Unaudited) September 30, 2024
KraneShares MSCI All China Index ETF (continued)
| | | Shares | | | Value | |
| COMMON STOCK (continued) | | | | | | | | |
| Utilities (continued) | | | | | | | | |
| Huaneng Power International, Cl H | | | 39,077 | | | $ | 23,997 | |
| Kunlun Energy | | | 14,000 | | | | 14,455 | |
| Sichuan Chuantou Energy, Cl A | | | 11,800 | | | | 31,782 | |
| | | | | | | | 301,774 | |
| TOTAL CHINA | | | | | | | 8,014,740 | |
| | | | | | | | | |
| HONG KONG — 0.3% | | | | | | | | |
| Health Care — 0.3% | | | | | | | | |
| Sino Biopharmaceutical | | | 39,500 | | | | 18,968 | |
| TOTAL HONG KONG | | | | | | | 18,968 | |
| | | | | | | | | |
TOTAL COMMON STOCK
(Cost $8,322,761) | | | | | | | 8,033,708 | |
| | | Number of Rights | | | | | |
| RIGHTS — 0.0% | | | | | | | | |
| CHINA — 0.0% | | | | | | | | |
| Health Care — 0.0% | | | | | | | | |
| Kangmei Pharma‡‡*(A) | | | 446 | | | | — | |
| TOTAL CHINA | | | | | | | — | |
| | | | | | | | | |
TOTAL RIGHTS
(Cost $–) |
|
|
|
|
|
|
— |
|
| | | | | | | | | |
TOTAL INVESTMENTS — 99.7%
(Cost $8,322,761) |
|
|
|
|
|
|
8,033,708 |
|
| OTHER ASSETS LESS LIABILITIES – 0.3% | | | | | | | 27,956 | |
| NET ASSETS - 100% | | | | | | $ | 8,061,664 | |
| ‡ | Industries are utilized for compliance purposes, whereas sectors are utilized for reporting. |
| * | Non-income producing security. |
| ‡‡ | Expiration date not available. |
| (A) | Level 3 security in accordance with fair value hierarchy. |
The accompanying notes are an integral part of the financial statements.
Schedule of Investments (Unaudited) September 30, 2024
KraneShares MSCI All China Index ETF (concluded)
The following summarizes the market value of the Fund’s investments used as of September 30, 2024, based on the inputs used to value them:
| Investments in Securities | | Level 1 | | | Level 2 | | | Level 3^ | | | Total | |
| Common Stock | | | | | | | | | | | | | | | | |
| China | | | | | | | | | | | | | | | | |
| Communication Services | | $ | 1,111,377 | | | $ | — | | | $ | — | | | $ | 1,111,377 | |
| Consumer Discretionary | | | 1,962,273 | | | | — | | | | — | | | | 1,962,273 | |
| Consumer Staples | | | 686,971 | | | | — | | | | — | | | | 686,971 | |
| Energy | | | 321,931 | | | | — | | | | — | | | | 321,931 | |
| Financials | | | 1,816,799 | | | | — | | | | 30,496 | | | | 1,847,295 | |
| Health Care | | | 323,797 | | | | — | | | | — | | | | 323,797 | |
| Industrials | | | 535,538 | | | | — | | | | — | | | | 535,538 | |
| Information Technology | | | 376,301 | | | | — | | | | — | | | | 376,301 | |
| Materials | | | 344,881 | | | | — | | | | — | | | | 344,881 | |
| Real Estate | | | 199,619 | | | | — | | | | 2,983 | | | | 202,602 | |
| Utilities | | | 301,774 | | | | — | | | | — | | | | 301,774 | |
| Hong Kong | | | 18,968 | | | | — | | | | — | | | | 18,968 | |
| Total Common Stock | | | 8,000,229 | | | | — | | | | 33,479 | | | | 8,033,708 | |
| Rights | | | — | | | | — | | | | — | ‡‡ | | | — | |
| Total Investments in Securities | | $ | 8,000,229 | | | $ | — | | | $ | 33,479 | | | $ | 8,033,708 | |
| ^ | A reconciliation of Level 3 investments, including certain disclosures related to significant inputs used in valuing Level 3 investments is only presented when the Fund has over 1% of Level 3 investments at the end of the period in relation to net assets. |
| ‡‡ | Security or securities with a market value of $0. |
Amounts designated as “—” are $0 or have been rounded to $0.
See “Glossary” for abbreviations.
The accompanying notes are an integral part of the financial statements.
Schedule of Investments (Unaudited) September 30, 2024
KraneShares MSCI One Belt One Road Index ETF
| | | Shares | | | Value | |
| COMMON STOCK — 99.9%‡ | | | | | | | | |
| CHINA — 47.6% | | | | | | | | |
| Energy — 2.9% | | | | | | | | |
| China Petroleum & Chemical, Cl H | | | 142,000 | | | $ | 88,481 | |
| CNOOC Energy Technology & Services, Cl A | | | 11,800 | | | | 7,655 | |
| Offshore Oil Engineering, Cl A | | | 7,700 | | | | 6,403 | |
| | | | | | | | 102,539 | |
| Financials — 4.9% | | | | | | | | |
| Bank of Changsha, Cl A | | | 7,200 | | | | 8,611 | |
| Bank of Chengdu, Cl A | | | 6,600 | | | | 14,853 | |
| Bank of Hangzhou, Cl A | | | 10,300 | | | | 20,751 | |
| Bank of Jiangsu, Cl A | | | 32,155 | | | | 38,593 | |
| Bank of Nanjing, Cl A | | | 17,891 | | | | 27,992 | |
| Bank of Ningbo, Cl A | | | 11,746 | | | | 43,133 | |
| Bank of Suzhou, Cl A | | | 6,900 | | | | 7,976 | |
| Chongqing Rural Commercial Bank, Cl A | | | 15,200 | | | | 11,815 | |
| | | | | | | | 173,724 | |
| Industrials — 17.8% | | | | | | | | |
| Beijing New Building Materials, Cl A | | | 3,008 | | | | 14,175 | |
| Beijing-Shanghai High Speed Railway, Cl A | | | 86,600 | | | | 74,738 | |
| China Communications Services, Cl H | | | 16,000 | | | | 8,672 | |
| China Energy Engineering, Cl A | | | 56,600 | | | | 19,490 | |
| China Merchants Expressway Network & Technology Holdings, Cl A | | | 10,700 | | | | 19,248 | |
| China Railway Group, Cl H | | | 24,500 | | | | 12,869 | |
| China State Construction Engineering, Cl A | | | 71,800 | | | | 63,401 | |
| China XD Electric, Cl A | | | 8,600 | | | | 10,703 | |
| CRRC, Cl H | | | 26,000 | | | | 17,004 | |
| Daqin Railway, Cl A | | | 31,932 | | | | 31,299 | |
| Dongfang Electric, Cl A | | | 4,900 | | | | 11,062 | |
| Goldwind Science & Technology, Cl A | | | 6,100 | | | | 8,733 | |
| Goneo Group, Cl A | | | 1,050 | | | | 12,491 | |
| Gotion High-tech, Cl A | | | 3,200 | | | | 10,562 | |
| Jiangsu Expressway, Cl H | | | 8,000 | | | | 8,106 | |
| Jiangsu Zhongtian Technology, Cl A | | | 6,100 | | | | 13,501 | |
| Liaoning Port, Cl A | | | 32,900 | | | | 7,004 | |
| Metallurgical Corp of China, Cl A | | | 32,800 | | | | 15,653 | |
| NARI Technology, Cl A | | | 13,752 | | | | 54,370 | |
| Ningbo Deye Technology, Cl A | | | 1,100 | | | | 15,981 | |
| Ningbo Orient Wires & Cables, Cl A | | | 1,200 | | | | 9,460 | |
| Ningbo Sanxing Medical Electric, Cl A | | | 2,400 | | | | 11,965 | |
| Power Construction Corp of China, Cl A | | | 30,200 | | | | 24,337 | |
| Shanghai Electric Group, Cl A* | | | 22,200 | | | | 14,338 | |
| Shanghai International Port Group, Cl A | | | 12,210 | | | | 11,340 | |
| Shenzhen Inovance Technology, Cl A | | | 2,450 | | | | 21,862 | |
The accompanying notes are an integral part of the financial statements.
Schedule of Investments (Unaudited) September 30, 2024
KraneShares MSCI One Belt One Road Index ETF (continued)
| | | Shares | | | Value | |
| COMMON STOCK (continued) | | | | | | | | |
| Industrials (continued) | | | | | | | | |
| Sichuan Road & Bridge, Cl A | | | 10,400 | | | $ | 10,447 | |
| Sieyuan Electric, Cl A | | | 1,400 | | | | 14,783 | |
| TBEA, Cl A | | | 8,767 | | | | 18,340 | |
| Tian Di Science & Technology, Cl A | | | 7,300 | | | | 6,801 | |
| Yangzijiang Shipbuilding Holdings | | | 17,300 | | | | 33,062 | |
| Zhejiang Expressway, Cl H | | | 12,000 | | | | 8,404 | |
| Zhejiang Weixing New Building Materials, Cl A | | | 3,200 | | | | 6,840 | |
| Zhuzhou CRRC Times Electric, Cl H | | | 2,800 | | | | 11,067 | |
| | | | | | | | 632,108 | |
| Materials — 3.7% | | | | | | | | |
| Anhui Conch Cement, Cl H | | | 7,500 | | | | 22,063 | |
| Beijing Oriental Yuhong Waterproof Technology, Cl A | | | 2,300 | | | | 4,532 | |
| China National Building Material, Cl H | | | 27,000 | | | | 11,888 | |
| China Northern Rare Earth Group High-Tech, Cl A | | | 6,224 | | | | 18,347 | |
| China Rare Earth Resources And Technology, Cl A | | | 1,800 | | | | 7,281 | |
| Henan Shenhuo Coal Industry & Electricity Power, Cl A | | | 4,000 | | | | 11,477 | |
| Jinduicheng Molybdenum, Cl A | | | 5,600 | | | | 9,522 | |
| Shanjin International Gold, Cl A | | | 5,100 | | | | 13,561 | |
| Western Mining, Cl A | | | 4,200 | | | | 11,384 | |
| Xiamen Tungsten, Cl A | | | 2,500 | | | | 7,473 | |
| Yunnan Chihong Zinc & Germanium, Cl A | | | 9,200 | | | | 7,532 | |
| Yunnan Tin, Cl A | | | 2,900 | | | | 6,754 | |
| | | | | | | | 131,814 | |
| Utilities — 18.3% | | | | | | | | |
| Beijing Enterprises Holdings | | | 3,000 | | | | 10,776 | |
| CGN Power, Cl H | | | 63,000 | | | | 24,332 | |
| China Gas Holdings | | | 15,800 | | | | 14,707 | |
| China Longyuan Power Group, Cl H | | | 19,000 | | | | 17,245 | |
| China National Nuclear Power, Cl A | | | 32,800 | | | | 52,256 | |
| China Power International Development | | | 26,000 | | | | 12,418 | |
| China Resources Gas Group | | | 5,400 | | | | 21,795 | |
| China Resources Power Holdings | | | 12,635 | | | | 34,322 | |
| China Three Gorges Renewables Group, Cl A | | | 50,200 | | | | 34,788 | |
| China Yangtze Power, Cl A | | | 43,100 | | | | 185,058 | |
| Datang International Power Generation, Cl A | | | 21,500 | | | | 9,124 | |
| ENN Energy Holdings | | | 4,700 | | | | 36,335 | |
| ENN Natural Gas, Cl A | | | 4,500 | | | | 13,233 | |
| GD Power Development, Cl A | | | 31,100 | | | | 24,307 | |
| Huadian Power International, Cl A | | | 14,842 | | | | 12,703 | |
| Huaneng Power International, Cl H | | | 25,000 | | | | 15,352 | |
| Kunlun Energy | | | 24,000 | | | | 24,780 | |
| SDIC Power Holdings, Cl A | | | 13,106 | | | | 31,741 | |
| Shanghai Electric Power, Cl A | | | 5,000 | | | | 6,908 | |
| Shenergy, Cl A | | | 8,519 | | | | 10,395 | |
The accompanying notes are an integral part of the financial statements.
Schedule of Investments (Unaudited) September 30, 2024
KraneShares MSCI One Belt One Road Index ETF (continued)
| | | Shares | | | Value | |
| COMMON STOCK (continued) | | | | | | | | |
| Utilities (continued) | | | | | | | | |
| Shenzhen Energy Group, Cl A | | | 8,900 | | | $ | 8,889 | |
| Sichuan Chuantou Energy, Cl A | | | 8,484 | | | | 22,851 | |
| Wintime Energy Group, Cl A* | | | 38,600 | | | | 7,391 | |
| Zhejiang Zheneng Electric Power, Cl A | | | 19,700 | | | | 18,944 | |
| | | | | | | | 650,650 | |
| TOTAL CHINA | | | | | | | 1,690,835 | |
| | | | | | | | | |
| INDIA — 4.3% | | | | | | | | |
| Energy — 0.6% | | | | | | | | |
| Great Eastern Shipping | | | 1,432 | | | | 20,514 | |
| | | | | | | | | |
| Industrials — 1.3% | | | | | | | | |
| AIA Engineering | | | 595 | | | | 30,789 | |
| GMM Pfaudler | | | 473 | | | | 8,073 | |
| MTAR Technologies* | | | 279 | | | | 5,813 | |
| | | | | | | | 44,675 | |
| Materials — 2.4% | | | | | | | | |
| Navin Fluorine International | | | 426 | | | | 17,494 | |
| PI Industries | | | 1,087 | | | | 60,390 | |
| Vinati Organics | | | 361 | | | | 8,988 | |
| | | | | | | | 86,872 | |
| TOTAL INDIA | | | | | | | 152,061 | |
| | | | | | | | | |
| INDONESIA — 6.9% | | | | | | | | |
| Energy — 2.0% | | | | | | | | |
| Adaro Energy Indonesia | | | 207,000 | | | | 52,092 | |
| Indo Tambangraya Megah | | | 5,600 | | | | 9,792 | |
| Medco Energi Internasional | | | 90,300 | | | | 7,545 | |
| | | | | | | | 69,429 | |
| Materials — 4.9% | | | | | | | | |
| Amman Mineral Internasional* | | | 93,800 | | | | 57,464 | |
| Chandra Asri Pacific | | | 111,900 | | | | 62,639 | |
| Indah Kiat Pulp & Paper | | | 35,400 | | | | 20,225 | |
| Merdeka Copper Gold* | | | 140,800 | | | | 25,296 | |
| Pabrik Kertas Tjiwi Kimia | | | 19,500 | | | | 9,724 | |
| | | | | | | | 175,348 | |
| TOTAL INDONESIA | | | | | | | 244,777 | |
| | | | | | | | | |
| ISRAEL — 4.8% | | | | | | | | |
| Industrials — 3.1% | | | | | | | | |
| Elbit Systems | | | 382 | | | | 76,077 | |
| ZIM Integrated Shipping Services | | | 1,383 | | | | 35,488 | |
| | | | | | | | 111,565 | |
The accompanying notes are an integral part of the financial statements.
Schedule of Investments (Unaudited) September 30, 2024
KraneShares MSCI One Belt One Road Index ETF (continued)
| | | Shares | | | Value | |
| COMMON STOCK (continued) | | | | | | | | |
| Materials — 1.7% | | | | | | | | |
| ICL Group | | | 11,101 | | | $ | 47,392 | |
| Israel | | | 53 | | | | 11,556 | |
| | | | | | | | 58,948 | |
| TOTAL ISRAEL | | | | | | | 170,513 | |
| | | | | | | | | |
| KAZAKHSTAN — 1.0% | | | | | | | | |
| Energy — 1.0% | | | | | | | | |
| NAC Kazatomprom JSC GDR | | | 930 | | | | 33,912 | |
| | | | | | | | 33,912 | |
| Materials — 0.0% | | | | | | | | |
| Solidcore Resources*(A) | | | 7,154 | | | | — | |
| TOTAL KAZAKHSTAN | | | | | | | 33,912 | |
| | | | | | | | | |
| KUWAIT — 9.3% | | | | | | | | |
| Financials — 9.3% | | | | | | | | |
| Kuwait Finance House | | | 140,419 | | | | 329,370 | |
| TOTAL KUWAIT | | | | | | | 329,370 | |
| | | | | | | | | |
| MALAYSIA — 2.4% | | | | | | | | |
| Industrials — 0.8% | | | | | | | | |
| Pentamaster | | | 7,000 | | | | 5,942 | |
| Sime Darby | | | 38,800 | | | | 23,147 | |
| | | | | | | | 29,089 | |
| Materials — 1.6% | | | | | | | | |
| Petronas Chemicals Group | | | 41,100 | | | | 56,215 | |
| TOTAL MALAYSIA | | | | | | | 85,304 | |
| | | | | | | | | |
| PHILIPPINES — 1.7% | | | | | | | | |
| Industrials — 1.7% | | | | | | | | |
| Ayala | | | 3,540 | | | | 42,420 | |
| JG Summit | | | 37,842 | | | | 18,773 | |
| TOTAL PHILIPPINES | | | | | | | 61,193 | |
| | | | | | | | | |
| POLAND — 2.3% | | | | | | | | |
| Materials — 2.3% | | | | | | | | |
| KGHM Polska Miedz | | | 2,006 | | | | 83,324 | |
| TOTAL POLAND | | | | | | | 83,324 | |
| | | | | | | | | |
| RUSSIA — 0.0% | | | | | | | | |
| Energy — 0.0% | | | | | | | | |
| Rosneft Oil PJSC(A)(B) | | | 33,666 | | | | — | |
| Sovcomflot PJSC(A)(B) | | | 9,110 | | | | — | |
The accompanying notes are an integral part of the financial statements.
Schedule of Investments (Unaudited) September 30, 2024
KraneShares MSCI One Belt One Road Index ETF (continued)
| | | Shares | | | Value | |
| COMMON STOCK (continued) | | | | | | | | |
| Energy (continued) | | | | | | | | |
| Surgutneftegas PJSC(A)(B) | | | 143,400 | | | $ | — | |
| | | | | | | | — | |
| Materials — 0.0% | | | | | | | | |
| GMK Norilskiy Nickel PAO(A)(B) | | | 123,900 | | | | — | |
| Segezha Group PJSC*(A)(B) | | | 78,500 | | | | — | |
| | | | | | | | — | |
| TOTAL RUSSIA | | | | | | | — | |
| | | | | | | | | |
| SINGAPORE — 10.0% | | | | | | | | |
| Financials — 7.4% | | | | | | | | |
| Oversea-Chinese Banking | | | 22,312 | | | | 262,801 | |
| | | | | | | | | |
| Industrials — 2.6% | | | | | | | | |
| Singapore Airlines | | | 9,900 | | | | 52,512 | |
| Singapore Technologies Engineering | | | 10,400 | | | | 37,803 | |
| | | | | | | | 90,315 | |
| TOTAL SINGAPORE | | | | | | | 353,116 | |
| | | | | | | | | |
| SOUTH AFRICA — 2.7% | | | | | | | | |
| Materials — 2.7% | | | | | | | | |
| Impala Platinum Holdings* | | | 12,980 | | | | 72,882 | |
| Kumba Iron Ore | | | 918 | | | | 21,362 | |
| TOTAL SOUTH AFRICA | | | | | | | 94,244 | |
| | | | | | | | | |
| THAILAND — 4.2% | | | | | | | | |
| Energy — 4.2% | | | | | | | | |
| PTT | | | 141,800 | | | | 149,832 | |
| TOTAL THAILAND | | | | | | | 149,832 | |
| | | | | | | | | |
| TÜRKIYE — 2.0% | | | | | | | | |
| Industrials — 2.0% | | | | | | | | |
| Otokar Otomotiv Ve Savunma Sanayi A.S | | | 517 | | | | 6,661 | |
| Turk Hava Yollari AO* | | | 7,914 | | | | 65,975 | |
| TOTAL TÜRKIYE | | | | | | | 72,636 | |
| | | | | | | | | |
| UNITED ARAB EMIRATES — 0.7% | | | | | | | | |
| Industrials — 0.7% | | | | | | | | |
| Air Arabia PJSC | | | 31,930 | | | | 23,819 | |
| TOTAL UNITED ARAB EMIRATES | | | | | | | 23,819 | |
| | | | | | | | | |
TOTAL COMMON STOCK
(Cost $4,012,961) |
|
|
|
|
|
|
3,544,936 |
|
The accompanying notes are an integral part of the financial statements.
Schedule of Investments (Unaudited) September 30, 2024
KraneShares MSCI One Belt One Road Index ETF (continued)
| | | Shares | | | Value | |
| PREFERRED STOCK — 0.0% | | | | | | | | |
| RUSSIA — 0.0% | | | | | | | | |
| Energy — 0.0% | | | | | | | | |
| Surgutneftegas PJSC(A)(B)(C) | | | 136,600 | | | $ | — | |
| | | | | | | | | |
TOTAL PREFERRED STOCK
(Cost $74,846) |
|
|
|
|
|
|
— |
|
| | | | | | | | | |
TOTAL INVESTMENTS — 99.9%
(Cost $4,087,807) |
|
|
|
|
|
|
3,544,936 |
|
| OTHER ASSETS LESS LIABILITIES – 0.1% | | | | | | | 3,474 | |
| NET ASSETS - 100% | | | | | | $ | 3,548,410 | |
| ‡ | Industries are utilized for compliance purposes, whereas sectors are utilized for reporting. |
| * | Non-income producing security. |
| (A) | Level 3 security in accordance with fair value hierarchy. |
| (B) | Due to the financial uncertainty surrounding Russia and its markets, and the inability to liquidate the positions due to market closures and restrictions, the Russian securities have been determined to be worthless. |
| (C) | Currently, no stated interest rate. |
The following summarizes the market value of the Fund’s investments used as of September 30, 2024, based on the inputs used to value them:
| Investments in Securities | | Level 1 | | | Level 2 | | | Level 3^ | | | Total | |
| Common Stock | | | | | | | | | | | | | | | | |
| China | | $ | 1,690,835 | | | $ | — | | | $ | — | | | $ | 1,690,835 | |
| India | | | 152,061 | | | | — | | | | — | | | | 152,061 | |
| Indonesia | | | 244,777 | | | | — | | | | — | | | | 244,777 | |
| Israel | | | 170,513 | | | | — | | | | — | | | | 170,513 | |
| Kazakhstan | | | | | | | | | | | | | | | | |
| Energy | | | 33,912 | | | | — | | | | — | | | | 33,912 | |
| Materials | | | — | | | | — | | | | — | ‡‡ | | | — | |
| Kuwait | | | 329,370 | | | | — | | | | — | | | | 329,370 | |
| Malaysia | | | 85,304 | | | | — | | | | — | | | | 85,304 | |
| Philippines | | | 61,193 | | | | — | | | | — | | | | 61,193 | |
| Poland | | | 83,324 | | | | — | | | | — | | | | 83,324 | |
| Russia | | | — | | | | — | | | | — | ‡‡ | | | — | |
| Singapore | | | 353,116 | | | | — | | | | — | | | | 353,116 | |
| South Africa | | | 94,244 | | | | — | | | | — | | | | 94,244 | |
| Thailand | | | 149,832 | | | | — | | | | — | | | | 149,832 | |
| Türkiye | | | 72,636 | | | | — | | | | — | | | | 72,636 | |
| United Arab Emirates | | | 23,819 | | | | — | | | | — | | | | 23,819 | |
| Total Common Stock | | | 3,544,936 | | | | — | | | | — | | | | 3,544,936 | |
| Preferred Stock | | | | | | | | | | | | | | | | |
| Russia | | | — | | | | — | | | | — | ‡‡ | | | — | |
| Total Preferred Stock | | | — | | | | — | | | | — | | | | — | |
| Total Investments in Securities | | $ | 3,544,936 | | | $ | — | | | $ | — | | | $ | 3,544,936 | |
The accompanying notes are an integral part of the financial statements.
Schedule of Investments (Unaudited) September 30, 2024
KraneShares MSCI One Belt One Road Index ETF (concluded)
| ^ | A reconciliation of Level 3 investments, including certain disclosures related to significant inputs used in valuing Level 3 investments is only presented when the Fund has over 1% of Level 3 investments at the end of the period in relation to net assets. |
| ‡‡ | Security or securities with a market value of $0. |
Amounts designated as “—” are $0 or have been rounded to $0.
See “Glossary” for abbreviations.
The accompanying notes are an integral part of the financial statements.
Schedule of Investments (Unaudited) September 30, 2024
KraneShares Emerging Markets Consumer Technology Index ETF
| | | Shares | | | Value | |
| COMMON STOCK — 100.2%‡ | | | | | | | | |
| AUSTRALIA — 0.6% | | | | | | | | |
| Consumer Discretionary — 0.6% | | | | | | | | |
| IDP Education | | | 9,889 | | | $ | 109,082 | |
| TOTAL AUSTRALIA | | | | | | | 109,082 | |
| | | | | | | | | |
| BRAZIL — 2.7% | | | | | | | | |
| Consumer Discretionary — 2.1% | | | | | | | | |
| MercadoLibre* | | | 176 | | | | 361,145 | |
| | | | | | | | | |
| Information Technology — 0.6% | | | | | | | | |
| TOTVS | | | 20,400 | | | | 106,986 | |
| TOTAL BRAZIL | | | | | | | 468,131 | |
| | | | | | | | | |
| CHINA — 51.4% | | | | | | | | |
| Communication Services — 16.0% | | | | | | | | |
| Baidu, Cl A* | | | 34,414 | | | | 467,862 | |
| Bilibili, Cl Z* | | | 23,680 | | | | 590,819 | |
| Kuaishou Technology, Cl B* | | | 70,600 | | | | 498,540 | |
| NetEase | | | 32,200 | | | | 623,894 | |
| Tencent Holdings | | | 10,475 | | | | 599,573 | |
| | | | | | | | 2,780,688 | |
| Consumer Discretionary — 21.0% | | | | | | | | |
| Alibaba Group Holding | | | 47,400 | | | | 671,258 | |
| JD.com, Cl A | | | 37,675 | | | | 810,491 | |
| Meituan, Cl B* | | | 32,498 | | | | 719,610 | |
| PDD Holdings ADR* | | | 5,323 | | | | 717,594 | |
| Tongcheng Travel Holdings | | | 54,400 | | | | 139,791 | |
| Trip.com Group* | | | 7,400 | | | | 467,770 | |
| Vipshop Holdings ADR | | | 8,184 | | | | 128,734 | |
| | | | | | | | 3,655,248 | |
| Consumer Staples — 7.9% | | | | | | | | |
| Alibaba Health Information Technology* | | | 978,000 | | | | 673,614 | |
| JD Health International* | | | 118,150 | | | | 532,379 | |
| Ping An Healthcare and Technology*(A) | | | 85,200 | | | | 159,047 | |
| | | | | | | | 1,365,040 | |
| Information Technology — 6.5% | | | | | | | | |
| GDS Holdings, Cl A* | | | 162,200 | | | | 456,269 | |
| Hua Hong Semiconductor | | | 54,000 | | | | 145,298 | |
| Kingdee International Software Group* | | | 463,000 | | | | 536,466 | |
| | | | | | | | 1,138,033 | |
| TOTAL CHINA | | | | | | | 8,939,009 | |
The accompanying notes are an integral part of the financial statements.
Schedule of Investments (Unaudited) September 30, 2024
KraneShares Emerging Markets Consumer Technology Index ETF (continued)
| | | Shares | | | Value | |
| COMMON STOCK (continued) | | | | | | | | |
| FINLAND — 2.1% | | | | | | | | |
| Information Technology — 2.1% | | | | | | | | |
| Nokia | | | 84,093 | | | $ | 368,274 | |
| TOTAL FINLAND | | | | | | | 368,274 | |
| | | | | | | | | |
| GREECE — 0.6% | | | | | | | | |
| Consumer Discretionary — 0.6% | | | | | | | | |
| OPAP | | | 6,078 | | | | 108,262 | |
| TOTAL GREECE | | | | | | | 108,262 | |
| | | | | | | | | |
| INDIA — 5.2% | | | | | | | | |
| Consumer Discretionary — 4.0% | | | | | | | | |
| FSN E-Commerce Ventures* | | | 137,757 | | | | 321,554 | |
| Zomato* | | | 110,927 | | | | 361,765 | |
| | | | | | | | 683,319 | |
| Financials — 1.2% | | | | | | | | |
| One 97 Communications* | | | 13,635 | | | | 111,991 | |
| PB Fintech* | | | 5,105 | | | | 98,684 | |
| | | | | | | | 210,675 | |
| TOTAL INDIA | | | | | | | 893,994 | |
| | | | | | | | | |
| JAPAN — 2.1% | | | | | | | | |
| Communication Services — 2.1% | | | | | | | | |
| Nexon | | | 18,600 | | | | 367,930 | |
| TOTAL JAPAN | | | | | | | 367,930 | |
| | | | | | | | | |
| RUSSIA — 0.0% | | | | | | | | |
| Communication Services — 0.0% | | | | | | | | |
| VK GDR*(B)(C) | | | 49,503 | | | | — | |
| | | | | | | | | |
| Consumer Discretionary — 0.0% | | | | | | | | |
| Ozon Holdings PLC ADR*(B)(C) | | | 58,005 | | | | — | |
| | | | | | | | | |
| Industrials — 0.0% | | | | | | | | |
| HeadHunter Group PLC ADR*(B)(C) | | | 11,746 | | | | — | |
| TOTAL RUSSIA | | | | | | | — | |
| | | | | | | | | |
| SINGAPORE — 3.5% | | | | | | | | |
| Communication Services — 3.5% | | | | | | | | |
| Sea ADR* | | | 6,394 | | | | 602,826 | |
| TOTAL SINGAPORE | | | | | | | 602,826 | |
The accompanying notes are an integral part of the financial statements.
Schedule of Investments (Unaudited) September 30, 2024
KraneShares Emerging Markets Consumer Technology Index ETF (continued)
| | | Shares | | | Value | |
| COMMON STOCK (continued) | | | | | | | | |
| SOUTH AFRICA — 3.5% | | | | | | | | |
| Consumer Discretionary — 3.5% | | | | | | | | |
| Naspers, Cl N | | | 2,518 | | | $ | 612,956 | |
| TOTAL SOUTH AFRICA | | | | | | | 612,956 | |
| | | | | | | | | |
| SOUTH KOREA — 16.6% | | | | | | | | |
| Communication Services — 11.1% | | | | | | | | |
| Kakao | | | 13,979 | | | | 386,435 | |
| Kakao Games* | | | 8,592 | | | | 114,980 | |
| Krafton* | | | 1,486 | | | | 389,199 | |
| NAVER | | | 2,993 | | | | 387,714 | |
| NCSoft | | | 2,751 | | | | 401,806 | |
| Netmarble* | | | 2,532 | | | | 115,205 | |
| Pearl Abyss* | | | 4,414 | | | | 130,290 | |
| | | | | | | | 1,925,629 | |
| Consumer Discretionary — 2.2% | | | | | | | | |
| Coupang, Cl A* | | | 15,385 | | | | 377,702 | |
| | | | | | | | | |
| Information Technology — 3.3% | | | | | | | | |
| SK Hynix | | | 4,285 | | | | 572,120 | |
| TOTAL SOUTH KOREA | | | | | | | 2,875,451 | |
| | | | | | | | | |
| TAIWAN — 11.3% | | | | | | | | |
| Consumer Discretionary — 0.7% | | | | | | | | |
| momo.com | | | 9,765 | | | | 121,575 | |
| | | | | | | | | |
| Information Technology — 10.6% | | | | | | | | |
| Nanya Technology* | | | 256,000 | | | | 383,031 | |
| Powerchip Semiconductor Manufacturing* | | | 173,000 | | | | 118,079 | |
| Taiwan Semiconductor Manufacturing | | | 18,000 | | | | 544,326 | |
| United Microelectronics | | | 213,000 | | | | 362,106 | |
| Vanguard International Semiconductor | | | 31,000 | | | | 101,386 | |
| VisEra Technologies | | | 12,000 | | | | 109,965 | |
| Win Semiconductors* | | | 27,000 | | | | 116,458 | |
| WPG Holdings | | | 45,000 | | | | 106,647 | |
| | | | | | | | 1,841,998 | |
| TOTAL TAIWAN | | | | | | | 1,963,573 | |
| | | | | | | | | |
| URUGUAY — 0.6% | | | | | | | | |
| Financials — 0.6% | | | | | | | | |
| Dlocal, Cl A*(A) | | | 12,638 | | | | 101,104 | |
| TOTAL URUGUAY | | | | | | | 101,104 | |
| | | | | | | | | |
TOTAL COMMON STOCK
(Cost $17,039,346) | | | | | | | 17,410,592 | |
The accompanying notes are an integral part of the financial statements.
Schedule of Investments (Unaudited) September 30, 2024
KraneShares Emerging Markets Consumer Technology Index ETF (continued)
| | | Shares | | | Value | |
| SHORT-TERM INVESTMENT — 1.3% | | | | | | | | |
| Invesco Government & Agency Portfolio, Cl Institutional, 4.840%(D)(E) | | | 222,095 | | | $ | 222,095 | |
TOTAL SHORT-TERM INVESTMENT
(Cost $222,095) | | | | | | | 222,095 | |
| | | | | | | | | |
TOTAL INVESTMENTS — 101.5%
(Cost $17,261,441) | | | | | | | 17,632,687 | |
| OTHER ASSETS LESS LIABILITIES – (1.5)% | | | | | | | (256,433 | ) |
| NET ASSETS - 100% | | | | | | $ | 17,376,254 | |
| ‡ | Industries are utilized for compliance purposes, whereas sectors are utilized for reporting. |
| * | Non-income producing security. |
| (A) | Certain securities or partial positions of certain securities are on loan at September 30, 2024. |
| (B) | Level 3 security in accordance with fair value hierarchy. |
| (C) | Due to the financial uncertainty surrounding Russia and its markets, and the inability to liquidate the positions due to market closures and restrictions, the Russian securities have been determined to be worthless. |
| (D) | The rate shown is the 7-day effective yield as of September 30, 2024. |
| (E) | This security was purchased with cash collateral held from securities on loan. The total value of such security as of September 30, 2024 was $222,095. |
The accompanying notes are an integral part of the financial statements.
Schedule of Investments (Unaudited) September 30, 2024
KraneShares Emerging Markets Consumer Technology Index ETF (concluded)
The following summarizes the market value of the Fund’s investments used as of September 30, 2024, based on the inputs used to value them:
| Investments in Securities | | Level 1 | | | Level 2 | | | Level 3^ | | | Total | |
| Common Stock | | | | | | | | | | | | | | | | |
| Australia | | $ | 109,082 | | | $ | — | | | $ | — | | | $ | 109,082 | |
| Brazil | | | 468,131 | | | | — | | | | — | | | | 468,131 | |
| China | | | 8,939,009 | | | | — | | | | — | | | | 8,939,009 | |
| Finland | | | 368,274 | | | | — | | | | — | | | | 368,274 | |
| Greece | | | 108,262 | | | | — | | | | — | | | | 108,262 | |
| India | | | 893,994 | | | | — | | | | — | | | | 893,994 | |
| Japan | | | 367,930 | | | | — | | | | — | | | | 367,930 | |
| Russia | | | | | | | | | | | | | | | | |
| Communication Services | | | — | | | | — | | | | — | ‡‡ | | | — | |
| Consumer Discretionary | | | — | | | | — | | | | — | ‡‡ | | | — | |
| Industrials | | | — | | | | — | | | | — | ‡‡ | | | — | |
| Singapore | | | 602,826 | | | | — | | | | — | | | | 602,826 | |
| South Africa | | | 612,956 | | | | — | | | | — | | | | 612,956 | |
| South Korea | | | 2,875,451 | | | | — | | | | — | | | | 2,875,451 | |
| Taiwan | | | 1,963,573 | | | | — | | | | — | | | | 1,963,573 | |
| Uruguay | | | 101,104 | | | | — | | | | — | | | | 101,104 | |
| Total Common Stock | | | 17,410,592 | | | | — | | | | — | | | | 17,410,592 | |
| Short-Term Investment | | | 222,095 | | | | — | | | | — | | | | 222,095 | |
| Total Investments in Securities | | $ | 17,632,687 | | | $ | — | | | $ | — | | | $ | 17,632,687 | |
| ^ | A reconciliation of Level 3 investments, including certain disclosures related to significant inputs used in valuing Level 3 investments is only presented when the Fund has over 1% of Level 3 investments at the end of the period in relation to net assets. |
| ‡‡ | Security or securities with a market value of $0. |
Amounts designated as “—” are $0 or have been rounded to $0.
See “Glossary” for abbreviations.
The accompanying notes are an integral part of the financial statements.
Schedule of Investments (Unaudited) September 30, 2024
KraneShares MSCI China Clean Technology Index ETF
| | | Shares | | | Value | |
| COMMON STOCK — 99.8%‡ | | | | | | | | |
| CHINA — 98.9% | | | | | | | | |
| Consumer Discretionary — 39.6% | | | | | | | | |
| BYD, Cl A | | | 13,400 | | | $ | 588,393 | |
| BYD, Cl H | | | 128,000 | | | | 4,676,717 | |
| Li Auto, Cl A* | | | 389,500 | | | | 5,420,657 | |
| NIO, Cl A* | | | 539,630 | | | | 3,914,792 | |
| Seres Group, Cl A* | | | 76,400 | | | | 987,060 | |
| Tianneng Power International | | | 558,000 | | | | 568,955 | |
| XPeng, Cl A* | | | 578,400 | | | | 3,942,875 | |
| Yadea Group Holdings | | | 1,026,694 | | | | 1,826,702 | |
| Zhejiang Leapmotor Technology* | | | 417,200 | | | | 1,799,318 | |
| | | | | | | | 23,725,469 | |
| Industrials — 21.1% | | | | | | | | |
| Beijing-Shanghai High Speed Railway, Cl A | | | 2,490,900 | | | | 2,149,705 | |
| China Conch Venture Holdings | | | 1,204,500 | | | | 1,189,381 | |
| China Everbright Environment Group | | | 3,097,216 | | | | 1,495,276 | |
| Contemporary Amperex Technology, Cl A | | | 125,550 | | | | 4,518,699 | |
| Ginlong Technologies, Cl A | | | 20,350 | | | | 241,921 | |
| Goldwind Science & Technology, Cl A | | | 173,635 | | | | 248,594 | |
| Gotion High-tech, Cl A | | | 90,000 | | | | 297,057 | |
| Ningbo Deye Technology, Cl A | | | 32,132 | | | | 466,830 | |
| Sungrow Power Supply, Cl A | | | 101,260 | | | | 1,440,774 | |
| Zhejiang Chint Electrics, Cl A | | | 108,800 | | | | 353,513 | |
| Zhejiang Weiming Environment Protection, Cl A | | | 86,200 | | | | 267,886 | |
| | | | | | | | 12,669,636 | |
| Information Technology — 16.0% | | | | | | | | |
| China Railway Signal & Communication, Cl A | | | 366,045 | | | | 328,981 | |
| Flat Glass Group, Cl A | | | 96,400 | | | | 278,512 | |
| JA Solar Technology, Cl A | | | 167,568 | | | | 324,426 | |
| Jinko Solar, Cl A | | | 503,348 | | | | 633,622 | |
| JinkoSolar Holding ADR | | | 29,052 | | | | 779,175 | |
| Kingdee International Software Group* | | | 2,539,000 | | | | 2,941,873 | |
| Kingsoft Cloud Holdings* | | | 1,760,000 | | | | 385,195 | |
| LONGi Green Energy Technology, Cl A | | | 382,646 | | | | 960,080 | |
| Sanan Optoelectronics, Cl A | | | 250,000 | | | | 445,086 | |
| Tuya ADR | | | 190,745 | | | | 314,729 | |
| Xinyi Solar Holdings | | | 4,097,588 | | | | 2,226,176 | |
| | | | | | | | 9,617,855 | |
| Utilities — 22.2% | | | | | | | | |
| Beijing Enterprises Water Group | | | 3,376,500 | | | | 1,051,964 | |
| CGN Power, Cl A | | | 455,200 | | | | 292,685 | |
| CGN Power, Cl H | | | 4,958,000 | | | | 1,914,902 | |
| China Datang Renewable Power, Cl H | | | 1,996,000 | | | | 549,912 | |
| China Longyuan Power Group, Cl H | | | 2,374,800 | | | | 2,155,435 | |
The accompanying notes are an integral part of the financial statements.
Schedule of Investments (Unaudited) September 30, 2024
KraneShares MSCI China Clean Technology Index ETF (concluded)
| | | Shares | | | Value | |
| COMMON STOCK (continued) | | | | | | | | |
| Utilities (continued) | | | | | | | | |
| China National Nuclear Power, Cl A | | | 953,200 | | | $ | 1,518,604 | |
| China Three Gorges Renewables Group, Cl A | | | 1,440,000 | | | | 997,907 | |
| China Yangtze Power, Cl A | | | 702,400 | | | | 3,015,884 | |
| SDIC Power Holdings, Cl A | | | 376,600 | | | | 912,086 | |
| Sichuan Chuantou Energy, Cl A | | | 245,800 | | | | 662,032 | |
| Xinyi Energy Holdings | | | 1,734,000 | | | | 214,308 | |
| | | | | | | | 13,285,719 | |
| TOTAL CHINA | | | | | | | 59,298,679 | |
| | | | | | | | | |
| HONG KONG — 0.9% | | | | | | | | |
| Utilities — 0.9% | | | | | | | | |
| Canvest Environmental Protection Group | | | 409,000 | | | | 235,369 | |
| Concord New Energy Group | | | 4,430,000 | | | | 325,086 | |
| TOTAL HONG KONG | | | | | | | 560,455 | |
| | | | | | | | | |
TOTAL COMMON STOCK
(Cost $54,032,640) | | | | | | | 59,859,134 | |
| | | | | | | | | |
TOTAL INVESTMENTS — 99.8%
(Cost $54,032,640) | | | | | | | 59,859,134 | |
| OTHER ASSETS LESS LIABILITIES – 0.2% | | | | | | | 130,954 | |
| NET ASSETS - 100% | | | | | | $ | 59,990,088 | |
| ‡ | Industries are utilized for compliance purposes, whereas sectors are utilized for reporting. |
| * | Non-income producing security. |
As of September 30, 2024, all of the Fund’s investments were considered Level 1 of the fair value hierarchy, in accordance with the authoritative guidance on fair value measurements and disclosure under U.S. generally accepted accounting principles.
See “Glossary” for abbreviations.
The accompanying notes are an integral part of the financial statements.
Schedule of Investments (Unaudited) September 30, 2024
KraneShares Electric Vehicles and Future Mobility Index ETF
| | | Shares | | | Value | |
| COMMON STOCK — 95.0%‡ | | | | | | | | |
| ARGENTINA — 1.9% | | | | | | | | |
| Materials — 1.9% | | | | | | | | |
| Arcadium Lithium* | | | 589,780 | | | $ | 1,680,873 | |
| TOTAL ARGENTINA | | | | | | | 1,680,873 | |
| | | | | | | | | |
| AUSTRALIA — 7.8% | | | | | | | | |
| Materials — 7.8% | | | | | | | | |
| IGO | | | 436,496 | | | | 1,774,522 | |
| Lynas Rare Earths* | | | 387,609 | | | | 2,156,610 | |
| Mineral Resources | | | 23,185 | | | | 837,043 | |
| Pilbara Minerals*(A) | | | 922,941 | | | | 2,093,752 | |
| TOTAL AUSTRALIA | | | | | | | 6,861,927 | |
| | | | | | | | | |
| BELGIUM — 1.7% | | | | | | | | |
| Materials — 1.7% | | | | | | | | |
| Umicore | | | 116,616 | | | | 1,517,536 | |
| TOTAL BELGIUM | | | | | | | 1,517,536 | |
| | | | | | | | | |
| CHINA — 50.6% | | | | | | | | |
| Consumer Discretionary — 27.1% | | | | | | | | |
| BAIC BluePark New Energy Technology, Cl A* | | | 879,500 | | | | 1,014,133 | |
| BYD, Cl A | | | 84,500 | | | | 3,710,386 | |
| Geely Automobile Holdings | | | 1,781,000 | | | | 2,792,736 | |
| Guangzhou Automobile Group, Cl H(A) | | | 1,502,000 | | | | 589,778 | |
| Li Auto, Cl A* | | | 257,100 | | | | 3,578,051 | |
| NIO ADR*(A) | | | 454,259 | | | | 3,034,450 | |
| Seres Group, Cl A* | | | 153,700 | | | | 1,985,748 | |
| Shenzhen Kedali Industry, Cl A | | | 43,136 | | | | 598,782 | |
| XPeng, Cl A* | | | 504,800 | | | | 3,441,153 | |
| Yadea Group Holdings | | | 644,000 | | | | 1,145,810 | |
| Zhejiang Leapmotor Technology* | | | 432,000 | | | | 1,863,148 | |
| | | | | | | | 23,754,175 | |
| Industrials — 11.0% | | | | | | | | |
| Beijing Easpring Material Technology, Cl A | | | 81,700 | | | | 505,704 | |
| China Baoan Group, Cl A | | | 412,407 | | | | 566,285 | |
| Contemporary Amperex Technology, Cl A | | | 116,920 | | | | 4,208,101 | |
| Eve Energy, Cl A | | | 327,960 | | | | 2,285,854 | |
| Gotion High-tech, Cl A | | | 285,789 | | | | 943,286 | |
| Hunan Yuneng New Energy Battery Material, Cl A | | | 122,000 | | | | 653,697 | |
| Qingdao TGOOD Electric, Cl A | | | 164,500 | | | | 517,100 | |
| | | | | | | | 9,680,027 | |
| Materials — 12.5% | | | | | | | | |
| CMOC Group, Cl A | | | 1,707,100 | | | | 2,122,091 | |
| CNGR Advanced Material, Cl A | | | 151,270 | | | | 868,025 | |
The accompanying notes are an integral part of the financial statements.
Schedule of Investments (Unaudited) September 30, 2024
KraneShares Electric Vehicles and Future Mobility Index ETF (continued)
| | | Shares | | | Value | |
| COMMON STOCK (continued) | | | | | | | | |
| Materials (continued) | | | | | | | | |
| Ganfeng Lithium Group, Cl A | | | 261,758 | | | $ | 1,289,219 | |
| GEM, Cl A | | | 826,940 | | | | 842,460 | |
| Guangzhou Tinci Materials Technology, Cl A | | | 311,194 | | | | 823,489 | |
| Ningbo Shanshan, Cl A | | | 361,800 | | | | 481,804 | |
| Shanghai Putailai New Energy Technology, Cl A | | | 343,800 | | | | 734,400 | |
| Tianqi Lithium, Cl A | | | 242,500 | | | | 1,219,664 | |
| Xiamen Tungsten, Cl A | | | 224,551 | | | | 671,216 | |
| Yunnan Energy New Material, Cl A | | | 159,300 | | | | 778,672 | |
| Zhejiang Huayou Cobalt, Cl A | | | 273,063 | | | | 1,151,378 | |
| | | | | | | | 10,982,418 | |
| TOTAL CHINA | | | | | | | 44,416,620 | |
| | | | | | | | | |
| JAPAN — 4.4% | | | | | | | | |
| Consumer Discretionary — 3.6% | | | | | | | | |
| Panasonic Holdings | | | 360,400 | | | | 3,131,832 | |
| | | | | | | | | |
| Industrials — 0.8% | | | | | | | | |
| Nidec | | | 34,000 | | | | 714,513 | |
| TOTAL JAPAN | | | | | | | 3,846,345 | |
| | | | | | | | | |
| SOUTH KOREA — 12.9% | | | | | | | | |
| Industrials — 9.1% | | | | | | | | |
| Ecopro* | | | 13,799 | | | | 1,946,865 | |
| L&F* | | | 14,399 | | | | 1,249,741 | |
| LG Energy Solution* | | | 6,786 | | | | 2,150,950 | |
| POSCO Future M | | | 11,669 | | | | 2,230,825 | |
| SK IE Technology* | | | 13,876 | | | | 384,118 | |
| | | | | | | | 7,962,499 | |
| Information Technology — 3.8% | | | | | | | | |
| Samsung SDI | | | 11,514 | | | | 3,332,606 | |
| TOTAL SOUTH KOREA | | | | | | | 11,295,105 | |
| | | | | | | | | |
| SWEDEN — 1.1% | | | | | | | | |
| Consumer Discretionary — 1.1% | | | | | | | | |
| Volvo Car, Cl B*(A) | | | 354,374 | | | | 976,079 | |
| TOTAL SWEDEN | | | | | | | 976,079 | |
| | | | | | | | | |
| UNITED STATES — 14.6% | | | | | | | | |
| Consumer Discretionary — 8.4% | | | | | | | | |
| Lucid Group*(A) | | | 489,159 | | | | 1,726,731 | |
| Rivian Automotive, Cl A* | | | 215,755 | | | | 2,420,771 | |
| Tesla* | | | 12,176 | | | | 3,185,607 | |
| | | | | | | | 7,333,109 | |
The accompanying notes are an integral part of the financial statements.
Schedule of Investments (Unaudited) September 30, 2024
KraneShares Electric Vehicles and Future Mobility Index ETF (concluded)
| | | Shares | | | Value | |
| COMMON STOCK (continued) | | | | | | | | |
| Industrials — 1.4% | | | | | | | | |
| ChargePoint Holdings*(A) | | | 226,361 | | | $ | 310,115 | |
| Plug Power*(A) | | | 417,605 | | | | 943,787 | |
| | | | | | | | 1,253,902 | |
| Materials — 4.8% | | | | | | | | |
| Albemarle | | | 32,217 | | | | 3,051,272 | |
| MP Materials*(A) | | | 67,396 | | | | 1,189,540 | |
| | | | | | | | 4,240,812 | |
| TOTAL UNITED STATES | | | | | | | 12,827,823 | |
| | | | | | | | | |
TOTAL COMMON STOCK
(Cost $103,726,402) | | | | | | | 83,422,308 | |
| | | | | | | | | |
| PREFERRED STOCK — 4.4% | | | | | | | | |
| CHILE — 2.3% | | | | | | | | |
| Materials — 2.3% | | | | | | | | |
| Sociedad Quimica y Minera de Chile(B) | | | 47,293 | | | | 1,964,880 | |
| | | | | | | | | |
| GERMANY— 2.1% | | | | | | | | |
| Consumer Discretionary — 2.1% | | | | | | | | |
| Dr Ing hc F Porsche(B) | | | 23,159 | | | | 1,848,026 | |
| | | | | | | | | |
TOTAL PREFERRED STOCK
(Cost $5,434,486) | | | | | | | 3,812,906 | |
| | | | | | | | | |
| SHORT-TERM INVESTMENT — 9.7% | | | | | | | | |
| Invesco Government & Agency Portfolio, Cl Institutional, 4.840%(C)(D) | | | 8,523,116 | | | | 8,523,116 | |
TOTAL SHORT-TERM INVESTMENT
(Cost $8,523,116) | | | | | | | 8,523,116 | |
| | | | | | | | | |
TOTAL INVESTMENTS — 109.1%
(Cost $117,684,004) | | | | | | | 95,758,330 | |
| OTHER ASSETS LESS LIABILITIES – (9.1)% | | | | | | | (7,961,925 | ) |
| NET ASSETS - 100% | | | | | | $ | 87,796,405 | |
| ‡ | Industries are utilized for compliance purposes, whereas sectors are utilized for reporting. |
| * | Non-income producing security. |
| (A) | Certain securities or partial positions of certain securities are on loan at September 30, 2024. |
| (B) | Currently, no stated interest rate. |
| (C) | The rate shown is the 7-day effective yield as of September 30, 2024. |
| (D) | This security was purchased with cash collateral held from securities on loan. The total value of such security as of September 30, 2024 was $8,523,116. |
As of September 30, 2024, all of the Fund’s investments were considered Level 1 of the fair value hierarchy, in accordance with the authoritative guidance on fair value measurements and disclosure under U.S. generally accepted accounting principles.
See “Glossary” for abbreviations.
The accompanying notes are an integral part of the financial statements.
Schedule of Investments (Unaudited) September 30, 2024
KraneShares MSCI All China Health Care Index ETF
| | | Shares | | | Value | |
| COMMON STOCK — 99.8%‡ | | | | | | | | |
| CHINA — 95.2% | | | | | | | | |
| Health Care — 95.2% | | | | | | | | |
| Aier Eye Hospital Group, Cl A | | | 720,714 | | | $ | 1,638,396 | |
| Akeso* | | | 157,000 | | | | 1,386,572 | |
| Asymchem Laboratories Tianjin, Cl A | | | 26,324 | | | | 314,936 | |
| Autobio Diagnostics, Cl A | | | 44,830 | | | | 308,490 | |
| BeiGene* | | | 177,518 | | | | 3,306,966 | |
| Beijing Tiantan Biological Products, Cl A | | | 152,810 | | | | 548,912 | |
| Beijing Tong Ren Tang, Cl A | | | 105,890 | | | | 636,370 | |
| Beijing Wantai Biological Pharmacy Enterprise, Cl A | | | 81,622 | | | | 954,812 | |
| Bloomage Biotechnology, Cl A | | | 37,223 | | | | 374,961 | |
| Changchun High-Tech Industry Group, Cl A | | | 31,208 | | | | 490,016 | |
| China National Medicines, Cl A | | | 58,255 | | | | 287,585 | |
| China Resources Pharmaceutical Group | | | 497,500 | | | | 384,934 | |
| China Resources Sanjiu Medical & Pharmaceutical, Cl A | | | 99,247 | | | | 675,152 | |
| Chongqing Zhifei Biological Products, Cl A | | | 184,972 | | | | 882,222 | |
| CSPC Innovation Pharmaceutical, Cl A | | | 108,460 | | | | 478,866 | |
| CSPC Pharmaceutical Group | | | 2,150,889 | | | | 1,675,298 | |
| Dong-E-E-Jiao, Cl A | | | 49,740 | | | | 438,507 | |
| Genscript Biotech* | | | 302,000 | | | | 541,986 | |
| Guangzhou Baiyunshan Pharmaceutical Holdings, Cl A | | | 108,640 | | | | 475,935 | |
| Hangzhou Tigermed Consulting, Cl A | | | 28,650 | | | | 282,421 | |
| Hansoh Pharmaceutical Group | | | 310,000 | | | | 836,112 | |
| Huadong Medicine, Cl A | | | 135,541 | | | | 677,642 | |
| Hualan Biological Engineering, Cl A | | | 141,247 | | | | 361,460 | |
| Hubei Jumpcan Pharmaceutical, Cl A | | | 71,200 | | | | 318,631 | |
| Humanwell Healthcare Group, Cl A | | | 126,100 | | | | 379,995 | |
| Imeik Technology Development, Cl A | | | 23,280 | | | | 783,689 | |
| Innovent Biologics* | | | 323,000 | | | | 1,958,584 | |
| Jiangsu Hengrui Pharmaceuticals, Cl A | | | 492,928 | | | | 3,683,587 | |
| Jiangsu Nhwa Pharmaceutical, Cl A | | | 78,000 | | | | 303,701 | |
| Jiangsu Yuyue Medical Equipment & Supply, Cl A | | | 77,410 | | | | 423,404 | |
| Jointown Pharmaceutical Group, Cl A | | | 389,584 | | | | 319,520 | |
| Lepu Medical Technology Beijing, Cl A | | | 145,300 | | | | 273,424 | |
| Livzon Pharmaceutical Group, Cl A | | | 47,959 | | | | 278,558 | |
| Pharmaron Beijing, Cl A | | | 114,775 | | | | 497,728 | |
| Shandong Weigao Group Medical Polymer, Cl H | | | 625,600 | | | | 452,639 | |
| Shanghai Fosun Pharmaceutical Group, Cl A | | | 163,829 | | | | 647,717 | |
| Shanghai Pharmaceuticals Holding, Cl A | | | 215,094 | | | | 650,017 | |
| Shanghai Pharmaceuticals Holding, Cl H | | | 177,800 | | | | 290,248 | |
| Shanghai RAAS Blood Products, Cl A | | | 513,534 | | | | 579,672 | |
| Shanghai United Imaging Healthcare, Cl A | | | 63,690 | | | | 1,164,842 | |
| Shenzhen Mindray Bio-Medical Electronics, Cl A | | | 93,655 | | | | 3,920,887 | |
| Shenzhen New Industries Biomedical Engineering, Cl A | | | 60,700 | | | | 710,847 | |
| Shenzhen Salubris Pharmaceuticals, Cl A | | | 86,065 | | | | 426,227 | |
| Shijiazhuang Yiling Pharmaceutical, Cl A | | | 129,050 | | | | 332,276 | |
The accompanying notes are an integral part of the financial statements.
Schedule of Investments (Unaudited) September 30, 2024
KraneShares MSCI All China Health Care Index ETF (continued)
| | | Shares | | | Value | |
| COMMON STOCK (continued) | | | | | | | | |
| Health Care (continued) | | | | | | | | |
| Sichuan Kelun Pharmaceutical, Cl A | | | 123,715 | | | $ | 565,663 | |
| Sinopharm Group, Cl H | | | 344,800 | | | | 923,314 | |
| WuXi AppTec, Cl A | | | 195,020 | | | | 1,459,031 | |
| WuXi AppTec, Cl H | | | 89,884 | | | | 631,821 | |
| Wuxi Biologics Cayman* | | | 909,635 | | | | 2,049,387 | |
| Yunnan Baiyao Group, Cl A | | | 138,123 | | | | 1,203,875 | |
| Zhangzhou Pientzehuang Pharmaceutical, Cl A | | | 46,534 | | | | 1,718,699 | |
| Zhejiang Huahai Pharmaceutical, Cl A | | | 113,272 | | | | 317,061 | |
| TOTAL CHINA | | | | | | | 45,223,595 | |
| | | | | | | | | |
| HONG KONG — 2.7% | | | | | | | | |
| Health Care — 2.7% | | | | | | | | |
| Sino Biopharmaceutical | | | 2,665,750 | | | | 1,280,109 | |
| TOTAL HONG KONG | | | | | | | 1,280,109 | |
| | | | | | | | | |
| UNITED STATES — 1.9% | | | | | | | | |
| Health Care — 1.9% | | | | | | | | |
| Legend Biotech ADR* | | | 18,780 | | | | 915,149 | |
| TOTAL UNITED STATES | | | | | | | 915,149 | |
| | | | | | | | | |
TOTAL COMMON STOCK
(Cost $50,050,504) | | | | | | | 47,418,853 | |
| | | Number of Rights | | | | |
| RIGHTS — 0.0% | | | | | | | | |
| CHINA — 0.0% | | | | | | | | |
| Health Care — 0.0% | | | | | | | | |
| Kangmei Pharma‡‡*(A) | | | 109,673 | | | | — | |
| TOTAL CHINA | | | | | | | — | |
| | | | | | | | | |
TOTAL RIGHTS
(Cost $–) | | | | | | | — | |
| | | | | | | | | |
TOTAL INVESTMENTS — 99.8%
(Cost $50,050,504) | | | | | | | 47,418,853 | |
| OTHER ASSETS LESS LIABILITIES – 0.2% | | | | | | | 76,454 | |
| NET ASSETS - 100% | | | | | | $ | 47,495,307 | |
| ‡ | Industries are utilized for compliance purposes, whereas sectors are utilized for reporting. |
| * | Non-income producing security. |
| (A) | Level 3 security in accordance with fair value hierarchy. |
| ‡‡ | Expiration date not available. |
The accompanying notes are an integral part of the financial statements.
Schedule of Investments (Unaudited) September 30, 2024
KraneShares MSCI All China Health Care Index ETF (concluded)
The following summarizes the market value of the Fund’s investments used as of September 30, 2024, based on the inputs used to value them:
| Investments in Securities | | Level 1 | | | Level 2 | | | Level 3^ | | | Total | |
| Common Stock | | | | | | | | | | | | | | | | |
| China | | $ | 45,223,595 | | | $ | — | | | $ | — | | | $ | 45,223,595 | |
| Hong Kong | | | 1,280,109 | | | | — | | | | — | | | | 1,280,109 | |
| United States | | | 915,149 | | | | — | | | | — | | | | 915,149 | |
| Total Common Stock | | | 47,418,853 | | | | — | | | | — | | | | 47,418,853 | |
| Rights | | | — | | | | — | | | | — | ‡‡ | | | — | |
| Total Investments in Securities | | $ | 47,418,853 | | | $ | — | | | $ | — | | | $ | 47,418,853 | |
| ^ | A reconciliation of Level 3 investments, including certain disclosures related to significant inputs used in valuing Level 3 investments is only presented when the Fund has over 1% of Level 3 investments at the end of the period in relation to net assets. |
| ‡‡ | Security or securities with a market value of $0. |
Amounts designated as “—” are $0 or have been rounded to $0.
See “Glossary” for abbreviations.
The accompanying notes are an integral part of the financial statements.
Schedule of Investments (Unaudited) September 30, 2024
KraneShares Asia Pacific High Income USD Bond ETF†
| | | Face Amount | | | Value | |
| CORPORATE OBLIGATIONS — 97.4% | | | | | | | | |
| AUSTRALIA — 2.2% | | | | | | | | |
| Materials — 2.2% | | | | | | | | |
| Mineral Resources | | | | | | | | |
| 9.250%, 10/01/2028 | | $ | 200,000 | | | $ | 212,409 | |
| Perenti Finance Pty | | | | | | | | |
| 7.500%, 04/26/2029 | | | 200,000 | | | | 208,260 | |
| TOTAL AUSTRALIA | | | | | | | 420,669 | |
| | | | | | | | | |
| CHINA — 23.6% | | | | | | | | |
| Consumer Discretionary — 3.1% | | | | | | | | |
| Fortune Star BVI | | | | | | | | |
| 5.950%, 10/19/2025 | | | 400,000 | | | | 391,000 | |
| 5.050%, 01/27/2027 | | | 200,000 | | | | 186,700 | |
| | | | | | | | | |
| Financials — 3.4% | | | | | | | | |
| Huarong Finance 2019, MTN | | | | | | | | |
| 4.250%,(A)(B) | | | 250,000 | | | | 245,532 | |
| Industrial & Commercial Bank of China | | | | | | | | |
| 3.200%, H15T5Y + 2.368%(A)(B) | | | 400,000 | | | | 390,320 | |
| | | | | | | | | |
| Real Estate — 16.1% | | | | | | | | |
| Central Plaza Development | | | | | | | | |
| 4.650%, 01/19/2026 | | | 400,000 | | | | 383,292 | |
| Franshion Brilliant | | | | | | | | |
| 6.000%, H15T5Y + 5.584%(A)(B) | | | 200,000 | | | | 190,442 | |
| 4.250%, 07/23/2029 | | | 200,000 | | | | 162,543 | |
| Fuqing Investment Management, MTN | | | | | | | | |
| 3.250%, 06/23/2025 | | | 400,000 | | | | 384,000 | |
| Greentown China Holdings | | | | | | | | |
| 5.650%, 07/13/2025 | | | 400,000 | | | | 391,470 | |
| 4.700%, 04/29/2025 | | | 400,000 | | | | 390,500 | |
| Pingan Real Estate Capital, MTN | | | | | | | | |
| 3.450%, 07/29/2026 | | | 200,000 | | | | 179,534 | |
| Shui On Development Holding | | | | | | | | |
| 5.500%, 03/03/2025 | | | 200,000 | | | | 184,306 | |
| Vanke Real Estate Hong Kong, MTN | | | | | | | | |
| 3.150%, 05/12/2025 | | | 200,000 | | | | 179,750 | |
| Wanda Properties International | | | | | | | | |
| 7.250%, 12/29/2024 | | | 175,000 | | | | 173,482 | |
| Yanlord Land HK | | | | | | | | |
| 5.125%, 05/20/2026 | | | 450,000 | | | | 419,400 | |
| | | | | | | | | |
| Utilities — 1.0% | | | | | | | | |
| China Oil & Gas Group | | | | | | | | |
| 4.700%, 06/30/2026 | | | 200,000 | | | | 183,860 | |
| TOTAL CHINA | | | | | | | 4,436,131 | |
The accompanying notes are an integral part of the financial statements.
Schedule of Investments (Unaudited) September 30, 2024
KraneShares Asia Pacific High Income USD Bond ETF† (continued)
| | | Face Amount | | | Value | |
| CORPORATE OBLIGATIONS (continued) | | | | | | | | |
| HONG KONG — 16.3% | | | | | | | | |
| Consumer Discretionary — 5.1% | | | | | | | | |
| LS Finance 2017 | | | | | | | | |
| 4.800%, 06/18/2026 | | $ | 200,000 | | | $ | 172,500 | |
| LS Finance 2025 | | | | | | | | |
| 4.500%, 06/26/2025 | | | 200,000 | | | | 189,500 | |
| Melco Resorts Finance | | | | | | | | |
| 7.625%, 04/17/2032 | | | 200,000 | | | | 206,181 | |
| 5.625%, 07/17/2027 | | | 200,000 | | | | 194,614 | |
| 5.250%, 04/26/2026 | | | 200,000 | | | | 196,254 | |
| | | | | | | | | |
| Financials — 4.5% | | | | | | | | |
| Bank of East Asia, MTN | | | | | | | | |
| 5.825%, H15T5Y + 5.527%(A)(B) | | | 250,000 | | | | 247,625 | |
| FWD Group Holdings | | | | | | | | |
| 8.045%, H15T5Y + 4.865%(A)(B) | | | 200,000 | | | | 200,400 | |
| FWD Group Holdings, MTN | | | | | | | | |
| 7.635%, 07/02/2031 | | | 200,000 | | | | 217,090 | |
| PCGI Intermediate Holdings III | | | | | | | | |
| 4.500%, 08/23/2026 | | | 200,000 | | | | 182,000 | |
| | | | | | | | | |
| Real Estate — 6.7% | | | | | | | | |
| FEC Finance | | | | | | | | |
| 7.375%,(A)(B) | | | 200,000 | | | | 198,000 | |
| NWD Finance BVI | | | | | | | | |
| 6.150%,(A)(B) | | | 400,000 | | | | 379,800 | |
| 5.250%,(A)(B) | | | 600,000 | | | | 501,390 | |
| PCPD Capital | | | | | | | | |
| 5.125%, 06/18/2026 | | | 200,000 | | | | 180,100 | |
| TOTAL HONG KONG | | | | | | | 3,065,454 | |
| | | | | | | | | |
| INDIA — 20.7% | | | | | | | | |
| Energy — 10.3% | | | | | | | | |
| Continuum Energy Aura Pte | | | | | | | | |
| 9.500%, 02/24/2027 | | | 200,000 | | | | 209,780 | |
| Continuum Green Energy India Pvt | | | | | | | | |
| 7.500%, 06/26/2033 | | | 200,000 | | | | 210,250 | |
| Diamond II | | | | | | | | |
| 7.950%, 07/28/2026 | | | 200,000 | | | | 202,769 | |
| Greenko Wind Projects Mauritius | | | | | | | | |
| 5.500%, 04/06/2025 | | | 200,000 | | | | 198,858 | |
| India Clean Energy Holdings, MTN | | | | | | | | |
| 4.500%, 04/18/2027 | | | 400,000 | | | | 378,755 | |
| India Cleantech Energy | | | | | | | | |
| 4.700%, 08/10/2026 | | | 574,700 | | | | 556,367 | |
| ReNew Wind Energy AP2 | | | | | | | | |
| 4.500%, 07/14/2028 | | | 200,000 | | | | 187,103 | |
The accompanying notes are an integral part of the financial statements.
Schedule of Investments (Unaudited) September 30, 2024
KraneShares Asia Pacific High Income USD Bond ETF† (continued)
| | | Face Amount | | | Value | |
| CORPORATE OBLIGATIONS (continued) | | | | | | | | |
| Financials — 3.5% | | | | | | | | |
| Axis Bank, MTN | | | | | | | | |
| 4.100%, H15T5Y + 3.315%(A)(B) | | $ | 200,000 | | | $ | 190,550 | |
| Manappuram Finance, MTN | | | | | | | | |
| 7.375%, 05/12/2028 | | | 200,000 | | | | 204,269 | |
| Piramal Capital & Housing Finance, MTN | | | | | | | | |
| 7.800%, 01/29/2028 | | | 250,000 | | | | 255,813 | |
| | | | | | | | | |
| Industrials — 4.2% | | | | | | | | |
| Delhi International Airport | | | | | | | | |
| 6.450%, 06/04/2029 | | | 200,000 | | | | 206,000 | |
| GMR Hyderabad International Airport | | | | | | | | |
| 4.250%, 10/27/2027 | | | 200,000 | | | | 191,575 | |
| Magnum Holdings | | | | | | | | |
| 5.375%, 10/31/2026 | | | 400,000 | | | | 393,996 | |
| | | | | | | | | |
| Materials — 2.7% | | | | | | | | |
| Vedanta Resources Finance II | | | | | | | | |
| 13.875%, 12/09/2028 | | | 168,000 | | | | 168,131 | |
| 13.875%, 01/21/2027 | | | 141,000 | | | | 141,053 | |
| 9.250%, 04/23/2026 | | | 200,000 | | | | 198,603 | |
| TOTAL INDIA | | | | | | | 3,893,872 | |
| | | | | | | | | |
| INDONESIA — 5.7% | | | | | | | | |
| Energy — 2.5% | | | | | | | | |
| Medco Bell Pte | | | | | | | | |
| 6.375%, 01/30/2027 | | | 200,000 | | | | 199,146 | |
| Medco Maple Tree Pte | | | | | | | | |
| 8.960%, 04/27/2029 | | | 250,000 | | | | 263,749 | |
| | | | | | | | | |
| Financials — 1.0% | | | | | | | | |
| Bank Negara Indonesia Persero | | | | | | | | |
| 4.300%, H15T5Y + 3.466%(A)(B) | | | 200,000 | | | | 191,625 | |
| | | | | | | | | |
| Materials — 1.2% | | | | | | | | |
| Nickel Industries | | | | | | | | |
| 11.250%, 10/21/2028 | | | 200,000 | | | | 217,600 | |
| | | | | | | | | |
| Real Estate — 1.0% | | | | | | | | |
| Kawasan Industri Jababeka, MTN | | | | | | | | |
| 7.500%, 12/15/2027 | | | 200,000 | | | | 197,559 | |
| TOTAL INDONESIA | | | | | | | 1,069,679 | |
| | | | | | | | | |
| JAPAN — 1.0% | | | | | | | | |
| Information Technology — 1.0% | | | | | | | | |
| Rakuten Group | | | | | | | | |
| 5.125%, H15T5Y + 4.578%(A)(B) | | | 200,000 | | | | 190,600 | |
The accompanying notes are an integral part of the financial statements.
Schedule of Investments (Unaudited) September 30, 2024
KraneShares Asia Pacific High Income USD Bond ETF† (continued)
| | | Face Amount | | | Value | |
| CORPORATE OBLIGATIONS (continued) | | | | | | | | |
| MACAU — 7.3% | | | | | | | | |
| Consumer Discretionary — 7.3% | | | | | | | | |
| Champion Path Holdings | | | | | | | | |
| 4.850%, 01/27/2028 | | $ | 200,000 | | | $ | 187,000 | |
| MGM China Holdings | | | | | | | | |
| 7.125%, 06/26/2031 | | | 200,000 | | | | 205,776 | |
| 5.250%, 06/18/2025 | | | 200,000 | | | | 198,915 | |
| Studio City Finance | | | | | | | | |
| 6.500%, 01/15/2028 | | | 200,000 | | | | 195,598 | |
| Wynn Macau | | | | | | | | |
| 5.625%, 08/26/2028 | | | 200,000 | | | | 194,405 | |
| 5.500%, 10/01/2027 | | | 200,000 | | | | 195,547 | |
| 5.125%, 12/15/2029 | | | 200,000 | | | | 187,864 | |
| TOTAL MACAU | | | | | | | 1,365,105 | |
| | | | | | | | | |
| MONGOLIA — 2.2% | | | | | | | | |
| Energy — 1.1% | | | | | | | | |
| Mongolian Mining | | | | | | | | |
| 12.500%, 09/13/2026 | | | 200,000 | | | | 216,000 | |
| | | | | | | | | |
| Financials — 1.1% | | | | | | | | |
| Golomt Bank | | | | | | | | |
| 11.000%, 05/20/2027 | | | 200,000 | | | | 202,260 | |
| TOTAL MONGOLIA | | | | | | | 418,260 | |
| | | | | | | | | |
| PHILIPPINES — 4.2% | | | | | | | | |
| Energy — 2.1% | | | | | | | | |
| Petron | | | | | | | | |
| 5.950%,(A)(B) | | | 400,000 | | | | 397,674 | |
| | | | | | | | | |
| Financials — 1.1% | | | | | | | | |
| Rizal Commercial Banking | | | | | | | | |
| 6.500%, H15T5Y + 6.236%(A)(B) | | | 200,000 | | | | 198,714 | |
| | | | | | | | | |
| Utilities — 1.0% | | | | | | | | |
| San Miguel Global Power Holdings | | | | | | | | |
| 5.450%,(A)(B) | | | 200,000 | | | | 191,035 | |
| TOTAL PHILIPPINES | | | | | | | 787,423 | |
| | | | | | | | | |
| SINGAPORE — 2.0% | | | | | | | | |
| Real Estate — 2.0% | | | | | | | | |
| GLP Pte, MTN | | | | | | | | |
| 3.875%, 06/04/2025 | | | 400,000 | | | | 380,000 | |
| | | | | | | | | |
| THAILAND — 5.3% | | | | | | | | |
| Financials — 5.3% | | | | | | | | |
| Kasikornbank, MTN | | | | | | | | |
| 4.000%, H15T5Y + 3.337%(A)(B) | | | 400,000 | | | | 382,116 | |
| Krung Thai Bank | | | | | | | | |
| 4.400%, H15T5Y + 3.530%(A)(B) | | | 400,000 | | | | 391,470 | |
The accompanying notes are an integral part of the financial statements.
Schedule of Investments (Unaudited) September 30, 2024
KraneShares Asia Pacific High Income USD Bond ETF† (concluded)
| | | Face Amount | | | Value | |
| CORPORATE OBLIGATIONS (continued) | | | | | | | | |
| Financials (continued) | | | | | | | | |
| Muangthai Capital | | | | | | | | |
| 6.875%, 09/30/2028 | | $ | 210,000 | | | $ | 211,431 | |
| TOTAL THAILAND | | | | | | | 985,017 | |
| | | | | | | | | |
| UNITED KINGDOM — 4.7% | | | | | | | | |
| Financials — 4.7% | | | | | | | | |
| Standard Chartered | | | | | | | | |
| 7.875%, H15T5Y + 3.574%(A)(B) | | | 300,000 | | | | 318,317 | |
| 7.750%, H15T5Y + 4.976%(A)(B) | | | 200,000 | | | | 208,857 | |
| 4.750%, H15T5Y + 3.805%(A)(B) | | | 200,000 | | | | 176,728 | |
| 4.300%, H15T5Y + 3.135%(A)(B) | | | 200,000 | | | | 181,919 | |
| TOTAL UNITED KINGDOM | | | | | | | 885,821 | |
| | | | | | | | | |
| VIETNAM — 2.2% | | | | | | | | |
| Utilities — 2.2% | | | | | | | | |
| Mong Duong Finance Holdings BV | | | | | | | | |
| 5.125%, 05/07/2029 | | | 421,640 | | | | 409,213 | |
| | | | | | | | | |
TOTAL CORPORATE OBLIGATIONS
(Cost $17,654,014) | | | | | | | 18,307,244 | |
| | | | | | | | | |
TOTAL INVESTMENTS — 97.4%
(Cost $17,654,014) | | | | | | | 18,307,244 | |
| OTHER ASSETS LESS LIABILITIES – 2.6% | | | | | | | 482,756 | |
| NET ASSETS - 100% | | | | | | $ | 18,790,000 | |
| † | Formerly KraneShares Asia Pacific High Income Bond ETF, effective August 1, 2024. |
| (A) | Variable or floating rate security, the interest rate of which adjusts periodically based on changes in current interest rates and prepayments on the underlying pool of assets. |
| (B) | Perpetual security with no stated maturity date. |
As of September 30, 2024, all of the Fund’s investments were considered Level 2 of the fair value hierarchy, in accordance with the authoritative guidance on fair value measurements and disclosure under U.S. generally accepted accounting principles.
See “Glossary” for abbreviations.
The accompanying notes are an integral part of the financial statements.
Schedule of Investments (Unaudited) September 30, 2024
KraneShares MSCI Emerging Markets ex China Index ETF
| | | Shares | | | Value | |
| COMMON STOCK — 97.4%‡ | | | | | | | | |
| BRAZIL — 4.9% | | | | | | | | |
| Communication Services — 0.1% | | | | | | | | |
| Telefonica Brasil | | | 9,900 | | | $ | 101,476 | |
| | | | | | | | | |
| Consumer Staples — 0.4% | | | | | | | | |
| Ambev | | | 92,400 | | | | 221,931 | |
| Raia Drogasil | | | 25,168 | | | | 117,803 | |
| | | | | | | | 339,734 | |
| Energy — 0.8% | | | | | | | | |
| Petroleo Brasileiro | | | 77,100 | | | | 555,973 | |
| Ultrapar Participacoes | | | 22,400 | | | | 87,242 | |
| | | | | | | | 643,215 | |
| Financials — 1.2% | | | | | | | | |
| B3 - Brasil Bolsa Balcao | | | 102,500 | | | | 201,582 | |
| Banco Bradesco | | | 49,188 | | | | 118,232 | |
| Banco do Brasil | | | 44,800 | | | | 223,597 | |
| BB Seguridade Participacoes | | | 12,400 | | | | 80,833 | |
| NU Holdings, Cl A* | | | 22,052 | | | | 301,010 | |
| | | | | | | | 925,254 | |
| Industrials — 0.7% | | | | | | | | |
| CCR | | | 19,800 | | | | 43,994 | |
| Localiza Rent a Car | | | 14,420 | | | | 108,564 | |
| Rumo | | | 19,800 | | | | 72,717 | |
| WEG | | | 29,700 | | | | 296,629 | |
| | | | | | | | 521,904 | |
| Materials — 1.2% | | | | | | | | |
| Klabin | | | 13,740 | | | | 52,707 | |
| Suzano | | | 14,700 | | | | 146,951 | |
| Vale | | | 64,700 | | | | 754,544 | |
| | | | | | | | 954,202 | |
| Utilities — 0.5% | | | | | | | | |
| Centrais Eletricas Brasileiras | | | 18,100 | | | | 130,786 | |
| Cia de Saneamento Basico do Estado de Sao Paulo | | | 5,000 | | | | 83,000 | |
| Equatorial Energia | | | 22,200 | | | | 132,487 | |
| | | | | | | | 346,273 | |
| TOTAL BRAZIL | | | | | | | 3,832,058 | |
| | | | | | | | | |
| CHILE — 0.6% | | | | | | | | |
| Consumer Discretionary — 0.1% | | | | | | | | |
| Empresas Copec | | | 6,582 | | | | 44,130 | |
| Falabella* | | | 12,658 | | | | 46,944 | |
| | | | | | | | 91,074 | |
The accompanying notes are an integral part of the financial statements.
Schedule of Investments (Unaudited) September 30, 2024
KraneShares MSCI Emerging Markets ex China Index ETF (continued)
| | | Shares | | | Value | |
| COMMON STOCK (continued) | | | | | | | | |
| Financials — 0.3% | | | | | | | | |
| Banco de Chile | | | 1,121,628 | | | $ | 143,280 | |
| Banco de Credito e Inversiones | | | 1,094 | | | | 34,109 | |
| Banco Santander Chile | | | 1,116,507 | | | | 58,132 | |
| | | | | | | | 235,521 | |
| Materials — 0.1% | | | | | | | | |
| Empresas CMPC | | | 21,405 | | | | 37,284 | |
| | | | | | | | | |
| Utilities — 0.1% | | | | | | | | |
| Enel Americas | | | 482,272 | | | | 49,301 | |
| Enel Chile | | | 1,209,442 | | | | 66,675 | |
| | | | | | | | 115,976 | |
| TOTAL CHILE | | | | | | | 479,855 | |
| | | | | | | | | |
| COLOMBIA — 0.1% | | | | | | | | |
| Financials — 0.1% | | | | | | | | |
| Bancolombia | | | 12,401 | | | | 107,668 | |
| TOTAL COLOMBIA | | | | | | | 107,668 | |
| | | | | | | | | |
| CZECHIA — 0.2% | | | | | | | | |
| Financials — 0.1% | | | | | | | | |
| Komercni Banka | | | 1,220 | | | | 43,089 | |
| | | | | | | | | |
| Utilities — 0.1% | | | | | | | | |
| CEZ | | | 2,594 | | | | 101,090 | |
| TOTAL CZECHIA | | | | | | | 144,179 | |
| | | | | | | | | |
| EGYPT — 0.1% | | | | | | | | |
| Financials — 0.1% | | | | | | | | |
| Commercial International Bank Egypt SAE | | | 44,444 | | | | 77,754 | |
| TOTAL EGYPT | | | | | | | 77,754 | |
| | | | | | | | | |
| GREECE — 0.1% | | | | | | | | |
| Communication Services — 0.1% | | | | | | | | |
| Hellenic Telecommunications Organization | | | 3,892 | | | | 67,283 | |
| TOTAL GREECE | | | | | | | 67,283 | |
| | | | | | | | | |
| HUNGARY — 0.4% | | | | | | | | |
| Energy — 0.1% | | | | | | | | |
| MOL Hungarian Oil & Gas | | | 6,065 | | | | 45,472 | |
| | | | | | | | | |
| Financials — 0.2% | | | | | | | | |
| OTP Bank Nyrt | | | 3,714 | | | | 194,753 | |
The accompanying notes are an integral part of the financial statements.
Schedule of Investments (Unaudited) September 30, 2024
KraneShares MSCI Emerging Markets ex China Index ETF (continued)
| | | Shares | | | Value | |
| COMMON STOCK (continued) | | | | | | | | |
| Health Care — 0.1% | | | | | | | | |
| Richter Gedeon Nyrt | | | 2,994 | | | $ | 92,465 | |
| TOTAL HUNGARY | | | | | | | 332,690 | |
| | | | | | | | | |
| INDIA — 23.0% | | | | | | | | |
| Communication Services — 1.4% | | | | | | | | |
| Bharti Airtel | | | 55,048 | | | | 1,122,982 | |
| | | | | | | | | |
| Consumer Discretionary — 2.5% | | | | | | | | |
| Bajaj Auto | | | 1,376 | | | | 202,718 | |
| Eicher Motors | | | 2,618 | | | | 157,023 | |
| Mahindra & Mahindra | | | 15,602 | | | | 576,204 | |
| Maruti Suzuki India | | | 2,525 | | | | 398,872 | |
| Tata Motors | | | 30,589 | | | | 355,765 | |
| Titan | | | 5,929 | | | | 270,547 | |
| | | | | | | | 1,961,129 | |
| Consumer Staples — 2.1% | | | | | | | | |
| Dabur India | | | 28,361 | | | | 211,587 | |
| Godrej Consumer Products | | | 15,399 | | | | 256,046 | |
| Hindustan Unilever | | | 15,257 | | | | 538,593 | |
| ITC | | | 73,392 | | | | 453,789 | |
| Nestle India | | | 6,784 | | | | 217,761 | |
| | | | | | | | 1,677,776 | |
| Energy — 1.4% | | | | | | | | |
| Bharat Petroleum | | | 34,754 | | | | 153,425 | |
| Indian Oil | | | 102,074 | | | | 219,431 | |
| Oil & Natural Gas | | | 74,596 | | | | 264,910 | |
| Reliance Industries | | | 13,561 | | | | 477,889 | |
| | | | | | | | 1,115,655 | |
| Financials — 6.2% | | | | | | | | |
| Axis Bank | | | 46,490 | | | | 683,581 | |
| Bajaj Finance | | | 4,255 | | | | 391,119 | |
| Bajaj Finserv | | | 8,527 | | | | 200,799 | |
| HDFC Bank | | | 54,293 | | | | 1,122,157 | |
| HDFC Life Insurance | | | 16,920 | | | | 144,969 | |
| ICICI Bank | | | 78,391 | | | | 1,190,815 | |
| Jio Financial Services* | | | 36,907 | | | | 154,408 | |
| Kotak Mahindra Bank | | | 29,006 | | | | 641,705 | |
| State Bank of India | | | 36,680 | | | | 344,866 | |
| | | | | | | | 4,874,419 | |
| Health Care — 1.2% | | | | | | | | |
| Aurobindo Pharma | | | 8,650 | | | | 150,774 | |
| Cipla | | | 9,982 | | | | 197,028 | |
The accompanying notes are an integral part of the financial statements.
Schedule of Investments (Unaudited) September 30, 2024
KraneShares MSCI Emerging Markets ex China Index ETF (continued)
| | | Shares | | | Value | |
| COMMON STOCK (continued) | | | | | | | | |
| Health Care (continued) | | | | | | | | |
| Dr Reddy’s Laboratories | | | 1,918 | | | $ | 154,527 | |
| Sun Pharmaceutical Industries | | | 18,314 | | | | 421,063 | |
| | | | | | | | 923,392 | |
| Industrials — 0.7% | | | | | | | | |
| Larsen & Toubro | | | 12,141 | | | | 532,508 | |
| | | | | | | | | |
| Information Technology — 4.5% | | | | | | | | |
| HCL Technologies | | | 22,020 | | | | 471,952 | |
| Infosys ADR | | | 77,419 | | | | 1,724,121 | |
| Tata Consultancy Services | | | 18,316 | | | | 932,944 | |
| Tech Mahindra | | | 12,640 | | | | 237,894 | |
| Wipro | | | 30,570 | | | | 197,516 | |
| | | | | | | | 3,564,427 | |
| Materials — 1.9% | | | | | | | | |
| Asian Paints | | | 8,196 | | | | 325,596 | |
| Grasim Industries | | | 5,527 | | | | 184,377 | |
| Hindalco Industries | | | 34,131 | | | | 307,989 | |
| JSW Steel | | | 14,477 | | | | 177,945 | |
| UltraTech Cement | | | 1,967 | | | | 277,019 | |
| UPL | | | 9,107 | | | | 66,633 | |
| Vedanta | | | 22,222 | | | | 135,942 | |
| | | | | | | | 1,475,501 | |
| Utilities — 1.1% | | | | | | | | |
| GAIL India | | | 51,399 | | | | 147,380 | |
| NTPC | | | 82,022 | | | | 433,790 | |
| Power Grid Corp of India | | | 80,267 | | | | 337,969 | |
| | | | | | | | 919,139 | |
| TOTAL INDIA | | | | | | | 18,166,928 | |
| | | | | | | | | |
| INDONESIA — 2.9% | | | | | | | | |
| Communication Services — 0.3% | | | | | | | | |
| Telkom Indonesia Persero | | | 1,124,300 | | | | 222,038 | |
| | | | | | | | | |
| Consumer Staples — 0.1% | | | | | | | | |
| Charoen Pokphand Indonesia | | | 153,900 | | | | 47,776 | |
| Unilever Indonesia | | | 158,900 | | | | 23,195 | |
| | | | | | | | 70,971 | |
| Energy — 0.2% | | | | | | | | |
| Adaro Energy Indonesia | | | 564,400 | | | | 142,032 | |
| United Tractors | | | 35,300 | | | | 63,302 | |
| | | | | | | | 205,334 | |
The accompanying notes are an integral part of the financial statements.
Schedule of Investments (Unaudited) September 30, 2024
KraneShares MSCI Emerging Markets ex China Index ETF (continued)
| | | Shares | | | Value | |
| COMMON STOCK (continued) | | | | | | | | |
| Financials — 2.1% | | | | | | | | |
| Bank Central Asia | | | 1,062,300 | | | $ | 724,455 | |
| Bank Mandiri Persero | | | 878,500 | | | | 401,824 | |
| Bank Negara Indonesia Persero | | | 327,600 | | | | 115,763 | |
| Bank Rakyat Indonesia Persero | | | 1,221,100 | | | | 399,237 | |
| | | | | | | | 1,641,279 | |
| Industrials — 0.2% | | | | | | | | |
| Astra International | | | 487,800 | | | | 162,708 | |
| TOTAL INDONESIA | | | | | | | 2,302,330 | |
| | | | | | | | | |
| MALAYSIA — 2.5% | | | | | | | | |
| Communication Services — 0.2% | | | | | | | | |
| CelcomDigi Bhd | | | 72,600 | | | | 65,496 | |
| Maxis | | | 72,600 | | | | 69,545 | |
| | | | | | | | 135,041 | |
| Consumer Discretionary — 0.0% | | | | | | | | |
| Genting | | | 47,600 | | | | 48,830 | |
| | | | | | | | | |
| Consumer Staples — 0.1% | | | | | | | | |
| SD Guthrie | | | 55,100 | | | | 64,006 | |
| | | | | | | | | |
| Financials — 1.5% | | | | | | | | |
| CIMB Group Holdings | | | 200,955 | | | | 392,309 | |
| Hong Leong Bank | | | 12,700 | | | | 66,403 | |
| Malayan Banking | | | 136,616 | | | | 347,214 | |
| Public Bank | | | 316,400 | | | | 349,893 | |
| | | | | | | | 1,155,819 | |
| Health Care — 0.1% | | | | | | | | |
| IHH Healthcare | | | 47,600 | | | | 82,652 | |
| | | | | | | | | |
| Materials — 0.1% | | | | | | | | |
| Petronas Chemicals Group | | | 72,600 | | | | 99,300 | |
| | | | | | | | | |
| Utilities — 0.5% | | | | | | | | |
| Petronas Gas | | | 12,400 | | | | 54,129 | |
| Tenaga Nasional | | | 90,000 | | | | 315,169 | |
| | | | | | | | 369,298 | |
| TOTAL MALAYSIA | | | | | | | 1,954,946 | |
| | | | | | | | | |
| MEXICO — 3.7% | | | | | | | | |
| Communication Services — 0.6% | | | | | | | | |
| America Movil | | | 581,200 | | | | 478,848 | |
| | | | | | | | | |
| Consumer Staples — 1.0% | | | | | | | | |
| Fomento Economico Mexicano | | | 40,200 | | | | 398,595 | |
The accompanying notes are an integral part of the financial statements.
Schedule of Investments (Unaudited) September 30, 2024
KraneShares MSCI Emerging Markets ex China Index ETF (continued)
| | | Shares | | | Value | |
| COMMON STOCK (continued) | | | | | | | | |
| Consumer Staples (continued) | | | | | | | | |
| Grupo Bimbo, Ser A | | | 27,200 | | | $ | 94,025 | |
| Wal-Mart de Mexico | | | 104,800 | | | | 316,346 | |
| | | | | | | | 808,966 | |
| Financials — 0.6% | | | | | | | | |
| Grupo Financiero Banorte, Cl O | | | 55,100 | | | | 392,126 | |
| Grupo Financiero Inbursa, Cl O* | | | 37,100 | | | | 84,413 | |
| | | | | | | | 476,539 | |
| Industrials — 0.5% | | | | | | | | |
| Grupo Aeroportuario del Pacifico, Cl B | | | 10,080 | | | | 175,816 | |
| Grupo Aeroportuario del Sureste, Cl B | | | 6,425 | | | | 182,691 | |
| | | | | | | | 358,507 | |
| Materials — 0.9% | | | | | | | | |
| Cemex | | | 305,800 | | | | 188,141 | |
| Grupo Mexico | | | 55,100 | | | | 308,557 | |
| Southern Copper | | | 1,766 | | | | 204,274 | |
| | | | | | | | 700,972 | |
| Real Estate — 0.1% | | | | | | | | |
| Fibra Uno Administracion† | | | 69,000 | | | | 80,679 | |
| TOTAL MEXICO | | | | | | | 2,904,511 | |
| | | | | | | | | |
| PERU — 0.6% | | | | | | | | |
| Financials — 0.4% | | | | | | | | |
| Credicorp | | | 1,620 | | | | 293,171 | |
| | | | | | | | | |
| Materials — 0.2% | | | | | | | | |
| Cia de Minas Buenaventura SAA ADR | | | 13,878 | | | | 192,072 | |
| TOTAL PERU | | | | | | | 485,243 | |
| | | | | | | | | |
| PHILIPPINES — 1.1% | | | | | | | | |
| Financials — 0.2% | | | | | | | | |
| BDO Unibank | | | 66,224 | | | | 186,721 | |
| | | | | | | | | |
| Industrials — 0.4% | | | | | | | | |
| Ayala | | | 7,800 | | | | 93,468 | |
| JG Summit | | | 98,535 | | | | 48,883 | |
| SM Investments | | | 7,800 | | | | 133,068 | |
| | | | | | | | 275,419 | |
| Real Estate — 0.5% | | | | | | | | |
| Ayala Land | | | 269,700 | | | | 176,150 | |
The accompanying notes are an integral part of the financial statements.
Schedule of Investments (Unaudited) September 30, 2024
KraneShares MSCI Emerging Markets ex China Index ETF (continued)
| | | Shares | | | Value | |
| COMMON STOCK (continued) | | | | | | | | |
| Real Estate (continued) | | | | | | | | |
| SM Prime | | | 368,300 | | | $ | 212,288 | |
| | | | | | | | 388,438 | |
| TOTAL PHILIPPINES | | | | | | | 850,578 | |
| | | | | | | | | |
| POLAND — 1.6% | | | | | | | | |
| Communication Services — 0.1% | | | | | | | | |
| CD Projekt | | | 1,475 | | | | 66,958 | |
| | | | | | | | | |
| Consumer Discretionary — 0.3% | | | | | | | | |
| LPP | | | 61 | | | | 251,073 | |
| | | | | | | | | |
| Energy — 0.1% | | | | | | | | |
| ORLEN | | | 6,846 | | | | 99,702 | |
| | | | | | | | | |
| Financials — 0.9% | | | | | | | | |
| Bank Polska Kasa Opieki | | | 4,039 | | | | 154,661 | |
| Powszechna Kasa Oszczednosci Bank Polski | | | 20,191 | | | | 294,631 | |
| Powszechny Zaklad Ubezpieczen | | | 14,669 | | | | 160,903 | |
| Santander Bank Polska | | | 781 | | | | 92,487 | |
| | | | | | | | 702,682 | |
| Materials — 0.2% | | | | | | | | |
| KGHM Polska Miedz | | | 2,816 | | | | 116,969 | |
| TOTAL POLAND | | | | | | | 1,237,384 | |
| | | | | | | | | |
| QATAR — 1.1% | | | | | | | | |
| Financials — 0.9% | | | | | | | | |
| Masraf Al Rayan | | | 95,608 | | | | 64,859 | |
| Qatar Islamic Bank QPSC | | | 28,035 | | | | 164,391 | |
| Qatar National Bank | | | 99,395 | | | | 462,715 | |
| | | | | | | | 691,965 | |
| Industrials — 0.2% | | | | | | | | |
| Industries Qatar | | | 44,590 | | | | 159,696 | |
| TOTAL QATAR | | | | | | | 851,661 | |
| | | | | | | | | |
| ROMANIA — 0.2% | | | | | | | | |
| Real Estate — 0.2% | | | | | | | | |
| NEPI Rockcastle | | | 22,869 | | | | 193,608 | |
| TOTAL ROMANIA | | | | | | | 193,608 | |
| | | | | | | | | |
| RUSSIA — 0.0% | | | | | | | | |
| Communication Services — 0.0% | | | | | | | | |
| Mobile TeleSystems PJSC ADR(A) | | | 3,839 | | | | — | |
The accompanying notes are an integral part of the financial statements.
Schedule of Investments (Unaudited) September 30, 2024
KraneShares MSCI Emerging Markets ex China Index ETF (continued)
| | | Shares | | | Value | |
| COMMON STOCK (continued) | | | | | | | | |
| Consumer Discretionary — 0.0% | | | | | | | | |
| X5 Retail Group GDR*(A) | | | 915 | | | $ | — | |
| | | | | | | | | |
| Energy — 0.0% | | | | | | | | |
| Gazprom PJSC*(A)(B) | | | 89,700 | | | | — | |
| LUKOIL PJSC(A)(B) | | | 3,729 | | | | — | |
| Novatek PJSC GDR*(A) | | | 756 | | | | — | |
| Rosneft Oil PJSC(A)(B) | | | 10,270 | | | | — | |
| Tatneft PJSC(A) | | | 16,537 | | | | — | |
| | | | | | | | — | |
| Financials — 0.0% | | | | | | | | |
| Sberbank of Russia PJSC(A) | | | 99,330 | | | | — | |
| | | | | | | | | |
| Materials — 0.0% | | | | | | | | |
| Alrosa PJSC(A)(B) | | | 18,910 | | | | — | |
| GMK Norilskiy Nickel PAO(A)(B) | | | 67,000 | | | | — | |
| Novolipetsk Steel PJSC(A)(B) | | | 8,860 | | | | — | |
| Severstal PAO(A)(B) | | | 1,512 | | | | — | |
| | | | | | | | — | |
| TOTAL RUSSIA | | | | | | | — | |
| | | | | | | | | |
| SOUTH AFRICA — 6.2% | | | | | | | | |
| Communication Services — 0.4% | | | | | | | | |
| MTN Group | | | 34,266 | | | | 182,600 | |
| Vodacom Group | | | 17,985 | | | | 114,250 | |
| | | | | | | | 296,850 | |
| Consumer Discretionary — 1.6% | | | | | | | | |
| Naspers, Cl N | | | 4,682 | | | | 1,139,737 | |
| Woolworths Holdings | | | 37,765 | | | | 149,263 | |
| | | | | | | | 1,289,000 | |
| Consumer Staples — 0.6% | | | | | | | | |
| Bid | | | 6,846 | | | | 175,893 | |
| Clicks Group | | | 4,108 | | | | 94,632 | |
| Shoprite Holdings | | | 13,066 | | | | 224,266 | |
| | | | | | | | 494,791 | |
| Energy — 0.2% | | | | | | | | |
| Exxaro Resources | | | 10,915 | | | | 108,982 | |
| | | | | | | | | |
| Financials — 2.7% | | | | | | | | |
| Absa Group | | | 14,676 | | | | 149,413 | |
| Capitec Bank | | | 2,121 | | | | 374,723 | |
| Discovery | | | 14,594 | | | | 145,495 | |
| FirstRand | | | 91,459 | | | | 440,829 | |
| Nedbank Group | | | 9,252 | | | | 160,522 | |
The accompanying notes are an integral part of the financial statements.
Schedule of Investments (Unaudited) September 30, 2024
KraneShares MSCI Emerging Markets ex China Index ETF (continued)
| | | Shares | | | Value | |
| COMMON STOCK (continued) | | | | | | | | |
| Financials (continued) | | | | | | | | |
| Old Mutual | | | 174,788 | | | $ | 138,958 | |
| Remgro | | | 17,837 | | | | 162,849 | |
| Sanlam | | | 29,739 | | | | 151,866 | |
| Standard Bank Group | | | 26,925 | | | | 378,661 | |
| | | | | | | | 2,103,316 | |
| Industrials — 0.1% | | | | | | | | |
| Bidvest Group | | | 5,480 | | | | 93,108 | |
| | | | | | | | | |
| Materials — 0.6% | | | | | | | | |
| Anglo American Platinum | | | 1,429 | | | | 51,444 | |
| Gold Fields | | | 21,782 | | | | 339,803 | |
| Sasol | | | 11,367 | | | | 76,550 | |
| | | | | | | | 467,797 | |
| TOTAL SOUTH AFRICA | | | | | | | 4,853,844 | |
| | | | | | | | | |
| SOUTH KOREA — 15.5% | | | | | | | | |
| Communication Services — 0.7% | | | | | | | | |
| Kakao | | | 5,229 | | | | 144,550 | |
| NAVER | | | 2,567 | | | | 332,530 | |
| NCSoft | | | 378 | | | | 55,210 | |
| | | | | | | | 532,290 | |
| Consumer Discretionary — 1.9% | | | | | | | | |
| Coway | | | 880 | | | | 44,885 | |
| Hyundai Mobis | | | 1,401 | | | | 233,018 | |
| Hyundai Motor | | | 3,064 | | | | 571,703 | |
| Kia | | | 6,104 | | | | 466,307 | |
| LG Electronics | | | 2,325 | | | | 185,438 | |
| | | | | | | | 1,501,351 | |
| Consumer Staples — 0.6% | | | | | | | | |
| Amorepacific | | | 856 | | | | 96,682 | |
| KT&G | | | 3,437 | | | | 286,220 | |
| LG H&H | | | 203 | | | | 58,834 | |
| | | | | | | | 441,736 | |
| Energy — 0.3% | | | | | | | | |
| HD Hyundai | | | 2,144 | | | | 125,423 | |
| SK Innovation* | | | 1,325 | | | | 118,649 | |
| S-Oil | | | 756 | | | | 35,381 | |
| | | | | | | | 279,453 | |
| Financials — 2.4% | | | | | | | | |
| DB Insurance | | | 830 | | | | 71,277 | |
| Hana Financial Group | | | 7,339 | | | | 329,994 | |
| Industrial Bank of Korea | | | 4,262 | | | | 45,531 | |
The accompanying notes are an integral part of the financial statements.
Schedule of Investments (Unaudited) September 30, 2024
KraneShares MSCI Emerging Markets ex China Index ETF (continued)
| | | Shares | | | Value | |
| COMMON STOCK (continued) | | | | | | | | |
| Financials (continued) | | | | | | | | |
| KB Financial Group | | | 8,760 | | | $ | 541,932 | |
| Samsung Fire & Marine Insurance | | | 1,106 | | | | 291,364 | |
| Samsung Life Insurance | | | 1,152 | | | | 82,103 | |
| Shinhan Financial Group | | | 9,360 | | | | 397,247 | |
| Woori Financial Group | | | 12,287 | | | | 145,636 | |
| | | | | | | | 1,905,084 | |
| Health Care — 0.3% | | | | | | | | |
| Samsung Biologics* | | | 355 | | | | 265,225 | |
| | | | | | | | | |
| Industrials — 1.7% | | | | | | | | |
| Hyundai Engineering & Construction | | | 2,881 | | | | 67,195 | |
| Hyundai Glovis | | | 2,884 | | | | 269,279 | |
| Korea Aerospace Industries | | | 3,714 | | | | 147,969 | |
| Korea Shipbuilding & Offshore Engineering* | | | 632 | | | | 90,714 | |
| LG | | | 2,665 | | | | 161,200 | |
| Samsung C&T | | | 2,375 | | | | 250,268 | |
| Samsung Heavy Industries* | | | 23,023 | | | | 176,585 | |
| SK Holdings | | | 954 | | | | 111,763 | |
| SK Square* | | | 1,768 | | | | 109,252 | |
| | | | | | | | 1,384,225 | |
| Information Technology — 6.2% | | | | | | | | |
| LG Display* | | | 3,616 | | | | 30,251 | |
| Samsung Electro-Mechanics | | | 1,628 | | | | 164,954 | |
| Samsung Electronics | | | 65,632 | | | | 3,086,616 | |
| Samsung SDI | | | 1,102 | | | | 318,962 | |
| Samsung SDS | | | 576 | | | | 68,140 | |
| SK Hynix | | | 9,035 | | | | 1,206,325 | |
| | | | | | | | 4,875,248 | |
| Materials — 1.2% | | | | | | | | |
| Hyundai Steel | | | 3,155 | | | | 67,312 | |
| Korea Zinc | | | 128 | | | | 67,343 | |
| LG Chemical | | | 979 | | | | 266,891 | |
| Lotte Chemical | | | 303 | | | | 23,518 | |
| POSCO Holdings | | | 1,668 | | | | 491,076 | |
| | | | | | | | 916,140 | |
| Utilities — 0.2% | | | | | | | | |
| Korea Electric Power* | | | 10,378 | | | | 163,086 | |
| TOTAL SOUTH KOREA | | | | | | | 12,263,838 | |
| | | | | | | | | |
| TAIWAN — 28.4% | | | | | | | | |
| Communication Services — 1.1% | | | | | | | | |
| Chunghwa Telecom | | | 99,000 | | | | 392,603 | |
The accompanying notes are an integral part of the financial statements.
Schedule of Investments (Unaudited) September 30, 2024
KraneShares MSCI Emerging Markets ex China Index ETF (continued)
| | | Shares | | | Value | |
| COMMON STOCK (continued) | | | | | | | | |
| Communication Services (continued) | | | | | | | | |
| Far EasTone Telecommunications | | | 73,000 | | | $ | 209,220 | |
| Taiwan Mobile | | | 73,000 | | | | 265,274 | |
| | | | | | | | 867,097 | |
| Consumer Staples — 0.6% | | | | | | | | |
| President Chain Store | | | 25,000 | | | | 233,043 | |
| Uni-President Enterprises | | | 99,000 | | | | 272,789 | |
| | | | | | | | 505,832 | |
| Financials — 5.7% | | | | | | | | |
| Cathay Financial Holding | | | 148,000 | | | | 310,998 | |
| Chailease Holding | | | 50,607 | | | | 261,460 | |
| Chang Hwa Commercial Bank | | | 391,283 | | | | 221,319 | |
| CTBC Financial Holding | | | 368,000 | | | | 400,019 | |
| E.Sun Financial Holding | | | 322,735 | | | | 286,058 | |
| First Financial Holding | | | 326,103 | | | | 282,345 | |
| Fubon Financial Holding | | | 185,668 | | | | 530,372 | |
| Hua Nan Financial Holdings | | | 255,091 | | | | 207,158 | |
| KGI Financial Holding | | | 450,000 | | | | 234,623 | |
| Mega Financial Holding | | | 209,516 | | | | 260,187 | |
| Shanghai Commercial & Savings Bank | | | 153,000 | | | | 186,618 | |
| Shin Kong Financial Holding* | | | 746,000 | | | | 284,054 | |
| SinoPac Financial Holdings | | | 179,591 | | | | 137,617 | |
| Taishin Financial Holding | | | 572,312 | | | | 332,755 | |
| Taiwan Cooperative Financial Holding | | | 288,883 | | | | 236,426 | |
| Yuanta Financial Holding | | | 307,310 | | | | 307,829 | |
| | | | | | | | 4,479,838 | |
| Industrials — 0.3% | | | | | | | | |
| Far Eastern New Century | | | 222,000 | | | | 269,376 | |
| | | | | | | | | |
| Information Technology — 19.4% | | | | | | | | |
| Accton Technology | | | 9,000 | | | | 151,296 | |
| ASE Technology Holding | | | 77,000 | | | | 367,403 | |
| Asustek Computer | | | 25,000 | | | | 436,857 | |
| AUO | | | 199,600 | | | | 107,537 | |
| Catcher Technology | | | 25,000 | | | | 186,829 | |
| Delta Electronics | | | 50,000 | | | | 601,172 | |
| Hon Hai Precision Industry | | | 222,000 | | | | 1,315,311 | |
| Innolux | | | 224,401 | | | | 114,517 | |
| Lite-On Technology | | | 99,000 | | | | 311,267 | |
| MediaTek | | | 25,000 | | | | 928,223 | |
| Novatek Microelectronics | | | 25,000 | | | | 409,208 | |
| Pegatron | | | 76,000 | | | | 247,358 | |
| Quanta Computer | | | 75,000 | | | | 625,662 | |
| Taiwan Semiconductor Manufacturing | | | 302,000 | | | | 9,132,574 | |
The accompanying notes are an integral part of the financial statements.
Schedule of Investments (Unaudited) September 30, 2024
KraneShares MSCI Emerging Markets ex China Index ETF (continued)
| | | Shares | | | Value | |
| COMMON STOCK (continued) | | | | | | | | |
| Information Technology (continued) | | | | | | | | |
| United Microelectronics | | | 198,000 | | | $ | 336,606 | |
| | | | | | | | 15,271,820 | |
| Materials — 1.3% | | | | | | | | |
| Asia Cement | | | 99,000 | | | | 149,377 | |
| China Steel | | | 326,000 | | | | 238,475 | |
| Formosa Chemicals & Fibre | | | 75,000 | | | | 102,974 | |
| Formosa Plastics | | | 99,000 | | | | 167,364 | |
| Nan Ya Plastics | | | 124,000 | | | | 180,241 | |
| TCC Group Holdings | | | 147,404 | | | | 157,435 | |
| | | | | | | | 995,866 | |
| TOTAL TAIWAN | | | | | | | 22,389,829 | |
| | | | | | | | | |
| THAILAND — 1.9% | | | | | | | | |
| Communication Services — 0.2% | | | | | | | | |
| Advanced Info Service | | | 23,500 | | | | 189,884 | |
| | | | | | | | 189,884 | |
| Consumer Staples — 0.3% | | | | | | | | |
| CP ALL | | | 125,200 | | | | 254,855 | |
| | | | | | | | 254,855 | |
| Energy — 0.5% | | | | | | | | |
| PTT | | | 256,400 | | | | 270,922 | |
| PTT Exploration & Production | | | 35,200 | | | | 143,305 | |
| | | | | | | | 414,227 | |
| Health Care — 0.3% | | | | | | | | |
| Bangkok Dusit Medical Services, Cl F | | | 230,500 | | | | 214,902 | |
| | | | | | | | 214,902 | |
| Industrials — 0.3% | | | | | | | | |
| Airports of Thailand | | | 114,400 | | | | 227,538 | |
| | | | | | | | 227,538 | |
| Materials — 0.2% | | | | | | | | |
| PTT Global Chemical | | | 62,500 | | | | 58,271 | |
| Siam Cement | | | 12,200 | | | | 91,374 | |
| | | | | | | | 149,645 | |
| Real Estate — 0.1% | | | | | | | | |
| Central Pattana | | | 35,200 | | | | 73,294 | |
| | | | | | | | 73,294 | |
| TOTAL THAILAND | | | | | | | 1,524,345 | |
The accompanying notes are an integral part of the financial statements.
Schedule of Investments (Unaudited) September 30, 2024
KraneShares MSCI Emerging Markets ex China Index ETF (continued)
| | | Shares | | | Value | |
| COMMON STOCK (continued) | | | | | | | | |
| TÜRKIYE — 0.8% | | | | | | | | |
| Consumer Staples — 0.3% | | | | | | | | |
| BIM Birlesik Magazalar | | | 17,095 | | | $ | 248,145 | |
| | | | | | | | | |
| Energy — 0.2% | | | | | | | | |
| Turkiye Petrol Rafinerileri | | | 34,228 | | | | 155,385 | |
| | | | | | | | | |
| Financials — 0.3% | | | | | | | | |
| Akbank | | | 122,312 | | | | 220,387 | |
| TOTAL TÜRKIYE | | | | | | | 623,917 | |
| | | | | | | | | |
| UNITED ARAB EMIRATES — 1.1% | | | | | | | | |
| Communication Services — 0.4% | | | | | | | | |
| Emirates Telecommunications Group PJSC | | | 53,501 | | | | 269,471 | |
| | | | | | | | | |
| Financials — 0.5% | | | | | | | | |
| Abu Dhabi Commercial Bank PJSC | | | 54,295 | | | | 124,467 | |
| First Abu Dhabi Bank PJSC | | | 80,020 | | | | 299,338 | |
| | | | | | | | 423,805 | |
| Real Estate — 0.2% | | | | | | | | |
| Emaar Properties PJSC | | | 59,940 | | | | 142,303 | |
| TOTAL UNITED ARAB EMIRATES | | | | | | | 835,579 | |
| | | | | | | | | |
| UNITED KINGDOM — 0.3% | | | | | | | | |
| Materials — 0.3% | | | | | | | | |
| Anglogold Ashanti | | | 8,065 | | | | 214,812 | |
| TOTAL UNITED KINGDOM | | | | | | | 214,812 | |
| | | | | | | | | |
| UNITED STATES — 0.1% | | | | | | | | |
| Consumer Staples — 0.1% | | | | | | | | |
| JBS | | | 14,800 | | | | 85,961 | |
| TOTAL UNITED STATES | | | | | | | 85,961 | |
| | | | | | | | | |
TOTAL COMMON STOCK
(Cost $67,419,872) | | | | | | | 76,780,801 | |
| | | | | | | | | |
| PREFERRED STOCK — 2.8% | | | | | | | | |
| BRAZIL — 1.9% | | | | | | | | |
| Energy — 0.7% | | | | | | | | |
| Petroleo Brasileiro(C) | | | 82,500 | | | | 545,526 | |
| | | | | | | | | |
| Financials — 1.1% | | | | | | | | |
| Banco Bradesco(C) | | | 42,471 | | | | 114,643 | |
| Itau Unibanco Holding(C) | | | 79,600 | | | | 527,811 | |
| Itausa(C) | | | 105,076 | | | | 213,595 | |
| | | | | | | | 856,049 | |
The accompanying notes are an integral part of the financial statements.
Schedule of Investments (Unaudited) September 30, 2024
KraneShares MSCI Emerging Markets ex China Index ETF (continued)
| | | Shares | | | Value | |
| PREFERRED STOCK (continued) | | | | | | | | |
| Materials — 0.1% | | | | | | | | |
| Gerdau(C) | | | 21,290 | | | $ | 74,670 | |
| | | | | | | | | |
| Utilities — 0.0% | | | | | | | | |
| Cia Energetica de Minas Gerais(C) | | | 26,500 | | | | 55,474 | |
| TOTAL BRAZIL | | | | | | | 1,531,719 | |
| | | | | | | | | |
| CHILE — 0.2% | | | | | | | | |
| Materials — 0.2% | | | | | | | | |
| Sociedad Quimica y Minera de Chile(C) | | | 3,101 | | | | 128,837 | |
| | | | | | | | | |
| COLOMBIA — 0.1% | | | | | | | | |
| Financials — 0.1% | | | | | | | | |
| Bancolombia(C) | | | 7,516 | | | | 59,746 | |
| | | | | | | | | |
| RUSSIA — 0.0% | | | | | | | | |
| Energy — 0.0% | | | | | | | | |
| Surgutneftegas PJSC(A)(C) | | | 50,900 | | | | — | |
| | | | | | | | | |
| SOUTH KOREA — 0.6% | | | | | | | | |
| Information Technology — 0.6% | | | | | | | | |
| Samsung Electronics(C) | | | 13,434 | | | | 522,896 | |
| | | | | | | | | |
TOTAL PREFERRED STOCK
(Cost $2,323,819) | | | | | | | 2,243,198 | |
| | | | | | | | | |
TOTAL INVESTMENTS — 100.2%
(Cost $69,743,691) | | | | | | | 79,023,999 | |
| OTHER ASSETS LESS LIABILITIES – (0.2)% | | | | | | | (150,668 | ) |
| NET ASSETS - 100% | | | | | | $ | 78,873,331 | |
| ‡ | Industries are utilized for compliance purposes, whereas sectors are utilized for reporting. |
| * | Non-income producing security. |
| † | Real Estate Investment Trust |
| (A) | Due to the financial uncertainty surrounding Russia and its markets, and the inability to liquidate the positions due to market closures and restrictions, the Russian securities have been determined to be worthless. |
| (B) | Level 3 security in accordance with fair value hierarchy. |
| (C) | Currently, no stated interest rate. |
Amounts designated as “—” are $0 or have been rounded to $0.
The accompanying notes are an integral part of the financial statements.
Schedule of Investments (Unaudited) September 30, 2024
KraneShares MSCI Emerging Markets ex China Index ETF (continued)
The following summarizes the market value of the Fund’s investments used as of September 30, 2024, based on the inputs used to value them:
| Investments in Securities | | Level 1 | | | Level 2 | | | Level 3^ | | | Total | |
| Common Stock | | | | | | | | | | | | | | | | |
| Brazil | | $ | 3,832,058 | | | $ | — | | | $ | — | | | $ | 3,832,058 | |
| Chile | | | 479,855 | | | | — | | | | — | | | | 479,855 | |
| Colombia | | | 107,668 | | | | — | | | | — | | | | 107,668 | |
| Czechia | | | 144,179 | | | | — | | | | — | | | | 144,179 | |
| Egypt | | | 77,754 | | | | — | | | | — | | | | 77,754 | |
| Greece | | | 67,283 | | | | — | | | | — | | | | 67,283 | |
| Hungary | | | 332,690 | | | | — | | | | — | | | | 332,690 | |
| India | | | 18,166,928 | | | | — | | | | — | | | | 18,166,928 | |
| Indonesia | | | 2,302,330 | | | | — | | | | — | | | | 2,302,330 | |
| Malaysia | | | 1,954,946 | | | | — | | | | — | | | | 1,954,946 | |
| Mexico | | | 2,904,511 | | | | — | | | | — | | | | 2,904,511 | |
| Peru | | | 485,243 | | | | — | | | | — | | | | 485,243 | |
| Philippines | | | 850,578 | | | | — | | | | — | | | | 850,578 | |
| Poland. | | | 1,237,384 | | | | — | | | | — | | | | 1,237,384 | |
| Qatar | | | 851,661 | | | | — | | | | — | | | | 851,661 | |
| Romania | | | 193,608 | | | | — | | | | — | | | | 193,608 | |
| Russia | | | — | ‡‡ | | | — | | | | — | ‡‡ | | | — | |
| South Africa | | | 4,853,844 | | | | — | | | | — | | | | 4,853,844 | |
| South Korea | | | 12,263,838 | | | | — | | | | — | | | | 12,263,838 | |
| Taiwan | | | 22,389,829 | | | | — | | | | — | | | | 22,389,829 | |
| Thailand | | | | | | | | | | | | | | | | |
| Communication Services | | | 48,481 | | | | 141,403 | | | | — | | | | 189,884 | |
| Consumer Staples | | | 62,085 | | | | 192,770 | | | | — | | | | 254,855 | |
| Energy | | | 102,907 | | | | 311,320 | | | | — | | | | 414,227 | |
| Health Care | | | 26,105 | | | | 188,797 | | | | — | | | | 214,902 | |
| Industrials | | | 52,708 | | | | 174,830 | | | | — | | | | 227,538 | |
| Materials | | | 36,833 | | | | 112,812 | | | | — | | | | 149,645 | |
| Real Estate | | | 17,074 | | | | 56,220 | | | | — | | | | 73,294 | |
| Türkiye | | | 623,917 | | | | — | | | | — | | | | 623,917 | |
| United Arab Emirates | | | 835,579 | | | | — | | | | — | | | | 835,579 | |
| United Kingdom | | | 214,812 | | | | — | | | | — | | | | 214,812 | |
| United States | | | 85,961 | | | | — | | | | — | | | | 85,961 | |
| Total Common Stock | | | 75,602,649 | | | | 1,178,152 | | | | — | | | | 76,780,801 | |
| Preferred Stock | | | | | | | | | | | | | | | | |
| Brazil | | | 1,531,719 | | | | — | | | | — | | | | 1,531,719 | |
| Chile | | | 128,837 | | | | — | | | | — | | | | 128,837 | |
| Colombia | | | 59,746 | | | | — | | | | — | | | | 59,746 | |
| Russia | | | — | ‡‡ | | | — | | | | — | | | | — | |
| South Korea | | | 522,896 | | | | — | | | | — | | | | 522,896 | |
| Total Preferred Stock | | | 2,243,198 | | | | — | | | | — | | | | 2,243,198 | |
| Total Investments in Securities | | $ | 77,845,847 | | | $ | 1,178,152 | | | $ | — | | | $ | 79,023,999 | |
| ^ | A reconciliation of Level 3 investments, including certain disclosures related to significant inputs used in valuing Level 3 investments is only presented when the Fund has over 1% of Level 3 investments at the end of the period in relation to net assets. |
The accompanying notes are an integral part of the financial statements.
Schedule of Investments (Unaudited) September 30, 2024
KraneShares MSCI Emerging Markets ex China Index ETF (concluded)
| ‡‡ | Security or securities with a market value of $0. |
Amounts designated as “—” are $0 or have been rounded to $0.
See “Glossary” for abbreviations.
The accompanying notes are an integral part of the financial statements.
Schedule of Investments (Unaudited) September 30, 2024
KraneShares Value Line® Dynamic Dividend Equity Index ETF
| | | Shares | | | Value | |
| COMMON STOCK — 100.1%‡ | | | | | | | | |
| UNITED STATES — 100.1% | | | | | | | | |
| Communication Services — 9.6% | | | | | | | | |
| Alphabet, Cl C | | | 6,986 | | | $ | 1,167,989 | |
| Comcast, Cl A | | | 12,293 | | | | 513,479 | |
| Meta Platforms, Cl A | | | 1,569 | | | | 898,158 | |
| Netflix* | | | 145 | | | | 102,844 | |
| Verizon Communications | | | 11,358 | | | | 510,088 | |
| | | | | | | | 3,192,558 | |
| Consumer Discretionary — 6.4% | | | | | | | | |
| Amazon.com* | | | 5,213 | | | | 971,338 | |
| Dick’s Sporting Goods | | | 457 | | | | 95,376 | |
| Home Depot | | | 1,916 | | | | 776,363 | |
| McDonald’s | | | 629 | | | | 191,537 | |
| Williams-Sonoma | | | 639 | | | | 98,994 | |
| | | | | | | | 2,133,608 | |
| Consumer Staples — 7.2% | | | | | | | | |
| Altria Group | | | 10,164 | | | | 518,771 | |
| Cal-Maine Foods | | | 5,855 | | | | 438,188 | |
| Coca-Cola | | | 1,568 | | | | 112,677 | |
| Colgate-Palmolive | | | 1,492 | | | | 154,885 | |
| Flowers Foods | | | 12,092 | | | | 278,962 | |
| Kimberly-Clark | | | 3,586 | | | | 510,216 | |
| Philip Morris International | | | 631 | | | | 76,603 | |
| Procter & Gamble | | | 1,746 | | | | 302,407 | |
| | | | | | | | 2,392,709 | |
| Energy — 5.3% | | | | | | | | |
| Chevron | | | 2,173 | | | | 320,018 | |
| DT Midstream | | | 6,221 | | | | 489,344 | |
| Enterprise Products Partners | | | 6,746 | | | | 196,376 | |
| Hess Midstream, Cl A | | | 12,707 | | | | 448,176 | |
| Phillips 66 | | | 2,350 | | | | 308,907 | |
| | | | | | | | 1,762,821 | |
| Financials — 10.3% | | | | | | | | |
| Allstate | | | 781 | | | | 148,117 | |
| Annaly Capital Management† | | | 19,591 | | | | 393,191 | |
| BlackRock, Cl A | | | 452 | | | | 429,179 | |
| Citizens Financial Group | | | 1,020 | | | | 41,891 | |
| CME Group, Cl A | | | 651 | | | | 143,643 | |
| Goldman Sachs Group | | | 1,177 | | | | 582,744 | |
| JPMorgan Chase | | | 1,673 | | | | 352,769 | |
| Morgan Stanley | | | 2,111 | | | | 220,051 | |
| Regions Financial | | | 3,488 | | | | 81,375 | |
| T Rowe Price Group | | | 3,890 | | | | 423,738 | |
The accompanying notes are an integral part of the financial statements.
Schedule of Investments (Unaudited) September 30, 2024
KraneShares Value Line® Dynamic Dividend Equity Index ETF (continued)
| | | Shares | | | Value | |
| COMMON STOCK (continued) | | | | | | | | |
| Financials (continued) | | | | | | | | |
| Virtu Financial, Cl A | | | 5,438 | | | $ | 165,642 | |
| Western Union | | | 34,536 | | | | 412,014 | |
| | | | | | | | 3,394,354 | |
| Health Care — 9.9% | | | | | | | | |
| AbbVie | | | 2,182 | | | | 430,901 | |
| Amgen | | | 927 | | | | 298,689 | |
| Bristol-Myers Squibb | | | 10,753 | | | | 556,360 | |
| CVS Health | | | 587 | | | | 36,910 | |
| Eli Lilly | | | 438 | | | | 388,042 | |
| Gilead Sciences | | | 6,107 | | | | 512,011 | |
| Johnson & Johnson | | | 926 | | | | 150,068 | |
| Merck | | | 3,165 | | | | 359,417 | |
| Pfizer | | | 18,650 | | | | 539,731 | |
| | | | | | | | 3,272,129 | |
| Industrials — 12.6% | | | | | | | | |
| Automatic Data Processing | | | 1,890 | | | | 523,020 | |
| Cummins | | | 884 | | | | 286,230 | |
| Fastenal | | | 6,228 | | | | 444,804 | |
| General Dynamics | | | 166 | | | | 50,165 | |
| Lockheed Martin | | | 420 | | | | 245,515 | |
| MSC Industrial Direct, Cl A | | | 4,202 | | | | 361,624 | |
| Paychex | | | 3,826 | | | | 513,411 | |
| Powell Industries | | | 392 | | | | 87,020 | |
| Robert Half | | | 2,867 | | | | 193,264 | |
| RTX | | | 664 | | | | 80,450 | |
| Snap-on | | | 598 | | | | 173,247 | |
| Union Pacific | | | 1,243 | | | | 306,375 | |
| United Parcel Service, Cl B | | | 3,111 | | | | 424,154 | |
| Vertiv Holdings, Cl A | | | 1,761 | | | | 175,202 | |
| Watsco | | | 608 | | | | 299,063 | |
| | | | | | | | 4,163,544 | |
| Information Technology — 25.4% | | | | | | | | |
| Apple | | | 7,475 | | | | 1,741,675 | |
| AppLovin, Cl A* | | | 676 | | | | 88,252 | |
| Broadcom | | | 343 | | | | 59,167 | |
| Cisco Systems | | | 12,256 | | | | 652,264 | |
| Dell Technologies, Cl C | | | 443 | | | | 52,513 | |
| International Business Machines | | | 1,823 | | | | 403,029 | |
| Microsoft | | | 4,495 | | | | 1,934,199 | |
| NetApp | | | 1,487 | | | | 183,659 | |
| NVIDIA | | | 21,504 | | | | 2,611,446 | |
| Oracle | | | 349 | | | | 59,470 | |
| Super Micro Computer* | | | 81 | | | | 33,728 | |
The accompanying notes are an integral part of the financial statements.
Schedule of Investments (Unaudited) September 30, 2024
KraneShares Value Line® Dynamic Dividend Equity Index ETF (concluded)
| | | Shares | | | Value | |
| COMMON STOCK (continued) | | | | | | | | |
| Information Technology (continued) | | | | | | | | |
| Texas Instruments | | | 2,959 | | | $ | 611,241 | |
| | | | | | | | 8,430,643 | |
| Materials — 4.2% | | | | | | | | |
| Air Products and Chemicals | | | 1,757 | | | | 523,129 | |
| Dow | | | 8,481 | | | | 463,317 | |
| Kronos Worldwide | | | 4,727 | | | | 58,851 | |
| Packaging Corp of America | | | 1,604 | | | | 345,502 | |
| | | | | | | | 1,390,799 | |
| Real Estate — 2.6% | | | | | | | | |
| Equinix† | | | 46 | | | | 40,831 | |
| Public Storage† | | | 1,525 | | | | 554,902 | |
| Simon Property Group† | | | 1,608 | | | | 271,784 | |
| | | | | | | | 867,517 | |
| Utilities — 6.6% | | | | | | | | |
| American Electric Power | | | 2,062 | | | | 211,561 | |
| Consolidated Edison | | | 3,067 | | | | 319,367 | |
| Duke Energy | | | 1,066 | | | | 122,910 | |
| Entergy | | | 2,060 | | | | 271,116 | |
| Evergy | | | 985 | | | | 61,080 | |
| ONE Gas | | | 2,471 | | | | 183,892 | |
| Public Service Enterprise Group | | | 2,529 | | | | 225,612 | |
| Spire | | | 1,192 | | | | 80,210 | |
| UGI | | | 8,124 | | | | 203,262 | |
| WEC Energy Group | | | 5,372 | | | | 516,679 | |
| | | | | | | | 2,195,689 | |
| TOTAL UNITED STATES | | | | | | | 33,196,371 | |
| | | | | | | | | |
TOTAL COMMON STOCK
(Cost $29,124,919) | | | | | | | 33,196,371 | |
| | | | | | | | | |
TOTAL INVESTMENTS — 100.1%
(Cost $29,124,919) | | | | | | | 33,196,371 | |
| OTHER ASSETS LESS LIABILITIES – (0.1)% | | | | | | | (24,678 | ) |
| NET ASSETS - 100% | | | | | | $ | 33,171,693 | |
| ‡ | Industries are utilized for compliance purposes, whereas sectors are utilized for reporting. |
| * | Non-income producing security. |
| † | Real Estate Investment Trust |
As of September 30, 2024, all of the Fund’s investments were considered Level 1 of the fair value hierarchy, in accordance with the authoritative guidance on fair value measurements and disclosure under U.S. generally accepted accounting principles.
See “Glossary” for abbreviations.
The accompanying notes are an integral part of the financial statements.
Schedule of Investments (Unaudited) September 30, 2024
KraneShares Mount Lucas Managed Futures Index Strategy ETF†
| | | Face Amount | | | Value | |
| U.S. TREASURY OBLIGATIONS — 73.6% | | | | | | | | |
| U.S. Treasury Bills | | | | | | | | |
| 5.177%, 10/03/2024(A) | | $ | 55,000,000 | | | $ | 54,985,800 | |
| 5.165%, 10/15/2024(A) | | | 55,000,000 | | | | 54,899,087 | |
| 5.083%, 10/29/2024(A) | | | 55,000,000 | | | | 54,797,340 | |
| 4.968%, 11/05/2024(A) | | | 55,000,000 | | | | 54,750,606 | |
| 4.581%, 11/29/2024(A) | | | 55,000,000 | | | | 54,578,221 | |
| | | | | | | | | |
TOTAL U.S. TREASURY OBLIGATIONS
(Cost $273,985,901) | | | | | | | 274,011,054 | |
| | | | | | | | | |
TOTAL INVESTMENTS — 73.6%
(Cost $273,985,901) | | | | | | | 274,011,054 | |
| OTHER ASSETS LESS LIABILITIES – 26.4% | | | | | | | 98,034,490 | |
| NET ASSETS - 100% | | | | | | $ | 372,045,544 | |
A list of the open futures contracts held by the Fund at September 30, 2024, is as follows:
| Type of Contract | | Number of
Contracts | | | Expiration
Date | | | Notional
Amount | | | Value | | | Unrealized
Appreciation/
(Depreciation) | |
| Long Contracts | | | | | | | | | | | | | | | | | | |
| AUD Currency | | 899 | | | Dec-2024 | | | $ | 60,085,763 | | | $ | 62,251,255 | | | $ | 2,165,492 | |
| British Pound | | 743 | | | Dec-2024 | | | | 60,635,131 | | | | 62,105,512 | | | | 1,470,381 | |
| CAD Currency | | 39 | | | Dec-2024 | | | | 2,906,793 | | | | 2,889,510 | | | | (17,283 | ) |
| Canadian 10-Year Bond | | 1,038 | | | Dec-2024 | | | | 95,476,844 | | | | 95,944,678 | | | | 754,009 | |
| Copper^ | | 150 | | | Dec-2024 | | | | 15,679,458 | | | | 17,073,750 | | | | 1,394,292 | |
| Euro FX | | 439 | | | Dec-2024 | | | | 60,735,912 | | | | 61,276,169 | | | | 540,257 | |
| Euro-Bund 10-Year Bond | | 649 | | | Dec-2024 | | | | 96,408,355 | | | | 97,471,008 | | | | 600,184 | |
| Gold^ | | 101 | | | Dec-2024 | | | | 25,344,310 | | | | 26,859,940 | | | | 1,515,630 | |
| Japanese 10-Year Bond | | 97 | | | Dec-2024 | | | | 98,345,294 | | | | 97,624,282 | | | | 254,512 | |
| Japanese Yen | | 702 | | | Dec-2024 | | | | 62,646,782 | | | | 61,692,638 | | | | (954,145 | ) |
| Long Gilt 10-Year Bond | | 738 | | | Dec-2024 | | | | 96,723,311 | | | | 97,117,986 | | | | (430,461 | ) |
| Swiss Franc | | 410 | | | Dec-2024 | | | | 60,911,726 | | | | 61,041,313 | | | | 129,587 | |
| Ultra 10-Year U.S Treasury Note | | 815 | | | Dec-2024 | | | | 96,365,357 | | | | 96,411,953 | | | | 46,596 | |
| | | | | | | | | | 832,265,036 | | | | 839,759,994 | | | | 7,469,051 | |
| Short Contracts | | | | | | | | | | | | | | | | | | |
| Corn^ | | (1,276) | | | Dec-2024 | | | | (28,757,959 | ) | | | (27,099,050 | ) | | | 1,658,909 | |
| Gasoline^ | | (301) | | | Dec-2024 | | | | (25,471,940 | ) | | | (24,098,180 | ) | | | 1,373,760 | |
| Live Cattle^ | | (120) | | | Dec-2024 | | | | (8,584,738 | ) | | | (8,870,400 | ) | | | (285,662 | ) |
| Natural Gas^ | | (842) | | | Dec-2024 | | | | (26,948,191 | ) | | | (28,164,900 | ) | | | (1,216,709 | ) |
| NY Harbor ULSD^ | | (265) | | | Dec-2024 | | | | (25,857,362 | ) | | | (24,075,303 | ) | | | 1,782,059 | |
| Soybean^ | | (512) | | | Nov-2024 | | | | (28,775,223 | ) | | | (27,059,200 | ) | | | 1,716,023 | |
| Sugar No. 11^ | | (386) | | | Mar-2025 | | | | (8,278,270 | ) | | | (9,714,231 | ) | | | (1,435,961 | ) |
| Wheat^ | | (928) | | | Dec-2024 | | | | (27,607,133 | ) | | | (27,097,600 | ) | | | 509,533 | |
| WTI Crude Oil^ | | (356) | | | Dec-2024 | | | | (25,139,660 | ) | | | (24,126,120 | ) | | | 1,013,541 | |
| | | | | | | | | | (205,420,476 | ) | | | (200,304,984 | ) | | | 5,115,493 | |
| | | | | | | | | $ | 626,844,560 | | | $ | 639,455,010 | | | $ | 12,584,544 | |
The accompanying notes are an integral part of the financial statements.
Schedule of Investments (Unaudited) September 30, 2024
KraneShares Mount Lucas Managed Futures Index Strategy ETF† (concluded)
| ^ | Security is held by the KFA MLM Index Subsidiary, Ltd. as of September 30, 2024. |
| † | Formerly KFA Mount Lucas Managed Futures Index Strategy ETF, effective August 1, 2024. |
| (A) | Interest rate represents the security’s effective yield at the time of purchase. |
The following summarizes the market value of the Fund’s investments and other financial instruments used as of September 30, 2024, based on the inputs used to value them:
| Investments in Securities | | Level 1 | | | Level 2 | | | Level 3 | | | Total | |
| U.S. Treasury Obligations | | $ | — | | | $ | 274,011,054 | | | $ | — | | | $ | 274,011,054 | |
| Total Investments in Securities | | $ | — | | | $ | 274,011,054 | | | $ | — | | | $ | 274,011,054 | |
| Other Financial Instruments | | Level 1 | | | Level 2 | | | Level 3 | | | Total | |
| Futures Contracts* | | | | | | | | | | | | | | | | |
| Unrealized Appreciation | | $ | 16,924,765 | | | $ | — | | | $ | — | | | $ | 16,924,765 | |
| Unrealized Depreciation | | | (4,340,221 | ) | | | — | | | | — | | | | (4,340,221 | ) |
| Total Other Financial Instruments | | $ | 12,584,544 | | | $ | — | | | $ | — | | | $ | 12,584,544 | |
| * | Futures Contracts are valued at the unrealized appreciation (depreciation) on the instrument. |
Amounts designated as “—” are $0 or have been rounded to $0.
See “Glossary” for abbreviations.
The accompanying notes are an integral part of the financial statements.
Schedule of Investments (Unaudited) September 30, 2024
KraneShares SSE STAR Market 50 Index ETF
| | | Shares | | | Value | |
| COMMON STOCK — 99.4%‡ | | | | | | | | |
| CHINA — 99.4% | | | | | | | | |
| Consumer Discretionary — 5.9% | | | | | | | | |
| Beijing Roborock Technology, Cl A | | | 22,098 | | | $ | 877,539 | |
| Ninebot | | | 85,756 | | | | 590,605 | |
| Tianneng Battery Group, Cl A | | | 23,323 | | | | 112,972 | |
| | | | | | | | 1,581,116 | |
| Health Care — 12.5% | | | | | | | | |
| APT Medical, Cl A | | | 11,613 | | | | 679,309 | |
| Bloomage Biotechnology, Cl A | | | 33,018 | | | | 332,602 | |
| iRay Technology, Cl A | | | 12,230 | | | | 221,650 | |
| MGI Tech, Cl A* | | | 35,614 | | | | 259,473 | |
| Shanghai Junshi Biosciences, Cl A* | | | 91,937 | | | | 417,606 | |
| Shanghai United Imaging Healthcare, Cl A | | | 56,495 | | | | 1,033,251 | |
| Sichuan Biokin Pharmaceutical, Cl A* | | | 13,744 | | | | 384,356 | |
| | | | | | | | 3,328,247 | |
| Industrials — 3.1% | | | | | | | | |
| AVIC Chengdu UAS, Cl A | | | 34,703 | | | | 188,424 | |
| Baimtec Material, Cl A | | | 15,423 | | | | 121,204 | |
| Sany Renewable Energy, Cl A | | | 41,318 | | | | 170,322 | |
| Zhuzhou CRRC Times Electric, Cl A | | | 44,672 | | | | 338,743 | |
| | | | | | | | 818,693 | |
| Information Technology — 74.5% | | | | | | | | |
| ACM Research Shanghai, Cl A | | | 14,934 | | | | 225,099 | |
| Advanced Micro-Fabrication Equipment China, Cl A | | | 74,384 | | | | 1,743,047 | |
| Amlogic Shanghai, Cl A | | | 57,351 | | | | 576,489 | |
| ASR Microelectronics, Cl A* | | | 35,842 | | | | 202,444 | |
| Beijing Kingsoft Office Software, Cl A | | | 39,592 | | | | 1,507,049 | |
| Biwin Storage Technology, Cl A* | | | 44,248 | | | | 383,135 | |
| Cambricon Technologies, Cl A* | | | 35,696 | | | | 1,474,835 | |
| China Railway Signal & Communication, Cl A | | | 443,219 | | | | 398,340 | |
| China Resources Microelectronics, Cl A | | | 90,725 | | | | 611,216 | |
| CSI Solar, Cl A | | | 82,148 | | | | 163,976 | |
| Everdisplay Optronics Shanghai, Cl A* | | | 712,404 | | | | 256,515 | |
| GalaxyCore, Cl A | | | 133,700 | | | | 281,397 | |
| Guobo Electronics, Cl A | | | 12,257 | | | | 84,029 | |
| Hangzhou EZVIZ Network, Cl A | | | 26,991 | | | | 130,662 | |
| Hwatsing Technology, Cl A | | | 24,341 | | | | 562,981 | |
| Hygon Information Technology, Cl A | | | 159,330 | | | | 2,351,254 | |
| Jinko Solar, Cl A | | | 685,843 | | | | 863,349 | |
| Loongson Technology, Cl A* | | | 27,488 | | | | 469,821 | |
| Montage Technology, Cl A | | | 156,491 | | | | 1,495,448 | |
| National Silicon Industry Group, Cl A | | | 282,473 | | | | 766,053 | |
| Nexchip Semiconductor, Cl A* | | | 68,759 | | | | 172,029 | |
| Piotech, Cl A | | | 23,848 | | | | 490,690 | |
The accompanying notes are an integral part of the financial statements.
Schedule of Investments (Unaudited) September 30, 2024
KraneShares SSE STAR Market 50 Index ETF (concluded)
| | | Shares | | | Value | |
| COMMON STOCK (continued) | | | | | | | | |
| Information Technology (continued) | | | | | | | | |
| Qi An Xin Technology Group, Cl A* | | | 46,968 | | | $ | 213,947 | |
| Shanghai BOCHU Electronic Technology, Cl A | | | 14,084 | | | | 424,030 | |
| Shanghai Fudan Microelectronics Group, Cl A | | | 54,983 | | | | 277,796 | |
| Shenzhen Transsion Holdings, Cl A | | | 77,405 | | | | 1,193,708 | |
| SICC, Cl A* | | | 29,456 | | | | 265,113 | |
| SUPCON Technology, Cl A | | | 108,295 | | | | 778,482 | |
| Trina Solar, Cl A | | | 186,741 | | | | 598,220 | |
| United Nova Technology, Cl A* | | | 241,519 | | | | 145,975 | |
| Verisilicon Microelectronics Shanghai, Cl A* | | | 59,969 | | | | 308,300 | |
| Xinjiang Daqo New Energy, Cl A | | | 110,274 | | | | 412,819 | |
| | | | | | | | 19,828,248 | |
| Materials — 3.4% | | | | | | | | |
| Cathay Biotech, Cl A | | | 49,987 | | | | 339,549 | |
| Western Superconducting Technologies, Cl A | | | 77,934 | | | | 516,913 | |
| Zhongfu Shenying Carbon Fiber, Cl A | | | 17,526 | | | | 55,969 | |
| | | | | | | | 912,431 | |
| TOTAL CHINA | | | | | | | 26,468,735 | |
| | | | | | | | | |
TOTAL COMMON STOCK
(Cost $28,488,063) | | | | | | | 26,468,735 | |
| | | | | | | | | |
TOTAL INVESTMENTS — 99.4%
(Cost $28,488,063) | | | | | | | 26,468,735 | |
| OTHER ASSETS LESS LIABILITIES – 0.6% | | | | | | | 149,850 | |
| NET ASSETS - 100% | | | | | | $ | 26,618,585 | |
| ‡ | Industries are utilized for compliance purposes, whereas sectors are utilized for reporting. |
| * | Non-income producing security. |
As of September 30, 2024, all of the Fund’s investments were considered Level 1 of the fair value hierarchy, in accordance with the authoritative guidance on fair value measurements and disclosure under U.S. generally accepted accounting principles.
See “Glossary” for abbreviations.
The accompanying notes are an integral part of the financial statements.
Schedule of Investments (Unaudited) September 30, 2024
KraneShares Hang Seng TECH Index ETF
| | | Shares | | | Value | |
| COMMON STOCK — 93.7%‡ | | | | | | | | |
| CHINA — 92.2% | | | | | | | | |
| Communication Services — 24.0% | | | | | | | | |
| Baidu, Cl A* | | | 33,200 | | | $ | 451,358 | |
| Bilibili, Cl Z* | | | 13,800 | | | | 344,311 | |
| China Literature* | | | 21,800 | | | | 90,933 | |
| Kingsoft | | | 44,200 | | | | 168,151 | |
| Kuaishou Technology, Cl B* | | | 78,400 | | | | 553,620 | |
| NetEase | | | 25,105 | | | | 486,424 | |
| Tencent Holdings | | | 16,200 | | | | 927,263 | |
| Weibo, Cl A | | | 260 | | | | 2,728 | |
| | | | | | | | 3,024,788 | |
| Consumer Discretionary — 45.0% | | | | | | | | |
| Alibaba Group Holding | | | 76,200 | | | | 1,079,112 | |
| Haier Smart Home, Cl A | | | 113,826 | | | | 457,209 | |
| JD.com, Cl A | | | 58,110 | | | | 1,250,093 | |
| Li Auto, Cl A* | | | 37,900 | | | | 527,453 | |
| Meituan, Cl B* | | | 51,180 | | | | 1,133,307 | |
| NIO, Cl A* | | | 6,660 | | | | 48,316 | |
| Tongcheng Travel Holdings | | | 65,200 | | | | 167,543 | |
| Trip.com Group* | | | 8,000 | | | | 505,697 | |
| XPeng, Cl A* | | | 75,300 | | | | 513,310 | |
| | | | | | | | 5,682,040 | |
| Consumer Staples — 4.0% | | | | | | | | |
| Alibaba Health Information Technology* | | | 300,000 | | | | 206,630 | |
| East Buy Holding* | | | 22,000 | | | | 55,967 | |
| JD Health International* | | | 52,300 | | | | 235,661 | |
| | | | | | | | 498,258 | |
| Financials — 0.6% | | | | | | | | |
| ZhongAn Online P&C Insurance, Cl H* | | | 39,800 | | | | 81,265 | |
| | | | | | | | | |
| Information Technology — 18.6% | | | | | | | | |
| BYD Electronic International | | | 37,500 | | | | 157,145 | |
| Hua Hong Semiconductor | | | 31,000 | | | | 83,412 | |
| Kingdee International Software Group* | | | 143,000 | | | | 165,690 | |
| Lenovo Group | | | 380,000 | | | | 518,571 | |
| SenseTime Group, Cl B* | | | 1,097,000 | | | | 242,915 | |
| Sunny Optical Technology Group | | | 35,840 | | | | 265,311 | |
| Xiaomi, Cl B* | | | 317,800 | | | | 920,566 | |
| | | | | | | | 2,353,610 | |
| TOTAL CHINA | | | | | | | 11,639,961 | |
The accompanying notes are an integral part of the financial statements.
Schedule of Investments (Unaudited) September 30, 2024
KraneShares Hang Seng TECH Index ETF (concluded)
| | | Shares | | | Value | |
| COMMON STOCK (continued) | | | | | | | | |
| HONG KONG — 1.5% | | | | | | | | |
| Information Technology — 1.5% | | | | | | | | |
| ASMPT | | | 15,600 | | | $ | 190,795 | |
| TOTAL HONG KONG | | | | | | | 190,795 | |
| | | | | | | | | |
TOTAL COMMON STOCK
(Cost $9,499,555) | | | | | | | 11,830,756 | |
| | | | | | | | | |
TOTAL INVESTMENTS — 93.7%
(Cost $9,499,555) | | | | | | | 11,830,756 | |
| OTHER ASSETS LESS LIABILITIES – 6.3% | | | | | | | 796,066 | |
| NET ASSETS - 100% | | | | | | $ | 12,626,822 | |
| ‡ | Industries are utilized for compliance purposes, whereas sectors are utilized for reporting. |
| * | Non-income producing security. |
As of September 30, 2024, all of the Fund’s investments were considered Level 1 of the fair value hierarchy, in accordance with the authoritative guidance on fair value measurements and disclosure under U.S. generally accepted accounting principles.
See “Glossary” for abbreviations.
The accompanying notes are an integral part of the financial statements.
Schedule of Investments (Unaudited) September 30, 2024
KraneShares Dynamic Emerging Markets Strategy ETF
| | | Shares | | | Value | |
| EXCHANGE - TRADED FUNDS — 99.2% | | | | | | | | |
| KraneShares MSCI All China Index ETF(A) | | | 132,306 | | | $ | 2,991,439 | |
| KraneShares MSCI Emerging Markets ex China Index ETF(A) | | | 65,711 | | | | 2,050,840 | |
TOTAL EXCHANGE - TRADED FUNDS
(Cost $4,385,345) | | | | | | | 5,042,279 | |
| | | | | | | | | |
TOTAL INVESTMENTS — 99.2%
(Cost $4,385,345) | | | | | | | 5,042,279 | |
| OTHER ASSETS LESS LIABILITIES – 0.8% | | | | | | | 39,235 | |
| NET ASSETS - 100% | | | | | | $ | 5,081,514 | |
| (A) | Affiliated Investment. |
As of September 30, 2024, all of the Fund’s investments were considered Level 1 of the fair value hierarchy, in accordance with the authoritative guidance on fair value measurements and disclosure under U.S. generally accepted accounting principles.
Transactions with affiliated companies during the period ended September 30, 2024 are as follows:
Value as of
3/31/2024 | | | Purchases at
Cost | | | Proceeds
from Sale | | | Change in
Unrealized
Appreciation/
(Depreciation) | | | Realized
Gain/(Loss) | | | Value as of
9/30/2024 | | | Dividend
Income | | | Capital
Gain
Distributions | |
| KraneShares MSCI All China Index ETF | | | | | | | | | |
| $ | 2,027,280 | | | $ | 413,544 | | | $ | (16,282 | ) | | $ | 568,132 | | | $ | (1,235 | ) | | $ | 2,991,439 | | | $ | — | | | $ | — | |
| KraneShares MSCI Emerging Markets ex China Index ETF | | | | | | | | | | | |
| | 1,668,176 | | | | 291,803 | | | | (30,740 | ) | | | 120,299 | | | | 1,302 | | | | 2,050,840 | | | | — | | | | — | |
| $ | 3,695,456 | | | $ | 705,347 | | | $ | (47,022 | ) | | $ | 688,431 | | | $ | 67 | | | $ | 5,042,279 | | | $ | — | | | $ | — | |
Amounts designated as “—” are $0 or have been rounded to $0.
See “Glossary” for abbreviations.
The accompanying notes are an integral part of the financial statements.
Schedule of Investments (Unaudited) September 30, 2024
KraneShares Global Luxury Index ETF
| | | Shares | | | Value | |
| COMMON STOCK — 98.6%‡ | | | | | | | | |
| CHINA — 0.7% | | | | | | | | |
| Consumer Discretionary — 0.7% | | | | | | | | |
| Chow Tai Fook Jewellery Group | | | 15,400 | | | $ | 17,348 | |
| TOTAL CHINA | | | | | | | 17,348 | |
| | | | | | | | | |
| DENMARK — 4.7% | | | | | | | | |
| Consumer Discretionary — 4.7% | | | | | | | | |
| Pandora | | | 717 | | | | 118,346 | |
| TOTAL DENMARK | | | | | | | 118,346 | |
| | | | | | | | | |
| FRANCE — 35.8% | | | | | | | | |
| Consumer Discretionary — 20.9% | | | | | | | | |
| Hermes International | | | 83 | | | | 204,346 | |
| Kering | | | 324 | | | | 92,877 | |
| LVMH Moet Hennessy Louis Vuitton | | | 302 | | | | 232,056 | |
| | | | | | | | 529,279 | |
| Consumer Staples — 8.4% | | | | | | | | |
| L’Oreal | | | 474 | | | | 212,687 | |
| | | | | | | | | |
| Health Care — 6.5% | | | | | | | | |
| EssilorLuxottica | | | 695 | | | | 164,903 | |
| TOTAL FRANCE | | | | | | | 906,869 | |
| | | | | | | | | |
| GERMANY — 0.8% | | | | | | | | |
| Consumer Discretionary — 0.8% | | | | | | | | |
| HUGO BOSS | | | 459 | | | | 21,049 | |
| TOTAL GERMANY | | | | | | | 21,049 | |
| | | | | | | | | |
| ITALY — 11.0% | | | | | | | | |
| Consumer Discretionary — 11.0% | | | | | | | | |
| Brunello Cucinelli | | | 293 | | | | 31,637 | |
| Ferrari | | | 239 | | | | 111,949 | |
| Moncler | | | 1,621 | | | | 103,156 | |
| PRADA | | | 3,900 | | | | 30,125 | |
| TOTAL ITALY | | | | | | | 276,867 | |
| | | | | | | | | |
| JAPAN — 8.5% | | | | | | | | |
| Consumer Staples — 8.5% | | | | | | | | |
| Kao | | | 2,600 | | | | 129,219 | |
| Shiseido | | | 3,200 | | | | 86,689 | |
| TOTAL JAPAN | | | | | | | 215,908 | |
| | | | | | | | | |
| SWITZERLAND — 9.9% | | | | | | | | |
| Consumer Discretionary — 9.9% | | | | | | | | |
| Cie Financiere Richemont, Cl A | | | 1,243 | | | | 197,159 | |
The accompanying notes are an integral part of the financial statements.
Schedule of Investments (Unaudited) September 30, 2024
KraneShares Global Luxury Index ETF (concluded)
| | | Shares | | | Value | |
| COMMON STOCK (continued) | | | | | | | | |
| Consumer Discretionary (continued) | | | | | | | | |
| Swatch Group | | | 253 | | | $ | 54,361 | |
| TOTAL SWITZERLAND | | | | | | | 251,520 | |
| | | | | | | | | |
| UNITED KINGDOM — 1.1% | | | | | | | | |
| Consumer Discretionary — 1.1% | | | | | | | | |
| Burberry Group | | | 3,031 | | | | 28,500 | |
| TOTAL UNITED KINGDOM | | | | | | | 28,500 | |
| | | | | | | | | |
| UNITED STATES — 26.1% | | | | | | | | |
| Consumer Discretionary — 20.8% | | | | | | | | |
| Capri Holdings* | | | 1,164 | | | | 49,400 | |
| Deckers Outdoor* | | | 754 | | | | 120,225 | |
| Ralph Lauren, Cl A | | | 330 | | | | 63,977 | |
| Samsonite International | | | 10,800 | | | | 29,755 | |
| Signet Jewelers | | | 380 | | | | 39,193 | |
| Tapestry | | | 1,998 | | | | 93,866 | |
| Vail Resorts | | | 366 | | | | 63,790 | |
| VF | | | 3,372 | | | | 67,272 | |
| | | | | | | | 527,478 | |
| Consumer Staples — 5.3% | | | | | | | | |
| Coty, Cl A* | | | 2,829 | | | | 26,565 | |
| Estee Lauder, Cl A | | | 854 | | | | 85,135 | |
| Inter Parfums | | | 165 | | | | 21,364 | |
| | | | | | | | 133,064 | |
| TOTAL UNITED STATES | | | | | | | 660,542 | |
| | | | | | | | | |
TOTAL COMMON STOCK
(Cost $2,343,282) | | | | | | | 2,496,949 | |
| | | | | | | | | |
TOTAL INVESTMENTS — 98.6%
(Cost $2,343,282) | | | | | | | 2,496,949 | |
| OTHER ASSETS LESS LIABILITIES – 1.4% | | | | | | | 35,241 | |
| NET ASSETS - 100% | | | | | | $ | 2,532,190 | |
| ‡ | Industries are utilized for compliance purposes, whereas sectors are utilized for reporting. |
| * | Non-income producing security. |
As of September 30, 2024, all of the Fund’s investments were considered Level 1 of the fair value hierarchy, in accordance with the authoritative guidance on fair value measurements and disclosure under U.S. generally accepted accounting principles.
See “Glossary” for abbreviations.
The accompanying notes are an integral part of the financial statements.
Schedule of Investments (Unaudited) September 30, 2024
KraneShares Artificial Intelligence and Technology ETF
| | | Shares | | | Value | |
| COMMON STOCK — 99.2%‡ | | | | | | | | |
| GERMANY — 1.9% | | | | | | | | |
| Information Technology — 1.9% | | | | | | | | |
| SAP | | | 417 | | | $ | 95,126 | |
| TOTAL GERMANY | | | | | | | 95,126 | |
| | | | | | | | | |
| ISRAEL — 1.2% | | | | | | | | |
| Information Technology — 1.2% | | | | | | | | |
| Nice* | | | 361 | | | | 62,967 | |
| TOTAL ISRAEL | | | | | | | 62,967 | |
| | | | | | | | | |
| NETHERLANDS — 2.3% | | | | | | | | |
| Information Technology — 2.3% | | | | | | | | |
| ASML Holding | | | 143 | | | | 118,994 | |
| TOTAL NETHERLANDS | | | | | | | 118,994 | |
| | | | | | | | | |
| SOUTH KOREA — 2.4% | | | | | | | | |
| Information Technology — 2.4% | | | | | | | | |
| SK Hynix | | | 923 | | | | 123,236 | |
| TOTAL SOUTH KOREA | | | | | | | 123,236 | |
| | | | | | | | | |
| TAIWAN — 3.4% | | | | | | | | |
| Information Technology — 3.4% | | | | | | | | |
| Taiwan Semiconductor Manufacturing ADR | | | 981 | | | | 170,370 | |
| TOTAL TAIWAN | | | | | | | 170,370 | |
| | | | | | | | | |
| UNITED STATES — 88.0% | | | | | | | | |
| Communication Services — 9.0% | | | | | | | | |
| Alphabet, Cl A | | | 1,017 | | | | 168,669 | |
| Meta Platforms, Cl A | | | 382 | | | | 218,672 | |
| ROBLOX, Cl A* | | | 1,541 | | | | 68,205 | |
| | | | | | | | 455,546 | |
| Consumer Discretionary — 10.2% | | | | | | | | |
| Amazon.com* | | | 1,382 | | | | 257,508 | |
| Duolingo, Cl A* | | | 366 | | | | 103,219 | |
| Tesla* | | | 605 | | | | 158,286 | |
| | | | | | | | 519,013 | |
| Industrials — 2.3% | | | | | | | | |
| Vertiv Holdings, Cl A | | | 1,204 | | | | 119,786 | |
| | | | | | | | | |
| Information Technology — 66.5% | | | | | | | | |
| Adobe* | | | 181 | | | | 93,718 | |
| Advanced Micro Devices* | | | 532 | | | | 87,291 | |
| Apple | | | 1,257 | | | | 292,881 | |
| Arista Networks* | | | 280 | | | | 107,470 | |
The accompanying notes are an integral part of the financial statements.
Schedule of Investments (Unaudited) September 30, 2024
KraneShares Artificial Intelligence and Technology ETF (concluded)
| | | Shares | | | Value | |
| COMMON STOCK (continued) | | | | | | | | |
| Information Technology (continued) | | | | | | | | |
| ARM Holdings ADR* | | | 502 | | | $ | 71,791 | |
| Broadcom | | | 1,069 | | | | 184,403 | |
| Cloudflare, Cl A* | | | 1,118 | | | | 90,435 | |
| Datadog, Cl A* | | | 854 | | | | 98,261 | |
| Elastic* | | | 943 | | | | 72,385 | |
| Gitlab, Cl A* | | | 1,689 | | | | 87,051 | |
| Intuit | | | 130 | | | | 80,730 | |
| Marvell Technology | | | 1,558 | | | | 112,363 | |
| Micron Technology | | | 778 | | | | 80,686 | |
| Microsoft | | | 894 | | | | 384,688 | |
| MongoDB, Cl A* | | | 326 | | | | 88,134 | |
| NVIDIA | | | 3,053 | | | | 370,756 | |
| Oracle | | | 741 | | | | 126,267 | |
| Palantir Technologies, Cl A* | | | 3,082 | | | | 114,650 | |
| Palo Alto Networks* | | | 298 | | | | 101,856 | |
| Pure Storage, Cl A* | | | 1,617 | | | | 81,238 | |
| QUALCOMM | | | 579 | | | | 98,459 | |
| Salesforce | | | 422 | | | | 115,506 | |
| ServiceNow* | | | 130 | | | | 116,271 | |
| Snowflake, Cl A* | | | 700 | | | | 80,402 | |
| Synopsys* | | | 133 | | | | 67,350 | |
| Workday, Cl A* | | | 279 | | | | 68,190 | |
| Zscaler* | | | 615 | | | | 105,128 | |
| | | | | | | | 3,378,360 | |
| TOTAL UNITED STATES | | | | | | | 4,472,705 | |
| | | | | | | | | |
TOTAL COMMON STOCK
(Cost $4,766,734) | | | | | | | 5,043,398 | |
| | | | | | | | | |
TOTAL INVESTMENTS — 99.2%
(Cost $4,766,734) | | | | | | | 5,043,398 | |
| OTHER ASSETS LESS LIABILITIES – 0.8% | | | | | | | 38,474 | |
| NET ASSETS - 100% | | | | | | $ | 5,081,872 | |
| ‡ | Industries are utilized for compliance purposes, whereas sectors are utilized for reporting. |
| * | Non-income producing security. |
As of September 30, 2024, all of the Fund’s investments were considered Level 1 of the fair value hierarchy, in accordance with the authoritative guidance on fair value measurements and disclosure under U.S. generally accepted accounting principles.
See “Glossary” for abbreviations.
The accompanying notes are an integral part of the financial statements.
Schedule of Investments (Unaudited) September 30, 2024
KraneShares Sustainable Ultra Short Duration Index ETF
| | | Face Amount | | | Value | |
| CORPORATE OBLIGATIONS — 95.2% | | | | | | | | |
| AUSTRALIA — 3.4% | | | | | | | | |
| Financials — 3.4% | | | | | | | | |
| Commonwealth Bank of Australia | | | | | | | | |
| 5.745%, 3/14/2025, SOFRRATE + 0.740%(A) | | $ | 1,000,000 | | | $ | 1,000,959 | |
| National Australia Bank | | | | | | | | |
| 5.906%, 5/13/2025, SOFRRATE + 0.760%(A) | | | 1,000,000 | | | | 1,002,857 | |
| 5.894%, 6/9/2025, SOFRRATE + 0.860%(A) | | | 1,000,000 | | | | 1,003,565 | |
| 1.388%, 01/12/2025 | | | 1,250,000 | | | | 1,237,957 | |
| Westpac Banking | | | | | | | | |
| 5.421%, 11/18/2024, SOFRRATE + 0.300%(A) | | | 957,000 | | | | 957,250 | |
| 5.350%, 10/18/2024 | | | 2,000,000 | | | | 2,000,160 | |
| 3.735%, 08/26/2025 | | | 1,400,000 | | | | 1,394,045 | |
| 2.350%, 02/19/2025 | | | 1,174,000 | | | | 1,163,013 | |
| 1.019%, 11/18/2024 | | | 302,000 | | | | 300,438 | |
| TOTAL AUSTRALIA | | | | | | | 10,060,244 | |
| | | | | | | | | |
| CANADA — 12.7% | | | | | | | | |
| Communication Services — 0.3% | | | | | | | | |
| Rogers Communications | | | | | | | | |
| 2.950%, 03/15/2025 | | | 1,000,000 | | | | 990,666 | |
| | | | | | | | | |
| Financials — 12.0% | | | | | | | | |
| Bank of Montreal, MTN | | | | | | | | |
| 3.700%, 06/07/2025 | | | 2,000,000 | | | | 1,988,270 | |
| 1.850%, 05/01/2025 | | | 2,500,000 | | | | 2,460,297 | |
| 1.500%, 01/10/2025 | | | 1,000,000 | | | | 990,661 | |
| Bank of Montreal | | | | | | | | |
| 5.920%, 09/25/2025 | | | 1,000,000 | | | | 1,015,189 | |
| 5.200%, 12/12/2024 | | | 92,000 | | | | 92,033 | |
| Bank of Nova Scotia | | | | | | | | |
| 5.450%, 06/12/2025 | | | 3,000,000 | | | | 3,017,643 | |
| 5.250%, 12/06/2024 | | | 1,000,000 | | | | 1,000,280 | |
| 2.200%, 02/03/2025 | | | 1,000,000 | | | | 990,630 | |
| Bank of Nova Scotia, MTN | | | | | | | | |
| 3.450%, 04/11/2025 | | | 2,000,000 | | | | 1,986,229 | |
| 1.450%, 01/10/2025 | | | 1,100,000 | | | | 1,089,532 | |
| Canadian Imperial Bank of Commerce | | | | | | | | |
| 5.681%, 10/18/2024, SOFRINDX + 0.420%(A) | | | 1,000,000 | | | | 1,000,074 | |
| 5.144%, 04/28/2025 | | | 500,000 | | | | 501,325 | |
| 3.300%, 04/07/2025 | | | 1,000,000 | | | | 992,628 | |
| 2.250%, 01/28/2025 | | | 1,000,000 | | | | 991,522 | |
| 1.000%, 10/18/2024 | | | 2,000,000 | | | | 1,996,314 | |
| National Bank of Canada | | | | | | | | |
| 5.250%, 01/17/2025 | | | 1,000,000 | | | | 1,000,431 | |
| Royal Bank of Canada, MTN | | | | | | | | |
| 5.641%, 10/7/2024, SOFRINDX + 0.340%(A) | | | 2,000,000 | | | | 2,000,044 | |
| 4.950%, 04/25/2025 | | | 2,000,000 | | | | 2,002,484 | |
The accompanying notes are an integral part of the financial statements.
Schedule of Investments (Unaudited) September 30, 2024
KraneShares Sustainable Ultra Short Duration Index ETF (continued)
| | | Face Amount | | | Value | |
| CORPORATE OBLIGATIONS (continued) | | | | | | | | |
| Financials (continued) | | | | | | | | |
| 3.375%, 04/14/2025 | | $ | 1,000,000 | | | $ | 993,523 | |
| 2.250%, 11/01/2024 | | | 997,000 | | | | 994,627 | |
| 1.150%, 06/10/2025 | | | 1,000,000 | | | | 976,953 | |
| 0.750%, 10/07/2024 | | | 2,000,000 | | | | 1,998,588 | |
| Toronto-Dominion Bank, MTN | | | | | | | | |
| 3.766%, 06/06/2025 | | | 2,000,000 | | | | 1,988,963 | |
| 1.450%, 01/10/2025 | | | 1,000,000 | | | | 990,622 | |
| 1.150%, 06/12/2025 | | | 2,100,000 | | | | 2,051,641 | |
| 0.750%, 09/11/2025 | | | 1,000,000 | | | | 967,719 | |
| | | | | | | | | |
| Materials — 0.4% | | | | | | | | |
| Nutrien | | | | | | | | |
| 5.900%, 11/07/2024 | | | 1,000,000 | | | | 1,000,469 | |
| TOTAL CANADA | | | | | | | 38,069,357 | |
| | | | | | | | | |
| FINLAND — 0.5% | | | | | | | | |
| Financials — 0.5% | | | | | | | | |
| Nordea Bank Abp | | | | | | | | |
| 3.600%, 06/06/2025 | | | 1,400,000 | | | | 1,390,719 | |
| | | | | | | | | |
| FRANCE — 1.6% | | | | | | | | |
| Financials — 1.6% | | | | | | | | |
| Banque Federative du Credit Mutuel | | | | | | | | |
| 2.375%, 11/21/2024 | | | 1,000,000 | | | | 996,050 | |
| 0.998%, 02/04/2025 | | | 1,000,000 | | | | 986,274 | |
| BNP Paribas | | | | | | | | |
| 3.375%, 01/09/2025 | | | 248,000 | | | | 246,656 | |
| BNP Paribas, MTN | | | | | | | | |
| 4.250%, 10/15/2024 | | | 100,000 | | | | 99,921 | |
| BPCE | | | | | | | | |
| 5.029%, 01/15/2025 | | | 1,000,000 | | | | 999,849 | |
| 2.375%, 01/14/2025 | | | 1,000,000 | | | | 991,888 | |
| Credit Agricole | | | | | | | | |
| 4.375%, 03/17/2025 | | | 135,000 | | | | 134,286 | |
| Societe Generale | | | | | | | | |
| 4.250%, 04/14/2025 | | | 274,390 | | | | 272,374 | |
| Societe Generale, MTN | | | | | | | | |
| 4.351%, 06/13/2025 | | | 100,000 | | | | 99,767 | |
| TOTAL FRANCE | | | | | | | 4,827,065 | |
| | | | | | | | | |
| GERMANY — 2.2% | | | | | | | | |
| Consumer Discretionary — 1.2% | | | | | | | | |
| BMW US Capital | | | | | | | | |
| 3.900%, 04/09/2025 | | | 83,000 | | | | 82,672 | |
| 3.250%, 04/01/2025 | | | 471,000 | | | | 467,581 | |
| Daimler Truck Finance North America | | | | | | | | |
| 1.625%, 12/13/2024 | | | 350,000 | | | | 347,295 | |
The accompanying notes are an integral part of the financial statements.
Schedule of Investments (Unaudited) September 30, 2024
KraneShares Sustainable Ultra Short Duration Index ETF (continued)
| | | Face Amount | | | Value | |
| CORPORATE OBLIGATIONS (continued) | | | | | | | | |
| Consumer Discretionary (continued) | | | | | | | | |
| Mercedes-Benz Finance North America | | | | | | | | |
| 5.500%, 11/27/2024 | | $ | 1,400,000 | | | $ | 1,400,406 | |
| 4.950%, 03/30/2025 | | | 1,305,000 | | | | 1,305,325 | |
| | | | | | | | | |
| Consumer Staples — 0.3% | | | | | | | | |
| EMD Finance | | | | | | | | |
| 3.250%, 03/19/2025 | | | 1,000,000 | | | | 990,574 | |
| | | | | | | | | |
| Financials — 0.7% | | | | | | | | |
| Deutsche Bank | | | | | | | | |
| 4.500%, 04/01/2025 | | | 100,000 | | | | 99,577 | |
| Deutsche Bank NY | | | | | | | | |
| 4.162%, 05/13/2025 | | | 1,000,000 | | | | 997,063 | |
| Erste Abwicklungsanstalt, MTN | | | | | | | | |
| 0.875%, 10/30/2024 | | | 1,000,000 | | | | 996,850 | |
| TOTAL GERMANY | | | | | | | 6,687,343 | |
| | | | | | | | | |
| HONG KONG — 0.3% | | | | | | | | |
| Diversified — 0.3% | | | | | | | | |
| Swire Pacific Financing, MTN | | | | | | | | |
| 3.875%, 09/21/2025 | | | 1,000,000 | | | | 994,812 | |
| | | | | | | | | |
| IRELAND — 0.4% | | | | | | | | |
| Industrials — 0.4% | | | | | | | | |
| AerCap Ireland Capital DAC | | | | | | | | |
| 1.750%, 10/29/2024 | | | 1,100,000 | | | | 1,096,951 | |
| | | | | | | | | |
| JAPAN — 3.2% | | | | | | | | |
| Financials — 2.7% | | | | | | | | |
| Mitsubishi UFJ Financial Group | | | | | | | | |
| 3.777%, 03/02/2025 | | | 1,000,000 | | | | 995,321 | |
| 2.193%, 02/25/2025 | | | 848,590 | | | | 839,237 | |
| 1.412%, 07/17/2025 | | | 1,000,000 | | | | 975,542 | |
| Nomura Holdings | | | | | | | | |
| 2.648%, 01/16/2025 | | | 1,000,000 | | | | 992,373 | |
| ORIX | | | | | | | | |
| 3.250%, 12/04/2024 | | | 1,000,000 | | | | 996,701 | |
| Sumitomo Mitsui Financial Group | | | | | | | | |
| 2.348%, 01/15/2025 | | | 1,500,000 | | | | 1,488,917 | |
| 1.474%, 07/08/2025 | | | 2,000,000 | | | | 1,953,747 | |
| | | | | | | | | |
| Industrials — 0.5% | | | | | | | | |
| Central Japan Railway | | | | | | | | |
| 2.200%, 10/02/2024 | | | 1,346,000 | | | | 1,345,894 | |
| TOTAL JAPAN | | | | | | | 9,587,732 | |
The accompanying notes are an integral part of the financial statements.
Schedule of Investments (Unaudited) September 30, 2024
KraneShares Sustainable Ultra Short Duration Index ETF (continued)
| | | Face Amount | | | Value | |
| CORPORATE OBLIGATIONS (continued) | | | | | | | | |
| NETHERLANDS — 0.7% | | | | | | | | |
| Financials — 0.7% | | | | | | | | |
| Cooperatieve Rabobank UA, MTN | | | | | | | | |
| 5.500%, 07/18/2025 | | $ | 1,000,000 | | | $ | 1,009,185 | |
| 3.375%, 05/21/2025 | | | 1,100,000 | | | | 1,092,788 | |
| TOTAL NETHERLANDS | | | | | | | 2,101,973 | |
| | | | | | | | | |
| SINGAPORE — 0.5% | | | | | | | | |
| Financials — 0.5% | | | | | | | | |
| DBS Group Holdings, MTN | | | | | | | | |
| 1.169%, 11/22/2024 | | | 1,100,000 | | | | 1,094,048 | |
| United Overseas Bank, MTN | | | | | | | | |
| 3.059%, 04/07/2025 | | | 412,000 | | | | 408,703 | |
| TOTAL SINGAPORE | | | | | | | 1,502,751 | |
| | | | | | | | | |
| SPAIN — 0.7% | | | | | | | | |
| Financials — 0.7% | | | | | | | | |
| Banco Bilbao Vizcaya Argentaria | | | | | | | | |
| 1.125%, 09/18/2025 | | | 1,000,000 | | | | 968,541 | |
| Banco Santander | | | | | | | | |
| 2.746%, 05/28/2025 | | | 1,000,000 | | | | 985,340 | |
| TOTAL SPAIN | | | | | | | 1,953,881 | |
| | | | | | | | | |
| SWEDEN — 0.4% | | | | | | | | |
| Consumer Staples — 0.3% | | | | | | | | |
| Skandinaviska Enskilda Banken | | | | | | | | |
| 3.700%, 06/09/2025 | | | 1,000,000 | | | | 993,752 | |
| | | | | | | | | |
| Financials — 0.1% | | | | | | | | |
| Svenska Handelsbanken | | | | | | | | |
| 3.650%, 06/10/2025 | | | 111,000 | | | | 110,330 | |
| Swedbank | | | | | | | | |
| 3.356%, 04/04/2025 | | | 200,000 | | | | 198,519 | |
| TOTAL SWEDEN | | | | | | | 1,302,601 | |
| | | | | | | | | |
| SWITZERLAND — 1.1% | | | | | | | | |
| Financials — 1.1% | | | | | | | | |
| UBS | | | | | | | | |
| 2.950%, 04/09/2025 | | | 1,000,000 | | | | 990,081 | |
| UBS, MTN | | | | | | | | |
| 3.700%, 02/21/2025 | | | 318,000 | | | | 316,513 | |
| UBS Group | | | | | | | | |
| 3.750%, 03/26/2025 | | | 2,000,000 | | | | 1,989,990 | |
| TOTAL SWITZERLAND | | | | | | | 3,296,584 | |
| | | | | | | | | |
| UNITED KINGDOM — 0.8% | | | | | | | | |
| Financials — 0.8% | | | | | | | | |
| Lloyds Banking Group | | | | | | | | |
| 4.500%, 11/04/2024 | | | 1,000,000 | | | | 998,834 | |
| 4.450%, 05/08/2025 | | | 1,000,000 | | | | 996,775 | |
The accompanying notes are an integral part of the financial statements.
Schedule of Investments (Unaudited) September 30, 2024
KraneShares Sustainable Ultra Short Duration Index ETF (continued)
| | | Face Amount | | | Value | |
| CORPORATE OBLIGATIONS (continued) | | | | | | | | |
| Financials (continued) | | | | | | | | |
| Standard Chartered, MTN | | | | | | | | |
| 3.200%, 04/17/2025 | | $ | 546,000 | | | $ | 540,543 | |
| TOTAL UNITED KINGDOM | | | | | | | 2,536,152 | |
| | | | | | | | | |
| UNITED STATES — 66.7% | | | | | | | | |
| Communication Services — 2.7% | | | | | | | | |
| Alphabet | | | | | | | | |
| 0.450%, 08/15/2025 | | | 1,000,000 | | | | 969,329 | |
| Charter Communications Operating | | | | | | | | |
| 4.908%, 07/23/2025 | | | 1,000,000 | | | | 998,346 | |
| Fox | | | | | | | | |
| 3.050%, 04/07/2025 | | | 1,000,000 | | | | 990,196 | |
| Omnicom Group | | | | | | | | |
| 3.650%, 11/01/2024 | | | 111,000 | | | | 110,859 | |
| Sprint | | | | | | | | |
| 7.625%, 02/15/2025 | | | 100,000 | | | | 100,319 | |
| T-Mobile USA | | | | | | | | |
| 3.500%, 04/15/2025 | | | 1,000,000 | | | | 992,721 | |
| TWDC Enterprises 18, MTN | | | | | | | | |
| 3.150%, 09/17/2025 | | | 1,000,000 | | | | 989,860 | |
| Verizon Communications | | | | | | | | |
| 3.500%, 11/01/2024 | | | 2,000,000 | | | | 1,996,777 | |
| Walt Disney | | | | | | | | |
| 3.350%, 03/24/2025 | | | 1,000,000 | | | | 993,831 | |
| | | | | | | | | |
| Consumer Discretionary — 10.6% | | | | | | | | |
| American Honda Finance, MTN | | | | | | | | |
| 5.956%, 1/10/2025, SOFRINDX + 0.670%(A) | | | 1,000,000 | | | | 1,000,942 | |
| 5.682%, 4/29/2025, SOFRRATE + 0.450%(A) | | | 1,000,000 | | | | 1,001,169 | |
| 5.530%, 6/13/2025, SOFRRATE + 0.450%(A) | | | 1,000,000 | | | | 1,000,656 | |
| 4.600%, 04/17/2025 | | | 1,000,000 | | | | 999,697 | |
| 1.500%, 01/13/2025 | | | 252,000 | | | | 249,598 | |
| 1.200%, 07/08/2025 | | | 1,000,000 | | | | 975,653 | |
| AutoZone | | | | | | | | |
| 3.625%, 04/15/2025 | | | 2,266,900 | | | | 2,251,303 | |
| DR Horton | | | | | | | | |
| 2.500%, 10/15/2024 | | | 1,308,000 | | | | 1,305,991 | |
| Ford Motor Credit | | | | | | | | |
| 5.125%, 06/16/2025 | | | 1,000,000 | | | | 999,722 | |
| 4.687%, 06/09/2025 | | | 2,000,000 | | | | 1,992,728 | |
| 4.134%, 08/04/2025 | | | 1,000,000 | | | | 990,715 | |
| 4.063%, 11/01/2024 | | | 207,000 | | | | 206,763 | |
| 2.300%, 02/10/2025 | | | 545,000 | | | | 538,888 | |
| General Motors Financial | | | | | | | | |
| 4.300%, 07/13/2025 | | | 1,000,000 | | | | 995,918 | |
| 3.500%, 11/07/2024 | | | 2,000,000 | | | | 1,996,780 | |
The accompanying notes are an integral part of the financial statements.
Schedule of Investments (Unaudited) September 30, 2024
KraneShares Sustainable Ultra Short Duration Index ETF (continued)
| | | Face Amount | | | Value | |
| CORPORATE OBLIGATIONS (continued) | | | | | | | | |
| Consumer Discretionary (continued) | | | | | | | | |
| 2.750%, 06/20/2025 | | $ | 2,000,000 | | | $ | 1,968,145 | |
| 1.200%, 10/15/2024 | | | 1,000,000 | | | | 998,370 | |
| Genuine Parts | | | | | | | | |
| 1.750%, 02/01/2025 | | | 1,000,000 | | | | 989,283 | |
| Harley-Davidson Financial Services | | | | | | | | |
| 3.350%, 06/08/2025 | | | 673,000 | | | | 664,768 | |
| Hasbro | | | | | | | | |
| 3.000%, 11/19/2024 | | | 100,000 | | | | 99,657 | |
| Lennar | | | | | | | | |
| 4.750%, 05/30/2025 | | | 1,000,000 | | | | 998,287 | |
| McDonald’s, MTN | | | | | | | | |
| 3.300%, 07/01/2025 | | | 1,000,000 | | | | 990,492 | |
| NIKE | | | | | | | | |
| 2.400%, 03/27/2025 | | | 1,000,000 | | | | 990,144 | |
| Toyota Motor Credit, MTN | | | | | | | | |
| 5.400%, 4/14/2025, SOFRRATE + 0.350%(A) | | | 437,000 | | | | 437,240 | |
| 3.650%, 08/18/2025 | | | 1,000,000 | | | | 995,753 | |
| 3.000%, 04/01/2025 | | | 1,000,000 | | | | 992,040 | |
| 2.000%, 10/07/2024 | | | 1,110,000 | | | | 1,109,428 | |
| 1.800%, 02/13/2025 | | | 1,000,000 | | | | 989,307 | |
| 1.450%, 01/13/2025 | | | 1,000,000 | | | | 990,945 | |
| VF | | | | | | | | |
| 2.400%, 04/23/2025 | | | 2,000,000 | | | | 1,966,228 | |
| | | | | | | | | |
| Consumer Staples — 4.3% | | | | | | | | |
| Aetna | | | | | | | | |
| 3.500%, 11/15/2024 | | | 502,000 | | | | 500,829 | |
| Baxalta | | | | | | | | |
| 4.000%, 06/23/2025 | | | 1,000,000 | | | | 994,677 | |
| Bunge Finance | | | | | | | | |
| 1.630%, 08/17/2025 | | | 1,000,000 | | | | 973,752 | |
| Campbell Soup | | | | | | | | |
| 3.950%, 03/15/2025 | | | 1,000,000 | | | | 995,492 | |
| Estee Lauder | | | | | | | | |
| 2.000%, 12/01/2024 | | | 1,020,000 | | | | 1,014,910 | |
| J M Smucker | | | | | | | | |
| 3.500%, 03/15/2025 | | | 1,000,000 | | | | 993,966 | |
| Keurig Dr Pepper | | | | | | | | |
| 4.417%, 05/25/2025 | | | 1,000,000 | | | | 998,172 | |
| PepsiCo | | | | | | | | |
| 5.587%, 11/12/2024, SOFRINDX + 0.400%(A) | | | 2,000,000 | | | | 2,000,658 | |
| 3.500%, 07/17/2025 | | | 1,000,000 | | | | 993,368 | |
| Roche Holdings | | | | | | | | |
| 5.656%, 3/10/2025, SOFRRATE + 0.560%(A) | | | 1,000,000 | | | | 1,001,757 | |
| 2.132%, 03/10/2025 | | | 1,250,000 | | | | 1,236,590 | |
The accompanying notes are an integral part of the financial statements.
Schedule of Investments (Unaudited) September 30, 2024
KraneShares Sustainable Ultra Short Duration Index ETF (continued)
| | | Face Amount | | | Value | |
| CORPORATE OBLIGATIONS (continued) | | | | | | | | |
| Consumer Staples (continued) | | | | | | | | |
| Target | | | | | | | | |
| 2.250%, 04/15/2025 | | $ | 1,000,000 | | | $ | 987,314 | |
| Walgreens Boots Alliance | | | | | | | | |
| 3.800%, 11/18/2024 | | | 96,600 | | | | 96,264 | |
| | | | | | | | | |
| Financials — 25.2% | | | | | | | | |
| Ally Financial | | | | | | | | |
| 5.800%, 05/01/2025 | | | 1,841,800 | | | | 1,848,405 | |
| American Express | | | | | | | | |
| 6.048%, 3/4/2025, SOFRINDX + 0.930%(A) | | | 162,000 | | | | 162,176 | |
| 3.950%, 08/01/2025 | | | 1,000,000 | | | | 995,841 | |
| Ameriprise Financial | | | | | | | | |
| 3.700%, 10/15/2024 | | | 1,000,000 | | | | 999,415 | |
| Ares Capital | | | | | | | | |
| 3.250%, 07/15/2025 | | | 2,000,000 | | | | 1,970,102 | |
| Bank of America, MTN | | | | | | | | |
| 4.000%, 01/22/2025 | | | 2,100,000 | | | | 2,093,646 | |
| 3.950%, 04/21/2025 | | | 2,000,000 | | | | 1,990,063 | |
| Bank of New York Mellon, MTN | | | | | | | | |
| 3.000%, 02/24/2025 | | | 1,000,000 | | | | 993,160 | |
| 2.100%, 10/24/2024 | | | 2,000,000 | | | | 1,996,302 | |
| 1.600%, 04/24/2025 | | | 1,793,000 | | | | 1,762,287 | |
| Canadian Imperial Bank | | | | | | | | |
| 2.041%, 04/07/2025 | | | 1,000,000 | | | | 1,003,405 | |
| Capital One Financial | | | | | | | | |
| 3.300%, 10/30/2024 | | | 1,000,000 | | | | 1,000,000 | |
| 3.200%, 02/05/2025 | | | 1,000,000 | | | | 994,798 | |
| Charles Schwab | | | | | | | | |
| 4.200%, 03/24/2025 | | | 1,608,600 | | | | 1,604,814 | |
| 3.850%, 05/21/2025 | | | 444,500 | | | | 442,148 | |
| Chubb INA Holdings | | | | | | | | |
| 3.150%, 03/15/2025 | | | 1,000,000 | | | | 992,794 | |
| Citigroup | | | | | | | | |
| 5.901%, 10/30/2024, SOFRRATE + 0.686%(A) | | | 329,000 | | | | 329,153 | |
| 4.400%, 06/10/2025 | | | 2,100,000 | | | | 2,092,023 | |
| 3.875%, 03/26/2025 | | | 2,000,000 | | | | 1,989,356 | |
| Citizens Bank | | | | | | | | |
| 2.250%, 04/28/2025 | | | 210,000 | | | | 206,746 | |
| CME Group | | | | | | | | |
| 3.000%, 03/15/2025 | | | 1,000,000 | | | | 992,004 | |
| CNO Financial Group | | | | | | | | |
| 5.250%, 05/30/2025 | | | 1,000,000 | | | | 1,000,396 | |
| Discover Financial Services | | | | | | | | |
| 3.750%, 03/04/2025 | | | 1,000,000 | | | | 993,508 | |
| Fifth Third Bancorp | | | | | | | | |
| 2.375%, 01/28/2025 | | | 330,000 | | | | 327,331 | |
The accompanying notes are an integral part of the financial statements.
Schedule of Investments (Unaudited) September 30, 2024
KraneShares Sustainable Ultra Short Duration Index ETF (continued)
| | | Face Amount | | | Value | |
| CORPORATE OBLIGATIONS (continued) | | | | | | | | |
| Financials (continued) | | | | | | | | |
| Goldman Sachs Group | | | | | | | | |
| 5.700%, 11/01/2024 | | $ | 1,991,000 | | | $ | 1,991,824 | |
| 3.750%, 05/22/2025 | | | 1,000,000 | | | | 993,730 | |
| 3.500%, 04/01/2025 | | | 1,000,000 | | | | 993,537 | |
| 3.500%, 01/23/2025 | | | 2,000,000 | | | | 1,990,928 | |
| JPMorgan Chase | | | | | | | | |
| 3.900%, 07/15/2025 | | | 1,000,000 | | | | 996,133 | |
| 3.125%, 01/23/2025 | | | 2,346,879 | | | | 2,333,604 | |
| Manufacturers & Traders Trust | | | | | | | | |
| 2.900%, 02/06/2025 | | | 1,000,000 | | | | 991,611 | |
| Marsh & McLennan | | | | | | | | |
| 3.500%, 03/10/2025 | | | 1,000,000 | | | | 995,472 | |
| Metropolitan Life Global Funding I | | | | | | | | |
| 4.050%, 08/25/2025 | | | 1,020,000 | | | | 1,017,548 | |
| Metropolitan Life Global Funding I, MTN | | | | | | | | |
| 2.800%, 03/21/2025 | | | 1,000,000 | | | | 991,735 | |
| Morgan Stanley, MTN | | | | | | | | |
| 5.750%, 1/22/2025, SOFRRATE + 0.509%(A) | | | 1,500,000 | | | | 1,500,094 | |
| 4.000%, 07/23/2025 | | | 1,000,000 | | | | 996,732 | |
| 3.700%, 10/23/2024 | | | 2,600,000 | | | | 2,597,488 | |
| NatWest Markets | | | | | | | | |
| 6.821%, 03/22/2025 | | | 1,000,000 | | | | 1,005,816 | |
| New York Life Global Funding | | | | | | | | |
| 0.950%, 06/24/2025 | | | 1,000,000 | | | | 973,958 | |
| PayPal Holdings | | | | | | | | |
| 2.400%, 10/01/2024 | | | 361,000 | | | | 361,000 | |
| 1.650%, 06/01/2025 | | | 1,000,000 | | | | 981,276 | |
| PNC Bank, MTN | | | | | | | | |
| 3.250%, 06/01/2025 | | | 1,000,000 | | | | 991,236 | |
| PNC Bank | | | | | | | | |
| 3.875%, 04/10/2025 | | | 2,000,000 | | | | 1,991,003 | |
| PNC Financial Services Group | | | | | | | | |
| 2.200%, 11/01/2024 | | | 2,000,000 | | | | 1,994,592 | |
| Pricoa Global Funding I, MTN | | | | | | | | |
| 1.150%, 12/06/2024 | | | 100,000 | | | | 99,289 | |
| Principal Life Global Funding II | | | | | | | | |
| 1.375%, 01/10/2025 | | | 879,000 | | | | 870,335 | |
| Regions Financial | | | | | | | | |
| 2.250%, 05/18/2025 | | | 2,422,800 | | | | 2,379,695 | |
| Santander Holdings USA | | | | | | | | |
| 3.450%, 06/02/2025 | | | 1,000,000 | | | | 989,410 | |
| State Street | | | | | | | | |
| 3.300%, 12/16/2024 | | | 1,427,000 | | | | 1,422,087 | |
| Synchrony Financial | | | | | | | | |
| 4.875%, 06/13/2025 | | | 1,000,000 | | | | 997,860 | |
The accompanying notes are an integral part of the financial statements.
Schedule of Investments (Unaudited) September 30, 2024
KraneShares Sustainable Ultra Short Duration Index ETF (continued)
| | | Face Amount | | | Value | |
| CORPORATE OBLIGATIONS (continued) | | | | | | | | |
| Financials (continued) | | | | | | | | |
| 4.500%, 07/23/2025 | | $ | 1,000,000 | | | $ | 993,792 | |
| Truist Bank | | | | | | | | |
| 2.150%, 12/06/2024 | | | 1,000,000 | | | | 994,680 | |
| 1.500%, 03/10/2025 | | | 1,300,000 | | | | 1,281,250 | |
| Truist Financial, MTN | | | | | | | | |
| 3.700%, 06/05/2025 | | | 2,100,000 | | | | 2,084,875 | |
| 2.850%, 10/26/2024 | | | 1,000,000 | | | | 998,176 | |
| 1.200%, 08/05/2025 | | | 1,000,000 | | | | 972,325 | |
| Truist Financial | | | | | | | | |
| 4.000%, 05/01/2025 | | | 1,000,000 | | | | 996,971 | |
| US Bancorp | | | | | | | | |
| 1.450%, 05/12/2025 | | | 2,000,000 | | | | 1,963,296 | |
| US Bank | | | | | | | | |
| 2.800%, 01/27/2025 | | | 1,000,000 | | | | 993,187 | |
| Wells Fargo, MTN | | | | | | | | |
| 3.000%, 02/19/2025 | | | 1,000,000 | | | | 992,629 | |
| Western Union | | | | | | | | |
| 2.850%, 01/10/2025 | | | 1,000,000 | | | | 992,848 | |
| | | | | | | | | |
| Health Care — 7.0% | | | | | | | | |
| Baxter International | | | | | | | | |
| 1.322%, 11/29/2024 | | | 116,000 | | | | 115,220 | |
| Becton Dickinson | | | | | | | | |
| 3.734%, 12/15/2024 | | | 157,600 | | | | 157,101 | |
| Boston Scientific | | | | | | | | |
| 1.900%, 06/01/2025 | | | 2,000,000 | | | | 1,963,134 | |
| Cencora | | | | | | | | |
| 3.250%, 03/01/2025 | | | 2,000,000 | | | | 1,983,536 | |
| Cigna Group | | | | | | | | |
| 3.250%, 04/15/2025 | | | 1,000,000 | | | | 992,123 | |
| CVS Health | | | | | | | | |
| 4.100%, 03/25/2025 | | | 1,000,000 | | | | 996,827 | |
| 3.875%, 07/20/2025 | | | 1,000,000 | | | | 992,835 | |
| Elevance Health | | | | | | | | |
| 2.375%, 01/15/2025 | | | 1,000,000 | | | | 992,329 | |
| GE HealthCare Technologies | | | | | | | | |
| 5.550%, 11/15/2024 | | | 388,000 | | | | 388,154 | |
| HCA | | | | | | | | |
| 5.375%, 02/01/2025 | | | 1,000,000 | | | | 1,000,320 | |
| 5.250%, 04/15/2025 | | | 1,000,000 | | | | 1,001,196 | |
| Humana | | | | | | | | |
| 4.500%, 04/01/2025 | | | 1,000,000 | | | | 997,942 | |
| Quest Diagnostics | | | | | | | | |
| 3.500%, 03/30/2025 | | | 1,000,000 | | | | 993,168 | |
| Stryker | | | | | | | | |
| 1.150%, 06/15/2025 | | | 1,608,000 | | | | 1,569,814 | |
The accompanying notes are an integral part of the financial statements.
Schedule of Investments (Unaudited) September 30, 2024
KraneShares Sustainable Ultra Short Duration Index ETF (continued)
| | | Face Amount | | | Value | |
| CORPORATE OBLIGATIONS (continued) | | | | | | | | |
| Health Care (continued) | | | | | | | | |
| Thermo Fisher Scientific | | | | | | | | |
| 1.215%, 10/18/2024 | | $ | 2,454,000 | | | $ | 2,449,196 | |
| UnitedHealth Group | | | | | | | | |
| 5.000%, 10/15/2024 | | | 1,188,000 | | | | 1,188,000 | |
| 3.750%, 07/15/2025 | | | 1,000,000 | | | | 996,713 | |
| Zimmer Biomet Holdings | | | | | | | | |
| 3.550%, 04/01/2025 | | | 1,000,000 | | | | 992,718 | |
| 1.450%, 11/22/2024 | | | 1,100,000 | | | | 1,093,788 | |
| | | | | | | | | |
| Industrials — 4.1% | | | | | | | | |
| Air Lease | | | | | | | | |
| 3.375%, 07/01/2025 | | | 1,000,000 | | | | 988,280 | |
| Automatic Data Processing | | | | | | | | |
| 3.375%, 09/15/2025 | | | 1,000,000 | | | | 993,036 | |
| Cummins | | | | | | | | |
| 0.750%, 09/01/2025 | | | 1,000,000 | | | | 968,228 | |
| Delta Air Lines | | | | | | | | |
| 2.900%, 10/28/2024 | | | 165,000 | | | | 164,473 | |
| John Deere Capital, MTN | | | | | | | | |
| 5.571%, 7/3/2025, SOFRRATE + 0.500%(A) | | | 2,000,000 | | | | 2,004,168 | |
| 5.499%, 10/11/2024, SOFRRATE + 0.200%(A) | | | 1,000,000 | | | | 1,000,009 | |
| 4.950%, 06/06/2025 | | | 1,100,000 | | | | 1,104,564 | |
| 4.550%, 10/11/2024 | | | 103,000 | | | | 102,989 | |
| 4.050%, 09/08/2025 | | | 1,000,000 | | | | 998,512 | |
| Southwest Airlines | | | | | | | | |
| 5.250%, 05/04/2025 | | | 2,000,000 | | | | 2,002,358 | |
| Verisk Analytics | | | | | | | | |
| 4.000%, 06/15/2025 | | | 1,000,000 | | | | 993,558 | |
| WW Grainger | | | | | | | | |
| 1.850%, 02/15/2025 | | | 1,030,000 | | | | 1,018,164 | |
| | | | | | | | | |
| Information Technology — 8.6% | | | | | | | | |
| Adobe | | | | | | | | |
| 3.250%, 02/01/2025 | | | 714,200 | | | | 709,802 | |
| Analog Devices | | | | | | | | |
| 5.579%, 10/1/2024, SOFRINDX + 0.250%(A) | | | 1,000,000 | | | | 1,000,000 | |
| Apple | | | | | | | | |
| 3.200%, 05/13/2025 | | | 2,117,000 | | | | 2,102,409 | |
| 2.750%, 01/13/2025 | | | 2,020,000 | | | | 2,009,305 | |
| 2.500%, 02/09/2025 | | | 1,000,000 | | | | 992,607 | |
| 1.125%, 05/11/2025 | | | 2,000,000 | | | | 1,959,456 | |
| 0.550%, 08/20/2025 | | | 1,000,000 | | | | 969,170 | |
| Broadcom | | | | | | | | |
| 3.625%, 10/15/2024 | | | 2,000,000 | | | | 1,998,133 | |
| CDW | | | | | | | | |
| 5.500%, 12/01/2024 | | | 100,000 | | | | 99,976 | |
The accompanying notes are an integral part of the financial statements.
Schedule of Investments (Unaudited) September 30, 2024
KraneShares Sustainable Ultra Short Duration Index ETF (continued)
| | | Face Amount | | | Value | |
| CORPORATE OBLIGATIONS (continued) | | | | | | | | |
| Information Technology (continued) | | | | | | | | |
| Cisco Systems | | | | | | | | |
| 3.500%, 06/15/2025 | | $ | 1,000,000 | | | $ | 994,494 | |
| Flex | | | | | | | | |
| 4.750%, 06/15/2025 | | | 1,000,000 | | | | 997,415 | |
| Intel | | | | | | | | |
| 3.400%, 03/25/2025 | | | 1,000,000 | | | | 992,123 | |
| Intuit | | | | | | | | |
| 0.950%, 07/15/2025 | | | 1,000,000 | | | | 972,425 | |
| KLA | | | | | | | | |
| 4.650%, 11/01/2024 | | | 1,100,000 | | | | 1,098,900 | |
| Lam Research | | | | | | | | |
| 3.800%, 03/15/2025 | | | 100,000 | | | | 99,504 | |
| Microsoft | | | | | | | | |
| 2.700%, 02/12/2025 | | | 1,000,000 | | | | 993,342 | |
| Oracle | | | | | | | | |
| 2.950%, 11/15/2024 | | | 1,000,000 | | | | 997,339 | |
| 2.500%, 04/01/2025 | | | 1,000,000 | | | | 988,484 | |
| QUALCOMM | | | | | | | | |
| 3.450%, 05/20/2025 | | | 1,000,000 | | | | 994,343 | |
| Texas Instruments | | | | | | | | |
| 1.375%, 03/12/2025 | | | 1,000,000 | | | | 985,852 | |
| VeriSign | | | | | | | | |
| 5.250%, 04/01/2025 | | | 2,000,000 | | | | 1,999,078 | |
| VMware | | | | | | | | |
| 4.500%, 05/15/2025 | | | 2,000,000 | | | | 1,995,643 | |
| | | | | | | | | |
| Materials — 0.3% | | | | | | | | |
| EIDP | | | | | | | | |
| 1.700%, 07/15/2025 | | | 1,000,000 | | | | 977,777 | |
| | | | | | | | | |
| Real Estate — 3.6% | | | | | | | | |
| Alexandria Real Estate Equities | | | | | | | | |
| 3.450%, 04/30/2025 | | | 1,420,000 | | | | 1,408,869 | |
| Equinix | | | | | | | | |
| 2.625%, 11/18/2024 | | | 2,000,000 | | | | 1,993,221 | |
| 1.250%, 07/15/2025 | | | 1,000,000 | | | | 972,000 | |
| GLP Capital | | | | | | | | |
| 5.250%, 06/01/2025 | | | 2,500,000 | | | | 2,497,988 | |
| Host Hotels & Resorts | | | | | | | | |
| 4.000%, 06/15/2025 | | | 1,000,000 | | | | 993,076 | |
| Kimco Realty OP | | | | | | | | |
| 3.300%, 02/01/2025 | | | 1,000,000 | | | | 993,188 | |
| Macquarie Bank | | | | | | | | |
| 6.630%, 03/21/2025 | | | 1,000,000 | | | | 1,005,098 | |
| Simon Property Group | | | | | | | | |
| 3.500%, 09/01/2025 | | | 1,000,000 | | | | 991,379 | |
The accompanying notes are an integral part of the financial statements.
Schedule of Investments (Unaudited) September 30, 2024
KraneShares Sustainable Ultra Short Duration Index ETF (concluded)
| | | Face Amount | | | Value | |
| CORPORATE OBLIGATIONS (continued) | | | | | | | | |
| Utilities — 0.3% | | | | | | | | |
| American Water Capital | | | | | | | | |
| 3.400%, 03/01/2025 | | $ | 1,000,000 | | | $ | 993,455 | |
| TOTAL UNITED STATES | | | | | | | 200,086,796 | |
| | | | | | | | | |
TOTAL CORPORATE OBLIGATIONS
(Cost $285,218,540) | | | | | | | 285,494,961 | |
| | | | | | | | | |
TOTAL INVESTMENTS — 95.2%
(Cost $285,218,540) | | | | | | | 285,494,961 | |
| OTHER ASSETS LESS LIABILITIES – 4.8% | | | | | | | 14,470,684 | |
| NET ASSETS - 100% | | | | | | $ | 299,965,645 | |
| (A) | Variable or floating rate security, the interest rate of which adjusts periodically based on changes in current interest rates and prepayments on the underlying pool of assets. |
As of September 30, 2024, all of the Fund’s investments were considered Level 2 of the fair value hierarchy, in accordance with the authoritative guidance on fair value measurements and disclosure under U.S. generally accepted accounting principles.
See “Glossary” for abbreviations.
The accompanying notes are an integral part of the financial statements.
Schedule of Investments (Unaudited) September 30, 2024
KraneShares China Alpha Index ETF
| | | Shares | | | Value | |
| COMMON STOCK — 99.9%‡ | | | | | | | | |
| CHINA — 99.9% | | | | | | | | |
| Consumer Discretionary — 8.7% | | | | | | | | |
| Chongqing Changan Automobile, Cl A | | | 133,700 | | | $ | 284,263 | |
| Fuyao Glass Industry Group, Cl A | | | 33,001 | | | | 274,433 | |
| Ningbo Tuopu Group, Cl A | | | 31,100 | | | | 205,566 | |
| | | | | | | | 764,262 | |
| Financials — 37.7% | | | | | | | | |
| Agricultural Bank of China, Cl A | | | 353,700 | | | | 242,584 | |
| Bank of Beijing, Cl A | | | 303,000 | | | | 252,837 | |
| Bank of Chengdu, Cl A | | | 118,200 | | | | 266,001 | |
| Bank of China, Cl A | | | 332,900 | | | | 237,832 | |
| Bank of Communications, Cl A | | | 234,500 | | | | 247,948 | |
| Bank of Jiangsu, Cl A | | | 205,500 | | | | 246,648 | |
| Bank of Nanjing, Cl A | | | 157,600 | | | | 246,579 | |
| Bank of Shanghai, Cl A | | | 224,200 | | | | 252,754 | |
| China CITIC Bank, Cl A | | | 267,300 | | | | 267,733 | |
| China Construction Bank, Cl A | | | 216,400 | | | | 245,198 | |
| China Galaxy Securities, Cl A | | | 30,300 | | | | 66,630 | |
| Guosen Securities, Cl A | | | 96,500 | | | | 163,116 | |
| Huaxia Bank, Cl A | | | 252,300 | | | | 267,850 | |
| Industrial & Commercial Bank of China, Cl A | | | 275,100 | | | | 242,921 | |
| Shanghai Pudong Development Bank, Cl A | | | 51,400 | | | | 74,397 | |
| | | | | | | | 3,321,028 | |
| Health Care — 2.8% | | | | | | | | |
| China Resources Sanjiu Medical & Pharmaceutical, Cl A | | | 36,400 | | | | 247,620 | |
| | | | | | | | | |
| Industrials — 19.0% | | | | | | | | |
| China Merchants Expressway Network & Technology Holdings, Cl A | | | 130,300 | | | | 234,399 | |
| COSCO SHIPPING Holdings, Cl A | | | 131,200 | | | | 294,507 | |
| CRRC, Cl A | | | 5,600 | | | | 6,537 | |
| Daqin Railway, Cl A | | | 258,900 | | | | 253,771 | |
| NARI Technology, Cl A | | | 62,500 | | | | 247,101 | |
| Shanghai International Port Group, Cl A | | | 255,100 | | | | 236,924 | |
| Weichai Power, Cl A | | | 128,100 | | | | 290,477 | |
| Zoomlion Heavy Industry Science and Technology, Cl A | | | 106,500 | | | | 115,347 | |
| | | | | | | | 1,679,063 | |
| Information Technology — 12.3% | | | | | | | | |
| Foxconn Industrial Internet, Cl A | | | 85,100 | | | | 306,298 | |
| Luxshare Precision Industry, Cl A | | | 26,300 | | | | 163,317 | |
| NAURA Technology Group, Cl A | | | 5,200 | | | | 271,923 | |
| Zhongji Innolight, Cl A | | | 15,500 | | | | 342,970 | |
| | | | | | | | 1,084,508 | |
The accompanying notes are an integral part of the financial statements.
Schedule of Investments (Unaudited) September 30, 2024
KraneShares China Alpha Index ETF (concluded)
| | | Shares | | | Value | |
| COMMON STOCK (continued) | | | | | | | | |
| Materials — 19.4% | | | | | | | | |
| Aluminum Corp of China, Cl A | | | 240,900 | | | $ | 306,346 | |
| Baoshan Iron & Steel, Cl A | | | 269,900 | | | | 267,638 | |
| Qinghai Salt Lake Industry, Cl A* | | | 16,300 | | | | 43,227 | |
| Satellite Chemical, Cl A | | | 101,400 | | | | 270,501 | |
| Shandong Gold Mining, Cl A | | | 62,800 | | | | 262,824 | |
| Zhongjin Gold, Cl A | | | 128,500 | | | | 279,082 | |
| Zijin Mining Group, Cl A | | | 108,300 | | | | 280,706 | |
| | | | | | | | 1,710,324 | |
| TOTAL CHINA | | | | | | | 8,806,805 | |
| | | | | | | | | |
TOTAL COMMON STOCK
(Cost $7,417,409) | | | | | | | 8,806,805 | |
| | | | | | | | | |
TOTAL INVESTMENTS — 99.9%
(Cost $7,417,409) | | | | | | | 8,806,805 | |
| OTHER ASSETS LESS LIABILITIES – 0.1% | | | | | | | 9,007 | |
| NET ASSETS - 100% | | | | | | $ | 8,815,812 | |
| ‡ | Industries are utilized for compliance purposes, whereas sectors are utilized for reporting. |
| * | Non-income producing security. |
As of September 30, 2024, all of the Fund’s investments were considered Level 1 of the fair value hierarchy, in accordance with the authoritative guidance on fair value measurements and disclosure under U.S. generally accepted accounting principles.
See “Glossary” for abbreviations.
The accompanying notes are an integral part of the financial statements.
Schedule of Investments (Unaudited) September 30, 2024
Glossary (abbreviations which may be used in preceding Schedule of Investments):
Portfolio Abbreviations
ADR — American Depositary Receipt
BV — Business Value
BVI — Business Volume Indicator
Cl — Class
ETF — Exchange-Traded Fund
FX — Foreign Exchange
GDR — Global Depositary Receipt
H15T5Y — U.S. Treasury Yield Curve Rate T Note Constant Maturity 5 Year
JSC — Joint-Stock Company
MTN — Medium Term Note
PJSC — Public Joint-Stock Company
PLC — Public Limited Company
USSW5 — U.S. Dollar Swap Semi 30/360 5 Year Currency
WTI — West Texas Intermediate
Statements of Assets and Liabilities (Unaudited)
September 30, 2024
| | | KraneShares
CSI China
Internet ETF | | | KraneShares
Bosera MSCI China
A 50 Connect
Index ETF | | | KraneShares
MSCI All China
Index ETF | |
| Assets: | | | | | | | | | | | | |
| Investments at Value | | $ | 7,263,358,990 | * | | $ | 185,158,605 | | | $ | 8,033,708 | |
| Cash and Cash Equivalents | | | 78,641,015 | | | | 10,196 | | | | 13,607 | |
| Foreign Currency at Value | | | — | | | | 1,260,332 | | | | 706 | |
| Receivable for Capital Shares Sold | | | 909,781,036 | | | | — | | | | 7,296 | |
| Dividend and Interest Receivable | | | 3,618,210 | | | | — | | | | 8,852 | |
| Unrealized Appreciation on Spot Contracts | | | 120,997 | | | | 105 | | | | — | |
| Reclaim Receivable | | | — | | | | — | | | | 79 | |
| Receivable for Trustees’ Fee | | | — | | | | 65 | | | | — | |
| Prepaid Expenses | | | 43,877 | | | | 1,584 | | | | 51 | |
| Total Assets | | | 8,255,564,125 | | | | 186,430,887 | | | | 8,064,299 | |
| | | | | | | | | | | | | |
| Liabilities: | | | | | | | | | | | | |
| Payable for Investment Securities Purchased | | | 963,888,969 | | | | — | | | | — | |
| Obligation to Return Securities Lending Collateral | | | 77,951,273 | | | | — | | | | — | |
| Payable for Management Fees | | | 2,454,484 | | | | 68,833 | | | | 2,592 | |
| Payable for Capital Shares Redeemed | | | 2,374,090 | | | | — | | | | — | |
| Payable for Securities Lending Fees | | | 47,584 | | | | — | | | | — | |
| Payable for Trustees’ Fees | | | 31,991 | | | | 936 | | | | 42 | |
| Unrealized Depreciation on Spot Contracts | | | — | | | | — | | | | 1 | |
| Total Liabilities | | | 1,046,748,391 | | | | 69,769 | | | | 2,635 | |
| Net Assets | | $ | 7,208,815,734 | | | $ | 186,361,118 | | | $ | 8,061,664 | |
| | | | | | | | | | | | | |
| Net Assets Consist of: | | | | | | | | | | | | |
| Paid-in Capital | | $ | 12,009,088,823 | | | $ | 407,954,528 | | | $ | 14,889,671 | |
| Total Distributable Loss | | | (4,800,273,089 | ) | | | (221,593,410 | ) | | | (6,828,007 | ) |
| Net Assets | | $ | 7,208,815,734 | | | $ | 186,361,118 | | | $ | 8,061,664 | |
| Outstanding Shares of Beneficial Interest (unlimited authorization - no par value) | | | 205,850,000 | | | | 7,050,000 | | | | 350,000 | |
| Net Asset Value, Offering and Redemption Price Per Share | | $ | 35.02 | | | $ | 26.43 | | | $ | 23.03 | |
| Cost of Investments | | $ | 6,727,120,342 | | | $ | 156,577,733 | | | $ | 8,322,761 | |
| Cost of Foreign Currency | | | — | | | | 1,239,300 | | | | 696 | |
| *Includes Market Value of Securities on Loan | | | 73,968,170 | | | | — | | | | — | |
Amounts designated as “—” are $0 or have been rounded to $0.
The accompanying notes are an integral part of the financial statements.
Statements of Assets and Liabilities (Unaudited)
September 30, 2024
| | | KraneShares
MSCI One Belt
One Road
Index ETF | | | KraneShares
Emerging Markets
Consumer Technology
Index ETF | | | KraneShares
MSCI China
Clean Technology
Index ETF | |
| Assets: | | | | | | | | | | | | |
| Investments at Value | | $ | 3,544,936 | | | $ | 17,632,687 | * | | $ | 59,859,134 | |
| Cash and Cash Equivalents | | | 9,516 | | | | 24,023 | | | | 329,511 | |
| Foreign Currency at Value | | | 1,063 | | | | — | | | | 125 | |
| Dividend and Interest Receivable | | | 2,802 | | | | 3,304 | | | | 145,256 | |
| Reclaim Receivable | | | 151 | | | | 7,357 | | | | — | |
| Receivable for Investment Securities Sold | | | — | | | | — | | | | 843,906 | |
| Prepaid Expenses | | | 34 | | | | 177 | | | | 501 | |
| Total Assets | | | 3,558,502 | | | | 17,667,548 | | | | 61,178,433 | |
| | | | | | | | | | | | | |
| Liabilities: | | | | | | | | | | | | |
| Payable for Foreign Capital Gains Tax | | | 7,961 | | | | 62,773 | | | | — | |
| Payable for Management Fees | | | 2,107 | | | | 6,137 | | | | 31,148 | |
| Payable for Trustees’ Fees | | | 24 | | | | 159 | | | | 342 | |
| Obligation to Return Securities Lending Collateral | | | — | | | | 222,095 | | | | — | |
| Payable for Capital Shares Redeemed | | | — | | | | — | | | | 1,155,659 | |
| Foreign Currency Payable at Value | | | — | | | | 69 | | | | — | |
| Payable for Securities Lending Fees | | | — | | | | 61 | | | | — | |
| Unrealized Depreciation on Spot Contracts | | | — | | | | — | | | | 1,196 | |
| Total Liabilities | | | 10,092 | | | | 291,294 | | | | 1,188,345 | |
| Net Assets | | $ | 3,548,410 | | | $ | 17,376,254 | | | $ | 59,990,088 | |
| | | | | | | | | | | | | |
| Net Assets Consist of: | | | | | | | | | | | | |
| Paid-in Capital | | $ | 7,799,901 | | | $ | 67,298,007 | | | $ | 146,155,677 | |
| Total Distributable Loss | | | (4,251,491 | ) | | | (49,921,753 | ) | | | (86,165,589 | ) |
| Net Assets | | $ | 3,548,410 | | | $ | 17,376,254 | | | $ | 59,990,088 | |
| Outstanding Shares of Beneficial Interest (unlimited authorization - no par value) | | | 150,002 | | | | 900,002 | | | | 2,400,002 | |
| Net Asset Value, Offering and Redemption Price Per Share | | $ | 23.66 | | | $ | 19.31 | | | $ | 25.00 | |
| Cost of Investments | | $ | 4,087,807 | | | $ | 17,261,441 | | | $ | 54,032,640 | |
| Cost (Proceeds) of Foreign Currency | | | 1,054 | | | | (66 | ) | | | 123 | |
| *Includes Market Value of Securities on Loan | | | — | | | | 212,727 | | | | — | |
Amounts designated as “—” are $0 or have been rounded to $0
The accompanying notes are an integral part of the financial statements.
Statements of Assets and Liabilities (Unaudited)
September 30, 2024
| | | KraneShares
Electric Vehicles
and Future Mobility
Index ETF | | | KraneShares
MSCI All China
Health Care
Index ETF | | | KraneShares
Asia Pacific
High Income
USD Bond ETF | |
| Assets: | | | | | | | | | | | | |
| Investments at Value | | $ | 95,758,330 | * | | $ | 47,418,853 | | | $ | 18,307,244 | |
| Cash and Cash Equivalents | | | 123,582 | | | | 67,146 | | | | 194,074 | |
| Foreign Currency at Value | | | 6,448 | | | | 2,489 | | | | 466 | |
| Reclaim Receivable | | | 398,750 | | | | — | | | | — | |
| Dividend and Interest Receivable | | | 75,662 | | | | 26,632 | | | | 297,599 | |
| Receivable for Investment Securities Sold | | | — | | | | — | | | | 199,528 | |
| Prepaid Expenses | | | 909 | | | | 407 | | | | 125 | |
| Total Assets | | | 96,363,681 | | | | 47,515,527 | | | | 18,999,036 | |
| | | | | | | | | | | | | |
| Liabilities: | | | | | | | | | | | | |
| Obligation to Return Securities Lending Collateral | | | 8,523,116 | | | | — | | | | — | |
| Payable for Management Fees | | | 42,159 | | | | 19,852 | | | | 10,018 | |
| Payable for Securities Lending Fees | | | 1,428 | | | | — | | | | — | |
| Payable for Trustees’ Fees | | | 570 | | | | 332 | | | | 84 | |
| Unrealized Depreciation on Spot Contracts | | | 3 | | | | 3 | | | | — | |
| Payable for Investment Securities Purchased | | | — | | | | — | | | | 198,934 | |
| Other Accrued Expenses | | | — | | | | 33 | | | | — | |
| Total Liabilities | | | 8,567,276 | | | | 20,220 | | | | 209,036 | |
| Net Assets | | $ | 87,796,405 | | | $ | 47,495,307 | | | $ | 18,790,000 | |
| | | | | | | | | | | | | |
| Net Assets Consist of: | | | | | | | | | | | | |
| Paid-in Capital | | $ | 227,793,420 | | | $ | 140,608,415 | | | $ | 28,599,275 | |
| Total Distributable Loss | | | (139,997,015 | ) | | | (93,113,108 | ) | | | (9,809,275 | ) |
| Net Assets | | $ | 87,796,405 | | | $ | 47,495,307 | | | $ | 18,790,000 | |
| Outstanding Shares of Beneficial Interest (unlimited authorization - no par value) | | | 3,750,002 | | | | 2,800,002 | | | | 750,001 | |
| Net Asset Value, Offering and Redemption Price Per Share | | $ | 23.41 | | | $ | 16.96 | | | $ | 25.05 | |
| Cost of Investments | | $ | 117,684,004 | | | $ | 50,050,504 | | | $ | 17,654,014 | |
| Cost of Foreign Currency | | | 6,439 | | | | 2,483 | | | | 426 | |
| *Includes Market Value of Securities on Loan | | | 8,177,296 | | | | — | | | | — | |
Amounts designated as “—” are $0 or have been rounded to $0.
The accompanying notes are an integral part of the financial statements.
Statements of Assets and Liabilities/Consolidated Statement of Assets and Liabilities
September 30, 2024
| | | KraneShares
MSCI Emerging
Markets ex China
Index ETF | | | KraneShares
Value Line® Dynamic
Dividend Equity
Index ETF | | | KraneShares
Mount Lucas Managed
Futures Index
Strategy ETF | |
| Assets: | | | | | | | | | | | | |
| Investments at Value | | $ | 79,023,999 | | | $ | 33,196,371 | | | $ | 274,011,054 | |
| Cash and Cash Equivalents | | | 465,725 | | | | — | | | | 49,759,826 | |
| Foreign Currency at Value | | | 36,711 | | | | — | | | | — | |
| Cash Collateral on Futures Contracts | | | — | | | | — | | | | 71,472,052 | |
| Dividend and Interest Receivable | | | 170,781 | | | | 46,291 | | | | 133,398 | |
| Reclaim Receivable | | | 6,986 | | | | — | | | | — | |
| Unrealized Appreciation on Spot Contracts | | | 51 | | | | — | | | | — | |
| Variation Margin Receivable on Future Contracts | | | — | | | | — | | | | 466,073 | |
| Prepaid Expenses | | | 583 | | | | 261 | | | | 2,078 | |
| Total Assets | | | 79,704,836 | | | | 33,242,923 | | | | 395,844,481 | |
| | | | | | | | | | | | | |
| Liabilities: | | | | | | | | | | | | |
| Payable for Foreign Capital Gains Tax | | | 816,549 | | | | — | | | | — | |
| Payable for Management Fees | | | 14,625 | | | | 14,721 | | | | 270,772 | |
| Payable for Trustees’ Fees | | | 331 | | | | 210 | | | | 1,845 | |
| Payable to Custodian | | | — | | | | 56,299 | | | | — | |
| Foreign Currency Payable at Value | | | — | | | | — | | | | 19,810,325 | |
| Variation Margin Payable on Future Contracts | | | — | | | | — | | | | 3,715,995 | |
| Total Liabilities | | | 831,505 | | | | 71,230 | | | | 23,798,937 | |
| Net Assets | | $ | 78,873,331 | | | $ | 33,171,693 | | | $ | 372,045,544 | |
| | | | | | | | | | | | | |
| Net Assets Consist of: | | | | | | | | | | | | |
| Paid-in Capital | | $ | 71,138,190 | | | $ | 27,389,780 | | | $ | 428,635,696 | |
| Total Distributable Earnings/(Loss) | | | 7,735,141 | | | | 5,781,913 | | | | (56,590,152 | ) |
| Net Assets | | $ | 78,873,331 | | | $ | 33,171,693 | | | $ | 372,045,544 | |
| Outstanding Shares of Beneficial Interest (unlimited authorization - no par value) | | | 2,500,002 | | | | 1,250,002 | | | | 12,750,002 | |
| Net Asset Value, Offering and Redemption Price Per Share | | $ | 31.55 | | | $ | 26.54 | | | $ | 29.18 | |
| Cost of Investments | | $ | 69,743,691 | | | $ | 29,124,919 | | | $ | 273,985,901 | |
| Cost (Proceeds) of Foreign Currency | | | 32,951 | | | | — | | | | (19,834,318 | ) |
Amounts designated as “—” are $0 or have been rounded to $0.
The accompanying notes are an integral part of the financial statements.
Statements of Assets and Liabilities (Unaudited)
September 30, 2024
| | | KraneShares
SSE STAR
Market 50
Index ETF | | | KraneShares
Hang Seng
TECH Index
ETF | | | KraneShares
Dynamic Emerging
Markets Strategy
ETF | |
| Assets: | | | | | | | | | | | | |
| Investments at Value | | $ | 26,468,735 | | | $ | 11,830,756 | | | $ | — | |
| Affiliated Investments at Value | | | — | | | | — | | | | 5,042,279 | |
| Cash and Cash Equivalents | | | 87,011 | | | | 23,701 | | | | 39,448 | |
| Foreign Currency at Value | | | 77,404 | | | | 141 | | | | — | |
| Dividend and Interest Receivable | | | 71 | | | | 117 | | | | 154 | |
| Receivable for Capital Shares Sold | | | — | | | | 2,231,297 | | | | — | |
| Receivable for Investment Securities Sold | | | — | | | | 729,058 | | | | — | |
| Prepaid Expenses | | | 216 | | | | 43 | | | | 30 | |
| Total Assets | | | 26,633,437 | | | | 14,815,113 | | | | 5,081,911 | |
| | | | | | | | | | | | | |
| Liabilities: | | | | | | | | | | | | |
| Payable for Management Fees | | | 14,697 | | | | 4,496 | | | | 374 | |
| Payable for Trustees’ Fees | | | 155 | | | | 47 | | | | 23 | |
| Payable for Investment Securities Purchased | | | — | | | | 2,181,951 | | | | — | |
| Unrealized Depreciation on Spot Contracts | | | — | | | | 1,797 | | | | — | |
| Total Liabilities | | | 14,852 | | | | 2,188,291 | | | | 397 | |
| Net Assets | | $ | 26,618,585 | | | $ | 12,626,822 | | | $ | 5,081,514 | |
| | | | | | | | | | | | | |
| Net Assets Consist of: | | | | | | | | | | | | |
| Paid-in Capital | | $ | 64,621,291 | | | $ | 15,137,677 | | | $ | 4,432,174 | |
| Total Distributable Earnings/(Loss) | | | (38,002,706 | ) | | | (2,510,855 | ) | | | 649,340 | |
| Net Assets | | $ | 26,618,585 | | | $ | 12,626,822 | | | $ | 5,081,514 | |
| Outstanding Shares of Beneficial Interest (unlimited authorization - no par value) | | | 2,100,000 | | | | 850,002 | | | | 175,002 | |
| Net Asset Value, Offering and Redemption Price Per Share | | $ | 12.68 | | | $ | 14.86 | | | $ | 29.04 | |
| Cost of Investments | | $ | 28,488,063 | | | $ | 9,499,555 | | | $ | — | |
| Cost of Affiliated Investments | | | — | | | | — | | | | 4,385,345 | |
| Cost of Foreign Currency | | | 74,355 | | | | 141 | | | | — | |
Amounts designated as “—” are $0 or have been rounded to $0.
The accompanying notes are an integral part of the financial statements.
Statements of Assets and Liabilities (Unaudited)
September 30, 2024
| | | KraneShares
Global Luxury
Index ETF | | | KraneShares
Artificial
Intelligence and
Technology ETF | | | KraneShares
Sustainable Ultra
Short Duration
Index ETF | |
| Assets: | | | | | | | | | | | | |
| Investments at Value | | $ | 2,496,949 | | | $ | 5,043,398 | | | $ | 285,494,961 | |
| Cash and Cash Equivalents | | | 17,409 | | | | 41,569 | | | | 11,848,383 | |
| Foreign Currency at Value | | | 413 | | | | 5 | | | | — | |
| Receivable for Investment Securities Sold | | | 14,269 | | | | — | | | | — | |
| Reclaim Receivable | | | 4,218 | | | | — | | | | — | |
| Dividend and Interest Receivable | | | 293 | | | | 850 | | | | 2,656,329 | |
| Receivable for Capital Shares Sold | | | — | | | | 50 | | | | — | |
| Prepaid Expenses | | | 19 | | | | — | | | | — | |
| Total Assets | | | 2,533,570 | | | | 5,085,872 | | | | 299,999,673 | |
| | | | | | | | | | | | | |
| Liabilities: | | | | | | | | | | | | |
| Payable for Management Fees | | | 1,318 | | | | 3,968 | | | | 31,319 | |
| Payable for Trustees’ Fees | | | 62 | | | | 32 | | | | 2,296 | |
| Foreign Currency Payable at Value | | | — | | | | — | | | | 413 | |
| Total Liabilities | | | 1,380 | | | | 4,000 | | | | 34,028 | |
| Net Assets | | $ | 2,532,190 | | | $ | 5,081,872 | | | $ | 299,965,645 | |
| | | | | | | | | | | | | |
| Net Assets Consist of: | | | | | | | | | | | | |
| Paid-in Capital | | $ | 2,423,050 | | | $ | 4,846,346 | | | $ | 299,561,162 | |
| Total Distributable Earnings | | | 109,140 | | | | 235,526 | | | | 404,483 | |
| Net Assets | | $ | 2,532,190 | | | $ | 5,081,872 | | | $ | 299,965,645 | |
| Outstanding Shares of Beneficial Interest (unlimited authorization - no par value) | | | 100,002 | | | | 200,002 | | | | 11,950,002 | |
| Net Asset Value, Offering and Redemption Price Per Share | | $ | 25.32 | | | $ | 25.41 | | | $ | 25.10 | |
| Cost of Investments | | $ | 2,343,282 | | | $ | 4,766,734 | | | $ | 285,218,540 | |
| Cost (Proceeds) of Foreign Currency | | | 334 | | | | 4 | | | | (414 | ) |
Amounts designated as “—” are $0 or have been rounded to $0.
The accompanying notes are an integral part of the financial statements.
Statements of Assets and Liabilities (Unaudited)
September 30, 2024
| | | KraneShares
China Alpha
Index ETF | |
| Assets: | | | | |
| Investments at Value | | $ | 8,806,805 | |
| Cash and Cash Equivalents | | | 12,842 | |
| Foreign Currency at Value | | | 551 | |
| Total Assets | | | 8,820,198 | |
| | | | | |
| Liabilities: | | | | |
| Payable for Management Fees | | | 4,365 | |
| Payable for Trustees’ Fees | | | 21 | |
| Total Liabilities | | | 4,386 | |
| Net Assets | | $ | 8,815,812 | |
| | | | | |
| Net Assets Consist of: | | | | |
| Paid-in Capital | | $ | 7,469,523 | |
| Total Distributable Earnings | | | 1,346,289 | |
| Net Assets | | $ | 8,815,812 | |
| Outstanding Shares of Beneficial Interest (unlimited authorization - no par value) | | | 300,002 | |
| Net Asset Value, Offering and Redemption Price Per Share | | $ | 29.39 | |
| Cost of Investments | | $ | 7,417,409 | |
| Cost of Foreign Currency | | | 552 | |
The accompanying notes are an integral part of the financial statements.
Statements of Operations (Unaudited)
For the Period Ended September 30, 2024
| | | KraneShares
CSI China
Internet ETF | | | KraneShares
Bosera MSCI
China A 50 Connect
Index ETF | | | KraneShares
MSCI All China
Index ETF | |
| Investment Income: | | | | | | | | | |
| Dividend Income | | $ | 65,040,550 | | | $ | 4,998,134 | | | $ | 196,440 | |
| Interest Income | | | 329,658 | | | | 14,543 | | | | 659 | |
| Security Lending Income | | | 3,788,947 | | | | — | | | | — | |
| Less: Foreign Taxes Withheld | | | — | | | | (499,814 | ) | | | (15,798 | ) |
| Total Investment Income | | | 69,159,155 | | | | 4,512,863 | | | | 181,301 | |
| | | | | | | | | | | | | |
| Expenses: | | | | | | | | | | | | |
| Management Fees† | | | 17,873,683 | | | | 692,589 | | | | 22,552 | |
| Trustees’ Fees | | | 263,773 | | | | 8,770 | | | | 325 | |
| Security Lending Fees† | | | 379,234 | | | | — | | | | — | |
| Insurance Expense | | | 45,273 | | | | 1,554 | | | | 52 | |
| Total Expenses | | | 18,561,963 | | | | 702,913 | | | | 22,929 | |
| Management Fee Waiver† | | | — | | | | (204,226 | ) | | | (6,633 | ) |
| Net Expenses | | | 18,561,963 | | | | 498,687 | | | | 16,296 | |
| Net Investment Income | | | 50,597,192 | | | | 4,014,176 | | | | 165,005 | |
| | | | | | | | | | | | | |
| Net Realized Gain (Loss) on: | | | | | | | | | | | | |
| Investments | | | (538,079,223 | ) | | | (19,441,919 | ) | | | (213,133 | ) |
| Foreign Currency Translations | | | (54,780 | ) | | | 31,839 | | | | (42 | ) |
| Net Realized Loss | | | (538,134,003 | ) | | | (19,410,080 | ) | | | (213,175 | ) |
| | | | | | | | | | | | | |
| Net Change in Unrealized Appreciation (Depreciation) on: | | | | | | | | | | | | |
| Investments | | | 2,011,087,183 | | | | 51,140,973 | | | | 1,792,000 | |
| Foreign Currency Translations | | | (5,175 | ) | | | 28,317 | | | | 42 | |
| Net Change in Unrealized Appreciation (Depreciation) | | | 2,011,082,008 | | | | 51,169,290 | | | | 1,792,042 | |
| Net Realized and Unrealized Gain | | | 1,472,948,005 | | | | 31,759,210 | | | | 1,578,867 | |
| Net Increase in Net Assets Resulting from Operations | | $ | 1,523,545,197 | | | $ | 35,773,386 | | | $ | 1,743,872 | |
| † | See Note 4 in Notes to Financial Statements. |
Amounts designated as “—” are $0 or have been rounded to $0.
The accompanying notes are an integral part of the financial statements.
Statements of Operations (Unaudited)
For the Period Ended September 30, 2024
| | | KraneShares
MSCI One Belt
One Road
Index ETF | | | KraneShares
Emerging Markets
Consumer Technology
Index ETF | | | KraneShares
MSCI China
Clean Technology
Index ETF | |
| Investment Income: | | | | | | | | | |
| Dividend Income | | $ | 108,220 | | | $ | 97,420 | | | $ | 1,186,769 | |
| Interest Income | | | 1,608 | | | | 1,271 | | | | 4,136 | |
| Security Lending Income | | | — | | | | 3,348 | | | | — | |
| Less: Foreign Taxes Withheld | | | (7,829 | ) | | | (9,552 | ) | | | (69,472 | ) |
| Total Investment Income | | | 101,999 | | | | 92,487 | | | | 1,121,433 | |
| | | | | | | | | | | | | |
| Expenses: | | | | | | | | | | | | |
| Management Fees† | | | 14,467 | | | | 62,028 | | | | 209,879 | |
| Trustees’ Fees | | | 186 | | | | 822 | | | | 2,694 | |
| Security Lending Fees† | | | — | | | | 353 | | | | — | |
| Insurance Expense | | | 34 | | | | 158 | | | | 481 | |
| Total Expenses | | | 14,687 | | | | 63,361 | | | | 213,054 | |
| Management Fee Waiver† | | | — | | | | (15,905 | ) | | | — | |
| Net Expenses | | | 14,687 | | | | 47,456 | | | | 213,054 | |
| Net Investment Income | | | 87,312 | | | | 45,031 | | | | 908,379 | |
| | | | | | | | | | | | | |
| Net Realized Gain (Loss) on: | | | | | | | | | | | | |
| Investments | | | 5,265 | | | | 440,329 | | | | (9,657,114 | ) |
| Foreign Currency Translations | | | (388 | ) | | | (3,003 | ) | | | (5,524 | ) |
| Net Realized Gain (Loss) | | | 4,877 | | | | 437,326 | | | | (9,662,638 | ) |
| | | | | | | | | | | | | |
| Net Change in Unrealized Appreciation (Depreciation) on: | | | | | | | | | | | | |
| Investments | | | 349,999 | | | | 3,452,610 | | | | 19,998,620 | |
| Accrued Foreign Capital Gains Tax on Appreciated Securities | | | (3,050 | ) | | | (37,016 | ) | | | — | |
| Foreign Currency Translations | | | 153 | | | | 595 | | | | (406 | ) |
| Net Change in Unrealized Appreciation (Depreciation) | | | 347,102 | | | | 3,416,189 | | | | 19,998,214 | |
| Net Realized and Unrealized Gain | | | 351,979 | | | | 3,853,515 | | | | 10,335,576 | |
| Net Increase in Net Assets Resulting from Operations | | $ | 439,291 | | | $ | 3,898,546 | | | $ | 11,243,955 | |
| † | See Note 4 in Notes to Financial Statements. |
Amounts designated as “—” are $0 or have been rounded to $0.
The accompanying notes are an integral part of the financial statements.
Statements of Operations (Unaudited)
For the Period Ended September 30, 2024
| | | KraneShares
Electric Vehicles
and Future Mobility
Index ETF | | | KraneShares
MSCI All China
Health Care
Index ETF | | | KraneShares
Asia Pacific
High Income
USD Bond ETF | |
| Investment Income: | | | | | | | | | | | | |
| Dividend Income | | $ | 930,640 | | | $ | 686,977 | | | $ | — | |
| Interest Income | | | 8,044 | | | | 3,534 | | | | 839,101 | |
| Security Lending Income | | | 158,897 | | | | 6,333 | | | | — | |
| Less: Foreign Taxes Withheld | | | (61,697 | ) | | | (58,864 | ) | | | — | |
| Total Investment Income | | | 1,035,884 | | | | 637,980 | | | | 839,101 | |
| | | | | | | | | | | | | |
| Expenses: | | | | | | | | | | | | |
| Management Fees† | | | 297,808 | | | | 164,497 | | | | 54,268 | |
| Trustees’ Fees | | | 4,510 | | | | 2,131 | | | | 769 | |
| Security Lending Fees† | | | 15,721 | | | | 630 | | | | — | |
| Insurance Expense | | | 850 | | | | 395 | | | | 116 | |
| Total Expenses | | | 318,889 | | | | 167,653 | | | | 55,153 | |
| Management Fee Waiver† | | | — | | | | (29,525 | ) | | | — | |
| Net Expenses | | | 318,889 | | | | 138,128 | | | | 55,153 | |
| Net Investment Income | | | 716,995 | | | | 499,852 | | | | 783,948 | |
| | | | | | | | | | | | | |
| Net Realized Gain (Loss) on: | | | | | | | | | | | | |
| Investments | | | (21,298,183 | ) | | | (8,122,016 | ) | | | 178 | |
| Foreign Currency Translations | | | (49,666 | ) | | | (489 | ) | | | — | |
| Net Realized Gain (Loss) | | | (21,347,849 | ) | | | (8,122,505 | ) | | | 178 | |
| | | | | | | | | | | | | |
| Net Change in Unrealized Appreciation (Depreciation) on: | | | | | | | | | | | | |
| Investments | | | 21,985,281 | | | | 13,994,619 | | | | 255,296 | |
| Foreign Currency Translations | | | 13,200 | | | | 94 | | | | 21 | |
| Net Change in Unrealized Appreciation (Depreciation) | | | 21,998,481 | | | | 13,994,713 | | | | 255,317 | |
| Net Realized and Unrealized Gain | | | 650,632 | | | | 5,872,208 | | | | 255,495 | |
| Net Increase in Net Assets Resulting from Operations | | $ | 1,367,627 | | | $ | 6,372,060 | | | $ | 1,039,443 | |
| † | See Note 4 in Notes to Financial Statements. |
Amounts designated as “—” are $0 or have been rounded to $0.
The accompanying notes are an integral part of the financial statements.
Statements of Operations/Consolidated Statement of Operations
For the Period Ended September 30, 2024
| | | KraneShares
MSCI Emerging
Markets ex China
Index ETF | | | KraneShares Value
Line® Dynamic
Dividend Equity
Index ETF | | | KraneShares
Mount Lucas Managed
Futures Index
Strategy ETF | |
| Investment Income: | | | | | | | | | |
| Dividend Income | | $ | 1,489,948 | | | $ | 455,170 | | | $ | — | |
| Interest Income | | | 8,370 | | | | 996 | | | | 8,097,244 | |
| Less: Foreign Taxes Withheld | | | (209,769 | ) | | | — | | | | — | |
| Total Investment Income | | | 1,288,549 | | | | 456,166 | | | | 8,097,244 | |
| | | | | | | | | | | | | |
| Expenses: | | | | | | | | | | | | |
| Management Fees† | | | 223,891 | | | | 86,685 | | | | 1,406,963 | |
| Trustees’ Fees | | | 3,706 | | | | 1,544 | | | | 15,271 | |
| Insurance Expense | | | 570 | | | | 252 | | | | 2,064 | |
| Total Expenses | | | 228,167 | | | | 88,481 | | | | 1,424,298 | |
| Management Fee Waiver† | | | (135,106 | ) | | | — | | | | — | |
| Net Expenses | | | 93,061 | | | | 88,481 | | | | 1,424,298 | |
| Net Investment Income | | | 1,195,488 | | | | 367,685 | | | | 6,672,946 | |
| | | | | | | | | | | | | |
| Net Realized Gain (Loss) on: | | | | | | | | | | | | |
| Investments | | | (184,529 | ) | | | 1,733,045 | | | | — | |
| Futures Contracts | | | — | | | | — | | | | (20,258,318 | ) |
| Capital Gains Tax | | | (48,559 | ) | | | — | | | | — | |
| Foreign Currency Translations | | | (18,697 | ) | | | — | | | | (276,535 | ) |
| Net Realized Gain (Loss) | | | (251,785 | ) | | | 1,733,045 | | | | (20,534,853 | ) |
| | | | | | | | | | | | | |
| Net Change in Unrealized Appreciation (Depreciation) on: | | | | | | | | | | | | |
| Investments | | | 5,589,021 | | | | 1,231,793 | | | | 28,348 | |
| Accrued Foreign Capital Gains Tax on Appreciated Securities | | | (599,467 | ) | | | — | | | | — | |
| Futures Contracts | | | — | | | | — | | | | 6,844,453 | |
| Foreign Currency Translations | | | 8,418 | | | | — | | | | (401,967 | ) |
| Net Change in Unrealized Appreciation (Depreciation) | | | 4,997,972 | | | | 1,231,793 | | | | 6,470,834 | |
| Net Realized and Unrealized Gain (Loss) | | | 4,746,187 | | | | 2,964,838 | | | | (14,064,019 | ) |
| Net Increase (Decrease) in Net Assets Resulting from Operations | | $ | 5,941,675 | | | $ | 3,332,523 | | | $ | (7,391,073 | ) |
| † | See Note 4 in Notes to Financial Statements. |
Amounts designated as “—” are $0 or have been rounded to $0.
The accompanying notes are an integral part of the financial statements.
Statements of Operations (Unaudited)
For the Period Ended September 30, 2024
| | | KraneShares
SSE STAR Market 50
Index ETF | | | KraneShares
Hang Seng TECH
Index ETF | | | KraneShares
Dynamic Emerging
Markets
Strategy ETF | |
| Investment Income: | | | | | | | | | |
| Dividend Income | | $ | 159,026 | | | $ | 61,893 | | | $ | — | |
| Interest Income | | | 1,472 | | | | 1,439 | | | | 965 | |
| Less: Foreign Taxes Withheld | | | (15,902 | ) | | | (877 | ) | | | — | |
| Total Investment Income | | | 144,596 | | | | 62,455 | | | | 965 | |
| | | | | | | | | | | | | |
| Expenses: | | | | | | | | | | | | |
| Management Fees† | | | 98,334 | | | | 24,008 | | | | 2,164 | |
| Trustees’ Fees | | | 1,117 | | | | 331 | | | | 206 | |
| Insurance Expense | | | 205 | | | | 46 | | | | 30 | |
| Total Expenses | | | 99,656 | | | | 24,385 | | | | 2,400 | |
| Net Investment Income (Loss) | | | 44,940 | | | | 38,070 | | | | (1,435 | ) |
| | | | | | | | | | | | | |
| Net Realized Gain (Loss) on: | | | | | | | | | | | | |
| Investments | | | (4,755,524 | ) | | | 33,424 | | | | — | |
| Affiliated Investments | | | — | | | | — | | | | 67 | |
| Foreign Currency Translations | | | 244 | | | | (702 | ) | | | — | |
| Net Realized Gain (Loss) | | | (4,755,280 | ) | | | 32,722 | | | | 67 | |
| | | | | | | | | | | | | |
| Net Change in Unrealized Appreciation (Depreciation) on: | | | | | | | | | | | | |
| Investments | | | 8,358,446 | | | | 2,649,960 | | | | — | |
| Affiliated Investments | | | — | | | | — | | | | 688,430 | |
| Foreign Currency Translations | | | 7,288 | | | | (1,421 | ) | | | — | |
| Net Change in Unrealized Appreciation (Depreciation) | | | 8,365,734 | | | | 2,648,539 | | | | 688,430 | |
| Net Realized and Unrealized Gain | | | 3,610,454 | | | | 2,681,261 | | | | 688,497 | |
| Net Increase in Net Assets Resulting from Operations | | $ | 3,655,394 | | | $ | 2,719,331 | | | $ | 687,062 | |
| † | See Note 4 in Notes to Financial Statements. |
Amounts designated as “—” are $0 or have been rounded to $0.
The accompanying notes are an integral part of the financial statements.
Statements of Operations (Unaudited)
For the Period Ended September 30, 2024
| | | KraneShares
Global Luxury
Index ETF | | | KraneShares
Artificial Intelligence and Technology ETF(1) | | | KraneShares
Sustainable Ultra
Short Duration
Index ETF(2) | |
| Investment Income: | | | | | | | | | |
| Dividend Income | | $ | 33,681 | | | $ | 3,658 | | | $ | — | |
| Interest Income | | | 299 | | | | 190 | | | | 1,612,568 | |
| Less: Foreign Taxes Withheld | | | (4,063 | ) | | | (195 | ) | | | — | |
| Total Investment Income | | | 29,917 | | | | 3,653 | | | | 1,612,568 | |
| | | | | | | | | | | | | |
| Expenses: | | | | | | | | | | | | |
| Management Fees† | | | 8,354 | | | | 8,597 | | | | 87,066 | |
| Trustees’ Fees | | | 168 | | | | 66 | | | | 2,798 | |
| Insurance Expense | | | 31 | | | | — | | | | — | |
| Total Expenses | | | 8,553 | | | | 8,663 | | | | 89,864 | |
| Management Fee Waiver† | | | — | | | | — | | | | (30,022 | ) |
| Net Expenses | | | 8,553 | | | | 8,663 | | | | 59,842 | |
| Net Investment Income (Loss) | | | 21,364 | | | | (5,010 | ) | | | 1,552,726 | |
| | | | | | | | | | | | | |
| Net Realized Gain (Loss) on: | | | | | | | | | | | | |
| Investments | | | (70,284 | ) | | | (34,245 | ) | | | 6,335 | |
| Foreign Currency Translations | | | 353 | | | | (1,885 | ) | | | — | |
| Net Realized Gain (Loss) | | | (69,931 | ) | | | (36,130 | ) | | | 6,335 | |
| | | | | | | | | | | | | |
| Net Change in Unrealized Appreciation (Depreciation) on: | | | | | | | | | | | | |
| Investments | | | (92,207 | ) | | | 276,664 | | | | 276,421 | |
| Foreign Currency Translations | | | 190 | | | | 2 | | | | 1 | |
| Net Change in Unrealized Appreciation (Depreciation) | | | (92,017 | ) | | | 276,666 | | | | 276,422 | |
| Net Realized and Unrealized Gain (Loss) | | | (161,948 | ) | | | 240,536 | | | | 282,757 | |
| Net Increase (Decrease) in Net Assets Resulting from Operations | | $ | (140,584 | ) | | $ | 235,526 | | | $ | 1,835,483 | |
| † | See Note 4 in Notes to Financial Statements. |
| (1) | The Fund’s inception date was on July 17, 2024. |
| (2) | The Fund’s inception date was on July 25, 2024. |
Amounts designated as “—” are $0 or have been rounded to $0.
The accompanying notes are an integral part of the financial statements.
Statements of Operations (Unaudited)
For the Period Ended September 30, 2024
| | | KraneShares
China Alpha
Index ETF(1) | |
| Investment Income: | | | |
| Dividend Income | | $ | 4,825 | |
| Interest Income | | | 34 | |
| Less: Foreign Taxes Withheld | | | (483 | ) |
| Total Investment Income | | | 4,376 | |
| | | | | |
| Expenses: | | | | |
| Management Fees† | | | 4,525 | |
| Trustees’ Fees | | | 21 | |
| Total Expenses | | | 4,546 | |
| Net Investment Loss | | | (170 | ) |
| | | | | |
| Net Realized Gain (Loss) on: | | | | |
| Investments | | | (42,308 | ) |
| Foreign Currency Translations | | | (628 | ) |
| Net Realized Loss | | | (42,936 | ) |
| | | | | |
| Net Change in Unrealized Appreciation (Depreciation) on: | | | | |
| Investments | | | 1,389,396 | |
| Foreign Currency Translations | | | (1 | ) |
| Net Change in Unrealized Appreciation (Depreciation) | | | 1,389,395 | |
| Net Realized and Unrealized Gain | | | 1,346,459 | |
| Net Increase in Net Assets Resulting from Operations | | $ | 1,346,289 | |
| † | See Note 4 in Notes to Financial Statements. |
| (1) | The Fund’s inception date was on August 27, 2024. |
The accompanying notes are an integral part of the financial statements.
Statements of Changes in Net Assets
| | | KraneShares CSI China Internet ETF | |
| | | Period Ended
September 30,
2024
(unaudited) | | | Year Ended
March 31,
2024 | |
| Operations: | | | | | | | | |
| Net Investment Income | | $ | 50,597,192 | | | $ | 12,673,699 | |
| Net Realized Loss | | | (538,134,003 | ) | | | (540,400,352 | ) |
| Net Change in Unrealized Appreciation (Depreciation) | | | 2,011,082,008 | | | | (454,948,205 | ) |
| Net Increase (Decrease) in Net Assets Resulting from Operations | | | 1,523,545,197 | | | | (982,674,858 | ) |
| Distributions: | | | — | | | | (94,044,849 | ) |
| | | | | | | | | |
| Capital Share Transactions:(1) | | | | | | | | |
| Issued | | | 1,624,581,380 | | | | 1,577,944,139 | |
| Redeemed | | | (1,370,297,174 | ) | | | (1,181,907,489 | ) |
| Increase in Net Assets from Capital Share Transactions | | | 254,284,206 | | | | 396,036,650 | |
| Total Increase (Decrease) in Net Assets | | | 1,777,829,403 | | | | (680,683,057 | ) |
| | | | | | | | | |
| Net Assets: | | | | | | | | |
| Beginning of Year/Period | | | 5,430,986,331 | | | | 6,111,669,388 | |
| End of Year/Period | | $ | 7,208,815,734 | | | $ | 5,430,986,331 | |
| | | | | | | | | |
| Share Transactions: | | | | | | | | |
| Issued | | | 50,250,000 | | | | 55,900,000 | |
| Redeemed | | | (51,150,000 | ) | | | (44,750,000 | ) |
| Net Increase (Decrease) in Shares Outstanding from Share Transactions | | | (900,000 | ) | | | 11,150,000 | |
| (1) | Includes transaction costs related to creations and redemptions. |
Amounts designated as “—” are $0 or have been rounded to $0.
The accompanying notes are an integral part of the financial statements.
Statements of Changes in Net Assets (continued)
| | | KraneShares Bosera MSCI China A 50
Connect Index ETF | |
| | | Period Ended
September 30,
2024
(unaudited) | | | Year Ended
March 31,
2024 | |
| Operations: | | | | | | | | |
| Net Investment Income | | $ | 4,014,176 | | | $ | 7,559,128 | |
| Net Realized Loss | | | (19,410,080 | ) | | | (128,360,616 | ) |
| Net Change in Unrealized Appreciation (Depreciation) | | | 51,169,290 | | | | 37,591,345 | |
| Net Increase (Decrease) in Net Assets Resulting from Operations | | | 35,773,386 | | | | (83,210,143 | ) |
| Distributions: | | | — | | | | (6,619,090 | ) |
| | | | | | | | | |
| Capital Share Transactions:(1) | | | | | | | | |
| Issued | | | 5,734,841 | | | | 45,259,571 | |
| Redeemed | | | (46,013,049 | ) | | | (235,437,465 | ) |
| Decrease in Net Assets from Capital Share Transactions | | | (40,278,208 | ) | | | (190,177,894 | ) |
| Total Decrease in Net Assets | | | (4,504,822 | ) | | | (280,007,127 | ) |
| | | | | | | | | |
| Net Assets: | | | | | | | | |
| Beginning of Year/Period | | | 190,865,940 | | | | 470,873,067 | |
| End of Year/Period | | $ | 186,361,118 | | | $ | 190,865,940 | |
| | | | | | | | | |
| Share Transactions: | | | | | | | | |
| Issued | | | 250,000 | | | | 1,900,000 | |
| Redeemed | | | (2,100,000 | ) | | | (11,050,000 | ) |
| Net Decrease in Shares Outstanding from Share Transactions | | | (1,850,000 | ) | | | (9,150,000 | ) |
| (1) | Includes transaction costs related to creations and redemptions. |
Amounts designated as “—” are $0 or have been rounded to $0.
The accompanying notes are an integral part of the financial statements.
Statements of Changes in Net Assets (continued)
| | | KraneShares MSCI All China Index ETF | |
| | | Period Ended
September 30,
2024
(unaudited) | | | Year Ended
March 31,
2024 | |
| Operations: | | | | | | | | |
| Net Investment Income | | $ | 165,005 | | | $ | 164,750 | |
| Net Realized Loss | | | (213,175 | ) | | | (942,543 | ) |
| Net Change in Unrealized Appreciation (Depreciation) | | | 1,792,042 | | | | (487,545 | ) |
| Net Increase (Decrease) in Net Assets Resulting from Operations | | | 1,743,872 | | | | (1,265,338 | ) |
| Distributions: | | | — | | | | (215,050 | ) |
| | | | | | | | | |
| Capital Share Transactions:(1) | | | | | | | | |
| Issued | | | — | | | | 8,973 | |
| Redeemed | | | — | | | | (1,005,314 | ) |
| Decrease in Net Assets from Capital Share Transactions | | | — | | | | (996,341 | ) |
| Total Increase (Decrease) in Net Assets | | | 1,743,872 | | | | (2,476,729 | ) |
| | | | | | | | | |
| Net Assets: | | | | | | | | |
| Beginning of Year/Period | | | 6,317,792 | | | | 8,794,521 | |
| End of Year/Period | | $ | 8,061,664 | | | $ | 6,317,792 | |
| | | | | | | | | |
| Share Transactions: | | | | | | | | |
| Redeemed | | | — | | | | (50,000 | ) |
| Net Decrease in Shares Outstanding from Share Transactions | | | — | | | | (50,000 | ) |
| (1) | Includes transaction costs related to creations and redemptions. |
Amounts designated as “—” are $0 or have been rounded to $0.
The accompanying notes are an integral part of the financial statements.
Statements of Changes in Net Assets (continued)
| | | KraneShares MSCI One Belt One Road Index ETF | |
| | | Period Ended
September 30,
2024
(unaudited) | | | Year Ended
March 31,
2024 | |
| Operations: | | | | | | | | |
| Net Investment Income | | $ | 87,312 | | | $ | 117,516 | |
| Net Realized Gain (Loss) | | | 4,877 | | | | (441,704 | ) |
| Net Change in Unrealized Appreciation (Depreciation) | | | 347,102 | | | | 164,619 | |
| Net Increase (Decrease) in Net Assets Resulting from Operations | | | 439,291 | | | | (159,569 | ) |
| Distributions: | | | — | | | | (137,606 | ) |
| | | | | | | | | |
| Capital Share Transactions:(1) | | | | | | | | |
| Redeemed | | | (1,078,939 | ) | | | — | |
| Decrease in Net Assets from Capital Share Transactions | | | (1,078,939 | ) | | | — | |
| Total Decrease in Net Assets | | | (639,648 | ) | | | (297,175 | ) |
| | | | | | | | | |
| Net Assets: | | | | | | | | |
| Beginning of Year/Period | | | 4,188,058 | | | | 4,485,233 | |
| End of Year/Period | | $ | 3,548,410 | | | $ | 4,188,058 | |
| | | | | | | | | |
| Share Transactions: | | | | | | | | |
| Redeemed | | | (50,000 | ) | | | — | |
| Net Decrease in Shares Outstanding from Share Transactions | | | (50,000 | ) | | | — | |
| (1) | Includes transaction costs related to creations and redemptions. |
Amounts designated as “—” are $0 or have been rounded to $0.
The accompanying notes are an integral part of the financial statements.
Statements of Changes in Net Assets (continued)
| | | KraneShares Emerging Markets | |
| | | Consumer Technology Index ETF | |
| | | Period Ended
September 30,
2024
(unaudited) | | | Year Ended
March 31,
2024 | |
| Operations: | | | | | | | | |
| Net Investment Income | | $ | 45,031 | | | $ | 31,365 | |
| Net Realized Gain (Loss) | | | 437,326 | | | | (11,744,186 | ) |
| Net Change in Unrealized Appreciation (Depreciation) | | | 3,416,189 | | | | 11,694,849 | |
| Net Increase (Decrease) in Net Assets Resulting from Operations | | | 3,898,546 | | | | (17,972 | ) |
| Distributions: | | | — | | | | (27,452 | ) |
| | | | | | | | | |
| Capital Share Transactions:(1) | | | | | | | | |
| Issued | | | — | | | | 13,097,618 | |
| Redeemed | | | (5,099,378 | ) | | | (25,036,681 | ) |
| Decrease in Net Assets from Capital Share Transactions | | | (5,099,378 | ) | | | (11,939,063 | ) |
| Total Decrease in Net Assets | | | (1,200,832 | ) | | | (11,984,487 | ) |
| | | | | | | | | |
| Net Assets: | | | | | | | | |
| Beginning of Year/Period | | | 18,577,086 | | | | 30,561,573 | |
| End of Year/Period | | $ | 17,376,254 | | | $ | 18,577,086 | |
| | | | | | | | | |
| Share Transactions: | | | | | | | | |
| Issued | | | — | | | | 950,000 | |
| Redeemed | | | (350,000 | ) | | | (1,700,000 | ) |
| Net Decrease in Shares Outstanding from Share Transactions | | | (350,000 | ) | | | (750,000 | ) |
| (1) | Includes transaction costs related to creations and redemptions. |
Amounts designated as “—” are $0 or have been rounded to $0.
The accompanying notes are an integral part of the financial statements.
Statements of Changes in Net Assets (continued)
| | | KraneShares MSCI China Clean
Technology Index ETF | |
| | | Period Ended
September 30,
2024
(unaudited) | | | Year Ended
March 31,
2024 | |
| Operations: | | | | | | | | |
| Net Investment Income | | $ | 908,379 | | | $ | 543,865 | |
| Net Realized Loss | | | (9,662,638 | ) | | | (41,459,536 | ) |
| Net Change in Unrealized Appreciation (Depreciation) | | | 19,998,214 | | | | 15,930,993 | |
| Net Increase (Decrease) in Net Assets Resulting from Operations | | | 11,243,955 | | | | (24,984,678 | ) |
| Distributions: | | | — | | | | (496,202 | ) |
| | | | | | | | | |
| Capital Share Transactions:(1) | | | | | | | | |
| Issued | | | 1,049,954 | | | | 29,519 | |
| Redeemed | | | (9,255,553 | ) | | | (13,207,448 | ) |
| Decrease in Net Assets from Capital Share Transactions | | | (8,205,599 | ) | | | (13,177,929 | ) |
| Total Increase (Decrease) in Net Assets | | | 3,038,356 | | | | (38,658,809 | ) |
| | | | | | | | | |
| Net Assets: | | | | | | | | |
| Beginning of Year/Period | | | 56,951,732 | | | | 95,610,541 | |
| End of Year/Period | | $ | 59,990,088 | | | $ | 56,951,732 | |
| | | | | | | | | |
| Share Transactions: | | | | | | | | |
| Issued | | | 50,000 | | | | — | |
| Redeemed | | | (450,000 | ) | | | (550,000 | ) |
| Net Decrease in Shares Outstanding from Share Transactions | | | (400,000 | ) | | | (550,000 | ) |
| (1) | Includes transaction costs related to creations and redemptions. |
Amounts designated as “—” are $0 or have been rounded to $0.
The accompanying notes are an integral part of the financial statements.
Statements of Changes in Net Assets (continued)
| | | KraneShares Electric
Vehicles and | |
| | | Future Mobility Index ETF | |
| | | Period Ended
September 30,
2024
(unaudited) | | | Year Ended
March 31,
2024 | |
| Operations: | | | | | | | | |
| Net Investment Income | | $ | 716,995 | | | $ | 1,193,104 | |
| Net Realized Loss | | | (21,347,849 | ) | | | (43,673,367 | ) |
| Net Change in Unrealized Appreciation (Depreciation) | | | 21,998,481 | | | | (3,114,157 | ) |
| Net Increase (Decrease) in Net Assets Resulting from Operations | | | 1,367,627 | | | | (45,594,420 | ) |
| Distributions: | | | — | | | | (1,252,258 | ) |
| | | | | | | | | |
| Capital Share Transactions:(1) | | | | | | | | |
| Issued | | | 31,064 | | | | 4,457,911 | |
| Redeemed | | | (19,220,648 | ) | | | (37,098,611 | ) |
| Decrease in Net Assets from Capital Share Transactions | | | (19,189,584 | ) | | | (32,640,700 | ) |
| Total Decrease in Net Assets | | | (17,821,957 | ) | | | (79,487,378 | ) |
| | | | | | | | | |
| Net Assets: | | | | | | | | |
| Beginning of Year/Period | | | 105,618,362 | | | | 185,105,740 | |
| End of Year/Period | | $ | 87,796,405 | | | $ | 105,618,362 | |
| | | | | | | | | |
| Share Transactions: | | | | | | | | |
| Issued | | | — | | | | 150,000 | |
| Redeemed | | | (950,000 | ) | | | (1,500,000 | ) |
| Net Decrease in Shares Outstanding from Share Transactions | | | (950,000 | ) | | | (1,350,000 | ) |
| (1) | Includes transaction costs related to creations and redemptions. |
Amounts designated as “—” are $0 or have been rounded to $0.
The accompanying notes are an integral part of the financial statements.
Statements of Changes in Net Assets (continued)
| | | KraneShares MSCI All China Health Care
Index ETF | |
| | | Period Ended
September 30,
2024
(unaudited) | | | Year Ended
March 31,
2024 | |
| Operations: | | | | | | | | |
| Net Investment Income | | $ | 499,852 | | | $ | 504,658 | |
| Net Realized Loss | | | (8,122,505 | ) | | | (23,644,703 | ) |
| Net Change in Unrealized Appreciation (Depreciation) | | | 13,994,713 | | | | 1,017,919 | |
| Net Increase (Decrease) in Net Assets Resulting from Operations | | | 6,372,060 | | | | (22,122,126 | ) |
| Distributions: | | | — | | | | (383,670 | ) |
| | | | | | | | | |
| Capital Share Transactions:(1) | | | | | | | | |
| Issued | | | 1,000 | | | | 25,068 | |
| Redeemed | | | (5,682,167 | ) | | | (25,206,898 | ) |
| Decrease in Net Assets from Capital Share Transactions | | | (5,681,167 | ) | | | (25,181,830 | ) |
| Total Increase (Decrease) in Net Assets | | | 690,893 | | | | (47,687,626 | ) |
| | | | | | | | | |
| Net Assets: | | | | | | | | |
| Beginning of Year/Period | | | 46,804,414 | | | | 94,492,040 | |
| End of Year/Period | | $ | 47,495,307 | | | $ | 46,804,414 | |
| | | | | | | | | |
| Share Transactions: | | | | | | | | |
| Redeemed | | | (400,000 | ) | | | (1,350,000 | ) |
| Net Decrease in Shares Outstanding from Share Transactions | | | (400,000 | ) | | | (1,350,000 | ) |
| (1) | Includes transaction costs related to creations and redemptions. |
Amounts designated as “—” are $0 or have been rounded to $0.
The accompanying notes are an integral part of the financial statements.
Statements of Changes in Net Assets (continued)
| | | KraneShares Asia Pacific High Income
USD Bond ETF | |
| | | Period Ended
September 30,
2024
(unaudited) | | | Year Ended
March 31,
2024 | |
| Operations: | | | | | | | | |
| Net Investment Income | | $ | 783,948 | | | $ | 1,998,210 | |
| Net Realized Gain (Loss) | | | 178 | | | | (1,965,464 | ) |
| Net Change in Unrealized Appreciation (Depreciation) | | | 255,317 | | | | 786,683 | |
| Net Increase in Net Assets Resulting from Operations | | | 1,039,443 | | | | 819,429 | |
| Distributions: | | | (763,769 | ) | | | (2,334,194 | ) |
| | | | | | | | | |
| Capital Share Transactions:(1) | | | | | | | | |
| Issued | | | 4,956,332 | | | | 468 | |
| Redeemed | | | (1,226,480 | ) | | | (3,746,502 | ) |
| Increase (Decrease) in Net Assets from Capital Share Transactions | | | 3,729,852 | | | | (3,746,034 | ) |
| Total Increase (Decrease) in Net Assets | | | 4,005,526 | | | | (5,260,799 | ) |
| | | | | | | | | |
| Net Assets: | | | | | | | | |
| Beginning of Year/Period | | | 14,784,474 | | | | 20,045,273 | |
| End of Year/Period | | $ | 18,790,000 | | | $ | 14,784,474 | |
| | | | | | | | | |
| Share Transactions: | | | | | | | | |
| Issued | | | 200,000 | | | | — | |
| Redeemed | | | (50,000 | ) | | | (150,000 | ) |
| Net Increase (Decrease) in Shares Outstanding from Share Transactions | | | 150,000 | | | | (150,000 | ) |
| (1) | Includes transaction costs related to creations and redemptions. |
Amounts designated as “—” are $0 or have been rounded to $0.
The accompanying notes are an integral part of the financial statements.
Statements of Changes in Net Assets (continued)
| | | KraneShares MSCI Emerging Markets
ex China Index ETF | |
| | | Period Ended
September 30,
2024
(unaudited) | | | Year Ended
March 31,
2024 | |
| Operations: | | | | | | | | |
| Net Investment Income | | $ | 1,195,488 | | | $ | 1,185,905 | |
| Net Realized Loss | | | (251,785 | ) | | | (262,202 | ) |
| Net Change in Unrealized Appreciation (Depreciation) | | | 4,997,972 | | | | 6,923,619 | |
| Net Increase in Net Assets Resulting from Operations | | | 5,941,675 | | | | 7,847,322 | |
| Distributions: | | | — | | | | (910,616 | ) |
| | | | | | | | | |
| Capital Share Transactions:(1) | | | | | | | | |
| Issued | | | 10,359 | | | | 41,704,010 | |
| Redeemed | | | (5,831,054 | ) | | | — | |
| Increase (Decrease) in Net Assets from Capital Share Transactions | | | (5,820,695 | ) | | | 41,704,010 | |
| Total Increase in Net Assets | | | 120,980 | | | | 48,640,716 | |
| | | | | | | | | |
| Net Assets: | | | | | | | | |
| Beginning of Year/Period | | | 78,752,351 | | | | 30,111,635 | |
| End of Year/Period | | $ | 78,873,331 | | | $ | 78,752,351 | |
| | | | | | | | | |
| Share Transactions: | | | | | | | | |
| Issued | | | — | | | | 1,500,000 | |
| Redeemed | | | (200,000 | ) | | | — | |
| Net Increase (Decrease) in Shares Outstanding from Share Transactions | | | (200,000 | ) | | | 1,500,000 | |
| (1) | Includes transaction costs related to creations and redemptions. |
Amounts designated as “—” are $0 or have been rounded to $0.
The accompanying notes are an integral part of the financial statements.
Statements of Changes in Net Assets (continued)
| | | KraneShares Value Line® Dynamic
Dividend Equity Index ETF | |
| | | Period Ended
September 30,
2024
(unaudited) | | | Year Ended
March 31,
2024 | |
| Operations: | | | | | | |
| Net Investment Income | | $ | 367,685 | | | $ | 840,880 | |
| Net Realized Gain | | | 1,733,045 | | | | 889,919 | |
| Net Change in Unrealized Appreciation (Depreciation) | | | 1,231,793 | | | | 1,941,048 | |
| Net Increase in Net Assets Resulting from Operations | | | 3,332,523 | | | | 3,671,847 | |
| Distributions: | | | (319,754 | ) | | | (1,177,428 | ) |
| | | | | | | | | |
| Capital Share Transactions:(1) | | | | | | | | |
| Issued | | | 1,287,470 | | | | 1,125,953 | |
| Redeemed | | | (2,503,458 | ) | | | (3,419,756 | ) |
| Decrease in Net Assets from Capital Share Transactions | | | (1,215,988 | ) | | | (2,293,803 | ) |
| Total Increase in Net Assets | | | 1,796,781 | | | | 200,616 | |
| | | | | | | | | |
| Net Assets: | | | | | | | | |
| Beginning of Year/Period | | | 31,374,912 | | | | 31,174,296 | |
| End of Year/Period | | $ | 33,171,693 | | | $ | 31,374,912 | |
| | | | | | | | | |
| Share Transactions: | | | | | | | | |
| Issued | | | 50,000 | | | | 50,000 | |
| Redeemed | | | (100,000 | ) | | | (150,000 | ) |
| Net Decrease in Shares Outstanding from Share Transactions | | | (50,000 | ) | | | (100,000 | ) |
| (1) | Includes transaction costs related to creations and redemptions. |
The accompanying notes are an integral part of the financial statements.
Consolidated Statements of Changes in Net Assets
| | | KraneShares Mount Lucas Managed | |
| | | Futures Index Strategy ETF | |
| | | Period Ended
September 30,
2024
(unaudited) | | | Year Ended
March 31,
2024 | |
| Operations: | | | | | | | | |
| Net Investment Income | | $ | 6,672,946 | | | $ | 11,272,473 | |
| Net Realized Loss | | | (20,534,853 | ) | | | (19,050,002 | ) |
| Net Change in Unrealized Appreciation (Depreciation) | | | 6,470,834 | | | | 6,360,555 | |
| Net Decrease in Net Assets Resulting from Operations | | | (7,391,073 | ) | | | (1,416,974 | ) |
| | | | | | | | | |
| Capital Share Transactions:(1) | | | | | | | | |
| Issued | | | 129,641,764 | | | | 135,546,332 | |
| Redeemed | | | (14,830,971 | ) | | | (147,777,132 | ) |
| Increase (Decrease) in Net Assets from Capital Share Transactions | | | 114,810,793 | | | | (12,230,800 | ) |
| Total Increase (Decrease) in Net Assets | | | 107,419,720 | | | | (13,647,774 | ) |
| | | | | | | | | |
| Net Assets: | | | | | | | | |
| Beginning of Year/Period | | | 264,625,824 | | | | 278,273,598 | |
| End of Year/Period | | $ | 372,045,544 | | | $ | 264,625,824 | |
| | | | | | | | | |
| Share Transactions: | | | | | | | | |
| Issued | | | 4,400,000 | | | | 4,400,000 | |
| Redeemed | | | (500,000 | ) | | | (4,950,000 | ) |
| Net Increase (Decrease) in Shares Outstanding from Share Transactions | | | 3,900,000 | | | | (550,000 | ) |
| (1) | Includes transaction costs related to creations and redemptions. |
The accompanying notes are an integral part of the financial statements.
Statements of Changes in Net Assets
| | | KraneShares SSE STAR
Market 50 | |
| | | Index ETF | |
| | | Period Ended
September 30,
2024
(unaudited) | | | Year Ended
March 31,
2024 | |
| Operations: | | | | | | | | |
| Net Investment Income (Loss) | | $ | 44,940 | | | $ | (15,090 | ) |
| Net Realized Loss | | | (4,755,280 | ) | | | (10,165,484 | ) |
| Net Change in Unrealized Appreciation (Depreciation) | | | 8,365,734 | | | | (6,016,928 | ) |
| Net Increase (Decrease) in Net Assets Resulting from Operations | | | 3,655,394 | | | | (16,197,502 | ) |
| | | | | | | | | |
| Capital Share Transactions:(1) | | | | | | | | |
| Issued | | | 1,973 | | | | 850,878 | |
| Redeemed | | | (1,572,933 | ) | | | (8,248,735 | ) |
| Decrease in Net Assets from Capital Share Transactions | | | (1,570,960 | ) | | | (7,397,857 | ) |
| Total Increase (Decrease) in Net Assets | | | 2,084,434 | | | | (23,595,359 | ) |
| | | | | | | | | |
| Net Assets: | | | | | | | | |
| Beginning of Year/Period | | | 24,534,151 | | | | 48,129,510 | |
| End of Year/Period | | $ | 26,618,585 | | | $ | 24,534,151 | |
| | | | | | | | | |
| Share Transactions: | | | | | | | | |
| Issued | | | — | | | | 50,000 | |
| Redeemed | | | (150,000 | ) | | | (650,000 | ) |
| Net Decrease in Shares Outstanding from Share Transactions | | | (150,000 | ) | | | (600,000 | ) |
| (1) | Includes transaction costs related to creations and redemptions. |
Amounts designated as “—” are $0 or have been rounded to $0.
The accompanying notes are an integral part of the financial statements.
Statements of Changes in Net Assets (continued)
| | | KraneShares Hang Seng TECH Index ETF | |
| | | Period Ended
September 30,
2024
(unaudited) | | | Year Ended
March 31,
2024 | |
| Operations: | | | | | | | | |
| Net Investment Income | | $ | 38,070 | | | $ | 1,494 | |
| Net Realized Gain (Loss) | | | 32,722 | | | | (161,143 | ) |
| Net Change in Unrealized Appreciation (Depreciation) | | | 2,648,539 | | | | (1,131,876 | ) |
| Net Increase (Decrease) in Net Assets Resulting from Operations | | | 2,719,331 | | | | (1,291,525 | ) |
| Distributions: | | | — | | | | (46,489 | ) |
| | | | | | | | | |
| Capital Share Transactions:(1) | | | | | | | | |
| Issued | | | 4,516,751 | | | | 988 | |
| Redeemed | | | — | | | | (587,039 | ) |
| Increase (Decrease) in Net Assets from Capital Share Transactions | | | 4,516,751 | | | | (586,051 | ) |
| Total Increase (Decrease) in Net Assets | | | 7,236,082 | | | | (1,924,065 | ) |
| | | | | | | | | |
| Net Assets: | | | | | | | | |
| Beginning of Year/Period | | | 5,390,740 | | | | 7,314,805 | |
| End of Year/Period | | $ | 12,626,822 | | | $ | 5,390,740 | |
| | | | | | | | | |
| Share Transactions: | | | | | | | | |
| Issued | | | 350,000 | | | | — | |
| Redeemed | | | — | | | | (50,000 | ) |
| Net Increase (Decrease) in Shares Outstanding from Share Transactions | | | 350,000 | | | | (50,000 | ) |
| (1) | Includes transaction costs related to creations and redemptions. |
Amounts designated as “—” are $0 or have been rounded to $0.
The accompanying notes are an integral part of the financial statements.
Statements of Changes in Net Assets (continued)
| | | KraneShares Dynamic Emerging | |
| | | Markets Strategy ETF | |
| | | Period Ended
September 30,
2024
(unaudited) | | | Period Ended
March 31,
2024(1) | |
| Operations: | | | | | | | | |
| Net Investment Income (Loss) | | $ | (1,435 | ) | | $ | 104,646 | |
| Net Realized Gain | | | 67 | | | | 57,287 | |
| Net Change in Unrealized Appreciation (Depreciation) | | | 688,430 | | | | (31,496 | ) |
| Net Increase in Net Assets Resulting from Operations | | | 687,062 | | | | 130,437 | |
| Distributions: | | | — | | | | (105,254 | ) |
| | | | | | | | | |
| Capital Share Transactions:(2) | | | | | | | | |
| Issued | | | 664,992 | | | | 7,491,762 | |
| Redeemed | | | — | | | | (3,787,485 | ) |
| Increase in Net Assets from Capital Share Transactions | | | 664,992 | | | | 3,704,277 | |
| Total Increase in Net Assets | | | 1,352,054 | | | | 3,729,460 | |
| | | | | | | | | |
| Net Assets: | | | | | | | | |
| Beginning of Year/Period | | | 3,729,460 | | | | — | |
| End of Year/Period | | $ | 5,081,514 | | | $ | 3,729,460 | |
| | | | | | | | | |
| Share Transactions: | | | | | | | | |
| Issued | | | 25,000 | | | | 300,002 | |
| Redeemed | | | — | | | | (150,000 | ) |
| Net Increase in Shares Outstanding from Share Transactions | | | 25,000 | | | | 150,002 | |
| (1) | The Fund’s inception date was on August 24, 2023. |
| (2) | Includes transaction costs related to creations and redemptions. |
Amounts designated as “—” are $0 or have been rounded to $0.
The accompanying notes are an integral part of the financial statements.
Statements of Changes in Net Assets (continued)
| | | KraneShares Global Luxury Index ETF | |
| | | Period Ended
September 30,
2024
(unaudited) | | | Period Ended
March 31,
2024(1) | |
| Operations: | | | | | | |
| Net Investment Income | | $ | 21,364 | | | $ | 8,497 | |
| Net Realized Gain (Loss) | | | (69,931 | ) | | | 104,566 | |
| Net Change in Unrealized Appreciation (Depreciation) | | | (92,017 | ) | | | 245,884 | |
| Net Increase (Decrease) in Net Assets Resulting from Operations | | | (140,584 | ) | | | 358,947 | |
| Distributions: | | | — | | | | (4,643 | ) |
| | | | | | | | | |
| Capital Share Transactions:(2) | | | | | | | | |
| Issued | | | — | | | | 2,990,439 | |
| Redeemed | | | — | | | | (671,969 | ) |
| Increase in Net Assets from Capital Share Transactions | | | — | | | | 2,318,470 | |
| Total Increase (Decrease) in Net Assets | | | (140,584 | ) | | | 2,672,774 | |
| | | | | | | | | |
| Net Assets: | | | | | | | | |
| Beginning of Year/Period | | | 2,672,774 | | | | — | |
| End of Year/Period | | $ | 2,532,190 | | | $ | 2,672,774 | |
| | | | | | | | | |
| Share Transactions: | | | | | | | | |
| Issued | | | — | | | | 125,002 | |
| Redeemed | | | — | | | | (25,000 | ) |
| Net Increase in Shares Outstanding from Share Transactions | | | — | | | | 100,002 | |
| (1) | The Fund’s inception date was on September 6, 2023. |
| (2) | Includes transaction costs related to creations and redemptions. |
Amounts designated as “—” are $0 or have been rounded to $0.
The accompanying notes are an integral part of the financial statements.
Statements of Changes in Net Assets (continued)
| | | KraneShares Artificial Intelligence and
Technology ETF | |
| | | Period Ended
September 30,
2024(1)
(unaudited) | |
| Operations: | | | | |
| Net Investment Loss | | $ | (5,010 | ) |
| Net Realized Loss | | | (36,130 | ) |
| Net Change in Unrealized Appreciation (Depreciation) | | | 276,666 | |
| Net Increase in Net Assets Resulting from Operations | | | 235,526 | |
| | | | | |
| Capital Share Transactions:(2) | | | | |
| Issued | | | 4,846,346 | |
| Increase in Net Assets from Capital Share Transactions | | | 4,846,346 | |
| Total Increase in Net Assets | | | 5,081,872 | |
| | | | | |
| Net Assets: | | | | |
| Beginning of Period | | | — | |
| End of Period | | $ | 5,081,872 | |
| | | | | |
| Share Transactions: | | | | |
| Issued | | | 200,002 | |
| Net Increase in Shares Outstanding from Share Transactions | | | 200,002 | |
| (1) | The Fund’s inception date was on July 17, 2024. |
| (2) | Includes transaction costs related to creations and redemptions. |
Amounts designated as “—” are $0 or have been rounded to $0.
The accompanying notes are an integral part of the financial statements.
Statements of Changes in Net Assets (continued)
| | | KraneShares Sustainable Ultra Short Duration Index ETF | |
| | | Period Ended
September 30, 2024(1) (unaudited) | |
| Operations: | | | | |
| Net Investment Income | | $ | 1,552,726 | |
| Net Realized Gain | | | 6,335 | |
| Net Change in Unrealized Appreciation (Depreciation) | | | 276,422 | |
| Net Increase in Net Assets Resulting from Operations | | | 1,835,483 | |
| Distributions: | | | (1,431,000 | ) |
| | | | | |
| Capital Share Transactions:(2) | | | | |
| Issued | | | 299,561,162 | |
| Increase in Net Assets from Capital Share Transactions | | | 299,561,162 | |
| Total Increase in Net Assets | | | 299,965,645 | |
| | | | | |
| Net Assets: | | | | |
| Beginning of Period | | | — | |
| End of Period | | $ | 299,965,645 | |
| | | | | |
| Share Transactions: | | | | |
| Issued | | | 11,950,002 | |
| Net Increase in Shares Outstanding from Share Transactions | | | 11,950,002 | |
| (1) | The Fund’s inception date was on July 25, 2024. |
| (2) | Includes transaction costs related to creations and redemptions. |
Amounts designated as “—” are $0 or have been rounded to $0.
The accompanying notes are an integral part of the financial statements.
Statements of Changes in Net Assets (concluded)
| | | KraneShares China Alpha Index ETF | |
| | | Period Ended
September 30,
2024(1)
(unaudited) | |
| Operations: | | | | |
| Net Investment Loss | | $ | (170 | ) |
| Net Realized Loss | | | (42,936 | ) |
| Net Change in Unrealized Appreciation (Depreciation) | | | 1,389,395 | |
| Net Increase in Net Assets Resulting from Operations | | | 1,346,289 | |
| | | | | |
| Capital Share Transactions:(2) | | | | |
| Issued | | | 7,469,523 | |
| Increase in Net Assets from Capital Share Transactions | | | 7,469,523 | |
| Total Increase in Net Assets | | | 8,815,812 | |
| | | | | |
| Net Assets: | | | | |
| Beginning of Period | | | — | |
| End of Period | | $ | 8,815,812 | |
| | | | | |
| Share Transactions: | | | | |
| Issued | | | 300,002 | |
| Net Increase in Shares Outstanding from Share Transactions | | | 300,002 | |
| (1) | The Fund’s inception date was on August 27, 2024. |
| (2) | Includes transaction costs related to creations and redemptions. |
Amounts designated as “—” are $0 or have been rounded to $0.
The accompanying notes are an integral part of the financial statements.
Financial Highlights
Selected Per Share Data & Ratios
For the Periods Ended September 30, 2024 (Unaudited)
For the Years Ended March 31
For a Share Outstanding Throughout Each Period
| | | Net Asset Value,
Beginning of Period
($) | | Net Investment
Income (Loss)
($)* | | Net Realized
and Unrealized
Gain (Loss)
on Investments
($) | | Total from
Operations
($) | | Distribution from
Net Investment
Income
($) | | Distribution from
Capital Gains
($) | | Return of
Capital
($) |
| KraneShares CSI China Internet ETF | | | | | | |
| 2024*** | | 26.27 | | 0.27 | | 8.48 | | 8.75 | | — | | — | | — |
| 2024 | | 31.25 | | 0.06 | | (4.58) | | (4.52) | | (0.46) | | — | | — |
| 2023 | | 29.52 | | 0.18 | | 1.55 | | 1.73 | | — | | — | | — |
| 2022 | | 75.59 | | (0.05) | | (43.44) | | (43.49) | | — | | (2.58) | | — |
| 2021 | | 45.19 | | (0.28) | | 30.90 | | 30.62 | | (0.22) | | — | | — |
| 2020 | | 47.04 | | (0.02) | | (1.79) | | (1.81) | | (0.04) | | — | | — |
| KraneShares Bosera MSCI China A 50 Connect Index ETF | | | |
| 2024*** | | 21.45 | | 0.50 | | 4.48 | | 4.98 | | — | | — | | — |
| 2024 | | 26.09 | | 0.51 | | (4.67) | | (4.16) | | (0.48) | | — | | — |
| 2023 | | 37.05 | | 0.57 | | (5.28) | | (4.71) | | (0.54) | | (5.71) | | — |
| 2022 | | 43.97 | | 0.43 | | (3.41) | | (2.98) | | (0.49) | | (3.45) | | — |
| 2021 | | 29.51 | | 0.30 | | 14.46 | | 14.76 | | (0.30) | | — | | — |
| 2020 | | 31.88 | | 0.47 | | (2.34) | | (1.87) | | (0.50) | | — | | — |
| KraneShares MSCI All China Index ETF | | | | | | |
| 2024*** | | 18.05 | | 0.47 | | 4.51 | | 4.98 | | — | | — | | — |
| 2024 | | 21.99 | | 0.45 | | (3.78) | | (3.33) | | (0.61) | | — | | — |
| 2023 | | 24.89 | | 0.50 | | (2.15) | | (1.65) | | (0.77) | | (0.48) | | — |
| 2022 | | 34.46 | | 0.47 | | (8.71) | | (8.24) | | (0.40) | | (0.93) | | — |
| 2021 | | 23.53 | | 0.22 | | 11.06 | | 11.28 | | (0.35) | | — | | — |
| 2020 | | 25.48 | | 0.36 | | (1.93) | | (1.57) | | (0.38) | | — | | — |
| KraneShares MSCI One Belt One Road Index ETF | | | | | | |
| 2024*** | | 20.94 | | 0.51 | | 2.21 | | 2.72 | | — | | — | | — |
| 2024 | | 22.43 | | 0.59 | | (1.39) | | (0.80) | | (0.69) | | — | | — |
| 2023 | | 27.63 | | 0.73 | | (4.85) | | (4.12) | | (1.08) | | — | | — |
| 2022 | | 28.85 | | 0.95 | | (1.18) | | (0.23) | | (0.99) | | — | | — |
| 2021 | | 17.76 | | 0.48 | | 11.16 | | 11.64 | | (0.55) | | — | | — |
| 2020 | | 23.69 | | 0.70 | | (5.58) | | (4.88) | | (1.05) | | — | | — |
| KraneShares Emerging Markets Consumer Technology Index ETF | | | | | | | |
| 2024*** | | 14.86 | | 0.04 | | 4.41 | | 4.45 | | — | | — | | — |
| 2024 | | 15.28 | | 0.03 | | (0.41) | | (0.38) | | (0.04) | | — | | — |
| 2023 | | 18.04 | | 0.10 | | (2.86) | | (2.76) | | — | | — | | — |
| 2022 | | 32.06 | | (0.05) | | (13.90) | | (13.95) | | (0.01) | | (0.06) | | — |
| 2021 | | 19.55 | | 0.11 | | 13.14 | | 13.25 | | (0.74) | | — | | — |
| 2020 | | 22.94 | | 0.10 | | (3.07) | | (2.97) | | (0.42) | | — | | — |
| * | Per share data calculated using average shares method. |
| ** | Total return is based on the change in net asset value of a share during the year or period and assumes reinvestment of dividends and distributions at net asset value. Total return is for the period indicated and periods of less than one year have not been annualized. The return shown does not reflect the deduction of taxes that a shareholder would pay on Fund distributions or the redemption of Fund shares. Excludes effects of standard creation and redemption transaction fees associated with creation units. |
| *** | For the six-month period ended September 30, 2024. |
| † | Annualized. |
| †† | Portfolio turnover rate is for the period indicated and periods of less than one year have not been annualized. Excludes effect of in-kind transfers. |
| ~ | During the periods, certain fees were waived. (See Note 4 in the Notes to Financial Statements). |
The accompanying notes are an integral part of the financial statements.
Total from
Distributions
($) | | Net Asset Value,
End of Period
($) | | Total Return
(%)** | | Net Assets,
End of Period
($)(000) | | Ratio of
Expenses to
Average
Net Assets
(%)~ | | Ratio of Expenses
to Average Net
Assets (Excluding
Waivers, as
applicable)
(%)~ | | Ratio of Net
Investment
Income (Loss)
to Average Net
Assets
(%) | | Portfolio
Turnover
(%) |
| | | | | | | | | | | | | | | | |
| — | | 35.02 | | 33.31 | | 7,208,816 | | 0.70†(1) | | 0.70† | | 1.92† | | 25 | †† |
| (0.46) | | 26.27 | | (14.48) | | 5,430,986 | | 0.70(1) | | 0.70 | | 0.24 | | 32 | |
| — | | 31.25 | | 5.86 | | 6,111,669 | | 0.69(1) | | 0.69 | | 0.61 | | 60 | |
| (2.58) | | 29.52 | | (57.99) | | 6,239,534 | | 0.69(1) | | 0.69 | | (0.12) | | 60 | |
| (0.22) | | 75.59 | | 67.77 | | 3,662,260 | | 0.70(1) | | 0.70 | | (0.39) | | 89 | |
| (0.04) | | 45.19 | | (3.85) | | 2,313,638 | | 0.73(1) | | 0.73 | | (0.05) | | 33 | |
| | | | | | | | | | | | | | | | |
| — | | 26.43 | | 23.22 | | 186,361 | | 0.56† | | 0.79† | | 4.51† | | 19 | †† |
| (0.48) | | 21.45 | | (15.78) | | 190,866 | | 0.56 | | 0.79 | | 2.23 | | 38 | |
| (6.25) | | 26.09 | | (12.63) | | 470,873 | | 0.55 | | 0.78 | | 1.83 | | 68 | |
| (3.94) | | 37.05 | | (7.96) | | 559,393 | | 0.59 | | 0.79 | | 0.97 | | 89 | |
| (0.30) | | 43.97 | | 50.00 | | 802,364 | | 0.59 | | 0.79 | | 0.74 | | 35 | |
| (0.50) | | 29.51 | | (5.98) | | 507,508 | | 0.59 | | 0.80 | | 1.52 | | 91 | |
| | | | | | | | | | | | | | | | |
| — | | 23.03 | | 27.59 | | 8,062 | | 0.49† | | 0.69† | | 4.96† | | 1 | †† |
| (0.61) | | 18.05 | | (15.09) | | 6,318 | | 0.49 | | 0.69 | | 2.33 | | 4 | |
| (1.25) | | 21.99 | | (6.44) | | 8,795 | | 0.49 | | 0.69 | | 2.19 | | 55 | |
| (1.33) | | 24.89 | | (24.35) | | 16,181 | | 0.48 | | 0.68 | | 1.49 | | 18 | |
| (0.35) | | 34.46 | | 47.97 | | 22,402 | | 0.49 | | 0.69 | | 0.67 | | 45 | |
| (0.38) | | 23.53 | | (6.30) | | 7,059 | | 0.49 | | 0.69 | | 1.47 | | 7 | |
| | | | | | | | | | | | | | | | |
| — | | 23.66 | | 12.99 | | 3,548 | | 0.79† | | 0.79† | | 4.69† | | 12 | †† |
| (0.69) | | 20.94 | | (3.41) | | 4,188 | | 0.79 | | 0.79 | | 2.77 | | 27 | |
| (1.08) | | 22.43 | | (14.98) | | 4,485 | | 0.79 | | 0.79 | | 2.96 | | 34 | |
| (0.99) | | 27.63 | | (1.11) | | 8,290 | | 0.78 | | 0.78 | | 3.12 | | 36 | |
| (0.55) | | 28.85 | | 65.82 | | 10,099 | | 0.79 | | 0.79 | | 2.07 | | 39 | |
| (1.05) | | 17.76 | | (21.78) | | 7,105 | | 0.80 | | 0.80 | | 3.03 | | 30 | |
| | | | | | | | | | | | | | | | |
| — | | 19.31 | | 29.95 | | 17,376 | | 0.60†(2) | | 0.79† | | 0.56† | | 22 | †† |
| (0.04) | | 14.86 | | (2.47) | | 18,577 | | 0.60(2) | | 0.80 | | 0.21 | | 135 | |
| — | | 15.28 | | (15.30) | | 30,562 | | 0.60(2) | | 0.80 | | 0.66 | | 87 | |
| (0.07) | | 18.04 | | (43.57) | | 55,935 | | 0.59 | | 0.79 | | (0.17) | | 97 | |
| (0.74) | | 32.06 | | 67.85 | | 110,604 | | 0.59 | | 0.79 | | 0.36 | | 112 | |
| (0.42) | | 19.55 | | (13.29) | | 22,485 | | 0.81 | | 0.81 | | 0.46 | | 56 | |
| (1) | The expense ratios include $379,234, $600,758, $301,354, $337,352, $376,498, and $579,613, respectively, in security lending fees paid to the Adviser. Had these fees been excluded, the expense ratios would have been 0.69%, 0.70%, 0.69%, 0.68%, 0.69%, and 0.69%, respectively. |
| (2) | The expense ratios include $3,348, $927 and $6,087, respectively, in security lending fees paid to the Adviser. Had these fees been excluded, the expense ratios would have been 0.60%, 0.59%, and 0.58%, respectively. |
Amounts designated as “—” are $0 or have been rounded to $0.
The accompanying notes are an integral part of the financial statements.
Financial Highlights (continued)
Selected Per Share Data & Ratios
For the Periods Ended September 30, 2024 (Unaudited)
For the Years Ended March 31
For a Share Outstanding Throughout Each Period
| | | Net Asset Value,
Beginning of Period
($) | | Net Investment
Income (Loss)
($)* | | Net Realized
and Unrealized
Gain (Loss)
on Investments
($) | | Total from
Operations
($) | | Distribution from
Net Investment
Income
($) | | Distribution from
Capital Gains
($) | | Return of
Capital
($) |
| KraneShares MSCI China Clean Technology Index ETF | | | | | | | | |
| 2024*** | | 20.34 | | 0.34 | | 4.32 | | 4.66 | | — | | — | | — |
| 2024 | | 28.54 | | 0.18 | | (8.21) | | (8.03) | | (0.17) | | — | | — |
| 2023 | | 36.71 | | 0.12 | | (7.75) | | (7.63) | | (0.10) | | (0.44) | | — |
| 2022 | | 40.34 | | 0.21 | | (3.65) | | (3.44) | | (0.19) | | — | | — |
| 2021 | | 16.60 | | (0.28) | | 24.02 | | 23.74 | | —# | | — | | — |
| 2020 | | 20.28 | | 0.70 | | (3.29) | | (2.59) | | (1.09) | | — | | — |
| KraneShares Electric Vehicles and Future Mobility Index ETF | | | | | | | | |
| 2024*** | | 22.47 | | 0.17 | | 0.77 | | 0.94 | | — | | — | | — |
| 2024 | | 30.60 | | 0.21 | | (8.11) | | (7.90) | | (0.23) | | — | | — |
| 2023 | | 39.57 | | 0.33 | | (8.98) | | (8.65) | | (0.32) | | — | | — |
| 2022 | | 42.25 | | 0.08 | | 0.39(2) | | 0.47 | | (0.52) | | (2.63) | | — |
| 2021 | | 19.02 | | 0.08 | | 23.21 | | 23.29 | | (0.06) | | — | | — |
| 2020 | | 20.64 | | 0.33 | | (1.51) | | (1.18) | | (0.44) | | — | | — |
| KraneShares MSCI All China Health Care Index ETF | | | | | | | | |
| 2024*** | | 14.63 | | 0.17 | | 2.16 | | 2.33 | | — | | — | | — |
| 2024 | | 20.77 | | 0.13 | | (6.16) | | (6.03) | | (0.11) | | — | | — |
| 2023 | | 23.79 | | 0.07 | | (3.08) | | (3.01) | | (0.01) | | — | | — |
| 2022 | | 38.30 | | (0.02) | | (10.44) | | (10.46) | | — | | (4.05) | | — |
| 2021 | | 23.78 | | (0.09) | | 14.61 | | 14.52 | | —# | | — | | — |
| 2020 | | 22.29 | | 0.07 | | 1.48 | | 1.55 | | (0.06) | | — | | — |
| KraneShares Asia Pacific High Income USD Bond ETF | | | | | | | | |
| 2024*** | | 24.64 | | 1.22 | | 0.36 | | 1.58 | | (1.17) | | — | | — |
| 2024 | | 26.73 | | 2.99 | | (1.39) | | 1.60 | | (3.69) | | — | | — |
| 2023 | | 29.48 | | 2.23 | | (2.44) | | (0.21) | | (2.54) | | — | | — |
| 2022 | | 39.14 | | 1.78 | | (9.26) | | (7.48) | | (1.88) | | — | | (0.30) |
| 2021 | | 37.32 | | 2.10 | | 2.44 | | 4.54 | | (2.58) | | (0.14) | | — |
| 2020 | | 40.73 | | 2.08 | | (3.49) | | (1.41) | | (1.81) | | (0.19) | | — |
| KraneShares MSCI Emerging Markets ex China Index ETF | | | | | | | | |
| 2024*** | | 29.17 | | 0.46 | | 1.92 | | 2.38 | | — | | — | | — |
| 2024 | | 25.09 | | 0.79 | | 3.86 | | 4.65 | | (0.57) | | — | | — |
| 2023 | | 29.73 | | 0.91 | | (4.56) | | (3.65) | | (0.99) | | — | | — |
| 2022 | | 30.99 | | 0.79 | | (0.56) | | 0.23 | | (0.73) | | (0.76) | | — |
| 2021 | | 18.41 | | 0.55 | | 12.53 | | 13.08 | | (0.50) | | — | | — |
| 2020(4) | | 25.00 | | 0.60 | | (6.45) | | (5.85) | | (0.74) | | — | | — |
| * | Per share data calculated using average shares method. |
| ** | Total return is based on the change in net asset value of a share during the year or period and assumes reinvestment of dividends and distributions at net asset value. Total return is for the period indicated and periods of less than one year have not been annualized. The return shown does not reflect the deduction of taxes that a shareholder would pay on Fund distributions or the redemption of Fund shares. Excludes effects of standard creation and redemption transaction fees associated with creation units. |
| *** | For the six-month period ended September 30, 2024. |
| † | Annualized. |
| †† | Portfolio turnover rate is for the period indicated and periods of less than one year have not been annualized. Excludes effect of in-kind transfers. |
| # | Amount represents less than $0.005 per share. |
The accompanying notes are an integral part of the financial statements.
Total from
Distributions
($) | | Net Asset Value,
End of Period
($) | | Total Return
(%)** | | Net Assets,
End of Period
($)(000) | | Ratio of
Expenses to
Average
Net Assets
(%)~ | | Ratio of Expenses
to Average Net
Assets (Excluding
Waivers, as
applicable)
(%)~ | | Ratio of Net
Investment
Income (Loss)
to Average Net
Assets
(%) | | Portfolio
Turnover
(%) |
| | | | | | | | | | |
| — | | 25.00 | | 22.91 | | 59,990 | | 0.79† | | 0.79† | | 3.37† | | 20 | †† |
| (0.17) | | 20.34 | | (28.17) | | 56,952 | | 0.79 | | 0.79 | | 0.72 | | 65 | |
| (0.54) | | 28.54 | | (20.71) | | 95,611 | | 0.79 | | 0.79 | | 0.38 | | 49 | |
| (0.19) | | 36.71 | | (8.61) | | 146,859 | | 0.78 | | 0.78 | | 0.48 | | 62 | |
| — | | 40.34 | | 143.03 | | 141,173 | | 0.78 | | 0.78 | | (0.65) | | 164 | |
| (1.09) | | 16.60 | | (13.17) | | 1,661 | | 0.79 | | 0.79 | | 3.81 | | 53 | |
| | | | | | | | | | |
| — | | 23.41 | | 4.18 | | 87,796 | | 0.73†(1) | | 0.73† | | 1.63† | | 18 | †† |
| (0.23) | | 22.47 | | (25.91) | | 105,618 | | 0.72(1) | | 0.72 | | 0.78 | | 42 | |
| (0.32) | | 30.60 | | (21.78) | | 185,106 | | 0.72(1) | | 0.72 | | 0.99 | | 69 | |
| (3.15) | | 39.57 | | 0.04 | | 296,761 | | 0.70 | | 0.70 | | 0.17 | | 114 | |
| (0.06) | | 42.25 | | 122.46 | | 198,570 | | 0.70 | | 0.70 | | 0.21 | | 81 | |
| (0.44) | | 19.02 | | (6.15) | | 17,116 | | 0.72 | | 0.72 | | 1.57 | | 53 | |
| | | | | | | | | | |
| — | | 16.96 | | 15.93 | | 47,495 | | 0.65† | | 0.79† | | 2.36† | | 11 | †† |
| (0.11) | | 14.63 | | (29.10) | | 46,804 | | 0.65(3) | | 0.79 | | 0.74 | | 17 | |
| (0.01) | | 20.77 | | (12.65) | | 94,492 | | 0.65(3) | | 0.79 | | 0.35 | | 32 | |
| (4.05) | | 23.79 | | (28.88) | | 136,811 | | 0.65 | | 0.79 | | (0.04) | | 44 | |
| — | | 38.30 | | 61.06 | | 214,464 | | 0.65 | | 0.79 | | (0.25) | | 45 | |
| (0.06) | | 23.78 | | 6.95 | | 32,110 | | 0.69 | | 0.79 | | 0.32 | | 101 | |
| | | | | | | | | | |
| (1.17) | | 25.05 | | 6.56 | | 18,790 | | 0.69† | | 0.69† | | 9.80† | | 74 | †† |
| (3.69) | | 24.64 | | 6.81 | | 14,784 | | 0.69 | | 0.69 | | 11.77 | | 121 | |
| (2.54) | | 26.73 | | (0.44) | | 20,045 | | 0.69 | | 0.69 | | 8.19 | | 119 | |
| (2.18) | | 29.48 | | (19.73) | | 26,535 | | 0.68 | | 0.68 | | 5.33 | | 150 | |
| (2.72) | | 39.14 | | 12.32 | | 9,786 | | 0.69 | | 0.69 | | 5.32 | | 53 | |
| (2.00) | | 37.32 | | (3.72) | | 11,197 | | 0.70 | | 0.70 | | 5.12 | | 70 | |
| | | | | | | | | | |
| — | | 31.55 | | 8.16 | | 78,873 | | 0.24† | | 0.59† | | 3.09† | | 2 | †† |
| (0.57) | | 29.17 | | 18.67 | | 78,752 | | 0.24 | | 0.59 | | 2.95 | | 6 | |
| (0.99) | | 25.09 | | (12.12) | | 30,112 | | 0.24 | | 0.59 | | 3.55 | | 50 | |
| (1.49) | | 29.73 | | 0.57 | | 32,699 | | 0.23 | | 0.58 | | 2.52 | | 23 | |
| (0.50) | | 30.99 | | 71.19 | | 30,991 | | 0.30 | | 0.58 | | 1.90 | | 19 | |
| (0.74) | | 18.41 | | (24.31) | | 1,841 | | 0.50† | | 0.60† | | 2.54† | | 5 | †† |
| ~ | During the periods, certain fees were waived. (See Note 4 in the Notes to Financial Statements). |
| (1) | The expense ratio includes $15,721, $42,152 and $67,245, respectively, in security lending fees paid to the Adviser. Had these fees been excluded, the expense ratios would have been 0.69%, 0.68% and 0.69%, respectively. |
| (2) | Realized and unrealized gains and losses per share are balancing amounts necessary to reconcile the change in net asset value per share for the period, and may not reconcile with the aggregate gains and losses in the Statement of Operations due to share transactions for the period. |
| (3) | The expense ratio includes $541 and $1,908, respectively in security lending fees paid to the Adviser. Had these fees been excluded, the expense ratios would have been 0.65% and 0.64%, respectively. |
| (4) | The Fund’s inception date was on April 11, 2019. |
Amounts designated as “—” are $0 or have been rounded to $0.
The accompanying notes are an integral part of the financial statements.
Financial Highlights/Consolidated Financial Highlights (continued)
Selected Per Share Data & Ratios
For the Periods Ended September 30, 2024 (Unaudited)
For the Years/Periods Ended March 31
For a Share Outstanding Throughout Each Period
| | | Net Asset Value,
Beginning of Period
($) | | Net Investment
Income (Loss)
($)* | | Net Realized
and Unrealized
Gain (Loss)
on Investments
($) | | Total from
Operations
($) | | Distribution from
Net Investment
Income
($) | | Distribution from
Capital Gains
($) | | Return of
Capital
($) |
| KraneShares Value Line® Dynamic Dividend Equity Index ETF | | | | | | | | |
| 2024*** | | 24.13 | | 0.29 | | 2.38 | | 2.67 | | (0.26) | | — | | — |
| 2024 | | 22.27 | | 0.60 | | 2.11 | | 2.71 | | (0.63) | | (0.22) | | — |
| 2023 | | 23.53 | | 0.56 | | (0.59) | | (0.03) | | (0.55) | | (0.68) | | — |
| 2022 | | 23.01 | | 0.48 | | 2.45 | | 2.93 | | (0.58) | | (1.83) | | — |
| 2021(1) | | 20.00 | | 0.20 | | 2.88 | | 3.08 | | (0.07) | | — | | — |
| KraneShares Mount Lucas Managed Futures Index Strategy ETF | | | | | | | | |
| 2024*** | | 29.90 | | 0.62 | | (1.34) | | (0.72) | | — | | — | | — |
| 2024 | | 29.60 | | 1.26 | | (0.96) | | 0.30 | | — | | — | | — |
| 2023 | | 31.51 | | 0.54 | | 1.59 | | 2.13 | | (1.56) | | (2.48) | | — |
| 2022 | | 27.55 | | (0.18) | | 5.98 | | 5.80 | | (1.77) | | (0.07) | | — |
| 2021(2) | | 25.00 | | (0.06) | | 2.61 | | 2.55 | | — | | — | | — |
| KraneShares SSE STAR Market 50 Index ETF | | | | | | | | |
| 2024*** | | 10.90 | | 0.02 | | 1.76 | | 1.78 | | — | | — | | — |
| 2024 | | 16.89 | | (0.01) | | (5.98) | | (5.99) | | — | | — | | — |
| 2023 | | 18.76 | | (0.07) | | (1.80) | | (1.87) | | — | | — | | — |
| 2022 | | 21.06 | | (0.14) | | (2.16) | | (2.30) | | — | | — | | — |
| 2021(3) | | 25.00 | | (0.03) | | (3.91) | | (3.94) | | — | | — | | — |
| KraneShares Hang Seng TECH Index ETF | | | | | | | | |
| 2024*** | | 10.78 | | 0.06 | | 4.02 | | 4.08 | | — | | — | | — |
| 2024 | | 13.30 | | — | | (2.43) | | (2.43) | | (0.09) | | — | | — |
| 2023 | | 13.93 | | 0.05 | | (0.66) | | (0.61) | | (0.02) | | — | | — |
| 2022(4) | | 25.00 | | 0.01 | | (11.08) | | (11.07) | | — | | — | | — |
| KraneShares Dynamic Emerging Markets Strategy ETF | | | | | | | | |
| 2024*** | | 24.86 | | (0.01) | | 4.19 | | 4.18 | | — | | — | | — |
| 2024(5) | | 25.00 | | 0.66 | | (0.10) | | 0.56 | | (0.70) | | — | | — |
| * | Per share data calculated using average shares method. |
| ** | Total return is based on the change in net asset value of a share during the year or period and assumes reinvestment of dividends and distributions at net asset value. Total return is for the period indicated and periods of less than one year have not been annualized. The return shown does not reflect the deduction of taxes that a shareholder would pay on Fund distributions or the redemption of Fund shares. Excludes effects of standard creation and redemption transaction fees associated with creation units. |
| *** | For the six-month period ended September 30, 2024. |
| † | Annualized. |
| †† | Portfolio turnover rate is for the period indicated and periods of less than one year have not been annualized. Excludes effect of in-kind transfers. |
| (1) | The Fund’s inception date was on November 23, 2020. |
| (2) | The Fund’s inception date was on December 1, 2020. |
| (3) | The Fund’s inception date was on January 26, 2021. |
| (4) | The Fund’s inception date was on June 8, 2021. |
| (5) | The Fund’s inception date was on August 24, 2023. |
Amounts designated as “—” are $0 or have been rounded to $0.
The accompanying notes are an integral part of the financial statements.
Total from
Distributions
($) | | Net Asset Value,
End of Period
($) | | Total Return
(%)** | | Net Assets,
End of Period
($)(000) | | Ratio of
Expenses to
Average
Net Assets
(%) | | Ratio of Expenses
to Average Net
Assets (Excluding
Waivers, as
applicable)
(%) | | Ratio of Net
Investment
Income (Loss)
to Average Net
Assets
(%) | | Portfolio
Turnover
(%) |
| | | | | | | | | | |
| (0.26) | | 26.54 | | 11.10 | | 33,172 | | 0.56† | | 0.56† | | 2.33† | | 44 | †† |
| (0.85) | | 24.13 | | 12.45 | | 31,375 | | 0.56 | | 0.56 | | 2.69 | | 200 | |
| (1.23) | | 22.27 | | 0.19 | | 31,174 | | 0.56 | | 0.56 | | 2.53 | | 155 | |
| (2.41) | | 23.53 | | 12.62 | | 30,583 | | 0.55 | | 0.55 | | 1.99 | | 164 | |
| (0.07) | | 23.01 | | 15.46 | | 25,315 | | 0.55† | | 0.55† | | 2.68† | | 55 | †† |
| | | | | | | | | | |
| — | | 29.18 | | (2.41) | | 372,046 | | 0.90† | | 0.90† | | 4.21† | | — | †† |
| — | | 29.90 | | 1.01 | | 264,626 | | 0.90 | | 0.90 | | 4.14 | | — | |
| (4.04) | | 29.60 | | 6.21 | | 278,274 | | 0.90 | | 0.90 | | 1.61 | | 251 | |
| (1.84) | | 31.51 | | 22.21 | | 45,697 | | 0.89 | | 0.89 | | (0.63) | | 15 | |
| — | | 27.55 | | 10.20 | | 28,923 | | 0.89† | | 0.89† | | (0.63)† | | — | †† |
| | | | | | | | | | |
| — | | 12.68 | | 16.33 | | 26,619 | | 0.89† | | 0.89† | | 0.40† | | 12 | †† |
| — | | 10.90 | | (35.46) | | 24,534 | | 0.89 | | 0.89 | | (0.04) | | 32 | |
| — | | 16.89 | | (9.97) | | 48,130 | | 0.89 | | 0.89 | | (0.44) | | 43 | |
| — | | 18.76 | | (10.92) | | 65,674 | | 0.88 | | 0.88 | | (0.57) | | 78 | |
| — | | 21.06 | | (15.76) | | 93,722 | | 0.88† | | 0.88† | | (0.88)† | | 12 | †† |
| | | | | | | | | | |
| — | | 14.86 | | 37.85 | | 12,627 | | 0.69† | | 0.69† | | 1.08† | | 30 | †† |
| (0.09) | | 10.78 | | (18.29) | | 5,391 | | 0.69 | | 0.69 | | 0.02 | | 55 | |
| (0.02) | | 13.30 | | (4.37) | | 7,315 | | 0.69 | | 0.69 | | 0.42 | | 126 | |
| — | | 13.93 | | (44.28) | | 5,570 | | 0.68† | | 0.68† | | 0.09† | | 60 | †† |
| | | | | | | | | | |
| — | | 29.04 | | 16.81 | | 5,082 | | 0.11† | | 0.11† | | (0.07)† | | 1 | †† |
| (0.70) | | 24.86 | | 2.31 | | 3,729 | | 0.11† | | 0.11† | | 4.48† | | 11 | †† |
The accompanying notes are an integral part of the financial statements.
Financial Highlights (concluded)
Selected Per Share Data & Ratios
For the Periods Ended September 30, 2024 (Unaudited)
For the Years/Periods Ended March 31
For a Share Outstanding Throughout Each Period
| | | Net Asset Value,
Beginning of
Period
($) | | Net Investment
Income (Loss)
($)* | | Net Realized and
Unrealized
Gain (Loss)
on Investments
($) | | Total from
Operations
($) | | Distribution from
Net Investment
Income
($) | | Return of
Capital
($) |
| KraneShares Global Luxury Index ETF | | | | | | |
| 2024*** | | 26.73 | | 0.21 | | (1.62) | | (1.41) | | — | | — |
| 2024(1) | | 25.00 | | 0.07 | | 1.70 | | 1.77 | | (0.04) | | — |
| KraneShares Artificial Intelligence and Technology ETF | | | | | | |
| 2024***(2) | | 25.00 | | (0.03) | | 0.44 | | 0.41 | | — | | — |
| KraneShares Sustainable Ultra Short Duration Index ETF | | | | | | |
| 2024***(3) | | 25.00 | | 0.24 | | 0.04 | | 0.28 | | (0.18) | | — |
| KraneShares China Alpha Index ETF | | | | | | |
| 2024***(4) | | 25.00 | | — | | 4.39 | | 4.39 | | — | | — |
| * | Per share data calculated using average shares method. |
| ** | Total return is based on the change in net asset value of a share during the year or period and assumes reinvestment of dividends and distributions at net asset value. Total return is for the period indicated and periods of less than one year have not been annualized. The return shown does not reflect the deduction of taxes that a shareholder would pay on Fund distributions or the redemption of Fund shares. Excludes effects of standard creation and redemption transaction fees associated with creation units. |
| *** | For the six-month period ended September 30, 2024. |
| † | Annualized. |
| †† | Portfolio turnover rate is for the period indicated and periods of less than one year have not been annualized. Excludes effect of in-kind transfers. |
| ~ | During the periods, certain fees were waived. (See Note 3 in the Notes to Financial Statements). |
| (1) | The Fund’s inception date was on September 6, 2023. |
| (2) | The Fund’s inception date was on July 17, 2024. |
| (3) | The Fund’s inception date was on July 25, 2024. |
| (4) | The Fund’s inception date was on August 27, 2024. |
Amounts designated as “—” are $0 or have been rounded to $0.
The accompanying notes are an integral part of the financial statements.
Total from
Distributions
($) | | Net Asset Value,
End of Period
($) | | Total Return
(%)** | | Net Assets,
End of Period
($)(000) | | Ratio of
Expenses to
Average
Net Assets
(%)~ | | Ratio of Expenses
to Average Net
Assets (Excluding
Waivers, as
applicable)
(%)~ | | Ratio of Net
Investment
Income (Loss)
to Average Net
Assets
(%) | | Portfolio
Turnover
(%) |
| | | | | | | | | | | | | | | | |
| — | | 25.32 | | (5.27) | | 2,532 | | 0.69† | | 0.69† | | 1.73† | | 30 | †† |
| (0.04) | | 26.73 | | 7.08 | | 2,673 | | 0.69† | | 0.69† | | 0.53† | | 14 | †† |
| | | | | | | | | | | | | | | | |
| — | | 25.41 | | 1.64 | | 5,082 | | 0.99† | | 0.99† | | (0.58)† | | 8 | †† |
| | | | | | | | | | | | | | | | |
| (0.18) | | 25.10 | | 1.12 | | 299,966 | | 0.20† | | 0.30† | | 5.16† | | — | †† |
| | | | | | | | | | | | | | | | |
| — | | 29.39 | | 17.56 | | 8,816 | | 0.78† | | 0.78† | | (0.03)† | | 119 | †† |
The accompanying notes are an integral part of the financial statements.
Notes to Financial Statements/Notes to Consolidated Financial Statements (Unaudited)
1. ORGANIZATION
KraneShares Trust (the “Trust”) is a Delaware Statutory Trust formed on February 3, 2012. The Trust is registered under the Investment Company Act of 1940, as amended (the “Investment Company Act”), as an open-end management investment company. As of September 30, 2024, the Trust had twenty-nine operational series. The financial statements herein and the related notes pertain to the following 19 series: KraneShares CSI China Internet ETF, KraneShares Bosera MSCI China A 50 Connect Index ETF, KraneShares MSCI All China Index ETF, KraneShares MSCI One Belt One Road Index ETF, KraneShares Emerging Markets Consumer Technology Index ETF, KraneShares MSCI China Clean Technology Index ETF, KraneShares Electric Vehicles and Future Mobility Index ETF, KraneShares MSCI All China Health Care Index ETF, KraneShares Asia Pacific High Income USD Bond ETF (formerly, KraneShares Asia Pacific High Income Bond ETF), KraneShares MSCI Emerging Markets ex China Index ETF, KraneShares Value Line® Dynamic Dividend Equity Index ETF, KraneShares Mount Lucas Managed Futures Index Strategy ETF (formerly, KFA Mount Lucas Managed Futures Index Strategy ETF), KraneShares SSE STAR Market 50 Index ETF, KraneShares Hang Seng TECH Index ETF, KraneShares Dynamic Emerging Markets Strategy ETF, KraneShares Global Luxury Index ETF, KraneShares Artificial Intelligence and Technology ETF, KraneShares Sustainable Ultra Short Duration Index ETF and KraneShares China Alpha Index ETF (each, a “Fund” and collectively, the “Funds”). KraneShares Bosera MSCI China A 50 Connect Index ETF, KraneShares MSCI All China Index ETF, KraneShares MSCI Emerging Markets ex China Index ETF, KraneShares Emerging Markets Consumer Technology Index ETF, KraneShares MSCI One Belt One Road Index ETF and KraneShares Electric Vehicles and Future Mobility Index ETF are diversified Funds. All other Funds are non-diversified Funds, as defined under Section 5(b)(1) of the Investment Company Act. Krane Funds Advisors, LLC (“Krane” or the “Adviser”), a Delaware limited liability company, serves as the investment adviser for the Funds and is subject to the supervision of the Board of Trustees (the “Board”). The Adviser is responsible for managing the investment activities of the Funds, the Funds’ business affairs and other administrative matters. The Adviser may use sub-advisers (each, a “Sub-Adviser” or collectively, the “Sub-Advisers”) to perform the day-to-day management of the Funds.
China International Capital Corporation (USA) Holdings Inc., a wholly-owned, indirect subsidiary of China International Capital Corporation Limited owns a majority stake in Krane. As of September 30, 2024, Central Huijin Investment Limited, a mainland Chinese-domiciled entity, and HKSCC Nominees Limited, held approximately 40.1% and 39.4%, respectively, of the shares of China International Capital Corporation Limited. Central Huijin Investment Limited is a wholly-owned subsidiary of China Investment Corporation, which is a mainland Chinese sovereign wealth fund. KFA One Holdings, LLC, located at 280 Park Avenue 32nd Floor, New York, New York, 10017, holds the remaining equity interests in Krane and Jonathan Krane, through his equity interests in KFA One Holdings, LLC, beneficially owns more than 10% of the equity interests in Krane.
The KFA MLM Index Subsidiary, Ltd. is a wholly-owned subsidiary of the KraneShares Mount Lucas Managed Futures Index Strategy ETF (the “Subsidiary”). The Subsidiary is organized under the laws of the Cayman Islands as an exempt limited company. Information regarding the KraneShares Mount Lucas Managed Futures Index Strategy ETF and its subsidiary has been consolidated in the Consolidated Schedule of Investments, Consolidated Statement of Assets and Liabilities, Consolidated Statement of Operations, Consolidated Statement of Changes in Net Assets and Consolidated Financial Highlights.
Notes to Financial Statements/Notes to Consolidated Financial Statements (Unaudited) (continued)
Shares of the Funds are listed and traded on the NYSE Arca, Inc. (the “Exchange” or the “NYSE”). Market prices for Fund shares (“Shares”) may be different from their net asset value (“NAV”). The Funds issue and redeem Shares on a continuous basis at NAV only in large blocks of Shares, typically 25,000, 50,000 or 100,000 Shares or multiples thereof, called “Creation Units”. This does not mean, however, that individual investors will be able to redeem and purchase Shares directly with the series of the Trust. Only Authorized Participants can redeem and purchase Creation Units of Shares directly. Each Fund will issue and redeem Shares for a basket of securities and/or a balancing cash amount. Individual shares trade in the secondary market at market prices that change throughout the day.
At September 30, 2024, all shares issued by the Funds were in Creation Unit aggregations to Authorized Participants through primary market transactions (e.g., transactions directly with the Funds). However, the individual shares that make up those Creation Units are traded on the Exchange (e.g., secondary market transactions). Some of those individual shares have been bought and sold by persons that are not Authorized Participants. Each Authorized Participant has entered into an agreement with the Funds’ Distributor.
The investment objective of each of the following Funds is to seek to provide a total return or investments results that (before fees and expenses) tracks the performance of its respective index listed below (each, an “Underlying Index”):
| Fund | | Index |
| KraneShares CSI China Internet ETF | | CSI Overseas China Internet Index |
| KraneShares Bosera MSCI China A 50 Connect Index ETF | | MSCI China A 50 Connect Index |
| KraneShares MSCI All China Index ETF | | MSCI China All Shares Index |
| KraneShares MSCI One Belt One Road Index ETF | | MSCI Global China Infrastructure Exposure Index |
| KraneShares Emerging Markets Consumer Technology Index ETF | | Solactive Emerging Markets Consumer Technology Index |
| KraneShares MSCI China Clean Technology Index ETF | | MSCI China IMI Environment 10/40 Index |
| KraneShares Electric Vehicles and Future Mobility Index ETF | | Bloomberg Electric Vehicles Index |
| KraneShares MSCI All China Health Care Index ETF | | MSCI China All Shares Health Care 10/40 Index |
| KraneShares MSCI Emerging Markets ex China Index ETF | | MSCI Emerging Markets ex China Index |
| KraneShares Value Line® Dynamic Dividend Equity Index ETF | | Value Line® Dynamic Dividend Equity Index |
| KraneShares Mount Lucas Managed Futures Index Strategy ETF | | KFA MLM Index |
| KraneShares SSE STAR Market 50 Index ETF | | SSE Science and Technology Innovation Board 50 Index |
| KraneShares Hang Seng TECH Index ETF | | Hang Seng TECH Index |
| KraneShares Global Luxury Index ETF | | Solactive Global Luxury Select Index |
| KraneShares Sustainable Ultra Short Duration Index ETF | | Solactive ISS Sustainable Select 0-1 Year USD Corporate IG Index |
| KraneShares China Alpha Index ETF | | Qi China Alpha Index |
Notes to Financial Statements/Notes to Consolidated Financial Statements (Unaudited) (continued)
KraneShares Artificial Intelligence and Technology ETF seeks growth of capital. With respect to its investments in instruments in the Solactive Etna Artificial General Intelligence Index (“Underlying Index”), KraneShares Artificial Intelligence and Technology ETF seeks to provide investment results that, before fees and expenses, track the performance of its Underlying Index. KraneShares Artificial Intelligence and Technology ETF also may invest in the securities of private companies with exposure to artificial intelligence businesses, which are not securities included in its Underlying Index.
KraneShares Asia Pacific High Income USD Bond ETF seeks to provide a total return that, before fees and expenses, exceeds that of the JP Morgan Asia Credit Index (JACI) Non-Investment Grade Corporate Index (the Benchmark Index) over a complete market cycle. KraneShares Asia Pacific High Income USD Bond ETF is actively managed and does not track an index.
Kraneshares Dynamic Emerging Markets Strategy ETF seeks growth of capital. The KraneShares Dynamic Emerging Markets Strategy ETF is actively managed and does not track an index.
2. SIGNIFICANT ACCOUNTING POLICIES
The following is a summary of the significant accounting policies followed by the Funds. The Funds are investment companies that apply the accounting and reporting guidance issued in Topic 946 by the U.S. Financial Accounting Standards Board (“FASB”).
USE OF ESTIMATES — The preparation of financial statements in conformity with U.S. generally accepted accounting principles (“U.S. GAAP”) requires management to make estimates and assumptions that affect the reported amounts of assets and liabilities and disclosure of contingent assets and liabilities at the date of the financial statements and the reported amounts of increases and decreases in net assets from operations during the reporting period. Actual results could differ from those estimates, and could have a material impact to the Funds.
SECURITY VALUATION — The NAV per share of each Fund is computed by dividing the value of the net assets of a Fund (i.e., the value of its total assets less total liabilities and withholdings) by the total number of shares of a Fund outstanding, rounded to the nearest cent. Expenses and fees, including without limitation, the management, administration and distribution fees, are accrued daily and taken into account for purposes of determining NAV. The NAV per share for each Fund normally is calculated by the Administrator (as defined below) and determined as of the regularly scheduled close of normal trading on each day that the NYSE is scheduled to be open for business (normally 4:00 p.m., Eastern Time). Any assets or liabilities denominated in currencies other than the U.S. dollar are converted into U.S. dollars at the current market rates on the date of valuation as quoted by one or more sources.
Securities listed on a securities exchange (i.e., exchange-traded equity securities), market or automated quotation system for which quotations are readily available (except for securities traded on NASDAQ), including securities traded over the counter, are valued by independent pricing agents at the last reported sale price on the primary exchange or market (foreign or domestic) on which they are traded (or at the time as of which the Fund’s NAV is calculated if a security’s exchange is normally open at that time). If there is no such reported sale, such securities are valued at the most recently reported bid price. For securities traded on NASDAQ, the NASDAQ Official Closing Price will be used. If a security price cannot be obtained from an independent, third-party pricing agent, the Fund seeks to obtain bid and ask prices from two broker-dealers who make a market in the portfolio instrument and determines the average of the two.
Notes to Financial Statements/Notes to Consolidated Financial Statements (Unaudited) (continued)
If available, debt securities are priced based upon valuations provided by independent, third-party pricing agents. Such values generally reflect the last reported sales price if the security is actively traded. The third-party pricing agents may also value debt securities at an evaluated bid price by employing methodologies that utilize actual market transactions, broker-supplied valuations, or other methodologies designed to identify the market value for such securities. Debt obligations with remaining maturities of sixty days or less may be valued at their amortized cost, which approximates market value.
The prices for foreign securities are reported in local currency and converted to U.S. dollars using currency exchange rates. The exchange rates used for valuation are captured as of the close of the London Stock Exchange each day normally at 4:00 p.m. Greenwich Mean Time.
The value of a swap contract is equal to the obligation (or rights) under the swap contract, which will generally be equal to the net amounts to be paid or received under the contract based upon the relative values of the positions held by each party to the contract as determined by the applicable independent, third party pricing agent.
Exchange-traded options, except as discussed below for FLEX options, are valued at the mean of their most recent bid and asked price, if available, and otherwise, long positions will be valued at the most-recent bid price, and short positions will be valued at the most-recent ask price. Over-the-counter (“OTC”) options are valued based upon prices determined by the applicable independent, third party pricing agent. FLEX (short for flexible) options are normally valued using a model-based price provided by a third-party pricing vendor. On days when a trade in a FLEX option occurs, the trade price will be used to value such FLEX options in lieu of the model price.
Futures are valued at the settlement price established by the board of trade on which they are traded. Foreign currency forward contracts are valued at the current day’s interpolated foreign exchange rate, as calculated using the current day’s spot rate and the 30-, 60-, 90- and 180-day forward rates provided by an independent pricing agent. As of and during the period ended September 30, 2024, the Funds did not hold swaps or foreign currency forward contracts.
On certain days, the settlement price for futures may not be available at the time the Fund calculates its NAV. On such days, the best available price (which is typically the last trade price) may be used to value futures.
Investments in open-end investment companies that do not trade on an exchange are valued at the end of day NAV per share. Investments in open-end investment companies that trade on an exchange are valued in the same manner as other exchange-traded equity securities (described above).
Securities issued by a wholly owned subsidiary of a Fund will be valued at the subsidiary’s net asset value, which will be determined using the same pricing policies and procedures applicable to the Fund.
Investments for which market prices are not “readily available,” or are not deemed to reflect current market values, or are debt securities where no evaluated price is available from third-party pricing agents pursuant to established methodologies, are fair valued in accordance with the Adviser’s valuation policies and procedures approved by the Board. Some of the more common reasons that may necessitate that a security be valued using “fair value” pricing may include, but are not limited to: the security’s trading has been halted or suspended; the security’s primary trading market is temporarily closed; or the security has not been traded for an extended period of time.
Notes to Financial Statements/Notes to Consolidated Financial Statements (Unaudited) (continued)
In addition, a Fund may fair value its securities if an event that may materially affect the value of a Fund’s securities that trade outside of the United States (a “Significant Event”) has occurred between the time of the security’s last close and the time that a Fund calculates its NAV. A Significant Event may relate to a single issuer or to an entire market sector, country or region. Events that may be Significant Events may include: government actions, natural disasters, armed conflict, acts of terrorism and significant market fluctuations. If Krane becomes aware of a Significant Event that has occurred with respect to a portfolio instrument or group of portfolio instruments after the closing of the exchange or market on which the portfolio instrument or portfolio instruments principally trade, but before the time at which a Fund calculates its NAV, it will notify the Administrator and may request that an ad hoc meeting of the Fair Value Pricing Committee be called.
With respect to trade-halted securities, the Adviser typically will fair value a trade-halted security by adjusting the security’s last market close price by the security’s sector performance, as measured by a predetermined index, unless Krane’s Fair Value Pricing Committee determines to make additional adjustments. Certain foreign securities exchanges have mechanisms in place that confine one day’s price movement in an individual security to a pre-determined price range based on that day’s opening price (“Collared Securities”). Fair value determinations for Collared Securities will generally be capped based on any applicable pre-determined “limit down” or “limit up” prices established by the relevant foreign securities exchange. As an example, China A-Shares can only be plus or minus ten percent in one day of trading in the relevant mainland China equity market. As a result, the fair value price determination on a given day will generally be capped plus or minus ten percent.
Fair value pricing involves subjective judgments and it is possible that a fair value determination for a security is materially different than the value that could actually be realized upon the sale of the security or that another fund that uses market quotations or its own fair value procedures to price the same securities. In addition, fair value pricing could result in a difference between the prices used to calculate a Fund’s NAV and the prices used by the Underlying Index. This may adversely affect a Fund’s ability to track its Underlying Index.
Trading in securities on many foreign exchanges is normally completed before the close of business on each Business Day (a “Business Day”, as used herein, is any day on which the Exchange is open for business). In addition, securities trading in a particular country or countries may not take place on each Business Day or may take place on days that are not Business Days. Changes in valuations on certain securities may occur at times or on days on which a Fund’s NAV is not calculated and on which Fund shares do not trade and sales and redemptions of shares do not occur. As a result, the value of a Fund’s portfolio securities and the net asset value of its shares may change on days when share purchases or sales cannot occur.
Fund shares are purchased or sold on a national securities exchange at market prices, which may be higher or lower than NAV. Transactions in Fund shares will be priced at NAV only if shares are purchased or redeemed directly from a Fund in Creation Units. No secondary sales will be made to brokers or dealers at concession by the Distributor or by a Fund. Purchases and sales of shares in the secondary market, which will not involve a Fund, will be subject to customary brokerage commissions and charges.
In accordance with the authoritative guidance on fair value measurements and disclosure under U.S. GAAP, the Funds disclose the fair value of their investments in a hierarchy that prioritizes the inputs to valuation techniques used to measure the fair value. The objective of a fair value measurement is to determine the price that would be received to sell an asset or paid to transfer
Notes to Financial Statements/Notes to Consolidated Financial Statements (Unaudited) (continued)
a liability in an orderly transaction between market participants at the measurement date (an exit price). Accordingly, the fair value hierarchy gives the highest priority to quoted prices (unadjusted) in active markets for identical assets or liabilities (Level 1) and the lowest priority to unobservable inputs (Level 3). The three levels of the fair value hierarchy are described below:
Level 1 — Unadjusted quoted prices in active markets for identical, unrestricted assets or liabilities that the Funds have the ability to access at the measurement date.
Level 2 — Other significant observable inputs (including quoted prices in non-active markets, quoted prices for similar investments, fair value of investments for which the Funds have the ability to fully redeem tranches at net asset value as of the measurement date or within the near term, and short-term investments valued at amortized cost).
Level 3 — Significant unobservable inputs (including the Funds’ own assumptions in determining the fair value of investments, broker quotes, fair value of investments for which the Funds do not have the ability to fully redeem tranches at net asset value as of the measurement date or within the near term).
Investments are classified within the level of the lowest significant input considered in determining fair value. Investments classified within Level 3 whose fair value measurement considers several inputs may include Level 1 or Level 2 inputs as components of the overall fair value measurement. For details of the investment classification, refer to each Fund’s Schedule of Investments.
FEDERAL INCOME TAXES — It is each Fund’s intention to qualify or continue to qualify as a regulated investment company for federal income tax purposes by complying with the appropriate provisions of Subchapter M of the Internal Revenue Code of 1986, as amended (the “Code”), and to distribute annually all or substantially all of its taxable income and gains to shareholders. Accordingly, no provisions for federal income taxes have been made in the financial statements.
The Funds evaluate tax positions taken or expected to be taken in the course of preparing the Funds’ tax returns to determine whether it is “more-likely-than-not” (i.e., greater than 50 percent) that each tax position will be sustained upon examination by a taxing authority based on the technical merits of the position. Tax positions not deemed to meet the more-likely-than-not threshold are recorded as a tax benefit or expense in the current year. The Funds did not record any tax provisions in the current period. However, management’s conclusions regarding tax positions may be subject to review and adjustment at a later date based on factors including, but not limited to, examination by tax authorities (i.e., the last three tax year ends, as applicable), on-going analysis of and changes to tax laws, regulations and interpretations thereof.
As of September 30, 2024, management of the Funds has reviewed all open tax years since inception and concluded that there is no tax liability resulting from unrecognized tax benefits relating to uncertain income tax positions taken or expected to be taken in future tax returns. The Funds are also not aware of any tax positions for which it is reasonably possible that the total amounts of unrecognized tax benefits will significantly change in the next 12 months.
SECURITY TRANSACTIONS AND INVESTMENT INCOME — Security transactions are accounted for on the trade date for financial reporting purposes. Costs used in determining realized gains and losses on the sale of investment securities are based on specific identification. Dividend income is recorded, net of any applicable withholding tax, on the ex-dividend date, or for certain foreign
Notes to Financial Statements/Notes to Consolidated Financial Statements (Unaudited) (continued)
securities, when the information becomes available to the Funds. Interest income is recognized on the accrual basis from the settlement date and includes the amortization of premiums and the accretion of discount calculated using the effective interest method.
Dividend income received from affiliated funds is recognized on the ex-dividend date and is recorded as income distributions in the Statement of Operations. Capital gain distributions received from affiliated funds are recognized on ex-dividend date and are recorded on the Statement of Operations as such. Costs used in determining realized gains and losses on the sales of affiliated funds are on the basis of specific identification. See details on the Statements of Operations.
FOREIGN CURRENCY — The books and records of the Funds are maintained in U.S. dollars. Investment securities and other assets and liabilities denominated in a foreign currency are translated into U.S. dollars on the date of valuation. Purchases and sales of investment securities, income and expenses are translated into U.S. dollars at the relevant rates of exchange prevailing on the respective dates of such transactions. The Funds do not isolate that portion of realized or unrealized gains and losses resulting from changes in the foreign exchange rate from fluctuations arising from changes in the market prices of the securities. The Funds report certain foreign-currency-related transactions as components of realized gains for financial reporting purposes, whereas such components are treated as ordinary income for Federal income tax purposes.
FUTURES — The KraneShares Mount Lucas Managed Futures Index Strategy ETF will utilize the Subsidiary for purposes of investing in commodities futures contracts that are the same as or similar to those included in the Index. Initial margin deposits of cash or securities are made upon entering into futures contracts. The contracts are marked-to-market daily and the resulting changes in value are accounted for as unrealized gains and losses. Variation margin payments are paid or received, depending upon whether unrealized gains or losses are incurred. When contracts are closed, the Fund records a realized gain or loss equal to the difference between the proceeds from (or cost of) the closing transaction and the amount invested in the contract. As of September 30, 2024, the KraneShares Mount Lucas Managed Futures Index Strategy ETF had open futures contracts. Refer to the Fund’s Consolidated Schedule of Investments for details regarding open futures contracts as of September 30, 2024.
For the period ended September 30, 2024, the average monthly notional amount of futures contracts for the KraneShares Mount Lucas Managed Futures Index Strategy ETF was as follows:
| KraneShares Mount Lucas Managed Futures Index Strategy ETF | | | | |
| Average Monthly Notional Value Long | | $ | 378,465,492 | |
| Average Monthly Notional Value Short | | $ | 411,081,362 | |
DIVIDENDS AND DISTRIBUTIONS TO SHAREHOLDERS — Each Fund, except for the KraneShares Asia Pacific High Income USD Bond ETF, the KraneShares Value Line® Dynamic Dividend Equity Index ETF, KraneShares Mount Lucas Managed Futures Index Strategy ETF and KraneShares Sustainable Ultra Short Duration Index ETF, intends to pay out dividends, if any, at least annually; the KraneShares Asia Pacific High Income USD Bond ETF and KraneShares Sustainable Ultra Short Duration Index ETF intend to pay out net investment income, if any, at least monthly. The KraneShares Value Line® Dynamic Dividend Equity Index ETF typically distributes any net investment income quarterly. The KraneShares Mount Lucas Managed Futures Index Strategy ETF may pay out net investment income, if any, at least semi-annually in June and December, but may pay such income as frequently as quarterly. The Funds pay out to their shareholders net realized capital gains, if any, once a year (usually in December). Each Fund may make distributions on a
Notes to Financial Statements/Notes to Consolidated Financial Statements (Unaudited) (continued)
more frequent basis. Each Fund reserves the right to declare special distributions, including if, in its reasonable discretion, such action is necessary or advisable to preserve the status of the Fund as a regulated investment company under Subchapter M of the Code, or to avoid imposition of income or excise taxes on undistributed income.
CASH OVERDRAFT CHARGES — Per the terms of an agreement with Brown Brothers Harriman & Co. (“BBH”), the Funds’ Custodian, if a Fund has a cash overdraft on a given day, it will be assessed an overdraft charge of the BBH Overdraft Base Rate plus 2.00%. Cash overdraft charges, if applicable, are included in “Interest Expense” on the Statements of Operations.
SECURITIES LENDING — The Funds may lend securities from their portfolios to brokers, dealers and other financial institutions. In connection with such loans, a Fund remains the beneficial owner of the loaned securities and continues to receive payments in amounts approximately equal to the interest, dividends or other distributions payable on the loaned securities. A Fund also has the right to terminate a loan at any time. A Fund does not have the right to vote on securities while they are on loan. Loans of portfolio securities will not exceed 33 1/3% of the value of a Fund’s total assets (including the value of all assets received as collateral for the loan). A Fund will receive collateral in an amount equal to at least 100% of the current market value of the loaned securities. If the collateral consists of cash, a Fund will reinvest the cash and pay the borrower a pre-negotiated fee or “rebate” from any return earned on the investment. Should the borrower of the securities fail financially, a Fund may experience delays in recovering the loaned securities or exercising its rights in the collateral. In a loan transaction, a Fund will also bear the risk of any decline in value of securities acquired with cash collateral. Krane and a sub-adviser are subject to potential conflicts of interest because the compensation paid to them increases in connection with any net income received by a Fund from a securities lending program. Each Fund pays Krane 10% of any net monthly income received from the investment of cash collateral and loan fees received from borrowers in respect of each securities loan (net of any amounts paid to the custodian and/or securities lending agent or rebated to borrowers) (see Note 4).
The following table discloses the securities on loan as of September 30, 2024:
| | | Market Value Securities on Loan | | | Cash Collateral for Securities on Loan | |
| KraneShares CSI China Internet ETF | | $ | 73,968,170 | | | $ | 77,951,273 | |
| KraneShares Emerging Markets Consumer Technology Index ETF | | | 212,727 | | | | 222,095 | |
| KraneShares Electric Vehicles and Future Mobility Index ETF | | | 8,177,296 | | | | 8,523,116 | |
CREATION UNITS — The Funds issue and redeem Shares at NAV and only in large blocks of Shares (each block of Shares for a Fund is a Creation Unit of 25,000 Shares, 50,000 Shares, 100,000 Shares, or multiples thereof). In its discretion, the Trust reserves the right to increase or decrease the number of each Fund’s shares that constitute a Creation Unit.
Except when aggregated in Creation Units, Shares are not redeemable securities of a Fund. Shares of a Fund may only be purchased or redeemed by certain Authorized Participants. An Authorized Participant is either (i) a broker-dealer or other participant in the clearing process through the Continuous Net Settlement System of the National Securities Clearing Corporation or (ii) a Depository Trust Company participant and, in each case, must have executed a Participant Agreement with the Distributor. Most retail investors will not qualify as Authorized Participants or have the resources to buy and sell whole Creation Units. Therefore, they will be unable to purchase or redeem the Shares directly from a Fund. Rather, most retail investors will purchase Shares in
Notes to Financial Statements/Notes to Consolidated Financial Statements (Unaudited) (continued)
the secondary market with the assistance of a broker and will be subject to customary brokerage commissions or fees when buying or selling Shares. If a Creation Unit is purchased or redeemed for cash, a higher transaction fee may be charged.
The Adviser may adjust the transaction fees from time to time based on actual experience.
CASH AND CASH EQUIVALENTS — Idle cash and currency balances may be swept into various overnight sweep accounts and are classified as cash equivalents on the Statements of Assets and Liabilities/Consolidated Statement of Assets and Liabilities. These amounts, at times, may exceed United States federally insured limits. Amounts swept are available on the next business day.
3. DERIVATIVES TRANSACTIONS
The following tables are exposure by type of risk on derivatives held throughout the year.
| | | Asset Derivatives | | | Liability Derivatives | |
| | | Consolidated
Statements of Assets
and Liabilities | | Fair Value | | | Consolidated
Statements of Assets
and Liabilities | | Fair Value | |
| KraneShares Mount Lucas Managed Futures Index Strategy ETF | | | | | | | | |
| Interest rate contracts | | Unrealized appreciation on futures contracts | | $ | 1,655,302 | * | | Unrealized depreciation on futures contracts | | $ | 430,461 | * |
| Foreign exchange contracts | | Unrealized appreciation on futures contracts | | | 4,305,717 | * | | Unrealized depreciation on futures contracts | | | 971,428 | * |
| Commodity contracts | | Unrealized appreciation on futures contracts | | | 10,963,746 | * | | Unrealized depreciation on futures contracts | | | 2,938,332 | * |
| Total Derivatives not accounted for as hedging instruments | | $ | 16,924,765 | | | | | $ | 4,340,221 | |
| * | Includes cumulative appreciation/depreciation of futures contracts as reported in the Consolidated Schedule of Investments. Only current day’s variation margin is reported within the Consolidated Statements of Assets and Liabilities. |
The effect of derivative instruments on the Consolidated Statement of Operations for the period ended September 30, 2024:
Change in realized appreciation or (depreciation) on derivatives recognized in income:
| Derivatives Not Accounted for as Hedging Instruments | | Futures | |
| KraneShares Mount Lucas Managed Futures Index Strategy ETF | | | | |
| Interest rate contracts | | $ | (3,451,730 | ) |
| Foreign exchange contracts | | | (6,070,738 | ) |
| Commodity contracts | | | (10,735,850 | ) |
| Total | | $ | (20,258,318 | ) |
Notes to Financial Statements/Notes to Consolidated Financial Statements (Unaudited) (continued)
Change in unrealized appreciation or (depreciation) on derivatives recognized in income:
| Derivatives Not Accounted for as Hedging Instruments | | Futures | |
| KraneShares Mount Lucas Managed Futures Index Strategy ETF | | | | |
| Interest rate contracts | | $ | 1,099,754 | |
| Foreign exchange contracts | | | 621,249 | |
| Commodity contracts | | | 5,123,450 | |
| Total | | $ | 6,844,453 | |
4. RELATED PARTY TRANSACTIONS
INVESTMENT ADVISORY AGREEMENT — The Adviser serves as investment adviser to each Fund pursuant to an Investment Advisory Agreement between the Trust on behalf of each Fund and the Adviser (the “Agreement”). Under the Agreement, Krane is responsible for reviewing, supervising and administering each Fund’s investment program and the general management and administration of the Trust. In addition to these services, to the extent a Fund engages in securities lending, Krane will: (i) determine which securities are available for loan and notify the securities lending agent for a Fund (the “Agent”), (ii) monitor the Agent’s activities to ensure that securities loans are effected in accordance with Krane’s instructions and in accordance with applicable procedures and guidelines adopted by the Board, (iii) make recommendations to the Board regarding the Fund’s participation in securities lending; (iv) prepare appropriate periodic reports for, and seek appropriate periodic approvals from, the Board with respect to securities lending activities, (v) respond to Agent inquiries concerning the Agent’s activities, and (vi) such other related duties as Krane deems necessary or appropriate. The Board supervises Krane and establishes policies that Krane must follow in its management activities.
The Agreement requires the Adviser to pay all operating expenses of the Funds, except: (a) interest and taxes (including, but not limited to, income, excise, transaction, transfer and withholding taxes); (b) expenses of the Funds incurred with respect to the acquisition and disposition of portfolio securities and the execution of portfolio transactions, including brokerage commissions and short sale dividend or interest expense; (c) expenses incurred in connection with any distribution plan adopted by the Trust in compliance with Rule 12b-1 under the Investment Company Act, including distribution fees; (d) “Acquired Fund Fees and Expenses” (as defined by Form N-1A under the Investment Company Act); (e) litigation expenses; (f) the compensation payable to the Adviser under the Agreement; (g) compensation and expenses of the Independent Trustees (including any fees of independent legal counsel to the Independent Trustees); and (h) any expenses determined to be extraordinary expenses by the Board. In addition, under the Agreement, while the fees and expenses related to the Funds’ securities lending-related activities reduce the gross revenues and income of the Funds from such activities, they are not fees and expenses for which Krane is responsible.
Each Agreement provides that each Fund pays a unitary (or unified) fee to the Adviser for advisory and management services provided to the Fund, subject to the exceptions noted herein. In this context, there exists a risk that a Trust service provider will seek recourse against the Trust if it is not timely paid by Krane for the fees and expenses for which it is responsible, which could materially adversely affect the Funds. Pursuant to the Agreement between the Trust and the Adviser, the Funds below pay the Adviser a fee, which is calculated daily and paid monthly, at the following annual rates, based on a percentage of the average daily net assets of each Fund. In addition, as compensation for the services provided by the Adviser in connection with any securities lending-related activities, each Fund pays the Adviser 10% of the monthly investment income received from
Notes to Financial Statements/Notes to Consolidated Financial Statements (Unaudited) (continued)
the investment of cash collateral and loan fees received from borrowers in respect to securities loans (net of any amounts paid to the custodian and/or securities lending agent or rebated to borrowers), included on the Statements of Operations as “Security Lending Fees”.
| | | Management Fee | |
| KraneShares CSI China Internet ETF | | 0.68% | |
| KraneShares Bosera MSCI China A 50 Connect Index ETF | | 0.78% | |
| KraneShares MSCI All China Index ETF | | 0.68% | |
| KraneShares MSCI One Belt One Road Index ETF | | 0.78% | |
| KraneShares Emerging Markets Consumer Technology Index ETF | | 0.78% | |
| KraneShares MSCI China Clean Technology Index ETF | | 0.78% | |
| KraneShares Electric Vehicles and Future Mobility Index ETF | | 0.68% | |
| KraneShares MSCI All China Health Care Index ETF | | 0.78% | |
| KraneShares Asia Pacific High Income USD Bond ETF | | 0.68% | |
| KraneShares MSCI Emerging Markets ex China Index ETF | | 0.58% | |
| KraneShares Value Line® Dynamic Dividend Equity Index ETF | | 0.55% | |
| KraneShares Mount Lucas Managed Futures Index Strategy ETF | | 0.89% | |
| KraneShares SSE STAR Market 50 Index ETF | | 0.88% | |
| KraneShares Hang Seng TECH Index ETF | | 0.68% | |
| KraneShares Dynamic Emerging Markets Strategy ETF | | 0.10% | |
| KraneShares Global Luxury Index ETF | | 0.68% | |
| KraneShares Artificial Intelligence and Technology ETF | | 0.99% | |
| KraneShares Sustainable Ultra Short Duration Index ETF | | 0.29% | |
| KraneShares China Alpha Index ETF | | 0.78% | |
The Adviser bears all of its own costs associated with providing these advisory services.
Pursuant to the terms of Fee Waiver Agreements, Krane has contractually agreed to waive its management fee for the below listed Funds by the following amounts of the Fund’s average daily net assets until August 1, 2025. The Fee Waiver Agreements may only be terminated prior thereto by the Board. In addition, the Fee Waiver Agreements will terminate if the Agreement for a Fund is terminated.
| | | Fee Waiver Fee | |
| KraneShares Bosera MSCI China A 50 Connect Index ETF | | 0.23% | |
| KraneShares MSCI All China Index ETF | | 0.20% | |
| KraneShares Emerging Markets Consumer Technology Index ETF | | 0.30% | |
| KraneShares MSCI All China Health Care Index ETF | | 0.14% | |
| KraneShares MSCI Emerging Markets ex China Index ETF | | 0.35% | |
| KraneShares Sustainable Ultra Short Duration Index ETF | | 0.10% | |
SUB-ADVISORY AGREEMENT — Bosera Asset Management (International) Co., Ltd. (“Bosera”), operating out of Hong Kong, serves as the Sub-Adviser to the KraneShares Bosera MSCI China A 50 Connect Index ETF and KraneShares SSE STAR Market 50 Index ETF and is responsible for the day-to-day management of the Funds, subject to the supervision by the Adviser and the Board. As of January 1, 2024, Krane pays Bosera fifteen (15%) percent of the net revenue received by Krane from KraneShares Bosera MSCI China A 50 Connect Index ETF under the Investment Advisory
Notes to Financial Statements/Notes to Consolidated Financial Statements (Unaudited) (continued)
Agreement. Prior to that date, Krane paid Bosera fifty (50%) percent of the net revenue received by Krane from the Fund. For the services Bosera provides to KraneShares SSE STAR Market 50 Index ETF, the Adviser pays Bosera a twelve basis points (0.12%) sub-advisory fee based upon the monthly average assets under management of KraneShares SSE STAR Market 50 Index ETF.
Nikko Asset Management Americas Inc. (“Nikko”) serves as the investment sub-adviser to KraneShares Asia Pacific High Income USD Bond ETF. Nikko is responsible for the day-to-day investment management of the Fund, subject to the supervision of Krane and the Board. Nikko delegates to its affiliate Nikko Asset Management Asia, Ltd. (“Nikko Asia”), a registered investment adviser with the SEC, certain of its responsibilities for the management of the Fund. Krane has entered into a Sub-Advisory Agreement with Nikko pursuant to which Krane has agreed to pay Nikko 36.77% of the sum of: (i) the total gross advisory fee due to the Adviser from the Fund under the terms of the Agreement minus (ii) any applicable fee waivers from time to time entered into between the Fund and the Adviser.
Mount Lucas Index Advisers LLC (“MLIA”) serves as the Sub-Adviser of the KraneShares Mount Lucas Managed Futures Index Strategy ETF. For the services MLIA provides to the Fund, the Adviser pays MLIA a fee equal to 32% of the Net Revenue received by Krane from the Fund. Net Revenue is defined for these purposes as gross revenue under Schedule A of the Agreement minus gross fund-related expenses (including any waiver by Krane of its compensation under the Agreement and any reimbursements by Krane of the Fund’s expenses).
Etna Capital Management Company Ltd. (“Etna”) serves as the Sub-Adviser of the KraneShares Artificial Intelligence and Technology ETF. Etna is responsible for the selection of the Fund’s private securities, subject to the supervision of Krane and the Board of Trustees. For the services it will provide, Krane will pay Etna a fee equal to 30% of the total gross advisory fee paid to Krane by the Fund under the terms of the Investment Advisory Agreement.
DISTRIBUTION AGREEMENT — SEI Investments Distribution Co. (the “Distributor”), a wholly-owned subsidiary of SEI Investments Company, and an affiliate of the Administrator, serves as the Funds’ distributor of Creation Units pursuant to a Distribution Agreement. The Distributor does not maintain any secondary market in Fund shares.
The Trust has adopted a Distribution and Service Plan (“Plan”) pursuant to Rule 12b-1 under the Investment Company Act. In accordance with its Plan, each Fund is authorized to pay an amount up to 0.25% of its average daily net assets each year for certain distribution-related activities. For the period ended September 30, 2024, no fees were charged under the Plan. Fees would only be charged under the Plan upon approval by the Board.
ADMINISTRATOR, CUSTODIAN AND TRANSFER AGENT — SEI Investments Global Funds Services (the “Administrator”) serves as the Funds’ Administrator pursuant to an Administration Agreement. BBH serves as the Funds’ Custodian and Transfer Agent pursuant to a Custodian and Transfer Agent Agreement.
5. BASIS FOR CONSOLIDATION FOR THE KRANESHARES MOUNT LUCAS MANAGED FUTURES INDEX STRATEGY ETF
The Consolidated Schedule of Investments, Consolidated Statement of Assets and Liabilities, Consolidated Statement of Operations, Consolidated Statement of Changes in Net Assets and the Consolidated Financial Highlights of the KraneShares Mount Lucas Managed Futures Index
Notes to Financial Statements/Notes to Consolidated Financial Statements (Unaudited) (continued)
Strategy ETF include the accounts of the Fund’s Subsidiary. All intercompany accounts and transactions have been eliminated in consolidation for the Fund. The Subsidiary has a fiscal year end of March 31 for financial statement consolidation purposes.
The Subsidiary is classified as a controlled foreign corporation under the Code. The Subsidiary’s taxable income is included in the calculation of the Fund’s taxable income. Net losses of the Subsidiary are not deductible by the Fund either in the current period or carried forward to future periods.
The KraneShares Mount Lucas Managed Futures Index Strategy ETF’s investment in the Subsidiary may not exceed 25% of the value of its total assets (ignoring any subsequent market appreciation in the Subsidiary’s value), which limitation is imposed by the Code and is measured at the end of each quarter.
A summary of the investments in the Subsidiary is as follows:
| | | Inception
Date of
Subsidiary | | Subsidiary
Net Assets at
September 30,
2024 | | | % of Total
Net Assets at
September 30,
2024 | |
| KraneShares MLM Index Subsidiary, Ltd. | | December 1,
2020 | | $ | 39,530,267 | | | | 14.94 | % |
6. INVESTMENT TRANSACTIONS
For the period ended September 30, 2024, the following Funds had purchases and sales of investments in securities excluding in-kind transactions, long-term U.S. Government and short-term securities:
| | | Purchases | | | Sales and
Maturities | |
| KraneShares CSI China Internet ETF | | $ | 1,625,812,631 | | | $ | 1,370,036,769 | |
| KraneShares Bosera MSCI China A 50 Connect Index ETF | | | 33,642,380 | | | | 69,609,940 | |
| KraneShares MSCI All China Index ETF | | | 234,025 | | | | 83,916 | |
| KraneShares MSCI One Belt One Road Index ETF | | | 437,753 | | | | 1,059,090 | |
| KraneShares Emerging Markets Consumer Technology Index ETF | | | 3,607,677 | | | | 7,384,513 | |
| KraneShares MSCI China Clean Technology Index ETF | | | 10,872,250 | | | | 17,718,097 | |
| KraneShares Electric Vehicles and Future Mobility Index ETF | | | 16,418,706 | | | | 27,135,708 | |
| KraneShares MSCI All China Health Care Index ETF | | | 4,685,300 | | | | 9,826,128 | |
| KraneShares Asia Pacific High Income USD Bond ETF | | | 9,370,907 | | | | 7,250,782 | |
| KraneShares MSCI Emerging Markets ex China Index ETF | | | 1,485,174 | | | | 5,036,548 | |
| KraneShares Value Line® Dynamic Dividend Equity Index ETF | | | 14,000,698 | | | | 13,887,313 | |
| KraneShares SSE STAR Market 50 Index ETF | | | 2,795,842 | | | | 4,282,245 | |
| KraneShares Hang Seng TECH Index ETF | | | 6,639,953 | | | | 2,192,637 | |
| KraneShares Dynamic Emerging Markets Strategy ETF | | | 46,606 | | | | 47,022 | |
| KraneShares Global Luxury Index ETF | | | 788,145 | | | | 734,971 | |
| KraneShares Artificial Intelligence and Technology ETF | | | 5,176,634 | | | | 375,660 | |
| KraneShares China Alpha Index ETF | | | 14,185,630 | | | | 6,725,913 | |
For the period ended September 30, 2024, there were no purchases or sales of long-term U.S. government securities for the Funds.
Notes to Financial Statements/Notes to Consolidated Financial Statements (Unaudited) (continued)
For the period ended September 30, 2024, in-kind transactions associated with creations and redemptions were:
| | | Purchases | | | Sales | | | Realized Gain/
(Loss) | |
| KraneShares CSI China Internet ETF | | $ | 524,326,656 | | | $ | 489,633,415 | | | $ | 91,985,894 | |
| KraneShares MSCI One Belt One Road Index ETF | | | — | | | | 366,462 | | | | 17,087 | |
| KraneShares Emerging Markets Consumer Technology Index ETF | | | — | | | | 1,221,619 | | | | 79,953 | |
| KraneShares MSCI China Clean Technology Index ETF | | | 17,979 | | | | 567,045 | | | | (193,187 | ) |
| KraneShares Electric Vehicles and Future Mobility Index ETF | | | — | | | | 7,814,207 | | | | (365,593 | ) |
| KraneShares MSCI All China Health Care Index ETF | | | — | | | | 131,813 | | | | 12,962 | |
| KraneShares MSCI Emerging Markets ex China Index ETF | | | — | | | | 1,153,294 | | | | 207,339 | |
| KraneShares Value Line® Dynamic Dividend Equity Index ETF | | | 1,284,236 | | | | 2,495,413 | | | | 374,625 | |
| KraneShares Dynamic Emerging Markets Strategy ETF | | | 658,741 | | | | — | | | | — | |
| KraneShares Sustainable Ultra Short Duration Index ETF | | | 297,445,273 | | | | — | | | | — | |
7. TAX INFORMATION
The amount and character of income and capital gain distributions to be paid, if any, are determined in accordance with Federal income tax regulations, which may differ from U.S. GAAP. As a result, net investment income (loss) and net realized gain (loss) on investment transactions for a reporting period may differ significantly from distributions during such period. These book/tax differences may be temporary or permanent. To the extent these differences are permanent in nature, they are charged or credited to distributable earnings (loss) or paid-in capital, as appropriate, in the period that the differences arise.
The tax character of dividends and distributions paid during the years or periods ended March 31, 2024 and March 31, 2023 were as follows:
| | | Ordinary
Income | | | Long-Term
Capital Gain | | | Totals | |
| KraneShares CSI China Internet ETF | | | | | | | | | | | | |
| 2024 | | $ | 94,044,849 | | | $ | — | | | $ | 94,044,849 | |
| 2023 | | | — | | | | — | | | | — | |
| KraneShares Bosera MSCI China A 50 Connect Index ETF | | | | | | | | | | | | |
| 2024 | | $ | 6,619,090 | | | $ | — | | | $ | 6,619,090 | |
| 2023 | | | 9,640,424 | | | | 101,634,817 | | | | 111,275,241 | |
| KraneShares MSCI All China Index ETF | | | | | | | | | | | | |
| 2024 | | $ | 215,050 | | | $ | — | | | $ | 215,050 | |
| 2023 | | | 192,809 | | | | 119,165 | | | | 311,974 | |
Notes to Financial Statements/Notes to Consolidated Financial Statements (Unaudited) (continued)
| | | Ordinary
Income | | | Long-Term
Capital Gain | | | Totals | |
| KraneShares MSCI One Belt One Road Index ETF | | | | | | | | | | | | |
| 2024 | | $ | 137,606 | | | $ | — | | | $ | 137,606 | |
| 2023 | | | 215,731 | | | | — | | | | 215,731 | |
| KraneShares Emerging Markets Consumer Technology Index ETF | | | | | | | | | | | | |
| 2024 | | $ | 27,452 | | | $ | — | | | $ | 27,452 | |
| 2023 | | | — | | | | — | | | | — | |
| KraneShares MSCI China Clean Technology Index ETF | | | | | | | | | | | | |
| 2024 | | $ | 496,202 | | | $ | — | | | $ | 496,202 | |
| 2023 | | | 337,960 | | | | 1,438,072 | | | | 1,776,032 | |
| KraneShares Electric Vehicles and Future Mobility Index ETF | | | | | | | | | | | | |
| 2024 | | $ | 1,252,258 | | | $ | — | | | $ | 1,252,258 | |
| 2023 | | | 2,090,551 | | | | — | | | | 2,090,551 | |
| KraneShares MSCI All China Health Care Index ETF | | | | | | | | | | | | |
| 2024 | | $ | 383,670 | | | $ | — | | | $ | 383,670 | |
| 2023 | | | 50,955 | | | | — | | | | 50,955 | |
| KraneShares Asia Pacific High Income USD Bond ETF | | | | | | | | | | | | |
| 2024 | | $ | 2,334,194 | | | $ | — | | | $ | 2,334,194 | |
| 2023 | | | 2,002,618 | | | | — | | | | 2,002,618 | |
| KraneShares MSCI Emerging Markets ex China Index ETF | | | | | | | | | | | | |
| 2024 | | $ | 910,616 | | | $ | — | | | $ | 910,616 | |
| 2023 | | | 693,378 | | | | — | | | | 693,378 | |
| KraneShares Value Line® Dynamic Dividend Equity Index ETF | | | | | | | | | | | | |
| 2024 | | $ | 868,772 | | | $ | 308,656 | | | $ | 1,177,428 | |
| 2023 | | | 1,085,154 | | | | 640,311 | | | | 1,725,465 | |
| KraneShares Mount Lucas Managed Futures Index Strategy ETF | | | | | | | | | | | | |
| 2024 | | $ | — | | | $ | — | | | $ | — | |
| 2023 | | | 22,793,108 | | | | 11,729,167 | | | | 34,522,275 | |
| KraneShares SSE STAR Market 50 Index ETF | | | | | | | | | | | | |
| 2024 | | $ | — | | | $ | — | | | $ | — | |
| 2023 | | | — | | | | — | | | | — | |
| KraneShares Hang Seng TECH Index ETF | | | | | | | | | | | | |
| 2024 | | $ | 46,489 | | | $ | — | | | $ | 46,489 | |
| 2023 | | | 11,428 | | | | — | | | | 11,428 | |
| KraneShares Dynamic Emerging Markets Strategy ETF | | | | | | | | | | | | |
| 2024 | | $ | 105,254 | | | $ | — | | | $ | 105,254 | |
| KraneShares Global Luxury Index ETF | | | | | | | | | | | | |
| 2024 | | $ | 4,643 | | | $ | — | | | $ | 4,643 | |
Notes to Financial Statements/Notes to Consolidated Financial Statements (Unaudited) (continued)
As of March 31, 2024, the components of tax basis distributable earnings (distributable losses) were as follows:
| | | KraneShares
CSI China
Internet ETF | | | KraneShares
Bosera MSCI
China A 50
Connect Index ETF | | | KraneShares
MSCI All China
Index ETF | | | KraneShares
MSCI One Belt
One Road
Index ETF | |
| Undistributed Ordinary Income | | $ | 61,776,827 | | | $ | — | | | $ | 29,210 | | | $ | 6,580 | |
| Capital Loss Carryforwards | | | (2,686,322,078 | ) | | | (189,335,870 | ) | | | (6,347,999 | ) | | | (3,643,750 | ) |
| Qualified Late-Year Loss Deferrals | | | — | | | | (67,774 | ) | | | — | | | | — | |
| Unrealized Depreciation on Investments and Foreign Currency | | | (3,699,273,032 | ) | | | (67,963,141 | ) | | | (2,253,091 | ) | | | (1,053,611 | ) |
| Other Temporary Differences | | | (3 | ) | | | (11 | ) | | | 1 | | | | (1 | ) |
| Total Distributable Loss | | $ | (6,323,818,286 | ) | | $ | (257,366,796 | ) | | $ | (8,571,879 | ) | | $ | (4,690,782 | ) |
| | | KraneShares
Emerging Markets
Consumer Technology
Index ETF | | | KraneShares
MSCI China
Clean Technology
Index ETF | | | KraneShares
Electric Vehicles and
Future Mobility
Index ETF | | | KraneShares
MSCI All China
Health Care
Index ETF | |
| Undistributed Ordinary Income | | $ | — | | | $ | — | | | $ | — | | | $ | 188,412 | |
| Capital Loss Carryforwards | | | (49,669,840 | ) | | | (79,020,064 | ) | | | (88,376,540 | ) | | | (65,852,693 | ) |
| Qualified Late-Year Loss Deferrals | | | (34,394 | ) | | | (114,325 | ) | | | (68,584 | ) | | | — | |
| Unrealized Depreciation on Investments and Foreign Currency | | | (4,116,065 | ) | | | (18,275,157 | ) | | | (52,919,518 | ) | | | (33,820,887 | ) |
| Other Temporary Differences | | | — | | | | 2 | | | | — | | | | — | |
| Total Distributable Loss | | $ | (53,820,299 | ) | | $ | (97,409,544 | ) | | $ | (141,364,642 | ) | | $ | (99,485,168 | ) |
| | | KraneShares
Asia Pacific High
Income USD
Bond ETF | | | KraneShares
MSCI Emerging
Markets ex China
Index ETF | | | KraneShares
Value Line® Dynamic
Dividend Equity
Index ETF | |
| Undistributed Ordinary Income | | $ | 193,997 | | | $ | 774,098 | | | $ | 351,770 | |
| Capital Loss Carryforwards | | | (10,377,329 | ) | | | (1,594,046 | ) | | | — | |
| Unrealized Appreciation (Depreciation) on Investments and Foreign Currency | | | 49,221 | | | | 2,613,416 | | | | 2,417,373 | |
| Other Temporary Differences | | | 49,162 | | | | (2 | ) | | | 1 | |
| Total Distributable Earnings/(Loss) | | $ | (10,084,949 | ) | | $ | 1,793,466 | | | $ | 2,769,144 | |
Notes to Financial Statements/Notes to Consolidated Financial Statements (Unaudited) (continued)
| | | KraneShares
Mount Lucas
Managed
Futures Index
Strategy ETF | | | KraneShares
SSE STAR
Market 50 Index
ETF | | | KraneShares
Hang Seng TECH
Index ETF | |
| Capital Loss Carryforwards | | $ | (11,119,493 | ) | | $ | (29,622,667 | ) | | $ | (3,028,445 | ) |
| Post October Losses | | | (24,607,088 | ) | | | — | | | | — | |
| Qualified Late-Year Loss Deferrals | | | (5,771,888 | ) | | | (62,657 | ) | | | (9,567 | ) |
| Unrealized Appreciation (Depreciation) on Investments and Foreign Currency | | | (6,414,135 | ) | | | (11,972,769 | ) | | | (2,192,171 | ) |
| Other Temporary Differences | | | (1,286,475 | ) | | | (7 | ) | | | (3 | ) |
| Total Distributable Earnings/(Loss) | | $ | (49,199,079 | ) | | $ | (41,658,100 | ) | | $ | (5,230,186 | ) |
| | | KraneShares Dynamic
Emerging
Markets
Strategy ETF | | |
KraneShares
Global Luxury
Index ETF | |
| Undistributed Ordinary Income | | $ | — | | | $ | 15,083 | |
| Capital Loss Carryforwards | | | (1,149 | ) | | | — | |
| Qualified Late-Year Loss Deferrals | | | (607 | ) | | | — | |
| Unrealized Appreciation (Depreciation) on Investments and Foreign Currency | | | (35,966 | ) | | | 234,643 | |
| Other Temporary Differences | | | — | | | | (2 | ) |
| Total Distributable Earnings/(Loss) | | $ | (37,722 | ) | | $ | 249,724 | |
Qualified late year ordinary and Post-October capital losses (including currency and specified gain/loss items) represent losses realized from January 1, 2024 through March 31, 2024 and November 1, 2023 through March 31, 2024, respectively, that in accordance with federal income tax regulations, the Funds have elected to defer and treat as having arisen in the following fiscal year.
Other temporary differences primarily consist of late year and specified loss deferrals, perpetual bond adjustments, PFIC mark to market and book adjustments not recognized for tax.
The Funds have capital loss carryforwards as follows:
| | | Short-Term
Loss | | | Long-Term
Loss | | | Total | |
| KraneShares CSI China Internet ETF | | $ | 689,050,525 | | | $ | 1,997,271,553 | | | $ | 2,686,322,078 | |
| KraneShares Bosera MSCI China A 50 Connect Index ETF | | | 78,152,608 | | | | 111,183,262 | | | | 189,335,870 | |
| KraneShares MSCI All China Index ETF | | | 215,395 | | | | 6,132,604 | | | | 6,347,999 | |
| KraneShares MSCI One Belt One Road Index ETF | | | 2,450,106 | | | | 1,193,644 | | | | 3,643,750 | |
| KraneShares Emerging Markets Consumer Technology Index ETF | | | 22,091,565 | | | | 27,578,275 | | | | 49,669,840 | |
| KraneShares MSCI China Clean Technology Index ETF | | | 3,500,356 | | | | 75,519,708 | | | | 79,020,064 | |
| KraneShares Electric Vehicles and Future Mobility Index ETF | | | 31,371,478 | | | | 57,005,062 | | | | 88,376,540 | |
Notes to Financial Statements/Notes to Consolidated Financial Statements (Unaudited) (continued)
| | | Short-Term
Loss | | | Long-Term
Loss | | |
Total | |
| KraneShares MSCI All China Health Care Index ETF | | $ | 4,089,006 | | | $ | 61,763,687 | | | $ | 65,852,693 | |
| KraneShares Asia Pacific High Income USD Bond ETF | | | 8,486,154 | | | | 1,891,175 | | | | 10,377,329 | |
| KraneShares MSCI Emerging Markets ex China Index ETF | | | 5,865 | | | | 1,588,181 | | | | 1,594,046 | |
| KraneShares Mount Lucas Managed Futures Index Strategy ETF | | | 4,174,372 | | | | 6,945,121 | | | | 11,119,493 | |
| KraneShares SSE STAR Market 50 Index ETF | | | 8,548,968 | | | | 21,073,699 | | | | 29,622,667 | |
| KraneShares Hang Seng TECH Index ETF | | | 2,090,066 | | | | 938,379 | | | | 3,028,445 | |
| KraneShares Dynamic Emerging Markets Strategy ETF | | | 1,149 | | | | — | | | | 1,149 | |
During the year ended March 31, 2024, the following Funds utilized capital loss carryforwards, to offset capital gains:
| | | Amount
Utilized | |
| KraneShares MSCI China Clean Technology Index ETF | | $ | 1,634,475 | |
| KraneShares MSCI Emerging Markets ex China Index ETF | | | 5,115 | |
| KraneShares Hang Seng TECH Index ETF | | | 25,841 | |
The differences between book and tax-basis unrealized appreciation and depreciation are attributable primarily to the tax deferral of losses on wash sales, investments in PFICs and perpetual bonds. The federal tax cost and aggregate gross unrealized appreciation and depreciation on investments held by the Funds at September 30, 2024 were as follows:
| | | Federal
Tax Cost | | | Aggregated
Gross
Unrealized
Appreciation | | | Aggregated
Gross
Unrealized
Depreciation | | |
Net Unrealized
Appreciation
(Depreciation) | |
| KraneShares CSI China Internet ETF | | $ | 6,727,120,342 | | | $ | 1,128,976,756 | | | $ | (592,738,108 | ) | | $ | 536,238,648 | |
| KraneShares Bosera MSCI China A 50 Connect Index ETF | | | 156,577,733 | | | | 31,270,646 | | | | (2,689,774 | ) | | | 28,580,872 | |
| KraneShares MSCI All China Index ETF | | | 8,322,761 | | | | 931,511 | | | | (1,220,564 | ) | | | (289,053 | ) |
| KraneShares MSCI One Belt One Road Index ETF | | | 4,087,807 | | | | 607,141 | | | | (1,150,012 | ) | | | (542,871 | ) |
| KraneShares Emerging Markets Consumer Technology Index ETF | | | 17,261,441 | | | | 4,512,955 | | | | (4,141,709 | ) | | | 371,246 | |
| KraneShares MSCI China Clean Technology Index ETF | | | 54,032,640 | | | | 10,021,836 | | | | (4,195,342 | ) | | | 5,826,494 | |
| KraneShares Electric Vehicles and Future Mobility Index ETF | | | 117,684,004 | | | | 8,515,439 | | | | (30,441,113 | ) | | | (21,925,674 | ) |
| KraneShares MSCI All China Health Care Index ETF | | | 50,050,504 | | | | 5,056,049 | | | | (7,687,700 | ) | | | (2,631,651 | ) |
| KraneShares Asia Pacific High Income USD Bond ETF | | | 17,654,014 | | | | 515,852 | | | | (146,521 | ) | | | 369,331 | |
| KraneShares MSCI Emerging Markets ex China Index ETF | | | 69,743,691 | | | | 14,144,022 | | | | (4,863,714 | ) | | | 9,280,308 | |
Notes to Financial Statements/Notes to Consolidated Financial Statements (Unaudited) (continued)
| | |
Federal Tax
Cost | | | Aggregated
Gross
Unrealized
Appreciation | | | Aggregated
Gross
Unrealized
Depreciation | | |
Net Unrealized
Appreciation
(Depreciation) | |
| KraneShares Value Line® Dynamic Dividend Equity Index ETF | | $ | 29,124,919 | | | $ | 3,464,932 | | | $ | (390,600 | ) | | $ | 3,074,332 | |
| KraneShares Mount Lucas Managed Futures Index Strategy ETF | | | 273,985,901 | | | | 37,250 | | | | 4,528,388 | | | | 4,565,638 | |
| KraneShares SSE STAR Market 50 Index ETF | | | 28,488,063 | | | | 2,774,679 | | | | (4,794,007 | ) | | | (2,019,328 | ) |
| KraneShares Hang Seng TECH Index ETF | | | 9,499,555 | | | | 2,581,891 | | | | (250,690 | ) | | | 2,331,201 | |
| KraneShares Dynamic Emerging Markets Strategy ETF | | | 4,385,345 | | | | 656,934 | | | | — | | | | 656,934 | |
| KraneShares Global Luxury Index ETF | | | 2,343,282 | | | | 331,625 | | | | (177,958 | ) | | | 153,667 | |
| KraneShares Artificial Intelligence and Technology ETF | | | 4,766,734 | | | | 379,250 | | | | (102,586 | ) | | | 276,664 | |
| KraneShares Sustainable Ultra Short Duration Index ETF | | | 285,218,540 | | | | 317,052 | | | | (40,631 | ) | | | 276,421 | |
| KraneShares China Alpha Index ETF | | | 7,417,409 | | | | 1,389,396 | | | | — | | | | 1,389,396 | |
For the KraneShares MSCI One Belt One Road Index ETF, KraneShares Emerging Markets Consumer Technology Index ETF and the KraneShares MSCI Emerging Markets ex China Index ETF, the difference in unrealized appreciation is attributable to Foreign Capital Gains Tax Payable.
Uncertainties in the Chinese tax rules governing the taxation of income distributions and capital gains from investments in A Shares could result in unexpected tax liabilities for the Funds. China generally imposes withholding tax at a rate of 10% on dividends and interest derived by non-Chinese resident investors (including, for example, Qualified Foreign Institutional Investors (“QFII”)) from Chinese companies and those companies which are not Chinese tax residents, but which are deemed to be Chinese tax residents (e.g., under Notice 7). China also imposes withholding tax at a rate of 10% on capital gains derived by non-residents from investment in actual and constructive Chinese resident companies. The Chinese withholding taxes applied to dividends, interest and capital gains may, in principle, be subject to a reduced rate under an applicable Chinese tax treaty, but the application of such treaties in the case of a non-resident (e.g., in the case of a QFII acting on behalf of non-resident investors, such as the Funds) is also uncertain. The imposition of such taxes could have a material adverse effect on the Funds’ returns. The People’s Republic of China (the “PRC”) rules regarding the taxation of non-resident investors are quickly evolving and certain of the tax regulations to be issued by the PRC State Administration of Taxation and/or the PRC Ministry of Finance to clarify matters may apply retrospectively. Such retroactively applied rules may be adverse to the Funds and their shareholders. It is also unclear how China’s value added tax (“VAT”) may be affected by tax treaty provisions. If such a tax is collected, the expenses will be passed on and borne by the Funds. The imposition of such taxes, as well as future changes in applicable PRC tax law, may adversely affect the Funds. If the Funds expect VAT to be imposed, they reserve the right to establish a reserve for such tax. If the Funds establish such a reserve but are not ultimately subject to the tax, shareholders who redeemed or sold their shares while
Notes to Financial Statements/Notes to Consolidated Financial Statements (Unaudited) (continued)
the reserve was in place will effectively bear the tax and may not benefit from the later release, if any, of the reserve. Conversely, if the Funds do not establish such a reserve but ultimately are subject to the tax, shareholders who redeemed or sold their shares prior to the tax being withheld, reserved or paid will have effectively avoided the tax, even if they benefited from investments in a Fund. Effective November 17, 2014, QFIIs, RQFIIs (i.e., QFIIs investing in Yuan, rather than foreign currency) and non-Chinese resident investors investing through the Hong Kong-Shanghai Stock Connect are exempted temporarily from the 10% capital gains tax that normally applies to sales of A Shares on a public Chinese exchange (such as the Shanghai Stock Exchange). However, such investors are still required to pay capital gains tax for gains realized on trades executed before November 17, 2014.
On November 7, 2018, China’s Ministry of Finance and the State Administration of Taxation jointly issued Circular 108. This circular announced a three year exemption from corporate income tax withholding (“WHT”) and Value Added Tax (“VAT”) for China-sourced bond interest derived by overseas institutional investors. The WHT and VAT exemptions were extended to December 31, 2025.
In 2020, the PRC government eliminated QFII and RQFII quotas, meaning that entities registered with the appropriate Chinese regulator will no longer be subject to quotas when investing in PRC securities (but will remain subject to foreign shareholder limits), and merged the two programs into the Qualified Foreign Investor regime (“QFI”).
8. CONCENTRATION OF RISKS
As with all exchange-traded funds (“ETFs”), shareholders of the Funds are subject to the risk that their investment could lose money. Each Fund is subject to certain of the principal risks noted below, any of which may adversely affect a Fund’s NAV, trading price, yield, total return and ability to meet its investment objective. A more complete description of principal risks is included in each Fund’s prospectus under the heading “Principal Risks”.
ARTIFICAL INTELLIGENCE AND TECHNOLIGY RISK — “AI and Technology” companies typically have high research and capital expenditures and, as a result, their profitability can vary widely, if they are profitable at all. The space in which they are engaged is highly competitive and issuers’ products and services may become obsolete very quickly. These companies are heavily dependent on intellectual property rights and may be adversely affected by loss or impairment of those rights. The issuers are also subject to legal, regulatory and political changes that may have a large impact on their profitability. A failure in an issuer’s product or even questions about the safety of the product could be devastating to the issuer, especially if it is the marquee product of the issuer. It can be difficult to accurately capture what qualifies as an AI and Technology company.
Certain AI and Technology companies may face special risks that their products or services may not prove to be commercially successful. Such companies are also strongly affected by worldwide scientific or technological developments. As a result, their products may rapidly become obsolete. Such companies are also often subject to governmental regulation and may, therefore, be adversely affected by governmental policies. In addition, certain of such companies in which the Fund may invest may not currently be profitable and there can be no assurance that such companies will be profitable in the future.
CHINA RISK — The Chinese economy is generally considered an emerging market and can be significantly affected by economic and political conditions in China and surrounding Asian countries. China may be subject to considerable degrees of economic, political and social
Notes to Financial Statements/Notes to Consolidated Financial Statements (Unaudited) (continued)
instability. In addition, the Chinese economy is export-driven and highly reliant on trade with key partners. A downturn in the economies of China’s primary trading partners could slow or eliminate the growth of the Chinese economy and adversely impact the Fund’s investments. The Chinese government strictly regulates the payment of foreign currency denominated obligations and sets monetary policy. The Chinese government may introduce new laws and regulations that could have an adverse effect on the Fund. Although China has begun the process of privatizing certain sectors of its economy, privatized entities may lose money and/or be re-nationalized.
In the Chinese securities markets, a small number of issuers may represent a large portion of the entire market. The Chinese securities markets are subject to more frequent trading halts, low trading volume and price volatility. Recent developments in relations between the United States and China have heightened concerns of increased tariffs and restrictions on trade between the two countries. An increase in tariffs or trade restrictions or even the threat of such developments, could lead to significant reduction in international trade, which could have a negative impact on China’s export industry and a commensurately negative impact on the Fund.
The RMB Bond market is volatile with a risk of trading suspensions in particular securities and government interventions. Trading in RMB Bonds may be suspended without warning and for lengthy periods. Information on such trading suspensions, including as to their expected length, may be unavailable. Securities affected by trading suspensions may be or become illiquid. In recent years, Chinese entities have incurred significant levels of debt and Chinese financial institutions currently hold relatively large amounts of non-performing debt. Thus, there exists a possibility that widespread defaults could occur, which could trigger a financial crisis, freeze Chinese debt and finance markets and make certain Chinese securities illiquid.
In addition, trade relations between the U.S. and China have recently been strained. Worsening trade relations between the two countries could adversely impact the Fund, particularly to the extent that the Chinese government restricts foreign investments in on-shore Chinese companies or the U.S. government restricts investments by U.S. investors in China including by limiting the ability of Chinese issuers to list on the U.S. exchanges. Worsening trade relations may also result in market volatility and volatility in the price of Fund shares. In addition, the U.S government has imposed restrictions on the ability of U.S. investors to hold and/or acquire securities of certain Chinese companies, which may adversely impact the Fund, may mean that the Fund’s Underlying Index may need to adjust its methodology or could increase tracking error for the Fund.
CONCENTRATION RISK — Because the assets of certain Funds are expected to be concentrated in an industry or group of industries to the extent that the Underlying Index concentrates in a particular industry or group of industries, the Fund is subject to loss due to adverse occurrences that may affect that industry or group of industries or sector. Market conditions, interest rates, and economic, regulatory, or financial developments could significantly affect a single industry or a group of related industries, and the securities of companies in that industry or group of industries could react similarly to these or other developments. Depending on the composition of each Fund’s Underlying Index, the Fund may be subject to principal risks, as outlined in each Fund’s prospectus. Each Fund may have significant exposure to other industries or sectors over time.
CURRENCY RISK — The Funds’ assets will be invested in instruments denominated in foreign currencies and the income received by the Fund may be in foreign currencies. The Fund will compute and expects to distribute its income in U.S. dollars, and the computation of income will be made on the date that the income is earned by the Fund at the foreign exchange rate in effect on that date. The Fund will conduct its foreign currency exchange transactions either on a spot (i.e.,
Notes to Financial Statements/Notes to Consolidated Financial Statements (Unaudited) (continued)
cash) basis at the spot rate prevailing in the foreign currency exchange market at the time the Fund wishes to enter into the transaction, or through forward, futures or options contracts to purchase or sell foreign currencies.
The Fund’s NAV is determined on the basis of the U.S. dollar. The Fund may therefore lose value if the local currency of a foreign investment depreciates against the U.S. dollar, even if the local currency value of the Fund’s holdings goes up. Currency exchange rates can be very volatile and can change quickly and unpredictably, which may adversely affect the Fund. The Fund may also be subject to delays in converting or transferring U.S. dollars to foreign currencies and vice versa. This may adversely affect the Fund’s performance over time.
DERIVATIVES RISK — The use of derivatives (including swaps, futures, forwards, structured notes and options) may involve leverage, which includes risks that are different from, and greater than, the risks associated with investing directly in a reference asset, because a small investment in a derivative can result in a large impact on the Fund and may cause the Fund to be more volatile. Derivatives may at times be highly illiquid, and the Fund may not be able to close out or sell a derivative at a particular time or at an anticipated price. Derivatives can be difficult to value and valuation may be more difficult in times of market turmoil. There may be imperfect correlation between the derivative and that of the reference asset, resulting in unexpected returns that could materially adversely affect the Fund. Certain derivatives (such as swaps and options) are bi-lateral agreements that expose the Fund to counterparty risk, which is the risk of loss in the event that the counterparty to an agreement fails to make required payments or otherwise comply with the terms of derivative. In that case, the Fund may suffer losses potentially equal to, or greater than, the full value of the derivative if the counterparty fails to perform its obligations. That risk is generally thought to be greater with over-the-counter (OTC) derivatives than with derivatives that are exchange traded or centrally cleared. Counterparty risks are compounded by the fact that there are only a limited number of ways available to invest in certain reference assets and, therefore, there may be few counterparties to swaps or options based on those reference assets.
EMERGING MARKETS RISK — A Funds’ investments in emerging markets are subject to greater risk of loss than investments in developed markets. This is due to, among other things, greater market volatility, greater risk of asset seizures and capital controls, lower trading volume, political and economic instability, greater risk of market shutdown and more governmental limitations on foreign investments than typically found in developed markets. The economies of emerging markets, and China in particular, may be heavily reliant upon international trade and may suffer disproportionately if international trading declines or is disrupted.
EQUITY SECURITIES RISK — The values of equity securities are subject to factors such as market fluctuations, changes in interest rates and perceived trends in stock prices. Equity securities are subject to volatile changes in value and their values may be more volatile than other asset classes. In the event of liquidation, equity securities are generally subordinate in rank to debt and other securities of the same issuer.
FUTURES STRATEGY RISK — The use of futures contracts is subject to special risk considerations. The primary risks associated with the use of futures contracts include: (a) an imperfect correlation between the change in market value of the reference asset and the price of the futures contract; (b) possible lack of a liquid secondary market for a futures contract and the resulting inability to close a futures contract when desired; (c) losses caused by unanticipated market movements, which are potentially unlimited; (d) the inability to predict correctly the direction of market prices, interest rates, currency exchange rates and other economic factors; and (e) if the Fund has insufficient
Notes to Financial Statements/Notes to Consolidated Financial Statements (Unaudited) (continued)
cash, it may have to sell securities or financial instruments from its portfolio to meet daily variation margin requirements, which may lead to the Fund selling securities or financial instruments at a loss.
LIQUIDITY RISK — Certain of the Funds’ investments are subject to liquidity risk, which exists when an investment is or becomes difficult to purchase or sell at a reasonable time and price. If a transaction is particularly large or if the relevant market is or becomes illiquid, it may not be possible to initiate a transaction or liquidate a position, which may cause the Funds to suffer significant losses and difficulties in meeting redemptions. Liquidity risk may be the result of, among other things, market turmoil, the reduced number and capacity of traditional market participants, or the lack of an active trading market. Markets for securities or financial instruments could be disrupted by a number of events, including, but not limited to, an economic crisis, natural disasters, new legislation or regulatory changes inside or outside the U.S. Liquid investments may become less liquid after being purchased by the Fund, particularly during periods of market stress. In addition, if a number of securities held by the Fund stop trading, it may have a cascading effect and cause the Fund to halt trading. Volatility in market prices will increase the risk of the Fund being subject to a trading halt. Certain countries in which the Fund may invest may be subject to extended settlement delays and/or foreign holidays, during which the Fund will unlikely be able to convert holdings to cash.
MARKET RISK — The values of the Fund’s holdings could decline generally or could underperform other investments. In addition, there is a risk that policy changes by the U.S. Government, Federal Reserve, and/or other government actors could cause volatility in global financial markets, negative sentiment and higher levels of Fund redemptions, which could have a negative impact on the Fund and could result in losses. Geopolitical and other risks, including environmental and public health risks may add to instability in world economies and markets generally. Changes in value may be temporary or may last for extended periods. Further, the Fund is susceptible to the risk that certain investments may be difficult or impossible to sell at a favorable time or price. Market developments may also cause the Fund’s investments to become less liquid and subject to erratic price movements. Such market developments may also cause the Fund to encounter difficulties in timely honoring redemptions, especially if market events cause an increased incidence of shareholder redemptions.
NEW FUND RISK — If the Fund does not grow in size, it will be at greater risk than larger funds of wider bid-ask spreads for its shares, trading at a greater premium or discount to NAV, liquidation and/or a stop to trading.
NON-DIVERSIFIED FUND RISK — Because a Fund is non-diversified and may invest a greater portion of its assets in fewer issuers than a diversified fund, changes in the market value of a single portfolio holding could cause greater fluctuations in the Fund’s share price than would occur in a diversified fund. This may increase the Fund’s volatility and cause the performance of a single portfolio holding or a relatively small number of portfolio holdings to have a greater impact on the Fund’s performance.
VALUATION RISK — Independent market quotations for the non-U.S. securities held by the Funds may not be readily available and such securities may be fair valued by a pricing service at an evaluated price. These valuations involve subjectivity and different market participants may assign different prices to the same investment. As a result, there is a risk that a Fund may not be able to
Notes to Financial Statements/Notes to Consolidated Financial Statements (Unaudited) (concluded)
sell an investment at the price assigned to the investment by the Fund. In addition, the securities in which the Funds invest may trade on days that the Funds do not price their shares; as a result, the value of Fund shares may change on days when investors cannot purchase or sell their holdings.
9. INDEMNIFICATIONS
In the normal course of business, the Funds enter into contracts that provide general indemnifications. The Funds’ maximum exposure under these arrangements is dependent on future claims that may be made against the Funds and, therefore, cannot be established; however, based on experience, the risk of loss from such claims is considered remote.
10. SUBSEQUENT EVENTS
The Funds have evaluated the need for additional disclosures and/or adjustments resulting from subsequent events through the date the financial statements were issued.
Based on this evaluation, no additional disclosures or adjustments were required to the financial statements as of the date the financial statements were issued.
Approval of Advisory Agreement and Sub-Advisory Agreements (Form N-CSRS Item 11) (Unaudited)
Approval of the Existing Advisory Agreement and Sub-Advisory Agreements
At a meeting held on May 22-23, 2024, the Board of Trustees (the “Board”) of KraneShares Trust (the “Trust”), including a majority of the Trustees who are not “interested persons” of the Trust, as that term is defined in the Investment Company Act of 1940, as amended (the “Independent Trustees”), approved renewal of:
| ● | the existing investment advisory agreement (the “KFA Agreement”) between Krane Funds Advisors, LLC (“Krane”) and the Trust on behalf of each of the following separate series of the Trust (collectively, the “Funds”): |
| ● | KraneShares CSI China Internet ETF (“KWEB”) |
| ● | KraneShares Bosera MSCI China A 50 Connect Index ETF (“KBA”) |
| ● | KraneShares MSCI All China Index ETF (“KALL”) |
| ● | KraneShares MSCI One Belt One Road Index ETF (“OBOR”) |
| ● | KraneShares Emerging Markets Consumer Technology Index ETF (“KEMQ”) |
| ● | KraneShares MSCI China Clean Technology Index ETF (“KGRN”) |
| ● | KraneShares Electric Vehicles & Future Mobility Index ETF (“KARS”) |
| ● | KraneShares MSCI All China Health Care Index ETF (“KURE”) |
| ● | KraneShares Asia Pacific High Income USD Bond ETF (“KHYB”) |
| ● | KraneShares MSCI Emerging Markets ex China Index ETF (“KEMX”) |
| ● | KraneShares Value Line® Dynamic Dividend Equity Index ETF (“KVLE”) |
| ● | KraneShares Mount Lucas Managed Futures Index Strategy ETF (“KMLM”) |
| ● | KraneShares SSE STAR Market 50 Index ETF (“KSTR”) |
| ● | KraneShares Hang Seng TECH Index ETF (“KTEC”) |
| ● | the existing sub-advisory agreement (the “Bosera Agreement”) between Bosera Asset Management (International) Co., Ltd. (“Bosera”) and Krane, on behalf of KBA and KSTR; |
| ● | the existing sub-advisory agreement (the “Mount Lucas Agreement”) between Mount Lucas Index Advisers LLC (“Mount Lucas”) and Krane on behalf of KMLM; and |
| ● | the existing sub-advisory agreement (the “Nikko Agreement”) between Nikko Asset Management Americas Inc. (“Nikko”) and Krane on behalf of KHYB. |
Bosera, Mount Lucas and Nikko are referred to collectively herein as the “Sub-Advisers.” The Bosera Agreement, the Mount Lucas Agreement and the Nikko Agreement are referred to collectively herein as the “Sub-Advisory Agreements,” and the Sub-Advisory Agreements and the KFA Agreement are collectively referred to as the “Agreements.”
In advance of the meeting, and at a separate meeting of the Independent Trustees in executive session held on May 22, 2024, the Board received and considered information provided by Krane in response to the Independent Trustees’ written requests for information relating to the Board’s
Approval of Advisory Agreement and Sub-Advisory Agreements (Form N-CSRS Item 11) (Unaudited) (continued)
consideration of the KFA Agreement with respect to each of the Funds. The Board also considered information provided by each Sub-Adviser in response to separate written requests for information directed to each Sub-Adviser.
The Board considered that its evaluation process with respect to Krane and each Sub-Adviser is an ongoing one, and the Board considers information at each of its regularly scheduled meetings related to, among other matters, the services provided to each Fund by Krane and (as applicable) a Sub-Adviser. The Board also receives additional information from Krane outside of the regularly scheduled Board meetings, including at executive sessions held by the Independent Trustees.
In evaluating the Agreements with respect to each Fund, the Board considered, among other matters: (1) the nature, extent, and quality of the services provided to the Fund by Krane and, if applicable, by its respective Sub-Adviser; (2) the compensation paid by the Fund under the KFA Agreement; (3) the costs of the services provided by Krane and the profitability of Krane with respect to its relationship with the Fund; (4) the extent to which economies of scale could be realized as the Fund grows and whether the unitary fee charged to the Fund under the KFA Agreement will enable investors in the Fund to share in any such economies of scale; and (5) other benefits Krane and the Sub-Advisers receive from their respective relationships with the Funds.
| A. | Nature, Extent and Quality of Services |
Based on written and oral reports received by the Board prior to and at the May 22, 2024 executive session of the Independent Trustees and the May 22-23, 2024 meeting of the Board, the Board considered the nature, quality, and extent of the overall services provided by Krane and the Sub-Advisers under the Agreements. The Board considered the responsibilities of Krane with respect to each Fund under the KFA Agreement, including its obligation to oversee the services provided by the Sub-Advisers, as applicable. The Board also discussed the nature, quality and extent of services provided by Bosera under the Bosera Agreement, Mount Lucas under the Mount Lucas Agreement and Nikko under the Nikko Agreement.
The KFA Agreement
| ● | The Board took note of the qualifications, background and responsibilities of Krane’s senior personnel who provide services to the Funds managed directly by Krane and also considered the expertise of Krane personnel charged with oversight of the Sub-Advisers. |
| ● | The Board recognized that Krane has invested and continues to invest significant time and effort in structuring the Trust and the Funds. The Board noted that Krane, together with the Sub-Advisers (as applicable), is responsible for assessing the market appeal and the investment strategy of each Fund, and that Krane continues to seek to create new series of the Trust that address unique investment strategies. The Board considered the entrepreneurial risk assumed by Krane with respect to the Trust and Funds. |
| ● | The Board also took note that Krane had recommended the termination of several underperforming series of the Trust during the prior calendar year, eliminating the need for Krane personnel to manage investments, operations and compliance for such series. |
| ● | The Board considered that Krane is responsible for arranging and overseeing service providers for the Trust. |
| ● | The Board also considered that Krane has established and oversees the operation of a securities lending program for certain Funds and noted that the Board receives a quarterly |
Approval of Advisory Agreement and Sub-Advisory Agreements (Form N-CSRS Item 11) (Unaudited) (continued)
report of securities lending activities and the effect of such program on participating Funds.
| ● | The Board noted that Krane continues to evaluate its existing compliance and operational staff, as well as its investment personnel, and that Krane continually seeks to hire and retain qualified and experienced staff in these areas and to invest in additional resources as its business continues to grow. The Board noted the increase in compliance and operational personnel at Krane and Krane’s investment in technology to facilitate oversight of various compliance matters. |
| ● | The Board considered the financial condition of Krane and noted that Krane is a subsidiary in a larger family of investment management firms with significant resources. |
The Bosera Agreement
| ● | The Board took note of the significant experience of KBA’s portfolio management team with respect to investments in mainland China and access to the China A Share market. The Board noted KBA’s favorable performance against its Morningstar peer group for the 3- and 5- year time periods, in part due to the relative outperformance of A shares compared to the broader China markets due to regulatory headwinds for offshore-listed companies during those periods. |
| ● | With respect to KSTR, the Board noted Bosera’s access to the SSE Science and Technology Innovation Board (STAR Market), which is focused on innovative, pre-profit technology companies. The Board considered the experience of the KSTR portfolio management team with respect to investments in mainland China technology companies, and noted that although KSTR’s performance against its peer group was lower than the median for the 1-year and 3-year time periods, Krane attributed this to launching KSTR during a period of high IPO activity and high valuations. |
| ● | The Board considered the continued development of Bosera’s compliance function and its long-term relationship with the Adviser. |
The Mount Lucas Agreement
| ● | The Board took note of the experience of Mount Lucas and its portfolio staff with respect to managed futures and recognized their involvement in KMLM’s derivative risk management program. |
| ● | The Board noted that the KMLM structure provides non-institutional investors with access to a managed futures portfolio that can provide uncorrelated returns. In particular, the Board considered that KMLM targets to reduce the impact of equities and to offer diversification to its investors. |
The Nikko Agreement
| ● | The Board noted that investors in KHYB have access to a portfolio managed by one of the largest asset management firms in Asia with significant experience managing fixed income portfolios in Japan and across Asia. |
| ● | The Board considered that KHYB invests primarily in high-yield bonds across the Asia Pacific region. |
| ● | The Board considered Nikko’s and Krane’s explanation that KHYB’s recent below-median performance resulted largely from a lack of exposure to large real estate developers in China. |
Approval of Advisory Agreement and Sub-Advisory Agreements (Form N-CSRS Item 11) (Unaudited) (continued)
The Board noted that it considers the performance of each operational Fund versus an identified Morningstar peer group at each regular meeting of the Board. At the Meeting, the Board considered each Fund’s performance versus its Morningstar peer group, as well as a select group of competitors identified by Krane and, in certain cases, a second peer group curated to better reflect the strategy of a particular Fund. The Board recognized that many of the Funds are in the same Morningstar peer group because they have significant exposure to China, notwithstanding meaningful differences in the Funds’ underlying indexes and investment strategies. The Board noted the limitations of comparisons versus such large and undifferentiated peer groups, considering that the Funds offer shareholders access to unique investment opportunities, particularly in China.
The Board noted that several of the Funds are actively managed, and it considered that the performance of each actively managed Fund relative to its respective peer group is an appropriate measurement of performance. With respect to those Funds that passively track the performance of an underlying index, however, the Board determined that, although relative performance to a peer group should be considered, the tracking error and/or the tracking difference of each Fund against its underlying index was a more meaningful representation of each Fund’s performance. The Board considered that, at each meeting of the Board, it receives and considers tracking error reports for each passively managed Fund.
The Board noted that each passively managed Fund tracked its benchmark within expected ranges over the last year. The Board observed that the largest contributors to tracking error were adjustments to the portfolios as a result of changes to the underlying benchmarks due to Presidential Executive Order 13959 - Addressing the Threat from Securities Investments That Finance Certain Companies of the People’s Republic of China, portfolio sampling and portfolio rebalancing associated with meeting the portfolio diversification requirements under the IRS code.
The Board noted the following with respect to the performance of certain funds relative to their identified peer groups:
| ● | KWEB: The Board noted that KWEB’s 3- and 5-year returns were below the median for its Morningstar performance peer group due to a period of significant volatility in shares of China internet companies resulting primarily from regulatory headwinds during those periods, including the Holdings Foreign Companies Accountable Act (HFCAA) in the United States and new anti-monopoly rules in China. The Board recognized that KWEB’s 1-year return is above the median of its performance peer group as such regulatory headwinds have been dissipating. |
| ● | KBA: The Board noted that KBA underperformed against the median for its Morningstar performance peer group for the 1-year period ended March 31, 2023, because the improving regulatory environment in China resulted in improved performance of offshore listed companies versus the China A-shares market. The Board also considered that KBA invests solely in the China A-share market and its Morningstar peer group is the China Region Category, which includes broader and thematic China ETFs. |
| ● | KSTR: The Board noted that KSTR’s 1-year, 3-year, and since inception performance is lower than the median of the Morningstar peer group because the fund launched during a period of high IPO activity and high valuations for the STAR Market. The Board also considered that KSTR invests solely in the top 50 largest and most liquid companies listed on China’s STAR Board market, which is focused on innovative, pre-profit technology companies, while its Morningstar peer group is the China Region Category, which includes larger capitalization, broader and |
Approval of Advisory Agreement and Sub-Advisory Agreements (Form N-CSRS Item 11) (Unaudited) (continued)
thematic China ETFs.
| ● | KHYB: With respect to the long-term relative underperformance of KHYB, which is an actively managed Fund, against the median of its Morningstar peer group, the Board noted that the Fund’s long-term performance metrics include performance prior to August 2021 when KHYB invested solely in China. Additionally, the Board recognized that KHYB’s below median performance resulted primarily from the significant re-rating of the debt of many of China’s largest real estate developers, from which KHYB has largely divested. |
| ● | KEMQ: The Board recognized that the underperformance of KEMQ measured against its Morningstar peer group median for the 1-year, 3-year and since inception periods was partially due to market volatility in the emerging markets internet sector, especially the China internet sector. The Board also noted that regulatory uncertainty, from both China and the U.S., and slowing consumer spending contributed to performance issues overall in the technology sector. |
| ● | KURE: The Board noted that KURE underperformed versus the median of its Morningstar peer group for the 1-year, 3-year and 5-year periods ended March 31, 2024, partially due to uncertainty stemming from regulatory changes, including the expansion of the central government’s procurement for drugs and medical devices and an anti-graft campaign focused on health care product distribution. |
| ● | OBOR: The Board noted that OBOR seeks to capture the economic growth and monetize the potential upside for companies involved in China’s One Belt One Road initiative. The Board considered that OBOR’s 1-year, 3-year and 5-year returns are below the median of its Morningstar peer group due to its exposure to China, which has generally underperformed after the pandemic. |
| ● | KVLE: The Board noted that, although KVLE has performed in line with its Morningstar peer group median since inception, its 1-year performance is below the median. The Board considered that KVLE is underweight in the financial sector and overweight in utilities, and that these relative weightings had a negative impact on KVLE’s performance. |
The Board also considered other factors, including the use of fair value pricing by the Funds and the Funds’ asset inflows and outflows, which affect the performance of the Funds but not their underlying indices. The Board considered that these factors can be expected to primarily affect the Funds’ tracking error.
The Board considered that, pursuant to the KFA Agreement, Krane has agreed to a unitary advisory fee arrangement for each Fund. Under the unitary fee arrangement, Krane is responsible for paying most of the expenses incurred by a Fund, including those of its principal service providers and Sub-Adviser (if applicable). The Board considered the information provided by Krane regarding the amounts it pays to the Funds’ service providers under the unitary fee arrangement. The Board reviewed and considered the fees paid by each Fund in light of the nature, quality and extent of the services provided or obtained by Krane. The Board also considered that Krane has agreed to fee waivers on certain Funds and considered the net expense ratios of the currently operational Funds compared to those of their Morningstar peer groups.
The Board noted that the management fees paid by many of the Funds are higher than the median management fee within their respective Morningstar peer groups and that the total expense ratios of many Funds are managed through the use of fee waivers. The Board considered
Approval of Advisory Agreement and Sub-Advisory Agreements (Form N-CSRS Item 11) (Unaudited) (continued)
that the Morningstar peer groups for many of the Funds do not reflect the unique exposure and thematic approach of the Funds and considered that the Funds’ total expense ratios are generally consistent with those of their direct peers. The Board considered that Krane applies a methodical and consistent approach to pricing the Funds and conducts significant competitive research with respect to such pricing. The Board considered that the Funds offer unique investment exposure for investors in U.S. registered funds and considered the operational costs incurred by Krane under the unitary fee structure. The Board also considered the effect of each Fund’s assets under management on its net expense ratio.
Although the Board received information regarding the fees paid to the Sub-Advisers under the Sub-Advisory Agreements, the Board noted the arm’s-length nature of the relationship between Krane and the Sub-Advisers with respect to the negotiation of sub-advisory fee rates. The Board also considered that Krane (and not the Funds) pays each Sub-Adviser’s fees.
| D. | Costs and Profitability |
The Board reviewed a report of Fund-by-Fund profitability prepared by Krane. The Board noted that it had retained an independent third-party to review Krane’s profitability methodology and that it had the opportunity to discuss with the consultant Krane’s profitability methodology and the consultant’s views regarding the level of profitability reported by Krane versus the limited amount of publicly available information regarding the profitability of other closely held registered investment advisers.
The Board noted that Krane continues to waive fees for some of the Funds. The Board also considered that, although Krane is profitable, it was not making a profit from its relationship with all of the Funds under the KFA Agreement. The Board considered Krane’s commitment to the success of each of the Funds and the use of a unitary fee structure under which Krane bears the risk if certain expenses increase or if a Fund’s assets fail to increase to a level sufficient to cover such expenses. The Board recognized that the volatility in asset flows experienced by the Trust overall can directly and materially affect Krane’s profitability. The Board also considered that Krane has established a securities lending program for the benefit of certain of the Funds, and that fees earned by Krane from such Funds can affect the profitability of such Funds to Krane.
The Board considered the effect of each Fund’s assets under management on the potential profitability of such Fund under the unitary fee structure in light of the costs associated with the personnel, systems and equipment necessary to manage the Fund and to meet the regulatory and compliance requirements of the SEC and other regulatory bodies, as well as other expenses Krane pays in accordance with the KFA Agreement.
The Board did not consider information regarding the costs of services provided or profits realized by the Sub-Advisers from their relationships with the applicable Funds, noting the arm’s-length nature of the relationship between Krane and each Sub-Adviser with respect to the negotiation of the sub-advisory fee rate on behalf of the relevant Fund. The Board considered that Krane, and not a Fund, is responsible for paying the sub-advisory fees under each Sub-Advisory Agreement.
Approval of Advisory Agreement and Sub-Advisory Agreements (Form N-CSRS Item 11) (Unaudited) (continued)
The Board considered the extent to which Krane could derive ancillary benefits from the Funds’ operations, including benefits to Krane as a result of its ability to use the assets of certain Funds to engage in soft dollar transactions and the existence of a securities lending program for certain Funds. The Board did not observe any other potential benefits to be realized by Krane from its relationship with the Funds.
The Board considered that each Fund is managed by Krane pursuant to a unitary fee advisory agreement, pursuant to which Krane bears all of the Fund’s expenses until it gathers sufficient assets under management to, in effect, pay its own costs. As a result, the Board observed, Krane typically subsidizes each Fund for a period of time following its inception. The Board also considered that Krane continues to reinvest a significant portion of its profits in its business, including through the addition of compliance and operations personnel and investment in new compliance systems, and that any economies of scale are shared with the Funds in this manner. The Board determined to continue monitoring for potential economies of scale, but concluded that, at present, they were not a material factor for the Board to consider in connection with the renewal of the KFA Agreement.
The Board did not identify any single factor as being of paramount importance to its review, and different Trustees may have given different weight to different factors in their review of the Agreements. The Board reviewed a memorandum from Independent Trustee counsel and met separately with Independent Trustee counsel to discuss the information provided by Krane and the Sub-Advisers, as well as the legal standards and judicial precedent applicable to its consideration of the Agreements. The Board noted that, as in the past, it will continue to monitor the Funds at its regular meetings, during executive sessions of the Independent Trustees and outside of the Board meetings. Based on its review, including consideration of each of the factors referenced above, the Board determined, in the exercise of its reasonable business judgment, that the advisory arrangements, as outlined in the Agreements, were reasonable in light of the factors considered by the Board.
Approval of Advisory Agreement and Sub-Advisory Agreements (Form N-CSRS Item 11) (Unaudited) (continued)
Approval of Advisory Agreement
At a meeting held on May 22-23, 2024, the Board of Trustees (the “Board”) of KraneShares Trust (the “Trust”), including a majority of the Trustees who are not “interested persons” of the Trust, as that term is defined in the Investment Company Act of 1940, as amended (the “Independent Trustees”), approved the existing investment advisory agreement (the “Advisory Agreement”) between Krane Funds Advisors, LLC (“Krane”) and the Trust, on behalf of a new series of the Trust: KraneShares Sustainable Ultra Short Duration Index ETF (“New Fund”).
In advance of the meeting, and at a separate meeting of the Independent Trustees in executive session held on May 22, 2024, the Board received and considered information provided by Krane in response to the Independent Trustees’ written request for information regarding the New Fund and the Advisory Agreement.
The Board noted that it considers information at each of its regularly scheduled meetings related to, among other matters, the services provided by Krane to each series of the Trust. The Board recognized that, going forward, such information will include information related to the New Fund after it is operational. The Board also considered that the Independent Trustees receive additional information outside of regularly scheduled Board meetings and at executive sessions held by the Independent Trustees. As a result, the Board considered that its evaluation process with respect to advisory services provided to the New Fund will be an ongoing one.
In evaluating the Advisory Agreement with respect to the New Fund, the Board considered, among other matters: (1) the nature, extent, and quality of the services to be provided to the New Fund by Krane; (2) the proposed compensation to be paid by the New Fund under the Advisory Agreement and any related fee waivers or expense caps; (3) the estimated costs of the services to be provided by Krane and the profitability expectations of Krane with respect to its relationship with the New Fund; (4) the extent to which economies of scale could be realized as the New Fund grows and whether the unitary fee charged under the Advisory Agreement will enable investors in the New Fund to share in any such economies of scale; and (5) other benefits Krane anticipates it may receive from its relationship with the New Fund.
| A. | Nature, Extent and Quality of Services |
Based on written and oral reports received by the Board prior to and at the May 22, 2024 executive session of the Independent Trustees and the May 22-23, 2024 meeting of the Board, the Board considered the nature, quality, and extent of the overall services to be provided by Krane to the New Fund under the Advisory Agreement.
With respect to the New Fund, the Board noted that the proposed strategy would track the Solactive ISS Sustainable Select 0-1 Year USD Corporate IG Index, which is designed to measure the performance of US dollar-denominated, investment-grade corporate debt with a maturity of up to one year. The Board considered management’s representation that the New Fund will offer sustainably conscious investors exposure to high-quality, short-term corporate bonds. The Board noted that the index is comprised of a portfolio that is based on Institutional Shareholder Services (ISS) climate analysis and alignment with the Paris agreement’s 1.5°C scenario by 2050, while providing a distribution of credit and interest rate risk that is similar to commonly used ultra short duration, investment grade bond benchmarks. The Board considered Krane’s representation that this strategy will offer a risk premium and potentially higher yield than money market funds and a low correlation to traditional fixed income investments.
Approval of Advisory Agreement and Sub-Advisory Agreements (Form N-CSRS Item 11) (Unaudited) (continued)
The Board recognized that Krane invests significant time and effort in structuring new series of the Trust, including the New Fund. The Board considered Krane’s evaluation of the market appeal for the New Fund and considered that Krane worked with the Trust’s service providers to manage the administrative and other requirements for the New Fund. The Board considered that Krane continually evaluates its existing compliance, operational and investment teams and that Krane has consistently sought to retain qualified and experienced staff in these areas as its business has grown. The Board considered Krane’s current ownership structure, financial strength and long-term strategic plans, and noted that Krane is subsidiary in a family of investment management firms with significant resources, including administrative resources utilized by Krane.
The Board noted that, because the New Fund has not yet commenced investment operations, it has no investment performance. The Board considered that once the New Fund commences operations, the Board will receive regular reports regarding the performance of the New Fund relative to a Morningstar peer group, as well as a select group of peers identified by Krane. The Board also considered that at its regular meetings it will receive information regarding the performance of the New Fund against the performance of its respective underlying index. The Board recognized that there are limited peers available for the New Fund.
The Board considered that, pursuant to the Advisory Agreement, Krane will enter into a unitary advisory fee arrangement for the New Fund. The Board also considered that Krane structured the proposed fee for the New Fund in a manner that is consistent with other series of the Trust. The Board took note that under the unitary fee arrangement, Krane will be responsible for paying most of the expenses incurred by the New Fund, including those of its principal service providers, and that Krane takes the risk that the New Fund may not be successful in raising sufficient assets to enable Krane to cover the cost of such expenses.
The Board considered the proposed fee for the New Fund compared to its respective Morningstar peer group, noting that the proposed management fee for the New Fund is higher than the median of its peer group. The Board noted, however, that the total expense ratio for the New Fund is in line with or slightly lower than the median expense ratio for its respective peer group.
| D. | Costs and Profitability |
The Board considered pro-forma projected profit and loss statements for the New Fund. The Board recognized that, because the New Fund has not yet launched, it is difficult to estimate how profitable it will be to Krane, although the Board recognized that the New Fund will leverage procedures and systems put in place in connection with management of other series of the Trust. The Independent Trustees also considered information from Krane regarding its overall profitability and discussed with Krane’s management how launching the New Fund could impact such profitability. The Board noted Krane’s continuing commitment to operating the Trust and its continued use of a unitary fee structure under which it will bear many of the expenses of the New Fund. Based on these and other considerations, the Board concluded that the profitability of the New Fund was not a material factor in its consideration of the Advisory Agreement.
Approval of Advisory Agreement and Sub-Advisory Agreements (Form N-CSRS Item 11) (Unaudited) (continued)
The Board considered the extent to which Krane could derive ancillary benefits from the operations of the New Fund. The Board considered that Krane would benefit if the New Fund would participate in the Trust’s securities lending program and whether Krane would benefit as a result of its ability to use the New Fund’s assets to engage in soft dollar transactions.
The Board considered whether Krane would realize economies of scale with respect to its services as the New Fund grows, including the extent to which this is reflected in the level of fees to be paid by the New Fund. The Board noted that the proposed advisory fees for the New Fund do not include breakpoints, and considered that it is not possible—before the commencement of investment operations—to accurately evaluate potential economies of scale. The Board also noted that Krane continues to reinvest a portion of its profits in its business, including through the enhancement of its compliance, operations and investment infrastructure, and that any economies of scale could be shared with the New Fund in this manner. Based on these and other considerations, including that the New Fund is newly organized, the Board considered economies of scale not to be a material factor in its consideration of the Advisory Agreement.
The Board did not identify any single factor as being of paramount importance, and different Trustees may have given different weight to different factors in their review of the Advisory Agreement. The Board reviewed a memorandum from Independent Trustee counsel discussing the legal standards and judicial precedent applicable to its consideration of the Advisory Agreement. The Board noted that, consistent with its approach to other series of the Trust, it will continue to monitor the New Fund at its regular meetings, during executive sessions of the Independent Trustees and outside of the Board meetings. Based on its review, including consideration of each of the factors referenced above, the Board determined, in the exercise of its reasonable business judgment, that the advisory arrangements, as outlined in the Advisory Agreement, were reasonable in light of the factors considered by the Board.
Approval of Advisory Agreement and Sub-Advisory Agreements (Form N-CSRS Item 11) (Unaudited) (continued)
Approval of Advisory Agreement
At a meeting held on March 6-7, 2024, the Board of Trustees (the “Board”) of KraneShares Trust (the “Trust”), including a majority of the Trustees who are not “interested persons” of the Trust, as that term is defined in the Investment Company Act of 1940, as amended (the “Independent Trustees”), approved the existing investment advisory agreement (the “Advisory Agreement”) between Krane Funds Advisors, LLC (“Krane”) and the Trust, on behalf of a new series of the Trust: KraneShares Artificial Intelligence and Technology ETF (“New Fund”). The Board also considered and approved a proposed new sub-advisory agreement (“Sub-Advisory Agreement”) between KFA, on behalf of the New Fund, and Etna Capital Management Company Limited (“Etna” or “Sub-Adviser”). The Advisory Agreement and the Sub-Advisory Agreement are referred to collectively as the “Agreements.”
In advance of the meeting, and at a separate meeting of the Independent Trustees in executive session held on March 6, 2024, the Board received and considered information provided by Krane and the Sub-Adviser in response to the Independent Trustees’ written requests for information regarding the New Fund and the Agreements.
The Board noted that it considers information at each of its regularly scheduled meetings related to, among other matters, the services provided by Krane to each series of the Trust and services provided by sub-advisers, such as Etna, to particular series of the Trust. The Board recognized that, going forward, such information will include information related to the New Fund after it is operational. The Board also considered that the Independent Trustees receive additional information outside of regularly scheduled Board meetings and at executive sessions held by the Independent Trustees. As a result, the Board considered that its evaluation process with respect to advisory and sub-advisory services provided to the New Fund will be an ongoing one.
In evaluating the Agreements with respect to the New Fund, the Board considered, among other matters: (1) the nature, extent, and quality of the services to be provided to the New Fund by Krane and to Krane by the Sub-Adviser; (2) the proposed compensation to be paid by the New Fund under the Advisory Agreement and any related fee waivers or expense caps, and the proposed compensation to be paid by Krane to the Sub-Adviser of the New Fund; (3) the estimated costs of the services to be provided by Krane and the profitability expectations of Krane with respect to its relationship with the New Fund; (4) the extent to which economies of scale could be realized as the New Fund grows and whether the unitary fee charged under the Advisory Agreement will enable investors in the New Fund to share in any such economies of scale; and (5) other benefits Krane and the Sub-Adviser anticipate they may receive from their relationship with the New Fund.
| A. | Nature, Extent and Quality of Services |
Based on written and oral reports received by the Board prior to and at the March 6, 2024 executive session of the Independent Trustees and the March 6-7, 2024 meeting of the Board, the Board considered the nature, quality, and extent of the overall services to be provided by Krane to the New Fund under the Advisory Agreement. The Board also considered the nature, quality, and extent of the overall services to be provided by Etna to the New Fund. The Board took note of the qualifications, background and responsibilities of personnel at Krane and the Sub-Adviser who will provide services to the New Fund.
With respect to the New Fund, the Board noted that the proposed strategy would combine an approximately 80% allocation to securities making up the Solactive Global Select AI Index with an allocation to private companies in the artificial intelligence (“AI”) space selected and managed
Approval of Advisory Agreement and Sub-Advisory Agreements (Form N-CSRS Item 11) (Unaudited) (continued)
by Etna. The Board considered Krane’s expectation that the allocation to private companies could provide diversification in the portfolio. The Board considered Krane’s representation that this strategy will provide investors a unique investment opportunity by blending well known publicly listed equities with pre-IPO companies operating within the AI ecosystem.
The Board recognized that Krane invests significant time and effort in structuring new series of the Trust, including the New Fund. The Board considered Krane’s evaluation of the market appeal for the New Fund and considered that Krane worked with the Trust’s service providers to manage the administrative and other requirements for the New Fund. The Board considered that Krane continually evaluates its existing compliance, operational and investment teams and that Krane has consistently sought to retain qualified and experienced staff in these areas as its business has grown. The Board considered Krane’s current ownership structure, financial strength and long-term strategic plans, and noted that Krane is part of a family of investment management firms with significant resources, including administrative resources utilized by Krane.
The Board noted that, because the New Fund has not yet commenced investment operations, it has no investment performance. The Board considered that once the New Fund commences operations, the Board will receive regular reports regarding the performance of the New Fund relative to a broad Morningstar peer group, as well as a select group of peers identified by Krane. The Board also considered that at its regular meetings it will receive information regarding the performance of the New Fund against the performance of its respective underlying index. The Board recognized that there are limited peers available for the New Fund.
The Board considered that, pursuant to the Advisory Agreement, Krane will enter into a unitary advisory fee arrangement for the New Fund. The Board also considered that Krane structured the proposed fee for the New Fund in a manner that is consistent with other series of the Trust. The Board took note that under the unitary fee arrangement, Krane will be responsible for paying most of the expenses incurred by the New Fund, including those of its principal service providers, and that Krane takes the risk that the New Fund may not be successful in raising sufficient assets to enable Krane to cover the cost of such expenses.
The Board considered the proposed fee for the New Fund compared to its respective Morningstar universe, noting that the proposed fees and expenses for the New Fund are higher than the median of the peer group.
With respect to the New Fund, the Board considered the New Fund’s unique approach to gaining exposure to private companies in the AI space. The Board considered that there was not a peer group that included directly comparable funds, and that the New Fund’s placement at the top of its peer group’s fee range reflected that many of the peer funds followed a passive strategy of investing in the general technology sector rather than AI specifically. The Board noted the experience and expertise of Etna, the proposed sub-adviser.
The Board considered that Krane structured the proposed fee for the New Fund in a manner that is consistent with the other thematic series of the Trust. The Board noted that under the unitary fee arrangement, Krane will be responsible for paying most of the expenses incurred by the New Fund,
Approval of Advisory Agreement and Sub-Advisory Agreements (Form N-CSRS Item 11) (Unaudited) (continued)
including those of its principal service providers. The Board considered that, under the unitary fee structure, Krane takes the risk that the New Fund may not be successful in raising sufficient assets to enable Krane to cover the cost of such expenses.
| D. | Costs and Profitability |
The Board considered pro-forma projected profit and loss statements for the New Fund. The Board recognized that, because the New Fund has not yet launched, it is difficult to estimate how profitable it will be to Krane, although the Board recognized that the New Fund will leverage procedures and systems put in place in connection with management of other series of the Trust. The Independent Trustees also considered information from Krane regarding its overall profitability and discussed with Krane’s management how launching the New Fund could impact such profitability. The Board noted Krane’s continuing commitment to operating the Trust and its continued use of a unitary fee structure under which it will bear many of the expenses of the New Fund. Based on these and other considerations, the Board considered that the profitability of the New Fund was not a material factor in its consideration of the Advisory Agreement.
The Board considered the extent to which Krane could derive ancillary benefits from the operations of the New Fund. The Board considered that Krane would benefit if the New Fund would participate in the Trust’s securities lending program and whether Krane would benefit as a result of its ability to use the New Fund’s assets to engage in soft dollar transactions.
The Board considered whether Krane would realize economies of scale with respect to its services as the New Fund grows, including the extent to which this is reflected in the level of fees to be paid by the New Fund. The Board noted that the proposed advisory fees for the New Fund do not include breakpoints, and considered that it is not possible—before the commencement of investment operations—to accurately evaluate potential economies of scale. The Board also noted that Krane continues to reinvest a portion of its profits in its business, including through the evolution of its compliance, operations and investment infrastructure, and that any economies of scale could be shared with the New Fund in this manner. Based on these and other considerations, including that the New Fund is newly organized, the Board considered economies of scale not to be a material factor in its consideration of the Advisory Agreement.
The Board did not identify any single factor as being of paramount importance, and different Trustees may have given different weight to different factors in their review of the Agreements. The Board reviewed a memorandum from Independent Trustee counsel discussing the legal standards and judicial precedent applicable to its consideration of the Agreements. The Board noted that, consistent with its approach to other series of the Trust, it will continue to monitor the New Fund at its regular meetings, during executive sessions of the Independent Trustees and outside of the Board meetings. Based on its review, including consideration of each of the factors referenced above, the Board determined, in the exercise of its reasonable business judgment, that the advisory arrangements, as outlined in the Agreements, were reasonable in light of the factors considered by the Board.
Approval of Advisory Agreement and Sub-Advisory Agreements (Form N-CSRS Item 11) (Unaudited) (continued)
Approval of Advisory Agreement
At a meeting held on December 6-7, 2023, the Board of Trustees (the “Board”) of KraneShares Trust (the “Trust”), including a majority of the Trustees who are not “interested persons” of the Trust, as that term is defined in the Investment Company Act of 1940, as amended (the “Independent Trustees”), approved the existing investment advisory agreement (the “Advisory Agreement”) between Krane Funds Advisors, LLC (“Krane”) and the Trust, on behalf of a new series of the Trust: KraneShares China Alpha Index ETF (“New Fund”). In advance of the meeting, and at a separate meeting of the Independent Trustees in executive session held on December 6, 2023, the Board received and considered information provided by Krane in response to the Independent Trustees’ written request for information regarding the New Fund and the Advisory Agreement.
The Board noted that it considers information at each of its regularly scheduled meetings related to, among other matters, the services provided by Krane to each series of the Trust, and that, going forward, such information will include information related to the New Fund after it is operational. The Board considered that the Independent Trustees also receive additional information outside of regularly scheduled Board meetings and at executive sessions held by the Independent Trustees. As a result, the Board considered that its evaluation process with respect to Krane and each series of the Trust is an ongoing one.
In evaluating the Advisory Agreement with respect to the New Fund, the Board considered, among other matters: (1) the nature, extent, and quality of the services to be provided to the New Fund by Krane; (2) the proposed compensation to be paid by the New Fund under the Advisory Agreement; (3) the estimated costs of the services to be provided by Krane and the profitability expectations of Krane with respect to its relationship with the New Fund; (4) the extent to which economies of scale could be realized as the New Fund grows and whether the unitary fee charged under the Advisory Agreement will enable investors in the New Fund to share in any such economies of scale; and (5) other benefits Krane anticipates it may receive from its relationship with the New Fund.
| A. | Nature, Extent and Quality of Services |
Based on written and oral reports received by the Board prior to and at the December 6, 2023 executive session of the Independent Trustees and December 6-7, 2023 meeting of the Board, the Board considered the nature, quality, and extent of the overall services to be provided by Krane to the New Fund under the Advisory Agreement. The Board took note of the qualifications, background and responsibilities of Krane personnel who will provide services to the New Fund.
The Board considered that the New Fund will provide investors with a unique, systematic approach to active management among China A Share securities. The Board considered that the New Fund’s investments will be identified using a methodology that leverages artificial intelligence (“AI”) engines to combine back-testing and out-of-sample analysis. The Board considered management’s view that providing a systematic, AI-driven framework can be complementary to existing investment approaches that rely on purely passive investments or fundamental active strategies.
The Board recognized that Krane invests significant time and effort in structuring new series of the Trust, including the New Fund. The Board considered Krane’s evaluation of the market appeal for the New Fund and considered that Krane worked with the Trust’s service providers to manage the administrative and other requirements for the New Fund. The Board considered that Krane continually evaluates its existing compliance, operational and investment teams and that Krane has consistently sought to retain qualified and experienced staff in these areas as its business has
Approval of Advisory Agreement and Sub-Advisory Agreements (Form N-CSRS Item 11) (Unaudited) (continued)
grown. The Board considered Krane’s current ownership structure, financial strength and long-term strategic plans, and noted that Krane is part of a family of investment management firms with significant resources, including administrative resources utilized by Krane.
The Board noted that, because the New Fund has not yet commenced investment operations, it has no investment performance. The Board considered that once the New Fund commences operations, the Board will receive regular reports regarding the performance of the New Fund relative to a broad Morningstar peer group, as well as a select group of peers identified by Krane. The Board also considered that at its regular meetings it will receive information regarding the performance of the New Fund against the performance of its respective underlying index. The Board considered that there are limited peers available for the New Fund.
The Board considered that, pursuant to the Advisory Agreement, Krane will enter into a unitary advisory fee arrangement for the New Fund. The Board also considered that Krane structured the proposed fee for the New Fund in a manner that is consistent with other series of the Trust. The Board took note that under the unitary fee arrangement, Krane will be responsible for paying most of the expenses incurred by the New Fund, including those of its principal service providers, and that Krane takes the risk that the New Fund may not be successful in raising sufficient assets to enable Krane to cover the cost of such expenses.
The Board considered the proposed fee for the New Fund compared to its respective Morningstar universe, noting that the proposed fees and expenses for the New Fund are higher than the median of the peer group.
With respect to the New Fund, the Board considered Krane’s unique approach to management of the New Fund. The Board noted the time and expense incurred by Krane to use AI to develop custom investment basket for the New Fund, including the need to “train” the AI engine for a set period on data regarding the China A Shares market. The Board noted the results of back testing the proposed model against a representative index and considered the proposed size and concentration of the portfolio.
The Board considered that Krane structured the proposed fee for the New Fund in a manner that is consistent with the other thematic series of the Trust. The Board noted that under the unitary fee arrangement, Krane will be responsible for paying most of the expenses incurred by the New Fund, including those of its principal service providers. The Board noted that, under the unitary fee structure, Krane takes the risk that the New Fund may not be successful in raising sufficient assets to enable Krane to cover the cost of such expenses.
| D. | Costs and Profitability |
The Board considered pro-forma projected profit and loss statements for the New Fund, including the estimated cost of Krane’s services to the New Fund. The Board recognized that, because the New Fund has not yet launched, it is difficult to estimate how profitable it will be to Krane, although the Board recognized that the New Fund will leverage procedures and systems put in place in connection with management of other series of the Trust. The Independent Trustees also considered information from Krane regarding its overall profitability and discussed with Krane’s management
Approval of Advisory Agreement and Sub-Advisory Agreements (Form N-CSRS Item 11) (Unaudited) (concluded)
how launching the New Fund could impact such profitability. The Board noted Krane’s continuing commitment to operating the Trust and its continued use of a unitary fee structure under which it will bear many of the expenses of the New Fund.
The Board considered the extent to which Krane could derive ancillary benefits from the operations of the New Fund. They noted that it was unlikely that the New Fund would participate in the Trust’s securities lending program. The Board also considered whether Krane would benefit as a result of its ability to use the New Fund’s assets to engage in soft dollar transactions.
The Board considered whether Krane would realize economies of scale with respect to its services as the New Fund grows, including the extent to which this is reflected in the level of fees to be paid by the New Fund. The Board noted that the proposed advisory fees for the New Fund do not include breakpoints, and considered that it is not possible—before the commencement of investment operations—to accurately evaluate potential economies of scale. The Board also noted that Krane continues to reinvest a portion of its profits in its business, including through the evolution of its compliance and investment infrastructure, and that any economies of scale could be shared with the New Fund in this manner. Based on these and other considerations, including that the New Fund is newly organized, the Board considered economies of scale not to be a material factor in its consideration of the Advisory Agreement.
The Board did not identify any single factor as being of paramount importance, and different Trustees may have given different weight to different factors in their review of the Advisory Agreement. The Board reviewed a memorandum from Independent Trustee counsel discussing the legal standards and judicial precedent applicable to its consideration of the Advisory Agreement. The Board noted that, consistent with its approach to other series of the Trust, it will continue to monitor the New Fund at its regular meetings, during executive sessions of the Independent Trustees and outside of the Board meetings. Based on its review, including consideration of each of the factors referenced above, the Board determined, in the exercise of its reasonable business judgment, that the advisory arrangements, as outlined in the Advisory Agreement, were reasonable in light of the factors considered by the Board.
| KraneShares Trust: | | Distributor: |
280 Park Avenue 32nd Floor New York, NY 10017 | | SEI Investments Distribution Co. One Freedom Valley Drive Oaks, PA 19456 |
| | | |
| Investment Adviser: | | Administrator: |
Krane Funds Advisors, LLC 280 Park Avenue 32nd Floor New York, NY 10017 | | SEI Investments Global Funds Services One Freedom Valley Drive Oaks, PA 19456 |
| | | |
| Sub-Adviser: | | Independent Registered Public Accounting Firm: |
Bosera Asset Management (International) Co., Ltd. Suite 4109 Jardine House One Connaught Place Central, Hong Kong | | KPMG LLP 1601 Market Street Philadelphia, PA 19103 |
| | | |
| Sub-Adviser: | | |
Nikko Asset Management Americas, Inc. 605 Third Avenue 38th Floor New York, NY 10158 | | |
| | | |
| Sub-Adviser: | | |
Mount Lucas Index Advisers, LLC 405 South State Street Newtown, PA, 18940 | | |
This information must be preceded or accompanied by a current prospectus for the Funds described.
KraneShares Trust:
280 Park Avenue, 32nd Floor
New York, NY 10017
KRS-SA-001-1200
Item 8. Changes in and Disagreements with Accountants for Open-End Management Investment Companies.
There were no changes in or disagreements with accountants on accounting and financial disclosure during the period covered by the report.
Item 9. Proxy Disclosures for Open-End Management Investment Companies.
There were no matters submitted to a vote of shareholders during the period covered by this report.
Item 10. Remuneration Paid to Directors, Officers, and Others of Open-End Management Investment Companies.
The remuneration paid during the period covered by the report to the Trustees on the Registrant’s Board of Trustees is disclosed as part of the financial statements included above in Item 7.
Item 11. Statement Regarding Basis for Approval of Investment Advisory Contract.
The disclosure regarding the Approval of Advisory Agreement is included in the Registrant’s financial statements, which is included in Item 7.
Item 12. Disclosure of Proxy Voting Policies and Procedures for Closed-End Management Investment Companies.
Not applicable to the Registrant.
Item 13. Portfolio Managers of Closed-End Management Investment Companies.
Not applicable to the Registrant.
Item 14. Purchases of Equity Securities by Closed-End Management Investment Company and Affiliated Purchasers.
Not applicable to the Registrant.
Item 15. Submission of Matters to a Vote of Security Holders.
There have been no changes to the procedures by which shareholders may recommend nominees to the Registrant’s Board of Trustees during the period covered by this report.
Item 16. Controls and Procedures.
(a) The Registrant’s principal executive and principal financial officers, or persons performing similar functions, have concluded that the Registrant’s disclosure controls and procedures (as defined in Rule 30a-3(c) under the Act (17 CFR § 270.30a-3(c))) as of a date within 90 days of the filing date of the report, are effective based on the evaluation of these controls and procedures required by Rule 30a-3(b) under the Act (17 CFR § 270.30a-3(b)) and Rules 13a-15(b) or 15d-15(b) under the Securities Exchange Act of 1934 (17 CFR § 240.13a-15(b) or § 240.15d-15(b)).
(b) There has been no change in the Registrant’s internal control over financial reporting (as defined in Rule 30a-3(d) under the Act (17 CFR § 270.30a-3(d))) that occurred during the period covered by this report that has materially affected, or is reasonably likely to materially affect, the Registrant’s internal control over financial reporting.
Item 17. Disclosure of Securities Lending Activities for Closed-End Management Investment Companies.
Not applicable to the Registrant.
Item 18. Recovery of Erroneously Awarded Compensation.
(a) Not applicable to the Registrant.
(b) Not applicable to the Registrant.
Item 19. Exhibits.
(a)(1) Not applicable for semi-annual report.
(a)(2) Not applicable to the Registrant.
(a)(3) A separate certification for the principal executive officer and the principal financial officer of the Registrant as required by Rule 30a-2(a) under the Act (17 CFR § 270.30a-2(a)), is filed herewith.
(a)(4) Not applicable to the Registrant.
(a)(5) Not applicable to the Registrant.
(b) Officer certifications as required by Rule 30a-2(b) under the Investment Company Act of 1940, as amended (17 CFR 270.30a-2(b)), is filed herewith.
The certification furnished pursuant to Rule 30a-2(b) under the Investment Company Act of 1940, as amended, and Section 906 of the Sarbanes-Oxley Act will not be deemed “filed” for purposes of Section 18 of the Securities Exchange Act of 1934, as amended (“Exchange Act”), or otherwise subject to the liability of that section. Such certification will not be deemed to be incorporated by reference into any filing under the Securities Act of 1933, as amended, or the Exchange Act, except to the extent that the Registrant specifically incorporates it by reference.
SIGNATURES
Pursuant to the requirements of the Securities Exchange Act of 1934 and the Investment Company Act of 1940, the Registrant has duly caused this report to be signed on its behalf by the undersigned, thereunto duly authorized.
| (Registrant) | KraneShares Trust |
| | |
| By (Signature and Title) | /s/ Jonathan Krane |
| | Jonathan Krane |
| | Principal Executive Officer |
Date: December 6, 2024
Pursuant to the requirements of the Securities Exchange Act of 1934 and the Investment Company Act of 1940, this report has been signed below by the following persons on behalf of the Registrant and in the capacities and on the dates indicated.
| By (Signature and Title) | /s/ Jonathan Krane |
| | Jonathan Krane |
| | Principal Executive Officer |
Date: December 6, 2024
| By (Signature and Title) | /s/ Jonathan Krane |
| | Jonathan Krane |
| | Principal Financial Officer |
Date: December 6, 2024