UNITED STATES
SECURITIES AND EXCHANGE COMMISSION
Washington, D.C. 20549
FORM N-CSR
CERTIFIED SHAREHOLDER REPORT OF REGISTERED
MANAGEMENT INVESTMENT COMPANIES
Investment Company Act file number | 811-22696 | |||||||
| ||||||||
Victory Portfolios II | ||||||||
(Exact name of registrant as specified in charter) | ||||||||
| ||||||||
4900 Tiedeman Road, 4th Floor, Brooklyn, Ohio |
| 44144 | ||||||
(Address of principal executive offices) |
| (Zip code) | ||||||
| ||||||||
Citi Fund Services Ohio, Inc., 4400 Easton Commons, Suite 200, Columbus, OH 43219 | ||||||||
(Name and address of agent for service) | ||||||||
| ||||||||
Registrant’s telephone number, including area code: | 800-539-3863 |
| ||||||
| ||||||||
Date of fiscal year end: | August 31 |
| ||||||
| ||||||||
Date of reporting period: | August 31, 2019 |
| ||||||
Item 1. Reports to Stockholders.

August 31, 2019
Annual Report
VictoryShares USAA Core Short-Term Bond ETF
VictoryShares USAA Core Intermediate-Term Bond ETF
Beginning January 1, 2021, as permitted by regulations adopted by the Securities and Exchange Commission, paper copies of the VictoryShares' shareholder reports will no longer be sent by mail, unless you specifically request paper copies of the reports from your financial intermediary, such as a broker-dealer or bank. Instead, the reports will be made available on www.VictorySharesLiterature.com, and you will be notified by mail each time a report is posted and provided with a website link to access the report. If you already elected to receive shareholder reports electronically, you will not be affected by this change, and you need not take any action.
You may elect to receive shareholder reports and other communications electronically sooner than January 1, 2021 by notifying your financial intermediary directly.
You may elect to receive all future reports in paper free of charge. You can inform your financial intermediary that you wish to continue receiving paper copies of your reports. Your election to receive reports in paper will apply to all VictoryShares you hold through your financial intermediary.
vcm.com
News, Information And Education 24 Hours A Day, 7 Days A Week
The Victory Funds site gives fund shareholders, prospective shareholders, and investment professionals a convenient way to access fund information, get guidance, and track fund performance anywhere they can access the Internet. The site includes:
• Detailed performance records
• Daily share prices
• The latest fund news
• Investment resources to help you become a better investor
• A section dedicated to investment professionals
Whether you're a potential investor searching for the fund that matches your investment philosophy, a seasoned investor interested in planning tools, or an investment professional, www.vcm.com has what you seek. Visit us anytime. We're always open.
Victory Portfolios II
Table of Contents
Shareholder Letter (unaudited) | 3 | ||||||
Fund Review and Commentary (unaudited) | 4 | ||||||
Financial Statements | |||||||
Victory Portfolios II Exchange Traded Funds | |||||||
VictoryShares USAA Core Short-Term Bond ETF | |||||||
Schedule of Portfolio Investments | 10 | ||||||
Statements of Assets and Liabilities | 28 | ||||||
Statements of Operations | 29 | ||||||
Statements of Changes in Net Assets | 30 | ||||||
Financial Highlights | 32 | ||||||
VictoryShares USAA Core Intermediate-Term Bond ETF | |||||||
Schedule of Portfolio Investments | 17 | ||||||
Statements of Assets and Liabilities | 28 | ||||||
Statements of Operations | 29 | ||||||
Statements of Changes in Net Assets | 30 | ||||||
Financial Highlights | 32 | ||||||
Notes to Financial Statements | 34 | ||||||
| Report of Independent Registered Public Accounting Firm | 47 | ||||||
Supplemental Information (unaudited) | |||||||
Trustee and Officer Information | 49 | ||||||
Proxy Voting and Portfolio Holdings Information | 52 | ||||||
Expense Examples | 52 | ||||||
Advisory Contract Approval | 53 | ||||||
Privacy Policy (inside back cover) | |||||||
1
The VictoryShares are distributed by Foreside Fund Services, LLC. Victory Capital Management Inc. is the investment adviser to the Funds and receives fees from the Funds for performing services for the Funds.
This report is not authorized for distribution to prospective investors unless preceded or accompanied by a current prospectus of the VictoryShares.
For additional information about any VictoryShares, including fees, expenses, and risks, view our prospectus online at www.vcm.com or call 866-376-7890. Read it carefully before you invest or send money.
The information in this annual report is based on data obtained from recognized services and sources and is believed to be reliable. Any opinions, projections, or recommendations in this report are subject to change without notice and are not intended as individual investment advice. Past investment performance of the ETFs, markets or securities mentioned herein should not be considered to be indicative of future results.
This report is for the information of the shareholders and others who have received a copy of the currently effective prospectus of the Funds, managed by Victory Capital Management Inc. It may be used as sales literature only when preceded or accompanied by a current prospectus, which provides further details about the Funds.
IRA DISTRIBUTION WITHHOLDING DISCLOSURE
We generally must withhold federal income tax at a rate of 10% of the taxable portion of your distribution and, if you live in a state that requires state income tax withholding, at your state's tax rate. However, you may elect not to have withholding apply or to have income tax withheld at a higher rate. Any withholding election that you make will apply to any subsequent distribution unless and until you change or revoke the election. If you wish to make a withholding election, or change or revoke a prior withholding election, call (800) 235-8396.
If you do not have a withholding election in place by the date of a distribution, federal income tax will be withheld from the taxable portion of your distribution at a rate of 10%. If you must pay estimated taxes, you may be subject to estimated tax penalties if your estimated tax payments are not sufficient and sufficient tax is not withheld from your distribution.
For more specific information, please consult your tax adviser.
• NOT FDIC INSURED • NO BANK GUARANTEE • MAY LOSE VALUE

Call Victory at:
866-376-7890
Visit our website at:
www.vcm.com
2
Shareholder Letter
Dear Shareholder,
The bull market in U.S. equities may have stumbled, but it might not be finished running just yet. The past year saw several periods of tumult and elevated volatility, including steep drawdowns late in 2018, in the spring of 2019, and more recently in early August. The culprits for the turbulence have been the usual suspects — concerns about future global growth rates, troubling geopolitical news, and uncertainties regarding U.S. trade policies. For the prior 12 month period the S&P 500 Index1 increased 2.92%.
The relatively bumpy performance of domestic stocks was evident across the capitalization spectrum and various sectors of the economy. But despite the sometimes-dire headlines and concerns about the waning impact of fiscal stimulus, the market's performance seemingly illustrates resilience and some inherent underlying strength in the U.S. economy and labor markets.
The volatility has not been relegated exclusively to the stock market. Against the backdrop of rapidly falling equities in the fourth quarter of last year, the Federal Open Market Committee (FOMC) made its famous "pivot" and abruptly changed course from a tightening bias to a more accommodative policy. Naturally, this helped stocks reverse their momentary swoon, and the FOMC made good on its promise to cut interest rates at the end of July 2019. This was the first rate cut since the 2008-2009 global financial crisis (and subsequently, the FOMC cut rates again in September after the close of this reporting cycle).
The shifting fixed income environment is exemplified by compression in the 10-Year U.S. Treasury yield, which ended August at 1.5%, a significant decline of 136 basis points over the course of the prior 12 months. Even more significant, perhaps, has been an inversion in parts of the yield curve, whereby shorter-term yields have become greater than long-term yields. This infrequent inversion is often — but not always — a troubling harbinger for the economy.
Certainly, there are ample concerns regarding global growth and ongoing trade disputes, but these worries are being actively countered by the policies of the Federal Reserve and other major global central banks. Moreover, it's important to reflect on the actual economic data and not focus on sentiment alone. According to the most recent figures available from the U.S. Department of Commerce, the U.S. economy grew at an estimated annualized rate of 2.0% during the second-quarter of 2019. Consumer spending metrics have been strong and job growth also continues unabated. All this has offset concerns regarding a slow-down in manufacturing.
Nevertheless, the current economic expansion is more than a decade old, and it's critical for investors to keep perspective that the bull cannot run forever. Investing is not without risks, and there are cross-currents that need to be monitored. Investors may wish to take this opportunity to revisit their allocations and risk tolerance.
My colleagues and I sincerely appreciate the confidence you have placed in us, and we value the opportunity to continue helping you meet your investment goals.

Christopher K. Dyer, CFA
President
Victory Funds
1The S&P 500 Index, an unmanaged index comprised of 500 domestically traded common stocks, is weighted according to the market value of each common stock in the index, and includes reinvestment of dividends. The impact of transaction costs and the deduction of fees and expenses associated with a mutual fund, such as investment management and accounting fees, are not reflected in the index calculations. It is not possible to invest directly in an index.
Investing involves market risk, including the potential loss of principal. Past performance does not guarantee future performance results.
3
VictoryShares
VictoryShares USAA Core Short-Term Bond ETF
Portfolio Review
August 31, 2019 (Unaudited)
Portfolio Holdings
As a Percentage of Total Investments

When the reporting period started in September 2018, investors expected the U.S. Federal Reserve Bank (the "Fed") to continue raising short-term rates into 2019. This outlook changed in November, as investors grew concerned about a potential trade war between the U.S. and China, uncertainty related to the U.K.'s exit from the European Union, slowing global economic growth, a stronger U.S. dollar, and the possibility of a U.S. government shutdown. Interest rates on maturities of six months and longer began to trend downward, pushing bond prices higher. Investors' concerns persisted into December, which was also notable for the beginning of a U.S. government shutdown that lasted 35 days. Although Fed officials raised short-term rates at the December policy meeting, their tone turned more dovish. In March, they left rates unchanged and said they would stop their balance sheet runoff earlier than expected. (Since October 2017, the Fed has been trimming its balance sheet by gradually decreasing the reinvestment of maturing holdings of Treasury and government-sponsored mortgage-backed securities.) These actions, along with the Fed's softer language about the U.S. economy, generally sent interest rates lower, with the market anticipating zero Fed rate hikes in the 2019 calendar year. In June, Fed policymakers remained on hold but said a rate cut was possible if the economic outlook weakened. The bond market responded by pricing in a rate cut as soon as July. On July 31st, the Fed cut short-term rates and said it would end its balance sheet reduction on August 1st, two months earlier than previously announced.
During the reporting period, Treasury yields fell along the curve, except those on one-month and three-month maturities, which ended the period higher than they began. The two-year Treasury yield decreased 112 basis points, while 10-year and 30-year Treasury yields dropped 136 and 106 basis points, respectively. (A basis point is 1/100th of a percent.) Expectations about Fed monetary policy also led to an inversion in the very short end of the curve, with the 10-year Treasury yield falling below the one-month Treasury yield. The inversion occurred as the U.S. entered its tenth year of recovery from the financial crisis, with ongoing economic growth and strong employment levels.
With the exception of high-yield spreads, credit spreads (yield differentials between corporate bonds and U.S. Treasury securities of comparable maturity) ended the reporting period largely unchanged. AAA and BBB spreads widened by five and eleven basis points, respectively. AA spreads were up 1 bp, while A spreads tightened by one basis point. High-yield spreads widened by 55 basis points. (Spreads are generally considered an indication of risk; the wider the spread, the greater the perceived risk.)
4
VictoryShares
VictoryShares USAA Core Short-Term Bond ETF (continued)
The VictoryShares USAA Core Short-Term Bond ETF (the "Fund") earned a positive total return during the reporting period of 5.11% with a market price of 5.10% and outperformed the Bloomberg Barclays 1-3 Yr Credit Index, which returned at 5.09% during this same period. The Fund is driven primarily by coupon income and the decline in Treasury yields, while the small change in credit spreads had little effect on returns. The Fund seeks high current income consistent with preservation of principal.
Reflecting the portfolio's diversification, the Fund's results were spread among a variety of sectors. Within corporate bonds, the Fund benefited from investments in Retail, Utilities, commercial mortgage-backed securities, Financials, municipal bonds, and Treasuries. Certain other market segments weighed on relative performance, although they produced positive returns. These included Pharmaceuticals, Cable & Satellite, Consumer Cyclical Services, and cash. We continued to adhere to our disciplined investment approach, which is to pursue an attractive yield with an acceptable level of risk.
To identify attractive investment opportunities, we worked with our in-house team of credit analysts, continuing to build the portfolio bond-by-bond, through fundamental bottom-up analysis. We seek ideas where our fundamental understanding of the credit risk is different than the market. We believe this approach positions the Fund to generate competitive total returns over the long run, with less volatility. Our credit analysts review all securities considered for purchase and assign their own independent credit rating. They continuously monitor every holding in the Fund. We are committed to building a portfolio diversified among multiple asset classes and across a large number of issuers. To help limit the Fund's exposure to potential surprises, we limit the positions we take in any one issuer.
5
VictoryShares
VictoryShares USAA Core Short-Term Bond ETF (continued)
Average Annual Return
Year Ended August 31, 2019
| VictoryShares USAA Core Short-Term Bond ETF | VictoryShares USAA Core Short-Term Bond ETF | ||||||||||||||
INCEPTION DATE | 10/24/17 | 10/24/17 | |||||||||||||
Net Asset Value | Market Price Value | Bloomberg Barclays 1-3 Yr Credit Index | |||||||||||||
One Year | 5.11 | % | 5.10 | % | 5.09 | % | |||||||||
Three Year | N/A | N/A | N/A | ||||||||||||
Five Year | N/A | N/A | N/A | ||||||||||||
Ten Year | N/A | N/A | N/A | ||||||||||||
Since Inception | 3.12 | % | 3.17 | % | N/A | ||||||||||
Expense Ratios
Gross | 0.34 | % | |||||||||||||
With Applicable Waivers | 0.34 | % | |||||||||||||
Past performance is not indicative of future results. The performance data quoted represents past performance and current returns may be lower or higher. The investment return and principal value will fluctuate so that an investor's shares, when redeemed, may be worth more or less than the original cost. To obtain performance information current to the most recent month's end, please visit www.vcm.com.
The above expense ratios are from the Fund's prospectus dated July 1, 2019. Additional information pertaining to the Fund's expense ratios as of August 31, 2019 can be found in the financial highlights. The Adviser has contractually agreed to waive a portion of its management fee and/or reimburse certain expenses through June 30, 2021.
Comparison of the Change in Value of a $10,000 Investment

1The Bloomberg Barclays 1-3 Yr Credit Index measures the performance of investment grade corporate debt and sovereign, supranational, local authority, and non-U.S. agency bonds that have a remaining maturity of at least one year and less than three years. It is not possible to invest directly in an index.
The graph reflects investment growth of a hypothetical $10,000 investment of the Fund. Past performance is not guarantee of future results.
6
VictoryShares
VictoryShares USAA Core Intermediate-Term Bond ETF
Portfolio Review
August 31, 2019 (Unaudited)
Portfolio Holdings
As a Percentage of Total Investments

When the reporting period started in September 2018, investors expected the U.S. Federal Reserve Bank (the "Fed") to continue raising short-term rates into 2019. This outlook changed in November, as investors grew concerned about a potential trade war between the U.S. and China, uncertainty related to the U.K.'s exit from the European Union, slowing global economic growth, a stronger U.S. dollar, and the possibility of a U.S. government shutdown. Interest rates on maturities of six months and longer began to trend downward, pushing bond prices higher. Investors' concerns persisted into December, which was also notable for the beginning of a U.S. government shutdown that lasted 35 days. Although Fed officials raised short-term rates at the December policy meeting, their tone turned more dovish. In March, they left rates unchanged and said they would stop their balance sheet runoff earlier than expected. (Since October 2017, the Fed has been trimming its balance sheet by gradually decreasing the reinvestment of maturing holdings of Treasury and government-sponsored mortgage-backed securities.) These actions, along with the Fed's softer language about the U.S. economy, generally sent interest rates lower, with the market anticipating zero Fed rate hikes in the 2019 calendar year. In June, Fed policymakers remained on hold but said a rate cut was possible if the economic outlook weakened. The bond market responded by pricing in a rate cut as soon as July. On July 31st, the Fed cut short-term rates and said it would end its balance sheet reduction on August 1st, two months earlier than previously announced.
During the reporting period, Treasury yields fell along the curve, except those on one-month and three-month maturities, which ended the period higher than they began. The two-year Treasury yield decreased 112 basis points, while 10-year and 30-year Treasury yields dropped 136 and 106 basis points, respectively. (A basis point is 1/100th of a percent.) Expectations about Fed monetary policy also led to an inversion in the very short end of the curve, with the 10-year Treasury yield falling below the one-month Treasury yield. The inversion occurred as the U.S. entered its tenth year of recovery from the financial crisis, with ongoing economic growth and strong employment levels.
With the exception of high-yield spreads, credit spreads (yield differentials between corporate bonds and U.S. Treasury securities of comparable maturity) ended the reporting period largely unchanged. AAA and BBB spreads widened by five and eleven basis points, respectively. AA spreads were up 1 bp, while A spreads tightened by one basis point. High-yield spreads widened by 55 basis points. (Spreads are generally considered an indication of risk; the wider the spread, the greater the perceived risk.)
7
VictoryShares
VictoryShares USAA Core Intermediate-Term Bond ETF (continued)
The VictoryShares USAA Core Intermediate-Term Bond ETF (the "Fund") generated a positive total return for the reporting period of 11.37% and market price of 11.44% and outperformed the Bloomberg Barclays US Aggregate Index, which returned at 10.17% during this same period. (As bond prices rose during the reporting period, the Fund's overweight position in corporate bonds, the strongest-performing sector in the fixed income market, bolstered relative returns. The Fund also benefited from its holdings of commercial mortgage-backed securities and asset-backed securities. These positive results were offset somewhat by the portfolio's underweights and duration positioning in U.S. Treasury securities and agency mortgage-backed securities. (Duration is a measure of interest-rate sensitivity.) The Fund seeks high current income without undue risk to principal.
During the reporting period, we continued to build the portfolio bond by bond. We seek ideas where our fundamental understanding of the credit risk is different than that of the market, working with our team of analysts to evaluate each potential investment individually, rather than on the basis of thematic trends. Our analysts continued to analyze and monitor every holding in the portfolio. We are committed to building a portfolio diversified among multiple asset classes and across a large number of issuers. To help limit the Fund's exposure to potential surprises, we limit the positions we take in any one issuer.
Thank you for allowing us to help you with your investment needs.
8
VictoryShares
VictoryShares USAA Core Intermediate-Term Bond ETF (continued)
Average Annual Return
Year Ended August 31, 2019
| VictoryShares USAA Core Intermediate-Term Bond ETF | VictoryShares USAA Core Intermediate-Term Bond ETF | ||||||||||||||
INCEPTION DATE | 10/24/17 | 10/24/17 | |||||||||||||
Net Asset Value | Market Price Value | Bloomberg Barclays US Aggregate Index | |||||||||||||
One Year | 11.37 | % | 11.44 | % | 10.17 | % | |||||||||
Three Year | N/A | N/A | N/A | ||||||||||||
Five Year | N/A | N/A | N/A | ||||||||||||
Ten Year | N/A | N/A | N/A | ||||||||||||
Since Inception | 5.80 | % | 5.89 | % | N/A | ||||||||||
Expense Ratios
Gross | 0.38 | % | |||||||||||||
With Applicable Waivers | 0.38 | % | |||||||||||||
Past performance is not indicative of future results. The performance data quoted represents past performance and current returns may be lower or higher. The investment return and principal value will fluctuate so that an investor's shares, when redeemed, may be worth more or less than the original cost. To obtain performance information current to the most recent month's end, please visit www.vcm.com.
The above expense ratios are from the Fund's prospectus dated July 1, 2019. Additional information pertaining to the Fund's expense ratios as of August 31, 2019 can be found in the financial highlights. The Adviser has contractually agreed to waive a portion of its management fee and/or reimburse certain expenses through June 30, 2021.
Comparison of the Change in Value of a $10,000 Investment

1The Bloomberg Barclays US Aggregate Index is a broad-based benchmark that measures the investment grade, U.S. dollar-denominated, fixed-rate taxable bond market. This includes Treasuries, government-related and corporate securities, mortgage backed securities, asset-backed securities and collateralized mortgage-backed securities. It is not possible to invest directly in an index.
The graph reflects investment growth of a hypothetical $10,000 investment of the Fund. Past performance is not guarantee of future results.
9
| Victory Portfolios II VictoryShares USAA Core Short-Term Bond ETF | Schedule of Portfolio Investments August 31, 2019 | ||||||
Security Description | Principal Amount | Value | |||||||||
Asset Backed Securities (10.1%) | |||||||||||
| AmeriCredit Automobile Receivables Trust, Series 2017-4, Class C, 2.60%, 9/18/23, Callable 12/18/21 @ 100 | $ | 500,000 | $ | 502,648 | |||||||
| Bank of The West Auto Trust, Series 2017-1, Class C, 2.96%, 2/15/24, Callable 11/15/21 @ 100 (a) | 500,000 | 510,052 | |||||||||
| Bank of The West Auto Trust, Series 2018-1, Class C, 3.98%, 5/15/24, Callable 10/15/21 @ 100 (a) | 400,000 | 417,044 | |||||||||
| Canadian Pacer Auto Receivables Trust, Series 2018-2A, Class B, 3.63%, 1/19/24, Callable 11/19/21 @ 100 (a) | 500,000 | 517,912 | |||||||||
| CarMax Auto Owner Trust, Series 2016-1, Class B, 2.22%, 8/16/21, Callable 3/15/20 @ 100 | 1,000,000 | 999,233 | |||||||||
Centre Point Funding LLC, Series 2012-2A, Class 1, 2.61%, 8/20/21 (a) | 58,398 | 58,147 | |||||||||
| CNH Equipment Trust, Series 2017-B, Class B, 2.47%, 12/16/24, Callable 10/15/21 @ 100 | 500,000 | 504,368 | |||||||||
| Credit Acceptance Auto Loan Trust, Series 2018-1, Class B, 3.60%, 4/15/27, Callable 6/15/21 @ 100 (a) | 500,000 | 511,462 | |||||||||
| Drive Auto Receivables Trust, Series 2018-4, Class C, 3.66%, 11/15/24, Callable 5/15/21 @ 100 | 500,000 | 506,867 | |||||||||
| GM Financial Consumer Automobile Receivables Trust, Series 2018-3, Class A3, 3.02%, 5/16/23, Callable 5/16/22 @ 100 | 500,000 | 509,027 | |||||||||
| GreatAmerica Leasing Receivables Funding LLC, Series 2018-1, Class A4, 2.83%, 6/17/24, Callable 11/15/21 @ 100 (a) | 500,000 | 507,937 | |||||||||
| MMAF Equipment Finance LLC, Series 2016-A, Class A4, 1.76%, 1/17/23, Callable 7/15/25 @ 100 (a) | 100,000 | 99,723 | |||||||||
OSCAR US Funding Trust VI LLC, Series 2017-1A, Class A4, 3.30%, 5/10/24 (a) | 500,000 | 507,277 | |||||||||
PSNH Funding LLC 3, Series 2018-1, Class A1, 3.09%, 2/1/26 | 389,081 | 399,498 | |||||||||
| Santander Drive Auto Receivables Trust, Series 2016-1, Class C, 3.09%, 4/15/22, Callable 7/15/20 @ 100 (b) | 68,311 | 68,373 | |||||||||
| Santander Drive Auto Receivables Trust, Series 2018-5, Class B, 3.52%, 12/15/22, Callable 9/15/21 @ 100 | 250,000 | 252,289 | |||||||||
| SCF Equipment Leasing LLC, Series 2017-2A, Class A, 3.41%, 12/20/23, Callable 9/20/19 @ 100 (a) | 104,900 | 105,798 | |||||||||
| SCF Equipment Leasing LLC, Series 2017-1, Class A, 3.77%, 1/20/23, Callable 2/20/22 @ 100 (a) | 426,793 | 432,621 | |||||||||
| Synchrony Credit Card Master Note Trust, Series 2017-1, Class B, 2.19%, 6/15/23 | 500,000 | 499,408 | |||||||||
| Westlake Automobile Receivables Trust, Series 2019-2A, Class C, 2.84%, 7/15/24, Callable 5/15/23 @ 100 (a) | 500,000 | 505,126 | |||||||||
Total Asset Backed Securities (Cost $8,268,703) | 8,414,810 | ||||||||||
Collateralized Mortgage Obligations (3.6%) | |||||||||||
| Citigroup Commercial Mortgage Trust, Series 2019-SMRT, Class B, 4.38%, 1/10/24 (a) | 500,000 | 540,879 | |||||||||
| Madison Park Funding XI Ltd., Series 2013-11A, Class AR, 3.42% (LIBOR03M+116bps), 7/23/29, Callable 10/23/19 @ 100 (a) (c) | 500,000 | 499,950 | |||||||||
| Oaktree EIF III Series I Ltd., Series 2016-IIIA, Class B, 4.28% (LIBOR03M+200bps), 10/20/27, Callable 4/20/20 @ 100 (a) (c) | 500,000 | 500,950 | |||||||||
| Palmer Square Loan Funding Ltd., Series 2018-2, Class A1, 2.95% (LIBOR03M+65bps), 7/15/26, Callable 10/15/19 @ 100 (a) (c) | 364,120 | 362,153 | |||||||||
See notes to financial statements.
10
| Victory Portfolios II VictoryShares USAA Core Short-Term Bond ETF | Schedule of Portfolio Investments — continued August 31, 2019 | ||||||
Security Description | Principal Amount | Value | |||||||||
| Palmer Square Loan Funding Ltd., Series 2018-2, Class A2, 3.35% (LIBOR03M+105bps), 7/15/26, Callable 10/15/19 @ 100 (a) (c) | $ | 500,000 | $ | 489,650 | |||||||
| WFRBS Commercial Mortgage Trust, Series 2012-C9, Class ASB, 2.45%, 11/15/45 | 395,748 | 397,965 | |||||||||
| WFRBS Commercial Mortgage Trust, Series 2012-C7, Class AS, 4.09%, 6/15/45 (b) | 225,017 | 234,441 | |||||||||
Total Collateralized Mortgage Obligations (Cost $2,992,295) | 3,025,988 | ||||||||||
Corporate Bonds (66.5%) | |||||||||||
Communication Services (4.8%): | |||||||||||
AT&T, Inc., 2.45%, 6/30/20, Callable 5/30/20 @ 100 (d) | 500,000 | 500,800 | |||||||||
Clear Channel Worldwide, 6.50%, 11/15/22 | 500,000 | 510,835 | |||||||||
Comcast Corp., 3.30%, 10/1/20 | 500,000 | 507,160 | |||||||||
Discovery Communications, 3.10% (LIBOR03M+71bps), 9/20/19 (c) | 480,000 | 480,139 | |||||||||
Fox Corp., 3.67%, 1/25/22 (a) | 500,000 | 518,300 | |||||||||
Nbcuniversal Media LLC, 5.15%, 4/30/20 | 725,000 | 739,580 | |||||||||
Sprint Spectrum, 3.36%, 3/20/23 (a) | 225,000 | 225,882 | |||||||||
Time Warner Cable, Inc., 5.00%, 2/1/20 | 500,000 | 505,005 | |||||||||
3,987,701 | |||||||||||
Consumer Discretionary (2.3%): | |||||||||||
Lennar Corp., 2.95%, 11/29/20, Callable 9/29/20 @ 100 | 300,000 | 300,000 | |||||||||
MGM Resorts International, 5.25%, 3/31/20 | 540,000 | 546,998 | |||||||||
| Nissan Motor Acceptance Corp. 2.97% (LIBOR03M+52bps), 9/13/19 (a) (c) | 500,000 | 500,065 | |||||||||
1.55%, 9/13/19 (a) | 500,000 | 499,885 | |||||||||
1,846,948 | |||||||||||
Consumer Staples (5.6%): | |||||||||||
Alimentation Couche-Tard, Inc., 2.70%, 7/26/22, Callable 6/26/22 @ 100 (a) | 500,000 | 505,765 | |||||||||
Altria Group, Inc., 4.75%, 5/5/21 | 500,000 | 521,505 | |||||||||
Anheuser-Busch InBev Worldwide, Inc., 4.15%, 1/23/25, Callable 12/23/24 @ 100 | 500,000 | 547,670 | |||||||||
Constellation Brands, Inc., 2.70%, 5/9/22, Callable 4/9/22 @ 100 | 400,000 | 404,888 | |||||||||
| Mondelez International Holdings Netherlands BV, 1.63%, 10/28/19, Callable 10/10/19 @ 100 (a) | 750,000 | 749,235 | |||||||||
Philip Morris International, Inc., 2.90%, 11/15/21 | 750,000 | 763,275 | |||||||||
| Reckitt Benckiser Treasury Services PLC, 2.38%, 6/24/22, Callable 4/24/22 @ 100 (a) | 400,000 | 402,412 | |||||||||
Walmart, Inc., 3.55%, 6/26/25, Callable 4/26/25 @ 100 | 750,000 | 813,840 | |||||||||
4,708,590 | |||||||||||
Energy (7.2%): | |||||||||||
| Andeavor Logistics LP/Tesoro Logistics Finance Corp., 3.50%, 12/1/22, Callable 11/1/22 @ 100 | 271,000 | 278,401 | |||||||||
Cenovus Energy, Inc., 5.70%, 10/15/19 | 470,385 | 471,255 | |||||||||
DCP Midstream Operating, LP, 5.35%, 3/15/20 (a) | 500,000 | 505,920 | |||||||||
Energy Transfer Operating LP, 7.50%, 10/15/20 | 500,000 | 527,175 | |||||||||
Enterprise Products Operating LLC, 2.55%, 10/15/19, Callable 10/10/19 @ 100 | 400,000 | 399,848 | |||||||||
| EQM Midstream Partners LP 4.75%, 7/15/23, Callable 6/15/23 @ 100 | 400,000 | 403,324 | |||||||||
4.00%, 8/1/24, Callable 5/1/24 @ 100 | 250,000 | 245,098 | |||||||||
See notes to financial statements.
11
| Victory Portfolios II VictoryShares USAA Core Short-Term Bond ETF | Schedule of Portfolio Investments — continued August 31, 2019 | ||||||
Security Description | Principal Amount | Value | |||||||||
EQT Corp., 3.09% (LIBOR03M+77bps), 10/1/20, Callable 9/25/19 @ 100 (c) | $ | 500,000 | $ | 498,445 | |||||||
Exxon Mobil Corp., 2.40%, 3/6/22, Callable 1/6/22 @ 100 | 500,000 | 507,770 | |||||||||
Midwest Connector Capital Co. LLC, 3.63%, 4/1/22, Callable 3/1/22 @ 100 (a) | 500,000 | 513,875 | |||||||||
Nustar Logistics, LP, 4.80%, 9/1/20 | 400,000 | 405,004 | |||||||||
Occidental Petroleum Corp., 2.70%, 8/15/22 | 750,000 | 757,050 | |||||||||
Rockies Express Pipeline LLC, 5.63%, 4/15/20 (a) | 500,000 | 507,815 | |||||||||
6,020,980 | |||||||||||
Financials (20.6%): | |||||||||||
Ares Capital Corp., 3.88%, 1/15/20, Callable 12/15/19 @ 100 | 500,000 | 501,350 | |||||||||
Associated Bank NA/Green Bay WI, 3.50%, 8/13/21, Callable 7/13/21 @ 100 | 500,000 | 509,960 | |||||||||
Assurant, Inc., 3.58% (LIBOR03M+125bps), 3/26/21, Callable 9/25/19 @ 100 (c) | 400,000 | 399,388 | |||||||||
Banco Santander Chile, 2.50%, 12/15/20, Callable 11/15/20 @ 100 (a) | 300,000 | 299,760 | |||||||||
Bank of America Corp., 2.15%, 11/9/20, Callable 11/9/19 @ 100 | 500,000 | 500,015 | |||||||||
BAT International Finance PLC, 1.63%, 9/9/19, MTN | 500,000 | 499,930 | |||||||||
BBVA Bancomer SA/Texas, 6.50%, 3/10/21 (a) | 250,000 | 262,195 | |||||||||
Capital One Financial Corp., 2.40%, 10/30/20, Callable 9/30/20 @ 100 | 350,000 | 350,924 | |||||||||
Citigroup, Inc., 3.14% (LIBOR03M+72bps), 1/24/23, Callable 1/24/22 @ 100 (c) | 400,000 | 408,932 | |||||||||
Citizens Bank NA, 2.25%, 10/30/20, Callable 9/30/20 @ 100 | 294,000 | 293,841 | |||||||||
Flagstar Bancorp, Inc., 6.13%, 7/15/21, Callable 6/15/21 @ 100 | 500,000 | 517,510 | |||||||||
Ford Motor Credit Co. LLC, 3.20%, 1/15/21 | 500,000 | 502,435 | |||||||||
FS KKR Capital Corp., 4.25%, 1/15/20, Callable 12/15/19 @ 100 | 500,000 | 500,920 | |||||||||
Harley-Davidson Financial Services, 2.40%, 9/15/19 (a) | 445,000 | 444,964 | |||||||||
HSBC Finance Corp., 6.68%, 1/15/21 | 500,000 | 525,380 | |||||||||
Huntington National Bank, 2.40%, 4/1/20, Callable 3/1/20 @ 100 | 500,000 | 500,725 | |||||||||
Hyundai Capital America, 3.00%, 6/20/22 (a) | 750,000 | 757,575 | |||||||||
Infinity Property & Casualty Corp., 5.00%, 9/19/22 | 500,000 | 531,425 | |||||||||
Main Street Capital Corp., 5.20%, 5/1/24 | 500,000 | 540,950 | |||||||||
Metropolitan Life Global Funding I, 3.45%, 10/9/21 (a) | 500,000 | 514,600 | |||||||||
Navient Corp., 8.00%, 3/25/20, MTN | 500,000 | 514,980 | |||||||||
New York Life Global Funding, 2.00%, 4/13/21 (a) | 500,000 | 500,335 | |||||||||
ORIX Corp., 2.95%, 7/23/20, MTN | 400,000 | 402,056 | |||||||||
Park Aerospace Holdings Ltd., 3.63%, 3/15/21, Callable 2/15/21 @ 100 (a) | 500,000 | 504,105 | |||||||||
Primerica, Inc., 4.75%, 7/15/22 | 400,000 | 425,564 | |||||||||
Protective Life Global Funding, 3.10%, 4/15/24 (a) | 500,000 | 518,840 | |||||||||
Regions Bank, 2.75%, 4/1/21, Callable 3/1/21 @ 100 | 400,000 | 402,880 | |||||||||
Reliance Standard Life Global Funding II, 2.50%, 1/15/20 (a) | 500,000 | 500,200 | |||||||||
| Santander Holdings USA, Inc. 4.45%, 12/3/21, Callable 11/3/21 @ 100 | 250,000 | 260,703 | |||||||||
3.40%, 1/18/23, Callable 12/18/22 @ 100 | 250,000 | 256,815 | |||||||||
| Santander UK Group Holdings PLC, 3.37% (LIBOR03M+108bps), 1/5/24, Callable 1/5/23 @ 100 (c) | 250,000 | 253,673 | |||||||||
Silversea Cruise Finance, 7.25%, 2/1/25, Callable 2/1/20 @ 105.44 (a) | 250,000 | 267,858 | |||||||||
Sterling Bancorp, 3.50%, 6/8/20, Callable 5/8/20 @ 100 | 580,000 | 575,453 | |||||||||
SunTrust Banks, Inc., 2.90%, 3/3/21, Callable 2/3/21 @ 100 | 400,000 | 404,436 | |||||||||
Synchrony Financial, 2.85%, 7/25/22, Callable 6/25/22 @ 100 | 500,000 | 506,525 | |||||||||
US Bank NA/Cincinnati OH, 2.85%, 1/23/23, Callable 12/23/22 @ 100 | 500,000 | 515,075 | |||||||||
Wells Fargo & Co., 3.00%, 1/22/21, MTN | 500,000 | 506,680 | |||||||||
Zions Bancorp NA, 3.35%, 3/4/22, Callable 2/4/22 @ 100 (d) | 500,000 | 512,025 | |||||||||
17,190,982 | |||||||||||
See notes to financial statements.
12
| Victory Portfolios II VictoryShares USAA Core Short-Term Bond ETF | Schedule of Portfolio Investments — continued August 31, 2019 | ||||||
Security Description | Principal Amount | Value | |||||||||
Health Care (3.5%): | |||||||||||
Centene Corp., 5.63%, 2/15/21, Callable 10/10/19 @ 101.41 | $ | 500,000 | $ | 506,045 | |||||||
| CVS Health Corp. 2.13%, 6/1/21, Callable 5/1/21 @ 100 | 400,000 | 400,152 | |||||||||
2.63%, 8/15/24, Callable 7/15/24 @ 100 | 750,000 | 755,122 | |||||||||
Elanco Animal Health, Inc., 3.91%, 8/27/21 | 500,000 | 510,445 | |||||||||
Orlando Health Obligated Group, 2.72%, 10/1/19 | 250,000 | 250,048 | |||||||||
SSM Health Care Corp., 3.69%, 6/1/23, Callable 3/1/23 @ 100 | 500,000 | 526,930 | |||||||||
2,948,742 | |||||||||||
Industrials (6.5%): | |||||||||||
Air Lease Corp., 3.50%, 1/15/22 | 500,000 | 514,245 | |||||||||
Aircastle Ltd., 4.25%, 6/15/26, Callable 4/15/26 @ 100 | 500,000 | 514,765 | |||||||||
CK Hutchison International 17 II Ltd., 2.75%, 3/29/23 (a) | 750,000 | 760,283 | |||||||||
General Electric Co., 2.20%, 1/9/20, Callable 12/9/19 @ 100 | 500,000 | 498,685 | |||||||||
Heathrow Funding Ltd., 4.88%, 7/15/23 (a) | 475,000 | 493,174 | |||||||||
Ryder System, Inc., 2.25%, 9/1/21, MTN, Callable 8/1/21 @ 100 | 500,000 | 500,375 | |||||||||
Smiths Group PLC, 3.63%, 10/12/22 (a) | 500,000 | 510,864 | |||||||||
The ADT Security Corp., 5.25%, 3/15/20 | 656,000 | 664,515 | |||||||||
TTX Co., 2.60%, 6/15/20, Callable 5/15/20 @ 100 (a) | 500,000 | 500,435 | |||||||||
Wabtec Corp., 3.71% (LIBOR03M+130bps), 9/15/21, Callable 9/25/19 @ 100 (c) | 500,000 | 498,940 | |||||||||
5,456,281 | |||||||||||
Information Technology (1.8%): | |||||||||||
Broadcom, Inc., 3.13%, 4/15/21 (a) | 500,000 | 505,220 | |||||||||
Fiserv, Inc., 2.75%, 7/1/24, Callable 6/1/24 @ 100 | 500,000 | 511,660 | |||||||||
Tyco Electronics Group SA, 2.93% (LIBOR03M+45bps), 6/5/20 (c) | 500,000 | 500,275 | |||||||||
1,517,155 | |||||||||||
Materials (3.1%): | |||||||||||
Ecolab, Inc., 4.35%, 12/8/21 | 400,000 | 420,272 | |||||||||
INVISTA Finance LLC, 4.25%, 10/15/19 (a) | 500,000 | 500,700 | |||||||||
Newmont Mining Corp., 5.13%, 10/1/19 (d) | 1,250,000 | 1,252,375 | |||||||||
Reliance Steel & Aluminum Co., 4.50%, 4/15/23, Callable 1/15/23 @ 100 | 400,000 | 425,136 | |||||||||
2,598,483 | |||||||||||
Real Estate (4.5%): | |||||||||||
AvalonBay Communities, Inc., 3.63%, 10/1/20, Callable 7/1/20 @ 100 | 400,000 | 405,108 | |||||||||
Corecivic, Inc., 4.13%, 4/1/20, Callable 1/1/20 @ 100 | 500,000 | 499,135 | |||||||||
Office Properties Income Trust, 3.60%, 2/1/20, Callable 1/1/20 @ 100 | 600,000 | 601,704 | |||||||||
| Sabra Health Care LP/Sabra Capital Corp., 5.38%, 6/1/23, Callable 10/10/19 @ 101.79 | 300,000 | 304,923 | |||||||||
| Scentre Group Trust 1/Scentre Group Trust 2, 2.38%, 4/28/21, Callable 3/29/21 @ 100 (a) | 500,000 | 500,280 | |||||||||
| Senior Housing Properties Trust 6.75%, 4/15/20, Callable 10/15/19 @ 100 | 500,000 | 501,895 | |||||||||
6.75%, 12/15/21, Callable 6/15/21 @ 100 | 500,000 | 533,015 | |||||||||
Welltower, Inc., 5.25%, 1/15/22 (d) | 359,000 | 382,094 | |||||||||
3,728,154 | |||||||||||
See notes to financial statements.
13
| Victory Portfolios II VictoryShares USAA Core Short-Term Bond ETF | Schedule of Portfolio Investments — continued August 31, 2019 | ||||||
Security Description | Principal Amount | Value | |||||||||
Sovereign Bond (1.3%): | |||||||||||
Province of Alberta Canada, 1.90%, 12/6/19 | $ | 700,000 | $ | 699,551 | |||||||
Province of Quebec Canada, 2.75%, 8/25/21 | 500,000 | 510,660 | |||||||||
1,210,211 | |||||||||||
Utilities (5.3%): | |||||||||||
AEP Texas, Inc., 2.40%, 10/1/22, Callable 9/1/22 @ 100 | 400,000 | 403,412 | |||||||||
Dominion Energy, Inc., 2.72%, 8/15/21 | 500,000 | 504,130 | |||||||||
Iberdrola Finance Ireland Ltd., 5.00%, 9/11/19 (a) (d) | 470,000 | 470,103 | |||||||||
National Fuel Gas Co., 4.90%, 12/1/21, Callable 9/1/21 @ 100 | 500,000 | 521,195 | |||||||||
Public Service Electric & Gas Co., 3.25%, 9/1/23, MTN, Callable 8/1/23 @ 100 | 500,000 | 524,475 | |||||||||
Sempra Energy, 2.90%, 2/1/23, Callable 1/1/23 @ 100 | 400,000 | 408,308 | |||||||||
Sierra Pacific Power Co., 3.38%, 8/15/23, Callable 5/15/23 @ 100 | 500,000 | 522,185 | |||||||||
The AES Corp., 4.00%, 3/15/21 | 500,000 | 508,710 | |||||||||
WGL Holdings, Inc., 2.25%, 11/1/19, Callable 10/10/19 @ 100 | 525,000 | 524,265 | |||||||||
4,386,783 | |||||||||||
Total Corporate Bonds (Cost $54,896,817) | 55,601,010 | ||||||||||
Municipal Bonds (11.4%) | |||||||||||
California (0.3%): | |||||||||||
San Jose Redevelopment Agency Successor Agency, Series A-T, 2.63%, 8/1/22 | 250,000 | 256,613 | |||||||||
Colorado (0.7%): | |||||||||||
City of Loveland Electric & Communications Enterprise Revenue, 2.85%, 12/1/23 | 600,000 | 621,066 | |||||||||
Connecticut (0.6%): | |||||||||||
State of Connecticut, GO, Series A, 3.75%, 9/15/20 | 500,000 | 506,740 | |||||||||
Illinois (0.6%): | |||||||||||
City of Chicago Wastewater Transmission Revenue, 3.73%, 1/1/20 | 500,000 | 501,190 | |||||||||
Massachusetts (0.6%): | |||||||||||
Development Finance Agency Revenue, Series B, 3.52%, 7/1/20, AGM | 500,000 | 502,715 | |||||||||
Michigan (0.9%): | |||||||||||
Ecorse Public School District, GO, 2.00%, 5/1/24, Q-SBLF (e) | 750,000 | 752,018 | |||||||||
New Jersey (0.9%): | |||||||||||
| Economic Development Authority Revenue 3.80%, 6/15/20 | 250,000 | 251,923 | |||||||||
Series B, 3.50%, 6/15/20 | 150,000 | 150,977 | |||||||||
Educational Facilities Authority Revenue, 2.47%, 9/1/21 | 300,000 | 302,385 | |||||||||
705,285 | |||||||||||
New York (0.6%): | |||||||||||
Dormitory Authority Revenue, Series B, 3.18%, 3/15/22 | 500,000 | 515,825 | |||||||||
Oregon (1.0%): | |||||||||||
Port of Morrow Revenue, 2.18%, 9/1/24 | 750,000 | 759,727 | |||||||||
Rhode Island (0.6%): | |||||||||||
Commerce Corp. Revenue, 2.86%, 5/1/24 | 500,000 | 521,310 | |||||||||
See notes to financial statements.
14
| Victory Portfolios II VictoryShares USAA Core Short-Term Bond ETF | Schedule of Portfolio Investments — continued August 31, 2019 | ||||||
Security Description | Principal Amount | Value | |||||||||
Texas (3.1%): | |||||||||||
| City of Houston, GO 2.62%, 3/1/21 | $ | 150,000 | $ | 151,598 | |||||||
2.77%, 3/1/22 | 150,000 | 153,672 | |||||||||
Dallas-Fort Worth International Airport Revenue, 2.04%, 11/1/24 | 750,000 | 755,414 | |||||||||
State of Texas, GO, 3.11%, 10/1/23 | 500,000 | 526,665 | |||||||||
| Texas A&M University Revenue Series A, 2.95%, 5/15/23 | 500,000 | 522,580 | |||||||||
Series B, 2.12%, 5/15/24 | 500,000 | 508,090 | |||||||||
2,618,019 | |||||||||||
Virginia (0.9%): | |||||||||||
| Economic Development Authority, GO, Series B, 2.03%, 10/1/24, ST AID WITHHLDG | 750,000 | 758,624 | |||||||||
Wisconsin (0.6%): | |||||||||||
| Public Finance Authority Revenue, 3.75%, 2/1/22, Continuously Callable @ 100 (LOC — Citizens Financial Group) | 500,000 | 502,510 | |||||||||
Total Municipal Bonds (Cost $9,354,730) | 9,521,642 | ||||||||||
U.S. Treasury Obligations (6.3%) | |||||||||||
| U.S. Treasury Notes 1.63%, 10/15/20 | 1,000,000 | 998,633 | |||||||||
1.13%, 7/31/21 | 1,680,000 | 1,666,612 | |||||||||
1.88%, 9/30/22 (d) | 1,070,000 | 1,084,462 | |||||||||
1.25%, 7/31/23 | 1,500,000 | 1,489,805 | |||||||||
Total U.S. Treasury Obligations (Cost $5,113,144) | 5,239,512 | ||||||||||
Commercial Papers (0.8%) | |||||||||||
Cabot Corp., 3.00%, 9/3/19 (f) | 645,000 | 644,839 | |||||||||
Total Commercial Papers (Cost $644,919) | 644,839 | ||||||||||
Total Investments (Cost $81,270,608) — 98.7% | 82,447,801 | ||||||||||
Other assets in excess of liabilities — 1.3% | 1,125,494 | ||||||||||
NET ASSETS — 100.00% | $ | 83,573,295 | |||||||||
(a) Rule 144A security or other security that is restricted as to resale to institutional investors. The Fund's Adviser has deemed this security to be liquid based upon procedures approved by the Board of Trustees. As of August 31, 2019, the fair value of these securities was $20,307,326 and amounted to 24.3% of net assets.
(b) The rate for certain asset-backed and mortgage-backed securities may vary based on factors relating to the pool of assets underlying the security. The rate disclosed is the rate in effect at August 31, 2019.
(c) Variable or Floating-Rate Security. Rate disclosed is as of August 31, 2019.
(d) All or a portion of this security has been segregated as collateral for securities purchased on a when-issued basis.
(e) Security purchased on a when-issued basis.
(f) Rate represents the effective yield at August 31, 2019.
See notes to financial statements.
15
| Victory Portfolios II VictoryShares USAA Core Short-Term Bond ETF | Schedule of Portfolio Investments — continued August 31, 2019 | ||||||
AGM — Assured Guaranty Municipal Corporation
bps — Basis points
GO — General Obligation
LLC — Limited Liability Company
LP — Limited Partnership
MTN — Medium Term Note
PLC — Public Limited Company
Q-SBLF — Qualified-School Board Loan
Credit Enhancements — Adds the financial strength of the provider of the enhancement to support the issuer's ability to repay the principal and interest payments when due. The enhancement may be provided by a high-quality bank, insurance company or other corporation, or a collateral trust. The enhancements do not guarantee the market values of the securities.
LOC Principal and interest payments are guaranteed by a bank letter of credit or other bank credit agreement.
LIBOR — London InterBank Offered Rate
LIBOR03M — 3 Month US Dollar LIBOR, rate disclosed as of August 31, 2019, based on the last reset date of the security.
See notes to financial statements.
16
| Victory Portfolios II VictoryShares USAA Core Intermediate-Term Bond ETF | Schedule of Portfolio Investments August 31, 2019 | ||||||
Security Description | Principal Amount | Value | |||||||||
Asset Backed Securities (2.7%) | |||||||||||
| Avis Budget Rental Car Funding AESOP LLC, Series 2016-2A, Class B, 3.36%, 11/20/22 (a) | $ | 1,250,000 | $ | 1,274,141 | |||||||
| Avis Budget Rental Car Funding AESOP LLC, Series 2019-2A, Class B, 3.55%, 9/22/25 (a) | 500,000 | 523,849 | |||||||||
| Bank of The West Auto Trust, Series 2017-1, Class C, 2.96%, 2/15/24, Callable 11/15/21 @ 100 (a) | 500,000 | 510,053 | |||||||||
| Canadian Pacer Auto Receivables Trust, Series 2018-2A, Class B, 3.63%, 1/19/24, Callable 11/19/21 @ 100 (a) | 500,000 | 517,912 | |||||||||
ExteNet LLC, Series 2019-1A, Class A2, 3.20%, 7/26/49 (a) | 500,000 | 510,475 | |||||||||
| Navient Student Loan Trust, Series 2018-2A, Class B, 3.30% (LIBOR01M+115bps), 3/25/67, Callable 4/25/33 @ 100 (a) (b) | 1,000,000 | 1,012,762 | |||||||||
NP SPE II LLC, Series 2019-1A, Class A2, 1.00%, 9/20/49 (a) | 500,000 | 502,500 | |||||||||
OSCAR US Funding Trust VIII LLC, Series 2018-1A, Class A3, 3.23%, 5/10/22 (a) | 400,000 | 404,066 | |||||||||
PSNH Funding LLC, Series 2018-1, Class A3, 3.81%, 2/1/35 | 1,000,000 | 1,141,550 | |||||||||
| SCF Equipment Leasing LLC, Series 2019-1A, Class B, 3.49%, 1/20/26, Callable 4/20/20 @ 100 (a) | 500,000 | 517,069 | |||||||||
| SLM Student Loan Trust, Series 2006-10, Class B, 2.50% (LIBOR03M+22bps), 3/25/44, Callable 1/25/32 @ 100 (b) | 262,205 | 243,119 | |||||||||
| SLM Student Loan Trust, Series 2007-1, Class B, 2.50% (LIBOR03M+22bps), 1/27/42, Callable 10/25/28 @ 100 (b) | 424,054 | 394,058 | |||||||||
| Tesla Auto Lease Trust, Series 2018-A, Class B, 2.75%, 2/20/20, Callable 2/20/20 @ 100 (a) | 500,000 | 500,256 | |||||||||
| VB-S1 Issuer LLC, Series 2018-1A, Class C, 3.41%, 2/15/48, Callable 2/15/22 @ 100 (a) | 500,000 | 508,423 | |||||||||
Total Asset Backed Securities (Cost $8,290,730) | 8,560,233 | ||||||||||
Collateralized Mortgage Obligations (1.2%) | |||||||||||
| Citigroup Commercial Mortgage Trust, Series 2017-P8, Class AS, 3.79%, 9/15/50 (c) | 500,000 | 548,131 | |||||||||
| Citigroup Commercial Mortgage Trust, Series 2019-SMRT, Class C, 4.68%, 1/10/24 (a) | 500,000 | 540,463 | |||||||||
COMM Mortgage Trust, Series 2015-LC23, Class AM, 4.16%, 10/10/48 (c) | 250,000 | 273,568 | |||||||||
Deutsche Bank Mortgage Trust, Series 2016-SFC, Class A, 2.83%, 8/10/36 (a) | 250,000 | 258,380 | |||||||||
| JP Morgan Chase Commercial Mortgage Securities Trust, Series 2010-C2, Class C, 5.79%, 11/15/43 (a) (c) | 813,000 | 850,427 | |||||||||
| Octagon Investment Partners XXIII Ltd., Series 2015-1A, Class A1R, 3.15% (LIBOR03M+85bps), 7/15/27, Callable 10/15/19 @ 100 (a) (b) | 1,000,000 | 996,439 | |||||||||
| Wells Fargo Commercial Mortgage Trust, Series 2018-AUS, Class A, 4.19%, 7/17/36 (a) (c) | 250,000 | 283,514 | |||||||||
Total Collateralized Mortgage Obligations (Cost $3,644,480) | 3,750,922 | ||||||||||
Senior Secured Loans (0.2%) | |||||||||||
| Solera LLC, 1st Lien Term Loan B, 4.89% (LIBOR01M+300bps), 3/3/23, Callable 10/9/19 @ 100 (b) | 492,366 | 489,599 | |||||||||
| Sprint Communications, Inc., 1st Lien Term Loan B, 5.14% (LIBOR01M+300bps), 2/3/24, Callable 10/9/19 @ 100 (b) | 248,750 | 248,051 | |||||||||
Total Senior Secured Loans (Cost $738,990) | 737,650 | ||||||||||
See notes to financial statements.
17
| Victory Portfolios II VictoryShares USAA Core Intermediate-Term Bond ETF | Schedule of Portfolio Investments — continued August 31, 2019 | ||||||
Security Description | Principal Amount | Value | |||||||||
Corporate Bonds (52.6%) | |||||||||||
Communication Services (3.6%): | |||||||||||
AT&T, Inc., 4.35%, 3/1/29, Callable 12/1/28 @ 100 | $ | 1,500,000 | $ | 1,675,110 | |||||||
British Telecommunications PLC, 5.13%, 12/4/28, Callable 9/4/28 @ 100 | 1,000,000 | 1,155,900 | |||||||||
CBS Corp., 4.20%, 6/1/29, Callable 3/1/29 @ 100 | 1,000,000 | 1,101,100 | |||||||||
| Charter Communications Operating LLC/Charter Communications Operating Capital 4.50%, 2/1/24, Callable 1/1/24 @ 100 | 500,000 | 537,830 | |||||||||
3.75%, 2/15/28, Callable 11/15/27 @ 100 | 500,000 | 516,605 | |||||||||
| Clear Channel Worldwide Holdings, Inc., 5.13%, 8/15/27, Callable 8/15/22 @ 102.56 (a) | 500,000 | 523,265 | |||||||||
Comcast Corp., 3.55%, 5/1/28, Callable 2/1/28 @ 100 | 750,000 | 813,075 | |||||||||
| CSC Holdings LLC 6.63%, 10/15/25, Callable 10/15/20 @ 103.31 (a) | 500,000 | 535,190 | |||||||||
6.50%, 2/1/29, Callable 2/1/24 @ 103.25 (a) | 500,000 | 559,055 | |||||||||
Fox Corp., 4.71%, 1/25/29, Callable 10/25/28 @ 100 (a) | 1,000,000 | 1,157,910 | |||||||||
Meredith Corp., 6.88%, 2/1/26, Callable 2/1/21 @ 103.44 | 500,000 | 527,675 | |||||||||
Sprint Corp., 7.25%, 9/15/21 | 500,000 | 537,690 | |||||||||
Sprint Spectrum Co. LLC/Sprint Spectrum Co. II LLC, 4.74%, 9/20/29 (a) | 500,000 | 532,055 | |||||||||
T-Mobile USA, Inc., 4.75%, 2/1/28, Callable 2/1/23 @ 102.38 | 500,000 | 526,340 | |||||||||
Vodafone Group PLC, 5.00%, 5/30/38 | 500,000 | 580,155 | |||||||||
11,278,955 | |||||||||||
Consumer Discretionary (1.8%): | |||||||||||
AutoZone, Inc., 3.75%, 6/1/27, Callable 3/1/27 @ 100 | 500,000 | 539,240 | |||||||||
Brookfield Resid Properties, Inc., 6.13%, 7/1/22, Callable 10/10/19 @ 101.53 (a) | 480,000 | 486,662 | |||||||||
| Daimler Finance North America LLC 3.70%, 5/4/23 (a) | 1,000,000 | 1,044,090 | |||||||||
4.30%, 2/22/29 (a) | 1,000,000 | 1,116,780 | |||||||||
Dr Horton, Inc., 4.75%, 2/15/23, Callable 11/15/22 @ 100 | 500,000 | 534,915 | |||||||||
| L Brands, Inc. 5.63%, 10/15/23 | 250,000 | 262,650 | |||||||||
7.50%, 6/15/29, Callable 6/15/24 @ 103.75 | 500,000 | 490,500 | |||||||||
MGM Resorts International, 5.50%, 4/15/27, Callable 1/15/27 @ 100 | 500,000 | 541,565 | |||||||||
Newell Brands, Inc., 4.20%, 4/1/26, Callable 1/1/26 @ 100 | 500,000 | 518,475 | |||||||||
The William Carter Co., 5.63%, 3/15/27, Callable 3/15/22 @ 102.81 (a) | 100,000 | 106,567 | |||||||||
5,641,444 | |||||||||||
Consumer Staples (4.2%): | |||||||||||
| Anheuser-Busch InBev Worldwide, Inc. 3.65%, 2/1/26, Callable 11/1/25 @ 100 | 1,000,000 | 1,074,470 | |||||||||
4.38%, 4/15/38, Callable 10/15/37 @ 100 | 500,000 | 567,695 | |||||||||
5.45%, 1/23/39, Callable 7/23/38 @ 100 | 1,000,000 | 1,274,030 | |||||||||
B&G Foods, Inc., 5.25%, 4/1/25, Callable 4/1/20 @ 103.94 | 500,000 | 507,225 | |||||||||
| Bacardi Ltd. 4.45%, 5/15/25, Callable 3/15/25 @ 100 (a) | 1,500,000 | 1,610,955 | |||||||||
2.75%, 7/15/26, Callable 4/15/26 @ 100 (a) | 500,000 | 489,030 | |||||||||
BAT Capital Corp., 4.39%, 8/15/37, Callable 2/15/37 @ 100 | 250,000 | 251,240 | |||||||||
Becle SAB de CV, 3.75%, 5/13/25 (a) | 1,000,000 | 1,030,280 | |||||||||
See notes to financial statements.
18
| Victory Portfolios II VictoryShares USAA Core Intermediate-Term Bond ETF | Schedule of Portfolio Investments — continued August 31, 2019 | ||||||
Security Description | Principal Amount | Value | |||||||||
| Bunge Ltd. Finance Corp. 4.35%, 3/15/24, Callable 2/15/24 @ 100 | $ | 500,000 | $ | 532,165 | |||||||
3.25%, 8/15/26, Callable 5/15/26 @ 100 | 502,000 | 501,759 | |||||||||
Constellation Brands, Inc., 3.50%, 5/9/27, Callable 2/9/27 @ 100 | 750,000 | 792,660 | |||||||||
General Mills, Inc., 4.55%, 4/17/38, Callable 10/17/37 @ 100 | 1,000,000 | 1,153,500 | |||||||||
Imperial Brands Finance PLC, 3.88%, 7/26/29, Callable 4/26/29 @ 100 (a) | 1,000,000 | 1,036,410 | |||||||||
Mars, Inc., 3.88%, 4/1/39, Callable 10/1/38 @ 100 (a) | 1,000,000 | 1,143,630 | |||||||||
Molson Coors Brewing Co., 3.00%, 7/15/26, Callable 4/15/26 @ 100 | 250,000 | 252,660 | |||||||||
Smithfield Foods, Inc., 5.20%, 4/1/29, Callable 1/1/29 @ 100 (a) | 500,000 | 558,965 | |||||||||
The Kroger Co., 3.50%, 2/1/26, Callable 11/1/25 @ 100 | 500,000 | 523,890 | |||||||||
13,300,564 | |||||||||||
Energy (8.1%): | |||||||||||
| Aker BP ASA 6.00%, 7/1/22, Callable 10/10/19 @ 103 (a) | 250,000 | 256,943 | |||||||||
5.88%, 3/31/25, Callable 3/31/21 @ 102.94 (a) | 500,000 | 525,780 | |||||||||
| Andeavor Logistics LP/Tesoro Logistics Finance Corp., 4.25%, 12/1/27, Callable 9/1/27 @ 100 | 500,000 | 529,300 | |||||||||
| Boardwalk Pipelines LP 4.45%, 7/15/27, Callable 4/15/27 @ 100 | 1,500,000 | 1,561,095 | |||||||||
4.80%, 5/3/29, Callable 2/3/29 @ 100 | 500,000 | 525,290 | |||||||||
Buckeye Partners LP, 4.13%, 12/1/27, Callable 9/1/27 @ 100 | 2,500,000 | 2,196,724 | |||||||||
| Chevron Phillips Chemical Co. LLC/Chevron Phillips Chemical Co. LP 3.30%, 5/1/23, Callable 4/1/23 @ 100 (a) | 250,000 | 258,385 | |||||||||
3.70%, 6/1/28, Callable 3/1/28 @ 100 (a) | 250,000 | 268,870 | |||||||||
Continental Resources, Inc., 5.00%, 9/15/22, Callable 10/10/19 @ 100.83 | 160,000 | 161,390 | |||||||||
| Energy Transfer Operating LP, 5.27% (LIBOR03M+302bps), 11/1/66, Callable 10/10/19 @ 100 (b) | 500,000 | 376,820 | |||||||||
Eni SpA, 4.25%, 5/9/29, Callable 2/9/29 @ 100 (a) | 1,000,000 | 1,094,770 | |||||||||
Enlink Midstream Partners LP, 4.85%, 7/15/26, Callable 4/15/26 @ 100 | 500,000 | 492,720 | |||||||||
EQM Midstream Partners LP, 4.75%, 7/15/23, Callable 6/15/23 @ 100 | 500,000 | 504,155 | |||||||||
Midwest Connector Capital Co. LLC, 4.63%, 4/1/29, Callable 1/1/29 @ 100 (a) | 500,000 | 549,815 | |||||||||
| MPLX LP 4.00%, 3/15/28, Callable 12/15/27 @ 100 | 750,000 | 785,258 | |||||||||
4.80%, 2/15/29, Callable 11/15/28 @ 100 | 250,000 | 277,473 | |||||||||
Murphy Oil Corp., 5.75%, 8/15/25, Callable 8/15/20 @ 104.31 | 500,000 | 506,105 | |||||||||
Nabors Industries, Inc., 4.63%, 9/15/21 | 500,000 | 484,525 | |||||||||
Newfield Exploration Co., 5.38%, 1/1/26, Callable 10/1/25 @ 100 | 500,000 | 549,035 | |||||||||
| NuStar Logistics LP 4.75%, 2/1/22, Callable 11/1/21 @ 100 | 500,000 | 509,025 | |||||||||
6.00%, 6/1/26, Callable 3/1/26 @ 100 | 1,500,000 | 1,613,040 | |||||||||
Occidental Petroleum Corp., 3.50%, 8/15/29, Callable 5/15/29 @ 100 | 1,000,000 | 1,018,030 | |||||||||
| ONEOK, Inc. 4.55%, 7/15/28, Callable 4/15/28 @ 100 | 500,000 | 546,635 | |||||||||
4.35%, 3/15/29, Callable 12/15/28 @ 100 | 500,000 | 540,555 | |||||||||
Petrobras Global Finance BV, 5.75%, 2/1/29 | 1,000,000 | 1,083,650 | |||||||||
| Petroleos Mexicanos 6.38%, 2/4/21 | 250,000 | 257,943 | |||||||||
6.50%, 3/13/27 | 2,000,000 | 2,049,379 | |||||||||
Rockies Express Pipeline LLC, 4.95%, 7/15/29, Callable 4/15/29 @ 100 (a) | 2,000,000 | 2,040,520 | |||||||||
Sabal Trail Transmission LLC, 4.25%, 5/1/28, Callable 2/1/28 @ 100 (a) | 1,000,000 | 1,100,060 | |||||||||
See notes to financial statements.
19
| Victory Portfolios II VictoryShares USAA Core Intermediate-Term Bond ETF | Schedule of Portfolio Investments — continued August 31, 2019 | ||||||
Security Description | Principal Amount | Value | |||||||||
Saudi Arabian Oil Co., 4.25%, 4/16/39 (a) | $ | 1,000,000 | $ | 1,133,020 | |||||||
Southwestern Energy Co., 7.75%, 10/1/27, Callable 10/1/22 @ 103.88 | 500,000 | 436,600 | |||||||||
Targa Resources Partners LP, 6.50%, 7/15/27, Callable 7/15/22 @ 104.88 (a) | 100,000 | 108,396 | |||||||||
Transocean Guardian Ltd., 5.88%, 1/15/24, Callable 7/15/21 @ 102.94 (a) | 445,000 | 448,449 | |||||||||
Western Gas Partners LP, 4.50%, 3/1/28, Callable 12/1/27 @ 100 | 500,000 | 499,850 | |||||||||
Whiting Petroleum Corp., 6.63%, 1/15/26, Callable 10/15/25 @ 100 | 500,000 | 363,290 | |||||||||
25,652,895 | |||||||||||
Financials (15.8%): | |||||||||||
ABN AMRO Bank NV, 4.80%, 4/18/26 (a) | 500,000 | 550,995 | |||||||||
Amcor Finance USA, Inc., 3.63%, 4/28/26, Callable 1/28/26 @ 100 (a) | 250,000 | 259,160 | |||||||||
| American Equity Investment Life Holding Co., 5.00%, 6/15/27, Callable 3/15/27 @ 100 | 500,000 | 530,025 | |||||||||
Ares Capital Corp., 4.25%, 3/1/25, Callable 1/1/25 @ 100 | 500,000 | 519,105 | |||||||||
AXA Equitable Holdings, Inc., 4.35%, 4/20/28, Callable 1/20/28 @ 100 | 1,000,000 | 1,070,980 | |||||||||
Banco Santander SA, 4.38%, 4/12/28 | 600,000 | 660,258 | |||||||||
| Bank of America Corp., 3.70% (LIBOR03M+151bps), 4/24/28, Callable 4/24/27 @ 100 (b) | 1,000,000 | 1,077,220 | |||||||||
| Bank of Montreal, 3.80% (USSW5+143bps), 12/15/32, Callable 12/15/27 @ 100 (b) | 500,000 | 523,760 | |||||||||
| Barclays PLC 4.61% (LIBOR03M+140bps), 2/15/23, Callable 2/15/22 @ 100 (b) | 1,000,000 | 1,035,920 | |||||||||
3.93% (LIBOR03M+161bps), 5/7/25, Callable 5/7/24 @ 100 (b) | 500,000 | 513,985 | |||||||||
BB&T Corp., 4.25%, 9/30/24 | 750,000 | 815,468 | |||||||||
BMW US Capital LLC, 3.75%, 4/12/28, Callable 1/12/28 @ 100 (a) | 1,000,000 | 1,091,179 | |||||||||
| BNP Paribas SA, 4.71% (LIBOR03M+224bps), 1/10/25, Callable 1/10/24 @ 100 (a) (b) | 1,000,000 | 1,084,160 | |||||||||
| BPCE SA 4.00%, 9/12/23 (a) | 500,000 | 529,755 | |||||||||
3.25%, 1/11/28 (a) | 1,000,000 | 1,052,780 | |||||||||
Capital One Financial Corp., 3.75%, 7/28/26, Callable 6/28/26 @ 100 | 1,000,000 | 1,041,440 | |||||||||
CEMEX Finance LLC, 6.00%, 4/1/24, Callable 10/10/19 @ 103 (a) | 250,000 | 256,348 | |||||||||
CIT Group, Inc., 5.25%, 3/7/25, Callable 12/7/24 @ 100 | 500,000 | 559,220 | |||||||||
Citigroup, Inc., 4.13%, 7/25/28 | 1,000,000 | 1,088,900 | |||||||||
CNO Financial Group, Inc., 5.25%, 5/30/29, Callable 2/28/29 @ 100 | 1,000,000 | 1,106,050 | |||||||||
| Co-operatieve Rabobank UA, 4.00% (USSW5+189bps), 4/10/29, MTN, Callable 4/10/24 @ 100 (b) | 600,000 | 625,824 | |||||||||
Credit Acceptance Corp., 6.63%, 3/15/26, Callable 3/15/22 @ 103.31 (a) | 500,000 | 540,870 | |||||||||
Credit Agricole SA, 3.25%, 10/4/24 (a) | 250,000 | 258,295 | |||||||||
Credit Suisse Group Funding Guernsey Ltd., 3.75%, 3/26/25 | 500,000 | 528,455 | |||||||||
Deutsche Bank AG, 5.00%, 2/14/22 | 250,000 | 258,893 | |||||||||
Fairfax Financial Holdings Ltd., 4.85%, 4/17/28, Callable 1/17/28 @ 100 | 500,000 | 545,110 | |||||||||
Fifth Third Bancorp, 3.95%, 3/14/28, Callable 2/14/28 @ 100 | 500,000 | 554,490 | |||||||||
| Ford Motor Credit Co. LLC 4.54%, 8/1/26, Callable 6/1/26 @ 100 | 1,400,000 | 1,426,362 | |||||||||
5.11%, 5/3/29, Callable 2/3/29 @ 100 | 500,000 | 516,020 | |||||||||
FS KKR Capital Corp., 4.63%, 7/15/24, Callable 6/15/24 @ 100 | 1,000,000 | 1,017,240 | |||||||||
| Glencore Funding LLC 4.00%, 3/27/27, Callable 12/27/26 @ 100 (a) | 500,000 | 515,070 | |||||||||
4.88%, 3/12/29, Callable 12/12/28 @ 100 (a) | 750,000 | 810,023 | |||||||||
See notes to financial statements.
20
| Victory Portfolios II VictoryShares USAA Core Intermediate-Term Bond ETF | Schedule of Portfolio Investments — continued August 31, 2019 | ||||||
Security Description | Principal Amount | Value | |||||||||
| HSBC Holdings PLC 3.80% (LIBOR03M+121bps), 3/11/25, Callable 3/11/24 @ 100 (b) | $ | 500,000 | $ | 522,320 | |||||||
4.29% (LIBOR03M+135bps), 9/12/26, Callable 9/12/25 @ 100 (b) | 500,000 | 538,665 | |||||||||
Hyundai Capital America, 3.40%, 6/20/24 (a) | 500,000 | 512,735 | |||||||||
ILFC E-Capital Trust I, 4.09%, 12/21/65, Callable 10/10/19 @ 100 (a) | 500,000 | 349,465 | |||||||||
| KeyBank NA 3.40%, 5/20/26, MTN | 500,000 | 527,445 | |||||||||
3.90%, 4/13/29, Callable 3/13/29 @ 100 | 1,000,000 | 1,101,339 | |||||||||
KKR Group Finance Co. VI LLC, 3.75%, 7/1/29, Callable 4/1/29 @ 100 (a) | 500,000 | 530,680 | |||||||||
Lincoln National Corp., 3.80%, 3/1/28, Callable 12/1/27 @ 100 | 500,000 | 536,290 | |||||||||
| Lloyds Banking Group PLC 2.91% (LIBOR03M+81bps), 11/7/23, Callable 11/7/22 @ 100 (b) | 250,000 | 250,795 | |||||||||
3.57% (LIBOR03M+121bps), 11/7/28, Callable 11/7/27 @ 100 (b) | 250,000 | 256,105 | |||||||||
| Main Street Capital Corp. 4.50%, 12/1/22 | 500,000 | 517,515 | |||||||||
5.20%, 5/1/24 | 500,000 | 540,950 | |||||||||
Mercury General Corp., 4.40%, 3/15/27, Callable 12/15/26 @ 100 | 1,000,000 | 1,054,570 | |||||||||
| National Australia Bank Ltd., 3.93% (H15T5Y+188bps), 8/2/34, Callable 8/2/29 @ 100 (a) (b) | 1,500,000 | 1,556,925 | |||||||||
| Nationwide Building Society 3.62% (LIBOR03M+118bps), 4/26/23, Callable 4/26/22 @ 100 (a) (b) | 1,000,000 | 1,021,349 | |||||||||
4.27% (LIBOR03M+139bps), 8/1/24, Callable 8/1/23 @ 100 (a) (b) | 750,000 | 788,873 | |||||||||
4.30% (LIBOR03M+145bps), 3/8/29, Callable 3/8/28 @ 100 (a) (b) | 250,000 | 268,433 | |||||||||
3.96% (LIBOR03M+186bps), 7/18/30, Callable 7/18/29 @ 100 (a) (b) | 500,000 | 525,415 | |||||||||
| New York Community Bancorp, Inc., 5.90% (LIBOR03M+278bps), 11/6/28, Callable 11/6/23 @ 100 (b) | 250,000 | 261,405 | |||||||||
Old Republic International Corp., 3.88%, 8/26/26, Callable 7/26/26 @ 100 | 500,000 | 530,245 | |||||||||
Pine Street Trust I, 4.57%, 2/15/29, Callable 11/15/28 @ 100 (a) | 1,000,000 | 1,076,460 | |||||||||
Prudential Financial, Inc., 4.35%, 2/25/50, MTN, Callable 8/25/49 @ 100 | 500,000 | 595,285 | |||||||||
| Royal Bank of Scotland Group PLC 6.13%, 12/15/22 | 500,000 | 539,735 | |||||||||
4.27% (LIBOR03M+176bps), 3/22/25, Callable 3/22/24 @ 100 (b) | 1,000,000 | 1,043,290 | |||||||||
5.08% (LIBOR03M+191bps), 1/27/30, Callable 1/27/29 @ 100 (b) | 500,000 | 558,710 | |||||||||
4.44% (LIBOR03M+187bps), 5/8/30, Callable 5/8/29 @ 100 (b) | 1,000,000 | 1,069,659 | |||||||||
| Santander Holdings USA, Inc. 4.45%, 12/3/21, Callable 11/3/21 @ 100 | 250,000 | 260,703 | |||||||||
3.40%, 1/18/23, Callable 12/18/22 @ 100 | 250,000 | 256,815 | |||||||||
4.40%, 7/13/27, Callable 4/14/27 @ 100 | 750,000 | 806,985 | |||||||||
Societe Generale SA, 3.88%, 3/28/24 (a) | 1,000,000 | 1,052,910 | |||||||||
| Standard Chartered PLC, 4.87% (LIBOR03M+197bps), 3/15/33, Callable 3/15/28 @ 100 (a) (b) | 500,000 | 536,720 | |||||||||
Starwood Property Trust, Inc., 3.63%, 2/1/21, Callable 11/1/20 @ 100 | 1,000,000 | 1,006,720 | |||||||||
Sterling Bancorp, 3.50%, 6/8/20, Callable 5/8/20 @ 100 | 1,160,000 | 1,150,905 | |||||||||
| Synchrony Financial 4.50%, 7/23/25, Callable 4/23/25 @ 100 | 500,000 | 537,350 | |||||||||
3.95%, 12/1/27, Callable 9/1/27 @ 100 | 500,000 | 517,905 | |||||||||
5.15%, 3/19/29, Callable 12/19/28 @ 100 | 500,000 | 562,670 | |||||||||
| Synovus Financial Corp., 5.90% (USSW5+338bps), 2/7/29, Callable 2/7/24 @ 100 (b) | 500,000 | 526,350 | |||||||||
Texas Capital Bank NA, 5.25%, 1/31/26 | 250,000 | 263,878 | |||||||||
The Goldman Sachs Group, Inc., 2.90% (LIBOR03M+75bps), 2/23/23 (b) | 500,000 | 499,445 | |||||||||
See notes to financial statements.
21
| Victory Portfolios II VictoryShares USAA Core Intermediate-Term Bond ETF | Schedule of Portfolio Investments — continued August 31, 2019 | ||||||
Security Description | Principal Amount | Value | |||||||||
Torchmark Corp., 4.55%, 9/15/28, Callable 6/15/28 @ 100 | $ | 500,000 | $ | 562,415 | |||||||
Wells Fargo & Co., 3.00%, 10/23/26 | 1,000,000 | 1,037,530 | |||||||||
49,617,319 | |||||||||||
Health Care (2.6%): | |||||||||||
Becton Dickinson and Co., 3.70%, 6/6/27, Callable 3/6/27 @ 100 | 500,000 | 536,110 | |||||||||
Boston Medical Center Corp., 3.91%, 7/1/28 | 500,000 | 544,375 | |||||||||
Celgene Corp., 3.90%, 2/20/28, Callable 11/20/27 @ 100 | 500,000 | 552,580 | |||||||||
| CVS Health Corp. 4.30%, 3/25/28, Callable 12/25/27 @ 100 | 500,000 | 545,310 | |||||||||
3.25%, 8/15/29, Callable 5/15/29 @ 100 | 500,000 | 507,430 | |||||||||
DaVita, Inc., 5.00%, 5/1/25, Callable 5/1/20 @ 102.5 | 500,000 | 500,660 | |||||||||
Eastern Maine Healthcare Systems, 3.71%, 7/1/26 | 465,000 | 466,088 | |||||||||
HCA, Inc., 4.50%, 2/15/27, Callable 8/15/26 @ 100 | 500,000 | 542,345 | |||||||||
Mercy Health, 4.30%, 7/1/28 | 250,000 | 285,748 | |||||||||
Mylan NV, 3.95%, 6/15/26, Callable 3/15/26 @ 100 | 500,000 | 519,635 | |||||||||
Orlando Health Obligated Group, 3.78%, 10/1/28, Callable 7/1/28 @ 100 | 500,000 | 552,740 | |||||||||
Premier Health Partners, 2.91%, 11/15/26, Callable 5/15/26 @ 100 | 750,000 | 741,539 | |||||||||
Quest Diagnostics, Inc., 3.45%, 6/1/26, Callable 3/1/26 @ 100 | 250,000 | 263,833 | |||||||||
Takeda Pharmaceutical Co. Ltd., 5.00%, 11/26/28, Callable 8/26/28 @ 100 (a) | 500,000 | 591,270 | |||||||||
Teva Pharmaceutical Finance IV BV, 3.65%, 11/10/21 | 500,000 | 474,040 | |||||||||
7,623,703 | |||||||||||
Industrials (5.9%): | |||||||||||
Air Canada Pass Through Trust, 5.38%, 11/15/22 (a) | 183,344 | 187,768 | |||||||||
Aircastle Ltd., 4.40%, 9/25/23, Callable 8/25/23 @ 100 | 500,000 | 526,140 | |||||||||
| American Airlines Pass Through Trust 3.70%, 4/1/28 | 375,960 | 398,514 | |||||||||
3.85%, 8/15/29 | 500,000 | 507,245 | |||||||||
3.60%, 4/15/31 | 472,939 | 489,520 | |||||||||
Aramark Services, Inc., 5.00%, 2/1/28, Callable 2/1/23 @ 102.5 (a) | 500,000 | 518,725 | |||||||||
| Arconic, Inc. 5.13%, 10/1/24, Callable 7/1/24 @ 100 | 250,000 | 266,000 | |||||||||
5.90%, 2/1/27 | 250,000 | 278,900 | |||||||||
| Avolon Holdings Funding Ltd. 5.25%, 5/15/24, Callable 4/15/24 @ 100 (a) | 1,000,000 | 1,078,479 | |||||||||
4.38%, 5/1/26, Callable 3/1/26 @ 100 (a) | 500,000 | 521,710 | |||||||||
| British Airways Pass Through Trust 3.35%, 12/15/30 (a) | 500,000 | 511,785 | |||||||||
3.80%, 3/20/33 (a) | 729,432 | 778,479 | |||||||||
CK Hutchison International 17 Ltd., 3.50%, 4/5/27 (a) | 750,000 | 795,443 | |||||||||
Delta Air Lines, Inc., 4.38%, 4/19/28, Callable 1/19/28 @ 100 | 1,000,000 | 1,077,650 | |||||||||
FedEx Corp., 3.90%, 2/1/35 | 250,000 | 261,310 | |||||||||
Flowserve Corp., 4.00%, 11/15/23, Callable 8/15/23 @ 100 | 250,000 | 257,818 | |||||||||
| Hawaiian Airlines Pass Through Certificates 4.95%, 7/15/23 | 639,190 | 652,926 | |||||||||
3.90%, 7/15/27 | 115,542 | 119,284 | |||||||||
Hubbell, Inc., 3.50%, 2/15/28, Callable 11/15/27 @ 100 | 1,000,000 | 1,047,060 | |||||||||
Ingersoll-Rand Global Holding Co. Ltd., 3.75%, 8/21/28, Callable 5/21/28 @ 100 | 500,000 | 541,720 | |||||||||
Latam Airlines Pass Through Trust, 4.20%, 8/15/29 | 796,198 | 799,741 | |||||||||
Northrop Grumman Corp., 3.25%, 1/15/28, Callable 10/15/27 @ 100 | 500,000 | 530,825 | |||||||||
See notes to financial statements.
22
| Victory Portfolios II VictoryShares USAA Core Intermediate-Term Bond ETF | Schedule of Portfolio Investments — continued August 31, 2019 | ||||||
Security Description | Principal Amount | Value | |||||||||
| Penske Truck Leasing Co LP/Penske Truck Leasing Finance Corp. 3.95%, 3/10/25, Callable 1/10/25 @ 100 (a) | $ | 500,000 | $ | 531,120 | |||||||
4.45%, 1/29/26, Callable 11/29/25 @ 100 (a) | 1,000,000 | 1,091,830 | |||||||||
Rolls-Royce PLC, 3.63%, 10/14/25, Callable 7/14/25 @ 100 (a) | 275,000 | 289,094 | |||||||||
Ryder System, Inc., 3.40%, 3/1/23, MTN, Callable 2/1/23 @ 100 | 1,000,000 | 1,038,290 | |||||||||
Union Pacific Corp., 4.30%, 3/1/49, Callable 9/1/48 @ 100 | 500,000 | 595,520 | |||||||||
United Airlines Pass Through Trust, 3.70%, 9/1/31 | 491,296 | 514,800 | |||||||||
United Rentals North America, Inc., 5.50%, 7/15/25, Callable 7/15/20 @ 102.75 | 750,000 | 784,118 | |||||||||
| Wabtec Corp. 3.45%, 11/15/26, Callable 8/15/26 @ 100 | 750,000 | 765,600 | |||||||||
4.95%, 9/15/28, Callable 6/15/28 @ 100 | 560,000 | 624,842 | |||||||||
18,382,256 | |||||||||||
Information Technology (1.5%): | |||||||||||
Amphenol Corp., 4.35%, 6/1/29, Callable 3/1/29 @ 100 | 500,000 | 567,685 | |||||||||
CommScope, Inc., 6.00%, 3/1/26, Callable 3/1/22 @ 103 (a) | 500,000 | 508,285 | |||||||||
Dell International LLC/EMC Corp., 4.90%, 10/1/26, Callable 8/1/26 @ 100 (a) | 500,000 | 533,635 | |||||||||
Micron Technology, Inc., 4.66%, 2/15/30, Callable 11/15/29 @ 100 | 1,000,000 | 1,041,860 | |||||||||
Motorola Solutions, Inc., 4.60%, 2/23/28, Callable 11/23/27 @ 100 | 750,000 | 814,853 | |||||||||
Salesforce.com, Inc., 3.70%, 4/11/28, Callable 1/11/28 @ 100 | 1,000,000 | 1,115,660 | |||||||||
4,581,978 | |||||||||||
Materials (4.6%): | |||||||||||
Anglo American Capital PLC, 4.00%, 9/11/27 (a) | 1,000,000 | 1,031,230 | |||||||||
Ball Corp., 4.88%, 3/15/26, Callable 12/15/25 @ 100 | 500,000 | 548,085 | |||||||||
Cemex SAB de CV, 7.75%, 4/16/26, Callable 4/16/21 @ 103.88 (a) | 500,000 | 538,760 | |||||||||
| Crown Americas LLC/Crown Americas Capital Corp. 4.75%, 2/1/26, Callable 2/1/21 @ 103.56 | 500,000 | 525,205 | |||||||||
4.25%, 9/30/26, Callable 3/31/26 @ 100 | 500,000 | 521,860 | |||||||||
DuPont de Nemours, Inc., 4.73%, 11/15/28, Callable 8/15/28 @ 100 | 500,000 | 578,930 | |||||||||
Freeport-McMoRan, Inc., 3.55%, 3/1/22, Callable 12/1/21 @ 100 | 1,000,000 | 1,002,690 | |||||||||
Huntsman International LLC, 4.50%, 5/1/29, Callable 2/1/29 @ 100 | 500,000 | 533,645 | |||||||||
International Paper Co., 3.00%, 2/15/27, Callable 11/15/26 @ 100 | 750,000 | 766,725 | |||||||||
Kinross Gold Corp., 5.95%, 3/15/24, Callable 12/15/23 @ 100 | 500,000 | 556,780 | |||||||||
LafargeHolcim Finance US LLC, 3.50%, 9/22/26, Callable 6/22/26 @ 100 (a) | 1,500,000 | 1,545,660 | |||||||||
Martin Marietta Materials, Inc., 3.50%, 12/15/27, Callable 9/15/27 @ 100 | 625,000 | 645,013 | |||||||||
Nutrien Ltd., 4.20%, 4/1/29, Callable 1/1/29 @ 100 | 1,000,000 | 1,116,470 | |||||||||
Packaging Corp of America, 3.40%, 12/15/27, Callable 9/15/27 @ 100 | 500,000 | 521,750 | |||||||||
Reliance Steel & Aluminum Co., 4.50%, 4/15/23, Callable 1/15/23 @ 100 | 500,000 | 531,420 | |||||||||
Reynolds Group Issuer, Inc., 5.13%, 7/15/23, Callable 10/10/19 @ 102.56 (a) | 250,000 | 256,843 | |||||||||
Syngenta Finance NV, 3.93%, 4/23/21 (a) | 500,000 | 509,270 | |||||||||
The Mosaic Co., 4.05%, 11/15/27, Callable 8/15/27 @ 100 | 1,000,000 | 1,043,680 | |||||||||
Vale Overseas Ltd., 6.25%, 8/10/26 | 1,000,000 | 1,151,490 | |||||||||
Vulcan Materials Co., 3.90%, 4/1/27, Callable 1/1/27 @ 100 | 500,000 | 529,125 | |||||||||
14,454,631 | |||||||||||
Real Estate (2.0%): | |||||||||||
AvalonBay Communities, Inc., 3.20%, 1/15/28, MTN, Callable 10/15/27 @ 100 | 750,000 | 797,070 | |||||||||
EPR Properties, 4.95%, 4/15/28, Callable 1/15/28 @ 100 | 500,000 | 548,950 | |||||||||
Hospitality Properties Trust, 4.95%, 2/15/27, Callable 8/15/26 @ 100 | 500,000 | 519,280 | |||||||||
See notes to financial statements.
23
| Victory Portfolios II VictoryShares USAA Core Intermediate-Term Bond ETF | Schedule of Portfolio Investments — continued August 31, 2019 | ||||||
Security Description | Principal Amount | Value | |||||||||
| Hudson Pacific Properties LP 3.95%, 11/1/27 | $ | 500,000 | $ | 533,265 | |||||||
4.65%, 4/1/29, Callable 1/1/29 @ 100 | 500,000 | 561,745 | |||||||||
| MPT Operating Partnership LP/MPT Finance Corp., 4.63%, 8/1/29, Callable 8/1/24 @ 102.31 | 1,500,000 | 1,558,575 | |||||||||
| Sabra Health Care LP/Sabra Capital Corp., 5.38%, 6/1/23, Callable 10/10/19 @ 101.79 | 825,000 | 838,538 | |||||||||
STORE Capital Corp., 4.63%, 3/15/29, Callable 12/15/28 @ 100 | 500,000 | 553,985 | |||||||||
Vornado Realty LP, 3.50%, 1/15/25, Callable 11/15/24 @ 100 | 500,000 | 518,930 | |||||||||
6,430,338 | |||||||||||
Utilities (2.5%): | |||||||||||
American Water Capital Corp., 2.95%, 9/1/27, Callable 6/1/27 @ 100 | 1,000,000 | 1,036,910 | |||||||||
Aqua America, Inc., 4.28%, 5/1/49, Callable 11/1/48 @ 100 | 500,000 | 591,150 | |||||||||
Comision Federal de Electricidad, 4.88%, 5/26/21 (a) | 750,000 | 778,283 | |||||||||
Dominion Energy, Inc., 3.07%, 8/15/24 | 1,000,000 | 1,029,360 | |||||||||
Edison International, 5.75%, 6/15/27, Callable 4/15/27 @ 100 | 500,000 | 568,480 | |||||||||
Entergy Louisiana LLC, 4.00%, 3/15/33, Callable 12/15/32 @ 100 | 1,000,000 | 1,164,590 | |||||||||
National Fuel Gas Co., 4.75%, 9/1/28, Callable 6/1/28 @ 100 | 1,000,000 | 1,080,350 | |||||||||
Southern California Edison Co., 4.00%, 4/1/47, Callable 10/1/46 @ 100 | 500,000 | 546,030 | |||||||||
| The Cleveland Electric Illuminating Co., 4.55%, 11/15/30, Callable 8/15/30 @ 100 (a) | 500,000 | 574,300 | |||||||||
| Vistra Operations Co. LLC 3.55%, 7/15/24, Callable 6/15/24 @ 100 (a) | 500,000 | 505,685 | |||||||||
4.30%, 7/15/29, Callable 4/15/29 @ 100 (a) | 500,000 | 510,445 | |||||||||
8,385,583 | |||||||||||
Total Corporate Bonds (Cost $155,540,480) | 165,349,666 | ||||||||||
Municipal Bonds (1.2%) | |||||||||||
California (0.2%): | |||||||||||
| San Jose Redevelopment Agency Successor Agency, Series A-T, 3.13%, 8/1/28, Continuously Callable @ 100 | 500,000 | 536,035 | |||||||||
Connecticut (0.2%): | |||||||||||
State of Connecticut, GO, Series A, 3.43%, 4/15/28 | 500,000 | 545,855 | |||||||||
Illinois (0.2%): | |||||||||||
Illinois Finance Authority, Revenue, 3.55%, 8/15/29 | 500,000 | 540,145 | |||||||||
Kentucky (0.2%): | |||||||||||
| Kentucky Economic Development Finance Authority, Revenue, 3.82%, 12/1/27, AGM | 500,000 | 543,885 | |||||||||
Oklahoma (0.1%): | |||||||||||
Oklahoma Development Finance Authority, Revenue, Series C, 5.45%, 8/15/28 | 500,000 | 588,320 | |||||||||
Pennsylvania (0.1%): | |||||||||||
Commonwealth Financing Authority, Revenue, Series A, 3.63%, 6/1/29 | 500,000 | 555,305 | |||||||||
Texas (0.2%): | |||||||||||
| Ector County Hospital District Revenue, Build America Bond, 6.80%, 9/15/25, Continuously Callable @ 100 | 500,000 | 511,775 | |||||||||
Total Municipal Bonds (Cost $3,499,784) | 3,821,320 | ||||||||||
See notes to financial statements.
24
| Victory Portfolios II VictoryShares USAA Core Intermediate-Term Bond ETF | Schedule of Portfolio Investments — continued August 31, 2019 | ||||||
Security Description | Principal Amount | Value | |||||||||
U.S. Government Agency Mortgages (11.1%) | |||||||||||
| Federal Home Loan Mortgage Corporation Series K028, Class A2, 3.11%, 2/25/23 | $ | 1,000,000 | $ | 1,039,333 | |||||||
Series KIR3, Class A2, 3.28%, 8/25/27 | 1,500,000 | 1,636,843 | |||||||||
Series K085, Class A2, 4.06%, 10/25/28 | 500,000 | 580,847 | |||||||||
Series K095, Class A2, 2.79%, 6/25/29 | 1,000,000 | 1,066,633 | |||||||||
Series K096, Class A2, 2.52%, 7/25/29 | 1,000,000 | 1,044,099 | |||||||||
3.00%, 2/1/33 | 485,398 | 498,704 | |||||||||
4.00%, 8/1/44 – 5/1/46 | 2,047,621 | 2,159,714 | |||||||||
3.50%, 6/1/46 – 7/1/47 | 3,383,041 | 3,511,176 | |||||||||
11,537,349 | |||||||||||
| Federal National Mortgage Association Series M4, Class A2, 3.14%, 3/25/28 | 500,000 | 537,647 | |||||||||
Series 2019-M1, Class A2, 3.67%, 9/25/28 | 750,000 | 840,641 | |||||||||
Series 2019-M12, Class A2, 2.89%, 5/25/29 | 1,000,000 | 1,069,264 | |||||||||
4.00%, 12/1/41 – 4/1/44 | 492,270 | 524,130 | |||||||||
3.50%, 9/1/45 – 7/1/47 | 5,764,949 | 5,989,288 | |||||||||
4.50%, 8/1/47 | 56,458 | 59,899 | |||||||||
9,020,869 | |||||||||||
| Federal National Mortgage Corporation Series K059, Class A2, 3.12%, 9/25/26 | 1,000,000 | 1,076,600 | |||||||||
Series K069, Class A2, 3.19%, 9/25/27 | 86,000 | 93,268 | |||||||||
Series K071, Class A2, 3.29%, 11/25/27 | 500,000 | 546,438 | |||||||||
Series K075, Class A2, 3.65%, 2/25/28 | 500,000 | 559,796 | |||||||||
Series K083, Class A2, 4.05%, 9/25/28 | 250,000 | 290,359 | |||||||||
Series K087, Class A2, 3.77%, 12/25/28 | 500,000 | 570,437 | |||||||||
Series K091, Class A2, 3.51%, 3/25/29 | 1,250,000 | 1,401,093 | |||||||||
Series 4818, Class VD, 4.00%, 6/15/29 – 7/1/42 | 3,170,856 | 3,308,546 | |||||||||
Series K094, Class A2, 2.90%, 6/25/29 | 1,000,000 | 1,074,849 | |||||||||
Series K159, Class A2, 3.95%, 11/25/30 | 500,000 | 586,711 | |||||||||
3.00%, 3/1/31 | 272,695 | 280,931 | |||||||||
Series K154, Class A3, 3.46%, 11/25/32 | 100,000 | 111,463 | |||||||||
3.50%, 5/1/33 – 11/1/47 | 1,792,370 | 1,859,260 | |||||||||
Series K-1510, Class A3, 3.79%, 1/25/34 | 1,000,000 | 1,166,461 | |||||||||
Series K1511, Class A3, 3.54%, 3/25/34 | 250,000 | 285,300 | |||||||||
Series K-1512, Class A3, 3.06%, 4/25/34 | 1,000,000 | 1,084,643 | |||||||||
4.50%, 12/1/45 | 201,456 | 218,336 | |||||||||
14,514,491 | |||||||||||
Total U.S. Government Agency Mortgages (Cost $33,755,754) | 35,072,709 | ||||||||||
U.S. Treasury Obligations (26.6%) | |||||||||||
U.S. Treasury Bills, 1.84%, 1/2/20 (d) | 1,100,000 | 1,093,134 | |||||||||
| U.S. Treasury Bonds 4.38%, 2/15/38 | 750,000 | 1,061,602 | |||||||||
4.38%, 11/15/39 | 1,000,000 | 1,433,750 | |||||||||
3.13%, 11/15/41 | 1,000,000 | 1,221,563 | |||||||||
2.75%, 8/15/47 | 500,000 | 583,516 | |||||||||
2.75%, 11/15/47 | 500,000 | 583,984 | |||||||||
See notes to financial statements.
25
| Victory Portfolios II VictoryShares USAA Core Intermediate-Term Bond ETF | Schedule of Portfolio Investments — continued August 31, 2019 | ||||||
Security Description | Principal Amount | Value | |||||||||
3.00%, 2/15/48 | $ | 3,500,000 | $ | 4,284,765 | |||||||
3.38%, 11/15/48 | 2,012,000 | 2,642,951 | |||||||||
2.88%, 5/15/49 | 3,000,000 | 3,610,312 | |||||||||
U.S. Treasury Inflation Indexed Bonds, 0.88%, 1/15/29 | 500,000 | 549,216 | |||||||||
| U.S. Treasury Notes 2.75%, 11/30/20 | 250,000 | 253,203 | |||||||||
2.25%, 2/15/21 | 195,000 | 196,714 | |||||||||
2.38%, 3/15/21 | 2,000,000 | 2,022,734 | |||||||||
2.38%, 4/15/21 | 3,850,000 | 3,896,620 | |||||||||
1.63%, 6/30/21 | 1,000,000 | 1,001,211 | |||||||||
1.75%, 7/31/21 | 1,000,000 | 1,004,141 | |||||||||
2.75%, 8/15/21 | 1,700,000 | 1,739,246 | |||||||||
2.88%, 11/15/21 | 3,630,000 | 3,736,914 | |||||||||
2.50%, 1/15/22 | 712,000 | 728,743 | |||||||||
1.50%, 1/31/22 | 1,000,000 | 1,000,703 | |||||||||
1.88%, 1/31/22 | 1,000,000 | 1,009,141 | |||||||||
2.50%, 2/15/22 | 2,000,000 | 2,049,219 | |||||||||
1.88%, 2/28/22 | 1,700,000 | 1,716,602 | |||||||||
2.25%, 4/15/22 | 2,000,000 | 2,040,313 | |||||||||
1.50%, 8/15/22 | 1,000,000 | 1,001,953 | |||||||||
2.00%, 10/31/22 | 400,000 | 406,906 | |||||||||
2.00%, 4/30/24 | 24,550,000 | 25,192,519 | |||||||||
2.75%, 2/28/25 | 850,000 | 909,234 | |||||||||
3.00%, 9/30/25 | 300,000 | 327,000 | |||||||||
1.50%, 8/15/26 | 2,000,000 | 2,005,938 | |||||||||
2.00%, 11/15/26 | 2,700,000 | 2,800,406 | |||||||||
2.25%, 8/15/27 | 1,000,000 | 1,058,125 | |||||||||
2.25%, 11/15/27 | 1,700,000 | 1,800,672 | |||||||||
2.75%, 2/15/28 | 2,000,000 | 2,200,000 | |||||||||
2.88%, 8/15/28 | 630,000 | 702,155 | |||||||||
3.13%, 11/15/28 | 1,000,000 | 1,138,438 | |||||||||
2.63%, 2/15/29 | 1,000,000 | 1,097,969 | |||||||||
3.50%, 2/15/39 | 2,770,000 | 3,546,898 | |||||||||
Total U.S. Treasury Obligations (Cost $77,961,137) | 83,648,510 | ||||||||||
Commercial Papers (1.9%) | |||||||||||
CSLB Holdings, Inc., 2.82%, 9/4/19 (d) | 1,300,000 | 1,299,593 | |||||||||
Erac USA Finance LLC, 2.52%, 9/9/19 (d) | 1,600,000 | 1,598,992 | |||||||||
Southern Co. Gas Capital, 2.71%, 9/5/19 (d) | 3,000,000 | 2,998,871 | |||||||||
Total Commercial Papers (Cost $5,898,165) | 5,897,456 | ||||||||||
Total Investments (Cost $289,329,520) — 97.5% | 306,838,466 | ||||||||||
Other assets in excess of liabilities — 2.5% | 8,017,698 | ||||||||||
NET ASSETS — 100.00% | $ | 314,856,164 | |||||||||
(a) Rule 144A security or other security that is restricted as to resale to institutional investors. The Fund's Adviser has deemed this security to be liquid based upon procedures approved by the Board of Trustees. As of August 31, 2019, the fair value of these securities was $58,783,280 and amounted to 18.7% of net assets.
(b) Variable or Floating-Rate Security. Rate disclosed is as of August 31, 2019.
See notes to financial statements.
26
| Victory Portfolios II VictoryShares USAA Core Intermediate-Term Bond ETF | Schedule of Portfolio Investments — continued August 31, 2019 | ||||||
(c) The rate for certain asset-backed and mortgage-backed securities may vary based on factors relating to the pool of assets underlying the security. The rate disclosed is the rate in effect at August 31, 2019.
(d) Rate represents the effective yield at August 31, 2019.
AGM — Assured Guaranty Municipal Corporation
bps — Basis points
GO — General Obligation
H15T5Y — 5 Year Treasury Constant Maturity Rate, rate disclosed as of August 31, 2019.
LLC — Limited Liability Company
LP — Limited Partnership
MTN — Medium Term Note
PLC — Public Limited Company
USSW5 — USD 5 Year Swap Rate, rate disclosed as of August 31, 2019.
LIBOR — London InterBank Offered Rate
LIBOR01M — 1 Month US Dollar LIBOR, rate disclosed as of August 31, 2019, based on the last reset date of the security.
LIBOR03M — 3 Month US Dollar LIBOR, rate disclosed as of August 31, 2019, based on the last reset date of the security.
See notes to financial statements.
27
Victory Portfolios II | Statements of Assets and Liabilities August 31, 2019 | ||||||
| VictoryShares USAA Core Short-Term Bond ETF | VictoryShares USAA Core Intermediate-Term Bond ETF | ||||||||||
ASSETS: | |||||||||||
Investments, at value (Cost $81,270,608 and $289,329,520) | $ | 82,447,801 | $ | 306,838,466 | |||||||
Cash and cash equivalents | 478,969 | 5,634,702 | |||||||||
Interest and dividends receivable | 625,633 | 2,485,194 | |||||||||
Receivable for capital shares issued | 2,534,058 | — | |||||||||
Receivable for investments sold | 500,000 | — | |||||||||
Receivable from Adviser | 1,193 | — | |||||||||
Total Assets | 86,587,654 | 314,958,362 | |||||||||
LIABILITIES: | |||||||||||
Payables: | |||||||||||
Investments purchased | 2,985,902 | — | |||||||||
Accrued expenses and other payables: | |||||||||||
Investment advisory fees | 17,323 | 77,860 | |||||||||
Administration fees | 3,469 | 7,932 | |||||||||
Custodian fees | 1,699 | 3,655 | |||||||||
Chief Compliance Officer fees | 63 | 116 | |||||||||
Other accrued expenses | 5,903 | 12,635 | |||||||||
Total Liabilities | 3,014,359 | 102,198 | |||||||||
NET ASSETS: | |||||||||||
Capital | 82,377,626 | 297,192,289 | |||||||||
Total distributable earnings/(loss) | 1,195,669 | 17,663,875 | |||||||||
Net Assets | $ | 83,573,295 | $ | 314,856,164 | |||||||
Shares Outstanding (unlimited shares authorized, no par value): | 1,650,000 | 6,000,000 | |||||||||
Net asset value: | $ | 50.65 | $ | 52.48 | |||||||
See notes to financial statements.
28
Victory Portfolios II | Statements of Operations For the Year Ended August 31, 2019 | ||||||
| VictoryShares USAA Core Short-Term Bond ETF | VictoryShares USAA Core Intermediate-Term Bond ETF | ||||||||||
Investment Income: | |||||||||||
Interest | $ | 2,199,481 | $ | 7,820,553 | |||||||
Total Income | 2,199,481 | 7,820,553 | |||||||||
Expenses: | |||||||||||
Management fees | 142,696 | 489,000 | |||||||||
Administration and operating service fees | 85,618 | 244,500 | |||||||||
Investment advisory fees | 34,456 | 149,893 | |||||||||
Administration fees | 11,308 | 32,659 | |||||||||
Custodian fees | 2,059 | 4,014 | |||||||||
Servicing fees | 683 | 683 | |||||||||
Trustees' fees | 1,892 | 4,986 | |||||||||
Chief Compliance Officer fees | 115 | 288 | |||||||||
Legal and audit fees | 2,828 | 6,317 | |||||||||
Other expenses | 2,535 | 6,163 | |||||||||
Total Expenses | 284,190 | 938,503 | |||||||||
Management fee waiver | (28,539 | ) | (81,500 | ) | |||||||
Expenses waived/reimbursed by Adviser | (7,765 | ) | (17,737 | ) | |||||||
Net Expenses | 247,886 | 839,266 | |||||||||
Net Investment Income (Loss) | 1,951,595 | 6,981,287 | |||||||||
Realized/Unrealized Gains (Losses) from Investments: | |||||||||||
Net realized gains (losses) from investment securities | 10,689 | (87,276 | ) | ||||||||
Net realized gains (losses) from futures contracts | — | (194 | ) | ||||||||
| Net change in unrealized appreciation/depreciation on investment securities | 1,644,842 | 19,860,520 | |||||||||
| Net change in unrealized appreciation/depreciation on futures contracts | — | 1,401 | |||||||||
Net realized/unrealized gains (losses) on investments | 1,655,531 | 19,774,451 | |||||||||
Change in net assets resulting from operations | $ | 3,607,126 | $ | 26,755,738 | |||||||
See notes to financial statements.
29
Victory Portfolios II | Statements of Changes in Net Assets | ||||||
| VictoryShares USAA Core Short-Term Bond ETF | VictoryShares USAA Core Intermediate-Term Bond ETF | ||||||||||||||||||
| Year Ended August 31, 2019 | For the Period October 24, 2017(a) through August 31, 2018 (000's) | Year Ended August 31, 2019 | For the Period October 24, 2017(a) through August 31, 2018 (000's) | ||||||||||||||||
From Investment Activities: | |||||||||||||||||||
Operations: | |||||||||||||||||||
Net investment income (loss) | $ | 1,951,595 | $ | 849 | $ | 6,981,287 | $ | 2,672 | |||||||||||
| Net realized gains (losses) from investments | 10,689 | (55 | ) | (87,470 | ) | (39 | ) | ||||||||||||
| Net change in unrealized appreciation/depreciation on investments | 1,644,842 | (468 | ) | 19,861,921 | (2,353 | ) | |||||||||||||
| Change in net assets resulting from operations | 3,607,126 | 326 | 26,755,738 | 280 | |||||||||||||||
| Change in net assets resulting from distributions to shareholders (b) | (1,927,032 | ) | (811 | ) | (6,792,738 | ) | (2,580 | ) | |||||||||||
| Change in net assets resulting from capital transactions | 20,020,825 | 62,357 | 144,189,678 | 153,003 | |||||||||||||||
Change in net assets | 21,700,919 | 61,872 | 164,152,678 | 150,703 | |||||||||||||||
Net Assets: | |||||||||||||||||||
Beginning of period | 61,872,376 | — | 150,703,486 | — | |||||||||||||||
End of period | $ | 83,573,295 | $ | 61,872 | $ | 314,856,164 | $ | 150,703 | |||||||||||
Capital Transactions: | |||||||||||||||||||
Proceeds from shares issued | $ | 20,020,825 | $ | 62,357 | (c) | $ | 144,189,678 | $ | 153,003 | (c) | |||||||||
| Change in net assets resulting from capital transactions | $ | 20,020,825 | $ | 62,357 | $ | 144,189,678 | $ | 153,003 | |||||||||||
Share Transactions: | |||||||||||||||||||
Issued | 400,000 | 1,250 | 2,900,000 | 3,100 | |||||||||||||||
Change in Shares | 400,000 | 1,250 | 2,900,000 | 3,100 | |||||||||||||||
(a) Commencement of operations. Prior period is reported in thousands.
(b) Current and prior year distributions to shareholders have been reclassified and conform to amended GAAP presentation under Regulation S-X (See Item 8 in the Notes to Financial Statements).
(c) Includes $97 thousand and $190 thousand of variable fees incurred for the VictoryShares USAA Core Short-Term Bond ETF and VictoryShares USAA Core Intermediate-Term Bond ETF, respectively.
See notes to financial statements.
30
This page is intentionally left blank.
31
Victory Portfolios II | Financial Highlights | ||||||
For a Share Outstanding Throughout Each Period
Investment Activities | Distributions to Shareholders From | ||||||||||||||||||||||||||
| Net Asset Value, Beginning of Period | Net Investment Income (Loss)(a) | Net Realized and Unrealized Gains (Losses) on Investments | Total from Investment Activities | Net Investment Income | Net Realized Gains from Investments | ||||||||||||||||||||||
VictoryShares USAA Core Short-Term Bond ETF | |||||||||||||||||||||||||||
Year Ended 08/31/19 | $ | 49.50 | 1.37 | 1.13 | 2.50 | (1.35 | ) | — | |||||||||||||||||||
| 10/24/17 (d) through 08/31/18 | $ | 50.00 | 0.93 | (0.59 | ) | 0.34 | (0.84 | ) | — | ||||||||||||||||||
VictoryShares USAA Core Intermediate-Term Bond ETF | |||||||||||||||||||||||||||
Year Ended 08/31/19 | $ | 48.61 | 1.62 | 3.81 | 5.43 | (1.56 | ) | — | |||||||||||||||||||
| 10/24/17 (d) through 08/31/18 | $ | 49.93 | 1.29 | (1.46 | ) | (0.17 | ) | (1.15 | ) | — | |||||||||||||||||
(a) Per share net investment income (loss) has been calculated using the average daily shares method.
(b) Not annualized for periods less than one year.
(c) Annualized for periods less than one year.
(d) Commencement of operations.
(e) Excludes impact of in-kind transactions.
(f) Portfolio turnover decreased significantly due to changes in the volume and timing of purchases and sales of portfolio holdings during the year.
See notes to financial statements.
32
Victory Portfolios II | Financial Highlights — continued | ||||||
For a Share Outstanding Throughout Each Period
Ratios to Average Net Assets | Supplemental Data | ||||||||||||||||||||||||||||||||||
| Total Distributions to Shareholders | Net Asset Value, End of Period | Total Return(b) | Net Expenses(c) | Net Investment Income (Loss)(c) | Gross Expenses(c) | Net Assets, End of Period (000's) | Portfolio Turnover(b)(e) | ||||||||||||||||||||||||||||
VictoryShares USAA Core Short-Term Bond ETF | |||||||||||||||||||||||||||||||||||
Year Ended 08/31/19 | (1.35 | ) | $ | 50.65 | 5.11 | % | 0.35 | % | 2.75 | % | 0.40 | % | $ | 83,573 | 30 | % | |||||||||||||||||||
| 10/24/17 (d) through 08/31/18 | (0.84 | ) | $ | 49.50 | 0.70 | % | 0.35 | % | 2.21 | % | 0.40 | % | $ | 61,872 | 22 | % | |||||||||||||||||||
VictoryShares USAA Core Intermediate-Term Bond ETF | |||||||||||||||||||||||||||||||||||
Year Ended 08/31/19 | (1.56 | ) | $ | 52.48 | 11.37 | % | 0.39 | % | 3.27 | % | 0.44 | % | $ | 314,856 | 3 | %(f) | |||||||||||||||||||
| 10/24/17 (d) through 08/31/18 | (1.15 | ) | $ | 48.61 | (0.33 | )% | 0.40 | % | 3.10 | % | 0.45 | % | $ | 150,703 | 10 | % | |||||||||||||||||||
See notes to financial statements.
33
Victory Portfolios II | Notes to Financial Statements August 31, 2019 | ||||||
1. Organization:
Victory Portfolios II (the "Trust") was organized on April 11, 2012 as a Delaware statutory trust, as a successor to the "Compass EMP Funds Trust". The Trust is registered under the Investment Company Act of 1940, as amended (the "1940 Act"), as an open-end investment company. The Trust is currently comprised of 26 funds, 24 of which are exchange-traded funds ("ETFs"), and is authorized to issue an unlimited number of shares, which are units of beneficial interest with no par value. Each Fund is classified as diversified under the 1940 Act.
The accompanying financial statements are those of the following two Funds (collectively, the "Funds" and individually, a "Fund"). These Funds have been newly formed for the purposes of completing the reorganizations ("Reorganizations") with the two corresponding series of USAA ETF Trust ("USAA Trust"), a registered investment company (each such series, a "USAA Fund" or a "Predecessor Fund"), as follows:
Predecessor Fund Name | Fund Legal Name | Fund Short Name | |||||||||
| USAA Core Short-Term Bond ETF | VictoryShares USAA Core Short-Term Bond ETF | USAA Core Short-Term Bond ETF | |||||||||
| USAA Core Intermediate-Term Bond ETF | VictoryShares USAA Core Intermediate-Term Bond ETF | USAA Core Intermediate-Term Bond ETF | |||||||||
On April 18, 2019, shareholders of the USAA ETF Trust voted to approve the Agreement and Plan of Reorganization (the "Agreement"), which provided for the Reorganization of the Predecessor Funds into the Funds.
The Funds commenced operation on July 1, 2019, upon the completion of the Reorganizations and each Fund is the accounting successor of its respective Predecessor Fund. The Funds assumed the performance, financial and other historical information of the Predecessor Funds. Information presented for periods prior to the date of these financial statements reflects, where applicable, the historical information of the Predecessor Funds.
On November 6, 2018, United Services Automobile Association (USAA), the parent company of USAA Asset Management Company ("AMCO"), the investment adviser of the Predecessor Funds, announced that AMCO would be acquired by Victory Capital Holdings Inc., a global investment management firm headquartered in Cleveland, Ohio (the "Transaction"), on July 1, 2019. Effective July 1, 2019, Victory Capital Management Inc.'s internal investment team, Victory Solutions, began managing the Fund's net assets.
Under the Trust's organizational documents, its officers and trustees are indemnified against certain liabilities arising out of the performance of their duties to the Funds. In addition, in the normal course of business, the Funds enter into contracts with their vendors and others that provide for general indemnifications. The Funds' maximum exposure under these arrangements is unknown, as this would involve future claims that may be made against the Funds. However, based on experience, the Funds expect that risk of loss to be remote.
2. Significant Accounting Policies:
Shares of the Funds are listed and traded on NYSE Arca, Inc. ("Exchange"). The Funds will issue and redeem shares of a Fund ("Shares") at net asset value ("NAV") only in aggregations of 50,000 Shares (each a "Creation Unit"). The Funds will issue and redeem Creation Units principally in exchange for a basket of securities included in the respective Fund's Index (the "Deposit Securities"), together with the deposit of a specified cash payment (the "Cash Component"), plus a transaction fee. Shares will trade on the Exchange at market prices that may be below, at, or above NAV. Shares of a Fund may only be purchased or redeemed by certain financial institutions ("Authorized Participants"). An Authorized Participant is either (i) a broker-dealer or other participant in the clearing process through the Continuous Net Settlement System of the National Securities Clearing Corporation or (ii) a DTC participant and, in each case, must have executed a Participant Agreement with the Distributor. Most retail investors do not qualify as Authorized Participants nor have the resources to buy and sell whole
34
Victory Portfolios II | Notes to Financial Statements — continued August 31, 2019 | ||||||
Creation Units. Therefore, they are unable to purchase or redeem the shares directly from a Fund. In addition, shares may be issued in advance of receipt of Deposit Securities subject to various conditions, including a requirement to maintain on deposit with the Trust cash equal to up to 105% of the market value of the missing Deposit Securities. In each instance of such cash creations or redemptions, transaction fees may be imposed and may be higher than the transaction fees associated with in-kind creations or redemptions.
Each Fund may issue an unlimited number of shares of beneficial interest, with no par value. Shares of each Fund have equal rights and privileges. A purchase (i.e., creation) transaction fee is imposed for the transfer and other transactional costs associated with the purchase of Creation Units.
A purchase (i.e., creation) transaction fee is imposed for the transfer and other transactional costs associated with the purchase of Creation Units. In addition, a variable fee may be charged on all cash transactions or substitutes for Creation Units. Variable fees received by each Fund are displayed in the Capital Share Transaction section of the Statements of Changes in Net Assets as an increase to Capital.
The Transaction Fees for each Fund are listed below:
| Fee for In-Kind and Cash Purchases and Redemptions | Maximum Additional Variable Charge for Cash Purchases and Redemptions* | ||||||||||
USAA Core Short-Term Bond ETF | $ | 100 | 2.00 | % | |||||||
USAA Core Intermediate-Term Bond ETF | 100 | 2.00 | % | ||||||||
* As a percentage of the amount invested.
The following is a summary of significant accounting policies followed by the Trust in the preparation of its financial statements. The policies are in conformity with accounting principles generally accepted in the United States of America ("GAAP"). The preparation of financial statements in accordance with GAAP requires management to make estimates and assumptions that affect the reported amounts of assets and liabilities and disclosure of contingent assets and liabilities at the date of the financial statements and the reported amounts of income and expenses for the period. Actual results could differ from those estimates. The Funds follow the specialized accounting and reporting requirements under GAAP that are applicable to investment companies.
Investment Valuation:
The Funds record investments at fair value. Fair value is defined as the price that would be received to sell an asset or paid to transfer a liability in an orderly transaction between market participants at the measurement date.
The valuation techniques described below maximize the use of observable inputs and minimize the use of unobservable inputs in determining fair value. The inputs used for valuing the Funds' investments are summarized in the three broad levels listed below:
• Level 1 — quoted prices in active markets for identical securities
• Level 2 — other significant observable inputs (including quoted prices for similar securities or interest rates applicable to those securities, etc.)
• Level 3 — significant unobservable inputs (including the Funds' own assumptions in determining the fair value of investments)
Changes in valuation techniques may result in transfers in or out of an assigned level within the disclosure hierarchy. The inputs or methodologies used for valuation techniques are not necessarily an indication of the risk associated with entering into those investments.
Investments in open-end investment companies are valued at net asset value. These valuations are typically categorized as Level 1 in the fair value hierarchy.
35
Victory Portfolios II | Notes to Financial Statements — continued August 31, 2019 | ||||||
Futures contracts are valued at the settlement price established each day by the board of trade or an exchange on which they are traded. These valuations are typically categorized as Level 1 in the fair value hierarchy.
Debt securities of United States ("U.S.") issuers, along with corporate and municipal securities, including short-term investments maturing in 60 days or less, are valued on the basis of bid valuations provided by dealers or an independent pricing service approved by the Trust's Board of Trustees (the "Board"). These valuations are typically categorized as Level 2 in the fair value hierarchy.
Investments for which there are no such quotations, or for which quotations do not appear reliable, are valued at fair value in accordance with procedures established by and under the general supervision and responsibility of the Board. These valuations are typically categorized as Level 2 or Level 3 in the fair value hierarchy, based on the observability of inputs used to determine the fair value.
A summary of the valuations as of August 31, 2019, based upon the three levels defined above, is included in the table below while the breakdown, by category, of investments is disclosed in the Schedules of Portfolio Investments:
LEVEL 1 | LEVEL 2 | LEVEL 3 | Total | ||||||||||||||||
USAA Core Short-Term Bond ETF | |||||||||||||||||||
Asset Backed Securities | $ | — | $ | 8,414,810 | $ | — | $ | 8,414,810 | |||||||||||
Collateralized Mortgage Obligations | — | 3,025,988 | — | 3,025,988 | |||||||||||||||
Corporate Bonds | — | 55,601,010 | — | 55,601,010 | |||||||||||||||
Municipal Bonds | — | 9,521,642 | — | 9,521,642 | |||||||||||||||
U.S. Treasury Obligations | — | 5,239,512 | — | 5,239,512 | |||||||||||||||
Commercial Papers | — | 644,839 | — | 644,839 | |||||||||||||||
Total | — | 82,447,801 | — | 82,447,801 | |||||||||||||||
USAA Core Intermediate-Term Bond ETF | |||||||||||||||||||
Asset Backed Securities | — | 8,560,233 | — | 8,560,233 | |||||||||||||||
Collateralized Mortgage Obligations | — | 3,750,922 | — | 3,750,922 | |||||||||||||||
Senior Secured Loans | — | 737,650 | — | 737,650 | |||||||||||||||
Corporate Bonds | — | 165,349,666 | — | 165,349,666 | |||||||||||||||
Municipal Bonds | — | 3,821,320 | — | 3,821,320 | |||||||||||||||
U.S. Government Agency Mortgages | — | 35,072,709 | — | 35,072,709 | |||||||||||||||
U.S. Treasury Obligations | — | 83,648,510 | — | 83,648,510 | |||||||||||||||
Commercial Papers | — | 5,897,456 | — | 5,897,456 | |||||||||||||||
Total | — | 306,838,466 | — | 306,838,466 | |||||||||||||||
For the year ended August 31, 2019, there were no Level 3 investments for which significant unobservable inputs were used to determine fair value.
Securities Purchased on a When-Issued Basis:
The Funds may purchase securities on a when-issued basis. When-issued securities are securities purchased for delivery beyond normal settlement periods at a stated price and/or yield, thereby involving the risk that the price and/or yield obtained may be more or less than those available in the market when delivery takes place. At the time a Fund makes the commitment to purchase a security on a when-issued basis, the Fund records the transaction and reflects the value of the security in determining net asset value. No interest accrues to the Fund until the transaction settles and payment takes place. Normally, the settlement date occurs within one month of the purchase. A segregated account is established and the Fund maintains cash and/or marketable securities at least equal in value to commitments for when-issued securities as collateral. If a Fund owns when-issued securities, these values are included in "Payable for investments purchased" on the accompanying Statements of Assets and Liabilities and the segregated assets are identified in the Schedules of Portfolio Investments.
36
Victory Portfolios II | Notes to Financial Statements — continued August 31, 2019 | ||||||
Municipal Obligations:
The values of municipal obligations can fluctuate and may be affected by adverse tax, legislative, or political changes, and by financial developments affecting municipal issuers. Payment of municipal obligations may depend on a relatively limited source of revenue, resulting in greater credit risk. Future changes in federal tax laws or the activity of an issuer may adversely affect the tax-exempt status of municipal obligations.
Mortgage related and Asset-Backed Securities:
The values of some mortgage-related or asset-backed securities may be particularly sensitive to changes in prevailing interest rates. Early repayment of principal on some mortgage-related securities may expose a Fund to a lower rate of return upon reinvestment of principal. The values of mortgage and asset-backed securities depend in part on the credit quality and adequacy of the underlying assets or collateral and may fluctuate in response to the market's perception of these factors as well as current and future repayment rates. Some mortgage-backed securities are backed by the full faith and credit of the U.S. government (e.g., mortgage-backed securities issued by the Government National Mortgage Association, commonly known as "Ginnie Mae"), while other mortgage-backed securities (e.g., mortgage-backed securities issued by the Federal National Mortgage Association and the Federal Home Loan Mortgage Corporation, commonly known as "Fannie Mae" and "Freddie Mac"), are backed only by the credit of the government entity issuing them. In addition, some mortgage-backed securities are issued by private entities and, as such, are not guaranteed by the U.S. government or any agency or instrumentality of the U.S. government.
Loans:
Floating rate loans in which a Fund invest are primarily "senior" loans. Senior floating rate loans typically hold a senior position in the capital structure of the borrower, are typically secured by specific collateral, and have a claim on the assets and/or stock of the borrower that is senior to that held by subordinated debtholders and stockholders of the borrower. While these protections may reduce risk, these investments still present significant credit risk. A significant portion of a Fund's floating rate investments may be issued in connection with highly leveraged transactions such as leveraged buyouts, leveraged recapitalization loans, and other types of acquisition financing. Obligations in these types of transactions are subject to greater credit risk (including default and bankruptcy) than many other investments and may be, or become, illiquid. See the note below regarding below investment grade securities.
A Fund may purchase second lien loans (secured loans with a claim on collateral subordinate to a senior lender's claim on such collateral), fixed rate loans, unsecured loans, and other debt obligations.
Transactions in loans often settle on a delayed basis, and a Fund may not receive the proceeds from the sale of a loan or pay for a loan purchase for a substantial period of time after entering into the transactions.
Below Investment Grade Securities:
Certain Funds may invest in below investment grade securities (i.e. lower-quality, "junk" debt), which are subject to various risks. Lower-quality debt is considered to be speculative because it is less certain that the issuer will be able to pay interest or repay the principal than in the case of investment grade debt. These securities can involve a substantially greater risk of default than higher-rated securities, and their values can decline significantly over short periods of time. Lower-quality debt securities tend to be more sensitive to adverse news about their issuers, the market and the economy in general, than higher-quality debt securities. The market for these securities can be less liquid, especially during periods of recession or general market decline.
37
Victory Portfolios II | Notes to Financial Statements — continued August 31, 2019 | ||||||
Collateralized Loan Obligations ("CLOs"):
CLOs are securities issued by entities that are collateralized by a pool of loans. CLOs are issued in multiple classes (tranches), and can be equity or debt with specific adjustable or fixed interest rates, and varying maturities. The cash flow from the underlying loans is used to pay off each tranche separately within the debt, or senior tranches. Equity, or subordinated tranches, typically are not paid a cash flow but do offer ownership in the CLO itself in the event of a sale.
Investment Companies:
The Funds may invest in portfolios of open-end investment companies. These investment companies value securities in their portfolios for which market quotations are readily available at their market values (generally the last reported sale price) and all other securities and assets at their fair value by the methods established by the board of directors of the underlying funds.
Derivative Instruments:
Futures Contracts:
The Funds may enter into contracts for the future delivery of securities or foreign currencies and futures contracts based on a specific security, class of securities, foreign currency or an index, and purchase or sell options on any such futures contracts. A futures contract on a securities index is an agreement obligating either party to pay, and entitling the other party to receive, while the contract is outstanding, cash payments based on the level of a specified securities index. No physical delivery of the underlying asset is made. A Fund may enter into futures contracts in an effort to hedge against market risks. The acquisition of put and call options on futures contracts will give the Fund the right (but not the obligation), for a specified price, to sell or to purchase the underlying futures contract, upon exercise of the option, at any time during the option period. Futures transactions involve brokerage costs and require the Fund to segregate assets to cover contracts that would require it to purchase securities or currencies. A good faith margin deposit, known as initial margin, of cash or government securities with a broker or custodian is required to initiate and maintain open positions in futures contracts. Subsequent payments, known as variation margin, are made or received by the Fund based on the change in the market value of the position and are recorded as unrealized appreciation or depreciation until the contract is closed out, at which time the gain or loss is realized. A Fund may lose the expected benefit of futures transactions if interest rates, exchange rates or securities prices change in an unanticipated manner. Such unanticipated changes may also result in lower overall performance than if the Fund had not entered into any futures transactions. In addition, the value of a Fund's futures positions may not prove to be perfectly or even highly correlated with the value of its portfolio securities or foreign currencies, limiting a Fund's ability to hedge effectively against interest rate, exchange rate and/or market risk and giving rise to additional risks. There is no assurance of liquidity in the secondary market for purposes of closing out futures positions. The collateral held by the Funds is presented on the Statements of Assets and Liabilities under Deposit with broker for futures contracts.
The Funds invested in futures contracts during the year but held no futures contract at year end. During the year ended the USAA Core Intermediate-Term Bond ETF entered into futures contracts primarily for the strategy of hedging or other purposes, including but not limited to, providing liquidity and equitizing cash.
Offsetting of Financial Assets and Derivatives Assets:
The Funds are subject to various Master Netting Arrangements, which govern the terms of certain transactions with select counterparties. The Master Netting Arrangements allow the Funds to close out and net total exposure to a counterparty in the event of a default with respect to all the transactions governed under a single agreement with a counterparty. The Master Netting Arrangements also specify collateral posting arrangements at pre-arranged exposure levels. Under the Master Netting Arrangements, collateral is routinely transferred if the total net exposure to certain transactions (net of existing collateral already in place) governed under the relevant Master Netting Arrangement with a
38
Victory Portfolios II | Notes to Financial Statements — continued August 31, 2019 | ||||||
counterparty in a given account exceeds a specified threshold depending on the counterparty and the type of Master Netting Arrangement. The Funds did not hold any derivative assets as of August 31, 2019.
Summary of Derivative Instruments:
The following table presents the effect of derivative instruments on the Statements of Operations, categorized by risk exposure, for the year ended August 31, 2019.
| Net Realized Gains (Losses) on Derivatives Recognized as a Result from Operations | Net Change in Unrealized Appreciation/Depreciation on Derivatives Recognized as a Result of Operations | ||||||||||
| Net Realized Gains (Losses) from Futures Contracts | Net Change in Unrealized Appreciation/Depreciation on Futures Contracts | ||||||||||
Interest Rate Risk Exposure: | |||||||||||
USAA Core Intermediate-Term Bond ETF | $ | (194 | ) | $ | 1,401 | ||||||
All open derivative positions at year end are reflected in each respective Fund's Schedule of Portfolio Investments. The underlying face value of open derivative positions relative to each Fund's net assets at year end is generally representative of the notional amount of open positions to net assets throughout the year.
Investment Transactions and Related Income:
Changes in holdings of investments are accounted for no later than one business day following the trade date. For financial reporting purposes, however, investment transactions are accounted for on trade date on the last business day of the reporting period. Interest income is determined on the basis of coupon interest accrued using the effective interest method which adjusts, where applicable, the amortization of premiums or accretion of discounts. Dividend income is recorded on the ex-dividend date. Gains or losses realized on sales of securities are determined by comparing the identified cost of the security lot sold with the net sales proceeds.
Certain Funds may receive other income from investment in loan assignments and/or unfunded commitments, including amendment fees, consent fees, and commitment fees. These fees are recorded as income when received by the Fund. These amounts, if received, are included in Interest Income in the Statements of Operations.
Withholding taxes on interest, dividends and gains as a result of certain investments in ADRs by the Funds have been provided for in accordance with each investment's applicable country's tax rules and rates.
Securities Lending:
Prior to the Reorganizations on July 1, 2019, the Predecessor Funds had entered into a securities lending agreement with Citibank, N.A. ("Citibank" or the "Agent"), which was terminated as a result of the Reorganizations. Effective July 1, 2019, the Trust has entered into an amended Master Securities Lending Agreement ("MSLA") with Citibank. Under the terms of the current MSLA, the Funds may lend securities to certain broker-dealers and banks in exchange for collateral in the amount of at least 102% of the value of U.S. securities loaned or at least 105% of the value of non-U.S. securities loaned, marked-to-market daily. Any collateral shortfalls associated with increases in the valuation of the securities loaned are adjusted the next business day. The collateral can be received in the form of cash collateral and/or non-cash collateral. Non-cash collateral can include U.S. Government Securities, letters of credit and certificates of deposit. The cash collateral is invested in short-term instruments or cash equivalents, primarily open-end investment companies, as noted in the Funds' Schedules of Portfolio Investments. The Trust does not have effective control of the non-cash collateral and therefore it is not disclosed in the Funds' Schedules of Portfolio Investments. During the time portfolio securities are on loan, the borrower will pay the Funds any dividends or interest paid on such securities plus any fee
39
Victory Portfolios II | Notes to Financial Statements — continued August 31, 2019 | ||||||
negotiated between the parties to the lending agreement. The Funds also earn a return from the collateral. The Funds pay the Agent various fees in connection with the investment of cash collateral and fees based on the investment income received from securities lending activities. Securities lending income (net of these fees) is disclosed on the Statements of Operations. Although risk is mitigated by the collateral, the Funds could experience a delay in recovering their securities and possible loss of income or value if the borrower fails to return them.
Securities lending transactions are entered into by a Fund under the MSLA, which permits the Fund, under certain circumstances such as an event of default, to offset amounts payable by the Fund to the same counterparty against amounts receivable from the counterparty to create a net payment due to or from the Fund.
The Funds had no securities on loan during the year ended August 31, 2019.
Distributions to Shareholders:
Each Fund intends to declare and distribute any net investment income monthly. Each Fund distributes any net realized long or short-term capital gains at least annually.
The amounts of dividends from net investment income and distributions from net realized gains (collectively distributions to shareholders) are determined in accordance with federal income tax regulations, which may differ from GAAP. To the extent these "book/tax" differences are permanent in nature (e.g., net operating loss and distribution reclassification,), such amounts are reclassified within the components of net assets based on their federal tax-basis treatment; temporary differences (e.g., wash sales) do not require reclassification. To the extent dividends and distributions exceed net investment income and net realized gains for tax purposes, they are reported as distributions of capital. Net investment losses incurred by a Fund may be reclassified as an offset to capital on the accompanying Statements of Assets and Liabilities.
As of August 31, 2019, there are no reclassification adjustments (inclusive of in-kind redemptions as applicable) incurred by the Funds on the Statements of Assets and Liabilities as a result of permanent book-to-tax differences.
Federal Income Taxes:
It is the policy of each Fund to continue to qualify as a regulated investment company by complying with the provisions available to certain investment companies, as defined in applicable sections of the Internal Revenue Code, and to make distributions of net investment income and net realized gains sufficient to relieve it from all, or substantially all, federal income taxes. Accordingly, no provision for federal income taxes is required in the financial statements. The Funds have a tax year end of August 31.
Management of the Funds has reviewed tax positions taken in tax years that remain subject to examination by all major tax jurisdictions, including federal (i.e., all open tax year ends and the interim tax period since then). Management believes that there is no tax liability resulting from unrecognized tax benefits related to uncertain tax positions taken.
Allocations:
Expenses directly attributable to a Fund are charged to the Fund, while expenses which are attributable to more than one fund in the Trust, or jointly with an affiliated trust, are allocated among the respective funds in the Trust and/or affiliated trust based upon net assets or another appropriate basis.
Cross-Trade Transactions:
Pursuant to Rule 17a-7 under the 1940 Act, the Funds may engage in cross-trades which are securities transactions with affiliated investment companies and advisory accounts managed by the Adviser and any applicable sub-adviser. Any such purchase or sale transaction must be effected without brokerage commission or other remuneration, except for customary transfer fees. The transaction must be effected at the current market price, which is either the security's last sale price on an exchange or, if there are no transactions in the security that day, at the average of the highest bid and lowest ask price. For the
40
Victory Portfolios II | Notes to Financial Statements — continued August 31, 2019 | ||||||
year ended August 31, 2019, the Funds engaged in the following securities transactions with affiliated funds, which resulted in the following net realized gains (losses):
Purchases | Sales | Net Realized Gains (Losses) | |||||||||||||
USAA Core Intermediate-Term Bond ETF | $ | 3,455,105 | $ | — | $ | — | |||||||||
3. Purchases and Sales:
Purchases and sales of securities (excluding securities maturing less than one year from acquisition), purchases and sales of U.S. Government Securities, and purchases and sales of in-kind transactions for the fiscal year ended August 31, 2019 were as follows. Any realized gains or losses from in-kind redemptions are reflected on the Statements of Operations as Net realized gains (losses) from in-kind redemptions.
| Excluding U.S. Government Securities | U.S. Government Securities | ||||||||||||||||||
Purchases | Sales | Purchases | Sales | ||||||||||||||||
USAA Core Short-Term Bond ETF | $ | 37,147,359 | $ | 16,062,281 | $ | 230,273 | $ | 3,601,980 | |||||||||||
USAA Core Intermediate-Term Bond ETF | 83,956,947 | 4,408,433 | 53,313,611 | 2,721,746 | |||||||||||||||
4. Fees and Transactions with Affiliates and Related Parties:
Investment Advisory and Management Fees:
Effective with the Transaction on July 1. 2019, investment advisory services are provided to the Funds by Victory Capital Management Inc. ("VCM" or the "Adviser"), a New York corporation registered as an investment adviser with the Securities and Exchange Commission ("SEC"). The Adviser is a wholly-owned indirect subsidiary of Victory Capital Holdings, Inc., a publicly traded Delaware corporation, and a wholly-owned direct subsidiary of Victory Capital Operating, LLC.
Under the terms of the Investment Advisory Agreement, the Adviser is entitled to receive fees based on a percentage of the average daily net assets of each Fund. The rates at which the Adviser is paid by each Fund are included in the table below and amounts incurred during the period from July 1, 2019 to August 31, 2019 are reflected as Investment advisory fees on the Statements of Operations.
| Adviser Fee Rate | |||||||
USAA Core Short-Term Bond ETF | 0.25 | % | |||||
USAA Core Intermediate-Term Bond ETF | 0.30 | % | |||||
Prior to the Transaction on July 1, 2019, AMCO had provided investment management services to the Predecessor Funds pursuant to an Advisory Agreement. Under this agreement, which was in effect through June 30, 2019, AMCO was responsible for managing the business and affairs of the Predecessor Funds, and for directly managing day-to-day investment of each Predecessor Fund's assets, subject to the authority of and supervision by the Board of Trustees.
The investment management fees for the Predecessor Funds were comprised of a base fee which were accrued daily and paid monthly at an annualized rate of each Predecessor Fund's average net assets. AMCO had contractually agreed to waive a portion of its management fees in an amount equal to 0.05% of the average net assets of each Predecessor Fund through October 15, 2018, and the waiver could not be terminated or reduced without approval of the Funds' Board during that term. Effective October 15, 2018, AMCO had contractually agreed to extend the contractual waiver on a portion of each Predecessor Fund's management fees in an amount equal to 0.05% of the average net assets of each Predecessor Fund through December 31, 2019, which had terminated on July 1, 2019. These management fees waived are not available to be recouped at a future time. Amounts incurred during the period September 1, 2018 through June 30, 2019 are reflected as Management fees and
41
Victory Portfolios II | Notes to Financial Statements — continued August 31, 2019 | ||||||
Management fee waiver on the Statements of Operations. The annual rate of management fees incurred for the period September 1, 2018 through June 30, 2019 were as follows:
| Annual Rate | |||||||
USAA Core Short-Term Bond ETF | 0.25 | % | |||||
USAA Core Intermediate-Term Bond ETF | 0.30 | % | |||||
Administration and Operating Service Fees:
Effective July 1, 2019, VCM serves as the Funds' administrator and fund accountant. Under an Administration and Fund Accounting Agreement, VCM is paid for its services an annual fee at a rate of 0.08% of the first $15 billion in average daily net assets of the Trust, USAA Mutual Funds Trust, Victory Variable Insurance Funds, and Victory Portfolios (collectively, the "Victory Funds Complex"), 0.05% of the average daily net assets above $15 billion to $30 billion of the Victory Funds Complex and 0.04% of the average daily net assets over $30 billion of the Victory Funds Complex. Amounts incurred during the period from July 1, 2019 to August 31, 2019 are reflected as Administration fees on the Statements of Operations.
Prior to July 1, 2019, AMCO served as the Predecessor Funds' administrator and State Street Bank and Trust Company served as the Predecessor Funds' sub-administrator, transfer agent and custodian.
Prior to July 1, 2019, AMCO provided certain administration and operating services for the Predecessor Funds and received a fee accrued daily and paid monthly at an annualized rate of the Predecessor Funds' average net assets. AMCO paid all operating expenses of the Predecessor Funds, excluding distribution and/or service fees, taxes, brokerage commissions and transaction costs, acquired fund fees and expenses, and extraordinary expenses. Amounts incurred during the period September 1, 2018 through June 30, 2019 are reflected as Administration and operating service fees on the Statements of Operations. The annual rate of administration and operating service fees incurred for the period September 1, 2018 through June 30, 2019 were as follows:
| Annual Rate | |||||||
USAA Core Short-Term Bond ETF | 0.15 | % | |||||
USAA Core Intermediate-Term Bond ETF | 0.15 | % | |||||
Distribution and Service 12b-1 Fees:
Prior to the Transaction on July 1, 2019, the Funds adopted a plan pursuant to Rule 12b-1 under the 1940 Act. Under the plan, the Funds may, but did not pay fees to USAA Investment Management Company ("IMCO"), the distributor, for distribution and shareholder services. IMCO paid all or a portion of such fees to intermediaries that made the Funds available for investment by their customers. The fee was accrued daily and paid monthly at an annual rate of 0.25% of each Fund's average net assets. For the period September 1, 2018 through June 30, 2019, the Funds did not incur any distribution and service (12b-1) fees.
Effective July 1, 2019, Foreside Fund Services, LLC ("Foreside") serves as the Funds' distributor. Effective July 1, 2019, the Funds adopted a plan pursuant to Rule 12b-1. No fees are currently paid by the Funds under the plan, and there are no current plans to impose such fees.
Other Related Parties Fees:
Effective July 1, 2019, Citi Fund Services Ohio, Inc. ("Citi"), an affiliate of Citibank, acts as sub-administrator and sub-fund accountant to the Funds pursuant to a Sub-Administration and Sub-Fund Accounting Services Agreement between VCM and Citi. VCM pays Citi a fee for providing these services. The Trust reimburses VCM and Citi for all of their reasonable out-of-pocket expenses incurred in providing these services.
Effective July 1, 2019, Citibank also serves as the Funds' Transfer Agent.
The Chief Compliance Officer ("CCO") is an employee of the Adviser, which pays the compensation of the CCO and his support staff. Effective July 1, 2019, the Funds (as part of the Trust) have entered into
42
Victory Portfolios II | Notes to Financial Statements — continued August 31, 2019 | ||||||
an CCO Agreement to provide compliance services with the Adviser, pursuant to which the Adviser furnishes its compliance personnel, including the services of the CCO, and other resources reasonably necessary to provide the Trust with compliance oversight services related to the design, administration and oversight of a compliance program for the Trust in accordance with Rule 38a-1 under the 1940 Act. Funds in the Victory Funds Complex, in the aggregate, compensates the Adviser for these services.
The Victory Funds Complex pays an annual retainer to each Independent Trustee, plus an additional annual retainer to the Chairman of the Board. The aggregate amount of the fees and expenses of the Independent Trustees are allocated amongst all the funds in the Victory Funds Complex and are presented in the Statements of Operations.
Shearman & Sterling LLP provides legal services to the Trust.
Effective July 1, 2019, the Adviser has entered into expense limitation agreements with the Funds. Under the terms of the agreements, the Adviser has agreed to waive fees or reimburse certain expenses to the extent that ordinary operating expenses incurred by certain Funds in any fiscal year exceed the expense limit for such Fund. Such excess amounts will be the liability of the Adviser. Interest, taxes, brokerage commissions, other expenditures which are capitalized in accordance with GAAP, and other extraordinary expenses not incurred in the ordinary course of a Fund's business are excluded from the expense limits (excluding voluntary waivers).
Expense limits in effect from July 1, 2019 to August 31, 2019 are as follows:
USAA Core Short-Term Bond ETF | 0.35 | % | |||||
USAA Core Intermediate-Term Bond ETF | 0.40 | % | |||||
Under this expense limitation agreement, the Funds have agreed to repay fees and expenses that were waived or reimbursed by the Adviser for a period up to three fiscal years after such waiver or reimbursement was made to the extent such payments or repayments would not cause the expenses to exceed the original expense limitation in place at time of the waiver or reimbursement or any expense limitation agreement in place at the time of repayment. Amounts repaid to the Adviser during the period of July 1, 2019 to August 31, 2019, if any, are reflected on the Statements of Operations as "Recoupment of prior expenses waived/reimbursed by Adviser". As of August 31, 2019, the following amounts are available to be repaid to the Adviser:
| Expires 8/31/22 | |||||||
USAA Core Short-Term Bond ETF | $ | 2,875 | |||||
The Adviser voluntarily waived the following administration fees during the period of July 1, 2019 to August 31, 2019, in order to assist the Funds in maintaining competitive expense ratios. Voluntary waivers and reimbursements applicable to the Funds are not available to be recouped at a future time.
USAA Core Short-Term Bond ETF | $ | 4,890 | |||||
USAA Core Intermediate-Term Bond ETF | 17,737 | ||||||
Effective July 1, 2019, certain officers and/or interested trustees of the Funds are also officers and/or employees of the Adviser, Administrator, Fund Accountant, Sub-Administrator, Sub-Fund Accountant and Legal Counsel.
Prior to July 1, 2019, certain trustees and officers of the Funds were also directors, officers, and/or employees of AMCO. None of the affiliated trustees or Funds' officers received any compensation from the Funds.
5. Risks:
Each Fund may be subject to other risks in addition to these identified risks.
An investment in the Funds' shares represents an indirect investment in the securities owned by the Funds, some of which will be traded on a national securities exchange or in the over-the-counter markets. The value of the securities in which the Funds invest, like other market investments, may move up or down, sometimes rapidly and unpredictably. The value of the securities in which the Funds
43
Victory Portfolios II | Notes to Financial Statements — continued August 31, 2019 | ||||||
invest may affect the value of the Funds' shares. An investment in the Funds' shares at any point in time may be worth less than the original investment, even after taking into account the reinvestment of the Funds' distributions.
The Funds will be subject to credit risk with respect to the amount each expects to receive from counterparties for financial instruments entered into by the Funds. The Funds may be negatively impacted if a counterparty becomes bankrupt or otherwise fails to perform its obligations due to financial difficulties. The Funds may experience significant delays in obtaining any recovery in bankruptcy or other reorganization proceeding and the Funds may obtain only limited recovery or may obtain no recovery in such circumstances. The Funds typically enter into transactions with counterparties whose credit ratings are investment grade, as determined by a nationally recognized statistical rating organization or, if unrated, judged by the Adviser to be of comparable quality.
The Funds will be subject to credit and interest rate risk with respect to fixed income securities. Credit risk refers to the ability of an issuer to make timely payments of interest and principal. Interest rates may rise or the rate of inflation may increase, impacting the value of investments in fixed income securities. A debt issuers' credit quality may be downgraded or an issuer may default. Interest rates may fluctuate due to changes in governmental fiscal policy initiatives and resulting market reaction to those initiatives.
6. Line of Credit:
Prior to July 1, 2019, the Predecessor Funds participated, along with other funds of the USAA Mutual Funds Trust (collectively the "USAA Trusts") in a line of credit agreement with USAA Capital Corporation ("CAPCO"), in a joint, short-term, revolving, committed loan agreement of $500 million with CAPCO, an affiliate of AMCO. The purpose of the agreement was to provide temporary or emergency cash needs, including redemption requests that might otherwise require the untimely disposition of securities. Subject to availability (including usage of the facility by other funds of the USAA Trusts), the Predecessor Funds may have borrowed from CAPCO an amount up to 5% of each Predecessor Fund's total assets at an interest rate based on the London Interbank Offered Rate (LIBOR), plus 100.0 basis points. The USAA Trusts were also assessed facility fees by CAPCO in the amount of 14.0 basis points of the amount of the committed loan agreement. The facility fees were allocated among the funds of the USAA Trusts based on their respective average daily net assets for the period.
The USAA Trusts were permitted an optional increase upon request of the committed loan agreement from $500 million up to $750 million. If the USAA Trusts increased the committed loan agreement, the assessed facility fee on the amount of the additional commitment would be 15.0 basis points. The line of credit agreement with CAPCO was terminated on June 30, 2019 as a result of the Transaction. During the period September 1, 2018 through June 30, 2019, AMCO, on behalf of the Predecessor Funds, paid CAPCO facility fees of $10,029. The Predecessor Funds had no borrowings under this agreement during the period September 1, 2018 through June 30, 2019.
Effective July 1, 2019, the Funds are now included under and participate in a short-term, demand note "Line of Credit" agreement with Citibank. This agreement has a termination date of June 29, 2020. Under the agreement with Citibank, the Victory Funds Complex may borrow up to $600 million, of which $300 million is committed and $300 million is uncommitted. $40 million of the Line of Credit is reserved for use by the Victory Floating Rate Fund, another series of the Victory Funds Complex, with that fund paying the related commitment fees for that amount. The purpose of the agreement is to meet temporary or emergency cash needs, including redemption requests that might otherwise require the untimely disposition of securities. Effective with the Line of Credit agreement terms on July 1, 2019, Citibank receives an annual commitment fee of 0.15% on $300 million for providing the Line of Credit. Each fund in the Victory Funds Complex pays a pro-rata portion of the commitment fees plus any interest (one month LIBOR plus one percent) on amounts borrowed. Interest charged to the Funds during the period is presented on the Statements of Operations under line of credit fees.
The Funds had no borrowings under either agreement during the year ended August 31, 2019.
44
Victory Portfolios II | Notes to Financial Statements — continued August 31, 2019 | ||||||
7. Federal Income Tax Information:
The tax character of distributions paid during the tax years ended, as noted below, were as follows (total distributions paid may differ from the Statements of Changes in Net Assets because, for tax purposes, dividends are recognized when actually paid):
Year Ended August 31, 2019 | |||||||||||||||||||||||
Distributions paid from | |||||||||||||||||||||||
| Ordinary Income | Net Long-Term Capital Gains | Total Taxable Distributions | Return of Capital | Total Distributions Paid | |||||||||||||||||||
USAA Core Short-Term Bond ETF | $ | 1,927,032 | $ | — | $ | 1,927,032 | $ | — | $ | 1,927,032 | |||||||||||||
USAA Core Intermediate-Term Bond ETF | 6,792,738 | — | 6,792,738 | — | 6,792,738 | ||||||||||||||||||
Period Ended August 31, 2018 (amounts in 000's) | |||||||||||||||||||||||
Distributions paid from | |||||||||||||||||||||||
| Ordinary Income | Net Long-Term Capital Gains | Total Taxable Distributions | Return of Capital | Total Distributions Paid | |||||||||||||||||||
USAA Core Short-Term Bond ETF | $ | 811 | $ | — | $ | 811 | $ | — | $ | 811 | |||||||||||||
USAA Core Intermediate-Term Bond ETF | 2,580 | — | 2,580 | — | 2,580 | ||||||||||||||||||
As of August 31, 2019, the components of distributable earnings/accumulated deficit on a tax basis were as follows:
| Undistributed Ordinary Income | Undistributed Long-Term Capital Gains | Accumulated Earnings | Accumulated Capital and Other Losses | Unrealized Appreciation (Depreciation)** | Total Accumulated Earnings (Deficit) | ||||||||||||||||||||||
| USAA Core Short-Term Bond ETF | $ | 62,664 | $ | — | $ | 62,664 | $ | (44,188 | ) | $ | 1,177,193 | $ | 1,195,669 | ||||||||||||||
| USAA Core Intermediate-Term Bond ETF | 280,798 | — | 280,798 | (102,077 | ) | 17,485,154 | 17,663,875 | ||||||||||||||||||||
** The difference between the book-basis and tax-basis of unrealized appreciation/(depreciation) is attributable primarily to tax deferral of losses on wash sales.
As of the tax year ended August 31, 2019, the following Funds had net capital loss carry-forwards (no expiration) not limited as a result of changes in Fund ownership during the year and in prior years as summarized in the tables below.
| Short-Term Amount | Long-Term Amount | Total | |||||||||||||
USAA Core Short-Term Bond ETF | $ | 31,749 | $ | 12,439 | $ | 44,188 | |||||||||
USAA Core Intermediate-Term Bond ETF | — | 102,077 | 102,077 | ||||||||||||
At August 31, 2019, the cost basis for federal income tax purposes, gross unrealized appreciation, gross unrealized depreciation, and net unrealized appreciation (depreciation) for investments were as follows:
| Cost of Investments for Federal Tax Purposes | Gross Unrealized Appreciation | Gross Unrealized Depreciation | Net Unrealized Appreciation (Depreciation) | ||||||||||||||||
| USAA Core Short-Term Bond ETF | $ | 81,270,608 | $ | 1,202,641 | $ | (25,448 | ) | $ | 1,177,193 | ||||||||||
| USAA Core Intermediate-Term Bond ETF | 289,353,312 | 18,112,638 | (627,484 | ) | 17,485,154 | ||||||||||||||
45
Victory Portfolios II | Notes to Financial Statements — continued August 31, 2019 | ||||||
8. Recent Accounting Pronouncements:
In March 2017, the Financial Accounting Standards Board ("FASB") issued Accounting Standards Update ("ASU") No. 2017-08 "Premium Amortization on Purchased Callable Debt Securities" ("ASU 2017-08"), which shortens the premium amortization period for purchased non-contingently callable debt securities. ASU 2017-08 specifies that the premium amortization period ends at the earliest call date, for purchased non-contingently callable debt securities. ASU 2017-08 is effective for fiscal years, and interim periods within those fiscal years, beginning after December 15, 2018. Management does not believe that adoption of ASU 2017-08 will materially impact the Funds' financial statements.
In August 2018, FASB issued ASU No. 2018-13, "Fair Value Measurements" ("ASU 2018-13"). This update makes certain removals from, changes to and additions to existing disclosure requirements for fair value measurements. ASU 2018-13 does not change fair value measurements already required or permitted by existing standards. ASU 2018-13 is effective for financial statements issued for fiscal years beginning after December 15, 2019, and interim periods within those fiscal years. As permitted, the Funds have early adopted ASU 2018-13 with the financial statements prepared as of August 31, 2019.
In August 2018, the SEC adopted amendments to certain financial statement disclosure requirements to conform them to GAAP for investment companies. These amendments made certain disclosure requirements effective under Regulation S-X. The Funds' adoption of these amendments, effective with the financial statements prepared as of August 31, 2019 had no effect on the Funds' net assets or results of operations. As a result of adopting these amendments, the distributions to shareholders in the August 31, 2018 Statements of Changes in Net Assets presented herein have been reclassified to conform to the current year presentation, which includes all distributions of each class of shareholders, other than tax basis return of capital distributions, in one line item per share class. Distributions to shareholders for the year ended August 31, 2018 from net investment income and net realized gains in the Funds were as follows (amounts in thousands).
| USAA Core Short-Term Bond ETF | USAA Core Intermediate-Term Bond ETF | ||||||||||
Accumulated Net investment Income (Loss): | $ | 38 | $ | 92 | |||||||
Distributions to Shareholders: | |||||||||||
From net investment income: | (811 | ) | (2,580 | ) | |||||||
From net Realized Gains: | — | — | |||||||||
9. Subsequent Events:
The Board approved a change in fiscal year end from August 31 to June 30. This change in fiscal year end is effective September 1, 2019.
The Funds have evaluated the need for additional disclosures or adjustments resulting from subsequent events through the date these financial statements were issued. Based on this evaluation, there were no additional subsequent events to report that would have a material impact on the Funds' financial statements.
46
REPORT OF INDEPENDENT REGISTERED PUBLIC ACCOUNTING FIRM
To the Shareholders and Board of Trustees of Victory Portfolios II
Opinion on the Financial Statements
We have audited the accompanying statements of assets and liabilities, including the schedules of portfolio investments, of VictoryShares USAA Core Short-Term Bond ETF and VictoryShares USAA Core Intermediate-Term Bond ETF (the "Funds"), each a series of Victory Portfolios II, as of August 31, 2019, and the related statements of operations and changes in net assets, including the related notes, and the financial highlights for the year then ended (collectively referred to as the "financial statements"). In our opinion, the financial statements present fairly, in all material respects, the financial position of each of the Funds as of August 31, 2019, the results of their operations, the changes in their net assets, and the financial highlights for the year then ended, in conformity with accounting principles generally accepted in the United States of America.
The Funds' financial statements and financial highlights for the period ended August 31, 2018, were audited by other auditors whose report dated October 25, 2018, expressed an unqualified opinion on those financial statements and financial highlights.
Basis for Opinion
These financial statements are the responsibility of the Funds' management. Our responsibility is to express an opinion on the Funds' financial statements based on our audit. We are a public accounting firm registered with the Public Company Accounting Oversight Board (United States) ("PCAOB") and are required to be independent with respect to the Funds in accordance with the U.S. federal securities laws and the applicable rules and regulations of the Securities and Exchange Commission and the PCAOB.
We conducted our audit in accordance with the standards of the PCAOB. Those standards require that we plan and perform the audit to obtain reasonable assurance about whether the financial statements are free of material misstatement, whether due to error or fraud.
Our audit included performing procedures to assess the risks of material misstatement of the financial statements, whether due to error or fraud, and performing procedures that respond to those risks. Such procedures included examining, on a test basis, evidence regarding the amounts and disclosures in the financial statements. Our procedures included confirmation of securities owned as of August 31, 2019, by correspondence with the custodian and brokers or by other appropriate auditing procedures where replies from brokers or counterparties were not received. Our audit also included evaluating the accounting principles used and significant estimates made by management, as well as evaluating the overall presentation of the financial statements. We believe that our audit provides a reasonable basis for our opinion.
We have served as the auditor of one or more investment companies advised by Victory Capital Management, Inc. since 2015.

COHEN & COMPANY, LTD.
Cleveland, Ohio
October 28, 2019
47
Victory Portfolios II | Supplemental Information August 31, 2019 | ||||||
(Unaudited)
Shareholder Voting Results:
A Special Meeting ("Meeting") of Shareholders of USAA ETF Trust was held on April 18, 2019. The Meeting was held for the following purpose: to approve the Agreement and Plan of Reorganization (the "Agreement") by and among USAA ETF Trust, on behalf of each of the funds indicated below as an "Acquired Fund," Victory Portfolios II, on behalf of each corresponding fund indicated below as an "Acquiring Fund," AMCO, and Victory Capital.
Acquired Fund | Acquiring Fund | ||||||
USAA Core Short-Term Bond ETF | VictoryShares USAA Core Short-Term Bond ETF | ||||||
USAA Core Intermediate-Term Bond ETF | VictoryShares USAA Core Intermediate-Term Bond ETF | ||||||
The results of the voting on the above matter was as follows:
Votes For | Votes Against | Votes Abstain | |||||||||||||
USAA Core Short-Term Bond ETF | 1,273,518 | 1,657 | 1,542 | ||||||||||||
USAA Core Intermediate-Term Bond ETF | 3,875,696 | 3,305 | 3,285 | ||||||||||||
Change in Independent Registered Public Accounting Firm:
On July 3, 2019, Ernst & Young, LLP ("EY") resigned as the independent registered public accounting firm of the USAA ETF Trust as a result of the Reorganizations that occurred on July 1, 2019. EY's report on the financial statements of the USAA ETF Trust for the fiscal period ended August 31, 2018, did not contain an adverse opinion or disclaimer of opinion, and was not qualified or modified as to uncertainty, audit scope or accounting principles. During the USAA ETF Trust's most recent fiscal years and through July 3, 2019, there were no (1) disagreements with EY on any matter of accounting principles or practices, financial statement disclosure, or auditing scope or procedure, which disagreements, if not resolved to EY's satisfaction, would have caused it to make reference to that matter in connection with its report; or (2) "reportable events," as that term is defined in Item 304(a)(1)(v) of Regulation S-K under the Securities Exchange Act of 1934.
Cohen & Company, Ltd ("Cohen") is the independent registered public accounting firm of the Funds for the fiscal year ended August 31, 2019. Cohen, located at 1350 Euclid Avenue, Suite 800, Cleveland, Ohio 44115, serves as the independent registered public accounting firm for other Victory Funds.
48
Victory Portfolios II | Supplemental Information — continued August 31, 2019 | ||||||
(Unaudited)
Trustee and Officer Information
Board of Trustees:
Overall responsibility for management of the Trust rests with the Board. The Trust is managed by the Board in accordance with the laws of the State of Delaware. There are currently ten Trustees, nine of whom are not "interested persons" of the Trust within the meaning of that term under the 1940 Act ("Independent Trustees") and one of whom is an "interested person" of the Trust within the meaning of that term under the 1940 Act ("Interested Trustee"). The Trustees, in turn, elect the officers of the Trust to actively supervise its day-to-day operations.
The following tables list the Trustees, their ages, position with the Trust, commencement of service, principal occupations during the past five years and any directorships of other investment companies or companies whose securities are registered under the Securities Exchange Act of 1934, as amended, or who file reports under that Act. Each Trustee oversees 26 portfolios in the Trust, nine portfolios in Victory Variable Insurance Funds and 42 portfolios in Victory Portfolios, each a registered investment company that, together with the Trust, comprise the Victory Funds Complex. Each Trustee's address is c/o Victory Portfolios II, 4900 Tiedeman Road, 4th Floor, Brooklyn, Ohio 44144. Each Trustee has an indefinite term.
Name and Age | Position Held with the Trust | Date Commenced Service | Principal Occupation During Past 5 Years | Other Directorships Held During Past 5 Years | |||||||||||||||
Independent Trustees. | |||||||||||||||||||
David Brooks Adcock, 67 | Trustee | May 2015 | Consultant (since 2006). | Chair and Trustee, Turner Funds (December 2016-December 2017). | |||||||||||||||
Nigel D. T. Andrews, 72 | Vice Chair and Trustee | May 2015 | Retired. | Director, TCG BDC II, Inc. (since 2017); Director, TCG BDC I, Inc. (formerly Carlyle GMS Finance, Inc.) (since 2012); Director, Old Mutual US Asset Management (2002-2014). | |||||||||||||||
E. Lee Beard, 68* | Trustee | May 2015 | Retired (since 2015); Consultant, The Henlee Group, LLC (consulting) (2005-2015). | None. | |||||||||||||||
Dennis M. Bushe, 75 | Trustee | July 2016 | Retired. | Trustee, RS Investment Trust and RS Variable Products Trust (November 2011-July 2016). | |||||||||||||||
49
Victory Portfolios II | Supplemental Information — continued August 31, 2019 | ||||||
(Unaudited)
Name and Age | Position Held with the Trust | Date Commenced Service | Principal Occupation During Past 5 Years | Other Directorships Held During Past 5 Years | |||||||||||||||
Sally M. Dungan, 65 | Trustee | May 2015 | Chief Investment Officer, Tufts University (since 2002). | None. | |||||||||||||||
John L. Kelly, 66 | Trustee | May 2015 | Partner, McCarvill Capital Partners (September 2016-September 2017); Advisor, Endgate Commodities LLC (January 2016-April 2016); Managing Partner, Endgate Commodities LLC (August 2014-January 2016). | Director, Caledonia Mining Corporation (since May 2012). | |||||||||||||||
David L. Meyer, 62* | Trustee | May 2015 | Retired. | None. | |||||||||||||||
Gloria S. Nelund, 58 | Trustee | July 2016 | Chair, CEO and Co-Founder of TriLinc Global, LLC, an investment firm. | TriLinc Global Impact Fund, LLC (since 2012); Trustee, RS Investment Trust and RS Variable Products Trust (November 2007-July 2016). | |||||||||||||||
Leigh A. Wilson, 74 | Chair and Trustee | May 2015 | Private Investor. | Chair (since 2013), Caledonia Mining Corporation. | |||||||||||||||
Interested Trustee. | |||||||||||||||||||
David C. Brown, 47** | Trustee | May 2015 | Chairman and Chief Executive Officer (since 2013), the Adviser; Chairman and Chief Executive Officer, Victory Capital Holdings, Inc. (since 2013). | Trustee, USAA Mutual Funds Trust. | |||||||||||||||
* The Board has designated Mr. Meyer and Ms. Beard as its Audit Committee Financial Experts.
** Mr. Brown is an "Interested Person" by reason of his relationship with the Adviser.
The Statement of Additional Information includes additional information about the Trustees of the Trust and is available, without charge, on the SEC's website at www.sec.gov and/or by calling 800-539-3863.
50
Victory Portfolios II | Supplemental Information — continued August 31, 2019 | ||||||
(Unaudited)
Officers:
The officers of the Trust, their ages, commencement of service and their principal occupations during the past five years, are detailed in the following table. Each officer serves until the earlier of his or her resignation, removal, retirement, death, or the election of a successor. The mailing address of each officer of the Trust is 4900 Tiedeman Road, 4th Floor, Brooklyn, Ohio 44144. The officers of the Trust receive no compensation directly from the Trust for performing the duties of their offices.
Name and Age | Position with the Trust | Date Commenced Service | Principal Occupation During Past 5 Years | ||||||||||||
Christopher K. Dyer, 57 | President | May 2015 | Director of Fund Administration, the Adviser. | ||||||||||||
Scott A. Stahorsky, 50 | Vice President | May 2015 | Manager, Fund Administration, the Adviser (since 2015); Senior Analyst, Fund Administration, the Adviser (prior to 2015). | ||||||||||||
Erin G. Wagner, 45 | Secretary | May 2015 | Associate General Counsel, the Adviser (since 2013). | ||||||||||||
Allan Shaer, 54 | Treasurer | December 2017 | Senior Vice President, Financial Administration, Citi Fund Services Ohio, Inc. (since 2016); Vice President, Mutual Fund Administration, JP Morgan Chase (2011-2016). | ||||||||||||
Christopher A. Ponte, 35 | Assistant Treasurer* | May 2015 | Manager, Fund Administration, the Adviser (since 2017); Senior Analyst, Fund Administration, the Adviser (prior to 2017); Chief Financial Officer, Victory Capital Advisers, Inc. (since 2018). | ||||||||||||
Colin Kinney, 46 | Chief Compliance Officer | July 2017 | Chief Compliance Officer (since 2013) and Chief Risk Officer (2009-2017), the Adviser. | ||||||||||||
Chuck Booth, 59 | Anti-Money Laundering Compliance Officer and Identity Theft Officer | May 2015 | Director, Regulatory Administration and CCO Support Services, Citi Fund Services Ohio, Inc. | ||||||||||||
Jay G. Baris, 65 | Assistant Secretary | May 2015 | Partner, Shearman & Sterling LLP (since 2018); Partner, Morrison & Foerster LLP (2011-January 2018). | ||||||||||||
* On December 5, 2017, Mr. Ponte resigned as Treasurer and accepted the position of Assistant Treasurer of the Trust.
51
Victory Portfolios II | Supplemental Information — continued August 31, 2019 | ||||||
(Unaudited)
Proxy Voting and Portfolio Holdings Information
Proxy Voting:
Information regarding the policies and procedures that each Fund uses to determine how to vote proxies relating to portfolio securities is available without charge, upon request, by calling 800-539-3863. The information is also included in the Funds' Statement of Additional Information, which is available on the SEC's website at www.sec.gov.
Information relating to how the Funds voted proxies relating to portfolio securities held during the most recent twelve months ended June 30 is available on the SEC's website at www.sec.gov.
Availability of Schedules of Portfolio Investments:
The Trust files a complete list of Schedules of Portfolio Investments with the SEC for the first and third quarter of each fiscal year on Form N-PORT. Prior to the implementation of Form N-PORT, the trust filed a complete list of Schedules of Portfolio Investments with the SEC for the first and third quarters of each fiscal year on Form N-Q. Forms N-PORT and Forms N-Q are available on the SEC's website at www.sec.gov.
Expense Examples
As a shareholder of the Funds, you may incur two types of costs: (1) transaction costs, and (2) ongoing costs, including management fees and other Fund expenses. These examples are intended to help you understand your ongoing costs (in dollars) of investing in the Funds and to compare these costs with the ongoing costs of investing in other mutual funds.
These examples are based on an investment of $1,000 invested at the beginning of the period and held for the entire period from March 1, 2019 through August 31, 2019.
The Actual Expense figures in the table below provide information about actual account values and actual expenses. You may use the information below, together with the amount you invested, to estimate the expenses that you paid over the period. Simply divide your account value by $1,000 (for example, an $8,600 account value divided by $1,000 = 8.6), then multiply the result by the number in the table under the heading entitled "Actual Expenses Paid During Period" to estimate the expenses you paid on your account during this period.
The Hypothetical Expense figures in the table below provide information about hypothetical account values and hypothetical expenses based on each Fund's actual expense ratio and an assumed rate of return of 5% per year before expenses, which is not the Fund's actual return. The hypothetical account values and expenses may not be used to estimate the actual ending account balance or expenses you paid for the period. You may use this information to compare this 5% hypothetical example with the 5% hypothetical examples that appear in shareholder reports of other funds.
Please note the expenses shown in the table are meant to highlight your ongoing costs only and do not reflect any transactional costs. Therefore, the table is useful in comparing ongoing costs only, and will not help you determine the relative total costs of owning different funds. In addition, if these transactional costs were included, your costs would have been higher.
| Beginning Account Value 3/1/19 | Actual Ending Account Value 8/31/19 | Hypothetical Ending Account Value 8/31/19 | Actual Expenses Paid During Period 3/1/19- 8/31/19* | Hypothetical Expenses Paid During Period 3/1/19- 8/31/19* | Annualized Expense Ratio During Period 3/1/19- 8/31/19 | ||||||||||||||||||||||
| USAA Core Short-Term Bond ETF | $ | 1,000.00 | $ | 1,031.40 | $ | 1,023.44 | $ | 1.79 | $ | 1.79 | 0.35 | % | |||||||||||||||
| USAA Core Intermediate- Term Bond ETF | 1,000.00 | 1,091.70 | 1,023.24 | 2.06 | 1.99 | 0.39 | |||||||||||||||||||||
* Expenses are equal to the average account value multiplied by the Fund's annualized expense ratio multiplied by 184/365 (the number of days in the most recent fiscal half-year divided by the number of days in the fiscal year).
52
Victory Portfolios II | Supplemental Information — continued August 31, 2019 | ||||||
(Unaudited)
Considerations of the Board in Approving the Investment Advisory Agreement
In anticipation of the reorganization of each of the USAA Core Short-Term Bond ETF and USAA Core Intermediate-Term Bond ETF managed by USAA Asset Management Company ("AMCO," and each fund managed by AMCO, a "USAA ETF") into two comparable funds (each a "Fund") to be managed by a new, combined Victory Capital Management Inc. ("Victory Capital")/AMCO organization (the "Adviser") upon the completion of the acquisition of AMCO by the parent company of Victory Capital (the "Reorganization"), the Board approved an investment advisory agreement with the Adviser, on behalf of each Fund (the "Agreement"), at a meeting, which was called for that purpose, on February 26, 2019.
In considering whether to approve the Agreement, the Board requested, and the Adviser provided, information that the Board believed to be reasonably necessary to reach its conclusions. The Board, including the Independent Trustees, evaluated this information along with other information about the Adviser obtained throughout the year and was advised by independent legal counsel to the Independent Trustees. The Board reviewed numerous factors with respect to each USAA ETF that would continue into the comparable Fund. In considering whether the compensation to be paid to the Adviser was fair and reasonable, the Board also evaluated, among other things, the following factors:
• The requirements of the Funds for the services provided by the Adviser;
• The nature, quality and extent of the services provided and expected to be provided;
• The fees payable for the services and whether the fee arrangements provided for economies of scale that would benefit Fund shareholders as the Funds grow;
• Fees paid by other clients of the Adviser whose accounts are managed in a similar investment style and any differences in the services provided to the other clients compared to those provided to the Funds;
• Total expenses of the USAA ETFs, taking into consideration any distribution or shareholder servicing fees and the pro forma expense ratio of each comparable Fund;
• Management's commitment to operating the Funds at competitive expense levels;
• The anticipated pro forma profitability of the Adviser (as reflected by comparing fees earned against an estimate of the Adviser's costs) with respect to the Adviser's relationship with the Funds;
• Research and other service benefits received by the Adviser obtained through payment of client commissions for securities transactions;
• Other indirect benefits received by the Adviser, and its affiliates, including revenues paid to the Adviser, or its affiliates, by the Funds for administration and fund accounting services, and distribution;
• The capabilities and financial condition of the Adviser as a combined organization;
• Current economic and industry trends; and
• The historical relationship between the Trust and the Adviser.
The Board reviewed each Fund's proposed management fee, comprised of the advisory fee plus the administrative services fee to be paid to the Adviser, in the context of the Adviser's profitability of each Fund individually. In addition, the Board compared each Fund's proposed gross management fees and anticipated total operating expense ratio on a net and gross basis, taking into consideration any anticipated distribution or shareholder servicing fees, with the median gross management fee and median expense ratio of a universe of comparable mutual funds compiled by an independent consultant and a peer group of funds with similar investment strategies selected by that independent consultant. The Board reviewed the factors and methodology used by the independent consultant in the selection of each Fund's peer group, including the independent consultant's selection of a broad universe of funds using the standard retail Morningstar categories, the more specific universe of comparable funds, and peer groups of funds with comparable investment strategies and asset levels, among other factors. The Board noted that none of the advisory fee arrangements for the Funds included breakpoints, which are generally viewed as a method by which the investment adviser shares economies of scale as a fund grows. The Board also considered the Adviser's commitment to limit expenses as discussed in more detail below.
53
Victory Portfolios II | Supplemental Information — continued August 31, 2019 | ||||||
(Unaudited)
The Board found that the proposed gross annual management fee to be paid by each Fund was within the range of management fees paid by each Fund's respective peer group. The Board also found that each Fund's anticipated net annual expense ratio, taking into account any shareholder servicing or distribution fees, was reasonable as compared with each Fund's respective peer group. The Board considered the Adviser's contractual agreement with each Fund to waive its fees and reimburse expenses for a specified period of time, as described in the Fund's prospectus.
The Board reviewed various other specific factors with respect to each Fund, as described below. In their deliberations, the Trustees did not rank the importance of any particular information or factor considered and each Trustee may have attributed different weights to various factors.
Conclusion
Based on its review of the information requested and provided, and following extended discussions, the Board determined that the Agreement, on behalf of the Funds discussed above, was consistent with the best interests of each Fund and its shareholders, and the Board unanimously approved the Agreement, on behalf of each Fund on the basis of the foregoing review and discussions and the following considerations, among others:
• The fairness and reasonableness of the proposed investment advisory fee to be paid to the Adviser under the Agreement in light of the investment advisory services to be provided, the expected costs of these services, the anticipated profitability of the Adviser's relationship with the Fund and the comparability of the fee paid to the fees paid by other investment companies;
• The nature, quality and extent of the investment advisory services to be provided by the Adviser;
• The Adviser's entrepreneurial commitment to the management of the Funds and the creation of a broad-based family of funds, which could entail a substantial commitment of the Adviser's resources to the successful operation of the Funds;
• The Adviser's representations regarding its staffing and capabilities to manage the Funds, including the retention of personnel with relevant portfolio management experience;
• The Adviser's efforts to enhance investment results by, among other things, developing quality portfolio management teams; and
• The overall high quality of the personnel, operations, financial condition, investment management capabilities, methodologies and performance of the Adviser.
54
Privacy Policy
Protecting the Privacy of Information
The Trust respects your right to privacy. We also know that you expect us to conduct and process your business in an accurate and efficient manner. To do so, we must collect and maintain certain personal information about you. This is the information we collect from you on applications or other forms, and from the transactions you make with us or third parties. It may include your name, address, social security number, account transactions and balances, and information about investment goals and risk tolerance.
We do not disclose any information about you or about former customers to anyone except as permitted or required by law. Specifically, we may disclose the information we collect to companies that perform services on our behalf, such as the transfer agent that processes shareholder accounts and printers and mailers that assist us in the distribution of investor materials. We may also disclose this information to companies that perform marketing services on our behalf. This allows us to continue to offer you Victory investment products and services that meet your investing needs, and to effect transactions that you request or authorize. These companies will use this information only in connection with the services for which we hired them. They are not permitted to use or share this information for any other purpose.
To protect your personal information internally, we permit access only by authorized employees and maintain physical, electronic and procedural safeguards to guard your personal information.*
* You may have received communications regarding information about privacy policies from other financial institutions which gave you the opportunity to "opt-out" of certain information sharing with companies which are not affiliated with that financial institution. The Trust does not share information with other companies for purposes of marketing solicitations for products other than the Trust. Therefore, the Trust does not provide opt-out options to their shareholders.
The Victory Funds
P.O. Box 182593
Columbus, Ohio 43218-2593

Visit our website at: | Call Victory at: | ||||||
www.vcm.com | 866-376-7890 | ||||||
VS-BOND-ETF-AR (8/19)

August 31, 2019
Annual Report
VictoryShares USAA MSCI USA Value Momentum ETF
VictoryShares USAA MSCI USA Small Cap Value Momentum ETF
VictoryShares USAA MSCI International Value Momentum ETF
VictoryShares USAA MSCI Emerging Markets Value Momentum ETF
Beginning January 1, 2021, as permitted by regulations adopted by the Securities and Exchange Commission, paper copies of the VictoryShares' shareholder reports will no longer be sent by mail, unless you specifically request paper copies of the reports from your financial intermediary, such as a broker-dealer or bank. Instead, the reports will be made available on www.VictorySharesLiterature.com, and you will be notified by mail each time a report is posted and provided with a website link to access the report. If you already elected to receive shareholder reports electronically, you will not be affected by this change, and you need not take any action.
You may elect to receive shareholder reports and other communications electronically sooner than January 1, 2021 by notifying your financial intermediary directly.
You may elect to receive all future reports in paper free of charge. You can inform your financial intermediary that you wish to continue receiving paper copies of your reports. Your election to receive reports in paper will apply to all VictoryShares you hold through your financial intermediary.
vcm.com
News, Information And Education 24 Hours A Day, 7 Days A Week
The Victory Funds site gives fund shareholders, prospective shareholders, and investment professionals a convenient way to access fund information, get guidance, and track fund performance anywhere they can access the Internet. The site includes:
• Detailed performance records
• Daily share prices
• The latest fund news
• Investment resources to help you become a better investor
• A section dedicated to investment professionals
Whether you're a potential investor searching for the fund that matches your investment philosophy, a seasoned investor interested in planning tools, or an investment professional, www.vcm.com has what you seek. Visit us anytime. We're always open.
Victory Portfolios II
Table of Contents
Shareholder Letter (unaudited) | 3 | ||||||
Fund Review and Commentary (unaudited) | 4 | ||||||
Financial Statements | |||||||
Victory Portfolios II Exchange Traded Funds | |||||||
| VictoryShares USAA MSCI USA Value Momentum ETF | |||||||
Schedule of Portfolio Investments | 12 | ||||||
Statements of Assets and Liabilities | 56 | ||||||
Statements of Operations | 58 | ||||||
Statements of Changes in Net Assets | 60 | ||||||
Financial Highlights | 62 | ||||||
| VictoryShares USAA MSCI USA Small Cap Value Momentum ETF | |||||||
Schedule of Portfolio Investments | 18 | ||||||
Statements of Assets and Liabilities | 56 | ||||||
Statements of Operations | 58 | ||||||
Statements of Changes in Net Assets | 60 | ||||||
Financial Highlights | 62 | ||||||
| VictoryShares USAA MSCI International Value Momentum ETF | |||||||
Schedule of Portfolio Investments | 30 | ||||||
Statements of Assets and Liabilities | 57 | ||||||
Statements of Operations | 59 | ||||||
Statements of Changes in Net Assets | 61 | ||||||
Financial Highlights | 64 | ||||||
| VictoryShares USAA MSCI Emerging Markets Value Momentum ETF | |||||||
Schedule of Portfolio Investments | 44 | ||||||
Statements of Assets and Liabilities | 57 | ||||||
Statements of Operations | 59 | ||||||
Statements of Changes in Net Assets | 61 | ||||||
Financial Highlights | 64 | ||||||
Notes to Financial Statements | 66 | ||||||
| Report of Independent Registered Public Accounting Firm | 83 | ||||||
Supplemental Information (unaudited) | |||||||
Trustee and Officer Information | 85 | ||||||
Proxy Voting and Portfolio Holdings Information | 88 | ||||||
Expense Examples | 88 | ||||||
Additional Federal Income Tax Information | 90 | ||||||
Advisory Contract Approval | 91 | ||||||
Privacy Policy (inside back cover) | |||||||
1
The VictoryShares are distributed by Foreside Fund Services, LLC. Victory Capital Management Inc. is the investment adviser to the Funds and receives fees from the Funds for performing services for the Funds.
This report is not authorized for distribution to prospective investors unless preceded or accompanied by a current prospectus of the VictoryShares.
For additional information about any VictoryShares, including fees, expenses, and risks, view our prospectus online at www.vcm.com or call 866-376-7890. Read it carefully before you invest or send money.
The information in this annual report is based on data obtained from recognized services and sources and is believed to be reliable. Any opinions, projections, or recommendations in this report are subject to change without notice and are not intended as individual investment advice. Past investment performance of the ETFs, markets or securities mentioned herein should not be considered to be indicative of future results.
This report is for the information of the shareholders and others who have received a copy of the currently effective prospectus of the Funds, managed by Victory Capital Management Inc. It may be used as sales literature only when preceded or accompanied by a current prospectus, which provides further details about the Funds.
IRA DISTRIBUTION WITHHOLDING DISCLOSURE
We generally must withhold federal income tax at a rate of 10% of the taxable portion of your distribution and, if you live in a state that requires state income tax withholding, at your state's tax rate. However, you may elect not to have withholding apply or to have income tax withheld at a higher rate. Any withholding election that you make will apply to any subsequent distribution unless and until you change or revoke the election. If you wish to make a withholding election, or change or revoke a prior withholding election, call (800) 235-8396.
If you do not have a withholding election in place by the date of a distribution, federal income tax will be withheld from the taxable portion of your distribution at a rate of 10%. If you must pay estimated taxes, you may be subject to estimated tax penalties if your estimated tax payments are not sufficient and sufficient tax is not withheld from your distribution.
For more specific information, please consult your tax adviser.
• NOT FDIC INSURED • NO BANK GUARANTEE • MAY LOSE VALUE

Call Victory at:
866-376-7890
Visit our website at:
www.vcm.com
2
Shareholder Letter
Dear Shareholder,
The bull market in U.S. equities may have stumbled, but it might not be finished running just yet. The past year saw several periods of tumult and elevated volatility, including steep drawdowns late in 2018, in the spring of 2019, and more recently in early August. The culprits for the turbulence have been the usual suspects — concerns about future global growth rates, troubling geopolitical news, and uncertainties regarding U.S. trade policies. For the prior 12 month period the S&P 500 Index1 increased 2.92%.
The relatively bumpy performance of domestic stocks was evident across the capitalization spectrum and various sectors of the economy. But despite the sometimes-dire headlines and concerns about the waning impact of fiscal stimulus, the market's performance seemingly illustrates resilience and some inherent underlying strength in the U.S. economy and labor markets.
The volatility has not been relegated exclusively to the stock market. Against the backdrop of rapidly falling equities in the fourth quarter of last year, the Federal Open Market Committee (FOMC) made its famous "pivot" and abruptly changed course from a tightening bias to a more accommodative policy. Naturally, this helped stocks reverse their momentary swoon, and the FOMC made good on its promise to cut interest rates at the end of July 2019. This was the first rate cut since the 2008-2009 global financial crisis (and subsequently, the FOMC cut rates again in September after the close of this reporting cycle).
The shifting fixed income environment is exemplified by compression in the 10-Year U.S. Treasury yield, which ended August at 1.5%, a significant decline of 136 basis points over the course of the prior 12 months. Even more significant, perhaps, has been an inversion in parts of the yield curve, whereby shorter-term yields have become greater than long-term yields. This infrequent inversion is often — but not always — a troubling harbinger for the economy.
Certainly, there are ample concerns regarding global growth and ongoing trade disputes, but these worries are being actively countered by the policies of the Federal Reserve and other major global central banks. Moreover, it's important to reflect on the actual economic data and not focus on sentiment alone. According to the most recent figures available from the U.S. Department of Commerce, the U.S. economy grew at an estimated annualized rate of 2.0% during the second-quarter of 2019. Consumer spending metrics have been strong and job growth also continues unabated. All this has offset concerns regarding a slow-down in manufacturing.
Nevertheless, the current economic expansion is more than a decade old, and it's critical for investors to keep perspective that the bull cannot run forever. Investing is not without risks, and there are cross-currents that need to be monitored. Investors may wish to take this opportunity to revisit their allocations and risk tolerance.
My colleagues and I sincerely appreciate the confidence you have placed in us, and we value the opportunity to continue helping you meet your investment goals.

Christopher K. Dyer, CFA
President,
Victory Funds
1The S&P 500 Index, an unmanaged index comprised of 500 domestically traded common stocks, is weighted according to the market value of each common stock in the index, and includes reinvestment of dividends. The impact of transaction costs and the deduction of fees and expenses associated with a mutual fund, such as investment management and accounting fees, are not reflected in the index calculations. It is not possible to invest directly in an index.
Investing involves market risk, including the potential loss of principal. Past performance does not guarantee future performance results.
3
VictoryShares
VictoryShares USAA MSCI USA Value Momentum ETF
Portfolio Review
August 31, 2019 (Unaudited)
Portfolio Holdings
As a Percentage of Total Investments

U.S. equities posted mixed results for the year ended August 31, 2019, with the S&P 500 and Nasdaq 100 Indexes clinging to modest single-digit gains of 2.92% and 1.60%, respectively, while the Russell 2000 Index fell 12.92% over the period. The bull market, which started after the 2008-2009 financial crisis, faced a number of geopolitical and economic headwinds in the form of a US-China trade war and slowing global growth. U.S. stock prices declined during the last quarter of 2018 as President Trump continued to levy tariffs against imported Chinese goods. The declining trend reversed by the start of 2019 as talks between the two countries progressed in a positive direction. By the end of August, the S&P 500 Index was up 18.34% compared to the start of the calendar year. Despite gains in the stock market, the U.S. economic expansion seems to have slowed in 2019 with real GDP growth reported at a 2.57% annual rate during the first half of 2019, compared to 3.03% in the first half of 2018. The growth in consumer spending remained strong but concerns over declining business investments have surfaced. In light of the perceived slowdown, the U.S. Federal Reserve Bank (the "Fed") cut its interest rate by 0.25% during the July meeting, and it signaled a willingness to continue to accommodate the ongoing bull market through further monetary easing if necessary. Inflation remained below the Fed's targeted 2.00% annual rate. The U.S. bond market cautioned investors of a potential recession ahead when the yield curve inverted in August for the first time since the financial crisis. Long-term U.S. treasury rates remain near their all-time lows but continue to attract investors when compared against other countries, some of which are yielding negative rates. As concerns grew over slowing global growth, precious metals became a safe haven for investors. Gold spot price, as measured by the London Bullion Market Association's index, increased by 27.11% over the period.
During the reporting period, VictoryShares USAA MSCI USA Value Momentum ETF (the "Fund") returned -4.79% based on net asset value ("NAV") and -4.84% based on market price. The Fund's underlying index, the MSCI USA Select Value Momentum Blend Index (the "Index"), returned -4.59% over the same period. The Fund seeks to provide investment results that closely correspond, before fees and expenses, to the performance of the Index. The Fund, which provides exposure to U.S. large- and mid-cap stocks with value and momentum characteristics, generated negative absolute returns during the reporting period driven by double-digit declines in the energy, consumer discretionary and materials sectors. The real estate, utilities and communication services sectors fared best by contributing positive total returns over the reporting period. On an individual security level, the Fund's largest detractors were holdings in PG&E Corporation, Marathon Petroleum Corporation and DXC Technology Co. The biggest positive contributors were holdings in Ball Corporation, Tyson Foods Inc., and Starbucks Corporation. The portfolio's cash position resulted in a minor drag relative to the Index.
4
VictoryShares
VictoryShares USAA MSCI USA Value Momentum ETF (continued)
Average Annual Return
Year Ended August 31, 2019
| VictoryShares USAA MSCI USA Value Momentum ETF | VictoryShares USAA MSCI USA Value Momentum ETF | ||||||||||||||||||
INCEPTION DATE | 10/24/17 | 10/24/17 | |||||||||||||||||
Net Asset Value | Market Price Value | MSCI USA Select Value Momentum Blend Index | MSCI USA Index | ||||||||||||||||
One Year | –4.79 | % | –4.84 | % | –4.59 | % | 2.78 | % | |||||||||||
Three Year | N/A | N/A | N/A | N/A | |||||||||||||||
Five Year | N/A | N/A | N/A | N/A | |||||||||||||||
Ten Year | N/A | N/A | N/A | N/A | |||||||||||||||
Since Inception | 1.63 | % | 1.63 | % | N/A | N/A | |||||||||||||
Expense Ratios
Gross | 0.23 | % | |||||||||||||||||
With Applicable Waivers | 0.20 | % | |||||||||||||||||
Past performance is not indicative of future results. The performance data quoted represents past performance and current returns may be lower or higher. The investment return and principal value will fluctuate so that an investor's shares, when redeemed, may be worth more or less than the original cost. To obtain performance information current to the most recent month's end, please visit www.vcm.com.
The above expense ratios are from the Fund's prospectus dated July 1, 2019. Additional information pertaining to the Fund's expense ratios as of August 31, 2019 can be found in the financial highlights. The Adviser has contractually agreed to waive a portion of its management fee and/or reimburse certain expenses through June 30, 2021.
Comparison of the Change in Value of a $10,000 Investment

1The MSCI USA Select Value Momentum Blend Index is based on MSCI USA Index, its parent index, which includes large and mid-cap stocks in the US equity market. The index is designed to represent the performance of a strategy that seeks higher exposure to value and momentum factors within the parent index while also maintaining moderate Index turnover and lower realized volatility than traditional cap weighted indexes. It is not possible to invest directly in an index.
2The MSCI USA Index is designed to measure the performance of the large and mid-cap segments of the US market. With 637 constituents, the index covers approximately 85% of the free float-adjusted market capitalization in the US. It is not possible to invest directly in an index.
The graph reflects investment growth of a hypothetical $10,000 investment of the Fund. Past performance is not guarantee of future results.
5
VictoryShares
VictoryShares USAA MSCI USA Small Cap Value Momentum ETF
Portfolio Review
August 31, 2019 (Unaudited)
Portfolio Holdings
As a Percentage of Total Investments

U.S. equities posted mixed results for the year ended August 31, 2019, with the S&P 500 and Nasdaq 100 Indexes clinging to modest single-digit gains of 2.92% and 1.60% respectively, while the Russell 2000 Index fell 12.92% over the period. The bull market, which started after the 2008-2009 financial crisis, faced a number of geopolitical and economic headwinds in the form of a US-China trade war and slowing global growth. U.S. stock prices declined during the last quarter of 2018 as President Trump continued to levy tariffs against imported Chinese goods. The declining trend reversed by the start of 2019 as talks between the two countries progressed in a positive direction. By the end of August, the S&P 500 Index was up 18.34% compared to the start of the calendar year. Despite gains in the stock market, the U.S. economic expansion seems to have slowed in 2019 with real GDP growth reported at a 2.57% annual rate during the first half of 2019, compared to 3.03% in the first half of 2018. The growth in consumer spending remained strong but concerns over declining business investments have surfaced. In light of the perceived slowdown, the U.S. Federal Reserve Bank ("the Fed") cut its interest rate by 0.25% during the July meeting, and it signaled a willingness to continue to accommodate the ongoing bull market through further monetary easing if necessary. Inflation remained below the Fed's targeted 2.00% annual rate. The U.S. bond market cautioned investors of a potential recession ahead when the yield curve inverted in August for the first time since the financial crisis. Long-term U.S. treasury rates remain near their all-time lows but continue to attract investors when compared against other countries, some of which are yielding negative rates. As concerns grew over slowing global growth, precious metals became a safe haven for investors. Gold spot price, as measured by the London Bullion Market Association's index, increased by 27.11% over the period.
During the reporting period, VictoryShares USAA MSCI USA Small Cap Value Momentum ETF (the "Fund") returned -11.99% based on net asset value ("NAV") and -11.98% based on market price. The Fund's underlying index, the MSCI USA Small Cap Select Value Momentum Blend Index (the "Index") lost -11.81% over the same period. The Fund seeks to provide investment results that closely correspond, before fees and expenses, to the performance of the Index. The Fund, which provides exposure to U.S. small-cap stocks with value and momentum characteristics, generated negative absolute returns during the reporting period driven by double-digit declines in the energy, health care and consumer discretionary sectors. Utilities and real estate were the only sectors with positive total returns over the reporting period. On an individual security level, the Fund was most negatively impacted by holdings in United Natural Foods Inc., Mallinckrodt Plc and Inogen Inc. The biggest positive contributors were holdings in PS Business Parks Inc., Cable One Inc. and Trade Desk Inc. The portfolio's cash position resulted in a minor positive impact relative to the Index.
6
VictoryShares
VictoryShares USAA MSCI USA Small Cap Value Momentum ETF (continued)
Average Annual Return
Year Ended August 31, 2019
| VictoryShares USAA MSCI USA Small Cap Value Momentum ETF | VictoryShares USAA MSCI USA Small Cap Value Momentum ETF | ||||||||||||||||||
INCEPTION DATE | 10/24/17 | 10/24/17 | |||||||||||||||||
Net Asset Value | Market Price Value | MSCI USA Small Cap Select Value Momentum Blend Index | MSCI USA Small Cap Index | ||||||||||||||||
One Year | –11.99 | % | –11.98 | % | –11.81 | % | –8.20 | % | |||||||||||
Three Year | N/A | N/A | N/A | N/A | |||||||||||||||
Five Year | N/A | N/A | N/A | N/A | |||||||||||||||
Ten Year | N/A | N/A | N/A | N/A | |||||||||||||||
Since Inception | 0.56 | % | 0.59 | % | N/A | N/A | |||||||||||||
Expense Ratios
Gross | 0.24 | % | |||||||||||||||||
With Applicable Waivers | 0.24 | % | |||||||||||||||||
Past performance is not indicative of future results. The performance data quoted represents past performance and current returns may be lower or higher. The investment return and principal value will fluctuate so that an investor's shares, when redeemed, may be worth more or less than the original cost. To obtain performance information current to the most recent month's end, please visit www.vcm.com.
The above expense ratios are from the Fund's prospectus dated July 1, 2019. Additional information pertaining to the Fund's expense ratios as of August 31, 2019 can be found in the financial highlights. The Adviser has contractually agreed to waive a portion of its management fee and/or reimburse certain expenses through June 30, 2021.
Comparison of the Change in Value of a $10,000 Investment
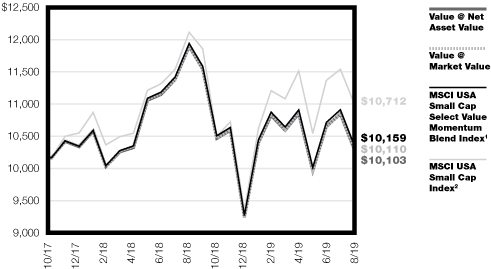
1The MSCI USA Small Cap Select Value Momentum Blend Index is based on a traditional market cap weighted parent index, MSCI USA Small Cap Index, which includes US small cap stocks. The index is designed to represent the performance of a strategy that seeks higher exposure to value and momentum factors within the parent index while also maintaining moderate Index turnover and lower realized volatility than traditional cap weighted indexes. It is not possible to invest directly in an index.
2The MSCI USA Small Cap Index is designed to measure the performance of the small cap segment of the US equity market. With 1,791 constituents, the index represents approximately 14% of the free float-adjusted market capitalization in the US. It is not possible to invest directly in an index.
The graph reflects investment growth of a hypothetical $10,000 investment of the Fund. Past performance is not guarantee of future results.
7
VictoryShares
VictoryShares USAA MSCI International Value Momentum ETF
Portfolio Review
August 31, 2019 (Unaudited)
Portfolio Holdings
As a Percentage of Total Investments

Non-U.S. developed market equities, as represented by the MSCI EAFE Index, returned -2.65% for the year ended August 31, 2019, 19. The bull market, which started after the 2008-2009 financial crisis, faced a number of geopolitical and economic headwinds in the form of a US-China trade war and slowing global growth. Non-U.S. developed stock prices declined during the last quarter of 2018 at a time when U.S. President Donald Trump continued to levy tariffs against imported Chinese goods. The declining trend reversed by the start of 2019 as talks between the two countries progressed in a positive direction. By the end of August, the MSCI EAFE Index was up 10.21% compared to the start of 2019. Despite stock market gains in developed markets, the economic expansion seems to be slowing. The International Monetary Fund's July release of the World Economic Outlook (WEO) estimates GDP growth in Advanced Economies to be 1.90% in 2019 and 1.70% in 2020. In light of the perceived slowdown, central banks around the world have been evaluating the possibility of monetary easing despite some of them already having negative interest rates. For example, the 10-year German government bonds ("bunds") finished August at a negative rate of 0.70%. In addition to low rates across various developed economies, the U.S. bond market cautioned investors of a potential recession ahead when the yield curve inverted in August for the first time since the financial crisis. As concerns grew over slowing global growth, precious metals became a safe haven for investors. Gold spot price, as measured by the London Bullion Market Association's index, increased by 27.11% over the period.
During the reporting period, VictoryShares USAA MSCI International Value Momentum ETF (the "Fund") returned -7.70% based on net asset value and -7.53% based on market price. The Fund's underlying index, the MSCI World ex USA Select Value Momentum Blend Index (the "Index") declined by -7.45% over the same horizon. The Fund seeks to provide investment results that closely correspond, before fees and expenses, to the performance of the Index. The Fund, which provides exposure to equities in non-U.S. markets with value and momentum characteristics, generated negative absolute returns during the reporting period driven by double-digit declines in Japan, France and the United Kingdom. Switzerland and Sweden were the top two positively contributing countries. On an individual security level, the Fund was most negatively impacted by holdings in Teva Pharmaceutical Industries, J Sainsbury Plc and Wm Morrison Supermarkets Plc. The biggest positive contributors were holdings in Swiss Life Holding AG, Goodman Group and Fortescue Metals Group Ltd. The portfolio's cash position had a positive impact relative to the Index.
8
VictoryShares
VictoryShares USAA MSCI International Value Momentum ETF (continued)
Average Annual Return
Year Ended August 31, 2019
| VictoryShares USAA MSCI International Value Momentum ETF | VictoryShares USAA MSCI International Value Momentum ETF | ||||||||||||||||||
INCEPTION DATE | 10/24/17 | 10/24/17 | |||||||||||||||||
Net Asset Value | Market Price Value | MSCI World ex USA Select Value Momentum Blend Index | MSCI World ex USA (Net) Index | ||||||||||||||||
One Year | –7.70 | % | –7.53 | % | –7.45 | % | –2.90 | % | |||||||||||
Three Year | N/A | N/A | N/A | N/A | |||||||||||||||
Five Year | N/A | N/A | N/A | N/A | |||||||||||||||
Ten Year | N/A | N/A | N/A | N/A | |||||||||||||||
Since Inception | –5.59 | % | –5.52 | % | N/A | N/A | |||||||||||||
Expense Ratios
Gross | 0.51 | % | |||||||||||||||||
With Applicable Waivers | 0.35 | % | |||||||||||||||||
Past performance is not indicative of future results. The performance data quoted represents past performance and current returns may be lower or higher. The investment return and principal value will fluctuate so that an investor's shares, when redeemed, may be worth more or less than the original cost. To obtain performance information current to the most recent month's end, please visit www.vcm.com.
The above expense ratios are from the Fund's prospectus dated July 1, 2019. Additional information pertaining to the Fund's expense ratios as of August 31, 2019 can be found in the financial highlights. The Adviser has contractually agreed to waive a portion of its management fee and/or reimburse certain expenses through June 30, 2021.
Comparison of the Change in Value of a $10,000 Investment

1The MSCI World ex USA Select Value Momentum Blend Index is based on MSCI World ex USA, its parent index, which includes large and mid-cap stocks across 22 of 23 Developed Markets (DM) countries, excluding the US. The index is designed to represent the performance of a strategy that seeks higher exposure to value and momentum factors within the parent index while also maintaining moderate Index turnover and lower realized volatility than traditional cap weighted indexes. It is not possible to invest directly in an index.
2The MSCI World ex USA (Net) Index captures large and mid-cap representation across 22 of 23 Developed Markets (DM) countries, excluding the United States. With 1,013 constituents, the index covers approximately 85% of the free float-adjusted market capitalization in each country. It is not possible to invest directly in an index.
The graph reflects investment growth of a hypothetical $10,000 investment of the Fund. Past performance is not guarantee of future results.
9
VictoryShares
VictoryShares USAA MSCI Emerging Markets Value Momentum ETF
Portfolio Review
August 31, 2019 (Unaudited)
Portfolio Holdings
As a Percentage of Total Investments

Emerging market equities, as represented by the MSCI Emerging Markets Index, returned -4.01% for the year ended August 31, 2019. The bull market, which started after the 2008-2009 financial crisis, faced a number of geopolitical and economic headwinds in the form of a US-China trade war and slowing global growth. Emerging Market stocks declined during the last quarter of 2018 at a time when U.S. President Donald Trump continued to levy tariffs against imported Chinese goods. The declining trend reversed by the start of 2019 as talks between the two countries progressed in a positive direction. By the end of August, the MSCI Emerging Markets Index was up 4.15% compared to the start of the year. Although growth in developed economies is expected to slow, the International Monetary Fund's July release of the World Economic Outlook (WEO) estimates GDP growth in Emerging Market and Developing Economies to be 4.10% in 2019 and 4.70% in 2020. Despite growth prospects being better in emerging economies, concerns remain over political uncertainty as shown by countries like Venezuela where political struggles are causing disruptions. In addition to the political environment, another area of consideration for emerging markets is their high debt levels. A persistently strong U.S. dollar could make it difficult for emerging countries to service their debts. In light of global concerns, many central banks around the world have expressed a willingness for monetary easing to keep interest rates low but the tools at their disposal may be limited by already low and in some cases negative rates. The U.S. bond market recently cautioned investors of a potential recession ahead when the yield curve inverted in August for the first time since the financial crisis. As concerns over global growth and political tensions remain, precious metals have become a safe haven for investors. Gold spot price, as measured by the London Bullion Market Association's index, increased by 27.11% over the period.
During the reporting period, VictoryShares USAA MSCI Emerging Markets Value Momentum ETF (the "Fund") returned -7.62% based on net asset value ("NAV") and -7.66% based on market price. The Fund's underlying index, the MSCI Emerging Markets Select Value Momentum Blend Index (the "Index") returned -6.98% over the same horizon. The Fund seeks to provide investment results that closely correspond, before fees and expenses, to the performance of the Index. The Fund, which provides exposure to equities in emerging markets with value and momentum characteristics, generated negative absolute returns during the reporting period driven by Korea, China and Taiwan. Among the countries with the top positive performance were Brazil, Russia and South Africa. On an individual security level, the Fund was most negatively impacted by holdings in E-MART Inc., United Microelectronics Corp. and Jiayuan International Group Ltd. The biggest positive contributors were holdings in JBS S.A., Yihai International Holding Ltd and Companhia Energetica de Minas Gerais. The portfolio's cash position had a positive impact relative to the Index.
10
VictoryShares
VictoryShares USAA MSCI Emerging Markets Value Momentum ETF (continued)
Average Annual Return
Year Ended August 31, 2019
| VictoryShares USAA MSCI Emerging Markets Value Momentum ETF | VictoryShares USAA MSCI Emerging Markets Value Momentum ETF | ||||||||||||||||||
INCEPTION DATE | 10/24/17 | 10/24/17 | |||||||||||||||||
Net Asset Value | Market Price Value | MSCI Emerging Markets Select Value Momentum Blend Index | MSCI Emerging Markets (Net) Index | ||||||||||||||||
One Year | –7.62 | % | –7.66 | % | –6.98 | % | –4.36 | % | |||||||||||
Three Year | N/A | N/A | N/A | N/A | |||||||||||||||
Five Year | N/A | N/A | N/A | N/A | |||||||||||||||
Ten Year | N/A | N/A | N/A | N/A | |||||||||||||||
Since Inception | –8.35 | % | –8.18 | % | N/A | N/A | |||||||||||||
Expense Ratios
Gross | 1.18 | % | |||||||||||||||||
With Applicable Waivers | 0.45 | % | |||||||||||||||||
Past performance is not indicative of future results. The performance data quoted represents past performance and current returns may be lower or higher. The investment return and principal value will fluctuate so that an investor's shares, when redeemed, may be worth more or less than the original cost. To obtain performance information current to the most recent month's end, please visit www.vcm.com.
The above expense ratios are from the Fund's prospectus dated July 1, 2019. Additional information pertaining to the Fund's expense ratios as of August 31, 2019 can be found in the financial highlights. The Adviser has contractually agreed to waive a portion of its management fee and/or reimburse certain expenses through June 30, 2021.
Comparison of the Change in Value of a $10,000 Investment

1The MSCI Emerging Markets Select Value Momentum Blend Index is based on MSCI Emerging Markets index, its parent index, which includes large and mid-cap stocks across 24 Emerging Markets (EM) countries. The index is designed to represent the performance of a strategy that seeks higher exposure to value and momentum factors within the parent index while also maintaining moderate Index turnover and lower realized volatility than traditional cap weighted indexes. It is not possible to invest directly in an index.
2The MSCI Emerging Markets Index captures large and mid-cap representation across 26 Emerging Markets (EM) countries. With 1,202 constituents, the index covers approximately 85% of the free float-adjusted market capitalization in each country. It is not possible to invest directly in an index.
The graph reflects investment growth of a hypothetical $10,000 investment of the Fund. Past performance is not guarantee of future results.
11
| Victory Portfolios II VictoryShares USAA MSCI USA Value Momentum ETF | Schedule of Portfolio Investments August 31, 2019 | ||||||
Security Description | Shares | Value | |||||||||
Common Stocks (99.4%) | |||||||||||
Communication Services (5.8%): | |||||||||||
Altice USA, Inc., Class A (a) | 93,184 | $ | 2,691,154 | ||||||||
AT&T, Inc. | 103,652 | 3,654,769 | |||||||||
CenturyLink, Inc. | 172,439 | 1,962,356 | |||||||||
Comcast Corp., Class A | 78,406 | 3,470,250 | |||||||||
Discovery Communications, Inc., Class A (a) | 72,622 | 2,004,367 | |||||||||
Live Nation Entertainment, Inc. (a) | 40,821 | 2,837,468 | |||||||||
Sprint Corp. (a) | 280,303 | 1,903,257 | |||||||||
The Walt Disney Co. | 26,519 | 3,639,998 | |||||||||
T-Mobile US, Inc. (a) | 19,491 | 1,521,273 | |||||||||
Verizon Communications, Inc. | 32,317 | 1,879,557 | |||||||||
Viacom, Inc., Class B | 75,129 | 1,876,722 | |||||||||
27,441,171 | |||||||||||
Consumer Discretionary (9.5%): | |||||||||||
AutoZone, Inc. (a) | 3,001 | 3,306,172 | |||||||||
Best Buy Co., Inc. | 31,218 | 1,987,026 | |||||||||
BorgWarner, Inc. | 37,852 | 1,235,111 | |||||||||
Chipotle Mexican Grill, Inc. (a) | 1,091 | 914,716 | |||||||||
D.R. Horton, Inc. | 34,971 | 1,730,015 | |||||||||
Ford Motor Co. | 305,449 | 2,800,968 | |||||||||
Garmin Ltd. | 19,025 | 1,551,869 | |||||||||
General Motors Co., Class C | 71,204 | 2,640,956 | |||||||||
Kohl's Corp. | 34,950 | 1,651,737 | |||||||||
Lear Corp. | 21,770 | 2,443,900 | |||||||||
Lennar Corp., Class A | 54,162 | 2,762,262 | |||||||||
Macy's, Inc. | 90,452 | 1,335,072 | |||||||||
Norwegian Cruise Line Holdings Ltd. (a) | 45,284 | 2,298,163 | |||||||||
NVR, Inc. (a) | 417 | 1,500,783 | |||||||||
PulteGroup, Inc. | 86,931 | 2,938,268 | �� | ||||||||
Ralph Lauren Corp. | 9,706 | 857,428 | |||||||||
Roku, Inc. (a) | 8,989 | 1,360,575 | |||||||||
Royal Caribbean Cruises Ltd. | 21,925 | 2,286,339 | |||||||||
Starbucks Corp. | 40,820 | 3,941,579 | |||||||||
Target Corp. | 14,157 | 1,515,365 | |||||||||
The Gap, Inc. | 42,332 | 668,422 | |||||||||
Tractor Supply Co. | 11,442 | 1,165,711 | |||||||||
Whirlpool Corp. | 9,385 | 1,305,360 | |||||||||
44,197,797 | |||||||||||
Consumer Staples (4.9%): | |||||||||||
Church & Dwight Co., Inc. | 22,894 | 1,826,483 | |||||||||
Coty, Inc., Class A (b) | 87,997 | 840,371 | |||||||||
General Mills, Inc. | 30,573 | 1,644,827 | |||||||||
Molson Coors Brewing Co., Class B | 48,004 | 2,465,485 | |||||||||
Mondelez International, Inc., Class A | 35,057 | 1,935,848 | |||||||||
The Hershey Co. | 12,540 | 1,987,339 | |||||||||
The J.M. Smucker Co. | 11,575 | 1,217,227 | |||||||||
The Kroger Co. | 88,320 | 2,091,417 | |||||||||
See notes to financial statements.
12
| Victory Portfolios II VictoryShares USAA MSCI USA Value Momentum ETF | Schedule of Portfolio Investments — continued August 31, 2019 | ||||||
Security Description | Shares | Value | |||||||||
The Procter & Gamble Co. | 38,946 | $ | 4,682,478 | ||||||||
Tyson Foods, Inc., Class A | 34,661 | 3,224,860 | |||||||||
Walgreens Boots Alliance, Inc. | 27,319 | 1,398,460 | |||||||||
23,314,795 | |||||||||||
Energy (5.3%): | |||||||||||
Baker Hughes, Inc. | 49,791 | 1,079,967 | |||||||||
Chevron Corp. | 31,945 | 3,760,565 | |||||||||
Cimarex Energy Co. | 16,114 | 689,357 | |||||||||
ConocoPhillips | 21,290 | 1,110,912 | |||||||||
Devon Energy Corp. | 75,022 | 1,649,734 | |||||||||
Diamondback Energy, Inc. | 10,589 | 1,038,569 | |||||||||
HollyFrontier Corp. | 45,145 | 2,002,632 | |||||||||
Kinder Morgan, Inc. | 157,221 | 3,186,870 | |||||||||
Marathon Oil Corp. | 135,966 | 1,609,837 | |||||||||
Parsley Energy, Inc., Class A (a) | 100,571 | 1,801,227 | |||||||||
Phillips 66 | 36,644 | 3,614,198 | |||||||||
Plains GP Holdings LP, Class A | 54,247 | 1,189,094 | |||||||||
Valero Energy Corp. | 32,386 | 2,438,018 | |||||||||
25,170,980 | |||||||||||
Financials (15.9%): | |||||||||||
Alleghany Corp. (a) | 2,921 | 2,188,735 | |||||||||
Ally Financial, Inc. | 96,315 | 3,019,475 | |||||||||
American International Group, Inc. | 59,472 | 3,094,923 | |||||||||
Arch Capital Group Ltd. (a) | 110,598 | 4,368,621 | |||||||||
Athene Holding Ltd., Class A (a) | 76,449 | 2,970,808 | |||||||||
AXA Equitable Holdings, Inc. | 149,445 | 3,103,973 | |||||||||
Bank of America Corp. | 46,279 | 1,273,135 | |||||||||
Brighthouse Financial, Inc. (a) | 85,914 | 3,029,328 | |||||||||
Capital One Financial Corp. | 31,951 | 2,767,596 | |||||||||
Chubb Ltd. | 16,093 | 2,515,014 | |||||||||
Cincinnati Financial Corp. | 36,946 | 4,156,056 | |||||||||
CIT Group, Inc. | 63,973 | 2,724,610 | |||||||||
Citigroup, Inc. | 44,980 | 2,894,463 | |||||||||
Citizens Financial Group, Inc. | 76,835 | 2,592,413 | |||||||||
Erie Indemnity Co., Class A | 18,435 | 4,042,980 | |||||||||
Jefferies Financial Group, Inc. | 65,441 | 1,219,820 | |||||||||
Lincoln National Corp. | 42,565 | 2,250,837 | |||||||||
MetLife, Inc. | 58,342 | 2,584,551 | |||||||||
Morgan Stanley | 30,659 | 1,272,042 | |||||||||
MSCI, Inc. | 7,128 | 1,672,443 | |||||||||
Prudential Financial, Inc. | 33,681 | 2,697,511 | |||||||||
RenaissanceRe Holdings Ltd., ADR | 21,458 | 3,874,242 | |||||||||
Synchrony Financial | 67,479 | 2,162,702 | |||||||||
Unum Group | 84,988 | 2,159,545 | |||||||||
Voya Financial, Inc. | 46,163 | 2,276,759 | |||||||||
W.R. Berkley Corp. | 69,452 | 4,948,454 | |||||||||
Willis Towers Watson PLC | 10,141 | 2,007,614 | |||||||||
73,868,650 | |||||||||||
See notes to financial statements.
13
| Victory Portfolios II VictoryShares USAA MSCI USA Value Momentum ETF | Schedule of Portfolio Investments — continued August 31, 2019 | ||||||
Security Description | Shares | Value | |||||||||
Health Care (12.6%): | |||||||||||
Abbott Laboratories | 43,057 | $ | 3,673,623 | ||||||||
Allergan PLC | 14,493 | 2,314,822 | |||||||||
Anthem, Inc. | 5,050 | 1,320,676 | |||||||||
Cardinal Health, Inc. | 26,077 | 1,124,701 | |||||||||
Celgene Corp. (a) | 20,592 | 1,993,306 | |||||||||
Cerner Corp. | 18,871 | 1,300,401 | |||||||||
CVS Health Corp. | 20,364 | 1,240,575 | |||||||||
Danaher Corp. | 27,541 | 3,913,301 | |||||||||
Dentsply Sirona, Inc. | 50,115 | 2,613,497 | |||||||||
Eli Lilly & Co. | 14,226 | 1,607,111 | |||||||||
Gilead Sciences, Inc. | 20,747 | 1,318,264 | |||||||||
IQVIA Holdings, Inc. (a) | 20,761 | 3,221,069 | |||||||||
Jazz Pharmaceuticals PLC (a) | 8,524 | 1,092,351 | |||||||||
Laboratory Corp. of America Holdings (a) | 9,670 | 1,620,305 | |||||||||
McKesson Corp. | 16,574 | 2,291,687 | |||||||||
Medtronic PLC | 18,530 | 1,999,202 | |||||||||
Merck & Co., Inc. | 43,524 | 3,763,521 | |||||||||
Mettler-Toledo International, Inc. (a) | 2,089 | 1,372,034 | |||||||||
Mylan NV (a) | 99,501 | 1,937,284 | |||||||||
Steris PLC | 25,551 | 3,945,074 | |||||||||
Stryker Corp. | 8,206 | 1,810,736 | |||||||||
The Cooper Co., Inc. | 4,727 | 1,464,188 | |||||||||
Thermo Fisher Scientific, Inc. | 12,706 | 3,647,385 | |||||||||
Universal Health Services, Inc., Class B | 21,569 | 3,118,446 | |||||||||
Veeva Systems, Inc., Class A (a) | 13,042 | 2,091,676 | |||||||||
Zimmer Biomet Holdings, Inc. | 9,981 | 1,389,355 | |||||||||
Zoetis, Inc. | 13,755 | 1,738,907 | |||||||||
58,923,497 | |||||||||||
Industrials (14.7%): | |||||||||||
AMERCO, Inc. | 8,585 | 3,018,657 | |||||||||
American Airlines Group, Inc. | 68,735 | 1,808,418 | |||||||||
AMETEK, Inc. | 20,892 | 1,795,250 | |||||||||
CoStar Group, Inc. (a) (b) | 2,314 | 1,422,809 | |||||||||
CSX Corp. | 17,186 | 1,151,806 | |||||||||
Cummins, Inc. | 19,010 | 2,837,623 | |||||||||
Delta Air Lines, Inc. | 48,010 | 2,777,859 | |||||||||
Eaton Corp. PLC | 21,740 | 1,754,853 | |||||||||
HEICO Corp. | 9,922 | 1,435,416 | |||||||||
IHS Markit Ltd. (a) | 31,260 | 2,050,969 | |||||||||
Ingersoll-Rand PLC | 29,130 | 3,527,352 | |||||||||
Jacobs Engineering Group, Inc. | 35,241 | 3,131,515 | |||||||||
Johnson Controls International PLC | 35,166 | 1,501,237 | |||||||||
Kansas City Southern | 13,723 | 1,726,353 | |||||||||
Knight-Swift Transportation Holdings, Inc. | 67,997 | 2,321,418 | |||||||||
L3Harris Technologies, Inc. | 7,530 | 1,591,917 | |||||||||
ManpowerGroup, Inc. | 28,416 | 2,322,724 | |||||||||
Norfolk Southern Corp. | 17,052 | 2,967,901 | |||||||||
Owens Corning, Inc. | 47,516 | 2,725,517 | |||||||||
PACCAR, Inc. | 44,186 | 2,896,834 | |||||||||
See notes to financial statements.
14
| Victory Portfolios II VictoryShares USAA MSCI USA Value Momentum ETF | Schedule of Portfolio Investments — continued August 31, 2019 | ||||||
Security Description | Shares | Value | |||||||||
Republic Services, Inc., Class A | 56,315 | $ | 5,026,113 | ||||||||
Roper Technologies, Inc. | 5,497 | 2,016,080 | |||||||||
Southwest Airlines Co. | 52,122 | 2,727,023 | |||||||||
Spirit Aerosystems Holdings, Inc., Class A | 16,089 | 1,296,773 | |||||||||
Union Pacific Corp. | 9,477 | 1,534,895 | |||||||||
United Airlines Holdings, Inc. (a) | 27,471 | 2,316,080 | |||||||||
United Rentals, Inc. (a) | 15,563 | 1,751,771 | |||||||||
Verisk Analytics, Inc., Class A | 13,938 | 2,251,545 | |||||||||
Waste Management, Inc. | 41,453 | 4,947,416 | |||||||||
68,634,124 | |||||||||||
Information Technology (12.9%): | |||||||||||
Analog Devices, Inc. | 14,314 | 1,572,107 | |||||||||
Arrow Electronics, Inc. (a) | 21,961 | 1,519,701 | |||||||||
Broadcom, Inc. | 8,189 | 2,314,539 | |||||||||
Cadence Design Systems, Inc. (a) | 42,073 | 2,881,159 | |||||||||
CDW Corp. | 13,385 | 1,545,968 | |||||||||
Cisco Systems, Inc. | 67,176 | 3,144,508 | |||||||||
Dell Technologies, Inc., Class C (a) | 44,616 | 2,299,062 | |||||||||
DXC Technology Co. | 56,039 | 1,861,616 | |||||||||
EPAM Systems, Inc. (a) | 7,386 | 1,413,163 | |||||||||
Fidelity National Information Services, Inc. | 16,411 | 2,235,506 | |||||||||
Flextronics International Ltd. (a) | 84,183 | 810,682 | |||||||||
Global Payments, Inc. | 10,437 | 1,732,333 | |||||||||
Hewlett Packard Enterprises Co. | 187,769 | 2,594,967 | |||||||||
Intel Corp. | 30,007 | 1,422,632 | |||||||||
Juniper Networks, Inc. | 60,650 | 1,404,654 | |||||||||
Keysight Technologies, Inc. (a) | 32,074 | 3,106,687 | |||||||||
Lam Research Corp. | 5,336 | 1,123,281 | |||||||||
Leidos Holdings, Inc. | 18,740 | 1,637,126 | |||||||||
Mastercard, Inc., Class A | 7,367 | 2,072,853 | |||||||||
Microchip Technology, Inc. | 14,994 | 1,294,432 | |||||||||
Micron Technology, Inc. (a) | 40,424 | 1,829,994 | |||||||||
Motorola Solutions, Inc. | 9,568 | 1,730,947 | |||||||||
Okta, Inc. (a) | 9,800 | 1,239,700 | |||||||||
ON Semiconductor Corp. (a) | 102,558 | 1,825,532 | |||||||||
Paycom Software, Inc. (a) | 4,225 | 1,056,757 | |||||||||
Qorvo, Inc. (a) | 29,478 | 2,105,614 | |||||||||
QUALCOMM, Inc. | 11,630 | 904,465 | |||||||||
Seagate Technology PLC | 21,356 | 1,072,285 | |||||||||
Synopsys, Inc. (a) | 13,216 | 1,874,161 | |||||||||
Total System Services, Inc. | 13,023 | 1,747,947 | |||||||||
Twilio, Inc., Class A (a) | 10,133 | 1,322,053 | |||||||||
VMware, Inc., Class A | 5,660 | 800,550 | |||||||||
Western Digital Corp. | 35,188 | 2,015,217 | |||||||||
Xerox Holdings Corp. | 74,949 | 2,172,772 | |||||||||
Xilinx, Inc. | 12,212 | 1,270,781 | |||||||||
60,955,751 | |||||||||||
See notes to financial statements.
15
| Victory Portfolios II VictoryShares USAA MSCI USA Value Momentum ETF | Schedule of Portfolio Investments — continued August 31, 2019 | ||||||
Security Description | Shares | Value | |||||||||
Materials (4.0%): | |||||||||||
Air Products & Chemicals, Inc. | 19,599 | $ | 4,427,806 | ||||||||
Ball Corp. | 49,562 | 3,985,280 | |||||||||
Crown Holdings, Inc. (a) | 24,798 | 1,632,700 | |||||||||
Dow, Inc. | 31,400 | 1,338,582 | |||||||||
Nucor Corp. | 21,986 | 1,076,874 | |||||||||
Steel Dynamics, Inc. | 74,767 | 2,018,709 | |||||||||
The Mosaic Co. | 99,072 | 1,821,934 | |||||||||
WestRock Co. | 72,570 | 2,480,443 | |||||||||
18,782,328 | |||||||||||
Real Estate (6.9%): | |||||||||||
American Tower Corp. | 18,727 | 4,310,768 | |||||||||
CBRE Group, Inc., Class A (a) | 59,452 | 3,107,556 | |||||||||
Equinix, Inc. | 3,192 | 1,775,646 | |||||||||
Equity LifeStyle Properties, Inc. | 35,272 | 4,751,843 | |||||||||
Host Hotels & Resorts, Inc. | 194,745 | 3,123,710 | |||||||||
Jones Lang LaSalle, Inc. | 19,075 | 2,557,004 | |||||||||
Kimco Realty Corp. | 73,300 | 1,347,254 | |||||||||
National Retail Properties, Inc. | 32,573 | 1,828,974 | |||||||||
Public Storage | 7,713 | 2,041,940 | |||||||||
Realty Income Corp. | 26,164 | 1,931,165 | |||||||||
SBA Communications Corp. | 6,164 | 1,617,619 | |||||||||
Welltower, Inc. | 42,629 | 3,817,853 | |||||||||
32,211,332 | |||||||||||
Utilities (6.9%): | |||||||||||
AES Corp. | 211,394 | 3,240,670 | |||||||||
Ameren Corp. | 29,587 | 2,282,637 | |||||||||
American Electric Power Co., Inc. | 27,687 | 2,523,670 | |||||||||
CenterPoint Energy, Inc. | 79,485 | 2,200,940 | |||||||||
Edison International | 21,282 | 1,538,050 | |||||||||
Entergy Corp. | 21,052 | 2,375,508 | |||||||||
Exelon Corp. | 95,113 | 4,495,040 | |||||||||
OGE Energy Corp. | 106,010 | 4,544,649 | |||||||||
Pinnacle West Capital Corp. | 23,682 | 2,257,131 | |||||||||
The Southern Co. | 41,968 | 2,445,056 | |||||||||
Vistra Energy Corp. | 176,991 | 4,415,925 | |||||||||
32,319,276 | |||||||||||
Total Common Stocks (Cost $456,107,114) | 465,819,701 | ||||||||||
Total Investments (Cost $456,107,114) — 99.4% | 465,819,701 | ||||||||||
Other assets in excess of liabilities — 0.6% | 2,624,868 | ||||||||||
NET ASSETS — 100.00% | $ | 468,444,569 | |||||||||
(a) Non-income producing security.
(b) All or a portion of this security has been segregated as collateral for derivative instruments.
ADR — American Depositary Receipt
LP — Limited Partnership
PLC — Public Limited Company
See notes to financial statements.
16
| Victory Portfolios II VictoryShares USAA MSCI USA Value Momentum ETF | Schedule of Portfolio Investments — continued August 31, 2019 | ||||||
Futures Contracts Purchased
| Number of Contracts | Expiration Date | Notional Amount | Value | Unrealized Appreciation (Depreciation) | |||||||||||||||||||
E-Mini S&P 500 Futures | 13 | 9/20/19 | $ | 1,877,888 | $ | 1,901,120 | $ | 23,232 | |||||||||||||||
Total unrealized appreciation | $ | 23,232 | |||||||||||||||||||||
Total unrealized depreciation | — | ||||||||||||||||||||||
Total net unrealized appreciation(depreciation) | $ | 23,232 | |||||||||||||||||||||
See notes to financial statements.
17
| Victory Portfolios II VictoryShares USAA MSCI USA Small Cap Value Momentum ETF | Schedule of Portfolio Investments August 31, 2019 | ||||||
Security Description | Shares | Value | |||||||||
Common Stocks (99.2%) | |||||||||||
Communication Services (4.3%): | |||||||||||
Bandwidth, Inc., Class A (a) | 2,607 | $ | 227,304 | ||||||||
Cable One, Inc. | 327 | 424,322 | |||||||||
Entercom Communications Corp., Class A | 38,047 | 135,447 | |||||||||
Entravision Communications Corp., Class A | 59,304 | 181,470 | |||||||||
Frontier Communications Corp. (a) | 92,086 | 73,715 | |||||||||
Gannett Co., Inc. | 21,169 | 222,698 | |||||||||
GCI Liberty, Inc., Class A (a) | 2,272 | 141,409 | |||||||||
Glu Mobile, Inc. (a) | 8,884 | 39,445 | |||||||||
Gray Television, Inc. (a) | 10,997 | 168,254 | |||||||||
Iridium Communications, Inc. (a) | 8,071 | 195,157 | |||||||||
Nexstar Broadcasting Group, Inc., Class A | 2,362 | 233,578 | |||||||||
Sinclair Broadcast Group, Inc., Class A | 4,001 | 178,325 | |||||||||
Tegna, Inc. | 15,500 | 221,805 | |||||||||
Telephone & Data Systems, Inc. | 9,935 | 250,362 | |||||||||
The E.W. Scripps Co., Class A | 15,230 | 188,243 | |||||||||
The Marcus Corp. | 4,425 | 148,503 | |||||||||
The New York Times Co. | 8,467 | 247,236 | |||||||||
Tribune Media Co., Class A | 7,739 | 360,483 | |||||||||
United States Cellular Corp. (a) | 6,218 | 223,786 | |||||||||
World Wrestling Entertainment, Inc., Class A | 1,454 | 103,859 | |||||||||
Zynga, Inc., Class A (a) | 50,446 | 288,047 | |||||||||
4,253,448 | |||||||||||
Consumer Discretionary (9.8%): | |||||||||||
1-800-Flowers.com, Inc., Class A (a) | 6,219 | 91,543 | |||||||||
Aaron's, Inc. | 3,986 | 255,543 | |||||||||
Abercrombie & Fitch Co., Class A | 6,672 | 97,545 | |||||||||
American Axle & Manufacturing Holdings, Inc. (a) | 20,507 | 130,014 | |||||||||
America's Car-Mart, Inc. (a) | 2,257 | 193,605 | |||||||||
Beazer Homes USA, Inc. (a) | 16,647 | 208,587 | |||||||||
Bed Bath & Beyond, Inc. | 18,347 | 177,415 | |||||||||
Boot Barn Holdings, Inc. (a) | 2,285 | 78,261 | |||||||||
Bright Horizons Family Solutions, Inc. (a) | 1,351 | 222,983 | |||||||||
Carvana Co. (a) | 1,814 | 147,224 | |||||||||
Century Communities, Inc. (a) | 8,708 | 245,391 | |||||||||
Core-Mark Holding Co., Inc. | 5,086 | 164,736 | |||||||||
Crocs, Inc. (a) | 4,301 | 95,912 | |||||||||
Dana, Inc. | 7,548 | 96,086 | |||||||||
Deckers Outdoor Corp. (a) | 1,568 | 231,202 | |||||||||
Dick's Sporting Goods, Inc. | 6,365 | 216,665 | |||||||||
Dillard's, Inc., Class A | 2,895 | 169,415 | |||||||||
Etsy, Inc. (a) | 1,187 | 62,662 | |||||||||
Express, Inc. (a) | 56,099 | 118,930 | |||||||||
Five Below, Inc. (a) | 790 | 97,067 | |||||||||
Foot Locker, Inc. | 1,622 | 58,700 | |||||||||
Fossil Group, Inc. (a) | 9,338 | 119,526 | |||||||||
Fox Factory Holding Corp. (a) | 1,483 | 106,835 | |||||||||
GameStop Corp., Class A | 33,973 | 134,873 | |||||||||
See notes to financial statements.
18
| Victory Portfolios II VictoryShares USAA MSCI USA Small Cap Value Momentum ETF | Schedule of Portfolio Investments — continued August 31, 2019 | ||||||
Security Description | Shares | Value | |||||||||
Genesco, Inc. (a) | 4,441 | $ | 158,455 | ||||||||
Gentex Corp. | 6,096 | 162,154 | |||||||||
Graham Holdings Co., Class B | 671 | 472,425 | |||||||||
Group 1 Automotive, Inc. | 2,877 | 214,969 | |||||||||
Haverty Furniture Cos., Inc. | 8,307 | 159,079 | |||||||||
Helen of Troy Ltd. (a) | 1,018 | 156,273 | |||||||||
Hibbett Sports, Inc. (a) | 9,400 | 155,476 | |||||||||
International Speedway Corp., Class A | 3,418 | 153,878 | |||||||||
K12, Inc. (a) | 6,684 | 176,123 | |||||||||
KB Home | 9,699 | 272,445 | |||||||||
Lindblad Expeditions Holdings, Inc. (a) | 8,923 | 166,503 | |||||||||
Lithia Motors, Inc. | 1,998 | 261,879 | |||||||||
M/I Homes, Inc. (a) | 9,212 | 332,922 | |||||||||
MDC Holdings, Inc. | 8,684 | 335,811 | |||||||||
Meritage Homes Corp. (a) | 4,723 | 308,601 | |||||||||
Office Depot, Inc. | 89,596 | 116,475 | |||||||||
Party City Holdco, Inc. (a) | 12,059 | 56,677 | |||||||||
Planet Fitness, Inc., Class A (a) | 1,617 | 114,176 | |||||||||
Rent-A-Center, Inc. (a) | 6,532 | 166,762 | |||||||||
Seaworld Entertainment, Inc. (a) | 6,673 | 193,584 | |||||||||
Servicemaster Global Holdings, Inc. (a) | 2,761 | 157,487 | |||||||||
Shoe Carnival, Inc. | 2,469 | 75,897 | |||||||||
Signet Jewelers Ltd. | 9,658 | 118,214 | |||||||||
Skechers U.S.A., Inc., Class A (a) | 2,539 | 80,385 | |||||||||
Sonic Automotive, Inc., Class A | 3,351 | 90,175 | |||||||||
Strategic Education, Inc. | 644 | 108,984 | |||||||||
Taylor Morrison Home Corp., Class A (a) | 6,554 | 156,378 | |||||||||
Tempur Sealy International, Inc. (a) | 1,219 | 94,009 | |||||||||
The Buckle, Inc. | 5,290 | 103,684 | |||||||||
The Cato Corp., Class A | 14,278 | 244,582 | |||||||||
TopBuild Corp. (a) | 2,791 | 258,502 | |||||||||
Tower International, Inc. | 2,398 | 74,170 | |||||||||
Twin River Worldwide Holdings, Inc. | 3,215 | 72,820 | |||||||||
Vera Bradley, Inc. (a) | 14,275 | 151,172 | |||||||||
William Lyon Homes, Class A (a) | 12,464 | 220,239 | |||||||||
Wingstop, Inc. | 1,194 | 119,603 | |||||||||
Zumiez, Inc. (a) | 7,532 | 195,681 | |||||||||
9,977,369 | |||||||||||
Consumer Staples (2.9%): | |||||||||||
Casey's General Stores, Inc. | 925 | 155,261 | |||||||||
Coca-Cola Consolidated, Inc. | 618 | 208,025 | |||||||||
Darling Ingredients, Inc. (a) | 7,524 | 139,946 | |||||||||
elf Beauty, Inc. (a) | 7,071 | 115,399 | |||||||||
Freshpet, Inc. (a) | 2,313 | 113,522 | |||||||||
Ingles Markets, Inc., Class A | 7,013 | 272,665 | |||||||||
Pilgrim's Pride Corp. (a) | 8,544 | 266,231 | |||||||||
Post Holdings, Inc. (a) | 1,625 | 161,996 | |||||||||
Sanderson Farms, Inc. | 957 | 143,186 | |||||||||
SpartanNash Co. | 12,469 | 134,291 | |||||||||
The Simply Good Foods Co. (a) | 10,033 | 297,278 | |||||||||
See notes to financial statements.
19
| Victory Portfolios II VictoryShares USAA MSCI USA Small Cap Value Momentum ETF | Schedule of Portfolio Investments — continued August 31, 2019 | ||||||
Security Description | Shares | Value | |||||||||
Tootsie Roll Industries, Inc. | 5,663 | $ | 207,719 | ||||||||
TreeHouse Foods, Inc. (a) | 3,690 | 186,899 | |||||||||
Turning Point Brands, Inc. | 2,457 | 88,083 | |||||||||
United Natural Foods, Inc. (a) | 20,088 | 161,508 | |||||||||
Universal Corp. | 4,460 | 223,268 | |||||||||
Weis Markets, Inc. | 3,621 | 138,431 | |||||||||
3,013,708 | |||||||||||
Energy (2.6%): | |||||||||||
Arch Coal, Inc., Class A | 1,884 | 144,239 | |||||||||
Bonanza Creek Energy, Inc. (a) | 4,293 | 96,850 | |||||||||
Clean Energy Fuels Corp. (a) | 26,955 | 53,640 | |||||||||
CONSOL Energy, Inc. (a) | 2,753 | 46,140 | |||||||||
CVR Energy, Inc. | 3,701 | 147,226 | |||||||||
Denbury Resources, Inc. (a) | 80,957 | 87,434 | |||||||||
Dril-Quip, Inc. (a) | 2,170 | 99,495 | |||||||||
EQT Corp. | 5,456 | 55,488 | |||||||||
Gulfport Energy Corp. (a) | 35,823 | 85,975 | |||||||||
Helix Energy Solutions Group, Inc. (a) | 10,535 | 76,273 | |||||||||
Highpoint Resources Corp. (a) | 74,326 | 86,961 | |||||||||
International Seaways, Inc. (a) | 8,790 | 151,364 | |||||||||
Matrix Service Co. (a) | 4,021 | 79,897 | |||||||||
Northern Oil And Gas, Inc. (a) | 50,476 | 92,876 | |||||||||
Par Pacific Holdings, Inc. (a) | 6,259 | 136,071 | |||||||||
Peabody Energy Corp. | 2,935 | 54,092 | |||||||||
Penn Virginia Corp. (a) | 2,124 | 60,534 | |||||||||
Propetro Holding Corp. (a) | 10,086 | 107,416 | |||||||||
Renewable Energy Group, Inc. (a) | 6,396 | 77,839 | |||||||||
REX American Resources Corp. (a) | 1,765 | 121,220 | |||||||||
SandRidge Energy, Inc. (a) | 25,442 | 119,069 | |||||||||
Southwestern Energy Co. (a) | 64,202 | 101,439 | |||||||||
Texas Pacific Land Trust | 268 | 175,596 | |||||||||
Unit Corp. (a) | 23,624 | 71,581 | |||||||||
Valaris PLC (a) | 16,463 | 76,718 | |||||||||
Whiting Petroleum Corp. (a) | 2,749 | 18,226 | |||||||||
World Fuel Services Corp. (b) | 6,210 | 238,464 | |||||||||
2,662,123 | |||||||||||
Financials (18.4%): | |||||||||||
AG Mortgage Investment Trust, Inc. | 13,669 | 204,898 | |||||||||
AMBAC Financial Group, Inc. (a) | 13,541 | 244,280 | |||||||||
American Equity Investment Life Holding Co. | 8,688 | 187,226 | |||||||||
American National Insurance Co. | 3,964 | 452,173 | |||||||||
Apollo Commercial Real Estate Finance, Inc. | 29,697 | 550,879 | |||||||||
Arbor Realty Trust, Inc. | 33,202 | 416,685 | |||||||||
Ares Commercial Real Estate Corp. | 30,133 | 451,694 | |||||||||
Ares Management Corp., Class A | 5,114 | 148,817 | |||||||||
Argo Group International Holdings Ltd. | 2,963 | 194,728 | |||||||||
Arlington Asset Investment Corp., Class A | 23,038 | 113,808 | |||||||||
Assured Guaranty Ltd. | 8,686 | 369,589 | |||||||||
Axis Capital Holdings Ltd. ADR | 3,068 | 188,345 | |||||||||
See notes to financial statements.
20
| Victory Portfolios II VictoryShares USAA MSCI USA Small Cap Value Momentum ETF | Schedule of Portfolio Investments — continued August 31, 2019 | ||||||
Security Description | Shares | Value | |||||||||
Blackstone Mortgage Trust, Inc., Class A | 17,231 | $ | 599,639 | ||||||||
Brown & Brown, Inc. | 6,569 | 242,330 | |||||||||
Cannae Holdings, Inc. (a) | 11,499 | 319,902 | |||||||||
Capstead Mortgage Corp. | 54,159 | 393,736 | |||||||||
Chimera Investment Corp. | 23,910 | 455,964 | |||||||||
Cohen & Steers, Inc. | 7,359 | 396,871 | |||||||||
Cowen, Inc., Class A (a) | 12,808 | 199,933 | |||||||||
Dime Community Bancshares, Inc. | 7,309 | 144,937 | |||||||||
eHealth, Inc. (a) | 1,644 | 136,962 | |||||||||
Encore Capital Group, Inc. (a) | 5,581 | 205,939 | |||||||||
Essent Group Ltd. (a) | 5,762 | 279,457 | |||||||||
Exantas Capital Corp. | 26,880 | 301,325 | |||||||||
EZCORP, Inc., Class A (a) | 26,415 | 207,886 | |||||||||
Federated Investors, Inc., Class B | 4,541 | 145,494 | |||||||||
FGL Holdings | 18,780 | 149,864 | |||||||||
First American Financial Corp. | 3,743 | 218,778 | |||||||||
First BanCorp. | 23,266 | 222,888 | |||||||||
Genworth Financial, Inc., Class A (a) | 47,729 | 211,439 | |||||||||
Granite Point Mortgage Trust, Inc. | 15,407 | 281,794 | |||||||||
Greenlight Capital Re Ltd. (a) | 15,239 | 140,046 | |||||||||
Hannon Armstrong Sustainable Infrastructure Capital, Inc. | 5,847 | 161,553 | |||||||||
Heritage Insurance Holdings, Inc. | 12,071 | 158,251 | |||||||||
Hilltop Holdings, Inc. | 6,615 | 157,106 | |||||||||
Invesco Mortgage Capital, Inc. | 28,636 | 430,399 | |||||||||
Kemper Corp. | 1,554 | 108,749 | |||||||||
Kinsale Capital Group, Inc. | 1,482 | 145,577 | |||||||||
KKR Real Estate Finance Trust, Inc. | 7,384 | 139,631 | |||||||||
Ladder Capital Corp. | 12,614 | 211,663 | |||||||||
Legg Mason, Inc. | 8,332 | 306,534 | |||||||||
Meta Financial Group, Inc. | 3,486 | 107,752 | |||||||||
MFA Financial, Inc. | 36,536 | 261,963 | |||||||||
MGIC Investment Corp. | 19,993 | 252,911 | |||||||||
Mr Cooper Group, Inc. (a) | 12,271 | 108,108 | |||||||||
National Western Life Group, Inc., Class A | 1,349 | 347,799 | |||||||||
Navient Corp. | 16,652 | 212,146 | |||||||||
Nelnet, Inc., Class A | 4,055 | 271,888 | |||||||||
New Residential Investment Corp. | 13,196 | 185,668 | |||||||||
New York Community Bancorp, Inc. | 29,884 | 344,862 | |||||||||
New York Mortgage Trust, Inc. | 72,041 | 443,052 | |||||||||
NMI Holdings, Inc., Class A (a) | 7,235 | 205,040 | |||||||||
OFG Bancorp | 10,660 | 218,743 | |||||||||
Old Republic International Corp. | 18,482 | 431,740 | |||||||||
Onemain Holdings, Inc. | 5,312 | 190,435 | |||||||||
Opus Bank | 9,552 | 198,300 | |||||||||
Oritani Financial Corp. | 14,285 | 244,702 | |||||||||
Pennymac Financial Services (a) | 10,368 | 306,789 | |||||||||
PennyMac Mortgage Investment Trust | 19,456 | 423,363 | |||||||||
Popular, Inc. | 5,384 | 283,037 | |||||||||
Radian Group, Inc. | 11,278 | 254,319 | |||||||||
Redwood Trust, Inc. | 28,118 | 466,759 | |||||||||
See notes to financial statements.
21
| Victory Portfolios II VictoryShares USAA MSCI USA Small Cap Value Momentum ETF | Schedule of Portfolio Investments — continued August 31, 2019 | ||||||
Security Description | Shares | Value | |||||||||
Selective Insurance Group, Inc. | 2,236 | $ | 178,053 | ||||||||
Starwood Property Trust, Inc. | 12,731 | 298,287 | |||||||||
Sterling BanCorp | 6,701 | 127,788 | |||||||||
Stifel Financial Corp. | 4,376 | 233,766 | |||||||||
Third Point Reinsurance Ltd. (a) | 32,347 | 304,709 | |||||||||
TPG RE Finance Trust, Inc. | 14,792 | 287,113 | |||||||||
Washington Federal, Inc. | 5,179 | 184,372 | |||||||||
Western Asset Mortgage Capital Corp. | 39,487 | 371,178 | |||||||||
White Mountains Insurance Group Ltd. ADR | 283 | 300,178 | |||||||||
18,642,589 | |||||||||||
Health Care (17.0%): | |||||||||||
Acadia Healthcare Co., Inc. (a) | 6,645 | 175,827 | |||||||||
Addus HomeCare Corp. (a) | 2,916 | 256,550 | |||||||||
Amedisys, Inc. (a) | 1,857 | 239,014 | |||||||||
Amphastar Pharmaceuticals, Inc. (a) | 9,278 | 208,384 | |||||||||
AngioDynamics, Inc. (a) | 15,527 | 285,231 | |||||||||
ANI Pharmaceuticals, Inc. (a) | 2,902 | 190,081 | |||||||||
Anika Therapeutics, Inc. (a) | 1,551 | 88,035 | |||||||||
Apellis Pharmaceuticals, Inc. (a) | 2,610 | 75,951 | |||||||||
Arena Pharmaceuticals, Inc. (a) | 2,653 | 140,317 | |||||||||
ArQule, Inc. (a) | 13,150 | 117,824 | |||||||||
Arrowhead Pharmaceuticals, Inc. (a) | 4,241 | 144,915 | |||||||||
Assertio Therapeutics, Inc. (a) | 58,899 | 84,815 | |||||||||
AtriCure, Inc. (a) | 7,558 | 207,014 | |||||||||
Atrion Corp. | 410 | 318,632 | |||||||||
Axsome Therapeutics, Inc. (a) | 4,247 | 108,086 | |||||||||
Biohaven Pharmaceutical Holding Co. Ltd. (a) | 1,187 | 46,519 | |||||||||
Bio-Rad Laboratories, Inc., Class A (a) | 1,014 | 342,438 | |||||||||
Biospecifics Technologies Corp. (a) | 2,000 | 110,160 | |||||||||
Bio-Techne Corp. | 1,806 | 345,974 | |||||||||
BioTelemetry, Inc. (a) | 1,820 | 72,163 | |||||||||
Bruker Corp. | 6,468 | 279,224 | |||||||||
Cardiovascular Systems, Inc. (a) | 5,256 | 254,548 | |||||||||
CareDx, Inc. (a) | 3,515 | 80,212 | |||||||||
Catalent, Inc. (a) | 2,102 | 110,859 | |||||||||
Catalyst Pharmaceuticals, Inc. (a) | 24,729 | 152,331 | |||||||||
Charles River Laboratories International, Inc. (a) | 2,229 | 292,445 | |||||||||
Chemed Corp. | 1,044 | 448,325 | |||||||||
Codexis, Inc. (a) | 11,260 | 157,978 | |||||||||
Computer Programs & Systems | 3,850 | 81,428 | |||||||||
CONMED Corp. | 3,807 | 383,630 | |||||||||
CorVel Corp. (a) | 3,969 | 334,309 | |||||||||
CryoLife, Inc. (a) | 7,833 | 209,924 | |||||||||
Denali Therapeutics, Inc. (a) | 3,662 | 65,916 | |||||||||
Eidos Therapeutics, Inc. (a) | 1,805 | 75,467 | |||||||||
Enanta Pharmaceuticals, Inc. (a) | 965 | 68,081 | |||||||||
Encompass Health Corp. | 3,417 | 207,719 | |||||||||
Endo International PLC (a) | 33,296 | 78,912 | |||||||||
Evolus, Inc. (a) (c) | 4,118 | 70,994 | |||||||||
Exelixis, Inc. (a) | 3,758 | 74,596 | |||||||||
See notes to financial statements.
22
| Victory Portfolios II VictoryShares USAA MSCI USA Small Cap Value Momentum ETF | Schedule of Portfolio Investments — continued August 31, 2019 | ||||||
Security Description | Shares | Value | |||||||||
Fate Therapeutics, Inc. (a) | 2,678 | $ | 43,705 | ||||||||
Fluidigm Corp. (a) | 5,079 | 28,341 | |||||||||
Genomic Health, Inc. (a) | 3,275 | 251,061 | |||||||||
Glaukos Corp. (a) | 2,141 | 137,688 | |||||||||
Haemonetics Corp. (a) | 950 | 126,854 | |||||||||
HealthEquity, Inc. (a) | 1,380 | 81,917 | |||||||||
Hill-Rom Holdings, Inc. | 3,300 | 355,344 | |||||||||
HMS Holdings Corp. (a) | 6,163 | 225,134 | |||||||||
Horizon Therapeutics PLC (a) | 5,382 | 148,705 | |||||||||
Inovalon Holdings, Inc., Class A (a) | 11,977 | 202,651 | |||||||||
Insulet Corp. (a) | 662 | 102,061 | |||||||||
Integer Holdings Corp. (a) | 2,745 | 198,738 | |||||||||
Integra LifeSciences Holdings Corp. (a) | 2,259 | 135,585 | |||||||||
Invitae Corp. (a) | 5,577 | 135,298 | |||||||||
Iovance Biotherapeutics, Inc. (a) | 2,674 | 56,181 | |||||||||
Lantheus Holdings, Inc. (a) | 5,152 | 112,108 | |||||||||
LeMaitre Vascular, Inc. | 2,790 | 88,331 | |||||||||
LHC Group, Inc. (a) | 1,991 | 235,934 | |||||||||
Magellan Health, Inc. (a) | 2,991 | 188,463 | |||||||||
Mallinckrodt PLC (a) | 19,409 | 50,269 | |||||||||
Masimo Corp. (a) | 2,005 | 307,266 | |||||||||
Medidata Solutions, Inc. (a) | 2,652 | 242,869 | |||||||||
Medpace Holdings, Inc. (a) | 2,253 | 182,290 | |||||||||
Merit Medical Systems, Inc. (a) | 2,317 | 80,585 | |||||||||
Mirati Therapeutics, Inc. (a) | 1,247 | 102,217 | |||||||||
Molina Healthcare, Inc. (a) | 1,350 | 175,878 | |||||||||
Myriad Genetics, Inc. (a) | 3,192 | 75,108 | |||||||||
NanoString Technologies, Inc. (a) | 5,260 | 134,025 | |||||||||
Natera, Inc. (a) | 2,285 | 75,291 | |||||||||
National Healthcare Corp. | 5,748 | 464,439 | |||||||||
NeoGenomics, Inc. (a) | 8,222 | 205,386 | |||||||||
Nextgen Healthcare, Inc. (a) | 6,204 | 88,159 | |||||||||
Novocure Ltd. (a) | 1,822 | 165,547 | |||||||||
NuVasive, Inc. (a) | 1,788 | 113,574 | |||||||||
Omnicell, Inc. (a) | 3,066 | 220,139 | |||||||||
Orthofix Medical, Inc. (a) | 2,513 | 127,761 | |||||||||
Orthopediatrics Corp. (a) | 1,841 | 59,262 | |||||||||
Pacific Biosciences of California, Inc. (a) | 7,014 | 38,928 | |||||||||
Pacira Pharmaceuticals, Inc. (a) | 1,886 | 70,235 | |||||||||
PDL BioPharma, Inc. (a) | 65,431 | 153,109 | |||||||||
Penumbra, Inc. (a) | 661 | 96,209 | |||||||||
PRA Health Sciences, Inc. (a) | 1,583 | 156,464 | |||||||||
Premier, Inc., Class A (a) | 4,009 | 141,357 | |||||||||
Prestige Consumer Healthcare, Inc. (a) | 8,172 | 260,524 | |||||||||
Quanterix Corp. (a) | 2,698 | 71,038 | |||||||||
Quidel Corp. (a) | 3,018 | 190,285 | |||||||||
R1 Rcm, Inc. (a) | 12,187 | 142,100 | |||||||||
Ra Pharmaceuticals, Inc. (a) | 5,621 | 152,891 | |||||||||
RadNet, Inc. (a) | 6,812 | 94,755 | |||||||||
Reata Pharmaceuticals, Inc., Class A (a) | 823 | 63,453 | |||||||||
See notes to financial statements.
23
| Victory Portfolios II VictoryShares USAA MSCI USA Small Cap Value Momentum ETF | Schedule of Portfolio Investments — continued August 31, 2019 | ||||||
Security Description | Shares | Value | |||||||||
Repligen Corp. (a) | 2,564 | $ | 237,964 | ||||||||
Spark Therapeutics, Inc. (a) | 942 | 91,760 | |||||||||
STAAR Surgical Co. (a) | 3,035 | 91,384 | |||||||||
Surgery Partners, Inc. (a) | 6,221 | 40,063 | |||||||||
Syneos Health, Inc. (a) | 3,666 | 192,575 | |||||||||
Tabula Rasa Healthcare, Inc. (a) | 1,137 | 64,582 | |||||||||
Tandem Diabetes Care, Inc. (a) | 1,556 | 112,701 | |||||||||
Teladoc Health, Inc. (a) | 1,283 | 74,260 | |||||||||
Tenet Healthcare Corp. (a) | 3,604 | 78,027 | |||||||||
The Ensign Group, Inc. | 4,146 | 206,885 | |||||||||
Triple-S Management Corp. (a) | 6,525 | 133,893 | |||||||||
uniQure NV (a) | 2,490 | 135,083 | |||||||||
United Therapeutics Corp. (a) | 1,483 | 122,436 | |||||||||
US Physical Therapy, Inc. | 2,680 | 357,834 | |||||||||
Veracyte, Inc. (a) | 6,024 | 159,636 | |||||||||
Vericel Corp. (a) | 3,625 | 59,958 | |||||||||
Vocera Communications, Inc. (a) | 3,338 | 76,607 | |||||||||
West Pharmaceutical Services, Inc. | 2,444 | 355,504 | |||||||||
Wright Medical Group NV (a) | 9,985 | 208,187 | |||||||||
ZIOPHARM Oncology, Inc. (a) | 10,668 | 53,233 | |||||||||
17,192,912 | |||||||||||
Industrials (13.8%): | |||||||||||
ABM Industries, Inc. | 7,088 | 264,099 | |||||||||
ACCO Brands Corp. | 25,299 | 234,522 | |||||||||
ADT, Inc. | 18,837 | 89,664 | |||||||||
AECOM (a) | 8,521 | 302,325 | |||||||||
AGCO Corp. | 4,856 | 335,646 | |||||||||
Air Lease Corp. | 7,763 | 322,475 | |||||||||
Aircastle Ltd. | 15,735 | 343,810 | |||||||||
ArcBest Corp. | 5,594 | 165,638 | |||||||||
Arcosa, Inc. | 3,514 | 114,170 | |||||||||
Armstrong Flooring, Inc. (a) | 9,873 | 66,840 | |||||||||
Armstrong World Industries, Inc. | 3,080 | 294,048 | |||||||||
Atkore International Group, Inc. (a) | 4,755 | 137,943 | |||||||||
Atlas Air Worldwide Holdings, Inc. (a) | 6,013 | 155,436 | |||||||||
Avis Budget Group, Inc. (a) | 3,057 | 75,722 | |||||||||
Barrett Business Services, Inc. | 2,643 | 230,285 | |||||||||
Beacon Roofing Supply, Inc. (a) | 3,114 | 99,274 | |||||||||
BMC Stock Holdings, Inc. (a) | 10,385 | 264,091 | |||||||||
Brady Corp., Class A | 7,456 | 351,998 | |||||||||
CAI International, Inc. (a) | 6,840 | 144,871 | |||||||||
Carlisle Cos., Inc. | 2,752 | 398,930 | |||||||||
Casella Waste Systems, Inc. (a) | 2,764 | 125,762 | |||||||||
CBIZ, Inc. (a) | 7,505 | 167,662 | |||||||||
Clean Harbors, Inc. (a) | 4,090 | 300,820 | |||||||||
Covenant Transport Group, Inc., Class A (a) | 12,805 | 184,136 | |||||||||
CSW Industrials, Inc. | 5,482 | 373,927 | |||||||||
DMC Global, Inc. | 2,533 | 110,008 | |||||||||
EMCOR Group, Inc. | 1,982 | 173,306 | |||||||||
Encore Wire Corp. | 4,592 | 247,921 | |||||||||
See notes to financial statements.
24
| Victory Portfolios II VictoryShares USAA MSCI USA Small Cap Value Momentum ETF | Schedule of Portfolio Investments — continued August 31, 2019 | ||||||
Security Description | Shares | Value | |||||||||
Enphase Energy, Inc. (a) | 1,582 | $ | 46,938 | ||||||||
ESCO Technologies, Inc. | 4,406 | 335,429 | |||||||||
Exponent, Inc. | 2,249 | 159,432 | |||||||||
Federal Signal Corp. | 9,916 | 294,604 | |||||||||
FTI Consulting, Inc. (a) | 2,968 | 320,959 | |||||||||
GATX Corp. | 1,985 | 147,327 | |||||||||
Genco Shipping & Trading Ltd. (a) | 13,953 | 133,391 | |||||||||
Generac Holdings, Inc. (a) | 1,997 | 155,746 | |||||||||
Genesee & Wyoming, Inc., Class A (a) | 3,347 | 371,115 | |||||||||
GMS, Inc. (a) | 4,640 | 136,694 | |||||||||
Great Lakes Dredge & Dock Corp. (a) | 15,887 | 172,215 | |||||||||
Griffon Corp. | 7,477 | 130,474 | |||||||||
Hawaiian Holdings, Inc. | 7,686 | 187,615 | |||||||||
Heidrick & Struggles International, Inc. | 5,924 | 157,282 | |||||||||
Herc Holdings, Inc. (a) | 2,899 | 119,671 | |||||||||
Herman Miller, Inc. | 2,887 | 122,062 | |||||||||
Hertz Global Holdings, Inc. (a) | 4,474 | 54,180 | |||||||||
Huron Consulting Group, Inc. (a) | 2,121 | 129,826 | |||||||||
ICF International, Inc. | 1,661 | 140,620 | |||||||||
KAR Auction Services, Inc. | 7,079 | 188,018 | |||||||||
KBR, Inc. | 4,338 | 110,706 | |||||||||
Kelly Services, Inc., Class A | 10,865 | 263,042 | |||||||||
Kratos Defense & Security Solutions, Inc. (a) | 4,310 | 86,071 | |||||||||
Marten Transport Ltd. | 7,484 | 147,210 | |||||||||
Matson, Inc. | 2,942 | 104,529 | |||||||||
McGrath RentCorp | 2,124 | 136,000 | |||||||||
Mercury Systems, Inc. (a) | 2,622 | 224,521 | |||||||||
Meritor, Inc. (a) | 11,527 | 193,884 | |||||||||
Oshkosh Corp. | 1,621 | 113,908 | |||||||||
Quanta Services, Inc. | 9,303 | 315,371 | |||||||||
Regal Beloit Corp. | 2,148 | 152,293 | |||||||||
REV Group, Inc. | 9,738 | 125,523 | |||||||||
Ryder System, Inc. | 5,245 | 252,652 | |||||||||
SkyWest, Inc. | 4,402 | 252,059 | |||||||||
Spirit Airlines, Inc. (a) | 2,310 | 86,717 | |||||||||
Steelcase, Inc., Class A | 7,227 | 112,235 | |||||||||
Sunrun, Inc. (a) | 5,008 | 76,773 | |||||||||
Teledyne Technologies, Inc. (a) | 552 | 170,342 | |||||||||
Tetra Tech, Inc. | 1,970 | 159,806 | |||||||||
Titan Machinery, Inc. (a) | 8,802 | 132,558 | |||||||||
Triton International Ltd. | 5,006 | 160,943 | |||||||||
Tutor Perini Corp. (a) | 15,038 | 150,230 | |||||||||
UniFirst Corp. | 767 | 150,263 | |||||||||
Universal Forest Products, Inc. | 3,862 | 151,004 | |||||||||
Viad Corp. | 2,554 | 165,065 | |||||||||
Werner Enterprises, Inc. | 5,029 | 164,348 | |||||||||
Woodward, Inc. | 1,570 | 169,325 | |||||||||
13,906,305 | |||||||||||
See notes to financial statements.
25
| Victory Portfolios II VictoryShares USAA MSCI USA Small Cap Value Momentum ETF | Schedule of Portfolio Investments — continued August 31, 2019 | ||||||
Security Description | Shares | Value | |||||||||
Information Technology (12.3%): | |||||||||||
Acacia Communications, Inc. (a) | 2,275 | $ | 143,439 | ||||||||
Alpha & Omega Semiconductor Ltd. (a) | 7,574 | 89,222 | |||||||||
Alteryx, Inc., Class A (a) | 2,035 | 289,886 | |||||||||
Amkor Technology, Inc. (a) | 23,800 | 208,250 | |||||||||
Anixter International, Inc. (a) | 1,999 | 119,880 | |||||||||
Appfolio, Inc., Class A (a) | 1,292 | 127,611 | |||||||||
Avaya Holdings Corp. (a) | 16,169 | 228,306 | |||||||||
Avnet, Inc. | 7,384 | 309,315 | |||||||||
AVX Corp. | 20,063 | 271,854 | |||||||||
Benchmark Electronics, Inc. | 11,630 | 307,962 | |||||||||
Booz Allen Hamilton Holdings Corp. | 5,287 | 399,222 | |||||||||
CACI International, Inc., Class A (a) | 1,624 | 360,999 | |||||||||
Ciena Corp. (a) | 5,751 | 235,388 | |||||||||
Conduent, Inc. (a) | 15,281 | 99,479 | |||||||||
Coupa Software, Inc. (a) | 1,782 | 247,573 | |||||||||
Cree, Inc. (a) | 1,743 | 74,827 | |||||||||
CSG Systems International, Inc. | 2,897 | 156,090 | |||||||||
Cypress Semiconductor Corp. | 4,651 | 107,020 | |||||||||
Diodes, Inc. (a) | 6,411 | 234,322 | |||||||||
Echostar Holding Corp., Class A (a) | 3,851 | 162,705 | |||||||||
Euronet Worldwide, Inc. (a) | 1,938 | 296,785 | |||||||||
Everbridge, Inc. (a) | 1,276 | 109,991 | |||||||||
Everi Holdings, Inc. (a) | 8,519 | 76,160 | |||||||||
EVERTEC, Inc. | 9,311 | 324,581 | |||||||||
Fabrinet (a) | 3,696 | 186,611 | |||||||||
Fair Isaac Corp. (a) | 1,092 | 385,170 | |||||||||
Finisar Corp. (a) | 8,263 | 186,826 | |||||||||
FormFactor, Inc. (a) | 5,092 | 87,022 | |||||||||
Ichor Holdings Ltd. (a) | 9,835 | 209,092 | |||||||||
Insight Enterprises, Inc. (a) | 4,117 | 197,863 | |||||||||
Jabil, Inc. | 10,049 | 289,512 | |||||||||
KEMET Corp. | 7,115 | 119,176 | |||||||||
Knowles Corp. (a) | 12,583 | 255,183 | |||||||||
Kulicke & Soffa Industries, Inc. | 12,165 | 253,397 | |||||||||
Lattice Semiconductor Corp. (a) | 11,470 | 225,844 | |||||||||
Liveramp Holdings, Inc. (a) | 1,822 | 77,180 | |||||||||
Manhattan Associates, Inc. (a) | 1,345 | 111,137 | |||||||||
ManTech International Corp., Class A | 1,969 | 138,381 | |||||||||
Mellanox Technologies Ltd. ADR (a) | 2,331 | 249,534 | |||||||||
Mesa Laboratories, Inc. | 418 | 92,474 | |||||||||
NetScout Systems, Inc. (a) | 4,911 | 108,779 | |||||||||
PC Connection, Inc. | 3,560 | 125,419 | |||||||||
Perficient, Inc. (a) | 8,023 | 295,567 | |||||||||
Photronics, Inc. (a) | 22,855 | 246,834 | |||||||||
Presidio, Inc. | 6,380 | 102,208 | |||||||||
PROS Holdings, Inc. (a) | 1,540 | 109,371 | |||||||||
Rambus, Inc. (a) | 23,892 | 299,606 | |||||||||
RingCentral, Inc., Class A (a) | 744 | 105,001 | |||||||||
Sanmina Corp. (a) | 7,600 | 219,640 | |||||||||
See notes to financial statements.
26
| Victory Portfolios II VictoryShares USAA MSCI USA Small Cap Value Momentum ETF | Schedule of Portfolio Investments — continued August 31, 2019 | ||||||
Security Description | Shares | Value | |||||||||
ScanSource, Inc. (a) | 9,323 | $ | 263,468 | ||||||||
SMART Global Holdings, Inc. (a) | 3,676 | 104,435 | |||||||||
Smartsheet, Inc., Class A (a) | 2,203 | 107,066 | |||||||||
SPS Commerce, Inc. (a) | 1,212 | 61,254 | |||||||||
SYNNEX Corp. | 1,226 | 102,751 | |||||||||
Tech Data Corp. (a) | 2,212 | 205,119 | |||||||||
Teradyne, Inc. | 4,849 | 256,852 | |||||||||
The Trade Desk, Inc., Class A (a) | 981 | 241,100 | |||||||||
TiVo Corp. | 29,222 | 220,042 | |||||||||
TTEC Holdings, Inc. | 2,557 | 119,949 | |||||||||
TTM Technologies, Inc. (a) | 19,365 | 206,431 | |||||||||
Tucows, Inc. (a) | 1,932 | 97,489 | |||||||||
Ultra Clean Holdings, Inc. (a) | 10,976 | 131,053 | |||||||||
Universal Display Corp. | 382 | 78,490 | |||||||||
Verint Systems, Inc. (a) | 2,379 | 126,777 | |||||||||
Vishay Intertechnology, Inc. | 7,402 | 117,174 | |||||||||
Workiva, Inc. (a) | 2,189 | 105,313 | |||||||||
Xperi Corp. | 8,504 | 155,793 | |||||||||
Zscaler, Inc. (a) | 2,731 | 187,729 | |||||||||
12,545,979 | |||||||||||
Materials (4.3%): | |||||||||||
AptarGroup, Inc. | 1,850 | 226,107 | |||||||||
Ashland Global Holdings, Inc. | 2,599 | 190,351 | |||||||||
Berry Global Group, Inc. (a) | 3,709 | 145,170 | |||||||||
Clearwater Paper Corp. (a) | 5,022 | 80,452 | |||||||||
Cleveland-Cliffs, Inc. | 13,958 | 110,827 | |||||||||
Domtar Corp. | 7,517 | 247,685 | |||||||||
Innospec, Inc. | 3,361 | 279,568 | |||||||||
Louisiana Pacific Corp. | 5,715 | 137,389 | |||||||||
Materion Corp. | 1,871 | 110,090 | |||||||||
Mercer International, Inc. | 15,762 | 189,775 | |||||||||
Owens-Illinois, Inc. | 9,017 | 91,703 | |||||||||
P.H. Glatfelter Co. | 7,192 | 103,421 | |||||||||
Quaker Chemical Corp. | 861 | 136,778 | |||||||||
Rayonier Advanced Materials, Inc. | 9,506 | 33,366 | |||||||||
Reliance Steel & Aluminum Co. | 3,505 | 340,790 | |||||||||
Resolute Forest Products, Inc. | 23,894 | 102,266 | |||||||||
Royal Gold, Inc. | 1,111 | 148,185 | |||||||||
Schnitzer Steel Industries, Inc. | 8,904 | 197,135 | |||||||||
Silgan Holdings, Inc. | 7,207 | 214,480 | |||||||||
Sonoco Products Co. | 3,735 | 213,642 | |||||||||
Stepan Co. | 3,369 | 321,370 | |||||||||
The Scotts Miracle-Gro Co., Class A | 1,419 | 150,868 | |||||||||
Uinted States Steel Corp. | 4,466 | 49,439 | |||||||||
Venator Materials PLC (a) | 73,802 | 164,578 | |||||||||
Verso Corp., Class A (a) | 14,638 | 149,454 | |||||||||
Warrior Met Coal, Inc. | 9,088 | 189,939 | |||||||||
4,324,828 | |||||||||||
See notes to financial statements.
27
| Victory Portfolios II VictoryShares USAA MSCI USA Small Cap Value Momentum ETF | Schedule of Portfolio Investments — continued August 31, 2019 | ||||||
Security Description | Shares | Value | |||||||||
Real Estate (10.6%): | |||||||||||
Agree Realty Corp. | 5,976 | $ | 446,347 | ||||||||
Alexander & Baldwin, Inc. | 14,087 | 322,451 | |||||||||
Altisource Portfolio Solutions SA (a) | 7,135 | 141,273 | |||||||||
American Assets Trust, Inc. | 9,645 | 451,965 | |||||||||
American Campus Communities, Inc. | 4,119 | 191,451 | |||||||||
Americold Realty Trust | 10,004 | 364,346 | |||||||||
Braemar Hotels & Resorts, Inc. | 8,820 | 80,879 | |||||||||
CareTrust REIT, Inc. | 14,274 | 339,578 | |||||||||
Community Healthcare Trust, Inc. | 8,880 | 378,643 | |||||||||
CorEnergy Infrastructure Trust, Inc. | 3,991 | 180,034 | |||||||||
CubeSmart | 5,576 | 200,123 | |||||||||
DiamondRock Hospitality Co. | 16,027 | 151,776 | |||||||||
EastGroup Properties, Inc. | 3,706 | 461,472 | |||||||||
EPR Properties | 5,598 | 438,044 | |||||||||
Equity Commonwealth | 9,245 | 311,187 | |||||||||
Essential Properties Realty Trust, Inc. | 7,295 | 165,669 | |||||||||
First Industrial Realty Trust, Inc. | 5,652 | 220,145 | |||||||||
Gaming and Leisure Properties, Inc. | 6,902 | 270,006 | |||||||||
Getty Realty Corp. | 6,779 | 215,301 | |||||||||
Independence Realty Trust, Inc. | 13,821 | 192,250 | |||||||||
Innovative Industrial Properties, Inc. | 3,481 | 310,366 | |||||||||
Lamar Advertising Co., Class A | 2,407 | 184,497 | |||||||||
LTC Properties, Inc. | 4,639 | 226,383 | |||||||||
Marcus & Millichap, Inc. (a) | 8,292 | 299,176 | |||||||||
Medical Properties Trust, Inc. | 20,848 | 387,564 | |||||||||
New Senior Investment Group, Inc. | 20,157 | 125,981 | |||||||||
NexPoint Residential Trust, Inc. | 7,992 | 370,829 | |||||||||
Omega Healthcare Investors, Inc. | 5,005 | 203,603 | |||||||||
Outfront Media, Inc., Class A | 10,851 | 298,185 | |||||||||
Parks Hotels & Resorts, Inc. | 5,544 | 130,561 | |||||||||
PS Business Parks, Inc. | 2,960 | 531,647 | |||||||||
RE/MAX Holdings, Inc. | 7,966 | 204,487 | |||||||||
Retail Value, Inc. | 4,332 | 160,241 | |||||||||
Rexford Industrial Realty, Inc. | 4,556 | 201,330 | |||||||||
Spirit Realty Capital, Inc. | 7,352 | 352,455 | |||||||||
STORE Capital Corp. | 11,038 | 416,795 | |||||||||
Terreno Realty Corp. | 4,458 | 225,396 | |||||||||
The St. Joe Co. (a) | 9,856 | 177,211 | |||||||||
Universal Health Realty Income Trust | 3,759 | 363,458 | |||||||||
Xenia Hotels & Resorts, Inc. | 8,011 | 161,902 | |||||||||
10,855,007 | |||||||||||
Utilities (3.2%): | |||||||||||
ALLETE, Inc. | 2,776 | 237,986 | |||||||||
Black Hills Corp. | 5,610 | 430,343 | |||||||||
El Paso Electric Co. | 3,720 | 248,124 | |||||||||
Hawaiian Electric Industries, Inc. | 13,063 | 579,997 | |||||||||
National Fuel Gas Co. | 3,746 | 175,088 | |||||||||
NorthWestern Corp. | 7,146 | 517,656 | |||||||||
See notes to financial statements.
28
| Victory Portfolios II VictoryShares USAA MSCI USA Small Cap Value Momentum ETF | Schedule of Portfolio Investments — continued August 31, 2019 | ||||||
Security Description | Shares | Value | |||||||||
PNM Resources, Inc. | 3,762 | $ | 191,900 | ||||||||
Portland General Electric Co. (b) | 8,817 | 501,599 | |||||||||
Spire, Inc. | 5,685 | 482,657 | |||||||||
3,365,350 | |||||||||||
Total Common Stocks (Cost $99,654,455) | 100,739,618 | ||||||||||
Collateral for Securities Loaned^ (0.1%) | |||||||||||
BlackRock Liquidity Funds TempFund Portfolio, Institutional Class, 2.15% (d) | 14,002 | 14,002 | |||||||||
Fidelity Investments Money Market Government Portfolio, Class I, 2.03% (d) | 19,103 | 19,103 | |||||||||
Fidelity Investments Prime Money Market Portfolio, Class I, 2.10% (d) | 468 | 468 | |||||||||
| Goldman Sachs Financial Square Prime Obligations Fund, Institutional Class, 2.20% (d) | 8,867 | 8,867 | |||||||||
JPMorgan Prime Money Market Fund, Capital Class, 2.15% (d) | 9,334 | 9,334 | |||||||||
| Morgan Stanley Institutional Liquidity Prime Portfolio, Institutional Class, 2.17% (d) | 15,167 | 15,167 | |||||||||
Total Collateral for Securities Loaned (Cost $66,941) | 66,941 | ||||||||||
Total Investments (Cost $99,721,396) — 99.3% | 100,806,559 | ||||||||||
Other assets in excess of liabilities — 0.7% | 757,265 | ||||||||||
NET ASSETS — 100.00% | $ | 101,563,824 | |||||||||
^ Purchased with cash collateral from securities on loan.
(a) Non-income producing security.
(b) All or a portion of this security has been segregated as collateral for derivative instruments.
(c) All or a portion of this security is on loan.
(d) Rate disclosed is the daily yield on August 31, 2019.
ADR — American Depositary Receipt
AMBAC — American Municipal Bond Assurance Corporation
PLC — Public Limited Company
REIT — Real Estate Investment Trust
Futures Contracts Purchased
| Number of Contracts | Expiration Date | Notional Amount | Value | Unrealized Appreciation (Depreciation) | |||||||||||||||||||
Russell 2000 Mini Index Futures | 9 | 9/20/19 | $ | 686,549 | $ | 672,390 | $ | (14,159 | ) | ||||||||||||||
Total unrealized appreciation | $ | — | |||||||||||||||||||||
Total unrealized depreciation | (14,159 | ) | |||||||||||||||||||||
Total net unrealized appreciation(depreciation) | $ | (14,159 | ) | ||||||||||||||||||||
See notes to financial statements.
29
| Victory Portfolios II VictoryShares USAA MSCI International Value Momentum ETF | Schedule of Portfolio Investments August 31, 2019 | ||||||
Security Description | Shares | Value | |||||||||
Common Stocks (98.5%) | |||||||||||
Australia (5.9%): | |||||||||||
Communication Services (0.2%): | |||||||||||
Telstra Corp. Ltd. | 260,708 | $ | 653,425 | ||||||||
Consumer Discretionary (0.4%): | |||||||||||
Harvey Norman Holdings Ltd. | 404,400 | 1,193,395 | |||||||||
Energy (0.3%): | |||||||||||
Santos Ltd. | 206,498 | 1,003,113 | |||||||||
Financials (1.1%): | |||||||||||
ASX Ltd. | 43,284 | 2,517,024 | |||||||||
Magellan Financial Group Ltd. | 15,236 | 520,859 | |||||||||
QBE Insurance Group Ltd. | 81,406 | 687,236 | |||||||||
3,725,119 | |||||||||||
Health Care (0.2%): | |||||||||||
Ramsay Health Care Ltd. | 16,867 | 745,942 | |||||||||
Industrials (0.5%): | |||||||||||
Aurizon Holdings Ltd. | 199,269 | 793,462 | |||||||||
Brambles Ltd. | 92,710 | 705,836 | |||||||||
1,499,298 | |||||||||||
Materials (0.7%): | |||||||||||
BlueScope Steel Ltd. | 49,371 | 415,464 | |||||||||
Fortescue Metals Group Ltd. | 154,806 | 834,404 | |||||||||
Newcrest Mining Ltd. | 21,498 | 535,918 | |||||||||
Rio Tinto Ltd. | 9,065 | 534,899 | |||||||||
2,320,685 | |||||||||||
Real Estate (2.5%): | |||||||||||
Dexus | 206,889 | 1,798,150 | |||||||||
Goodman Group | 177,279 | 1,734,294 | |||||||||
Mirvac Group | 810,112 | 1,741,144 | |||||||||
Stockland | 250,677 | 763,399 | |||||||||
The GPT Group | 445,220 | 1,916,789 | |||||||||
7,953,776 | |||||||||||
19,094,753 | |||||||||||
Austria (0.9%): | |||||||||||
Energy (0.4%): | |||||||||||
OMV AG | 24,497 | 1,252,016 | |||||||||
Financials (0.3%): | |||||||||||
Raiffeisen Bank International AG | 42,146 | 922,927 | |||||||||
Utilities (0.2%): | |||||||||||
Verbund AG, Class A | 11,963 | 713,385 | |||||||||
2,888,328 | |||||||||||
See notes to financial statements.
30
| Victory Portfolios II VictoryShares USAA MSCI International Value Momentum ETF | Schedule of Portfolio Investments — continued August 31, 2019 | ||||||
Security Description | Shares | Value | |||||||||
Belgium (0.9%): | |||||||||||
Communication Services (0.2%): | |||||||||||
Proximus SADP | 26,949 | $ | 798,030 | ||||||||
Consumer Staples (0.2%): | |||||||||||
Colruyt SA | 13,299 | 682,041 | |||||||||
Financials (0.3%): | |||||||||||
Ageas | 16,013 | 858,790 | |||||||||
Health Care (0.2%): | |||||||||||
UCB SA | 8,981 | 671,948 | |||||||||
3,010,809 | |||||||||||
Bermuda (0.3%): | |||||||||||
Industrials (0.3%): | |||||||||||
Jardine Matheson Holdings Ltd. | 15,800 | 859,046 | |||||||||
Canada (10.9%): | |||||||||||
Communication Services (0.7%): | |||||||||||
BCE, Inc. | 30,146 | 1,429,258 | |||||||||
Quebecor, Inc., Class B | 44,248 | 998,644 | |||||||||
2,427,902 | |||||||||||
Consumer Discretionary (0.9%): | |||||||||||
Gildan Activewear, Inc. | 38,851 | 1,427,090 | |||||||||
Magna International, Inc. | 27,148 | 1,361,895 | |||||||||
2,788,985 | |||||||||||
Consumer Staples (2.1%): | |||||||||||
Alimentation Couche-Tard, Inc., Class B | 22,823 | 1,439,319 | |||||||||
Empire Co. Ltd., Class A | 40,040 | 1,106,765 | |||||||||
Loblaw Cos. Ltd. | 37,843 | 2,075,270 | |||||||||
METRO, Inc. | 52,167 | 2,217,726 | |||||||||
6,839,080 | |||||||||||
Energy (1.2%): | |||||||||||
Cenovus Energy, Inc. | 46,324 | 405,091 | |||||||||
Enbridge, Inc. | 21,838 | 731,823 | |||||||||
Encana Corp. | 86,406 | 383,651 | |||||||||
TC Energy Corp. | 40,251 | 2,066,468 | |||||||||
Tourmaline Oil Corp. | 36,533 | 346,965 | |||||||||
3,933,998 | |||||||||||
Financials (0.6%): | |||||||||||
Manulife Financial Corp. | 44,156 | 734,050 | |||||||||
Power Corp. of Canada | 53,602 | 1,132,306 | |||||||||
1,866,356 | |||||||||||
Health Care (0.1%): | |||||||||||
Cronos Group, Inc. (a) (b) | 18,138 | 200,517 | |||||||||
See notes to financial statements.
31
| Victory Portfolios II VictoryShares USAA MSCI International Value Momentum ETF | Schedule of Portfolio Investments — continued August 31, 2019 | ||||||
Security Description | Shares | Value | |||||||||
Industrials (1.6%): | |||||||||||
Air Canada (a) | 13,979 | $ | 470,771 | ||||||||
CAE, Inc. | 71,550 | 1,876,518 | |||||||||
Canadian Pacific Railway Ltd. | 3,608 | 870,422 | |||||||||
Thomson Reuters Corp. | 30,159 | 2,076,495 | |||||||||
5,294,206 | |||||||||||
Information Technology (0.7%): | |||||||||||
CGI, Inc. (a) | 28,295 | 2,223,483 | |||||||||
Materials (0.8%): | |||||||||||
First Quantum Minerals Ltd. | 35,714 | 219,315 | |||||||||
Kirkland Lake Gold Ltd. | 19,680 | 958,822 | |||||||||
Nutrien Ltd. | 12,140 | 612,573 | |||||||||
Teck Resources Ltd., Class B | 39,809 | 679,162 | |||||||||
2,469,872 | |||||||||||
Real Estate (0.7%): | |||||||||||
H&R Real Estate Investment Trust | 78,360 | 1,334,502 | |||||||||
Smartcentres Real Estate Investment Trust | 45,355 | 1,080,629 | |||||||||
2,415,131 | |||||||||||
Utilities (1.5%): | |||||||||||
Atco Ltd. | 31,454 | 1,126,265 | |||||||||
Emera, Inc. | 58,870 | 2,555,405 | |||||||||
Hydro One Ltd. (c) | 70,134 | 1,302,609 | |||||||||
4,984,279 | |||||||||||
35,443,809 | |||||||||||
China (0.2%): | |||||||||||
Industrials (0.2%): | |||||||||||
Yangzijiang Shipbuilding Holdings Ltd. | 1,169,900 | 767,452 | |||||||||
Denmark (1.5%): | |||||||||||
Consumer Staples (0.7%): | |||||||||||
Carlsberg A/S, Class B | 14,588 | 2,157,842 | |||||||||
Financials (0.3%): | |||||||||||
Tryg A/S | 32,802 | 982,519 | |||||||||
Industrials (0.3%): | |||||||||||
AP Moller — Maersk A/S, Class A | 515 | 513,813 | |||||||||
Vestas Wind Systems A/S | 6,173 | 454,501 | |||||||||
968,314 | |||||||||||
Utilities (0.2%): | |||||||||||
Orsted A/S (c) | 7,744 | 740,933 | |||||||||
4,849,608 | |||||||||||
Finland (0.1%): | |||||||||||
Energy (0.1%): | |||||||||||
Neste Oyj | 15,657 | 493,818 | |||||||||
See notes to financial statements.
32
| Victory Portfolios II VictoryShares USAA MSCI International Value Momentum ETF | Schedule of Portfolio Investments — continued August 31, 2019 | ||||||
Security Description | Shares | Value | |||||||||
France (8.5%): | |||||||||||
Communication Services (1.0%): | |||||||||||
Eutelsat Communications SA | 30,188 | $ | 525,928 | ||||||||
Orange SA | 129,810 | 1,972,753 | |||||||||
Vivendi SA | 26,935 | 754,308 | |||||||||
3,252,989 | |||||||||||
Consumer Discretionary (1.7%): | |||||||||||
Compagnie Generale des Etablissements Michelin SCA | 6,090 | 641,151 | |||||||||
Faurecia SE | 10,495 | 459,415 | |||||||||
Kering SA | 1,095 | 531,064 | |||||||||
LVMH Moet Hennessy Louis Vuitton SE | 3,886 | 1,550,874 | |||||||||
Peugeot SA | 51,019 | 1,142,233 | |||||||||
Renault SA | 23,038 | 1,323,329 | |||||||||
5,648,066 | |||||||||||
Consumer Staples (1.0%): | |||||||||||
Carrefour SA | 66,990 | 1,143,476 | |||||||||
Casino Guichard Perrachon SA (b) | 25,816 | 1,088,863 | |||||||||
Danone SA | 11,115 | 997,101 | |||||||||
3,229,440 | |||||||||||
Energy (0.6%): | |||||||||||
Total SA | 35,834 | 1,791,187 | |||||||||
Financials (1.1%): | |||||||||||
BNP Paribas SA | 13,240 | 598,312 | |||||||||
CNP Assurances | 37,386 | 680,150 | |||||||||
Credit Agricole SA | 103,332 | 1,182,322 | |||||||||
Societe Generale SA | 41,164 | 1,045,125 | |||||||||
3,505,909 | |||||||||||
Health Care (0.9%): | |||||||||||
Sanofi | 19,789 | 1,702,439 | |||||||||
Sartorius Stedim Biotech | 7,939 | 1,230,988 | |||||||||
2,933,427 | |||||||||||
Industrials (1.7%): | |||||||||||
Alstom SA | 18,348 | 785,396 | |||||||||
Compagnie de Saint-Gobain | 20,042 | 724,378 | |||||||||
Safran SA | 11,569 | 1,683,637 | |||||||||
Schneider Electric SE | 9,228 | 773,963 | |||||||||
Teleperformance | 3,203 | 700,522 | |||||||||
Vinci SA | 8,610 | 943,434 | |||||||||
5,611,330 | |||||||||||
Information Technology (0.5%): | |||||||||||
Atos SE | 14,832 | 1,125,067 | |||||||||
Ingenico Group SA | 4,949 | 491,597 | |||||||||
1,616,664 | |||||||||||
27,589,012 | |||||||||||
See notes to financial statements.
33
| Victory Portfolios II VictoryShares USAA MSCI International Value Momentum ETF | Schedule of Portfolio Investments — continued August 31, 2019 | ||||||
Security Description | Shares | Value | |||||||||
Germany (4.6%): | |||||||||||
Consumer Discretionary (1.0%): | |||||||||||
adidas AG | 2,214 | $ | 657,573 | ||||||||
Bayerische Motoren Werke AG | 20,681 | 1,384,944 | |||||||||
Daimler AG, Registered Shares | 27,056 | 1,272,412 | |||||||||
3,314,929 | |||||||||||
Consumer Staples (0.4%): | |||||||||||
METRO AG | 71,595 | 1,110,122 | |||||||||
Financials (1.4%): | |||||||||||
Commerzbank AG | 126,628 | 719,417 | |||||||||
Deutsche Bank AG, Registered Shares (b) | 121,503 | 879,367 | |||||||||
Hannover Rueck SE | 5,590 | 891,386 | |||||||||
Muenchener Rueckversicherungs-Gesellschaft AG in Muenchen, Class R | 8,010 | 1,922,096 | |||||||||
4,412,266 | |||||||||||
Health Care (0.5%): | |||||||||||
Carl Zeiss Meditec AG | 7,074 | 817,196 | |||||||||
Merck KGaA | 7,849 | 840,686 | |||||||||
1,657,882 | |||||||||||
Industrials (0.8%): | |||||||||||
Deutsche Lufthansa AG, Registered Shares | 61,063 | 940,093 | |||||||||
MTU Aero Engines Holding AG | 6,065 | 1,658,414 | |||||||||
2,598,507 | |||||||||||
Materials (0.2%): | |||||||||||
HeidelbergCement AG | 9,704 | 673,678 | |||||||||
Utilities (0.3%): | |||||||||||
RWE AG | 34,619 | 987,796 | |||||||||
14,755,180 | |||||||||||
Greece (0.2%): | |||||||||||
Consumer Discretionary (0.2%): | |||||||||||
Puma SE | 7,574 | 575,936 | |||||||||
Hong Kong (4.6%): | |||||||||||
Communication Services (0.7%): | |||||||||||
HKT Trust & HKT Ltd. | 1,484,000 | 2,322,020 | |||||||||
Consumer Discretionary (0.5%): | |||||||||||
SJM Holdings Ltd. | 394,000 | 372,612 | |||||||||
Techtronic Industries Co. Ltd. | 90,000 | 622,563 | |||||||||
YUE Yuen Industrial Holdings Ltd. | 210,000 | 537,372 | |||||||||
1,532,547 | |||||||||||
Consumer Staples (0.5%): | |||||||||||
Vitasoy International Holdings Ltd. | 120,000 | 559,005 | |||||||||
WH Group Ltd. (c) | 1,238,000 | 996,992 | |||||||||
1,555,997 | |||||||||||
See notes to financial statements.
34
| Victory Portfolios II VictoryShares USAA MSCI International Value Momentum ETF | Schedule of Portfolio Investments — continued August 31, 2019 | ||||||
Security Description | Shares | Value | |||||||||
Industrials (0.7%): | |||||||||||
CK Hutchison Holdings Ltd. | 212,000 | $ | 1,847,984 | ||||||||
NWS Holdings Ltd. | 318,000 | 547,901 | |||||||||
2,395,885 | |||||||||||
Real Estate (2.2%): | |||||||||||
CK Asset Holdings Ltd. | 96,000 | 652,428 | |||||||||
Hang Lung Properties Ltd. | 329,000 | 744,049 | |||||||||
Henderson Land Development Co. Ltd. | 163,000 | 759,315 | |||||||||
Kerry Properties Ltd. | 284,500 | 960,394 | |||||||||
Link REIT | 153,000 | 1,718,366 | |||||||||
Swire Pacific Ltd., Class A | 167,500 | 1,640,721 | |||||||||
Swire Properties Ltd. | 194,200 | 638,217 | |||||||||
7,113,490 | |||||||||||
14,919,939 | |||||||||||
Ireland (1.0%): | |||||||||||
Communication Services (0.4%): | |||||||||||
WPP PLC | 100,560 | 1,188,174 | |||||||||
Industrials (0.6%): | |||||||||||
Experian PLC | 63,086 | 1,934,559 | |||||||||
3,122,733 | |||||||||||
Israel (3.8%): | |||||||||||
Financials (2.2%): | |||||||||||
Bank Hapoalim BM (a) | 244,120 | 1,790,755 | |||||||||
Bank Leumi Le-Israel B.M. | 261,174 | 1,781,228 | |||||||||
Israel Discount Bank Ltd., Class A | 478,378 | 1,993,044 | |||||||||
Mizrahi Tefahot Bank Ltd. | 77,436 | 1,783,062 | |||||||||
7,348,089 | |||||||||||
Health Care (0.2%): | |||||||||||
Teva Pharmaceutical Industries Ltd., ADR (a) | 80,101 | 552,697 | |||||||||
Information Technology (0.8%): | |||||||||||
CyberArk Software Ltd. (a) | 7,807 | 877,038 | |||||||||
Nice Ltd. (a) | 11,647 | 1,782,965 | |||||||||
2,660,003 | |||||||||||
Real Estate (0.6%): | |||||||||||
Azrieli Group Ltd. | 25,827 | 1,926,739 | |||||||||
12,487,528 | |||||||||||
Italy (3.3%): | |||||||||||
Communication Services (0.3%): | |||||||||||
Telecom Italia SpA (a) | 1,992,531 | 1,062,905 | |||||||||
Energy (0.8%): | |||||||||||
Eni SpA | 105,173 | 1,584,440 | |||||||||
Snam SpA | 160,692 | 813,848 | |||||||||
2,398,288 | |||||||||||
See notes to financial statements.
35
| Victory Portfolios II VictoryShares USAA MSCI International Value Momentum ETF | Schedule of Portfolio Investments — continued August 31, 2019 | ||||||
Security Description | Shares | Value | |||||||||
Financials (1.1%): | |||||||||||
Assicurazioni Generali SpA | 36,863 | $ | 668,605 | ||||||||
Mediobanca Banca di Credito Finanziario SpA | 51,608 | 512,067 | |||||||||
Poste Italiane SpA (c) | 151,026 | 1,625,252 | |||||||||
UniCredit SpA | 69,562 | 770,647 | |||||||||
3,576,571 | |||||||||||
Health Care (0.2%): | |||||||||||
Recordati SpA | 16,485 | 723,622 | |||||||||
Industrials (0.3%): | |||||||||||
Leonardo SpA | 83,109 | 1,018,659 | |||||||||
Utilities (0.6%): | |||||||||||
Enel SpA | 246,235 | 1,788,069 | |||||||||
10,568,114 | |||||||||||
Japan (27.0%): | |||||||||||
Communication Services (1.1%): | |||||||||||
KDDI Corp. | 23,700 | 632,997 | |||||||||
Nippon Telegraph & Telephone Corp. | 27,000 | 1,296,265 | |||||||||
SoftBank Group Corp. | 15,900 | 722,611 | |||||||||
Toho Co. Ltd. | 24,600 | 1,044,072 | |||||||||
3,695,945 | |||||||||||
Consumer Discretionary (3.3%): | |||||||||||
Bandai Namco Holdings, Inc. | 18,400 | 1,083,424 | |||||||||
Hikari Tsushin, Inc. | 2,000 | 469,169 | |||||||||
Honda Motor Co. Ltd. | 41,300 | 981,870 | |||||||||
Iida Group Holdings Co. Ltd. | 61,600 | 959,879 | |||||||||
Mazda Motor Corp. | 90,100 | 757,334 | |||||||||
Nissan Motor Co. Ltd. | 84,800 | 524,403 | |||||||||
Pan Pacific International Holdings Corp. | 28,400 | 444,415 | |||||||||
Rakuten, Inc. | 79,104 | 745,990 | |||||||||
Sankyo Co. Ltd. | 18,000 | 623,204 | |||||||||
Sekisui House Ltd. | 36,700 | 651,918 | |||||||||
Sumitomo Electric Industries Ltd. | 36,700 | 432,538 | |||||||||
The Yokohama Rubber Co. Ltd. | 48,200 | 927,718 | |||||||||
Toyota Industries Corp. | 17,000 | 935,324 | |||||||||
Toyota Motor Corp. | 19,700 | 1,291,742 | |||||||||
10,828,928 | |||||||||||
Consumer Staples (0.2%): | |||||||||||
NH Foods Ltd. | 13,000 | 499,694 | |||||||||
Energy (0.7%): | |||||||||||
Idemitsu Kosan Co. Ltd. | 24,044 | 646,716 | |||||||||
Inpex Corp. | 93,800 | 812,117 | |||||||||
JXTG Holdings, Inc. | 193,000 | 798,401 | |||||||||
2,257,234 | |||||||||||
See notes to financial statements.
36
| Victory Portfolios II VictoryShares USAA MSCI International Value Momentum ETF | Schedule of Portfolio Investments — continued August 31, 2019 | ||||||
Security Description | Shares | Value | |||||||||
Financials (3.8%): | |||||||||||
Concordia Financial Group Ltd. | 211,700 | $ | 727,971 | ||||||||
Credit Saison Co. Ltd. | 76,500 | 851,882 | |||||||||
Fukuoka Financial Group, Inc. | 42,000 | 723,312 | |||||||||
Japan Post Holdings Co. Ltd. | 62,400 | 567,887 | |||||||||
Mebuki Financial Group, Inc. | 366,700 | 818,766 | |||||||||
Mitsubishi UFJ Financial Group, Inc. | 184,400 | 886,691 | |||||||||
Mitsubishi UFJ Lease & Finance Co. Ltd. | 159,500 | 862,528 | |||||||||
Mizuho Financial Group, Inc. | 406,800 | 592,887 | |||||||||
ORIX Corp. | 65,800 | 972,634 | |||||||||
Resona Holdings, Inc. | 206,200 | 810,075 | |||||||||
Shinsei Bank Ltd. (b) | 61,400 | 841,072 | |||||||||
Sumitomo Mitsui Financial Group, Inc. | 30,600 | 1,004,385 | |||||||||
Sumitomo Mitsui Trust Holdings, Inc. | 26,500 | 866,814 | |||||||||
The Bank of Kyoto Ltd. | 10,800 | 388,167 | |||||||||
The Chiba Bank Ltd. | 159,700 | 797,409 | |||||||||
The Shizuoka Bank Ltd. | 65,400 | 442,387 | |||||||||
12,154,867 | |||||||||||
Health Care (1.6%): | |||||||||||
Alfresa Holdings Corp. | 35,700 | 808,879 | |||||||||
Daiichi Sankyo Co. Ltd. | 13,900 | 919,028 | |||||||||
Hoya Corp. | 13,769 | 1,121,938 | |||||||||
Medipal Holdings Corp. | 44,600 | 948,346 | |||||||||
Sumitomo Dainippon Pharma Co. Ltd. | 13,600 | 237,803 | |||||||||
Suzuken Co. Ltd. | 18,700 | 1,005,954 | |||||||||
5,041,948 | |||||||||||
Industrials (6.8%): | |||||||||||
Amada Holdings Co. Ltd. | 43,500 | 453,667 | |||||||||
ANA Holdings, Inc. | 19,200 | 656,973 | |||||||||
Asahi Glass Co. Ltd. | 32,300 | 932,682 | |||||||||
Central Japan Railway Co. | 3,300 | 653,347 | |||||||||
Dai Nippon Printing Co. Ltd. | 26,300 | 569,633 | |||||||||
ITOCHU Corp. | 61,400 | 1,225,455 | |||||||||
Japan Airlines Co. Ltd. | 19,900 | 622,244 | |||||||||
JTEKT Corp. | 68,000 | 738,009 | |||||||||
Kajima Corp. | 75,400 | 918,481 | |||||||||
Kamigumi Co. Ltd. | 49,700 | 1,165,418 | |||||||||
Keihan Holdings Co. Ltd. | 14,400 | 603,703 | |||||||||
Keio Corp. | 8,500 | 531,726 | |||||||||
Keisei Electric Railway Co. Ltd. | 15,500 | 610,391 | |||||||||
Marubeni Corp. | 170,100 | 1,086,672 | |||||||||
Mitsubishi Corp. | 41,300 | 1,005,799 | |||||||||
Mitsubishi Heavy Industries Ltd. | 25,200 | 947,745 | |||||||||
Mitsui & Co. Ltd. | 76,500 | 1,198,544 | |||||||||
Mitsui Osk Lines Ltd. | 31,000 | 730,717 | |||||||||
Nippon Yusen KK | 25,300 | 378,028 | |||||||||
NSK Ltd. | 51,000 | 409,365 | |||||||||
Obayashi Corp. | 108,200 | 997,954 | |||||||||
See notes to financial statements.
37
| Victory Portfolios II VictoryShares USAA MSCI International Value Momentum ETF | Schedule of Portfolio Investments — continued August 31, 2019 | ||||||
Security Description | Shares | Value | |||||||||
Shimizu Corp. | 115,600 | $ | 964,922 | ||||||||
Sumitomo Corp. | 79,700 | 1,195,744 | |||||||||
Sumitomo Heavy Industries Ltd. | 27,100 | 779,976 | |||||||||
Toppan Printing Co. Ltd. | 71,800 | 1,145,201 | |||||||||
Toyota Tsusho Corp. | 29,900 | 928,169 | |||||||||
West Japan Railway Co. | 8,400 | 708,276 | |||||||||
22,158,841 | |||||||||||
Information Technology (2.8%): | |||||||||||
Advantest Corp. | 6,900 | 283,749 | |||||||||
Brother Industries Ltd. | 41,800 | 724,594 | |||||||||
FUJIFILM Holdings Corp. | 27,400 | 1,174,267 | |||||||||
Fujitsu Ltd. | 12,500 | 966,013 | |||||||||
Hitachi High-Technologies Co. | 7,100 | 383,947 | |||||||||
Hitachi Ltd. | 25,700 | 878,659 | |||||||||
Konica Minolta, Inc. | 113,400 | 807,673 | |||||||||
Kyocera Corp. | 15,500 | 922,158 | |||||||||
NEC Corp. | 27,500 | 1,178,812 | |||||||||
Nippon Electric Glass Co. Ltd. | 33,500 | 695,911 | |||||||||
Ricoh Co. Ltd. | 100,600 | 931,648 | |||||||||
8,947,431 | |||||||||||
Materials (2.7%): | |||||||||||
Hitachi Chemical Co. Ltd. | 26,941 | 842,660 | |||||||||
JFE Holdings, Inc. | 61,900 | 725,165 | |||||||||
Kobe Steel Ltd. | 98,600 | 514,621 | |||||||||
Mitsubishi Chemical Holdings Corp. | 124,000 | 851,861 | |||||||||
Mitsubishi Gas Chemical Co., Inc. | 32,100 | 386,488 | |||||||||
Mitsubishi Materials Corp. | 32,000 | 776,297 | |||||||||
Mitsui Chemicals, Inc. | 39,200 | 838,694 | |||||||||
Nippon Steel Corp. | 62,800 | 879,182 | |||||||||
Oji Holdings Corp. | 100,500 | 468,675 | |||||||||
Showa Denko KK | 19,400 | 501,152 | |||||||||
Sumitomo Chemical Co. Ltd. | 176,700 | 774,087 | |||||||||
Taiheiyo Cement Corp. | 17,400 | 439,652 | |||||||||
Tosoh Corp. | 29,500 | 379,085 | |||||||||
Toyo Seikan Group Holdings Ltd. | 26,400 | 385,013 | |||||||||
8,762,632 | |||||||||||
Real Estate (3.0%): | |||||||||||
Aeon Mall Co. Ltd. | 30,800 | 484,873 | |||||||||
Daiwa House Industry Co. Ltd. | 32,000 | 1,004,513 | |||||||||
Japan Prime Realty Investment Corp. | 423 | 1,932,781 | |||||||||
Japan Real Estate Investment Corp. | 296 | 1,971,567 | |||||||||
Nippon Building Fund, Inc. | 240 | 1,763,625 | |||||||||
Nippon Prologis REIT, Inc. | 325 | 881,200 | |||||||||
Nomura Real Estate Master Fund, Inc. | 964 | 1,684,695 | |||||||||
9,723,254 | |||||||||||
See notes to financial statements.
38
| Victory Portfolios II VictoryShares USAA MSCI International Value Momentum ETF | Schedule of Portfolio Investments — continued August 31, 2019 | ||||||
Security Description | Shares | Value | |||||||||
Utilities (1.0%): | |||||||||||
Chubu Electric Power Co., Inc. | 77,900 | $ | 1,149,657 | ||||||||
Electric Power Development Co. Ltd. | 41,500 | 962,579 | |||||||||
Toho Gas Co. Ltd. | 13,000 | 505,205 | |||||||||
Tokyo Electric Power Co. Holdings (a) | 142,200 | 677,877 | |||||||||
3,295,318 | |||||||||||
87,366,092 | |||||||||||
Luxembourg (0.3%): | |||||||||||
Materials (0.3%): | |||||||||||
ArcelorMittal | 62,225 | 897,132 | |||||||||
Netherlands (4.2%): | |||||||||||
Consumer Staples (0.8%): | |||||||||||
Heineken Holding NV, Class A | 10,260 | 1,016,328 | |||||||||
Koninklijke Ahold Delhaize NV | 68,015 | 1,594,277 | |||||||||
2,610,605 | |||||||||||
Financials (1.2%): | |||||||||||
Aegon NV | 253,557 | 966,971 | |||||||||
EXOR NV | 18,652 | 1,263,241 | |||||||||
NN Group NV | 43,909 | 1,472,885 | |||||||||
3,703,097 | |||||||||||
Health Care (0.2%): | |||||||||||
Koninklijke Philips NV | 16,249 | 767,392 | |||||||||
Industrials (1.0%): | |||||||||||
AerCap Holdings NV (a) | 27,086 | 1,452,352 | |||||||||
Wolters Kluwer NV | 25,401 | 1,832,779 | |||||||||
3,285,131 | |||||||||||
Information Technology (0.2%): | |||||||||||
NXP Semiconductor NV | 6,025 | 615,393 | |||||||||
Materials (0.8%): | |||||||||||
Akzo Nobel NV | 9,876 | 886,062 | |||||||||
Koninklijke DSM NV | 12,957 | 1,613,811 | |||||||||
2,499,873 | |||||||||||
13,481,491 | |||||||||||
New Zealand (0.8%): | |||||||||||
Industrials (0.2%): | |||||||||||
Auckland International Airport Ltd. | 128,548 | 779,943 | |||||||||
Utilities (0.6%): | |||||||||||
Meridian Energy Ltd. | 595,040 | 1,868,953 | |||||||||
2,648,896 | |||||||||||
Norway (0.5%): | |||||||||||
Consumer Staples (0.2%): | |||||||||||
Mowi ASA | 27,989 | 670,046 | |||||||||
See notes to financial statements.
39
| Victory Portfolios II VictoryShares USAA MSCI International Value Momentum ETF | Schedule of Portfolio Investments — continued August 31, 2019 | ||||||
Security Description | Shares | Value | |||||||||
Financials (0.3%): | |||||||||||
Gjensidige Forsikring ASA | 45,879 | $ | 886,469 | ||||||||
1,556,515 | |||||||||||
Russian Federation (0.2%): | |||||||||||
Materials (0.2%): | |||||||||||
Evraz PLC | 95,380 | 576,494 | |||||||||
Singapore (2.4%): | |||||||||||
Consumer Discretionary (0.2%): | |||||||||||
Jardine Cycle & Carriage Ltd. | 30,700 | 681,632 | |||||||||
Consumer Staples (0.9%): | |||||||||||
Golden Agri-Resources Ltd. | 4,784,000 | 913,898 | |||||||||
Wilmar International Ltd. | 671,700 | 1,844,851 | |||||||||
2,758,749 | |||||||||||
Industrials (0.2%): | |||||||||||
SembCorp Industries Ltd. | 461,600 | 688,806 | |||||||||
Real Estate (1.1%): | |||||||||||
Ascendas Real Estate Investment Trust | 566,354 | 1,257,476 | |||||||||
CapitaLand Mall Trust | 1,234,200 | 2,357,721 | |||||||||
3,615,197 | |||||||||||
7,744,384 | |||||||||||
Spain (2.1%): | |||||||||||
Communication Services (0.2%): | |||||||||||
Cellnex Telecom SA (c) | 16,121 | 646,218 | |||||||||
Energy (0.5%): | |||||||||||
Repsol SA | 113,143 | 1,647,193 | |||||||||
Financials (0.3%): | |||||||||||
Banco de Sabadell SA | 980,717 | 841,114 | |||||||||
Industrials (0.5%): | |||||||||||
ACS, Actividades de Construccion y Servicios SA | 35,700 | 1,351,242 | |||||||||
Siemens Gamesa Renewable Energy SA | 27,984 | 381,673 | |||||||||
1,732,915 | |||||||||||
Utilities (0.6%): | |||||||||||
Iberdrola SA | 182,973 | 1,884,417 | |||||||||
6,751,857 | |||||||||||
Sweden (2.1%): | |||||||||||
Communication Services (0.3%): | |||||||||||
Telia Co. AB | 203,599 | 891,893 | |||||||||
Consumer Staples (0.9%): | |||||||||||
Essity AB, Class B | 27,372 | 854,363 | |||||||||
ICA Gruppen AB | 41,764 | 2,049,702 | |||||||||
2,904,065 | |||||||||||
See notes to financial statements.
40
| Victory Portfolios II VictoryShares USAA MSCI International Value Momentum ETF | Schedule of Portfolio Investments — continued August 31, 2019 | ||||||
Security Description | Shares | Value | |||||||||
Financials (0.5%): | |||||||||||
Industrivarden AB, Class C | 42,433 | $ | 888,312 | ||||||||
L E Lundbergforetagen AB, B Shares | 22,667 | 849,654 | |||||||||
1,737,966 | |||||||||||
Industrials (0.2%): | |||||||||||
Assa Abloy AB, Class B | 35,082 | 732,991 | |||||||||
Materials (0.2%): | |||||||||||
Boliden AB | 23,670 | 523,758 | |||||||||
6,790,673 | |||||||||||
Switzerland (3.7%): | |||||||||||
Consumer Staples (0.9%): | |||||||||||
Nestle SA, Registered Shares | 24,403 | 2,737,615 | |||||||||
Financials (1.2%): | |||||||||||
Baloise Holding AG, Registered Shares | 11,522 | 1,964,487 | |||||||||
Swiss Life Holding AG | 4,190 | 1,987,333 | |||||||||
3,951,820 | |||||||||||
Health Care (1.6%): | |||||||||||
Alcon, Inc. (a) | 11,496 | 700,600 | |||||||||
Novartis AG, Registered Shares | 20,031 | 1,801,970 | |||||||||
Roche Holding AG | 6,650 | 1,818,677 | |||||||||
Sonova Holding AG, Registered Shares | 3,596 | 834,809 | |||||||||
5,156,056 | |||||||||||
11,845,491 | |||||||||||
United Kingdom (8.4%): | |||||||||||
Communication Services (0.9%): | |||||||||||
Auto Trader Group PLC (c) | 88,108 | 570,419 | |||||||||
BT Group PLC | 292,641 | 590,328 | |||||||||
Informa PLC | 85,473 | 905,611 | |||||||||
Vodafone Group PLC | 373,462 | 706,063 | |||||||||
2,772,421 | |||||||||||
Consumer Discretionary (1.3%): | |||||||||||
Barratt Developments PLC | 157,993 | 1,216,811 | |||||||||
Compass Group PLC | 34,830 | 883,560 | |||||||||
Fiat Chrysler Automobiles NV | 64,554 | 841,564 | |||||||||
Ocado Group PLC (a) | 18,005 | 284,069 | |||||||||
Taylor Wimpey PLC | 616,341 | 1,095,515 | |||||||||
4,321,519 | |||||||||||
Consumer Staples (1.7%): | |||||||||||
British American Tobacco PLC | 31,561 | 1,106,972 | |||||||||
Coca-Cola European Partners PLC | 33,128 | 1,866,431 | |||||||||
J Sainsbury PLC | 555,896 | 1,327,592 | |||||||||
Tesco PLC | 465,560 | 1,242,824 | |||||||||
5,543,819 | |||||||||||
See notes to financial statements.
41
| Victory Portfolios II VictoryShares USAA MSCI International Value Momentum ETF | Schedule of Portfolio Investments — continued August 31, 2019 | ||||||
Security Description | Shares | Value | |||||||||
Energy (0.5%): | |||||||||||
Royal Dutch Shell PLC, Class A | 58,277 | $ | 1,614,981 | ||||||||
Financials (1.6%): | |||||||||||
| 3i Group PLC | 113,575 | 1,516,648 | |||||||||
Barclays PLC | 718,838 | 1,195,845 | |||||||||
London Stock Exchange Group PLC | 10,207 | 864,423 | |||||||||
Royal Bank of Scotland Group PLC | 421,897 | 952,855 | |||||||||
Standard Chartered PLC | 72,773 | 551,257 | |||||||||
5,081,028 | |||||||||||
Health Care (0.3%): | |||||||||||
Smith & Nephew PLC | 40,249 | 963,188 | |||||||||
Industrials (0.7%): | |||||||||||
Meggitt PLC | 93,716 | 706,477 | |||||||||
Spirax-Sarco Engineering PLC | 15,977 | 1,561,470 | |||||||||
2,267,947 | |||||||||||
Information Technology (0.7%): | |||||||||||
Halma PLC | 72,803 | 1,740,456 | |||||||||
Micro Focus International PLC | 34,991 | 472,501 | |||||||||
2,212,957 | |||||||||||
Materials (0.4%): | |||||||||||
Anglo American PLC | 37,380 | 807,672 | |||||||||
Rio Tinto PLC | 9,335 | 471,741 | |||||||||
1,279,413 | |||||||||||
Real Estate (0.3%): | |||||||||||
Segro PLC | 112,528 | 1,075,780 | |||||||||
27,133,053 | |||||||||||
United States (0.1%): | |||||||||||
Health Care (0.1%): | |||||||||||
Bausch Health Cos., Inc. (a) | 23,762 | 507,322 | |||||||||
Total Common Stocks (Cost $327,585,436) | 318,725,465 | ||||||||||
Preferred Stocks (0.7%) | |||||||||||
Germany (0.7%): | |||||||||||
Consumer Discretionary (0.7%): | |||||||||||
Porsche Automobil Holding SE | 18,362 | 1,153,817 | |||||||||
Volkswagen AG | 7,375 | 1,186,582 | |||||||||
2,340,399 | |||||||||||
Total Preferred Stocks (Cost $2,590,665) | 2,340,399 | ||||||||||
Collateral for Securities Loaned^ (0.8%) | |||||||||||
United States (0.8%): | |||||||||||
BlackRock Liquidity Funds TempFund Portfolio, Institutional Class, 2.15% (d) | 532,886 | 532,886 | |||||||||
| Fidelity Investments Money Market Government Portfolio, Class I, 2.03% (d) | 727,008 | 727,008 | |||||||||
See notes to financial statements.
42
| Victory Portfolios II VictoryShares USAA MSCI International Value Momentum ETF | Schedule of Portfolio Investments — continued August 31, 2019 | ||||||
Security Description | Shares | Value | |||||||||
Fidelity Investments Prime Money Market Portfolio, Class I, 2.10% (d) | 17,826 | $ | 17,826 | ||||||||
| Goldman Sachs Financial Square Prime Obligations Fund, Institutional Class, 2.20% (d) | 337,437 | 337,437 | |||||||||
JPMorgan Prime Money Market Fund, Capital Class, 2.15% (d) | 355,225 | 355,225 | |||||||||
| Morgan Stanley Institutional Liquidity Prime Portfolio, Institutional Class, 2.17% (d) | 577,204 | 577,204 | |||||||||
Total Collateral for Securities Loaned (Cost $2,547,586) | 2,547,586 | ||||||||||
Total Investments (Cost $332,723,687) — 100.0% | 323,613,450 | ||||||||||
Other assets in excess of liabilities — 0.0% | 79,514 | ||||||||||
NET ASSETS — 100.00% | $ | 323,692,964 | |||||||||
^ Purchased with cash collateral from securities on loan.
(a) Non-income producing security.
(b) All or a portion of this security is on loan.
(c) Rule 144A security or other security that is restricted as to resale to institutional investors. The Fund's Adviser has deemed this security to be liquid based upon procedures approved by the Board of Trustees. As of August 31, 2019, the fair value of these securities was $5,882,423 and amounted to 1.8% of net assets.
(d) Rate disclosed is the daily yield on August 31, 2019.
ADR — American Depositary Receipt
PLC — Public Limited Company
REIT — Real Estate Investment Trust
Futures Contracts Purchased
| Number of Contracts | Expiration Date | Notional Amount | Value | Unrealized Appreciation (Depreciation) | |||||||||||||||||||
Mini MSCI EAFE Index Futures | 18 | 9/20/19 | $ | 1,697,168 | $ | 1,659,510 | $ | (37,658 | ) | ||||||||||||||
Total unrealized appreciation | $ | — | |||||||||||||||||||||
Total unrealized depreciation | (37,658 | ) | |||||||||||||||||||||
Total net unrealized appreciation(depreciation) | $ | (37,658 | ) | ||||||||||||||||||||
See notes to financial statements.
43
| Victory Portfolios II VictoryShares USAA MSCI Emerging Markets Value Momentum ETF | Schedule of Portfolio Investments August 31, 2019 | ||||||
Security Description | Shares | Value | |||||||||
Common Stocks (96.5%) | |||||||||||
Brazil (5.4%): | |||||||||||
Communication Services (0.3%): | |||||||||||
TIM Participacoes SA | 152,292 | $ | 453,316 | ||||||||
Consumer Discretionary (0.4%): | |||||||||||
Lojas Renner SA | 37,186 | 454,904 | |||||||||
Magazine Luiza SA | 23,384 | 205,364 | |||||||||
660,268 | |||||||||||
Consumer Staples (1.2%): | |||||||||||
Atacadao SA | 133,347 | 719,626 | |||||||||
JBS SA | 90,152 | 646,654 | |||||||||
Natura Cosmeticos SA | 43,356 | 692,278 | |||||||||
2,058,558 | |||||||||||
Energy (0.2%): | |||||||||||
Cosan SA | 36,200 | 437,936 | |||||||||
Financials (0.7%): | |||||||||||
Banco do Brasil SA | 25,114 | 281,030 | |||||||||
IRB Brasil Resseguros S/A | 32,900 | 863,862 | |||||||||
1,144,892 | |||||||||||
Health Care (0.3%): | |||||||||||
Notre Dame Intermedica Participacoes SA | 34,500 | 468,215 | |||||||||
Industrials (0.2%): | |||||||||||
Localiza Rent a Car SA | 32,500 | 369,972 | |||||||||
Materials (0.6%): | |||||||||||
Companhia Siderurgica Nacional SA | 126,500 | 439,606 | |||||||||
Suzano SA | 30,771 | 216,548 | |||||||||
Vale SA (a) | 27,485 | 303,105 | |||||||||
959,259 | |||||||||||
Real Estate (0.4%): | |||||||||||
BR Malls Participacoes SA | 107,298 | 350,026 | |||||||||
Multiplan Empreendimentos Imobiliarios SA | 65,796 | 413,832 | |||||||||
763,858 | |||||||||||
Utilities (1.1%): | |||||||||||
Centrais Eletricas Brasileiras SA | 41,548 | 461,912 | |||||||||
Companhia de Saneamento Basico do Estado de Sao Paulo | 61,476 | 769,157 | |||||||||
Engie Brasil Energia SA | 53,400 | 581,272 | |||||||||
1,812,341 | |||||||||||
9,128,615 | |||||||||||
Chile (0.7%): | |||||||||||
Consumer Staples (0.7%): | |||||||||||
Companhia Cervecerias Unidas SA | 108,246 | 1,232,111 | |||||||||
See notes to financial statements.
44
| Victory Portfolios II VictoryShares USAA MSCI Emerging Markets Value Momentum ETF | Schedule of Portfolio Investments — continued August 31, 2019 | ||||||
Security Description | Shares | Value | |||||||||
China (21.3%): | |||||||||||
Communication Services (0.8%): | |||||||||||
China Communications Services Corp. Ltd. | 486,457 | $ | 272,553 | ||||||||
China Telecom Corp. Ltd., Class H | 2,413,952 | 1,081,377 | |||||||||
1,353,930 | |||||||||||
Consumer Discretionary (2.7%): | |||||||||||
ANTA Sports Products Ltd. | 48,000 | 398,195 | |||||||||
BAIC Motor Corp. Ltd., Class H (b) | 939,944 | 530,232 | |||||||||
Brilliance China Automotive Holdings Ltd. | 244,000 | 259,404 | |||||||||
Dongfeng Motor Group Co. Ltd., Class H | 876,482 | 814,359 | |||||||||
Great Wall Motor Co. Ltd., Class H | 789,500 | 501,791 | |||||||||
Guangzhou Automobile Group Co. Ltd. | 583,061 | 587,872 | |||||||||
Li Ning Co. Ltd. | 292,000 | 862,731 | |||||||||
Zhongsheng Group Holdings Ltd. | 189,354 | 592,083 | |||||||||
4,546,667 | |||||||||||
Consumer Staples (0.7%): | |||||||||||
Tsingtao Brewery Co. Ltd., Class H | 52,000 | 351,407 | |||||||||
Yihai International Holding Ltd. | 154,000 | 923,762 | |||||||||
1,275,169 | |||||||||||
Energy (0.3%): | |||||||||||
Yanzhou Coal Mining Co. Ltd. | 534,536 | 463,221 | |||||||||
Financials (5.8%): | |||||||||||
Agricultural Bank of China Ltd. | 2,317,640 | 893,294 | |||||||||
Bank of China Ltd. | 2,568,084 | 979,991 | |||||||||
Bank of Communications Co. Ltd., Class H | 1,518,181 | 993,991 | |||||||||
China Cinda Asset Management Co. Ltd. | 3,730,166 | 775,992 | |||||||||
China CITIC Bank Corp. Ltd. | 1,823,619 | 954,244 | |||||||||
China Construction Bank Corp., Class H | 1,246,235 | 925,688 | |||||||||
China Everbright Bank Co. Ltd. | 2,208,633 | 921,750 | |||||||||
China Huarong Asset Management Co. Ltd., Class H (b) | 4,301,714 | 675,287 | |||||||||
China Minsheng Banking Corp. Ltd. | 1,572,288 | 1,035,436 | |||||||||
Chongqing Rural Commercial Bank Co. Ltd. | 1,539,488 | 744,658 | |||||||||
Industrial & Commercial Bank of China Ltd., Class H | 765,038 | 483,315 | |||||||||
Postal Savings Bank of China Co. Ltd., Class H (b) | 661,848 | 398,696 | |||||||||
9,782,342 | |||||||||||
Health Care (2.2%): | |||||||||||
China Resources Pharmaceutical Group Ltd. (b) | 529,137 | 547,009 | |||||||||
Luye Pharma Group Ltd. (b) | 796,529 | 619,100 | |||||||||
Shandong Weigao Group Medical Polymer Co. Ltd., Class H | 770,708 | 795,756 | |||||||||
Shanghai Pharmaceuticals Holding Co. Ltd. | 462,553 | 873,705 | |||||||||
Sihuan Pharmaceutical Holdings Group Ltd. | 2,743,607 | 490,221 | |||||||||
Sinopharm Group Co. Ltd. | 117,852 | 426,414 | |||||||||
3,752,205 | |||||||||||
See notes to financial statements.
45
| Victory Portfolios II VictoryShares USAA MSCI Emerging Markets Value Momentum ETF | Schedule of Portfolio Investments — continued August 31, 2019 | ||||||
Security Description | Shares | Value | |||||||||
Industrials (3.8%): | |||||||||||
China Communications Construction Co. Ltd. | 1,034,005 | $ | 802,357 | ||||||||
China Conch Venture Holdings Ltd. | 142,289 | 473,973 | |||||||||
China Railway Construction Corp. Ltd. | 705,840 | 762,111 | |||||||||
China Railway Group Ltd. | 1,225,872 | 802,609 | |||||||||
COSCO Shipping Energy Transportation Co. Ltd., Class H | 1,558,361 | 883,065 | |||||||||
Country Garden Services Holdings Co. Ltd. | 141,159 | 408,956 | |||||||||
Metallurgical Corp. of China Ltd. | 3,382,132 | 755,388 | |||||||||
Sinopec Engineering Group Co. Ltd., Class H | 984,038 | 643,019 | |||||||||
Sinotrans Ltd. | 972,224 | 313,927 | |||||||||
Weichai Power Co. Ltd. | 405,891 | 621,630 | |||||||||
6,467,035 | |||||||||||
Information Technology (0.8%): | |||||||||||
Lenovo Group Ltd. | 1,010,000 | 665,139 | |||||||||
Xinyi Solar Holdings Ltd. | 1,092,000 | 689,874 | |||||||||
1,355,013 | |||||||||||
Materials (2.3%): | |||||||||||
Angang Steel Co. Ltd. | 1,451,835 | 503,997 | |||||||||
Anhui Conch Cement Co. Ltd., Class H | 59,811 | 337,018 | |||||||||
BBMG Corp. | 1,874,000 | 533,355 | |||||||||
China Hongqiao Group Ltd. | 427,500 | 280,441 | |||||||||
China National Building Material Co. Ltd. | 598,697 | 513,473 | |||||||||
China Oriental Group Co. Ltd. | 760,000 | 300,688 | |||||||||
China Zhongwang Holdings Ltd. | 2,078,967 | 854,368 | |||||||||
Maanshan Iron & Steel Co. Ltd., Class H | 1,436,000 | 538,820 | |||||||||
3,862,160 | |||||||||||
Real Estate (1.4%): | |||||||||||
China Aoyuan Group Ltd. | 154,965 | 182,746 | |||||||||
China Vanke Co. Ltd. | 176,105 | 609,092 | |||||||||
Future Land Development Holdings Ltd. | 208,000 | 164,587 | |||||||||
KWG Property Holding Ltd. | 260,500 | 227,075 | |||||||||
Logan Property Holdings Co. Ltd. | 190,058 | 268,277 | |||||||||
Longfor Group Holdings Ltd. (b) | 163,290 | 582,483 | |||||||||
Sunac China Holdings Ltd. | 92,584 | 371,028 | |||||||||
2,405,288 | |||||||||||
Utilities (0.5%): | |||||||||||
China Power International Development Ltd. | 1,937,000 | 420,262 | |||||||||
Huaneng Renewables Corp. Ltd. (c) | 1,374,820 | 380,756 | |||||||||
801,018 | |||||||||||
36,064,048 | |||||||||||
Greece (1.6%): | |||||||||||
Communication Services (0.6%): | |||||||||||
Hellenic Telecommunications Organization SA | 77,096 | 1,030,709 | |||||||||
Consumer Discretionary (0.0%): (d) | |||||||||||
FF Group (a) (e) | 14,913 | 7,883 | |||||||||
See notes to financial statements.
46
| Victory Portfolios II VictoryShares USAA MSCI Emerging Markets Value Momentum ETF | Schedule of Portfolio Investments — continued August 31, 2019 | ||||||
Security Description | Shares | Value | |||||||||
Financials (1.0%): | |||||||||||
Alpha Bank AE (a) | 311,654 | $ | 559,087 | ||||||||
Eurobank Ergasias SA (a) | 562,573 | 498,724 | |||||||||
National Bank of Greece SA (a) | 180,840 | 525,357 | |||||||||
1,583,168 | |||||||||||
2,621,760 | |||||||||||
Hong Kong (7.6%): | |||||||||||
Communication Services (1.3%): | |||||||||||
Alibaba Pictures Group Ltd. (a) | 3,770,000 | 620,687 | |||||||||
China Mobile Ltd. | 79,000 | 654,859 | |||||||||
China Unicom Hong Kong Ltd. | 878,055 | 875,214 | |||||||||
2,150,760 | |||||||||||
Consumer Discretionary (0.2%): | |||||||||||
Bosideng International Holdings Ltd. | 812,000 | 278,773 | |||||||||
Consumer Staples (0.5%): | |||||||||||
China Agri-Industries Holdings Ltd. | 2,890,606 | 815,310 | |||||||||
Financials (0.3%): | |||||||||||
China Ding Yi Feng Holdings Ltd. (e) | 128,000 | 188,683 | |||||||||
China Everbright Ltd. | 361,067 | 412,432 | |||||||||
601,115 | |||||||||||
Health Care (1.0%): | |||||||||||
Alibaba Health Information Technology Ltd. (a) (f) | 230,000 | 218,101 | |||||||||
China Traditional Chinese Medicine Holdings Co. Ltd. | 1,429,122 | 671,210 | |||||||||
Sino Biopharmaceutical Ltd. | 201,000 | 299,114 | |||||||||
SSY Group Ltd. | 690,547 | 611,638 | |||||||||
1,800,063 | |||||||||||
Industrials (2.0%): | |||||||||||
CITIC Ltd. | 947,703 | 1,123,646 | |||||||||
COSCO Shipping Ports Ltd. | 1,073,464 | 941,209 | |||||||||
Shanghai Industrial Holdings Ltd. | 490,209 | 955,974 | |||||||||
Sinotruk Hong Kong Ltd. | 228,029 | 352,141 | |||||||||
3,372,970 | |||||||||||
Information Technology (0.3%): | |||||||||||
Kingboard Holdings Ltd. | 240,822 | 564,301 | |||||||||
Materials (0.7%): | |||||||||||
China Resources Cement Holdings Ltd. | 653,390 | 579,561 | |||||||||
Nine Dragons Paper Holdings Ltd. | 722,151 | 547,464 | |||||||||
1,127,025 | |||||||||||
Real Estate (0.8%): | |||||||||||
China Resources Land Ltd. | 176,514 | 718,640 | |||||||||
Shimao Property Holdings Ltd. | 94,516 | 267,793 | |||||||||
Yuexiu Property Co. Ltd. | 1,478,000 | 318,789 | |||||||||
1,305,222 | |||||||||||
See notes to financial statements.
47
| Victory Portfolios II VictoryShares USAA MSCI Emerging Markets Value Momentum ETF | Schedule of Portfolio Investments — continued August 31, 2019 | ||||||
Security Description | Shares | Value | |||||||||
Utilities (0.5%): | |||||||||||
Beijing Enterprises Holdings Ltd. | 184,348 | $ | 878,761 | ||||||||
12,894,300 | |||||||||||
Hungary (1.3%): | |||||||||||
Energy (0.6%): | |||||||||||
MOL Hungarian Oil & Gas PLC | 114,236 | 1,120,270 | |||||||||
Health Care (0.7%): | |||||||||||
Richter Gedeon Nyrt | 68,251 | 1,140,873 | |||||||||
2,261,143 | |||||||||||
India (2.3%): | |||||||||||
Energy (0.3%): | |||||||||||
Reliance Industries Ltd., GDR (b) | 15,186 | 526,954 | |||||||||
Health Care (1.1%): | |||||||||||
Dr Reddy's Laboratories Ltd., ADR (g) | 50,922 | 1,820,462 | |||||||||
Information Technology (0.9%): | |||||||||||
Wipro Ltd., ADR (g) | 418,443 | 1,598,452 | |||||||||
3,945,868 | |||||||||||
Indonesia (0.8%): | |||||||||||
Consumer Staples (0.6%): | |||||||||||
PT Indofood Sukses Makmur TBK | 1,896,433 | 1,059,516 | |||||||||
Materials (0.2%): | |||||||||||
PT Indah Kiat Pulp & Paper Corp. TBK | 517,670 | 249,985 | |||||||||
1,309,501 | |||||||||||
Korea, Republic Of (20.0%): | |||||||||||
Communication Services (1.6%): | |||||||||||
Cheil Worldwide, Inc. | 22,712 | 495,023 | |||||||||
LG Uplus Corp. | 68,553 | 747,079 | |||||||||
NCSoft Corp. | 845 | 374,626 | |||||||||
SK Telecom Co. Ltd. | 5,617 | 1,110,647 | |||||||||
2,727,375 | |||||||||||
Consumer Discretionary (3.7%): | |||||||||||
Fila Korea Ltd. | 10,806 | 510,302 | |||||||||
Hankook Tire & Technology Co. Ltd. | 14,580 | 350,883 | |||||||||
Hyundai Department Store Co. Ltd. | 13,503 | 869,543 | |||||||||
Hyundai Mobis Co. Ltd. | 4,091 | 839,309 | |||||||||
Hyundai Motor Co. | 7,776 | 824,946 | |||||||||
Kia Motors Corp. | 26,479 | 955,321 | |||||||||
LG Electronics, Inc. | 13,104 | 663,179 | |||||||||
Lotte Shopping Co. Ltd. | 5,532 | 621,137 | |||||||||
Shinsegae, Inc. | 2,884 | 550,013 | |||||||||
6,184,633 | |||||||||||
See notes to financial statements.
48
| Victory Portfolios II VictoryShares USAA MSCI Emerging Markets Value Momentum ETF | Schedule of Portfolio Investments — continued August 31, 2019 | ||||||
Security Description | Shares | Value | |||||||||
Consumer Staples (2.1%): | |||||||||||
CJ CheilJedang Corp. | 4,872 | $ | 919,093 | ||||||||
E-MART, Inc. | 7,371 | 705,912 | |||||||||
GS Retail Co. Ltd. | 23,433 | 748,695 | |||||||||
KT&G Corp. | 13,693 | 1,153,095 | |||||||||
3,526,795 | |||||||||||
Financials (4.4%): | |||||||||||
BNK Financial Group, Inc. | 188,836 | 1,044,542 | |||||||||
Dongbu Insurance Co. Ltd. | 9,411 | 372,167 | |||||||||
Hana Financial Group, Inc. | 30,716 | 824,165 | |||||||||
Industrial Bank of Korea | 101,019 | 1,034,168 | |||||||||
KB Financial Group, Inc. | 30,115 | 987,051 | |||||||||
Meritz Securities Co. Ltd. | 209,142 | 821,028 | |||||||||
Samsung Securities Co. Ltd. | 17,098 | 498,294 | |||||||||
Shinhan Financial Group Co. Ltd. | 30,143 | 1,014,099 | |||||||||
Woori Financial Group, Inc. | 88,567 | 870,132 | |||||||||
7,465,646 | |||||||||||
Health Care (0.4%): | |||||||||||
Yuhan Corp. | 3,529 | 668,653 | |||||||||
Industrials (3.8%): | |||||||||||
Daelim Industrial Co. Ltd. | 11,599 | 935,581 | |||||||||
Daewoo Engineering & Construction Co. Ltd. (a) | 166,722 | 575,354 | |||||||||
GS Engineering & Construction Corp. | 24,782 | 662,899 | |||||||||
Hanwha Corp. | 42,423 | 858,092 | |||||||||
HDC Hyundai Development Co.-Engineering & Construct | 20,134 | 595,917 | |||||||||
Hyundai Heavy Industries Holdings Co. Ltd. | 2,675 | 732,105 | |||||||||
KCC Corp. | 1,985 | 369,550 | |||||||||
Korean Air Lines Co. Ltd. | 13,358 | 244,828 | |||||||||
LG Corp. | 17,348 | 1,019,754 | |||||||||
Posco International Corp. | 24,561 | 372,090 | |||||||||
6,366,170 | |||||||||||
Information Technology (1.1%): | |||||||||||
LG Display Co. Ltd. (a) | 27,288 | 314,277 | |||||||||
Samsung Electronics Co. Ltd. | 24,445 | 887,992 | |||||||||
SK Hynix, Inc. | 11,071 | 707,447 | |||||||||
1,909,716 | |||||||||||
Materials (1.9%): | |||||||||||
Hanwha Chemical Corp. | 48,626 | 694,514 | |||||||||
Hyundai Steel Co. | 25,453 | 783,816 | |||||||||
Kumho Petrochemical Co. Ltd. | 4,127 | 239,528 | |||||||||
Lotte Chemical Corp. | 3,871 | 719,071 | |||||||||
POSCO | 4,620 | 804,805 | |||||||||
3,241,734 | |||||||||||
See notes to financial statements.
49
| Victory Portfolios II VictoryShares USAA MSCI Emerging Markets Value Momentum ETF | Schedule of Portfolio Investments — continued August 31, 2019 | ||||||
Security Description | Shares | Value | |||||||||
Utilities (1.0%): | |||||||||||
Korea Electric Power Corp. (a) | 43,059 | $ | 908,283 | ||||||||
Korea Gas Corp. | 26,055 | 839,998 | |||||||||
1,748,281 | |||||||||||
33,839,003 | |||||||||||
Luxembourg (0.2%): | |||||||||||
Financials (0.2%): | |||||||||||
Reinet Investments SCA | 25,084 | 418,657 | |||||||||
Malaysia (1.9%): | |||||||||||
Communication Services (0.2%): | |||||||||||
Telekom Malaysia Berhad | 297,800 | 265,545 | |||||||||
Consumer Staples (1.1%): | |||||||||||
PPB Group Berhad | 434,151 | 1,926,348 | |||||||||
Financials (0.3%): | |||||||||||
AMMB Holdings Berhad | 507,800 | 507,136 | |||||||||
Industrials (0.3%): | |||||||||||
AirAsia Group Berhad | 1,249,842 | 531,974 | |||||||||
3,231,003 | |||||||||||
Philippines (0.3%): | |||||||||||
Industrials (0.3%): | |||||||||||
International Container Terminal Services, Inc. | 175,630 | 458,158 | |||||||||
Poland (3.3%): | |||||||||||
Communication Services (1.3%): | |||||||||||
Cyfrowy Polsat SA | 176,744 | 1,294,893 | |||||||||
Orange Polska SA (a) | 602,063 | 966,314 | |||||||||
2,261,207 | |||||||||||
Consumer Staples (0.6%): | |||||||||||
Dino Polska SA (a) (b) | 23,821 | 922,386 | |||||||||
Energy (0.4%): | |||||||||||
Grupa Lotos SA | 34,487 | 747,749 | |||||||||
Materials (0.6%): | |||||||||||
Jastrzebska Spolka Weglowa SA | 45,375 | 339,517 | |||||||||
KGHM Polska Miedz SA (a) | 30,940 | 610,083 | |||||||||
949,600 | |||||||||||
Utilities (0.4%): | |||||||||||
PGE Polska Grupa Energetyczna SA (a) | 342,885 | 665,233 | |||||||||
5,546,175 | |||||||||||
Qatar (1.1%): | |||||||||||
Energy (0.6%): | |||||||||||
Qatar Fuel QSC | 162,440 | 963,467 | |||||||||
Financials (0.3%): | |||||||||||
Qatar Islamic Bank SAQ | 124,372 | 539,597 | |||||||||
See notes to financial statements.
50
| Victory Portfolios II VictoryShares USAA MSCI Emerging Markets Value Momentum ETF | Schedule of Portfolio Investments — continued August 31, 2019 | ||||||
Security Description | Shares | Value | |||||||||
Materials (0.2%): | |||||||||||
Mesaieed Petrochemical Holding Co. | 472,383 | $ | 368,385 | ||||||||
1,871,449 | |||||||||||
Russian Federation (4.3%): | |||||||||||
Communication Services (0.3%): | |||||||||||
Mobile TeleSystems PJSC (g) | 54,623 | 438,623 | |||||||||
Energy (2.7%): | |||||||||||
| Gazprom PJSC | 447,364 | 1,557,054 | |||||||||
LUKOIL PJSC | 8,481 | 684,922 | |||||||||
LUKOIL PJSC | 4,796 | 386,807 | |||||||||
Surgutneftegas PJSC (g) | 306,910 | 1,459,357 | |||||||||
| Tatneft PJSC | 43,356 | 483,026 | |||||||||
4,571,166 | |||||||||||
Financials (0.3%): | |||||||||||
| Sberbank of Russia PJSC (g) | 151,320 | 508,634 | |||||||||
Materials (0.7%): | |||||||||||
| Magnitogorsk Iron & Steel Works PJSC | 1,062,451 | 666,461 | |||||||||
| MMC Norilsk Nickel PJSC | 2,248 | 542,216 | |||||||||
1,208,677 | |||||||||||
Utilities (0.3%): | |||||||||||
Inter RAO UES PJSC | 8,846,029 | 569,716 | |||||||||
7,296,816 | |||||||||||
Singapore (0.6%): | |||||||||||
Industrials (0.6%): | |||||||||||
BOC Aviation Ltd. (b) | 109,395 | 950,794 | |||||||||
South Africa (1.8%): | |||||||||||
Communication Services (0.5%): | |||||||||||
Telkom SA SOC Ltd. | 149,453 | 783,598 | |||||||||
Energy (0.1%): | |||||||||||
Exxaro Resources Ltd. | 26,475 | 237,432 | |||||||||
Materials (0.7%): | |||||||||||
Anglo American Platinum Ltd. | 12,203 | 748,025 | |||||||||
AngloGold Ashanti Ltd. | 13,013 | 296,654 | |||||||||
Kumba Iron Ore Ltd. | 8,163 | 211,271 | |||||||||
1,255,950 | |||||||||||
Real Estate (0.5%): | |||||||||||
Fortress REIT Ltd. | 563,973 | 784,093 | |||||||||
3,061,073 | |||||||||||
Taiwan (3.2%): | |||||||||||
Consumer Discretionary (0.4%): | |||||||||||
Giant Manufacturing Co. Ltd. | 99,000 | 688,682 | |||||||||
See notes to financial statements.
51
| Victory Portfolios II VictoryShares USAA MSCI Emerging Markets Value Momentum ETF | Schedule of Portfolio Investments — continued August 31, 2019 | ||||||
Security Description | Shares | Value | |||||||||
Financials (1.4%): | |||||||||||
Chailease Holding Co. Ltd. | 239,140 | $ | 947,880 | ||||||||
Yuanta Financial Holding Co. Ltd. | 2,384,554 | 1,370,303 | |||||||||
2,318,183 | |||||||||||
Industrials (0.3%): | |||||||||||
Far Eastern New Century Corp. | 595,678 | 540,491 | |||||||||
Information Technology (1.1%): | |||||||||||
Innolux Corp. | 3,825,461 | 854,974 | |||||||||
Nanya Technology Corp. | 167,099 | 374,523 | |||||||||
Realtek Semiconductor Corp. | 103,000 | 705,030 | |||||||||
1,934,527 | |||||||||||
5,481,883 | |||||||||||
Taiwan, Province of China (13.0%): | |||||||||||
Consumer Discretionary (2.0%): | |||||||||||
Feng TAY Enterprise Co. Ltd. | 113,510 | 739,026 | |||||||||
Hotai Motor Co. Ltd. | 63,000 | 887,536 | |||||||||
Pou Chen Corp. | 1,065,000 | 1,329,131 | |||||||||
Ruentex Industries Ltd. | 189,000 | 419,398 | |||||||||
3,375,091 | |||||||||||
Financials (6.4%): | |||||||||||
Chang Hwa Commercial Bank Ltd. | 1,351,000 | 868,838 | |||||||||
E.Sun Financial Holding Co. Ltd. | 2,300,455 | 1,849,299 | |||||||||
Hua Nan Financial Holdings Co. Ltd. | 2,987,163 | 1,897,291 | |||||||||
Mega Financial Holding Co. Ltd. | 773,000 | 707,537 | |||||||||
Sinopac Financial Holdings Co. Ltd. | 4,087,965 | 1,542,260 | |||||||||
Taiwan Business Bank | 4,974,241 | 1,947,888 | |||||||||
Taiwan Cooperative Financial Holding Co. Ltd. | 3,127,970 | 1,991,703 | |||||||||
10,804,816 | |||||||||||
Industrials (0.4%): | |||||||||||
Taiwan High Speed Rail Corp. | 569,000 | 686,568 | |||||||||
Information Technology (2.6%): | |||||||||||
Chicony Electronics Co. Ltd. | 217,000 | 609,341 | |||||||||
Foxconn Technology Co. Ltd. | 513,000 | 1,035,473 | |||||||||
Lite-On Technology Corp. | 296,000 | 471,187 | |||||||||
Novatek Microelectronics Corp. | 70,000 | 414,518 | |||||||||
Walsin Technology Corp. | 71,855 | 361,448 | |||||||||
Wistron Corp. | 642,000 | 508,940 | |||||||||
Yageo Corp. | 27,467 | 198,504 | |||||||||
Zhen Ding Technology Holding Ltd. | 228,000 | 842,025 | |||||||||
4,441,436 | |||||||||||
Materials (1.2%): | |||||||||||
Asia Cement Corp. | 717,500 | 982,251 | |||||||||
Taiwan Cement Corp. | 839,572 | 1,027,747 | |||||||||
2,009,998 | |||||||||||
See notes to financial statements.
52
| Victory Portfolios II VictoryShares USAA MSCI Emerging Markets Value Momentum ETF | Schedule of Portfolio Investments — continued August 31, 2019 | ||||||
Security Description | Shares | Value | |||||||||
Real Estate (0.4%): | |||||||||||
Highwealth Construction Corp. | 403,000 | $ | 635,100 | ||||||||
21,953,009 | |||||||||||
Thailand (4.0%): | |||||||||||
Consumer Staples (0.9%): | |||||||||||
Charoen Pokphand Foods PCL | 497,100 | 479,662 | |||||||||
Thai Union Group PCL | 1,879,900 | 1,069,924 | |||||||||
1,549,586 | |||||||||||
Industrials (1.0%): | |||||||||||
BTS Group Holdings PCL | 3,884,600 | 1,715,335 | |||||||||
Utilities (2.1%): | |||||||||||
Electricity Generating PCL | 137,400 | 1,510,063 | |||||||||
Ratch Group PCL | 796,300 | 1,914,402 | |||||||||
3,424,465 | |||||||||||
6,689,386 | |||||||||||
Turkey (1.2%): | |||||||||||
Financials (0.8%): | |||||||||||
Haci Omer Sabanci Holding AS | 252,014 | 379,346 | |||||||||
Turkiye Garanti Bankasi AS (a) | 178,117 | 272,086 | |||||||||
Turkiye Is Bankasi AS (a) | 774,545 | 732,502 | |||||||||
1,383,934 | |||||||||||
Industrials (0.4%): | |||||||||||
Turk Hava Yollari AO (a) (f) | 317,704 | 616,187 | |||||||||
2,000,121 | |||||||||||
United Arab Emirates (0.6%): | |||||||||||
Financials (0.6%): | |||||||||||
Abu Dhabi Commercial Bank PJSC | 417,067 | 986,705 | |||||||||
United States (0.0%): (d) | |||||||||||
Consumer Discretionary (0.0%): (d) | |||||||||||
Trans World Entertainment Corp. (a) | 1 | 2 | |||||||||
Total Common Stocks (Cost $181,006,458) | 163,241,580 | ||||||||||
Preferred Stocks (2.1%) | |||||||||||
Brazil (1.5%): | |||||||||||
Communication Services (0.7%): | |||||||||||
Telefonica Brasil SA | 89,936 | 1,168,110 | |||||||||
Consumer Staples (0.4%): | |||||||||||
Companhia Brasileira de Distribuicao | 35,080 | 743,334 | |||||||||
Utilities (0.4%): | |||||||||||
Companhia Energetica de Minas Gerais, ADR | 161,171 | 575,695 | |||||||||
2,487,139 | |||||||||||
See notes to financial statements.
53
| Victory Portfolios II VictoryShares USAA MSCI Emerging Markets Value Momentum ETF | Schedule of Portfolio Investments — continued August 31, 2019 | ||||||
Security Description | Shares | Value | |||||||||
Colombia (0.4%): | |||||||||||
Financials (0.4%): | |||||||||||
Bancolombia SA | 48,356 | $ | 603,426 | ||||||||
Korea, Republic Of (0.2%): | |||||||||||
Materials (0.2%): | |||||||||||
LG Chem, Ltd. | 2,477 | 368,098 | |||||||||
Total Preferred Stocks (Cost $3,224,052) | 3,458,663 | ||||||||||
Rights (0.0%) (d) | |||||||||||
Brazil (0.0%): (d) | |||||||||||
Consumer Discretionary (0.0%): (d) | |||||||||||
B2W Companhia Digital Expires 09/23/19 @ $0.00 (a) | 2,593 | 5,140 | |||||||||
Total Rights (Cost $—) | 5,140 | ||||||||||
Collateral for Securities Loaned^ (0.3%) | |||||||||||
United States (0.3%): | |||||||||||
BlackRock Liquidity Funds TempFund Portfolio, Institutional Class, 2.15% (h) | 123,894 | 123,894 | |||||||||
Fidelity Investments Money Market Government Portfolio, Class I, 2.03% (h) | 169,027 | 169,027 | |||||||||
Fidelity Investments Prime Money Market Portfolio, Class I, 2.10% (h) | 4,144 | 4,144 | |||||||||
| Goldman Sachs Financial Square Prime Obligations Fund, Institutional Class, 2.20% (h) | 78,453 | 78,453 | |||||||||
JPMorgan Prime Money Market Fund, Capital Class, 2.15% (h) | 82,588 | 82,588 | |||||||||
| Morgan Stanley Institutional Liquidity Prime Portfolio, Institutional Class, 2.17% (h) | 134,199 | 134,199 | |||||||||
Total Collateral for Securities Loaned (Cost $592,305) | 592,305 | ||||||||||
Total Investments (Cost $184,822,815) — 98.9% | 167,297,688 | ||||||||||
Other assets in excess of liabilities — 1.1% | 1,753,764 | ||||||||||
NET ASSETS — 100.00% | $ | 169,051,452 | |||||||||
^ Purchased with cash collateral from securities on loan.
(a) Non-income producing security.
(b) Rule 144A security or other security that is restricted as to resale to institutional investors. The Fund's Adviser has deemed this security to be liquid based upon procedures approved by the Board of Trustees. As of August 31, 2019, the fair value of these securities was $5,752,941 and amounted to 3.4% of net assets.
(c) Security was fair valued based upon procedures approved by the Board of Trustees and represents 0.2% of the Fund's net assets as of August 31, 2019.
(d) Amount represents less than 0.05% of net assets.
(e) Security was fair valued based upon procedures approved by the Board of Trustees and represents 0.1% of the Fund's net assets as of August 31, 2019. This security is classified as Level 3 within the fair value hierarchy and is deemed to be illiquid by the Fund's Adviser. (See Note 2)
(f) All or a portion of this security is on loan.
(g) All or a portion of this security has been segregated as collateral for derivative instruments.
(h) Rate disclosed is the daily yield on August 31, 2019.
See notes to financial statements.
54
| Victory Portfolios II VictoryShares USAA MSCI Emerging Markets Value Momentum ETF | Schedule of Portfolio Investments — continued August 31, 2019 | ||||||
ADR — American Depositary Receipt
GDR — Global Depository Receipt
PCL — Public Company Limited
PLC — Public Limited Company
REIT — Real Estate Investment Trust
Futures Contracts Purchased
| Number of Contracts | Expiration Date | Notional Amount | Value | Unrealized Appreciation (Depreciation) | |||||||||||||||||||
| Mini MSCI Emerging Markets Index Futures | 46 | 9/20/19 | $ | 2,271,125 | $ | 2,263,200 | $ | (7,925 | ) | ||||||||||||||
Total unrealized appreciation | $ | — | |||||||||||||||||||||
Total unrealized depreciation | (7,925 | ) | |||||||||||||||||||||
Total net unrealized appreciation(depreciation) | $ | (7,925 | ) | ||||||||||||||||||||
See notes to financial statements.
55
Victory Portfolios II | Statements of Assets and Liabilities August 31, 2019 | ||||||
| VictoryShares USAA MSCI USA Value Momentum ETF | VictoryShares USAA MSCI USA Small Cap Value Momentum ETF | ||||||||||
ASSETS: | |||||||||||
| Investments, at value (Cost $456,107,114 and $99,721,396) | $ | 465,819,701 | $ | 100,806,559 | (a) | ||||||
Cash and cash equivalents | 1,541,065 | 633,027 | |||||||||
Deposits with brokers for futures contracts | 307,679 | 81,257 | |||||||||
Interest and dividends receivable | 862,228 | 99,729 | |||||||||
Receivable for investments sold | — | 37,603 | |||||||||
Receivable from Adviser | 2,978 | 1,515 | |||||||||
Total Assets | 468,533,651 | 101,659,690 | |||||||||
LIABILITIES: | |||||||||||
Payables: | |||||||||||
Collateral received on loaned securities | — | 66,941 | |||||||||
Variation margin payable on open futures contracts | 979 | 1,299 | |||||||||
Accrued expenses and other payables: | |||||||||||
Investment advisory fees | 59,328 | 13,134 | |||||||||
Administration fees | 11,168 | 4,061 | |||||||||
Custodian fees | 4,641 | 3,830 | |||||||||
Chief Compliance Officer fees | 117 | 78 | |||||||||
Other accrued expenses | 12,849 | 6,523 | |||||||||
Total Liabilities | 89,082 | 95,866 | |||||||||
NET ASSETS: | |||||||||||
Capital | 489,775,065 | 110,708,907 | |||||||||
Total distributable earnings/(loss) | (21,330,496 | ) | (9,145,083 | ) | |||||||
Net Assets | $ | 468,444,569 | $ | 101,563,824 | |||||||
Shares Outstanding (unlimited shares authorized, no par value): | 9,300,000 | 2,050,000 | |||||||||
Net asset value: | $ | 50.37 | $ | 49.54 | |||||||
(a) Includes $70,305 of securities on loan.
See notes to financial statements.
56
Victory Portfolios II | Statements of Assets and Liabilities August 31, 2019 | ||||||
| VictoryShares USAA MSCI International Value Momentum ETF | VictoryShares USAA MSCI Emerging Markets Value Momentum ETF | ||||||||||
ASSETS: | |||||||||||
| Investments, at value (Cost $332,723,687 and $184,822,815) | $ | 323,613,450 | (a) | $ | 167,297,688 | (b) | |||||
Foreign currency, at value (Cost $769,426 and $1,220,558) | 769,338 | 1,213,569 | |||||||||
Cash and cash equivalents | 1,439,534 | 65,986 | |||||||||
Deposits with brokers for futures contracts | 145,729 | 205,411 | |||||||||
Interest and dividends receivable | 792,352 | 425,034 | |||||||||
Receivable for investments sold | 2,142,225 | 2,219,704 | |||||||||
Variation margin receivable on open futures contracts | 7,560 | 17,932 | |||||||||
Reclaims receivable | 270,903 | 1,790 | |||||||||
Receivable from Adviser | — | 632 | |||||||||
Total Assets | 329,181,091 | 171,447,746 | |||||||||
LIABILITIES: | |||||||||||
Payables: | |||||||||||
Collateral received on loaned securities | 2,547,586 | 592,305 | |||||||||
Line of credit | — | 700,000 | |||||||||
Investments purchased | 2,837,848 | 935,145 | |||||||||
Accrued foreign capital gains taxes | — | 96,358 | |||||||||
Accrued expenses and other payables: | |||||||||||
Investment advisory fees | 69,141 | 42,532 | |||||||||
Administration fees | 8,322 | 5,207 | |||||||||
Custodian fees | 14,592 | 17,341 | |||||||||
Chief Compliance Officer fees | 251 | 41 | |||||||||
Other accrued expenses | 10,387 | 7,365 | |||||||||
Total Liabilities | 5,488,127 | 2,396,294 | |||||||||
NET ASSETS: | |||||||||||
Capital | 378,016,137 | 207,156,813 | |||||||||
Total distributable earnings/(loss) | (54,323,173 | ) | (38,105,361 | ) | |||||||
Net Assets | $ | 323,692,964 | $ | 169,051,452 | |||||||
Shares Outstanding (unlimited shares authorized, no par value): | 7,500,000 | 4,100,000 | |||||||||
Net asset value: | $ | 43.16 | $ | 41.23 | |||||||
(a) Includes $2,458,083 of securities on loan.
(b) Includes $546,429 of securities on loan.
See notes to financial statements.
57
Victory Portfolios II | Statements of Operations For the Year Ended August 31, 2019 | ||||||
| VictoryShares USAA MSCI USA Value Momentum ETF | VictoryShares USAA MSCI USA Small Cap Value Momentum ETF | ||||||||||
Investment Income: | |||||||||||
Dividends | $ | 9,109,878 | $ | 2,002,697 | |||||||
Interest | 10,168 | 1,788 | |||||||||
Foreign tax withholding | (1,367 | ) | (1,138 | ) | |||||||
Total Income | 9,118,679 | 2,003,347 | |||||||||
Expenses: | |||||||||||
Management fees | 502,661 | 107,833 | |||||||||
Administration and operating service fees | 335,108 | 107,833 | |||||||||
Investment advisory fees | 119,526 | 26,918 | |||||||||
Administration fees | 50,320 | 14,030 | |||||||||
Custodian fees | 4,641 | 3,830 | |||||||||
Servicing fees | 683 | 683 | |||||||||
Trustees' fees | 8,448 | 2,305 | |||||||||
Chief Compliance Officer fees | 412 | 144 | |||||||||
Legal and audit fees | 8,894 | 3,059 | |||||||||
Other expenses | 4,101 | 2,967 | |||||||||
Total Expenses | 1,034,794 | 269,602 | |||||||||
Management fee waiver | (167,554 | ) | (35,944 | ) | |||||||
Expenses waived/reimbursed by Adviser | (37,604 | ) | (9,112 | ) | |||||||
Net Expenses | 829,636 | 224,546 | |||||||||
Net Investment Income (Loss) | 8,289,043 | 1,778,801 | |||||||||
Realized/Unrealized Gains (Losses) from Investments: | |||||||||||
Net realized gains (losses) from investment securities | (29,947,697 | ) | (9,508,434 | ) | |||||||
Net realized gains (losses) from futures contracts | (70,530 | ) | (23,882 | ) | |||||||
Net realized gains (losses) from in-kind redemptions | 10,547,585 | 2,810,015 | |||||||||
| Net change in unrealized appreciation/depreciation on investment securities | (6,904,193 | ) | (4,525,250 | ) | |||||||
| Net change in unrealized appreciation/depreciation on futures contracts | 23,232 | (14,159 | ) | ||||||||
Net realized/unrealized gains (losses) on investments | (26,351,603 | ) | (11,261,710 | ) | |||||||
Change in net assets resulting from operations | $ | (18,062,560 | ) | $ | (9,482,909 | ) | |||||
See notes to financial statements.
58
Victory Portfolios II | Statements of Operations For the Year Ended August 31, 2019 | ||||||
| VictoryShares USAA MSCI International Value Momentum ETF | VictoryShares USAA MSCI Emerging Markets Value Momentum ETF | ||||||||||
Investment Income: | |||||||||||
Dividends | $ | 10,868,429 | $ | 6,493,945 | |||||||
Interest | 48,757 | 39,856 | |||||||||
Securities lending (net of fees) | 16,059 | — | |||||||||
Foreign tax withholding | (1,007,953 | ) | (712,260 | ) | |||||||
Total Income | 9,925,292 | 5,821,541 | |||||||||
Expenses: | |||||||||||
Management fees | 626,043 | 416,701 | |||||||||
Administration and operating service fees | 375,626 | 277,801 | |||||||||
Investment advisory fees | 139,315 | 88,457 | |||||||||
Administration fees | 36,039 | 20,672 | |||||||||
Custodian fees | 14,592 | 23,424 | |||||||||
Servicing fees | 683 | 683 | |||||||||
Trustees' fees | 6,208 | 3,680 | |||||||||
Chief Compliance Officer fees | 458 | 156 | |||||||||
Legal and audit fees | 6,781 | 4,362 | |||||||||
Other expenses | 3,499 | 5,627 | |||||||||
Total Expenses | 1,209,244 | 841,563 | |||||||||
Management fee waiver | (125,209 | ) | (69,450 | ) | |||||||
Expenses waived/reimbursed by Adviser | (19,771 | ) | (11,156 | ) | |||||||
Net Expenses | 1,064,264 | 760,957 | |||||||||
Net Investment Income (Loss) | 8,861,028 | 5,060,584 | |||||||||
Realized/Unrealized Gains (Losses) from Investments: | |||||||||||
| Net realized gains (losses) from investment securities and foreign currency translations | (34,883,027 | ) | (14,721,517 | ) | |||||||
Foreign taxes on realized gains | — | (89,999 | ) | ||||||||
Net realized gains (losses) from futures contracts | (14,052 | ) | (93,727 | ) | |||||||
Net realized gains (losses) from in-kind redemptions | 156,989 | — | |||||||||
| Net change in unrealized appreciation/depreciation on investment securities and foreign currency translations | 950,056 | (3,462,393 | ) | ||||||||
| Net change in unrealized appreciation/depreciation on futures contracts | (37,658 | ) | (7,925 | ) | |||||||
Net change in accrued foreign taxes on unrealized gains | — | (3,545 | ) | ||||||||
Net realized/unrealized gains (losses) on investments | (33,827,692 | ) | (18,379,106 | ) | |||||||
Change in net assets resulting from operations | $ | (24,966,664 | ) | $ | (13,318,522 | ) | |||||
See notes to financial statements.
59
Victory Portfolios II | Statements of Changes in Net Assets | ||||||
| VictoryShares USAA MSCI USA Value Momentum ETF | VictoryShares USAA MSCI USA Small Cap Value Momentum ETF | ||||||||||||||||||
| Year Ended August 31, 2019 | For the Period October 24, 2017(a) through August 31, 2018 (000's) | Year Ended August 31, 2019 | For the Period October 24, 2017(a) through August 31, 2018 (000's) | ||||||||||||||||
From Investment Activities: | |||||||||||||||||||
Operations: | |||||||||||||||||||
Net investment income (loss) | $ | 8,289,043 | $ | 3,617 | $ | 1,778,801 | $ | 415 | |||||||||||
| Net realized gains (losses) from investments | (19,470,642 | ) | (3,831 | ) | (6,722,301 | ) | 896 | ||||||||||||
| Net change in unrealized appreciation/depreciation on investments | (6,880,961 | ) | 16,616 | (4,539,409 | ) | 5,610 | |||||||||||||
| Change in net assets resulting from operations | (18,062,560 | ) | 16,402 | (9,482,909 | ) | 6,921 | |||||||||||||
| Change in net assets resulting from distributions to shareholders (b) | (7,198,442 | ) | (1,868 | ) | (1,357,525 | ) | (190 | ) | |||||||||||
| Change in net assets resulting from capital transactions | 95,201,128 | 383,870 | 40,887,570 | 64,786 | |||||||||||||||
Change in net assets | 69,940,126 | 398,404 | 30,047,136 | 71,517 | |||||||||||||||
Net Assets: | |||||||||||||||||||
Beginning of period | 398,504,443 | 100 | 71,516,688 | — | |||||||||||||||
End of period | $ | 468,444,569 | $ | 398,504 | $ | 101,563,824 | $ | 71,517 | |||||||||||
Capital Transactions: | |||||||||||||||||||
Proceeds from shares issued | 156,763,683 | 383,970 | 53,138,254 | 73,368 | |||||||||||||||
Cost of shares redeemed | (61,562,555 | ) | (100 | ) | (12,250,684 | ) | (8,582 | ) | |||||||||||
| Change in net assets resulting from capital transactions | 95,201,128 | 383,870 | 40,887,570 | 64,786 | |||||||||||||||
Share Transactions: | |||||||||||||||||||
Issued | 3,150,000 | 7,400 | 1,050,000 | 1,400 | |||||||||||||||
Redeemed | (1,250,000 | ) | (2 | ) | (250,000 | ) | (150 | ) | |||||||||||
Change in Shares | 1,900,000 | 7,398 | 800,000 | 1,250 | |||||||||||||||
(a) Commencement of operations. Prior period is presented in thousands.
(b) Current and prior year distributions to shareholders have been reclassified and conform to amended GAAP presentation under Regulation S-X (See Item 8 in the Notes to Financial Statements).
See notes to financial statements.
60
Victory Portfolios II | Statements of Changes in Net Assets | ||||||
| VictoryShares USAA MSCI International Value Momentum ETF | VictoryShares USAA MSCI Emerging Markets Value Momentum ETF | ||||||||||||||||||
| Year Ended August 31, 2019 | For the Period October 24, 2017(a) through August 31, 2018 (000's) | Year Ended August 31, 2019 | For the Period October 24, 2017(a) through August 31, 2018 (000's) | ||||||||||||||||
From Investment Activities: | |||||||||||||||||||
Operations: | |||||||||||||||||||
Net investment income (loss) | $ | 8,861,028 | $ | 5,054 | $ | 5,060,584 | $ | 2,675 | |||||||||||
| Net realized gains (losses) from investments | (34,740,090 | ) | (12,121 | ) | (14,905,243 | ) | (9,086 | ) | |||||||||||
| Net change in unrealized appreciation/depreciation on investments | 912,398 | (10,067 | ) | (3,473,863 | ) | (14,078 | ) | ||||||||||||
| Change in net assets resulting from operations | (24,966,664 | ) | (17,134 | ) | (13,318,522 | ) | (20,489 | ) | |||||||||||
| Change in net assets resulting from distributions to shareholders (b) | (8,527,397 | ) | (3,553 | ) | (3,550,809 | ) | (747 | ) | |||||||||||
| Change in net assets resulting from capital transactions | 49,350,829 | 328,523 | 30,946,414 | 176,210 | |||||||||||||||
Change in net assets | 15,856,768 | 307,836 | 14,077,083 | 154,974 | |||||||||||||||
Net Assets: | |||||||||||||||||||
Beginning of period | 307,836,196 | — | 154,974,369 | — | |||||||||||||||
End of period | $ | 323,692,964 | $ | 307,836 | $ | 169,051,452 | $ | 154,974 | |||||||||||
Capital Transactions: | |||||||||||||||||||
Proceeds from shares issued | 55,562,743 | 328,523 | 30,946,414 | 176,210 | (c) | ||||||||||||||
Cost of shares redeemed | (6,211,914 | ) | — | — | — | ||||||||||||||
| Change in net assets resulting from capital transactions | 49,350,829 | 328,523 | 30,946,414 | 176,210 | |||||||||||||||
Share Transactions: | |||||||||||||||||||
Issued | 1,250,000 | 6,400 | 700,000 | 3,400 | |||||||||||||||
Redeemed | (150,000 | ) | — | — | — | ||||||||||||||
Change in Shares | 1,100,000 | 6,400 | 700,000 | 3,400 | |||||||||||||||
(a) Commencement of operations. Prior period is presented in thousands.
(b) Current and prior year distributions to shareholders have been reclassified and conform to amended GAAP presentation under Regulation S-X (See Item 8 in the Notes to Financial Statements).
(c) Includes $330 thousand of variable fees.
See notes to financial statements.
61
Victory Portfolios II | Financial Highlights | ||||||
For a Share Outstanding Throughout Each Period
Investment Activities | Distributions to Shareholders From | ||||||||||||||||||||||||||
| Net Asset Value, Beginning of Period | Net Investment Income (Loss)(a) | Net Realized and Unrealized Gains (Losses) on Investments | Total from Investment Activities | Net Investment Income | Total Distributions to Shareholders | ||||||||||||||||||||||
VictoryShares USAA MSCI USA Value Momentum ETF | |||||||||||||||||||||||||||
Year Ended 8/31/19 | $ | 53.85 | 1.00 | (3.59 | ) | (2.59 | ) | (0.89 | ) | (0.89 | ) | ||||||||||||||||
| 10/24/17(e) through 8/31/18 | $ | 50.19 | 0.78 | 3.34 | 4.12 | (0.46 | ) | (0.46 | ) | ||||||||||||||||||
VictoryShares USAA MSCI USA Small Cap Value Momentum ETF | |||||||||||||||||||||||||||
Year Ended 8/31/19 | $ | 57.21 | 1.00 | (7.86 | ) | (6.86 | ) | (0.81 | ) | (0.81 | ) | ||||||||||||||||
| 10/24/17(e) through 8/31/18 | $ | 50.13 | 0.57 | 6.81 | 7.38 | (0.30 | ) | (0.30 | ) | ||||||||||||||||||
(a) Per share net investment income (loss) has been calculated using the average daily shares method.
(b) Not annualized for periods less than one year.
(c) Annualized for periods less than one year.
(d) Excludes impact of in-kind transactions.
(e) Commencement of operations.
See notes to financial statements.
62
Victory Portfolios II | Financial Highlights — continued | ||||||
For a Share Outstanding Throughout Each Period
Ratio to Average Net Assets | Supplemental Data | ||||||||||||||||||||||||||||||
| Net Asset Value, End of Period | Total Return(b) | Net Expenses(c) | Net Investment Income (Loss)(c) | Gross Expenses(c) | Net Assets, End of Period (000's) | Portfolio Turnover(b)(d) | |||||||||||||||||||||||||
VictoryShares USAA MSCI USA Value Momentum ETF | |||||||||||||||||||||||||||||||
Year Ended 8/31/19 | $ | 50.37 | (4.79 | )% | 0.20 | % | 2.00 | % | 0.25 | % | $ | 468,445 | 87 | % | |||||||||||||||||
| 10/24/17(e) through 8/31/18 | $ | 53.85 | 8.23 | % | 0.20 | % | 1.76 | % | 0.25 | % | $ | 398,504 | 84 | % | |||||||||||||||||
VictoryShares USAA MSCI USA Small Cap Value Momentum ETF | |||||||||||||||||||||||||||||||
Year Ended 8/31/19 | $ | 49.54 | (11.99 | )% | 0.25 | % | 1.98 | % | 0.30 | % | $ | 101,564 | 88 | % | |||||||||||||||||
| 10/24/17(e) through 8/31/18 | $ | 57.21 | 14.80 | % | 0.25 | % | 1.25 | % | 0.30 | % | $ | 71,517 | 81 | % | |||||||||||||||||
See notes to financial statements.
63
Victory Portfolios II | Financial Highlights | ||||||
For a Share Outstanding Throughout Each Period
Investment Activities | Distributions to Shareholders From | ||||||||||||||||||||||||||
| Net Asset Value, Beginning of Period | Net Investment Income (Loss)(a) | Net Realized and Unrealized Gains (Losses) on Investments | Total from Investment Activities | Net Investment Income | Total Distributions to Shareholders | ||||||||||||||||||||||
VictoryShares USAA MSCI International Value Momentum ETF | |||||||||||||||||||||||||||
Year Ended 8/31/19 | $ | 48.10 | 1.30 | (4.99 | ) | (3.69 | ) | (1.25 | ) | (1.25 | ) | ||||||||||||||||
| 10/24/17(d) through 8/31/18 | $ | 50.08 | 1.34 | (2.64 | ) | (1.30 | ) | (0.68 | ) | (0.68 | ) | ||||||||||||||||
VictoryShares USAA MSCI Emerging Markets Value Momentum ETF | |||||||||||||||||||||||||||
Year Ended 8/31/19 | $ | 45.58 | 1.31 | (4.73 | ) | (3.42 | ) | (0.93 | ) | (0.93 | ) | ||||||||||||||||
| 10/24/17(d) through 8/31/18 | $ | 49.95 | 1.17 | (5.10 | ) | (3.93 | ) | (0.44 | ) | (0.44 | ) | ||||||||||||||||
(a) Per share net investment income (loss) has been calculated using the average daily shares method.
(b) Not annualized for periods less than one year.
(c) Annualized for periods less than one year.
(d) Commencement of operations.
(e) Excludes impact of in-kind transactions.
See notes to financial statements.
64
Victory Portfolios II | Financial Highlights — continued | ||||||
For a Share Outstanding Throughout Each Period
Ratio to Average Net Assets | Supplemental Data | ||||||||||||||||||||||||||||||
| Net Asset Value, End of Period | Total Return(b) | Net Expenses(c) | Net Investment Income (Loss)(c) | Gross Expenses(c) | Net Assets, End of Period (000's) | Portfolio Turnover(b)(e) | |||||||||||||||||||||||||
VictoryShares USAA MSCI International Value Momentum ETF | |||||||||||||||||||||||||||||||
Year Ended 8/31/19 | $ | 43.16 | (7.70 | )% | 0.35 | % | 2.90 | % | 0.40 | % | $ | 323,693 | 87 | % | |||||||||||||||||
| 10/24/17(d) through 8/31/18 | $ | 48.10 | (2.64 | )% | 0.35 | % | 3.12 | % | 0.40 | % | $ | 307,836 | 65 | % | |||||||||||||||||
VictoryShares USAA MSCI Emerging Markets Value Momentum ETF | |||||||||||||||||||||||||||||||
Year Ended 8/31/19 | $ | 41.23 | (7.62 | )% | 0.45 | % | 3.00 | % | 0.50 | % | $ | 169,051 | 67 | % | |||||||||||||||||
| 10/24/17(d) through 8/31/18 | $ | 45.58 | (7.95 | )% | 0.45 | % | 2.77 | % | 0.50 | % | $ | 154,974 | 58 | % | |||||||||||||||||
See notes to financial statements.
65
Victory Portfolios II | Notes to Financial Statements August 31, 2019 | ||||||
1. Organization:
Victory Portfolios II (the "Trust") was organized on April 11, 2012 as a Delaware statutory trust, as a successor to the "Compass EMP Funds Trust". The Trust is registered under the Investment Company Act of 1940, as amended (the "1940 Act"), as an open-end investment company. The Trust is currently comprised of 26 funds, 24 of which are exchange-traded funds ("ETFs"), and is authorized to issue an unlimited number of shares, which are units of beneficial interest with no par value. Each Fund is classified as diversified under the 1940 Act.
The accompanying financial statements are those of the following four Funds (collectively, the "Funds" and individually, a "Fund"). These Funds have been newly formed for the purposes of completing the reorganizations ("Reorganizations") with the four corresponding series of USAA ETF Trust ("USAA Trust"), a registered investment company (each such series, a "USAA Fund" or a "Predecessor Fund"), as follows:
Predecessor Fund Name | Fund Legal Name | Fund Short Name | |||||||||
| USAA MSCI USA Value Momentum Blend Index ETF | VictoryShares USAA MSCI USA Value Momentum ETF | USAA MSCI USA Value Momentum ETF | |||||||||
| USAA MSCI USA Small Cap Value Momentum Blend Index ETF | VictoryShares USAA MSCI USA Small Cap Value Momentum ETF | USAA MSCI USA Small Cap Value Momentum ETF | |||||||||
| USAA MSCI International Value Momentum Blend Index ETF | VictoryShares USAA MSCI International Value Momentum ETF | USAA MSCI International Value Momentum ETF | |||||||||
| USAA MSCI Emerging Markets Value Momentum Blend Index ETF | VictoryShares USAA MSCI Emerging Markets Value Momentum ETF | USAA MSCI Emerging Markets Value Momentum ETF | |||||||||
On April 18, 2019, shareholders of the USAA ETF Trust voted to approve the Agreement and Plan of Reorganization (the "Agreement"), which provided for the Reorganization of the Predecessor Funds into the Funds.
The Funds commenced operation on July 1, 2019, upon the completion of the Reorganizations and each Fund is the accounting successor of its respective Predecessor Fund. The Funds assumed the performance, financial and other historical information of the Predecessor Funds. Information presented for periods prior to the date of these financial statements reflects, where applicable, the historical information of the Predecessor Funds.
On November 6, 2018, United Services Automobile Association (USAA), the parent company of USAA Asset Management Company ("AMCO"), the investment adviser of the Predecessor Funds, announced that AMCO would be acquired by Victory Capital Holdings Inc., a global investment management firm headquartered in Cleveland, Ohio (the "Transaction"), on July 1, 2019. Effective July 1, 2019, Victory Capital Management Inc.'s internal investment team, Victory Solutions, began managing the Fund's net assets.
Under the Trust's organizational documents, its officers and trustees are indemnified against certain liabilities arising out of the performance of their duties to the Funds. In addition, in the normal course of business, the Funds enter into contracts with their vendors and others that provide for general indemnifications. The Funds' maximum exposure under these arrangements is unknown, as this would involve future claims that may be made against the Funds. However, based on experience, the Funds expect that risk of loss to be remote.
2. Significant Accounting Policies:
Shares of the Funds are listed and traded on NYSE Arca, Inc ("Exchange"). The Funds will issue and redeem shares of a Fund ("Shares") at net asset value ("NAV") only in aggregations of 50,000 Shares (each a "Creation Unit"). The Funds will issue and redeem Creation Units principally in exchange for a basket of securities included in the respective Fund's Index (the "Deposit Securities"), together with the deposit of a specified cash payment (the "Cash Component"), plus a transaction fee. Shares will trade on the Exchange at market prices that may be below, at, or above NAV. Shares of a Fund may
66
Victory Portfolios II | Notes to Financial Statements — continued August 31, 2019 | ||||||
only be purchased or redeemed by certain financial institutions ("Authorized Participants"). An Authorized Participant is either (i) a broker-dealer or other participant in the clearing process through the Continuous Net Settlement System of the National Securities Clearing Corporation or (ii) a DTC participant and, in each case, must have executed a Participant Agreement with the Distributor. Most retail investors do not qualify as Authorized Participants nor have the resources to buy and sell whole Creation Units. Therefore, they are unable to purchase or redeem the shares directly from a Fund. In addition, shares may be issued in advance of receipt of Deposit Securities subject to various conditions, including a requirement to maintain on deposit with the Trust cash equal to up to 105% of the market value of the missing Deposit Securities. In each instance of such cash creations or redemptions, transaction fees may be imposed and may be higher than the transaction fees associated with in-kind creations or redemptions.
Each Fund may issue an unlimited number of shares of beneficial interest, with no par value. Shares of each Fund have equal rights and privileges. A purchase (i.e., creation) transaction fee is imposed for the transfer and other transactional costs associated with the purchase of Creation Units.
A purchase (i.e., creation) transaction fee is imposed for the transfer and other transactional costs associated with the purchase of Creation Units. In addition, a variable fee may be charged on all cash transactions or substitutes for Creation Units. Variable fees received by each Fund are displayed in the Capital Share Transaction section of the Statements of Changes in Net Assets as an increase to Capital.
The Transaction Fees for each Fund are listed below:
| Fee for In-Kind and Cash Purchases and Redemptions | Maximum Additional Variable Charge for Cash Purchases and Redemptions* | ||||||||||
USAA MSCI USA Value Momentum ETF | $ | 500 | 2.00 | % | |||||||
USAA MSCI USA Small Cap Value Momentum ETF | 750 | 2.00 | % | ||||||||
USAA MSCI International Value Momentum ETF | 3,000 | 2.00 | % | ||||||||
USAA MSCI Emerging Markets Value Momentum ETF | 5,500 | 2.00 | % | ||||||||
* As a percentage of the amount invested.
The following is a summary of significant accounting policies followed by the Trust in the preparation of its financial statements. The policies are in conformity with accounting principles generally accepted in the United States of America ("GAAP"). The preparation of financial statements in accordance with GAAP requires management to make estimates and assumptions that affect the reported amounts of assets and liabilities and disclosure of contingent assets and liabilities at the date of the financial statements and the reported amounts of income and expenses for the period. Actual results could differ from those estimates. The Funds follow the specialized accounting and reporting requirements under GAAP that are applicable to investment companies.
Investment Valuation:
The Funds record investments at fair value. Fair value is defined as the price that would be received to sell an asset or paid to transfer a liability in an orderly transaction between market participants at the measurement date.
The valuation techniques described below maximize the use of observable inputs and minimize the use of unobservable inputs in determining fair value. The inputs used for valuing the Funds' investments are summarized in the three broad levels listed below:
• Level 1 — quoted prices in active markets for identical securities
• Level 2 — other significant observable inputs (including quoted prices for similar securities or interest rates applicable to those securities, etc.)
• Level 3 — significant unobservable inputs (including the Funds' own assumptions in determining the fair value of investments)
67
Victory Portfolios II | Notes to Financial Statements — continued August 31, 2019 | ||||||
Changes in valuation techniques may result in transfers in or out of an assigned level within the disclosure hierarchy. The inputs or methodologies used for valuation techniques are not necessarily an indication of the risk associated with entering into those investments.
Portfolio securities listed or traded on securities exchanges, including American Depositary Receipts ("ADRs") and Rights, are valued at the closing price on the exchange or system where the security is principally traded, if available, or at the Nasdaq Official Closing Price. If there have been no sales for that day on the exchange or system, then a security is valued at the last available bid quotation on the exchange or system where the security is principally traded. In each of these situations, valuations are typically categorized as Level 1 in the fair value hierarchy.
Investments in open-end investment companies are valued at net asset value. These valuations are typically categorized as Level 1 in the fair value hierarchy.
Futures contracts are valued at the settlement price established each day by the board of trade or an exchange on which they are traded. These valuations are typically categorized as Level 1 in the fair value hierarchy.
Investments for which there are no such quotations, or for which quotations do not appear reliable, are valued at fair value in accordance with procedures established by and under the general supervision and responsibility of the Trust's Board of Trustees (the "Board"). These valuations are typically categorized as Level 2 or Level 3 in the fair value hierarchy, based on the observability of inputs used to determine the fair value.
In accordance with procedures adopted by the Board, fair value pricing may be used if events materially affecting the value of foreign securities occur between the time the exchange on which they are traded closes and the time the Funds' net asset values are calculated. The Funds use a systematic valuation model, provided daily by an independent third party to fair value their international equity securities. These valuations are considered as Level 2 in the fair value hierarchy.
A summary of the valuations as of August 31, 2019, based upon the three levels defined above, is included in the table below while the breakdown, by category, of investments is disclosed in the Schedules of Portfolio Investments:
LEVEL 1 | LEVEL 2 | LEVEL 3 | Total | ||||||||||||||||
| USAA MSCI USA Value Momentum ETF | |||||||||||||||||||
Common Stocks | $ | 465,819,701 | $ | — | $ | — | $ | 465,819,701 | |||||||||||
Total | 465,819,701 | — | — | 465,819,701 | |||||||||||||||
Other Financial Investments^: | |||||||||||||||||||
Assets: | |||||||||||||||||||
Futures Contracts | 23,232 | — | — | 23,232 | |||||||||||||||
Total | 23,232 | — | — | 23,232 | |||||||||||||||
| USAA MSCI USA Small Cap Value Momentum ETF | |||||||||||||||||||
Common Stocks | 100,739,618 | — | — | 100,739,618 | |||||||||||||||
Collateral for Securities Loaned | 66,941 | — | — | 66,941 | |||||||||||||||
Total | 100,806,559 | — | — | 100,806,559 | |||||||||||||||
Other Financial Investments^: | |||||||||||||||||||
Liabilities: | |||||||||||||||||||
Futures Contracts | (14,159 | ) | — | — | (14,159 | ) | |||||||||||||
Total | (14,159 | ) | — | — | (14,159 | ) | |||||||||||||
68
Victory Portfolios II | Notes to Financial Statements — continued August 31, 2019 | ||||||
LEVEL 1 | LEVEL 2 | LEVEL 3 | Total | ||||||||||||||||
| USAA MSCI International Value Momentum ETF | |||||||||||||||||||
Common Stocks | $ | 318,725,465 | $ | — | $ | — | $ | 318,725,465 | |||||||||||
Preferred Stocks | 2,340,399 | — | — | 2,340,399 | |||||||||||||||
Collateral for Securities Loaned | 2,547,586 | — | — | 2,547,586 | |||||||||||||||
Total | 323,613,450 | — | — | 323,613,450 | |||||||||||||||
Other Financial Investments^: | |||||||||||||||||||
Liabilities: | |||||||||||||||||||
Futures Contracts | (37,658 | ) | — | — | (37,658 | ) | |||||||||||||
Total | (37,658 | ) | — | — | (37,658 | ) | |||||||||||||
| USAA MSCI Emerging Markets Value Momentum ETF | |||||||||||||||||||
| Common Stocks | 162,664,258 | 380,756 | 196,566 | 163,241,580 | |||||||||||||||
Preferred Stocks | 3,458,663 | — | — | 3,458,663 | |||||||||||||||
Rights | 5,140 | — | — | 5,140 | |||||||||||||||
Collateral for Securities Loaned | 592,305 | — | — | 592,305 | |||||||||||||||
| Total | 166,720,366 | 380,756 | 196,566 | 167,297,688 | |||||||||||||||
Other Financial Investments^: | |||||||||||||||||||
Liabilities: | |||||||||||||||||||
Futures Contracts | (7,925 | ) | — | — | (7,925 | ) | |||||||||||||
Total | (7,925 | ) | — | — | (7,925 | ) | |||||||||||||
^ Futures Contracts are valued at the unrealized appreciation (depreciation) on the investment.
The following is a reconciliation of assets in which significant unobservable inputs (Level 3) were used in determining fair value:
| Investments In Securities | |||||||
USAA MSCI Emerging Markets Value Momentum ETF | |||||||
Balance as of August 31, 2018 | $ | 83,286 | |||||
Realized Gain (Loss) | — | ||||||
Change in Unrealized Appreciation/Depreciation | (266,480 | ) | |||||
Purchases | 379,760 | ||||||
Sales Proceeds | — | ||||||
Transfers into Level 3 | — | ||||||
Transfers out of Level 3 | — | ||||||
Balance as of August 31, 2019 | $ | 196,566 | |||||
The following is a summary of quantitative information about Level 3 Fair Value Measurements. Level 3 securities are typically valued by the Adviser, pursuant to fair valuation procedures approved by the Board of Trustees.
MSCI Emerging Markets Value Momentum ETF: | |||||||||||||||||||||||
Common Stocks: | Fair Value as of August 31, 2019 | Valuation Techniques | Unobservable Input | Input Values | Impact to valuation from an increase to input | ||||||||||||||||||
FF Group | $ | 7,883 | Market Comparables | Discount | Market Transactions | Any change to the discount would result in direct and proportional changes in the fair value of the security. | |||||||||||||||||
69
Victory Portfolios II | Notes to Financial Statements — continued August 31, 2019 | ||||||
Common Stocks: | Fair Value as of August 31, 2019 | Valuation Techniques | Unobservable Input | Input Values | Impact to valuation from an increase to input | ||||||||||||||||||
| China Ding YI Feng Holding | 188,683 | Market Comparables | Discount | Market Transactions | Any change to the discount would result in direct and proportional changes in the fair value of the security. | ||||||||||||||||||
Real Estate Investment Trusts ("REITS"):
The Funds may invest in REITS which report information on the source of their distributions annually. REITS are pooled investment vehicles that invest primarily in income producing real estate or real estate related loans or interests (such as mortgages). Certain distributions received from REITS during the year are recorded as realized gains or return of capital as estimated by the Funds or when such information becomes known.
Investment Companies:
The Funds may invest in portfolios of open-end investment companies. These investment companies value securities in their portfolios for which market quotations are readily available at their market values (generally the last reported sale price) and all other securities and assets at their fair value by the methods established by the board of directors of the underlying funds.
Derivative Instruments:
Futures Contracts:
The Funds may enter into contracts for the future delivery of securities or foreign currencies and futures contracts based on a specific security, class of securities, foreign currency or an index, and purchase or sell options on any such futures contracts. A futures contract on a securities index is an agreement obligating either party to pay, and entitling the other party to receive, while the contract is outstanding, cash payments based on the level of a specified securities index. No physical delivery of the underlying asset is made. A Fund may enter into futures contracts in an effort to hedge against market risks. The acquisition of put and call options on futures contracts will give the Fund the right (but not the obligation), for a specified price, to sell or to purchase the underlying futures contract, upon exercise of the option, at any time during the option period. Futures transactions involve brokerage costs and require the Fund to segregate assets to cover contracts that would require it to purchase securities or currencies. A good faith margin deposit, known as initial margin, of cash or government securities with a broker or custodian is required to initiate and maintain open positions in futures contracts. Subsequent payments, known as variation margin, are made or received by the Fund based on the change in the market value of the position and are recorded as unrealized appreciation or depreciation until the contract is closed out, at which time the gain or loss is realized. A Fund may lose the expected benefit of futures transactions if interest rates, exchange rates or securities prices change in an unanticipated manner. Such unanticipated changes may also result in lower overall performance than if the Fund had not entered into any futures transactions. In addition, the value of a Fund's futures positions may not prove to be perfectly or even highly correlated with the value of its portfolio securities or foreign currencies, limiting a Fund's ability to hedge effectively against interest rate, exchange rate and/or market risk and giving rise to additional risks. There is no assurance of liquidity in the secondary market for purposes of closing out futures positions. The collateral held by the Funds is presented on the Statements of Assets and Liabilities under Deposit with broker for futures contracts.
As of August 31, 2019, the Funds entered into futures contracts primarily for the strategy of hedging or other purposes, including but not limited to, providing liquidity and equitizing cash.
Offsetting of Financial Assets and Derivatives Assets:
The Funds are subject to various Master Netting Arrangements, which govern the terms of certain transactions with select counterparties. The Master Netting Arrangements allow the Funds to close out and net total exposure to a counterparty in the event of a default with respect to all the transactions
70
Victory Portfolios II | Notes to Financial Statements — continued August 31, 2019 | ||||||
governed under a single agreement with a counterparty. The Master Netting Arrangements also specify collateral posting arrangements at pre-arranged exposure levels. Under the Master Netting Arrangements, collateral is routinely transferred if the total net exposure to certain transactions (net of existing collateral already in place) governed under the relevant Master Netting Arrangement with a counterparty in a given account exceeds a specified threshold depending on the counterparty and the type of Master Netting Arrangement.
The table below, as of August 31, 2019, discloses both gross information and net information about instruments and transactions eligible for offset in the Statements of Assets and Liabilities and instruments and transactions that are subject to an agreement similar to a master netting agreement as well as amounts related to collateral held at clearing brokers and counterparties.
| Gross Amounts of Recognized Assets | Gross Amounts Available for Offset | Net Amounts Presented in the Statements of Assets and Liabilities | Cash Collateral Received | Net Amount | |||||||||||||||||||
USAA MSCI USA Value Momentum ETF | |||||||||||||||||||||||
Futures-Goldman Sachs & Co. | $ | 161 | $ | (161 | ) | $ | — | $ | — | $ | — | ||||||||||||
| USAA MSCI USA Small Cap Value Momentum ETF | |||||||||||||||||||||||
Futures-Goldman Sachs & Co. | 21 | (21 | ) | — | — | — | |||||||||||||||||
| USAA MSCI International Value Momentum ETF | |||||||||||||||||||||||
Futures-Goldman Sachs & Co. | 7,560 | — | 7,560 | — | 7,560 | ||||||||||||||||||
| USAA MSCI Emerging Markets Value Momentum ETF | |||||||||||||||||||||||
Futures-Goldman Sachs & Co. | 17,932 | — | 17,932 | — | 17,932 | ||||||||||||||||||
| Gross Amounts of Recognized Liabilities | Gross Amounts Available for Offset | Net Amounts Presented in the Statements of Assets and Liabilities | Cash Collateral Pledged* | Net Amount | |||||||||||||||||||
USAA MSCI USA Value Momentum ETF | |||||||||||||||||||||||
Futures-Goldman Sachs & Co. | $ | 1,140 | $ | (161 | ) | $ | 979 | $ | (979 | ) | $ | — | |||||||||||
| USAA MSCI USA Small Cap Value Momentum ETF | |||||||||||||||||||||||
Futures-Goldman Sachs & Co. | 1,320 | (21 | ) | 1,299 | (1,299 | ) | — | ||||||||||||||||
* Cash collateral pledged may be in excess of the amounts shown in the table. The total cash collateral pledged by each Fund is disclosed in the Statements of Assets and Liabilities.
Summary of Derivative Instruments:
The following table summarizes the fair values of derivative instruments on the Statements of Assets and Liabilities, categorized by risk exposure, as of August 31, 2019.
Assets | Liabilities | ||||||||||
| Variation Margin Receivable on Open Futures Contracts* | Variation Margin Payable on Open Futures Contracts* | ||||||||||
Equity Risk Exposure: | |||||||||||
USAA MSCI USA Value Momentum ETF | $ | 23,232 | $ | — | |||||||
| USAA MSCI USA Small Cap Value Momentum ETF | — | 14,159 | |||||||||
71
Victory Portfolios II | Notes to Financial Statements — continued August 31, 2019 | ||||||
Assets | Liabilities | ||||||||||
| Variation Margin Receivable on Open Futures Contracts* | Variation Margin Payable on Open Futures Contracts* | ||||||||||
| USAA MSCI International Value Momentum ETF | $ | — | $ | 37,658 | |||||||
| USAA MSCI Emerging Markets Value Momentum ETF | — | 7,925 | |||||||||
* Includes cumulative appreciation (depreciation) of futures contracts as reported on the Schedules of Portfolio Investments. Only current day's variation margin for futures contracts is reported within the Statements of Assets and Liabilities.
The following table presents the effect of derivative instruments on the Statements of Operations, categorized by risk exposure, for the year ended August 31, 2019.
| Net Realized Gains (Losses) on Derivatives Recognized as a Result from Operations | Net Change in Unrealized Appreciation/Depreciation on Derivatives Recognized as a Result of Operations | ||||||||||
| Net Realized Gains (Losses) from Futures Contracts | Net Change in Unrealized Appreciation/Depreciation on Futures Contracts | ||||||||||
Equity Risk Exposure: | |||||||||||
USAA MSCI USA Value Momentum ETF | $ | (70,530 | ) | $ | 23,232 | ||||||
| USAA MSCI USA Small Cap Value Momentum ETF | (23,882 | ) | (14,159 | ) | |||||||
| USAA MSCI International Value Momentum ETF | (14,052 | ) | (37,658 | ) | |||||||
| USAA MSCI Emerging Markets Value Momentum ETF | (93,727 | ) | (7,925 | ) | |||||||
All open derivative positions at year end are reflected in each respective Fund's Schedule of Portfolio Investments. The underlying face value of open derivative positions relative to each Fund's net assets at year end is generally representative of the notional amount of open positions to net assets throughout the year.
Investment Transactions and Related Income:
Changes in holdings of investments are accounted for no later than one business day following the trade date. For financial reporting purposes, however, investment transactions are accounted for on trade date on the last business day of the reporting period. Interest income is determined on the basis of coupon interest accrued using the effective interest method which adjusts, where applicable, the amortization of premiums or accretion of discounts. Dividend income is recorded on the ex-dividend date. Gains or losses realized on sales of securities are determined by comparing the identified cost of the security lot sold with the net sales proceeds.
Withholding taxes on interest, dividends and gains as a result of certain investments in ADRs by the Funds have been provided for in accordance with each investment's applicable country's tax rules and rates.
Securities Lending:
Prior to the Reorganizations on July 1, 2019, the Predecessor Funds had entered into a securities lending agreement with Citibank, N.A. ("Citibank" or the "Agent") which was terminated as a result of the Reorganizations. Effective July 1, 2019, the Trust has entered into an amended Master Securities Lending Agreement ("MSLA") with Citibank. Under the terms of the current MSLA, the Funds may lend securities to certain broker-dealers and banks in exchange for collateral in the amount of at least 102% of the value of U.S. securities loaned or at least 105% of the value of non-U.S. securities loaned, marked-to-market daily. Any collateral shortfalls associated with increases in the valuation of the
72
Victory Portfolios II | Notes to Financial Statements — continued August 31, 2019 | ||||||
securities loaned are adjusted the next business day. The collateral can be received in the form of cash collateral and/or non-cash collateral. Non-cash collateral can include U.S. Government Securities, letters of credit and certificates of deposit. The cash collateral is invested in short-term instruments or cash equivalents, primarily open-end investment companies, as noted in the Funds' Schedules of Portfolio Investments. The Trust does not have effective control of the non-cash collateral and therefore it is not disclosed in the Funds' Schedules of Portfolio Investments. During the time portfolio securities are on loan, the borrower will pay the Funds any dividends or interest paid on such securities plus any fee negotiated between the parties to the lending agreement. The Funds also earn a return from the collateral. The Funds pay the Agent various fees in connection with the investment of cash collateral and fees based on the investment income received from securities lending activities. Securities lending income (net of these fees) is disclosed on the Statements of Operations. Although risk is mitigated by the collateral, the Funds could experience a delay in recovering their securities and possible loss of income or value if the borrower fails to return them.
Securities lending transactions are entered into by a Fund under the MSLA, which permits the Fund, under certain circumstances such as an event of default, to offset amounts payable by the Fund to the same counterparty against amounts receivable from the counterparty to create a net payment due to or from the Fund.
The following table is a summary of the Funds' securities lending transactions which are subject to offset under the MSLA as of August 31, 2019. These transactions are accounted for as secured borrowings with an overnight and continuous contractual maturity for cash collateral, and greater than overnight and continuous contractual maturity for non-cash collateral.
| Gross Amount of Recognized Assets (Value of | Value of Cash | Value of Non-cash Collateral Received by Maturity* | |||||||||||||||||||||||||
| Securities on Loan) | Collateral Received* | <30 Days | Between 30 & 90 Days | >90 Days | Net Amount | ||||||||||||||||||||||
| USAA MSCI USA Small Cap Value Momentum ETF | $ | 70,305 | $ | 66,941 | $ | — | $ | — | $ | — | $ | 3,364 | |||||||||||||||
| USAA MSCI International Value Momentum ETF | 2,458,083 | 2,458,083 | — | — | — | — | |||||||||||||||||||||
| USAA MSCI Emerging Markets Value Momentum ETF | 546,429 | 546,429 | — | — | — | — | |||||||||||||||||||||
* Collateral received in excess of the market value of securities on loan is not presented in this table. The total cash collateral received by each Fund is disclosed in the Statements of Assets and Liabilities.
Foreign Currency Translations:
The accounting records of the Funds are maintained in U.S. dollars. Investment securities and other assets and liabilities of a Fund denominated in a foreign currency are translated into U.S. dollars at current exchange rates. Purchases and sales of securities, income receipts and expense payments are translated into U.S. dollars at the exchange rates on the date of the transactions. The Funds do not isolate the portion of the results of operations resulting from changes in foreign exchange rates on investments from fluctuations arising from changes in market prices of securities held. Such fluctuations are disclosed as net change in unrealized appreciation/depreciation on investments and foreign currency translations on the Statements of Operations. Any realized gains or losses from these fluctuations, including foreign currency arising from in-kind redemptions, are disclosed as net realized gains or losses from investment transactions and foreign currency translations on the Statements of Operations.
Foreign Taxes:
The Funds may be subject to foreign taxes related to foreign income received (a portion of which may be reclaimable), capital gains on the sale of securities, and certain foreign currency transactions. All
73
Victory Portfolios II | Notes to Financial Statements — continued August 31, 2019 | ||||||
foreign taxes are recorded in accordance with the applicable regulations and rates that exist in the foreign jurisdictions in which the Funds invest.
Distributions to Shareholders:
Distributions of net investment income are quarterly for MSCI USA Value Momentum ETF and MSCI USA Small Cap Value Momentum ETF; semi-annually for MSCI International Value Momentum ETF and MSCI Emerging Markets Value Momentum ETF. Each of the Funds distributes any net realized long or short-term capital gains at least annually.
The amounts of dividends from net investment income and distributions from net realized gains (collectively distributions to shareholders) are determined in accordance with federal income tax regulations, which may differ from GAAP. To the extent these "book/tax" differences are permanent in nature (e.g., net operating loss and distribution reclassification,), such amounts are reclassified within the components of net assets based on their federal tax-basis treatment; temporary differences (e.g., wash sales) do not require reclassification. To the extent dividends and distributions exceed net investment income and net realized gains for tax purposes, they are reported as distributions of capital. Net investment losses incurred by a Fund may be reclassified as an offset to capital on the accompanying Statements of Assets and Liabilities.
As of August 31, 2019, on the Statements of Assets and Liabilities, as a result of permanent book-to-tax differences, reclassification adjustments (inclusive of in-kind redemptions if applicable) were as follows:
| Total Distributable Earnings/(Loss) | Capital | ||||||||||
USAA MSCI USA Value Momentum ETF | $ | (10,603,813 | ) | $ | 10,603,813 | ||||||
USAA MSCI USA Small Cap Value Momentum ETF | (2,820,976 | ) | 2,820,976 | ||||||||
USAA MSCI International Value Momentum ETF | (142,245 | ) | 142,245 | ||||||||
Federal Income Taxes:
It is the policy of each Fund to continue to qualify as a regulated investment company by complying with the provisions available to certain investment companies, as defined in applicable sections of the Internal Revenue Code, and to make distributions of net investment income and net realized gains sufficient to relieve it from all, or substantially all, federal income taxes. Accordingly, no provision for federal income taxes is required in the financial statements. The Funds have a tax year end of August 31.
Management of the Funds has reviewed tax positions taken in tax years that remain subject to examination by all major tax jurisdictions, including federal (i.e., all open tax year ends and the interim tax period since then). Management believes that there is no tax liability resulting from unrecognized tax benefits related to uncertain tax positions taken.
Allocations:
Expenses directly attributable to a Fund are charged to the Fund, while expenses which are attributable to more than one fund in the Trust, or jointly with an affiliated trust, are allocated among the respective funds in the Trust and/or affiliated trust based upon net assets or another appropriate basis.
Cross-Trade Transactions:
Pursuant to Rule 17a-7 under the 1940 Act, the Funds may engage in cross-trades which are securities transactions with affiliated investment companies and advisory accounts managed by the Adviser and any applicable sub-adviser. Any such purchase or sale transaction must be effected without brokerage commission or other remuneration, except for customary transfer fees. The transaction must be effected at the current market price, which is either the security's last sale price on an exchange or, if there are no transactions in the security that day, at the average of the highest bid and lowest ask price. For the year ended August 31, 2019, the Funds did not engage in any Rule 17a-7 transactions under the 1940 Act.
74
Victory Portfolios II | Notes to Financial Statements — continued August 31, 2019 | ||||||
3. Purchases and Sales:
Purchases and sales of securities (excluding securities maturing less than one year from acquisition), and purchases and sales of in-kind transactions for the fiscal year ended August 31, 2019 were as follows. Any realized gains or losses from in-kind redemptions are reflected on the Statements of Operations as Net realized gains (losses) from in-kind redemptions.
| Excluding U.S. Government Securities | Associated with in-kind transactions | ||||||||||||||||||
Purchases | Sales | Purchases | Sales | ||||||||||||||||
USAA MSCI USA Value Momentum ETF | $ | 366,595,740 | $ | 360,651,678 | $ | 156,061,214 | $ | 61,675,905 | |||||||||||
| USAA MSCI USA Small Cap Value Momentum ETF | 79,869,157 | 79,123,029 | 53,001,179 | 12,272,146 | |||||||||||||||
| USAA MSCI International Value Momentum ETF | 267,910,213 | 266,224,317 | 51,343,332 | 5,632,178 | |||||||||||||||
| USAA MSCI Emerging Markets Value Momentum ETF | 136,559,190 | 111,353,845 | 5,243,722 | — | |||||||||||||||
There were no purchases and sales of U.S. Government Securities during the year ended August 31, 2019.
4. Fees and Transactions with Affiliates and Related Parties:
Investment Advisory and Management Fees:
Effective July 1, 2019, investment advisory services are provided to the Funds by Victory Capital Management Inc. ("VCM" or the "Adviser"), a New York corporation registered as an investment adviser with the Securities and Exchange Commission ("SEC"). The Adviser is a wholly-owned indirect subsidiary of Victory Capital Holdings, Inc., a publicly traded Delaware corporation, and a wholly-owned direct subsidiary of Victory Capital Operating, LLC.
Under the terms of the Investment Advisory Agreement, the Adviser is entitled to receive fees based on a percentage of the average daily net assets of each Fund. The rates at which the Adviser is paid by each Fund are included in the table below and amounts incurred during the period from July 1, 2019 to August 31, 2019 are reflected as Investment advisory fees on the Statements of Operations.
| Adviser Fee Rate | |||||||
USAA MSCI USA Value Momentum ETF | 0.15 | % | |||||
USAA MSCI USA Small Cap Value Momentum ETF | 0.15 | % | |||||
USAA MSCI International Value Momentum ETF | 0.25 | % | |||||
USAA MSCI Emerging Markets Value Momentum ETF | 0.30 | % | |||||
Prior to the Transaction on July 1, 2019, AMCO had provided investment management services to the Predecessor Funds pursuant to an Advisory Agreement. Under this agreement, which was in effect through June 30, 2019, AMCO was responsible for managing the business and affairs of the Predecessor Funds. AMCO was authorized to select (with approval of the Board and without shareholder approval) one or more sub-advisers to manage the day-to-day investment of all or a portion of the Predecessor Funds' assets, subject to the authority of and supervision by the Board of Trustees.
AMCO monitored each sub-adviser's performance through quantitative and qualitative analysis and periodically reported to the Board as to whether each sub-adviser's agreement should be renewed, terminated, or modified. AMCO was also responsible for determining the asset allocation for the sub-adviser(s). The allocation for each sub-adviser could range from 0% to 100% of the Predecessor Funds' assets, and AMCO could change the allocations without shareholder approval.
The investment management fees for the Funds were comprised of a base fee which were accrued daily and paid monthly at an annualized rate of each Predecessor Fund's average net assets. AMCO had contractually agreed to waive a portion of its management fees in an amount equal to 0.05% of the average net assets of each Predecessor Fund through October 15, 2018, and the waiver could not be
75
Victory Portfolios II | Notes to Financial Statements — continued August 31, 2019 | ||||||
terminated or reduced without approval of the Predecessor Funds' Board during that term. Effective October 15, 2018, AMCO had contractually agreed to extend the contractual waiver on a portion of each Predecessor Fund's management fees in an amount equal to 0.05% of the average net assets of each Predecessor Fund through December 31, 2019, which had terminated on July 1, 2019. These management fees waived are not available to be recouped at a future time. Amounts incurred during the period September 1, 2018 through June 30, 2019 are reflected as Management fees and Management fee waiver on the Statements of Operations. The annual rate of management fees incurred for the period September 1, 2018 through June 30, 2019 were as follows:
| Adviser Fee Rate | |||||||
USAA MSCI USA Value Momentum | 0.15 | % | |||||
USAA MSCI USA Small Cap Value | 0.15 | % | |||||
USAA MSCI International Value | 0.25 | % | |||||
USAA MSCI Emerging Markets Value | 0.30 | % | |||||
Sub-advisory Arrangements:
Prior to July 1, 2019, AMCO had entered into Investment Sub-advisory Agreements with SSGA Funds Management, Inc. ("SSGA FM"), under which SSGA FM directed the investment and reinvestment of a portion of the Funds' assets (as allocated from time to time by AMCO). SSGA FM is a subsidiary of State Street Corporation. Effective July 1, 2019, the Funds have no Investment Sub-advisory Agreements.
AMCO (not the Predecessor Funds) paid SSGA FM a sub-advisory fee on the portion of the Predecessor Funds' average net assets that SSGA FM managed at annual amounts as shown below:
Sub-advisory Fee Rate | |||||||
USAA MSCI USA Value Momentum ETF | 0.02% | ||||||
USAA MSCI USA Small Cap Value Momentum ETF | 0.02% | ||||||
| USAA MSCI International Value Momentum ETF | 0.04% on the first 400,000,000 and 0.03% thereafter | ||||||
| USAA MSCI Emerging Markets Value Momentum ETF | 0.06% on the first 250,000,000 and 0.04% thereafter | ||||||
Administration and Operating Service Fees:
Effective July 1, 2019, VCM serves as the Funds' administrator and fund accountant. Under an Administration and Fund Accounting Agreement, VCM is paid for its services an annual fee at a rate of 0.08% of the first $15 billion in average daily net assets of the Trust, USAA Mutual Funds Trust, Victory Variable Insurance Funds and Victory Portfolios (collectively, the "Victory Funds Complex"), 0.05% of the average daily net assets above $15 billion to $30 billion of the Victory Funds Complex and 0.04% of the average daily net assets over $30 billion of the Victory Funds Complex. Amounts incurred during the period from July 1, 2019 to August 31, 2019 are reflected as Administration fees on the Statements of Operations.
Prior to July 1, 2019, AMCO served as the Predecessor Funds' administrator and State Street Bank and Trust Company served as the Predecessor Funds' sub-administrator, transfer agent and custodian.
Prior to July 1, 2019, AMCO provided certain administration and operating services for the Predecessor Funds and received a fee accrued daily and paid monthly at an annualized rate of the Predecessor Funds' average net assets. AMCO paid all operating expenses of the Predecessor Funds, excluding distribution and/or service fees, taxes, brokerage commissions and transaction costs, acquired fund fees and expenses, and extraordinary expenses. Amounts incurred during the period September 1, 2018 through June 30, 2019 are reflected as Administration and operating service fees on the
76
Victory Portfolios II | Notes to Financial Statements — continued August 31, 2019 | ||||||
Statements of Operations. The annual rate of administration and operating service fees incurred for the period September 1, 2018 through June 30, 2019 were as follows:
| Annual Rate | |||||||
USAA MSCI USA Value Momentum | 0.10 | % | |||||
USAA MSCI USA Small Cap Value | 0.15 | % | |||||
USAA MSCI International Value | 0.15 | % | |||||
USAA MSCI Emerging Markets Value | 0.20 | % | |||||
Distribution and Service 12b-1 Fees:
Prior to July 1, 2019, the Predecessor Funds adopted a plan pursuant to Rule 12b-1 under the 1940 Act. Under the plan, the Predecessor Funds may, but did not pay fees to USAA Investment Management Company ("IMCO"), the distributor, for distribution and shareholder services. IMCO paid all or a portion of such fees to intermediaries that made the Predecessor Funds available for investment by their customers. The fee was accrued daily and paid monthly at an annual rate of 0.25% of each Predecessor Fund's average net assets. For the period September 1, 2018 through June 30, 2019, the Predecessor Funds did not incur any distribution and service (12b-1) fees.
Effective July 1, 2019, Foreside Fund Services, LLC ("Foreside") serves as the Funds' distributor. Effective July 1, 2019, the Funds adopted a plan pursuant to Rule 12b-1. No fees are currently paid by the Funds under the plan, and there are no current plans to impose such fees.
Other Related Parties Fees:
Effective July 1, 2019, Citi Fund Services Ohio, Inc. ("Citi"), an affiliate of Citibank, acts as sub-administrator and sub-fund accountant to the Funds pursuant to a Sub-Administration and Sub-Fund Accounting Services Agreement between VCM and Citi. VCM pays Citi a fee for providing these services. The Trust reimburses VCM and Citi for all of their reasonable out-of-pocket expenses incurred in providing these services.
Effective July 1, 2019, Citibank, also serves as the Funds' Transfer Agent.
The Chief Compliance Officer ("CCO") is an employee of the Adviser, which pays the compensation of the CCO and his support staff. Effective July 1, 2019, the Funds (as part of the Trust) have entered into an CCO Agreement to provide compliance services with the Adviser, pursuant to which the Adviser furnishes its compliance personnel, including the services of the CCO, and other resources reasonably necessary to provide the Trust with compliance oversight services related to the design, administration and oversight of a compliance program for the Trust in accordance with Rule 38a-1 under the 1940 Act. Funds in the Victory Funds Complex, in the aggregate, compensates the Adviser for these services.
The Victory Funds Complex pays an annual retainer to each Independent Trustee, plus an additional annual retainer to the Chairman of the Board. The aggregate amount of the fees and expenses of the Independent Trustees are allocated amongst all the funds in the Victory Funds Complex and are presented in the Statements of Operations. Amounts incurred during the period September 1, 2018 through June 30, 2019 are reflected as Administration and operating service fees on the Statements of Operations.
Shearman & Sterling LLP provides legal services to the Trust.
Effective July 1, 2019, the Adviser has entered into expense limitation agreements with the Funds. Under the terms of the agreements, the Adviser has agreed to waive fees or reimburse certain expenses to the extent that ordinary operating expenses incurred by certain Funds in any fiscal year exceed the expense limit for such Fund. Such excess amounts will be the liability of the Adviser. Interest, taxes, brokerage commissions, other expenditures which are capitalized in accordance with GAAP, and other extraordinary expenses not incurred in the ordinary course of a Fund's business are excluded from the expense limits (excluding voluntary waivers).
77
Victory Portfolios II | Notes to Financial Statements — continued August 31, 2019 | ||||||
Expense limits in effect from July 1, 2019 to August 31, 2019 were as follows:
USAA MSCI USA Value Momentum ETF | 0.20 | % | |||||
USAA MSCI USA Small Cap Value Momentum ETF | 0.25 | % | |||||
USAA MSCI International Value Momentum ETF | 0.35 | % | |||||
USAA MSCI Emerging Markets Value Momentum ETF | 0.45 | % | |||||
Under this expense limitation agreement, the Funds have agreed to repay fees and expenses that were waived or reimbursed by the Adviser for a period up to three fiscal years after such waiver or reimbursement was made to the extent such payments or repayments would not cause the expenses to exceed the original expense limitation in place at time of the waiver or reimbursement or any expense limitation agreement in place at the time of repayment. Amounts repaid to the Adviser during the year, if any, are reflected on the Statements of Operations as "Recoupment of prior expenses waived/reimbursed by Adviser". As of August 31, 2019, the following amounts are available to be repaid to the Adviser:
| Expires 8/31/22 | |||||||
USAA MSCI USA Value Momentum ETF | $ | 9,240 | |||||
USAA MSCI USA Small Cap Value Momentum ETF | 2,724 | ||||||
USAA MSCI Emerging Markets Value Momentum ETF | 632 | ||||||
The Adviser voluntarily waived the following administration fees during the year to assist the Funds in maintaining competitive expense ratios. Voluntary waivers and reimbursements applicable to the Funds are not available to be recouped at a future time.
USAA MSCI USA Value Momentum ETF | $ | 28,364 | |||||
USAA MSCI USA Small Cap Value Momentum ETF | 6,388 | ||||||
USAA MSCI International Value Momentum ETF | 19,771 | ||||||
USAA MSCI Emerging Markets Value Momentum ETF | 10,524 | ||||||
Effective July 1, 2019, certain officers and/or interested trustees of the Funds are also officers and/or employees of the Adviser, Administrator and Fund Accountant, Sub-Administrator and Sub-Fund Accountant, and Legal Counsel.
Prior to July 1, 2019, certain trustees and officers of the Funds were also directors, officers, and/or employees of AMCO. None of the affiliated trustees or Funds' officers received any compensation from the Funds.
5. Risks:
Each Fund may be subject to other risks in addition to these identified risks.
An investment in the Funds' shares represents an indirect investment in the securities owned by the Funds, some of which will be traded on a national securities exchange or in the over-the-counter markets. The value of the securities in which the Funds invest, like other market investments, may move up or down, sometimes rapidly and unpredictably. The value of the securities in which the Funds invest may affect the value of the Funds' shares. An investment in the Funds' shares at any point in time may be worth less than the original investment, even after taking into account the reinvestment of the Funds' distributions.
The MSCI International Value Momentum ETF and MSCI Emerging Markets Value Momentum ETF invest in securities of foreign issuers in various countries. Investing on an international basis involves certain risks not involved in domestic investments including the risk of nationalization or expropriation of assets, imposition of currency exchange controls or restrictions on the repatriation of foreign currency, confiscatory taxation, political or financial instability and diplomatic developments, which could affect the value of a Fund's investments in certain foreign countries. Governments of many countries have exercised and continue to exercise substantial influence over many aspects of the private sector through the ownership or control of many companies, including some of the largest in these countries. As a result, government actions in the future could have a significant effect on economic
78
Victory Portfolios II | Notes to Financial Statements — continued August 31, 2019 | ||||||
conditions which may adversely affect prices of certain portfolio securities. There is also generally less government supervision and regulation of stock exchanges, brokers and listed companies than in the U.S. Dividends or interest on, or proceeds from the sale of, foreign securities may be subject to foreign withholding taxes, and special U.S. tax considerations may apply. Moreover, foreign economies may differ favorably or unfavorably from the U.S. economy in such respects as growth of gross national product, rate of inflation, capital re-investment, resource self-sufficiency and balance of payments position. The Schedule of Portfolio Investments includes information on each Fund's holdings, including industry and/or geographic composition, as relevant.
The Funds will be subject to credit risk with respect to the amount each expects to receive from counterparties for financial instruments entered into by the Funds. The Funds may be negatively impacted if a counterparty becomes bankrupt or otherwise fails to perform its obligations due to financial difficulties. The Funds may experience significant delays in obtaining any recovery in bankruptcy or other reorganization proceeding and the Funds may obtain only limited recovery or may obtain no recovery in such circumstances. The Funds typically enter into transactions with counterparties whose credit ratings are investment grade, as determined by a nationally recognized statistical rating organization or, if unrated, judged by the Funds' Adviser to be of comparable quality.
6. Line of Credit:
Prior to July 1, 2019, the Predecessor Funds participated, along with other funds of the USAA Mutual Funds Trust, (collectively the "USAA Trusts") in a line of credit agreement with USAA Capital Corporation ("CAPCO"), in a joint, short-term, revolving, committed loan agreement of $500 million with CAPCO, an affiliate of AMCO. The purpose of the agreement was to provide temporary or emergency cash needs, including redemption requests that might otherwise require the untimely disposition of securities. Subject to availability (including usage of the facility by other funds of the USAA Trusts), the Predecessor Funds may have borrowed from CAPCO an amount up to 5% of each Predecessor Fund's total assets at an interest rate based on the London Interbank Offered Rate (LIBOR), plus 100.0 basis points. The USAA Trusts were also assessed facility fees by CAPCO in the amount of 14.0 basis points of the amount of the committed loan agreement. The facility fees were allocated among the funds of the USAA Trusts based on their respective average daily net assets for the period.
The USAA Trusts were permitted an optional increase upon request of the committed loan agreement from $500 million up to $750 million. If the USAA Trusts increased the committed loan agreement, the assessed facility fee on the amount of the additional commitment would be 15.0 basis points. The line of credit agreement with CAPCO was terminated on June 30, 2019 as a result of the Transaction. During the period September 1, 2018 through June 30, 2019, AMCO, on behalf of the Predecessor Funds, paid CAPCO facility fees of $10,029. The Predecessor Funds had no borrowings under this agreement during the period September 1, 2018 through June 30, 2019.
Effective July 1, 2019, the Funds are now included under and participate in a short-term, demand note "Line of Credit" agreement with Citibank. This agreement has a termination date of June 29, 2020. Under the agreement with Citibank, the Victory Funds Complex may borrow up to $600 million, of which $300 million is committed and $300 million is uncommitted. $40 million of the Line of Credit is reserved for use by the Victory Floating Rate Fund, another series of the Victory Funds Complex, with that fund paying the related commitment fees for that amount. The purpose of the agreement is to meet temporary or emergency cash needs, including redemption requests that might otherwise require the untimely disposition of securities. Effective with the Line of Credit agreement terms on July 1, 2019, Citibank receives an annual commitment fee of 0.15% on $300 million for providing the Line of Credit. Each fund in the Victory Funds Complex pays a pro-rata portion of the commitment fees plus any interest (one month LIBOR plus one percent) on amounts borrowed. Interest charged to the Funds during the period is presented on the Statements of Operations under line of credit fees.
79
Victory Portfolios II | Notes to Financial Statements — continued August 31, 2019 | ||||||
The average loans under the line of credit agreement with Citibank for the days outstanding and average interest rate for each Fund during the year ended August 31, 2019 were as follows:
| Amount Outstanding at August 31, 2019 | Average Borrowing | Days Borrowing Outstanding | Average Interest Rate* | Maximum Borrowing During the Period | |||||||||||||||||||
| USAA MSCI Emerging Markets Value Momentum ETF | $ | 700,000 | $ | 5,800,000 | 2 | 3.12 | % | $ | 10,900,000 | ||||||||||||||
* For the year ended August 31, 2019, based on the number of days borrowings were outstanding.
7. Federal Income Tax Information:
The tax character of distributions paid during the tax years ended, as noted below, were as follows (total distributions paid may differ from the Statements of Changes in Net Assets because, for tax purposes, dividends are recognized when actually paid):
Year Ended August 31, 2019 | |||||||||||||||||||||||
Distributions paid from | |||||||||||||||||||||||
| Ordinary Income | Net Long-Term Capital Gains | Total Taxable Distributions | Return of Capital | Total Distributions Paid | |||||||||||||||||||
USAA MSCI USA Value Momentum ETF | $ | 7,198,442 | $ | — | $ | 7,198,442 | $ | — | $ | 7,198,442 | |||||||||||||
USAA MSCI USA Small Cap Value Momentum ETF | 1,357,525 | — | 1,357,525 | — | 1,357,525 | ||||||||||||||||||
USAA MSCI International Value Momentum ETF | 8,527,397 | — | 8,527,397 | — | 8,527,397 | ||||||||||||||||||
USAA MSCI Emerging Markets Value Momentum ETF | 3,550,809 | — | 3,550,809 | — | 3,550,809 | ||||||||||||||||||
Period Ended August 31, 2018 (amounts in 000's) | |||||||||||||||||||||||
Distributions paid from | |||||||||||||||||||||||
| Ordinary Income | Net Long-Term Capital Gains | Total Taxable Distributions | Return of Capital | Total Distributions Paid | |||||||||||||||||||
USAA MSCI USA Value Momentum ETF | $ | 1,868 | $ | — | $ | 1,868 | $ | — | $ | 1,868 | |||||||||||||
USAA MSCI USA Small Cap Value Momentum ETF | 190 | — | 190 | — | 190 | ||||||||||||||||||
USAA MSCI International Value Momentum ETF | 3,553 | — | 3,553 | — | 3,553 | ||||||||||||||||||
USAA MSCI Emerging Markets Value Momentum ETF | 747 | — | 747 | — | 747 | ||||||||||||||||||
As of August 31, 2019, the components of distributable earnings/accumulated deficit on a tax basis were as follows:
| Undistributed Ordinary Income | Undistributed Long-Term Capital Gains | Accumulated Earnings | Accumulated Capital and Other Losses | Unrealized Appreciation (Depreciation)** | Total Accumulated Earnings (Deficit) | ||||||||||||||||||||||
| USAA MSCI USA Value Momentum ETF | $ | 2,646,534 | $ | — | $ | 2,646,534 | $ | (33,347,678 | ) | $ | 9,370,648 | $ | (21,330,496 | ) | |||||||||||||
| USAA MSCI USA Small Cap Value Momentum ETF | 647,621 | — | 647,621 | (10,735,048 | ) | 942,344 | (9,145,083 | ) | |||||||||||||||||||
| USAA MSCI International Value Momentum ETF | 3,645,131 | — | 3,645,131 | (46,425,214 | ) | (11,543,090 | ) | (54,323,173 | ) | ||||||||||||||||||
| USAA MSCI Emerging Markets Value Momentum ETF | 3,304,055 | — | 3,304,055 | (23,343,454 | ) | (18,065,962 | ) | (38,105,361 | ) | ||||||||||||||||||
** The difference between the book-basis and tax-basis of unrealized appreciation/(depreciation) is attributable primarily to tax deferral of losses on wash sales.
80
Victory Portfolios II | Notes to Financial Statements — continued August 31, 2019 | ||||||
As of the tax year ended August 31, 2019, the following Funds had net capital loss carry-forwards (no expiration) not limited as a result of changes in Fund ownership during the year and in prior years as summarized in the tables below.
| Short-Term Amount | Long-Term Amount | Total | |||||||||||||
USAA MSCI USA Value Momentum ETF | $ | 23,500,499 | $ | 9,847,179 | $ | 33,347,678 | |||||||||
| USAA MSCI USA Small Cap Value Momentum ETF | 9,031,140 | 1,703,908 | 10,735,048 | ||||||||||||
USAA MSCI International Value Momentum ETF | 36,008,309 | 10,416,905 | 46,425,214 | ||||||||||||
USAA MSCI Emerging Markets Value Momentum ETF | 18,696,913 | 4,646,541 | 23,343,454 | ||||||||||||
At August 31, 2019, the cost basis for federal income tax purposes, gross unrealized appreciation, gross unrealized depreciation, and net unrealized appreciation (depreciation) for investments were as follows:
| Cost of Investments for Federal Tax Purposes | Gross Unrealized Appreciation | Gross Unrealized Depreciation | Net Unrealized Appreciation (Depreciation) | ||||||||||||||||
| USAA MSCI USA Value Momentum ETF | $ | 456,449,053 | $ | 29,264,478 | $ | (19,893,830 | ) | $ | 9,370,648 | ||||||||||
| USAA MSCI USA Small Cap Value Momentum ETF | 99,864,215 | 7,722,240 | (6,779,896 | ) | 942,344 | ||||||||||||||
| USAA MSCI International Value Momentum ETF | 335,149,314 | 16,452,821 | (27,988,685 | ) | (11,535,864 | ) | |||||||||||||
| USAA MSCI Emerging Markets Value Momentum ETF | 185,344,917 | 8,964,500 | (27,011,729 | ) | (18,047,229 | ) | |||||||||||||
During the fiscal year ended August 31, 2019, the Funds realized the following net capital gains (losses) resulting from in-kind redemptions, in which shareholders exchanged Fund shares for securities held by the Fund rather than for cash. Because such gains (losses) are not taxable to the Fund, and are not distributed to shareholders, they have been reclassified from distributable earnings (loss) to capital.
Short Term | Long Term | Total | |||||||||||||
USAA MSCI USA Value Momentum ETF | $ | 7,070,774 | $ | 3,533,039 | $ | 10,603,813 | |||||||||
| USAA MSCI USA Small Cap Value Momentum ETF | 1,340,843 | 1,480,749 | 2,821,592 | ||||||||||||
USAA MSCI International Value Momentum ETF | 56,835 | 85,410 | 142,245 | ||||||||||||
8. Recent Accounting Pronouncements:
In August 2018, the Financial Accounting Standards Board ("FASB") issued Accounting Standards Update ("ASU") No. 2018-13, "Fair Value Measurements" ("ASU 2018-13"). This update makes certain removals from, changes to and additions to existing disclosure requirements for fair value measurements. ASU 2018-13 does not change fair value measurements already required or permitted by existing standards. ASU 2018-13 is effective for financial statements issued for fiscal years beginning after December 15, 2019, and interim periods within those fiscal years. As permitted, the Funds have early adopted ASU 2018-13 with the financial statements prepared as of August 31, 2019.
In August 2018, the SEC adopted amendments to certain financial statement disclosure requirements to conform them to GAAP for investment companies. These amendments made certain disclosure requirements effective under Regulation S-X. The Funds' adoption of these amendments, effective with the financial statements prepared as of August 31, 2019 had no effect on the Funds' net assets or results of operations. As a result of adopting these amendments, the distributions to shareholders in the August 31, 2018 Statements of Changes in Net Assets presented herein have been reclassified to conform to the current year presentation, which includes all distributions of each class of shareholders, other than tax basis return of capital distributions, in one line item per share class. Distributions to
81
Victory Portfolios II | Notes to Financial Statements — continued August 31, 2019 | ||||||
shareholders for the year ended August 31, 2018 from net investment income and net realized gains in the Funds were as follows (amounts in thousands).
| USAA MSCI USA Value Momentum ETF | USAA MSCI USA Small Cap Value Momentum ETF | USAA MSCI International Value Momentum ETF | USAA MSCI Emerging Markets Value Momentum ETF | ||||||||||||||||
| Accumulated Net investment Income (Loss): | $ | 1,599 | $ | 203 | $ | 1,482 | $ | 1,767 | |||||||||||
| Distributions to Shareholders: | |||||||||||||||||||
| From net investment income: | (1,868 | ) | (190 | ) | (3,553 | ) | (747 | ) | |||||||||||
| From net Realized Gains: | — | — | — | — | |||||||||||||||
9. Subsequent Events:
The Board approved a change in fiscal year end from August 31 to June 30. This change in fiscal year end is effective September 1, 2019.
The Funds have evaluated the need for additional disclosures or adjustments resulting from subsequent events through the date these financial statements were issued. Based on this evaluation, there were no additional subsequent events to report that would have a material impact on the Funds' financial statements.
82
REPORT OF INDEPENDENT REGISTERED PUBLIC ACCOUNTING FIRM
To the Shareholders and Board of Trustees of Victory Portfolios II
Opinion on the Financial Statements
We have audited the accompanying statements of assets and liabilities, including the schedules of portfolio investments, of VictoryShares USAA MSCI USA Value Momentum ETF, VictoryShares USAA MSCI USA Small Cap Value Momentum ETF, VictoryShares USAA MSCI International Value Momentum ETF, and VictoryShares USAA MSCI Emerging Markets Value Momentum ETF (the "Funds"), each a series of Victory Portfolios II, as of August 31, 2019, and the related statements of operations and changes in net assets, including the related notes, and the financial highlights for the year then ended (collectively referred to as the "financial statements"). In our opinion, the financial statements present fairly, in all material respects, the financial position of each of the Funds as of August 31, 2019, the results of their operations, the changes in their net assets, and the financial highlights for the year then ended, in conformity with accounting principles generally accepted in the United States of America.
The Funds' financial statements and financial highlights for the period ended August 31, 2018, were audited by other auditors whose report dated October 25, 2018, expressed an unqualified opinion on those financial statements and financial highlights.
Basis for Opinion
These financial statements are the responsibility of the Funds' management. Our responsibility is to express an opinion on the Funds' financial statements based on our audit. We are a public accounting firm registered with the Public Company Accounting Oversight Board (United States) ("PCAOB") and are required to be independent with respect to the Funds in accordance with the U.S. federal securities laws and the applicable rules and regulations of the Securities and Exchange Commission and the PCAOB.
We conducted our audit in accordance with the standards of the PCAOB. Those standards require that we plan and perform the audit to obtain reasonable assurance about whether the financial statements are free of material misstatement, whether due to error or fraud.
Our audit included performing procedures to assess the risks of material misstatement of the financial statements, whether due to error or fraud, and performing procedures that respond to those risks. Such procedures included examining, on a test basis, evidence regarding the amounts and disclosures in the financial statements. Our procedures included confirmation of securities owned as of August 31, 2019, by correspondence with the custodian and brokers or by other appropriate auditing procedures where replies from brokers or counterparties were not received. Our audit also included evaluating the accounting principles used and significant estimates made by management, as well as evaluating the overall presentation of the financial statements. We believe that our audit provides a reasonable basis for our opinion.
We have served as the auditor of one or more investment companies advised by Victory Capital Management, Inc. since 2015.

COHEN & COMPANY, LTD.
Cleveland, Ohio
October 28, 2019
83
Victory Portfolios II | Supplemental Information August 31, 2019 | ||||||
(Unaudited)
Shareholder Voting Results:
A Special Meeting ("Meeting") of Shareholders of USAA ETF Trust was held on April 18, 2019. The Meeting was held for the following purpose: to approve the Agreement and Plan of Reorganization (the "Agreement") by and among USAA ETF Trust, on behalf of each of the funds indicated below as an "Acquired Fund," Victory Portfolios II, on behalf of each corresponding fund indicated below as an "Acquiring Fund," AMCO, and Victory Capital.
Acquired Fund | Acquiring Fund | ||||||
USAA MSCI USA Value Momentum Blend Index ETF | VictoryShares USAA MSCI USA Value Momentum ETF | ||||||
USAA MSCI USA Small Cap Value Momentum Blend Index ETF | VictoryShares USAA MSCI USA Small Cap Value Momentum ETF | ||||||
| USAA MSCI International Value Momentum Blend Index ETF | VictoryShares USAA MSCI International Value Momentum ETF | ||||||
USAA MSCI Emerging Markets Value Momentum Blend Index ETF | VictoryShares USAA MSCI Emerging Markets Momentum ETF | ||||||
The results of the voting on the above matter was as follows:
Votes For | Votes Against | Votes Abstain | |||||||||||||
USAA MSCI USA Value Momentum Blend Index ETF | 7,883,594 | 3,904 | 5,785 | ||||||||||||
| USAA MSCI USA Small Cap Value Momentum Blend Index ETF | 1,591,736 | 4,350 | 1,721 | ||||||||||||
| USAA MSCI International Value Momentum Blend Index ETF | 6,451,950 | 4,638 | 2,202 | ||||||||||||
| USAA MSCI Emerging Markets Value Momentum Blend Index ETF | 3,672,689 | 5,271 | 1,396 | ||||||||||||
Change in Independent Registered Public Accounting Firm:
On July 3, 2019, Ernst & Young, LLP ("EY") resigned as the independent registered public accounting firm of the USAA ETF Trust as a result of the Reorganizations that occurred on July 1, 2019. EY's report on the financial statements of the USAA ETF Trust for the fiscal period ended August 31, 2018, did not contain an adverse opinion or disclaimer of opinion, and was not qualified or modified as to uncertainty, audit scope or accounting principles. During the USAA ETF Trust's most recent fiscal years and through July 3, 2019, there were no (1) disagreements with EY on any matter of accounting principles or practices, financial statement disclosure, or auditing scope or procedure, which disagreements, if not resolved to EY's satisfaction, would have caused it to make reference to that matter in connection with its report; or (2) "reportable events," as that term is defined in Item 304(a)(1)(v) of Regulation S-K under the Securities Exchange Act of 1934.
Cohen & Company, Ltd ("Cohen") is the independent registered public accounting firm of the Funds for the fiscal year ended August 31, 2019. Cohen, located at 1350 Euclid Avenue, Suite 800, Cleveland, Ohio 44115, serves as the independent registered public accounting firm for other Victory Funds.
84
Victory Portfolios II | Supplemental Information — continued August 31, 2019 | ||||||
(Unaudited)
Trustee and Officer Information
Board of Trustees:
Overall responsibility for management of the Trust rests with the Board. The Trust is managed by the Board in accordance with the laws of the State of Delaware. There are currently ten Trustees, nine of whom are not "interested persons" of the Trust within the meaning of that term under the 1940 Act ("Independent Trustees") and one of whom is an "interested person" of the Trust within the meaning of that term under the 1940 Act ("Interested Trustee"). The Trustees, in turn, elect the officers of the Trust to actively supervise its day-to-day operations.
The following tables list the Trustees, their ages, position with the Trust, commencement of service, principal occupations during the past five years and any directorships of other investment companies or companies whose securities are registered under the Securities Exchange Act of 1934, as amended, or who file reports under that Act. Each Trustee oversees 26 portfolios in the Trust, nine portfolios in Victory Variable Insurance Funds and 42 portfolios in Victory Portfolios, each a registered investment company that, together with the Trust, comprise the Victory Funds Complex. Each Trustee's address is c/o Victory Portfolios II, 4900 Tiedeman Road, 4th Floor, Brooklyn, Ohio 44144. Each Trustee has an indefinite term.
Name and Age | Position Held with the Trust | Date Commenced Service | Principal Occupation During Past 5 Years | Other Directorships Held During Past 5 Years | |||||||||||||||
Independent Trustees. | |||||||||||||||||||
David Brooks Adcock, 67 | Trustee | May 2015 | Consultant (since 2006). | Chair and Trustee, Turner Funds (December 2016-December 2017). | |||||||||||||||
Nigel D. T. Andrews, 72 | Vice Chair and Trustee | May 2015 | Retired. | Director, TCG BDC II, Inc. (since 2017); Director, TCG BDC I, Inc. (formerly Carlyle GMS Finance, Inc.) (since 2012); Director, Old Mutual US Asset Management (2002-2014). | |||||||||||||||
E. Lee Beard, 68* | Trustee | May 2015 | Retired (since 2015); Consultant, The Henlee Group, LLC (consulting) (2005-2015). | None. | |||||||||||||||
Dennis M. Bushe, 75 | Trustee | July 2016 | Retired. | Trustee, RS Investment Trust and RS Variable Products Trust (November 2011-July 2016). | |||||||||||||||
85
Victory Portfolios II | Supplemental Information — continued August 31, 2019 | ||||||
(Unaudited)
Name and Age | Position Held with the Trust | Date Commenced Service | Principal Occupation During Past 5 Years | Other Directorships Held During Past 5 Years | |||||||||||||||
Sally M. Dungan, 65 | Trustee | May 2015 | Chief Investment Officer, Tufts University (since 2002). | None. | |||||||||||||||
John L. Kelly, 66 | Trustee | May 2015 | Partner, McCarvill Capital Partners (September 2016-September 2017); Advisor, Endgate Commodities LLC (January 2016-April 2016); Managing Partner, Endgate Commodities LLC (August 2014-January 2016). | Director, Caledonia Mining Corporation (since May 2012). | |||||||||||||||
David L. Meyer, 62* | Trustee | May 2015 | Retired. | None. | |||||||||||||||
Gloria S. Nelund, 58 | Trustee | July 2016 | Chair, CEO and Co-Founder of TriLinc Global, LLC, an investment firm. | TriLinc Global Impact Fund, LLC (since 2012); Trustee, RS Investment Trust and RS Variable Products Trust (November 2007-July 2016). | |||||||||||||||
Leigh A. Wilson, 74 | Chair and Trustee | May 2015 | Private Investor. | Chair (since 2013), Caledonia Mining Corporation. | |||||||||||||||
Interested Trustee. | |||||||||||||||||||
David C. Brown, 47** | Trustee | May 2015 | Chairman and Chief Executive Officer (since 2013), the Adviser; Chairman and Chief Executive Officer, Victory Capital Holdings, Inc. (since 2013). | Trustee, USAA Mutual Funds Trust. | |||||||||||||||
* The Board has designated Mr. Meyer and Ms. Beard as its Audit Committee Financial Experts.
** Mr. Brown is an "Interested Person" by reason of his relationship with the Adviser.
The Statement of Additional Information includes additional information about the Trustees of the Trust and is available, without charge, on the SEC's website at www.sec.gov and/or by calling 800-539-3863.
86
Victory Portfolios II | Supplemental Information — continued August 31, 2019 | ||||||
(Unaudited)
Officers:
The officers of the Trust, their ages, commencement of service and their principal occupations during the past five years, are detailed in the following table. Each officer serves until the earlier of his or her resignation, removal, retirement, death, or the election of a successor. The mailing address of each officer of the Trust is 4900 Tiedeman Road, 4th Floor, Brooklyn, Ohio 44144. The officers of the Trust receive no compensation directly from the Trust for performing the duties of their offices.
Name and Age | Position with the Trust | Date Commenced Service | Principal Occupation During Past 5 Years | ||||||||||||
Christopher K. Dyer, 57 | President | May 2015 | Director of Fund Administration, the Adviser. | ||||||||||||
Scott A. Stahorsky, 50 | Vice President | May 2015 | Manager, Fund Administration, the Adviser (since 2015); Senior Analyst, Fund Administration, the Adviser (prior to 2015). | ||||||||||||
Erin G. Wagner, 45 | Secretary | May 2015 | Associate General Counsel, the Adviser (since 2013). | ||||||||||||
Allan Shaer, 54 | Treasurer | December 2017 | Senior Vice President, Financial Administration, Citi Fund Services Ohio, Inc. (since 2016); Vice President, Mutual Fund Administration, JP Morgan Chase (2011-2016). | ||||||||||||
Christopher A. Ponte, 35 | Assistant Treasurer* | May 2015 | Manager, Fund Administration, the Adviser (since 2017); Senior Analyst, Fund Administration, the Adviser (prior to 2017); Chief Financial Officer, Victory Capital Advisers, Inc. (since 2018). | ||||||||||||
Colin Kinney, 46 | Chief Compliance Officer | July 2017 | Chief Compliance Officer (since 2013) and Chief Risk Officer (2009-2017), the Adviser. | ||||||||||||
Chuck Booth, 59 | Anti-Money Laundering Compliance Officer and Identity Theft Officer | May 2015 | Director, Regulatory Administration and CCO Support Services, Citi Fund Services Ohio, Inc. | ||||||||||||
Jay G. Baris, 65 | Assistant Secretary | May 2015 | Partner, Shearman & Sterling LLP (since 2018); Partner, Morrison & Foerster LLP (2011-January 2018). | ||||||||||||
* On December 5, 2017, Mr. Ponte resigned as Treasurer and accepted the position of Assistant Treasurer of the Trust.
87
Victory Portfolios II | Supplemental Information — continued August 31, 2019 | ||||||
(Unaudited)
Proxy Voting and Portfolio Holdings Information
Proxy Voting:
Information regarding the policies and procedures that each Fund uses to determine how to vote proxies relating to portfolio securities is available without charge, upon request, by calling 800-539-3863. The information is also included in the Funds' Statement of Additional Information, which is available on the SEC's website at www.sec.gov.
Information relating to how the Funds voted proxies relating to portfolio securities held during the most recent twelve months ended June 30 is available on the SEC's website at www.sec.gov.
Availability of Schedules of Portfolio Investments:
The Trust files a complete list of Schedules of Portfolio Investments with the SEC for the first and third quarter of each fiscal year on Form N-PORT. Prior to the implementation of Form N-PORT, the trust filed a complete list of Schedules of Portfolio Investments with the SEC for the first and third quarters of each fiscal year on Form N-Q. Forms N-PORT and Forms N-Q are available on the SEC's website at www.sec.gov.
Expense Examples
As a shareholder of the Funds, you may incur two types of costs: (1) transaction costs, and (2) ongoing costs, including management fees, and other Fund expenses. These examples are intended to help you understand your ongoing costs (in dollars) of investing in the Funds and to compare these costs with the ongoing costs of investing in other mutual funds.
These examples are based on an investment of $1,000 invested at the beginning of the period and held for the entire period from March 1, 2019 through August 31, 2019.
The Actual Expense figures in the table below provide information about actual account values and actual expenses. You may use the information below, together with the amount you invested, to estimate the expenses that you paid over the period. Simply divide your account value by $1,000 (for example, an $8,600 account value divided by $1,000 = 8.6), then multiply the result by the number in the table under the heading entitled "Actual Expenses Paid During Period" to estimate the expenses you paid on your account during this period.
The Hypothetical Expense figures in the table below provide information about hypothetical account values and hypothetical expenses based on each Fund's actual expense ratio and an assumed rate of return of 5% per year before expenses, which is not the Fund's actual return. The hypothetical account values and expenses may not be used to estimate the actual ending account balance or expenses you paid for the period. You may use this information to compare this 5% hypothetical example with the 5% hypothetical examples that appear in shareholder reports of other funds.
Please note the expenses shown in the table are meant to highlight your ongoing costs only and do not reflect any transactional costs. Therefore, the table is useful in comparing ongoing costs only, and will not help you determine the relative total costs of owning different funds. In addition, if these transactional costs were included, your costs would have been higher.
| Beginning Account Value 3/1/19 | Actual Ending Account Value 8/31/19 | Hypothetical Ending Account Value 8/31/19 | Actual Expenses Paid During Period 3/1/19- 8/31/19* | Hypothetical Expenses Paid During Period 3/1/19- 8/31/19* | Annualized Expense Ratio During Period 3/1/19- 8/31/19 | ||||||||||||||||||||||
| USAA MSCI USA Value Momentum Index ETF | $ | 1,000.00 | $ | 1,005.80 | $ | 1,024.20 | $ | 1.01 | $ | 1.02 | 0.20 | % | |||||||||||||||
| USAA MSCI USA Small Cap Value Momentum ETF | 1,000.00 | 956.50 | 1,023.95 | 1.23 | 1.28 | 0.25 | % | ||||||||||||||||||||
88
Victory Portfolios II | Supplemental Information — continued August 31, 2019 | ||||||
(Unaudited)
| Beginning Account Value 3/1/19 | Actual Ending Account Value 8/31/19 | Hypothetical Ending Account Value 8/31/19 | Actual Expenses Paid During Period 3/1/19- 8/31/19* | Hypothetical Expenses Paid During Period 3/1/19- 8/31/19* | Annualized Expense Ratio During Period 3/1/19- 8/31/19 | ||||||||||||||||||||||
| USAA MSCI International Value Momentum ETF | $ | 1,000.00 | $ | 967.50 | $ | 1,023.44 | $ | 1.74 | $ | 1.79 | 0.35 | % | |||||||||||||||
| USAA MSCI Emerging Markets Value Momentum ETF | 1,000.00 | 917.90 | 1,022.94 | 2.18 | 2.29 | 0.45 | % | ||||||||||||||||||||
* Expenses are equal to the average account value multiplied by the Fund's annualized expense ratio multiplied by 184/365 (the number of days in the most recent fiscal half-year divided by the number of days in the fiscal year).
89
Victory Portfolios II | Supplemental Information — continued August 31, 2019 | ||||||
(Unaudited)
Additional Federal Income Tax Information
For the year ended August 31, 2019, the Funds paid qualified dividend income for the purposes of reducing individual federal income tax rates of:
Amount | |||||||
| USAA MSCI USA Value Momentum ETF | 93 | % | |||||
| USAA MSCI USA Small Cap Value Momentum ETF | 41 | % | |||||
| USAA MSCI International Value Momentum ETF | 64 | % | |||||
| USAA MSCI Emerging Markets Value Momentum ETF | 29 | % | |||||
Dividends qualified for corporate dividends received deductions of:
Amount | |||||||
| USAA MSCI USA Value Momentum ETF | 89 | % | |||||
| USAA MSCI USA Small Cap Value Momentum ETF | 50 | % | |||||
The following Funds intend to elect to pass through to shareholders the income tax credit for taxes paid to foreign countries. Foreign source income and foreign tax expense per outstanding share on August 31, 2019, were as follows:
| Foreign Source Income | Foreign Tax Expense | ||||||||||
| USAA MSCI International Value Momentum ETF | 1.57 | 0.13 | |||||||||
| USAA MSCI Emerging Markets Value Momentum ETF | 1.70 | 0.17 | |||||||||
90
Victory Portfolios II | Supplemental Information — continued August 31, 2019 | ||||||
(Unaudited)
Considerations of the Board in Approving the Investment Advisory Agreement
In anticipation of the reorganization of each of the USAA MSCI USA Value Momentum ETF, USAA MSCI USA Small Cap Value Momentum ETF, USAA MSCI International Value Momentum ETF and USAA MSCI Emerging Markets Value Momentum ETF managed by USAA Asset Management Company ("AMCO," and each fund managed by AMCO, a "USAA ETF") into four comparable funds (each a "Fund") to be managed by a new, combined Victory Capital Management Inc. ("Victory Capital")/AMCO organization (the "Adviser") upon the completion of the acquisition of AMCO by the parent company of Victory Capital (the "Reorganization"), the Board approved an investment advisory agreement with the Adviser, on behalf of each Fund (the "Agreement"), at a meeting, which was called for that purpose, on February 26, 2019.
In considering whether to approve the Agreement, the Board requested, and the Adviser provided, information that the Board believed to be reasonably necessary to reach its conclusions. The Board, including the Independent Trustees, evaluated this information along with other information about the Adviser obtained throughout the year and was advised by independent legal counsel to the Independent Trustees. The Board reviewed numerous factors with respect to each USAA ETF that would continue into the comparable Fund. In considering whether the compensation to be paid to the Adviser was fair and reasonable, the Board also evaluated, among other things, the following factors:
• The requirements of the Funds for the services provided by the Adviser;
• The nature, quality and extent of the services provided and expected to be provided;
• The fees payable for the services and whether the fee arrangements provided for economies of scale that would benefit Fund shareholders as the Funds grow;
• Fees paid by other clients of the Adviser whose accounts are managed in a similar investment style and any differences in the services provided to the other clients compared to those provided to the Funds;
• Total expenses of the USAA ETFs, taking into consideration any distribution or shareholder servicing fees and the pro forma expense ratio of each comparable Fund;
• Management's commitment to operating the Funds at competitive expense levels;
• The anticipated pro forma profitability of the Adviser (as reflected by comparing fees earned against an estimate of the Adviser's costs) with respect to the Adviser's relationship with the Funds;
• Research and other service benefits received by the Adviser obtained through payment of client commissions for securities transactions;
• Other indirect benefits received by the Adviser, and its affiliates, including revenues paid to the Adviser, or its affiliates, by the Funds for administration and fund accounting services, and distribution;
• The capabilities and financial condition of the Adviser as a combined organization;
• Current economic and industry trends; and
• The historical relationship between the Trust and the Adviser.
The Board reviewed each Fund's proposed management fee, comprised of the advisory fee plus the administrative services fee to be paid to the Adviser, in the context of the Adviser's profitability of each Fund individually. In addition, the Board compared each Fund's proposed gross management fees and anticipated total operating expense ratio on a net and gross basis, taking into consideration any anticipated distribution or shareholder servicing fees, with the median gross management fee and median expense ratio of a universe of comparable mutual funds compiled by an independent consultant and a peer group of funds with similar investment strategies selected by that independent consultant from the universe. The Board reviewed the factors and methodology used by the independent consultant in the selection of each Fund's peer group, including the independent consultant's selection of a broad universe of funds using the standard retail Morningstar categories, the more specific universe of comparable funds, and peer groups of funds with comparable investment strategies and asset levels, among other factors. The Board noted that none of the advisory fee arrangements for the Funds included breakpoints, which are generally viewed as a method by which the investment adviser shares economies of scale as a fund grows. The Board also considered the Adviser's commitment to limit expenses as discussed in more detail below.
91
Victory Portfolios II | Supplemental Information — continued August 31, 2019 | ||||||
(Unaudited)
The Board found that the proposed gross annual management fee to be paid by each Fund was within the range of management fees paid by each Fund's respective peer group. The Board also found that each Fund's anticipated net annual expense ratio, taking into account any shareholder servicing or distribution fees, was reasonable as compared with each Fund's respective peer group. The Board considered the Adviser's contractual agreement with each Fund to waive its fees and reimburse expenses for a specified period of time, as described in the Fund's prospectus.
The Board reviewed various other specific factors with respect to each Fund, as described below. In their deliberations, the Trustees did not rank the importance of any particular information or factor considered and each Trustee may have attributed different weights to various factors.
Conclusion
Based on its review of the information requested and provided, and following extended discussions, the Board determined that the Agreement, on behalf of the Funds discussed above, was consistent with the best interests of each Fund and its shareholders, and the Board unanimously approved the Agreement, on behalf of each Fund on the basis of the foregoing review and discussions and the following considerations, among others:
• The fairness and reasonableness of the proposed investment advisory fee to be paid to the Adviser under the Agreement in light of the investment advisory services to be provided, the expected costs of these services, the anticipated profitability of the Adviser's relationship with the Fund and the comparability of the fee paid to the fees paid by other investment companies;
• The nature, quality and extent of the investment advisory services to be provided by the Adviser;
• The Adviser's entrepreneurial commitment to the management of the Funds and the creation of a broad-based family of funds, which could entail a substantial commitment of the Adviser's resources to the successful operation of the Funds;
• The Adviser's representations regarding its staffing and capabilities to manage the Funds, including the retention of personnel with relevant portfolio management experience;
• The Adviser's efforts to enhance investment results by, among other things, developing quality portfolio management teams; and
• The overall high quality of the personnel, operations, financial condition, investment management capabilities, methodologies and performance of the Adviser.
92
Privacy Policy
Protecting the Privacy of Information
The Trust respects your right to privacy. We also know that you expect us to conduct and process your business in an accurate and efficient manner. To do so, we must collect and maintain certain personal information about you. This is the information we collect from you on applications or other forms, and from the transactions you make with us or third parties. It may include your name, address, social security number, account transactions and balances, and information about investment goals and risk tolerance.
We do not disclose any information about you or about former customers to anyone except as permitted or required by law. Specifically, we may disclose the information we collect to companies that perform services on our behalf, such as the transfer agent that processes shareholder accounts and printers and mailers that assist us in the distribution of investor materials. We may also disclose this information to companies that perform marketing services on our behalf. This allows us to continue to offer you Victory investment products and services that meet your investing needs, and to effect transactions that you request or authorize. These companies will use this information only in connection with the services for which we hired them. They are not permitted to use or share this information for any other purpose.
To protect your personal information internally, we permit access only by authorized employees and maintain physical, electronic and procedural safeguards to guard your personal information.*
* You may have received communications regarding information about privacy policies from other financial institutions which gave you the opportunity to "opt-out" of certain information sharing with companies which are not affiliated with that financial institution. The Trust does not share information with other companies for purposes of marketing solicitations for products other than the Trust. Therefore, the Trust does not provide opt-out options to their shareholders.
The Victory Funds
P.O. Box 182593
Columbus, Ohio 43218-2593

Visit our website at: | Call Victory at: | ||||||
www.vcm.com | 866-376-7890 | ||||||
VS-MSCI-ETF-AR (8/19)
Item 2. Code of Ethics.
(a) The registrant has adopted a code of ethics that applies to the registrant’s principal executive officer, principal financial officer, principal accounting officer or controller, or persons performing similar functions. This code of ethics in included as an Exhibit.
(b) During the period covered by the report, with respect to the registrant’s code of ethics that applies to its principal executive officer, principal financial officer, principal accounting officer or controller, or persons performing similar functions; there have been no amendments to, nor any waivers granted from, a provision that relates to any element of the code of ethics definition enumerated in paragraph (b) of this Item 2.
Item 3. Audit Committee Financial Expert.
(a)(1) The registrant’s board of directors has determined that the registrant has at least one audit committee financial expert serving on its audit committee.
(a)(2) The audit committee financial experts are David L. Meyer and E. Lee Beard, who are “independent” for purposes of this Item 3 of Form N-CSR.
Item 4. Principal Accountant Fees and Services.
|
| 2019 |
| 2018 |
| ||
(a) Audit Fees (1) |
| $ | 86,000 |
| $ | 337,148 |
|
(b) Audit-Related Fees (2) |
| 0 |
| 0 |
| ||
(c) Tax Fees (3) |
| 19,500 |
| 13,525 |
| ||
(d) All Other Fees (4) |
| 0 |
| 0 |
| ||
(1) Audit fees include amounts related to the audit of the Registrant’s annual financial statements and services normally provided by the accountant in connection with statutory and regulatory filings. Audit fees billed were for professional services provided by Cohen Fund Audit Services, Ltd in 2019 and Ernst & Young LLP in 2018 for audit compliance, audit advice and audit planning.
(2) Represents the fee for assurance and related services by Cohen Fund Audit Services, Ltd in 2019 and Ernst & Young LLP in 2018 reasonably related to the performance of the audit of the Registrant’s financial statements that was not reported under (a) of this item.
(3) Represents the aggregate tax fee billed for professional services rendered by Cohen Fund Audit Services, Ltd in 2019 and Ernst & Young LLP in 2018 for tax compliance, tax advice, international tax fee transactions and tax planning. Such tax services included the review of income and excise tax returns for the Registrant.
(4) For the fiscal years ended August 31, 2019 and August 31, 2018, there were no fees billed for professional services rendered by Cohen Fund Audit Services, Ltd and Ernst & Young LLP, respectively, to the Registrant, other than the services reported in (a) through (c) of this item.
Tax fees for 2019 and 2018 are for recurring tax fees for the preparation of the federal and state tax returns and procedures performed relating to the Registrant’s analysis of complex securities.
(e)(1) The Registrant’s Audit Committee must pre-approve non-audit services to be provided by the principal accountant and the fees charged with these services. The Committee may delegate authority to one or more Committee members to pre-approve these services, subject to subsequent review and approval by the Committee.
(e)(2) There were no services performed under Rule 2.01 (c)(7)(i)(C).
(f) Not applicable.
(g)
2019 |
| $ | 0 |
|
2018 |
| $ | 89,435 |
|
(h) The Registrant’s Audit Committee has evaluated the non-audit services that the principal accountant provided to the Registrant’s investment adviser (and the adviser’s relevant affiliated), which services the Committee did not pre-approve, and has concluded that the provision of those services was compatible with maintaining the accountant’s independence.
Item 5. Audit Committee of Listed Registrants.
Not applicable.
Item 6. Investments.
(a) Not applicable.
(b) Not applicable.
Item 7. Disclosure of Proxy Voting Policies and Procedures for Closed-End Management Investment Companies.
Not applicable.
Item 8. Portfolio Managers of Closed-End Management Investment Companies.
Not applicable.
Item 9. Purchases of Equity Securities by Closed-End Management Investment Company and Affiliated Purchasers.
Not applicable.
Item 10. Submission of Matters to a Vote of Security Holders.
Not applicable.
Item 11. Controls and Procedures.
(a)The registrant’s principal executive officer and principal financial officer have concluded, based on their evaluation of the registrant’s disclosure controls and procedures as conducted within 90 days of the filing date of this report, that these disclosure controls and procedures are adequately designed and are operating effectively to ensure that information required to be disclosed by the registrant on Form N-CSR is recorded, processed, summarized and reported within the time periods specified in the Securities and Exchange Commission’s rules and forms.
(b)There were no changes in the registrant’s internal control over financial reporting (as defined in Rule 30a-3(d) under the Investment Company Act of 1940 (17 CFR 270.30a-3(d)) that occurred during the period covered by this report that have materially affected or are reasonably likely to materially affect, the registrant’s internal control over financial reporting.
Item 12. Disclosure of Securities Lending Activities for Closed-End Management Investment Companies.
(a)(1) Not applicable.
(a)(2) Not applicable.
(a)(3) Not applicable.
(a)(4) Not applicable.
(b) Not applicable.
Item 13. Exhibits.
(a)(1) The code of ethics that is the subject of the disclosure required by Item 2 is attached hereto.
(a)(2) Certifications pursuant to Rule 30a-2(a) are attached hereto.
(a)(3) Not applicable.
(a)(4) Change in the registrant’s independent public accountant is attached hereto.
(b) Certifications pursuant to Rule 30a-2(b) are furnished herewith.
SIGNATURES
Pursuant to the requirements of the Securities Exchange Act of 1934 and the Investment Company Act of 1940, the registrant has duly caused this report to be signed on its behalf by the undersigned, thereunto duly authorized.
(Registrant) | Victory Portfolios II |
| |||
|
|
| |||
By (Signature and Title)* | /s/ Allan Shaer |
| |||
| Allan Shaer, Principal Financial Officer |
| |||
|
|
| |||
Date | November 7, 2019 |
|
| ||
Pursuant to the requirements of the Securities Exchange Act of 1934 and the Investment Company Act of 1940, this report has been signed below by the following persons on behalf of the registrant and in the capacities and on the dates indicated.
By (Signature and Title)* | /s/ Christopher K. Dyer |
| ||
| Christopher K. Dyer, Principal Executive Officer |
| ||
|
|
| ||
Date | November 7, 2019 |
|
| |
|
|
| ||
|
|
| ||
By (Signature and Title)* | /s/ Allan Shaer |
| ||
| Allan Shaer, Principal Financial Officer |
| ||
|
|
| ||
Date | November 7, 2019 |
|
| |