Southcross Energy Partners, L.P.
1700 Pacific Avenue, Suite 2900
Dallas, Texas 75201
October 10, 2012
Via EDGAR and Facsimile
Securities and Exchange Commission
Division of Corporation Finance
100 F Street, N.E.
Washington, D.C. 20549-4628
Attn: H. Roger Schwall, Assistant Director
Division of Corporation Finance
Re: Southcross Energy Partners, L.P.
Amendment No. 4 to Registration Statement on Form S-1
File No. 333-180841
Filed September 14, 2012
Ladies and Gentlemen:
Set forth below are the responses of Southcross Energy Partners, L.P., a Delaware limited partnership (“we” or the “Partnership”), to comments received from the staff of the Division of Corporation Finance (the “Staff”) of the Securities and Exchange Commission (the “Commission”) by letter dated October 2, 2012 with respect to the above-referenced Registration Statement (the “Registration Statement”).
Concurrently with the submission of this letter, we have filed through EDGAR Amendment No. 5 to the Registration Statement (“Amendment No. 5”). For your convenience, we have hand delivered four copies of this letter, as well as four copies of Amendment No. 5 marked to show all changes made since the filing of Amendment No. 4 to the Registration Statement.
For your convenience, each response is prefaced by the exact text of the Staff’s corresponding comment in bold text. All references to page numbers and captions correspond to Amendment No. 5, unless otherwise indicated.
Estimated Cash Available for Distribution, page 63
Assumptions and Considerations, page 64
General considerations and sensitivity analysis, page 64
1. We note that you elected to present projected information as of March 31, 2013 in order to illustrate your anticipated capacities after you have placed in service the growth capital
projects that are expected to increase your distributable cash flow for the last six months of the forecast period. Please tell us why the forecasted pipeline systems capacity as of March 31, 2013 should include the pipeline acquisition expected to close October 2013 given that your distributable cash flow projection is for the twelve months ending September 30, 2013.
Response: We have revised footnote two to the table on page 64 to reflect that the pipeline acquisition closed in September 2012.
Revenue, page 67
2. We note that the amount of forecasted revenue described in the fourth paragraph on page 67 differs from the forecasted revenue disclosed in the table on page 63. Please revise.
Response: We acknowledge the Staff’s comment and have revised the Registration Statement to conform the forecasted revenue amount on page 67 to the forecasted revenue disclosed in the table on page 63.
Southcross Energy Partners, L.P.
Balance Sheet as of April 19, 2012, page F-78
3. Please update Southcross Energy Partners, L.P. balance sheet and related financial information included in the prospectus in accordance with Rule 3-12 of Regulation S-X.
Response: We acknowledge the Staff’s comment and have revised the Registration Statement to include the Partnership’s audited balance sheet as of September 30, 2012. Please see pages F-77 through F-79.
Comment Letter dated August 1, 2012
Please note that in response to comment number one from the Staff set forth in the Staff’s letter dated August 1, 2012, we are hereby supplementally providing the Staff with written materials that the Partnership presented to potential investors that are qualified institutional buyers or institutional accredited investors in reliance on Section 5(d) of the Securities Act as amended by Secction 105(d) of the Jumpstart Our Business Startups Act. The materials were made available for viewing by such investors only during the Partnership’s presentation. The written materials are attached hereto as Exhibit A. Pursuant to Rule 418(b) under the Securities Act, we request that the materials be returned to us following completion of your review.
We hereby acknowledge the Staff’s closing comments to the letter and hereby undertake to comply with the Staff’s requests. Please direct any questions or comments regarding the foregoing to the undersigned or to our counsel at Latham & Watkins LLP, William Finnegan at (713) 546-7410 or Ryan Maierson at (713) 546-7420.
| Very truly yours, | |
|
| |
| SOUTHCROSS ENERGY PARTNERS, L.P. | |
|
| |
| By: | Southcross Energy Partners GP, LLC, |
|
| its General Partner |
|
|
|
| By: | /s/ David W. Biegler |
|
| David W. Biegler |
|
| Chief Executive Officer |
cc: William N. Finnegan IV (Issuer’s counsel)
Ryan J. Maierson (Issuer’s counsel)
Douglass M. Rayburn (Underwriter’s counsel)
Exhibit A
(see attached)

Southcross Energy Partners, L.P.
Citi One-on-One MLP / Midstream Conference
August 2012
Cautionary Statements
This presentation contains forward-looking statements. Forward-looking statements give current expectations, contain projections of results of operations or of financial condition, or forecasts of future events, in contrast with statements that reflect historical facts. Examples include discussion of SXE’s (defined below) strategies, financing plans and growth opportunities. Words such as “could,” “will,” “may,” “assume,” “forecast,” “position,” “predict,” “strategy,” “expect,” “intend,” “plan,” “estimate,” “anticipate,” “believe,” “project,” “budget,” “potential,” or “continue,” and similar expressions are used to identify forward-looking statements. These forward-looking statements are not a guarantee of performance, and you should not place undue reliance on such statements. SXE has based these forward-looking statements largely on its current expectations and projections about future events. Forward-looking statements are subject to many risks, uncertainties and other variable circumstances including those discussed in the registration statement on Form S-1 (No. 333-180841) filed by Southcross Energy Partners, LP (“SXE” or the “Partnership”) under the headings “Risk Factors” and “Management’s Discussion and Analysis of Financial Condition and Results of Operations,” that may cause the statements to be inaccurate and readers are cautioned not to place undue reliance on such statements. Many of these risks are outside of SXE’s control and could cause SXE’s actual results and experience to differ materially from those it thought would occur. The forward-looking statements included in this presentation are made only as of the date hereof. SXE does not undertake, and specifically declines, any obligation to update any such statements or to publicly announce the results of any revisions to any of such statements to reflect future events or developments.
SXE has filed a registration statement (including a prospectus) with the Securities and Exchange Commission (“SEC”) for the offering to which this presentation relates. Before you invest, you should read the prospectus in that registration statement and other documents SXE has filed with the SEC for more complete information about SXE and this offering. You may get these documents for free by visiting EDGAR on the SEC web site at www.sec.gov. Alternatively, SXE, any underwriter or any dealer participating in the offering will arrange to send you the prospectus if you request it by calling Citigroup Global Markets Inc. at 1-800-831-9146 or Wells Fargo Securities Inc. at 1-888-603-5847.
Management Team and Experience
|
|
|
|
|
|
|
| Years |
Name |
| Title |
| Experience |
|
|
| Experience |
|
|
|
|
|
|
|
|
|
David Biegler |
| Chairman & CEO |
| · Chairman & CEO |
| Estrella Energy |
| 45+ Years |
| · Chairman & Co-Founder |
| Regency Gas Services |
| ||||
| · Vice Chairman, President & COO |
| TXU |
| ||||
| · Chairman, President & CEO |
| ENSERCH |
| ||||
| · President & COO |
| Lone Star Gas |
| ||||
|
|
|
|
|
|
|
|
|
Mike Hunter |
| President |
| · President |
| Estrella Energy |
| 35+ Years |
| · Director |
| Regency Gas Services |
| ||||
| · President Pipeline Division |
| TXU |
| ||||
| · President & COO Interstate Natural Gas Pipeline Entities |
| NORAM Energy Corp |
| ||||
|
|
|
|
|
|
|
|
|
Michael Anderson |
| SVP & CFO |
| · SVP & CFO |
| Exterran and Exterran Partners |
| 20+ Years |
| · SVP & CFO |
| Universal Compression |
| ||||
| · CFO; later serving as Chairman & CEO |
| Azurix Corp. |
| ||||
| · Vice President, M&A |
| JPMorgan Chase & Co. |
|
Growth-Oriented MLP with Integrated Midstream Value Chain
· Growth oriented midstream MLP formed by management and Charlesbank
· Comprehensive services including natural gas gathering, processing, treating, compression and transportation as well as NGL fractionation and transportation
· Assets strategically located in South Texas within and around the Eagle Ford shale region, Alabama and Mississippi
· South Texas contributed 77% of revenue in 2011
· Significant organic growth with over $200 million in commenced or completed acquisitions and growth projects since January 2011
South Texas and Eagle Ford
Key Operating Data (as of June 30, 2012)
Asset |
|
|
|
Pipeline (miles) |
| 2590 |
|
Processing Capacity (MMcf/d) |
| 185 | (1) |
Fractionation Capacity (Bbl/d) |
| 4800 | (2) |
(1) | Does not include 200 MMcf/ Woodsboro facility completed in Q3 2012 |
(2) | Does not include 11,500 Bbl/d Bonnie View facility to be completed in 2012 |
Alabama and Mississippi

Investment Highlights
Strategically Located Assets
· Majority of assets within or near the Eagle Ford shale area
· Assets are proximate to major natural gas market areas and have direct NGL market connections
Reliable Cash Flows
· Primarily fixed-fee and fixed-spread contracts
Integrated Midstream Value Chain
· Comprehensive services
· Natural gas gathering, processing, treating, compression and transportation as well as NGL fractionation and transportation
Experienced Management and Strong Sponsor
· Management track record of managing and growing energy assets
· Charlesbank has substantial investment experience in the midstream sector
Business Strategy
Capitalize on Organic Growth Opportunities
· Focus on high-growth Eagle Ford Shale play
· Execute projects that enhance existing systems
Enhance the Profitability of Existing Assets
· Add new volumes of natural gas supplies to existing assets
· Expand relationships and business with NGL end-use customers
Pursue Accretive Acquisitions of Complementary Assets
· Identify and pursue accretive acquisitions
· Focus on regions with potential for additional near-term development
Manage Exposure to Commodity Price Risk
· Mitigate commodity price fluctuations to generate stable cash flows
· Target fixed-fee and fixed-spread contracts
Maintain Sound Financial Practices
· Maintain commitment to financial discipline
· Prudently fund long–term capital requirements
Southcross History
Purchase Company & Improve Asset Base (Phase I) |
| Initial Expansion (Phase II) |
| Phase III Expansion | |||
|
|
|
|
| |||
Aug. 2009 – Dec. 2010 |
| Jan. 2011 – July 2012 |
| July 2012 – August 2012 | |||
|
|
|
|
| |||
· | Assets purchased from Crosstex; Southcross formed |
| · | Won Swift contract in Eagle Ford |
| · | Expansion of Bonnie View fractionator |
|
|
|
|
|
|
|
|
· | Built operating and support infrastructure |
| · | Constructed McMullen pipeline extension |
|
|
|
|
|
|
|
|
|
|
|
· | Invested in smaller projects to enhance system transport and processing capabilities |
| · | Constructed Woodsboro processing plant and Bonnie View fractionator |
|
|
|
| · Gregory plant expansion (TX) |
|
|
|
|
|
|
| · SMEPA (MS) |
| · | Increased Gregory processing capacity |
|
|
|
| · Tauber / TGP (TX) |
|
|
|
|
|
|
|
|
| · | Signed long-term Ethane and Propane sales agreement with Dow |
|
|
|
|
|
|
|
|
|
|
|
|
|
| · | Completed acquisition of Enterprise Alabama |
|
|
|
Integrated Solutions Across the Value Chain

Southcross Services
· Natural gas gathering, processing, treating, compression and transportation
· NGL fractionation and transportation
· Source, purchase, transport and sell natural gas and NGLs
Advantages and Service Differentiation
· Ability to move producers’ natural gas and NGLs from wellhead to market
· Direct connections to end-use markets
· Integrated business provides incremental opportunities along the value chain
· Ability to source and transport natural gas to market to satisfy the needs of commercial and industrial customers
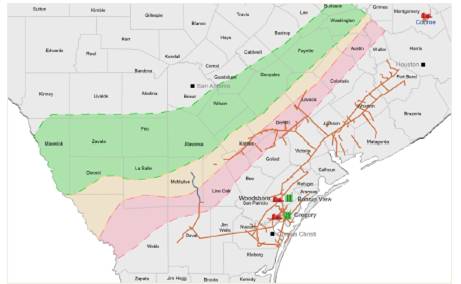
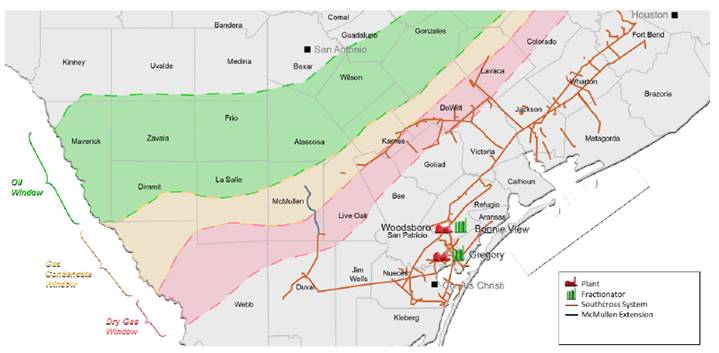
South Texas
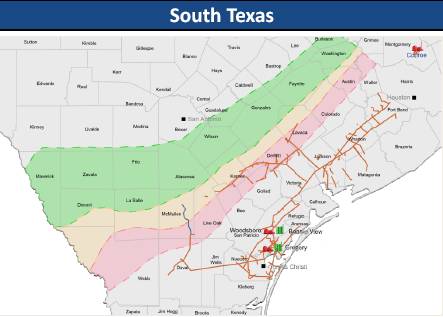
South Texas Assets
· 77% of 2011 revenues
· 1,445 miles of pipe
· Two plants with total capacity of 185 MMcf/d(1) and contracted third-party processing capacity of 83 MMcf/d
· 4,800 Bbls/d fractionation capacity(2)
· Direct access to Corpus Christi Ship Channel and industrial market
(1) Does not include 200 MMcf/ Woodsboro facility completed in Q3 2012
(2) Does not include 11,500 Bbl/d Bonnie View facility to be completed in 2012
Recent Projects
· Woodsboro processing plant construction
· Completed construction and commenced operations of a 200 MMcf/d cryogenic natural gas processing plant
· Bonnie View fractionation plant installation
· Expanding our NGL capacity by installing an 11,500 Bbl/d fractionation facility
· Announced 2013 Bonnie View expansion to bring capacity to 22,500 Bbl/d
· Constructing associated pipelines to transport fractionated NGLs to market
· Gregory processing plant enhancements
· Reactivated an idle train, upgraded existing equipment and added new equipment to enhance liquids recovery performance for both trains
· Increased processing capacity from 85 MMcf/d to 135 MMcf/d while improving ethane recoveries
· Pipeline expansion
· Completed construction of McMullen extension, a 25-mile liquids-rich natural gas extension to connect to Eagle Ford shale
· Guaranteed throughput for five years with two producers
· Added 115 MMcf/d of throughput capacity
· Constructing 21 miles of new pipeline to bring additional supply from DeWitt and Karnes Counties in the Eagle Ford shale area to the Woodsboro processing plant
Eagle Ford Production and Drilling Activity
Active Eagle Ford Rigs
Eagle Ford Rig Count
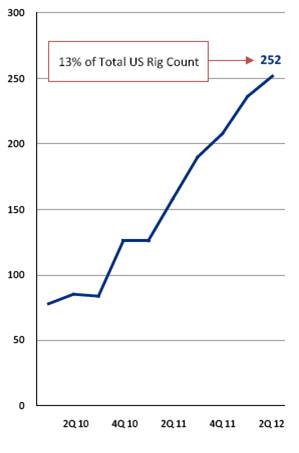
Source: Smith Bits. Data as of 6/30/12.
Proximity to Eagle Ford Permitting Activity
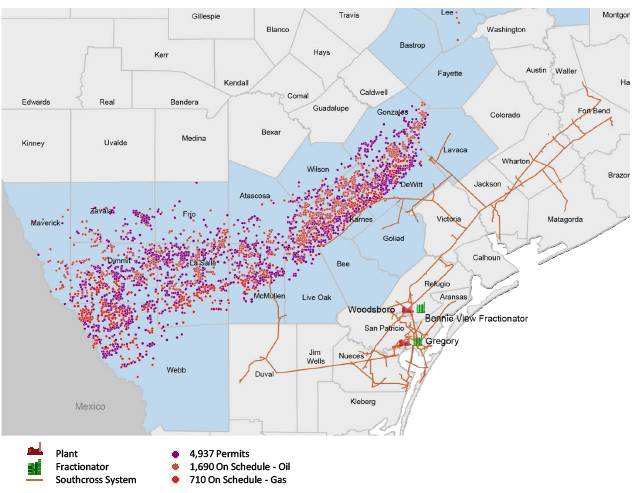
Source: Railroad Commission of Texas. Data as of 7/3/12.
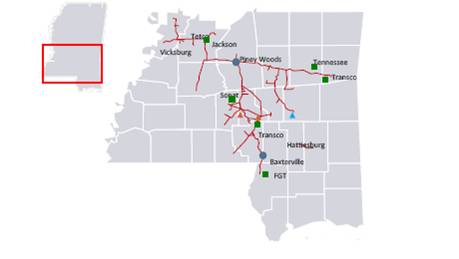
Alabama & Mississippi Assets
· 320 miles of gathering pipelines
· 825 miles of intrastate pipelines
· Alabama
· Fee-based producer services (81% fixed-fee in 2011)
· 519 miles of pipeline
· Connections to end-users and interstate pipelines
· 22 compressors totaling ~24,500 hp
· Acquired Enterprise Alabama in September 2011 (388 miles of pipe, 21,545 hp)
· Estimated capacity of 375 MMcf/d
· Mississippi
· Largest intrastate pipeline system
· 626 miles of pipeline
· Diverse customer base
· 2 compressors totaling ~2,200 hp
· Fee-based transportation services (35% fixed-fee and 65% fixed-spread in 2011)
· Estimated capacity of 345 MMcf/d
Alabama

Mississippi
Track Record of Organic Growth
· Significant built-in growth with over $200 million in commenced or completed acquisitions and growth projects since January 2011. Notable projects include:
· Woodsboro processing plant
· Bonnie View fractionation plant
· McMullen pipeline extension
· Gregory processing plant enhancements
· SMEPA pipeline expansion
· Estimated growth capital expenditure for twelve months ending June 30, 2013 will be $33.0 million
· 21-mile pipeline connecting DeWitt and Karnes Counties to Woodsboro
· Dry gas line near Petronila, Texas to enhance deliveries to Corpus Christi area
· Increasing Bonnie View fractionation capacity
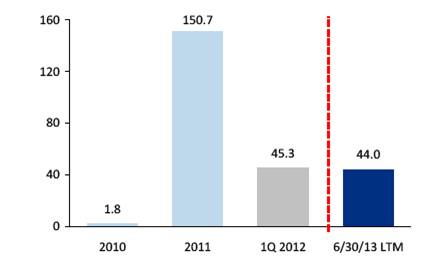
Historical and Projected Expansion Capex ($mm)
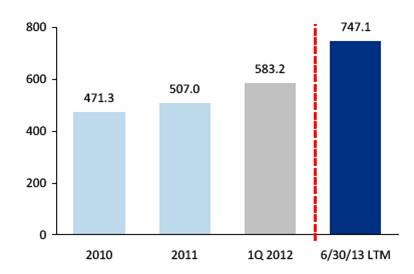
Historical and Projected Throughput (MMBtu/d)
Forecasted Cash Flow Available for Distributions
|
| Twelve Months |
| |
($ in millions) |
| Ending June 30, 2013 |
| |
Adjusted EBITDA |
| $ | 61.5 |
|
|
|
|
| |
Less: |
|
|
| |
Cash interest expense, net of interest income |
| (7.4 | ) | |
Cash tax expense |
| (0.5 | ) | |
Expansion capital expenditures |
| (44.0 | ) | |
Maintenance capital expenditures |
| (5.7 | ) | |
|
|
|
| |
Add: |
|
|
| |
Available cash and borrowings to fund expansion capital expenditures |
| 44.0 |
| |
Estimated cash available for distribution |
| $ | 48.0 |
|
Key Financial Statistics
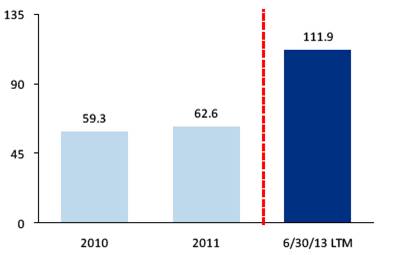
Gross margin ($mm)
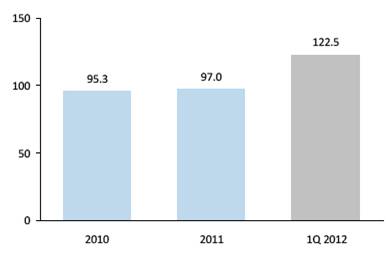
Throughput (MMBtu/d)

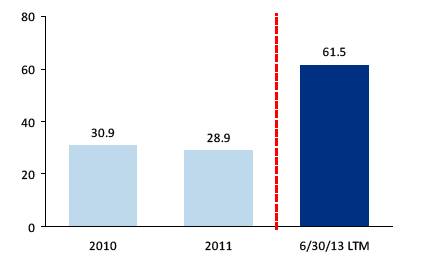
EBITDA ($mm)
Plant Inlet Volume (MMBtu/d)
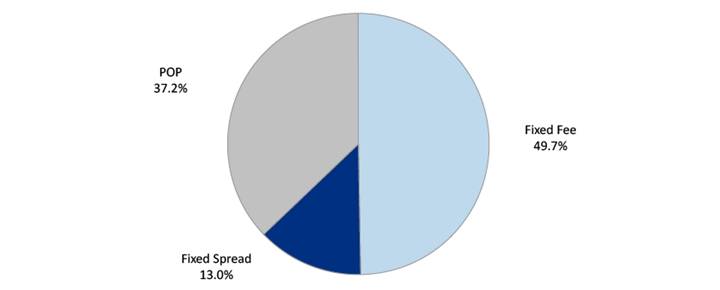
Stable Cash Flows
NTM Gross Margin by Contract Type
Estimated NTM Commodity Sensitivities
Commodity |
| Amount of Price Change |
| Impact to Distributable Cash Flow |
|
Natural Gas |
| +/- 5 | % | -/+ $0.4 million |
|
NGL |
| +/- 5 | % | +/- $2.2 million |
|
Southcross Investment Summary
· Strategically located asset base
· Reliable cash flows underpinned by long-term, fixed-fee and fixed-spread contracts
· Integrated midstream value chain
· Experienced and incentivized management and operating teams
· Supportive sponsor with significant industry expertise
Non-GAAP Reconciliation
|
|
|
|
|
| Forecast |
|
($ in millions) |
| 2010 |
| 2011 |
| Period(1) |
|
Net Income |
| 9.7 |
| 7.5 |
| 30.7 |
|
Add: |
|
|
|
|
|
|
|
Depreciation and amortization expense |
| 11.0 |
| 12.3 |
| 22.1 |
|
Interest expense |
| 10.0 |
| 5.4 |
| 8.3 |
|
Unrealized gain (loss) on commodity derivatives |
| 0.0 |
| 0.0 |
| 0.0 |
|
Loss on extinguishment of debt |
| 0.0 |
| 3.2 |
| 0.0 |
|
Transaction costs |
| 0.1 |
| 0.2 |
| 0.0 |
|
Income tax expense |
| 0.0 |
| 0.3 |
| 0.5 |
|
Less: |
|
|
|
|
|
|
|
Interest income |
| (0.0 | ) | (0.0 | ) | 0.0 |
|
Adjusted EBITDA |
| 30.9 |
| 28.9 |
| 61.5 |
|
(1) Twelve months ending June 30, 2013
Non-GAAP Measures
SXE has used the non-GAAP financial measures of Adjusted EBITDA and gross operating margin. SXE provides reconciliations of these non-GAAP financial measure to their most directly comparable financial measures as calculated and presented in accordance with GAAP. SXE defines Adjusted EBITDA as net income: plus interest expense, income tax expense, depreciation and amortization expense, certain non-cash charges such as non-cash equity compensation, unrealized losses on commodity derivative contracts, and selected charges / transaction costs that are unusual or non-recurring; less interest income, income tax benefit, unrealized gains on commodity derivative contracts, and selected gains that are unusual or non-recurring. Adjusted EBITDA is used as a supplemental financial measure by management and by external users of our financial statements, such as investors and lenders, to assess: the financial performance of our assets without regard to financing methods, capital structure or historical cost basis; the ability of our assets to generate cash sufficient to support our indebtedness and make cash distributions to our unitholders and general partner; our operating performance and return on capital as compared to those of other companies in the midstream energy sector, without regard to financing or capital structure; and the attractiveness of capital projects and acquisitions and the overall rates of return on alternative investment opportunities.
The economic rationale behind management’s use of Adjusted EBITDA is to measure the ability of our assets to generate cash sufficient to pay interest costs, support our indebtedness and make distributions to our investors. The GAAP measure most directly comparable to Adjusted EBITDA is net income. Our non-GAAP financial measure of Adjusted EBITDA should not be considered as an alternative to net income. You should not consider Adjusted EBITDA in isolation or as a substitute for analysis of our results as reported under GAAP. Adjusted EBITDA has limitations as an analytical tool and should not be considered as an alternative to, or more meaningful than, performance measures calculated in accordance with GAAP. Some of these limitations are: certain items excluded from Adjusted EBITDA are significant components in the understanding and assessing a company’s financial performance, such as a company’s cost of capital and tax structure; Adjusted EBITDA does not reflect our cash expenditures or future requirements for capital expenditures or contractual commitments; Adjusted EBITDA does not reflect changes in, or cash requirements for, our working capital needs; although depreciation and amortization are non-cash charges, the assets being depreciated and amortized will often have to be replaced in the future, and Adjusted EBITDA does not reflect any cash requirements for such replacements; and our computations of Adjusted EBITDA may not be comparable to other similarly titled measures of other companies.