UNITED STATES
SECURITIES AND EXCHANGE COMMISSION
Washington, D.C. 20549
FORM N-CSR
CERTIFIED SHAREHOLDER REPORT OF REGISTERED
MANAGEMENT INVESTMENT COMPANIES
Investment Company Act file number | 811-22699 | |||||
| ||||||
Nuveen Preferred and Income Term Fund | ||||||
(Exact name of registrant as specified in charter) | ||||||
| ||||||
Nuveen Investments 333 West Wacker Drive Chicago, IL 60606 | ||||||
(Address of principal executive offices) (Zip code) | ||||||
| ||||||
Kevin J. McCarthy Nuveen Investments 333 West Wacker Drive Chicago, IL 60606 | ||||||
(Name and address of agent for service) | ||||||
| ||||||
Registrant’s telephone number, including area code: | (312) 917-7700 |
| ||||
| ||||||
Date of fiscal year end: | July 31 |
| ||||
| ||||||
Date of reporting period: | January 31, 2013 |
| ||||
Form N-CSR is to be used by management investment companies to file reports with the Commission not later than 10 days after the transmission to stockholders of any report that is required to be transmitted to stockholders under Rule 30e-1 under the Investment Company Act of 1940 (17 CFR 270.30e-1). The Commission may use the information provided on Form N-CSR in its regulatory, disclosure review, inspection, and policymaking roles.
A registrant is required to disclose the information specified by Form N-CSR, and the Commission will make this information public. A registrant is not required to respond to the collection of information contained in Form N-CSR unless the Form displays a currently valid Office of Management and Budget ("OMB") control number. Please direct comments concerning the accuracy of the information collection burden estimate and any suggestions for reducing the burden to Secretary, Securities and Exchange Commission, 450 Fifth Street, NW, Washington, DC 20549-0609. The OMB has reviewed this collection of information under the clearance requirements of 44 U.S.C. SS. 3507.
ITEM 1. REPORTS TO STOCKHOLDERS.

Closed-End Funds
Nuveen Investments
Closed-End Funds
Seeks to provide high current income and total return.
Semi-Annual Report
January 31, 2013

Nuveen Preferred and
Income Term Fund
JPI

LIFE IS COMPLEX.
Nuveen makes things e-simple.
It only takes a minute to sign up for e-Reports. Once enrolled, you'll receive an e-mail as soon as your Nuveen Fund information is ready. No more waiting for delivery by regular mail. Just click on the link within the e-mail to see the report and save it on your computer if you wish.
Free e-Reports right to your e-mail!
www.investordelivery.com
If you receive your Nuveen Fund distributions and statements from your financial advisor or brokerage account.
OR
www.nuveen.com/accountaccess
If you receive your Nuveen Fund distributions and statements directly from Nuveen.

Table of Contents
Chairman's Letter to Shareholders | 4 | ||||||
Portfolio Managers' Comments | 5 | ||||||
Fund Leverage and Other Information | 8 | ||||||
Share Distribution and Price Information | 10 | ||||||
Performance Overview | 11 | ||||||
Portfolio of Investments | 12 | ||||||
Statement of Assets and Liabilities | 15 | ||||||
Statement of Operations | 16 | ||||||
Statement of Changes in Net Assets | 17 | ||||||
Statement of Cash Flows | 18 | ||||||
Financial Highlights | 20 | ||||||
Notes to Financial Statements | 22 | ||||||
Reinvest Automatically, Easily and Conveniently | 28 | ||||||
Glossary of Terms Used in this Report | 30 | ||||||
Additional Fund Information | 35 | ||||||
Chairman's
Letter to Shareholders

Dear Shareholders,
Despite the global economy's ability to muddle through the many economic headwinds of 2012, investors continue to have good reasons to remain cautious. The European Central Bank's decisions to extend intermediate term financing to major European banks and to support sovereign debt markets have begun to show signs of a stabilized euro area financial market. The larger member states of the European Union (EU) are working diligently to strengthen the framework for a tighter financial and banking union and meaningful progress has been made by agreeing to centralize large bank regulation under the European Central Bank. However, economic conditions in the southern tier members are not improving and the pressures on their political leadership remain intense. The jury is out on whether the respective populations will support the continuing austerity measures that are needed to meet the EU fiscal targets.
In the U.S., the Fed remains committed to low interest rates into 2015 through its third program of Quantitative Easing (QE3). Inflation remains low but a growing number of economists are expressing concern about the economic distortions resulting from negative real interest rates. The highly partisan atmosphere in Congress led to a disappointingly modest solution for dealing with the end-of-year tax and spending issues. Early indications for the new Congressional term have not given much encouragement that the atmosphere for dealing with the sequestration legislation and the debt ceiling issues, let alone a more encompassing "grand bargain," will be any better than the last Congress. Over the longer term, there are some encouraging trends for the U.S. economy: house prices are beginning to recover, banks and corporations continue to strengthen their financial positions and incentives for capital investment in the U.S. by domestic and foreign corporations are increasing due to more competitive energy and labor costs.
During 2012 U.S. investors have benefited from strong returns in the domestic equity markets and solid returns in most fixed income markets. However, many of the macroeconomic risks of 2012 remain unresolved, including negotiating through the many U.S. fiscal issues, managing the risks of another year of abnormally low U.S. interest rates, sustaining the progress being made in the euro area and reducing the potential economic impact of geopolitical issues, particularly in the Middle East. In the face of these uncertainties, the experienced investment professionals at Nuveen Investments seek out investments that are enjoying positive economic conditions. At the same time they are always on the alert for risks in markets subject to excessive optimism or for opportunities in markets experiencing undue pessimism. Monitoring this process is a critical function for the Fund Board as it oversees your Nuveen Fund on your behalf.
As always, I encourage you to communicate with your financial consultant if you have any questions about your investment in a Nuveen Fund. On behalf of the other members of your Fund Board, we look forward to continuing to earn your trust in the months and years ahead.
Sincerely,

Robert P. Bremner
Chairman of the Board
March 25, 2013
Nuveen Investments
4
Portfolio Managers' Comments
Certain statements in this report are forward-looking statements. Discussions of specific investments are for illustration only and are not intended as recommendations of individual investments. The forward-looking statements and other views expressed herein are those of the portfolio managers as of the date of this report. Actual future results or occurrences may differ significantly from those anticipated in any forward-looking statements and the views expressed herein are subject to change at any time, due to numerous market and other factors. The Fund disclaims any obligation to update publicly or revise any forward-looking statements or views expressed herein.
Ratings shown are the highest rating given by one of the following national rating agencies: Standard & Poor's Group, Moody's Investors Service, Inc. or Fitch, Inc. Credit ratings are subject to change. AAA, AA, A and BBB are investment grade ratings; BB, B, CCC, CC, C and D are below investment grade ratings. Certain bonds backed by U.S. Government or agency securities are regarded as having an implied rating equal to the rating of such securities. Holdings designated N/R are not rated by these national rating agencies.
Nuveen Preferred and Income Term Fund (JPI)
The Nuveen Preferred and Income Term Fund features management by Nuveen Asset Management, LLC, an affiliate of Nuveen Investments. Douglas Baker, CFA, and Brenda Langenfeld, CFA, have served as the Fund's portfolio managers since its inception. Here the managers discuss the Fund's performance and its investment strategy for the six-month period ended January 31, 2013.
What key strategies were used to manage the Fund during the six-month period ending January 31, 2013?
The Fund seeks to achieve its investment objective of providing a high level of current income and total return by investing in preferred securities and other income producing securities. The Fund's portfolio is actively managed, seeking to capitalize on historically wide preferred credit spreads (the difference between current yields on preferred securities and U.S. Treasury bonds and other fixed income benchmarks) currently available in the market. The Fund's strategy focuses opportunistically on financial services companies.
We employed a credit based investment approach, which uses a top-down process that analyzes various structural dimensions of the preferred securities market, while also incorporating bottom-up fundamental credit research analysis. The process starts by identifying the investable universe of preferred securities, which encompasses both $1,000 par and $25 par securities. In an effort to capitalize on the inefficiencies between the different structure of the preferred securities market, we allocate capital between the $25 par exchange listed market and the $1,000 par over-the-counter market. Periods of volatility may drive valuations between these two markets to become meaningfully divided. This dynamic is often primarily due to periodic differences in how retail and institutional markets price risk. In addition, technical factors may also influence the relative valuations between $25 par exchange listed structures and $1,000 par over-the-counter structures.
We concentrated on highly regulated industries including the utility, insurance and banking sectors. The team conducts relative value analysis to determine sector allocations. After narrowing the universe through quantitative analysis, the investment team performs bottom-up fundamental credit research focusing on stable and improving credits. Based on this analysis, the investment team seeks to build a portfolio of preferred securities that offers the most attractive combination of value relative to other preferred securities with similar credit ratings, current income, subordination and call protection.
Nuveen Investments
5
Past performance is not predictive of future results. Current performance may be higher or lower than the data shown. Returns do not reflect the deduction of taxes that shareholders may have to pay on Fund distributions or upon the sale of Fund shares.
For additional information, see the Performance Overview page in this report.
* JPI Since inception returns are from 7/26/12.
** Refer to the Glossary of Terms Used in this Report for definitions. Indexes are not available for direct investment.
Under normal circumstances, the Fund invests at least 80% of its managed assets in preferred and other income producing securities issued by U.S. and non-U.S. companies, including debt securities, hybrid securities and convertible securities. The Fund also may invest in other sectors or industries, such as energy, industrials, utilities, pipelines, health care and telecommunications.
Preferred securities generally pay fixed or adjustable rate distributions to investors and have preference over common stock in the payment of distributions and the liquidation of a company's assets, but are junior to most forms of the company's debt, including both senior and subordinated debt. Preferred securities are typically rated between three and five notches below the senior debt ratings of any particular issuer. As such, preferred securities are in most cases issued by firms with investment grade quality senior debt ratings of BBB/Baa or higher. The weighted average senior debt rating of the companies underlying the Fund's initial portfolio is expected to be A+; however, the Fund's portfolio composition may vary over time. In addition, the Fund may invest up to 20% of its managed assets in securities issued by federal, state and local governments and U.S. government agencies.
During an environment of rising interest rates, preferreds, especially those with perpetual maturities and low fixed dividend rates will exhibit a measure of duration extension. While we do not foresee a significant rise in either longer term or short term interest rates through 2013, in that eventuality, we will invest in shorter duration preferred stocks with higher dividend rates as well as preferreds with floating rate features in order to mitigate price depreciation due to rising rates.
How did the Fund perform during this six-month period ending January 31, 2013?
The performance of the Fund, as well as comparative indexes are presented in the accompanying table.
Average Annual Total Returns on Common Share Net Asset Value (NAV)
For periods ended 1/31/13
| Cumulative 6-Month | Since Inception* | ||||||||||
JPI | 10.98 | % | 10.72 | % | |||||||
Bank of America / Merrill Lynch Preferred Stock Fixed Rate Index** | 3.49 | % | 3.55 | % | |||||||
Blended Benchmark Index** | 4.72 | % | 4.91 | % | |||||||
JPI outperformed both the Bank of America / Merrill Lynch Preferred Stock Fixed Rate Index and its Blended Benchmark Index during the period ended January 31, 2013. Several factors contributed to the Fund's outperformance versus its comparative indexes, including a relative overweight to $1,000 par structures versus $25 par structures, a relative overweight to the insurance sector versus the bank sector, a relative overweight to lower rated investment grade and below investment grade securities versus the index, and a relative overweight to the more subordinate tier-1 securities versus the relatively more senior lower tier-2 structures. In addition, the use of regulatory leverage was an important positive factor affecting the Fund's performance. Leverage is discussed in more detail later in this report.
Nuveen Investments
6
During the period, an overweight to $1,000 par structures contributed meaningfully to the Fund's outperformance versus the Blended Benchmark Index. The $1,000 par institutional side of the market significantly outperformed the $25 par retail side of the market. We did not find this relative performance surprising as the average option adjusted spread (OAS) valuation for the $25 par side of the market at the beginning of the period was meaningfully richer compared to the $1,000 par side of the market.
Another factor contributing to the Fund's relative outperformance was our overweight to the insurance sector versus the bank sector. While the financial services sector continued to perform well during the period, the insurance sub-sector outperformed the bank sub-sector's return. Supply from the insurance sub-sector remained relatively light during the reporting period, thus providing technical support for valuations across the sector. As has been the case for several quarters, investors continued to anticipate that insurance companies might buy back high coupon, long non-call, preferred/hybrid security structures. We believe this also helped the insurance sub-sector to outperform during the measurement period.
The Fund also benefited from an overweight to lower rated investment grade, below investment grade and more subordinate tier-1 securities versus the Blended Benchmark Index. During the reporting period, when credit spreads in general have contracted, lower rated investment grade and below investment grade securities, as well as more subordinate tier-1 securities, have tended to outperform their higher rated counterparts.
With respect to the Fund's allocation to lower investment grade and below investment grade securities, we continue to believe that this segment, over the long run, will likely provide a more compelling risk-adjusted return profile versus higher-rated preferred/hybrid securities. Lower-rated securities are often overlooked by both retail and institutional investors, and especially by those investors with investment grade only mandates. Below investment grade securities typically are not index eligible, limiting the potential investor base and frequently creating opportunities within this particular segment of the asset class. And while lower-rated preferred securities may exhibit periods of relatively higher price volatility, we believe the return potential is disproportionately higher due to inefficiencies inherent to the segment. It is important to remember that preferred/hybrid securities are often rated three to five notches below an issuer's senior unsecured debt rating. So, in most instances, a BB-rated preferred/hybrid security has been issued by an entity with an investment grade senior unsecured credit rating of BBB or higher.
Our team continued to monitor the Fund's portfolio and, in general, will rotate out of premium-priced bank issued trust preferred and enhanced trust preferred securities, and into similar structures priced at discounts to par. As a result of recent regulation affecting bank capital securities, issuers may have the right to redeem certain structures at par, sometimes well before an explicit call date listed on a security, or even for a security that appears to be non-callable. Discount-priced structures are a defensive measure against such redemptions, and thus these structures have outperformed similar premium-priced structures. As with previous measurement periods, the Fund did benefit marginally from increasingly stronger demand for discount priced structures from investors seeking similar defensive positioning.
Nuveen Investments
7
Fund Leverage
and Other Information
IMPACT OF THE FUND'S LEVERAGE STRATEGY ON PERFORMANCE
One important factor impacting the returns of the Fund relative to its benchmark was the Fund's use of leverage through bank borrowings. The Fund uses leverage because its managers believe that, over time, leveraging provides opportunities for additional income and total return for shareholders. However, use of leverage also can expose shareholders to additional volatility. For example, as the prices of securities held by the Fund decline, the negative impact of these valuation changes on NAV and total return is magnified by the use of leverage. Conversely, leverage may enhance returns during periods when the prices of securities held by the Fund generally are rising. Leverage had a positive impact on the performance of the Fund over this reporting period.
RISK CONSIDERATIONS
Fund shares are not guaranteed or endorsed by any bank or other insured depository institution, and are not federally insured by the Federal Deposit Insurance Corporation. Shares of closed-end funds are subject to investment risks, including the possible loss of principal invested. Past performance is no guarantee of future results.
Investment, Market and Price Risk. An investment in common shares is subject to investment risk, including the possible loss of the entire principal amount that you invest. Your investment in common shares represents an indirect investment in the corporate securities owned by the Fund, which generally trade in the over-the-counter markets. Shares of closed-end investment companies like the Fund frequently trade at a discount to their NAV. Your common shares at any point in time may be worth less than your original investment, even after taking into account the reinvestment of Fund dividends and distributions.
Leverage Risk. The Fund's use of leverage creates the possibility of higher volatility for the Fund's per share NAV, market price, and distributions. Leverage risk can be introduced through regulatory leverage (issuing preferred shares or debt borrowings at the Fund level) or through certain derivative investments held in the Fund's portfolio. Leverage typically magnifies the total return of the Fund's portfolio, whether that return is positive or negative. The use of leverage creates an opportunity for increased common share net income, but there is no assurance that the Fund's leveraging strategy will be successful.
Tax Risk. The tax treatment of Fund distributions may be affected by new IRS interpretations of the Internal Revenue Code and future changes in tax laws and regulations.
Nuveen Investments
8
Issuer Credit Risk. This is the risk that a security in the Fund's portfolio will fail to make dividend or interest payments when due.
Interest Rate Risk. Fixed-income securities such as bonds, preferred, convertible and other debt securities will decline in value if market interest rates rise.
Reinvestment Risk. If market interest rates decline, income earned from the Fund's portfolio may be reinvested at rates below that of the original bond that generated the income.
Preferred Stock Risk. Preferred stocks are subordinated to bonds and other debt instruments in a company's capital structure, and therefore are subject to greater credit risk.
Call Risk or Prepayment Risk. Issuers may exercise their option to prepay principal earlier than scheduled, forcing the Fund to reinvest in lower-yielding securities.
Non-U.S. Securities Risk. Investments in non-U.S securities involve special risks not typically associated with domestic investments including currency risk and adverse political, social and economic developments. These risks often are magnified in emerging markets.
Nuveen Investments
9
Share Distribution and
Price Information
Distribution Information
The following information regarding the Fund's distributions is current as of January 31, 2013, and will likely vary over time based on the Fund's investment activity and portfolio investment value changes.
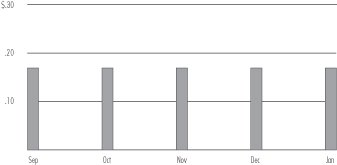
During the six-month reporting period, the Fund declared its initial distribution to shareholders of $0.1690 in September 2012, which remained stable during the period.
The Fund employs financial leverage through the use of bank borrowings. Financial leverage provides the potential for higher earnings (net investment income), total returns and distributions over time, but-as noted earlier-also increases the variability of shareholders' NAV per share in response to changing market conditions.
During certain periods, the Fund may pay dividends at a rate that may be more or less than the amount of net investment income actually earned by the Fund during the period. If the Fund has cumulatively earned more than it has paid in dividends, it holds excess in reserve as undistributed net investment income (UNII) as part of the Fund's NAV. Conversely, if the Fund has cumulatively paid dividends in excess of earnings, the excess constitutes negative UNII that is likewise reflected in the Fund's NAV. The Fund will, over time, pay all of its net investment income as dividends to shareholders. As of January 31, 2013, the Fund had positive UNII balance, based upon our best estimate, for tax purposes and a positive UNII balance for financial reporting purposes.
Price Information
During November 2012, the Nuveen Funds Board of Directors/Trustees authorized the Fund's open-market share repurchase program, allowing the Fund to repurchase an aggregate of up to approximately 10% of its outstanding common shares. The Fund has not repurchased any of its outstanding common shares since the inception of its share repurchase program.
As of January 31, 2013, and during the six-month reporting period, the Fund was trading at a (+) premium/(-) discount to its common share NAV as shown in the accompanying table.
1/31/13 | Six-Month | ||||||||||
JPI | (-)1.49% | (+)2.02% | |||||||||
Nuveen Investments
10
JPI
Performance
OVERVIEW
Nuveen Preferred and Income Term Fund
as of January 31, 2013
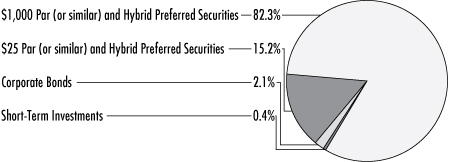
Portfolio Allocation (as a % of total investments)1
2012-2013 Monthly Dividends Per Share3
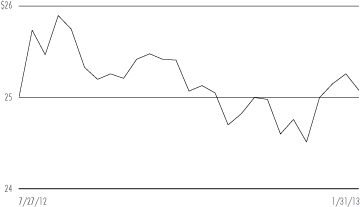
Share Price Performance — Weekly Closing Price
Refer to the Glossary of Terms Used in this Report for further definition of the terms used within this Fund's Performance Overview Page.
1 Holdings are subject to change.
2 Excluding short-term investments.
3 The Fund declared its initial dividend to shareholders in September 2012.
Fund Snapshot
Share Price | $ | 25.08 | |||||
Net Asset Value (NAV) | $ | 25.46 | |||||
Premium/(Discount) to NAV | -1.49 | % | |||||
Latest Dividend | $ | 0.169 | |||||
Market Yield | 8.09 | % | |||||
Net Assets ($000) | $ | 579,249 | |||||
Leverage
Regulatory Leverage | 27.98 | % | |||||
Effective Leverage | 27.98 | % | |||||
Cumulative Total Returns
(Inception 7/26/12)
On Share Price | On NAV | ||||||||||
| 6-Month | 2.13 | % | 10.98 | % | |||||||
Since Inception | 4.17 | % | 10.72 | % | |||||||
Portfolio Composition
(as a % of total investments)1
Insurance | 49.0 | % | |||||
Commercial Banks | 28.5 | % | |||||
Diversified Financial Services | 18.4 | % | |||||
Capital Markets | 3.3 | % | |||||
Real Estate Investment Trust | 0.4 | % | |||||
Short-Term Investments | 0.4 | % | |||||
Country Allocation
(as a % of total investments)1
United States | 59.8 | % | |||||
United Kingdom | 11.7 | % | |||||
Netherlands | 10.8 | % | |||||
France | 8.8 | % | |||||
Spain | 4.1 | % | |||||
Australia | 2.4 | % | |||||
Switzerland | 1.9 | % | |||||
Germany | 0.4 | % | |||||
Japan | 0.1 | % | |||||
Top Five Issuers
(as a % of total investments)1,2
Rabobank Nederland | 5.4 | % | |||||
JPMorgan Chase & Company | 5.3 | % | |||||
MetLife Inc. | 5.2 | % | |||||
Wells Fargo & Company | 5.1 | % | |||||
ING Groep N.V. | 5.0 | % | |||||
Nuveen Investments
11
JPI
Nuveen Preferred and Income Term Fund
Portfolio of INVESTMENTS
January 31, 2013 (Unaudited)
| Shares | Description (1) | Coupon | Ratings (2) | Value | |||||||||||||||||||
$25 Par (or similar) and Hybrid Preferred Securities – 20.9% (15.2% of Total Investments) | |||||||||||||||||||||||
Capital Markets – 0.6% | |||||||||||||||||||||||
| 6,638 | Deutsche Bank Capital Funding Trust I | 7.350 | % | BBB | $ | 168,340 | |||||||||||||||||
| 50,000 | Deutsche Bank Capital Funding Trust V | 8.050 | % | BBB | 1,422,000 | ||||||||||||||||||
| 16,894 | Deutsche Bank Capital Funding Trust VIII | 6.375 | % | BBB | 428,432 | ||||||||||||||||||
| 25,000 | Morgan Stanley Capital Trust VI | 6.600 | % | BB+ | 631,000 | ||||||||||||||||||
| 25,000 | Morgan Stanley Capital Trust VII | 6.600 | % | BB+ | 630,500 | ||||||||||||||||||
Total Capital Markets | 3,280,272 | ||||||||||||||||||||||
Commercial Banks – 7.1% | |||||||||||||||||||||||
| 220,000 | Barclays Bank PLC | 8.125 | % | BBB | 5,691,400 | ||||||||||||||||||
| 282,200 | Cobank Agricultural Credit Bank, (3) | 6.250 | % | A- | 30,036,663 | ||||||||||||||||||
| 100,000 | Cobank Agricultural Credit Bank, (3) | 11.000 | % | A- | 5,678,130 | ||||||||||||||||||
Total Commercial Banks | 41,406,193 | ||||||||||||||||||||||
Diversified Financial Services – 6.8% | |||||||||||||||||||||||
| 840,603 | ING Groep N.V | 8.500 | % | BBB- | 21,981,768 | ||||||||||||||||||
| 651,000 | ING Groep N.V | 7.375 | % | BBB- | 16,483,320 | ||||||||||||||||||
| 40,000 | ING Groep N.V | 7.200 | % | BBB- | 1,014,000 | ||||||||||||||||||
Total Diversified Financial Services | 39,479,088 | ||||||||||||||||||||||
Insurance – 6.4% | |||||||||||||||||||||||
| 15,000 | Aegon N.V | 8.000 | % | Baa1 | 418,950 | ||||||||||||||||||
| 100,000 | Aegon N.V | 6.500 | % | Baa1 | 2,515,000 | ||||||||||||||||||
| 50,000 | Allianz SE, (3) | 8.375 | % | A+ | 1,287,500 | ||||||||||||||||||
| 43,000 | Arch Capital Group Limited | 6.750 | % | BBB | 1,154,550 | ||||||||||||||||||
| 50,000 | Aspen Insurance Holdings Limited | 7.250 | % | BBB- | 1,343,000 | ||||||||||||||||||
| 182,123 | Axis Capital Holdings Limited | 6.875 | % | BBB | 4,971,958 | ||||||||||||||||||
| 375,000 | Endurance Specialty Holdings Limited | 7.500 | % | BBB- | 10,308,750 | ||||||||||||||||||
| 400,000 | Maiden Holdings Limited | 8.250 | % | BB | 10,576,000 | ||||||||||||||||||
| 130,000 | PartnerRe Limited | 7.250 | % | BBB+ | 3,588,000 | ||||||||||||||||||
| 21,134 | Reinsurance Group of America Inc. | 6.200 | % | BBB | 569,984 | ||||||||||||||||||
| 13,774 | Selective Insurance Group | 7.500 | % | Baa3 | 349,859 | ||||||||||||||||||
Total Insurance | 37,083,551 | ||||||||||||||||||||||
Total $25 Par (or similar) and Hybrid Preferred Securities (cost $119,364,460) | 121,249,104 | ||||||||||||||||||||||
| Principal Amount (000) | Description (1) | Coupon | Maturity | Ratings (2) | Value | ||||||||||||||||||
Corporate Bonds – 2.8% (2.1% of Total Investments) | |||||||||||||||||||||||
Insurance – 2.8% | |||||||||||||||||||||||
$ | 11,430 | Nationwide Mutual Insurance Company, 144A | 9.375 | % | 8/15/39 | A- | $ | 16,490,907 | |||||||||||||||
$ | 11,430 | Total Corporate Bonds (cost $15,564,713) | 16,490,907 | ||||||||||||||||||||
Nuveen Investments
12
| Principal Amount (000)/ Shares | Description (1) | Coupon | Maturity | Ratings (2) | Value | ||||||||||||||||||
$1,000 Par (or similar) and Hybrid Preferred Securities – 113.4% (82.3% of Total Investments) | |||||||||||||||||||||||
Capital Markets – 4.0% | |||||||||||||||||||||||
$ | 8,710 | Aberdeen Asset Management PLC, (4) | 7.900 | % | 12/31/49 | N/R | $ | 8,840,650 | |||||||||||||||
| 1,000 | Credit Suisse Guernsey, Reg S | 7.875 | % | 2/24/41 | BBB- | 1,042,500 | |||||||||||||||||
| 1,972 | Macquarie PMI LLC, (4) | 8.375 | % | 12/31/49 | BB+ | 2,041,020 | |||||||||||||||||
| 10,000 | UBS AG Stamford | 7.625 | % | 8/17/22 | BBB | 10,987,410 | |||||||||||||||||
Total Capital Markets | 22,911,580 | ||||||||||||||||||||||
Commercial Banks – 32.0% | |||||||||||||||||||||||
| 7,275 | Banco Santander Finance, (4) | 7.908 | % | 6/13/36 | Ba1 | 7,566,000 | |||||||||||||||||
| 20,440 | Banco Santander Finance, (4) | 10.500 | % | N/A (5) | BB | 21,567,654 | |||||||||||||||||
| 13,000 | Barclays Bank PLC, 144A, (4) | 10.179 | % | 6/12/21 | A- | 17,607,460 | |||||||||||||||||
| 25,400 | BNP Paribas, 144A, (4) | 7.195 | % | N/A (5) | BBB | 26,428,700 | |||||||||||||||||
| 2,061 | HSBC Capital Funding LP, (4) | 10.176 | % | N/A (5) | BBB+ | 2,926,620 | |||||||||||||||||
| 7,000 | PNC Financial Services Inc., (4) | 6.750 | % | N/A (5) | BBB | 8,031,870 | |||||||||||||||||
| 32,303 | Rabobank Nederland, 144A, (4) | 11.000 | % | N/A (5) | A- | 43,285,350 | |||||||||||||||||
| 2,473 | Royal Bank of Scotland Group PLC, (4) | 7.648 | % | 12/31/49 | BB | 2,609,015 | |||||||||||||||||
| 13,956 | Societe Generale, (4) | 8.750 | % | N/A (5) | BBB- | 14,584,020 | |||||||||||||||||
| 35,650 | Wells Fargo & Company, (4) | 7.980 | % | N/A (5) | BBB+ | 40,997,500 | |||||||||||||||||
Total Commercial Banks | 185,604,189 | ||||||||||||||||||||||
Diversified Financial Services – 18.5% | |||||||||||||||||||||||
| 20,845 | Bank of America Corporation, (4) | 8.000 | % | N/A (5) | BB+ | 23,496,276 | |||||||||||||||||
| 5,000 | Citigroup Inc., (4) | 5.950 | % | 12/31/49 | BB | 5,050,000 | |||||||||||||||||
| 31,600 | General Electric Capital Corporation, (4) | 7.125 | % | N/A (5) | AA- | 36,237,300 | |||||||||||||||||
| 36,650 | JPMorgan Chase & Company, (4) | 7.900 | % | N/A (5) | BBB | 42,162,160 | |||||||||||||||||
Total Diversified Financial Services | 106,945,736 | ||||||||||||||||||||||
Insurance – 58.3% | |||||||||||||||||||||||
| 12,701 | American General Capital II, (4) | 8.500 | % | 7/01/30 | Baa2 | 16,387,097 | |||||||||||||||||
| 6,680 | American International Group, Inc., (4) | 8.175 | % | 5/05/68 | BBB | 8,684,000 | |||||||||||||||||
| 17,300 | Aviva PLC, Reg S, (4) | 8.250 | % | 12/31/49 | Baa1 | 18,277,450 | |||||||||||||||||
| 29,660 | AXA SA, 144A, (4) | 6.380 | % | N/A (5) | Baa1 | 29,511,700 | |||||||||||||||||
| 29,060 | Catlin Insurance Company Limited, (4) | 7.249 | % | N/A (5) | BBB+ | 29,568,550 | |||||||||||||||||
| 2,640 | Cloverie PLC Zurich Insurance, (4) | 8.250 | % | N/A (5) | A | 3,003,000 | |||||||||||||||||
| 1,000 | Dai-Ichi Mutual Life, 144A, (4) | 7.250 | % | 12/31/49 | A3 | 1,126,034 | |||||||||||||||||
| 36,660 | Financial Security Assurance Holdings, 144A, (4) | 6.400 | % | 12/15/66 | BBB | 32,627,400 | |||||||||||||||||
| 35,640 | Glen Meadows Pass Through Trust, (4) | 6.505 | % | 2/12/67 | BB+ | 32,877,900 | |||||||||||||||||
| 2,950 | Liberty Mutual Group Inc., 144A, (4) | 10.750 | % | 6/15/58 | Baa3 | 4,484,000 | |||||||||||||||||
| 17,698 | Lincoln National Corporation, (4) | 7.000 | % | 5/17/66 | BBB | 18,158,148 | |||||||||||||||||
| 23,555 | MetLife Capital Trust X, 144A, (4) | 9.250 | % | 4/8/38 | BBB | 32,388,125 | |||||||||||||||||
| 5,790 | MetLife Inc., (4) | 10.750 | % | 8/1/39 | BBB | 8,887,650 | |||||||||||||||||
| 30,849 | Prudential Financial Inc., (4) | 8.875 | % | 6/15/38 | BBB+ | 37,404,413 | |||||||||||||||||
| 5,000 | Prudential PLC, (4) | 7.750 | % | 12/31/49 | A- | 5,335,000 | |||||||||||||||||
| 2,000 | Prudential PLC, (4) | 6.500 | % | N/A (5) | A- | 1,990,000 | |||||||||||||||||
| 16,410 | QBE Capital Funding Trust II, 144A | 7.250 | % | 5/24/41 | BBB+ | 16,984,350 | |||||||||||||||||
| 7,183 | Reinsurance Group of America Inc., (4) | 6.750 | % | 12/15/65 | BBB- | 7,326,660 | |||||||||||||||||
| 28,226 | Symetra Financial Corporation, 144A, (4) | 8.300 | % | 10/15/37 | BBB- | 29,778,430 | |||||||||||||||||
| 2,000 | White Mountains Re Group Limited, (4) | 7.506 | % | N/A (5) | BB+ | 2,120,419 | |||||||||||||||||
Total Insurance | 336,920,326 | ||||||||||||||||||||||
Real Estate Investment Trust – 0.6% | |||||||||||||||||||||||
| 3 | Sovereign Real Estate Investment Trust, 144A, (4) | 12.000 | % | N/A (5) | Ba1 | $ | 3,640,814 | ||||||||||||||||
$1,000 Par (or similar) and Hybrid Preferred Securities (cost $623,245,787) | 656,022,645 | ||||||||||||||||||||||
Nuveen Investments
13
JPI
Nuveen Preferred and Income Term Fund (continued)
Portfolio of INVESTMENTS January 31, 2013 (Unaudited)
| Principal Amount (000) | Description (1) | Coupon | Maturity | Ratings (2) | Value | ||||||||||||||||||
Short-Term Investments – 0.5% (0.4% of Total Investments) | |||||||||||||||||||||||
$ | 3,028 | Repurchase Agreement with Fixed Income Clearing Corporation, dated 1/31/13, repurchase price $3,028,369, collateralized by $3,110,000 U.S. Treasury Notes, 0.625%, due 9/30/17, value $3,091,785 | 0.010 | % | 2/01/13 | $ | 3,028,368 | ||||||||||||||||
Total Short-Term Investments (cost $3,028,368) | 3,028,368 | ||||||||||||||||||||||
Total Investments (cost $761,203,328) – 137.6% | 796,791,024 | ||||||||||||||||||||||
Borrowings – (38.8)% (6) (7) | (225,000,000 | ) | |||||||||||||||||||||
Other Assets Less Liabilities – 1.2% | 7,457,793 | ||||||||||||||||||||||
Net Assets – 100% | $ | 579,248,817 | |||||||||||||||||||||
For Fund portfolio compliance purposes, the Fund's industry classifications refer to any one or more of the industry sub-classifications used by one or more widely recognized market indexes or ratings group indexes, and/or as defined by Fund management. This definition may not apply for purposes of this report, which may combine industry sub-classifications into sectors for reporting ease.
(1) All percentages shown in the Portfolio of Investments are based on net assets.
(2) Ratings: Using the highest of Standard & Poor's Group ("Standard & Poor's"), Moody's Investors Service, Inc. ("Moody's") or Fitch, Inc. ("Fitch") rating. Ratings below BBB by Standard & Poor's, Baa by Moody's or BBB by Fitch are considered to be below investment grade. Holdings designated N/R are not rated by any of these national rating agencies.
(3) For fair value measurement disclosure purposes, $25 Par (or similar) and Hybrid Preferred Securities classified as Level 2. See Notes to Financial
Statements—General Information and Significant Accounting Policies, Investment Valuation for more information.
(4) For fair value measurement disclosure purposes, $1,000 Par (or similar) and Hybrid Preferred Securities classified as Level 2. See Notes to Financial
Statements—General Information and Significant Accounting Policies, Investment Valuation for more information.
(5) Perpetual security. Maturity date is not applicable.
(6) The Fund may pledge up to 100% of its eligible investments in the Portfolio of Investments as collateral for Borrowings. As of January 31, 2013, investments with a value of $576,668,982 have been pledged as collateral for Borrowings.
(7) Borrowings as a percentage of total investments is 28.2%.
N/R Not rated.
144A Investment is exempt from registration under Rule 144A of the Securities Act of 1933, as amended. These investments may only be resold in transactions exempt from registration, which are normally those transactions with qualified institutional buyers.
Reg S Regulation S allows U.S. companies to sell securities to persons or entities located outside of the United States without registering those securities with the Securities and Exchange Commission. Specifically, Regulation S provides a safe harbor from the registration requirements of the Securities Act for the offers and sales of securities by both foreign and domestic issuers that are made outside the United States.
N/A Not applicable.
See accompanying notes to financial statements.
Nuveen Investments
14
Statement of
ASSETS & LIABILITIES
January 31, 2013 (Unaudited)
Assets | |||||||
Investments, at value (cost $761,203,328) | $ | 796,791,024 | |||||
Receivables: | |||||||
Dividends | 16,688 | ||||||
Interest | 11,362,459 | ||||||
Investments sold | 1,695,085 | ||||||
Other assets | 8,972 | ||||||
Total assets | 809,874,228 | ||||||
Liabilities | |||||||
Borrowings | 225,000,000 | ||||||
Payables: | |||||||
Dividends | 3,787,235 | ||||||
Investments purchased | 1,083,750 | ||||||
Accrued expenses: | |||||||
Interest on borrowings | 14,513 | ||||||
Management fees | 586,519 | ||||||
Trustees fees | 13,610 | ||||||
Other | 139,784 | ||||||
Total liabilities | 230,625,411 | ||||||
Net assets | $ | 579,248,817 | |||||
Shares outstanding | 22,752,777 | ||||||
Net asset value per share outstanding | $ | 25.46 | |||||
Net assets consist of: | |||||||
Shares, $.01 par value per share | $ | 227,528 | |||||
Paid-in surplus | 541,912,539 | ||||||
Undistributed (Over-distribution of) net investment income | 502,657 | ||||||
Accumulated net realized gain (loss) | 1,018,397 | ||||||
Net unrealized appreciation (depreciation) | 35,587,696 | ||||||
Net assets | $ | 579,248,817 | |||||
Authorized shares | Unlimited | ||||||
See accompanying notes to financial statements.
Nuveen Investments
15
Statement of
OPERATIONS
Six Months Ended January 31, 2013 (Unaudited)
Investment Income | |||||||
Dividends (net of tax withheld of $1,125) | $ | 3,752,160 | |||||
Interest | 20,818,762 | ||||||
Total investment income | 24,570,922 | ||||||
Expenses | |||||||
Management fees | 3,178,808 | ||||||
Interest expense on borrowings | 1,435,811 | ||||||
Shareholder servicing agent fees and expenses | 507 | ||||||
Custodian fees and expenses | 39,147 | ||||||
Trustees fees and expenses | 28,008 | ||||||
Professional fees | 26,909 | ||||||
Shareholder reporting expenses | 81,517 | ||||||
Stock exchange listing fees | 718 | ||||||
Investor relations expense | 36,499 | ||||||
Other expenses | 4,576 | ||||||
Total expenses | 4,832,500 | ||||||
Net investment income (loss) | 19,738,422 | ||||||
Realized and Unrealized Gain (Loss) | |||||||
Net realized gain (loss) from investments | 3,232,242 | ||||||
Change in net unrealized appreciation (depreciation) of investments | 35,922,927 | ||||||
Net realized and unrealized gain (loss) | 39,155,169 | ||||||
Net increase (decrease) in net assets from operations | $ | 58,893,591 | |||||
See accompanying notes to financial statements.
Nuveen Investments
16
Statement of
CHANGES in NET ASSETS (Unaudited)
| Six Months Ended 1/31/13 | For the Period 7/26/12 (commencement of operations) through 7/31/12 | ||||||||||
Operations | |||||||||||
Net investment income (loss) | $ | 19,738,422 | $ | (12,585 | ) | ||||||
Net realized gain (loss) from investments | 3,232,242 | — | |||||||||
Change in net unrealized appreciation (depreciation) of investments | 35,922,927 | (335,231 | ) | ||||||||
Net increase (decrease) in net assets from operations | 58,893,591 | (347,816 | ) | ||||||||
Distributions to Shareholders | |||||||||||
From net investment income | (19,223,180 | ) | — | ||||||||
From accumulated net realized gains | (2,213,845 | ) | — | ||||||||
Decrease in net assets from distributions to shareholders | (21,437,025 | ) | — | ||||||||
Capital Share Transactions | |||||||||||
Proceeds from sale of shares, net of offering costs | 65,316,610 | 476,500,000 | |||||||||
Net proceeds from shares issued to shareholders due to reinvestment of distributions | 223,182 | — | |||||||||
Net increase (decrease) in net assets from capital share transactions | 65,539,792 | 476,500,000 | |||||||||
Net increase (decrease) in net assets | 102,996,358 | 476,152,184 | |||||||||
Net assets at the beginning of period | 476,252,459 | 100,275 | |||||||||
Net assets at the end of period | $ | 579,248,817 | $ | 476,252,459 | |||||||
Undistributed (Over-distribution of) net investment income at the end of period | $ | 502,657 | $ | (12,585 | ) | ||||||
See accompanying notes to financial statements.
Nuveen Investments
17
Statement of
CASH FLOWS
Six Months Ended January 31, 2013 (Unaudited)
Cash Flows from Operating Activities: | |||||||
Net Increase (Decrease) in Net Assets from Operations | $ | 58,893,591 | |||||
| Adjustments to reconcile the net increase (decrease) in net assets from operations to net cash provided by (used in) operating activities: | |||||||
Purchases of investments | (867,076,500 | ) | |||||
Proceeds from sales and maturities of investments | 168,843,041 | ||||||
Proceeds from (Purchases of) short-term investments, net | 473,571,907 | ||||||
Amortization (Accretion) of premiums and discounts, net | 185,351 | ||||||
(Increase) Decrease in: | |||||||
Receivable for dividends | (16,688 | ) | |||||
Receivable for interest | (10,630,576 | ) | |||||
Receivable for investments sold | (1,695,085 | ) | |||||
Receivable for reclaims | 8,250 | ||||||
Other assets | (8,972 | ) | |||||
Increase (Decrease) in: | |||||||
Payable for investments purchased | (56,550,860 | ) | |||||
Accrued interest on borrowings | 14,513 | ||||||
Accrued management fees | 586,154 | ||||||
Accrued trustees fees | 13,565 | ||||||
Accrued other expenses | 138,476 | ||||||
Net realized gain (loss) from investments | (3,232,242 | ) | |||||
Change in net unrealized (appreciation) depreciation of investments | (35,922,927 | ) | |||||
Net cash provided by (used in) operating activities | (272,879,002 | ) | |||||
Cash Flows from Financing Activities: | |||||||
Increase in borrowings | 225,000,000 | ||||||
Increase (decrease) in accrued organization and offering costs | (11,000 | ) | |||||
Cash distribution paid to shareholders | (17,426,608 | ) | |||||
Proceeds from sale of shares, net of offering costs | 65,316,610 | ||||||
Net cash provided by (used in) financing activities | 272,879,002 | ||||||
Net Increase (Decrease) in Cash | — | ||||||
Cash at the beginning of period | — | ||||||
Cash at the End of Period | $ | — | |||||
Supplemental Disclosure of Cash Flow Information | |||||||
Cash paid for interest on borrowings (excluding borrowing costs) was $1,083,798. | |||
Non-cash financing activities not included herein consists of reinvestments of distributions of $223,182. | |||
See accompanying notes to financial statements.
Nuveen Investments
18
Intentionally Left Blank
Nuveen Investments
19
Financial
HIGHLIGHTS (Unaudited)
Selected data for a share outstanding throughout each period:
Investment Operations | Less Distributions | ||||||||||||||||||||||||||||||
| Beginning Net Asset Value | Net Investment Income (Loss)(a) | Net Realized/ Unrealized Gain (Loss) | Total | From Net Investment Income | From Accumulated Net Realized Gains | Total | |||||||||||||||||||||||||
Year Ended 7/31: | |||||||||||||||||||||||||||||||
2013 | (e) | $ | 23.81 | $ | .88 | $ | 1.73 | $ | 2.61 | $ | (.86 | ) | $ | (.10 | ) | $ | (.96 | ) | |||||||||||||
2012 | (d) | 23.88 | — | * | (.02 | ) | (.02 | ) | — | — | — | ||||||||||||||||||||
Borrowings at End of Period(f) | |||||||||||
| Aggregate Amount Outstanding (000) | Asset Coverage Per $1,000 | ||||||||||
Year Ended 7/31: | |||||||||||
| 2013(e) | $ | 225,000 | $ | 3,574 | |||||||
(a) Per share Net Investment Income (Loss) is calculated using the average daily shares method.
(b) Total Return Based on Market Value is the combination of changes in the market price per share and the effect of reinvested dividend income and reinvested capital gains distributions, if any, at the average price paid per share at the time of reinvestment. The last dividend declared in the period, which is typically paid on the first business day of the following month, is assumed to be reinvested at the ending market price. The actual reinvestment for the last dividend declared in the period may take place over several days, and in some instances may not be based on the market price, so the actual reinvestment price may be different from the price used in the calculation. Total returns are not annualized.
Total Return Based on Net Asset Value is the combination of changes in net asset value, reinvested dividend income at net asset value and reinvested capital gains distributions at net asset value, if any. The last dividend declared in the period, which is typically paid on the first business day of the following month, is assumed to be reinvested at the ending net asset value. The actual reinvest price for the last dividend declared in the period may often be based on the Fund's market price (and not its net asset value), and therefore may be different from the price used in the calculation. Total returns are not annualized.
Nuveen Investments
20
Ratios/Supplemental Data | |||||||||||||||||||||||||||||||||||||||
Total Returns | Ratios to Average Net Assets(c) | ||||||||||||||||||||||||||||||||||||||
| Offering Costs | Ending Net Asset Value | Ending Market Value | Based on Market Value(b) | Based on Net Asset Value(b) | Ending Net Assets (000) | Expenses | Net Investment Income (Loss) | Portfolio Turnover Rate | |||||||||||||||||||||||||||||||
Year Ended 7/31: | |||||||||||||||||||||||||||||||||||||||
2013 | (e) | $ | — | * | $ | 25.46 | $ | 25.08 | 2.13 | % | 10.98 | % | $ | 579,249 | 1.74 | %** | 7.10 | %** | 27 | % | |||||||||||||||||||
2012 | (d) | (0.05 | ) | 23.81 | 25.50 | 2.00 | (.23 | ) | 476,252 | .97 | ** | (.96 | )** | 0 | |||||||||||||||||||||||||
(c) • Net Investment Income (Loss) ratios reflect income earned and expenses incurred on assets attributable to borrowings, where applicable.
• Each ratio includes the effect of all interest expense paid and other costs related to borrowings as follows:
| Ratios of Borrowings Interest Expense to Average Net Assets(f) | |||||||
Year Ended 7/31: | |||||||
| 2013(e) | .52 | %** | |||||
(d) For the period July 26, 2012 (commencement of operations) through July 31, 2012.
(e) For the six months ended January 31, 2013.
(f) The Fund did not utilize borrowings during the period July 26, 2012 (commencement of operations) through July 31, 2012.
* Rounds to less than $.01 per share.
** Annualized.
See accompanying notes to financial statements.
Nuveen Investments
21
Notes to
FINANCIAL STATEMENTS (Unaudited)
1. General Information and Significant Accounting Policies
General Information
Nuveen Preferred and Income Term Fund (the "Fund") is a non-diversified, closed-end registered investment company registered under the Investment Company Act of 1940, as amended. The Fund's shares are listed on the New York Stock Exchange ("NYSE") and trade under the ticker symbol "JPI." The Fund was organized as a Massachusetts business trust on April 18, 2012.
On December 31, 2012, the Fund's investment adviser converted from a Delaware corporation to a Delaware limited liability company. As a result, Nuveen Fund Advisers, Inc., a wholly-owned subsidiary of Nuveen Investments, Inc. ("Nuveen"), changed its name to Nuveen Fund Advisers, LLC (the "Adviser"). There were no changes to the identities or roles of any personnel as a result of the change.
The Fund's investment objective is to provide a high level of current income and total return. The Fund seeks to achieve its investment objective by investing in preferred securities and other income producing securities. Under normal market conditions, the Fund will invest at least 80% of its managed assets (as defined in Footnote 7—Management Fees and Other Transactions with Affiliates) in preferred and other income producing securities. The Fund will invest at least 60% of its managed assets in securities rated investment grade (BBB-/Baa3 or higher) at the time of purchase. The Fund will invest 100% of its managed assets in U.S. dollar denominated securities. The Fund will also invest up to 40% of its managed assets in securities issued by non-U.S. domiciled companies.
Significant Accounting Policies
The following is a summary of significant accounting policies followed by the Fund in the preparation of its financial statements in accordance with U.S. generally accepted accounting principles ("U.S. GAAP").
Investment Valuation
Common stocks and other equity-type securities are valued at the last sales price on the securities exchange on which such securities are primarily traded and are generally classified as Level 1 for fair value measurement purposes. Securities primarily traded on the NASDAQ National Market ("NASDAQ") are valued, except as indicated below, at the NASDAQ Official Closing Price and are generally classified as Level 1. However, securities traded on a securities exchange or NASDAQ for which there were no transactions on a given day or securities not listed on a securities exchange or NASDAQ are valued at the quoted bid price and are generally classified as Level 2.
Prices of fixed-income securities are provided by a pricing service approved by the Fund's Board of Trustees. These securities are generally classified as Level 2. The pricing service establishes a security's fair value using methods that may include consideration of the following: yields or prices of investments of comparable quality, type of issue, coupon, maturity and rating, market quotes or indications of value from security dealers, evaluations of anticipated cash flows or collateral, general market conditions and other information and analysis, including the obligor's credit characteristics considered relevant. In pricing certain securities, particularly less liquid and lower quality securities, the pricing service may consider information about a security, its issuer, or market activity provided by the Adviser. These securities are generally classified as Level 2 or Level 3 depending on the priority of the significant inputs.
Repurchase agreements are valued at contract amount plus accrued interest, which approximates market value. These securities are generally classified as Level 2.
Certain securities may not be able to be priced by the pre-established pricing methods as described above. Such securities may be valued by the Fund's Board of Trustees or its designee at fair value. These securities generally include, but are not limited to, restricted securities (securities which may not be publicly sold without registration under the Securities Act of 1933, as amended) for which a pricing service is unable to provide a market price; securities whose trading has been formally suspended; debt securities that have gone into default and for which there is no current market quotation; a security whose market price is not available from a pre-established pricing source; a security with respect to which an event has occurred that is likely to materially affect the value of the security after the market has closed but before the calculation of the Fund's net asset value (as may be the case in non-U.S. markets on which the security is primarily traded) or make it difficult or impossible to obtain a reliable market quotation; and a security whose price, as provided by the pricing service, is not deemed to reflect the security's fair value. As a general principle, the fair value of a security would appear to be the
Nuveen Investments
22
amount that the owner might reasonably expect to receive for it in a current sale. A variety of factors may be considered in determining the fair value of such securities, which may include consideration of the following: yields or prices of investments of comparable quality, type of issue, coupon, maturity and rating, market quotes or indications of value from security dealers, evaluations of anticipated cash flows or collateral, general market conditions and other information and analysis, including the obligor's credit characteristics considered relevant. These securities are generally classified as Level 2 or Level 3 depending on the priority of the significant inputs. Regardless of the method employed to value a particular security, all valuations are subject to review by the Fund's Board of Trustees or its designee.
Refer to Footnote 2—Fair Value Measurements for further details on the leveling of securities held by the Fund as of the end of the reporting period.
Investment Transactions
Investment transactions are recorded on a trade date basis. Realized gains and losses from investment transactions are determined on the specific identification method, which is the same basis used for federal income tax purposes. Investments purchased on a when-issued/delayed delivery basis may have extended settlement periods. Any investments so purchased are subject to market fluctuation during this period. The Fund has instructed the custodian to earmark securities in the Fund's portfolio with a current value at least equal to the amount of the when-issued/delayed delivery purchase commitments. As of January 31, 2013, the Fund had no such outstanding purchase commitments.
Investment Income
Dividend income is recorded on the ex-dividend date or, for foreign securities, when information is available. Interest income, which reflects the amortization of premiums and includes accretion of discounts for financial reporting purposes, is recorded on an accrual basis. Interest income also reflects paydown gains and losses, if any.
Professional Fees
Professional fees presented on the Statement of Operations consist of legal fees incurred in the normal course of operations, audit fees, tax consulting fees and, in some cases, workout expenditures. Workout expenditures are incurred in an attempt to protect or enhance an investment or to pursue other claims or legal actions on behalf of Fund shareholders. Legal fee refund presented on the Statement of Operations reflects a refund of workout expenditures paid in a prior reporting period, when applicable.
Income Taxes
The Fund intends to distribute substantially all of its investment company taxable income to shareholders and to otherwise comply with the requirements of Subchapter M of the Internal Revenue Code applicable to regulated investment companies. Therefore, no federal income tax provision is required.
For all open tax years and all major taxing jurisdictions, management of the Fund has concluded that there are no significant uncertain tax positions that would require recognition in the financial statements. Open tax years are those that are open for examination by taxing authorities (i.e., generally the last four tax year ends and the interim tax period since then). Furthermore, management of the Fund is also not aware of any tax positions for which it is reasonably possible that the total amounts of unrecognized tax benefits will significantly change in the next twelve months.
Dividends and Distributions to Shareholders
Dividends to shareholders are declared monthly. Net realized capital gains from investment transactions, if any, are declared and distributed to shareholders at least annually. Furthermore, capital gains are distributed only to the extent they exceed available capital loss carryforwards.
Distributions to shareholders are recorded on the ex-dividend date. The amount and timing of distributions are determined in accordance with federal income tax regulations, which may differ from U.S. GAAP.
Derivative Financial Instruments
The Fund is authorized to invest in certain derivative instruments, including foreign currency fowards, futures, options and swap contracts. Although the Fund is authorized to invest in such financial instruments, and may do so in the future, it did not make any such investments during the six months ended January 31, 2013.
Market and Counterparty Credit Risk
In the normal course of business the Fund may invest in financial instruments and enter into financial transactions where risk of potential loss exists due to changes in the market (market risk) or failure of the other party to the transaction to perform (counterparty credit risk). The potential loss could exceed the value of the financial assets recorded on the financial statements. Financial assets, which potentially expose the Fund to counterparty credit risk, consist principally of cash due from counterparties on forward, option and swap transactions, when applicable. The extent of the Fund's exposure to counterparty credit risk in respect to these financial assets approximates their carrying value as recorded on the Statement of Assets and Liabilities. Futures contracts, when applicable, expose the Fund to minimal counterparty credit risk as they are exchange traded and the exchange's clearing-house, which is counterparty to all exchange traded futures, guarantees the futures contracts against default.
Nuveen Investments
23
Notes to
FINANCIAL STATEMENTS (Unaudited) (continued)
The Fund helps manage counterparty credit risk by entering into agreements only with counterparties the Adviser believes have the financial resources to honor their obligations and by having the Adviser monitor the financial stability of the counterparties. Additionally, counterparties may be required to pledge collateral daily (based on the daily valuation of the financial asset) on behalf of the Fund with a value approximately equal to the amount of any unrealized gain above a pre-determined threshold. Reciprocally, when the Fund has an unrealized loss, the Fund has instructed the custodian to pledge assets of the Fund as collateral with a value approximately equal to the amount of the unrealized loss above a pre-determined threshold. Collateral pledges are monitored and subsequently adjusted if and when the valuations fluctuate, either up or down, by at least the pre-determined threshold amount.
Repurchase Agreements
In connection with transactions in repurchase agreements, it is the Fund's policy that its custodian take possession of the underlying collateral securities, the fair value of which exceeds the principal amount of the repurchase transaction, including accrued interest, at all times. If the counterparty defaults, and the fair value of the collateral declines, realization of the collateral may be delayed or limited.
Zero Coupon Securities
The Fund is authorized to invest in zero coupon securities. A zero coupon security does not pay a regular interest coupon to its holders during the life of the security. Income to the holder of the security comes from accretion of the difference between the original purchase price of the security at issuance and the par value of the security at maturity and is effectively paid at maturity. The market prices of zero coupon securities generally are more volatile than the market prices of securities that pay interest periodically.
Indemnifications
Under the Fund's organizational documents, its officers and trustees are indemnified against certain liabilities arising out of the performance of their duties to the Fund. In addition, in the normal course of business, the Fund enters into contracts that provide general indemnifications to other parties. The Fund's maximum exposure under these arrangements is unknown as this would involve future claims that may be made against the Fund that have not yet occurred. However, the Fund has not had prior claims or losses pursuant to these contracts and expects the risk of loss to be remote.
Use of Estimates
The preparation of financial statements in conformity with U.S. GAAP requires management to make estimates and assumptions that affect the reported amounts of assets and liabilities at the date of the financial statements and the reported amounts of increases and decreases in net assets applicable to Common shares from operations during the reporting period. Actual results may differ from those estimates.
2. Fair Value Measurements
Fair value is defined as the price that the Fund would receive upon selling an investment or transferring a liability in an orderly transaction to an independent buyer in the principal or most advantageous market for the investment. A three-tier hierarchy is used to maximize the use of observable market data and minimize the use of unobservable inputs and to establish classification of fair value measurements for disclosure purposes. Observable inputs reflect the assumptions market participants would use in pricing the asset or liability. Observable inputs are based on market data obtained from sources independent of the reporting entity. Unobservable inputs reflect the reporting entity's own assumptions about the assumptions market participants would use in pricing the asset or liability. Unobservable inputs are based on the best information available in the circumstances. The following is a summary of the three-tiered hierarchy of valuation input levels.
Level 1 — Inputs are unadjusted and prices are determined using quoted prices in active markets for identical securities.
Level 2 — Prices are determined using other significant observable inputs (including quoted prices for similar securities, interest rates, prepayment speeds, credit risk, etc.).
Level 3 — Prices are determined using significant unobservable inputs (including management's assumptions in determining the fair value of investments).
Nuveen Investments
24
The inputs or methodologies used for valuing securities are not an indication of the risks associated with investing in those securities. The following is a summary of the Fund's fair value measurements as of the end of the reporting period:
Level 1 | Level 2 | Level 3 | Total | ||||||||||||||||
Long-Term Investments*: | |||||||||||||||||||
$25 Par (or similar) and Hybrid Preferred Securities | $ | 84,246,811 | $ | 37,002,293 | $ | — | $ | 121,249,104 | |||||||||||
Corporate Bonds | — | 16,490,907 | — | 16,490,907 | |||||||||||||||
$1,000 Par (or similar) and Hybrid Preferred Securities | 29,014,260 | 627,008,385 | — | 656,022,645 | |||||||||||||||
Short-Term Investments: | |||||||||||||||||||
Repurchase Agreements | — | 3,028,368 | — | 3,028,368 | |||||||||||||||
Total | $ | 113,261,071 | $ | 683,529,953 | $ | — | $ | 796,791,024 | |||||||||||
* Refer to the Fund's Portfolio of Investments for industry classification and breakdown of $25 Par (or similar) and Hybrid Preferred Securities and $1,000 Par (or similar) and Hybrid Preferred Securities classified as Level 2.
The Nuveen funds' Board of Directors/Trustees is responsible for the valuation process and has delegated the oversight of the daily valuation process to the Adviser's Valuation Committee. The Valuation Committee, pursuant to the valuation policies and procedures adopted by the Board of Directors/Trustees, is responsible for making fair value determinations, evaluating the effectiveness of the funds' pricing policies, and reporting to the Board of Directors/Trustees. The Valuation Committee is aided in its efforts by the Adviser's dedicated Securities Valuation Team, which is responsible for administering the daily valuation process and applying fair value methodologies as approved by the Valuation Committee. When determining the reliability of independent pricing services for investments owned by the funds, the Valuation Committee, among other things, conducts due diligence reviews of the pricing services and monitors the quality of security prices received through various testing reports conducted by the Securities Valuation Team.
The Valuation Committee will consider pricing methodologies it deems relevant and appropriate when making fair value determinations. Examples of possible methodologies include, but are not limited to, multiple of earnings; discount from market of a similar freely traded security; discounted cash-flow analysis; book value or a multiple thereof; risk premium/yield analysis; yield to maturity; and/or fundamental investment analysis. The Valuation Committee will also consider factors it deems relevant and appropriate in light of the facts and circumstances. Examples of possible factors include, but are not limited to, the type of security; the issuer's financial statements; the purchase price of the security; the discount from market value of unrestricted securities of the same class at the time of purchase; analysts' research and observations from financial institutions; information regarding any transactions or offers with respect to the security; the existence of merger proposals or tender offers affecting the security; the price and extent of public trading in similar securities of the issuer or comparable companies; and the existence of a shelf registration for restricted securities.
For each portfolio security that has been fair valued pursuant to the policies adopted by the Board of Directors/Trustees, the fair value price is compared against the last available and next available market quotations. The Valuation Committee reviews the results of such testing and fair valuation occurrences are reported to the Board of Directors/Trustees.
3. Derivative Instruments and Hedging Activities
The Fund records derivative instruments at fair value, with changes in fair value recognized on the Statement of Operations, when applicable. Even though the Fund's investments in derivatives may represent economic hedges, they are not considered to be hedge transactions for financial reporting purposes. The Fund did not invest in derivative instruments during the six months ended January 31, 2013.
4. Fund Shares
During November 2012, the Nuveen Funds Board of Directors/Trustees authorized the Fund's open-market share repurchase program, allowing the Fund to repurchase an aggregate of up to approximately 10% of its outstanding common shares. The Fund has not repurchased any of its outstanding common shares since the inception of its share repurchase program.
Transactions in Fund shares were as follows:
| Six Months Ended 1/31/13 | For the period 7/26/12 (commencement of operations through 7/31/12) | ||||||||||
Shares sold | 2,739,573 | 20,000,000 | |||||||||
Fund shares issued to shareholders due to reinvestment of distributions | 9,004 | — | |||||||||
5. Investment Transactions
Purchases and sales (excluding short-term investments) during the six months ended January 31, 2013, aggregated $867,076,500 and $168,843,041, respectively.
Nuveen Investments
25
Notes to
FINANCIAL STATEMENTS (Unaudited) (continued)
6. Income Tax Information
The following information is presented on an income tax basis. Differences between amounts for financial statement and federal income tax purposes are primarily due to recognition of premium amortization, timing differences in the recognition of income and timing differences in recognizing certain gains and losses on investment transactions. To the extent that differences arise that are permanent in nature, such amounts are reclassified within the capital accounts as listed below. Temporary differences do not require reclassification. Temporary and permanent differences do not impact the net asset value of the Fund.
As of January 31, 2013, the cost and unrealized appreciation (depreciation) of investments, as determined on a federal income tax basis, were as follows:
Cost of investments | $ | 761,469,535 | |||||
Gross unrealized: | |||||||
Appreciation | $ | 35,899,480 | |||||
Depreciation | (577,991 | ) | |||||
Net unrealized appreciation (depreciation) of investments | $ | 35,321,489 | |||||
The tax components of undistributed net ordinary income and net long-term capital gains at July 31, 2012, the Fund's last tax year end, were as follows:
Undistributed net ordinary income * | $ | — | |||||
Undistributed net long-term capital gains | — | ||||||
* Net ordinary income consists of net taxable income derived from dividends, interest, and net short-term capital gains, if any.
During the period July 26, 2012 (commencement of operations) through July 31, 2012, the Fund's last tax year end, the Fund made no distributions to its shareholders.
During the Fund's last tax year ended July 31, 2012, there were no capital losses generated.
The Fund has elected to defer losses incurred from July 26, 2012 (commencement of operations) through July 31, 2012, the Fund's last tax year end, in accordance with federal income tax rules. These losses are treated as having arisen on the first day of the current fiscal year. The Fund has elected to defer losses as follows:
Post-October capital losses | $ | — | |||||
Late-year ordinary losses | 12,585 | ||||||
7. Management Fees and Other Transactions with Affiliates
The Fund's management fee consists of two components—a fund-level fee, based only on the amount of assets within the Fund, and a complex-level fee, based on the aggregate amount of all eligible fund assets managed by the Adviser. This pricing structure enables Fund shareholders to benefit from growth in the assets within the Fund as well as from growth in the amount of complex-wide assets managed by the Adviser.
The annual fund-level fee, payable monthly, is calculated according to the following schedule:
Average Daily Managed Assets* | Fund-Level Fee Rate | ||||||
For the first $500 million | .7000 | % | |||||
For the next $500 million | .6750 | ||||||
For the next $500 million | .6500 | ||||||
For the next $500 million | .6250 | ||||||
For managed assets over $2 billion | .6000 | ||||||
Nuveen Investments
26
The annual complex-level fee, payable monthly, is calculated according to the following schedule:
Complex-Level Managed Asset Breakpoint Level* | Effective Rate at Breakpoint Level | ||||||
| $55 billion | .2000 | % | |||||
| $56 billion | .1996 | ||||||
| $57 billion | .1989 | ||||||
| $60 billion | .1961 | ||||||
| $63 billion | .1931 | ||||||
| $66 billion | .1900 | ||||||
| $71 billion | .1851 | ||||||
| $76 billion | .1806 | ||||||
| $80 billion | .1773 | ||||||
| $91 billion | .1691 | ||||||
| $125 billion | .1599 | ||||||
| $200 billion | .1505 | ||||||
| $250 billion | .1469 | ||||||
| $300 billion | .1445 | ||||||
* For the fund-level and complex-level fees, managed assets include closed-end fund assets managed by the Adviser that are attributable to financial leverage. For these purposes, financial leverage includes the funds' use of preferred stock and borrowings and certain investments in the residual interest certificates (also called inverse floating rate securities) in tender option bond (TOB) trusts, including the portion of assets held by a TOB trust that has been effectively financed by the trust's issuance of floating rate securities, subject to an agreement by the Adviser as to certain funds to limit the amount of such assets for determining managed assets in certain circumstances. The complex-level fee is calculated based upon the aggregate daily managed assets of all Nuveen Funds that constitute "eligible assets." Eligible assets do not include assets attributable to investments in other Nuveen Funds and assets in excess of $2 billion added to the Nuveen Fund complex in connection with the Adviser's assumption of the management of the former First American Funds effective January 1, 2011. As of January 31, 2013, the complex-level fee rate for the Fund was .1672%.
The management fee compensates the Adviser for overall investment advisory and administrative services and general office facilities. The Adviser is responsible for the Fund's overall investment strategy and asset allocation decisions. The Adviser has entered into a sub-advisory agreement with Nuveen Asset Management, LLC (the "Sub-Adviser"), a wholly-owned subsidiary of the Adviser, under which the Sub-Adviser manages the investment portfolio of the Fund. The Sub-Adviser is compensated for its services to the Fund from the management fees paid to the Adviser.
The Fund pays no compensation directly to those of its trustees who are affiliated with the Adviser or to its officers, all of whom receive remuneration for their services to the Fund from the Adviser or its affiliates. The Board of Trustees has adopted a deferred compensation plan for independent trustees that enables trustees to elect to defer receipt of all or a portion of the annual compensation they are entitled to receive from certain Nuveen-advised funds. Under the plan, deferred amounts are treated as though equal dollar amounts had been invested in shares of select Nuveen-advised funds.
8. Borrowing Arrangements
On August 29, 2012, the Fund entered into a $225 million (maximum commitment amount) prime brokerage facility ("Borrowings") with BNP Paribas Prime Brokerage, Inc. ("BNP") as a means of financial leverage. On January, 31 2013, the outstanding balance on these Borrowings was $225 million. During the period August 29, 2012 through January 31, 2013, the average daily balance outstanding and annual interest rate on these Borrowings were $224 million and 1.18%, respectively.
In order to maintain these Borrowings, the Fund must meet certain collateral, asset coverage and other requirements. Borrowings outstanding are fully secured by securities held in the Fund's portfolio of investments. Interest will be charged on these Borrowings at a rate equal to the 3-month LIBOR (London Inter-bank Offered Rate) plus .85% per annum on the amount borrowed. In addition to interest expense, the Fund will pay a commitment fee equal to .50% per annum on the undrawn balance. The Fund also paid a onetime .15% arrangement fee on the maximum commitment amount, which will be fully expensed during the fiscal year ended July 31, 2013.
Borrowings outstanding are recognized as "Borrowings" on the Statement of Assets and Liabilities. Interest expense and commitment fees incurred and the one-time arrangement fee are recognized as a component of "Interest expense on borrowings" on the Statement of Operations.
9. New Accounting Pronouncements
Financial Accounting Standards Board ("FASB") Balance Sheet (Topic 210): Disclosures about Offsetting Assets and Liabilities
In January 2013, Accounting Standards Update (ASU) 2013-01, Clarifying the Scope of Disclosures about Offsetting Assets and Liabilities, replaced ASU 2011-11, Disclosures about Offsetting Assets and Liabilities. ASU 2013-01 is effective for fiscal years beginning on or after January 1, 2013. ASU 2011-11 was intended to enhance disclosure requirements on the offsetting of financial assets and liabilities. ASU 2013-01 limits the scope of the new balance sheet offsetting disclosures to derivatives, repurchase agreements and securities lending transactions to the extent that they are (1) offset in the financial statements or (2) subject to an enforceable master netting arrangement or similar agreement. Management is currently evaluating the application of ASU 2013-01 and its impact to the financial statements and footnote disclosures, if any.
Nuveen Investments
27
Reinvest Automatically,
Easily and Conveniently
Nuveen makes reinvesting easy. A phone call is all it takes to set up your reinvestment account.
Nuveen Closed-End Funds Automatic Reinvestment Plan
Your Nuveen Closed-End Fund allows you to conveniently reinvest distributions in additional Fund shares.
By choosing to reinvest, you'll be able to invest money regularly and automatically, and watch your investment grow through the power of compounding. Just like distributions in cash, there may be times when income or capital gains taxes may be payable on distributions that are reinvested.
It is important to note that an automatic reinvestment plan does not ensure a profit, nor does it protect you against loss in a declining market.
Easy and convenient
To make recordkeeping easy and convenient, each quarter you'll receive a statement showing your total distributions, the date of investment, the shares acquired and the price per share, and the total number of shares you own.
How shares are purchased
The shares you acquire by reinvesting will either be purchased on the open market or newly issued by the Fund. If the shares are trading at or above net asset value at the time of valuation, the Fund will issue new shares at the greater of the net asset value or 95% of the then-current market price. If the shares are trading at less than net asset value, shares for your account will be purchased on the open market. If the Plan Agent begins purchasing Fund shares on the open market while shares are trading below net asset value, but the Fund's shares subsequently trade at or above their net asset value before the Plan Agent is able to complete its purchases, the Plan Agent may cease open-market purchases and may invest the uninvested portion of the distribution in newly-issued Fund shares at a price equal to the greater of the shares' net asset value or 95% of the shares' market value on the last business day immediately prior to the purchase date. Distributions received to purchase shares in the open market will normally be invested shortly after the distribution payment date. No interest will be paid on distributions awaiting reinvestment. Because the market price of the shares may increase before purchases are completed, the average purchase price per share may exceed the market price at the time of valuation, resulting in the acquisition of fewer shares than if the distribution had been paid in shares issued by the Fund. A pro rata portion of any applicable brokerage commissions on open market purchases will be paid
Nuveen Investments
28
by Plan participants. These commissions usually will be lower than those charged on individual transactions.
Flexible
You may change your distribution option or withdraw from the Plan at any time, should your needs or situation change.
You can reinvest whether your shares are registered in your name, or in the name of a brokerage firm, bank, or other nominee. Ask your investment advisor if his or her firm will participate on your behalf. Participants whose shares are registered in the name of one firm may not be able to transfer the shares to another firm and continue to participate in the Plan.
The Fund reserves the right to amend or terminate the Plan at any time. Although the Fund reserves the right to amend the Plan to include a service charge payable by the participants, there is no direct service charge to participants in the Plan at this time.
Call today to start reinvesting distributions
For more information on the Nuveen Automatic Reinvestment Plan or to enroll in or withdraw from the Plan, speak with your financial advisor or call us at (800) 257-8787.
Nuveen Investments
29
Glossary of Terms
Used in this Report
• Average Annual Total Return: This is a commonly used method to express an investment's performance over a particular, usually multi-year time period. It expresses the return that would have been necessary each year to equal the investment's actual cumulative performance (including change in NAV or offer price and reinvested dividends and capital gains distributions, if any) over the time period being considered.
• Bank of America/Merrill Lynch Preferred Stock Fixed Rate Index: An index that tracks the performance of fixed rate U.S. dollar denominated preferred securities issued in the U.S. Domestic Market. Qualifying securities must be rated investment grade (based on an average of Moody's, S&P, and Fitch) and must have an investment grade rated country of risk (based on an average of Moody's, S&P, and Fitch foreign currency long-term sovereign debt ratings). In addition, qualifying securities must be issued as public securities or through a 144a filing, must be issued in $25, $50 or $100 par/liquidation preference increments, must have a fixed coupon or dividend schedule, and must have a minimum amount outstanding of $100 million. The index returns assume reinvestment of dividends, but do not include the effects of any sales charges or management fees.
• Blended Benchmark Index: A blended return consisting of the Bank of America/Merrill Lynch Preferred Stock Fixed Rate Index and the Barclays USD Capital Securities Index. The Blended Benchmark Index is comprised of a 65% weighting in the Bank of America / Merrill Lynch Preferred Stock Fixed Rate Index, and a 35% weighting in the Barclays USD Capital Securities Index. Benchmark returns assume reinvestment of distributions, but do not include the effects of any sales charges or management fees.
• Duration: A measure of the price sensitivity of a fixed-income security or portfolio to changes in interest rates. Duration is stated in years. For example, if a bond has a duration of four years, the price of the bond is expected to change by approximately 4% for every one percentage point change in interest rates. The shorter the duration the less price variability expected in the security's price due to changes in interest rates.
• Effective Leverage: Effective leverage is a Fund's effective economic leverage, and includes both Regulatory leverage (see below) and the leverage effects of certain derivative investments in the Fund's portfolio that increase the Funds' investment exposure.
• Gross Domestic Product (GDP): The total market value of all final goods and services produced in a country/region in a given year, equal to total consumer, investment and government spending, plus the value of exports, minus the value of imports.
• Leverage: Using borrowed money to invest in securities or other assets, seeking to increase the return of an investment or portfolio.
Nuveen Investments
30
• Net Asset Value (NAV): The net market value of all securities held in a portfolio.
• Net Asset Value (NAV) Per Share: The market value of one share of a mutual fund or closed-end fund. For a Fund, the NAV is calculated daily by taking the Fund's total assets (securities, cash, and accrued earnings), subtracting the Fund's liabilities, and dividing by the number of shares outstanding.
• Regulatory Leverage: Regulatory leverage consists of preferred shares issued by or borrowings of the Fund. Both of these are part of a Fund's capital structure. Regulatory leverage is sometimes referred to as "'40 Act Leverage" and is subject to asset coverage limits set forth in the Investment Company Act of 1940.
Nuveen Investments
31
Notes
Nuveen Investments
32
Notes
Nuveen Investments
33
Notes
Nuveen Investments
34
Additional Fund Information
Board of Trustees
John P. Amboian
Robert P. Bremner
Jack B. Evans
William C. Hunter
David J. Kundert
William J. Schneider
Judith M. Stockdale
Carole E. Stone
Virginia L. Stringer
Terence J. Toth
Fund Manager
Nuveen Fund Advisors, LLC
333 West Wacker Drive
Chicago, IL 60606
Custodian
State Street Bank & Trust Company
Boston, MA
Transfer Agent and
Shareholder Services
State Street Bank & Trust Company
Nuveen Funds
P.O. Box 43071
Providence, RI 02940-3071
(800) 257-8787
Legal Counsel
Chapman and Cutler LLP
Chicago, IL
Independent Registered
Public Accounting Firm
Ernst & Young LLP
Chicago, IL
Nuveen Funds' Quarterly Portfolio of Investments and Proxy Voting Information
You may obtain (i) the Funds' quarterly portfolio of investments, (ii) information regarding how the Funds voted proxies relating to portfolio securities held during the most recent twelve-month period ended June 30, and (iii) a description of the policies and procedures that the Funds used to determine how to vote proxies relating to portfolio securities without charge, upon request, by calling Nuveen Investments toll-free at (800) 257-8787 or on Nuveen's website at www.nuveen.com.
You may also obtain this and other Fund information directly from the Securities and Exchange Commission (SEC). The SEC may charge a copying fee for this information. Visit the SEC on-line at http://www.sec.gov or in person at the SEC's Public Reference Room in Washington, D.C. Call the SEC at (202) 942-8090 for room hours and operation. You may also request Fund information by sending an e-mail request to publicinfo@sec.gov or by writing to the SEC's Public Reference Section at 100 F Street NE, Washington, D.C. 20549.
CEO Certification Disclosure
The Fund's Chief Executive Officer has submitted to the New York Stock Exchange (NYSE) the annual CEO certification as required by Section 303A.12(a) of the NYSE Listed Company Manual.
The Fund has filed with the SEC the certification of its Chief Executive Officer and Chief Financial Officer required by Section 302 of the Sarbanes-Oxley Act.
Common Share Information
The Fund intends to repurchase shares of its own common stock in the future at such times and in such amounts as is deemed advisable. During the period covered by this report, the Fund repurchased shares of its common stock as shown in the accompanying table.
| Fund | Common Shares Repurchased | ||||||
JPI | — | ||||||
Any future repurchases will be reported to shareholders in the next annual or semi-annual report.
Nuveen Investments
35
Nuveen Investments:
Serving Investors for Generations
Since 1898, financial advisors and their clients have relied on Nuveen Investments to provide dependable investment solutions through continued adherence to proven, long-term investing principles. Today, we offer a range of high quality equity and fixed-income solutions designed to be integral components of a well-diversified core portfolio.
Focused on meeting investor needs.
Nuveen Investments provides high-quality investment services designed to help secure the long-term goals of institutional and individual investors as well as the consultants and financial advisors who serve them. Nuveen Investments markets a wide range of specialized investment solutions which provide investors access to capabilities of its high-quality boutique investment affiliates—Nuveen Asset Management, Symphony Asset Management, NWQ Investment Management Company, Santa Barbara Asset Management, Tradewinds Global Investors, Winslow Capital Management and Gresham Investment Management. In total, Nuveen Investments managed $219 billion as of December 31, 2012.
Find out how we can help you.
To learn more about how the products and services of Nuveen Investments may be able to help you meet your financial goals, talk to your financial advisor, or call us at (800) 257-8787. Please read the information provided carefully before you invest. Investors should consider the investment objective and policies, risk considerations, charges and expenses of any investment carefully. Where applicable, be sure to obtain a prospectus, which contains this and other relevant information. To obtain a prospectus, please contact your securities representative or Nuveen Investments, 333 W. Wacker Dr., Chicago, IL 60606. Please read the prospectus carefully before you invest or send money.
Learn more about Nuveen Funds at: www.nuveen.com/cef
Distributed by
Nuveen Securities, LLC
333 West Wacker Drive
Chicago, IL 60606
www.nuveen.com/cef
ESA-C-0113D
ITEM 2. CODE OF ETHICS.
Not applicable to this filing.
ITEM 3. AUDIT COMMITTEE FINANCIAL EXPERT.
Not applicable to this filing.
ITEM 4. PRINCIPAL ACCOUNTANT FEES AND SERVICES.
Not applicable to this filing.
ITEM 5. AUDIT COMMITTEE OF LISTED REGISTRANTS.
Not applicable to this filing.
ITEM 6. SCHEDULE OF INVESTMENTS.
a) See Portfolio of Investments in Item 1.
b) Not applicable.
ITEM 7. DISCLOSURE OF PROXY VOTING POLICIES AND PROCEDURES FOR CLOSED-END MANAGEMENT INVESTMENT COMPANIES.
Not applicable to this filing.
ITEM 8. PORTFOLIO MANAGERS OF CLOSED-END MANAGEMENT INVESTMENT COMPANIES.
Not applicable to this filing.
ITEM 9. PURCHASES OF EQUITY SECURITIES BY CLOSED-END MANAGEMENT INVESTMENT COMPANY AND AFFILIATED PURCHASERS.
Not applicable.
ITEM 10. SUBMISSION OF MATTERS TO A VOTE OF SECURITY HOLDERS.
There have been no material changes to the procedures by which shareholders may recommend nominees to the registrant’s Board implemented after the registrant last provided disclosure in response to this item.
ITEM 11. CONTROLS AND PROCEDURES.
(a) |
| The registrant’s principal executive and principal financial officers, or persons performing similar functions, have concluded that the registrant’s disclosure controls and procedures (as defined in Rule 30a-3(c) under the Investment Company Act of 1940, as amended (the “1940 Act”) (17 CFR 270.30a-3(c))) are effective, as of a date within 90 days of the filing date of this report that includes the disclosure required by this paragraph, based on their evaluation of the controls and procedures required by Rule 30a-3(b) under the 1940 Act (17 CFR 270.30a-3(b)) and Rules 13a-15(b) or 15d-15(b) under the Securities Exchange Act of 1934, as amended (the “Exchange Act”)(17 CFR 240.13a-15(b) or 240.15d-15(b)). |
|
|
|
(b) |
| There were no changes in the registrant’s internal control over financial reporting (as defined in Rule 30a-3(d) under the 1940 Act (17 CFR 270.30a-3(d)) that occurred during the second fiscal quarter of the period covered by this report that has materially affected, or is reasonably likely to materially affect, the registrant’s internal control over financial reporting. |
ITEM 12. EXHIBITS.
File the exhibits listed below as part of this Form.
(a)(1) Any code of ethics, or amendment thereto, that is the subject of the disclosure required by Item 2, to the extent that the registrant intends to satisfy the Item 2 requirements through filing of an exhibit: Not applicable to this filing.
(a)(2) A separate certification for each principal executive officer and principal financial officer of the registrant as required by Rule 30a-2(a) under the 1940 Act (17 CFR 270.30a-2(a)) in the exact form set forth below: Ex-99.CERT attached hereto.
(a)(3) Any written solicitation to purchase securities under Rule 23c-1 under the 1940 Act (17 CFR 270.23c-1) sent or given during the period covered by the report by or on behalf of the registrant to 10 or more persons: Not applicable.
(b) If the report is filed under Section 13(a) or 15(d) of the Exchange Act, provide the certifications required by Rule 30a-2(b) under the 1940 Act (17 CFR 270.30a-2(b)); Rule 13a-14(b) or Rule 15d-14(b) under the Exchange Act (17 CFR 240.13a-14(b) or 240.15d-14(b)), and Section 1350 of Chapter 63 of Title 18 of the United States Code (18 U.S.C. 1350) as an exhibit. A certification furnished pursuant to this paragraph will not be deemed “filed” for purposes of Section 18 of the Exchange Act (15 U.S.C. 78r), or otherwise subject to the liability of that section. Such certification will not be deemed to be incorporated by reference into any filing under the Securities Act of 1933 or the Exchange Act, except to the extent that the registrant specifically incorporates it by reference. Ex-99.906 CERT attached hereto.
SIGNATURES
Pursuant to the requirements of the Securities Exchange Act of 1934 and the Investment Company Act of 1940, the registrant has duly caused this report to be signed on its behalf by the undersigned, thereunto duly authorized.
(Registrant) Nuveen Preferred and Income Term Fund
By (Signature and Title) | /s/ Kevin J. McCarthy |
|
| Kevin J. McCarthy | |
| Vice President and Secretary | |
Date: April 5, 2013
Pursuant to the requirements of the Securities Exchange Act of 1934 and the Investment Company Act of 1940, this report has been signed below by the following persons on behalf of the registrant and in the capacities and on the dates indicated.
By (Signature and Title) | /s/ Gifford R. Zimmerman |
|
| Gifford R. Zimmerman | |
| Chief Administrative Officer | |
| (principal executive officer) | |
Date: April 5, 2013
By (Signature and Title) | /s/ Stephen D. Foy |
|
| Stephen D. Foy | |
| Vice President and Controller | |
| (principal financial officer) | |
Date: April 5, 2013