May 2019 DISCUSSION MATERIALS SHOS “Go-Shop” Transaction Concept [ DRAFT – Subject to Change] Exhibit (c)(8)
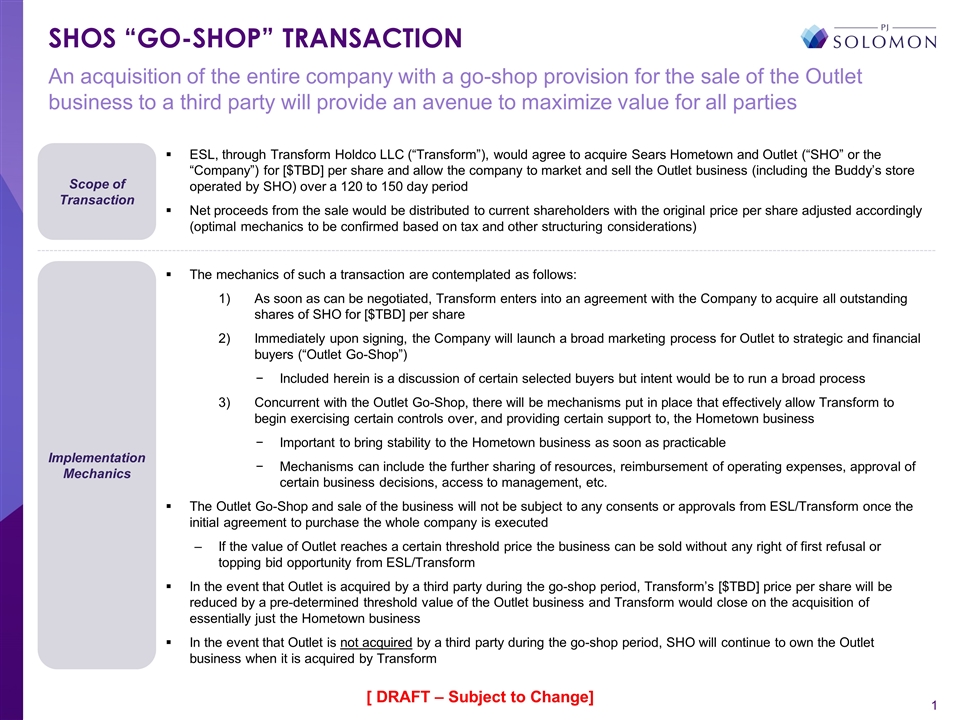
ESL, through Transform Holdco LLC (“Transform”), would agree to acquire Sears Hometown and Outlet (“SHO” or the “Company”) for [$TBD] per share and allow the company to market and sell the Outlet business (including the Buddy’s store operated by SHO) over a 120 to 150 day period Net proceeds from the sale would be distributed to current shareholders with the original price per share adjusted accordingly (optimal mechanics to be confirmed based on tax and other structuring considerations) The mechanics of such a transaction are contemplated as follows: As soon as can be negotiated, Transform enters into an agreement with the Company to acquire all outstanding shares of SHO for [$TBD] per share Immediately upon signing, the Company will launch a broad marketing process for Outlet to strategic and financial buyers (“Outlet Go-Shop”) Included herein is a discussion of certain selected buyers but intent would be to run a broad process Concurrent with the Outlet Go-Shop, there will be mechanisms put in place that effectively allow Transform to begin exercising certain controls over, and providing certain support to, the Hometown business Important to bring stability to the Hometown business as soon as practicable Mechanisms can include the further sharing of resources, reimbursement of operating expenses, approval of certain business decisions, access to management, etc. The Outlet Go-Shop and sale of the business will not be subject to any consents or approvals from ESL/Transform once the initial agreement to purchase the whole company is executed If the value of Outlet reaches a certain threshold price the business can be sold without any right of first refusal or topping bid opportunity from ESL/Transform In the event that Outlet is acquired by a third party during the go-shop period, Transform’s [$TBD] price per share will be reduced by a pre-determined threshold value of the Outlet business and Transform would close on the acquisition of essentially just the Hometown business In the event that Outlet is not acquired by a third party during the go-shop period, SHO will continue to own the Outlet business when it is acquired by Transform An acquisition of the entire company with a go-shop provision for the sale of the Outlet business to a third party will provide an avenue to maximize value for all parties SHOS “GO-SHOP” TRANSACTION [ DRAFT – Subject to Change] Scope of Transaction Implementation Mechanics
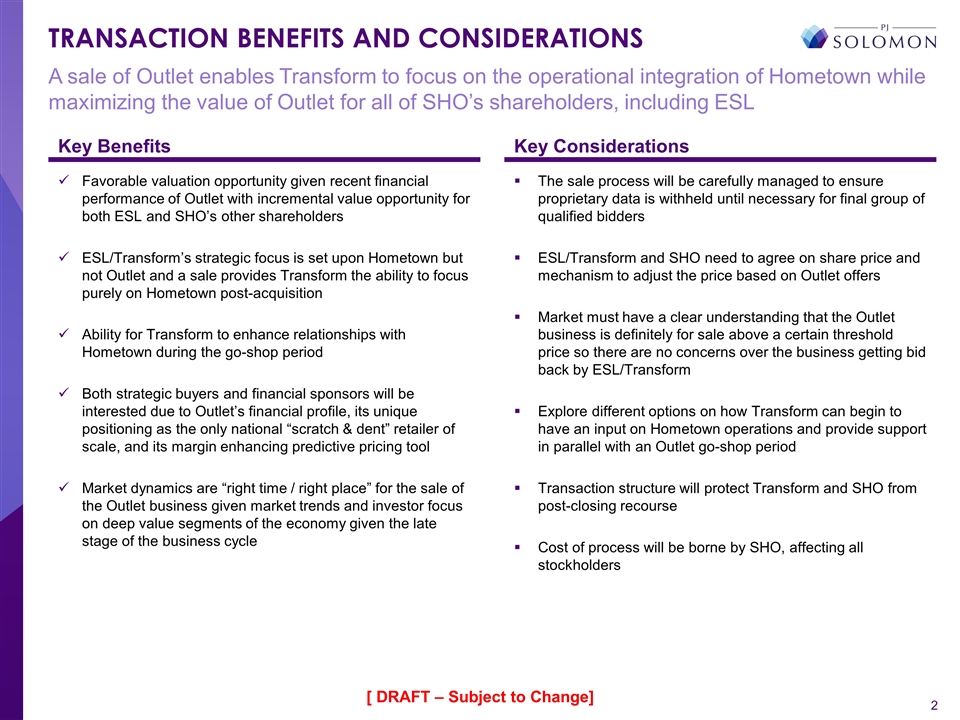
Favorable valuation opportunity given recent financial performance of Outlet with incremental value opportunity for both ESL and SHO’s other shareholders ESL/Transform’s strategic focus is set upon Hometown but not Outlet and a sale provides Transform the ability to focus purely on Hometown post-acquisition Ability for Transform to enhance relationships with Hometown during the go-shop period Both strategic buyers and financial sponsors will be interested due to Outlet’s financial profile, its unique positioning as the only national “scratch & dent” retailer of scale, and its margin enhancing predictive pricing tool Market dynamics are “right time / right place” for the sale of the Outlet business given market trends and investor focus on deep value segments of the economy given the late stage of the business cycle The sale process will be carefully managed to ensure proprietary data is withheld until necessary for final group of qualified bidders ESL/Transform and SHO need to agree on share price and mechanism to adjust the price based on Outlet offers Market must have a clear understanding that the Outlet business is definitely for sale above a certain threshold price so there are no concerns over the business getting bid back by ESL/Transform Explore different options on how Transform can begin to have an input on Hometown operations and provide support in parallel with an Outlet go-shop period Transaction structure will protect Transform and SHO from post-closing recourse Cost of process will be borne by SHO, affecting all stockholders A sale of Outlet enables Transform to focus on the operational integration of Hometown while maximizing the value of Outlet for all of SHO’s shareholders, including ESL Key Benefits Key Considerations TRANSACTION BENEFITS AND CONSIDERATIONS [ DRAFT – Subject to Change]
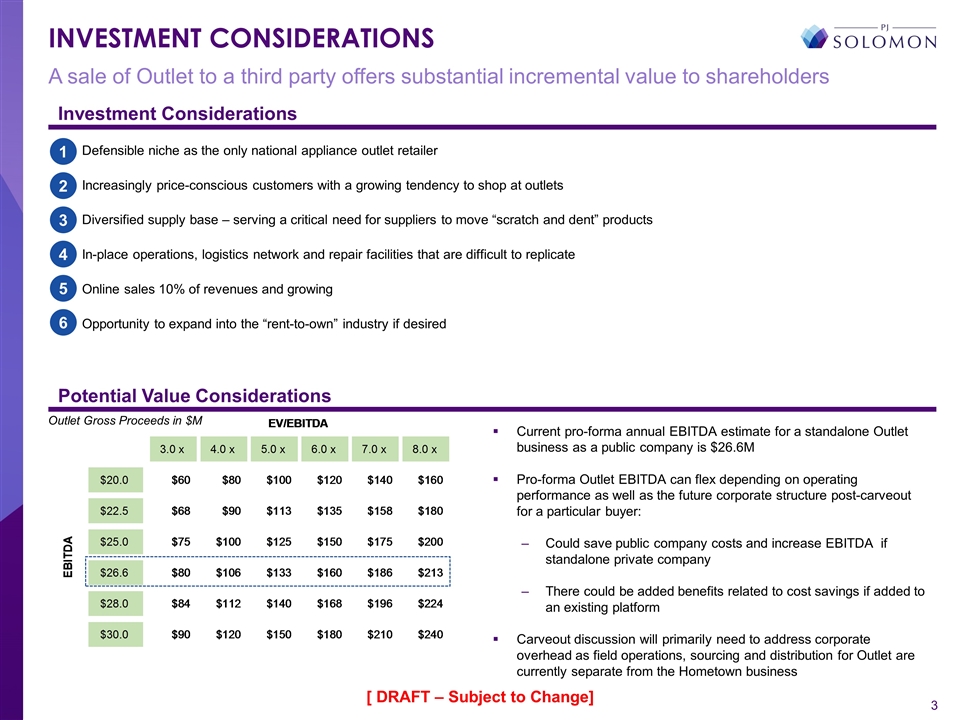
A sale of Outlet to a third party offers substantial incremental value to shareholders INVESTMENT CONSIDERATIONS Investment Considerations Defensible niche as the only national appliance outlet retailer Increasingly price-conscious customers with a growing tendency to shop at outlets Diversified supply base – serving a critical need for suppliers to move “scratch and dent” products In-place operations, logistics network and repair facilities that are difficult to replicate Online sales 10% of revenues and growing Opportunity to expand into the “rent-to-own” industry if desired 1 2 3 4 5 6 Potential Value Considerations Current pro-forma annual EBITDA estimate for a standalone Outlet business as a public company is $26.6M Pro-forma Outlet EBITDA can flex depending on operating performance as well as the future corporate structure post-carveout for a particular buyer: Could save public company costs and increase EBITDA if standalone private company There could be added benefits related to cost savings if added to an existing platform Carveout discussion will primarily need to address corporate overhead as field operations, sourcing and distribution for Outlet are currently separate from the Hometown business Outlet Gross Proceeds in $M [ DRAFT – Subject to Change]
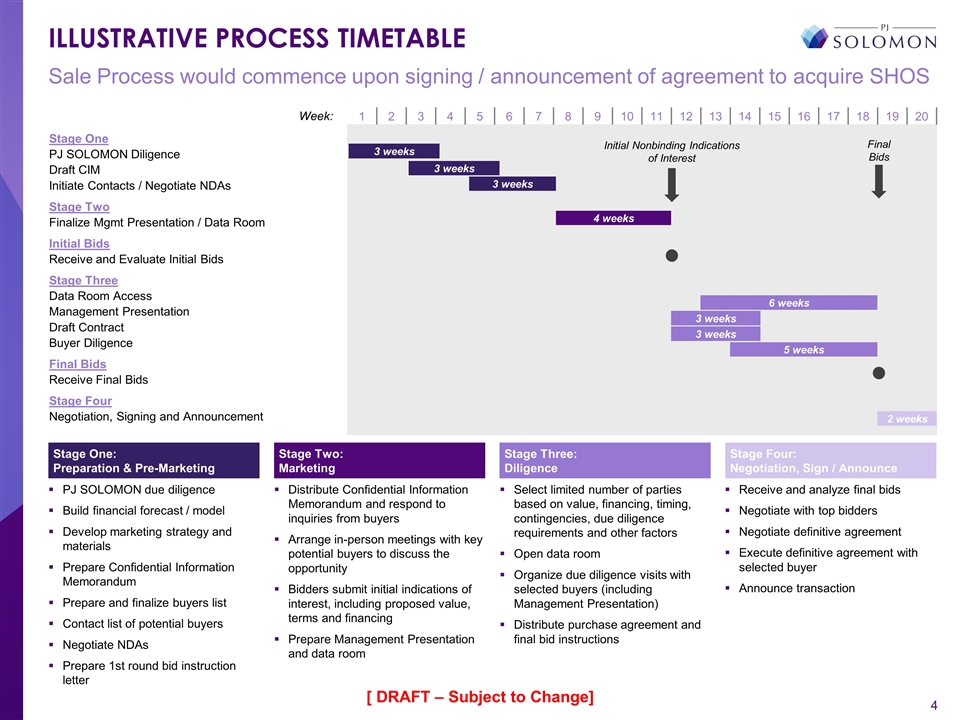
ILLUSTRATIVE PROCESS TIMETABLE PJ SOLOMON due diligence Build financial forecast / model Develop marketing strategy and materials Prepare Confidential Information Memorandum Prepare and finalize buyers list Contact list of potential buyers Negotiate NDAs Prepare 1st round bid instruction letter Select limited number of parties based on value, financing, timing, contingencies, due diligence requirements and other factors Open data room Organize due diligence visits with selected buyers (including Management Presentation) Distribute purchase agreement and final bid instructions Distribute Confidential Information Memorandum and respond to inquiries from buyers Arrange in-person meetings with key potential buyers to discuss the opportunity Bidders submit initial indications of interest, including proposed value, terms and financing Prepare Management Presentation and data room Receive and analyze final bids Negotiate with top bidders Negotiate definitive agreement Execute definitive agreement with selected buyer Announce transaction Stage One: Preparation & Pre-Marketing Stage Three: Diligence Stage Four: Negotiation, Sign / Announce Stage Two: Marketing Stage One PJ SOLOMON Diligence Draft CIM Initiate Contacts / Negotiate NDAs Stage Two Finalize Mgmt Presentation / Data Room Initial Bids Receive and Evaluate Initial Bids Stage Three Data Room Access Management Presentation Draft Contract Buyer Diligence Final Bids Receive Final Bids Stage Four Negotiation, Signing and Announcement 1 2 3 4 5 6 7 8 9 10 11 12 13 14 15 16 17 18 19 20 Week: 3 weeks 6 weeks 2 weeks 4 weeks Initial Nonbinding Indications of Interest Final Bids 3 weeks 3 weeks 3 weeks 5 weeks 3 weeks Sale Process would commence upon signing / announcement of agreement to acquire SHOS [ DRAFT – Subject to Change]
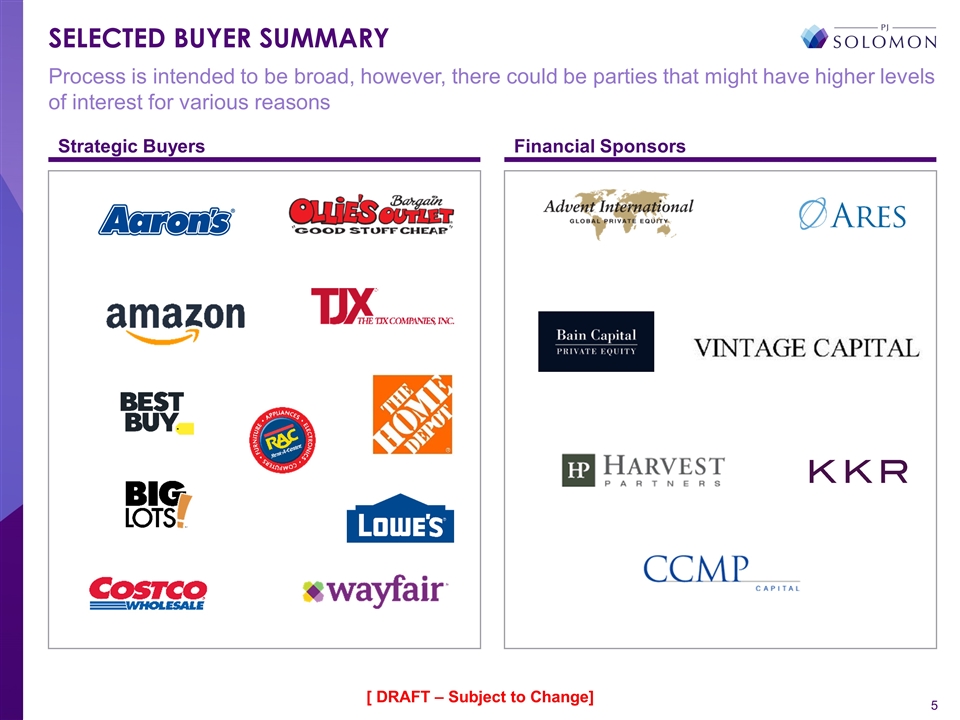
Process is intended to be broad, however, there could be parties that might have higher levels of interest for various reasons Strategic Buyers Financial Sponsors SELECTED BUYER SUMMARY [ DRAFT – Subject to Change]
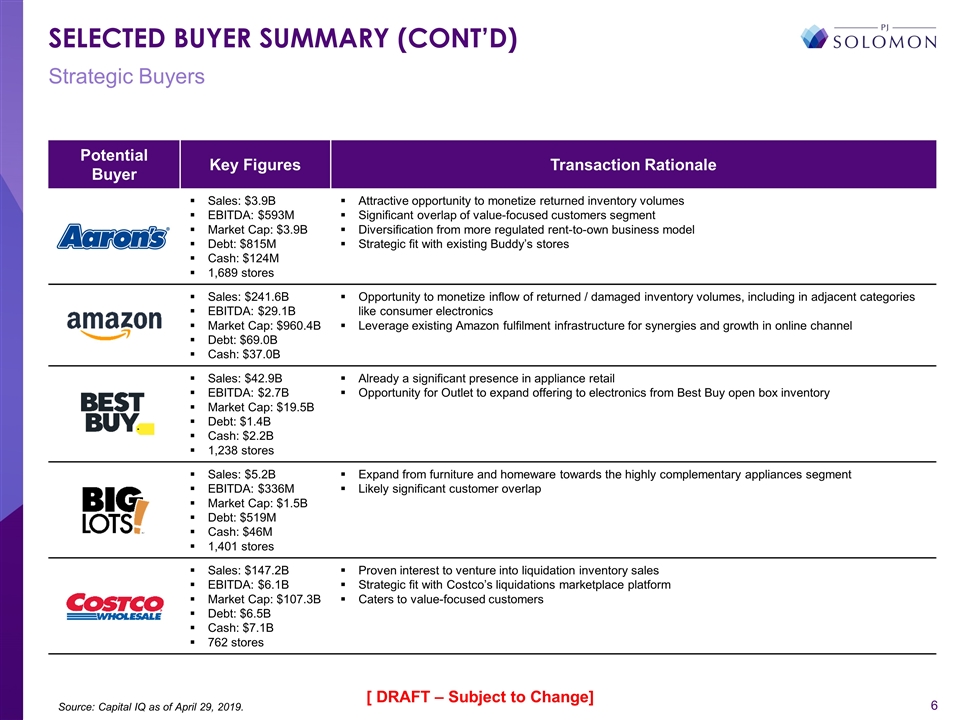
Strategic Buyers Source: Capital IQ as of April 29, 2019. SELECTED BUYER SUMMARY (CONT’D) Potential Buyer Key Figures Transaction Rationale Sales: $3.9B EBITDA: $593M Market Cap: $3.9B Debt: $815M Cash: $124M 1,689 stores Attractive opportunity to monetize returned inventory volumes Significant overlap of value-focused customers segment Diversification from more regulated rent-to-own business model Strategic fit with existing Buddy’s stores Sales: $241.6B EBITDA: $29.1B Market Cap: $960.4B Debt: $69.0B Cash: $37.0B Opportunity to monetize inflow of returned / damaged inventory volumes, including in adjacent categories like consumer electronics Leverage existing Amazon fulfilment infrastructure for synergies and growth in online channel Sales: $42.9B EBITDA: $2.7B Market Cap: $19.5B Debt: $1.4B Cash: $2.2B 1,238 stores Already a significant presence in appliance retail Opportunity for Outlet to expand offering to electronics from Best Buy open box inventory Sales: $5.2B EBITDA: $336M Market Cap: $1.5B Debt: $519M Cash: $46M 1,401 stores Expand from furniture and homeware towards the highly complementary appliances segment Likely significant customer overlap Sales: $147.2B EBITDA: $6.1B Market Cap: $107.3B Debt: $6.5B Cash: $7.1B 762 stores Proven interest to venture into liquidation inventory sales Strategic fit with Costco’s liquidations marketplace platform Caters to value-focused customers [ DRAFT – Subject to Change]
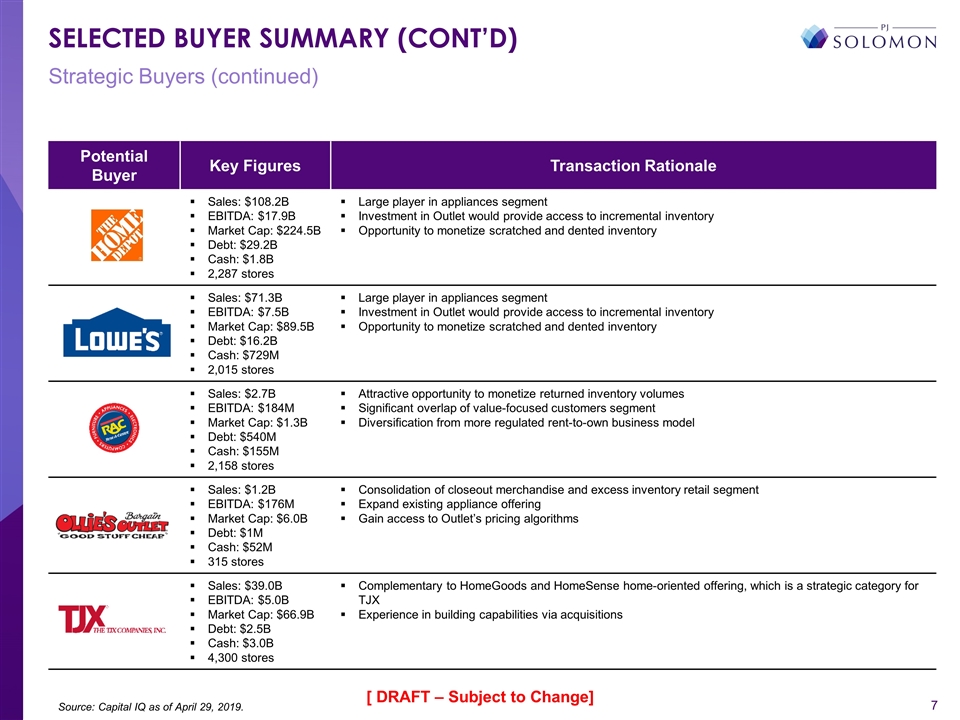
Strategic Buyers (continued) Source: Capital IQ as of April 29, 2019. SELECTED BUYER SUMMARY (CONT’D) Potential Buyer Key Figures Transaction Rationale Sales: $108.2B EBITDA: $17.9B Market Cap: $224.5B Debt: $29.2B Cash: $1.8B 2,287 stores Large player in appliances segment Investment in Outlet would provide access to incremental inventory Opportunity to monetize scratched and dented inventory Sales: $71.3B EBITDA: $7.5B Market Cap: $89.5B Debt: $16.2B Cash: $729M 2,015 stores Large player in appliances segment Investment in Outlet would provide access to incremental inventory Opportunity to monetize scratched and dented inventory Sales: $2.7B EBITDA: $184M Market Cap: $1.3B Debt: $540M Cash: $155M 2,158 stores Attractive opportunity to monetize returned inventory volumes Significant overlap of value-focused customers segment Diversification from more regulated rent-to-own business model Sales: $1.2B EBITDA: $176M Market Cap: $6.0B Debt: $1M Cash: $52M 315 stores Consolidation of closeout merchandise and excess inventory retail segment Expand existing appliance offering Gain access to Outlet’s pricing algorithms Sales: $39.0B EBITDA: $5.0B Market Cap: $66.9B Debt: $2.5B Cash: $3.0B 4,300 stores Complementary to HomeGoods and HomeSense home-oriented offering, which is a strategic category for TJX Experience in building capabilities via acquisitions [ DRAFT – Subject to Change]
Strategic Buyers (continued) Source: Capital IQ as of April 29, 2019. SELECTED BUYER SUMMARY (CONT’D) Potential Buyer Key Figures Transaction Rationale Sales: $6.8B EBITDA: $(404)M Market Cap: $14.1B Debt: $922M Cash: $964M Expand existing appliance offering Access to significant retail footprint, which could enable omnichannel benefits at scale [ DRAFT – Subject to Change]
Financial Sponsors Source: Publicly available information. SELECTED BUYER SUMMARY (CONT’D) Potential Buyer Est. Relevant Fund Size Transaction Rationale ~$13B Experience in the value retail segment through highly successful investment in “extreme discount” retailer Five Below ~$8B Investment in discount retailer 99 Cents Only Stores Proven ongoing interest in the discount segment with ongoing acquisition of Savers ~$7B Existing presence in the discount segment with Dollarama (UK) ~$4B Proven interest in excess inventory segment through position in Ollie’s Bargain Outlet ~$2B Known to be looking at comparable opportunities ~$9B Previous presence in the value segment with Dollar General Would allow Mills Fleet Farm investment to penetrate further into adjacent appliance category n.a. Current owner of Buddy’s Seeking to grow presence in the furniture and appliances space targeting lower-income customer segments Attractive alternative to failed investment in Rent-A-Center [ DRAFT – Subject to Change]

APPENDIX
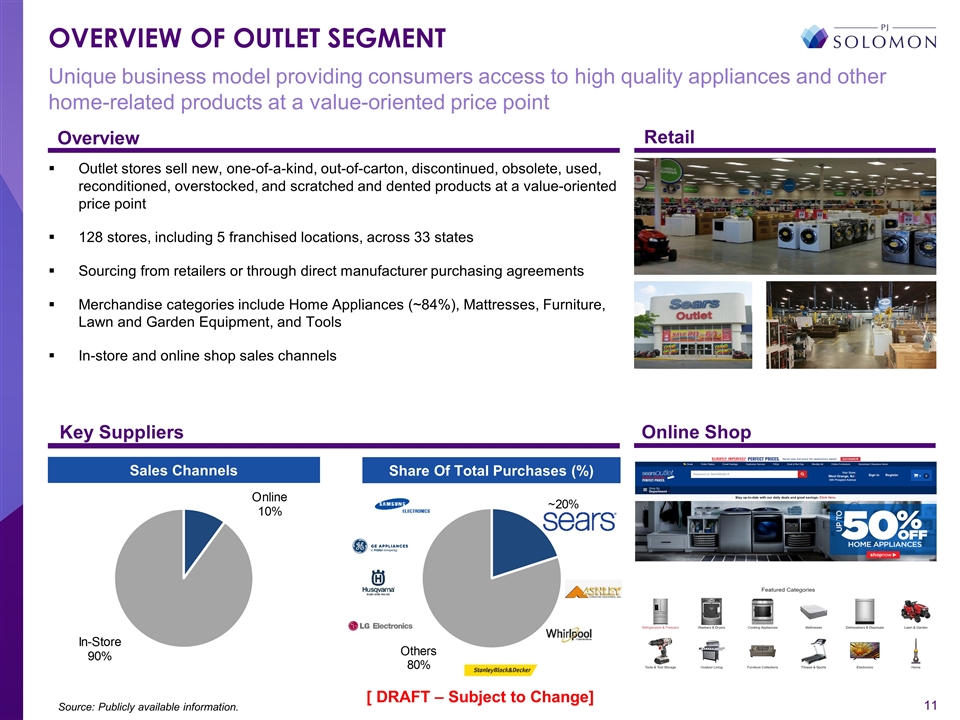
Unique business model providing consumers access to high quality appliances and other home-related products at a value-oriented price point Source: Publicly available information. OVERVIEW OF OUTLET SEGMENT Overview Retail Outlet stores sell new, one-of-a-kind, out-of-carton, discontinued, obsolete, used, reconditioned, overstocked, and scratched and dented products at a value-oriented price point 128 stores, including 5 franchised locations, across 33 states Sourcing from retailers or through direct manufacturer purchasing agreements Merchandise categories include Home Appliances (~84%), Mattresses, Furniture, Lawn and Garden Equipment, and Tools In-store and online shop sales channels Key Suppliers Online Shop Share Of Total Purchases (%) Sales Channels [ DRAFT – Subject to Change]
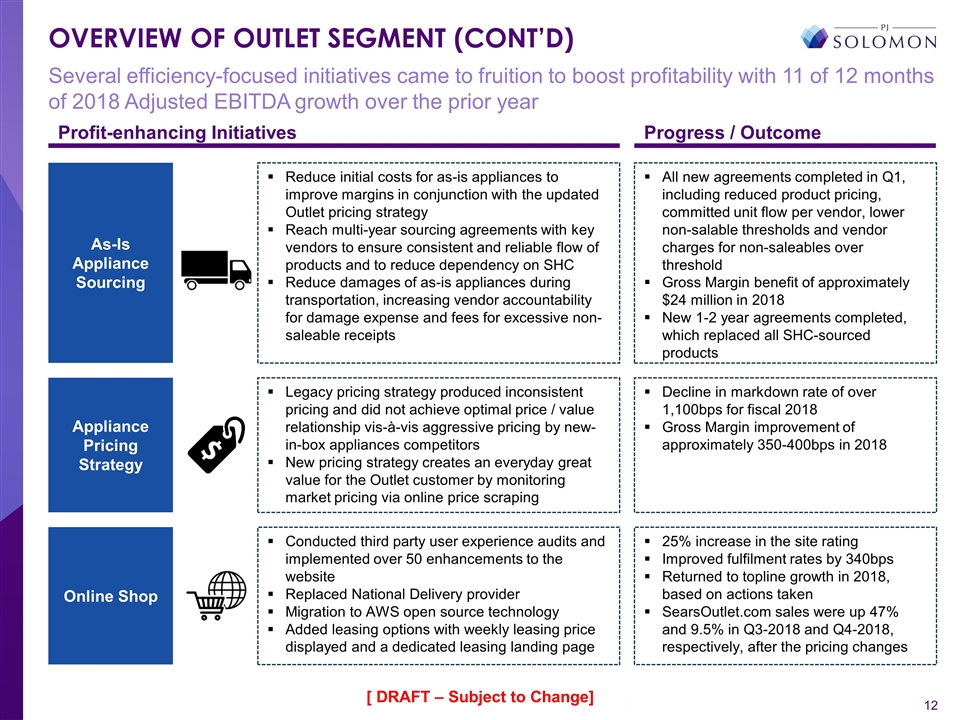
OVERVIEW OF OUTLET SEGMENT (CONT’D) Several efficiency-focused initiatives came to fruition to boost profitability with 11 of 12 months of 2018 Adjusted EBITDA growth over the prior year Profit-enhancing Initiatives Progress / Outcome As-Is Appliance Sourcing Appliance Pricing Strategy Online Shop Reduce initial costs for as-is appliances to improve margins in conjunction with the updated Outlet pricing strategy Reach multi-year sourcing agreements with key vendors to ensure consistent and reliable flow of products and to reduce dependency on SHC Reduce damages of as-is appliances during transportation, increasing vendor accountability for damage expense and fees for excessive non-saleable receipts All new agreements completed in Q1, including reduced product pricing, committed unit flow per vendor, lower non-salable thresholds and vendor charges for non-saleables over threshold Gross Margin benefit of approximately $24 million in 2018 New 1-2 year agreements completed, which replaced all SHC-sourced products Legacy pricing strategy produced inconsistent pricing and did not achieve optimal price / value relationship vis-à-vis aggressive pricing by new-in-box appliances competitors New pricing strategy creates an everyday great value for the Outlet customer by monitoring market pricing via online price scraping Decline in markdown rate of over 1,100bps for fiscal 2018 Gross Margin improvement of approximately 350-400bps in 2018 Conducted third party user experience audits and implemented over 50 enhancements to the website Replaced National Delivery provider Migration to AWS open source technology Added leasing options with weekly leasing price displayed and a dedicated leasing landing page 25% increase in the site rating Improved fulfilment rates by 340bps Returned to topline growth in 2018, based on actions taken SearsOutlet.com sales were up 47% and 9.5% in Q3-2018 and Q4-2018, respectively, after the pricing changes [ DRAFT – Subject to Change]
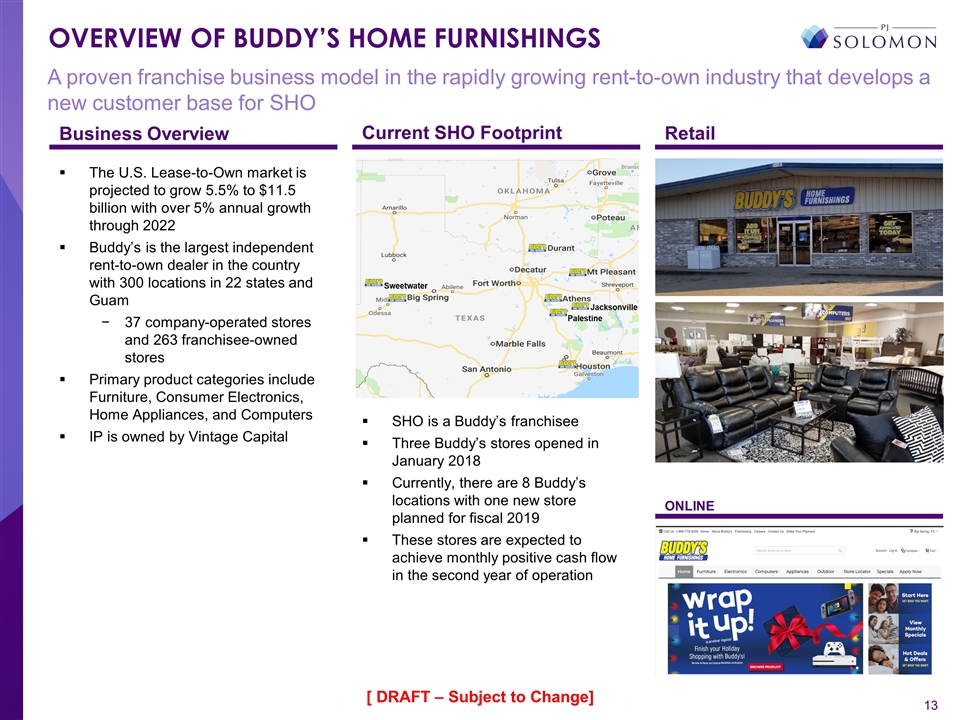
A proven franchise business model in the rapidly growing rent-to-own industry that develops a new customer base for SHO Retail ONLINE The U.S. Lease-to-Own market is projected to grow 5.5% to $11.5 billion with over 5% annual growth through 2022 Buddy’s is the largest independent rent-to-own dealer in the country with 300 locations in 22 states and Guam 37 company-operated stores and 263 franchisee-owned stores Primary product categories include Furniture, Consumer Electronics, Home Appliances, and Computers IP is owned by Vintage Capital Current SHO Footprint Business Overview SHO is a Buddy’s franchisee Three Buddy’s stores opened in January 2018 Currently, there are 8 Buddy’s locations with one new store planned for fiscal 2019 These stores are expected to achieve monthly positive cash flow in the second year of operation OVERVIEW OF BUDDY’S HOME FURNISHINGS [ DRAFT – Subject to Change]


