UNITED STATES
SECURITIES AND EXCHANGE COMMISSION
Washington, D.C. 20549
FORM 10-K
(Mark One)
| x | ANNUAL REPORT PURSUANT TO SECTION 13 OR 15(d) | |
OF THE
SECURITIES EXCHANGE ACT OF 1934
For the Fiscal Year Ended
December 30, 2006
o | TRANSITION REPORT PURSUANT TO SECTION 13 OR 15(d) | |
OF
THE SECURITIES EXCHANGE ACT OF 1934
For the transition period from
_________________ to _________________
Commission File No. 0-5680
BURKE MILLS, INC.
(Exact name of registrant as specified in its charter)
(I.R.S. Employer Identification No.) 56-0506342
State or other jurisdiction of incorporation or organization:
North Carolina
191 Sterling Street, NW
Valdese, North Carolina 28690
(Address of principal executive offices) (Zip Code)
Registrant's telephone number, including area code:
828-874-6341
Securities registered pursuant to Section 12(b) of the Act: Common Stock
Indicate by check mark if the registrant is a well-known seasoned issuer, as defined in Rule 405 of the Exchange Act. Yes o Nox
Indicate by check mark if the registrant is not required to file reports pursuant to Section 13 or Section 15(d) of the Exchange Act. Yes x No o
Indicate by check mark whether the registrant (1) has filed all reports required to be filed by Section 13 or 15(d) of the Securities Exchange Act of 1934 during the preceding 12 months (or for such shorter period that the registrant was required to file such reports), and (2) has been subject to such filing requirements for the past 90 days. Yes x No o
Indicate by check mark if a disclosure of delinquent filers pursuant to Item 405 of Regulation S-K is not contained herein, and will not be contained, to the best of the registrant's knowledge in definitive proxy or information statements incorporated by reference in Part III of this Form 10-K or any amendment to this Form 10-K. o
Indicate by check mark whether the registrant is a large accelerated filer, an accelerated filer, or a non-accelerated filer.
Large accelerated filer o Accelerated Filer o Non-accelerated filer x
Indicated by check mark whether the registrant is a Shell Company (as defined in Rule 12b-2 of the Exchange Act). Yes o No x
The aggregate market value of the voting common stock (the registrant has no non-voting equity) held by non-affiliates of the registrant (computed by reference to the average bid and asked price as of the last business day of the registrant’s most recently completed second fiscal quarter) was $962,054.
The number of shares outstanding of the registrant's only class of common stock as of March 5, 2007 is 2,741,168 shares.
DOCUMENTS INCORPORATED BY REFERENCE
Portions of the Company's proxy statement related to the annual meeting of shareholders of the Company scheduled for May 15, 2007, which is to be filed pursuant to Regulation 14A not later than 120 days after the end of the fiscal year covered by this report, are incorporated by reference in Part III of this report.
TABLE OF CONTENTS
| Part I | | | Page Number |
| Item 1. | Business | 4 |
| | | | | |
| | Item 1A. | Risk Factors | 6 |
| | | | | |
| | Item 1B. | Unresolved Staff Comments | 6 |
| | | | | |
| | Item 2. | Properties | 6 |
| | | | | |
| | Item 3. | Legal Proceedings | 7 |
| | | | | |
| | Item 4. | Submission of Matters to a Vote of Security Holders | 7 |
| | | | | |
| Part II | | | |
| | | | | |
| | Item 5. | Market for the Registrant’s Common Equity, Related Stockholder Matters, and Issuer Purchases of Equity Securities | 7 |
| | | | | |
| | Item 6. | Selected Financial Data | 10 |
| | | | | |
| | Item 7. | Management’s Discussion and Analysis of Financial Condition and Results of Operations | 11 |
| | | | | |
| | Item 7A. | Quantitative and Qualitative Disclosures about Market Risk | 21 |
| | | | | |
| | Item 8. | Financial Statements and Supplementary Data (Report of Independent Registered Public Accounting Firm) | 22 |
| | | | | |
| | Financial Statements | |
| | | | Balance Sheets | |
| | | December 30, 2006 and December 31, 2005 | 24 |
| | | | | |
| | | | Statements of Operations | |
| | | December 30, 2006 and December 31, 2005, and January 1, 2005 | 25 |
| | | | | |
| | | | Statements of Changes in Shareholders’ Equity | |
| | | December 30, 2006 and December 31, 2005, and January 1, 2005 | 26 |
| | | | | |
| | | Statements of Cash Flows | |
| | | December 30, 2006 and December 31, 2005, and January 1, 2005 | 27 |
| | | | | |
| | Notes to Financial Statements | 28 |
| | | | | |
| | Item 9. | Changes in and Disagreements with Accountants on Accounting and Financial Disclosure | 38 |
| | | | | |
| | Item 9A. | Controls and Procedures | 38 |
| | | | | |
| | Item 9B. | Other Information | 38 |
| | | | | |
| Part III | | | |
| | | | | |
| | Item 10. | Directors, Executive Officers and Corporate Governance | 38 |
| | | | | |
| | Item 11. | Executive Compensation | 39 |
| | | | | |
| | Item 12. | Security Ownership of Certain Beneficial Owners and Management and Related Stockholder Matters | 39 |
| | | | | |
| | | | | |
| | Item 13. | Certain Relationships and Related Transactions. | 39 |
| | | | | |
| | Item 14. | Principal Accountant Fees and Services | 39 |
| | | | | |
| Part IV | | | |
| | | | | |
| | Item 15. | Exhibits and Financial Statement Schedules | 41 |
| | | | | |
| | Signatures | 43 |
| | | | | |
| | Exhibit Table | 44 |
| | | | | |
| | Exhibit 14 Code of Ethics | 45 |
| | | | | |
| | Certifications | 46 |
BURKE MILLS INC.
PART I
ITEM 1 - BUSINESS
| | (a) | General Development of Business - During 2006, the Company’s general development of business consisted of continuing to expand its product line to other fibers, development of specialty products, and reducing cost. Its balance sheet weakened as a result of its loss from operations. |
During 2006, the Company added new customers but continued to experience a decline in sales to existing customers due to competition from imports and erosion in customers' credit. It also developed lower cost off shore suppliers for its textured yarns.
| | (b) | Financial Information about Industry Segments - The Company had only one industry segment during the fiscal year ended December 30, 2006. |
| | | |
| | (c) | Narrative Description of Business - The Company is engaged in texturing, winding, dyeing, processing and selling of cotton, nylon, rayon, filament, novelty and spun yarns, and in the dyeing and processing of these yarns for others on a commission basis. |
The principal markets served by the Company are apparel, upholstery, home furnishings and industrial uses through the knitting and weaving industry.
The Company's products are sold in highly competitive markets primarily throughout the United States. Competitiveness of the Company's products is based on price, service and product quality. Many of the Company's competitors are divisions or segments of larger, diversified firms with greater financial resources than those of the Company.
The methods of distribution of the Company's products consist of the efforts of the Company's sales force which makes contact with existing and prospective customers. The Company markets its products throughout the United States, Mexico and Canada, with the bulk of the business being primarily in the eastern United States, through three salesmen employed directly by the Company on salary and a number of commissioned sales agents working on various accounts.
The dollar amount of backlog of unshipped orders as of December 30, 2006 was $1,635,000 and as of December 31, 2005 was $2,149,000. Generally, all orders in backlog at the end of a year are shipped the following year. The backlog has been calculated by the Company's normal practice of including orders which are deliverable over various periods and which may be changed or canceled in the future.
The most important raw materials used by the Company are unprocessed raw yarn, dyes and chemicals. The Company believes that its sources of supply for these materials are adequate for its needs and that it is not substantially dependent upon any one supplier.
With respect to the practices of the Company relating to working capital items, the Company generally carries enough inventory for approximately 50 days. On average, the Company turns its inventory approximately 7 to 9 times each year. The Company meets its delivery schedules on a consistent on-time basis, and has a ready supply of raw materials from suppliers. For the fiscal year ended December 30, 2006, approximately 12% of the Company's sales were from dyeing and processing of yarn for customers who supplied the yarn. The Company does not allow customers to return merchandise except where the merchandise is defective. The Company rarely extends payment terms to its customers beyond sixty (60) days and has experienced no significant problems in collecting its accounts receivable. The Company believes that industry practices are very similar to that of the Company in regard to these matters.
BURKE MILLS, INC. PART I
ITEM 1 - BUSINESS (continued)
Substantially all of the Company's manufacturing operations are run by electrical energy purchased from local utility companies, and fuel oil or natural gas is used to heat the premises and fuel the boilers. The Company has not experienced any shortages in electricity, oil or gas during the fiscal year, and has made no other arrangements for alternate sources of energy. While energy related difficulties are not expected to prevent the Company from achieving desired production levels, energy shortages of extended duration could have an adverse impact on operations.
The Company has established a recycling program for its major waste items: yarn, cardboard, plastic tubes and cleaning fluid.
The Company believes its manufacturing operations are in compliance with all presently applicable federal, state and local legislative and administrative regulations concerning environmental protection. Although it cannot predict the effect that future changes in such regulations may have, particularly as such changes may require capital expenditures or affect earnings, the Company does not believe that any competitor subject to the same or similar regulations will gain any significant and competitive advantages as a result of any such changes. Compliance by the Company during the fiscal year ended December 30, 2006 with federal, state and local environmental protection laws had no material effect on capital expenditures, earnings, or the competitive position of the Company.
During 1996, in connection with a bank loan to the Company secured by real estate, the Company had a Phase I Environmental Site Assessment conducted on its property. The assessment indicated the presence of a contaminant in the groundwater under the Company's property. The contaminant was a solvent used by the Company in the past but is no longer used. The contamination was reported to the North Carolina Department of Environment and Natural Resources (DENR). DENR required a Comprehensive Site Assessment that has been completed. The Company's outside engineering firm conducted testing and prepared a Corrective Action Plan that was submitted to DENR. The Company has identified remediation issues and continues to move toward a solution of natural attenuation. The cost of monitoring is approximately $11,000 per year.
On January 30, 2007, the Company had 157 employees. The Company's yarn division is its only division. During the fiscal year ended December 30, 2006, there were no customers that exceeded ten percent of the Company's revenue. Quaker Fabric Corporation was 15.9% of total revenues in 2005 and 20.7% in 2004. Culp Weaving was 11.8% of total revenues in 2005 and 11.8% in 2004.
The Company and its joint venture partner, Akra, voted on March 26, 2004 to close their joint venture, Fytek. The joint venture operated on a scaled down basis through mid-August 2004. In 2005 and 2006, the Company and its joint venture partner continued liquidation of Fytek. The Company received approximately $325,000 cash distribution through year end 2005. In the fourth quarter of 2006, the Company sold its shares in Fytek to Akra for $15,000. Akra will maintain the financial records of Fytek for five years, as required by Mexican tax laws.
| | (d) | Financial Information about Geographic Areas. For each of the last three fiscal years of the Company, revenues of the Company from customers outside the U.S. are as follows: |
| Country of | | | 2006 | | 2005 | | 2004 | |
| | Mexico | | | -0- | | | 115,000 | | | 67,000 | |
| | Canada | | | 6,000 | | | 15,000 | | | 15,000 | |
| | Honduras | | | 11,000 | | | 155,000 | | | 406,000 | |
| | Barbados | | | -0- | | | 11,000 | | | -0- | |
| | Turkey | | | -0- | | | -0- | | | 1,000 | |
| | Hong Kong | | | 31,000 | | | 47,000 | | | 33,000 | |
| | Sri Lanka | | | 101,000 | | | -0- | | | -0- | |
| Total | | $ | 149,000 | | $ | 343,000 | | $ | 522,000 | |
| | | | | | | | | | | | |
BURKE MILLS, INC. PART I
ITEM 1 - BUSINESS (continued)
The basis for attributing revenues from external customers to individual countries is payment by country of domicile on invoices from the Company. The Company does not have any long-lived assets, long-term customer relationships with a financial institution, mortgage and other servicing rights, deferred policy acquisition costs or deferred tax assets located in any foreign country.
| | (e) | Available Information. No report required. |
| | | |
| | (f) | Reports to Securities Holders. No report required. |
| | | |
| | (g) | Enforceability of Civil Liabilities Against Foreign Persons. No report required. |
The Company’s web site may be viewed at www.burkemills.com.
ITEM 1A. RISK FACTORS
Risk factors applying to the Company and its business are as follows:
| | (a) | The textile market in the United States has been in substantial decline for at least the past ten years due to fibers, fabrics and apparel being imported from foreign countries where manufacturers can produce the product at much lower cost than in the United States, primarily because of much lower labor costs. The problem has been exacerbated by free trade agreements and particularly the reluctance of the Federal Government to impose duties upon foreign products where the foreign government in effect subsidizes production of products. The Company, whose customers are in the textile business, as a yarn processor is faced with a shrinking customer base, as well as the price pressures due to imports faced by the Company’s customers. The Company’s customer base has been declining as some of its customers close, go into bankruptcy or are bought out by other entities. |
| | | |
| | (b) | The Company is a relatively small player in a large market. Many of the Company’s competitors are divisions or segments of larger or diversified entities with far greater financial resources than those of the Company. |
| | | |
| | (c) | The last fiscal year in which the Company made a profit was the fiscal year ended December 29, 2001. For each fiscal year since that year, the Company had a net loss. |
| | | |
| | (d) | Sales of the Company for the fiscal year ended December 29, 2001 were $37,194,000. Sales have declined since that year, dropping to $23,884,000 for the fiscal year ended December 30, 2006. |
| | | |
| | (e) | The market for the common stock of the Company is not favorable. During 2006, the stock of the Company had a high bid of $1.31 per share and steadily declined through the year to close the year at a bid of $0.81 per share. |
ITEM 1B. UNRESOLVED STAFF COMMENTS
No report required.
ITEM 2. PROPERTIES
The executive offices and manufacturing plant of the Company are located at Valdese, North Carolina, which is 75 miles northwest of Charlotte, North Carolina, and 60 miles east of Asheville, North Carolina. The main plant and executive offices are located on an approximate nineteen-acre tract of land owned by the Company. The Company also owns approximately 18 acres adjacent to the plant which is undeveloped. The main plant building used by the Company contains approximately 309,000 square feet. The Company also owns an auxiliary building containing 36,600 square feet located adjacent to its main plant. This latter building is currently used for warehousing yarn and as a distribution center.
BURKE MILLS, INC. PART I
ITEM 2. PROPERTIES (continued)
The plant buildings are steel and brick structures protected by automatic sprinkler systems. The various departments, with the exception of the production dyehouse, are heated, cooled and humidified. The Company considers all its properties and manufacturing equipment to be in a good state of repair, well maintained and adequate for its present needs.
The Company utilizes substantially all of the space in its main plant for its offices, machinery and equipment, storage and receiving areas. The Company utilizes substantially all of the space in the auxiliary building for warehouse and distribution purposes.
The approximate maximum capacity in pounds per year of the Company's machinery and equipment, based upon operating the machinery and equipment seven (7) days per week fifty (50) weeks per year, and the approximate percentage of utilization thereof during the fiscal year ended December 30, 2006 are as follows:
| | Department | | Pounds/Year 2006 Capacity | | Utilization | |
| | Winding Machines | | 21,961,000 | | 21% | |
| | Texturing Machines | | 816,000 | | 29% | |
| | Dyeing Equipment | | 22,376,000 | | 42% | |
| | | | | | | |
ITEM 3. LEGAL PROCEEDINGS
The Company is not presently involved in any legal proceedings other than ordinary, routine litigation incidental to the business of the Company.
ITEM 4. SUBMISSION OF MATTERS TO A VOTE OF SECURITY HOLDERS
No matters were submitted to a vote of security holders during the fourth quarter of the fiscal year covered by this report.
PART II
ITEM 5. MARKET FOR THE REGISTRANT'S COMMON EQUITY, RELATED STOCKHOLDER MATTERS, AND ISSUER PURCHASES OF EQUITY SECURITIES
| | (a) | The principal United States (or other) market in which the Company's common stock is being traded is the over-the-counter market. The stock is quoted in the Nasdaq Over-The-Counter Bulletin Board quotations system under the symbol BMLS.OB. The range of high and low bid quotations for the Company's common stock for each quarterly period during the past two years ended December 30, 2006, and on the latest practicable date (as obtained from Commodity Systems, Inc.) is as follows: |
| | | | | | Low Bid | |
| | March 31 | | $0.90 | | $0.55 | |
| | June 30 | | $1.31 | | $0.51 | |
| | September 30 | | $0.81 | | $0.75 | |
| | | | $0.81 | | $0.65 | |
| | | | | | | |
| | | | | | | |
BURKE MILLS, INC. PART II
ITEM 5. MARKET FOR THE REGISTRANT'S COMMON EQUITY, RELATED STOCKHOLDER MATTERS, AND ISSUER PURCHASES OF EQUITY SECURITIES (continued)
| | Quarter Ending 2005 | | | | Low Bid | |
| | | | | | | |
| | March 31 | | $1.30 | | $0.80 | |
| | June 30 | | $1.65 | | $0.61 | |
| | September 30 | | $1.15 | | $0.85 | |
| | December 31 | | $1.15 | | $0.57 | |
| | | | | | | |
| | February 1, 2007 | | $0.81 | | $0.81 | |
Such over-the-counter market quotations reflect inter-dealer prices, without retail mark-up, mark-down or commission and may not necessarily represent actual transactions.
| | (b) | As of February 1, 2007, there were 318 holders of record of the common stock of the Company. |
| | | |
| | (c) | The Company has declared no dividends on its common stock during the past two fiscal years. |
| | | |
| | (d) | Securities Authorized For Issuance Under Equity Compensation Plans. No equities securities of the Company are authorized for issuance under equity compensation plans. |
| | | |
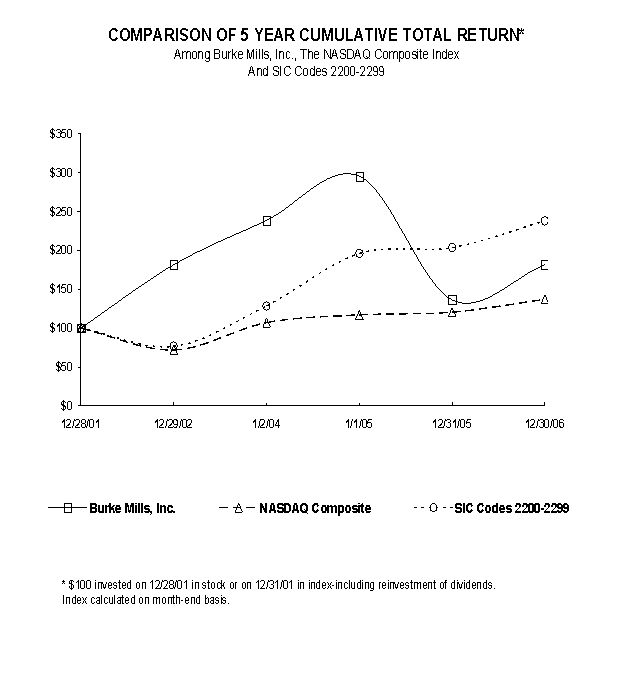
| | (e) | Performance Graph. The graph which follows compares the yearly percentage change in the Company’s cumulative total shareholder return on its common stock with the cumulative total return of (a) all United States companies traded on the NASDAQ stock market and (b) five companies traded on the NASDAQ stock market which carry NASDAQ Standard Industrial Classification (SIC) Code 2200-2299, being companies producing textile mill products (Dixie Group, Inc., Hampshire Group, Interface, Inc., Quaker Fabric, Corp. and True Religion Apparel, Inc.) Dividend reinvestment is assumed. (This graph was prepared for the Company by Research Data Group, Inc. of San Francisco, CA.) |
| | | | | | | | |
| | | 12/28/01 | 12/29/02 | 1/2/04 | 1/1/05 | 12/31/05 | 12/30/06 |
| | | | | | | | |
Burke Mills, Inc. | | 100.00 | 181.82 | 238.64 | 295.45 | 136.36 | 181.82 |
NASDAQ Composite | | 100.00 | 71.97 | 107.18 | 117.07 | 120.50 | 137.02 |
SIC Codes 2200-2299 | 100.00 | 76.70 | 128.52 | 196.13 | 203.76 | 237.99 |
ITEM 6. SELECTED FINANCIAL DATA
The following selected financial data set forth for the last five fiscal years of the Company have been derived from the audited financial statements of the Company. The data should be read in conjunction with "Management's Discussion and Analysis of Financial Condition and Results of Operations" and the audited financial statements and related notes thereto and other financial information included therein.
| | | (in thousands except per share data) | |
| | | Years Ended | |
| | | Dec. 30 2006 | | Dec. 31 2005 | | Jan. 1 2005 | | Jan. 3 2004 | | Dec. 28 2002 | |
| SELECTED STATEMENT OF OPERATIONS DATA | | | | | | | | | | | | | | | | |
| Net sales | | $ | 23,884 | | $ | 25,253 | | $ | 25,134 | | $ | 24,815 | | $ | 29,990 | |
| Cost of sales | | | 23,777 | | | 25,144 | | | 24,546 | | | 24,237 | | | 27,968 | |
| | | | | | | | | | | | | | | | | |
| Gross profit | | $ | 107 | | $ | 109 | | $ | 588 | | $ | 578 | | $ | 2,022 | |
| | | | | | | | | | | | | | | | | |
| Loss before income | | | | | | | | | | | | | | | | |
| taxes | | $ | (1,877) | | $ | (1,922) | | $ | (2,106) | | $ | (2,222) | | $ | (641) | |
| Income taxes (benefit) | | | -0- | | | -0- | | | (399) | | | (638) | | | (322) | |
| Net loss | | $ | (1,877) | | $ | (1,922) | | $ | (1,707) | | $ | (1,584) | | $ | (319) | |
| | | | | | | | | | | | | | | | | |
| Per Share (Note A) | | | | | | | | | | | | | | | | |
| Net loss-basic and diluted | | $ | (.68) | | $ | (.70) | | $ | (.62) | | $ | (.58) | | $ | (.12) | |
| | | | | | | | | | | | | | | | | |
| Cash dividends declared | | | | | | | | | | | | | | | | |
| Per common share | | | None | | | None | | | None | | | None | | | None | |
| | | | | | | | | | | | | | | | | |
| Weighted average number | | | | | | | | | | | | | | | | |
| of common shares outstanding | | | 2,741 | | | 2,741 | | | 2,741 | | | 2,741 | | | 2,741 | |
| - basic and diluted | | | | | | | | | | | | | | | | |
| | | | | | | | | | | | | | | | | |
BURKE MILLS, INC. PART II
ITEM 6. SELECTED FINANCIAL DATA (continued)
| SELECTED CASH FLOW DATA | | | | | | | | | | | | | | | | |
| Capital expenditures | | $ | 137 | | $ | 312 | | $ | 72 | | $ | 127 | | $ | 888 | |
| | | | | | | | | | | | | | | | | |
| Depreciation | | $ | 1,588 | | $ | 1,674 | | $ | 1,779 | | $ | 2,010 | | $ | 2,055 | |
| | | | | | | | | | | | | | | | | |
| SELECTED BALANCE SHEET DATA | | | | | | | | | | | | | | | | |
| Current assets | | $ | 4,357 | | $ | 4,728 | | $ | 5,135 | | $ | 4,445 | | $ | 8,670 | |
| Current liabilities | | | 1,677 | | | 1,630 | | | 1,676 | | | 1,181 | | | 2,482 | |
| | | | | | | | | | | | | | | | | |
| Working capital | | $ | 2,680 | | $ | 3,098 | | $ | 3,459 | | $ | 3,264 | | $ | 6,188 | |
| | | | | | | | | | | | | | | | | |
| Current ratio | | | 2.60 | | | 2.89 | | | 3.06 | | | 3.76 | | | 3.49 | |
| | | | | | | | | | | | | | | | | |
| Total assets | | $ | 7,674 | | $ | 9,504 | | $ | 11,472 | | $ | 13,078 | | $ | 20,225 | |
| | | | | | | | | | | | | | | | | |
| Long-term debt | | $ | -0- | | $ | -0- | | $ | -0- | | $ | -0- | | $ | 2,920 | |
| | | | | | | | | | | | | | | | | |
| Net deferred tax liability | | $ | -0- | | $ | -0- | | $ | -0- | | $ | 394 | | $ | 1,735 | |
| | | | | | | | | | | | | | | | |
| Shareholders' equity | | $ | 5,997 | | $ | 7,874 | | $ | 9,796 | | $ | 11,503 | | $ | 13,088 | |
| (A) | Income per share has been computed based on the weighted average number of common shares outstanding during each period. |
ITEM 7. MANAGEMENT'S DISCUSSION AND ANALYSIS OF FINANCIAL CONDITION AND RESULTS OF OPERATIONS
EXECUTIVE SUMMARY
The Company’s major market is supplying packaged dyed yarn to knitters and weavers for apparel, home furnishings, home upholstery, automotive upholstery, contract upholstery and some specialty products.
The Company continued to add customers in 2006, as sales to older customers continued to decline. Although the Company's net sales declined, pounds shipped remained approximately the same as commission customers were added during the year. During the second quarter of 2006, the Company added commission (the dyeing and processing of customer owned yarns) customers and changed the sales mix significantly. Commission pounds shipped in 2006 accounted for 21% of total shipments versus 5% in 2005. Commission pounds shipped in the fourth quarter of 2006 accounted for 28% of pounds shipped. The average sales price for commission sales will be lower as there is no yarn cost in the sales price. An advantage of processing on a commission basis is the Company does not tie up cash in raw yarn inventory.
Since the Company began diversifying into other fibers in 2004, its non-polyester volume has increased to 29% of total pounds shipped. These fibers have longer cycle times in the dye machines and require winding after dyeing.
In the fourth quarter of 2006, it was announced that the Company's largest supplier of textured yarns, Dillion Yarns, would be purchased by the Company's largest competitor, Unifi Corporation, effective January 2007. Unifi has told the Company that it will continue to supply yarns at a competitive price to the Company.
During 2006, the Company had developed other sources for textured yarns before the acquisition was announced. At the time, the sources were developed to lower the cost of the Company's textured yarns.
BURKE MILLS, INC. PART II
ITEM 7. MANAGEMENT'S DISCUSSION AND ANALYSIS OF FINANCIAL CONDITION AND RESULTS OF OPERATIONS
EXECUTIVE SUMMARY (continued)
Duke Energy, the Company's supplier of electricity, has notified the Company that there will be a rate increase effective July 1, 2007 of 14% to 18%. The Company is studying ways to reduce its electricity usage.
In the fourth quarter, the Company sold its shares in Fytek to its joint venture partner Akra. The joint venture has been liquidated, and Akra will maintain the financial records for the prescribed time required by the Mexican tax laws.
The following table sets forth selected operating data of the Company as percentages of net sales for the periods indicated.
| | | Relationship to Total Revenue For the Year Ended | |
| | | | | | | | |
| Net Sales | | 100.0 | % | 100.0 | % | 100.0 | % |
| Cost of Sales | | 99.6 | | 99.6 | | 97.7 | |
| Gross profit margin | | 0.4 | | 0.4 | | 2.3 | |
| | | | | | | | |
| Selling, general, administrative | | 8.3 | | 8.0 | | 10.0 | |
| Operating loss | | (7.9 | ) | (7.6 | ) | (7.7 | ) |
| Other income | | 0.0 | | 0.3 | | 0.1 | |
| Other expenses | | (0.0 | ) | 0.0 | | 0.0 | |
| | | | | | | | |
Loss before income taxes and net equity in affiliates | | (7.9 | ) | (7.3 | ) | (7.6 | ) |
| Income taxes (benefit) | | 0.0 | | 0.0 | | (1.6) | |
| | | (7.9 | ) | (7.3 | | (6.0 | |
Equity (Loss) in Net Earnings Of Affiliate | | 0.0 | | (0.3) | | (0.8 | ) |
| | | | | | | |
| Net Loss | | (7.9 | )% | (7.6 | )% | (6.8 | )% |
Results of Operations: 2006 Compared to 2005
Net Sales
Net sales for the year decreased by 5.4% to $23,884,000 compared to $25,253,000 in 2005. Pounds shipped decreased by only .3%.
The Company continued to add customers in 2006, as sales to older customers continued to decline. Although the Company's net sales declined, pounds shipped remained approximately the same as commission customers were added during the year.
During the second quarter of 2006, the Company added commission (the dyeing and processing of customer owned yarns) customers and changed the sales mix significantly. Commission pounds shipped in 2006 accounted for 21% of total shipments versus 5% in 2005. Commission pounds shipped in the fourth quarter of 2006 accounted for 28% of pounds shipped. The average sales price for commission sales will be lower as there is no yarn cost in the sales price. An advantage of processing on a commission basis is the Company does not tie up cash in raw yarn inventory.
BURKE MILLS, INC. PART II
ITEM 7. MANAGEMENT'S DISCUSSION AND ANALYSIS OF FINANCIAL CONDITION AND RESULTS OF OPERATIONS
Results of Operations: 2006 Compared to 2005
Net Sales (continued)
Since the Company began diversifying into other fibers in 2004, its non-polyester volume has increased to 29% of total pounds shipped. These fibers have longer cycle times in the dye machines and require winding after dyeing.
Cost of Sales and Gross Margin
Cost of good sold decreased by $1,367,000 or 5.4%.
Cost of materials decreased by $1,827,000 or 11.9% primarily due to a change in sales mix to a greater portion of commission sales.
Direct labor increased by $74,000 or 6.6% as a result of a change in sales mix that required more winding of the yarn and some excessive overtime in the third quarter of 2006.
Overhead cost increased by $412,000 or 4.8% primarily as a result of the following:
| | (a) | Electricity increased by $176,000 or 20.8% primarily due to a change in the product mix which requires longer drying cycles and increased winding of the yarn. Duke Energy, the Company’s supplier of electricity, has notified the Company that there will be a rate increase effective July 1, 2007 of 14% to 18%. |
| | | |
| | (b) | Natural gas and fuel oil increased by $312,000 or 30.6%. Approximately 8% of the increase was caused by the change in product mix, requiring longer cycle times. The reminder of the increase was due to price. The price of natural gas and fuel oil are difficult to predict because of world events. |
| | | |
| | (c) | Water increased by $66,000 or 16.5% primarily as a result of the product mix change. Usage was up approximately 13%, and the remainder of the increase was a price increase. The Company expects a price increase of approximately 5% in July 2007. |
| | | |
| | (d) | Repair and maintenance of machinery increased by $53,000 or 10.1%. As the Company’s machinery ages, the repair cost will increase. |
The above cost increases were particularly offset by the following:
| | (a) | Employee health claims decreased by $129,000 or 20.3%. It is impossible to predict the frequency or severity of the employees' medical needs. |
| | | |
| | (b) | Depreciation decreased by $66,000 or 4.0% and should continue to decrease unless the Company makes large capital expenditures. |
As a result of a decrease in net sales of 5.4% and a decrease in cost of sales of 5.4%, the Company's gross margin remained at .4%.
Selling, General and Administrative Expenses
Selling, general and administrative expenses decreased by $234,000 or 10.5% primarily as a result of cost cutting measures put in place in the fourth quarter of 2005.
BURKE MILLS, INC. PART II
ITEM 7. MANAGEMENT'S DISCUSSION AND ANALYSIS OF FINANCIAL CONDITION AND RESULTS OF OPERATIONS
Results of Operations: 2006 Compared to 2005
Equity in Affiliate
In the fourth quarter, the Company sold its shares in Fytek to its joint venture partner, Akra, for $15,000. The Company has no further ownership in the joint venture.
Provision (benefit) for Income Taxes
There was no provision or benefit provided for income taxes for the year 2006 and 2005. See Note 8.
Results of Operations: 2005 Compared to 2004
Net Sales
Net sales for 2005 increased to $25.3 million from $25.1 million or .4%. During 2005 the Company continued to expand into other fibers and added customers. Customers added during 2004 also contributed to the increase in sales. Although the Company added new customers for the last two years, sales remained about the same as older customer's sales have declined. Five customers accounted for a decrease in sales of $3.1 million. The major reasons for their decrease in sales are bankruptcy, credit problems, and competition from imports. The Company passed the price increases on polyester yarn to its customers as price increases.
Cost of Sales and Gross Margin
Total cost of sales increased $598,000 or 2.4%.
Material cost increased by 4.2% mainly as a result of price increases on polyester yarns and sales mix.
In September 2005, the polyester yarn suppliers placed a surcharge of approximately 12% on all polyester yarns. The surcharge was caused by Hurricane Katrina's disruption of the oil refineries in the Gulf Coast area that produced the chemicals used to produce polyester. The surcharge was removed in stages during the fourth quarter, but was replaced with a price increase in January 2006 of approximately 4%. The Company adjusted its pricing accordingly to its customers for the surcharge and the January increase. Another price increase was announced for March 2006 of approximately 4.5%.
Direct labor decreased by 2.2% mainly due to sales mix and better management of labor cost.
Manufacturing overhead cost increased by 1.5% primarily as a result of the following:
| | (a) | Natural gas and fuel oil cost increased 23.6% due to the increased market price of petroleum products. The Company cannot predict the direction of the fuel oil price for 2007. |
| | | |
| | (b) | Repair and maintenance of machinery and equipment increased by 15.8% due to some major repairs of dye machinery and the age of the other machinery. |
BURKE MILLS, INC. PART II
| | (e) | Health claims increased by 8.9% primarily as a result of higher claims in the first and second quarters of 2005. It is impossible to predict the frequency or severity of the employees' medical needs. |
| | Water increased by 11.8% primarily due to a 5% increase in water rates effective in July 2005, and an increase in dyeing of cotton fiber which requires more water in the process. |
The above cost increases were somewhat offset by the following:
| | (a) | Production wages (non-direct) decreased by 5.4% primarily due to cost reduction program initiated in the third quarter of 2005. |
| | | |
| | (b) | Depreciation decreased by 6.2% and should continue to decrease unless the Company makes large capital expenditures. |
As a result of an increase in sales of .4%, and an increase in cost of sales of 2.4%, the Company's gross margin decreased to .4% compared to 2.3% in 2004.
Results of Operations: 2005 Compared to 2004
Selling, General and Administrative Expenses
Selling, general and administrative expenses decreased by 5.3% primarily due to the elimination of the factoring charges of $102,000 and cost reduction program in the third quarter of 2005.
Gain on Disposal of Property Assets
The Company sold its fully depreciated machinery located at its joint venture in Mexico. In the first quarter of 2005, the Company received $101,000, and in the fourth quarter of 2005 received $105,000 from the sale of this machinery.
Equity in Net Loss of Affiliate
The Company's joint venture, Fytek, had a net loss of $464,000 on discontinued operations. The Company's portion of the loss is $232,000, but only $21,000 was recorded as the investment in affiliate was reduced to zero. The Company received $175,000 in the second quarter of 2005 as a distribution of cash from the liquidation.
Provision (Benefit) for Income Taxes
There was no provision or benefit for income taxes in 2005 compared to a benefit of $399,000 in 2004. See Note 8 - Income Taxes.
Results of Operations 2006 - 2004 Sales Analysis
The table below sets forth an analysis of sales volume for the period 2004 to 2006, inclusive. Unit prices for commission sales have varied based on mix and market conditions.
The increase in full yarn average sales prices is a result of price increases and sales mix.
| | | | | | | | | | | | |
| 2006: | | | | | | | | | | | |
| | Yarn sales | | | 88% | | | 79% | | $ | 2.83 | |
| | Commission sales | | | 12% | | | 21% | | | 1.44 | |
| | | | | | | | | | | | |
| | Total | | | 100% | | | 100% | | | | |
| | | | | | | | | | | | |
| 2005: | | | | | | | | | | | |
| | Yarn sales | | | 96% | | | 95% | | $ | 2.68 | |
| | Commission sales | | | 4% | | | 5% | | | 2.54 | |
| | | | | | | | | | | | |
| | Total | | | 100% | | | 100% | | | | |
| | | | | | | | | | | | |
| 2004: | | | | | | | | | | | |
| | Yarn sales | | | 94% | | | 93% | | $ | 2.54 | |
| | Commission sales | | | 6 | | | 7 | | | 2.43 | |
| | | | | | | | | | | | |
| | Total | | | 100% | | | 100% | | | | |
| | | | | | | | | | | | |
Critical Accounting Policies and Estimates
The preparation of financial statements, in accordance with accounting principles generally accepted in the United States, requires management to make assumptions and estimates that affect the reported amounts of assets and liabilities as of the balance sheet date and revenues and expenses recognized and incurred during the reporting period then ended. In addition, estimates affect the determination of contingent assets and liabilities and their related disclosure. The Company bases its estimates on a number of factors, including historical information and other assumptions that it believes are reasonable under the circumstances. Actual results may differ from these estimates in the event there are changes in related conditions or assumptions. The development and selection of the disclosed estimates have been discussed with the Audit Committee of the Board of Directors. The following accounting policies are deemed to be critical, as they require accounting estimates to be made based upon matters that are highly uncertain at the time such estimates are made.
BURKE MILLS, INC. PART II
ITEM 7. MANAGEMENT'S DISCUSSION AND ANALYSIS OF FINANCIAL CONDITION AND RESULTS OF OPERATIONS
The Company is self-funded for its employee health claims. The health claims are paid by the Company after review by the Company’s third party administrator. The Company’s liability for health claims includes claims that the Company estimates have been incurred, but not yet presented to the administrator. A historical basis is used to establish the amount.
The Company reviews its inventory and when necessary records the impairment in the carrying value of obsolete and slow moving items. The impairment is determined by aging the inventory, reviewing the inventory with the salesmen, and determining a salvage value.
The Company reviews its net deferred tax asset and when necessary records a valuation allowance to adjust the asset to an amount believed more likely than not to be realizable. Consideration is given to estimated future taxable income, expiration of operating loss carryforwards, and expiration of tax credits to determine the amount of the valuation allowance.
Recent Accounting Pronouncements
In February 2006, the FASB issued FAS No. 155, “Accounting for Certain Hybrid Financial Instruments, an amendment of FASB statements No. 133 and 140” (FAS No. 155). This Standard resolves and clarifies the accounting and reporting for certain financial instruments, including hybrid financial instruments with embedded derivatives, interest-only strips, and securitized financial instruments. FAS No. 155 is effective for all financial instruments acquired or issued after the beginning of an entity’s first fiscal year that begins after September 15, 2006. The Company will be required to adopt this Standard on January 1, 2007, and does not expect adoption of this Standard to have a material effect on its financial statements.
In March 2006, the FASB issued FAS No. 156. “Accounting for Servicing of Financial Assets, an amendment of FAS No. 140”. This Standard amends the accounting treatment with respect to separately recognized servicing assets and servicing liabilities, and is effective for fiscal years beginning after September 15, 2006. The Company does not expect adoption of this Standard to have a material effect on its financial statements.
In June 2006, the FASB issued Interpretation No. 48, “Accounting for Uncertainty in Income Taxes, an Interpretation of FAS No. 109” (FIN 48). This interpretation clarifies the accounting for income taxes, by prescribing a minimum recognition threshold a tax position is required to meet before being recognized in the financial statements. FIN 48 also provides guidance on derecognizing, measurement, classification, interest and penalties, accounting in interim periods, disclosure and transition. The Company will adopt FIN 48 in fiscal year 2007, as required. The Company will be required to apply the provisions of FIN 48 to all tax positions upon initial adoption with any cumulative effect adjustment to be recognized as an adjustment to retained earnings. The Company is currently evaluating the effect FIN 48 will have on its financial statements.
In September 2006, the FASB issued FAS No. 157, “Fair Value Measurements” (FAS No. 157). FAS No. 157 clarifies the principle that fair value should be based on the assumptions market participants would use when pricing an asset or liability and establishes a fair value hierarchy that prioritizes the information used to develop those assumptions. Under the Standard, fair value measurements would be separately disclosed by level within the fair value hierarchy. FAS No. 157 is effective for financial statements issued for fiscal years beginning after November 15, 2007, and interim periods within those fiscal years, with early adoption permitted. The Company does not expect the adoption of FAS No. 157 to have a material effect on its financial statements.
BURKE MILLS, INC. PART II
In September 2006, the FASB issued FAS No. 158, “Employers’ Accounting for Defined Benefit Pension and Other Postretirement Plans” (FAS No. 158). FAS No. 158 requires recognition of all obligations related to defined benefit pensions and other postretirement benefits. The Company does not currently have a defined benefit pension plan or other postretirement plan and does not believe FAS No. 158 will have a material effect on its financial statements.
In September 2006, the Securities and Exchange Commission issued Staff Accounting Bulletin No. 108 “Considering the Effects of Prior Year Misstatements when Quantifying Misstatements in Current Year Financial Statements” (SAB 108). SAB 108 provides interpretive guidance on how the effects of the carryover or reversal of prior year misstatements should be considered in quantifying a current year misstatement. The SEC staff believes that companies should quantify errors using both a balance sheet and an income statement approach and evaluate whether either approach results in quantifying a misstatement that, when all relevant quantitative and qualitative factors are considered, is material. The adoption of SAB 108 did not have a material effect on the Company’s financial statements.
BURKE MILLS, INC. PART II
ITEM 7. MANAGEMENT'S DISCUSSION AND ANALYSIS OF FINANCIAL CONDITION AND RESULTS OF OPERATIONS
Liquidity and Capital Resources
In 2006 and 2005, the Company financed its operations with funds generated from operations and its line of credit.
The Company's ability to generate cash from its operating activity is subject to the level of net sales. As discussed earlier, the Company continues to expand into other fibers and add customers.
As set forth in the Statement of Cash Flows, funds used by operating activities were $517,000. The funds used reflect the net loss and an increase in accounts receivable and a decrease in accounts payable.
The Company had net inventories of $1,543,000 at December 30, 2006, and an averaged inventory of $1,843,000 for 2006. The inventory turned in 2006 approximately seven times. The Company expects the inventory turns in 2007 will be approximately the same.
In 2006, the Company used $111,000 in its investing activities as compared to funds provided of $75,000 in 2005. In 2005, the Company liquidated most of its investment and equipment at its joint venture Fytek. This liquidation resulted in cash received for machinery of $212,000 and $175,000 as return of investment.
The Company used $137,000 for capital expenditures in 2006 compared to $312,000 in 2005. Planned capital expenditures for 2007 are approximately $100,000.
The Company's line of credit provided $258,000 in 2006. The Company had debt under its line of credit of $258,000 and availability of $2,745,000 at December 30, 2006. See Note 6 Line of Credit.
The Company's working capital decreased by $418,000 primarily as a result of the decrease in cash caused by the net loss.
| | | 2006 | | 2005 | | 2004 | |
| Working Capital | | $ | 2,680,000 | | $ | 3,098,000 | | $ | 3,459,000 | |
| Working Capital Ratio | | | 2.60 to 1 | | | 2.89 to 1 | | | 3.06 to 1 | |
As a measure of current liquidity, the Company's quick position (cash, cash equivalents and receivables over current liabilities) discloses the following at December 30, 2006 and December 31, 2005:
| | | | December 30 2006 | | | | |
Cash, cash equivalents and receivables | | $ | 2,783,000 | | $ | 2,995,000 | |
| Current liabilities | | | 1,677,000 | | | 1,630,000 | |
| | | | | | | | |
Excess of quick assets over current liabilities | | $ | 1,106,000 | | $ | 1,365,000 | |
| Quick Ratio | | | 1.66 to 1 | | | 1.83 to 1 | |
BURKE MILLS INC. PART II
ITEM 7. MANAGEMENT'S DISCUSSION AND ANALYSIS OF FINANCIAL CONDITION AND RESULTS OF OPERATIONS
Contractual Obligations
The following is a summary of the Company’s known contractual obligations as of the latest fiscal year end on December 30, 2006.
| | | | | | Payments due by period | |
| | | | Total | | | Less than 1 year | | | 1-3 years | | | 3-5 years | | | More than 5 years | |
| Contractual Obligations | | | | | | | | | | | | | | | | |
| | | | | | | | | | | | | | | | | |
| Line of Credit Balance | | $ | 258,000 | | | | | $ | -0- | | $ | -0- | | $ | -0- | |
| | | | | | | | | | | | | | | | | |
Operating Lease Obligations | | $ | 87,000 | | $ | 46,000 | | $ | 36,000 | | $ | 5,000 | | $ | -0- | |
| | | | | | | | | | | | | | | | | |
Purchase Obligations/ Commitments(1) | | $ | 1,823,000 | | $ | 1,823,000 | | $ | -0- | | $ | -0- | | $ | -0- | |
| | | | | | | | | | | | | | | | | |
| TOTAL | | $ | 2,168,000 | | $ | 2,127,000 | | $ | 36,000 | | $ | 5,000 | | $ | -0- | |
| | | | | | | | | | | | | | | | | |
| (1) | | The Company's purchase obligations/commitments represent open purchase orders, Letters of Credit, and other commitments for goods and services that will be received during the year. |
Environmental Matters
During 1996, in connection with a bank loan to the Company collateralized by real estate, the Company had a Phase I Environmental Site Assessment conducted on its property. The assessment indicated the presence of a contaminant in the groundwater under the Company's property. The contaminant was a solvent used by the Company in the past but is no longer used. The contamination was reported to the North Carolina Department of Environment and Natural Resources (DENR). DENR required a Comprehensive Site Assessment that has been completed. The Company's outside engineering firm conducted testing and prepared a Corrective Action Plan that was submitted to DENR. The Company has identified remediation issues and continues to move toward a solution of natural attenuation. The cost of monitoring is approximately $11,000 per year.
Inflation
The Company has experienced volatile pricing for fuel oil and natural gas due to world events. The cost for 2006 on the average was higher.
Polyester yarns, a petroleum based product, had the same type volatility as gas and oil. The cost at year end was approximately 8% higher.
BURKE MILLS INC. PART II
ITEM 7. MANAGEMENT'S DISCUSSION AND ANALYSIS OF FINANCIAL CONDITION AND RESULTS OF OPERATIONS
Inflation (continued)
Water rates increased by 5% in 2006 and are expected to increased in 2007 by approximately 5%.
Duke Energy, the Company supplier of electricity, has announced a rate increase effective July 1, 2007 of 14% to 18%.
The textile markets served by the Company are very competitive and cost increases of any kind are very difficult to pass on to the customers.
Forward Looking Statements
Certain statements in this Management's Discussion and Analysis of Financial condition and Results of Operations, and other sections of this report, contain forward-looking statements within the meaning of federal securities laws about the Company's financial condition and results of operations that are based on management's current expectations, beliefs, assumptions, estimates and projections about the markets in which the Company operates. Words such as "expects", "anticipates", "believes", "estimates", variations of such words and other similar expressions are intended to identify such forward-looking statements. These statements are not guarantees of future performance and involve certain risks, uncertainties and assumptions that are difficult to predict. Therefore, actual outcomes and results may differ materially from what is expressed or forecasted in, or implied by, such forward-looking statements. Readers are cautioned not to place undue reliance on these forward-looking statements, which reflect management's judgment only as of the date hereof. The Company undertakes no obligations to update publicly any of these forward-looking statements to reflect new information, future events or otherwise.
Factors that may cause actual outcome and results to differ materially from those expressed in, or implied by, these forward-looking statements include, but are not necessarily limited to, availability, sourcing and pricing of raw materials, pressures on sales prices due to competition and economic conditions, reliance on and financial viability of significant customers, technological advancements, employee relations, changes in construction spending and capital equipment expenditures (including those related to unforeseen acquisition opportunities), the timely completion of construction and expansion projects planned or in process, continued availability of financial resources through financing arrangements and operations, negotiations of new or modifications of existing contracts for asset management and for property and equipment construction and acquisition, regulations governing tax laws, other governmental and authoritative bodies, policies and legislation, and proceeds received from the sale of assets held for disposal. In addition to these representative factors, forward-looking statements could be impacted by general domestic and international economic and industry conditions in the markets where the Company competes; such as, changes in currency exchange rates, interest and inflation rates, recession and other economic and political factors over which the Company has no control.
ITEM 7A. QUANTITATIVE AND QUALITATIVE DISCLOSURES ABOUT MARKET RISK
The Company has not purchased any material instruments or entered into any arrangements resulting in market risk to the Company for trading purposes or for purposes other than trading purposes. The Company had no long-term debt for the fiscal year ended December 30, 2006.
BURKE MILLS INC. PART II
ITEM 8. FINANCIAL STATEMENTS AND SUPPLEMENTARY DATA
Report of Independent Registered Public Accounting Firm
To the Stockholders and Board of Directors of Burke Mills, Inc.
We have audited the accompanying balance sheets of Burke Mills, Inc. (the "Company") as of December 30, 2006 and December 31, 2005 and the related statements of operations, changes in shareholders’ equity, and cash flows for each of the two years then ended. These financial statements are the responsibility of the Company’s management. Our responsibility is to express an opinion on these financial statements and schedule based on our audits.
We conducted our audits in accordance with the standards of the Public Company Accounting Oversight Board (United States). Those standards require that we plan and perform the audit to obtain reasonable assurance about whether the financial statements are free of material misstatement. The Company is not required to have, nor were we engaged to perform, an audit of its internal control over financial reporting. Our audits included consideration of internal control over financial reporting as a basis for designing audit procedures that are appropriate in the circumstances, but not for the purpose of expressing an opinion on the effectiveness of the Company’s internal control over financial reporting. Accordingly, we express no such opinion. An audit also includes examining, on a test basis, evidence supporting the amounts and disclosures in the financial statements, assessing the accounting principles used and significant estimates made by management, as well as evaluating the overall financial statement presentation. We believe that our audits provide a reasonable basis for our opinion.
In our opinion, the financial statements referred to above present fairly, in all material respects, the financial position of Burke Mills, Inc. at December 30, 2006 and December 31, 2005, and the results of its operations and its cash flows for each of the two years then ended, in conformity with accounting principles generally accepted in the United States of America.
/s/ Scott McElveen, L.L.P.
Columbia, South Carolina
March 13, 2007
BURKE MILLS INC. PART II
Report of Independent Registered Public Accounting Firm
To the Stockholders and Board of Directors of Burke Mills, Inc.
We have audited the accompanying statements of operations, shareholders’ equity, and cash flows of Burke Mills, Inc. for the year ended January 1, 2005. These financial statements are the responsibility of the Company’s management. Our responsibility is to express an opinion on these financial statements based on our audit.
We conducted our audit in accordance with the standards of the Public Company Accounting Oversight Board (United States). Those standards require that we plan and perform the audit to obtain reasonable assurance about whether the financial statements are free of material misstatement. The Company is not required to have, nor were we engaged to perform, an audit of its internal control over financial reporting. Our audit included consideration of internal control over financial reporting as a basis for designing audit procedures that are appropriate in the circumstances, but not for the purpose of expressing an opinion on the effectiveness of the Company’s internal control over financial reporting. Accordingly, we express no such opinion. An audit also includes examining, on a test basis, evidence supporting the amounts and disclosures in the financial statements, assessing the accounting principles used and significant estimates made by management, as well as evaluating the overall financial statement presentation. We believe that our audit provides a reasonable basis for our opinion.
In our opinion, the financial statements referred to above present fairly, in all material respects, the results of operations of Burke Mills, Inc. and its cash flows for the year ended January 1, 2005 in conformity with accounting principles generally accepted in the United States of America.
/s/ BDO SEIDMAN, LLP
High Point, North Carolina
February 4, 2005
BURKE MILLS, INC.
BALANCE SHEETS
| ASSETS | | | December 30 2006 | | | December 31 2005 | |
| Current Assets | | | | | | | |
| Cash and cash equivalents | | $ | 55,816 | | $ | 425,812 | |
| Accounts receivable, net | | | 2,727,461 | | | 2,568,838 | |
| Inventories | | | 1,543,272 | | | 1,684,132 | |
| Prepaid expenses and other current assets | | | 30,371 | | | 49,413 | |
| | | 4,356,920 | | | 4,728,195 | |
| | | | | | | | |
| Property, plant & equipment - at cost | | | 28,041,676 | | | 28,085,778 | |
| Less: accumulated depreciation | | | 24,741,391 | | | 23,326,789 | |
| Property, Plant and Equipment- Net | | | 3,300,285 | | | 4,758,989 | |
| | | | | | | | |
| Other Assets | | | | | | | |
| Other | | | 16,575 | | | 16,575 | |
| Total Assets | | $ | 7,673,780 | | $ | 9,503,759 | |
| | | | | | | | |
| LIABILITIES AND SHAREHOLDERS' EQUITY | | | | | | | |
| | | | | | | | |
| Current Liabilities | | | | | | | |
| Accounts payable | | $ | 1,218,199 | | $ | 1,434,169 | |
| Line of credit | | | 258,274 | | | -0- | |
| Accrued salaries and wages | | | 67,317 | | | 69,272 | |
| Other liabilities and accrued expenses | | | 132,778 | | | 126,303 | |
| Total Liabilities | | $ | 1,676,568 | | $ | 1,629,744 | |
| | | | | | | | |
| Commitments and contingencies | | | | | | | |
| | | | | | | | |
| Shareholders' Equity | | | | | | | |
| Common stock, no par value | | | | | | | |
| (stated value, $.66) | | | | | | | |
| Authorized - 5,000,000 shares | | | | | | | |
| Issued and outstanding - | | | | | | | |
| 2,741,168 shares | | | 1,809,171 | | | 1,809,171 | |
| Paid-in capital | | | 3,111,349 | | | 3,111,349 | |
| Retained earnings | | | 1,076,692 | | | 2,953,495 | |
| Total Shareholders' Equity | | | 5,997,212 | | | 7,874,015 | |
| | | $ | 7,673,780 | | $ | 9,503,759 | |
| | | | | | | | |
The accompanying notes are an integral part of these financial statements.
BURKE MILLS, INC.
STATEMENTS OF OPERATIONS
| | | For The Years Ended | |
| | | December 30 | | | December 31 | | | January 1 | |
| | | 2006 | | | 2005 | | | 2005 | |
| | | | | | | | | | | |
Net Sales | | $ | 23,884,260 | | $ | 25,252,600 | | $ | 25,133,683 | |
| Costs and Expenses | | | | | | | | | | |
| Cost of sales | | | 23,777,095 | | | 25,143,775 | | | 24,546,085 | |
| | | | | | | | | | | |
| Gross Profit | | | 107,165 | | | 108,825 | | | 587,598 | |
| | | | | | | | | | | |
Selling, general and administrative expenses | | | 1,992,668 | | | 2,226,739 | | | 2,350,520 | |
Loss (gain) on disposal of property assets | | | (2,974 | ) | | (208,989 | ) | | 154,353 | |
| Operating Loss | | | (1,882,529 | ) | | (1,908,925 | ) | | (1,917,275 | ) |
| | | | | | | | | | | |
| Other Income | | | | | | | | | | |
| Interest income | | | 4,559 | | | 6,100 | | | 2,788 | |
| Other, net | | | 2,178 | | | 2,308 | | | 33,811 | |
| | | | | | | | | | | |
| Total Other Income | | | 6,737 | | | 8,408 | | | 36,599 | |
| | | | | | | | | | | |
| Other Expenses | | | | | | | | | | |
| Interest expense | | | 16,342 | | | 370 | | | 1,263 | |
| Other, net | | | -0- | | | -0- | | | 17,790 | |
| Total Other Expenses | | | 16,342 | | | 370 | | | 19,053 | |
| | | | | | | | | | | |
| Loss Before Benefit of | | | | | | | | | | |
| Income Taxes and Equity | | | | | | | | | | |
| in Loss of Affiliate | | | (1,892,134 | ) | | (1,900,887 | ) | | (1,899,729 | ) |
| | | | | | | | | | | |
| Income Tax Benefit | | | -0- | | | -0- | | | (399,478 | ) |
| | | | | | | | | | | |
Loss before Equity in Net Loss of Affiliate | | | (1,892,134 | ) | | (1,900,887 | ) | | (1,500,251 | ) |
| | | | | | | | | | | |
Equity in Net Earnings (Loss) of Affiliate | | | 15,331 | | | (21,314 | ) | | (206,892 | ) |
| | | | | | | | | | | |
| Net Loss | | $ | (1,876,803 | ) | $ | (1,922,201 | ) | $ | (1,707,143 | ) |
| | | | | | | | | | | |
Basic and Diluted Net Loss Per Share | | $ | (.68 | ) | $ | (.70 | ) | $ | (.62 | ) |
| | | | | | | | | | | |
| Weighted Average Common | | | | | | | | | | |
Shares Outstanding- | | | | | | | | | | |
| | | 2,741,168 | | | 2,741,168 | | | 2,741,168 | |
| | | | | | | | | | | |
The accompanying notes are an integral part of these financial statements.
BURKE MILLS, INC.
STATEMENTS OF CHANGES
IN SHAREHOLDERS' EQUITY
FOR THE THREE YEARS ENDED
DECEMBER 30, 2006
| | | | Shares Issued | | | Common Stock | | | Paid-In Capital | | | Retained Earnings | | | Total Shareholders Equity | |
| | | | | | | | | | | | | | | | |
| | | 2,741,168 | | $ | 1,809,171 | | $ | 3,111,349 | | $ | 6,582,839 | | $ | 11,503,359 | |
| | | | | | | | | | | | | | | | | |
Net Loss for the year ended Jan. 1, 2005 | | | - | | | - | | | - | | | (1,707,143 | ) | | (1,707,143 | ) |
| | | | | | | | | | | | | | | | |
| | | 2,741,168 | | $ | 1,809,171 | | $ | 3,111,349 | | $ | 4,875,696 | | $ | 9,796,216 | |
| | | | | | | | | | | | | | | | | |
Net Loss for the year ended Dec. 31, 2005 | | | - | | | - | | | - | | | (1,922,201 | ) | | (1,922,201 | ) |
| | | | | | | | | | | | | | | | | |
| | | 2,741,168 | | $ | 1,809,171 | | $ | 3,111,349 | | $ | 2,953,495 | | $ | 7,874,015 | |
| | | | | | | | | | | | | | | | | |
Net Loss for the year ended Dec. 30, 2006 | | | - | | | - | | | - | | $ | (1,876,803 | ) | $ | (1,876,803 | ) |
| | | | | | | | | | | | | | | | | |
| | | 2,741,168 | | $ | 1,809,171 | | $ | 3,111,349 | | $ | 1,076,692 | | $ | 5,997,212 | |
| | | | | | | | | | | | | | | | | |
BURKE MILLS, INC.
STATEMENTS OF CASH FLOWS
| | | For The Years Ended | |
| | | Dec. 30 2006 | | | | | |
| Cash flows from operating activities: | | | | | | | | | | |
| Net loss | | $ | (1,876,803 | ) | $ | (1,922,201 | ) | $ | (1,707,143 | ) |
| | | | | | | | | | | |
Adjustments to reconcile net loss to net cash provided by (used in) operating activities: | | | | | | | | | |
| Depreciation | | | 1,588,429 | | | 1,674,433 | | | 1,779,135 | |
| Allowance for doubtful accounts | | | 26,747 | | | 3,253 | | | -0- | |
(Gain) loss on sales of plant & equipment, including loss on disposals | | | (2,974 | ) | | (208,989 | ) | | 154,353 | |
| Provision for impairment of inventory | | | | ) | | | ) | | | |
| Deferred income taxes | | | -0- | | | -0- | | | (394,000 | ) |
| (Gain) Loss in net earnings of affiliate | | | (15,331 | ) | | 21,314 | | | 206,892 | |
| | | | | | | | | | | |
| Changes in operating assets and liabilities: | | | | | | | | | | |
| | | (185,370 | ) | | 492,274 | | | (699,081 | ) |
| Inventories | | | 155,829 | | | 82,966 | | | 185,410 | |
Prepaid expenses & other current assets | | | 19,042 | | | 63,167 | | | (59,947 | ) |
| Accounts payable | | | (215,970 | ) | | (31,461 | ) | | 593,935 | |
| Accrued salaries & wages | | | (1,955 | ) | | (20,575 | ) | | 35,797 | |
| Other liabilities & accrued expenses | | | 6,475 | | | 6,166 | | | 6,725 | |
| | | 1,359,953 | | | 1,956,433 | | | 1,863,303 | |
| | | | | | | | | | | |
Net cash (used in) provided by operating activities | | | (516,850 | ) | | 34,232 | | | 156,160 | |
| | | | | | | | | | | |
| Cash flows from investing activities: | | | | | | | | | | |
Acquisition of property, plant and equipment | | | (136,751 | ) | | (312,127 | ) | | (72,267 | ) |
Proceeds from sales of plant and equipment | | | 10,000 | | | 211,977 | | | 77,316 | |
| Proceeds from Investment in Affiliate | | | 15,331 | | | 174,985 | | | 149,988 | |
| | | | | | | | | | | |
Net cash (used in) provided by investing activities | | | (111,420 | ) | | 74,835 | | | 155,037 | |
| | | | | | | | | | | |
| Cash flows from financing activities: | | | | | | | | | | |
Net advances/(payments) on line of Credit | | | 258,274 | | | -0- | | | (141,514 | ) |
| | | | | | | | | | | |
Net cash provided by (used in) financing activities | | | 258,274 | | | -0- | | | (141,514 | ) |
| | | | | | | | | | | |
Net (decrease) increase in cash and cash equivalents | | | (369,996 | ) | | 109,067 | | | 169,683 | |
Cash & cash equivalents at beginning of year | | | 425,812 | | | 316,745 | | | 147,062 | |
| | | | | | | | | | | |
| CASH AND CASH EQUIVALENTS AT END OF YEAR | | $ | 55,816 | | $ | 425,812 | | $ | 316,745 | |
| | | | | | | | | | | |
The accompanying notes are an integral part of these financial statements.
BURKE MILLS, INC. PART II
NOTES TO FINANCIAL STATEMENTS
NOTE 1 - SIGNIFICANT ACCOUNTING POLICIES
Accounting Period. The Company's fiscal year is the 52 or 53 week period ending the Saturday nearest to December 31. Fiscal years 2004, 2005, and 2006 ended on January 1, December 31, and December 30 respectively. The three fiscal years consisted of 52 weeks.
Revenue Recognition. Revenues from sales are recognized at the time shipments are made to the customer. Sales terms are FOB Burke Mills, Inc. unless otherwise specified. Related shipping and handling costs are included in cost of sales.
Cost of Sales. All manufacturing, quality control, inbound freight, receiving, inspection, purchasing, planning, warehousing of raw, in-process and finished inventory, outbound freight and internal transfer costs are included in the cost of sales.
Selling, general and administrative. Includes cost related to the selling process, accounting, information services, and corporate offices.
Cash and Cash Equivalents. The Company considers cash and cash equivalents to include cash on hand, deposits in banks, and all highly liquid debt instruments with a maturity of three months or less when purchased. At December 30, 2006, the company had cash deposits in excess of federally insured limits in the approximate amount of $200,000.
Accounts Receivable. Substantially all of the Company’s accounts receivable are due from manufacturers in the furniture, contract, automotive upholstery and apparel industries. The Company grants credit to customers and generally does not require collateral. Management continuously performs credit evaluations of its customers, considering numerous inputs including past payment history, financial condition, operating performance, and economic conditions and prospects. While management believes that adequate allowances for doubtful accounts have been provided in the financial statements, it is possible that the Company could experience unexpected credit losses.
Inventories. Inventories are stated at the lower of cost (first-in, first-out) or market. Cost elements included in work-in-process and finished goods inventories are raw materials, direct labor and manufacturing overhead. Market is considered to be net realizable value.
Property, Plant and Equipment. Property, plant and equipment are stated at cost.
Depreciation and amortization of the property accounts are provided over the estimated useful lives of the assets. For financial reporting purposes, depreciation on plant and equipment is provided primarily at straight-line rates. For income tax purposes, depreciation has been provided at straight-line rates for all property, plant and equipment acquired prior to 1981 and the accelerated and modified accelerated cost recovery system for property assets acquired subsequent to December 31, 1980. The estimated useful lives used for computing depreciation for financial reporting purposes are generally:
| | Buildings | | 15 - 45 years | |
| Buildings and land improvements | 5 - 20 years | |
| Plant machinery and equipment | 5 - 17 years | |
| Office equipment | | 5 - 10 years | |
| Automotive equipment | | 3 - 5 years | |
| Computer equipment | | 3 - 5 years | |
Accounting for Possible Impairment of Long-lived Assets. Long-lived assets are reviewed for impairment whenever events or changes in circumstances indicate that the carrying amount may not be recoverable. If the sum of the expected future undiscounted cash flow is less than the carrying amount of the asset, a loss is recognized for the difference between the fair value and carrying value of the asset. Repair and maintenance costs are charged to operating expense as incurred.
BURKE MILLS, INC. PART II
NOTES TO FINANCIAL STATEMENTS
NOTE 1 - SIGNIFICANT ACCOUNTING POLICIES (continued)
Accounting for Possible Impairment of Long-lived Assets (continued)
In 2004, the Company wrote off equipment with net book values of $198,000. With the decrease in sales volume and no anticipated business increase in products that will run on the machinery, the machinery was written off as a non-performing asset. No salvage value was assigned to the machinery, as the Company had no potential buyer.
Earnings Per Share. Earnings per share is based on the net income divided by the weighted average number of common shares outstanding during the respective periods.
Use of Estimates in Preparing Financial Statements. The preparation of financial statements in conformity with generally accepted accounting principles requires management to make estimates and assumptions that affect certain reported amounts and disclosures. Accordingly, actual results could differ from those estimates. Significant estimates are the liability for self-funded health claims, inventory markdowns, allowance for doubtful accounts receivable, and the investment value of affiliates.
Income Taxes. The Company accounts for income taxes in accordance with Statement of Financial Accounting Standards (“SFAS”) No. 109 - “Accounting for Income Taxes”. Under this method, deferred tax assets and liabilities are determined based on differences between financial reporting and tax bases of assets and liabilities and are measured using the enacted tax rates and laws that will be in effect when the differences are expected to reverse. Because the realization of tax benefits related to the Company’s net deferred tax asset is uncertain, a valuation allowance has been provided against the net deferred tax asset.
Financial Instruments. The Company’s financial instruments consist primarily of receivables, accounts payable, short-term debt and accrued expenses. The carrying amounts of receivables, accounts payable, short-term debt and accrued expenses approximate their fair value because of the short-term maturity of such instruments.
Recent Accounting Pronouncements. In February 2006, the FASB issued FAS No. 155, “Accounting for Certain Hybrid Financial Instruments, an amendment of FASB statements No. 133 and 140” (FAS No. 155). This Standard resolves and clarifies the accounting and reporting for certain financial instruments, including hybrid financial instruments with embedded derivatives, interest-only strips, and securitized financial instruments. FAS No. 155 is effective for all financial instruments acquired or issued after the beginning of an entity’s first fiscal year that begins after September 15, 2006. The Company will be required to adopt this Standard on January 1, 2007, and does not expect adoption of this Standard to have a material effect on its financial statements.
In March 2006, the FASB issued FAS No. 156. “Accounting for Servicing of Financial Assets, an amendment of FAS No. 140”. This Standard amends the accounting treatment with respect to separately recognized servicing assets and servicing liabilities, and is effective for fiscal years beginning after September 15, 2006. The Company does not expect adoption of this Standard to have a material effect on its financial statements.
In June 2006, the FASB issued Interpretation No. 48, “Accounting for Uncertainty in Income Taxes, an Interpretation of FAS No. 109” (FIN 48). This interpretation clarifies the accounting for income taxes, by prescribing a minimum recognition threshold a tax position is required to meet before being recognized in the financial statements. FIN 48 also provides guidance on derecognizing, measurement, classification, interest and penalties, accounting in interim periods, disclosure and transition. The Company will adopt FIN 48 as of January 1, 2007, as required.
BURKE MILLS, INC. PART II
NOTES TO FINANCIAL STATEMENTS
NOTE 1 - SIGNIFICANT ACCOUNTING POLICIES (continued)
Recent Accounting Pronouncements (continued)
The Company will be required to apply the provisions of FIN 48 to all tax positions upon initial adoption with any cumulative effect adjustment to be recognized as an adjustment to retained earnings. The Company is currently evaluating the effect FIN 48 will have on its financial statements.
In September 2006, the FASB issued FAS No.157, “Fair Value Measurements” (FAS No. 157). FAS No. 157 clarifies the principle that fair value should be based on the assumptions market participants would use when pricing an asset or liability and establishes a fair value hierarchy that prioritizes the information used to develop those assumptions. Under the Standard, fair value measurements would be separately disclosed by level within the fair value hierarchy. FAS No. 157 is effective for financial statements issued for fiscal years beginning after November 15, 2007, and interim periods within those fiscal years, with early adoption permitted. The Company does not expect the adoption of FAS No. 157 to have a material effect on its financial statements.
In September 2006, the FASB issued FAS No. 158, “Employers’ Accounting for Defined Benefit Pension and Other Postretirement Plans” (FAS No.158). FAS No. 158 requires recognition of all obligations related to defined benefit pensions and other postretirement benefits. The Company does not currently have a defined benefit pension plan or other postretirement plan and does not believe FAS No. 158 will have a material effect on its financial statements.
In September 2006, the Securities and Exchange Commission issued Staff Accounting Bulletin No. 108 “Considering the Effects of Prior Year Misstatements when Quantifying Misstatements in Current Year Financial Statements” (SAB 108). SAB 108 provides interpretive guidance on how the effects of the carryover or reversal of prior year misstatements should be considered in quantifying a current year misstatement. The SEC staff believes that companies should quantify errors using both a balance sheet and an income statement approach and evaluate whether either approach results in quantifying a misstatement that, when all relevant quantitative and qualitative factors are considered, is material. The adoption of SAB 108 did not have a material effect on the Company’s financial statements.
NOTE 2 - SEGMENTS OF BUSINESS ENTERPRISE
The Company is engaged in texturing, twisting, winding, dyeing, processing and selling of cotton, polyester, rayon, nylon, and other specialty yarns and in the dyeing and processing of these yarns for others on a commission basis.
BURKE MILLS, INC. PART II
NOTES TO FINANCIAL STATEMENTS
NOTE 2 - SEGMENTS OF BUSINESS ENTERPRISE (continued)
With respect to its operations, the Company's products and its services for others on a commission basis are sold and/or performed for customers primarily located in the territorial limits of the United States.
The Company had foreign sales as a percentage of total sales as follows:
| | Country | | 2006 | | 2005 | | 2004 | | |
| | Mexico | | | | % | | .46 | % | | .27 | % | |
| | Canada | | | | % | | .06 | % | | .06 | % | |
| | Honduras | | | | % | | .62 | % | | 1.62 | % | |
| | Barbados | | | | % | | .05 | % | | .0 | % | |
| | Hong Kong | | | | % | | .19 | % | | .13 | % | |
| | Turkey | | | | % | | .0 | % | | .01 | % | |
| | Sri Lanka | | | | % | | .0 | % | | .0 | % | |
| Total | | | | % | | 1.38 | % | | 2.09 | % | |
| | | | | | | | | | | | | |
In connection with sales to major customers, there was no customer that exceeded 10% of the Company's sales during the year ended December 30, 2006. Two customers did exceed 10% of the Company's sales during each of the two years ended December 31, 2005, and January 1, 2005. For the purpose of this determination, sales to groups of companies under common control have been combined.
| Customer: | | | A | | | B | |
| | | | | | | | |
| December 30, 2006 | | | -- | | | -- | |
| December 31, 2005 | | | 15.9% | | | 11.8% | |
| January 1, 2005 | | | 20.7% | | | 11.8% | |
| | | | | | | | |
The Company had equipment located in Mexico that was leased to its joint venture Fytek in 2003 and 2004. The Company sold the equipment in 2005.
BURKE MILLS, INC. PART II
NOTES TO FINANCIAL STATEMENTS
NOTE 3 - ACCOUNTS RECEIVABLE
Accounts receivable comprise the following:
| | | | December 30 | | December 31 | | |
| | | | 2006 | | 2005 | | |
| | | | | | | | |
| | Accounts receivable | | $ | 2,757,000 | | $ | 2,572,000 | | |
| | Allowance for doubtful accounts | | | (30,000 | ) | | (3,000 | ) | |
| Total | | $ | 2,727,000 | | $ | 2,569,000 | | |
NOTE 4 - INVENTORIES
Inventories are summarized as follows:
| | | | December 30 | | December 31 | | |
| | | | 2006 | | 2005 | | |
| | Finished & in process | | $ | 703,000 | | $ | 853,000 | | |
| | Raw materials | | | 541,000 | | | 614,000 | | |
| | Dyes & chemicals | | | 208,000 | | | 165,000 | | |
| | Other | | | 100,000 | | | 76,000 | | |
| | Mark-down allowance | | | (9,000 | ) | | (24,000 | ) | |
| | | | | | | | | | |
| | Total | | $ | 1,543,000 | | $ | 1,684,000 | | |
| | | | | | | | | | |
NOTE 5 - PROPERTY, PLANT AND EQUIPMENT
Major classifications of property, plant and equipment are as follows:
| | December 30, 2006 | | December 31, 2005 | |
| | | | | | | | | | | | | | |
| | | | Cost | | | Accumulated Depreciation | | | Cost | | | | |
| | | | | | | | | | | | | | |
| Land | | $ | 156,000 | | $ | -0- | | $ | 156,000 | | $ | -0- | |
| Land improvements | | | 183,000 | | | 132,000 | | | 183,000 | | | 126,000 | |
| Building & improvements | | | 6,390,000 | | | 5,365,000 | | | 6,390,000 | | | 5,247,000 | |
Plant machinery & equipment | | | 20,234,000 | | | 18,194,000 | | | 20,267,000 | | | 16,900,000 | |
| Office equipment | | | 968,000 | | | 964,000 | | | 968,000 | | | 949,000 | |
| Automotive equipment | | | 111,000 | | | 86,000 | | | 122,000 | | | 105,000 | |
| Total | | $ | 28,042,000 | | $ | 24,741,000 | | $ | 28,086,000 | | $ | 23,327,000 | |
| | | | | | | | | | | | | | |
NOTE 6 - LINE OF CREDIT
The Company has entered into an Accounts Receivable Inventory Financing Agreement (the “Financing Agreement”) with The CIT Group/ Commercial Services, Inc. (“CIT”). In addition, the Company signed a Letter of Credit Agreement (the “LOC Agreement”) with CIT. Under the terms of the Financing Agreement, CIT may, at its sole discretion, advance up to $5,000,000 to the Company as follows: (a) revolving credit advances in amounts up to 85 percent of the net amount of eligible accounts receivable; (b) revolving credit advances in amounts up to 60 percent of the value of eligible inventory. Advances against eligible inventory will not exceed the lesser of $2,000,000 and the advances made by CIT against accounts receivable.
BURKE MILLS, INC. PART II
NOTES TO FINANCIAL STATEMENTS
NOTE 6 - LINE OF CREDIT (continued)
With regard to the LOC Agreement, the Financing Agreement provides that CIT will assist the Company in opening letters of credit or guarantee the payment and performance of such letters of credit up to an aggregate face amount not exceeding $500,000 outstanding letters of credit.
The Company has granted to CIT a security interest in its accounts receivable; monies, securities and other property held in transit to CIT; present and future deposits held by CIT; all rights of the Company in future accounts receivable; the Company’s inventory; the Company’s equipment (defined to be all machinery, equipment, rolling stock, furnishings and fixtures and all additions, substitutions or employments thereof); all proceeds and products of any defined collateral; and other customary definitions of collateral related to accounts receivable, inventory and equipment.
The Company is obligated to pay interest to CIT on the average of net balances owed monthly at one percent above the prime rate announced by JP Morgan Chase Bank in New York, NY. Interest is calculated on a 360 day year. In addition, the Company paid CIT an initial facility fee of $25,000 and will pay CIT $1,000 per month as a “collateral management fee.”
The Company had $258,000 of debt under its line of credit, and approximately $2,745,000 net available at December 30, 2006.
NOTE 7 - OTHER LIABILITIES AND ACCRUED EXPENSES
Other liabilities and accrued expenses consist of the following:
| | | | December 30 2006 | | | December 31 2005 | |
| Employee insurance | | $ | 50,000 | | $ | 55,000 | |
| Payroll taxes payable | | | 38,000 | | | 47,000 | |
| Other | | | 45,000 | | | 24,000 | |
| Total | | $ | 133,000 | | $ | 126,000 | |
| | | | | | | | |
NOTE 8 - INCOME TAXES
The Company uses the liability method as required by FASB Statement 109 "Accounting for Income Taxes". Under this method, deferred tax assets and liabilities are determined based on the differences between financial reporting and tax bases of assets and liabilities and are measured using the enacted tax rates and laws.
BURKE MILLS, INC. PART II
NOTES TO FINANCIAL STATEMENTS
NOTE 8 - INCOME TAXES (continued)
The items that comprise deferred tax assets and liabilities are as follows:
| | | | Dec. 30 2006 | | | Dec. 31 2005 | |
| Deferred tax assets: | | | | | | | |
| Alternative minimum taxes paid | | $ | 349,000 | | $ | 349,000 | |
| Net operating loss carryover | | | 1,701,000 | | | 1,284,000 | |
| Charitable contributions carryover | | | 1,000 | | | 13,000 | |
| State tax credits | | | 41,000 | | | | |
| Bad debts | | | 12,000 | | | 1,000 | |
| Inventory | | | 5,000 | | | 14,000 | |
| Total gross deferred tax assets | | $ | 2,109,000 | | $ | 1,702,000 | |
| Valuation Allowance | | | (1,751,000 | ) | | (1,020,000 | ) |
| Net deferred tax assets | | $ | 358,000 | | $ | 682,000 | |
| Deferred tax liabilities: | | | | | | | |
| Accelerated depreciation for tax purposes | | | 358,000 | | | 682,000 | |
| Net deferred tax liability | | $ | -0- | | $ | -0- | |
| | | | | | | | |
At December 30, 2006, the Company had a net operating loss carry forward of approximately $4,196,000, which expires in various amounts starting 2022-2025.
The provision for income taxes on historical income differs from the amounts computed by applying the applicable Federal statutory rates, due to the following:
| | | For The Years Ended | |
| | | | December 30 2006 | | | December 31 2005 | | | January 1 2005 | |
| Loss before income tax benefit | | $ | (1,877,000 | ) | $ | (1,922,000 | ) | $ | (2,106,000 | ) |
| Federal income taxes | | | 34% | | | 34 | % | | 34 | % |
| | | | | | | | | | | |
Computed taxes (benefit) at maximum statutory tax | | | (638,000 | ) | | (654,000 | ) | | (716,000 | ) |
State income taxes (benefit), net of federal income tax benefits | | | (85,000 | ) | | (88,000 | ) | | (96,000 | ) |
Total adjustment for foreign affiliate earnings | | | -0- | | | 8,000 | | | 115,000 | |
Adjustment for deferred income taxes | | | (11,000 | ) | | 12,000 | | | (4,000 | ) |
| Prior year tax examination & other | | | 3,000 | | | 3,000 | | | | |
| State Tax Refund | | | -0- | | | -0- | | | (5,000 | ) |
| Sub-Total | | $ | (731,000 | ) | $ | (719,000 | ) | $ | (700,000 | ) |
| Valuation Allowance | | | 731,000 | | | 719,000 | | | 301,000 | |
| | | | | | | | | | | |
Provision (benefit) for Income Taxes | | $ | -0- | | $ | -0- | | $ | (399,000 | ) |
BURKE MILLS, INC. PART II
NOTES TO FINANCIAL STATEMENTS
The benefit for taxes on income consists of the following:
| | For The Years Ended | |
| | | | December 30 2006 | | | December 31 2005 | | | January 1 2005 | |
| Deferred: | | | | | | | | | | |
| Federal | | $ | (649,000 | ) | $ | (634,000 | ) | $ | (605,000 | ) |
| State and local | | | (82,000 | ) | | (85,000 | ) | | (95,000 | ) |
| Valuation Allowance | | | 731,000 | | | 719,000 | | | 301,000 | |
| Total | | $ | -0- | | $ | -0- | | $ | (399,000 | ) |
| | | | | | | | | | | |
NOTE 9 - INVESTMENT IN AFFILIATE AND RELATED PARTY TRANSACTIONS
The Company and its joint venture partner, Akra, voted on March 26, 2004 to close their joint venture, Fytek. The joint venture operated on a scaled down basis through mid-August 2004. In 2005 and 2006, the Company and its joint venture partner continued liquidation of Fytek. The Company received approximately $325,000 cash distribution through year end 2005. In the fourth quarter of 2006, the Company sold its shares in Fytek to Akra for $15,000. Akra will maintain the financial records of Fytek for five years, as required by Mexican tax laws.
Financial information for Fytek is as follows:
Statements of Operations
(In thousands of U.S. Dollars)
| | September 30 | | December 31 | |
| | | | 2006 | | | 2005 | | | 2004 | |
| Net Sales | | $ | -0- | | $ | -0- | | $ | 1,436 | |
| Gross Profit/(Loss) | | | -0- | | | -0- | | | (173 | ) |
| (Loss) from operating income | | | -0- | | | -0- | | | (378 | ) |
| Income/(Loss) from discontinued operations | | | 17 | | | (440 | ) | | | |
| Income/(Loss) before income taxes | | | 17 | | | (440 | ) | | (563 | ) |
| Income taxes | | | 3 | | | 24 | | | -0- | |
| | | | | | | | | | | |
| Net loss | | $ | (14 | ) | $ | (464 | ) | $ | (563 | ) |
| | | | | | | | | | | |
Balance Sheets
(In thousands of U.S. Dollars)
| | | As of September 30 | | As of December 31 | |
| | | | 2006 | | | 2005 | | | 2004 | |
| Current assets | | $ | 74 | | $ | 168 | | $ | 783 | |
| | | | | | | | | | | |
| Non-current | | | -0- | | | -0- | | | 185 | |
| | | | | | | | | | | |
| Total assets | | $ | 74 | | $ | 168 | | $ | 968 | |
| | | | | | | | | | | |
| | | | | | | | | | | |
| Current liabilities | | $ | 2 | | $ | 152 | | $ | 160 | |
| Total liabilities | | | 2 | | | 152 | | | 160 | |
| | | | | | | | | | | |
| Stockholders’ equity | | | 72 | | | 16 | | | 808 | |
| | | | | | | | | | | |
| Total liabilities and stockholders’ equity | | $ | 74 | | $ | 168 | | $ | 968 | |
| | | | | | | | | | | |
NOTE 9 - INVESTMENT IN AFFILIATE AND RELATED PARTY TRANSACTIONS (continued)
The Company paid its Chairman and Chief Executive Officer, who is also the Company’s majority shareholder, a base salary of $210,000 for the years ended December 30, 2006 and December 31, 2005. The Company also reimbursed this officer for a portion of his office and travel expense. These payments totaled approximately $83,000, and $116,000, for the years ended December 30, 2006 and December 31, 2005 respectively.
NOTE 10 - STATEMENTS OF CASH FLOWS
Cash paid for interest was $16,000 in 2006, $400 in 2005, and $1,300 in 2004. The Company had cash payments for state franchise taxes of $5,000 in 2006, $5,000 in 2005, and $6,000 in 2004. The Company received a state tax refund of $6,000 in 2004.
NOTE 11 - RENTAL EXPENSES AND LEASE COMMITMENTS
The Company leases forklift trucks and office equipment with varying interest rates, monthly payments and maturity dates. Rental expenses under all lease commitments for the three fiscal years ended December 30, 2006, aggregated $64,000, $62,000, and $57,000 respectively.
Minimum commitments under terms of all non-cancelable leases, which consist only of leased equipment, are as follows as of December 30, 2006:
| 2007 | | $ | 46,000 |
| 2008 | | $ | 13,000 |
| 2009 | | $ | 12,000 |
BURKE MILLS, INC. PART II
NOTES TO FINANCIAL STATEMENTS
NOTE 12 - QUARTERLY FINANCIAL DATA (UNAUDITED)
| | | | (in thousands of dollars except for per share amounts) | |
| | | | QUARTER | |
| 2006 | | | First | | | Second | | | Third | | | Fourth | |
| Net sales | | $ | 6,368 | | $ | 6,187 | | $ | 5,913 | | $ | 5,415 | |
| Cost of sales | | | 6,320 | | | 6,041 | | | 5,980 | | | 5,435 | |
| Gross profit/(loss) | | | 48 | | | 146 | | | (67 | ) | | (20 | ) |
| Net loss | | | (475 | ) | | (387 | ) | | (538 | ) | | (477 | ) |
| Net loss per common share | | $ | (.17 | ) | $ | (.14 | ) | $ | (.20 | ) | $ | (.17 | ) |
| | | | | | | | | | | | | | |
2005 | | | First(1) | | | Second | | | Third | | | Fourth(2) | |
| Net sales | | $ | 7,138 | | $ | 6,579 | | $ | 5,769 | | $ | 5,766 | |
| Cost of sales | | | 6,887 | | | 6,698 | | | 5,810 | | | 5,748 | |
| Gross profit/(loss) | | | 251 | | | (119 | ) | | (41 | ) | | 18 | |
| Net loss | | | (307 | ) | | (659 | ) | | (601 | ) | | (355 | ) |
| Net loss per common share | | | | | $ | (0.24 | ) | $ | (0.22 | ) | $ | (0.13 | ) |
| | | | | | | | | | | | | | |
| (1) | | In the first quarter of 2005, the Company recorded a gain of $101,000 on the sale of a portion of its machinery located at its joint venture. |
| | | |
| (2) | | In the fourth quarter of 2005, the Company recorded a gain of $105,000 on the sale of the remaining machinery located at its joint venture. |
NOTE 13 - EMPLOYEE BENEFIT PLAN
The Company is a participating employer in the Burke Mills, Inc., Savings and Retirement Plan and Trust that has been qualified under Section 401(k) of the Internal Revenue Code. This plan allows eligible employees to contribute an amount of not less than 1% nor greater than 25% of the employee's salary but not to exceed dollar limits set by law. The employer may make a discretionary contribution for each employee out of current net profits or accumulated net profits in an amount the employer may from time to time deem advisable. No provision was made for a discretionary contribution in 2006, 2005, or 2004.
NOTE 14 - CONCENTRATIONS OF CREDIT RISK
Financial instruments that potentially subject the Company to concentration of credit risk consist principally of occasional temporary cash investments and accounts receivable. At year-end 2006, two customers represented approximately 25% of total accounts receivable compared to 27% in 2005.
NOTE 15 - OTHER COMMITMENTS
During 1996, in connection with a bank loan to the Company secured by real estate, the Company had a Phase I Environmental Site Assessment conducted on its property. The assessment indicated the presence of a contaminant in the groundwater under the Company's property. The contaminant was a solvent used by the Company in the past but no longer used. The contamination was reported to the North Carolina Department of Environment and Natural Resources (DENR). DENR required a
BURKE MILLS, INC. PART II
Comprehensive Site Assessment that has been completed. The Company's outside engineering firm conducted testing and prepared a Corrective Action Plan that was submitted to DENR. The Company has identified remediation issues and continues to move toward a solution of natural attenuation. The cost of monitoring is approximately $11,000 per year.
SELF-INSURANCE - The Company provides health benefits to its employees under a self-insured health plan. Claims are paid by the Company up to an individual and an aggregated limit of $55,000 and approximately $959,000, respectively. Claims in excess of these limits are covered by a third-party insurance contract. Expense is recorded on a monthly basis for actual claims experience.
ITEM 9. CHANGES IN AND DISAGREEMENTS WITH ACCOUNTANTS ON ACCOUNTING AND FINANCIAL DISCLOSURE
For the fiscal year ending December 30, 2006, there are no changes or disagreements with accountants.
ITEM 9A. CONTROLS AND PROCEDURES
As of the fiscal year ended December 30, 2006, the Company, with the participation of the Company’s chief executive officer and chief financial officer, carried out an evaluation of the effectiveness of the Company’s disclosure controls and procedures (as defined in SEC Rule 13a-15(e)). Based upon that evaluation, the chief executive officer and the chief financial officer of the Company have concluded that such disclosure controls and procedures were effective in timely alerting them to material information relating to the Company required to be included in the reports filed with the SEC by the Company.
During the quarter ended December 30, 2006, there have been no changes in the Company’s internal controls or in other factors that could significantly affect such internal controls. Subsequent to the date of the evaluation, there have been no changes or corrective actions with regard to the material weakness.
ITEM 9B. OTHER INFORMATION.
No disclosure required.
BURKE MILLS, INC. PART III
ITEM 10. DIRECTORS, EXECTUIVE OFFICERS AND CORPORATE GOVERNANCE
The information required for Item 10 of Form 10-K is incorporated by reference from the information contained in the Company's Definitive Proxy Statement to be filed pursuant to Regulation 14A for the annual meeting of shareholders scheduled for May 15, 2007, which is expected to be filed not later than 120 days after the end of the fiscal year covered by this report.
BURKE MILLS, INC. PART III
ITEM 11. EXECUTIVE COMPENSATION
The information required for Item 11 of Form 10-K is incorporated by reference from the information contained in the Company's Definitive Proxy Statement to be filed pursuant to Regulation 14A for the annual meeting of shareholders scheduled for May 15, 2007, which is expected to be filed not later than 120 days after the end of the fiscal year covered by this report.
ITEM 12. SECURITY OWNERSHIP OF CERTAIN BENEFICIAL OWNERS AND MANAGEMENT AND RELATED STOCKHOLDER MATTERS
The information required for Item 12 of Form 10-K is incorporated by reference from the information contained in the Company's Definitive Proxy Statement to be filed pursuant to Regulation 14A for the annual meeting of shareholders scheduled for May 15, 2007, which is expected to be filed not later than 120 days after the end of the fiscal year covered by this report.
ITEM 13. CERTAIN RELATIONSHIPS AND RELATED TRANSACTIONS
The information required for Item 13 of Form 10-K is incorporated by reference from the information contained in the Company's Definitive Proxy Statement to be filed pursuant to Regulation 14A for the annual meeting of shareholders scheduled for May 15, 2007, which is expected to be filed not later than 120 days after the end of the fiscal year covered by this report.
ITEM 14. PRINCIPAL ACCOUNTANT FEES AND SERVICES
The information required for Item 14 of Form 10-K is incorporated by reference from the information contained in the Company's Definitive Proxy Statement to be filed pursuant to Regulation 14A for the annual meeting of shareholders scheduled for May 15, 2007, which is expected to be filed not later than 120 days after the end of the fiscal year covered by this report.
BURKE MILLS, INC. PART IV
ITEM 15. EXHIBITS AND FINANCIAL STATEMENT SCHEDULES
| (a) | | The following documents are filed as a part of this report. |
| | | |
| | | 1. | Report of Independent Registered Public Accounting Firm - Part II, Item 8. |
| | | | |
| | | 2. | The following financial statements of Burke Mills, Inc. and the related auditors' report required to be included in Part II, Item 8, are listed below: |
BURKE MILLS, INC. PART IV
ITEM 15. EXHIBITS AND FINANCIAL STATEMENT SCHEDULES (continued)
| | Balance sheets | |
| | | December 30, 2006 |
| | | December 31, 2005 |
| | | | |
| | Statements of operations | |
| | | Year ended December 30, 2006 |
| | | Year ended January 1, 2005 |
| | | Year ended December 31, 2005 |
| | | | |
| | Statements of changes in shareholders' equity |
| | | Year ended December 30, 2006 |
| | | Year ended December 31, 2005 |
| | | Year ended January 1, 2005 |
| | | | |
| | Statements of cash flows | |
| | | Year ended December 30, 2006 |
| | | Year ended December 31, 2005 |
| | | Year ended January 1, 2005 |
| | | | |
| | Notes to financial statements | |
| 3. | | The exhibits required by Item 601 of Regulation S-K and paragraph (c) of Item 14 are: (a) the articles of incorporation and by-laws of the Company which are incorporated herein by reference from the Amendment on Form 8K to the annual report on Form 10-K of the Company for the fiscal year ended January 2, 1982 previously filed with the Commission; (b) Exhibit 31 - Rule 13a-14(a) certifications; and (c) Exhibit 32 - Section 1350 certifications. |
BURKE MILLS, INC.
SIGNATURES
Pursuant to the requirements of Section 13 or 15(d) of the Securities Exchange Act of 1934, the registrant has duly caused this report to be signed on its behalf by the undersigned, thereunto duly authorized.
| | BURKE MILLS, INC. |
| Date: April 12, 2007 | | |
| By: | /s/ Humayun N. Shaikh |
| | | Humayun N. Shaikh |
| | Chairman of the Board |
| | (Principal Executive Officer) |
| | |
| | |
| By: | /s/ Thomas I. Nail |
| | Thomas I. Nail |
| | President and COO |
| | (Principal Financial Officer) |
| | | |
BURKE MILLS, INC.
SIGNATURES
Pursuant to the requirements of the Securities Exchange Act of 1934, this report has been signed by the following persons on behalf of the registrant and in the capacities and on the dates indicated.
| Date: April 12, 2007 | | By: /s/Humayun N. Shaikh |
| | | Humayun N. Shaikh, Director |
| | |
| | | |
| | | |
| | | |
| Date: April 12, 2007 | | |
| | | Thomas I. Nail, Director |
| | |
| | | |
| | | |
| | | |
| Date: April 12, 2007 | | |
| | | Richard F. Byers, Director |
| | |
| | | |
| | | |
| | | |
| Date: April 12, 2007 | | |
| | | Robert P. Huntley, Director |
| | |
| | | |
| | | |
| | | |
| Date: April 12, 2007 | | |
| | | William T. Dunn, Director |
| | |
| | | |
| | | |
| | | |
| Date: April 12, 2007 | | |
| | | Robert T. King, Director |
| | |
| | | |
| | | |
| | | |
| Date: April 12, 2007 | | |
| | | Aehsun Shaikh, Director |
| | |
EXHIBIT TABLE
| (3)(i) | | Articles of Incorporation - Incorporated by reference |
| | | |
| (ii) | | Bylaws - Incorporated by reference |
| | | |
| (14) | | Code of Ethics |
| | | |
| (31)(1) | | Rule 13a - 14(a)/15d - 14(a) Certifications |
| | | |
| (32) | | Section 1350 Certifications |
Page 43