LaPorte Bancorp, Inc. LPSB Investor Presentation February 2013 Michele M. Thompson – President & Chief Financial Officer Exhibit 99.1 |
Forward-Looking Statements 2 The presentation contains “forward-looking statements” within the meaning of Section 27A of the Securities Act of 1933, as amended and Section 21E of the Securities Exchange Act of 1934, as amended. We intend such forward-looking statements to be covered by the safe harbor provisions for forward-looking statements contained in the Private Securities Litigation Reform Act of 1995, and are including this statement for purposes of said safe harbor provisions. You can identify these forward- looking statements through our use of the words such as “may”, “will”, “anticipate”, “assume”, “should”, “indicate”, “would”, “believe”, “contemplate”, “expect”, “estimate”, “continue”, “plan”, “project”, “could”, “intend”, “target” and other similar words and expressions of the future. These forward-looking statements include, but are not limited to: Statements of our goals, intentions and expectations; Statements regarding our business plans, prospects, growth and operating strategies; Statements regarding the asset quality of our loan and investment portfolios; and Estimates of our risks and future costs and benefits. These forward-looking statements are based on current beliefs and expectations of our management and are inherently subject to significant business, economic and competitive uncertainties and contingencies, many of which are beyond our control. In addition, these forward-looking statements are subject to assumptions with respect to future business strategies and decisions that are subject to change. |
Forward-Looking Statements (continued) The following factors, among others, could cause actual results to differ materially from the anticipated results or other expectations express in the forward-looking statements: 3 general economic conditions, either nationally or in our market areas, that are worse than expected; changes in prevailing real estate values and loan demand, both nationally and within our current and future market area; inflation and changes in the interest rate environment that reduce our margins or reduce the fair value of financial instruments; increased competitive pressures among financial services companies; changes in consumer spending, borrowing and savings habits; the amount of assessments and premiums we are required to pay for FDIC deposit insurance; legislative or regulatory changes that affect our business, including the Dodd-Frank Act and its impact on our compliance costs or capital requirements; changes in accounting policies and practices, as may be adopted by the bank regulatory agencies, the financial Accounting Standards Board, the Securities and Exchange Commission and Public Company Accounting Oversight Board; our ability to successfully manage our commercial lending; our ability to enter new markets successfully and capitalize on growth opportunities; our ability to successfully integrate acquired entities; changes in our organization, compensation and benefit plans; changes in the financial condition, results of operations or future prospects of issuers or securities that we own; the financial health of certain entities, including government sponsored enterprises, the securities of which are owned or acquired by us; adverse changes in the securities market; the costs, effects and outcomes of existing or future litigation; the economic impact of past and any future terrorist attacks, acts of war or threats thereof and the response of the United States to any such threat and attacks; the success of our mortgage warehouse lending program, including the impact of the Dodd-Frank Act on the mortgage companies; and our ability to manage the risks associated with the foregoing factors as well as the anticipated factors. This list of important factors in not all inclusive. For a discussion of these and other risks that may cause actual results to differ from expectations, please refer to the Company’s Prospectus dated August 10, 2012 on file with the SEC. Readers are cautioned not to place undue reliance on the forward-looking statements contained herein, which speak only as of the date of the Presentation. Except as required by applicable law or regulation, we do not undertake, and specifically disclaim any obligation, to update any forward-looking statements, whether written or oral, that may be made from time to time by or on behalf of the Company or The LaPorte Savings Bank. |

Deposit Market Share - La Porte County, IN 2012 Rank Institution (ST) Type 2012 Number of Branches 2012 Deposits in Market ($000) 2012 Market Share (%) 1 Horizon Bancorp (IN) Bank 6 544,999 33.28 2 LaPorte Bancorp Inc (IN) Thrift 7 304,117 18.57 3 Wells Fargo & Co. (CA) Bank 1 298,037 18.20 4 1st Source Corp. (IN) Bank 5 188,880 11.53 5 PNC Financial Services Group (PA) Bank 4 141,138 8.62 Total For Institutions In Market 32 1,578,116 Franchise Overview Established in 1871 Eight full-service locations in LaPorte and Porter Counties Acquired Indiana based City Savings Financial Corp in an MHC conversion / acquisition in 2007 Completed second step conversion in October of 2012 4 (1) FDIC June 30, 2012 deposit information 1 |
Experienced Management Team Lee A. Brady – Chief Executive Officer & Director • Serves as Chairman & CEO of The LaPorte Savings Bank • Started career at The LaPorte Savings Bank in 1974 • Graduate of Indiana University and the Graduate School of Banking at the University of Wisconsin-Madison Michele M. Thompson – President, Chief Financial Officer & Director • Joined The LaPorte Savings Bank in 2003 • More than 30 years of banking experience • Graduate of Ball State University and holds an MBA from Indiana University Daniel P. Carroll – Executive Vice President and Chief Credit Officer • Joined The LaPorte Savings Bank in 2011 • More than 15 years of commercial lending and management experience • Graduate of Notre Dame and the Graduate School of Commercial Lending at the University of Oklahoma Patrick W. Collins – Senior Vice President , Mortgage Warehouse Lending • Joined the LaPorte Savings Bank in 2009 • More than 15 years of mortgage warehouse lending experience • Graduate of DeVry University in Columbus, OH Kevin N. Beres – Senior Vice President, Lending • Joined The LaPorte Savings Bank in 2007 • More than 17 years of banking experience • Graduate of Indiana University and the Graduate School of Banking at the University of Wisconsin-Madison 5 L. Charles Lukmann, III Partner, Harris, Welsh & Lukmann Dale A. Parkison, C.P.A. President, Parkison & Hinton, Inc. P.C. Robert P. Rose Presdient Harbor Trust & Investment Management Company Michele M. Thompson President & CFO, The LaPorte Savings Bank Board of Directors Paul G. Fenker Chairman of the Board of LaPorte Bancorp Owner, Fenker's Fine Furniture Jerry L. Mayes Vice Chairman of the Board Retired, Mayes Management Lee A. Brady Chairman & CEO, The LaPorte Savings Bank Ralph F. Howes Senior Partner, Howes & Howes Mark A. Krentz CEO, Thanhardt Burger |
Our Story Strong Balance Sheet – Capital – Clean Asset Quality Consistent Earnings – ROAA increased from 0.65% in 2009 to 0.91% in 2012 Steady Loan Growth: – Commercial – Mortgage Warehouse – Retail Strong Core Deposit Base 6 |
Business Strategy Quality – Maintaining loan portfolio quality – Staff – Product lines Growth – Increasing commercial business lending – Focus on mortgage warehouse lending – Continued growth in core retail banking franchise – Continued growth in earnings and profitability Service – Customers – Communities we serve 7 |
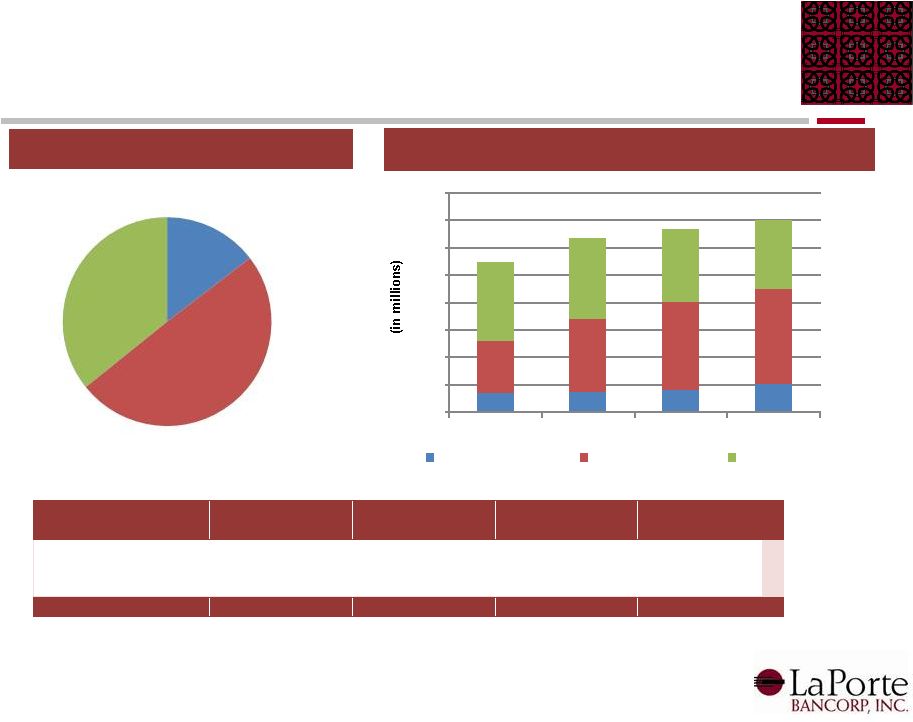
Loan Composition 8 Historical Loan Trends ($MM) Loan Composition Loan Type ($000) 12/31/2009 12/31/2010 12/31/2011 12/31/2012 Commercial 82,249 31.8% 91,393 33.0% 98,149 32.8% 94,030 29.6% Commercial & Industrial 18,122 7.0% 17,977 6.5% 18,017 6.0% 20,179 6.3% Mortgage 70,126 27.1% 57,144 20.6% 45,576 15.2% 36,996 11.6% Mortgage Warehouse 43,765 16.9% 69,600 25.1% 103,864 34.7% 137,467 43.3% Construction & Land 17,173 6.6% 17,627 6.4% 13,440 4.5% 11,829 3.7% Home Equity 15,704 6.1% 14,187 5.1% 12,966 4.3% 12,267 3.9% Consumer and Other 11,790 4.6% 8,985 3.2% 6,942 2.3% 5,018 1.6% Total Loans $258,929 100.0% $276,913 100.0% $298,954 100.0% $317,786 100.0% % of Total % of Total % of Total % of Total Note: Total loans excludes deferred loan fees and loans held for sale $259 $277 $299 $318 $0 $50 $100 $150 $200 $250 $300 $350 12/31/09 12/31/10 12/31/11 12/31/12 Commercial Commercial & Industrial Mortgage Mortgage Warehouse Construction & Land Home Equity Consumer and Other Series8 29.6% 6.3% 11.6% 43.3% 3.7% 3.9% 1.6% |
Deposit Composition 9 Historical Deposit Trends ($MM) Deposit Composition Deposit Type ($000) 12/31/2009 12/31/2010 12/31/2011 12/31/2012 Non-interest Bearing 34,066 12.5% 34,999 11.0% 38,977 11.7% 50,892 14.6% Savings, Now, MMA 94,931 34.7% 133,834 42.2% 160,308 48.1% 173,247 49.6% CDs and IRAs 144,411 52.8% 148,505 46.8% 134,275 40.3% 124,831 35.8% Total Deposits $273,408 100.0% $317,338 100.0% $333,560 100.0% $348,970 100.0% % of Total % of Total % of Total % of Total $273 $317 $334 $349 $0 $50 $100 $150 $200 $250 $300 $350 $400 12/31/09 12/31/10 12/31/11 12/31/12 Non-interest Bearing Savings, Now, MMA CDs and IRAs 14.6% 49.6% 35.8% |
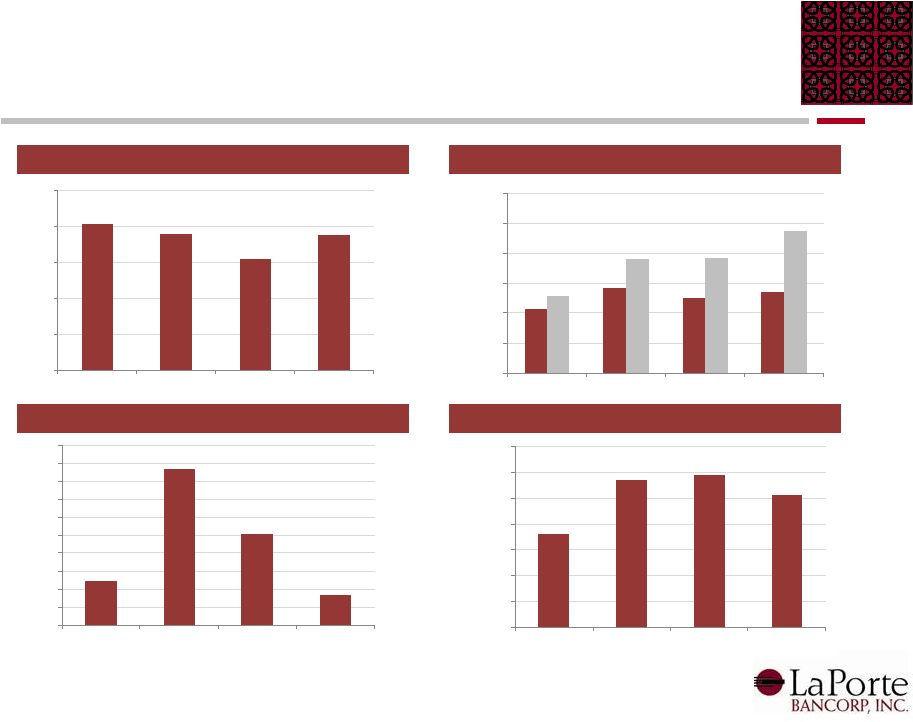
2.04 1.89 1.55 1.88 0.00 0.50 1.00 1.50 2.00 2.50 2009Y 2010Y 2011Y 2012Y 1.07 1.42 1.26 1.35 1.28 1.90 1.92 2.38 0.00 0.50 1.00 1.50 2.00 2.50 3.00 2009Y 2010Y 2011Y 2012Y 0.25 0.87 0.50 0.17 0.00 0.10 0.20 0.30 0.40 0.50 0.60 0.70 0.80 0.90 1.00 2009Y 2010Y 2011Y 2012Y 35.98 57.21 59.27 51.54 0.00 10.00 20.00 30.00 40.00 50.00 60.00 70.00 2009Y 2010Y 2011Y 2012Y Asset Quality Profile NPAs / Assets (%) 1 LLR / Loans (%) LLR / NPLs (%) Net Charge-Offs / Loans (%) (1) NPAs/Assets includes TDRs 10 Red bar = LLRs/Loans Gray bar = LLRs/Loans excluding mortgage warehouse loans and the reserves held against those loans |
0.65 0.61 0.72 0.91 0.00 0.10 0.20 0.30 0.40 0.50 0.60 0.70 0.80 0.90 1.00 2009Y 2010Y 2011Y 2012Y 5.25 5.12 6.15 6.91 0.00 1.00 2.00 3.00 4.00 5.00 6.00 7.00 8.00 2009Y 2010Y 2011Y 2012Y 3.21 3.59 3.31 3.57 0.00 0.50 1.00 1.50 2.00 2.50 3.00 3.50 4.00 2009Y 2010Y 2011Y 2012Y 74.66 62.06 68.36 63.34 0.00 10.00 20.00 30.00 40.00 50.00 60.00 70.00 80.00 2009Y 2010Y 2011Y 2012Y Profitability ROAA (%) ROAE (%) Efficiency Ratio (%) Net Interest Margin (%) 11 |
Consistent Growth in Earnings Per Share Our management team has been consistently focused on generating profits for our shareholders 12 Earnings Per Share ($) 1 (1) EPS calculation is exchange ratio adjusted 0.42 0.44 0.55 0.72 - 0.10 0.20 0.30 0.40 0.50 0.60 0.70 0.80 0.90 1.00 2009Y 2010Y 2011Y 2012Y |
Strong Capital Position LaPorte maintains a low risk profile with strong capital levels 13 Strong Capital Levels 10.2 9.4 10.0 15.6 - 4.0 6.0 8.0 10.0 12.0 14.0 16.0 18.0 2009Y 2010Y 2011Y 2012Y 2.0 |
Use of Proceeds / Capital Management Deliberate growth – Organic and select acquisitions Cash dividends – LPSB currently pays a $0.04 per share cash dividend Share repurchases, once permitted 1 14 (1) Under current FRB regulations, we may not repurchase shares of our common stock during the first year following the completion of the conversion, except when extraordinary circumstances exist and with prior regulatory approval. |
Investment Conclusions Experienced community banking team Well positioned for future growth Continued focus on shareholder returns 15 |
Questions? |