

Annual Report
Contents
ANZ Annual Report 2009 1
Chairman’s Report
A MESSAGE FROM CHARLES GOODE
ANZ delivered a solid result in 2009 against the backdrop of the global financial crisis and a major downturn in the world economy.
Our Performance
ANZ’s statutory profit after tax for the year ended 30 September 2009 was $2,943 million, down 11%, reflecting higher provisions. With an increase in the weighted average number of shares of 16%, this led to a fall in earnings per share of 23%. The dividend for the year was $1.02 per share fully franked, down 25%.
Excluding the impact of $829 million from one-off items, hedging timing differences and non-continuing businesses our underlying profit1 for 2009 was $3,772 million, up 10%.
Underlying revenue growth of 17% was strong while costs increased by 12%, with our underlying cost-to-income ratio at 42.2%, down from 44%. Provisions were at cyclical highs with the total credit impairment charge up 46% to $3,056 million, with increases across all regions but most pronounced in New Zealand.
Importantly, ANZ maintained its AA-credit rating, one of only 11 banks remaining in the world with a AA-rating.
These results were achieved at a time the global financial system and the world economy came under extraordinary pressure and they reflect the very significant efforts of our management and our staff during the year. I thank them for their contribution.
Capital Management
During 2009 ANZ took further steps to manage its capital position and funding programs to ensure we were strongly positioned given the difficult financial and economic conditions.
In May, we undertook a fully underwritten $2.5 billion institutional share placement. In July, we completed a Share Purchase Plan for retail shareholders which saw us issue $2.2 billion of ordinary equity.
Over 40% of our retail shareholders participated, making it one of the most successful Share Placement Plans undertaken by an Australian company. The new shares were issued at $14.40 compared to ANZ’s year-end share price of $24.39 representing a strong return to participating shareholders.
Including the underwritten Dividend Reinvestment Plan in July, ANZ raised $5.7 billion of ordinary equity and the Group ended 2009 as one of the world’s best capitalised banks.
ANZ’s Tier 1 capital ratio was 10.6% at the end of 2009 compared to 7.7% a year earlier. Adjusting for the acquisitions we made during the year but which have not yet been completed, the pro-forma Tier 1 ratio is estimated to be 9.5%.
Expansion and Growth
Our financial performance and strong capital position allowed ANZ to capitalise on significant strategic opportunities that arose during the year and our super regional strategy was advanced through both organic growth and acquisitions.
In August, we announced an agreement to acquire certain selected businesses of the Royal Bank of Scotland (RBS) in East Asia for approximately US$550 million (A$626 million).
The acquisition includes the RBS Retail, Wealth and Commercial businesses in Taiwan, Singapore, Indonesia and Hong Kong and the Institutional businesses in Taiwan, the Philippines and Vietnam. It creates a new platform for our Retail and Wealth businesses in Asia.
ANZ also moved to strengthen its franchise in Australia and New Zealand with an agreement to acquire the 51% held by the ING Group in the ANZ-ING wealth management and life insurance joint ventures.
Board Changes
John Morschel, one of Australia’s most respected business leaders, has agreed to succeed me as Chairman in February 2010.
John has been a director of ANZ since October 2004 and has made a major contribution since joining the Board. He has extensive experience as a chief executive and more recently as a non-executive director and chairman of major Australian and international companies. John also brings to the role a strong background in banking and financial services. He will make an excellent Chairman for ANZ.
We have also welcomed three new directors to the Board during the year – Peter Hay, Alison Watkins and Lee Hsien Yang – to facilitate a transition with the planned retirements of some Directors.
| 1 | Adjusted for material items that are not part of the normal ongoing operations of the Group including one-off gains and losses, gains and losses on the sale of businesses, non-continuing businesses, timing differences on economic hedges, and acquisition related costs. Refer page 6. |
2ANZ Annual Report 2009
CHAIRMAN’S REPORT (continued)
Peter Hay has a strong background in company law and investment banking advisory work, with strong experience in mergers and acquisitions. Alison Watkins is an experienced CEO and established director with a grounding in finance and accounting. Lee Hsien Yang is one of Asia’s most respected business leaders and has considerable knowledge of the region.
I would also like to acknowledge the outstanding contribution made to ANZ over 15 years by Margaret Jackson who retired from the Board in April 2009.
Customers and the Community
While the global financial and economic conditions have been testing, ANZ has maintained the momentum established in recent years by focusing on its customers and contributing to the community.
In Australia, we maintained the highest level of customer satisfaction of any of the major banks and we began the roll out of our new global brand identity and positioning for ANZ.
A number of the communities in which ANZ operates experienced disasters during the year. These included natural disasters in Asia and the Pacific and the bushfires in Victoria. ANZ contributed to the relief efforts through donations, direct grants and the efforts of many ANZ staff.
During 2009, ANZ was named as the most sustainable bank globally in the Dow Jones Sustainability Index for the third consecutive year.
Outlook
Looking ahead, the actions taken by governments around the world have gained traction and are now moderating the effects of the global economic downturn.
While it is clear that Australia and Asia have weathered the crisis better than the US and Europe, there is still uncertainty about the shape of the recovery and it is prudent to be cautious. In New Zealand, there are early signs the economy has stabilised, however economic recovery is likely to be slow.
At ANZ, we are facing some headwinds in 2010 including the strength of the Australian dollar, a less favourable global markets environment and a 13% increase in the weighted average number of shares to be serviced.2 Our regional growth focus however puts us in a unique position to capitalise on Asia’s recovery and growth.
However, we also have some tail winds with the recovery in the economies of Australia, New Zealand and the region, continued profitable expansion in East Asia and a moderation in the outlook for doubtful debts.
We have a strong management team, a strong capital position, strong liquidity and a well thought out strategy to be a super regional bank. The bank is being managed for the medium term and the outlook is for an improvement in profits in 2010 and a strong 2011.

CHARLES GOODE
CHAIRMAN
| 2 | Shares on issue at 30 September 2009 divided by weighted average number of shares during 2009. |
Chairman’s Report3
Chief Executive Officer’s Report
A MESSAGE FROM MICHAEL SMITH
Two years ago, we took a decision at ANZ that although we had great individual businesses in Australia, New Zealand and Asia Pacific, there was a unique opportunity to create value for shareholders by becoming a super regional bank – a bank of global quality with regional focus.
2009 represents a turning point in delivering that aspiration. We’ve worked hard to reposition ANZ to face up to what we called the ‘new reality’ following the global financial crisis and we’ve built a strong foundation through careful, disciplined management of our balance sheet, capital and liquidity.
At the same time, we’ve made significant progress in completing change and remediation in the business in order to place ANZ on a new footing. Together, that’s allowed us to shift our focus this year to the opportunities that are available to a strongly capitalised bank and to the growth available in our region which is now the best performing region in the world economy.
Our operating environment
Our 2009 financial year began just weeks after the collapse of Lehman Brothers, one of the leading Wall Street investment banks. In the weeks that followed some household names in finance disappeared and as at the end of 2009 over 100 banks in the United States had failed and many of what were the world’s largest banks are now effectively in the hands of their respective national governments.
As the financial crisis unfolded, its impact on the world economy became very clear. As a result we’ve seen unprecedented action by governments to save the global financial system and to rescue the world economy which entered into the most globalised downturn since the Great Depression.
In Australia, even with provisions at or near cyclical highs, Australian banks are in good shape relative to their international peers. Today, Australia’s four major banks, including ANZ, are among just 11 AA-rated banks left in the world.
In this very difficult environment, ANZ has consistently called the trends early in the economic cycle and the global financial situation.
Today, in Australia and in Asia, the economies are showing early positive signs of recovery and although the economic cycle is still playing out, there are reasons for optimism.
In the region, China and India are continuing to show good growth and we believe the urbanisation and fundamental transformation occurring in those economies will see that growth continue.
We strongly believe Asia will be an engine for global growth for many decades to come, and given the trade and investment flows between Australia and New Zealand and Asia, it’s an essential part of the long-term growth strategy for any business.
Our business performance
In this environment, ANZ has remained financially strong, maintained momentum in the business and worked hard to position ANZ for future growth.
Statutory profit for the year was $2.9 billion, down 11%. Taking into account the impact of some one off items and non-continuing businesses, underlying profit1 increased 10% to $3.8 billion.
Australia performed well with underlying profit* up 13% to $2,560 million. The Retail and Institutional businesses in the region were standout performers. Commercial produced a credible result, given the difficult year experienced by middle market and small business managers.
Importantly we are also delivering for our customers. ANZ remains the highest rated of the major banks when it comes to customer satisfaction.
In New Zealand, trading conditions remained challenging. New Zealand’s economic downturn has been more pronounced and protracted than that in Australia and while we maintained our market leading position, the economic environment led to a 34% decline in underlying profit after tax to $513 million.
The Asia Pacific, Europe & America region produced an outstanding performance with underlying profit up 81% to $699 million, with strong contributions from our partnerships and the Institutional business driving much of this growth.
ANZ has continued to invest significantly in the region including deepening the Institutional business and advancing the Retail and Wealth platforms. We’ve continued to build our branch networks in Indonesia, Vietnam and China and are acquiring business in six countries in Asia from the Royal Bank of Scotland.
The Institutional Division has turned around its performance, delivering an underlying profit of $1.4 billion, up 82% on last year. A key feature of the Institutional result was Global Markets revenue growth with both customer flow and trading revenue up strongly. Interest rate and general market volatility coupled with increased customer penetration drove the significant increase in revenue within the Global Markets business.
The Institutional team leveraged their strong revenue growth to make investments in improved systems and processes and to begin to grow frontline staff numbers.
Strategic growth
During 2009, we’ve been able to take advantage of the global financial crisis and ANZ’s strong balance sheet to advance our super regional strategy.
In August we reached agreement with the Royal Bank of Scotland Group to acquire selected RBS businesses in East Asia for around US$550 million ($626 million) delivering a further stepping stone in our super regional strategy and creating a new platform for our businesses in Asia.
| 1 | Adjusted for material items that are not part of the normal ongoing operations of the Group including one-off gains and losses, gains and losses on the sale of businesses, non-continuing businesses, timing differences on economic hedges, and acquisition related costs. Refer page 6. |
4ANZ Annual Report 2009
CHIEF EXECUTIVE OFFICER’S REPORT (continued)
The acquisition, which is still subject to regulatory approvals, includes the RBS retail, wealth and commercial businesses in Taiwan, Singapore, Indonesia and Hong Kong, and the institutional businesses in Taiwan, the Philippines and Vietnam.
Together, the businesses are an attractive portfolio of well provisioned banking assets at a reasonable price which complement our existing businesses across China, Indochina and South East Asia and provide our franchise with further growth momentum.
In September, we signed an agreement with ING to acquire its 51% shareholding in the ANZ-ING joint ventures in Australia and New Zealand for $1.76 billion. The transaction brings certainty to our wealth management position through full ownership of what is an established specialist wealth management and protection business with a 120-year history in Australia.
Importantly for shareholders, it will be accretive to underlying earnings in 2010 before some significant revenue and cost synergies.
In the medium term, it also gives us a foundation to build a significant wealth business with the flexibility to pursue further growth opportunities without the constraints of a joint venture structure.
Organisational capability
This year we’ve also put a new customer focused business model and organisation structure in place. A new competitive era and strategy demanded a new business model and structure, one that can support our aspirations to become a super regional bank.
We are now organised around three key regions – Australia, New Zealand and Asia Pacific, Europe and America with Institutional operating as a global business. We have also put in place a simpler, less complex structure for Operations, Technology, Human Resources, Finance and Risk.
We’ve continued to reshape our top management team during the year, with several new appointments made.
The latest addition, which completes the management team, is the appointment of Phillip Chronican to lead the Australia Division. Phillip joins ANZ after a 27-year career with Westpac where he built a reputation as one of Australia’s leading banking executives.
Also this year, Joyce Phillips joined ANZ as head of Strategy, M&A, Marketing and Innovation from GE and Citigroup and Shayne Elliott, was appointed as head of Institutional also from Citigroup and most recently EFG-Hermes.
Our customers and brand
Part of our strategy is to design our business around our customers’ needs, not our product lines. We made significant progress with this with our new organisation structure.
But we also need to shift our thinking from selling commoditised product to looking at differentiating the way we market ourselves, the way we package and segment our offering and the way we service our customers. Part of that involves investing in developing a great regional brand and so this year we’ve worked hard to develop a new global brand identity and positioning for ANZ in support of our super regional strategy.
Having one strong, unified brand across all our geographies, which tells the world that we are ‘One ANZ’ wherever customers choose to deal with us, is an important part of our future growth. It identifies who we are as a business and what we stand for.
The new brand identity and positioning followed 18 months of detailed research involving more than 1,300 customers and 250 staff in Australia, New Zealand and Asia Pacific that showed our customers want us to care about them as people and appreciate how complex life has become.
As part of the launch, we introduced a new global tagline, ‘We live in your world’.
This aspiration is at the heart of our brand promise – no matter where our customers deal with us, we want to give them one high standard of experience, based on understanding their world better than anyone else.
We know there’s a lot to do to really deliver on this and all our people are committed to the task.
2009 and the future
Reflecting on what has been a full year of activity at ANZ, we’ve remained financially very strong, we have a very clear growth strategy and we have a very experienced team of real bankers to make sure we keep hitting our targets and growing the bank with an acceptable risk profile. In doing so, I believe we have created real value for shareholders.
Looking forward to 2010, we are going to have to manage continuing volatility in financial markets and the global economy. The recovery in Europe and the United States is still in a very sensitive position and there’s going to be good and bad news in the slow advance forward.
I also want to sound a note of caution. While the inevitable aftermath of the recent failures in the financial system and in business is going to be greater regulation, in my view, the real challenge is for governments to avoid acting on populist rhetoric. Regulators and business need to work together to identify how we create the right balance between free markets which are the best tool we know for fostering innovation and generating wealth, and ensuring there is a watchful eye from regulators that can help markets avoid overshooting and spinning out of control.
Against this backdrop, ANZ is clearly established as one of the best capitalised banks in the world. We have largely completed the remediation and change needed in parts of the business and we have taken advantage of opportunities to grow, as we progress on our journey to build a super regional bank that delivers performance and growth for our shareholders, customers and the communities in which we operate.

CHIEF EXECUTIVE OFFICER
Chief Executive Officer’s Report5
Chief Financial Officer’s Report
A MESSAGE FROM PETER MARRIOTT
ANZ reported a profit after tax of $2,943 million for the year ended 30 September 2009.
| | | | | | | | | | | | |
Income Statement ($m) | | 2009 | | | 2008 | | | Movt | |
Net interest income | | | 9,808 | | | | 7,850 | | | | 25 | % |
Other operating income | | | 3,802 | | | | 4,309 | | | | -12 | % |
| | | | | | | | | | | | |
Operating income | | | 13,610 | | | | 12,159 | | | | 12 | % |
Operating expenses | | | (6,225 | ) | | | (5,696 | ) | | | 9 | % |
| | | | | | | | | | | | |
Profit before credit impairment and income tax | | | 7,385 | | | | 6,463 | | | | 14 | % |
Provision for credit impairment | | | (3,005 | ) | | | (1,948 | ) | | | 54 | % |
| | | | | | | | | | | | |
Profit before income tax | | | 4,380 | | | | 4,515 | | | | -3 | % |
Income tax expense | | | (1,435 | ) | | | (1,188 | ) | | | 21 | % |
Minority interest | | | (2 | ) | | | (8 | ) | | | -75 | % |
| | | | | | | | | | | | |
Profit attributable to shareholders of the Company | | | 2,943 | | | | 3,319 | | | | -11 | % |
| | | | | | | | | | | | |
Underlying profit
Profit has been adjusted to exclude non-core items to arrive at underlying profit, the result for the ongoing business activities of the Group. The principles set out in the Australian Institute of Company Directors’ (AICD’s) and the Financial Services Institute of Australasia’s (Finsia’s) joint recommendations “Principles for reporting of non-statutory profit information” have been adopted in determining underlying profit.
| | | | | | | | | | | | |
Income Statement ($m) | | 2009 | | | 2008 | | | Movt | |
Statutory profit attributable to shareholders of the Company | | | 2,943 | | | | 3,319 | | | | -11 | % |
Adjust for the following gains/(losses) included in statutory profit (net of tax) | | | | | | | | | | | | |
Tax on New Zealand Conduits | | | (196 | ) | | | — | | | | n/a | |
Economic hedging – fair value gains/(losses) (incl. revenue and net investment hedges) | | | (227 | ) | | | 217 | | | | large | |
Gain on Visa shares | | | — | | | | 248 | | | | -100 | % |
Organisational transformation costs (incl. One ANZ restructuring) | | | (100 | ) | | | (152 | ) | | | -34 | % |
Impairment of intangible – Origin Australia | | | — | | | | (24 | ) | | | -100 | % |
New Zealand tax rate change | | | — | | | | 1 | | | | -100 | % |
ANZ share of ING NZ investor settlement | | | (121 | ) | | | — | | | | n/a | |
Non continuing businesses | | | | | | | | | | | | |
Credit intermediation trades | | | (69 | ) | | | (371 | ) | | | -81 | % |
Other | | | (116 | ) | | | (26 | ) | | | large | |
| | | | | | | | | | | | |
Underlying profit | | | 3,772 | | | | 3,426 | | | | 10 | % |
| | | | | | | | | | | | |
Underlying profit by key line item | | | | | | | | | | | | |
Net interest income | | | 9,810 | | | | 7,855 | | | | 25 | % |
Other operating income1 | | | 4,557 | | | | 4,440 | | | | 3 | % |
| | | | | | | | | | | | |
Operating income | | | 14,367 | | | | 12,295 | | | | 17 | % |
Operating expenses | | | (6,068 | ) | | | (5,406 | ) | | | 12 | % |
| | | | | | | | | | | | |
Profit before credit impairment and income tax | | | 8,299 | | | | 6,889 | | | | 20 | % |
Provision for credit impairment1 | | | (3,056 | ) | | | (2,090 | ) | | | 46 | % |
| | | | | | | | | | | | |
Profit before income tax | | | 5,243 | | | | 4,799 | | | | 9 | % |
Income tax expense | | | (1,469 | ) | | | (1,365 | ) | | | 8 | % |
Minority interest | | | (2 | ) | | | (8 | ) | | | -75 | % |
| | | | | | | | | | | | |
Profit attributable to shareholders of the Company | | | 3,772 | | | | 3,426 | | | | 10 | % |
| | | | | | | | | | | | |
| 1 | Credit valuation adjustments on defaulted or impaired exposures of $82 million are reclassified as provision for credit impairment (Sep 2008: $156 million). |
6ANZ Annual Report 2009
CHIEF FINANCIAL OFFICER’S REPORT (continued)
ANZ reported a profit attributable to shareholders of the Company of $2,943 million for the year ended 30 September 2009, down $376 million or 11% from $3,319 million for the year ended 30 September 2008. Growth in profit before credit impairment and income tax of 14% was offset by an increase in provision for credit impairment of $1,057 million or 54% and a higher effective tax rate, largely as a result of a $196 million provision for New Zealand conduit transactions.
Analysis of business performance on an underlying basis by major income and expense categories follows.
Net Interest Income
Net interest income increased $1,955 million (25%) to $9,810 million for the year ended 30 September 2009. Net interest income was driven by an increase in average interest earning assets of 9% and growth in average deposits and other borrowings of 12% as well as an increase in net interest margin of 28 basis points, or 16 basis points excluding cash flow on derivatives.
The increase in average interest earning assets included a 7% increase in net advances, primarily in Mortgages within Australia region, reflecting increased market share and customer demand. Other interest earning assets increased 22% driven by increases in trading and available-for-sale assets, interbank lending and higher liquid assets.
Average deposits and other borrowings increased 12% with customer deposits growing by 16%. Australia region grew by 16% due primarily to an uplift in term deposits driven by competitive pricing and customer acquisition. Asia Pacific, Europe & America region grew by 57%, spread across all countries driven by deposit raising strategies and customer acquisitions. Customer deposits grew by $31.1 billion (16%).
Net interest margin was up 28 basis points to 2.29% (or 16 basis points excluding the impact of cash flow on derivatives). The key drivers of the improved margin performance were:
| • | | Improved asset margin from repricing activities and rate adjustments (+45 basis points) which were required to offset higher funding costs and increased risk in the loan book as a result of the flow through effects of the global credit crisis. Higher funding costs came through as an increase in wholesale funding costs (-6 basis points), lower margin on deposits (-28 basis points) and lower interest on capital (-7 basis points). |
| • | | Markets (+17 basis points) continued to perform strongly in their balance sheet businesses (+8 basis points) and the impact of funding benefits associated with unrealised trading gains and losses on derivatives (+12 basis points) $524 million directly offset in other operating income, partly offset by the mix impact of Markets balance sheet on the Group (-3 basis points). |
| • | | Additional capital raised during 2009, mainly through the share purchase and share placement plans, had a +4 basis points mix impact on margin. |
| • | | Other asset and funding mix changes (+4 basis point) were as a result of a lower proportion of wholesale funding (+7 basis points), favourable benefit from non interest bearing items (-3 basis point). Asset mix impact was neutral. |
| • | | Other items (-1 basis point) include New Zealand lower mortgage prepayment income (-1 basis point) driven by the downward movement in New Zealand market rates, higher sub-debt premiums (-1 basis point) and other net impacts (+1 basis point). |
Other Operating Income
Other operating income increased $117 million (3%) to $4,557 million for the year ended 30 September 2009. Major movements include:
| • | | Fee income increased $80 million (3%). Lending fee income increased $169 million (28%) due mainly to the Institutional business across the regions. Non-lending fee income decreased $89 million (4%) with Investment and Insurance Products down $48 million as a result of downturn in investment markets. Relationship Banking decreased $18 million and Specialised Lending reduced $17 million both driven by lower lending volumes. |
| • | | Net foreign exchange earnings increased $243 million (35%) principally in Markets Australia with a $134 million increase as a result of volatility in global currency markets and higher sales volumes and in Asia Pacific, Europe & America grew $103 million reflecting increased earnings in Taiwan and Korea, United Kingdom and Europe and Indonesia. New Zealand increased $26 million due to strong Institutional earnings. |
| • | | Profit on trading instruments decreased $194 million (38%) which included a $524 million decrease in unrealised trading gains offset in net interest income. Excluding the offset, the Markets business performed strongly benefiting from increased volatility in the interest rate market and higher sales volumes. |
Operating Expenses
Operating expenses increased $662 million (12%) for the year ended 30 September 2009. Across the Group, movements in exchange rates contributed 1% of the increase. Excluding this, around 35% of the dollar cost growth was attributable to Asia Pacific, Europe & America (costs up 54%) with substantial investment in expanding branch networks across the region, and increased resources to drive the growth agenda. Within the Australia and New Zealand regions, Institutional drove the majority of the cost growth, up 19% and representing 32% of the Group’s total cost growth through investment in the “Rebuild and Refocus” program and increased remuneration costs. Elsewhere in Australia, costs in the Australian division were up only 4%, however there was an increase in centrally funded transformation projects and infrastructure investment in the Group Centre. Cost growth was limited to 1% (or 4% in NZD) in New Zealand region. Further details on the major expense categories are on the following page.
Chief Financial Officer’s Report 7
CHIEF FINANCIAL OFFICER’S REPORT (continued)
| • | | Personnel costs were up $349 million (11%) as a result of growth in remuneration costs associated with attracting and retaining talent and additional bankers and specialists to support growth. Asia Pacific, Europe & America increased staff numbers by 827 employees due to continued growth in the business. |
| • | | Premises costs increased $45 million (9%), driven mainly by a $30 million higher rental expense reflecting additional space requirements, the impact of the sale and leaseback program and market rental growth. |
| • | | Computer costs grew $157 million (26%), due to increased software purchased of $50 million including higher licence costs and increasing technology initiatives, higher amortisation charges of $31 million, a $24 million increase in software written-off, a $15 million increase on computer contractors, $11 million increase in rentals and repairs, $8 million higher data communications costs and a $23 million increase in other computer costs which include super regional network costs. |
| • | | Other expenses increased $111 million (11%) with minor movements across many categories. Professional fees grew $21 million including an increase in Group Centre due to various project work. Advertising costs increased $13 million due mainly to increased marketing costs in South Asia. Card processing costs increased $9 million reflecting increased volumes. New Zealand other expenses increased $26 million including the impact from the acquisition of a controlled entity during the second half of 2008. Travel costs reduced $22 million due to increased focus on cost management. |
Provision for Credit Impairment
Provision for credit impairment charge increased $966 million from 2008 to $3,056 million. The challenging economic environment, reducing business confidence and rising levels of commercial losses combined to put pressure on the provisioning levels. The individual provision charge increased across all regions partially offset by a decrease in collective provision charge, primarily as a result of a release of concentration risk provision taken up in 2008 as losses were crystallised, a lower economic cycle adjustment charge and reduced lending volumes.
Total individual provision charge increased $1,542 million to $2,814 million from 2008. The increase in Australia of $1,199 million was driven by higher loss rates across all portfolios within the region, and rising levels of bankruptcies and commercial losses in line with higher business liquidations and lower realisable asset values as well as the large single provisions raised for customers within the Commercial Property, Finance and Brokering Services portfolios in Institutional Australia. The increase in New Zealand of $349 million occurred across all segments as weaker global and local economic conditions impacted export, household incomes, consumer spending and business sectors. The Asia Pacific, Europe & America increase of $72 million was due to higher losses in South Asia, Indonesia Cards as well as commercial property downgrades in Cambodia and North Asia.
The collective provision charge decreased $576 million during the year to $242 million, with a decrease in Australia partially offset by increases in New Zealand and Asia Pacific, Europe & America. The decrease in Australia was due mainly to lower institutional lending and concentration provision releases following defaults by a small number of large customers within Institutional crystallising losses which were provided for in 2008. This was partly offset by increases within the Cards portfolio due to higher delinquencies and bankruptcies, and risk deterioration in Esanda and Investment and Insurance Products. The New Zealand charge increased $127 million reflecting a rise in unsecured consumer delinquencies and a weakening risk profile across the portfolio. Unfavourable risk movements were also experienced in Asia Pacific, Europe & America, particularly across Europe and America and this, coupled with refinements to methodology, resulted in increased charges of $106 million.
8ANZ Annual Report 2009
CHIEF FINANCIAL OFFICER’S REPORT (continued)
Credit Risk on Derivatives
ANZ recognised $135 million of credit risk on derivatives during the year as a reduction to other income in the Income Statement in the statutory accounts. The charge relating to the credit intermediation trades are part of the adjustments to arrive at underlying profit. The decrease of $552 million over the 2008 year resulted from narrowing credit spreads.
| | | | | | | | |
| | | 2009
$m | | | 2008
$m | |
Credit risk on derivatives | | | | | | | | |
Credit intermediation trade related | | | 53 | | | | 531 | |
Credit risk on impaired derivatives | | | 82 | | | | 156 | |
| | | | | | | | |
Credit risk on derivatives | | | 135 | | | | 687 | |
| | | | | | | | |
This charge arose from:
| • | | changes to the creditworthiness of counterparties to our structured credit intermediation trades, |
| • | | defaults on customer derivative exposures with two mining companies and a financial institution, and |
| • | | changes in counterparty credit ratings on the remainder of our derivatives portfolio. |
ANZ entered into a series of structured credit intermediation trades from 2004 to 2007. The underlying structures involve credit default swaps (CDS) over synthetic collateralised debt obligations (CDOs) (78%), portfolios of external collateralised loan obligations (CLOs) (13%) or specific bonds/floating rate notes (FRNs) (9%).
ANZ sold protection using credit default swaps over these structures and then to mitigate risk purchased protection via credit default swaps over the same trades from eight US financial guarantors.
As derivatives, both the sold protection and purchased protection are marked-to-market. Prior to the commencement of the global credit crisis, gains and losses were not significant and offset each other in income.
At 30 September 2009, the value of the obligation under the sold protection is USD 897 million, for which the purchased protection has produced only a partial offset as:
| • | | one of the purchased protection counterparties has defaulted and many of the remaining were downgraded, and |
| • | | ANZ has made a credit valuation adjustment on the remaining counterparties reflective of changes to credit spreads. |
The current charge includes $85 million in realised losses relating to restructuring trades to reduce risks which were unhedged due to default by the purchased protection counterparty. It also includes net foreign exchange hedging losses.
The credit risk expense on structured credit derivatives is very volatile reflecting the impact of market movements in credit spreads and USD/AUD rates. It is likely there will continue to be substantial volatility in this market value.
Impaired assets
Gross impaired loans at $4,392 million represent a $2,642 million increase over 30 September 2008, driven mainly by increases in Australia and New Zealand. The increase in Australia was predominantly across entities within the Institutional Relationships, Corporate Banking and Financial Institution portfolios, with the ten largest impaired loan customers representing 60% of the total Australia gross impaired loans balance. There was an increase in Australia division across most businesses, as deterioration in the economic environment resulted in higher levels of default, particularly within Esanda, Business Banking and Investment and Insurance Products. The New Zealand increase of $699 million was driven primarily by customer downgrades in the small business, commercial, agribusiness segments and mortgages portfolios. Asia Pacific, Europe & America increased slightly, driven by increases in Europe and America.
Capital and funding
ANZ took early and measured steps to manage its capital and funding programs throughout the global financial crisis. This included initiatives to strengthen the balance sheet, boost liquidity and the quantity and composition of capital, to stay ahead of changes in the cycle and to allow the Group to capitalise on opportunities that have and will arise.
ANZ’s capital base has been progressively strengthened since late 2007 but most recently through the raising of $5.7 billion of ordinary equity. The Group’s Tier 1 capital ratio was 10.6% at the end of September 2009 compared to 7.7% a year ago. Adjusting for the announced acquisitions of certain RBS assets in Asia and the ING Group’s share of the ING Australia and ING New Zealand joint ventures, the pro-forma Tier 1 ratio reduces to 9.5%.
Global liquidity conditions have improved over the year. Deposit growth has been strong with the proportion of total funding from customers increasing from 50% to 55%. ANZ executed its full year term wholesale funding requirements well ahead of schedule raising a total of $25.8 billion. A combination of stronger deposit growth and consistent term debt issuance has reduced the reliance on short term wholesale funding from 22% to 17%.
Chief Financial Officer’s Report 9
CHIEF FINANCIAL OFFICER’S REPORT (continued)
Balance Sheet Summary
| | | | | | | | | | | | |
| | | 2009
$m | | | 2008
$m | | | Movt | |
Assets | | | | | | | | | | | | |
Liquid assets | | | 25,317 | | | | 25,030 | | | | 1 | % |
Due from other financial institutions | | | 4,985 | | | | 9,862 | | | | -49 | % |
Trading and available-for-sale assets | | | 47,566 | | | | 32,657 | | | | 46 | % |
Derivative financial instruments | | | 37,404 | | | | 36,941 | | | | 1 | % |
Net loans and advances including acceptances | | | 345,769 | | | | 349,851 | | | | -1 | % |
Other | | | 15,946 | | | | 15,952 | | | | 0 | % |
| | | | | | | | | | | | |
Total Assets | | | 476,987 | | | | 470,293 | | | | 1 | % |
| | | | | | | | | | | | |
Liabilities | | | | | | | | | | | | |
Due to other financial institutions | | | 19,924 | | | | 20,092 | | | | -1 | % |
Deposits and other borrowings | | | 294,370 | | | | 283,966 | | | | 4 | % |
Derivative financial instruments | | | 36,516 | | | | 31,927 | | | | 14 | % |
Liability for acceptances | | | 13,762 | | | | 15,297 | | | | -10 | % |
Bonds and notes | | | 57,260 | | | | 67,323 | | | | -15 | % |
Other | | | 22,726 | | | | 25,136 | | | | -10 | % |
| | | | | | | | | | | | |
Total liabilities | | | 444,558 | | | | 443,741 | | | | 0 | % |
| | | | | | | | | | | | |
Total equity | | | 32,429 | | | | 26,552 | | | | 22 | % |
| | | | | | | | | | | | |
Analysis of movements in balance sheet captions on a statutory basis is set out on the following page.
10ANZ Annual Report 2009
CHIEF FINANCIAL OFFICER’S REPORT (continued)
Growth in the balance sheet was subdued reflecting the challenging economic environment experienced during the last twelve months with asset growth of $6.7 billion or 1% and liability growth of $0.8 billion. Movements in exchange rates have resulted in a decrease of $6.7 billion for the year ended 30 September 2009. Excluding the impact of exchange rates, total assets increased 3%.
Movements in the major asset and liability categories include:
| • | | Liquid assets increased $0.3 billion to $25.3 billion at 30 September 2009. Strong growth was evident in America (up $4.5 billion) due primarily to an increase in bills receivable and Singapore (up $2.2 billion) within bank certificates of deposits where funds were redeployed from interbank placements for better yields. This was partially offset by reductions in the United Kingdom of $2.9 billion, New Zealand of $1.4 billion and Group Treasury of $0.9 billion. |
| • | | Due from other financial institutions decreased $4.9 billion to $5.0 billion at 30 September 2009 due mainly to a reduction in interbank lending volumes in Transaction Banking in Australia and Singapore. |
| • | | Trading and available-for-sale assets increased $14.9 billion to $47.6 billion at 30 September 2009, primarily in trading securities within the Markets business in Australia due to a build up in liquidity levels. These securities are high quality paper. |
| • | | Derivative assets increased $0.5 billion to $37.4 billion at 30 September 2009 and derivative liabilities increased $4.6 billion to $36.5 billion at 30 September 2009. The increase was driven by volatility in foreign exchange, interest rate and credit derivative markets. |
| • | | Net loans and advances including acceptances contracted slightly by 1% to $345.8 billion at 30 September 2009. Australia grew by $0.7 billion, with housing loans in Mortgages increasing by $12.7 billion (10%), partially offset by reduced lending in Institutional, primarily in Specialised Lending and Markets, of $12.1 billion (20%) driven by equity raisings in capital markets and widespread deleveraging prompting paydown of loan balances. New Zealand declined by $2.4 billion or 3%. |
| | | Excluding the impact of exchange rates the contraction was smaller at $0.7 billion (1%), with growth in Rural Banking of $1.2 billion (8%) being offset by reductions in the Institutional business of $0.9 billion (13%) and Corporate & Commercial Banking of $0.6 billion (5%). Asia Pacific, Europe & America decreased $2.4 billion (11%) due to a reduction in the United Kingdom and America of $1.4 billion (18%). |
| • | | Deposits and other borrowings increased $10.4 billion to $294.4 billion at 30 September 2009. Excluding the impact of exchange rate movements, deposits and other borrowings increased $14.6 billion (5%), driven by an increase in customer deposits of $29.4 billion (14%), partly offset by a decrease in wholesale funding of $14.8 billion (19%). Australia increased $10.6 billion (6%) predominantly driven by the robust growth in retail deposits. Growth was mainly in Deposits ($15.5 billion), partly offset by decreases in Esanda of $9.1 billion, following the winding back of debentures, and Group Treasury ($5.4 billion). New Zealand Businesses decreased $5.9 billion (9%) driven by a reduction in commercial paper issued by Treasury. Asia Pacific, Europe & America increased $5.7 billion (16%) primarily from Singapore through successful initiatives to raise deposit levels and additional certificates of deposit issued in the United Kingdom for funding requirements. |
| • | | Bonds and notes decreased $10.1 billion to $57.3 billion at 30 September 2009 driven by exchange rate movements. |
Chief Financial Officer’s Report11
CHIEF FINANCIAL OFFICER’S REPORT (continued)
Australia Region
| | | | | | | | | | | | |
Income Statement ($m) | | 2009 | | | 2008 | | | Movt | |
Net interest income | | | 7,085 | | | | 5,677 | | | | 25 | % |
Other external operating income | | | 2,677 | | | | 2,849 | | | | -6 | % |
| | | | | | | | | | | | |
Operating income | | | 9,762 | | | | 8,526 | | | | 14 | % |
Operating expenses | | | (4,034 | ) | | | (3,677 | ) | | | 10 | % |
| | | | | | | | | | | | |
Profit before credit impairment and income tax | | | 5,278 | | | | 4,849 | | | | 18 | % |
Provision for credit impairment | | | (2,053 | ) | | | (1,663 | ) | | | 23 | % |
| | | | | | | | | | | | |
Profit before income tax | | | 3,675 | | | | 3,186 | | | | 15 | % |
Income tax expense | | | (1,113 | ) | | | (917 | ) | | | 21 | % |
Minority interest | | | (2 | ) | | | (2 | ) | | | 0 | % |
| | | | | | | | | | | | |
Underlying profit | | | 2,560 | | | | 2,267 | | | | 13 | % |
| | | | | | | | | | | | |
Adjustments between statutory profit and underlying profit1 | | | (476 | ) | | | (160 | ) | | | large | |
| | | | | | | | | | | | |
Profit | | | 2,084 | | | | 2,107 | | | | -1 | % |
| | | | | | | | | | | | |
| 1 | Adjusted for material items that are not part of the normal ongoing operations of the Group including one-off gains and losses, gains and losses on the sale of businesses, non-continuing businesses, timing differences on economic hedges, and acquisition related costs. Refer page 6. |
Profit after tax decreased $23 million or 1% to $2,084 million for the year ended 30 September 2009. On an underlying basis profit increased $293 million (13%).
Significant influences on underlying profit were:
| • | | Net interest income increased 25% driven by an increase in net interest margin of 29 basis points, while average net loans and advances grew by 7% and average deposits grew by 11%. Higher funding benefits associated with unrealised trading gains (offset by a decrease in trading income) had an 11 basis point positive impact. Excluding this, margin improved by 18 basis points with higher margins in Australia division in Retail and Commercial reflecting repricing for risk and recouping higher funding costs and increased margins in Institutional Australia reflecting repricing on the corporate lending book and management of interest rate risk in Markets. Growth in balance sheet volume was driven by Australia division, with Retail customer deposits up 28% reflecting increased market share and net loans and advances up 10% in Mortgages. |
| • | | Other external operating income decreased 6%. Excluding the offset to the derivative funding benefit in net interest income, other external operating income increased 5% driven by strong trading and sales revenues generated in a volatile market and favourable growth in Retail driven by fee revenue mainly in Deposits. This was partially offset by a decline in income in Wealth from lower investment and advisory income and a lower contribution from the INGA business. |
| • | | Operating expenses increased 10% or $357 million. Institutional Australia increased 21% or $178 million due primarily to investment in frontline staff and systems, salary inflation and remuneration costs. Australia division increased 4% or $114 million with increased volume growth related personnel in service delivery and collections areas, salary inflation, premises costs and investment in systems, partly offset by savings due to productivity, restructuring and offshoring activities. Increases of $61 million within Group Centre include increased expenditure on transformation activity. |
| • | | Provision for credit impairment increased $390 million (23%). The individual provision charge increased by $1,199 million driven by higher loss rates across all portfolios and increased bankruptcies, liquidations and a significant reduction in Retail resale options. In addition, Institutional Australia experienced several large single name provisions. The collective provision charge decreased by $809 million with the release of collective provision provided in 2008 as actual losses crystallised and flowed through the 2009 individual provision charge within Institutional Australia, partly offset by increases within the Cards portfolio due to higher delinquencies and bankruptcies and Esanda and Wealth due to risk deterioration. |
12ANZ Annual Report 2009
CHIEF FINANCIAL OFFICER’S REPORT (continued)
Asia Pacific, Europe and America Region
| | | | | | | | | | | | |
Income Statement ($m) | | 2009 | | | 2008 | | | Movt | |
Net interest income | | | 846 | | | | 473 | | | | 79 | % |
Other external operating income | | | 1,121 | | | | 736 | | | | 52 | % |
| | | | | | | | | | | | |
Operating income | | | 1,967 | | | | 1,209 | | | | 63 | % |
Operating expenses | | | (852 | ) | | | (554 | ) | | | 54 | % |
| | | | | | | | | | | | |
Profit before credit impairment and income tax | | | 1,115 | | | | 655 | | | | 70 | % |
Provision for credit impairment | | | (276 | ) | | | (176 | ) | | | 57 | % |
| | | | | | | | | | | | |
Profit before income tax | | | 839 | | | | 479 | | | | 75 | % |
Income tax expense | | | (140 | ) | | | (87 | ) | | | 61 | % |
Minority interest | | | — | | | | (6 | ) | | | -100 | % |
| | | | | | | | | | | | |
Underlying profit | | | 699 | | | | 386 | | | | 81 | % |
| | | | | | | | | | | | |
Adjustments between statutory profit and underlying profit1 | | | 1 | | | | (5 | ) | | | large | |
| | | | | | | | | | | | |
Profit | | | 700 | | | | 381 | | | | 84 | % |
| | | | | | | | | | | | |
| 1 | Adjusted for material items that are not part of the normal ongoing operations of the Group including one-off gains and losses, gains and losses on the sale of businesses, non-continuing businesses, timing differences on economic hedges, and acquisition related costs. Refer page 6. |
Profit after tax increased $319 million or 84% (55% excluding exchange rate impacts) to $700 million for the year ended 30 September 2009 (on an underlying basis profit grew $313 million or 81%).
This increase was driven by strong growth in the Institutional business as it benefited from currency and rates volatility in the region particularly in the early part of the year. Continued investment in front office sales capability generated a significant increase in trade sales. The Asia Partnerships also contributed significantly to the result with increased equity accounted earnings, particularly from Shanghai Rural Commercial Bank (SRCB) and Bank of Tianjin (BoT) in China and AMMB Holdings Berhad (AMMB) in Malaysia (including improved assessment of credit provisioning requirements), offsetting an impairment charge relating to the carrying value of our investment in Saigon Securities Inc (SSI) in Vietnam.
Operating expenses increased as a result of the continued investment in the key strategic markets of Indonesia, Vietnam and China as well as building our operating and support capabilities.
Key factors affecting the underlying result were:
| • | | Net interest income increased by 79% (43% excluding exchange rate impacts) due to significant increases in our Global Markets business. While net loans and advances were down 11% year on year as we de-risked our balance sheet, overall external assets were up 3% due primarily to increased Markets activities. Customer deposits grew a healthy 35% improving our deposits to loans ratio to 160%. Margins increased by 47 basis points to 170 basis points (18 basis points increase excluding cash flow on derivatives). |
| • | | Other external operating income grew by 52% (40% excluding exchange rate impacts), of which more than half was contributed by equity accounted earnings from our Asia Partnerships which included benefit from reassessed credit provisioning requirements. Fee and other income were significantly higher in the Markets businesses leveraging off volatility in the currency markets. |
| • | | Operating expenses increased 54% (32% excluding exchange rate impacts) through a combination of new investments, and growth across the region in employee numbers. Employees increased by 1,786 as we continue to build core capability in the region and increase our operations and technology support staff in Bangalore. |
| • | | Provision for credit impairment increased by 57% ($100 million) due primarily to risk grade decreases and an additional $43 million as a result of a refinement to the collective provision calculation in 2009. |
Chief Financial Officer’s Report 13
CHIEF FINANCIAL OFFICER’S REPORT (continued)
New Zealand Region
| | | | | | | | | | | | |
Income Statement ($m) | | 2009 | | | 2008 | | | Movt | |
Net interest income | | | 1,879 | | | | 1,705 | | | | 10 | % |
Other external operating income | | | 759 | | | | 855 | | | | -11 | % |
| | | | | | | | | | | | |
Operating income | | | 2,638 | | | | 2,560 | | | | 3 | % |
Operating expenses | | | (1,182 | ) | | | (1,175 | ) | | | 1 | % |
| | | | | | | | | | | | |
Profit before credit impairment and income tax | | | 1,456 | | | | 1,385 | | | | 5 | % |
Provision for credit impairment | | | (727 | ) | | | (251 | ) | | | large | |
| | | | | | | | | | | | |
Profit before income tax | | | 729 | | | | 1,134 | | | | -36 | % |
Income tax expense | | | (216 | ) | | | (361 | ) | | | -40 | % |
| | | | | | | | | | | | |
Underlying profit | | | 513 | | | | 773 | | | | -34 | % |
| | | | | | | | | | | | |
Adjustments between statutory profit and underlying profit1 | | | (354 | ) | | | 58 | | | | large | |
| | | | | | | | | | | | |
Profit | | | 159 | | | | 831 | | | | -81 | % |
| | | | | | | | | | | | |
| 1 | Adjusted for material items that are not part of the normal ongoing operations of the Group including one-off gains and losses, gains and losses on the sale of businesses, non-continuing businesses, timing differences on economic hedges, and acquisition related costs. Refer page 6. |
Profit decreased 81% impacted by negative adjustments between statutory profit and underlying profit of $412 million, principally tax provisioning on Conduits and the ING investor settlement. After excluding adjustments to arrive at statutory profit, underlying profit reduced 34%, largely driven by a $344 million after tax increase in credit impairment expense, with credit cycle impacts felt across all businesses. Operating income in the New Zealand Businesses declined 7%, with lending growth constrained by de-leveraging underway in the consumer and business sectors, and net interest margin contracting as a result of deposit competition. The Institutional business, however, delivered a 33% increase in revenue, with Markets taking advantage of opportunities presented by volatility during the first half.
| • | | Net interest income increased 10%. After adjusting for a $185 million increase in net interest income from derivative and liquidity positions that was offset by a decrease in trading income, net interest income was down 1%. The result was driven by a strong contribution from positioning the balance sheet (mismatch earnings) and earnings on higher levels of retained capital, moderated by margin contraction of 26 basis points in our core Retail and Commercial businesses. Margin contraction reflected intensified competition for deposits driven by increased wholesale funding spreads, and the delay in passing these costs on due to the predominance of fixed rate mortgages in the lending book, as well as adverse break costs on mortgages as customers take advantage of falling interest rates. |
| • | | Excluding the change in composition of the derivative and liquidity result referred to above, other external operating income increased 10%, largely reflecting a strong Markets result. |
| • | | Operating expenses increased 1%. Costs have been well managed, reflecting benefits from business transformation strategies that have been in place over the last year, as well as from strong control of discretionary expenditure. These have offset the increase in costs from the acquisition of a subsidiary as part of a debt restructure, higher remuneration costs in Institutional and higher business transformation costs. |
| • | | Provision for credit impairment charge increased $476 million as a result of credit cycle impacts across the businesses. The individual provision charge increased $349 million, reflecting an increase in loss rate from the relatively low level of 20 basis points in the 2008 year to 64 basis points in 2009. This was largely from general deterioration across the book, with the largest increase in the Commercial businesses, albeit from relatively low levels in 2008. An increase of $42 million in Institutional largely related to a single name exposure. The collective provision charge increased $130 million with the largest increases in the Commercial businesses as a result of economic cycle risk adjustments booked in the second half. The total provision coverage (ratio of total provisions held to credit risk weighted assets) at September 2009 was strong at 2.12%, up from 1.11% in 2008. |
14ANZ Annual Report 2009
CHIEF FINANCIAL OFFICER’S REPORT (continued)
Institutional Division
(Global line of business, also included in each of the regions discussed on pages 12 to 14).
| | | | | | | | | | | | |
Income Statement ($m) | | 2009 | | | 2008 | | | Movt | |
Net interest income | | | 3,041 | | | | 1,823 | | | | 67 | % |
Other operating income | | | 1,907 | | | | 1,801 | | | | 6 | % |
| | | | | | | | | | | | |
Operating income | | | 4,948 | | | | 3,624 | | | | 37 | % |
Operating expenses | | | (1,583 | ) | | | (1,245 | ) | | | 27 | % |
| | | | | | | | | | | | |
Profit before credit impairment and income tax | | | 3,365 | | | | 2,379 | | | | 41 | % |
Provision for credit impairment | | | (1,408 | ) | | | (1,281 | ) | | | 10 | % |
| | | | | | | | | | | | |
Profit before income tax | | | 1,957 | | | | 1,098 | | | | 78 | % |
Income tax expense and minority interest | | | (556 | ) | | | (327 | ) | | | 70 | % |
| | | | | | | | | | | | |
Underlying profit | | | 1,401 | | | | 771 | | | | 82 | % |
| | | | | | | | | | | | |
Profit after tax increased $630 million or 82% to $1,401 million for the year ended 30 September 2009.
The refocus on Institutional’s global client segment propositions drove revenue in areas of core client demand. Interest rate and general market volatility and increased customer focus delivered Global Markets trading and sales revenue growth of 77%. Transaction Banking revenue grew by 12% and Specialised Lending revenue grew by 23%. Net lending assets fell by 18% during the year, where an increase in equity raisings in capital markets and a general response to the economic environment prompted the pay down of lending. Net interest margin (excluding cash flow on derivatives) increased by 32 basis points in response to widening credit spreads and repricing for risk. Customer deposits increased by $12.5 billion during the year reflecting our focus on core client needs in a volatile environment while reducing reliance on wholesale borrowing. Expenses grew by 27% reflecting the investment in the “Rebuild and Refocus” program and building our client franchises particularly in Asia where employee numbers increased by 188 to support business growth in that region. In addition, remuneration costs increased associated with attracting experienced bankers and specialist staff.
Provision for credit impairment was up 10%. Individual provisions of $1.5 billion were predominantly in Australia in the first half, largely related to securities lending, property exposures, agribusiness and a limited number of corporate names. This was offset in part by a net release of collective provision of $136 million, reflecting the release of some of the $300 million concentration risk and economic cycle collective provision booked in the prior financial year for exposures to financial services and property sectors which crystallised during the year, lower volumes and allowance for concentration risks at the end of the year. Net non performing loans grew to $1.8 billion, although the rate of growth slowed significantly in the second half.
Significant factors affecting the result were as follows:
| • | | Global Markets revenue increased 77% to $2.2 billion with strong trading and sales revenues generated in a volatile market. |
| • | | Net interest margin increased by 69 basis points to 2.05%. Excluding the impact of higher funding benefits associated with unrealised trading gains (offset by an equivalent decrease in trading income), net interest margin increased 32 basis points reflecting widening spreads and repricing for risk. |
| • | | Asia Pacific, Europe & America revenue increased reflecting strategic investment in the region. |
| • | | New Zealand revenue growth was 33%, despite poor local economic conditions. Revenue growth was driven mainly by Global Markets. |
Chief Financial Officer’s Report 15
Ten Year Summary
| | | | | | | | | | | | | | | | | | |
| | | | | 2009
$m | | | 2008
$m | | | 2007
$m | | | 2006
$m | |
Financial Performance1 | | | | | | | | | | | | | | | | |
Net interest income | | | 9,810 | | | | 7,855 | | | | 7,302 | | | | 6,943 | |
Other operating income | | | 4,557 | | | | 4,440 | | | | 3,765 | | | | 3,146 | |
Operating expenses | | | (6,068 | ) | | | (5,406 | ) | | | (4,953 | ) | | | (4,605 | ) |
Profit before income tax, credit impairment and non-core items1 | | | 8,299 | | | | 6,889 | | | | 6,114 | | | | 5,484 | |
Provision for credit impairment | | | (3,056 | ) | | | (2,090 | ) | | | (567 | ) | | | (407 | ) |
Income tax expense | | | (1,469 | ) | | | (1,365 | ) | | | (1,616 | ) | | | (1,486 | ) |
Minority interest | | | (2 | ) | | | (8 | ) | | | (7 | ) | | | (4 | ) |
| | | | | | | | | | | | | | | | | | |
Underlying profit1 | | | 3,772 | | | | 3,426 | | | | 3,924 | | | | 3,587 | |
Adjustments between statutory profit and underlying profit1 | | | (829 | ) | | | (107 | ) | | | 256 | | | | 101 | |
| | | | | | | | | | | | | | | | | | |
Profit attributable to shareholders of the Company | | | 2,943 | | | | 3,319 | | | | 4,180 | | | | 3,688 | |
| | | | | | | | | | | | | | | | | | |
Financial Position | | | | | | | | | | | | | | | | |
Assets2 | | | 476,987 | | | | 470,293 | | | | 392,773 | | | | 334,640 | |
Net Assets | | | 32,429 | | | | 26,552 | | | | 22,048 | | | | 19,906 | |
Tier 1 capital ratio3 | | | 10.6 | % | | | 7.7 | % | | | 6.7 | % | | | 6.8 | % |
Return on average ordinary equity4,5 | | | 10.3 | % | | | 14.5 | % | | | 20.9 | % | | | 20.7 | % |
Return on average assets4 | | | 0.6 | % | | | 0.8 | % | | | 1.2 | % | | | 1.1 | % |
Cost to income ratio6 | | | 42.2 | % | | | 44.0 | % | | | 44.9 | % | | | 45.6 | % |
| | | | | | | | | | | | | | | | | | |
Shareholder value – ordinary shares | | | | | | | | | | | | | | | | |
Total return to shareholders | | | | | | | | | | | | | | | | |
(share price movement plus dividends) | | | 40.3 | % | | | -33.5 | % | | | 15.6 | % | | | 17.1 | % |
Market capitalisation | | | 61,085 | | | | 38,263 | | | | 55,382 | | | | 49,331 | |
Dividend | | | 102c | | | | 136c | | | | 136c | | | | 125c | |
| Franked portion | | –interim | | | 100 | % | | | 100 | % | | | 100 | % | | | 100 | % |
| | – final | | | 100 | % | | | 100 | % | | | 100 | % | | | 100 | % |
| Share price7 | | – high | | $ | 24.99 | | | $ | 31.74 | | | $ | 31.50 | | | $ | 28.66 | |
| | – low | | $ | 11.83 | | | $ | 15.07 | | | $ | 25.75 | | | $ | 22.70 | |
| | –30 Sep | | $ | 24.39 | | | $ | 18.75 | | | $ | 29.70 | | | $ | 26.86 | |
| | | | | | | | | | | | | | | | | | |
Share information | | | | | | | | | | | | | | | | |
(per fully paid ordinary share) | | | | | | | | | | | | | | | | |
Earnings per share7 | | | 131.0c | | | | 170.4c | | | | 224.1c | | | | 200.0c | |
Dividend payout ratio8 | | | 82.3 | % | | | 82.7 | % | | | 60.9 | % | | | 62.6 | % |
Net tangible assets per ordinary share9 | | $ | 11.02 | | | $ | 10.72 | | | $ | 9.36 | | | $ | 8.53 | |
No. of fully paid ordinary shares issued (millions) | | | 2,504.5 | | | | 2,040.7 | | | | 1,864.7 | | | | 1,836.6 | |
Dividend Reinvestment Plan (DRP) issue price | | | | | | | | | | | | | | | | |
| | –interim | | $ | 15.16 | | | $ | 20.82 | | | $ | 29.29 | | | $ | 26.50 | |
| | – final | | | — | | | $ | 13.58 | | | $ | 27.33 | | | $ | 28.25 | |
| | | | | | | | | | | | | | | | | | |
Other information | | | | | | | | | | | | | | | | |
Points of representation10 | | | 1,352 | | | | 1,340 | | | | 1,327 | | | | 1,265 | |
No. of employees (full time equivalents) | | | 37,687 | | | | 36,925 | | | | 34,353 | | | | 32,256 | |
No. of shareholders11 | | | 396,181 | | | | 376,813 | | | | 327,703 | | | | 291,262 | |
| | | | | | | | | | | | | | | | | | |
| 1 | Adjusted for material items that are not part of the normal ongoing operations of the Group including one-off gains and losses, gains and losses on the sale of businesses, non-continuing businesses timing differences on economic hedges, and acquisition related costs, refer page 6. Prior to 2009 these were adjustments to arrive at cash profit in accordance with market convention. |
| 2 | From 2000 to 2001, consolidated assets include the statutory funds of ANZ Life as required by an accounting standard. For the year 2004, consolidated assets include the statutory funds of NBNZ Life Insurance Limited. ANZ Life was sold in May 2002 and NBNZ Life Insurance was sold on 30 September 2005. |
| 3 | Calculated in accordance with Australian Prudential Regulation Authority requirements effective at the relevant date. Basel II has been applied from 1 January 2008. |
| 4 | Excludes minority interest. The 2005 ratio has been calculated on an IFRS basis that is comparable with that of 2006. |
| 5 | For the periods 2000 to 2002, the return on average ordinary equity calculation accrues the dividend over the year. From 2003, dividends may no longer be accrued and are not included in the calculation of return on average ordinary equity. |
16ANZ Annual Report 2009
TEN YEAR SUMMARY (continued)
| | | | | | | | | | | | | | | | | | | | | | |
| | | | Previous AGAAP | |
2005 $m | | | 2004
$m | | | 2003
$m | | | 2002
$m | | | 2001
$m | | | 2000
$m | |
| | | | | | | | | | | | | | | | | | | | | | |
| | 6,371 | | | | 5,252 | | | | 4,311 | | | | 4,018 | | | | 3,833 | | | | 3,801 | |
| | 2,935 | | | | 3,267 | | | | 2,808 | | | | 2,796 | | | | 2,573 | | | | 2,583 | |
| | (4,340 | ) | | | (4,005 | ) | | | (3,228 | ) | | | (3,153 | ) | | | (3,092 | ) | | | (3,314 | ) |
| | 4,966 | | | | 4,514 | | | | 3,891 | | | | 3,661 | | | | 3,314 | | | | 3,070 | |
| | (565 | ) | | | (632 | ) | | | (614 | ) | | | (610 | ) | | | (531 | ) | | | (502 | ) |
| | (1,247 | ) | | | (1,147 | ) | | | (926 | ) | | | (880 | ) | | | (911 | ) | | | (863 | ) |
| | (3 | ) | | | (4 | ) | | | (3 | ) | | | (3 | ) | | | (2 | ) | | | (2 | ) |
| | | | | | | | | | | | | | | | | | | | | | |
| | 3,151 | | | | 2,731 | | | | 2,348 | | | | 2,168 | | | | 1,870 | | | | 1,703 | |
| | 24 | | | | 84 | | | | — | | | | 154 | | | | — | | | | 44 | |
| | | | | | | | | | | | | | | | | | | | | | |
| | 3,175 | | | | 2,815 | | | | 2,348 | | | | 2,322 | | | | 1,870 | | | | 1,747 | |
| | | | | | | | | | | | | | | | | | | | | | |
| | | | | | | | | | | | | | | | | | | | | | |
| | 300,885 | | | | 259,345 | | | | 195,591 | | | | 183,105 | | | | 185,493 | | | | 172,467 | |
| | 19,538 | | | | 17,925 | | | | 13,787 | | | | 11,465 | | | | 10,551 | | | | 9,807 | |
| | 6.9 | % | | | 6.9 | % | | | 7.7 | % | | | 7.9 | % | | | 7.5 | % | | | 7.4 | % |
| | 18.3 | % | | | 19.1 | % | | | 20.6 | % | | | 21.6 | % | | | 20.2 | % | | | 19.3 | % |
| | 1.1 | % | | | 1.2 | % | | | 1.2 | % | | | 1.3 | % | | | 1.1 | % | | | 1.1 | % |
| | 46.6 | % | | | 45.3 | % | | | 45.1 | % | | | 46.0 | % | | | 48.0 | % | | | 51.7 | % |
| | | | | | | | | | | | | | | | | | | | | | |
| | | | | | | | | | | | | | | | | | | | | | |
| | | | | | | | | | | | | | | | | | | | | | |
| | 32.6 | % | | | 17.0 | % | | | 6.7 | % | | | 15.3 | % | | | 26.2 | % | | | 36.3 | % |
| | 43,834 | | | | 34,586 | | | | 27,314 | | | | 26,544 | | | | 23,783 | | | | 20,002 | |
| | 110c | | | | 101c | | | | 95c | | | | 85c | | | | 73c | | | | 64c | |
| | 100 | % | | | 100 | % | | | 100 | % | | | 100 | % | | | 100 | % | | | 100 | % |
| | 100 | % | | | 100 | % | | | 100 | % | | | 100 | % | | | 100 | % | | | 100 | % |
| $ | 24.45 | | | $ | 19.44 | | | $ | 18.45 | | | $ | 19.70 | | | $ | 16.71 | | | $ | 12.87 | |
| $ | 19.02 | | | $ | 15.94 | | | $ | 15.01 | | | $ | 15.23 | | | $ | 12.63 | | | $ | 9.18 | |
| $ | 24.00 | | | $ | 19.02 | | | $ | 17.17 | | | $ | 16.88 | | | $ | 15.28 | | | $ | 12.70 | |
| | | | | | | | | | | | | | | | | | | | | | |
| | | | | | | | | | | | | | | | | | | | | | |
| | | | | | | | | | | | | | | | | | | | | | |
| | 169.5c | | | | 153.1c | | | | 142.4c | | | | 141.4c | | | | 112.7c | | | | 102.5c | |
| | 65.0 | % | | | 67.5 | % | | | 64.2 | % | | | 57.8 | % | | | 62.0 | % | | | 59.1 | % |
| $ | 7.77 | | | $ | 7.51 | | | $ | 7.49 | | | $ | 6.58 | | | $ | 5.96 | | | $ | 5.49 | |
| | 1,826.4 | | | | 1,818.4 | | | | 1,521.7 | | | | 1,503.9 | | | | 1,488.3 | | | | 1,506.2 | |
| | | | | | | | | | | | | | | | | | | | | | |
| $ | 21.85 | | | $ | 17.84 | | | $ | 18.48 | | | $ | 19.24 | | | $ | 15.05 | | | $ | 11.62 | |
| $ | 23.85 | | | $ | 19.95 | | | $ | 16.61 | | | $ | 18.32 | | | $ | 18.33 | | | $ | 14.45 | |
| | | | | | | | | | | | | | | | | | | | | | |
| | | | | | | | | | | | | | | | | | | | | | |
| | 1,223 | | | | 1,190 | | | | 1,019 | | | | 1,018 | | | | 1,056 | | | | 1,087 | |
| | 30,976 | | | | 28,755 | | | | 23,137 | | | | 22,482 | | | | 22,501 | | | | 23,134 | |
| | 263,467 | | | | 252,072 | | | | 223,545 | | | | 198,716 | | | | 181,667 | | | | 179,829 | |
| | | | | | | | | | | | | | | | | | | | | | |
| 6 | Excludes non-core items. Periods prior to 2005 also exclude goodwill amortisation. The 2005 ratio has been calculated on an IFRS basis that is comparable with that of 2006. |
| 7 | Periods prior to 2004 adjusted for the bonus elements of the November 2003 Rights Issue. |
| 8 | From 2003, the dividend payout ratio includes the final dividend proposed but not provided for in accordance with changes to accounting standards effective from the September 2003 financial year. |
| 9 | Equals shareholders’ equity less preference share capital, goodwill, software and other intangible assets divided by the number of ordinary shares. For periods prior to 2005, this equals shareholders’ equity less preference share capital and unamortised goodwill divided by the number of ordinary shares. |
| 10 | Includes branches, offices, representative offices and agencies. |
| 11 | Excludes employees whose only ANZ shares are held in trust under ANZ employee share schemes. |
Ten Year Summary 17
Directors’ Report
The directors present their report together with the Financial Report of the consolidated entity (the Group), being Australia and New Zealand Banking Group Limited (the Company) and its controlled entities, for the year ended 30 September 2009 and the Independent Auditor’s Report thereon. The information is provided in conformity with the Corporations Act 2001.
Principal Activities
The Group provides a broad range of banking and financial products and services to retail, small business, corporate and institutional clients.
The Group conducts its operations primarily in Australia and New Zealand and the Asia Pacific region. It also operates in a number of other countries including the United Kingdom and the United States.
At 30 September 2009, the Group had 1,352 branches and other points of representation worldwide excluding Automatic Teller Machines (ATMs).
Result
Consolidated profit after income tax attributable to shareholders of the Company was $2,943 million, a decrease of 11% over the prior year.
Strong growth in profit before credit impairment and income tax of $922 million or 14% was offset by an increase in the provision for credit impairment of $1,057 million or 54% reflecting the challenging economic conditions evident in each of the regions, but most pronounced in New Zealand.
Balance sheet growth was curtailed with total assets increasing 1% and total liabilities were largely in line with prior year.
Movements within the major components include:
| • | | Net advances growth contracted by 1% with growth in Mortgages within Australia of $12.7 billion offset by a reduction in lending in Institutional Australia of $12.2 billion as corporates deleveraged. |
| • | | Customer deposits and other funding liabilities increased by 14%, reducing the reliance on short term wholesale funding. During 2009, $25.8 billion of term wholesale debt was raised. |
Further details are contained on pages 6 to 15 of this Annual Report.
Stateof Affairs
In the directors’ opinion, there have been no significant changes in the state of affairs of the Group during the financial year, other than:
Impaired financial assets – an increase in gross non-performing loans of $2.6 billion over 30 September 2008 mainly reflected a number of downgrades in Australia and New Zealand as deterioration in the economic environment resulted in a higher level of default. The rate of growth in impaired financial assets slowed in the second half of the financial year.
Capital raisings – ANZ ordinary shares of $2.5 billion were raised via an institutional placement, a further $2.2 billion through a Share Purchase Plan to existing shareholders, and the final 2008 dividend was fully underwritten.
Organisational structure – Esanda Finance Corporation Limited transitioned from a wholly owned subsidiary towards being a division of the Company and ANZ established a licensed banking branch in New Zealand.
Asia expansion – ANZ is continuing to progress its super regional growth strategy with further branch expansion in Indonesia and Vietnam. In addition, ANZ is the one of the first International banks to open a rural bank in Western China.
Refer also to ‘Events Since the End of the Financial Year’ below for details on acquisitions which are expected to occur in 2010.
Further review of matters affecting the Group’s state of affairs is also contained in the Chief Financial Officer’s Report on pages 6 to 15 of this Annual Report.
Dividends
The directors propose that a final fully franked dividend of 56 cents per fully paid ordinary share shall be paid on 18 December 2009. The proposed payment amounts to approximately $1,403 million.
During the financial year, the following fully franked dividends were paid on fully paid ordinary shares:
| | | | | | | | | | | | |
Type | | Cents
per share | | | Amount before bonus
option plan adjustment
$m | | | Date of
payment | |
Final 2008 | | | 74 | | | | 1,514 | | | | 18 December 2008 | |
Interim 2009 | | | 46 | | | | 993 | | | | 1 July 2009 | |
The proposed final dividend of 56 cents together with the interim dividend of 46 cents brings total dividends in relation to the year ended 30 September 2009 to 102 cents fully franked.
Review of Operations
Review of the Group during the financial year and the results of those operations, including an assessment of the financial position and business strategies of the Group, is contained in the Chairman’s Report, the Chief Executive Officer’s Report and the Chief Financial Officer’s Report on pages 2 to 15 of this Annual Report.
18ANZ Annual Report 2009
DIRECTORS’ REPORT (continued)
Events Since the End of the Financial Year
On 25 September 2009, the Company announced it had reached agreement with ING Groep to acquire ING Groep’s 51% shareholdings in the ANZ-ING wealth management and life insurance joint ventures in Australia and New Zealand for $1,760 million, taking its ownership interest to 100%. Completion is subject to various conditions, including regulatory approval, and is expected to occur during the fourth quarter of calendar 2009. Once completed, the acquisition will result in the Group fully consolidating the assets, liabilities and operations of ING Australia Limited (“INGA”) and ING (NZ) Holdings Limited (“INGNZ”) and its subsidiary companies into the Group’s results. At acquisition date, under the step acquisition provisions of AASB3R Business Combinations (Revised) which will come into effect in 2010, the Group will remeasure its existing 49% interests which are accounted for under the equity method at acquisition date fair values and will recognise the resulting gain or loss in the income statement.
On 4 August 2009 the Company announced it had reached agreement with Royal Bank of Scotland Group plc to acquire selected businesses in Taiwan, Singapore, Indonesia1, Hong Kong, Phillipines and Vietnam. The purchase price is based on the fully recapitalised net tangible book value of these businesses plus a premium of USD50 million and whilst the ultimate purchase price is not determinable until completion it is estimated to amount to approximately USD550 million (AUD626 million). Each acquisition is subject to regulatory approval in the relevant jurisdictions, which is expected to occur from late calendar 2009 through 2010. Accordingly these acquisitions are expected to be progressively consolidated into the 2010 results including the impacts of acquisition accounting, integration and acquisition costs.
| 1 | The Indonesian business will be acquired through ANZ’s 85% owned subsidiary P.T. Bank Pan Indonesia. |
FutureDevelopments
Details of likely developments in the operations of the Group and its prospects in future financial years are contained in this Annual Report under the Chairman’s Report. In the opinion of the directors, disclosure of any further information would be likely to result in unreasonable prejudice to the Group.
Environmental Regulation
ANZ recognises our obligations to our stakeholders – customers, shareholders, staff and the community – to operate in a way that advances sustainability and mitigates our environmental impact. Our commitment to improve our environmental performance is integral to successfully navigating responsible growth.
We acknowledge that we have an impact on the environment:
| • | | directly through the conduct of our business operations; and |
| • | | indirectly through the products and services that we procure and that we provide to our customers. |
As such, ANZ has established strategies and internal responsibilities for reducing the impact of our operations and business activities on the environment.
The operations of the Group become subject to environmental regulation when enforcing securities over land. ANZ has developed policies to manage such environmental risks.
Having made due enquiry, to the best of our knowledge, no member of the Group has incurred any material environmental liability during the year.
ANZ has historically made data publicly available on its direct and indirect emissions on an annual basis through our Corporate Responsibility Report as well as through other avenues such as the Carbon Disclosure Project. ANZ is also subject to two key pieces of legislation.
ANZ operations in Australia are categorised as a ‘high energy user’ under the Energy Efficiency Act 2006. ANZ has a mandatory obligation to identify energy efficiency opportunities and report to the Federal Government progress with the implementation of the opportunities identified. As required under the legislation, ANZ submitted a five year energy efficiency assessment plan and reports to the Government annually, every December, until the end of the five year reporting cycle in 2011.
The National Greenhouse Energy Reporting Act introduced in July 2008 has been designed to create a national framework for energy reporting including creating a baseline for emissions trading. The Act makes registration and reporting mandatory for corporations whose energy production, energy use, or greenhouse gas emissions trigger the specified corporate or facility threshold. ANZ is over the corporate threshold for this legislation and as a result we were required to submit our first report on 31 October 2009.
Directors’ Report19
DIRECTORS’ REPORT(continued)
Directors’ Qualifications, Experience and Special Responsibilities
At the date of this report, the Board comprises nine non-executive directors who have a diversity of business and community experience and one executive director, the Chief Executive Officer, who has extensive banking experience. The names of directors and details of their skills, qualifications, experience and when they were appointed to the Board are contained on pages 53 to 55 of this Annual Report.
Details of the number of Board and Board Committee meetings held during the year, directors’ attendance at those meetings, and details of directors’ special responsibilities are shown on pages 56 to 64 of this Annual Report.
Details of directorships of other listed companies held by each current director in the three years prior to the end of the 2009 financial year are listed on pages 53 to 55.
Company Secretaries’ Qualifications and Experience
Currently there are three people appointed as Company Secretaries of the Company. Details of their roles are contained on page 20. Their qualifications are as follows:
| • | | Bob Santamaria, BCom, LLB (Hons), |
Group General Counsel and Company Secretary.
Mr Santamaria joined ANZ in 2007. He had previously been a Partner at the law firm Allens Arthur Robinson since 1987. He was Executive Partner Corporate, responsible for client liaison with some of Allens Arthur Robinson’s largest corporate clients. Mr Santamaria brings to ANZ a strong background in leadership of a major law firm, together with significant experience in securities, mergers and acquisitions. He holds a Bachelor of Commerce and Bachelor of Laws (Honours) from the University of Melbourne. He is also an Affiliate of Chartered Secretaries Australia.
| • | | Peter Marriott, BEc (Hons), FCA |
Chief Financial Officer and Company Secretary.
Mr Marriott has been involved in the finance industry for more than 25 years. Mr Marriott joined ANZ in 1993. Prior to his career at ANZ, Mr Marriott was a Partner in the Melbourne office of the then KPMG Peat Marwick. He is a Fellow of a number of professional organisations including the Institute of Chartered Accountants in Australia and the Australian Institute of Banking and Finance. He is also a Member of the Australian Institute of Company Directors.
| • | | John Priestley, BEc, LLB, FCIS, |
Company Secretary.
Mr Priestley, a qualified lawyer, joined ANZ in 2004. Prior to ANZ, he had a long career with Mayne Group and held positions which included responsibility for the legal, company secretarial, compliance and insurance functions. He is a Fellow of Chartered Secretaries Australia and also a member of Chartered Secretaries Australia’s National Legislation Review Committee.
Non-audit Services
The Company’s Relationship with External Auditor Policy (which incorporates requirements of the Corporations Act 2001) states that the external auditor may not provide services that are perceived to be in conflict with the role of the auditor. These include consulting advice and sub-contracting of operational activities normally undertaken by management, and engagements where the auditor may ultimately be required to express an opinion on their own work.
Specifically the policy:
| • | | limits the non-audit services that may be provided; |
| • | | requires that audit and permitted non-audit services must be pre-approved by the Audit Committee, or pre-approved by the Chairman of the Audit Committee (or up to a specified amount by the Chief Financial Officer or the Group General Manager, Finance) and endorsed by the Audit Committee; and |
| • | | requires the external auditor to not commence an audit engagement (or permitted non-audit service) for the Group, until the Group has confirmed that the engagement has been pre-approved. |
Further details about the policy can be found in the Corporate Governance Statement on page 52.
The Audit Committee has reviewed a summary of non-audit services provided by the external auditor for 2009, and has confirmed that the provision of non-audit services for 2009 is consistent with the Company’s Relationship with External Auditor Policy and compatible with the general standard of independence for auditors imposed by the Corporations Act 2001. This has been formally advised to the Board of Directors.
The external auditor has confirmed to the Audit Committee that they have complied with the Company’s Relationship with External Auditor Policy on the provision of non-audit services by the external auditor for 2009.
20ANZ Annual Report 2009
DIRECTORS’ REPORT(continued)
The non-audit services supplied to the Group by the Group’s external auditor, KPMG, and the amount paid or payable by the Group by type of non-audit service during the year ended 30 September 2009 are as follows:
| | | | | | | | |
| | | Amount paid/payable
$’000’s | |
Non-audit service | | 2009 | | | 2008 | |
Market Risk benchmarking review | | | 75 | | | | — | |
Market Risk system capability review | | | 41 | | | | — | |
Training courses | | | 35 | | | | 70 | |
Accounting Advice | | | 17 | | | | — | |
ANZ Nominees confirmation procedures | | | — | | | | 28 | |
Due diligence agreed upon procedures | | | — | | | | 106 | |
Trustee certification | | | — | | | | 6 | |
| | | | | | | | |
Total | | | 168 | | | | 210 | |
| | | | | | | | |
For the reasons set out above, the directors are satisfied that the provision of non-audit services by the external auditor during the year ended 30 September 2009 is compatible with the general standard of independence for auditors imposed by the Corporations Act 2001.
LeadAuditor’s Independence Declaration
The lead auditor’s independence declaration given under section 307C of the Corporations Act 2001 is set out on page 51 and forms part of this Directors’ Report for the year ended 30 September 2009.
Directors and Officers who were Previously Partners of the Auditor
The following persons during the financial year were directors or officers of the Group and were partners of KPMG at a time when KPMG was the auditor of Australia and New Zealand Banking Group Limited:
| • | | Ms Margaret Jackson, Non-executive director who retired from the Board on 21 March 2009 (left KPMG in June 1992) |
| • | | Mr Peter Marriott, Chief Financial Officer (left KPMG in January 1993). |
Chief ExecutiveOfficer/Chief Financial Officer Declaration
The Chief Executive Officer and the Chief Financial Officer have given the declarations to the Board concerning the Group’s financial statements required under section 295A (2) of the Corporations Act 2001 and Recommendation 7.3 of the ASX Corporate Governance Principles and Recommendations.
Directors’ and Officers’ Indemnity
The Company’s Constitution (Rule 11.1) permits the Company to indemnify each officer or employee of the Company against liabilities (so far as may be permitted under applicable law) incurred in the execution and discharge of the officer’s or employee’s duties. It is the Company’s policy that its employees should not incur any liability for acting in the course of their employment legally, within the policies of the Company and provided they act in good faith.
Under the policy, the Company will indemnify employees against any liability they incur in carrying out their role. The indemnity protects employees and former employees who incur a liability when acting as an employee, trustee or officer of the Company, or a subsidiary of the Company at the request of the Company.
The indemnity is subject to applicable law and will not apply in respect of any liability arising from:
| • | | a claim by the Company; |
| • | | a claim by a related body corporate; |
| • | | serious misconduct, gross negligence, or a lack of good faith; |
| • | | illegal, dishonest or fraudulent conduct; or |
| • | | material non-compliance with the Company’s policies or discretions. |
The Company has entered into Indemnity Deeds with each of its directors, with certain secretaries of the Company, and with certain employees and other individuals who act as directors or officers of related body corporates or of another company. To the extent permitted by law, the Company indemnifies the individual for all liabilities, including costs, damages and expenses incurred in their capacity as an officer of the company to which they have been appointed.
The Company has indemnified the trustees and former trustees of certain of the Company’s superannuation funds and directors, former directors, officers and former officers of trustees of various Company sponsored superannuation schemes in Australia. Under the relevant Deeds of Indemnity, the Company must indemnify each indemnified person if the assets of the relevant fund are insufficient to cover any loss, damage, liability or cost incurred by the indemnified person in connection with the fund, being loss, damage, liability or costs for which the indemnified person would have been entitled to be indemnified out of the assets of the fund in accordance with the trust deed and the Superannuation Industry (Supervision) Act 1993. This indemnity survives the termination of the fund. Some of the indemnified persons are or were directors or executive officers of the Company.
Directors’ Report21
DIRECTORS’ REPORT(continued)
The Company has also indemnified certain employees of the Company, being trustees and administrators of a trust, from and against any loss, damage, liability, tax, penalty, expense or claim of any kind or nature arising out of or in connection with the creation, operation or dissolution of the trust or any act or omission performed or omitted by them in good faith and in a manner that they reasonably believed to be within the scope of the authority conferred by the trust.
Except for the above, neither the Company nor any related body corporate of the Company has indemnified or made an agreement to indemnify any person who is or has been an officer or auditor of the Company or of a related body corporate.
During the financial year, and again since the end of the financial year, the Company has paid a premium for an insurance policy for the benefit of the directors and employees of the Company and related bodies corporate of the Company. In accordance with common commercial practice, the insurance policy prohibits disclosure of the nature of the liability insured against and the amount of the premium.
Rounding of Amounts
The Company is a company of the kind referred to in Australian Securities and Investments Commission class order 98/100 (as amended) pursuant to section 341(1) of the Corporations Act 2001.
As a result, amounts in this Directors’ Report and the accompanying financial statements have been rounded to the nearest million dollars except where otherwise indicated.
Executive Officers’ and Employee Share Options
Details of share options issued over shares granted to the Chief Executive Officer and disclosed executives, and on issue as at the date of this report are detailed in the Remuneration Report.
Details of share options issued over shares granted to employees and on issue as at the date of this report are detailed in note 46 of the 2009 Financial Report.
Details of shares issued as a result of the exercise of options granted to employees as at the date of this report are detailed in note 46 of the 2009 Financial Report.
No person entitled to exercise any option has or had, by virtue of an option, a right to participate in any share issue of any other body corporate. The names of all persons who currently hold options are entered in the register kept by the Company pursuant to section 170 of the Corporations Act 2001. This register may be inspected free of charge.
22 ANZ Annual Report 2009
REMUNERATION REPORT
Contents
Remuneration Report23
REMUNERATION REPORT(Unaudited)(continued)
Remuneration Overview
This overview has been written to provide you with a clear and simple summary of ANZ’s remuneration structure and the actual value derived from the various remuneration components by executives in 2008/09. Detailed data is provided in the Directors’ Remuneration Report on pages 27-51.
Remuneration Structure
NON-EXECUTIVE DIRECTORS
Full details of the fees paid to Non-Executive Directors (NEDs) in 2008/09 are provided on page 32 of the Remuneration Report. In summary, NEDs receive a base fee for being a director of the Board and additional fees for either chairing or being a member of a committee, working on special committees and/or for serving on a subsidiary board. They do not receive any performance/incentive payments and are not eligible to participate in any of the Group’s incentive arrangements.
CEO AND EXECUTIVES
ANZ’s remuneration framework is designed to create and enhance value for all ANZ stakeholders and to ensure there is strong alignment between the short and long term interests of shareholders and executives. A key feature of ANZ’s reward structure is the role it plays in helping drive ANZ’s strategy to build a culture of out-performance with integrity, by ensuring differentiation of rewards and recognition of key contributors. To achieve this, remuneration for the CEO and Executives is comprised of:
Fixed pay:This is the only ‘guaranteed’ part of the remuneration package. ANZ positions fixed pay for Executives against the median of the relevant financial services market.
Short Term Incentive (STI):The STI provides an annual opportunity for an incentive award if certain company and individual objectives are met and there have been no inappropriate behaviour or risk/ compliance/audit breaches.
Long Term Incentive (LTI): The LTI provides an annual opportunity for an equity award that aligns a significant portion of overall remuneration to shareholder value over the longer term.
2009 Actual Remuneration Outcomes
NON-EXECUTIVE DIRECTORS
In 2008 the Board agreed not to increase the NED fees for 2008/09. As a result, the fee structure has been maintained at 2008 levels for the current year.
CEO
Fixed Pay:The level of fixed annual pay for the CEO was set for three years at $3 million on his commencement in October 2007. This will be reviewed in October 2010.
Short Term Incentive (STI): The CEO has an annual opportunity to receive a bonus payment equivalent to the value of his fixed remuneration, i.e. $3 million if targets are met. The actual amount paid can increase or decrease from this target dependent on Group and individual performance. The CEO’s STI payment for the 2009 year has been determined having regard to both the company’s underlying profit for the current year as well as the significant progress achieved in relation to ANZ’s long-term strategic goals. The STI will be $4.5 million with $2.4 million paid in cash and the balance awarded as deferred shares. Half the deferred shares will be restricted for 1 year and half for 2 years.
Special Equity Allocation: At the 2008 Annual General Meeting, shareholders approved an additional grant of 700,000 options to the CEO at an exercise price of $14.18 and with a vesting date of 18 December 2011. At grant the options were valued at $2.27 each, i.e. a total value of $1.589 million. These options will only have any value if, at the vesting date or during the subsequent exercise period (i.e. 2 years after vesting), the share price exceeds $14.18. This value will be the difference between the exercise price ($14.18) and the price on the vesting date (as long as it is greater than $14.18) multiplied by the total number of options. No options have been granted in respect of the 2009 year.
Long Term Incentive (LTI): Three tranches of performance rights were provided to the CEO in December 2007, covering his first three years in the role. The first of these tranches will be tested against a relative Total Shareholder Return (TSR) hurdle after 3 years, i.e. December 2010 and the other two will be tested in December 2011 and December 2012 respectively. Therefore, since joining ANZ as CEO on 1 October 2007 the CEO has received no benefit from these LTI grants and will only do so from December 2010 onwards and only if the performance hurdles have been met. There is no retesting of these grants.
In addition to his standard remuneration arrangements, the CEO was provided with additional equity as part of his original sign-on arrangements to recognise remuneration forgone from his previous employer in order to join ANZ. The CEO was offered $9 million on his commencement which could have been taken in cash but which he elected to take as shares, with one third vesting at his 1st, 2nd and 3rd anniversaries respectively. This equated to a total of 330,033 ANZ shares at the time of grant when the share price was $27.27. On 2 October 2008, 110,011 shares became available to the CEO, however, the value had declined significantly from the original grant value of $3 million to $2.097 million (based on the one day value weighted average price (VWAP) of $19.061 per share on 2 October 2008). The subsequent grants will vest on 2 October 2009 and 2010 respectively.
The following table, relating to the CEO, shows:
| • | | The actual amounts or grants made in respect of the year ended 30 September 2009; |
| • | | Any amounts which had to be deferred in respect of the year ended 30 September 2009; |
| • | | The actual amounts received in respect of the year ended 30 September 2009; and |
| • | | The actual amounts received in respect of prior year allocations. |
24 ANZ Annual Report 2009
REMUNERATION REPORT(Unaudited)(continued)
| | | | | | | | | | | | | | | | | | | | |
Chief Executive Officer (M Smith)4 | | Fixed Pay
($) | | | STI
($) | | | LTI5
($) | | | Other grants
/benefits
($) | | | TOTAL
($) | |
Amounts paid or granted in respect of 2008/09 year | | | 3,000,000 | | | | 4,500,000 | | | | 0 | | | | 1,594,000 | 2,3 | | | 9,094,000 | |
| | | | | | | | | | | | | | | | | | | | |
less amounts which must be deferred in respect of 2008/09 year | | | 0 | | | | 2,100,000 | | | | 0 | | | | 1,589,000 | 2 | | | 3,689,000 | |
| | | | | | | | | | | | | | | | | | | | |
Amount received – 2008/09 year | | | 3,000,000 | | | | 2,400,000 | | | | 0 | | | | 5,000 | 3 | | | 5,405,000 | |
| | | | | | | | | | | | | | | | | | | | |
Amount received – related to prior year allocations1 | | | | | | | | | | | | | | | | | | | 0 | |
| | | | | | | | | | | | | | | | | | | | |
| 1 | Includes prior year deferred STI/LTI components and/or equity grants which first became payable in the 2008/09 year. |
| 2 | Special equity grant – Dec 08 – 700,000 options valued @ $2.27 per option. |
| 3 | Provision of Australian taxation return services by PwC. |
| 4 | On commencement with ANZ, M Smith was granted three tranches of equity valued at $3 million each. The first of these tranches of deferred shares became available on 2 Oct 08 – price at vesting $19.0610 (based on 1 day VWAP as at 2 Oct 08). Therefore the value of this tranche at date of vesting was $2,096,920. This amount is not reflected in the table above as it relates to a specific equity arrangement associated with his commencement and is not a part of his standard remuneration arrangements. |
| 5 | LTI grants covering the CEO’s first three years in the role were granted on his commencement and, therefore, no further grant was made in the 2008/09 year – details of the LTI grants are provided in the LTI section above. No value was received from these LTI grants in the current year. Accordingly, no value for LTI is provided in the table as having been awarded or received in 2008/09. |
EXECUTIVES
Fixed pay:Some minor adjustments were made to fixed pay levels in October 2008. Subsequently, a review identified that ANZ’s current fixed remuneration levels for senior executives were at market. As a result of this review and also being cognisant of the need for restraint in the current climate, a decision was made earlier this year that a salary freeze would be effected for the 2009 remuneration review.
Short Term Incentive (STI):Executives have an opportunity to receive an on-target STI payment equivalent to 120% of their fixed pay, with top performers able to receive incentive payments well above the target level whereas poorer performers will receive a significantly reduced or no incentive payment at all. All incentives paid this year (paid in October 2008 but relating to FY2008 performance) were impacted by the company’s performance with reductions applied to the STI payments for each executive. The STI pool for the 2009 year has also been reduced below on-target levels, reflecting the link between performance and variable reward outcomes.
Historically, STI payments were paid in cash at the end of each year. However, in 2008 a deferral threshold level was established. Where the STI payment exceeds this threshold, Executives are required to take half of the payment in excess of the threshold in ANZ equity. The equity is subject to mandatory deferral, with half of the deferred equity unavailable for a 1 year period and the other half of the deferred equity unavailable for a 2 year period. This is designed to strengthen the link between the STI award and longer term alignment with shareholder interests. This change resulted in Executives receiving significantly less of their STI in cash with more deferred into equity than had been the case in the past. If an executive resigns or is terminated on notice from ANZ during the deferral period, the equity is forfeited.
Long Term Incentive (LTI): The target LTI for Executives is 50% of their fixed pay. This dollar value is converted into an actual number of performance rights using an independent and audited external valuation. These rights are subject to a relative TSR performance hurdle that compares ANZ’s performance with a selection of other comparable financial institutions over the three year period following the grant. If the hurdle is achieved, the shares are released and if not, they are forfeited. In the current year, the LTI grants made in 2005 and 2006 were tested in 2008 against the TSR performance of the comparator groups and as the performance hurdle was not achieved all of these rights were forfeited (i.e. Executives received no value at all).
Remuneration Report25
REMUNERATION REPORT(Unaudited) (continued)
The following table covers those disclosed Executives who were employed at the Executive level for the full year and details:
| • | | The actual amounts or grants made in respect of the year ended 30 September 2009; |
| • | | Any amounts which had to be deferred in respect of the year ended 30 September 2009; |
| • | | The actual amounts received in respect of the year ended 30 September 2009; and |
| • | | The actual amounts received in respect of prior year allocations. |
| | | | | | | | | | | | | | | | | | | | |
GMD, Operations, Technology and Shared Services (D Cartwright) | | Fixed Pay
($) | | | STI
($) | | | LTI
($) | | | Other grants
/ benefits
($) | | | TOTAL
($) | |
Amounts paid or granted in respect of 2008/09 year | | | 850,000 | | | | 730,000 | | | | 350,000 | | | | 128,977 | 3,4 | | | 2,058,977 | |
| | | | | | | | | | | | | | | | | | | | |
less amounts which must be deferred in respect of 2008/09 year | | | 0 | | | | 265,000 | | | | 350,000 | | | | 0 | | | | 615,000 | |
| | | | | | | | | | | | | | | | | | | | |
Amount received – 2008/09 year | | | 850,000 | | | | 465,000 | | | | 0 | | | | 128,977 | | | | 1,443,977 | |
| | | | | | | | | | | | | | | | | | | | |
Amount received – related to prior year allocations1 | | | | | | | | | | | | | | | | | | | 134,810 | |
| | | | | | | | | | | | | | | | | | | | |
| | | | | |
Deputy CEO and Acting CEO Australia (G Hodges) | | Fixed Pay
($) | | | STI
($) | | | LTI
($) | | | Other grants
/benefits
($) | | | TOTAL
($) | |
Amounts paid or granted in respect of 2008/09 year | | | 1,000,000 | | | | 860,000 | | | | 500,000 | | | | 145,940 | 4 | | | 2,505,940 | |
| | | | | | | | | | | | | | | | | | | | |
less amounts which must be deferred in respect of 2008/09 year | | | 0 | | | | 330,000 | | | | 500,000 | | | | 0 | | | | 830,000 | |
| | | | | | | | | | | | | | | | | | | | |
Amount received – 2008/09 year | | | 1,000,000 | | | | 530,000 | | | | 0 | | | | 145,940 | | | | 1,675,940 | |
| | | | | | | | | | | | | | | | | | | | |
Amount received – related to prior year allocations1 | | | | | | | | | | | | | | | | | | | 0 | |
| | | | | | | | | | | | | | | | | | | | |
| | | | | |
Chief Financial Officer (P Marriott) | | Fixed Pay
($) | | | STI
($) | | | LTI
($) | | | Other grants
/benefits
($) | | | TOTAL
($) | |
Amounts paid or granted in respect of 2008/09 year | | | 1,000,000 | | | | 850,000 | | | | 500,000 | | | | 0 | | | | 2,350,000 | |
| | | | | | | | | | | | | | | | | | | | |
less amounts which must be deferred in respect of 2008/09 year | | | 0 | | | | 325,000 | | | | 500,000 | | | | 0 | | | | 825,000 | |
| | | | | | | | | | | | | | | | | | | | |
Amount received – 2008/09 year | | | 1,000,000 | | | | 525,000 | | | | 0 | | | | 0 | | | | 1,525,000 | |
| | | | | | | | | | | | | | | | | | | | |
Amount received – related to prior year allocations1 | | | | | | | | | | | | | | | | | | | 0 | |
| | | | | | | | | | | | | | | | | | | | |
| | | | | |
Chief Risk Officer (C Page) | | Fixed Pay
($) | | | STI
($) | | | LTI
($) | | | Other grants
/benefits
($) | | | TOTAL
($) | |
Amounts paid or granted in respect of 2008/09 year | | | 850,000 | | | | 1,600,000 | | | | 425,000 | | | | 301,988 | 4 | | | 3,176,988 | |
| | | | | | | | | | | | | | | | | | | | |
less amounts which must be deferred in respect of 2008/09 year | | | 0 | | | | 700,000 | | | | 425,000 | | | | 0 | | | | 1,125,000 | |
| | | | | | | | | | | | | | | | | | | | |
Amount received – 2008/09 year | | | 850,000 | | | | 900,000 | | | | 0 | | | | 301,988 | | | | 2,051,988 | |
| | | | | | | | | | | | | | | | | | | | |
Amount received – related to prior year allocations1 | | | | | | | | | | | | | | | | | | | 0 | |
| | | | | | | | | | | | | | | | | | | | |
| | | | | |
CEO, Asia Pacific, Europe & America (A Thursby)2 | | Fixed Pay
($) | | | STI
($) | | | LTI
($) | | | Other grants
/benefits
($) | | | TOTAL
($) | |
Amounts paid or granted in respect of 2008/09 year | | | 1,000,000 | | | | 2,600,000 | | | | 550,000 | | | | 88,351 | 3,4 | | | 4,238,351 | |
| | | | | | | | | | | | | | | | | | | | |
less amounts which must be deferred in respect of 2008/09 year | | | 0 | | | | 1,200,000 | | | | 550,000 | | | | 0 | | | | 1,750,000 | |
| | | | | | | | | | | | | | | | | | | | |
Amount received – 2008/09 year | | | 1,000,000 | | | | 1,400,000 | | | | 0 | | | | 88,351 | | | | 2,488,351 | |
| | | | | | | | | | | | | | | | | | | | |
Amount received – related to prior year allocations1 | | | | | | | | | | | | | | | | | | | 0 | |
| | | | | | | | | | | | | | | | | | | | |
| 1 | Includes prior year deferred STI/LTI grants which first became payable in the 2008/09 year. |
| 2 | In addition to remuneration shown above, A Thursby received an equity grant in 2008/09 in accordance with his employment arrangements on joining ANZ. ANZ agreed to provide A Thursby with 3 separate tranches of deferred shares to the value of $1 million per annum. The first grant was made on 3 September 2007, the second on 28 August 2008 and the final tranche was granted on 22 September 2009. The shares are restricted and held in trust for three years from the date of allocation. |
| 3 | Taxation services provided by PricewaterhouseCoopers. |
| 4 | Relocation expenses and for G Hodges includes an annual leave payment on change of contracts on transfer from New Zealand to Australia. |
26ANZ Annual Report 2009
REMUNERATION REPORT(Audited)
Remuneration Report
The Directors’ Remuneration Report is designed to provide shareholders with an understanding of ANZ’s remuneration policies which relate to Key Management Personnel (KMP) as defined under the Corporations Act and the link between remuneration and ANZ’s performance, along with individual outcomes for ANZ’s Directors and Executives.
This Remuneration Report has been prepared in accordance with section 300A of the Corporations Act for the Company and the consolidated entity for the year ended 30 September 2009. The information provided in this Remuneration Report has been audited as required by section 308(3C) of the Corporations Act. This Remuneration Report forms part of the Directors’ Report.
Board Oversight of Remuneration
The Board Human Resources (HR) Committee has responsibility for director and executive remuneration, executive succession, and for making recommendations to the Board on remuneration and succession matters related to the CEO (refer to page 62 of the Corporate Governance Report for more details about the Committee’s role, and anz.com > about ANZ > Corporate Governance > ANZ Human Resources Committee Charter, which details the terms of reference under which the Committee operates).
On a number of occasions throughout the year, both the Board HR Committee and management received advice from external providers. (The following advisors were used: Ernst & Young, Hay Group, Freehills and PricewaterhouseCoopers.) The Board’s decisions were made independently using the advice provided and having careful regard to ANZ’s position, strategic objectives and current requirements.
Non-Executive Directors
Throughout this report specific disclosures are provided in relation to the remuneration of the Non-Executive Directors (NEDs) set out in Table 1, who fall within the definition of KMP of the Company and of the Group.
TABLE 1: NON EXECUTIVE DIRECTORS
| | |
| Current Non-Executive Directors | | |
| C Goode | | Chairman, Independent Non-Executive Director – Appointed Director July 1991; |
| | appointed Chairman August 1995 |
| G Clark | | Independent Non-Executive Director – Appointed February 2004 |
| J Ellis | | Independent Non-Executive Director – Appointed October 1995 |
| P Hay | | Independent Non-Executive Director – Commenced 12 November 2008 |
| H Lee | | Independent Non-Executive Director – Commenced 1 February 2009 |
| I Macfarlane | | Independent Non-Executive Director – Appointed February 2007 |
| D Meiklejohn | | Independent Non-Executive Director – Appointed October 2004 |
| J Morschel | | Independent Non-Executive Director – Appointed October 2004 |
| A Watkins | | Independent Non-Executive Director – Commenced 12 November 2008 |
| Former Non-Executive Director | | |
| M Jackson | | Independent Non-Executive Director – Appointed March 1994 – Retired 21 March 2009 |
Non-Executives Directors – Summary
| | | | |
Details | | Summary | | Discussion in Report |
| Fees | | NEDs receive a fixed base fee for being a director of the Board and additional fixed fees for either chairing or being a member of a committee, working on special committees and/or for serving on a subsidiary board. Superannuation contributions are also made at a rate of 9% (but only up to the Government’s prescribed maximum contributions cap). It was agreed that fees would not be increased for 2008/09. NEDs do not earn separate retirement benefits.1 | | Page 30 |
| | |
| Remuneration Outcomes | | Details of NED remuneration for 2008/09 including acquisitions under the NED Share Plan can be found in Table 6. | | Page 32 |
| 1 | The NED retirement scheme was closed effective 30 September 2005. Accrued entitlements were fixed at that time and will be carried forward until the retirement of the relevant NEDs. |
Remuneration Report 27
REMUNERATION REPORT(Audited) (continued)
Executives
Throughout this report specific disclosures are provided in relation to the remuneration of both the Chief Executive Officer (CEO) and other executives (i.e. those direct reports of the CEO with key responsibility for the strategic direction and management of a major revenue generating division or who control material revenue and expenses) who fall within the definition ofKMP of the Company and of the Group.
Also included are executives who are within the group of the five highest paid executives in the Company and the Group. This has been defined as the five highest paid, relevant group and company executives who participate in making decisions that affect the whole, or a substantial part, of the business of the company or who have the capacity to significantly affect the company’s financial standing.
Throughout this report the term “Executives” has been used to refer to these disclosed individuals. Details of these individuals are provided in Table 2.
ANZ operates a matrix structure with three geographic Divisions (Australia, New Zealand and Asia Pacific Europe & America) and three business segments (Retail, Wealth and Commercial) as well as the global Institutional client business. All of these are supported by enablement functions (e.g. Finance, Risk). This structure was introduced for the 2009 financial year (i.e. 1 October 2008), which has resulted in changes in position titles and roles for some Executives from those shown in the 2008 report.
TABLE 2: EXECUTIVES
| | |
Executive Director
Mike Smith | | Chief Executive Officer |
| Current Executives | | |
| David Cartwright | | Group Managing Director, Operations, Technology and Shared Services |
| Shayne Elliott | | Group Managing Director, Institutional – Appointed 1 June 2009 |
| Jenny Fagg | | Chief Executive Officer, New Zealand – Appointed 1 May 2009 |
| Graham Hodges | | Deputy Chief Executive Officer and Acting Chief Executive Officer, Australia – Appointed 4 May 2009 (previously Chief Executive Officer, New Zealand) |
| Peter Marriott | | Chief Financial Officer |
| Chris Page | | Chief Risk Officer |
| Alex Thursby | | Chief Executive Officer, Asia Pacific, Europe & America (previously Chief Executive Officer, Asia Pacific and Acting Group Managing Director, Institutional until 1 June 2009; Chief Executive Officer, Asia Pacific, Europe & America and Group Managing Director, Strategy 1 June – 9 August 2009) |
| Former Executives | | |
| Robert (Bob) Edgar | | Deputy Chief Executive Officer – Retired 8 May 2009 |
| Brian Hartzer | | Chief Executive Officer, Australia – Ceased employment 31 July 2009 |
| Peter Hodgson | | Former Group Managing Director, Institutional – Ceased employment 29 August 2008 |
28ANZ Annual Report 2009
REMUNERATION REPORT(Audited) (continued)
Executives – Summary
| | | | | | |
Details | | Summary | | Discussion in Report | |
| CEO | | The CEO is the only executive director at ANZ. The CEO’s remuneration arrangements are detailed separately in section 2.5. | | | Page 36 | |
| | |
| Fixed Remuneration | | This is the only ‘guaranteed’ part of the remuneration package. ANZ seeks to position its fixed remuneration for Executives against the median of the relevant financial services market in Australia. It has been agreed that there will be no increases to fixed remuneration in 2009 for Executives as part of the annual remuneration review. | | | Page 37 | |
| | |
| Short Term Incentives (STI) | | The STI plan is designed to drive out-performance by providing rewards that significantly differentiate individual achievement against targets. The STI provides an annual opportunity for an incentive award if certain company and individual objectives are met and there have been no inappropriate behaviour or risk/compliance/audit breaches. Half of the STI payment above a threshold level (currently $200,000) is subject to mandatory deferral into equity. 50% of the deferred portion vests after 1 year and 50% vests after 2 years. | | | Page 38 | |
| | |
| Long Term Incentives (LTI) | | The LTI provides alignment of a significant portion of remuneration to sustained growth in shareholder value over the longer term. Executives are granted Performance Rights which only vest if ANZ’s TSR hurdle relative to a peer group of comparator companies is achieved over the three year period from the date of grant. Performance equal to the median of the comparator group will result in half of the Performance Rights vesting. Achieving TSR above the median will result in further Performance Rights vesting, increasing on a straight line basis until ANZ’s TSR equals or exceeds the 75th percentile of the comparator group at which time all the Performance Rights vest. | | | Page 39 | |
| | |
| Other | | To ensure the interests of Executives continue to be aligned with those of shareholders, Executives are subject to a shareholding guideline which requires them to accumulate and maintain ANZ equity over a 5 year period equivalent to 200% of their fixed remuneration. To ensure equity remains at risk until vested, Executives are prohibited from hedging any unvested equity. ANZ has also extended its policy this year to prohibit Executives from providing ANZ securities in connection with a margin loan or similar financing arrangement. | | | Page 40 | |
| | |
| Contract Terms | | The contract terms for the CEO and other Executives are provided in Section 3. | | | Page 50 | |
1. Non-Executive Director Remuneration
1.1. BOARD POLICY ON REMUNERATION
Table 3 sets out the key principles that underpin the Board’s policy on NED remuneration.
TABLE 3: PRINCIPLES UNDERPINNING THE REMUNERATION POLICY FOR NEDS
| | |
Principle | | Comment |
| |
| Aggregate Board and Committee fees are within the maximum annual aggregate limit approved by shareholders | | The current aggregate fee pool for NEDs of $3.5 million was approved by shareholders at the 2008 Annual General Meeting. The increase from the previous cap of $3 million was considered necessary primarily to allow for the appointment of additional directors to the Board to enable appropriate succession management. The annual total of NEDs’ fees, including superannuation contributions, are within this agreed limit. NEDs are also eligible for other payments outside the limit such as reimbursement for business related expenses, including travel, and retirement benefits accrued as at September 2005. |
| |
| Fees are set by reference to key considerations | | Board and Committee fees are set by reference to a number of relevant considerations including: • general industry practice and best principles of corporate governance; • the responsibilities and risks attaching to the role of NED; • the time commitment expected of the NEDs on Group matters; • reference to fees paid to other NEDs of comparable companies; • and advice from external advisors. |
| |
| The remuneration structure preserves independence whilst aligning interests of NEDs and Shareholders | | So that independence and impartiality is maintained, fees are not linked to the performance of the Company and NEDs are not eligible to participate in any of the Group’s incentive arrangements. NEDS also have adopted Shareholding Guidelines (refer section 1.3). |
| |
| No Retirement Benefits | | NEDs do not accrue separate retirement benefits in addition to statutory superannuation entitlements. (Refer to Table 4 for details of preserved benefits for NEDs who participated in the NED retirement scheme prior to its closure in 2005). |
Remuneration Report 29
REMUNERATION REPORT(Audited) (continued)
1.2. COMPONENTS OF NON-EXECUTIVE DIRECTOR REMUNERATION
NEDs receive a fee for being a director of the Board, and additional fees for either chairing or being a member of a committee. The Chairman of the Board does not receive additional fees for service on Board Committees.
For the 2008/09 year, the Board has agreed not to increase fees from those applied in 2008. For details of remuneration paid to directors for the year ended 30 September 2009, refer to Table 6 in this Remuneration Report.
TABLE 4: COMPONENTS OF REMUNERATION FOR NEDS
| | | | | | |
Elements | | Details | | Included in
Fee Limit | |
| Board/Committee Fees | | For the year ended 30 September 2009 | | | Yes | |
| | | | | | | | |
Fees per annum are: | | Chairman | | | NED | |
Board | | $ | 783,000 | | | $ | 200,000 | |
Risk & Audit Committees | | $ | 52,000 | | | $ | 25,000 | |
HR Committee | | $ | 48,000 | | | $ | 21,000 | |
Governance & Technology Committees | | $ | 30,000 | | | $ | 10,000 | |
| | | | | | |
| Other fees/benefits | | Work on special committees or as a director on a subsidiary board may attract additional fees of an amount considered appropriate in the circumstances. | | | Yes | |
| | |
| Post-employment Benefits | | Superannuation contributions are made at a rate of 9% (but only up to the Government’s prescribed maximum contributions limit) which satisfies the company’s statutory superannuation contributions. | | | Yes | |
| | |
| | The NED retirement scheme was closed effective 30 September 2005. Accrued entitlements relating to the ANZ Directors’ Retirement Scheme were fixed at 30 September 2005 and NEDs had the option to convert these entitlements into ANZ shares. Such entitlements, either in ANZ shares or cash, will be carried forward and transferred to the NED when they retire (including interest accrued at the 30 day bank bill rate for cash entitlements). The accrued entitlements for current NEDs fixed under the ANZ Directors’ Retirement Scheme as at 30 September 2005 are as follows: | | | No | |
| | | | |
C Goode | | $ | 1,312,539 | |
G Clark | | $ | 83,197 | |
J Ellis | | $ | 523,039 | |
D Meiklejohn | | $ | 64,781 | |
J Morschel | | $ | 60,459 | |
| | | | | | |
| | The accrued entitlement for M Jackson at that time was $487,022. On M Jackson’s retirement in March 2009, a total payment of $604,392 was made to her for this entitlement and relevant interest. | | | | |
| | |
| Directors’ Share Plan | | ANZ operates the Directors’ Share Plan (the Plan). Under the Plan, both non-executive and executive directors were able to elect to sacrifice Fees in order to purchase ANZ shares. It has been agreed that from 1 October 2009, no new purchases will be made under the Plan, although existing shares will continue to be held in trust. As shares were purchased from remuneration forgone, they were not subject to performance conditions. Participation in the plan was voluntary. Shares acquired under the plan were purchased on market and were subject to a minimum 1 year restriction, during which the shares could not be traded. In the event of serious misconduct, all shares held in trust will be forfeited. All costs associated with the plan are met by the Company. | | | Yes | |
| | |
| | The Plan is not a performance-based share plan and is not intended as an incentive component of NED remuneration. | | | | |
30ANZ Annual Report 2009
REMUNERATION REPORT(Audited) (continued)
1.3. SHAREHOLDINGS OF NEDS
In recognising that ownership of Company shares aligns Directors’ interests with those of shareholders, Directors adopted shareholding guidelines in 2005. These guidelines provide for Directors to accumulate shares, over a five year period, to the value of 100% (200% for the Chairman) of the base annual NED Fee and to maintain this shareholding while a director of ANZ. Directors have agreed that where their holding is below this guideline they will direct a minimum of 25% of their fees each year toward achieving this shareholding.
The movement during the reporting period in shareholdings of NEDs (held directly, nominally and by related parties) is provided below:
TABLE 5: NED SHAREHOLDINGS
| | | | | | | | | | | | | | | | | | | | | | | | |
Name | | Balance as at
1 Oct 2008 | | | Shares acquired
during the year
in lieu of fees1 | | | Shares from
other changes
during the year2 | | | Balance as at
30 Sep 20093 | | | Balance as at
30 Sep 2009 as
a % of base fee4 | | | Balance as at
report sign-off
date | |
Current Non-Executive Directors | | | | | | | | | | | | | | | | | | | | | | | | |
C Goode | | | 738,279 | | | | — | | | | 34,972 | | | | 773,251 | | | | 9430 | % | | | 773,251 | |
G Clark | | | 12,479 | | | | — | | | | 1,042 | | | | 13,521 | | | | 165 | % | | | 13,521 | |
J Ellis | | | 140,381 | | | | 10,801 | | | | 3,161 | | | | 154,343 | | | | 1882 | % | | | 154,343 | |
P Hay6,7 | | | 2,963 | | | | 2,598 | | | | 1,445 | | | | 7,006 | | | | 85 | % | | | 7,006 | |
H Lee6 | | | — | | | | 1,575 | | | | — | | | | 1,575 | | | | 19 | % | | | 1,575 | |
I Macfarlane | | | 8,574 | | | | — | | | | 4,042 | | | | 12,616 | | | | 154 | % | | | 12,616 | |
D Meiklejohn | | | 15,156 | | | | — | | | | 1,042 | | | | 16,198 | | | | 198 | % | | | 16,198 | |
J Morschel | | | 10,677 | | | | 1,183 | | | | 1,042 | | | | 12,902 | | | | 157 | % | | | 12,902 | |
A Watkins6 | | | 15,000 | | | | 3,419 | | | | 1,042 | | | | 19,461 | | | | 237 | % | | | 19,461 | |
| | | | | | | | | | | | | | | | | | | | | | | | |
Former Non-Executive Directors | | | | | | | | | | | | | | | | | | | | | | | | |
M Jackson | | | 96,228 | | | | — | | | | 2,964 | | | | 99,192 | | | | | | | | n/a | 5 |
| | | | | | | | | | | | | | | | | | | | | | | | |
| 1 | All shares acquired in lieu of fees were done so under the Directors’ Share Plan (refer to section 1.2 of this Remuneration Report for an overview of the Directors’ Share Plan). |
| 2 | Shares from other changes during the year include the net result of any shares purchased/sold or acquired under the Dividend Reinvestment Plan or the ANZ Share Purchase Plan. |
| 3 | The following shares were nominally held as at 30 September 2009: C Goode – 424,843; G Clark – 13,521; J Ellis – 85,273; P Hay – 2,676; H Lee – 1,575; I Macfarlane – 2,574; D Meiklejohn – 13,698; J Morschel – 7,860; A Watkins – 18,419. |
| 4 | The value of shares has been calculated using the closing price on 30 September 2009 of $24.39. The percentage of base fee has been determined by comparing the share value against the current base annual NED fee of $200,000. |
| 5 | M Jackson’s shareholding is not provided as she is no longer a NED as at the report sign-off date. |
| 6 | Commencing balance is based on holdings as at the date of commencement as a NED. |
| 7 | P Hay acquired 1,600 ordinary shares on 2 November 2009 however these are excluded from the balance as at report sign-off date as settlement is due to occur on 6 November 2009. |
Remuneration Report 31
REMUNERATION REPORT(Audited) (continued)
1.4. REMUNERATION PAID TO NEDs
Remuneration details of NEDs for the years ended 30 September 2009 and 2008 are set out below in Table 6.
There is an increase in overall 2009 Total Remuneration for NEDs compared with 2008. This variation is primarily attributable to two factors:
| • | | the appointment of additional Directors during the year; and |
| • | | the termination benefit paid to M Jackson on her retirement from the Board comprised of the benefit accrued under the retirement scheme which existed prior to September 2005 |
There was no increase in actual fee levels so any individual changes can be primarily attributed to changes in representation on different committees. Refer to Section 1.2 for fee structure details.
TABLE 6: NED REMUNERATION FOR 2009 AND 2008
| | | | | | | | | | | | | | | | | | | | |
| | | Short-Term
Employee Benefits | |
| | | Financial
Year | | | Cash
salary/fees
$ | | | Value of shares
acquired in lieu of
cash salary/fees1
$ | | | Committee
fees (cash)
$ | | | Short term
incentive
$ | |
Current Non-Executive Directors | | | | | | | | | | | | | | | | | | | | |
| | | | | | | | | | | | | | | | | | | | |
C Goode (Appointed director July 1991;appointed Chairman August 1995) | | | 2009 | | | | 783,000 | | | | — | | | | — | | | | n/a | |
Independent Non-Executive Director, Chairman | | | 2008 | | | | 783,000 | | | | — | | | | — | | | | n/a | |
| | | | | | | | | | | | | | | | | | | | |
G Clark (Appointed February 2004) | | | 2009 | | | | 200,000 | | | | — | | | | 51,083 | | | | n/a | |
Independent Non-Executive Director | | | 2008 | | | | 142,900 | | | | 57,084 | | | | 40,000 | | | | n/a | |
| | | | | | | | | | | | | | | | | | | | |
J Ellis (Appointed October 1995) | | | 2009 | | | | 17,500 | | | | 182,429 | | | | 35,000 | | | | n/a | |
Independent Non-Executive Director | | | 2008 | | | | 177,860 | | | | 22,114 | | | | 35,000 | | | | n/a | |
| | | | | | | | | | | | | | | | | | | | |
P Hay (Appointed November 2008) | | | 2009 | | | | 139,500 | | | | 37,498 | | | | 30,975 | | | | n/a | |
Independent Non-Executive Director | | | | | | | | | | | | | | | | | | | | |
| | | | | | | | | | | | | | | | | | | | |
H Lee (Appointed February 2009) | | | 2009 | | | | 107,778 | | | | 24,995 | | | | 6,639 | | | | n/a | |
Independent Non-Executive Director | | | | | | | | | | | | | | | | | | | | |
| | | | | | | | | | | | | | | | | | | | |
I Macfarlane (Appointed February 2007) | | | 2009 | | | | 200,000 | | | | — | | | | 65,000 | | | | n/a | |
Independent Non-Executive Director | | | 2008 | | | | 152,000 | | | | 47,974 | | | | 65,000 | | | | n/a | |
| | | | | | | | | | | | | | | | | | | | |
D Meiklejohn (Appointed October 2004) | | | 2009 | | | | 200,000 | | | | — | | | | 87,000 | | | | n/a | |
Independent Non-Executive Director | | | 2008 | | | | 200,000 | | | | — | | | | 87,000 | | | | n/a | |
| | | | | | | | | | | | | | | | | | | | |
J Morschel (Appointed October 2004) | | | 2009 | | | | 180,000 | | | | 19,987 | | | | 73,000 | | | | n/a | |
Independent Non-Executive Director | | | 2008 | | | | 165,283 | | | | 47,974 | | | | 73,000 | | | | n/a | |
| | | | | | | | | | | | | | | | | | | | |
A Watkins (Appointed November 2008) | | | 2009 | | | | 127,313 | | | | 49,670 | | | | 54,960 | | | | n/a | |
Independent Non-Executive Director | | | | | | | | | | | | | | | | | | | | |
| | | | | | | | | | | | | | | | | | | | |
Former Non-Executive Directors | | | | | | | | | | | | | | | | | | | | |
| | | | | | | | | | | | | | | | | | | | |
M Jackson (Appointed March 1994;retired March 2009) | | | 2009 | | | | 94,444 | | | | — | | | | 34,472 | | | | n/a | |
Independent Non-Executive Director | | | 2008 | | | | 134,750 | | | | 65,234 | | | | 73,000 | | | | n/a | |
| | | | | | | | | | | | | | | | | | | | |
Total of all Non-Executive Directors5 | | | 2009 | | | | 2,049,535 | | | | 314,579 | | | | 438,129 | | | | n/a | |
| | | 2008 | | | | 1,755,793 | | | | 240,380 | | | | 373,000 | | | | n/a | |
| | | | | | | | | | | | | | | | | | | | |
| 1 | Shares acquired through participation in Directors’ Share Plan. The value reflects the fees forgone to purchase shares on market (amortisation is not applicable). |
| 2 | The termination benefit paid to M Jackson on her retirement from the Board relates to the benefit accrued under the retirement scheme which existed prior to September 2005 and interest on that benefit. |
| 3 | Amounts disclosed for remuneration of directors exclude insurance premiums paid by the consolidated entity in respect of directors’ and officers’ liability insurance contracts. The total premium, which cannot be disclosed because of confidentiality requirements, has not been allocated to the individuals covered by the insurance policy as, based on all available information, the directors believe that no reasonable basis for such allocation exists. |
| 4 | Other for J Ellis relates to car parking and office space. |
| 5 | Due to consistency of remuneration structure, the Remuneration details of the CEO (who is the only Executive Director) are included in Table 17 with other Executives. |
32ANZ Annual Report 2009
REMUNERATION REPORT(Audited) (continued)
| | | | | | | | | | | | | | | | | | | | | | | | | | |
| | | | | | | Post- Employment | | | Long-Term
Employee Benefits | | | Termination
Benefits2 | | | Share-Based
Payments | | | | |
Other
$ | | | Total
$ | | | Super
contributions
$ | | | Long service
leave accrued
during the year
$ | | | | | | Total amortisation
value of equity
$ | | | Total
Remuneration3
$ | |
| | | | | | | | | | | | | | | | | | | | | | | | | | |
| | | | | | | | | | | | | | | | | | | | | | | | | | |
| — | | | | 783,000 | | | | 13,924 | | | | n/a | | | | | | | | n/a | | | | 796,924 | |
| | — | | | | 783,000 | | | | 13,283 | | | | n/a | | | | | | | | n/a | | | | 796,283 | |
| | | | | | | | | | | | | | | | | | | | | | | | | | |
| | — | | | | 251,083 | | | | 13,924 | | | | n/a | | | | | | | | n/a | | | | 265,007 | |
| | — | | | | 239,984 | | | | 13,283 | | | | n/a | | | | | | | | n/a | | | | 253,267 | |
| | | | | | | | | | | | | | | | | | | | | | | | | | |
| | 18,085 | 4 | | | 253,014 | | | | 13,924 | | | | n/a | | | | | | | | n/a | | | | 266,938 | |
| | 17,982 | | | | 252,956 | | | | 13,283 | | | | n/a | | | | | | | | n/a | | | | 266,239 | |
| | | | | | | | | | | | | | | | | | | | | | | | | | |
| | — | | | | 207,973 | | | | 13,343 | | | | n/a | | | | | | | | n/a | | | | 221,316 | |
| | | | | | | | | | | | | | | | | | | | | | | | | | |
| | | | | | | | | | | | | | | | | | | | | | | | | | |
| | — | | | | 139,412 | | | | 10,149 | | | | n/a | | | | | | | | n/a | | | | 149,561 | |
| | | | | | | | | | | | | | | | | | | | | | | | | | |
| | | | | | | | | | | | | | | | | | | | | | | | | | |
| | — | | | | 265,000 | | | | 13,924 | | | | n/a | | | | | | | | n/a | | | | 278,924 | |
| | — | | | | 264,974 | | | | 13,283 | | | | n/a | | | | | | | | n/a | | | | 278,257 | |
| | | | | | | | | | | | | | | | | | | | | | | | | | |
| | — | | | | 287,000 | | | | 13,924 | | | | n/a | | | | | | | | n/a | | | | 300,924 | |
| | — | | | | 287,000 | | | | 13,283 | | | | n/a | | | | | | | | n/a | | | | 300,283 | |
| | | | | | | | | | | | | | | | | | | | | | | | | | |
| | — | | | | 272,987 | | | | 13,924 | | | | n/a | | | | | | | | n/a | | | | 286,911 | |
| | — | | | | 286,257 | | | | — | | | | n/a | | | | | | | | n/a | | | | 286,257 | |
| | | | | | | | | | | | | | | | | | | | | | | | | | |
| | — | | | | 231,943 | | | | 13,477 | | | | n/a | | | | | | | | n/a | | | | 245,420 | |
| | | | | | | | | | | | | | | | | | | | | | | | | | |
| | | | | | | | | | | | | | | | | | | | | | | | | | |
| | | | | | | | | | | | | | | | | | | | | | | | | | |
| | | | | | | | | | | | | | | | | | | | | | | | | | |
| — | | | | 128,916 | | | | 6,872 | | | | n/a | | | | 604,392 | | | | n/a | | | | 740,180 | |
| | — | | | | 272,984 | | | | 13,283 | | | | n/a | | | | — | | | | n/a | | | | 286,267 | |
| | | | | | | | | | | | | | | | | | | | | | | | | | |
| | 18,085 | | | | 2,820,328 | | | | 127,385 | | | | n/a | | | | 604,392 | | | | n/a | | | | 3,552,105 | |
| | 17,982 | | | | 2,387,155 | | | | 79,698 | | | | n/a | | | | — | | | | n/a | | | | 2,466,853 | |
| | | | | | | | | | | | | | | | | | | | | | | | | | |
Remuneration Report 33
REMUNERATION REPORT(Audited) (continued)
2. Executive Remuneration
2.1. REMUNERATION GUIDING PRINCIPLES
ANZ’s reward policy, approved by the Board, shapes the Group’s remuneration strategies and initiatives.
The following principles underpin ANZ’s reward policy for Executives:
| • | | Focus on creating and enhancing value for all ANZ stakeholders; |
| • | | Emphasis on “at risk” components of total rewards; |
| • | | Differentiation of individual rewards in line with ANZ’s culture of rewarding for out-performance, adherence to standards of behaviour and to risk and compliance policies and processes; and |
| • | | The provision of a competitive reward proposition to successfully attract, motivate and retain the highest quality individuals required to deliver ANZ’s business and growth strategies. |
2.2. PERFORMANCE OF ANZ
Sustained company performance over the long-term is a key focus for ANZ. The success of ANZ’s remuneration policy in aligning shareholder and executive rewards is demonstrated by the close correlation that exists between Company performance and the benefits derived by Executives from the ‘at-risk’ components of their remuneration over the past 5 years.
Table 7 shows ANZ’s annual performance over the five-year period spanning 1 October 2004 to 30 September 2009. The table illustrates the impact of ANZ’s performance on shareholder wealth, taking into account dividend payments, share price changes and other capital adjustments during the financial year.
TABLE 7: ANZ’S PERFORMANCE 2005 – 2009
| | | | | | | | | | | | | | | | | | | | |
| | | 2008/09 | | | 2007/08 | | | 2006/07 | | | 2005/06 | | | 2004/05 | |
Basic Earnings Per Share (EPS) | | | 131.0 | | | | 170.4 | | | | 224.1 | | | | 200.0 | | | | 169.5 | |
NPAT ($m) | | | 2,943 | | | | 3,319 | | | | 4,180 | | | | 3,688 | | | | 3,175 | |
Total Dividend (cps) | | | 102 | | | | 136 | | | | 136 | | | | 125 | | | | 110 | |
Share price at 30 September ($) | | | 24.39 | | | | 18.75 | | | | 29.70 | | | | 26.86 | | | | 24.00 | |
Total Shareholder Return (12 month %) | | | 40.3 | | | | -33.5 | | | | 15.6 | | | | 17.1 | | | | 32.6 | |
Underlying profit1 | | | 3,772 | | | | 3,426 | | | | 3,924 | | | | 3,587 | | | | 3,151 | |
| 1 | Underlying profit represents the directors’ assessment of the profit for the ongoing business activities of the Group, and is based on guidelines published by the Australian Institute of Company Directors and the Financial Services Institute of Australasia. ANZ applies this guidance by adjusting statutory profit for material items that are not part of the normal ongoing operations of the Group including one-off gains and losses, gains and losses on the sale of businesses, non-continuing businesses, timing differences on economic hedges, and acquisition related costs. Refer to page 6 for details of adjustments. |
Figure 1 compares ANZ’s TSR performance against the median TSR of the LTI comparator group and the S&P/ASX 200 Banks Accumulation Index over the 2005 to 2009 measurement period.
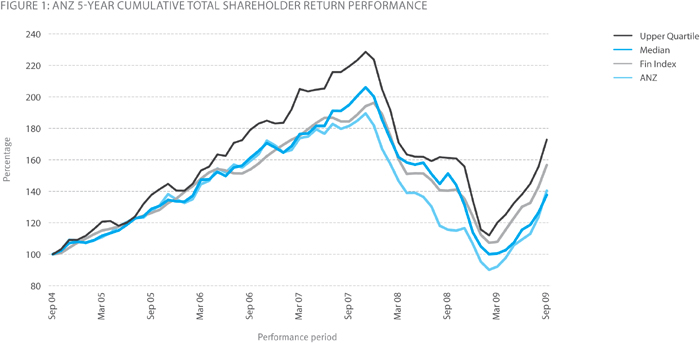
34ANZ Annual Report 2009
REMUNERATION REPORT(Audited) (continued)
FIGURE 2: ANZ – UNDERLYING PROFIT1 & AVERAGE STI PAYMENTS
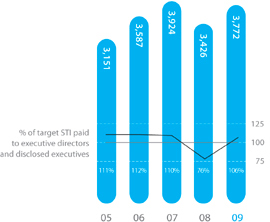
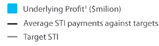
Figure 2 illustrates the relationship between the average actual STI payments against target and the Group’s performance measured using underlying profit over the last 5 years. The average STI payments for each year are based on those executives (including the CEO) disclosed in each relevant reporting period. As illustrated in the chart, the average STI payments are generally in alignment with the underlying profit trend, with the 2009 STI payments (as a percentage of target STI) trending upwards as a result of the increase in underlying profit.
| 1 | Underlying profit represents the directors’ assessment of the profit for the ongoing business activities of the Group, and is based on guidelines published by the Australian Institute of Company Directors and the Financial Services Institute of Australasia. ANZ applies this guidance by adjusting statutory profit for material items that are not part of the normal ongoing operations of the Group including one-off gains and losses, gains and losses on the sale of businesses, non-continuing businesses, timing differences on economic hedges, and acquisition related costs. Refer to page 6 for details of adjustments. |
2.3. REMUNERATION STRUCTURE OVERVIEW
The key aspects of ANZ’s remuneration strategy for Executives (including the CEO) is set out below:
REMUNERATION OBJECTIVES
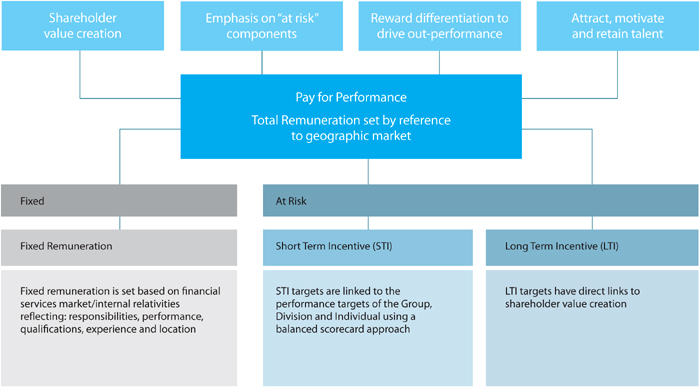
Remuneration Report35
REMUNERATION REPORT (Audited) (continued)
2.4. REMUNERATION COMPONENTS
The Board aims to achieve a balance between fixed and at-risk components of remuneration that reflects market conditions for each seniority level. The relative proportion of fixed and at-risk remuneration is as set out below:
TABLE 8: ANNUAL TOTAL REWARD MIX PERCENTAGE (% BASED ON AT TARGET LEVELS OF PERFORMANCE)
| | | | | | | | | | | | |
| | | Fixed | | | At Risk | |
| | | Fixed remuneration | | | STI | | | LTI | |
CEO | | | 33 | % | | | 33 | % | | | 33 | % |
Executives | | | 37 | % | | | 45 | %1 | | | 18 | % |
| 1 | The STI for all Executives is subject to mandatory deferral (refer to section 2.6.3 for details). |
The levels of reward within the remuneration structure are benchmarked against the financial services market median. However, the application of the structure allows for the opportunity to earn upper quartile variable pay for significant out performance, and significantly reduced or nil payment for underperformance. In this way the remuneration structure reflects “reward for performance”.
2.5. CEO REMUNERATION
The components of the CEO’s remuneration package are substantially the same as other Executives. However, there are some differences in the quantum, delivery and timing of the CEO’s arrangements. In the interests of clarity and in order to ensure a thorough understanding of the arrangements that are in place for the CEO, the following table provides a summary of these arrangements as well as cross references to other sections of the report where these arrangements are outlined in further detail.
| | | | |
Details | | Summary | | Discussion in
Report |
| Fixed Remuneration | | The level of fixed pay for the CEO was set at $3 million on his commencement in 2007. It was agreed this would be held constant for the first three years until October 2010 and will be subject to annual review from that time. | | |
| | |
| Short-Term Incentives (STI) | | The CEO has an annual opportunity to receive an incentive payment equivalent to the value of his fixed remuneration, i.e. $3 million if targets are met. The actual amount paid can increase or decrease from this number dependent on performance. The actual incentive payment paid in November 2008, but which related to the year ended 30 September 2008, was $2.4 million. (In addition the CEO received a Special Equity Allocation – detailed below). | | STI – Refer Page 38 |
| | |
| | The Board approved the CEO’s 2009 balanced scorecard at the start of the year and then assessed his performance against these objectives at the end of the 2009 year to determine the appropriate incentive (relative to target). As per the Board HR Committee Charter, robust performance measures and targets for the CEO that encourage superior long term performance and ethical behaviour are recommended by the Board HR Committee to the full Board. | | |
| | |
| | The key objectives for 2009 included a number of quantitative and qualitative measures aligned with ANZ’s strategy, which included (but were not limited to) financial goals, risk management, progress towards long-term strategic goals, strengthening the management bench, and people/culture measures. A key focus of these objectives was on the strategic acquisition and disposal of assets in order to position the company for the future. | | |
| | |
| | Based on the Board’s assessment, the STI payment for the CEO for the 2009 year will be $4.5 million. | | |
| | The CEO will be paid $2.4 million in cash and the balance will be awarded as deferred shares. Half the deferred shares will be restricted for 1 year and half for 2 years from the date of grant. | | |
| | |
| Special Equity Allocation | | In 2008 the Board reviewed the contract and retention arrangements of the CEO to ensure that they continued to be market competitive. Following this review, the Board considered it reasonable and appropriate to grant the CEO 700,000 options. This resolution was approved by shareholders at the 2008 | | |
| | AGM and the options were granted on 18 December 2008. | | |
| | |
| | The rationale for the grant of options to the CEO was: | | |
| | |
| | • As options only reward for uplift in the share price above the option exercise price, the award helps drive a longer term focus on sustained share price growth while strengthening the alignment of the CEO’s interests with shareholders; | | |
36ANZ Annual Report 2009
REMUNERATION REPORT (Audited) (continued)
2.5. CEO REMUNERATION(CONTINUED)
| | | | |
Details | | Summary | | Discussion in Report |
| | |
| Special Equity Allocation continued | | • The grant recognised the CEO’s performance in establishing a solid foundation to enable ANZ to achieve its longer term vision, as well as acknowledging his very strong internal and external leadership during the significant challenges the organisation faced during that year; | | |
| | |
| | • The grant took into consideration the fact that the CEO’s STI payment was reduced by 20% in 2008 as a result of ANZ’s performance, however, this result was largely attributable to decisions made prior to his appointment; | | |
| | |
| | • Using Performance Rights as part of the long-term incentive program and Options for retention purposes provides a strong motivation and retention element in both flat and growth economic cycles. | | |
| | |
| | These options will be available for exercise from the date of vesting, December 2011, with the option exercise price being equal to the market value of ANZ shares at the date they were granted i.e. $14.18 per share. Upon exercise, each option entitles the CEO to one ordinary ANZ share. At grant the options were independently valued at $2.27 each i.e. a total value of $1.589 million. However, these options will only have any value if, at the vesting date or during the subsequent exercise period (i.e. 2 years after vesting), the share price exceeds $14.18. This value will be based on the amount by which the market price exceeds the exercise price multiplied by the total number of options. | | |
| | |
| Long-Term Incentives (LTI) – Grants covering first 3 years | | Three tranches of performance rights were provided to the CEO in December 2007, each to a maximum value of $3 million, covering his first three years in the role. The first of these tranches will be tested after three years (i.e. December 2010) based on ANZ’s relative TSR against a comparator group, consistent with the Executives LTI program (refer section 2.6.4). The other two tranches will be tested in December 2011 and December 2012 respectively. No retesting is available. Therefore, since joining ANZ as CEO on 1 October 2007 the CEO will only receive a benefit from December 2010 onwards if the performance hurdles have been met. | | LTI –Refer Page 39 |
| | |
| Sign-On Award | | In addition to his standard remuneration arrangements, the CEO was provided with additional equity as part of his original sign-on arrangements to recognise remuneration forgone from his previous employer in order to join ANZ. The CEO was offered $9 million on his commencement which he elected to take as deferred shares, with one third of the award vesting in each of October 2008, 2009 and 2010 respectively. The sign-on award equated to a total of 330,033 ANZ shares at the time of grant when the share price was $27.27. | | |
| | |
| | Given the purpose of the sign-on award for the CEO was to compensate him for remuneration forgone, the ANZ Deferred Shares were not subject to any performance hurdles. The allocation of Deferred Shares will, however, strengthen the alignment of the CEO’s interests with shareholders. | | |
| | |
| | On 2 October 2008, 110,011 of those shares became available to the CEO. However, the nominal value of the shares had declined significantly from the original grant value of $3 million to $2.097 million on 2 October 2008 (based on the one day VWAP of $19.0610 per share). The subsequent grants will vest on 2 October 2009 and 2010 respectively. | | |
2.6. EXECUTIVE REMUNERATION
2.6.1. FIXED REMUNERATION
The fixed remuneration amount is expressed as a total dollar amount which can be taken as cash salary, 9% superannuation contributions, and other nominated benefits (e.g. novated car leases, superannuation contributions, car parking and contributions towards the Employee Share Save Scheme).
Fixed Remuneration at ANZ is reviewed annually. ANZ sets remuneration ranges with a midpoint targeted to the local market median being paid in the financial services industry in the relevant global markets in which ANZ operates.
2.6.2. VARIABLE REMUNERATION
Variable remuneration forms a significant part of Executives’ potential remuneration, providing at-risk components that are designed to drive performance in the short, medium and long-term. The term “variable remuneration” within ANZ covers both the STI and LTI arrangements.
Remuneration Report37
REMUNERATION REPORT (Audited) (continued)
2.6.3. SHORT TERM INCENTIVES (STI)
Details of the STI arrangements for Executives are provided in Table 9 below:
TABLE 9: SUMMARY OF STI ARRANGEMENTS
| | |
| Purpose | | The STI arrangements support ANZ’s strategic objectives by providing rewards that are significantly differentiated on the basis of achievement against annual performance targets. The introduction in 2008 of mandatory deferral of a portion of the STI places an increased emphasis on having a variable structure that is flexible, continues to be performance linked, has significant retention elements and motivates executives to drive continued performance over the longer term. |
| |
Determining STI Pools | | ANZ’s Employee Reward Scheme (ANZERS) structure is reviewed and approved by the Board HR Committee. The size of the overall pool is determined by the Board and is based on an assessment of the balanced scorecard of measures of the Group, with this pool then distributed between the different Divisions based on their relative performance against a balanced scorecard of financial and qualitative measures. |
| |
| Performance Targets | | The STI targets are set to ensure appropriate focus on achievement of ANZ Group, Division and individual performance aligned with ANZ’s overall strategy. Individual performance objectives for Executives are based on a number of qualitative and quantitative measures which may include: |
| |
| | • Financial Measures including Revenue growth, Net Profit After Tax growth, and Operating Costs; |
| |
| | • Customer Measures including Customer Satisfaction, Share of Wallet and Market Share; |
| |
| | • Process Measures including Process Improvements and Cost benefits; |
| |
| | • People Measures including Staff Turnover; Diversity Targets and Performance Management |
| |
| | • Behaviour, Risk Management, Audit and Compliance Measures/Standards. |
| |
| | The specific targets and features relating to these qualitative and quantitative measures have not been provided in detail due to their commercial sensitivity. |
| |
| | The performance of relevant executives against these objectives is reviewed at the end of the year by the Board HR Committee. |
| |
| Determining Individual Incentive Targets | | Each Executive has a target STI percentage which is determined according to market relativities. The 2009 target STI award level for Executives (excluding the CEO) is 120% of Fixed Remuneration. |
| |
| Rewarding Performance | | The STI program and the targets that are set have been designed to motivate and reward superior performance. The size of the actual STI payment made at the end of each financial year to individuals will be determined based on performance as detailed above. Within the overall incentive pool approved by the Board, Executives who out-perform relative to their peers and significantly exceed targets may be rewarded with a maximum STI award which is significantly higher than their target STI. Conversely, the poorest performers relative to their peers will not be eligible to receive any STI award. |
| |
| Mandatory Deferral | | Since 2008, the following tiered STI deferral approach applies to Executives (excluding the CEO): |
| |
| | • STI up to the threshold (currently $200,000) paid in cash1 |
| |
| | • 25% of STI amounts above the threshold deferred in ANZ equity for 1 year |
| |
| | • 25% of STI amounts above the threshold deferred in ANZ equity for 2 years |
| |
| | The balance (i.e. 50%) of STI amounts above the threshold to be paid as cash1. |
| |
| | In 2009, Executives could elect to receive the deferral value as 100% shares or 50% shares/50% options2. Allowing a mix of options and shares for the mandatory STI deferral provides a strong retention element in both flat and growth economic cycles. Options contain an in-built price hurdle given that they are designed to reward for share price growth. That is, options can provide benefits to the extent the ANZ share price increases above the option exercise price. Options deliver no value where the ANZ share price is equal to or below the option exercise price during the exercise period. As the incentive amount has already been earned, there are no further performance measures attached to the shares and options. However, all unvested deferred amounts are forfeited on resignation or termination on notice. In the case of retrenchment, retirement, death or total and permanent disablement, the unvested deferred amounts will vest unless the Board determines otherwise. |
| 1 | Executives are able to elect to take any cash bonus amounts they may be awarded as cash or superannuation. |
| 2 | J Fagg will receive share rights rather than shares due to taxation implications in New Zealand. A share right effectively provides a right in the future to acquire a share in ANZ at nil cost to the employee. The right value at grant is discounted (relative to the value of an ANZ share at grant), due to the fact that dividends will not be received during the deferral period. |
38ANZ Annual Report 2009
REMUNERATION REPORT (Audited) (continued)
2.6.4. LONG TERM INCENTIVES (LTI)
Details of the LTI arrangements for Executives are provided in Table 10 below:
TABLE 10: SUMMARY OF LTI ARRANGEMENTS
| | | | | | |
| Purpose | | The LTI arrangements are designed to link a significant portion of Executives’ remuneration to shareholder interests. |
| |
| Type of Equity Awarded | | LTI is delivered to Executives as 100% Performance Rights. A Performance Right is a right to acquire a share at nil cost, subject to meeting time and performance hurdles. Upon exercise, each Performance Right entitles the executive to one ordinary share. |
| |
| Time Restrictions | | The Performance Rights awarded to Executives will be tested once only against the performance hurdle at the end of three years. If they do not achieve the required performance hurdle they are forfeited at that time. |
| |
| | Subject to the performance hurdle being met, Executives then have a two-year exercise period. |
| |
| Performance Hurdle | | The Performance Rights granted to Executives in October 2008 have a single long-term performance measure (refer to section 2.11 for details of legacy LTI programs). The Performance Rights are designed to reward Executives if the Company’s TSR is at or above the median TSR of a group of peer companies over a three year period. TSR represents the change in the value of a share plus the value of reinvested dividends paid. TSR was chosen as the most appropriate comparative measure as it focuses on the delivery of shareholder value and is a well understood and tested mechanism to measure performance. |
| |
| Vesting Schedule | | The proportion of Performance Rights that become exercisable will depend upon the TSR achieved by ANZ relative to the companies in the comparator group (shown below) at the end of the three-year period. |
| | | |
| | | ANZ’s TSR Ranking | | % of Grant Vested | | |
| | | |
| | 0 – 49th percentile | | 0% | | |
| | | |
| | 50th percentile | | 50% | | |
| | | |
| | Higher than 50th but below the 75th percentile | | An additional 2% for every 1.0 percentile above the 50th percentile but below the 75th percentile | | |
| | | |
| | 75th – 100th percentile | | 100% | | |
| |
| | An averaging calculation is used for TSR over a 90 day period for start and end values in order to reduce the impact of share price volatility. To ensure an independent TSR measurement, ANZ engages the services of an external organisation (Macquarie Financial Services) to calculate ANZ’s performance against the TSR hurdle. Where ANZ’s performance falls between two of the comparators, TSR is measured on a pro-rata basis. |
| |
| Comparator Group | | The peer group of companies against which ANZ’s TSR performance is measured, comprises the following nine companies: |
| | | |
| | AMP Limited | | AXA Asia Pacific Holdings Limited | | |
| | Commonwealth Bank of Australia | | Insurance Australia Group Limited | | |
| | Macquarie Bank Limited | | National Australia Bank Limited | | |
| | QBE Insurance Group Limited | | Suncorp-Metway Limited | | |
| | Westpac Banking Corporation | | | | |
| |
| | The comparator group that has been used since 2004 included all the above companies together with St George Bank. After being acquired by Westpac, St George was subsequently delisted in November 2008 from the ASX. Consideration was given to a possible substitute company to be included in the comparator group. However, other possible inclusions had either a significantly different market cap or different business/market. Accordingly, the Board determined that comparisons for all existing grants would be made with the remaining nine companies from the original comparator group. The removal of St George did not have any material impact on vesting of existing equity grants. |
Remuneration Report 39
REMUNERATION REPORT (Audited) (continued)
TABLE 10: SUMMARY OF LTI ARRANGEMENTS (CONTINUED)
| | |
| Size of LTI Grants | | The size of individual LTI grants for Executives is determined by an individual’s level of responsibility, their performance and the assessed potential of the executive. The target LTI for disclosed Executives is around 18% of the individual’s target reward mix and around 50% of Fixed Remuneration. Executives are advised of the dollar value of their LTI Grant, which is then converted into a number of Performance Rights based on an independent valuation. Refer to section 2.8 for further details on the valuation approach and inputs. LTI allocations are made annually after the annual review which occurs in October. The following example uses the October 2008 allocation value. |
| |
| | Example: Executive granted LTI value of $500,000 Approved Allocation Valuation is $9.99 per Performance Right $500,000 / $9.99 = 50,050 Performance Rights |
| |
| Cessation of Employment Provisions | | The following provisions apply in the case of cessation of employment: • In case of dismissal for misconduct, Performance Rights are forfeited; • In case of resignation all unvested or vested but unexercised Performance Rights are forfeited at the time notice is given: • In case of termination on notice, unless the Board determines otherwise, only Performance Rights that are vested may be exercised and all unvested Performance Rights will be forfeited; and • In case of death or total & permanent disablement, the performance hurdle is waived and a grace period is provided in which to exercise all Performance Rights. |
| |
| Conditions of Grant | | The conditions under which Performance Rights are granted are approved by the Board in accordance with the rules of the ANZ Share Option Plan. |
| |
| Hedging and Margin Lending Prohibitions | | As specified in the ANZ Securities Trading Policy, equity allocated under ANZ incentive schemes must remain at risk until fully vested (in the case of Deferred Shares) or exercisable (in the case of Options or Performance Rights). As such, it is a condition of grant that no schemes are entered into that specifically protect the unvested value of Shares, Options and Performance Rights allocated. Doing so would constitute a breach of the grant conditions and would result in the forfeiture of the relevant Shares, Options or Performance Rights. The Policy was also extended this year to incorporate a prohibition on Executives providing ANZ securities in connection with a margin loan or similar financing arrangements under which they may be subject to a call. To monitor adherence to this policy, ANZ’s Executives are required to sign an annual declaration stating that they have not entered into (and are not currently involved in) any schemes to protect the value of their interests in any unvested ANZ securities. Based on the 2009 declarations, ANZ can advise that Executives are fully compliant with this policy. |
| |
| Shareholding Guidelines | | Executives are expected to accumulate ANZ shares over a five year period, to the value of 200% of their Fixed Remuneration and to maintain this shareholding while an executive of ANZ. This guideline was introduced in June 2005. New Executives are expected to accumulate the required holdings within five years of appointment. Shareholdings for this purpose include all vested and allocated but unvested equity which is not subject to performance hurdles. |
40ANZ Annual Report 2009
REMUNERATION REPORT (Audited) (continued)
2.7. EQUITY GRANTED AS REMUNERATION
Details of Deferred Shares, Options and Performance Rights granted to Executives during the 2009 year are set out in Table 11 below.
TABLE 11: DEFERRED SHARES, OPTIONS AND PERFORMANCE RIGHTS GRANTED AS REMUNERATION DURING 2009
| | | | | | | | | | | | | | | | | | | | | | | | | | |
Name | | Type of Equity | | Number
granted | | | Grant date | | | Vesting date | | | Date of
option expiry | | | Option
exercise price
$ | | | Fair Value8
$ | |
Current Executives | | | | | | | | | | | | | | | | | | | | | | | | | | |
M Smith | | Special Options1 | | | 700,000 | | | | 18-Dec-08 | | | | 18-Dec-11 | | | | 17-Dec-13 | | | | 14.18 | | | | 2.27 | |
| | | | | | | | | | | | | | | | | | | | | | | | | | |
D Cartwright | | STI Restricted Shares2 | | | 40,745 | | | | 31-Oct-08 | | | | 31-Oct-09 | | | | — | | | | — | | | | 16.38 | |
| | STI Deferred Shares3 | | | 7,276 | | | | 31-Oct-08 | | | | 31-Oct-09 | | | | — | | | | — | | | | 16.38 | |
| | STI Deferred Shares3 | | | 7,275 | | | | 31-Oct-08 | | | | 31-Oct-10 | | | | — | | | | — | | | | 15.45 | |
| | STI Deferred Options3 | | | 48,385 | | | | 31-Oct-08 | | | | 31-Oct-09 | | | | 30-Oct-13 | | | | 17.18 | | | | 2.80 | |
| | STI Deferred Options3 | | | 48,385 | | | | 31-Oct-08 | | | | 31-Oct-10 | | | | 30-Oct-13 | | | | 17.18 | | | | 2.94 | |
| | LTI Performance Rights4 | | | 40,040 | | | | 31-Oct-08 | | | | 31-Oct-11 | | | | 31-Oct-13 | | | | 0.00 | | | | 9.99 | |
| | | | | | | | | | | | | | | | | | | | | | | | | | |
S Elliott | | Other Deferred Shares5 | | | 7,530 | | | | 11-Jun-09 | | | | 11-Jun-10 | | | | — | | | | — | | | | 16.83 | |
| | Other Deferred Shares5 | | | 7,530 | | | | 11-Jun-09 | | | | 11-Jun-11 | | | | — | | | | — | | | | 16.83 | |
J Fagg6 | | | | | | | | | | | | | | | | | | | | | | | | | | |
G Hodges | | STI Deferred Options3 | | | 33,870 | | | | 31-Oct-08 | | | | 31-Oct-09 | | | | 30-Oct-13 | | | | 17.18 | | | | 2.80 | |
| | STI Deferred Options3 | | | 33,869 | | | | 31-Oct-08 | | | | 31-Oct-10 | | | | 30-Oct-13 | | | | 17.18 | | | | 2.94 | |
| | STI Deferred Share Rights3 | | | 5,341 | | | | 31-Oct-08 | | | | 31-Oct-09 | | | | 30-Oct-13 | | | | 0.00 | | | | 16.38 | |
| | STI Deferred Share Rights3 | | | 5,663 | | | | 31-Oct-08 | | | | 31-Oct-10 | | | | 30-Oct-13 | | | | 0.00 | | | | 15.45 | |
| | LTI Performance Rights4 | | | 50,050 | | | | 31-Oct-08 | | | | 31-Oct-11 | | | | 31-Oct-13 | | | | 0.00 | | | | 9.99 | |
| | | | | | | | | | | | | | | | | | | | | | | | | | |
P Marriott | | STI Deferred Shares3 | | | 3,638 | | | | 31-Oct-08 | | | | 31-Oct-09 | | | | — | | | | — | | | | 16.38 | |
| | STI Deferred Shares3 | | | 3,637 | | | | 31-Oct-08 | | | | 31-Oct-10 | | | | — | | | | — | | | | 15.45 | |
| | STI Deferred Options3 | | | 24,193 | | | | 31-Oct-08 | | | | 31-Oct-09 | | | | 30-Oct-13 | | | | 17.18 | | | | 2.80 | |
| | STI Deferred Options3 | | | 24,192 | | | | 31-Oct-08 | | | | 31-Oct-10 | | | | 30-Oct-13 | | | | 17.18 | | | | 2.94 | |
| | LTI Performance Rights4 | | | 50,050 | | | | 31-Oct-08 | | | | 31-Oct-11 | | | | 31-Oct-13 | | | | 0.00 | | | | 9.99 | |
| | | | | | | | | | | | | | | | | | | | | | | | | | |
C Page | | LTI Performance Rights4 | | | 38,038 | | | | 31-Oct-08 | | | | 31-Oct-11 | | | | 31-Oct-13 | | | | 0.00 | | | | 9.99 | |
| | | | | | | | | | | | | | | | | | | | | | | | | | |
A Thursby | | STI Deferred Shares3 | | | 12,369 | | | | 31-Oct-08 | | | | 31-Oct-09 | | | | — | | | | — | | | | 16.38 | |
| | STI Deferred Shares3 | | | 12,369 | | | | 31-Oct-08 | | | | 31-Oct-10 | | | | — | | | | — | | | | 15.45 | |
| | STI Deferred Options3 | | | 82,255 | | | | 31-Oct-08 | | | | 31-Oct-09 | | | | 30-Oct-13 | | | | 17.18 | | | | 2.80 | |
| | STI Deferred Options3 | | | 82,254 | | | | 31-Oct-08 | | | | 31-Oct-10 | | | | 30-Oct-13 | | | | 17.18 | | | | 2.94 | |
| | Other Deferred Shares7 | | | 43,610 | | | | 22-Sep-09 | | | | 22-Sep-12 | | | | — | | | | — | | | | 23.22 | |
| | LTI Performance Rights4 | | | 55,055 | | | | 31-Oct-08 | | | | 31-Oct-11 | | | | 31-Oct-13 | | | | 0.00 | | | | 9.99 | |
Former Executives | | | | | | | | | | | | | | | | | | | | | | | | | | |
R Edgar | | STI Deferred Shares3 | | | 3,638 | | | | 31-Oct-08 | | | | 31-Oct-09 | | | | — | | | | — | | | | 16.38 | |
| | STI Deferred Shares3 | | | 3,637 | | | | 31-Oct-08 | | | | 31-Oct-10 | | | | — | | | | — | | | | 15.45 | |
| | STI Deferred Options3 | | | 24,193 | | | | 31-Oct-08 | | | | 31-Oct-09 | | | | 30-Oct-13 | | | | 17.18 | | | | 2.80 | |
| | STI Deferred Options3 | | | 24,192 | | | | 31-Oct-08 | | | | 31-Oct-10 | | | | 30-Oct-13 | | | | 17.18 | | | | 2.94 | |
| | LTI Performance Rights4 | | | 25,025 | | | | 31-Oct-08 | | | | 31-Oct-11 | | | | 31-Oct-13 | | | | 0.00 | | | | 9.99 | |
| | | | | | | | | | | | | | | | | | | | | | | | | | |
B Hartzer | | STI Deferred Shares3 | | | 18,917 | | | | 31-Oct-08 | | | | 31-Oct-09 | | | | — | | | | — | | | | 16.38 | |
| | STI Deferred Shares3 | | | 18,917 | | | | 31-Oct-08 | | | | 31-Oct-10 | | | | — | | | | — | | | | 15.45 | |
| | LTI Performance Rights4 | | | 75,075 | | | | 31-Oct-08 | | | | 31-Oct-11 | | | | 31-Oct-13 | | | | 0.00 | | | | 9.99 | |
| | | | | | | | | | | | | | | | | | | | | | | | | | |
| 1 | Options granted to the CEO, M Smith were approved by shareholders at the 2008 AGM. Refer to Section 2.5 for further details of the grant and Table 12 for details of the valuation inputs and fair value. |
| 2 | In 2008 Executives could voluntarily elect to defer some/all of their cash STI payment into shares and/or options. Shares granted under this election were restricted for a 12 month period. The number of shares granted was based on the 1-week VWAP up to and including the date of grant. |
| 3 | Executives are required to take half of all STI amounts above the threshold as equity. Refer to Table 9 for further details of the Mandatory Deferral arrangements and Table 12 for details of the valuation methodology, inputs and fair value. |
| 4 | The 2008 LTI grants for Executives were delivered as Performance Rights. Refer to Table 10 for further details of the LTI grant and Table 12 for details of the valuation, inputs and fair value. |
| 5 | Other ordinary shares issued to S Elliott relate to the issue of deferred shares as part of his employment arrangements on commencement with ANZ. Refer to Table 19 for further details on the grant and restrictions. |
| 6 | J Fagg has not received any equity grants since being appointed as a KMP. |
| 7 | Other ordinary shares issued to A Thursby relate to the issue of deferred shares as part of his employment arrangements on commencement with ANZ. Refer to Table 19 for further details of the grant and restrictions. |
| 8 | The estimated maximum value of the grant can be determined by multiplying the number granted by the fair value of the equity investments. The minimum value of the grants, if the applicable conditions are not met, is nil. |
Remuneration Report 41
REMUNERATION REPORT (Audited) (continued)
2.8. EQUITY VALUATIONS
ANZ engages two external experts (Mercer and PricewaterhouseCoopers) to independently value any required Options, Rights and Shares, taking into account factors including the performance conditions, share price volatility, life of instrument, dividend yield and share price at grant date. These are then audited by internal audit and KPMG and the higher of the two values passing audit is then approved by the Board HR Committee as the allocation and/or expensing/disclosure value. The following table provides details of the valuations of the various equity instruments issued during the year:
TABLE 12: EQUITY VALUATION INPUTS
| | | | | | | | | | | | | | | | | | | | | | | | | | | | | | | | | | | | | | |
Recipients | | Type of Equity | | Grant date | | | Equity
value
($) | | | Share
closing price
at grant
($) | | | ANZ
expected
volatility
(%) | | | Equity
term
(years) | | | Vesting
period
(years) | | | Expected
life
(years) | | | Expected
dividend
yield
(%) | | | Risk free
interest rate
(%) | |
CEO | | Special Options | | | 18-Dec-08 | | | | 2.27 | | | | 14.27 | | | | 30 | | | | 5 | | | | 3 | | | | 4 | | | | 6.00 | | | | 3.37 | |
| | | | | | | | | | | | | | | | | | | | | | | | | | | | | | | | | | | | | | |
Executives | | STI Deferred Options | | | 31-Oct-08 | | | | 2.80 | | | | 17.36 | | | | 30 | | | | 5 | | | | 1 | | | | 3 | | | | 6.00 | | | | 4.48 | |
| | | | | | | | | | | | | | | | | | | | | | | | | | | | | | | | | | | | | | |
Executives | | STI Deferred Options | | | 31-Oct-08 | | | | 2.94 | | | | 17.36 | | | | 30 | | | | 5 | | | | 2 | | | | 3.5 | | | | 6.00 | | | | 4.64 | |
| | | | | | | | | | | | | | | | | | | | | | | | | | | | | | | | | | | | | | |
Executives | | STI Deferred Share Rights | | | 31-Oct-08 | | | | 16.38 | | | | 17.36 | | | | 30 | | | | 5 | | | | 1 | | | | 1 | | | | 6.00 | | | | 4.28 | |
| | | | | | | | | | | | | | | | | | | | | | | | | | | | | | | | | | | | | | |
Executives | | STI Deferred Share Rights | | | 31-Oct-08 | | | | 15.45 | | | | 17.36 | | | | 30 | | | | 5 | | | | 2 | | | | 2 | | | | 6.00 | | | | 4.48 | |
| | | | | | | | | | | | | | | | | | | | | | | | | | | | | | | | | | | | | | |
Executives | | LTI Performance Rights | | | 31-Oct-08 | | | | 9.99 | | | | 17.36 | | | | 30 | | | | 5 | | | | 3 | | | | 3 | | | | 6.00 | | | | 4.25 | |
| | | | | | | | | | | | | | | | | | | | | | | | | | | | | | | | | | | | | | |
42ANZ Annual Report 2009
REMUNERATION REPORT (Audited) (continued)
2.9. EQUITY VESTED/EXERCISED/LAPSED DURING THE 2008/09 YEAR
Details of the number and value of Deferred Shares, Options and Performance Rights granted to Executives in prior years which vested, were exercised or which lapsed during the 2009 year are set out in the table below.
TABLE 13: EQUITY VESTED/EXERCISED/LAPSED DURING THE 2008/09 YEAR
| | | | | | | | | | | | | | | | | | | | | | | | | | | | | | | | | | | | | | | | | | | | | | | | | | | | | | |
| | | | | | | | | | | | | | | | | Vested | | | Lapsed | | | Exercised | | | | | | | | | | |
Name | | Type of Equity | | Number
granted | | | Grant
date | | | First date
exercisable | | | Date
of expiry | | | Number | | | % | | | Number | | | % | | | Number | | | % | | | Value of
vested,
lapsed or
exercised1
$ | | | Vested and
exercisable
as at 30
Sep 2009 | | | Unexercisable
as at 30 Sep
2009 | |
Current Executives | | | | | | | | | | | | | | | | | | | | | | | | | | | | | | | | | | | | | | | | | | | | | | | | | | | | |
M Smith | | Sign-on Shares2 | | | 110,011 | | | | 19-Dec-07 | | | | 02-Oct-08 | | | | — | | | | 110,011 | | | | 100 | | | | — | | | | — | | | | — | | | | — | | | | 2,096,920 | | | | 110,011 | | | | — | |
| | | | | | | | | | | | | | | | | | | | | | | | | | | | | | | | | | | | | | | | | | | | | | | | | | | | | | |
D Cartwright | | STI Restricted Shares3 | | | 7,846 | | | | 02-Nov-07 | | | | 02-Nov-08 | | | | — | | | | 7,846 | | | | 100 | | | | — | | | | — | | | | — | | | | — | | | | 134,810 | | | | 7,846 | | | | — | |
| | | | | | | | | | | | | | | | | | | | | | | | | | | | | | | | | | | | | | | | | | | | | | | | | | | | | | |
S Elliott | | | | | — | | | | — | | | | — | | | | — | | | | — | | | | — | | | | — | | | | — | | | | — | | | | — | | | | — | | | | — | | | | — | |
| | | | | | | | | | | | | | | | | | | | | | | | | | | | | | | | | | | | | | | | | | | | | | | | | | | | | | |
J Fagg | | | | | — | | | | — | | | | — | | | | — | | | | — | | | | — | | | | — | | | | — | | | | — | | | | — | | | | — | | | | — | | | | — | |
| | | | | | | | | | | | | | | | | | | | | | | | | | | | | | | | | | | | | | | | | | | | | | | | | | | | | | |
G Hodges | | Performance Rights4 | | | 49,656 | | | | 18-Nov-05 | | | | 19-Nov-08 | | | | 18-Nov-10 | | | | — | | | | — | | | | (49,656 | ) | | | 100 | | | | — | | | | — | | | | (632,617 | ) | | | — | | | | — | |
| | Performance Rights4 | | | 10,690 | | | | 15-May-06 | | | | 19-Nov-08 | | | | 18-Nov-10 | | | | — | | | | — | | | | (10,690 | ) | | | 100 | | | | — | | | | — | | | | (136,191 | ) | | | — | | | | — | |
| | | | | | | | | | | | | | | | | | | | | | | | | | | | | | | | | | | | | | | | | | | | | | | | | | | | | | |
P Marriott | | Performance Rights4 | | | 53,794 | | | | 18-Nov-05 | | | | 19-Nov-08 | | | | 18-Nov-10 | | | | — | | | | — | | | | (53,794 | ) | | | 100 | | | | — | | | | — | | | | (685,336 | ) | | | — | | | | — | |
| | Performance Rights4 | | | 8,707 | | | | 15-May-06 | | | | 19-Nov-08 | | | | 18-Nov-10 | | | | — | | | | — | | | | (8,707 | ) | | | 100 | | | | — | | | | — | | | | (110,927 | ) | | | — | | | | — | |
| | Other5 | | | 442 | | | | 05-Nov-04 | | | | 05-Nov-07 | | | | 04-Nov-11 | | | | — | | | | — | | | | (442 | ) | | | 100 | | | | — | | | | — | | | | (1,851 | ) | | | — | | | | — | |
| | | | | | | | | | | | | | | | | | | | | | | | | | | | | | | | | | | | | | | | | | | | | | | | | | | | | | |
C Page | | | | | — | | | | — | | | | — | | | | — | | | | — | | | | — | | | | — | | | | — | | | | — | | | | — | | | | — | | | | — | | | | — | |
| | | | | | | | | | | | | | | | | | | | | | | | | | | | | | | | | | | | | | | | | | | | | | | | | | | | | | |
A Thursby | | | | | — | | | | — | | | | — | | | | — | | | | — | | | | — | | | | — | | | | — | | | | — | | | | — | | | | — | | | | — | | | | — | |
| | | | | | | | | | | | | | | | | | | | | | | | | | | | | | | | | | | | | | | | | | | | | | | | | | | | | | |
Former Executives | | | | | | | | | | | | | | | | | | | | | | | | | | | | | | | | | | | | | | | | | | | | | | | | | | | | |
R Edgar | | STI Deferred Shares6 | | | 3,638 | | | | 31-Oct-08 | | | | 31-Oct-09 | | | | — | | | | 3,638 | | | | 100 | | | | — | | | | — | | | | — | | | | — | | | | 58,221 | | | | 3,638 | | | | — | |
| | STI Deferred Shares6 | | | 3,637 | | | | 31-Oct-08 | | | | 31-Oct-10 | | | | — | | | | 3,637 | | | | 100 | | | | — | | | | — | | | | — | | | | — | | | | 58,205 | | | | 3,637 | | | | — | |
| | DRP STI Deferred Shares7 | | | 629 | | | | various | | | | 12-May-09 | | | | — | | | | 629 | | | | 100 | | | | — | | | | — | | | | — | | | | — | | | | 10,066 | | | | 629 | | | | — | |
| | STI Deferred Options6 | | | 24,193 | | | | 31-Oct-08 | | | | 31-Oct-09 | | | | 30-Oct-13 | | | | 24,193 | | | | 100 | | | | — | | | | — | | | | — | | | | — | | | | (17,182 | ) | | | 24,193 | | | | — | |
| | STI Deferred Options6 | | | 24,192 | | | | 31-Oct-08 | | | | 31-Oct-10 | | | | 30-Oct-13 | | | | 24,192 | | | | 100 | | | | — | | | | — | | | | — | | | | — | | | | (17,181 | ) | | | 24,192 | | | | — | |
| | Hurdled Options8 | | | 31,558 | | | | 11-May-04 | | | | 11-May-07 | | | | 10-May-11 | | | | — | | | | — | | | | — | | | | — | | | | (31,558 | ) | | | 100 | | | | 58,165 | | | | — | | | | — | |
| | Hurdled Options9 | | | 52,000 | | | | 05-Nov-04 | | | | 05-Nov-07 | | | | 04-Nov-11 | | | | — | | | | — | | | | (52,000 | ) | | | 100 | | | | — | | | | — | | | | (38,802 | ) | | | — | | | | — | |
| | Index-Linked Options9 | | | 125,000 | | | | 23-Oct-02 | | | | 23-Oct-05 | | | | 22-Oct-09 | | | | — | | | | — | | | | (125,000 | ) | | | 100 | | | | — | | | | — | | | | (510,775 | ) | | | — | | | | — | |
| | Performance Rights4 | | | 44,828 | | | | 18-Nov-05 | | | | 19-Nov-08 | | | | 18-Nov-10 | | | | — | | | | — | | | | (44,828 | ) | | | 100 | | | | — | | | | — | | | | (571,109 | ) | | | — | | | | — | |
| | Performance Rights4 | | | 15,518 | | | | 15-May-06 | | | | 19-Nov-08 | | | | 18-Nov-10 | | | | — | | | | — | | | | (15,518 | ) | | | 100 | | | | — | | | | — | | | | (197,699 | ) | | | — | | | | — | |
| | Performance Rights10 | | | 45,872 | | | | 24-Oct-06 | | | | 25-Oct-09 | | | | 24-Oct-11 | | | | — | | | | — | | | | (45,872 | ) | | | 100 | | | | — | | | | — | | | | (723,998 | ) | | | — | | | | — | |
| | Performance Rights10 | | | 19,290 | | | | 30-Oct-07 | | | | 31-Oct-10 | | | | 30-Oct-12 | | | | — | | | | — | | | | (19,290 | ) | | | 100 | | | | — | | | | — | | | | (304,454 | ) | | | — | | | | — | |
| | Performance Rights11 | | | 25,025 | | | | 31-Oct-08 | | | | 31-Oct-11 | | | | 31-Oct-13 | | | | — | | | | — | | | | (20,855 | ) | | | 83 | | | | 4.170 | | | | 17 | | | | (247,879 | ) | | | — | | | | — | |
| | | | | | | | | | | | | | | | | | | | | | | | | | | | | | | | | | | | | | | | | | | | | | | | | | | | | | |
B Hartzer | | STI Deferred Shares6 | | | 18,917 | | | | 31-Oct-08 | | | | 31-Oct-09 | | | | — | | | | — | | | | — | | | | (18,917 | ) | | | 100 | | | | — | | | | — | | | | (348,928 | ) | | | — | | | | — | |
| | STI Deferred Shares6 | | | 18,917 | | | | 31-Oct-08 | | | | 31-Oct-10 | | | | — | | | | — | | | | — | | | | (18,917 | ) | | | 100 | | | | — | | | | — | | | | (348,928 | ) | | | — | | | | — | |
| | DRP STI Deferred Shares7 | | | 2,124 | | | | various | | | | 31-Jul-09 | | | | — | | | | 2,124 | | | | 100 | | | | — | | | | — | | | | — | | | | — | | | | 39,178 | | | | 2,124 | | | | — | |
| | Hurdled Options9 | | | 26,640 | | | | 11-May-04 | | | | 11-May-07 | | | | 10-May-11 | | | | — | | | | — | | | | (26,640 | ) | | | 100 | | | | — | | | | — | | | | (5,999 | ) | | | — | | | | — | |
| | Hurdled Options9 | | | 72,800 | | | | 05-Nov-04 | | | | 05-Nov-07 | | | | 04-Nov-11 | | | | — | | | | — | | | | (72,800 | ) | | | 100 | | | | — | | | | — | | | | (162,693 | ) | | | — | | | | — | |
| | Index-Linked Options9 | | | 109,000 | | | | 23-Oct-02 | | | | 23-Oct-05 | | | | 22-Oct-09 | | | | — | | | | — | | | | (109,000 | ) | | | 100 | | | | — | | | | — | | | | (120,467 | ) | | | — | | | | — | |
| | Index-Linked Options9 | | | 113,000 | | | | 20-May-03 | | | | 20-May-06 | | | | 19-May-10 | | | | — | | | | — | | | | (113,000 | ) | | | 100 | | | | — | | | | — | | | | (95,508 | ) | | | — | | | | — | |
| | Performance Rights4 | | | 62,759 | | | | 18-Nov-05 | | | | 19-Nov-08 | | | | 18-Nov-10 | | | | — | | | | — | | | | (62,759 | ) | | | 100 | | | | — | | | | — | | | | (799,550 | ) | | | — | | | | — | |
| | Performance Rights4 | | | 1,897 | | | | 15-May-06 | | | | 19-Nov-08 | | | | 18-Nov-10 | | | | — | | | | — | | | | (1,897 | ) | | | 100 | | | | — | | | | — | | | | (24,168 | ) | | | — | | | | — | |
| | Performance Rights10 | | | 64,985 | | | | 24-Oct-06 | | | | 25-Oct-09 | | | | 24-Oct-11 | | | | — | | | | — | | | | (64,985 | ) | | | 100 | | | | — | | | | — | | | | (1,198,661 | ) | | | — | | | | — | |
| | Performance Rights10 | | | 65,586 | | | | 30-Oct-07 | | | | 31-Oct-10 | | | | 30-Oct-12 | | | | — | | | | — | | | | (65,586 | ) | | | 100 | | | | — | | | | — | | | | (1,209,747 | ) | | | — | | | | — | |
| | Performance Rights10 | | | 75,075 | | | | 31-Oct-08 | | | | 31-Oct-11 | | | | 31-Oct-13 | | | | — | | | | — | | | | (75,075 | ) | | | 100 | | | | — | | | | — | | | | (1,252,859 | ) | | | — | | | | — | |
| | | | | | | | | | | | | | | | | | | | | | | | | | | | | | | | | | | | | | | | | | | | | | | | | | | | | | |
| 1 | The value of shares and/or performance rights is based on the 1-day VWAP of the Company’s shares traded on the ASX on the date of vesting, lapsing or exercising, multiplied by the number of shares and/or performance rights. The value of options is based on the difference between the 1-day VWAP and the exercise price, multiplied by the number of options. |
| 2 | The first tranche of 110,011 deferred shares granted to the CEO on his commencement vested on 2 October 2008 – refer to section 2.5 for further details. The value has been determined based on the 1-day VWAP on 2 October 2008 of $19.0610 per share. |
| 3 | STI Restricted/Deferred Shares which were granted in prior years and first became exercisable in the current year. |
| 4 | Performance Rights granted under the LTI plans in 2005 and 2006 were subject to testing against the relevant performance hurdle in November 2008. As ANZ’s TSR performance was below the median of the comparator group at that time, the performance rights did not vest and, accordingly, were lapsed. |
| 5 | Other for P Marriott relates to share options granted to a related party. |
| 6 | Shares and/or options which were granted in 2008 under the STI mandatory deferral arrangements. In accordance with the conditions of grant, the equity is forfeited in the case of resignation prior to vesting (B Hartzer) but vests in the case of retirement (R Edgar). |
| 7 | DRP refers to shares acquired under the Dividend Reinvestment Plan in relation to deferred/restricted shares held in Trust. |
| 8 | Hurdled options which previously vested but were exercised in the current year at an exercise price of $18.22 per share. |
| 9 | Hurdled and/or Index-Linked Options which lapsed on cessation of employment. |
| 10 | Performance Rights which lapsed on cessation of employment. |
| 11 | Performance Rights which were pro-rated on cessation of employment based on service from time of grant to the retirement date. |
Remuneration Report 43
REMUNERATION REPORT (Audited) (continued)
2.10. SHAREHOLDINGS OF EXECUTIVES
The movement during the reporting period in shareholdings of Executives (held directly, nominally and by related parties) is provided below.
TABLE 14: EXECUTIVES’ SHAREHOLDINGS (INCLUDING MOVEMENTS DURING THE 2008/09 YEAR)
| | | | | | | | | | | | | | | | | | | | |
Name | | Balance of shares
as at 1 Oct 20081 | | | Shares granted
during the year
as remuneration2 | | | Shares from
other changes
during the year3 | | | Balance as at
30 Sep 20094 | | | Balance as at date
of report sign-off6 | |
Current Executives | | | | | | | | | | | | | | | | | | | | |
M Smith | | | 373,983 | | | | — | | | | 1,042 | | | | 375,025 | | | | 375,025 | |
D Cartwright | | | 16,469 | | | | 55,296 | | | | 2,300 | | | | 74,065 | | | | 74,065 | |
S Elliott5 | | | — | | | | 15,060 | | | | — | | | | 15,060 | | | | 15,060 | |
J Fagg5 | | | 46,097 | | | | — | | | | 1,047 | | | | 47,144 | | | | 47,144 | |
G Hodges | | | 282,054 | | | | — | | | | — | | | | 282,054 | | | | 282,054 | |
P Marriott | | | 571,641 | | | | 7,275 | | | | (44,566 | ) | | | 534,350 | | | | 534,350 | |
C Page | | | — | | | | — | | | | — | | | | — | | | | — | |
A Thursby | | | 97,337 | | | | 68,348 | | | | 2,139 | | | | 167,824 | | | | 167,824 | |
Former Executives | | | | | | | | | | | | | | | | | | | | |
R Edgar | | | 381,956 | | | | 7,275 | | | | (117,630 | ) | | | 271,601 | | | | n/a | |
B Hartzer | | | 332,092 | | | | 37,834 | | | | (367,357 | ) | | | 2,569 | | | | n/a | |
| 1 | Balance of shares held at 1 October 2008 include beneficially held shares (both direct and indirect) and shares held by related parties. |
| 2 | Details of shares granted as remuneration during 2009 are provided in Table 11. |
| 3 | Shares resulting from any other changes during the year include the net result of any shares purchased, or sold or any acquired under the Dividend Reinvestment Plan or the ANZ Share Purchase Plan. |
| 4 | The following shares were held on behalf of Executives (i.e. indirect beneficially held shares) as at 30 September 2009: M Smith – 330,033; D Cartwright– 73,023; S Elliott – 15,060; J Fagg – 10,547; G Hodges – 126,747; P Marriott – 168,225; A Thursby – 167,824. |
| 5 | Commencing balance is based on holdings as at the date of commencement as a KMP. |
| 6 | R Edgar’s and B Hartzer’s shareholdings are not provided as they are no longer KMP as at the report sign-off date. |
44ANZ Annual Report 2009
REMUNERATION REPORT (Audited) (continued)
The movement during the reporting period in options and performance rights of Executives (held directly, nominally and by related parties) is provided below.
TABLE 15: EXECUTIVES’ OPTION AND PERFORMANCE RIGHT HOLDINGS (INCLUDING MOVEMENTS DURING THE 2008/09 YEAR)
| | | | | | | | | | | | | | | | | | | | | | | | | | |
Name | | Type of options/rights | | Balance as at
1 Oct 20081 | | | Granted during
the year as
remuneration2 | | | Exercised
during
the year | | | Number forfeited
or lapsed during
the year3 | | | Balance as at
30 Sep 2009 | | | Balance as at
date of report
sign–off7 | |
Current Executives | | | | | | | | | | | | | | | | | | | | | | | | |
M Smith | | Special Options | | | — | | | | 700,000 | | | | — | | | | — | | | | 700,000 | | | | 700,000 | |
| | LTI Performance Rights | | | 779,002 | | | | — | | | | — | | | | — | | | | 779,002 | | | | 779,002 | |
| | | | | | | | | | | | | | | | | | | | | | | | | | |
D Cartwright | | STI Deferred Options | | | — | | | | 96,770 | | | | — | | | | — | | | | 96,770 | | | | 96,770 | |
| | LTI Performance Rights | | | 46,296 | | | | 40,040 | | | | — | | | | — | | | | 86,336 | | | | 86,336 | |
| | | | | | | | | | | | | | | | | | | | | | | | | | |
S Elliott4 | | | | | — | | | | — | | | | — | | | | — | | | | — | | | | — | |
| | | | | | | | | | | | | | | | | | | | | | | | | | |
J Fagg4 | | Hurdled Options | | | 33,316 | | | | — | | | | — | | | | — | | | | 33,316 | | | | 33,316 | |
| | Index-Linked Options | | | 34,155 | | | | — | | | | — | | | | — | | | | 34,155 | | | | 21,200 | |
| | LTI Performance Rights | | | 83,794 | | | | — | | | | — | | | | — | | | | 83,794 | | | | 76,238 | |
| | STI Deferred Share Rights | | | 37,722 | | | | — | | | | — | | | | — | | | | 37,722 | | | | 37,722 | |
| | | | | | | | | | | | | | | | | | | | | | | | | | |
G Hodges | | Hurdled Options | | | 109,181 | | | | — | | | | — | | | | — | | | | 109,181 | | | | 109,181 | |
| | Index-Linked Options | | | 176,000 | | | | — | | | | — | | | | — | | | | 176,000 | | | | 113,000 | |
| | STI Deferred Options | | | — | | | | 67,739 | | | | — | | | | — | | | | 67,739 | | | | 67,739 | |
| | LTI Performance Rights | | | 175,556 | | | | 50,050 | | | | — | | | | (60,346 | )3 | | | 165,260 | | | | 152,381 | |
| | STI Deferred Share Rights | | | — | | | | 11,004 | | | | — | | | | — | | | | 11,004 | | | | 11,004 | |
| | | | | | | | | | | | | | | | | | | | | | | | | | |
P Marriott | | Hurdled Options | | | 136,863 | | | | — | | | | — | | | | — | | | | 136,863 | | | | 136,863 | |
| | Index-Linked Options | | | 311,000 | | | | — | | | | — | | | | — | | | | 311,000 | | | | 158,000 | |
| | STI Deferred Options | | | — | | | | 48,385 | | | | — | | | | — | | | | 48,385 | | | | 48,385 | |
| | LTI Performance Rights | | | 177,711 | | | | 50,050 | | | | — | | | | (62,501 | )3 | | | 165,260 | | | | 152,381 | |
| | Other | | | 442 | | | | — | | | | — | | | | (442 | )5 | | | — | | | | — | |
| | | | | | | | | | | | | | | | | | | | | | | | | | |
C Page | | Performance Rights | | | — | | | | 38,038 | | | | — | | | | — | | | | 38,038 | | | | 38,038 | |
| | | | | | | | | | | | | | | | | | | | | | | | | | |
A Thursby | | STI Deferred Options | | | — | | | | 164,509 | | | | — | | | | — | | | | 164,509 | | | | 164,509 | |
| | LTI Performance Rights | | | 46,296 | | | | 55,055 | | | | — | | | | — | | | | 101,351 | | | | 101,351 | |
Former Executives | | | | | | | | | | | | | | | | | | | | | | | | | | |
R Edgar | | Hurdled Options | | | 83,558 | | | | — | | | | (31,558 | ) | | | (52,000 | )6 | | | — | | | | n/a | |
| | Index-Linked Options | | | 272,000 | | | | — | | | | — | | | | (125,000 | )6 | | | 147,000 | | | | n/a | |
| | STI Deferred Options | | | — | | | | 48,385 | | | | — | | | | — | | | | 48,385 | | | | n/a | |
| | LTI Performance Rights | | | 125,508 | | | | 25,025 | | | | (4,170 | ) | | | (146,363 | )3 | | | — | | | | n/a | |
| | | | | | | | | | | | | | | | | | | | | | | | | | |
B Hartzer | | Hurdled Options | | | 99,440 | | | | — | | | | — | | | | (99,440 | )6 | | | — | | | | n/a | |
| | Index-Linked Options | | | 222,000 | | | | — | | | | — | | | | (222,000 | )6 | | | — | | | | n/a | |
| | LTI Performance Rights | | | 195,227 | | | | 75,075 | | | | — | | | | (270,302 | )3 | | | — | | | | n/a | |
| | | | | | | | | | | | | | | | | | | | | | | | | | |
| 1 | Balance of options/rights held at 1 October 2008 include beneficially held options/rights (both direct and indirect) and options/rights held by related parties. |
| 2 | Details of options/rights granted as remuneration during 2009 are provided in Table 11. |
| 3 | The 2005 and 2006 LTI grants of Performance Rights were subject to a relative TSR hurdle against a comparator group of financial services companies. This hurdle was tested on 19 November 2008. As ANZ’s TSR was below the median of the comparator group over the three year period, the Performance Rights lapsed. |
| 4 | Commencing balance is based on holdings as at the date of commencement as a KMP. |
| 5 | Other relates to options granted to a related party. |
| 6 | Hurdled and Index-linked options forfeited on cessation of employment. |
| 7 | R Edgar’s and B Hartzer’s option and performance right holdings are not provided as they are no longer KMP as at the report sign-off date. |
Remuneration Report 45
REMUNERATION REPORT(Audited) (continued)
2.11. LEGACY LTI PROGRAMS
There are a number of legacy LTI programs which are no longer offered to new entrants but which have existing participants. Details of these are shown in Table 16 below
Option plans described below have the following features:
| • | | An exercise price (or for index-linked options, the original exercise price) that is set equal to the weighted average sale price of all fully paid ordinary shares in the Company sold on the Australian Securities Exchange during the 1 week prior to and including the date of grant; |
| • | | A maximum life of 7 years and an exercise period that commences 3 years after the date of grant, subject to performance hurdles being met. Options are re-tested monthly (if required) after the commencement of the exercise period; |
| • | | Upon exercise, each option entitles the option-holder to one ordinary share; |
| • | | In case of resignation or termination on notice or dismissal for misconduct: options are forfeited; |
| • | | In case of redundancy: options are pro-rated and a grace period is provided in which to exercise the remaining options (with hurdles waived, if applicable); |
| • | | In case of retirement, death or total & permanent disablement: A grace period is provided in which to exercise all options (with hurdles waived, if applicable); and |
| • | | Performance hurdles, which are explained below for each type of option. |
TABLE 16: LEGACY LTI PLANS
| | | | | | |
Type of Equity | | Details |
| |
Hurdled Options (Hurdled B) (Granted November 2004) | | In November 2004 hurdled options were granted with a relative TSR performance hurdle attached. The proportion of options that become exercisable will depend upon the TSR achieved by ANZ relative to the companies in the comparator group shown below. Performance equal to the median TSR of the comparator group will result in half the options becoming exercisable. Performance above median will result in further options becoming exercisable, increasing on a straight-line basis until all of the options become exercisable where ANZ’s TSR is at or above the 75th percentile in the comparator group. Where ANZ’s performance falls between two of the comparators, TSR is measured on a pro rata basis. |
| | | |
| | Comparator Group | | | | |
| | | |
| | AMP Limited | | Insurance Australia Group Limited | | QBE Insurance Group Limited |
| | AXA Asia Pacific Holdings Limited | | Macquarie Bank Limited | | Suncorp-Metway Limited |
| | Commonwealth Bank of Australia | | National Australia Bank Limited | | Westpac Banking Corporation |
| |
Hurdled Options (Hurdled A) (Granted to Executives from February 2000 until July 2002, and from November 2003 until May 2004) | | Until May 2004, hurdled options were granted to executives with the following performance hurdles attached. • Half the options may only be exercised once ANZ’s TSR exceeds the percentage change in the S&P/ASX 200 Banks (Industry Group) Accumulation Index, measured over the same period (since issue) and calculated as at the last trading day of any month (once the exercise period has commenced); and • The other half of hurdled options may only be exercised once the ANZ TSR exceeds the percentage change in the S&P/ASX 100 Accumulation Index, measured over the same period (since issue) and calculated as at the last trading day of any month (once the exercise period has commenced). |
| |
Index-linked options (Granted from October 2002 to May 2003) | | Index-linked options have a dynamic exercise price that acts as a built-in performance hurdle; i.e. the exercise price is adjusted in line with the movement in the S&P/ASX 200 Banks (Industry Group) Accumulation Index (excluding ANZ). As an additional constraint, the adjusted exercise price can only be set at or above the original exercise price. They are exercisable between the 3rd and 7th year after grant date, subject to the adjusted exercise price being above the prevailing share price. |
| |
Deferred Shares (Granted from February 2000) | | Deferred Shares granted under the LTI arrangements were designed to reward executives for superior growth whilst also encouraging executive retention and an increase in the Company’s share price. • Shares are subject to a time-based vesting hurdle of 3 years, during which time they are held in trust; |
| | • During the deferral period, the employee is entitled to any dividends paid on the shares; |
| | • Shares issued under this plan may be held in trust for up to 10 years; |
| | • The value used to determine the number of LTI deferred shares to be allocated has been based on the volume weighted average price of the shares traded on the ASX in the week leading up to and including the date of issue; |
| | • In case of resignation or termination on notice or dismissal for misconduct: LTI shares are forfeited; |
| | • In case of redundancy: the number of LTI shares that are released is pro rated according to the time held as a proportion of the vesting period; and |
| | • In case of retirement, death or total & permanent disablement: LTI shares are released to executives. |
| | Deferred Shares no longer form part of ANZ’s Executive LTI program, however there may be circumstances (such as retention) where this type of equity (including Deferred Share Rights) will be issued. |
46ANZ Annual Report 2009
REMUNERATION REPORT(Audited) (continued)
2.12. REMUNERATION PAID TO EXECUTIVES
Remuneration details of Executives for the years ended 30 September 2009 and 2008 are set out below in Table 17.
Overall the year-on-year total is higher but it must be noted that there are additional disclosed executives in this year’s table compared to 2008. Due to the change in composition, prior year figures are not provided in relation to the four newly included executives. This results in a distortion of year on year totals at the bottom of the table.
LTI equity grants awarded in 2009 are broadly unchanged from 2008. The overall actual STI payments are also only slightly higher than last year but this is consistent with the improvement in ANZ’s performance. However, despite these grants and payments remaining fairly consistent, the value expensed under share-based payments is significantly higher in 2009. This is due to the introduction of STI deferral last year which has resulted in the deferred STI portion being included for the first time in share-based payments expenses for the 2009 year.
For those Executives who were disclosed in both 2008 and 2009, the following are noted:
G Hodges – Fixed remuneration is unchanged and STI is slightly lower than last year, therefore, the year on year increase is attributable to the greater amount of amortisation of equity in 2009 which relates to prior year grants.
P Marriott – Fixed remuneration is also unchanged but the STI is higher than last year. The year on year increase is therefore attributable partly to the increased STI but also to the greater amount of amortisation of equity in the current year.
A Thursby – Fixed remuneration was reviewed last year and increased in October 2008. In 2009, Thursby has been awarded a higher STI amount reflecting very strong performance. The largest contributing factor to the year on year change is the amortisation of equity relating to prior grants, including sign-on arrangements.
Remuneration Report 47
REMUNERATION REPORT(Audited) (continued)
TABLE 17: EXECUTIVE REMUNERATION FOR 2009 AND 2008
| | | | | | | | | | | | | | | | | | | | | | | | |
| | | | | | Short-Term
Employee Benefits | | | Post-
Employment | |
| | | | | | | | | Non | | | Total | | | | | | | |
| | | | | | Cash | | | monetary | | | cash | | | | | | Super | |
| | | Financial | | | salary | | | benefits1 | | | incentive2,3 | | | Total | | | contributions4 | |
| | | Year | | | $ | | | $ | | | $ | | | $ | | | $ | |
Current Executives | | | | | | | | | | | | | | | | | | | | | | | | |
M Smith13 | | | 2009 | | | | 3,000,000 | | | | 5,000 | | | | 2,400,000 | | | | 5,405,000 | | | | — | |
Chief Executive Officer | | | 2008 | | | | 3,000,000 | | | | 566,567 | | | | 2,400,000 | | | | 5,966,567 | | | | — | |
D Cartwright | | | 2009 | | | | 850,000 | | | | 128,977 | | | | 465,000 | | | | 1,443,977 | | | | — | |
Group Managing Director, Operations, Technology and Shared Services | | | | | | | | | | | | | | | | | | | | | | | | |
S Elliott | | | 2009 | | | | 302,752 | | | | 8,905 | | | | 300,000 | | | | 611,657 | | | | 27,248 | |
Group Managing Director, Institutional | | | | | | | | | | | | | | | | | | | | | | | | |
J Fagg | | | 2009 | | | | 357,000 | | | | 63,814 | | | | 214,000 | | | | 634,814 | | | | — | |
Chief Executive Officer, New Zealand | | | | | | | | | | | | | | | | | | | | | | | | |
G Hodges10 | | | 2009 | | | | 1,012,631 | | | | 98,630 | | | | 530,000 | | | | 1,641,261 | | | | 34,679 | |
Deputy Chief Executive Officer and Acting Chief Executive Officer, Australia | | | 2008 | | | | 1,000,000 | | | | 90,705 | | | | 550,000 | | | | 1,640,705 | | | | — | |
P Marriott | | | 2009 | | | | 912,431 | | | | 9,426 | | | | 525,000 | | | | 1,446,857 | | | | 82,569 | |
Chief Financial Officer | | | 2008 | | | | 930,483 | | | | 9,786 | | | | 450,000 | | | | 1,390,269 | | | | 64,517 | |
C Page | | | 2009 | | | | 779,817 | | | | 301,988 | | | | 900,000 | | | | 1,981,805 | | | | 70,183 | |
Chief Risk Officer | | | | | | | | | | | | | | | | | | | | | | | | |
A Thursby | | | 2009 | | | | 1,000,000 | | | | 88,351 | | | | 1,400,000 | | | | 2,488,351 | | | | — | |
Chief Executive Officer, Asia Pacific, Europe & America | | | 2008 | | | | 875,000 | | | | 453,456 | | | | 1,050,000 | | | | 2,378,456 | | | | — | |
Former Executives | | | | | | | | | | | | | | | | | | | | | | | | |
R Edgar | | | 2009 | | | | 547,459 | | | | 5,656 | | | | 700,000 | | | | 1,253,115 | | | | 49,541 | |
Deputy Chief Executive Officer | | | 2008 | | | | 958,878 | | | | 9,786 | | | | 450,000 | | | | 1,418,664 | | | | 36,122 | |
B Hartzer11 | | | 2009 | | | | 1,138,052 | | | | 32,574 | | | | — | | | | 1,170,626 | | | | 102,798 | |
Chief Executive Officer, Australia | | | 2008 | | | | 1,460,741 | | | | 11,799 | | | | 850,000 | | | | 2,322,540 | | | | 32,246 | |
P Hodgson | | | | | | | | | | | | | | | | | | | | | | | | |
Group Manager Director, Institutional | | | 2008 | | | | 852,120 | | | | 8,905 | | | | — | | | | 861,025 | | | | 53,330 | |
Total of all Executive KMPs12 | | | 2009 | | | | 9,050,142 | | | | 614,344 | | | | 6,969,000 | | | | 16,633,486 | | | | 367,018 | |
| | | 2008 | | | | 9,077,222 | | | | 1,151,004 | | | | 5,750,000 | | | | 15,978,226 | | | | 186,215 | |
Total of all Disclosed Executives | | | 2009 | | | | 9,900,142 | | | | 743,321 | | | | 7,434,000 | | | | 18,077,463 | | | | 367,018 | |
| | | 2008 | | | | 9,077,222 | | | | 1,151,004 | | | | 5,750,000 | | | | 15,978,226 | | | | 186,215 | |
| 1 | Non-monetary benefits generally consists of salary packaged items such as car parking as well as company-funded benefits including preparation of Australian taxation returns by PwC. This item also includes costs met by the company in relation to relocation, such as airfares and housing assistance. The fringe benefits tax payable on any benefits is also included in this item. |
| 2 | The total cash incentive relates to the cash component only, with the deferred equity component to be amortised from the grant date. The relevant amortisation of the 2008 STI deferred components are included in share-based payments above. The 2009 STI deferred components will be amortised from the grant date in the 2010 Remuneration Report. The cash incentive component was approved by the Board on 20 October 2009. 100% of the cash incentive awarded for the 2008 and 2009 years vested to the Executive in the applicable financial year. |
| 3 | The possible range of STI payments is between 0 and 3 times target STI. The actual STI received is dependent on ANZ Group, Division and individual performance (refer to Section 2.6.3 for more details). The 2009 STI awarded (cash and equity component) as a percentage of target STI was: M Smith 150% (2008:80% plus additional option grant approved by shareholders in December 2008); D Cartwright 72%; S Elliott 100%; J Fagg 71%; G Hodges 72% (2008:75%); P Marriott 71% (2008:58%); C Page 157%; A Thursby 217% (2008:181%); R Edgar 100% pro-rated to cessation date (2008:58%); B Hartzer 0% (2008:83%); P Hodgson (2008:0%). Anyone who received less than 100% forfeited the rest of their STI entitlement. The minimum value is nil and the maximum value is what was actually paid. |
| 4 | As M Smith, D Cartwright and A Thursby are holders of long stay visas, their Fixed Remuneration does not include the 9% Superannuation Guarantee contribution, however they are able to elect voluntary superannuation contributions. |
| 5 | Accrual relates to Retirement Allowance. As a result of being employed with ANZ prior to November 1992, G Hodges is eligible to receive a Retirement Allowance on retirement, retrenchment, death, or resignation for illness, incapacity or domestic reasons. The Retirement Allowance is calculated as follows: 3 months of preserved notional salary (which is 65% of Fixed Remuneration) plus an additional 3% of notional salary for each year of full-time service above 10 years, less the total accrual value of long service leave (including taken and untaken). R Edgar was also entitled to a Retirement Allowance, which was paid to him on retirement and is included in the Termination Benefits amount. |
48ANZ Annual Report 2009
REMUNERATION REPORT(Audited) (continued)
| | | | | | | | | | | | | | | | | | | | | | | | | | | | | | | | | | | | | | | | | | |
Long-Term Employee Benefits | | | Share-Based Payments6 | | | | | | | | | | |
| | | | Long service | | | | | | | | | | | | | | | Total | | | Total | | | | | | | | | | |
| Retirement | | | leave | | | Total | | | Total | | | Total | | | Total | | | amortisation | | | amortisation | | | | | | Total | | | | |
| benefit | | | accrued | | | amortisation | | | amortisation | | | amortisation | | | amortisation | | | value of | | | of other | | | | | | excluding | | | | |
| accrued | | | during | | | value of | | | value of | | | value of | | | value of | | | performance | | | equity | | | Termination | | | termination | | | Grand Total | |
| during year5 | | | the year | | | STI shares | | | LTI shares | | | STI options | | | LTI options | | | rights | | | allocations7 | | | benefits8 | | | benefits | | | Remuneration9 | |
| $ | | | $ | | | $ | | | $ | | | $ | | | $ | | | $ | | | $ | | | $ | | | $ | | | $ | |
| | | | | | | | | | | | | | | | | | | | | | | | | | | | | | | | | | | | | | | | | | |
| | — | | | | 45,663 | | | | — | | | | — | | | | — | | | | — | | | | 2,341,479 | | | | 3,143,461 | | | | — | | | | 10,935,603 | | | | 10,935,603 | |
| | — | | | | 45,788 | | | | — | | | | — | | | | — | | | | — | | | | 1,839,734 | | | | 5,111,391 | | | | — | | | | 12,963,480 | | | | 12,963,480 | |
| | — | | | | 13,933 | | | | 160,485 | | | | — | | | | 189,057 | | | | — | | | | 310,957 | | | | 82,736 | | | | — | | | | 2,201,145 | | | | 2,201,145 | |
| | | | | | | | | | | | | | | | | | | | | | | | | | | | | | | | | | | | | | | | | | |
| | — | | | | 1,679 | | | | — | | | | — | | | | — | | | | — | | | | — | | | | 57,810 | | | | — | | | | 698,394 | | | | 698,394 | |
| | | | | | | | | | | | | | | | | | | | | | | | | | | | | | | | | | | | | | | | | | |
| | — | | | | 14,268 | | | | — | | | | — | | | | — | | | | — | | | | 222,457 | | | | 42,061 | | | | — | | | | 913,600 | | | | 913,600 | |
| | | | | | | | | | | | | | | | | | | | | | | | | | | | | | | | | | | | | | | | | | |
| | 28,588 | | | | (9,088 | ) | | | — | | | | — | | | | 132,340 | | | | — | | | | 790,098 | | | | — | | | | — | | | | 2,617,878 | | | | 2,617,878 | |
| | 3,035 | | | | 44,415 | | | | — | | | | 4,977 | | | | — | | | | 4,795 | | | | 701,280 | | | | — | | | | — | | | | 2,399,207 | | | | 2,399,207 | |
| | — | | | | 15,222 | | | | 80,239 | | | | — | | | | 94,529 | | | | — | | | | 670,933 | | | | — | | | | — | | | | 2,390,349 | | | | 2,390,349 | |
| | — | | | | 20,871 | | | | — | | | | 5,607 | | | | — | | | | 5,402 | | | | 709,626 | | | | — | | | | — | | | | 2,196,292 | | | | 2,196,292 | |
| | — | | | | 14,527 | | | | — | | | | — | | | | — | | | | — | | | | 115,909 | | | | — | | | | — | | | | 2,182,424 | | | | 2,182,424 | |
| | | | | | | | | | | | | | | | | | | | | | | | | | | | | | | | | | | | | | | | | | |
| | — | | | | 17,275 | | | | 272,832 | | | | — | | | | 321,397 | | | | — | | | | 356,711 | | | | 678,029 | | | | — | | | | 4,134,595 | | | | 4,134,595 | |
| | — | | | | 14,377 | | | | — | | | | — | | | | — | | | | — | | | | 174,414 | | | | 365,291 | | | | — | | | | 2,932,538 | | | | 2,932,538 | |
| | | | | | | | | | | | | | | | | | | | | | | | | | | | | | | | | | | | | | | | | | |
| | — | | | | — | | | | 115,782 | | | | — | | | | 138,865 | | | | — | | | | 233,660 | | | | — | | | | 421,902 | | | | 1,790,963 | | | | 2,212,865 | |
| | 19,298 | | | | 59,677 | | | | — | | | | 21,516 | | | | — | | | | 4,155 | | | | 506,025 | | | | — | | | | — | | | | 2,065,457 | | | | 2,065,457 | |
| | — | | | | — | | | | — | | | | — | | �� | | — | | | | — | | | | (762,604 | ) | | | — | | | | 212,967 | | | | 510,820 | | | | 723,787 | |
| | — | | | | 74,902 | | | | — | | | | 6,039 | | | | — | | | | 5,817 | | | | 780,312 | | | | — | | | | — | | | | 3,221,856 | | | | 3,221,856 | |
| | | | | | | | | | | | | | | | | | | | | | | | | | | | | | | | | | | | | | | | | | |
| | — | | | | — | | | | — | | | | 16,732 | | | | — | | | | 1,259 | | | | 200,327 | | | | — | | | | 1,334,282 | | | | 1,132,673 | | | | 2,466,955 | |
| | 28,588 | | | | 99,546 | | | | 468,853 | | | | — | | | | 687,131 | | | | — | | | | 3,968,643 | | | | 3,921,361 | | | | 634,869 | | | | 26,174,626 | | | | 26,809,495 | |
| | 22,333 | | | | 260,030 | | | | — | | | | 54,871 | | | | — | | | | 21,428 | | | | 4,911,718 | | | | 5,476,682 | | | | 1,334,282 | | | | 26,911,503 | | | | 28,245,785 | |
| | 28,588 | | | | 113,479 | | | | 629,338 | | | | — | | | | 876,188 | | | | — | | | | 4,279,600 | | | | 4,004,097 | | | | 634,869 | | | | 28,375,771 | | | | 29,010,640 | |
| | 22,333 | | | | 260,030 | | | | — | | | | 54,871 | | | | — | | | | 21,428 | | | | 4,911,718 | | | | 5,476,682 | | | | 1,334,282 | | | | 26,911,503 | | | | 28,245,785 | |
| 6 | In accordance with the requirements of AASB 2, the amortisation value includes a proportion of the fair value (taking into account market-related vesting conditions) of all equity that had not yet fully vested as at the commencement of the financial year. It is assumed that the options / performance rights will vest at the commencement of their exercise period (i.e. the shortest possible vesting period is assumed) and that deferred shares will vest after 3 years. The fair value is determined at grant date and is allocated on a straight-line basis over the relevant vesting period. The amount included as remuneration is not related to nor indicative of the benefit (if any) that may ultimately be realised should the options / performance rights become exercisable. For deferred shares, the fair value is the volume weighted average price of the Company’s shares traded on the ASX on the day the shares were granted. |
| 7 | Amortisation of other equity allocations for M Smith relates to the sign-on award and the special equity allocations which were approved by shareholders at the 2007 and 2008 Annual General Meetings respectively. Amortisation for S Elliott and A Thursby relates to equity granted on commencement – refer to Table 19 for more details; Amortisation for J Fagg relates to equity granted prior to commencement as a KMP but amortised and reflected since her commencement and inclusion as a KMP. |
| 8 | Termination benefits for R Edgar include retirement allowance and annual and long service leave entitlements payable on his retirement. Termination benefits for B Hartzer include annual and long service leave entitlements only which were payable on his cessation. |
| 9 | Remuneration amounts disclosed exclude insurance premiums paid by the consolidated entity in respect of directors’ and officers’ liability insurance contracts which cover current and former KMP of the controlled entities. The total premium, which cannot be disclosed because of confidentiality requirements, has not been allocated to the individuals covered by the insurance policy as, based on all available information, the directors believe that no reasonable basis for such allocation exists. |
| 10 | G Hodges’ 2009 cash salary includes an annual leave payment of $47,310, paid on change of contracts on transfer from New Zealand to Australia. |
| 11 | B Hartzer’s 2009 share-based payments amortisation reflects the reversal of previously amortised values due to the forfeiture of equity on cessation of his employment. |
| 12 | Total excludes D Cartwright who is included in the disclosures by virtue of being in the Top 5 highest remunerated executives and is not included under the definition of KMP. |
| 13 | While the CEO is an Executive Director he has been included in this table with other Executives. |
Remuneration Report 49
REMUNERATION REPORT(Audited) (continued)
3. Contract Terms
3.1. CEO’S CONTRACT TERMS
The following table sets out details of the contract terms relating to the CEO. The contract terms are in line with industry practice (based on external advice on Australian and international peer company benchmarks) and ASX Corporate Governance Principles.
TABLE 18: CONTRACT TERMS – CEO (M SMITH)
| | |
| |
| Length of Contract | | M Smith commenced as CEO and Executive Director of ANZ on 1 October 2007 on a rolling twelve month contract with a minimum term of three years. |
| |
| Notice Periods | | M Smith or ANZ may terminate the employment agreement by providing 12 months’ written notice. |
| |
| Resignation | | M Smith may resign by providing 12 months’ written notice. On resignation, all unexercised Performance Rights (or cash equivalent) and unvested sign-on award will be forfeited. |
| |
Termination on Notice by ANZ | | If ANZ terminates M Smith’s employment within the first 3 years, ANZ will give M Smith the greater of 12 months’ written notice or notice equal to the unexpired term of three years from commencement as CEO. ANZ may elect to pay in lieu all or part of the notice period based on M Smith’s Fixed Remuneration. On termination on notice by ANZ: All Performance Rights (or cash equivalent) which have vested or vest during the notice period will be retained and become exercisable; all Performance Rights (or cash equivalent) which have not yet vested will be retained and will vest and become exercisable subject to the relevant time and performance hurdles being satisfied. Sign-on award will vest in full. |
| |
Death or Total and Permanent Disablement | | All Performance Rights (or cash equivalent) and sign-on award will vest. |
| |
Termination for serious misconduct | �� | ANZ may immediately terminate the CEO’s employment at any time in the case of serious misconduct, and the CEO will only be entitled to payment of Fixed Remuneration up to the date of termination. Payment of statutory entitlements of long service leave and annual leave applies in all events of separation. On Termination without notice by ANZ in the event of serious misconduct: All Performance Rights (or cash equivalent) and sign-on award will be forfeited. |
3.2. EXECUTIVES’ CONTRACT TERMS
The following table sets out details of the contract terms relating to the Executives. The contract terms for all Executives are similar, but do, on occasion, vary to suit different needs.
TABLE 19: CONTRACT TERMS – EXECUTIVES
| | |
| |
| Length of Contract | | Rolling. |
| |
| Notice Periods | | In order to terminate the employment arrangements, Executives are required to provide the company with 6 months’ written notice, ANZ must provide Executives with 12 months’ written notice. |
| |
| Resignation | | Employment may be terminated by the Executive giving 6 months’ written notice. On resignation any options, performance rights and unvested deferred shares will be forfeited. |
| |
| Termination on Notice by ANZ | | ANZ may terminate the executive’s employment by providing 12 months’ written notice or payment in lieu of the notice period based on Fixed Remuneration. |
| |
| | There is discretion to pay STI on a pro-rata basis (depending on termination date, reason for termination and subject to business performance). |
| |
| | On termination on notice by ANZ any options, performance rights or LTI deferred shares that have vested, or will vest during the notice period will be released, in accordance with the ANZ Share Option Plan Rules. Options, performance rights or LTI shares that have not yet vested will generally be forfeited. (Although in relation to P Marriott there is a contractual requirement that equity granted prior to 1 October 2008 will vest in full.) Under the new mandatory deferral provisions of the STI program (effective from 2008), Executives must be in employment with ANZ and not in receipt of notice (given or received), to exercise vested STI deferred options or for vested STI deferred shares to be released in full. |
50ANZ Annual Report 2009
REMUNERATION REPORT(Audited) (continued)
TABLE 19: CONTRACT TERMS – EXECUTIVES (CONTINUED)
| | | | |
| Redundancy | | If ANZ terminates employment for reasons of bona fide redundancy, a severance payment will be made that is equal to 12 months’ Fixed Remuneration. All STI Deferred Shares are released. Options, Performance Rights and LTI Deferred Shares are either released in full or on a pro-rata basis, at the discretion of the Board with regard to the circumstances. There is discretion to pay short-term incentives on a pro-rata basis (depending on termination date and subject to business performance). |
| |
Death or Total and Permanent Disablement | | All Options, Performance Rights and Shares are released; pro-rata short-term incentive. |
| |
Termination for serious misconduct | | ANZ may immediately terminate the Executive’s employment at any time in the case of serious misconduct, and the employee will only be entitled to payment of Fixed Remuneration up to the date of termination. Payment of statutory entitlements of long service leave and annual leave applies in all events of separation. On Termination without notice by ANZ in the event of serious misconduct any Options, Performance Rights and Deferred Shares still held in trust will be forfeited. |
| |
| Other arrangements | | S Elliott |
| |
| | As part of S Elliott’s employment arrangement, he was granted Deferred Shares to a total value of $250,000. The grant was made following his commencement with one-half vesting after 1 year and the other half vesting after 2 years. |
| |
| | The Shares are restricted and held in trust for the beneficial interest of S Elliott, during which period they will be forfeited if employment ceases for any reason other than retrenchment, death or total and permanent disablement, and that for the whole period that the Shares remain in trust (including any further period) they will be forfeited for any serious misconduct. |
| |
| | A Thursby |
| |
| | As part of A Thursby’s employment arrangement, he was granted 3 separate tranches of Deferred Shares to the value of $1 million per annum, subject to Board approval. The first grant was to be made around the time of commencement with the subsequent two grants being awarded around his 1st and 2nd anniversaries with ANZ. The first tranche was approved by the Board on 3 September 2007, the second on 28 August 2008, and the third on 22 September 2009. |
| |
| | The Shares are restricted and held in trust for three years from the date of allocation for the beneficial interest of A Thursby, during which period they will be forfeited if employment ceases for any reason other than retrenchment, death or total and permanent disablement, and that for the whole period that the Shares remain in trust (including any further period) they will be forfeited for any serious misconduct. |
| | | | |
| |
| Signed in accordance with a resolution of the Directors | | COPY OF THE AUDITORS INDEPENDENCE DECLARATION |
| |
| | Lead Auditor’s Independence Declaration under Section 307C of the Corporations Act 2001 |
| |
| | To: the directors of Australia and New Zealand Banking Group Limited |
| | I declare that, to the best of my knowledge and belief, in relation to the audit for the financial year ended 30 September 2009 there have been: |
| |
| Charles B Goode | | (i) no contraventions of the auditor independence requirements as set out in the Corporations Act 2001 in relation to the audit; and |
| |
| Chairman | | (ii) no contraventions of any applicable code of professional conduct in relation to the audit. |
| | |

| |  | |  |
| | |
Michael R P Smith Director | | KPMG | | Melbourne |
| | |
5 November 2009 | | | | 5 November 2009 |
Remuneration Report 51
Corporate Governance
The following statement sets out the governance framework the Board has adopted at ANZ as well as highlights of the substantive work undertaken by the Board and its Committees during the financial year.
Approach to Governance
In relation to corporate governance, the Board seeks to:
| • | | embrace principles and practices it considers to be best practice internationally; |
| • | | be an ‘early adopter’, where possible, by complying before a published law or recommendation takes effect; and |
| • | | take an active role in discussions regarding the development of corporate governance best practice and associated regulation in Australia and overseas. |
Compliance with Corporate Governance Codes
ANZ has equity securities listed on the Australian (ASX) and New Zealand (NZX) Securities Exchanges and has debt securities listed on these and other overseas Securities Exchanges. As such, ANZ must comply with a range of listing and corporate governance requirements from both Australia and overseas.
AUSTRALIA
As a company listed on the ASX, ANZ is required to disclose how it has applied the Recommendations contained within the ASX Corporate Governance Council’s Corporate Governance Principles and Recommendations (ASX Governance Principles) during the financial year, explaining any departures from them.
Full details of the location of the references in this statement (and elsewhere in this Annual Report) which specifically set out how ANZ applies each Recommendation of the ASX Governance Principles are contained on www.anz.com >About us > Our company > Corporate governance.
NEW ZEALAND
As an overseas listed issuer on the NZX, ANZ is deemed to comply with the NZX Listing Rules provided that it remains listed on the ASX, complies with the ASX Listing Rules and provides the NZX with all the information and notices that it provides to the ASX.
The ASX Governance Principles may materially differ from the NZX’s corporate governance rules and the principles of the NZX’s Corporate Governance Best Practice Code. More information about the corporate governance rules and principles of the ASX can be found at www.asx.com.au and, in respect of the NZX, at www.nzx.com.
Irrespective of any differences, ANZ has complied with all applicable governance principles both in Australia and New Zealand throughout the financial year.
OTHER JURISDICTIONS
ANZ also monitors best practice developments in corporate governance across other relevant jurisdictions.
ANZ deregistered from the US Securities and Exchange Commission (SEC) with effect from October 2007. Despite no longer being required to comply with US corporate governance rules, ANZ has decided to continue with certain governance practices required under US regulations as being best practice, including practices in relation to the independence of Directors, the independence of the external auditor and the financial expertise of the Audit Committee, as described in this statement.
Recognition
ANZ has been assessed as the leading bank globally on the Dow Jones Sustainability Index (DJSI) for the third consecutive year. ANZ received a rating of 92/100 for Corporate Governance as part of this assessment.
In 2009, ANZ also received the Special Award for Governance Reporting (Private Sector) at the 2009 Australasian Reporting Awards for the second consecutive year.
Website
Full details of ANZ’s governance framework are set out at www.anz.com > About us > Our company > Corporate governance.
This section of ANZ’s website also contains copies of all the charters and summaries of many of the documents and policies mentioned in this statement, as well as summaries of other ANZ policies of interest to shareholders and stakeholders. The website is regularly updated to ensure it reflects ANZ’s most recent corporate governance information.
52ANZ Annual Report 2009
CORPORATE GOVERNANCE (Continued)
Directors
The below information relates to the Directors in office, and sets out their Board Committee memberships and other details, as at 30 September 2009.
| | |
Mr C B Goode, AC Chairman, Independent Non-Executive Director |
BCOM (HONS), MBA (COLUMBIA), HON LLD (MELB), HON LLD (MONASH) Non-executive director since July 1991. Mr Goode was appointed Chairman in August 1995 and is an ex officio member of all Board Committees. Skills, experience and expertise: Mr Goode has a background in the finance industry and has been a professional non-executive director since 1989. Mr Goode brings a wide range of skills and significant experience of the finance industry to his role as Chairman of the Board. Current Directorships: Chairman: Australian United Investment Company Limited (Director from 1990), Diversified United Investment Limited (Director from 1991), Grosvenor Australia Properties Pty Ltd (Director from 2008)and The Ian Potter Foundation Ltd (Director from 1987). | | Member: International Council of the Asia Society (from 2000), Asia Society Australasia Centre (from 2003), AsiaLink Council (from 2002) and The Global Foundation (from 1999). Former Directorships include: Former Chairman: Woodside Petroleum Limited (Director 1988–2007, Chairman 1999–2007). Former President: Howard Florey Institute of Experimental Physiology and Medicine (Director 1987–2006, President 1997–2004). Former Director: Singapore Airlines Limited (1999–2006). Age: 71. Residence: Melbourne. Mr Goode will retire from the Board in February 2010 and will be succeeded by Mr Morschel as Chairman. |
Mr M R P Smith, OBE Chief Executive Officer, Executive Director |
BSC (HONS) Chief Executive Officer since 1 October 2007. Skills, experience and expertise: Mr Smith is an international banker with over 30 years experience in banking operations in Asia, Australia and internationally. Until June 2007, he was President and Chief Executive Officer, The Hong Kong and Shanghai Banking Corporation Limited, Chairman, Hang Seng Bank Limited, Global Head of Commercial Banking for the HSBC Group and Chairman, HSBC Bank Malaysia Berhad. Previously, Mr Smith was Chief Executive Officer of HSBC Argentina Holdings SA. Mr Smith joined the HSBC Group in 1978 and during his international career he has held a wide variety of roles in Commercial, Institutional and Investment Banking, Planning and Strategy, Operations and General Management. | | Current Directorships: Director: ANZ National Bank Limited (from 2007) and The Financial Markets Foundation for Children (from 2008). Member: Chongqing Mayor’s International Economic Advisory Council (from 2006), Australian Bankers’ Association Incorporated (from 2007), Asia Business Council (from 2008), Financial Literacy Advisory Board (from 2008) and Visa Asia Pacific Senior Advisory Council (from 2009). Fellow: The Hong Kong Management Association (from 2005). Former Directorships include: Former Chairman: HSBC Bank Malaysia Berhad (2004–2007) and Hang Seng Bank Limited (2005–2007). Former CEO and Director: The Hong Kong and Shanghai Banking Corporation Limited (2004–2007). Former Director: HSBC Australia Limited (2004–2007), HSBC Finance Corporation (2006–2007) and HSBC Bank (China) Company Limited (2007). Former Board Member: Visa International (Asia Pacific) Limited (2005–2007). Age: 53. Residence: Melbourne. |
Dr G J Clark Independent Non-Executive Director, Chairman of the Technology Committee |
BSC (HONS), PHD, FAPS, FTSE | | Current Directorships: |
Non-executive director since February 2004. Dr Clark is a member of the Governance Committee and the Human Resources Committee. Skills, experience and expertise: Dr Clark is Principal of Clark Capital Partners, a US based firm that advises internationally on technology and the technology market place. Previously he held senior executive positions in IBM, News Corporation, and Loral Space and Communications. He brings to the Board international business experience and a distinguished career in micro-electronics, computing and communications. | | Chairman: KaComm Communications Pty Ltd (Director from 2006). Director: Eircom Holdings Ltd (formerly Babcock & Brown Capital Limited) (from 2006). Former Directorships include: Former Chairman: GPM Classified Directories (2007–2008). Former Director: James Hardie Industries NV (2002–2006). Age: 66. Residence: Based in New York, United States of America and also resides in Sydney. |
Corporate Governance 53
CORPORATE GOVERNANCE (continued)
| | |
Mr J K Ellis Independent Non-Executive Director |
MA OXON, FAICD, FAUS IMM, FTSE, HON LLD (MONASH), HON DR ENG (C.Q.U), HON FIE AUST Non-executive director since October 1995. Mr Ellis is a member of the Audit Committee and the Technology Committee. Skills, experience and expertise: Mr Ellis brings to the Board his analytical skills together with his practical understanding of operational issues, investments and acquisitions arising from his involvement across a range of sectors including natural resources, manufacturing, biotechnology and education. Current Directorships: Chairman: Landcare Australia Limited (from 2004), Future Eye Pty Ltd Advisory Board (from 2008), Pacific Road Corporate Finance Pty Limited Advisory Board (Director from 2002), Earth Resources Development Council (from 2006) and MBD Energy Limited (from 2009). | | Director: Future Directions International Pty Ltd (from 2003). Member: The Sentient Group Advisory Council (from 2001) and Anglo American plc’s Australian Advisory Board (from 2006). Former Directorships include: Former Chairman: The Broken Hill Proprietary Company Limited (Director 1991–1999, Chairman 1997–1999), Pacifica Group Limited (Chairman and Director 1999–2007) and Golf Australia (2005–2008). Former Chancellor: Monash University (1999–2007). Age: 71. Residence: Melbourne. Mr Ellis will retire from the Board with effect from the end of the 2009 Annual General Meeting. |
Mr P A F Hay Independent Non-Executive Director | | |
LLB (MELB) | | Current Directorships: |
Non-executive director since November 2008. Mr Hay is a member of the Risk Committee and Governance Committee. Skills, experience and expertise: Mr Hay has a strong background in company law and investment banking advisory work, with a particular expertise in relation to mergers and acquisitions. He has also had significant involvement in advising governments and government-owned enterprises. | | Chairman: Lazard Pty Ltd Advisory Board (from 2009). Director: Alumina Limited (from 2002), Landcare Australia Limited (from 2008), GUD Holdings Limited (from 2009) and NBN Co Limited (from 2009). Part Time Member: Takeovers Panel (from 2009). Former Directorships include: Former Chief Executive Officer: Freehills (2000–2005). Former Director: Pacifica Group Limited (1989–2008) and Lazard Pty Ltd (2007–2009). Age: 59. Residence: Melbourne. |
Mr Lee Hsien YangIndependent Non-Executive Director | | |
MSC, BA Non-executive director since February 2009. Mr Lee is a member of the Technology Committee. Skills, experience and expertise: Mr Lee is one of Asia’s most respected business leaders and hasconsiderable knowledge of the region. He has a background in engineering and brings to the Board his international business and management experience across a wide range of sectors including food and beverages, properties, publishing and printing, telecommunications, financial services, education, civil aviation and land transport. Current Directorships: Chairman: Fraser & Neave, Limited (from 2007) and Civil Aviation Authority of Singapore (from July 2009). Director: Singapore Exchange Limited (from 2004), The Islamic Bank of Asia Limited (from 2007) | | and Kwa Geok Choo Pte Ltd (from 1979). Member: Governing Board of Lee Kuan Yew School of Public Policy (from 2005), Rolls Royce International Advisory Council (from 2007) and Merrill Lynch PacRim Advisory Council (from 2007). Consultant: Capital International Inc Advisory Board (from 2007). Former Directorships include: Former Chairman: Republic Polytechnic (2002–2009). Former Director: SingTel Optus Pty Limited (2002–2007), Singapore Post Limited (1995–2007), L & L Services Pte Ltd (2004–2008) and Board of INSEAD (1999–2007). Former Member: Textron International Advisory Council (1999–2008). Former Chief Executive Officer: Singapore Telecommunications Limited (1995–2007). Age: 52. Residence: Singapore. |
54ANZ Annual Report 2009
CORPORATE GOVERNANCE (continued)
| | |
Mr I J Macfarlane, AC Independent Non-Executive Director, Chairman of the Governance Committee |
BEC (HONS), MEC, HON DSC (SYD), HON DSC (UNSW), HON DCOM (MELB), HON DLITT (MACQ), HON LLD (MONASH) Non-executive director since February 2007. Mr Macfarlane is a member of the Risk Committee and the Technology Committee. Skills, experience and expertise: During his 28 year career at the Reserve Bank of Australia including a 10 year term as Governor, Mr Macfarlane made a significant contribution to economic policy in Australia and internationally. He has a deep understanding of financial markets as well as a long involvement with Asia. Current Directorships: Director: Woolworths Limited (from 2007), Leighton Holdings Limited (from 2007) and the Lowy Institute for International Policy (from 2004). | | Member: Council of International Advisors to the China Banking Regulatory Commission (from 2009), International Advisory Board of Goldman Sachs JB Were (from 2007) and International Advisory Board of CHAMP Private Equity (from 2007). Former Directorships include: Former Chairman: Payments System Board (1998–2006), Australian Council of Financial Regulators (1998–2006) and Financial Markets Foundation for Children (1996–2006). Former Governor: Reserve Bank of Australia (Member 1992–2006, Chairman 1996–2006). Age: 63. Residence: Sydney. |
Mr D E MeiklejohnIndependent Non-Executive Director, Chairman of the Audit Committee |
BCOM, DIPED, FCPA, FAICD, FAIM | | Current Directorships: |
Non-executive director since October 2004. Mr Meiklejohn is a member of the Governance Committee and the Risk Committee. Skills, experience and expertise: Mr Meiklejohn has a strong background in finance and accounting. He also brings to the Board his experience across a number of directorships of major Australian companies spanning a rangeof industries. | | Chairman: PaperlinX Limited (Director from 1999). Director: Coca Cola Amatil Limited (from 2005) and Mirrabooka Investments Limited (from 2006). President: Melbourne Cricket Club (Committee member from 1987). Former Directorships include: Former Director and Chief Financial Officer: Amcor Limited (1985–2000). Age: 67. Residence: Melbourne. |
Mr J P MorschelIndependent Non-Executive Director, Chairman of the Risk Committee |
DIPQS, FAICD Non-executive director since October 2004. Mr Morschel is a member of the Human Resources Committee. Skills, experience and expertise: Mr Morschel has a strong background in banking, financial services and property and brings the experience of being a Chairman and director of major Australian and international companies. Current Directorships: Director: Singapore Telecommunications Limited (from 2001), | | Tenix Pty Limited (from 1998) and Gifford Communications Pty Limited (from 2000). Former Directorships include: Former Chairman: Rinker Group Limited (Chairman and Director 2003–2007), Leighton Holdings Limited (Chairman and Director 2001–2004) and CSR Limited (Director 1996–2003, Chairman 2001–2003). Former Director: Rio Tinto Plc (1998–2005), Rio Tinto Limited (1998–2005), Westpac Banking Corporation (1993–2001) and Lend Lease Corporation Limited (1983–1995). Age: 66. Residence: Sydney. |
Ms A M Watkins Independent Non-Executive Director, Chairman of the Human Resources Committee |
BCOM, FCA, F FIN, MAICD Non-executive director since November 2008. Ms Watkins is a member of the Audit Committee. Skills, experience and expertise: Ms Watkins is an experienced CEO and established director with a grounding in finance and accounting. Her experience includes retailing, agriculture, food manufacturing and financial services, and covers small to medium companies as well as large organisations. | | Current Directorships: Chief Executive Officer: Bennelong Group (from 2008). Director: Woolworths Limited (from 2007), Yarra Capital Partners Pty Ltd (from 2008), AICD Victorian Council (from 2007) and The Nature Conservancy Australian Advisory Board (from 2007). Former Directorships include: Former Chairman: Mrs Crocket’s Kitchen (2006–2007). Former CEO: Berri Limited (2002–2005). Former Director: Just Group Limited (2004–2008). Former Partner: McKinsey & Company (1996–1999). |
| | Age: 46. Residence: Melbourne. |
Corporate Governance 55
CORPORATE GOVERNANCE (continued)
Board Responsibility and Delegation of Authority
The Board is chaired by an independent non-executive Director. The roles of the Chairman and Chief Executive Officer are separate, and the Chief Executive Officer is the only executive Director on the Board.
Role of the Chairman
The Chairman plays an important leadership role and is involved in:
| • | | chairing meetings of the Board and providing effective leadership to it; |
| • | | monitoring the performance of the Board and the mix of skills and effectiveness of individual contributions; |
| • | | being a member of all principal Board Committees; |
| • | | maintaining ongoing dialogue with the Chief Executive Officer and providing appropriate mentoring and guidance; and |
| • | | being a respected ambassador for ANZ, including chairing meetings of shareholders and dealing with key customer, political and regulatory parties. |
Board Charter
The Board Charter clearly sets out the Board’s purpose, powers, and specific responsibilities.
The Board is responsible for:
| • | | charting the direction, strategies and financial objectives for ANZ and monitoring the progress in relation to such matters; |
| • | | monitoring compliance with regulatory requirements, ethical standards and external commitments; |
| • | | appointing and reviewing the performance of the Chief Executive Officer; and |
| • | | reporting to shareholders on ANZ’s performance. |
In addition to the above and any matters expressly required by law to be approved by the Board, powers specifically reserved for the Board include:
| • | | approval of appointment of senior executives to roles leading ANZ businesses or functions and reporting to the Chief Executive Officer (Board Appointees); |
| • | | any matters in excess of any discretions delegated to Board Committees or the Chief Executive Officer; |
| • | | annual approval of the budget and strategic plan; |
| • | | annual approval of the remuneration and conditions of service for any executive Directors, direct reports to the Chief Executive Officer and other key executives; |
| • | | significant changes to organisational structure; and |
| • | | the acquisition, establishment, disposal or cessation of any significant business. |
Under ANZ’s Constitution, the Board may delegate any of its powers and responsibilities to Committees of the Board. The roles of the principal Board Committees are set out on pages 60 to 64.
Substantive areas of focus for the Board in the 2009 financial year included oversight of:
| • | | the management of ANZ’s businesses in the context of the global financial crisis and economic downturn, including in particular ANZ’s capital and funding requirements; |
| • | | succession planning for the role of the Chairman of the Board; |
| • | | new Director appointments; |
| • | | completion of the “One ANZ” restructure, and remediation work arising from the Securities Lending Review; and |
| • | | the ongoing implementation of ANZ’s strategies in relation to its super regional aspirations. |
Board Meetings
The Board normally meets at least 8 times each year, including an offsite meeting to review in detail the Group’s strategy.
Typically at Board meetings the agenda will include:
| • | | minutes of the previous meeting, and outstanding issues raised by Directors at previous meetings; |
| • | | the Chief Executive Officer’s report; |
| • | | the Chief Financial Officer’s report; |
| • | | reports on major projects and current business issues; |
| • | | specific business proposals; |
| • | | reports from Chairs of Committees which have met since the last Board meeting on matters considered at those meetings; and |
| • | | for review, the minutes of Committee meetings which have occurred since the last Board meeting. |
There are two private sessions held at the end of each Board meeting which are each chaired by the Chairman of the Board.
The first involves all Directors including the CEO, and the second involves only the non-executive Directors.
The Chief Financial Officer, Group General Counsel and Company Secretary are also present at all Board meetings. Members of senior management attend Board meetings when an issue under their area of responsibility is being considered or as otherwise requested by the Board.
CEO and Delegation to Management
The Board has delegated to the Chief Executive Officer, and through the Chief Executive Officer to other senior management, the authority and responsibility for managing the everyday affairs of ANZ. The Board monitors management and performance on behalf of shareholders.
The Group Discretions Policy details the comprehensive discretions framework that applies within ANZ and to employees appointed to operational roles or directorships of related entities.
The Group Discretions Policy is maintained by the Chief Financial Officer and reviewed annually by the Audit Committee with the outcome of this review reported to the Board.
56 ANZ Annual Report 2009
CORPORATE GOVERNANCE (continued)
At a senior management level, ANZ has a Management Board which comprises the Chief Executive Officer and ANZ’s most senior executives.
As at 30 September 2009, the following senior executives, in addition to the Chief Executive Officer, were members of Management Board: Graham Hodges – Deputy Chief Executive Officer and Acting Chief Executive Officer, Australia*; Peter Marriott – Chief Financial Officer; Jenny Fagg – Chief Executive Officer, New Zealand; Alex Thursby – Chief Executive Officer, Asia Pacific, Europe and America; Shayne Elliott – Group Managing Director, Institutional; David Hisco – Group Managing Director, Commercial Banking; David Cartwright – Group Managing Director, Operations, Technology and Shared Services; Susie Babani – Group Managing Director, Human Resources; Chris Page – Chief Risk Officer; and Joyce Phillips – Group Managing Director, Strategy, M&A, Marketing and Innovation.
(* From November 2009, Philip Chronican will join ANZ as Chief Executive Officer, Australia).
Typically, the Management Board meets every week and has a full day meeting each month to discuss business performance, review shared initiatives and build collaboration and synergy across the Group.
One ANZ
In September 2008, ANZ announced a new business model and organisational structure to accelerate progress with its strategy to become a super regional bank, lift customer focus and drive performance improvement.
ANZ is now organised around its three geographies – Australia, New Zealand and Asia Pacific, Europe & America – and its global Institutional client business. Each geography mainly focuses on two customer segments – Retail and Commercial, which are co-ordinated globally.
The new structure became effective during the year.
Internal Review
On 22 August 2008, ANZ released the findings of the Review Committee which examined ANZ’s involvement in Securities Lending and its relationship with Broker clients including the Opes Prime group.
ANZ pursued a remediation program to address the 13 recommendations arising from the Review. Remedial actions are well progressed and ANZ has kept APRA fully informed.
ANZ continues to focus on ensuring the remedial initiatives are operationally effective and achieve their intended outcomes.
Board Composition, Selection and Appointment
The Board strives to achieve a balance of skills, knowledge, experience, tenure and perspective among its Directors. Details regarding the skills, experience and expertise of each Director in office at the date of this Annual Report can be found on pages 53 to 55.
The Governance Committee (see page 62) has been delegated responsibility for the director nomination process. The Committee reviews the size and composition of the Board and assesses whether there is a need for any new non-executive Director appointments.
Nominations may be provided from time to time to the Chairman of the Governance Committee. The Committee also reviews and recommends the process for the election of the Chairman of the Board and reviews succession planning for the Chairman of the Board, making recommendations to the Board as appropriate.
The Committee assesses potential new Director candidates against Board approved selection criteria including integrity, fitness and propriety, skills, qualifications, experience, communication capabilities and community standing. If found suitable, and where there is a need for any new appointments, candidates are recommended to the Board. Otherwise, the Chairman of the Committee maintains names of suitable candidates for succession purposes.
The Chairman of the Board is responsible for approaching potential candidates. This process is formalised in the Board Renewal and Performance Evaluation Policy.
The composition of the principal Board Committees is reviewed annually by the Board.
APPOINTMENT DOCUMENTATION
Each new non-executive Director receives an appointment letter accompanied by a:
| • | | Directors’ Handbook – The Handbook includes information on a broad range of matters relating to the role of a Director, including details of all applicable policies; and |
| • | | Directors’ Deed – Each Director signs a Deed in the form approved by shareholders at the 2005 Annual General Meeting which covers a number of issues including indemnity, directors’ and officers’ liability insurance, the right to obtain independent advice and requirements concerning confidential information. |
UNDERTAKING INDUCTION TRAINING
Every new Director takes part in a formal induction program which involves the provision of information regarding ANZ’s values and culture, the Group’s governance framework, the non-executive Directors Code of Conduct and Ethics, Director related policies, Board and Committee policies, processes and key issues, financial management and business operations. A briefing is also provided by senior management about matters concerning their areas of responsibility.
MEETING SHARE QUALIFICATION
Non-executive Directors are required to accumulate within 5 years of appointment, and thereafter maintain, a holding in ANZ shares that is equivalent to at least 100% of a non-executive Director’s base fee (and 200% of this fee in the case of the Chairman).
ELECTION AT NEXT ANNUAL GENERAL MEETING
Subject to the provisions of ANZ’s Constitution and the Corporations Act 2001, the Board may appoint a person as a non-executive Director of ANZ at any time but that person must retire and, if they wish to continue in that role, must seek election by shareholders at the next Annual General Meeting.
Corporate Governance 57
CORPORATE GOVERNANCE(continued)
FIT AND PROPER
ANZ has a robust framework in place to ensure that individuals appointed to relevant senior positions within the Group have the appropriate fitness and propriety to properly discharge their prudential responsibilities both on appointment and throughout the course of their appointment.
The framework, set out in ANZ’s Fit and Proper Policy, addresses the requirements of APRA’s Fit and Proper Prudential Standard. It involves assessments being carried out for each Director, relevant senior executives and the external auditor prior to a new appointment being made. These assessments are carried out against a benchmark of documented competencies which have been prepared for each role, and also involve attestations being completed by each individual, as well as the obtaining of evidence of material qualifications and the carrying out of checks such as criminal record, bankruptcy and regulatory disqualification checks.
These assessments are reviewed thereafter on an annual basis. The Governance Committee and the Board have responsibility for assessing the fitness and propriety of non-executive Directors. The Human Resources Committee is responsible for assessing the fitness and propriety of the Chief Executive Officer and key senior executives. The Audit Committee is responsible for assessing the fitness and propriety of the external auditor.
Fit and Proper assessments were carried out in respect of each non-executive Director, the Chief Executive Officer, key senior executives and the external auditor during the 2009 financial year.
INDEPENDENCE AND MATERIALITY
Under ANZ’s Board Charter, the Board must contain a majority of non-executive Directors who satisfy ANZ’s criteria for independence.
The Board Charter sets out independence criteria in order to establish whether a non-executive Director has a relationship with ANZ which could (or could be perceived to) impede their decision-making.
All non-executive Directors are required to notify the Chairman of a potential change in their outside Board appointments. The Chairman reviews the proposed appointments and will consult with other Directors as the Chairman deems appropriate.
In the 2009 financial year, the Board conducted its annual review of criteria for independence against the ASX Governance Principles and APRA Prudential Standards, as well as US director independence requirements.
ANZ’s criteria are more comprehensive than those set in many jurisdictions including in particular criteria stipulated specifically for Audit Committee members. The criteria and review process are both set out in the Corporate Governance section of ANZ’s website.
In summary, a relationship with ANZ is regarded as material if a reasonable person would expect there to be a real and sensible possibility that it would influence a Director’s mind in:
| • | | making decisions on matters likely to come regularly before the Board or its Committees; |
| • | | objectively assessing information and advice given by management; |
| • | | setting policy for general application across ANZ; and |
| • | | generally, carrying out the performance of his or her role as a Director. |
During 2009, the Board considered each non-executive Director’s independence and concluded that the independence criteria were met by each non-executive Director.
Directors’ biographies on pages 53 to 55 and on anz.com highlight their major associations outside of ANZ.
CONFLICTS OF INTEREST
Over and above the issue of independence, each Director has a continuing responsibility to determine whether he or she has a potential or actual conflict of interest in relation to any material matter which comes before the Board. Such a situation may arise from external associations, interests or personal relationships.
Under the Directors Disclosure of Interest Policy and Policy for Handling Conflicts of Interest, a Director may not exercise any influence over the Board if a potential conflict of interest exists.
In such circumstances, the Director may not receive relevant Board papers and, unless the other Directors have resolved to the contrary, may not be present for Board deliberations on the subject, and may not vote on any related Board resolutions. These matters, should they occur, are recorded in the Board minutes.
INDEPENDENT ADVICE
In order to assist Directors in fulfilling their responsibilities, each Director has the right (with the prior approval of the Chairman) to seek independent professional advice regarding his/her responsibilities at the expense of ANZ. In addition, the Board and each Committee, at the expense of ANZ, may obtain whatever professional advice it requires to assist in its work.
TENURE AND RETIREMENT
ANZ’s Constitution, consistent with the ASX Listing Rules, provides that a non-executive Director must seek re-election by shareholders every 3 years if they wish to continue in their role as a non-executive Director.
In addition, ANZ’s Board Renewal and Performance Evaluation Policy confirms that non-executive Directors will retire once they have served a maximum of three 3-year terms after first being elected by shareholders unless invited by the Board to extend their tenure due to special circumstances. This Policy applies to current non-executive Directors except where there is an agreed retirement plan that has been made public and it also applies to future non-executive Directors.
58ANZ Annual Report 2009
CORPORATE GOVERNANCE(continued)
CONTINUING EDUCATION
ANZ Directors take part in a range of training and continuing education programs. In addition to a formal induction program (see page 57), Directors also receive a quarterly bulletin designed to keep them abreast of matters relating to their duties and responsibilities as Directors.
Each Committee also conducts its own continuing education sessions from time to time as appropriate. Internal and/or external experts are engaged to conduct all education sessions. Directors also receive regular business briefings at Board meetings. These briefings are intended to provide Directors with information on each area of ANZ’s business, in particular regarding performance, key issues, risks and strategies for growth. In addition, Directors have the opportunity to participate in site visits from time to time.
ACCESS TO DIRECTORS
Management is able to consult Directors as required. Employees have access to the Directors directly or through the Company Secretary. Shareholders who wish to communicate with the Directors may direct correspondence to a particular Director, or to the non executive Directors as a whole.
Role of Company Secretary
The Board is responsible for the appointment of ANZ’s Company Secretaries. The Board has appointed three Company Secretaries. The Group General Counsel provides legal advice to the Board as and when required. He works closely with the Chairman of the Governance Committee to develop and maintain ANZ’s corporate governance principles, and is responsible to the Board for the Company Secretary’s Office function.
The Company Secretary is responsible for the day-to-day operations of the Company Secretary’s Office including lodgements with relevant Securities Exchanges and other regulators, the administration of Board and Board Committee meetings (including preparation of meeting minutes), the management of dividend payments and associated share plans, the administration of the Group’s Australian subsidiaries and oversight of the relationship with ANZ’s Share Registrar.
The Chief Financial Officer is also appointed as a Company Secretary. Profiles of ANZ’s Company Secretaries can be found in the Directors’ Report on page 20.
Performance Evaluations
OVERVIEW
The framework used to assess the performance of Directors is based on the expectation that they are performing their duties in a manner which should create and continue to build sustainable value for shareholders, and in accordance with the duties and obligations imposed upon them by ANZ’s Constitution and the law.
The performance review takes into account each Director’s contribution across various criteria including:
| • | | the charting of direction, strategy and financial objectives for ANZ; |
| • | | the monitoring of compliance with regulatory requirements and ethical standards; |
| • | | the monitoring and assessing of management performance in achieving strategies and budgets approved by the Board; |
| • | | the setting of criteria for, and evaluation of, the Chief Executive Officer’s performance; and |
| • | | the regular and continuing review of executive succession planning and executive development activities. |
The performance evaluation process is set out in ANZ’s Board Renewal and Performance Evaluation Policy.
NON-EXECUTIVE DIRECTORS
Non-executive Director performance evaluations are conducted in two ways:
| • | | Annual review – On an annual basis, or more frequently if appropriate, the Chairman has a one-on-one meeting with each non-executive Director specifically addressing the performance criteria including compliance with the non-executive Directors Code of Conduct and Ethics. To assist the effectiveness of these meetings, the Chairman is provided with objective information about each Director (e.g. number of meetings attended, Committee memberships, other current directorships etc) and a guide for discussion to ensure consistency. A report on the outcome of these meetings is provided to the Governance Committee and to the Board. |
| • | | Re-election statement – Non-executive Directors when nominating for re-election are given the opportunity to submit a written or oral statement to the Board setting out the reasons why they seek re-election. In the non-executive Director’s absence, the Board evaluates this statement (having regard to the performance criteria) when it considers whether to endorse the relevant Director’s re-election. |
Corporate Governance 59
CORPORATE GOVERNANCE(continued)
CHAIRMAN OF THE BOARD
An annual review of the performance of the Chairman of the Board is facilitated by the Chairman of the Governance Committee who seeks input from each Director individually on the performance of the Chairman of the Board against the competencies for the Chairman’s role approved by the Board.
The Chairman of the Governance Committee collates the input in order to provide an overview report to the Governance Committee and to the Board, as well as feedback to the Chairman of the Board.
THE BOARD
During 2008/09, the performance of the Board in respect of the previous year was assessed using an independent external facilitator, who sought input from each Director and certain members of senior management when carrying out the assessment.
It is expected that externally facilitated reviews will occur approximately every three years. The review process in the intervening years will consider progress against any recommendations implemented arising from the most recent externally facilitated review, together with any new issues that may have arisen, and will be conducted internally.
BOARD COMMITTEES
Each of the principal Board Committees conducts an annual Committee performance self-assessment to review performance using Guidelines approved by the Governance Committee. The Guidelines set out that at a minimum, the self-assessments should review and consider the following:
| • | | the scope of the Committee’s responsibilities and duties as enshrined in its Charter; |
| • | | the Committee’s performance against its Charter and annual calendar of business; |
| • | | the Committee’s performance against any goals or objectives it set itself for the year under review; |
| • | | major issues that faced the Committee during the year; and |
| • | | the identification of future topics for training/education of the Committee. |
The outcomes of the performance self-assessments, along with plans and objectives for the new financial year, are submitted to the Governance Committee (and, in the case of the Governance Committee, to the Board) for discussion and noting.
SENIOR MANAGEMENT
Details of how the performance evaluation process is undertaken in respect of the Chief Executive Officer (by the Board) and other key senior executives (by the Human Resources Committee), including how financial, operational and qualitative measures are assessed, are set out in the Remuneration Report on pages 24 to 25.
REVIEW PROCESSES UNDERTAKEN
Board and relevant senior management evaluations in accordance with the above processes have been undertaken in respect of the 2008/09 reporting period with one exception. During the year, the Chairman of the Board announced that he would be retiring in February 2010 and, in these circumstances, it was believed unnecessary and of no benefit to carry out a performance review of the Chairman.
Board Committees
As set out on page 56 of this statement, the Board has the ability under its Constitution to delegate its powers and responsibilities to Committees of the Board. This allows the Board to spend additional and more focused time on specific issues. ANZ’s Board has five principal Board Committees: Audit Committee, Governance Committee, Human Resources Committee, Risk Committee and Technology Committee.
MEMBERSHIP AND ATTENDANCE
Each of the principal Board Committees is comprised solely of independent non-executive Directors, has its own Charter and has the power to initiate any special investigations it deems necessary.
Membership criteria are based on each Director’s skills and experience, as well as his/her ability to add value and commit time to the Committee. Composition is reviewed annually by the Board.
The Chairman is an ex-officio member of each principal Board Committee. The Chief Executive Officer is invited to attend Board Committee meetings as appropriate. His presence is not automatic, however, and he does not attend any meeting where his remuneration is considered or discussed, nor does he attend the non-executive Director private sessions of Committees. Non-executive Directors may attend any meeting of any Committee.
Each Board Committee may, within the scope of its responsibilities, have unrestricted access to management, employees and information it considers relevant and necessary to the carrying out of its responsibilities under its Charter.
Each Board Committee may require the attendance of any ANZ officer or employee, or request the attendance of any external party, at meetings as appropriate.
MEETINGS
The principal Board Committees plan their annual agendas following a process approved by the Board. The offices of the executives who are appointed to assist the Chairman of each Board Committee liaise in order to review the calendars of business prepared by each Committee and identify any potential gaps and unnecessary overlaps between the Committees. Any issues arising from this are reported to, and resolved by, the relevant Committee Chairman. The results of this process are then reported to the Governance Committee to assist the Board in fulfilling its oversight responsibilities in respect of the delegations it has made to the various Board Committees.
Committees report at the next Board meeting through the Committee Chairman. When there is a cross-Committee item, the Committees will communicate with each other through their Chairman. Throughout the year, Committee Chairman also conduct agenda planning meetings involving relevant stakeholders to take account of emerging issues.
60ANZ Annual Report 2009
CORPORATE GOVERNANCE(continued)
ANZ BOARD COMMITTEE MEMBERSHIPS – as at 30 September 2009
| | | | | | | | |
Audit | | Governance | | Human Resources | | Risk | | Technology |
| Mr D E MeiklejohnFE, C | | Mr I J MacfarlaneC | | Ms A M Watkins3C | | Mr J P MorschelC | | Dr G J ClarkC |
| Mr J K Ellis | | Dr G J Clark | | Dr G J Clark4 | | Mr P A F Hay2 | | Mr J K Ellis |
| Ms A M Watkins1 | | Mr P A F Hay2 | | Mr J P Morschel | | Mr I J Macfarlane | | Mr I J Macfarlane |
| Mr C B Goode (ex Officio) | | Mr D E Meiklejohn | | Mr C B Goode (ex Officio) | | Mr D E Meiklejohn | | Mr Lee Hsien Yang5 |
| Mr C B Goode (ex Officio) | | | | | | Mr C B Goode (ex Officio) | | Mr C B Goode (ex Officio) |
C – Chairman FE – Financial Expert
| 1 | Ms Watkins joined the Audit Committee on 12 November 2008, following her appointment as a Director. |
| 2 | Mr Hay joined the Governance Committee and Risk Committee on 12 November 2008, following his appointment as a Director. |
| 3 | Ms Watkins was appointed to the Human Resources Committee on 12 November 2008, following her appointment as a Director and became Chairman of the Committee on 22 March 2009. |
| 4 | Dr Clark joined the Human Resources Committee on 22 March 2009. |
| 5 | Mr Lee joined the Technology Committee on 1 February 2009, following his appointment as a Director. |
Ms Jackson was a Director of ANZ, Chairman of the Human Resources Committee, and a member of the Audit Committee during 2008/09 prior to her retirement from the Board on 21 March 2009.
AUDIT COMMITTEE
The Audit Committee is responsible for the oversight and monitoring of:
| • | | ANZ’s financial reporting principles and policies, controls and procedures; |
| • | | the effectiveness of ANZ’s internal control and risk management framework; |
| • | | the work of Internal Audit which reports directly to the Chairman of the Audit Committee (refer to Internal Audit on page 64 for more information); |
| • | | the Audit Committees of significant subsidiary companies; |
| • | | prudential supervision procedures required by regulatory bodies relating to financial reporting; |
| • | | and the integrity of ANZ’s financial statements, compliance with related regulatory requirements and the independent audit thereof. |
The Audit Committee is also responsible for:
| • | | the appointment, annual evaluation and oversight of the external auditor, including reviewing their independence and fitness and propriety; |
| • | | compensation of the external auditor; and |
| • | | where appropriate, replacement of the external auditor. |
Under the Committee Charter, all members of the Audit Committee must be financially literate. Mr Meiklejohn (Chairman) was determined to be a ‘financial expert’ for the 2009 financial year under the definition set out in the Audit Committee Charter which reflects US audit committee requirements. Refer to page 55 for his qualifications. While the Board has determined that Mr Meiklejohn has the necessary attributes to be a ‘financial expert’ in accordance with the relevant requirements, it is important to note that this does not give rise to him having responsibilities additional to those of other members of the Audit Committee.
The Audit Committee meets with the external auditor and internal auditor without management being present. The Chairman of the Audit Committee meets separately and regularly with the Group General Manager, Internal Audit, the external auditor and management.
The Group General Manager, Finance is the executive responsible for assisting the Chairman of the Committee in connection with the administration and efficient operation of the Committee.
Substantive areas of focus in the 2009 financial year included:
| • | | Internal and External Audit – The Committee approved the annual plans for internal and external audit and kept progress against those plans under regular review. Adjustments to the internal audit plan were made during the year to accommodate changes arising from the One ANZ restructure and high priority items; |
| • | | Regulatory developments – Reports on domestic and international accounting and financial reporting developments were provided to the Committee outlining relevant changes and implications for ANZ; |
| • | | Financial Reporting Governance Program – Notwithstanding that ANZ has ceased to be registered with the SEC in the US, the Committee requested management ensure that ANZ’s financial governance framework retained the beneficial aspects of US regulation. The 2009 Program involved increased management testing with Internal Audit providing an oversight role and the Committee received regular Financial Reporting Governance updates providing comment on key themes, emerging risks and areas of focus, and Program status; |
| • | | Whistleblowing – The Committee received reports on disclosures made under ANZ’s Global Whistleblower Protection Policy, and of enhancements to the Policy, including the establishment of a 24/7 External Hotline; and |
| • | | Information Security – the Committee received regular reports on information security. |
Corporate Governance 61
CORPORATE GOVERNANCE(continued)
GOVERNANCE COMMITTEE
The Governance Committee is responsible for:
| • | | identifying and recommending prospective Board members, Committee members and succession planning for the position of Chairman (see page 57); |
| • | | ensuring there is a robust and effective process for evaluating the performance of the Board, Board Committees and non-executive Directors (see pages 59 to 60); |
| • | | ensuring an appropriate Board and Board Committee structure is in place; |
| • | | reviewing and approving the Charters for each Board Committee except its own, which is reviewed and approved by the Board; and |
| • | | reviewing the development of and approving corporate governance policies and principles applicable to ANZ. |
The Group General Counsel is the executive responsible for assisting the Chairman of the Committee in connection with the administration and efficient operation of the Committee.
Substantive areas of focus in the 2009 financial year included:
| • | | Succession Planning – Three new Director appointments were made during the year, together with announcements regarding the succession plan relating to the Chairman of the Board; |
| • | | Governance framework –The Committee reviewed the Board’s governance framework and principles including Board composition and appointment procedures, Board and Committee education and Director independence criteria. A new director tenure policy was adopted under which non-executive Directors will retire once they have served a maximum of three 3 year terms after election by shareholders, unless invited by the Board to extend their tenure due to special circumstances; |
| • | | Ethics Framework – A new Code of Conduct for employees and non-executive Directors was launched during the year; |
| • | | Securities Lending Review – The Committee was updated on progress of the Securities Lending remediation program and endorsed a number of governance initiatives which included implementation of a new Policy and Guidelines to enhance the governance of Management Committees; |
| • | | Board Performance Evaluation – The Committee considered and reported to the Board on each of the recommendations from the external review of Board performance; and |
| • | | Review and approval of Group policies – The Committee approved amendments to existing Group policies including the Continuous Disclosure Policy, Global Employee Securities Trading and Conflict of Interest Policy, Board Renewal and Performance Evaluation Policy, Fit & Proper Policy, Director independence criteria and assessment process, and Shareholder Charter. |
HUMAN RESOURCES COMMITTEE
The Human Resources Committee is responsible for reviewing and approving the Group’s compensation programs and remuneration strategy, including any equity based programs, compensation levels and policy guidelines (details in the Remuneration Report on pages 23 to 51).
The Committee also evaluates the performance of and approves the compensation for Board Appointees and makes recommendations to the Board on matters relating to the Chief Executive Officer (details in the Remuneration Report on pages 23 to 51).
In addition, the Committee considers and approves key executive appointments, and senior executive succession plans, as well as policies relating to health and safety issues and diversity.
The Group Managing Director, Human Resources is the executive responsible for assisting the Chairman of the Committee in connection with the administration and efficient operation of the Committee.
| • | | Substantive areas of focus in the 2009 financial year included: |
| • | | Management roles and performance – The Committee reviewed the performance of the CEO and CEO’s direct reports and ensured that succession plans were in place for Management Board and business critical roles; |
| • | | Focus on governance and policy impacts of APRA Prudential Standards on remuneration, the proposed changes to taxation of employee equity plans, the Productivity Commission Review and the proposed termination payments cap legislation. The Committee continues to closely monitoring these developments and implications for ANZ; |
| • | | Fitness and Propriety – The Committee completed fit and proper assessments for all current and new Board Appointees; and |
| • | | Remuneration – The Committee approved the grant of $1000 of shares to each eligible employee under the Employee Share Acquisition Plan, and reviewed and approved amendments to the bonus framework for the Institutional Division. The Committee conducted an annual review of remuneration for non-executive Directors and agreed to freeze director fees for the 2008/09 financial year, and also reviewed the compensation structure for senior executives and agreed not to increase salaries for the 2009/10 financial year. |
For more details on the activities of the Human Resources Committee, please refer to the Remuneration Report on pages 23 to 51.
RISK COMMITTEE
The Board is principally responsible for approving the Group’s risk tolerance, related strategies and policies, and for the oversight of policy compliance and the effectiveness of the risk and compliance management framework that is in place.
The Risk Committee is delegated responsibility for overseeing, monitoring and reviewing the Group’s risk management principles and policies, strategies, processes and controls including credit, market, liquidity, balance sheet, operational, compliance and other reputational risk frameworks.
62ANZ Annual Report 2009
CORPORATE GOVERNANCE(continued)
The Committee is also authorised to approve credit transactions and other related matters beyond the approval discretion of executive management.
The Chief Risk Officer is the executive responsible for supporting the Chairman of the Committee in connection with the administration and efficient operation of the Committee.
Substantive areas of focus in the 2009 financial year included:
| • | | Economic Environment – The Committee received regular updates on the global economic environment and regulatory changes implemented/proposed following the impact of the global financial crisis; |
| • | | Liquidity – The Committee performed an ongoing and detailed review of the Group’s liquidity and funding positions and risks throughout the year; |
| • | | Provisioning – The Committee regularly reviewed provisioning in light of the global financial crisis; |
| • | | Risk Frameworks – The Committee approved an updated Operational Risk Framework and further development of the Risk Appetite Framework. The Committee also reviewed the Information Security Governance Framework; |
| • | | Securities Lending Review – The Committee continued to monitor the remediation program in relation to issues raised in the Review. |
During the year, management reported to the Risk Committee as to the effectiveness of ANZ’s risk and compliance management framework and the management of ANZ’s material business risks.
For further information on how ANZ manages its material financial risks, please see the disclosures in relation to AASB 7 ‘Financial Instruments: Disclosure’ in the notes to the financial statements and the Corporate Governance section of anz.com.
TECHNOLOGY COMMITTEE
The Technology Committee assists the Board in the effective discharge of its responsibilities in relation to technology and related operations matters. The Committee is responsible for the oversight and evaluation of new projects in technology above $50 million and security issues relevant to ANZ’s technology, its operational processes and systems.
The Committee is also responsible for the review and approval of management’s recommendations for long-term technology and related operations planning and the overall framework for the management of technology risk.
The Group Managing Director, Operations, Technology and Shared Services is the executive responsible for assisting the Chairman of the Committee in connection with the administration and efficient operation of the Committee.
Substantive areas of focus in the 2009 financial year included:
| • | | Technology Architecture – The Committee monitored the definition and execution of ANZ’s Technology Architecture Strategy; |
| • | | Information Security – The Committee received regular updates on key information security issues and strategies and technology risk remediation; |
| • | | Future needs – The Committee received reports on the future technology investment requirements for ANZ and on ANZ’s future IT operating model; and |
| • | | Projects – The Committee received reports on the progress of ANZ’s major technology and property projects, including the 833 Collins Street development, and on recent changes to the priorisation and governance of projects at ANZ. |
DIRECTORS’ MEETINGS
The number of Board meetings and meetings of Committees during the year the Director was eligible to attend, and the number of meetings attended by each Director were:
| | | | | | | | | | | | | | | | | | | | | | | | | | | | | | | | | | | | | | | | | | | | | | | | | | | | | | | | | | | | | | | | | | | | | | | | |
| | | Board | | | Risk
Committee | | | Audit
Committee | | | Human
Resources
Committee | | | Governance
Committee | | | Technology
Committee | | | Executive
Committee | | | Shares
Committee* | | | Committee
of the Board* | |
| | | A | | | B | | | A | | | B | | | A | | | B | | | A | | | B | | | A | | | B | | | A | | | B | | | A | | | B | | | A | | | B | | | A | | | B | |
G J Clark | | | 17 | | | | 17 | | | | | | | | | | | | | | | | | | | | 2 | | | | 2 | | | | 4 | | | | 4 | | | | 4 | | | | 4 | | | | 1 | | | | 1 | | | | | | | | | | | | 1 | | | | 1 | |
J K Ellis | | | 17 | | | | 16 | | | | | | | | | | | | 9 | | | | 7 | | | | | | | | | | | | | | | | | | | | 4 | | | | 4 | | | | | | | | | | | | 1 | | | | 1 | | | | 2 | | | | 2 | |
P A F Hay | | | 14 | | | | 14 | | | | 5 | | | | 5 | | | | | | | | | | | | | | | | | | | | 3 | | | | 3 | | | | | | | | | | | | | | | | | | | | | | | | | | | | 3 | | | | 3 | |
C B Goode | | | 17 | | | | 16 | | | | 7 | | | | 7 | | | | 9 | | | | 9 | | | | 5 | | | | 5 | | | | 4 | | | | 4 | | | | 4 | | | | 4 | | | | 2 | | | | 2 | | | | 6 | | | | 6 | | | | 11 | | | | 11 | |
M A Jackson | | | 7 | | | | 6 | | | | | | | | | | | | 5 | | | | 5 | | | | 3 | | | | 3 | | | | | | | | | | | | | | | | | | | | 1 | | | | 1 | | | | 2 | | | | 2 | | | | | | | | | |
Lee Hsien Yang | | | 11 | | | | 11 | | | | | | | | | | | | | | | | | | | | | | | | | | | | | | | | | | | | 4 | | | | 4 | | | | 1 | | | | 1 | | | | | | | | | | | | 1 | | | | 1 | |
I J Macfarlane | | | 17 | | | | 17 | | | | 7 | | | | 7 | | | | | | | | | | | | | | | | | | | | 4 | | | | 4 | | | | 4 | | | | 4 | | | | 2 | | | | 2 | | | | | | | | | | | | | | | | | |
D E Meiklejohn | | | 17 | | | | 15 | | | | 7 | | | | 6 | | | | 9 | | | | 9 | | | | | | | | | | | | 4 | | | | 3 | | | | | | | | | | | | 2 | | | | 2 | | | | 2 | | | | 2 | | | | 7 | | | | 7 | |
J P Morschel | | | 17 | | | | 17 | | | | 7 | | | | 7 | | | | | | | | | | | | 5 | | | | 5 | | | | | | | | | | | | | | | | | | | | | | | | | | | | 1 | | | | 1 | | | | 5 | | | | 5 | |
M R P Smith | | | 17 | | | | 17 | | | | | | | | | | | | | | | | | | | | | | | | | | | | | | | | | | | | | | | | | | | | 2 | | | | 2 | | | | | | | | | | | | 10 | | | | 10 | |
A M Watkins | | | 14 | | | | 13 | | | | | | | | | | | | 7 | | | | 7 | | | | 3 | | | | 3 | | | | | | | | | | | | | | | | | | | | 1 | | | | 1 | | | | 2 | | | | 2 | | | | 2 | | | | 2 | |
Column A – Indicates the number of meetings the Director was eligible to attend.
Column B – Indicates the number of meetings attended. The Chairman is an ex-officio member of the Risk, Audit, Human Resources, Governance, and Technology Committees.
| * | The meetings of the Shares Committee and Committee of the Board as referred to in the table above include those conducted by written resolution. |
Corporate Governance 63
CORPORATE GOVERNANCE(continued)
ADDITIONAL COMMITTEES
In addition to the five principal Board Committees, the Board has constituted an Executive Committee and a Shares Committee, each consisting solely of Directors, to assist in carrying out specific tasks.
The Executive Committee has the full power of the Board and is convened as necessary between regularly scheduled Board meetings to deal with urgent matters. The Shares Committee has the power to manage on behalf of the Board the issue of shares and options (including under ANZ’s Employee Share Plan and Employee Share Option Plan). The Board also forms and delegates authority to ad-hoc Committees of the Board as and when needed to carry out specific tasks.
Audit and Financial Governance
INTERNAL AUDIT
Internal Audit is a function independent of management whose role is to appraise the effectiveness of ANZ’s risk management, control and governance processes. Operating under a Board approved Charter, Internal Audit’s primary reporting line is to the Audit Committee with a direct communication line to the Chief Executive Officer and external auditors.
The Global audit plan is derived utilising a risk based approach and is refreshed on a quarterly basis. The Audit Committee approves the plan, the associated budget and any changes thereto quarterly.
Audits fully conform to the International Standards for the Professional Practice of Internal Auditing and results thereof are reported to the Audit Committee, Risk Committee and Executive Management. These results influence the performance assessment of business heads.
Furthermore, Internal Audit monitors the remediation of audit issues and highlights the current status of any outstanding audits.
EXTERNAL AUDIT
The external auditor’s role is to provide an independent opinion that ANZ’s financial reports are true and fair and comply with applicable regulations. The external auditor performs an independent audit in accordance with Australian Auditing Standards. The Audit Committee oversees ANZ’s Policy on Relationship with the External Auditor. Under the Policy, the Audit Committee is responsible for the appointment (subject to ratification by shareholders) and also the compensation, retention and oversight of the external auditor.
The Policy also stipulates that the Audit Committee:
| • | | pre-approves all audit and non-audit services on an engagement by engagement basis or pursuant to specific pre-approval policies adopted by the Committee; |
| • | | regularly reviews the independence of the external auditor; and |
| • | | evaluates the effectiveness of the external auditor. |
The Policy also requires that all services provided by the external auditor, including the non-audit services that may be provided by the external auditor, must be in accordance with the following principles:
| • | | the external auditor should not have a mutual or conflicting interest with ANZ; |
| • | | the external auditor should not audit its own work; |
| • | | the external auditor should not function as part of management or as an employee; and |
| • | | the external auditor should not act as an advocate of ANZ. |
The Policy, which sets out in detail the types of services the external auditor may and may not provide, can be found on the Corporate Governance section of anz.com.
Details of the non-audit services provided by the external auditor, KPMG, during the 2009 financial year, including their dollar value, together with the statement from the Board as to their satisfaction with KPMG’s compliance with the related independence requirements of the Corporations Act 2001, are set out in the Directors’ Report on pages 20 to 21.
In addition, ANZ requires a two year period before any former partner or employee of the external auditor is appointed as a Director or senior executive of ANZ. The lead partner of the external auditor is required to rotate off the ANZ audit after 5 years and cannot return for a further 5 years. Certain other senior audit staff are required to rotate off after a maximum of seven years. Any appointments of ex-partners or ex-employees of the external auditor as ANZ finance staff, or at senior manager level or higher, must be pre-approved by the Chairman of the Audit Committee.
As disclosed in previous Annual Reports, the US SEC commenced an inquiry into non-audit services provided by ANZ’s auditor, KPMG. ANZ has provided the information requested by the SEC. This inquiry has not concluded. Should the SEC determine that services provided by KPMG did not comply with the US auditor independence rules, the SEC may seek sanctions, the nature and amount of which are not known. Whilst ANZ cannot predict the outcome of the inquiry, based on information currently available, ANZ does not believe it will have a material adverse effect on the Company.
FINANCIAL CONTROLS
As previously noted, the Audit Committee of the Board oversees ANZ’s financial reporting policies and controls, the integrity of ANZ’s financial statements, the relationship with the external auditor, the work of Internal Audit, and the Audit Committees of various significant subsidiary companies.
ANZ has in place a Financial Reporting Governance (FRG) Program which evaluates the design and tests the operation of key financial reporting controls, including Company-level controls, period-end controls, process-level controls, and IT general controls. In addition, Preparers’ Statements in the form of half-yearly certifications are completed by senior management, including senior finance executives.
64ANZ Annual Report 2009
CORPORATE GOVERNANCE(continued)
These Statements comprise representations and questions about financial results, disclosures, processes and controls and are aligned with ANZ’s external obligations. The process is independently evaluated by Internal Audit and tested under the FRG Program. Any issues arising from the evaluation and testing are reported to the Audit Committee. This process assists the Chief Executive Officer and Chief Financial Officer in making the certifications to the Board under the Corporations Act and ASX Governance Principles as set out in the Directors’ Report on page 21.
Ethical and Responsible Decision-making
CODES OF CONDUCT AND ETHICS
ANZ has two main Codes of Conduct and Ethics, the Employee Code and the non-executive Directors Code. These Codes provide employees and Directors with a practical set of guiding principles to help them make decisions in their day to day work. Having two Codes recognises the different responsibilities that Directors have under law but enshrines the same values and principles.
The Codes embody honesty, integrity, quality and trust, and employees and Directors are required to demonstrate these behaviours and comply with the Codes whenever they are identified as representatives of ANZ.
The principles underlying ANZ’s Codes of Conduct and Ethics are:
| • | | We act in ANZ’s best interests and value ANZ’s reputation; |
| • | | We act with honesty and integrity; |
| • | | We treat others with respect, value difference and maintain a safe workplace; |
| • | | We identify conflicts of interest and manage them responsibly; |
| • | | We respect and maintain privacy and confidentiality; |
| • | | We do not make or receive improper payments, benefits or gains; |
| • | | We comply with the Codes, the law and ANZ’s policies and procedures; and |
| • | | We immediately report any breaches of the Codes, the law or ANZ policies and procedures. |
The Codes are supported by the following detailed policies that together form ANZ’s Conduct and Ethics Policy Framework:
| • | | Anti-Money Laundering and Counter-Terrorism Financing Program; |
| • | | Use of Systems, Equipment and Information Policy; |
| • | | Global Fraud and Corruption Policy; |
| • | | Equal Employment Opportunity, Bullying and Harassment Policy; |
| • | | Health and Safety Policy; |
| • | | Global Employee Securities Trading and Conflict of Interest Policy; |
| • | | Global Anti-Bribery Policy; and |
| • | | Global Whistleblower Protection Policy. |
Within two months of commencing employment with ANZ, and thereafter on an annual basis, all employees are required to sign up to the principles of the Employee Code, including key relevant extracts of the policies set out above, to show that they have understood and agree to comply with their obligations.
In June 2009, ANZ launched the Global Performance Improvement and Unacceptable Behaviour Policy to support the Code of Conduct and Ethics. This Policy sets out the processes that will be followed to determine whether the Code of Conduct and Ethics has been breached and the consequences that should be imposed on employees who are found to have breached the Code of Conduct and Ethics. Breaches of the Code of Conduct and Ethics which lead to formal warnings automatically result in a behaviour flag being raised under the ANZ Global Performance Management Framework and have a direct bearing on the individual’s performance and remuneration outcomes for the financial year in question.
Directors’ compliance with the non-executive Directors Code continues to form part of their annual performance review.
SECURITIES TRADING
ANZ’s Global Employee Securities Trading and Conflict of Interest Policy prohibits trading in ANZ securities or the securities of other companies by all employees and Directors who are aware of unpublished price-sensitive information.
The Policy specifically prohibits restricted employees and their associates trading in ANZ securities during ‘blackout periods’ leading up to the day following the half-yearly and annual results announcements.
Non-executive Directors are required to seek approval from the Chairman in advance of any trading in ANZ securities. The Chairman of the Board is required to seek approval from the Chairman of the Audit Committee. Senior Executives and other restricted employees are also required to seek approval before they, or their associates, trade in ANZ securities.
It is a condition of the grant of employee share options (including Performance Rights) and deferred shares that no schemes are entered into by any employee that specifically protect the value of such shares, options and Performance Rights before the shares have vested or the options or Performance Rights have entered their exercisable period. Any breach of this prohibition would constitute a breach of the grant conditions and would result in the forfeiture of the relevant shares, options or Performance Rights.
Directors and Management Board members are also prohibited from providing ANZ securities as security in connection with any margin loan or similar financing arrangement under which they may be subject to a margin call or loan to value ratio obligations.
Corporate Governance 65
CORPORATE GOVERNANCE(continued)
WHISTLEBLOWER PROTECTION
The ANZ Global Whistleblower Policy provides a mechanism by which ANZ employees, contractors and consultants may voice serious concerns or escalate serious matters on a confidential basis, without fear of reprisal, dismissal or discriminatory treatment.
Complaints may be made under the Policy to designated Whistleblower Protection Officers, or via an independently managed Whistleblower Protection Hotline.
Commitment to Shareholders
Shareholders are the owners of ANZ and our approaches described below are enshrined in ANZ’s Shareholder Charter, a copy of which can be found on the Corporate Governance section of anz.com.
COMMUNICATION
In order to make informed decisions about ANZ, and to communicate views to ANZ, it is important for shareholders to have an understanding of ANZ’s business operations and performance.
ANZ encourages shareholders to take an active interest in ANZ, and seeks to provide shareholders with quality information in a timely fashion generally through ANZ’s reporting of results, ANZ’s Annual Report and Shareholder Review, briefings, half yearly newsletters and via its dedicated shareholder site on anz.com. ANZ strives for transparency in all its business practices, and recognises the impact of quality and transparent disclosure on the trust and confidence of shareholders, the wider market and the community. To this end, ANZ, outside of its scheduled result announcements, issued additional Trading Updates to the market during the financial year.
Should shareholders require any information, contact details for ANZ and its Share Registrar are set out in the Shareholder Review, the half yearly shareholder newsletter, and the Investor Centre section of anz.com.
MEETINGS
To allow as many shareholders as possible to have an opportunity to attend shareholder meetings, ANZ rotates meetings around capital cities and makes them available to be viewed online using webcast technology.
Further details on meetings and presentations held throughout this financial year are available on anz.com > About us > Investor Centre > Events & Publications. Prior to the Annual General Meeting, shareholders are provided the opportunity to submit any questions they have for the Chairman or Chief Executive Officer to enable key common themes to be considered.
The external auditor is present at ANZ Annual General Meetings and available to answer shareholder questions on any matter that concerns them in their capacity as auditor, including in relation to the conduct of the audit and the preparation and content of the auditor’s report.
The letter of appointment, which has been agreed to and signed by all non-executive Directors, states that Directors are also expected to attend and be available to meet shareholders at the Annual General Meeting each year.
Shareholders have the right to vote on various resolutions put to a meeting. If shareholders are unable to attend a meeting they can submit their proxies via post or electronically. Where votes are taken on a poll, which is usual ANZ practice, ANZ appoints an independent party to verify the results, normally KPMG, which are reported as soon as possible to the ASX and posted on anz.com.
Continuous Disclosure
ANZ’s practice is to release all price-sensitive information in a timely manner and as required under the ASX Listing Rules and then to all relevant Securities Exchanges on which ANZ’s securities are listed, and to the market and community generally through ANZ’s media releases, website and other appropriate channels.
Through ANZ’s Continuous Disclosure Policy, ANZ demonstrates its commitment to continuous disclosure. The Policy reflects relevant obligations under applicable securities exchange listing rules and legislation. For disclosure purposes, price-sensitive information is information that a reasonable person would expect to have a material effect on the price or value of ANZ’s securities.
Designated Disclosure Officers have responsibility for reviewing proposed disclosures and considering what information can be or should be disclosed to the market. Each ANZ employee is required to inform a Disclosure Officer regarding any potentially price-sensitive information concerning ANZ as soon as they become aware of it.
A committee of senior executives (the Continuous Disclosure Review Sub-Committee) also meets on a regular basis each quarter to overview the effectiveness of ANZ’s systems and procedures for achieving compliance with applicable regulatory requirements in relation to the disclosure of price-sensitive information. This Sub-Committee reports to the Governance Committee of the Board on an annual basis.
In carrying out their role, the Disclosure Officers recognise ANZ’s commitment to achieving best practice in terms of disclosure by acting in accordance with the spirit, intention and purposes of the applicable regulatory requirements and by looking beyond form to substance.
66ANZ Annual Report 2009
CORPORATE GOVERNANCE(continued)
Corporate Responsibility
Corporate responsibility and sustainability are part of ANZ’s core strategy. The global financial crisis has brought into focus how economies and the community are best served when the banking sector understands the importance of its role in the broader community. In September 2009, ANZ released a new corporate responsibility framework which responds to the priorities of customers, employees, community groups, regulators and governments across our business and provides a clear direction for ANZ, with flexibility to suit specific geographic regions. The following 5 priority areas have been identified for ANZ to focus on globally:
| • | | education and employment for the disadvantaged; |
ANZ will strengthen existing programs and develop and implement new initiatives consistent with our core purpose and priorities over the coming years.
Donations
During the year ended 30 September 2009, ANZ contributed over $22 million in cash, time and in-kind services to charitable organisations in the regions where ANZ does business.
More than $4 million of this contribution was invested in financial literacy and inclusion programs such as MoneyMinded (Australia and New Zealand), Saver Plus and Progress Loans (Australia). ANZ’s community partners the Brotherhood of St Laurence, Berry Street, The Benevolent Society and The Smith Family currently deliver these programs in over 20 communities. Funding of $13.5 million has been granted by the Federal Government with the aim of extending the reach and impact of the Saver Plus program from 20 to more than 50 communities across Australia over the next 2 years. ANZ will continue to work closely with its community partners on this expansion. Financial Literacy is a key element of ANZ’s Corporate Responsibility Strategy, targeting especially those in disadvantaged communities who are most at risk of financial exclusion.
The $22 million contribution also includes donations of more than $2.5 million to support the recovery and rebuilding of communities in our region affected by disaster, including for example the Sichuan Earthquake (Oct 2008), the Victorian Bushfire Crisis (Feb 2009) and the Pacific Tsunami (Sept 2009). Further details can be accessed at www.anz.com/community
In addition, for the year to 30 September 2009, ANZ donated $50,000 to the Liberal Party of Australia and $50,000 to the Australian Labor Party.
Corporate Governance 67
Shareholders Information
Ordinary Shares
At 8 October 2009, the twenty largest holders of ordinary shares held 1,430,321,088 ordinary shares, equal to 57.11% of the total issued ordinary capital.
| | | | | | | | |
| | | Number of | | | | |
Name | | shares | | | % | |
1. HSBC CUSTODY NOMINEES (AUSTRALIA) LIMITED | | | 451,912,188 | | | | 18.04 | |
2. J P MORGAN NOMINEES AUSTRALIA LIMITED | | | 357,731,260 | | | | 14.28 | |
3. NATIONAL NOMINEES LIMITED | | | 289,692,228 | | | | 11.57 | |
4. CITICORP NOMINEES PTY LIMITED | | | 78,029,750 | | | | 3.12 | |
5. ANZ NOMINEES LIMITED <CASH INCOME A/C> | | | 65,373,642 | | | | 2.61 | |
6. COGENT NOMINEES PTY LIMITED | | | 38,300,554 | | | | 1.53 | |
7. QUEENSLAND INVESTMENT CORPORATION | | | 25,071,461 | | | | 1.00 | |
8. AMP LIFE LIMITED | | | 21,031,328 | | | | 0.84 | |
9. UBS WEALTH MANAGEMENT AUSTRALIA NOMINEES PTY LTD | | | 14,451,928 | | | | 0.58 | |
10. CITICORP NOMINEES PTY LIMITED
<CFS WSLE GEARED SHR FND A/C> | | | 13,931,919 | | | | 0.56 | |
11. RBC DEXIA INVESTOR SERVICES AUSTRALIA
NOMINEES PTY LIMITED <PIPOOLED A/C> | | | 12,772,086 | | | | 0.51 | |
12. AUSTRALIAN REWARD INVESTMENT ALLIANCE | | | 11,300,111 | | | | 0.45 | |
13. CITICORP NOMINEES PTY LIMITED <CFS WSLE IMPUTATION FND A/C> | | | 8,093,657 | | | | 0.32 | |
14. ANZEST PTY LTD <DEFERRED SHARE PLAN A/C> | | | 7,627,312 | | | | 0.30 | |
15. AUSTRALIAN FOUNDATION INVESTMENT COMPANY LIMITED | | | 6,224,394 | | | | 0.25 | |
16. PERPETUAL TRUSTEE COMPANY LIMITED | | | 6,181,106 | | | | 0.25 | |
17. CITICORP NOMINEES PTY LIMITED <CFS
IMPUTATION FUND A/C> | | | 5,783,314 | | | | 0.23 | |
18. RBC DEXIA INVESTOR SERVICES AUSTRALIA
NOMINEES PTY LIMITED <MLCI A/C> | | | 5,777,259 | | | | 0.23 | |
19. ANZEST PTY LTD <ESAP SHARE PLAN A/C> | | | 5,529,303 | | | | 0.22 | |
20. RBC DEXIA INVESTOR SERVICES AUSTRALIA
NOMINEES PTY LIMITED | | | 5,506,288 | | | | 0.22 | |
| | | | | | | | |
Total | | | 1,430,321,088 | | | | 57.11 | |
| | | | | | | | |
Distribution of shareholdings
| | | | | | | | | | | | | | | | |
| At 8 October 2009 | | Number of | | | % of | | | Number of | | | % of | |
Range of shares | | holders | | | holders | | | shares | | | shares | |
1 to 1,000 | | | 195,343 | | | | 49.07 | | | | 80,884,874 | | | | 3.23 | |
1,000 to 5,000 | | | 166,016 | | | | 41.71 | | | | 366,217,289 | | | | 14.62 | |
5,001 to 10,000 | | | 23,633 | | | | 5.94 | | | | 161,712,649 | | | | 6.46 | |
10,001 to 100,000 | | | 12,582 | | | | 3.16 | | | | 255,057,728 | | | | 10.18 | |
Over 100,000 | | | 477 | | | | 0.12 | | | | 1,640,715,687 | | | | 65.51 | |
| | | | | | | | | | | | | | | | |
Total | | | 398,051 | | | | 100.00 | | | | 2,504,588,227 | | | | 100.00 | |
| | | | | | | | | | | | | | | | |
At 8 October 2009:
| • | | there were no additional/new entries in the register of Substantial Shareholdings. Subsequently, ANZ received a notice of initial substantial holder from Barclays Group on 13 October 2009 in relation to its holding of 126,645,464 ANZ ordinary shares; |
| • | | the average size of holdings of ordinary shares was 6,292 (2008: 5,421) shares; and |
| • | | there were 7,370 holdings (2008: 10,095 holdings) of less than a marketable parcel (less than $500 in value or 21 shares based on the market price of $24.74), which is less than 1.85% of the total holdings of ordinary shares. |
Voting rights of ordinary shares
The Constitution provides for votes to be cast:
| i) | on show of hands, 1 vote for each shareholder; and |
| ii) | on a poll, 1 vote for each fully paid ordinary share. |
68ANZ Annual Report 2009
SHAREHOLDERSINFORMATION (continued)
ANZ Convertible Preference Shares (ANZ CPS)
At 8 October 2009, the twenty largest holders of ANZ CPS held 2,672,105 securities, equal to 24.71% of the total issued securities.
| | | | | | | | |
| | | Number of | | | | |
Name | | securities | | | % | |
1. UBS WEALTH MANAGEMENT AUSTRALIA NOMINEES PTY LTD | | | 628,530 | | | | 5.81 | |
2. RBC DEXIA INVESTOR SERVICES AUSTRALIA
NOMINEES PTY LIMITED <MLCI A/C> | | | 318,502 | | | | 2.95 | |
3. UCA CASH MANAGEMENT FUND LTD | | | 239,791 | | | | 2.22 | |
4. HSBC CUSTODY NOMINEES (AUSTRALIA) LIMITED | | | 193,838 | | | | 1.79 | |
5. J P MORGAN NOMINEES AUSTRALIA LIMITED | | | 180,310 | | | | 1.67 | |
6. UBS NOMINEES PTY LTD | | | 162,204 | | | | 1.50 | |
7. QUESTOR FINANCIAL SERVICES LIMITED <TPS RF A/C> | | | 139,290 | | | | 1.29 | |
8. HARMAN NOMINEES PTY LTD
<HARMAN FAMILY A/C> | | | 119,794 | | | | 1.11 | |
9. NETWEALTH INVESTMENTS LIMITED
<WRAP SERVICES A/C> | | | 87,248 | | | | 0.81 | |
10. RBC DEXIA INVESTOR SERVICES AUSTRALIA
NOMINEES PTY LIMITED <NMSMT A/C> | | | 76,866 | | | | 0.71 | |
11. NATIONAL NOMINEES LIMITED | | | 75,304 | | | | 0.70 | |
12. COGENT NOMINEES PTY LIMITED | | | 69,588 | | | | 0.64 | |
13. CITICORP NOMINEES PTY LIMITED
<CFSIL CFS WS ENH YIELD A/C> | | | 59,000 | | | | 0.55 | |
14. BALLARD BAY PTY LTD <BALLARD BAY
DISCRETIONARY AC> | | | 50,000 | | | | 0.46 | |
15. JMB PTY LIMITED | | | 50,000 | | | | 0.46 | |
16. SPINETTA PTY LTD | | | 50,000 | | | | 0.46 | |
17. THE AUSTRALIAN NATIONAL UNIVERSITY | | | 48,000 | | | | 0.44 | |
18. MACEQUEST PTY LTD <MICHAEL POWER INVEST A/C> | | | 42,500 | | | | 0.39 | |
19. ANZ NOMINEES LIMITED <CASH INCOME A/C> | | | 41,340 | | | | 0.38 | |
20. KOLL PTY LTD | | | 40,000 | | | | 0.37 | |
| | | | | | | | |
Total | | | 2,672,105 | | | | 24.71 | |
| | | | | | | | |
Distribution of ANZ CPS holdings
| | | | | | | | | | | | | | | | |
At 8 October 2009 Range of shares | | Number
of holders | | | % of
holders | | | Number of
securities | | | % of
securities | |
1 to 1,000 | | | 14,472 | | | | 92.37 | | | | 4,313,214 | | | | 39.89 | |
1,000 to 5,000 | | | 1,040 | | | | 6.64 | | | | 2,280,500 | | | | 21.09 | |
5,001 to 10,000 | | | 98 | | | | 0.63 | | | | 800,838 | | | | 7.41 | |
10,001 to 100,000 | | | 50 | | | | 0.32 | | | | 1,435,313 | | | | 13.28 | |
Over 100,000 | | | 8 | | | | 0.05 | | | | 1,982,259 | | | | 18.33 | |
| | | | | | | | | | | | | | | | |
Total | | | 15,668 | | | | 100.00 | | | | 10,812,124 | | | | 100.00 | |
| | | | | | | | | | | | | | | | |
At 8 October 2009: There was one holding of less than a marketable parcel (less than $500 in value or 6 securities based on the market price of $99.94, which is less than 0.01% of the total holdings of ANZ CPS).
Voting rights of ANZ CPS
An ANZ CPS does not entitle its holder to vote at any general meeting of ANZ except in the following circumstances:
i) on any proposal to reduce ANZ’s share capital, other than a resolution to approve a Redemption of the ANZ CPS;
ii) on a proposal that affects the rights attached to the ANZ CPS;
iii) on any resolution to approve the terms of a buy-back agreement, other than a resolution to approve a Redemption of ANZ CPS;
iv) on a proposal to wind up ANZ;
v) on a proposal for the disposal of the whole of ANZ’s property, business and undertaking;
vi) on any matter during a winding up of ANZ; and
vii) on any matter during a period in which a Divided remains unpaid.
On a resolution or proposal on which an ANZ CPS holder is entitled to vote, the ANZ CPS holder has:
| i) | on a show of hands, one vote; and |
| ii) | on a poll, one vote for each ANZ CPS held. |
Shareholder Information69
SHAREHOLDER INFORMATION(continued)
Employee Shareholder Information
At the Annual General Meeting in January 1994, shareholders approved an aggregate limit of 7% of all classes of shares and options, which remain subject to the rules of a relevant incentive plan, being held by employees and directors. At 30 September 2009 participants held 1.30% (2008: 1.52%) of the issued shares and options of ANZ under the following incentive plans:
ANZ Employee Share Acquisition Plan;
ANZ Employee Share Save Scheme;
ANZ Share Option Plan;
ANZ Directors’ Share Plan; and
ANZ Directors’ Retirement Benefit Plan.
Stock Exchange Listings
Australia and New Zealand Banking Group Limited’s ordinary shares are listed on the Australian Securities Exchange and the New Zealand Stock Exchange.
The Group’s other stock exchange listings include:
| • | | Australian Securities Exchange – ANZ Convertible Preference Shares (ANZ CPS) [Australia and New Zealand Banking Group Limited]; senior and subordinated debt [Australia and New Zealand Banking Group Limited]; |
| • | | Channel Islands Stock Exchange – Senior debt [ANZ Jackson Funding 2 Limited, ANZ Jackson Funding 3 Limited and ANZ Jackson Funding 4 Limited ] and subordinated debt [ANZ Jackson Funding PLC]; |
| • | | London Stock Exchange – Non-cumulative mandatory convertible stapled securities (UK Stapled Securities)[Australia and New Zealand Banking Group Limited];senior and subordinated debt [Australia and New Zealand Banking Group Limited]; and senior debt [ANZ National (Int’l) Limited]; |
| • | | Luxembourg Stock Exchange – Subordinated debt [Australia and New Zealand Banking Group Limited]; and non-cumulative Trust Securities (Euro Trust Securities) [ANZ Capital Trust III]; |
| • | | New Zealand Stock Exchange – Senior and subordinated debt and perpetual callable subordinated notes [ANZ National Bank Limited]; and |
| • | | Swiss Stock Exchange – Senior debt [Australia and New Zealand Banking Group Limited and ANZ National (Int’l) Limited]. |
American Depositary Receipts
Australia and New Zealand Banking Group Limited (ANZ) has American Depositary Receipts (ADRs) representing American Depositary Shares (ADSs) that are traded on the over-the counter (“OTC”) securities market on the Pink Sheets electronic platform operated by Pink Sheets LLC in the United States under the ticker symbol: ANZBY and the CUSIP number: 05258304.
With effect from 23 July 2008, the ADR ratio changed from one ADS representing five ANZ ordinary shares to one ADS representing one ANZ ordinary share.
The Bank of New York Mellon Corporation (“BNY Mellon”) is the Depositary for the Company’s ADR program in the United States. Holders of the Company’s ADRs should deal directly with BNY Mellon on all matters relating to their ADR holdings, by telephone on 1-888-269-2377 (for callers within the US), 1-212-815-3700 (for callers outside the US) or by email to shareowners@bankofny.com.
US Trust Securities
In November 2003, ANZ issued 1.1 million Fixed Rate Non-cumulative Trust Securities (“US Trust Securities”) at an issue price of USD1,000 each in two tranches through ANZ Capital Trust I or ANZ Capital Trust II (formed in the State of Delaware). Each US Trust Security is a stapled security comprising a preference share in ANZ and an unsecured note issued by Samson Funding Limited. Prior to a conversion event, the preference share and note components of a US Trust Security cannot be separately traded. After 15 January 2010 and 15 December 2013, ANZ may redeem the USD350 million US Trust Securities issued through ANZ Capital Trust I and the USD750 million US Trust Securities issued through ANZ Capital Trust II respectively. If ANZ fails to redeem, the US Trust Securities may convert into ANZ ordinary shares at the discretion of the holder.
Euro Trust Securities
In December 2004, ANZ issued 500,000 Floating Rate Non-cumulative Trust Securities (“Euro Trust Securities”) at an issue price of €1,000 each through ANZ Capital Trust III (formed in the State of Delaware). Each Euro Trust Security is a stapled security comprising a preference share in ANZ and an unsecured subordinated note issued by ANZ Jackson Funding PLC. The Euro Trust Securities are listed on the Luxembourg Stock Exchange. The unsecured subordinated notes are listed on the Channel Islands Stock Exchange. Prior to a conversion event, the preference share and subordinated note components of a Euro Trust Security cannot be separately traded.
70ANZ Annual Report 2009
SHAREHOLDERS INFORMATION(continued)
UK Stapled Securities
In June 2007, ANZ issued 9,000 non-cumulative stapled securities (“UK Stapled Securities”) at an issue price of £50,000 each. Each UK Stapled Security is a stapled security comprising a preference share in ANZ and an unsecured subordinated note issued by ANZ through its New York branch. The UK Trust Securities are listed on the London Stock Exchange. Prior to a conversion event, the preference share and subordinated note components of the UK Stapled Securities cannot be traded separately. The UK Stapled Securities will mandatorily convert into ANZ ordinary shares on 15 June 2012. However, the mandatory conversion is deferred for five years if the conversion conditions are not satisfied.
Convertible Notes
On 26 September 2008, ANZ through its New York branch issued 1,200 Convertible Notes at an issue price of $500,000 each. The Convertible Notes were perpetual, subordinated and non-cumulative, paid floating rate interest payments and could convert into ANZ ordinary shares on 28 September 2009 or each following quarterly interest payment date, at the holders option, or earlier following the occurrence of certain events. ANZ redeemed the Convertible Notes on 28 September 2009.
ANZ CPS
On 30 September 2008, the Company issued 10,812,124 Convertible Preference Shares (“ANZ CPS”) at an issue price of $100 each. ANZ CPS are floating-rate and non-cumulative and will mandatorily convert into ANZ ordinary shares on the Mandatory Conversion Date. However, ANZ may elect for a third party to purchase the ANZ CPS rather than delivering the ANZ ordinary shares issued on conversion to the holder. The ANZ CPS are listed on the Australian Securities Exchange. The Mandatory Conversion Date is 16 June 2014 or each following quarterly dividend payment date provided that all of the mandatory conversion conditions are satisfied.
Shareholder Information 71
Financial Report
INCOME STATEMENTS FOR THE YEAR ENDED 30 SEPTEMBER
Income Statements
| | | | | | | | | | | | | | | | | | | | |
| | | | | | Consolidated | | | The Company | |
| | | Note | | | Sep 09
$m | | | Sep 08
$m | | | Sep 09
$m | | | Sep 08
$m | |
Interest income | | | 3 | | | | 26,206 | | | | 32,604 | | | | 20,666 | | | | 23,634 | |
Interest expense | | | 4 | | | | (16,398 | ) | | | (24,754 | ) | | | (13,600 | ) | | | (18,238 | ) |
| | | | | | | | | | | | | | | | | | | | |
Net interest income | | | | | | | 9,808 | | | | 7,850 | | | | 7,066 | | | | 5,396 | |
| | | | | | | | | | | | | | | | | | | | |
Other operating income | | | 3 | | | | 3,337 | | | | 3,948 | | | | 3,075 | | | | 4,437 | |
Share of joint venture profit from ING Australia and ING New Zealand | | | 3 | | | | 83 | | | | 143 | | | | — | | | | — | |
Share of associates profit | | | 3 | | | | 382 | | | | 218 | | | | — | | | | — | |
| | | | | | | | | | | | | | | | | | | | |
Operating income | | | | | | | 13,610 | | | | 12,159 | | | | 10,141 | | | | 9,833 | |
Operating expense | | | 4 | | | | (6,225 | ) | | | (5,696 | ) | | | (4,868 | ) | | | (4,300 | ) |
| | | | | | | | | | | | | | | | | | | | |
Profit before credit impairment and income tax | | | | | | | 7,385 | | | | 6,463 | | | | 5,273 | | | | 5,533 | |
Provision for credit impairment | | | 16 | | | | (3,005 | ) | | | (1,948 | ) | | | (2,079 | ) | | | (1,573 | ) |
| | | | | | | | | | | | | | | | | | | | |
Profit before income tax | | | | | | | 4,380 | | | | 4,515 | | | | 3,194 | | | | 3,960 | |
| | | | | | | | | | | | | | | | | | | | |
Income tax expense | | | 6 | | | | (1,435 | ) | | | (1,188 | ) | | | (909 | ) | | | (624 | ) |
| | | | | | | | | | | | | | | | | | | | |
Profit after income tax | | | | | | | 2,945 | | | | 3,327 | | | | 2,285 | | | | 3,336 | |
Profit attributable to minority interest | | | | | | | (2 | ) | | | (8 | ) | | | — | | | | — | |
| | | | | | | | | | | | | | | | | | | | |
Profit attributable to shareholders of the Company | | | | | | | 2,943 | | | | 3,319 | | | | 2,285 | | | | 3,336 | |
| | | | | | | | | | | | | | | | | | | | |
Earnings per ordinary share (cents) | | | | | | | | | | | | | | | | | | | | |
Basic | | | 8 | | | | 131.0 | | | | 170.4 | | | | n/a | | | | n/a | |
Diluted | | | 8 | | | | 129.6 | | | | 162.2 | | | | n/a | | | | n/a | |
Dividend per ordinary share (cents) | | | 7 | | | | 102 | | | | 136 | | | | 102 | | | | 136 | |
| | | | | | | | | | | | | | | | | | | | |
The notes appearing on pages 76 to 183 form an integral part of these financial statements.
The results of 2009 include the following items:
| • | | Tax on New Zealand Conduits ($196 million after tax) Company (nil). |
| • | | Transformation costs associated with an organisational transformation ($17 million after tax, tax expense: $7 million), Company ($2 million after tax, tax expense: $1 million). |
| • | | New Zealand investor settlement on ING Diversified Yield Fund and ING Regular Income Fund ($121 million after tax, tax expense: $52 million) Company (nil). |
| • | | Restructuring costs associated with the implementation of a new “One ANZ” business model ($83 million after tax, tax expense: $35 million), Company ($72 million after tax, tax expense: $31 million). |
The results of 2008 include the following items:
| • | | Gain arising from the allocation of shares in Visa Inc. measured at fair value ($248 million after tax, tax expense: $105 million), Company ($174 million after tax, tax expense: $105 million). |
| • | | Transformation costs associated with an organisational transformation ($152 million after tax, tax expense: $66 million), Company ($127 million after tax, tax expense: $54 million). |
| • | | An expense associated with a write-down of an intangible asset relating to Origin Australia, reflecting the winding back of the mortgage manager business model ($24 million loss after tax, tax expense $10 million), Group and Company. |
| • | | Additional adjustment relating to restatement of deferred tax assets following the change in New Zealand company tax rate ($1 million after tax) Company (nil). |
72ANZ Annual Report 2009
BALANCESHEETS AS AT 30 SEPTEMBER
| | | | | | | | | | | | | | | | | | | | |
| | | | | | Consolidated | | | The Company | |
| | | Note | | | Sep 09
$m | | | Sep 08
$m | | | Sep 09
$m | | | Sep 08
$m | |
Assets | | | | | | | | | | | | | | | | | | | | |
Liquid assets | | | 9 | | | | 25,317 | | | | 25,030 | | | | 20,199 | | | | 18,081 | |
Due from other financial institutions | | | 10 | | | | 4,985 | | | | 9,862 | | | | 3,236 | | | | 8,573 | |
Trading securities | | | 11 | | | | 30,991 | | | | 15,177 | | | | 27,410 | | | | 12,846 | |
Derivative financial instruments | | | 12 | | | | 37,404 | | | | 36,941 | | | | 33,001 | | | | 33,298 | |
Available-for-sale assets | | | 13 | | | | 16,575 | | | | 17,480 | | | | 13,554 | | | | 15,103 | |
Net loans and advances | | | 14 | | | | 332,007 | | | | 334,554 | | | | 256,008 | | | | 236,124 | |
Customer’s liability for acceptances | | | | | | | 13,762 | | | | 15,297 | | | | 13,739 | | | | 15,262 | |
Due from controlled entities | | | | | | | — | | | | — | | | | 45,471 | | | | 26,661 | |
Shares in controlled entities | | | 17 | | | | — | | | | — | | | | 8,522 | | | | 9,144 | |
Shares in associates and joint venture entities | | | 17 | | | | 4,565 | | | | 4,375 | | | | 761 | | | | 869 | |
Current tax assets | | | 18 | | | | 693 | | | | 809 | | | | 601 | | | | 680 | |
Deferred tax assets | | | 18 | | | | 503 | | | | 357 | | | | 446 | | | | 239 | |
Goodwill and other intangible assets1 | | | 19 | | | | 3,896 | | | | 3,741 | | | | 829 | | | | 623 | |
Other assets | | | 20 | | | | 4,227 | | | | 5,078 | | | | 2,749 | | | | 3,352 | |
Premises and equipment | | | 21 | | | | 2,062 | | | | 1,592 | | | | 1,449 | | | | 1,005 | |
| | | | | | | | | | | | | | | | | | | | |
Total assets | | | | | | | 476,987 | | | | 470,293 | | | | 427,975 | | | | 381,860 | |
| | | | | | | | | | | | | | | | | | | | |
Liabilities | | | | | | | | | | | | | | | | | | | | |
Due to other financial institutions | | | | | | | 19,924 | | | | 20,092 | | | | 16,974 | | | | 18,001 | |
Deposits and other borrowings | | | 22 | | | | 294,370 | | | | 283,966 | | | | 227,300 | | | | 203,328 | |
Derivative financial instruments | | | 12 | | | | 36,516 | | | | 31,927 | | | | 33,168 | | | | 31,455 | |
Liability for acceptances | | | | | | | 13,762 | | | | 15,297 | | | | 13,739 | | | | 15,262 | |
Due to controlled entities | | | | | | | — | | | | — | | | | 42,336 | | | | 17,469 | |
Current tax liabilities | | | 23 | | | | 99 | | | | 61 | | | | 61 | | | | 2 | |
Deferred tax liabilities | | | 23 | | | | 111 | | | | 149 | | | | 90 | | | | 145 | |
Payables and other liabilities | | | 24 | | | | 7,775 | | | | 9,443 | | | | 6,006 | | | | 6,851 | |
Provisions | | | 25 | | | | 1,312 | | | | 1,217 | | | | 905 | | | | 908 | |
Bonds and notes | | | 26 | | | | 57,260 | | | | 67,323 | | | | 46,033 | | | | 52,071 | |
Loan Capital | | | 27 | | | | 13,429 | | | | 14,266 | | | | 11,885 | | | | 12,776 | |
| | | | | | | | | | | | | | | | | | | | |
Total liabilities | | | | | | | 444,558 | | | | 443,741 | | | | 398,497 | | | | 358,268 | |
| | | | | | | | | | | | | | | | | | | | |
Net Assets | | | | | | | 32,429 | | | | 26,552 | | | | 29,478 | | | | 23,592 | |
| | | | | | | | | | | | | | | | | | | | |
Shareholders’ equity | | | | | | | | | | | | | | | | | | | | |
Ordinary share capital | | | 28 | | | | 19,151 | | | | 12,589 | | | | 19,151 | | | | 12,589 | |
Preference share capital | | | 28 | | | | 871 | | | | 871 | | | | 871 | | | | 871 | |
Reserves | | | 29 | | | | (1,787 | ) | | | (742 | ) | | | (494 | ) | | | (75 | ) |
Retained earnings | | | 29 | | | | 14,129 | | | | 13,772 | | | | 9,950 | | | | 10,207 | |
| | | | | | | | | | | | | | | | | | | | |
Share capital and reserves attributable to shareholders of the Company | | | | | | | 32,364 | | | | 26,490 | | | | 29,478 | | | | 23,592 | |
Minority interests | | | 30 | | | | 65 | | | | 62 | | | | — | | | | — | |
| | | | | | | | | | | | | | | | | | | | |
Total equity | | | | | | | 32,429 | | | | 26,552 | | | | 29,478 | | | | 23,592 | |
| | | | | |
Commitments | | | 43 | | | | | | | | | | | | | | | | | |
Contingent liabilities | | | 44 | | | | | | | | | | | | | | | | | |
| | | | | | | | | | | | | | | | | | | | |
The notes appearing on pages 76 to 183 form an integral part of these financial statements.
| 1 | Excludes notional goodwill in equity accounted entities. |
Financial Report73
STATEMENTS OF RECOGNISED INCOME AND EXPENSE FOR THE YEAR ENDED 30 SEPTEMBER
| | | | | | | | | | | | | | | | | | | | |
| | | | | | Consolidated | | | The Company | |
| | | Note | | | 2009
$m | | | 2008
$m | | | 2009
$m | | | 2008
$m | |
Items recognised directly in equity1 | | | | | | | | | | | | | | | | | | | | |
Currency translation adjustments | | | 29 | | | | (909 | ) | | | 393 | | | | (283 | ) | | | 254 | |
Exchange differences on translation of foreign operations taken to equity | | | | | | | | | | | | | | | | | | | | |
Available-for-sale assets | | | | | | | | | | | | | | | | | | | | |
Valuation gain/(loss) taken to equity | | | 29 | | | | 29 | | | | (305 | ) | | | 20 | | | | (272 | ) |
Cumulative (gain)/loss transferred to the income statement | | | | | | | 18 | | | | 60 | | | | 18 | | | | 63 | |
Transfer on step acquisition of associate | | | | | | | — | | | | 60 | | | | — | | | | 60 | |
Cash flow hedges | | | | | | | | | | | | | | | | | | | | |
Valuation gain/(loss) taken to equity | | | 29 | | | | (106 | ) | | | (39 | ) | | | (97 | ) | | | (34 | ) |
Transferred to income statement for the year | | | | | | | (63 | ) | | | (35 | ) | | | (63 | ) | | | 5 | |
Actuarial gain/(loss) on defined benefit plans | | | 45 | | | | (124 | ) | | | (79 | ) | | | (113 | ) | | | (60 | ) |
Adjustment on step acquisition of associate | | | | | | | — | | | | 1 | | | | — | | | | — | |
| | | | | | | | | | | | | | | | | | | | |
Net (loss)/income recognised directly in equity | | | | | | | (1,155 | ) | | | 56 | | | | (518 | ) | | | 16 | |
Profit for the year | | | | | | | 2,945 | | | | 3,327 | | | | 2,285 | | | | 3,336 | |
| | | | | | | | | | | | | | | | | | | | |
Total recognised income and expense for the year | | | | | | | 1,790 | | | | 3,383 | | | | 1,767 | | | | 3,352 | |
| | | | | | | | | | | | | | | | | | | | |
Total recognised income and expense for the year attributable to minority interests | | | | | | | 2 | | | | 8 | | | | — | | | | — | |
Total recognised income and expense for the year attributable to shareholders of the Company | | | | | | | 1,788 | | | | 3,375 | | | | 1,767 | | | | 3,352 | |
| | | | | | | | | | | | | | | | | | | | |
The notes appearing on pages 76 to 183 form an integral part of these financial statements.
| 1 | These items are disclosed net of tax (refer note 6). |
74 ANZ Annual Report 2009
CASH FLOW STATEMENTS FOR THE YEAR ENDED 30 SEPTEMBER
| | | | | | | | | | | | | | | | | | | | |
| | | | | | Consolidated | | | The Company | |
| | | Note | | | 2009
$m | | | 2008
$m | | | 2009
$m | | | 2008
$m | |
Cash flows from operating activities | | | | | | | | | | | | | | | | | | | | |
Interest received | | | | | | | 26,795 | | | | 32,189 | | | | 21,245 | | | | 23,341 | |
Dividends received | | | | | | | 49 | | | | 84 | | | | 156 | | | | 304 | |
Fee income received | | | | | | | 2,799 | | | | 2,696 | | | | 2,071 | | | | 1,953 | |
Other income received | | | | | | | 1,192 | | | | 692 | | | | 1,847 | | | | 70 | |
Interest paid | | | | | | | (17,354 | ) | | | (24,186 | ) | | | (14,503 | ) | | | (17,852 | ) |
Personnel expenses paid | | | | | | | (3,652 | ) | | | (3,156 | ) | | | (2,736 | ) | | | (2,256 | ) |
Premises expenses paid | | | | | | | (503 | ) | | | (465 | ) | | | (362 | ) | | | (324 | ) |
Other operating expenses paid | | | | | | | (1,161 | ) | | | (1,284 | ) | | | (1,457 | ) | | | (1,101 | ) |
Net cash paid on settlement of derivatives | | | | | | | (7,754 | ) | | | (1,628 | ) | | | (7,936 | ) | | | (796 | ) |
Income taxes paid | | | | | | | | | | | | | | | | | | | | |
Australia | | | | | | | (851 | ) | | | (2,006 | ) | | | (845 | ) | | | (2,002 | ) |
Overseas | | | | | | | (439 | ) | | | (464 | ) | | | (78 | ) | | | (38 | ) |
Goods and services tax paid | | | | | | | (29 | ) | | | (10 | ) | | | 5 | | | | 18 | |
| | | | | | | | | | | | | | | | | | | | |
(Increase)/decrease in operating assets: | | | | | | | | | | | | | | | | | | | | |
Liquid assets – greater than three months | | | | | | | 2,253 | | | | (4,692 | ) | | | 2,427 | | | | (3,620 | ) |
Due from other financial institutions – greater than three months | | | | | | | 1,402 | | | | (739 | ) | | | 1,032 | | | | (674 | ) |
Trading Securities | | | | | | | (15,971 | ) | | | 31 | | | | (14,491 | ) | | | 501 | |
Loans and advances | | | | | | | (1,897 | ) | | | (46,855 | ) | | | (23,162 | ) | | | (37,813 | ) |
Net intra-group loans and advances | | | | | | | — | | | | — | | | | 6,412 | | | | 2,222 | |
Increase/(decrease) in operating liabilities | | | | | | | | | | | | | | | | | | | | |
Deposits and other borrowings | | | | | | | 12,601 | | | | 49,796 | | | | 26,171 | | | | 43,503 | |
Due to other financial institutions | | | | | | | (168 | ) | | | 976 | | | | (1,027 | ) | | | 761 | |
Payables and other liabilities | | | | | | | (994 | ) | | | (1,189 | ) | | | 259 | | | | (3,146 | ) |
| | | | | | | | | | | | | | | | | | | | |
Net cash (used in)/provided by operating activities | | | 37 | (a) | | | (3,682 | ) | | | (210 | ) | | | (4,972 | ) | | | 3,051 | |
| | | | | | | | | | | | | | | | | | | | |
Cash flows from investing activities | | | | | | | | | | | | | | | | | | | | |
Net decrease/(increase) | | | | | | | | | | | | | | | | | | | | |
Available-for-sale assets | | | | | | | | | | | | | | | | | | | | |
Purchases | | | | | | | (30,980 | ) | | | (30,228 | ) | | | (28,206 | ) | | | (28,555 | ) |
Proceeds from sale or maturity | | | | | | | 31,559 | | | | 26,914 | | | | 29,480 | | | | 25,189 | |
Controlled entities and associates | | | | | | | | | | | | | | | | | | | | |
Purchased (net of cash acquired) | | | | | | | (263 | ) | | | (450 | ) | | | (231 | ) | | | (291 | ) |
Proceeds from sale (net of cash disposed) | | | | | | | 15 | | | | 128 | | | | 15 | | | | 113 | |
Premises and equipment | | | | | | | | | | | | | | | | | | | | |
Purchases | | | | | | | (709 | ) | | | (559 | ) | | | (211 | ) | | | (396 | ) |
Proceeds from sale | | | | | | | 27 | | | | 98 | | | | 8 | | | | 10 | |
Other | | | | | | | (50 | ) | | | (1,333 | ) | | | (704 | ) | | | (1,134 | ) |
| | | | | | | | | | | | | | | | | | | | |
Net cash (used in)/provided by investing activities | | | | | | | (401 | ) | | | (5,430 | ) | | | 151 | | | | (5,064 | ) |
| | | | | | | | | | | | | | | | | | | | |
Cash flows from financing activities | | | | | | | | | | | | | | | | | | | | |
Net increase/(decrease) | | | | | | | | | | | | | | | | | | | | |
Bonds and notes | | | | | | | | | | | | | | | | | | | | |
Issue proceeds | | | | | | | 20,417 | | | | 29,200 | | | | 16,297 | | | | 22,545 | |
Redemptions | | | | | | | (20,648 | ) | | | (21,091 | ) | | | (14,009 | ) | | | (17,319 | ) |
Loan capital | | | | | | | | | | | | | | | | | | | | |
Issue proceeds | | | | | | | 1,287 | | | | 3,823 | | | | 1,242 | | | | 2,851 | |
Redemptions | | | | | | | (1,344 | ) | | | (1,975 | ) | | | (1,344 | ) | | | (1,455 | ) |
Dividends paid | | | | | | | (697 | ) | | | (46 | ) | | | (664 | ) | | | — | |
Share capital issues | | | | | | | 4,680 | | | | 67 | | | | 4,680 | | | | 67 | |
| | | | | | | | | | | | | | | | | | | | |
Net cash (used in)/provided by financing activities | | | | | | | 3,695 | | | | 9,978 | | | | 6,202 | | | | 6,689 | |
| | | | | | | | | | | | | | | | | | | | |
Net cash (used in)/provided by operating activities | | | | | | | (3,682 | ) | | | (210 | ) | | | (4,972 | ) | | | 3,051 | |
Net cash (used in)/provided by investing activities | | | | | | | (401 | ) | | | (5,430 | ) | | | 151 | | | | (5,064 | ) |
Net cash (used in)/provided by financing activities | | | | | | | 3,695 | | | | 9,978 | | | | 6,202 | | | | 6,689 | |
| | | | | | | | | | | | | | | | | | | | |
Net increase/(decrease) in cash and cash equivalents | | | | | | | (388 | ) | | | 4,338 | | | | 1,381 | | | | 4,676 | |
Cash and cash equivalents at beginning of period | | | | | | | 23,487 | | | | 19,074 | | | | 17,156 | | | | 12,040 | |
Foreign currency translation | | | | | | | (294 | ) | | | 75 | | | | (486 | ) | | | 440 | |
| | | | | | | | | | | | | | | | | | | | |
Cash and cash equivalents at end of period | | | 37 | (b) | | | 22,805 | | | | 23,487 | | | | 18,051 | | | | 17,156 | |
| | | | | | | | | | | | | | | | | | | | |
The notes appearing on pages 76 to 183 form an integral part of these financial statements.
Financial Report75
NOTES TO THE FINANCIAL STATEMENTS
1: Significant Accounting Policies
The financial report of Australia and New Zealand Banking Group Limited (the Company or the Parent entity) and its controlled entities (the Group) for the year ended 30 September 2009 was authorised for issue in accordance with the resolution of the directors on 5 November, 2009.
The principal accounting policies adopted in the preparation of the financial report are set out below. These policies have been consistently applied by all consolidated entities and to all periods presented in the consolidated financial report.
A) BASIS OF PREPARATION
i) Statement of compliance
The financial report of the Company and Group is a general purpose financial report which has been prepared in accordance with the accounts provisions of the Banking Act 1959 (as amended), Australian Accounting Standards (AASs), Australian Accounting Standards Board (AASB) Interpretations, other authoritative pronouncements of the AASB, and the Corporations Act 2001.
International Financial Reporting Standards (IFRS) are Standards and Interpretations adopted by the International Accounting Standards Board (IASB). IFRS forms the basis of AASs and Interpretations issued by the AASB. The Group’s application of AASs and Interpretations ensures that the consolidated financial report of the Group and the financial report of the Company comply with IFRS.
ii) Use of estimates and assumptions
The preparation of the financial report requires the use of management judgement, estimates and assumptions that affect reported amounts and the application of policies. The estimates and associated assumptions are based on historical experience and various other factors that are believed to be reasonable. Actual results may differ from these estimates. Discussion of the critical accounting treatments, which include complex or subjective decisions or assessments, are covered in note 2. Such estimates may require review in future periods.
iii) Basis of measurement
The financial report has been prepared in accordance with the historical cost basis except that the following assets and liabilities are stated at their fair value:
| • | | derivative financial instruments, including in the case of fair value hedging (refer note 1 (E)(ii)) the fair value of any applicable underlying exposure; |
| • | | assets treated as available-for-sale; |
| • | | financial instruments held for trading; |
| • | | assets and liabilities designated at fair value through profit and loss; and |
| • | | defined benefit plan assets and liabilities. |
iv) Changes in accounting policy and early adoptions
AASB 8 Operating Segments has been early adopted by the Group for the 2009 financial year. AASB 8 replaces AASB 114 Segment Reporting and requires the use of a ‘management approach’ to segment reporting. Segment information is therefore presented on the same basis as that used for internal reporting purposes. Adoption of this standard and the restructure of the Group has resulted in a revision to the Group’s reportable segments.
As goodwill is allocated by management to groups of cash-generating units (CGUs) on a segment level, the change in reportable segments has required a corresponding restructure of the Group’s CGUs. Refer to additional information in note 2(vi) and note 36.
AASB 2007-3 Amendments to Australian Accounting Standards arising from AASB 8 makes consequential amendments to various standards which arise as a result of the issuance of AASB 8. This standard is required to be applied when an entity applies AASB 8 and as such this standard has also been early adopted in the current financial year.
AASB 2008-10 Amendments to Australian Accounting Standards – Reclassification of Financial Assets resulted in amendments to AASB 139 Financial Instruments: Recognition and Measurement permitting reclassification of Financial Assets in certain limited circumstances. This standard also resulted in amendments to AASB 7 Financial Instruments: Disclosure. The Group has applied this standard from 1 October 2008 and reclassified $415 million of available-for-sale financial assets to loans and advances as at 1 November 2008. Refer to additional information in note 14.
Various AASB Interpretations became effective and thus applicable to the Group for the first time from 1 October 2008 with no material impact. These are as follows:
| • | | AASB Interpretation 13 “Customer Loyalty Programmes” which requires the deferral of revenue associated with such programmes and the recognition over the redemption period. The Group offers such programmes through many of its credit card arrangements, however, a thorough review of the underlying arrangements has not resulted in any material adjustment as ANZ typically acts as an agent in these relationships. |
| • | | AASB Interpretation 14 “AASB 119 – The Limit on a Defined Benefit Asset, Minimum Funding Requirements and their interaction” which provides guidance on the amount of surplus that can be recognised as an asset by an employer sponsor of a defined benefit scheme. No adjustment has resulted from applying this guidance. |
| • | | AASB Interpretation 16 “Hedges of a Net Investment in a Foreign Operation” clarifies certain aspects of hedge accounting for net investments in foreign operations. The Group’s existing hedges are in compliance with the requirements thus no adjustment was required. |
There has been no other change in accounting policy during the year.
v) Rounding
The Parent entity is an entity of the kind referred to in Australian Securities and Investments Commission class order 98/100 dated 10 July 1998 (as amended). Consequently, amounts in the financial report have been rounded to the nearest million dollars, except where otherwise indicated.
vi) Comparatives
Certain amounts in the comparative information have been reclassified to conform with current period financial statement presentations.
76ANZ Annual Report 2009
NOTES TO THE FINANCIALSTATEMENTS
1: Significant Accounting Policies(continued)
vii) Principles of consolidation
Subsidiaries
The financial statements consolidate the financial statements of the Company and all its subsidiaries where it is determined that there is a capacity to control.
Where subsidiaries have been sold or acquired during the year, their operating results have been included to the date of disposal or from the date of acquisition.
Control means the power to govern, directly or indirectly, the financial and operating policies of an entity so as to obtain benefits from its activities. All the facts of a particular situation are considered when determining whether control exists. Control is usually present when an entity has:
| • | | power over more than one-half of the voting rights of the other entity; or |
| • | | power to govern the financial and operating policies of the other entity; or |
| • | | power to appoint or remove the majority of the members of the board of directors or equivalent governing body; or |
| • | | power to cast the majority of votes at meetings of the board of directors or equivalent governing body of the entity. |
In addition, potential voting rights that are presently exercisable or convertible are taken into account in determining whether control exists.
In relation to special purpose entities, control is deemed to exist where:
| • | | in substance, the majority of the residual risks and rewards from their activities accrue to the Group; or |
| • | | in substance, the Group controls decision making powers so as to obtain the majority of the risks and rewards from their activities. |
Further detail on special purpose entities is provided in
note 2(i).
Associates and joint ventures
The Group adopts the equity method of accounting for associates and the Group’s interest in joint venture entities.
The Group’s share of results of associates and joint venture entities is included in the consolidated income statement. Shares in associates and joint venture entities are carried in the consolidated balance sheet at cost plus the Group’s share of post-acquisition net assets. Interests in associates and joint ventures are reviewed for any indication of impairment at least at each reporting date. This impairment review may use a discounted cash flow methodology and other methodologies to determine the reasonableness of the valuation, including the multiples of earnings methodology.
In the Company’s financial statements, investments in associates and joint venture entities are carried at cost.
viii) Foreign currency translation
Functional and presentation currency
Items included in the financial statements of each of the Group’s entities are measured using the currency of the primary economic environment in which the entity operates (the functional currency).
The consolidated financial statements are presented in Australian dollars, which is the Company’s functional and presentation currency.
Foreign currency transactions
Foreign currency transactions are translated into the functional currency using the exchange rates prevailing at the dates of the transactions.
Monetary assets and liabilities resulting from foreign currency transactions are subsequently translated at the spot rate at reporting date.
Exchange differences arising on the settlement of monetary items or on translating monetary items at rates different to those at which they were initially recognised or included in a previous financial report, are recognised in the income statement in the period in which they arise.
Translation differences on non-monetary items, such as derivatives measured at fair value through profit or loss, are reported as part of the fair value gain or loss on these items.
Translation differences on non-monetary items measured at fair value through equity, such as equities classified as available-for-sale financial assets, are included in the available-for-sale reserve in equity.
Foreign operations
The results and financial position of all Group entities (none of which has the currency of a hyperinflationary economy), that have a functional currency different from the Group’s presentation currency, are translated into the Group’s presentation currency as follows:
| • | | assets and liabilities of each foreign operation are translated at the rates of exchange ruling at balance date; |
| • | | revenue and expenses of each foreign operation are translated at the average exchange rate for the period, unless this average is not a reasonable approximation of the rate prevailing on transaction date, in which case revenue and expenses are translated at the exchange rate ruling at transaction date; and |
| • | | all resulting exchange differences are recognised in the foreign currency translation reserve. |
When a foreign operation is disposed, exchange differences are recognised in the income statement as part of the gain or loss on sale.
Goodwill arising on the acquisition of a foreign entity is treated as an asset of the foreign entity and translated at the rate ruling at balance date.
B) INCOME RECOGNITION
i) Interest income
Interest income is recognised as it accrues using the effective interest rate method.
The effective interest rate method calculates the amortised cost of a financial asset or financial liability and allocates the interest income or interest expense over the expected life of the financial asset or financial liability so as to achieve a constant yield on the financial asset or liability.
For assets subject to prepayment, expected life is determined on the basis of the historical behaviour of the particular asset portfolio, taking into account contractual obligations and prepayment experience assessed on a regular basis.
Financial Report77
NOTES TO THE FINANCIAL STATEMENTS
1: Significant Accounting Policies (continued)
ii) Fee and commission income
Fees and commissions received that are integral to the effective interest rate of a financial asset are recognised using the effective interest method. For example, loan commitment fees, together with related direct costs, are deferred and recognised as an adjustment to the effective interest rate on a loan once drawn. Commitment fees to originate a loan which is unlikely to be drawn down are recognised as fee income as the service is provided.
Fees and commissions that relate to the execution of a significant act (for example, advisory or arrangement services, placement fees and underwriting fees) are recognised when the significant act has been completed.
Fees charged for providing ongoing services (for example, maintaining and administering existing facilities) are recognised as income over the period the service is provided.
iii) Dividend income
Dividends are recognised as revenue when the right to receive payment is established.
iv) Leasing income
Finance income on finance leases is recognised on a basis that reflects a constant periodic return on the net investment in the finance lease.
v) Gain or loss on sale of property, plant and equipment
The gain or loss on the disposal of premises and equipment is determined as the difference between the carrying amount of the assets at the time of disposal and the proceeds of disposal, and is recognised as an item of other income in the year in which the significant risks and rewards of ownership are transferred to the buyer.
C) EXPENSE RECOGNITION
i) Interest expense
Interest expense on financial liabilities measured at amortised cost is recognised in the income statement as it accrues using the effective interest rate method.
ii) Loan origination expenses
Certain loan origination expenses are an integral part of the effective interest rate of a financial asset measured at amortised cost. These loan origination expenses include:
| • | | fees and commissions payable to brokers in respect of originating lending business; and |
| • | | other expenses of originating lending business, such as external legal costs and valuation fees, provided these are direct and incremental costs related to the issue of a financial asset. |
Such loan origination expenses are initially recognised as part of the cost of acquiring the financial asset and amortised as part of the expected yield of the financial asset over its expected life using the effective interest rate method.
iii) Share-based compensation expense
The Group has various equity settled share-based compensation plans. These are described in note 46 and largely comprise the Employee Share Acquisition Plan and the ANZ Share Option Plan.
ANZ ordinary shares
The fair value of ANZ ordinary shares granted under the Employee Share Acquisition Plan is measured at grant date, using the one-day volume weighted average market price of ANZ shares. The fair value is expensed immediately when shares vest immediately or on a straight-line basis over the relevant vesting period
Share options
The fair value of share options is measured at grant date, using an option pricing model. The fair value is expensed on a straight-line basis over the relevant vesting period. This is recognised as an employee compensation expense with a corresponding increase in the share options reserve.
The option pricing model takes into account the exercise price of the option, the risk-free interest rate, the expected volatility of ANZ’s ordinary share price and other factors. Market vesting conditions are taken into account in estimating the fair value.
Performance rights
A Performance Right is a right to acquire a share at nil cost to the employee subject to satisfactorily meeting time and performance hurdles. Upon exercise, each Performance Right entitles the holder to one ordinary share in ANZ. The fair value of Performance Rights is determined at grant date using an option pricing model, taking into account market conditions. The fair value is expensed over the relevant vesting period. This is recognised as an employee expense with a corresponding increase in the share options reserve.
Other adjustments
Subsequent to the grant of an equity-based award, the amount recognised as an expense is adjusted for vesting conditions other than market conditions so that, ultimately, the amount recognised as an expense is based on the number of equity instruments that eventually vest.
iv) Lease payments
Leases entered into by the Group as lessee are predominantly operating leases, and the operating lease payments are recognised as an expense on a straight-line basis over the lease term.
D) INCOME TAX
i) Income tax expense
Income tax on earnings for the year comprises current and deferred tax and is based on the applicable tax law in each jurisdiction. It is recognised in the income statement as tax expense, except when it relates to items credited directly to equity, in which case it is recorded in equity, or where it arises from the initial accounting for a business combination, in which case it is included in the determination of goodwill.
ii) Current tax
Current tax is the expected tax payable on taxable income for the year, based on tax rates (and tax laws) which are enacted at the reporting date, including any adjustment for tax payable in previous periods. Current tax for current and prior periods is recognised as a liability (or asset) to the extent that it is unpaid (or refundable).
78 ANZ Annual Report 2009
NOTES TO THE FINANCIAL STATEMENTS
1: Significant Accounting Policies (continued)
iii) Deferred tax
Deferred tax is accounted for using the comprehensive tax balance sheet method. It is generated by temporary differences between the carrying amounts of assets and liabilities for financial reporting purposes and their tax base.
Deferred tax assets, including those related to the tax effects of income tax losses and credits available to be carried forward, are recognised only to the extent that it is probable that future taxable profits will be available against which the deductible temporary differences or unused tax losses and credits can be utilised.
Deferred tax liabilities are recognised for all taxable temporary differences, other than those relating to taxable temporary differences arising from goodwill. They are also recognised for taxable temporary differences arising on investments in controlled entities, branches, associates and joint ventures, except where the Group is able to control the reversal of the temporary differences and it is probable that temporary differences will not reverse in the foreseeable future. Deferred tax assets associated with these interests are recognised only to the extent that it is probable that the temporary difference will reverse in the foreseeable future and there will be sufficient taxable profits against which to utilise the benefits of the temporary difference.
Deferred tax assets and liabilities are measured at the tax rates that are expected to apply to the period(s) when the asset and liability giving rise to them are realised or settled, based on tax rates (and tax laws) that have been enacted or substantively enacted by the reporting date. The measurement reflects the tax consequences that would follow from the manner in which the Group, at the reporting date, recovers or settles the carrying amount of its assets and liabilities.
iv) Offsetting
Current and deferred tax assets and liabilities are offset only to the extent that they relate to income taxes imposed by the same taxation authority, there is a legal right and intention to settle on a net basis and it is allowed under the tax law of the relevant jurisdiction.
E) ASSETS
Financial assets
i) Financial assets and liabilities at fair value through profit or loss
Trading securities are financial instruments acquired principally for the purpose of selling in the short-term or which are a part of a portfolio which is managed for short-term profit-taking. Trading securities are initially recognised and subsequently measured in the balance sheet at their fair value.
Derivatives that are neither financial guarantee contracts nor effective hedging instruments are carried at fair value through profit or loss. In addition, certain financial assets and liabilities are designated and measured at fair value through profit or loss where the following applies:
| • | | doing so eliminates or significantly reduces a measurement or recognition inconsistency that would otherwise arise from measuring assets and liabilities, or recognising the gains or losses thereon, on different bases; |
| • | | a group of financial assets or financial liabilities or both is managed and its performance evaluated on a fair value basis; or |
| • | | the financial instrument contains an embedded derivative, unless the embedded derivative does not significantly modify the cash flows or it is clear, with little or no analysis, that it would not be separately recorded. |
Changes in the fair value (gains or losses) of these financial instruments are recognised in the income statement in the period in which they occur.
Purchases and sales of trading securities are recognised on trade date.
ii) Derivative financial instruments
Derivative financial instruments are contracts whose value is derived from one or more underlying price, index or other variables. They include swaps, forward rate agreements, futures, options and combinations of these instruments.
Derivative financial instruments are entered into for trading purposes (including customer-related reasons), or for hedging purposes (where the derivative instruments are used to hedge the Group’s exposures to interest rate risk, currency risk, price risk, credit risk and other exposures relating to non-trading positions).
Derivative financial instruments are recognised initially at fair value with gains or losses from subsequent measurement at fair value being recognised in the income statement. Included in the determination of the fair value of derivatives is a credit valuation adjustment to reflect the credit worthiness of the counterparty. The valuation adjustment is influenced by the mark-to-market of the derivative trades and by movement in credit spreads.
Where the derivative is designated and is effective as a hedging instrument, the timing of the recognition of any resultant gain or loss in the income statement is dependent on the hedging designation. These hedging designations and associated accounting are as follows:
Fair value hedge
Where the Group hedges the fair value of a recognised asset or liability or firm commitment, changes in the fair value of the derivative designated as a fair value hedge are recognised in the income statement. Changes in the fair value of the hedged item attributable to the hedged risk are reflected in adjustments to the carrying value of the hedged item, which are also recognised in the income statement.
Hedge accounting is discontinued when the hedge instrument expires or is sold, terminated, exercised or no longer qualifies for hedge accounting. The resulting adjustment to the carrying amount of the hedged item arising from the hedged risk is amortised to the income statement over the period to maturity of the hedged item.
If the hedged item is sold or repaid, the unamortised fair value adjustment is recognised immediately in the income statement.
Cash flow hedge
The Group designates derivatives as cash flow hedges where the instrument hedges the variability in cash flows of a recognised asset or liability, a foreign exchange component of a firm commitment or a highly probable forecast transaction. The effective portion of changes in the fair value of derivatives qualifying and designated as cash flow hedges is deferred to the hedging reserve, which forms part of shareholders’ equity. Any ineffective portion is recognised immediately in the income statement. Amounts deferred in equity are recognised in the income statement in the period during which the hedged forecast transactions take place.
Financial Report79
NOTES TO THE FINANCIAL STATEMENTS
1: Significant Accounting Policies(continued)
When the hedging instrument expires, is sold, terminated, or no longer qualifies for hedge accounting, the cumulative amount deferred in equity remains in the hedging reserve, and is subsequently transferred to the income statement when the hedged item is recognised in the income statement.
When a forecast hedged transaction is no longer expected to occur, the amount deferred in equity is recognised immediately in the income statement.
Net investment hedge
Hedges of net investments in foreign operations are accounted for similarly to cash flow hedges. The gain or loss from remeasuring the fair value of the hedging instrument relating to the effective portion of the hedge is deferred in the foreign currency translation reserve in equity and the ineffective portion is recognised immediately in the income statement.
Derivatives that do not qualify for hedge accounting
All gains and losses from changes in the fair value of derivatives that are not designated in a hedging relationship but are entered into to manage the interest rate and foreign exchange risk of funding instruments are recognised in the income statement. Under certain circumstances, the component of the fair value change in the derivative which relates to current period realised and accrued interest is included in net interest income. The remainder of the fair value movement is included in other income.
Set-off arrangements
Fair value gains/losses arising from trading derivatives are not offset against fair value gains/losses on the balance sheet unless a legal right of set-off exists and there is an intention to net settle.
For contracts subject to master netting agreements that create a legal right of set-off for which only the net revaluation amount is recognised in the income statement, net unrealised gains on derivatives are recognised as part of other assets and net unrealised losses are recognised as part of other liabilities.
iii) Available-for-sale financial assets
Available-for-sale assets comprise non-derivative financial assets which the Group designates as available-for-sale but which are not deemed to be held principally for trading purposes, and include equity investments, certain loans and advances, and quoted debt securities.
They are initially recognised at fair value plus transaction costs. Subsequent gains or losses arising from changes in fair value are included as a separate component of equity in the ‘available-for-sale revaluation reserve’. When the asset is sold, the cumulative gain or loss relating to the asset is transferred to the income statement.
Where there is objective evidence of impairment on an available-for-sale asset, the cumulative loss related to that asset is removed from equity and recognised in the income statement, as an impairment expense for debt instruments or as non-interest income for equity instruments. If, in a subsequent period, the amount of an impairment loss relating to an available-for-sale debt instrument decreases and the decrease can be linked objectively to an event occurring after the impairment event, the loss is reversed through the income statement through the impairment expense line.
Purchases and sales of available-for-sale financial assets are recognised on trade date being the date on which the Group commits to purchase or sell the asset.
iv) Net loans and advances
Net loans and advances are non-derivative financial assets with fixed or determinable payments that are not quoted in an active market. They arise when the Group provides money to a debtor with no intention of trading the loans and advances. The loans and advances are initially recognised at fair value plus transaction costs that are directly attributable to the issue of the loan or advance. They are subsequently measured at amortised cost using the effective interest rate method (refer note 1(B)(i)), unless specifically designated on initial recognition at fair value through profit or loss.
All loans are graded according to the level of credit risks.
Net loans and advances includes direct finance provided to customers such as bank overdrafts, credit cards, term loans, finance lease receivables and commercial bills.
Impairment of loans and advances
Loans and advances are reviewed at least at each reporting date for impairment.
Credit impairment provisions are raised for exposures that are known to be impaired. Exposures are impaired and impairment losses are recorded if, and only if, there is objective evidence of impairment as a result of one or more loss events that occurred after the initial recognition of the loan and prior to the reporting date, and that loss event, or events, has had an impact on the estimated future cash flows of the individual loan or the collective portfolio of loans that can be reliably estimated.
Impairment is assessed for assets that are individually significant (or on a portfolio basis for small value loans) and then on a collective basis for those exposures not individually known to be impaired.
Exposures that are assessed collectively are placed in pools of similar assets with similar risk characteristics. The required provision is estimated on the basis of historical loss experience for assets with credit risk characteristics similar to those in the collective pool. The historical loss experience is adjusted based on current observable data such as changed economic conditions. The provision also takes account of the impact of inherent risk of large concentrated losses within the portfolio and an assessment of the economic cycle.
The estimated impairment losses are measured as the difference between the assets’ carrying amount and the estimated future cash flows discounted to their present value. As this discount unwinds during the period between recognition of impairment and recovery of the cash flow, it is recognised in interest income. The process of estimating the amount and timing of cash flows involves considerable management judgment. These judgments are reviewed regularly to reduce any differences between loss estimates and actual loss experience.
Impairment of capitalised acquisition expenses is assessed through comparing the actual behaviour of the portfolio against initial expected life assumptions.
The provision for impairment loss (individual and collective) is deducted from loans and advances in the balance sheet and the movement for the reporting period is reflected in the income statement.
When a loan is uncollectable, either partially or in full, it is written-off against the related provision for loan impairment. Unsecured facilities are normally written-off when they become 180 days past due or earlier in the event of the customer’s bankruptcy or similar legal release from the obligation.
80ANZ Annual Report 2009
NOTES TO THE FINANCIAL STATEMENTS
1: Significant Accounting Policies(continued)
However a certain level of recoveries is expected after the write-off, which is reflected in the amount of the provision for credit losses. In the case of secured facilities, remaining balances are written-off after proceeds from the realisation of collateral have been received if there is a shortfall.
Where impairment losses recognised in previous periods have subsequently decreased or no longer exist, such impairment losses are reversed in the income statement.
A provision is also raised for off-balance sheet items such as loan commitments that are considered to be onerous.
v) Lease receivables
Contracts to lease assets and hire purchase agreements are classified as finance leases if they transfer substantially all the risks and rewards of ownership of the asset to the customer or an unrelated third party. All other lease contracts are classified as operating leases.
vi) Repurchase agreements
Securities sold under repurchase agreements are retained in the financial statements where substantially all the risks and rewards of ownership remain with the Group, and a counterparty liability is disclosed under the classifications of due to other financial institutions or payables and other liabilities. The difference between the sale price and the repurchase price is accrued over the life of the repurchase agreement and charged to interest expense in the income statement.
Securities purchased under agreements to resell, where the Group does not acquire the risks and rewards of ownership, are recorded as receivables in liquid assets, net loans and advances, or due from other financial institutions, depending on the term of the agreement and the counterparty. The security is not included in the balance sheet. Interest income is accrued on the underlying loan amount.
Securities borrowed are not recognised in the balance sheet, unless these are sold to third parties, at which point the obligation to repurchase is recorded as a financial liability at fair value with fair value movements included in the income statement.
vii) Derecognition
The Group enters into transactions where it transfers financial assets recognised on its balance sheet yet retains either all the risks and rewards of the transferred assets or a portion of them. If all, or substantially all, the risks and rewards are retained, the transferred assets are not derecognised from the balance sheet.
In transactions where substantially all the risks and rewards of ownership of a financial asset are neither retained nor transferred, the Group derecognises the asset if control over the asset is lost. In transfers where control over the asset is retained, the Group continues to recognise the asset to the extent of its continuing involvement, determined by the extent to which it is exposed to changes in the value of the transferred asset. The rights and obligations retained or created in the transfer are recognised separately as assets and liabilities as appropriate.
Non-financial assets
viii) Goodwill
Goodwill represents the excess of the purchase consideration over the fair value of the identifiable net assets of a controlled entity at the date of gaining control. Goodwill is recognised as an asset and not amortised, but assessed for impairment at least annually or more frequently if there is an indication that the goodwill may be impaired. This involves using the discounted cash flow (DCF) or the capitalisation of earnings methodology (CEM) to determine the expected future benefits of the cash-generating units. Where the assessment results in the goodwill balance exceeding the value of expected future benefits, the difference is charged to the income statement. Any impairment of goodwill may not be subsequently reversed.
ix) Other intangible assets
Other intangible assets include costs incurred in acquiring and building software and computer systems (“software”).
Software is amortised using the straight-line method over its expected useful life to the Group. The period of amortisation is between 3 and 5 years, except for certain core infrastructure projects where the useful life has been determined to be 7 years.
At each reporting date, software assets are reviewed for impairment. If any such indication exists, the recoverable amount of the assets are estimated and compared against the existing carrying value. Where the existing carrying value exceeds the recoverable amount, the difference is charged to the income statement.
Costs incurred in planning or evaluating software proposals, or in maintaining systems after implementation, are not capitalised.
x) Premises and equipment
Premises and equipment are carried at cost less accumulated depreciation and impairment.
Borrowing costs incurred for the construction of qualifying assets (principally the new office building in Docklands area, Melbourne Australia) are capitalised during the period of time that is required to complete and prepare the asset for its intended use. The calculation of borrowing costs is based upon the Group’s internal cost of capital.
Assets other than freehold land are depreciated at rates based upon their expected useful lives to the Group, using the straight-line method. The depreciation rates used for each class of asset are:
| | | | |
Buildings | | | 1-1.5% | |
Building integrals | | | 10% | |
Furniture & equipment | | | 10% | |
Computer & office equipment | | | 12.5%–33% | |
Leasehold improvements are amortised on a straight-line basis over the shorter of their useful lives or remaining terms of the lease.
At each reporting date, the carrying amounts of premises and equipment are reviewed for impairment. If any such indication exists, the recoverable amount of the assets are estimated and compared against the existing carrying value. Where the existing carrying value exceeds the recoverable amount, the difference is charged to the income statement. If it is not possible to estimate the recoverable amount of an individual asset, the Group estimates the recoverable amount of the cash generating unit to which the asset belongs.
A previously recognised impairment loss is reversed if there has been a change in the estimates used to determine the recoverable amount.
Financial Report 81
NOTES TO THE FINANCIAL STATEMENTS
1: Significant Accounting Policies(continued)
F) LIABILITIES
Financial liabilities
i) Deposits and other borrowings
Deposits and other borrowings include certificates of deposit, interest bearing deposits, debentures and other related interest bearing financial instruments. They are measured at amortised cost. The interest expense is recognised using the effective interest method.
ii) Acceptances
Commercial bills accepted but not held in portfolio are accounted for as a liability with a corresponding contra asset. The liability is disclosed as liability for acceptances, and the asset is disclosed as Customer’s liability for acceptances.
The Group’s own acceptances discounted are held as part of the trading securities portfolio.
iii) Bonds, notes and loan capital
Bonds, notes and loan capital are accounted for in the same way as deposits and other borrowings, except for those bonds and notes which are stated designated at fair value through profit or loss on initial recognition, with fair value movements recorded in the income statement.
iv) Financial guarantee contracts
Financial guarantee contracts are contracts that require the issuer to make specified payments to reimburse the holder for a loss it incurs because a specified debtor fails to make payments when due. Financial guarantees are issued in the ordinary course of business, consisting of letters of credit, guarantees and acceptances. Financial guarantees are initially recognised in the financial statements at fair value on the date the guarantee was given; typically this is the premium received. Subsequent to initial recognition, the Group’s liabilities under such guarantees are measured at the higher of their amortised amount and the best estimate of the expenditure required to settle any financial obligation arising at the balance sheet date. These estimates are determined based on experience of similar transactions and the history of past losses.
v) Derecognition
Financial liabilities are derecognised when the obligation specified in the contract is discharged, cancelled or expires.
Non-financial liabilities
vi) Employee benefits
Leave benefits
The amounts expected to be paid in respect of employees’ entitlements to annual leave are accrued at expected salary rates including on-costs. Expected future payments for long service leave are discounted using market yields at the reporting date on national government bonds with terms to maturity that match, as closely as possible, the estimated future cash outflows. Liability for long service leave is calculated and accrued for in respect of all applicable employees (including on-costs) using an actuarial valuation.
Defined contribution superannuation schemes
The Group operates a number of defined contribution schemes and also contributes, according to local law, in the various countries in which it operates, to government and other plans that have the characteristics of defined contribution schemes.
The Group’s contributions to these schemes are recognised as an expense in the income statement when incurred.
Defined benefit superannuation schemes
The Group operates a small number of defined benefit schemes. The liability and expense related to providing benefits to employees under each defined benefit scheme are calculated by independent actuaries.
A defined benefit liability is recognised to the extent that the present value of the defined benefit obligation of each scheme, calculated using the Projected Unit Credit Method, is greater than the fair value of each scheme’s assets. Where this calculation results in a benefit to the Group, a defined benefit asset is recognised, which is capped at the recoverable amount. In each subsequent reporting period, ongoing movements in the defined benefit liability or asset carrying value is treated as follows:
| • | | the net movement relating to the current period’s service cost, interest cost, expected return on scheme assets, past service costs and other costs (such as the effects of any curtailments and settlements) is recognised as an employee expense in the income statement; |
| • | | movements relating to actuarial gains and losses are recognised directly in retained earnings; and |
| • | | contributions incurred are recognised directly against the net defined benefit position. |
vii) Provisions
The Group recognises provisions when there is a present obligation, the future sacrifice of economic benefits is probable, and the amount of the provision can be measured reliably.
The amount recognised is the best estimate of the consideration required to settle the present obligation at reporting date, taking into account the risks and uncertainties surrounding the obligation at reporting date. Where a provision is measured using the cash flows estimated to settle the present obligation, its carrying amount is the present value of those cash flows.
G) EQUITY
i) Ordinary shares
Ordinary shares in the Company are recognised at the amount paid per ordinary share net of directly attributable issue costs.
ii) Treasury shares
Shares in the Company which are purchased on-market by the ANZ Employee Share Acquisition Plan or issued by the Company to the ANZ Employee Share Acquisition Plan are classified as treasury shares (to the extent that they relate to unvested employee share-based awards) and deducted from share capital.
82ANZ Annual Report 2009
NOTES TO THE FINANCIAL STATEMENTS
1: Significant Accounting Policies(continued)
iii) Minority interests
Minority interests represent the share in the net assets of subsidiaries attributable to equity interests not owned directly or indirectly by the Company.
iv) Reserves
Foreign currency translation reserve
As indicated in note 1(A)(viii), exchange differences arising on translation of the assets and liabilities of all Group entities are reflected in the foreign currency translation reserve. Any offsetting gains or losses on hedging these balances, together with any tax effect, are also reflected in this reserve.
Available-for-sale revaluation reserve
This reserve includes changes in the fair value of available-for-sale financial assets, net of tax. These changes are transferred to the income statement (in non-interest income) when the asset is derecognised. Where the asset is impaired, the changes are transferred to impairment expense in the income statement for debt instruments and in the case of equity instruments to non-interest income.
Cash flow hedging reserve
This reserve includes the fair value gains and losses associated with the effective portion of designated cash flow hedging instruments.
Share-based payment reserves
Share-based payment reserves include the share options reserve and other equity reserves which arise on the recognition of share-based compensation expense (see note 1(C)(iii)).
H) PRESENTATION
i) Offsetting of income and expenses
Income and expenses are not offset unless required or permitted by an accounting standard. At the Group level, this generally arises in the following circumstances:
| • | | where transaction costs form an integral part of the effective interest rate of a financial instrument which is measured at amortised cost, these are offset against the interest income generated by the financial instrument; or |
| • | | where gains and losses relating to fair value hedges are assessed as being effective; or |
| • | | where gains and losses arise from a group of similar transactions, such as foreign exchange gains and losses. |
ii) Offsetting assets and liabilities
Assets and liabilities are offset and the net amount reported in the balance sheet only where there is:
| • | | a current enforceable legal right to offset the asset and liability; and |
| • | | an intention to settle on a net basis, or to realise the asset and settle the liability simultaneously. |
iii) Cash and cash equivalents
For cash flow statement presentation purposes, cash and cash equivalents includes cash on hand, deposits held at call with other financial institutions, other short-term, highly liquid investments with original terms to maturity of three months or less that are readily convertible to cash and which are subject to an insignificant risk of changes in value.
iv) Segment reporting
A segment is a distinguishable component of the Group that is engaged either in providing products or services (business segment), or in providing products or services within a particular economic environment (geographical segment), that is subject to risks and returns that are different from those of other business or geographical segments.
v) Goods and services tax
Income, expenses and assets are recognised net of the amount of goods and services tax (GST), except where the amount of GST incurred is not recoverable from the Australian Tax Office (ATO). In these circumstances the GST is recognised as part of the cost of acquisition of the asset or as part of the expense.
Receivables and payables are stated with the amount of GST included. The net amount of GST recoverable from or payable to the ATO is included as an other asset or liability in the balance sheet.
Cash flows are included in the cash flow statement on a gross basis. The GST components of cash flows arising from investing and financing activities which are recoverable from or payable to the ATO are classified as operating cash flows.
I) OTHER
i) Contingent liabilities
A contingent liability is a liability of sufficient uncertainty that it does not qualify for recognition as a provision.
Further disclosure is made in note 44 where the above requirements are not met, but there is a possible obligation that is higher than remote. Specific details of the nature of the contingent liability are provided and, where practicable, an estimate of its financial effect. Alternatively, where no disclosure is made of its financial effect because it is not practicable to do so, a statement to that effect.
ii) Earnings per share
Basic earnings per share is calculated by dividing net profit after tax applicable to equity holders of the Company, excluding any costs of servicing other equity instruments, by the weighted average number of ordinary shares outstanding during the financial year.
Diluted earnings per share adjusts the figures used in the determination of basic earnings per share to take into account the after income tax effective interest and other financing costs associated with dilutive potential ordinary shares and the weighted average number of additional ordinary shares that would have been outstanding assuming the conversion of all dilutive potential ordinary shares.
Financial Report 83
NOTES TO THE FINANCIAL STATEMENTS
1: Significant Accounting Policies(continued)
iii) Accounting Standards and Interpretations not early adopted
The following standards and amendments were available for early adoption but have not been applied by the Group in these financial statements. The Group does not intend to apply any of the pronouncements until their effective date.
| | | | |
AASB amendment/ standard/ interpretation | | Possible impact on the Company and the Group’s financial report in period of initial adoption | | Application date
for the Group |
AASB 3 Business Combinations (revised) | | This standard makes changes to certain aspects of accounting for business combinations including: | | 1 October 2009 |
| | • Transaction costs associated with a business combination are immediately expensed, unless the cost relates to issuing debt or equity securities; and | | |
| | • Contingent consideration must be recognised at its fair value at acquisition date and classified as a liability or equity. If the contingent consideration is classified as a liability, subsequent changes in that liability are recognised in profit or loss. If classified as equity, it is not remeasured in subsequent periods. | | |
| | The revised standard will apply to future reporting periods and the impact will depend upon the nature of acquisitions undertaken. | | |
| | |
AASB 101 Presentation of Financial Statements (revised) | | The main change made by this standard is the specification of a new structure for financial statements under which: | | 1 October 2009 |
| | • The “balance sheet” will revert to its former title “statement of financial position” and the “cash flow statement” will revert to its former title “statement of cash flows”; | | |
| | • A “statement of comprehensive income” will be required showing revenues and expenses recognised in profit or loss and directly against equity. Alternatively, an income statement may be presented showing revenues and expenses recognised in profit or loss and, separately, a statement of comprehensive income showing net profit or loss and revenues and expenses recognised directly in equity; and | | |
| | • A “statement of changes in equity” showing total comprehensive income, transactions with owners in their capacity as owners and the effect of retrospective applications or restatements. | | |
| | The application of this standard is not expected to have a material impact of the financial results or position of the Company or the Group as this standard is only concerned with disclosure. | | |
| | |
| AASB 123 Borrowing Costs (revised) | | The amendments to this standard remove the option to expense all borrowing costs and require the capitalisation of all borrowing costs directly attributable to the acquisition, construction or production of a qualifying asset. There is no significant impact expected to the Company or Group on application of this standard as the Company and Group currently capitalises borrowing costs on any significant qualifying assets. | | 1 October 2009 |
| | |
| AASB 127 Consolidated and Separate Financial Statements (revised) | | The standard makes changes to certain aspects of accounting for non-controlling interests (currently referred to as a ‘minority interests’). For example, total comprehensive income must be attributed to the owners of the parent and to the non-controlling interests even if this results in the controlling interests having a deficit balance. | | 1 October 2009 |
| | Requirements have been added to clarify that changes in a parent’s ownership interest in a subsidiary that do not result in the loss of control of a subsidiary are recognised directly in equity. When loss of control of a subsidiary occurs, any gain or loss arising from this event is recognised in profit or loss and the investment retained in the former subsidiary is measured at its fair value at the date control is lost. | | |
| | The amendments regarding minority interests are not expected to have a material impact on the Group’s financial results or position as minority interests are not material to the Group. | | |
| | The amendments regarding accounting for changes in a parent’s ownership interest in a subsidiary are not expected to have a material impact on the Company as these types of changes occur relatively infrequently for the Company and normally involve amounts which are not material to the Company. | | |
| | |
| AASB 2007-6 Amendments to Australian Accounting Standards arising from AASB 123 | | This standard makes consequential amendments to a number of Australian Accounting Standards arising from revised AASB 123 Borrowing Costs. No material impact on the Company or the Group is expected. | | 1 October 2009 |
84ANZ Annual Report 2009
NOTES TO THE FINANCIAL STATEMENTS
1: Significant Accounting Policies(continued)
iii) Accounting Standards and Interpretations not early adopted(continued)
| | | | |
AASB amendment/ standard/ interpretation | | Possible impact on the Company and the Group’s financial report in period of initial adoption | | Application date
for the Group |
AASB 2007-8 Amendments to Australian Accounting Standards arising from AASB 101 | | This standard makes technical amendments to a number of Australian Accounting Standards arising from revised AASB 101 Presentation of Financial Statements. No material impact on the Company or the Group is expected. | | 1 October 2009 |
AASB 2008-1 Amendments to Australian Accounting Standard – Share-based Payments: Vesting Conditions and Cancellations | | This standard clarifies that vesting conditions only include service and performance conditions. The application of this standard is not expected to have an impact of the financial results of the Company or the Group as the treatment of vesting conditions under the Group’s existing share-based plans is clear. | | 1 October 2009 |
AASB 2008-2 Amendments to Australian Accounting Standards – Puttable Financial Instruments and Obligations arising on Liquidation | | This standard defines puttable instruments and requires puttable instruments with certain characteristics to be classified as equity. The application of this standard is not expected to have an impact on the financial position of the Company or the Group as the Group or Company has not issued, nor expects to issue, puttable instruments with characteristics covered by the standard. | | 1 October 2009 |
AASB 2008-3 Amendments to Australian Accounting Standards arising from AASB 3 and AASB 127 | | This standard makes technical amendments to a number of Australian Accounting Standards arising from revised AASB 3 Business Combinations and AASB 127 Consolidated and Separate Financial Statements. No material impact on the Company or the Group is expected. | | 1 October 2009 |
AASB 2008-5 Amendments to Australian Accounting Standards arising from the Annual Improvements Project | | This standard makes amendments to 25 standards that result in terminology or editorial changes to standards as well as presentation, recognition and measurement changes to certain standards. Most of the amendments are of a technical or clarifying nature and are not expected to have a material impact on the Company or the Group. | | 1 October 2009 |
AASB 2008-6 Further Amendments to Australian Accounting Standards arising from the Annual Improvements Project | | This standard amends AASB 1 First-time Adoption of Australian Equivalent to International Financial Reporting Standards to require a first-time adopter to apply AASB 127 Consolidated and Separate Financial Statements (as amended in July 2008) prospectively from the date of transition to Australian equivalents to IFRSs. | | 1 October 2009 |
| | An amendment has also been made to AASB 5 Non-current Assets Held for Sale and Discontinued Operations to require an entity that is committed to a sale plan involving loss of control of a subsidiary to classify all the assets and liabilities of that subsidiary as held for sale when specified criteria are met, regardless of whether the entity will retain a non-controlling interest in its former subsidiary after the sale. | | |
| | No material impact on the Company or the Group is expected as a result of these amendments. | | |
Financial Report 85
NOTES TO THE FINANCIAL STATEMENTS
1: Significant Accounting Policies(continued)
iii) Accounting Standards and Interpretations not early adopted(continued)
| | | | |
AASB amendment/ standard/ interpretation | | Possible impact on the Company and the Group’s financial report in period of initial adoption | | Application date
for the Group |
| AASB 2008-7 Amendments to Australian Accounting Standards – Cost of an Investment in a Subsidiary, Jointly Controlled Entity or Associate | | This standard amends AASB 1 First-time Adoption of Australian Equivalents to International Financial Reporting Standards to allow first-time adopters, in their separate financial statements, to use a deemed cost option for determining the cost of an investment in a subsidiary, jointly controlled entity or associate. AASB 118 Revenue has been amended to remove the requirement to deduct dividends declared out of pre-acquisition profits from the cost of an investment in a subsidiary, jointly controlled entity or associate. AASB 127 Consolidated and Separate Financial Statements has been amended to require, in certain circumstances, a new parent entity established in a group reorganisation to measure the cost of its investment at the carrying amount of the share of equity items shown in the separate financial statements of the original parent at the date of the reorganisation. AASB 136 Impairment of Assets has been amended to include, as an impairment indicator, recognising a dividend from a subsidiary, jointly controlled entity or associate, together with other evidence. Consequential amendments have also been made to AASB 121 The Effects of Foreign Exchange Rates. The amendments are not expected to have a material impact on the Company or the Group. | | 1 October 2009 |
AASB 2008-8 Amendments to Australian Accounting Standards – Eligible Hedged Items | | This standard clarifies the effect of using options as hedging instruments and the circumstances in which inflation risks can be hedged. The above amendments are not expected to have a material impact as the Company or Group does not have hedges involving these types of items. | | 1 October 2009 |
| AASB 1039 Concise Financial Reports | | AASB 1039 has been revised to achieve consistency with the terminology and descriptions of financial statements used in AASB 101 Presentation of Financial Statements (effective for the Group on 1 October 2009) and to achieve consistency with the disclosure requirements for segments in AASB 8 Operating Segments (effective for the Group on 1 October 2009). The above amendments are not expected to have a material impact as the Group no longer issues a concise financial report. | | 1 October 2009 |
| Interpretation 17 Distribution of Non-cash Assets to Owners | | AASB Interpretation 17 applies to situations where an entity pays dividends by distributing non-cash assets to its shareholders. These distributions will need to be measured at fair value and the entity will need to recognise the difference between the fair value and the carrying amount of the distributed assets in the income statement on distribution. The interpretation further clarifies when a liability for the dividend must be recognised and that it is also measured at fair value. | | 1 October 2010 |
| | No material impact on the Company or Group is expected. | | |
AASB 2008-13 Amendments to Australian Accounting Standards arising from Interpretation 17 Distributions of Non-cash Assets to owners | | This standard makes consequential amendments resulting from the issuance of Interpretation 17. No material impact on the Company or Group is expected. | | 1 October 2010 |
| AASB 2009-2 Amendments to Australian Accounting Standards – Improving Disclosures about Financial Instruments | | This standard improves the disclosures about financial instruments. No material impact on the Company or Group is expected as the amendments relate to disclosure matters. | | 1 October 2009 |
86ANZ Annual Report 2009
NOTES TO THE FINANCIAL STATEMENTS
1: Significant Accounting Policies(continued)
iii) Accounting Standards and Interpretations not early adopted(continued)
| | | | |
AASB amendment/ standard/ interpretation | | Possible impact on the Company and the Group’s financial report in period of initial adoption | | Application date
for the Group |
AASB 2009-3 Amendments to Australian Accounting Standards – Embedded Derivatives | | This standard clarifies the treatment of certain embedded derivatives. No material impact on the Company or Group is expected. | | 1 October 2009 |
AASB 2009-4 Amendments to Australian Accounting Standards arising from the Annual Improvements Project | | This standard makes editorial amendments to standards from the Annual Improvements Project. No material impact on the Company or Group is expected as the amendments are of a technical nature. | | 1 October 2010 |
AASB 2009-5 Further Amendments to Australian Accounting Standards arising from the Annual Improvements Project | | This standard makes editorial amendments to standards from the Annual Improvements Project. No material impact on the Company or Group is expected as the amendments are of a technical nature. | | 1 October 2010 |
AASB 2009-6 Amendments to Australian Accounting Standards | | This standard makes editorial amendments to standards and interpretations as a result of the issuance of revised AASB 101 Presentation of Financial Statements. No material impact on the Company or Group is expected as the amendments are of a technical nature. | | 1 October 2009 |
AASB 2009-7 Amendments to Australian Accounting Standards | | This standard makes editorial amendments to standards and an interpretation. No material impact on the Company or Group is expected as the amendments are of a technical nature. | | 1 October 2009 |
| AASB 2009-8 Amendments to Australian Accounting Standards – Group Cash-settled Share-based Payment Transactions | | This standard clarifies the treatment of group cash-settled share-based payment transactions. No material impact is expected as the Company and Group does not have cash-settled share-based payment transactions. | | 1 October 2010 |
Financial Report 87
NOTES TO THE FINANCIAL STATEMENTS
2: Critical Estimates and Judgements Used in Applying Accounting Policies
The Group prepares its consolidated financial statements in accordance with policies which are based on Australian Accounting Standards (AAS), other authoritative accounting pronouncements of the Australian Accounting Standards Board (AASB), AASB Interpretations and the Corporations Act 2001. This involves the Group making estimates and assumptions that affect the reported amounts within the financial statements. Estimates and judgements are continually evaluated and are based on historical factors, including expectations of future events that are believed to be reasonable under the circumstances. All material changes to accounting policies and estimates and the application of these policies and judgements are approved by the Audit Committee of the Board.
A brief explanation of critical estimates and judgements, and their impact on the Group, follows:
Critical Accounting Estimates and Assumptions
Provisions for credit impairment
The accounting policy, as explained in note 1(E)(iv), relating to measuring the impairment of loans and advances, requires the Group to assess impairment at least at each reporting date. The credit provisions raised (individual and collective) represent management’s best estimate of the losses incurred in the loan portfolio at balance date based on experienced judgement.
The collective provision is estimated on the basis of historical loss experience for assets with credit characteristics similar to those in the collective pool. The historical loss experience is adjusted based on current observable data and events and an assessment of the impact of model risk. The provision also takes into account the impact of large concentrated losses within the portfolio and the economic cycle.
The use of such judgements and reasonable estimates is considered by management to be an essential part of the process and does not impact on reliability.
Individual provisioning is applied when the full collectibility of one of the Group’s loans is identified as being doubtful.
Individual and collective provisioning is calculated using discounted expected future cash flows. The methodology and assumptions used for estimating both the amount and timing of future cash flows are revised regularly to reduce any differences between loss estimates and actual loss experience.
Critical judgements in applying the entity’s accounting policies
i) Special purpose and off-balance sheet entities
The Group may invest in or establish special purpose entities (SPEs) to enable it to undertake specific types of transactions. The main types of these SPEs are securitisation vehicles, structured finance entities, and entities used to sell credit protection.
Where the Group has established SPEs which are controlled by the Group, these are consolidated in the Group’s financial statements.
The Group does not consolidate SPEs that it does not control in accordance with the Group’s policy outlined in note 1(A)(vii). As it can be complex to determine whether the Group has control of an SPE, the Group makes judgements about its exposure to the risks and rewards, as well as about its ability to make operational decisions for the SPE in question.
ii) Significant joint ventures
The Group adopts the equity accounting method for its 49% interest in the joint ventures:
| • | | ING Australia Limited (INGA); and |
| • | | ING (NZ) Holdings Limited (ING NZ). |
As at 30 September 2009, the carrying amount of the Group’s investment in INGA was $1,649 million (Sep 2008: $1,589 million) and in ING NZ was $204 million (Sep 2008: $178 million).
The carrying value of these investments is subject to an annual impairment test to ensure that their carrying value does not exceed recoverable amount at balance sheet date. Any excess of carrying value over recoverable amount is taken to the income statement as an impairment write-down.
The table below summarises the main types of SPEs with which the Group is involved, the reason for their establishment, and the control factors associated with ANZ’s interest in them. Although there may be some indicators of control, ANZ does not bear the majority of residual risks and rewards of the SPEs. Therefore they are not consolidated.
| | | | |
Type of SPE | | Reason for establishment | | Control factors |
| Securitisation vehicles | | Securitisation is a financing technique whereby assets are transferred to an SPE which funds the purchase by issuing securities. This enables ANZ (in the case where transferred assets originate within ANZ) or customers to increase diversity of funding sources. | | ANZ may manage these securitisation vehicles, service assets in the vehicle or provide liquidity or other support. ANZ retains the risks associated with the provision of these services. For any SPE which is not consolidated, credit and market risks associated with the underlying assets are not retained or assumed by ANZ except to the limited extent that ANZ provides arm’s length services and facilities. |
| | |
| Structured finance entities | | These entities are set up to assist with the structuring of client financing. The resulting lending arrangements are at arms length and ANZ typically has limited ongoing involvement with the entity. | | ANZ may manage these vehicles, hold minor amounts of capital, provide financing or derivatives. |
| | |
| Credit protection | | The special purpose entities in this category are created to allow ANZ to purchase credit protection. | | ANZ may manage these vehicles. |
Refer to additional information in relation to special purpose and off-balance sheet entities in section 4 of the Financial Information (unaudited), page 193.
88 ANZ Annual Report 2009
NOTES TO THE FINANCIAL STATEMENTS
2: Critical Estimates and Judgements Used in Applying Accounting Policies (continued)
A valuation of the Group’s investment in INGA and ING NZ, based on a value-in-use methodology, was performed as part of the planned acquisition of the remaining interest in these entities (refer note 50). The review concluded that the estimated recoverable amount of the investments based on a discounted cash flow approach (which may differ from a fair value assessment) exceeded their carrying amount and accordingly no write-down was required. Changes in the assumptions upon which these valuations were based, together with changes in future cash flows, could materially impact the valuation undertaken.
iii) Significant Associates
The carrying values of all significant investments in associates (as disclosed in note 39) are subject to an annual recoverable amount test. This assessment involves ensuring that the investment’s fair value less costs to sell or its value in use is greater than its carrying amount. Judgement is applied when determining the assumptions supporting these calculations. This exercise resulted in the recognition of an impairment charge of $25 million in relation to the Group’s investment in Saigon Securities Inc. (SSI).
As at 30 September 2009, the Group reviewed all investments in associates against the following impairment indicators:
| • | | actual financial performance against budgeted financial performance; |
| • | | any material unfavourable operational factors and regulatory factors; |
| • | | any material unfavourable economic outlook and market competitive factors; |
| • | | carrying value against market value (supported by third-party broker valuation); and |
| • | | carrying value against market capitalisation (for listed investments). |
Where appropriate, additional potential impairment indicators are reviewed which are more specific to the respective investment.
As at 30 September 2009 no impairment of associates was identified as a result of either the review of impairment indicators listed above or the recoverable amount test performed on longer term investments, beyond the impairment charge in relation to SSI.
iv) Available-for-sale financial assets
The accounting policy for impairment of available-for-sale financial assets, as explained in note 1(E)(iii), requires the Group to assess whether there is objective evidence of impairment. This requires judgement when considering whether such evidence exists and if so, in reliably determining the impact of such events on the estimated cash flows of the asset.
v) Financial Instruments at Fair Value
A significant portion of financial instruments are carried on the balance sheet at fair value.
The best evidence of fair value is a quoted price in an active market. Accordingly, wherever possible fair value is based on quoted market prices for the financial instrument. In the event that there is no active market for the instrument, fair values are based on present value estimates or other market accepted valuation techniques.
The majority of valuation techniques employ only observable market data, however, for certain financial instruments the fair value cannot be determined with reference to current market transactions or valuation techniques whose variables only include data from observable markets.
In respect of the valuation component where market observable data is not available, the fair value is determined using data derived and extrapolated from market data and tested against historic transactions and observed market trends. These valuations are based upon assumptions established by application of professional judgement to analyse the data available to support each assumption. Changing the assumptions changes the resulting estimate of fair value.
The valuation models incorporate the impact of factors that would influence the fair value determined by a market participant. Principal inputs used in the determination of fair value of financial instruments based on valuation techniques include data inputs such as statistical data on delinquency rates, foreclosure rates, actual losses, counterparty credit spreads, recovery rates, implied default probabilities, credit index tranche prices and correlation curves.
The majority of outstanding derivative positions are transacted over-the-counter and therefore need to be valued using valuation techniques. Included in the determination of the fair value of derivatives is a credit valuation adjustment to reflect the credit worthiness of the counterparty, representing the credit risk component of the overall fair value increment on a particular derivative asset. The total valuation adjustment is influenced by the mark-to-market of the derivative trades and by the movement in the current market cost of credit.
vi) Goodwill
The carrying value of goodwill is reviewed at each balance date and is written down, to the extent that it is no longer supported by probable future benefits.
Goodwill is allocated to cash-generating units (CGU) for the purpose of impairment testing, which is undertaken at the lowest level at which goodwill is monitored for internal management reporting purposes. The CGUs for the Group have been revised during the period to align with the Group’s new reportable segments. Refer note 36.
Impairment testing of purchased goodwill is performed annually, or more frequently when there is an indication that the goodwill may be impaired, by comparing the recoverable amount of the CGU with the current carrying amount of its net assets, including goodwill. Where the current carrying value is greater than recoverable amount, a charge for impairment of goodwill will be recorded in the income statement.
As at 30 September 2009, the balance of goodwill recorded as an asset in ANZ National Bank Limited was $2,657 million (30 September 2008: $2,713 million). This represents the most significant component of the Group’s goodwill balance and is allocated to the New Zealand region CGU in line with the Group’s new reportable segments.
In determining the recoverable amount of the CGU for testing of the goodwill in ANZ National Bank Limited, an independent valuation was obtained during the year based on a discounted cash flow approach. Changes in assumptions upon which the valuation is based together with changes in future cash flows could materially impact the valuation obtained. The results of the independent valuation showed a value-in-use in excess of the carrying amount of the CGU (including goodwill).
At 30 September 2009 impairment testing by management review was conducted for all material goodwill balances. This assessment involves applying judgement and reviews against the following indicators:
| • | | Operational and Regulatory factors |
| • | | Economic and industry factors |
The assessment did not reveal any impairment indicators and accordingly no write-down was required.
Financial Report89
NOTES TO THE FINANCIAL STATEMENTS
3: Income
| | | | | | | | | | | | | | | | |
| | | Consolidated | | | The Company | |
| | | 2009
$m | | | 2008
$m | | | 2009
$m | | | 2008
$m | |
Interest Income | | | | | | | | | | | | | | | | |
Other financial institutions | | | 313 | | | | 535 | | | | 254 | | | | 435 | |
Trading securities | | | 989 | | | | 1,125 | | | | 832 | | | | 940 | |
Available-for-sale assets | | | 678 | | | | 1,008 | | | | 556 | | | | 863 | |
Loans and advances | | | 22,545 | | | | 27,417 | | | | 15,835 | | | | 18,269 | |
Acceptances | | | 927 | | | | 1,370 | | | | 927 | | | | 1,370 | |
Other | | | 754 | | | | 1,149 | | | | 475 | | | | 709 | |
| | | | | | | | | | | | | | | | |
| | | 26,206 | | | | 32,604 | | | | 18,879 | | | | 22,586 | |
Controlled entities | | | — | | | | — | | | | 1,787 | | | | 1,048 | |
| | | | | | | | | | | | | | | | |
Total interest income | | | 26,206 | | | | 32,604 | | | | 20,666 | | | | 23,634 | |
| | | | | | | | | | | | | | | | |
Interest income is analysed by types of financial assets as follows | | | | | | | | | | | | | | | | |
Financial assets not at fair value through profit or loss | | | 25,193 | | | | 31,446 | | | | 19,819 | | | | 22,668 | |
Trading securities | | | 989 | | | | 1,125 | | | | 832 | | | | 940 | |
Financial assets designated at fair value through profit or loss | | | 24 | | | | 33 | | | | 15 | | | | 26 | |
| | | | | | | | | | | | | | | | |
| | | 26,206 | | | | 32,604 | | | | 20,666 | | | | 23,634 | |
| | | | | | | | | | | | | | | | |
Other operating income | | | | | | | | | | | | | | | | |
Lending fees1 | | | 764 | | | | 595 | | | | 598 | | | | 455 | |
Non-lending fees and commissions arising from financial assets and liabilities not at fair value through the profit and loss | | | 236 | | | | 166 | | | | 166 | | | | 153 | |
Fee income on trust and other fiduciary activities | | | 45 | | | | 47 | | | | — | | | | — | |
Other fees and commissions | | | 1,931 | | | | 2,104 | | | | 1,375 | | | | 1,472 | |
| | | | | | | | | | | | | | | | |
| | | 2,976 | | | | 2,912 | | | | 2,139 | | | | 2,080 | |
Controlled entities | | | — | | | | — | | | | 365 | | | | 248 | |
| | | | | | | | | | | | | | | | |
Total fee and commission income | | | 2,976 | | | | 2,912 | | | | 2,504 | | | | 2,328 | |
Fee and commission expense2 | | | (269 | ) | | | (256 | ) | | | (196 | ) | | | (186 | ) |
| | | | | | | | | | | | | | | | |
Net fee and commission income | | | 2,707 | | | | 2,656 | | | | 2,308 | | | | 2,142 | |
| | | | | | | | | | | | | | | | |
Other income | | | | | | | | | | | | | | | | |
Net foreign exchange earnings | | | 962 | | | | 708 | | | | 740 | | | | 340 | |
Net gains from trading securities and derivatives3 | | | 303 | | | | 310 | | | | 370 | | | | 104 | |
Credit risk on derivatives | | | (135 | ) | | | (687 | ) | | | (121 | ) | | | (684 | ) |
Movements on financial instruments measured at fair value through profit or loss4 | | | (358 | ) | | | 348 | | | | (328 | ) | | | 342 | |
Gain on Visa shares5 | | | — | | | | 281 | | | | — | | | | 281 | |
Profit on sale of premises6 | | | 15 | | | | 57 | | | | — | | | | 4 | |
Stadium Australia income | | | — | | | | 19 | | | | — | | | | — | |
Dividends received from controlled entities | | | — | | | | — | | | | 234 | | | | 1,805 | |
Brokerage income | | | 76 | | | | 78 | | | | �� | | | | — | |
ANZ Share of ING NZ frozen funds investor settlement | | | (173 | ) | | | — | | | | — | | | | — | |
Writedown of assets in non continuing business | | | (112 | ) | | | (32 | ) | | | (112 | ) | | | (32 | ) |
Writedown of investment in Saigon Securities Inc | | | (25 | ) | | | — | | | | (25 | ) | | | — | |
Mark to market (loss)/gain on Panin warrants | | | (14 | ) | | | 26 | | | | — | | | | — | |
Mark to market (loss)/gain on Saigon Securities Inc options | | | (1 | ) | | | 17 | | | | (1 | ) | | | 17 | |
Private equity and infrastructure earnings | | | (1 | ) | | | 49 | | | | (1 | ) | | | 49 | |
Other | | | 93 | | | | 118 | | | | 11 | | | | 69 | |
| | | | | | | | | | | | | | | | |
Total other income | | | 630 | | | | 1,292 | | | | 767 | | | | 2,295 | |
| | | | | | | | | | | | | | | | |
Total other operating income | | | 3,337 | | | | 3,948 | | | | 3,075 | | | | 4,437 | |
| | | | | | | | | | | | | | | | |
Share of joint venture profit from ING Australia and ING (NZ) | | | 83 | | | | 143 | | | | — | | | | — | |
Share of associates’ profit7 | | | 382 | | | | 218 | | | | — | | | | — | |
| | | | | | | | | | | | | | | | |
Total share of joint venture and associates profit | | | 465 | | | | 361 | | | | | | | | | |
| | | | | | | | | | | | | | | | |
Total income8 | | | 30,008 | | | | 36,913 | | | | 23,741 | | | | 28,071 | |
| | | | | | | | | | | | | | | | |
| 1 | Lending fees exclude fees treated as part of the effective yield calculation and included in interest income (refer note 1B(ii)). |
| 2 | Includes interchange fees paid. |
| 3 | Does not include interest income. |
| 4 | Includes fair value movements (excluding realised and accrued interest) on derivatives entered into to manage interest rate and foreign exchange risk on funding instruments, and not designated as accounting hedges, ineffective portions of cashflow hedges, and fair value movements in financial assets and liabilities designated at fair value. |
| | The net loss on financial assets and liabilities designated at fair value was $506 million (2008: $251 million gain) for the Group and $488 million (2008: $235 million gain) for the Company. |
| 5 | Comprises gain arising from the allocation of shares in Visa Inc. measured at fair value. In addition, the Group has recognised a $72 million gain through its associate, Cards NZ Limited, on that associate’s allocation of Visa Inc. shares (refer footnote 7 below). |
| 6 | Gross proceeds on sale of premises is $1 million (2008: $109 million). |
| 7 | September 2008 includes a $72 equity accounted gain arising from the allocation of shares in Visa Inc. through the Group’s associate, Cards NZ Limited, on Visa shares in New Zealand. |
| 8 | Total income includes external dividend income of $14 million (2008: $44 million) for the Group and $12 million (2008: $20 million) for the Company. |
90ANZ Annual Report 2009
NOTES TO THE FINANCIAL STATEMENTS
4: Expenses
| | | | | | | | | | | | | | | | |
| | | Consolidated | | | The Company | |
| | | 2009
$m | | | 2008
$m | | | 2009
$m | | | 2008
$m | |
Interest Expense | | | | | | | | | | | | | | | | |
Financial institutions | | | 431 | | | | 965 | | | | 306 | | | | 854 | |
Deposits | | | 9,821 | | | | 13,805 | | | | 7,328 | | | | 10,155 | |
Borrowing corporations’ debt | | | 472 | | | | 741 | | | | — | | | | — | |
Commercial paper | | | 730 | | | | 1,653 | | | | 336 | | | | 603 | |
Acceptances | | | 646 | | | | 1,183 | | | | 646 | | | | 1,183 | |
Loan capital, bonds and notes | | | 3,975 | | | | 6,000 | | | | 3,125 | | | | 4,469 | |
Other | | | 323 | | | | 407 | | | | 42 | | | | 302 | |
| | | | | | | | | | | | | | | | |
| | | 16,398 | | | | 24,754 | | | | 11,783 | | | | 17,566 | |
Controlled entities | | | — | | | | — | | | | 1,817 | | | | 672 | |
| | | | | | | | | | | | | | | | |
Total interest expense | | | 16,398 | | | | 24,754 | | | | 13,600 | | | | 18,238 | |
| | | | | | | | | | | | | | | | |
Interest expense is analysed by types of financial liabilities as follows: | | | | | | | | | | | | | | | | |
Financial liabilities not at fair value through profit or loss | | | 15,911 | | | | 23,626 | | | | 13,450 | | | | 17,929 | |
Financial liabilities designated at fair value through profit or loss | | | 487 | | | | 1,128 | | | | 150 | | | | 309 | |
| | | | | | | | | | | | | | | | |
| | | 16,398 | | | | 24,754 | | | | 13,600 | | | | 18,238 | |
| | | | | | | | | | | | | | | | |
Operating expenses | | | | | | | | | | | | | | | | |
i) Personnel | | | | | | | | | | | | | | | | |
Employee entitlements and taxes | | | 242 | | | | 256 | | | | 169 | | | | 177 | |
Salaries and wages | | | 2,238 | | | | 2,067 | | | | 1,622 | | | | 1,459 | |
Superannuation costs – defined benefits plan | | | 20 | | | | 5 | | | | 14 | | | | — | |
Superannuation costs – defined contribution plans | | | 238 | | | | 208 | | | | 196 | | | | 166 | |
Equity-settled share-based payments | | | 103 | | | | 84 | | | | 87 | | | | 72 | |
Temporary staff | | | 155 | | | | 148 | | | | 115 | | | | 112 | |
Other | | | 602 | | | | 493 | | | | 501 | | | | 382 | |
| | | | | | | | | | | | | | | | |
Total personnel expenses | | | 3,598 | | | | 3,261 | | | | 2,704 | | | | 2,368 | |
| | | | | | | | | | | | | | | | |
ii) Premises | | | | | | | | | | | | | | | | |
Amortisation of leasehold improvements | | | 38 | | | | 27 | | | | 27 | | | | 21 | |
Depreciation of buildings and integrals | | | 18 | | | | 22 | | | | 4 | | | | 4 | |
Rent | | | 335 | | | | 305 | | | | 236 | | | | 213 | |
Utilities and other outgoings | | | 134 | | | | 136 | | | | 92 | | | | 92 | |
Other | | | 34 | | | | 24 | | | | 34 | | | | 19 | |
| | | | | | | | | | | | | | | | |
Total premises expenses | | | 559 | | | | 514 | | | | 393 | | | | 349 | |
| | | | | | | | | | | | | | | | |
iii) Computer | | | | | | | | | | | | | | | | |
Computer contractors | | | 97 | | | | 76 | | | | 76 | | | | 64 | |
Data communication | | | 77 | | | | 69 | | | | 54 | | | | 46 | |
Depreciation and amortisation1 | | | 239 | | | | 208 | | | | 197 | | | | 175 | |
Rentals and repairs | | | 92 | | | | 81 | | | | 71 | | | | 58 | |
Software purchased | | | 181 | | | | 131 | | | | 148 | | | | 97 | |
Software written-off | | | 26 | | | | 2 | | | | 22 | | | | 2 | |
Other | | | 56 | | | | 42 | | | | 25 | | | | 15 | |
| | | | | | | | | | | | | | | | |
Total computer expenses | | | 768 | | | | 609 | | | | 593 | | | | 457 | |
| | | | | | | | | | | | | | | | |
iv) Other | | | | | | | | | | | | | | | | |
Advertising and public relations | | | 195 | | | | 182 | | | | 134 | | | | 125 | |
Amortisation of other intangible assets (refer note 19) | | | 7 | | | | 7 | | | | 3 | | | | 5 | |
Audit and other fees (refer note 5) | | | 14 | | | | 12 | | | | 9 | | | | 7 | |
Depreciation of furniture and equipment (refer note 21) | | | 72 | | | | 66 | | | | 58 | | | | 54 | |
Impairment of intangible – Origin Australia | | | — | | | | 34 | | | | — | | | | 34 | |
Freight and cartage | | | 64 | | | | 54 | | | | 50 | | | | 46 | |
Loss on sale and write-off of equipment | | | 16 | | | | 22 | | | | 10 | | | | 21 | |
Non-lending losses, fraud and forgeries | | | 74 | | | | 72 | | | | 55 | | | | 47 | |
Postage and stationery | | | 118 | | | | 122 | | | | 84 | | | | 84 | |
Professional fees | | | 197 | | | | 182 | | | | 171 | | | | 153 | |
Telephone | | | 63 | | | | 58 | | | | 34 | | | | 30 | |
Travel | | | 149 | | | | 169 | | | | 105 | | | | 118 | |
Other | | | 201 | | | | 151 | | | | 356 | | | | 254 | |
| | | | | | | | | | | | | | | | |
Total other expenses | | | 1,170 | | | | 1,131 | | | | 1,069 | | | | 978 | |
| | | | | | | | | | | | | | | | |
v) Restructuring | | | 130 | | | | 181 | | | | 109 | | | | 148 | |
| | | | | | | | | | | | | | | | |
Total operating expenses | | | 6,225 | | | | 5,696 | | | | 4,868 | | | | 4,300 | |
| | | | | | | | | | | | | | | | |
Total expenses | | | 22,623 | | | | 30,450 | | | | 18,468 | | | | 22,538 | |
| | | | | | | | | | | | | | | | |
| 1 | Comprises software amortisation of $155 million (2008: $127 million), refer note 19, and computer depreciation of $84 million (2008: $81 million), refer note 21. The Company comprises software amortisation of $140 million (2008: $115 million), refer note 21, and computer depreciation of $58 million (2008: $60 million), refer note 21. |
Financial Report 91
NOTES TO THE FINANCIAL STATEMENTS
5: Compensation of Auditors
| | | | | | | | | | | | | | | | |
| | | Consolidated | | | The Company | |
| | | 2009
$’000 | | | 2008
$’000 | | | 2009
$’000 | | | 2008
$’000 | |
KPMG Australia | | | | | | | | | | | | | | | | |
Audit or review of financial reports of the Company or Group entities2 | | | 6,004 | | | | 5,648 | | | | 5,127 | | | | 4,285 | |
Other audit-related services1,2 | | | 3,295 | | | | 2,415 | | | | 2,278 | | | | 1,637 | |
Other assurance services2,3 | | | 127 | | | | 198 | | | | 127 | | | | 198 | |
| | | | | | | | | | | | | | | | |
Total | | | 9,426 | | | | 8,261 | | | | 7,532 | | | | 6,120 | |
| | | | | | | | | | | | | | | | |
Overseas related practices of KPMG Australia | | | | | | | | | | | | | | | | |
Audit or review of financial reports of the Company or Group entities | | | 3,714 | | | | 3,131 | | | | 1,081 | | | | 752 | |
Other audit-related services1 | | | 1,074 | | | | 872 | | | | 459 | | | | 316 | |
Other assurance services3 | | | 41 | | | | 12 | | | | 41 | | | | — | |
| | | | | | | | | | | | | | | | |
| | | 4,829 | | | | 4,015 | | | | 1,581 | | | | 1,068 | |
| | | | | | | | | | | | | | | | |
Total compensation of auditors | | | 14,255 | | | | 12,276 | | | | 9,113 | | | | 7,188 | |
| | | | | | | | | | | | | | | | |
Group policy allows KPMG Australia or any of its related practices to provide assurance and other audit-related services that, while outside the scope of the statutory audit, are consistent with the role of auditor. These include regulatory and prudential reviews requested by the Company’s regulators such as the Australian Prudential Regulation Authority (APRA). KPMG Australia or any of its related practices may not provide services that are perceived to be in conflict with the role of auditor. These include consulting advice and subcontracting of operational activities normally undertaken by management, and engagements where the auditor may ultimately be required to express an opinion on its own work.
| 1 | Includes prudential supervision reviews for central banks and work required for local statutory purposes. |
| 2 | Goods and services tax inclusive. |
| 3 | Other assurance services comprises: |
| | | | | | | | |
Consolidated | | 2009
$’000 | | | 2008
$’000 | |
Market Risk benchmarking review | | | 75 | | | | — | |
Market Risk system capability review | | | 41 | | | | — | |
Training courses | | | 35 | | | | 70 | |
Accounting Advice | | | 17 | | | | — | |
ANZ Nominees confirmation procedures | | | — | | | | 28 | |
Due diligence agreed upon procedures | | | — | | | | 106 | |
Trustee certification | | | — | | | | 6 | |
Total | | | 168 | | | | 210 | |
92ANZ Annual Report 2009
NOTES TO THE FINANCIAL STATEMENTS
6: Current Income Tax Expense
| | | | | | | | | | | | | | | | |
| | | Consolidated | | | The Company | |
| | | 2009
$m | | | 2008
$m | | | 2009
$m | | | 2008
$m | |
(a) Income tax recognised in the Income Statement | | | | | | | | | | | | | | | | |
| | | | |
Tax expense/(income) comprises: | | | | | | | | | | | | | | | | |
| | | | |
Current tax expense/(income) | | | 1,175 | | | | 1,202 | | | | 643 | | | | 534 | |
Adjustments recognised in the current year in relation to the current tax of prior years | | | — | | | | 1 | | | | — | | | | — | |
Deferred tax expense/(income) relating to the origination and reversal of temporary differences | | | 260 | | | | (5 | ) | | | 266 | | | | 97 | |
Benefits arising from previously unrecognised tax losses, tax credits, or temporary differences of a prior period that is used to reduce: | | | | | | | | | | | | | | | | |
– current tax expense | | | — | | | | (10 | ) | | | — | | | | (7 | ) |
| | | | | | | | | | | | | | | | |
Total income tax expensed charged in the Income Statement | | | 1,435 | | | | 1,188 | | | | 909 | | | | 624 | |
| | | | | | | | | | | | | | | | |
Reconciliation of the prima facie income tax expense on pre-tax profit with the income tax expense charged in the Income statement | | | | | | | | | | | | | | | | |
| | | | |
Operating profit before income tax | | | 4,380 | | | | 4,515 | | | | 3,194 | | | | 3,960 | |
| | | | |
Prima facie income tax expense at 30% | | | 1,314 | | | | 1,355 | | | | 958 | | | | 1,188 | |
| | | | |
Change in income tax expense due to: | | | | | | | | | | | | | | | | |
| | | | |
Overseas tax rate differential | | | (16 | ) | | | 23 | | | | (8 | ) | | | (2 | ) |
Rebateable and non-assessable dividends | | | (8 | ) | | | (9 | ) | | | (72 | ) | | | (541 | ) |
Profit from associated and joint venture entities | | | (141 | ) | | | (112 | ) | | | — | | | | — | |
New Zealand Conduits | | | 196 | | | | — | | | | — | | | | — | |
Mark-to-market (gains)/losses on fair valued investments related to associated entities | | | 5 | | | | — | | | | — | | | | — | |
Impairment of investment in associate company | | | 7 | | | | — | | | | 7 | | | | — | |
Restatement of deferred tax balances for New Zealand tax rate change | | | — | | | | (1 | ) | | | — | | | | — | |
Structured transactions | | | 32 | | | | (90 | ) | | | 32 | | | | (90 | ) |
Foreign exchange translation of US hybrid loan capital | | | — | | | | — | | | | (37 | ) | | | 38 | |
Other | | | 46 | | | | 21 | | | | 29 | | | | 31 | |
| | | | | | | | | | | | | | | | |
| | | 1,435 | | | | 1,187 | | | | 909 | | | | 624 | |
| | | | | | | | | | | | | | | | |
Income tax (over) provided in previous years | | | — | | | | 1 | | | | — | | | | — | |
| | | | | | | | | | | | | | | | |
Total income tax expense charged in the Income Statement | | | 1,435 | | | | 1,188 | | | | 909 | | | | 624 | |
| | | | | | | | | | | | | | | | |
Effective Tax Rate | | | 32.8 | % | | | 26.3 | % | | | 28.5 | % | | | 15.8 | % |
| | | | | | | | | | | | | | | | |
Australia | | | 957 | | | | 751 | | | | 794 | | | | 552 | |
| | | | | | | | | | | | | | | | |
Overseas | | | 478 | | | | 437 | | | | 115 | | | | 72 | |
| | | | | | | | | | | | | | | | |
(b) Income tax recognised directly in equity | | | | | | | | | | | | | | | | |
The following income tax amounts were charged/(credited) directly to equity during the period | | | (60 | ) | | | (182 | ) | | | (70 | ) | | | (122 | ) |
| | | | | | | | | | | | | | | | |
Tax consolidation
The Company and all its wholly owned Australian resident entities are part of a tax-consolidated group under Australian taxation law. The Company is the head entity in the tax-consolidated group. Tax expense/income and deferred tax liabilities/assets arising from temporary differences of the members of the tax-consolidated group are recognised in the separate financial statements of the members of the tax-consolidated group on a ‘group allocation’ basis. Current tax liabilities and assets of the tax consolidated group are recognised by the Company (as head entity in the tax-consolidated group).
Due to the existence of a tax funding arrangement between the entities in the tax-consolidated group, amounts are recognised as payable to or receivable by the Company and each member of the group in relation to the tax contribution amounts paid or payable between the Company and the other members of the tax-consolidated group in accordance with the arrangement.
Members of the tax-consolidated group have also entered into a tax sharing agreement that provides for the allocation of income tax liabilities between the entities should the head entity default on its income tax payment obligations.
Financial Report 93
NOTES TO THE FINANCIAL STATEMENTS
7: Dividends
| | | | | | | | | | | | | | | | |
| | | Consolidated | | | The Company | |
| | | 2009
$m | | | 2008
$m | | | 2009
$m | | | 2008
$m | |
Ordinary dividends1 | | | | | | | | | | | | | | | | |
Interim dividend | | | 993 | | | | 1,192 | | | | 993 | | | | 1,192 | |
Final dividend | | | 1,514 | | | | 1,381 | | | | 1,514 | | | | 1,381 | |
Bonus option plan adjustment | | | (55 | ) | | | (67 | ) | | | (55 | ) | | | (67 | ) |
| | | | | | | | | | | | | | | | |
Dividend on ordinary shares | | | 2,452 | | | | 2,506 | | | | 2,452 | | | | 2,506 | |
| | | | | | | | | | | | | | | | |
| 1 | Dividends are not accrued and are recorded when paid. |
A final dividend of 56 cents, fully franked, is proposed to be paid on 18 December 2009 on each eligible fully paid ordinary share (2008: final dividend of 74 cents, paid 18 December 2008, fully franked). The 2009 interim dividend of 46 cents, paid 1 July 2009, was fully franked (2008: interim dividend of 62 cents, paid 1 July 2008, fully franked).
The tax rate applicable to the franking credits attached to the 2009 interim dividend and to be attached to the proposed 2009 final dividend is 30% (2008: 30%).
Dividends paid in cash or satisfied by the issue of shares under the dividend reinvestment plan during the years ended 30 September 2009 and 2008 were as follows:
| | | | | | | | | | | | | | | | |
| | | Consolidated | | | The Company | |
| | | 2009
$m | | | 2008
$m | | | 2009
$m | | | 2008
$m | |
Paid in cash1 | | | 664 | | | | — | | | | 664 | | | | — | |
Satisfied by share issue2 | | | 1,788 | | | | 2,506 | | | | 1,788 | | | | 2,506 | |
| | | | | | | | | | | | | | | | |
| | | 2,452 | | | | 2,506 | | | | 2,452 | | | | 2,506 | |
| | | | | | | | | | | | | | | | |
| | | | | | | | | | | | | | | | |
| | | Consolidated | | | The Company | |
| | | 2009
$m | | | 2008
$m | | | 2009
$m | | | 2008
$m | |
Preference share dividend | | | | | | | | | | | | | | | | |
Euro trust securities | | | 33 | | | | 46 | | | | — | | | | — | |
| | | | | | | | | | | | | | | | |
Dividend on preference shares | | | 33 | | | | 46 | | | | — | | | | — | |
| | | | | | | | | | | | | | | | |
| 1 | During the year ended 30 September 2009, cash of $664 million was paid to shareholders who did not elect to participate in the dividend reinvestment plan or the bonus option plan. Cash of $1,046 million was received from the issue of shares pursuant to dividend reinvestment plan underwriting agreement for the 2008 Final dividend. During the year ended 30 September 2008, cash of $1,487 million was paid to shareholders who did not elect to participate in the dividend reinvestment plan or the bonus option plan. Cash of the same amount was received from the issue of shares pursuant to the dividend reinvestment plan underwriting agreements. There was no net cashflow to ANZ during the year ended 30 September 2008. |
| 2 | Includes shares issued to participating shareholders under the dividend reinvestment plan and shares issued in accordance with dividend reinvestment plan underwriting agreements. |
Euro Trust Securities
On 13 December 2004, the Group issued 500,000 Euro Floating Rate Non-cumulative Trust Securities (“Euro Trust Securities”) at 1,000 each into the European market, raising 500 million ($871 million at the spot rate at the date of issue, net of issue costs). The Euro Trust Securities comprise 2 fully paid securities – an interest paying unsecured note issued by a United Kingdom subsidiary (ANZ Jackson Funding PLC) and a fully paid 1,000 preference share issued by the Company, which are stapled together and issued as a Euro Trust Security by ANZ Capital Trust III.
Distributions on Euro Trust Securities are non-cumulative and are payable quarterly in arrears (on 15 March, 15 June, 15 September, 15 December of each year) based upon a floating distribution rate equal to the 3 month EURIBOR rate plus a 66 basis point margin. At each payment date the 3 month EURIBOR rate is reset for the next quarter. Dividends are not payable on a preference share while it is stapled to a note. If distributions are not paid on Euro Trust Securities, the Company may not pay dividends or return capital on its ordinary shares or any other share capital or security ranking equal to or below the preference share component. (Refer to note 28 for further details.)
Dividend Franking Account
The amount of franking credits available to the Company for the subsequent financial year is $49 million (2008: $35 million) after adjusting for franking credits that will arise from the payment of tax on Australian profits for the 2009 financial year, $602 million of franking credits which will be utilised in franking the proposed 2009 final dividend and franking credits that may not be accessible by the Company at present.
Restrictions which Limit the Payment of Dividends
There are presently no significant restrictions on the payment of dividends from controlled entities to the Company. Various capital adequacy, liquidity, statutory reserve and other prudential and legal requirements must be observed by certain controlled entities and the impact on these requirements caused by the payment of cash dividends is monitored.
There are presently no restrictions on payment of dividends by the Company. Reductions of shareholders’ equity through the payment of cash dividends is monitored having regard to the regulatory and other legal requirements to maintain a specified capital adequacy ratio.
94ANZ Annual Report 2009
NOTES TO THE FINANCIAL STATEMENTS
7: Dividends (continued)
In particular, the Australian Prudential Regulation Authority (APRA) has advised that a bank under its supervision must consult with it before declaring a coupon payment or dividend on a Tier 1 instrument, if the bank proposes to pay coupon or dividends on Tier 1 instruments which exceed the level of current year profits.
If any dividend, interest or redemption payments or other distributions are not paid on the scheduled payment date, or shares or other qualifying Tier 1 securities are not issued on the applicable conversion or redemption dates, on the Group’s Euro Trust Securities, US Trust Securities, UK Stapled Securities or ANZ Convertible Preference Shares in accordance with their terms, the Group may be restricted from declaring or paying any dividends or other distributions on ANZ ordinary shares and the Euro Trust Securities for up to 12 months from the date of non-payment or failure to issue. This restriction is subject to a number of exceptions.
Dividend Reinvestment Plan
During the year, 33,032,100 ordinary shares were issued at $13.58 per share and 19,354,790 ordinary shares at $15.16 per share to participating shareholders under the dividend reinvestment plan (2008: 20,500,208 ordinary shares at $27.33 per share, and 22,046,238 ordinary shares at $20.82 per share). All eligible shareholders can elect to participate in the dividend reinvestment plan. In addition, 75,000,000 ordinary shares were issued at $13.95 per share to a nominee of UBS AG, Australia Branch (2008: 28,270,906 ordinary shares at $27.71 per share, and 33,263,186 ordinary shares at $21.14 per share were issued to UBS Nominees Pty Ltd and a nominee of JP Morgan Australia Limited respectively) in accordance with a dividend reinvestment plan underwriting agreement.
8: Earnings per Ordinary Share
A discount of 1.5% will be applied when calculating the “Acquisition Price” used in determining the number of ordinary shares to be provided under the dividend reinvestment plan and bonus option plan terms and conditions. This discount will apply in respect of the 2009 final dividend and will continue to apply to future dividends until such time as the Company announces otherwise.
For the 2009 final dividend, the “Pricing Period” under the dividend reinvestment plan and bonus option plan terms and conditions will be the seven trading days commencing on and including 13 November 2009.
Bonus Option Plan
The amount of dividends paid during the year has been reduced as a result of certain eligible shareholders participating in the bonus option plan and foregoing all or part of their right to dividends. These shareholders were issued bonus shares.
During the year, 3,928,449 ordinary shares were issued under the bonus option plan (2008: 2,838,335 ordinary shares). For the 2009 final dividend, details of the discount that will be applied when calculating the “Acquisition Price”, and of the “Pricing Period”, in respect of the bonus option plan are set out above in respect of the dividend reinvestment plan.
| | | | | | | | |
| | | Consolidated | |
| | | 2009
$m | | | 2008
$m | |
Basic Earnings per share (cents) | | | 131.0 | | | | 170.4 | |
Earnings reconciliation ($ millions) | | | | | | | | |
Profit for the year | | | 2,945 | | | | 3,327 | |
Less: profit attributable to minority interests | | | 2 | | | | 8 | |
Less: preference share dividend paid | | | 33 | | | | 46 | |
| | | | | | | | |
Earnings used in calculating basic earnings per share | | | 2,910 | | | | 3,273 | |
Weighted average number of ordinary shares (millions) | | | 2,221.6 | | | | 1,921.1 | |
Diluted earnings per share (cents) | | | 129.6 | | | | 162.2 | |
Earnings reconciliation ($ millions) | | | | | | | | |
Earnings used in calculating basic earnings per share | | | 2,910 | | | | 3,273 | |
Add: US Trust Securities interest expense | | | 54 | | | | 41 | |
Add: ANZ StEPS interest expense | | | — | | | | 55 | |
Add: UK Hybrid interest expense | | | — | | | | 63 | |
Add: Convertible Preference Shares interest expense | | | 52 | | | | — | |
Add: Convertible Perpetual Notes interest expense | | | 25 | | | | 1 | |
| | | | | | | | |
Earnings used in calculating diluted earnings per share | | | 3,041 | | | | 3,433 | |
Weighted average number of ordinary shares (millions) | | | | | | | | |
Used in calculating basic earnings per share | | | 2,221.6 | | | | 1,921.1 | |
Add: potential conversion of options to ordinary shares | | | 3.8 | | | | 6.7 | |
weighted average number of convertible US Trust Securities at current market prices | | | 51.3 | | | | 73.4 | |
weighted average number of convertible ANZ StEPS securities | | | — | | | | 57.9 | |
weighted average number of convertible UK Hybrid Securities | | | — | | | | 56.9 | |
weighted average number of Convertible Preference Shares | | | 45.5 | | | | 0.2 | |
weighted average number of Convertible Perpetual Notes | | | 24.7 | | | | 0.4 | |
| | | | | | | | |
Used in calculating diluted earnings per share | | | 2,346.9 | | | | 2,116.6 | |
| | | | | | | | |
The weighted average number of converted and lapsed options, weighted with reference to the date of conversion or lapse, and included in the calculation of diluted earnings per share is approximately 1 million (2008: approximately 1 million).
Financial Report 95
NOTES TO THE FINANCIAL STATEMENTS
9: Liquid Assets
| | | | | | | | | | | | | | | | |
| | | Consolidated | | | The Company | |
| | | 2009
$m | | | 2008
$m | | | 2009
$m | | | 2008
$m | |
Coins, notes and cash at bankers | | | 3,108 | | | | 4,849 | | | | 878 | | | | 1,260 | |
Money at call, bills receivable and remittances in transit | | | 10,133 | | | | 4,752 | | | | 9,492 | | | | 3,682 | |
Other banks’ certificates of deposit | | | 7,265 | | | | 9,740 | | | | 5,018 | | | | 7,450 | |
Securities purchased under agreements to resell in less than three months | | | 4,811 | | | | 5,689 | | | | 4,811 | | | | 5,689 | |
| | | | | | | | | | | | | | | | |
Total liquid assets | | | 25,317 | | | | 25,030 | | | | 20,199 | | | | 18,081 | |
| | | | | | | | | | | | | | | | |
Maturity analysis based on original term to maturity | | | | | | | | | | | | | | | | |
Less than three months | | | 18,393 | | | | 15,645 | | | | 15,228 | | | | 10,133 | |
More than three months | | | 6,924 | | | | 9,385 | | | | 4,971 | | | | 7,948 | |
| | | | | | | | | | | | | | | | |
Total liquid assets | | | 25,317 | | | | 25,030 | | | | 20,199 | | | | 18,081 | |
| | | | | | | | | | | | | | | | |
10: Due from Other Financial Institutions
| | | | | | | | | | | | | | | | |
| | | Consolidated | | | The Company | |
| | | 2009
$m | | | 2008
$m | | | 2009
$m | | | 2008
$m | |
Maturity analysis based on original term to maturity | | | | | | | | | | | | | | | | |
Less than three months | | | 4,412 | | | | 7,842 | | | | 2,823 | | | | 7,023 | |
More than three months | | | 573 | | | | 2,020 | | | | 413 | | | | 1,550 | |
| | | | | | | | | | | | | | | | |
Total due from other financial institutions | | | 4,985 | | | | 9,862 | | | | 3,236 | | | | 8,573 | |
| | | | | | | | | | | | | | | | |
11: Trading Securities
| | | | | | | | | | | | | | | | |
| | | Consolidated | | | The Company | |
| | | 2009
$m | | | 2008
$m | | | 2009
$m | | | 2008
$m | |
Listed | | | | | | | | | | | | | | | | |
Other securities and equity securities | | | 8 | | | | 10 | | | | 8 | | | | 10 | |
| | | | | | | | | | | | | | | | |
| | | 8 | | | | 10 | | | | 8 | | | | 10 | |
| | | | | | | | | | | | | | | | |
Unlisted | | | | | | | | | | | | | | | | |
Commonwealth securities | | | 2,657 | | | | 71 | | | | 2,657 | | | | 71 | |
Local, semi-government and other government securities | | | 6,412 | | | | 2,373 | | | | 5,273 | | | | 2,162 | |
ANZ accepted bills | | | 4,146 | | | | 3,736 | | | | 4,146 | | | | 3,736 | |
Other securities and equity securities | | | 17,768 | | | | 8,987 | | | | 15,326 | | | | 6,867 | |
| | | | | | | | | | | | | | | | |
| | | 30,983 | | | | 15,167 | | | | 27,402 | | | | 12,836 | |
| | | | | | | | | | | | | | | | |
Total trading securities | | | 30,991 | | | | 15,177 | | | | 27,410 | | | | 12,846 | |
| | | | | | | | | | | | | | | | |
96ANZ Annual Report 2009
NOTES TO THE FINANCIAL STATEMENTS
12: Derivative Financial Instruments
Derivative instruments are contracts whose value is derived from one or more underlying variables or indices, require little or no initial net investment and are settled at a future date. Derivatives include contracts traded on registered exchanges and contracts agreed between counterparties, called “Over the Counter” or “OTCs”. The use of derivatives and their sale to customers as risk management products is an integral part of the Group’s trading activities. Derivatives are also used to manage the Group’s own exposure to fluctuations in exchange and interest rates as part of its asset and liability management activities (i.e. balance sheet risk management).
Derivatives are subject to the same types of credit and market risk as other financial instruments, and the Group manages these risks in a consistent manner.
Types of derivative instruments
The principal foreign exchange rate contracts used by the Group are forward foreign exchange contracts, currency swaps and currency options. Forward foreign exchange contracts are agreements to buy or sell a specified quantity of foreign currency on a specified future date at an agreed rate. A currency swap generally involves the exchange, or notional exchange, of equivalent amounts of two currencies and a commitment to exchange interest periodically until the principal amounts are re-exchanged on a future date. Currency options provide the buyer with the right, but not the obligation, either to purchase or sell a fixed amount of a currency at a specified rate on or before a future date. As compensation for assuming the option risk, the option writer generally receives a premium at the start of the option period.
The principal commodity contracts used by the Group are forward commodity contracts, commodity swaps and commodity options. Forward commodity contracts are agreements for the payment of the difference between a specified commodity price and a fixed rate on a notional volume of the commodity at a future date. A commodity swap generally involves the exchange of the return on the commodity for a fixed or floating interest payment without the exchange of the underlying commodity or principal amount. Commodity options provide the buyer with the right, but not the obligation, to exchange the difference between a specified commodity price and a fixed rate on a notional volume of the commodity at a future date. As compensation for assuming the option risk, the option writer generally receives a premium at the start of the option period. In certain circumstances the option premium is paid at the end of the option period.
The principal interest rate contracts used by the Group are forward rate agreements, interest rate futures, interest rate swaps and options. Forward rate agreements are contracts for the payment of the difference between a specified interest rate and a reference rate on a notional deposit at a future settlement date. There is no exchange of principal. An interest rate future is an exchange traded contract for the delivery of a standardised amount of a fixed income security or time deposit at a future date. Interest rate swap transactions generally involve the exchange of fixed and floating interest payment obligations without the exchange of the underlying principal amounts. Interest rate options provide the buyer with the right but not the obligation either to receive or pay interest at a specified rate on or before a future date. As compensation for assuming the option risk, the option writer generally receives a premium at the start of the option period.
The principal credit contracts used by the Group are default swaps. Default swaps are contracts that provide for a specified payment to be made to the purchaser of the swap following a defined credit event.
Derivatives, except for those that are specifically designated as effective hedging instruments, are classified as held for trading. The held for trading classification includes two categories of derivative instruments: those held as trading positions and those used for the Group’s balance sheet risk management.
Trading positions
Trading positions consist of both sales to customers and market making activities. Sales to customers include the structuring and marketing of derivative products to customers which enable them to take or mitigate risks. Market making activities consist of derivatives entered into principally for the purpose of generating profits from short-term fluctuations in price or margins. Positions may be traded actively or held over a period of time to benefit from expected changes in market rates.
Gains or losses, including any current period interest, from the change in fair value of trading positions are recognised in the income statement as ‘other income’ in the period in which they occur.
Balance sheet risk management
The Group designates balance sheet risk management derivatives into hedging relationships in order to minimise income statement volatility. This volatility is created by differences in the timing of recognition of gains and losses between the derivative and the hedged item. Hedge accounting is not applied to all balance sheet risk management positions.
Gains or losses from the change in fair value of balance sheet risk management derivatives that form part of an effective hedging relationship are recognised in the income statement based on the hedging relationship. Any ineffectiveness is recognised in the income statement as ‘other income’ in the period in which it occurs.
Gains or losses, excluding any current period interest, from the change in fair value of balance sheet risk management positions that are not designated into hedging relationships are recognised in the income statement as ‘other income’ in the period in which they occur. Current period interest is included in interest income and expense.
The tables on the following pages provide an overview of the Group’s and the Company’s foreign exchange rate, commodity, credit and interest rate derivatives. They include all trading and balance sheet risk management contracts. Notional principal amounts measure the amount of the underlying physical or financial commodity and represent the volume of outstanding transactions. They are not a measure of the risk associated with a derivative. The derivative instruments become favourable (assets) or unfavourable (liabilities) as a result of fluctuations in market rates relative to their terms. The aggregate contractual or notional amount of derivative financial instruments on hand, the extent to which instruments are favourable or unfavourable, and as a consequence the aggregate fair values of derivative financial assets and liabilities, can fluctuate significantly from time to time. The fair values of derivative instruments held and notional principal amounts are set out as follows.
Financial Report 97
NOTES TO THE FINANCIAL STATEMENTS
12: Derivative Financial Instruments (continued)
| | | | | | | | | | | | | | | | | | | | | | | | | | | | | | | | | | | | | | | | | | | | |
| | | | | | | | | Fair Value | | | | | | | |
| | | | | | Trading | | | Hedging | | | Total fair value
of derivatives | |
| | | Notional | | | | | | | | | | | | | | | | | | | | | Net investment | | | | | | | |
| | | Principal | | | | | | | | | Fair value | | | Cash flow | | | in foreign operations | | | | | | | |
| Consolidated at | | Amount | | | Assets | | | Liabilities | | | Assets | | | Liabilities | | | Assets | | | Liabilities | | | Assets | | | Liabilities | | | Assets | | | Liabilities | |
30 September 2009 | | $m | | | $m | | | $m | | | $m | | | $m | | | $m | | | $m | | | $m | | | $m | | | $m | | | $m | |
Foreign exchange contracts | | | | | | | | | | | | | | | | | | | | | | | | | | | | | | | | | | | | | | | | | | | | |
Spot and forward contracts | | | 204,830 | | | | 5,648 | | | | (6,795 | ) | | | — | | | | — | | | | — | | | | — | | | | 10 | | | | — | | | | 5,658 | | | | (6,795 | ) |
Swap agreements | | | 168,826 | | | | 10,084 | | | | (13,167 | ) | | | 233 | | | | (260 | ) | | | — | | | | — | | | | — | | | | — | | | | 10,317 | | | | (13,427 | ) |
Futures contracts | | | 281 | | | | 19 | | | | (28 | ) | | | — | | | | — | | | | — | | | | — | | | | — | | | | — | | | | 19 | | | | (28 | ) |
Options purchased | | | 7,067 | | | | 569 | | | | — | | | | — | | | | — | | | | — | | | | — | | | | — | | | | — | | | | 569 | | | | — | |
Options sold | | | 14,089 | | | | — | | | | (530 | ) | | | — | | | | — | | | | — | | | | — | | | | — | | | | — | | | | — | | | | (530 | ) |
| | | | | | | | | | | | | | | | | | | | | | | | | | | | | | | | | | | | | | | | | | | | |
| | | 395,093 | | | | 16,320 | | | | (20,520 | ) | | | 233 | | | | (260 | ) | | | — | | | | — | | | | 10 | | | | — | | | | 16,563 | | | | (20,780 | ) |
| | | | | | | | | | | | | | | | | | | | | | | | | | | | | | | | | | | | | | | | | | | | |
Commodity contracts | | | | | | | | | | | | | | | | | | | | | | | | | | | | | | | | | | | | | | | | | | | | |
Derivative contracts | | | 23,195 | | | | 1,196 | | | | (1,472 | ) | | | — | | | | — | | | | — | | | | — | | | | — | | | | — | | | | 1,196 | | | | (1,472 | ) |
| | | | | | | | | | | | | | | | | | | | | | | | | | | | | | | | | | | | | | | | | | | | |
Interest rate contracts | | | | | | | | | | | | | | | | | | | | | | | | | | | | | | | | | | | | | | | | | | | | |
Forward rate agreements | | | 75,358 | | | | 9 | | | | (20 | ) | | | — | | | | — | | | | 1 | | | | (1 | ) | | | — | | | | — | | | | 10 | | | | (21 | ) |
Swap agreements | | | 1,041,561 | | | | 17,447 | | | | (16,880 | ) | | | 1,272 | | | | (1,297 | ) | | | 193 | | | | (236 | ) | | | — | | | | — | | | | 18,912 | | | | (18,413 | ) |
Futures contracts | | | 105,435 | | | | 1,478 | | | | (1,322 | ) | | | — | | | | — | | | | 14 | | | | (16 | ) | | | — | | | | — | | | | 1,492 | | | | (1,338 | ) |
Options purchased | | | 12,468 | | | | 188 | | | | — | | | | — | | | | — | | | | — | | | | — | | | | — | | | | — | | | | 188 | | | | — | |
Options sold | | | 14,699 | | | | — | | | | (124 | ) | | | — | | | | — | | | | — | | | | — | | | | — | | | | — | | | | — | | | | (124 | ) |
| | | | | | | | | | | | | | | | | | | | | | | | | | | | | | | | | | | | | | | | | | | | |
| | | 1,249,521 | | | | 19,122 | | | | (18,346 | ) | | | 1,272 | | | | (1,297 | ) | | | 208 | | | | (253 | ) | | | — | | | | — | | | | 20,602 | | | | (19,896 | ) |
| | | | | | | | | | | | | | | | | | | | | | | | | | | | | | | | | | | | | | | | | | | | |
Credit Default Swaps | | | | | | | | | | | | | | | | | | | | | | | | | | | | | | | | | | | | | | | | | | | | |
Structured credit derivatives purchased | | | 11,303 | | | | 704 | | | | — | | | | — | | | | — | | | | — | | | | — | | | | — | | | | — | | | | 704 | | | | — | |
Other credit derivatives purchased | | | 13,071 | | | | 271 | | | | (14 | ) | | | — | | | | — | | | | — | | | | — | | | | — | | | | — | | | | 271 | | | | (14 | ) |
| | | | | | | | | | | | | | | | | | | | | | | | | | | | | | | | | | | | | | | | | | | | |
Total credit derivatives purchased | | | 24,374 | | | | 975 | | | | (14 | ) | | | — | | | | — | | | | — | | | | — | | | | — | | | | — | | | | 975 | | | | (14 | ) |
| | | | | | | | | | | | | | | | | | | | | | | | | | | | | | | | | | | | | | | | | | | | |
Structured credit derivatives sold | | | 12,454 | | | | — | | | | (1,019 | ) | | | — | | | | — | | | | — | | | | — | | | | — | | | | — | | | | — | | | | (1,019 | ) |
Other credit derivatives sold | | | 9,804 | | | | 146 | | | | (419 | ) | | | — | | | | — | | | | — | | | | — | | | | — | | | | — | | | | 146 | | | | (419 | ) |
| | | | | | | | | | | | | | | | | | | | | | | | | | | | | | | | | | | | | | | | | | | | |
Total credit derivatives sold | | | 22,258 | | | | 146 | | | | (1,438 | ) | | | — | | | | — | | | | — | | | | — | | | | — | | | | — | | | | 146 | | | | (1,438 | ) |
| | | | | | | | | | | | | | | | | | | | | | | | | | | | | | | | | | | | | | | | | | | | |
| | | 46,632 | | | | 1,121 | | | | (1,452 | ) | | | — | | | | — | | | | — | | | | — | | | | — | | | | — | | | | 1,121 | | | | (1,452 | ) |
| | | | | | | | | | | | | | | | | | | | | | | | | | | | | | | | | | | | | | | | | | | | |
Collateral | | | — | | | | (2,078 | ) | | | 7,084 | | | | — | | | | — | | | | — | | | | — | | | | — | | | | — | | | | (2,078 | ) | | | 7,084 | |
| | | | | | | | | | | | | | | | | | | | | | | | | | | | | | | | | | | | | | | | | | | | |
Total | | | 1,714,441 | | | | 35,681 | | | | (34,706 | ) | | | 1,505 | | | | (1,557 | ) | | | 208 | | | | (253 | ) | | | 10 | | | | — | | | | 37,404 | | | | (36,516 | ) |
| | | | | | | | | | | | | | | | | | | | | | | | | | | | | | | | | | | | | | | | | | | | |
98ANZ Annual Report 2009
NOTES TO THE FINANCIAL STATEMENTS
12: Derivative Financial Instruments (continued)
| | | | | | | | | | | | | | | | | | | | | | | | | | | | | | | | | | | | | | | | | | | | |
| | | | | | | | | | | | Fair Value | | | | | | | |
| | | | | | Trading | | | Hedging | | | Total fair value
of derivatives | |
| | | Notional | | | | | | | | | | | | | | | Net investment | | | | | | | |
| | | Principal | | | | | | | | | Fair value | | | Cash flow | | | in foreign operations | | | | | | | |
| Consolidated at | | Amount | | | Assets | | | Liabilities | | | Assets | | | Liabilities | | | Assets | | | Liabilities | | | Assets | | | Liabilities | | | Assets | | | Liabilities | |
30 September 2008 | | $m | | | $m | | | $m | | | $m | | | $m | | | $m | | | $m | | | $m | | | $m | | | $m | | | $m | |
Foreign exchange contracts | | | | | | | | | | | | | | | | | | | | | | | | | | | | | | | | | | | | | | | | | | | | |
Spot and forward contracts | | | 222,003 | | | | 7,698 | | | | (7,956 | ) | | | — | | | | — | | | | — | | | | — | | | | 42 | | | | — | | | | 7,740 | | | | (7,956 | ) |
Swap agreements | | | 205,894 | | | | 15,940 | | | | (8,328 | ) | | | 727 | | | | (307 | ) | | | — | | | | — | | | | — | | | | — | | | | 16,667 | | | | (8,635 | ) |
Futures contracts | | | 134 | | | | 72 | | | | (17 | ) | | | — | | | | — | | | | — | | | | — | | | | — | | | | — | | | | 72 | | | | (17 | ) |
Options purchased | | | 8,929 | | | | 899 | | | | — | | | | — | | | | — | | | | — | | | | — | | | | — | | | | — | | | | 899 | | | | — | |
Options sold | | | 17,761 | | | | — | | | | (942 | ) | | | — | | | | — | | | | — | | | | — | | | | — | | | | — | | | | — | | | | (942 | ) |
| | | | | | | | | | | | | | | | | | | | | | | | | | | | | | | | | | | | | | | | | | | | |
| | | 454,721 | | | | 24,609 | | | | (17,243 | ) | | | 727 | | | | (307 | ) | | | — | | | | — | | | | 42 | | | | — | | | | 25,378 | | | | (17,550 | ) |
| | | | | | | | | | | | | | | | | | | | | | | | | | | | | | | | | | | | | | | | | | | | |
Commodity contracts | | | | | | | | | | | | | | | | | | | | | | | | | | | | | | | | | | | | | | | | | | | | |
Derivative contracts | | | 27,349 | | | | 1,609 | | | | (1,692 | ) | | | — | | | | — | | | | — | | | | — | | | | — | | | | — | | | | 1,609 | | | | (1,692 | ) |
| | | | | | | | | | | | | | | | | | | | | | | | | | | | | | | | | | | | | | | | | | | | |
Interest rate contracts | | | | | | | | | | | | | | | | | | | | | | | | | | | | | | | | | | | | | | | | | | | | |
Forward rate agreements | | | 150,302 | | | | 31 | | | | (32 | ) | | | — | | | | — | | | | 2 | | | | — | | | | — | | | | — | | | | 33 | | | | (32 | ) |
Swap agreements | | | 1,087,769 | | | | 9,990 | | | | (10,253 | ) | | | 524 | | | | (812 | ) | | | 323 | | | | (343 | ) | | | — | | | | — | | | | 10,837 | | | | (11,408 | ) |
Futures contracts | | | 92,841 | | | | 1,712 | | | | (1,658 | ) | | | — | | | | — | | | | 86 | | | | (47 | ) | | | — | | | | — | | | | 1,798 | | | | (1,705 | ) |
Options purchased | | | 23,156 | | | | 225 | | | | — | | | | — | | | | — | | | | — | | | | — | | | | — | | | | — | | | | 225 | | | | — | |
Options sold | | | 22,743 | | | | — | | | | (115 | ) | | | — | | | | — | | | | — | | | | — | | | | — | | | | — | | | | — | | | | (115 | ) |
| | | | | | | | | | | | | | | | | | | | | | | | | | | | | | | | | | | | | | | | | | | | |
| | | 1,376,811 | | | | 11,958 | | | | (12,058 | ) | | | 524 | | | | (812 | ) | | | 411 | | | | (390 | ) | | | — | | | | — | | | | 12,893 | | | | (13,260 | ) |
| | | | | | | | | | | | | | | | | | | | | | | | | | | | | | | | | | | | | | | | | | | | |
Credit Default Swaps | | | | | | | | | | | | | | | | | | | | | | | | | | | | | | | | | | | | | | | | | | | | |
Structured credit derivatives purchased | | | 12,455 | | | | 1,212 | | | | — | | | | — | | | | — | | | | — | | | | — | | | | — | | | | — | | | | 1,212 | | | | — | |
Other credit derivatives purchased | | | 14,414 | | | | 201 | | | | (32 | ) | | | — | | | | — | | | | — | | | | — | | | | — | | | | — | | | | 201 | | | | (32 | ) |
| | | | | | | | | | | | | | | | | | | | | | | | | | | | | | | | | | | | | | | | | | | | |
Total credit derivatives purchased | | | 26,869 | | | | 1,413 | | | | (32 | ) | | | — | | | | — | | | | — | | | | — | | | | — | | | | — | | | | 1,413 | | | | (32 | ) |
| | | | | | | | | | | | | | | | | | | | | | | | | | | | | | | | | | | | | | | | | | | | |
Structured credit derivatives sold | | | 14,060 | | | | — | | | | (1,704 | ) | | | — | | | | — | | | | — | | | | — | | | | — | | | | — | | | | — | | | | (1,704 | ) |
Other credit derivatives sold | | | 11,256 | | | | 48 | | | | (296 | ) | | | — | | | | — | | | | — | | | | — | | | | — | | | | — | | | | 48 | | | | (296 | ) |
| | | | | | | | | | | | | | | | | | | | | | | | | | | | | | | | | | | | | | | | | | | | |
Total credit derivatives sold | | | 25,316 | | | | 48 | | | | (2,000 | ) | | | — | | | | — | | | | — | | | | — | | | | — | | | | — | | | | 48 | | | | (2,000 | ) |
| | | | | | | | | | | | | | | | | | | | | | | | | | | | | | | | | | | | | | | | | | | | |
| | | 52,185 | | | | 1,461 | | | | (2,032 | ) | | | — | | | | — | | | | — | | | | — | | | | — | | | | — | | | | 1,461 | | | | (2,032 | ) |
| | | | | | | | | | | | | | | | | | | | | | | | | | | | | | | | | | | | | | | | | | | | |
Collateral | | | — | | | | (4,400 | ) | | | 2,607 | | | | — | | | | — | | | | — | | | | — | | | | — | | | | — | | | | (4,400 | ) | | | 2,607 | |
| | | | | | | | | | | | | | | | | | | | | | | | | | | | | | | | | | | | | | | | | | | | |
Total | | | 1,911,066 | | | | 35,237 | | | | (30,418 | ) | | | 1,251 | | | | (1,119 | ) | | | 411 | | | | (390 | ) | | | 42 | | | | — | | | | 36,941 | | | | (31,927 | ) |
| | | | | | | | | | | | | | | | | | | | | | | | | | | | | | | | | | | | | | | | | | | | |
Financial Report 99
NOTES TO THE FINANCIAL STATEMENTS
12: Derivative Financial Instruments (continued)
| | | | | | | | | | | | | | | | | | | | | | | | | | | | | | | | | | | | |
| | | | | | | | | | | | Fair Value | | | | |
| | | Notional | | | Trading | | | Hedging | | | Total fair value
of derivatives | |
| | | Principal | | | | | | | | | Fair value | | | Cash flow | | | | | | | |
| The Company at | | Amount | | | Assets | | | Liabilities | | | Assets | | | Liabilities | | | Assets | | | Liabilities | | | Assets | | | Liabilities | |
30 September 2009 | | $m | | | $m | | | $m | | | $m | | | $m | | | $m | | | $m | | | $m | | | $m | |
Foreign exchange contracts | | | | | | | | | | | | | | | | | | | | | | | | | | | | | | | | | | | | |
Spot and forward contracts | | | 186,901 | | | | 5,201 | | | | (5,670 | ) | | | — | | | | — | | | | — | | | | — | | | | 5,201 | | | | (5,670 | ) |
Swap agreements | | | 181,534 | | | | 10,900 | | | | (13,664 | ) | | | 233 | | | | (260 | ) | | | — | | | | — | | | | 11,133 | | | | (13,924 | ) |
Futures contracts | | | 281 | | | | 19 | | | | (28 | ) | | | — | | | | — | | | | — | | | | — | | | | 19 | | | | (28 | ) |
Options purchased | | | 6,941 | | | | 563 | | | | — | | | | — | | | | — | | | | — | | | | — | | | | 563 | | | | — | |
Options sold | | | 14,074 | | | | — | | | | (517 | ) | | | — | | | | — | | | | — | | | | — | | | | — | | | | (517 | ) |
| | | | | | | | | | | | | | | | | | | | | | | | | | | | | | | | | | | | |
| | | 389,731 | | | | 16,683 | | | | (19,879 | ) | | | 233 | | | | (260 | ) | | | — | | | | — | | | | 16,916 | | | | (20,139 | ) |
| | | | | | | | | | | | | | | | | | | | | | | | | | | | | | | | | | | | |
Commodity contracts | | | | | | | | | | | | | | | | | | | | | | | | | | | | | | | | | | | | |
Derivative contracts | | | 23,180 | | | | 1,196 | | | | (1,472 | ) | | | — | | | | — | | | | — | | | | — | | | | 1,196 | | | | (1,472 | ) |
| | | | | | | | | | | | | | | | | | | | | | | | | | | | | | | | | | | | |
Interest rate contracts | | | | | | | | | | | | | | | | | | | | | | | | | | | | | | | | | | | | |
Forward rate agreements | | | 52,290 | | | | 8 | | | | (18 | ) | | | — | | | | — | | | | 1 | | | | (1 | ) | | | 9 | | | | (19 | ) |
Swap agreements | | | 797,689 | | | | 12,979 | | | | (12,740 | ) | | | 1,043 | | | | (440 | ) | | | 79 | | | | (146 | ) | | | 14,101 | | | | (13,326 | ) |
Futures contracts | | | 88,494 | | | | 1,442 | | | | (1,320 | ) | | | — | | | | — | | | | 14 | | | | (16 | ) | | | 1,456 | | | | (1,336 | ) |
Options purchased | | | 12,305 | | | | 186 | | | | — | | | | — | | | | — | | | | — | | | | — | | | | 186 | | | | — | |
Options sold | | | 14,326 | | | | — | | | | (121 | ) | | | — | | | | — | | | | — | | | | — | | | | — | | | | (121 | ) |
| | | | | | | | | | | | | | | | | | | | | | | | | | | | | | | | | | | | |
| | | 965,104 | | | | 14,615 | | | | (14,199 | ) | | | 1,043 | | | | (440 | ) | | | 94 | | | | (163 | ) | | | 15,752 | | | | (14,802 | ) |
| | | | | | | | | | | | | | | | | | | | | | | | | | | | | | | | | | | | |
Credit Default Swaps | | | | | | | | | | | | | | | | | | | | | | | | | | | | | | | | | | | | |
Structured credit derivatives purchased | | | 11,303 | | | | 704 | | | | — | | | | — | | | | — | | | | — | | | | — | | | | 704 | | | | — | |
Other credit derivatives purchased | | | 13,066 | | | | 271 | | | | (14 | ) | | | — | | | | — | | | | — | | | | — | | | | 271 | | | | (14 | ) |
| | | | | | | | | | | | | | | | | | | | | | | | | | | | | | | | | | | | |
Total credit derivatives purchased | | | 24,369 | | | | 975 | | | | (14 | ) | | | — | | | | — | | | | — | | | | — | | | | 975 | | | | (14 | ) |
| | | | | | | | | | | | | | | | | | | | | | | | | | | | | | | | | | | | |
Structured credit derivatives sold | | | 12,454 | | | | — | | | | (1,019 | ) | | | — | | | | — | | | | — | | | | — | | | | — | | | | (1,019 | ) |
Other credit derivatives sold | | | 9,804 | | | | 146 | | | | (419 | ) | | | — | | | | — | | | | — | | | | — | | | | 146 | | | | (419 | ) |
| | | | | | | | | | | | | | | | | | | | | | | | | | | | | | | | | | | | |
Total credit derivatives sold | | | 22,258 | | | | 146 | | | | (1,438 | ) | | | — | | | | — | | | | — | | | | — | | | | 146 | | | | (1,438 | ) |
| | | | | | | | | | | | | | | | | | | | | | | | | | | | | | | | | | | | |
| | | 46,627 | | | | 1,121 | | | | (1,452 | ) | | | — | | | | — | | | | — | | | | — | | | | 1,121 | | | | (1,452 | ) |
| | | | | | | | | | | | | | | | | | | | | | | | | | | | | | | | | | | | |
Collateral | | | — | | | | (1,984 | ) | | | 4,697 | | | | — | | | | — | | | | — | | | | — | | | | (1,984 | ) | | | 4,697 | |
| | | | | | | | | | | | | | | | | | | | | | | | | | | | | | | | | | | | |
Total | | | 1,424,642 | | | | 31,631 | | | | (32,305 | ) | | | 1,276 | | | | (700 | ) | | | 94 | | | | (163 | ) | | | 33,001 | | | | (33,168 | ) |
| | | | | | | | | | | | | | | | | | | | | | | | | | | | | | | | | | | | |
100ANZ Annual Report 2009
NOTES TO THE FINANCIAL STATEMENTS
12: Derivative Financial Instruments (continued)
| | | | | | | | | | | | | | | | | | | | | | | | | | | | | | | | | | | | |
| | | | | | | | | | | | Fair Value | | | | | | | |
| | | | | | | | | | | | | | | | | | | | | | | | Total fair value | |
| | | Notional | | | Trading | | | Hedging | | | of derivatives | |
| | | Principal | | | | | | | | | Fair value | | | Cash flow | | | | | | | |
| The Company at | | Amount | | | Assets | | | Liabilities | | | Assets | | | Liabilities | | | Assets | | | Liabilities | | | Assets | | | Liabilities | |
30 September 2008 | | $m | | | $m | | | $m | | | $m | | | $m | | | $m | | | $m | | | $m | | | $m | |
Foreign exchange contracts | | | | | | | | | | | | | | | | | | | | | | | | | | | | | | | | | | | | |
Spot and forward contracts | | | 199,708 | | | | 7,148 | | | | (7,759 | ) | | | — | | | | — | | | | — | | | | — | | | | 7,148 | | | | (7,759 | ) |
Swap agreements | | | 213,523 | | | | 14,973 | | | | (10,615 | ) | | | 523 | | | | (307 | ) | | | — | | | | — | | | | 15,496 | | | | (10,922 | ) |
Futures contracts | | | 134 | | | | 72 | | | | (17 | ) | | | — | | | | — | | | | — | | | | — | | | | 72 | | | | (17 | ) |
Options purchased | | | 8,726 | | | | 888 | | | | — | | | | — | | | | — | | | | — | | | | — | | | | 888 | | | | — | |
Options sold | | | 17,574 | | | | — | | | | (930 | ) | | | — | | | | — | | | | — | | | | — | | | | — | | | | (930 | ) |
| | | | | | | | | | | | | | | | | | | | | | | | | | | | | | | | | | | | |
| | | 439,665 | | | | 23,081 | | | | (19,321 | ) | | | 523 | | | | (307 | ) | | | — | | | | — | | | | 23,604 | | | | (19,628 | ) |
| | | | | | | | | | | | | | | | | | | | | | | | | | | | | | | | | | | | |
Commodity contracts | | | | | | | | | | | | | | | | | | | | | | | | | | | | | | | | | | | | |
Derivative contracts | | | 27,334 | | | | 1,610 | | | | (1,697 | ) | | | — | | | | — | | | | — | | | | — | | | | 1,610 | | | | (1,697 | ) |
| | | | | | | | | | | | | | | | | | | | | | | | | | | | | | | | | | | | |
Interest rate contracts | | | | | | | | | | | | | | | | | | | | | | | | | | | | | | | | | | | | |
Forward rate agreements | | | 57,827 | | | | 19 | | | | (25 | ) | | | — | | | | — | | | | 2 | | | | — | | | | 21 | | | | (25 | ) |
Swap agreements | | | 860,676 | | | | 7,913 | | | | (8,123 | ) | | | 457 | | | | (292 | ) | | | 188 | | | | (224 | ) | | | 8,558 | | | | (8,639 | ) |
Futures contracts | | | 75,807 | | | | 1,699 | | | | (1,653 | ) | | | — | | | | — | | | | 86 | | | | (47 | ) | | | 1,785 | | | | (1,700 | ) |
Options purchased | | | 22,922 | | | | 168 | | | | — | | | | — | | | | — | | | | — | | | | — | | | | 168 | | | | — | |
Options sold | | | 22,630 | | | | — | | | | (114 | ) | | | — | | | | — | | | | — | | | | — | | | | — | | | | (114 | ) |
| | | | | | | | | | | | | | | | | | | | | | | | | | | | | | | | | | | | |
| | | 1,039,862 | | | | 9,799 | | | | (9,915 | ) | | | 457 | | | | (292 | ) | | | 276 | | | | (271 | ) | | | 10,532 | | | | (10,478 | ) |
| | | | | | | | | | | | | | | | | | | | | | | | | | | | | | | | | | | | |
Credit Default Swaps | | | | | | | | | | | | | | | | | | | | | | | | | | | | | | | | | | | | |
Structured credit derivatives purchased | | | 12,455 | | | | 1,212 | | | | — | | | | — | | | | — | | | | — | | | | — | | | | 1,212 | | | | — | |
Other credit derivatives purchased | | | 14,408 | | | | 201 | | | | (32 | ) | | | — | | | | — | | | | — | | | | — | | | | 201 | | | | (32 | ) |
| | | | | | | | | | | | | | | | | | | | | | | | | | | | | | | | | | | | |
Total credit derivatives purchased | | | 26,863 | | | | 1,413 | | | | (32 | ) | | | — | | | | — | | | | — | | | | — | | | | 1,413 | | | | (32 | ) |
| | | | | | | | | | | | | | | | | | | | | | | | | | | | | | | | | | | | |
Structured credit derivatives sold | | | 14,060 | | | | — | | | | (1,704 | ) | | | — | | | | — | | | | — | | | | — | | | | — | | | | (1,704 | ) |
Other credit derivatives sold | | | 11,256 | | | | 48 | | | | (296 | ) | | | — | | | | — | | | | — | | | | — | | | | 48 | | | | (296 | ) |
| | | | | | | | | | | | | | | | | | | | | | | | | | | | | | | | | | | | |
Total credit derivatives sold | | | 25,316 | | | | 48 | | | | (2,000 | ) | | | — | | | | — | | | | — | | | | — | | | | 48 | | | | (2,000 | ) |
| | | | | | | | | | | | | | | | | | | | | | | | | | | | | | | | | | | | |
| | | 52,179 | | | | 1,461 | | | | (2,032 | ) | | | — | | | | — | | | | — | | | | — | | | | 1,461 | | | | (2,032 | ) |
| | | | | | | | | | | | | | | | | | | | | | | | | | | | | | | | | | | | |
Collateral | | | — | | | | (3,909 | ) | | | 2,380 | | | | — | | | | — | | | | — | | | | — | | | | (3,909 | ) | | | 2,380 | |
| | | | | | | | | | | | | | | | | | | | | | | | | | | | | | | | | | | | |
Total | | | 1,559,040 | | | | 32,042 | | | | (30,585 | ) | | | 980 | | | | (599 | ) | | | 276 | | | | (271 | ) | | | 33,298 | | | | (31,455 | ) |
| | | | | | | | | | | | | | | | | | | | | | | | | | | | | | | | | | | | |
Financial Report 101
NOTES TO THE FINANCIAL STATEMENTS
12: Derivative Financial Instruments (continued)
Hedging Relationships
There are three types of allowable hedging relationships: fair value hedges, cash flow hedges and hedges of a net investment in a foreign operation. Each type of hedging has specific requirements when accounting for the fair value changes in the hedging relationship. For details on the accounting treatment of each type of hedging relationship refer to note 1.
Fair value hedges
The risk being hedged in a fair value hedge is a change in the fair value of an asset or liability or unrecognised firm commitment that may affect the income statement. Changes in fair value might arise through changes in interest rates or foreign exchange rates. The Group’s fair value hedges principally consist of interest rate swaps that are used to protect against changes in the fair value of fixed-rate long-term financial instruments due to movements in market interest rates.
The application of fair value hedge accounting results in the fair value adjustment on the hedged item attributable to the hedged risk being recognised in the income statement at the same time the hedging instrument impacts the income statement. If a hedging relationship is terminated, the fair value adjustment to the hedged item continues to be recognised as part of the carrying amount of the item or group of items and is amortised to the income statement as a part of the effective yield over the period to maturity. Where the hedged item is derecognised from the Group’s balance sheet, the fair value adjustment is included in the income statement as ‘other income’ as a part of the gain or loss on disposal.
| | | | | | | | | | | | | | | | |
| | | Consolidated | | | The Company | |
| | | 2009
$m | | | 2008
$m | | | 2009
$m | | | 2008
$m | |
Gain/(loss) arising from fair value hedges | | | | | | | | | | | | | | | | |
Hedged item (attributable to the hedged risk only) | | | (467 | ) | | | (566 | ) | | | (773 | ) | | | (1,176 | ) |
Hedging instrument | | | 442 | | | | 587 | | | | 759 | | | | 1,132 | |
Cash flow hedges
The risk being hedged in a cash flow hedge is the potential volatility in future cash flows that may affect the income statement. Volatility in the future cash flows may result from changes in interest rates or changes in exchange rates arising from recognised financial assets and liabilities and highly probable forecast transactions. The Group’s cash flow hedges consist principally of interest rate swaps, forward rate agreements and foreign currency swaps that are used to protect against exposures to variability in future interest cash flows on non-trading assets and liabilities which bear interest at variable rates or which are expected to be refunded or reinvested in the future. The Group primarily applies cash flow hedge accounting to its variable rate loan assets, variable rate liabilities and short term re-issuances of fixed rate customer and wholesale deposit liabilities. The amounts and timing of future cash flows, representing both principal and interest flows, are projected for each portfolio of financial assets and liabilities on the basis of their forecast repricing profile. This forms the basis for identifying gains and losses on the effective portions of derivatives designated as cash flow hedges.
The effective portion of changes in the fair value of derivatives qualifying and designated as cash flow hedges is deferred to the hedging reserve which forms part of shareholders’ equity. Amounts deferred in equity are recognised in the income statement in the period during which the hedged forecast transactions take place and is fully amortised when the hedging relationship matures. The schedule below shows the movements in the hedging reserve:
| | | | | | | | | | | | | | | | |
| | | Consolidated | | | The Company | |
| | | 2009
$m | | | 2008
$m | | | 2009
$m | | | 2008
$m | |
Balance at start of year | | | 79 | | | | 153 | | | | 51 | | | | 80 | |
Items recorded in net interest income | | | (89 | ) | | | (53 | ) | | | (89 | ) | | | 7 | |
Tax effect of items recorded in the income statement | | | 26 | | | | 18 | | | | 26 | | | | (2 | ) |
Valuation gain taken to equity | | | (148 | ) | | | (56 | ) | | | (135 | ) | | | (49 | ) |
Tax effect of net gain on cash flow hedges | | | 42 | | | | 17 | | | | 38 | | | | 15 | |
| | | | | | | | | | | | | | | | |
Closing balance | | | (90 | ) | | | 79 | | | | (109 | ) | | | 51 | |
| | | | | | | | | | | | | | | | |
The table below shows the breakdown of the hedging reserve attributable to each type of cash flow hedging relationship:
| | | | | | | | | | | | | | | | |
| | | Consolidated | | | The Company | |
| | | 2009
$m | | | 2008
$m | | | 2009
$m | | | 2008
$m | |
Variable rate loan assets | | | 236 | | | | 289 | | | | 111 | | | | 221 | |
Variable rate liabilities | | | (140 | ) | | | (96 | ) | | | (112 | ) | | | (95 | ) |
Re-issuances of short term fixed rate liabilities | | | (186 | ) | | | (114 | ) | | | (108 | ) | | | (75 | ) |
| | | | | | | | | | | | | | | | |
Total hedging reserve | | | (90 | ) | | | 79 | | | | (109 | ) | | | 51 | |
| | | | | | | | | | | | | | | | |
102ANZ Annual Report 2009
NOTES TO THE FINANCIAL STATEMENTS
12: Derivative Financial Instruments (continued)
The mechanics of hedge accounting results in the gain (or loss) in the hedging reserve above being released into the income statement at the same time that the corresponding loss (or gain) attributable to the hedged item impacts the income statement. It will not necessarily be released to the income statement uniformly over the period of the hedging relationship as the fair value of the derivative is driven by changes in market rates over the term of the instrument. As market rates do not always move uniformly across all time periods, a change in market rates may drive more value in one forecast period than another, which impacts when the hedging reserve is released to the income statement.
All underlying hedged cash flows are expected to be recognised in the income statement in the period in which they occur which is anticipated to take place over the next 0 –10 years (2008: 0–10 years).
All gains and losses associated with the ineffective portion of the hedging derivatives are recognised immediately as ‘other income’ in the income statement. Ineffectiveness recognised in the income statement in respect of cash flow hedges amounted to a $53 million loss for the Group (2008: $12 million gain) and a $71 million loss for the Company (2008: $9 million gain).
Hedges of net investment in foreign operations
In a hedge of a net investment in a foreign operation, the risk being hedged is the exposure to exchange differences arising on consolidation of foreign operations with a functional currency other than the Australian Dollar. Hedging is undertaken using forward foreign exchange contracts or by financing with borrowings in the same currency as the foreign functional currency involved.
Ineffectiveness arising from hedges of net investments in foreign operations and recognised as ‘other income’ in the income statement amounted to $4 million gain (2008: $4 million loss).
13: Available-for-sale Assets
| | | | | | | | | | | | | | | | |
| | | Consolidated | | | The Company | |
| | | 2009
$m | | | 2008
$m | | | 2009
$m | | | 2008
$m | |
Listed | | | | | | | | | | | | | | | | |
Other government securities | | | 1,501 | | | | 165 | | | | 1,147 | | | | 165 | |
Other securities and equity investments | | | 1,578 | | | | 2,686 | | | | 1,334 | | | | 1,748 | |
| | | | | | | | | | | | | | | | |
Total Listed | | | 3,079 | | | | 2,851 | | | | 2,481 | | | | 1,913 | |
| | | | | | | | | | | | | | | | |
Unlisted | | | | | | | | | | | | | | | | |
Local and semi-government securities | | | 716 | | | | 2,602 | | | | 716 | | | | 2,602 | |
Other government securities | | | 2,943 | | | | 957 | | | | 1,079 | | | | 39 | |
Other securities and equity investments | | | 9,412 | | | | 10,352 | | | | 8,853 | | | | 9,831 | |
Loans and advances | | | 425 | | | | 718 | | | | 425 | | | | 718 | |
| | | | | | | | | | | | | | | | |
Total unlisted | | | 13,496 | | | | 14,629 | | | | 11,073 | | | | 13,190 | |
| | | | | | | | | | | | | | | | |
Total available-for-sale assets | | | 16,575 | | | | 17,480 | | | | 13,554 | | | | 15,103 | |
| | | | | | | | | | | | | | | | |
An impairment loss of $20 million was recognised in the Income Statement (2008: $98 million), refer note 16.
Available for sale by maturities at 30 September 2009
| | | | | | | | | | | | | | | | | | | | | | | | | | | | |
| | | Less than
3 months
$m | | | Between
3 months and
12 months
$m | | | Between
1 year and
5 years
$m | | | Between
5 year and
10 years
$m | | | After
10 years
$m | | | No
maturity
specified
$m | | | Total
fair
value
$m | |
Local and semi government securities | | | 602 | | | | 114 | | | | — | | | | — | | | | — | | | | — | | | | 716 | |
Other government securities | | | 2,482 | | | | 1,111 | | | | 851 | | | | — | | | | — | | | | — | | | | 4,444 | |
Other securities and equity investments | | | 4,775 | | | | 3,524 | | | | 2,018 | | | | 19 | | | | 156 | | | | 498 | | | | 10,990 | |
Loans and advances | | | 57 | | | | 84 | | | | — | | | | — | | | | 284 | | | | — | | | | 425 | |
| | | | | | | | | | | | | | | | | | | | | | | | | | | | |
Total available-for-sale assets | | | 7,916 | | | | 4,833 | | | | 2,869 | | | | 19 | | | | 440 | | | | 498 | | | | 16,575 | |
| | | | | | | | | | | | | | | | | | | | | | | | | | | | |
Available for sale by maturities at 30 September 2008
| | | | | | | | | | | | | | | | | | | | | | | | | | | | |
| | | Less than
3 months
$m | | | Between
3 months and
12 months
$m | | | Between
1 year and
5 years
$m | | | Between
5 year and
10 years
$m | | | After
10 years
$m | | | No
maturity
specified
$m | | | Total
fair
value
$m | |
Local and semi government securities | | | 2,431 | | | | 171 | | | | — | | | | — | | | | — | | | | — | | | | 2,602 | |
Other government securities | | | 1,086 | | | | 27 | | | | 9 | | | | — | | | | — | | | | — | | | | 1,122 | |
Other securities and equity investments | | | 5,689 | | | | 4,369 | | | | 1,886 | | | | 101 | | | | 524 | | | | 469 | | | | 13,038 | |
Loans and advances | | | 117 | | | | 517 | | | | 84 | | | | — | | | | — | | | | — | | | | 718 | |
| | | | | | | | | | | | | | | | | | | | | | | | | | | | |
Total available-for-sale assets | | | 9,323 | | | | 5,084 | | | | 1,979 | | | | 101 | | | | 524 | | | | 469 | | | | 17,480 | |
| | | | | | | | | | | | | | | | | | | | | | | | | | | | |
Financial Report103
NOTES TO THE FINANCIAL STATEMENTS
14: Net Loans and Advances
| | | | | | | | | | | | | | | | |
| | | Consolidated | | | The Company | |
| | | 2009
$m | | | 2008
$m | | | 2009
$m | | | 2008
$m | |
Overdrafts | | | 8,347 | | | | 8,282 | | | | 6,653 | | | | 6,384 | |
Credit card outstandings | | | 9,376 | | | | 8,892 | | | | 7,910 | | | | 7,421 | |
Term loans – housing | | | 188,090 | | | | 175,826 | | | | 149,761 | | | | 129,856 | |
Term loans – non-housing | | | 116,609 | | | | 130,595 | | | | 82,068 | | | | 90,459 | |
Hire purchase | | | 10,766 | | | | 11,174 | | | | 10,387 | | | | 1,262 | |
Lease receivables (refer below) | | | 2,367 | | | | 2,394 | | | | 1,700 | | | | 1,175 | |
Commercial bills | | | 136 | | | | 295 | | | | 136 | | | | 287 | |
Other | | | 2,654 | | | | 2,592 | | | | 2,290 | | | | 2,226 | |
| | | | | | | | | | | | | | | | |
Total gross loans and advances | | | 338,345 | | | | 340,050 | | | | 260,905 | | | | 239,070 | |
| | | | | | | | | | | | | | | | |
Less: Provision for credit impairment (refer note 16) | | | (4,526 | ) | | | (3,496 | ) | | | (3,300 | ) | | | (2,632 | ) |
Less: Unearned income | | | (2,372 | ) | | | (2,600 | ) | | | (2,102 | ) | | | (508 | ) |
Add: Capitalised brokerage/mortgage origination fees | | | 560 | | | | 600 | | | | 505 | | | | 194 | |
| | | | | | | | | | | | | | | | |
| | | (6,338 | ) | | | (5,496 | ) | | | (4,897 | ) | | | (2,946 | ) |
| | | | | | | | | | | | | | | | |
Net loans and advances1 | | | 332,007 | | | | 334,554 | | | | 256,008 | | | | 236,124 | |
| | | | | | | | | | | | | | | | |
Lease receivables | | | | | | | | | | | | | | | | |
a) Finance lease receivables | | | | | | | | | | | | | | | | |
Gross finance lease receivables | | | | | | | | | | | | | | | | |
Less than 1 year | | | 593 | | | | 563 | | | | 489 | | | | 179 | |
1 to 5 years | | | 965 | | | | 1,169 | | | | 613 | | | | 491 | |
Later than 5 years | | | 458 | | | | 309 | | | | 266 | | | | 238 | |
| | | | | | | | | | | | | | | | |
Less: unearned future finance income on finance leases | | | (262 | ) | | | (273 | ) | | | (225 | ) | | | (158 | ) |
| | | | | | | | | | | | | | | | |
Net investment in finance lease receivables | | | 1,754 | | | | 1,768 | | | | 1,143 | | | | 750 | |
| | | | | | | | | | | | | | | | |
b) Operating lease receivables | | | | | | | | | | | | | | | | |
Gross operating lease receivables | | | | | | | | | | | | | | | | |
Less than 1 year | | | 34 | | | | 58 | | | | 22 | | | | 28 | |
1 to 5 years | | | 207 | | | | 213 | | | | 200 | | | | 170 | |
Later than 5 years | | | 110 | | | | 82 | | | | 110 | | | | 69 | |
| | | | | | | | | | | | | | | | |
Total operating lease receivables | | | 351 | | | | 353 | | | | 332 | | | | 267 | |
| | | | | | | | | | | | | | | | |
Total lease receivables | | | 2,105 | | | | 2,121 | | | | 1,475 | | | | 1,017 | |
| | | | | | | | | | | | | | | | |
Present value of gross investment in finance lease receivables | | | | | | | | | | | | | | | | |
Less than 1 year | | | 512 | | | | 519 | | | | 412 | | | | 150 | |
1 to 5 years | | | 806 | | | | 1,009 | | | | 488 | | | | 468 | |
Later than 5 years | | | 215 | | | | 273 | | | | 158 | | | | 215 | |
| | | | | | | | | | | | | | | | |
| | | 1,533 | | | | 1,801 | | | | 1,058 | | | | 833 | |
| | | | | | | | | | | | | | | | |
Hire purchase receivables | | | | | | | | | | | | | | | | |
Less than 1 year | | | 3,674 | | | | 3,694 | | | | 3,506 | | | | 432 | |
1 to 5 years | | | 7,021 | | | | 7,406 | | | | 6,810 | | | | 814 | |
Later than 5 years | | | 71 | | | | 74 | | | | 71 | | | | 16 | |
| | | | | | | | | | | | | | | | |
| | | 10,766 | | | | 11,174 | | | | 10,387 | | | | 1,262 | |
| | | | | | | | | | | | | | | | |
| 1 | The company results in 2009 were impacted by the transfer of the assets and liabilities of Esanda Finance Corporation Limited (Esanda). |
As a consequence of the turmoil in global financial markets, significant difficulty arose in determining appropriate fair value estimates by reference to quoted market prices for certain financial instruments reported at fair value on the balance sheet, increasing the subjectivity inherent in valuations. This affected some mortgage backed securities held by the Group which were originally classified for financial reporting purposes as Available-for-sale. In November 2008, the Group reclassified these mortgage backed securities, issued in America, into loans and advances measured at amortised cost. The reclassification applied only to securities that were no longer traded in an active market. It is the Group’s intention to hold these assets for the foreseeable future in order to recover the initial investment through a stream of contractual repayments.
104ANZ Annual Report 2009
NOTES TO THE FINANCIAL STATEMENTS
14: Net Loans and Advances (continued)
Below is an analysis of the impact on the financial position of ANZ (Consolidated and the Company):
| | | | | | | | | | | | |
| | | Fair value
$m | | | Carrying
amount
$m | | | AFS
revaluation
reserve in
equity
$m | |
Values on reclassification date | | | 415 | | | | 415 | | | | 233 | |
Exchange rate fluctuations | | | n/a | | | | (89 | ) | | | (49 | ) |
Impairment loss recognised in the year | | | — | | | | — | | | | (20 | ) |
Principal repayments | | | (61 | ) | | | (61 | ) | | | — | |
Amortisation to face value1 | | | n/a | | | | 8 | | | | (7 | ) |
| | | | | | | | | | | | |
Changes in fair value including exchange rate fluctuations | | | (138 | ) | | | n/a | | | | n/a | |
| | | | | | | | | | | | |
Closing balance at end of year | | | 216 | | | | 273 | | | | 157 | |
| | | | | | | | | | | | |
Impairment loss recognised in the year | | | — | | | | 20 | | | | — | |
| | | | | | | | | | | | |
| 1 | The weighted average effective interest rate for the reclassified assets approximates 1.3%. |
15: Impaired Financial Assets
Presented below is a summary of impaired financial instruments that are measured on the balance sheet at amortised cost. For these items, impairment losses are recorded through the provision for credit impairment. This contrasts to financial assets carried on the balance sheet at fair value, for which any impairment loss is recognised as a component of the overall fair value.
Detailed information on impaired financial assets is provided in note 33 Financial Risk Management.
| | | | | | | | | | | | | | | | |
| | | Consolidated | | | The Company | |
| | | 2009
$m | | | 2008
$m | | | 2009
$m | | | 2008
$m | |
Summary of impaired financial assets | | | | | | | | | | | | | | | | |
Non-performing loans | | | 4,392 | | | | 1,750 | | | | 3,310 | | | | 1,347 | |
Restructured items1 | | | 673 | | | | 846 | | | | 504 | | | | 846 | |
Non-performing commitments and contingencies | | | 530 | | | | 77 | | | | 504 | | | | 72 | |
| | | | | | | | | | | | | | | | |
Gross impaired financial assets | | | 5,595 | | | | 2,673 | | | | 4,318 | | | | 2,265 | |
Individual provisions | | | | | | | | | | | | | | | | |
Non-performing loans | | | (1,512 | ) | | | (646 | ) | | | (1,050 | ) | | | (459 | ) |
Non-performing commitments and contingencies | | | (14 | ) | | | (29 | ) | | | (12 | ) | | | (29 | ) |
| | | | | | | | | | | | | | | | |
Net impaired financial assets | | | 4,069 | | | | 1,998 | | | | 3,256 | | | | 1,777 | |
| | | | | | | | | | | | | | | | |
Accruing loans past due 90 days or more2 | | | | | | | | | | | | | | | | |
These amounts are not classified as impaired assets as they are either 90 days or more past due and well secured, or are portfolio managed facilities that can be held on an accrual basis for up to 180 days past due | | | 1,597 | | | | 1,060 | | | | 1,200 | | | | 758 | |
| | | | | | | | | | | | | | | | |
| 1 | Restructured items are facilities in which the original contractual terms have been modified to provide for concessions of interest, or principal, or other payments due, or for an extension in maturity for a non-commercial period for reasons related to the financial difficulties of a customer, and are not considered impaired. Includes both on and off balance sheet exposures. |
| 2 | Includes unsecured credit card and personal loans 90 day past due accounts which are allowed by APRA to be retained on a performing basis for up to 180 days past due amounting to $135 million (2008: $115 million) for the Group and $94 million (2008: $82 million) for the Company. The remainder of 90 day past due accounts are predominately held on an accrual basis having been assessed as well secured. |
16: Provision for Credit Impairment
| | | | | | | | | | | | | | | | |
| | | Consolidated | | | The Company | |
Provision movement analysis | | 2009
$m | | | 2008
$m | | | 2009
$m | | | 2008
$m | |
New and increased provisions | | | | | | | | | | | | | | | | |
Australia | | | 2,387 | | | | 978 | | | | 2,262 | | | | 856 | |
New Zealand | | | 540 | | | | 187 | | | | 2 | | | | — | |
Asia, Pacific, Europe and America | | | 118 | | | | 72 | | | | 37 | | | | 42 | |
| | | | | | | | | | | | | | | | |
| | | 3,045 | | | | 1,237 | | | | 2,301 | | | | 898 | |
Provision releases | | | (210 | ) | | | (105 | ) | | | (173 | ) | | | (72 | ) |
| | | | | | | | | | | | | | | | |
| | | 2,835 | | | | 1,132 | | | | 2,128 | | | | 826 | |
Recoveries of amounts previously written off | | | (85 | ) | | | (100 | ) | | | (50 | ) | | | (63 | ) |
| | | | | | | | | | | | | | | | |
Individual provision charge | | | 2,750 | | | | 1,032 | | | | 2,078 | | | | 763 | |
Impairment on available-for-sale assets | | | 20 | | | | 98 | | | | 20 | | | | 98 | |
Collective provision charge | | | 235 | | | | 818 | | | | (19 | ) | | | 712 | |
| | | | | | | | | | | | | | | | |
Charge to income statement | | | 3,005 | | | | 1,948 | | | | 2,079 | | | | 1,573 | |
| | | | | | | | | | | | | | | | |
Financial Report 105
NOTES TO THE FINANCIAL STATEMENTS
16: Provision for Credit Impairment (continued)
Movement in provision for credit impairment by financial asset class
| | | | | | | | | | | | | | | | | | | | | | | | | | | | | | | | | | | | | | | | |
| | | Liquid assets and due from other financial institutions | | | Net loans and advances and acceptances | | | Other financial assets | | | Credit related commitments1 | | | Total provisions | |
Consolidated | | 2009
$m | | | 2008
$m | | | 2009
$m | | | 2008
$m | | | 2009
$m | | | 2008
$m | | | 2009
$m | | | 2008
$m | | | 2009
$m | | | 2008
$m | |
Collective provision | | | — | | | | — | | | | | | | | | | | | | | | | | | | | | | | | | | | | | | | | | |
Balance at start of year | | | — | | | | — | | | | 2,062 | | | | 1,483 | | | | — | | | | — | | | | 759 | | | | 509 | | | | 2,821 | | | | 1,992 | |
Adjustment for exchange rate fluctuations | | | — | | | | — | | | | (48 | ) | | | 4 | | | | — | | | | — | | | | (8 | ) | | | 7 | | | | (56 | ) | | | 11 | |
Charge to income statement | | | — | | | | — | | | | 538 | | | | 575 | | | | — | | | | — | | | | (303 | ) | | | 243 | | | | 235 | | | | 818 | |
| | | | | | | | | | | | | | | | | | | | | | | | | | | | | | | | | | | | | | | | |
Total collective provision | | | — | | | | — | | | | 2,552 | | | | 2,062 | | | | — | | | | — | | | | 448 | | | | 759 | | | | 3,000 | | | | 2,821 | |
| | | | | | | | | | | | | | | | | | | | | | | | | | | | | | | | | | | | | | | | |
Individual provision | | | | | | | | | | | | | | | | | | | | | | | | | | | | | | | | | | | | | | | | |
Balance at start of year | | | — | | | | — | | | | 646 | | | | 261 | | | | — | | | | — | | | | 29 | | | | 9 | | | | 675 | | | | 270 | |
Charge to income statement | | | — | | | | — | | | | 2,741 | | | | 1,012 | | | | — | | | | — | | | | 9 | | | | 20 | | | | 2,750 | | | | 1,032 | |
Adjustment for exchange rate fluctuations | | | — | | | | — | | | | (22 | ) | | | — | | | | — | | | | — | | | | — | | | | — | | | | (22 | ) | | | — | |
Discount unwind | | | — | | | | — | | | | (73 | ) | | | (28 | ) | | | — | | | | — | | | | — | | | | — | | | | (73 | ) | | | (28 | ) |
Bad debts written off | | | — | | | | — | | | | (1,865 | ) | | | (699 | ) | | | — | | | | — | | | | (24 | ) | | | — | | | | (1,889 | ) | | | (699 | ) |
Recoveries of amounts previously written off | | | — | | | | — | | | | 85 | | | | 100 | | | | — | | | | — | | | | — | | | | — | | | | 85 | | | | 100 | |
| | | | | | | | | | | | | | | | | | | | | | | | | | | | | | | | | | | | | | | | |
Total individual provision | | | — | | | | — | | | | 1,512 | | | | 646 | | | | — | | | | — | | | | 14 | | | | 29 | | | | 1,526 | | | | 675 | |
| | | | | | | | | | | | | | | | | | | | | | | | | | | | | | | | | | | | | | | | |
Total provision for credit impairment | | | — | | | | — | | | | 4,064 | | | | 2,708 | | | | — | | | | — | | | | 462 | | | | 788 | | | | 4,526 | | | | 3,496 | |
| | | | | | | | | | | | | | | | | | | | | | | | | | | | | | | | | | | | | | | | |
| 1 | Comprises undrawn facilities and customer contingent liabilities. |
The table below contains a detailed analysis of the movements in individual provision for Net loans and advances and acceptances.
| | | | | | | | | | | | | | | | | | | | | | | | | | | | | | | | |
| | | Australia | | | Asia Pacific, Europe and America | | | New Zealand | | | Net loans and advances and acceptances | |
Consolidated | | 2009
$m | | | 2008
$m | | | 2009
$m | | | 2008
$m | | | 2009
$m | | | 2008
$m | | | 2009
$m | | | 2008
$m | |
Individual provision | | | | | | | | | | | | | | | | | | | | | | | | | | | | | | | | |
Balance at start of year | | | 487 | | | | 214 | | | | 48 | | | | 9 | | | | 111 | | | | 38 | | | | 646 | | | | 261 | |
Charge to income statement | | | 2,140 | | | | 794 | | | | 101 | | | | 59 | | | | 500 | | | | 159 | | | | 2,741 | | | | 1,012 | |
Adjustment for exchange rate fluctuations | | | (9 | ) | | | (11 | ) | | | (9 | ) | | | 12 | | | | (4 | ) | | | (1 | ) | | | (22 | ) | | | — | |
Discount unwind | | | (65 | ) | | | (23 | ) | | | (1 | ) | | | — | | | | (7 | ) | | | (5 | ) | | | (73 | ) | | | (28 | ) |
Bad debts written off | | | (1,569 | ) | | | (566 | ) | | | (69 | ) | | | (38 | ) | | | (227 | ) | | | (95 | ) | | | (1,865 | ) | | | (699 | ) |
Recoveries of amounts previously written off | | | 64 | | | | 79 | | | | 5 | | | | 6 | | | | 16 | | | | 15 | | | | 85 | | | | 100 | |
| | | | | | | | | | | | | | | | | | | | | | | | | | | | | | | | |
Total individual provision | | | 1,048 | | | | 487 | | | | 75 | | | | 48 | | | | 389 | | | | 111 | | | | 1,512 | | | | 646 | |
| | | | | | | | | | | | | | | | | | | | | | | | | | | | | | | | |
| | | | | | | | |
| | | Consolidated | |
| | | 2009
% | | | 2008
% | |
Ratios | | | | | | | | |
Individual provision as a % of total gross advances | | | 0.4 | | | | 0.2 | |
Collective provision as a % of total gross advances | | | 0.9 | | | | 0.8 | |
Bad debts written off as a % of total gross advances | | | 0.5 | | | | 0.2 | |
106ANZ Annual Report 2009
NOTES TO THE FINANCIAL STATEMENTS
16: Provision for Credit Impairment (continued)
Movement in provision for credit impairment by financial asset class (continued)
| | | | | | | | | | | | | | | | | | | | | | | | | | | | | | | | | | | | | | | | |
| | | Liquid assets and due from other financial institutions | | | Net loans and advances and acceptances | | | Other financial assets | | | Credit related commitments1 | | | Total provisions | |
The Company | | 2009
$m | | | 2008
$m | | | 2009
$m | | | 2008
$m | | | 2009
$m | | | 2008
$m | | | 2009
$m | | | 2008
$m | | | 2009
$m | | | 2008
$m | |
Collective provision | | | | | | | | | | | | | | | | | | | | | | | | | | | | | | | | | | | | | | | | |
Balance at start of year | | | — | | | | — | | | | 1,519 | | | | 1,028 | | | | — | | | | — | | | | 625 | | | | 389 | | | | 2,144 | | | | 1,417 | |
Adjustment for exchange rate fluctuations and transfers2 | | | — | | | | — | | | | 95 | | | | 7 | | | | — | | | | — | | | | 18 | | | | 8 | | | | 113 | | | | 15 | |
Charge to income statement | | | — | | | | — | | | | 272 | | | | 484 | | | | — | | | | — | | | | (291 | ) | | | 228 | | | | (19 | ) | | | 712 | |
| | | | | | | | | | | | | | | | | | | | | | | | | | | | | | | | | | | | | | | | |
Total collective provision | | | — | | | | — | | | | 1,886 | | | | 1,519 | | | | — | | | | — | | | | 352 | | | | 625 | | | | 2,238 | | | | 2,144 | |
| | | | | | | | | | | | | | | | | | | | | | | | | | | | | | | | | | | | | | | | |
Individual provision | | | | | | | | | | | | | | | | | | | | | | | | | | | | | | | | | | | | | | | | |
Balance at start of year | | | — | | | | — | | | | 459 | | | | 172 | | | | — | | | | — | | | | 29 | | | | 9 | | | | 488 | | | | 181 | |
Charge to income statement | | | — | | | | — | | | | 2,071 | | | | 743 | | | | — | | | | — | | | | 7 | | | | 20 | | | | 2,078 | | | | 763 | |
Adjustment for exchange rate fluctuations and transfers2 | | | — | | | | — | | | | 37 | | | | 4 | | | | — | | | | — | | | | — | | | | — | | | | 37 | | | | 4 | |
Discount unwind | | | — | | | | — | | | | (65 | ) | | | (23 | ) | | | — | | | | — | | | | — | | | | — | | | | (65 | ) | | | (23 | ) |
Bad debts written off | | | — | | | | — | | | | (1,502 | ) | | | (500 | ) | | | — | | | | — | | | | (24 | ) | | | — | | | | (1,526 | ) | | | (500 | ) |
Recoveries of amounts previously written off | | | — | | | | — | | | | 50 | | | | 63 | | | | — | | | | — | | | | — | | | | — | | | | 50 | | | | 63 | |
| | | | | | | | | | | | | | | | | | | | | | | | | | | | | | | | | | | | | | | | |
Total individual provision | | | — | | | | — | | | | 1,050 | | | | 459 | | | | — | | | | — | | | | 12 | | | | 29 | | | | 1,062 | | | | 488 | |
| | | | | | | | | | | | | | | | | | | | | | | | | | | | | | | | | | | | | | | | |
Total provision for credit impairment | | | — | | | | — | | | | 2,936 | | | | 1,978 | | | | — | | | | — | | | | 364 | | | | 654 | | | | 3,300 | | | | 2,632 | |
| | | | | | | | | | | | | | | | | | | | | | | | | | | | | | | | | | | | | | | | |
| 1 | Comprises undrawn facilities and customer contingent liabilities. |
The table below contains a detailed analysis of the movements in individual provision for Net loans and advances and acceptances.
| | | | | | | | | | | | | | | | | | | | | | | | | | | | | | | | |
| | | Australia | | | Asia Pacific, Europe and America | | | New Zealand | | | Net loans and advances and acceptances | |
The Company | | 2009
$m | | | 2008
$m | | | 2009
$m | | | 2008
$m | | | 2009
$m | | | 2008
$m | | | 2009
$m | | | 2008
$m | |
Individual provision | | | | | | | | | | | | | | | | | | | | | | | | | | | | | | | | |
Balance at start of year | | | 424 | | | | 165 | | | | 35 | | | | 7 | | | | — | | | | — | | | | 459 | | | | 172 | |
Charge to income statement | | | 2,042 | | | | 710 | | | | 27 | | | | 33 | | | | 2 | | | | — | | | | 2,071 | | | | 743 | |
Adjustment for exchange rate fluctuations and transfers | | | 44 | | | | (3 | ) | | | (7 | ) | | | 7 | | | | — | | | | — | | | | 37 | | | | 4 | |
Discount unwind | | | (65 | ) | | | (23 | ) | | | — | | | | — | | | | — | | | | — | | | | (65 | ) | | | (23 | ) |
Bad debts written off | | | (1,468 | ) | | | (485 | ) | | | (34 | ) | | | (15 | ) | | | — | | | | — | | | | (1,502 | ) | | | (500 | ) |
Recoveries of amounts previously written off | | | 49 | | | | 60 | | | | 1 | | | | 3 | | | | — | | | | — | | | | 50 | | | | 63 | |
| | | | | | | | | | | | | | | | | | | | | | | | | | | | | | | | |
Total individual provision | | | 1,026 | | | | 424 | | | | 22 | | | | 35 | | | | 2 | | | | — | | | | 1,050 | | | | 459 | |
| | | | | | | | | | | | | | | | | | | | | | | | | | | | | | | | |
| 2 | Includes the transfer of individual provisions of $49 million and collective provisions of $94 million from the Esanda Australia legal entity to the Company in 2009. |
| | | | | | | | |
| | | Consolidated | |
| | | 2009
% | | | 2008
% | |
Ratios | | | | | | | | |
Individual provision as a % of total gross advances | | | 0.4 | | | | 0.2 | |
Collective provision as a % of total gross advances | | | 0.8 | | | | 0.8 | |
Bad debts written off as a % of total gross advances | | | 0.6 | | | | 0.2 | |
Financial Report107
NOTES TO THE FINANCIAL STATEMENTS
17: Shares in Controlled Entities, Associates and Joint Venture Entities
| | | | | | | | | | | | | | | | |
| | | Consolidated | | | The Company | |
| | | 2009
$m | | | 2008
$m | | | 2009
$m | | | 2008
$m | |
Total shares in controlled entities | | | — | | | | — | | | | 8,522 | | | | 9,144 | |
Total shares in associates1(refer note 39) | | | 2,712 | | | | 2,608 | | | | 761 | | | | 869 | |
Total shares in joint venture entities2(refer note 40) | | | 1,853 | | | | 1,767 | | | | — | | | | — | |
| | | | | | | | | | | | | | | | |
Total shares in controlled entities, associates and joint venture entities | | | 4,565 | | | | 4,375 | | | | 9,283 | | | | 10,013 | |
| | | | | | | | | | | | | | | | |
| 1 | Investments in associates are accounted for in the consolidated financial statements using the equity method of accounting and are carried at cost by the parent entity. |
| 2 | Investments in joint venture entities are accounted for in the consolidated financial statements using the equity method of accounting. |
ACQUISITIONS OF CONTROLLED ENTITIES
There were no material controlled entities acquired during the year ended 30 September 2009 or the year ended 30 September 2008.
DISPOSAL OF CONTROLLED ENTITIES
There were no material controlled entities disposed of during the year ended 30 September 2009.
During January — March 2008, the Group progressively disposed of 46% of its investment in Diversified Infrastructure Trust (DIT). A principal investment held by DIT was in Stadium Australia Group, which owns the long-term leasehold of the ANZ Stadium in Sydney. Due to the distribution of voting power to non-ANZ unit holders, ANZ no longer holds a controlling interest and de-consolidated DIT from 1 March 2008. Subsequent to de-consolidation, and as of September 2008, ANZ treats the remaining holding as an investment in associate (refer to note 39 for further details).
Details of aggregate assets and liabilities of controlled entities disposed of by the Group are as follows:
| | | | | | | | | | | | | | | | |
| | | Consolidated
Carrying amount | | | The Company
Carrying amount | |
| | | 2009
$m | | | 2008
$m | | | 2009
$m | | | 2008
$m | |
Net loans and advances | | | — | | | | — | | | | n/a | | | | n/a | |
Premises and equipment | | | — | | | | 200 | | | | n/a | | | | n/a | |
Shares in controlled entities | | | — | | | | — | | | | — | | | | 174 | |
Other assets, including allocated goodwill | | | — | | | | 150 | | | | n/a | | | | n/a | |
Deposits and other borrowings | | | — | | | | (123 | ) | | | n/a | | | | n/a | |
Payables and other liabilities | | | — | | | | (50 | ) | | | n/a | | | | n/a | |
Provisions for long-term employee benefits | | | — | | | | — | | | | n/a | | | | n/a | |
| | | | | | | | | | | | | | | | |
| | | — | | | | 177 | | | | — | | | | 174 | |
| | | | | | | | | | | | | | | | |
Less: Interest retained | | | — | | | | (98 | ) | | | — | | | | (97 | ) |
Net assets disposed | | | — | | | | 79 | | | | — | | | | 77 | |
| | | | | | | | | | | | | | | | |
Cash consideration received | | | — | | | | 81 | | | | — | | | | 81 | |
Provisions for warranties and indemnities | | | — | | | | — | | | | — | | | | — | |
| | | | | | | | | | | | | | | | |
Gain on disposal | | | — | | | | 2 | | | | — | | | | 4 | |
| | | | | | | | | | | | | | | | |
Net proceeds received resulting in cash inflow for the Group was as follows:
| | | | | | | | | | | | | | | | |
| | | Consolidated | | | The Company | |
| | | 2009
$m | | | 2008
$m | | | 2009
$m | | | 2008
$m | |
Cash consideration received and direct costs relating to disposal | | | — | | | | 81 | | | | — | | | | 81 | |
Less: Balances of disposed cash and equivalents | | | — | | | | — | | | | — | | | | — | |
| | | | | | | | | | | | | | | | |
Inflow of cash from disposals, net of cash disposed | | | — | | | | 81 | | | | — | | | | 81 | |
| | | | | | | | | | | | | | | | |
108 ANZ Annual Report 2009
NOTES TO THE FINANCIAL STATEMENTS
18: Tax Assets
| | | | | | | | | | | | | | | | |
| | | Consolidated | | | The Company | |
| | | 2009
$m | | | 2008
$m | | | 2009
$m | | | 2008
$m | |
Australia | | | | | | | | | | | | | | | | |
Current tax asset | | | 586 | | | | 680 | | | | 601 | | | | 680 | |
Deferred tax asset | | | 214 | | | | — | | | | 194 | | | | 14 | |
| | | | | | | | | | | | | | | | |
| | | 800 | | | | 680 | | | | 795 | | | | 694 | |
| | | | | | | | | | | | | | | | |
New Zealand | | | | | | | | | | | | | | | | |
Current tax asset | | | 107 | | | | 129 | | | | — | | | | — | |
Deferred tax asset | | | — | | | | 98 | | | | — | | | | — | |
| | | | | | | | | | | | | | | | |
| | | 107 | | | | 227 | | | | — | | | | — | |
| | | | | | | | | | | | | | | | |
Overseas Markets | | | | | | | | | | | | | | | | |
Current tax asset | | | — | | | | — | | | | — | | | | — | |
Deferred tax asset | | | 289 | | | | 259 | | | | 252 | | | | 225 | |
| | | | | | | | | | | | | | | | |
| | | 289 | | | | 259 | | | | 252 | | | | 225 | |
| | | | | | | | | | | | | | | | |
Total current and deferred tax assets | | | 1,196 | | | | 1,166 | | | | 1,047 | | | | 919 | |
| | | | | | | | | | | | | | | | |
Total current tax assets | | | 693 | | | | 809 | | | | 601 | | | | 680 | |
| | | | | | | | | | | | | | | | |
Deferred tax assets recognised in profit and loss | | | | | | | | | | | | | | | | |
Collective provision for impaired loans and advances | | | 882 | | | | 850 | | | | 667 | | | | 650 | |
Individual provision for impaired loans and advances | | | 445 | | | | 218 | | | | 318 | | | | 165 | |
Deferred fee income | | | 108 | | | | 87 | | | | 99 | | | | 65 | |
Provision for employee entitlements | | | 130 | | | | 130 | | | | 100 | | | | 99 | |
Other provisions | | | 325 | | | | 288 | | | | 198 | | | | 187 | |
Other | | | 217 | | | | 170 | | | | 118 | | | | 110 | |
| | | | | | | | | | | | | | | | |
| | | 2,107 | | | | 1,743 | | | | 1,500 | | | | 1,276 | |
| | | | | | | | | | | | | | | | |
Deferred tax assets recognised directly in equity | | | | | | | | | | | | | | | | |
Defined benefits obligation | | | 70 | | �� | | 47 | | | | 57 | | | | 40 | |
Available-for-sale revaluation reserve | | | 49 | | | | 58 | | | | 48 | | | | 50 | |
Cash flow hedges | | | 37 | | | | — | | | | 43 | | | | — | |
| | | | | | | | | | | | | | | | |
| | | 156 | | | | 105 | | | | 148 | | | | 90 | |
| | | | | | | | | | | | | | | | |
Set-off of deferred tax assets pursuant to set-off provisions1 | | | (1,760 | ) | | | (1,491 | ) | | | (1,202 | ) | | | (1,127 | ) |
| | | | | | | | | | | | | | | | |
Net deferred tax assets | | | 503 | | | | 357 | | | | 446 | | | | 239 | |
| | | | | | | | | | | | | | | | |
Unrecognised deferred tax assets | | | | | | | | | | | | | | | | |
The following deferred tax assets will only be recognised if:
| • | | assessable income is derived of a nature and an amount sufficient to enable the benefit to be realised |
| • | | the conditions for deductability imposed by tax legislation are compiled with; and |
| • | | no changes in tax legislation adversely affect the Group in realising the benefit. |
| | | | | | | | | | | | | | | | |
Unused realised tax losses (on revenue account) | | | 8 | | | | 7 | | | | — | | | | — | |
| | | | | | | | | | | | | | | | |
Total unrecognised deferred tax assets | | | 8 | | | | 7 | | | | — | | | | — | |
| | | | | | | | | | | | | | | | |
| 1 | Deferred tax assets and liabilities are set-off where they relate to income tax levied by the same taxation authority on either the same taxable entity or different taxable entities within the same taxable group. |
Financial Report109
NOTES TO THE FINANCIAL STATEMENTS
19: Goodwill and Other Intangible Assets
| | | | | | | | | | | | | | | | |
| | | Consolidated | | | The Company | |
| | | 2009 | | | 2008 | | | 2009 | | | 2008 | |
| | | $m | | | $m | | | $m | | | $m | |
Goodwill | | | | | | | | | | | | | | | | |
Gross carrying amount | | | | | | | | | | | | | | | | |
Balances at start of the year | | | 3,064 | | | | 3,126 | | | | — | | | | — | |
Additions through business combinations | | | — | | | | 5 | | | | — | | | | — | |
Writedowns | | | — | | | | (4 | ) | | | — | | | | — | |
Derecognised on disposal | | | (4 | ) | | | — | | | | — | | | | — | |
Foreign currency exchange differences | | | (61 | ) | | | (63 | ) | | | — | | | | — | |
| | | | | | | | | | | | | | | | |
Balance at end of year1 | | | 2,999 | | | | 3,064 | | | | — | | | | — | |
| | | | | | | | | | | | | | | | |
Software and other intangible assets | | | | | | | | | | | | | | | | |
Gross carrying amount | | | | | | | | | | | | | | | | |
Balances at start of the year | | | 1,447 | | | | 1,222 | | | | 1,283 | | | | 1,087 | |
Additions | | | 3 | | | | — | | | | — | | | | — | |
Additions from internal developments | | | 411 | | | | 286 | | | | 372 | | | | 256 | |
Foreign currency exchange differences | | | (2 | ) | | | (2 | ) | | | (3 | ) | | | (1 | ) |
Impairment | | | (34 | ) | | | (59 | ) | | | (31 | ) | | | (59 | ) |
| | | | | | | | | | | | | | | | |
Balance at end of year | | | 1,825 | | | | 1,447 | | | | 1,621 | | | | 1,283 | |
| | | | | | | | | | | | | | | | |
Accumulated amortisation and impairment | | | | | | | | | | | | | | | | |
Balances at start of the year | | | 770 | | | | 671 | | | | 660 | | | | 576 | |
Amortisation expense2(refer note 4) | | | 162 | | | | 134 | | | | 143 | | | | 120 | |
Foreign currency exchange differences | | | 3 | | | | 1 | | | | (4 | ) | | | — | |
Impairment | | | (7 | ) | | | (36 | ) | | | (7 | ) | | | (36 | ) |
| | | | | | | | | | | | | | | | |
Balance at end of year | | | 928 | | | | 770 | | | | 792 | | | | 660 | |
| | | | | | | | | | | | | | | | |
Net book value | | | | | | | | | | | | | | | | |
Balances at start of the year | | | 677 | | | | 551 | | | | 623 | | | | 511 | |
| | | | | | | | | | | | | | | | |
Balance at end of year | | | 897 | | | | 677 | | | | 829 | | | | 623 | |
| | | | | | | | | | | | | | | | |
Goodwill, software and other intangible assets | | | | | | | | | | | | | | | | |
Net book value | | | | | | | | | | | | | | | | |
Balances at start of the year | | | 3,741 | | | | 3,677 | | | | 623 | | | | 511 | |
| | | | | | | | | | | | | | | | |
Balance at end of year1 | | | 3,896 | | | | 3,741 | | | | 829 | | | | 623 | |
| | | | | | | | | | | | | | | | |
| 1 | Excludes notional goodwill in equity accounted entities. |
| 2 | Comprises software amortisation expense of $155 million (September 2008: $127 million) and amortisation of other intangible assets $7 million (September 2008: $7 million). The Company comprises software amortisation expense of $140 million (September 2008: $115 million) and amortisation of other intangible assets $3 million (September 2008: $5 million). |
Goodwill allocated to cash-generating units
The goodwill balance above largely comprises the goodwill purchased on acquisition of NBNZ Holdings Limited in December 2003. Discussion of the goodwill and impairment testing for the cash generating unit containing this goodwill is included in note 2(vi).
110 ANZ Annual Report 2009
NOTES TO THE FINANCIAL STATEMENTS
20: Other Assets
| | | | | | | | | | | | | | | | |
| | | Consolidated | | �� | The Company | |
| | | 2009 | | | 2008 | | | 2009 | | | 2008 | |
| | | $m | | | $m | | | $m | | | $m | |
Accrued interest/prepaid discounts | | | 1,097 | | | | 1,819 | | | | 743 | | | | 1,329 | |
Accrued commissions | | | 77 | | | | 129 | | | | 57 | | | | 89 | |
Prepaid expenses | | | 139 | | | | 111 | | | | 54 | | | | 55 | |
Issued securities settlements | | | 917 | | | | 433 | | | | 581 | | | | 351 | |
Operating leases residual value | | | 277 | | | | 185 | | | | 160 | | | | 5 | |
Capitalised expenses | | | 37 | | | | 42 | | | | 37 | | | | 42 | |
Other | | | 1,683 | | | | 2,359 | | | | 1,117 | | | | 1,481 | |
| | | | | | | | | | | | | | | | |
Total other assets | | | 4,227 | | | | 5,078 | | | | 2,749 | | | | 3,352 | |
| | | | | | | | | | | | | | | | |
21: Premises and Equipment
| | | | | | | | | | | | | | | | |
| | | Consolidated | | | The Company | |
| | | 2009 | | | 2008 | | | 2009 | | | 2008 | |
| | | $m | | | $m | | | $m | | | $m | |
Freehold and leasehold land and buildings | | | | | | | | | | | | | | | | |
At Cost | | | 628 | | | | 640 | | | | 92 | | | | 97 | |
Depreciation | | | (218 | ) | | | (208 | ) | | | (42 | ) | | | (42 | ) |
| | | | | | | | | | | | | | | | |
| | | 410 | | | | 432 | | | | 50 | | | | 55 | |
| | | | | | | | | | | | | | | | |
Leasehold improvements | | | | | | | | | | | | | | | | |
At Cost | | | 385 | | | | 356 | | | | 254 | | | | 236 | |
Depreciation | | | (229 | ) | | | (202 | ) | | | (150 | ) | | | (127 | ) |
| | | | | | | | | | | | | | | | |
| | | 156 | | | | 154 | | | | 104 | | | | 109 | |
| | | | | | | | | | | | | | | | |
Furniture and equipment | | | | | | | | | | | | | | | | |
At Cost | | | 969 | | | | 938 | | | | 753 | | | | 725 | |
Depreciation | | | (613 | ) | | | (568 | ) | | | (459 | ) | | | (418 | ) |
| | | | | | | | | | | | | | | | |
| | | 356 | | | | 370 | | | | 294 | | | | 307 | |
| | | | | | | | | | | | | | | | |
Computer equipment | | | | | | | | | | | | | | | | |
At Cost | | | 979 | | | | 937 | | | | 719 | | | | 682 | |
Depreciation | | | (748 | ) | | | (722 | ) | | | (550 | ) | | | (527 | ) |
| | | | | | | | | | | | | | | | |
| | | 231 | | | | 215 | | | | 169 | | | | 155 | |
| | | | | | | | | | | | | | | | |
Capital works in progress | | | | | | | | | | | | | | | | |
At Cost | | | 909 | | | | 421 | | | | 832 | | | | 379 | |
| | | | | | | | | | | | | | | | |
Total premises and equipment | | | 2,062 | | | | 1,592 | | | | 1,449 | | | | 1,005 | |
| | | | | | | | | | | | | | | | |
Financial Report111
NOTES TO THE FINANCIAL STATEMENTS
21: Premises and Equipment (continued)
Reconciliations of the carrying amounts for each class of premises and equipment are set out below:
| | | | | | | | | | | | | | | | |
| | | Consolidated | | | The Company | |
| | | 2009 | | | 2008 | | | 2009 | | | 2008 | |
| | | $m | | | $m | | | $m | | | $m | |
| Freehold and leasehold land and buildings | | | | | | | | | | | | | | | | |
Carrying amount at beginning of year | | | 432 | | | | 634 | | | | 55 | | | | 58 | |
Additions | | | 41 | | | | 82 | | | | 6 | | | | 2 | |
Disposals | | | (34 | ) | | | (261 | ) | | | — | | | | (1 | ) |
Depreciation | | | (18 | ) | | | (22 | ) | | | (4 | ) | | | (4 | ) |
Foreign currency exchange difference | | | (11 | ) | | | (1 | ) | | | (7 | ) | | | — | |
| | | | | | | | | | | | | | | | |
Carrying amount at end of year | | | 410 | | | | 432 | | | | 50 | | | | 55 | |
| | | | | | | | | | | | | | | | |
| Leasehold improvements | | | | | | | | | | | | | | | | |
Carrying amount at beginning of year | | | 154 | | | | 125 | | | | 109 | | | | 89 | |
Additions | | | 46 | | | | 55 | | | | 23 | | | | 41 | |
Disposals | | | (1 | ) | | | (1 | ) | | | — | | | | (1 | ) |
Amortisation | | | (38 | ) | | | (27 | ) | | | (27 | ) | | | (21 | ) |
Foreign currency exchange difference | | | (5 | ) | | | 2 | | | | (1 | ) | | | 1 | |
| | | | | | | | | | | | | | | | |
Carrying amount at end of year | | | 156 | | | | 154 | | | | 104 | | | | 109 | |
| | | | | | | | | | | | | | | | |
| Furniture and equipment | | | | | | | | | | | | | | | | |
Carrying amount at beginning of year | | | 370 | | | | 340 | | | | 307 | | | | 280 | |
Additions | | | 67 | | | | 100 | | | | 50 | | | | 85 | |
Disposals | | | (4 | ) | | | (4 | ) | | | (3 | ) | | | (4 | ) |
Depreciation | | | (72 | ) | | | (66 | ) | | | (58 | ) | | | (54 | ) |
Foreign currency exchange difference | | | (5 | ) | | | — | | | | (2 | ) | | | — | |
| | | | | | | | | | | | | | | | |
Carrying amount at end of year | | | 356 | | | | 370 | | | | 294 | | | | 307 | |
| | | | | | | | | | | | | | | | |
| Computer equipment | | | | | | | | | | | | | | | | |
Carrying amount at beginning of year | | | 215 | | | | 229 | | | | 155 | | | | 171 | |
Additions | | | 110 | | | | 66 | | | | 78 | | | | 43 | |
Disposals | | | (8 | ) | | | (1 | ) | | | (5 | ) | | | — | |
Depreciation | | | (84 | ) | | | (81 | ) | | | (58 | ) | | | (60 | ) |
Foreign currency exchange difference | | | (2 | ) | | | 2 | | | | (1 | ) | | | 1 | |
| | | | | | | | | | | | | | | | |
Carrying amount at end of year | | | 231 | | | | 215 | | | | 169 | | | | 155 | |
| | | | | | | | | | | | | | | | |
Capital works in progress | | | | | | | | | | | | | | | | |
Carrying amount at beginning of year | | | 421 | | | | 165 | | | | 379 | | | | 141 | |
Net additions | | | 488 | | | | 256 | | | | 453 | | | | 238 | |
| | | | | | | | | | | | | | | | |
Carrying amount at end of year | | | 909 | | | | 421 | | | | 832 | | | | 379 | |
| | | | | | | | | | | | | | | | |
| Total premises and equipment | | | 2,062 | | | | 1,592 | | | | 1,449 | | | | 1,005 | |
| | | | | | | | | | | | | | | | |
112 ANZ Annual Report 2009
NOTES TO THE FINANCIAL STATEMENTS
22: Deposits and Other Borrowings
| | | | | | | | | | | | | | | | |
| | | Consolidated | | | The Company | |
| | | 2009 | | | 2008 | | | 2009 | | | 2008 | |
| | | $m | | | $m | | | $m | | | $m | |
Certificates of deposit | | | 44,711 | | | | 52,346 | | | | 41,019 | | | | 47,656 | |
Term deposits | | | 108,367 | | | | 89,225 | | | | 79,332 | | | | 62,225 | |
Other deposits bearing interest and other borrowings | | | 113,304 | | | | 100,575 | | | | 92,987 | | | | 79,098 | |
Deposits not bearing interest | | | 10,174 | | | | 9,367 | | | | 5,800 | | | | 5,322 | |
Commercial paper | | | 14,227 | | | | 22,422 | | | | 8,162 | | | | 9,027 | |
Borrowing corporations debt1 | | | 3,587 | | | | 10,031 | | | | — | | | | — | |
| | | | | | | | | | | | | | | | |
Total deposits and other borrowings | | | 294,370 | | | | 283,966 | | | | 227,300 | | | | 203,328 | |
| 1 | Included in this balance is debenture stock of controlled entities. $2.1 billion of debenture stock of the consolidated subsidiary company Esanda Finance Corporation Limited (Esanda), together with accrued interest thereon, is secured by a trust deed and collateral debentures, giving floating charges upon the undertaking and all the assets of the entity ($3.1 billion) other than land and buildings. All controlled entities of Esanda (except for some controlled entities which have been placed or are expected to be placed in voluntary de-registration and have minimal book value) have guaranteed the payment of principal, interest and other monies in relation to all debenture stock and unsecured notes issued by Esanda. The only loans pledged as collateral are those in Esanda and its subsidiaries. Effective from 18 March 2009, Esanda ceased to write new debentures. |
In addition, this balance also includes NZD 1.6 billion of secured debenture stock of the consolidated subsidiary UDC Finance Limited (UDC) and the accrued interest thereon which are secured by a floating charge over all assets of UDC (NZD 1.9 billion).
23: Income Tax Liabilities
| | | | | | | | | | | | | | | | |
| | | Consolidated | | | The Company | |
| | | 2009 | | | 2008 | | | 2009 | | | 2008 | |
| | | $m | | | $m | | | $m | | | $m | |
Australia and New Zealand | | | | | | | | | | | | | | | | |
Current tax payable | | | — | | | | — | | | | — | | | | — | |
Deferred tax liabilities | | | — | | | | — | | | | — | | | | — | |
| | | | | | | | | | | | | | | | |
| | | — | | | | — | | | | — | | | | — | |
| | | | | | | | | | | | | | | | |
Overseas Markets | | | | | | | | | | | | | | | | |
Current tax payable | | | 99 | | | | 61 | | | | 61 | | | | 2 | |
Deferred tax liabilities | | | 111 | | | | 149 | | | | 90 | | | | 145 | |
| | | | | | | | | | | | | | | | |
| | | 210 | | | | 210 | | | | 151 | | | | 147 | |
| | | | | | | | | | | | | | | | |
Total current and deferred income tax liability | | | 210 | | | | 210 | | | | 151 | | | | 147 | |
| | | | | | | | | | | | | | | | |
Total current tax payable | | | 99 | | | | 61 | | | | 61 | | | | 2 | |
| | | | | | | | | | | | | | | | |
Deferred tax liabilities recognised in profit and loss | | | | | | | | | | | | | | | | |
Lease finance | | | 215 | | | | 234 | | | | 104 | | | | 114 | |
Treasury instruments | | | 608 | | | | 637 | | | | 609 | | | | 658 | |
Capitalised expenses | | | 144 | | | | 147 | | | | 144 | | | | 53 | |
Other | | | 877 | | | | 576 | | | | 435 | | | | 426 | |
| | | | | | | | | | | | | | | | |
| | | 1,844 | | | | 1,594 | | | | 1,292 | | | | 1,251 | |
| | | | | | | | | | | | | | | | |
Deferred tax liabilities recognised directly in equity | | | | | | | | | | | | | | | | |
Cash flow hedges | | | — | | | | 31 | | | | — | | | | 21 | |
Foreign currency translation reserve | | | 27 | | | | 15 | | | | — | | | | — | |
| | | | | | | | | | | | | | | | |
| | | 27 | | | | 46 | | | | — | | | | 21 | |
| | | | | | | | | | | | | | | | |
Set-off of deferred tax liabilities pursuant to set-off provision1 | | | (1,760 | ) | | | (1,491 | ) | | | (1,202 | ) | | | (1,127 | ) |
| | | | | | | | | | | | | | | | |
Net deferred tax liability | | | 111 | | | | 149 | | | | 90 | | | | 145 | |
| | | | | | | | | | | | | | | | |
Unrecognised deferred tax liabilities | | | | | | | | | | | | | | | | |
The following deferred tax liabilities have not been bought to account as liabilities: | | | | | | | | | | | | | | | | |
Other unrealised taxable temporary differences2 | | | 67 | | | | 46 | | | | 31 | | | | 11 | |
| | | | | | | | | | | | | | | | |
Total unrecognised deferred tax liabilities | | | 67 | | | | 46 | | | | 31 | | | | 11 | |
| | | | | | | | | | | | | | | | |
| 1 | Deferred tax assets and liabilities are set-off where they relate to income tax levied by the same taxation authority on either the same taxable entity or different taxable entities within the same taxable group. |
| 2 | Represents additional potential foreign tax costs should all retained earnings in offshore branches and subsidiaries be repatriated. |
Financial Report113
NOTES TO THE FINANCIAL STATEMENTS
24: Payables and Other Liabilities
| | | | | | | | | | | | | | | | |
| | | Consolidated | | | The Company | |
| | | 2009 | | | 2008 | | | 2009 | | | 2008 | |
| | | $m | | | $m | | | $m | | | $m | |
Creditors | | | 1,689 | | | | 2,808 | | | | 1,295 | | | | 2,392 | |
Accrued interest and unearned discounts | | | 2,448 | | | | 3,563 | | | | 1,771 | | | | 2,561 | |
Defined benefits plan obligations | | | 246 | | | | 154 | | | | 200 | | | | 132 | |
Accrued charges | | | 1,028 | | | | 734 | | | | 780 | | | | 499 | |
Security settlements | | | 765 | | | | 379 | | | | 652 | | | | 318 | |
Other liabilities | | | 1,599 | | | | 1,805 | | | | 1,308 | | | | 949 | |
| | | | | | | | | | | | | | | | |
Total payables and other liabilities | | | 7,775 | | | | 9,443 | | | | 6,006 | | | | 6,851 | |
| | | | | | | | | | | | | | | | |
25: Provisions
| | | | | | | | | | | | | | | | |
| | | Consolidated | | | The Company | |
| | | 2009 | | | 2008 | | | 2009 | | | 2008 | |
| | | $m | | | $m | | | $m | | | $m | |
Employee entitlements1 | | | 445 | | | | 444 | | | | 339 | | | | 340 | |
Restructuring costs and surplus leased space2 | | | 144 | | | | 183 | | | | 124 | | | | 155 | |
Non-lending losses, frauds and forgeries3 | | | 169 | | | | 169 | | | | 146 | | | | 140 | |
Other | | | 554 | | | | 421 | | | | 296 | | | | 273 | |
| | | | | | | | | | | | | | | | |
Total provisions | | | 1,312 | | | | 1,217 | | | | 905 | | | | 908 | |
| | | | | | | | | | | | | | | | |
Reconciliations of the carrying amounts of each class of provision, except for employee entitlements, are set out below:
| | | | | | | | | | | | | | | | |
| | | Consolidated | | | The Company | |
| | | 2009 | | | 2008 | | | 2009 | | | 2008 | |
| | | $m | | | $m | | | $m | | | $m | |
Restructuring costs and surplus leased space2 | | | | | | | | | | | | | | | | |
Carrying amount at beginning of the year | | | 183 | | | | 37 | | | | 155 | | | | 32 | |
Provisions made during the year | | | 111 | | | | 185 | | | | 91 | | | | 153 | |
Payments made during the year | | | (104 | ) | | | (15 | ) | | | (77 | ) | | | (9 | ) |
Transfer/release of provision | | | (46 | ) | | | (24 | ) | | | (45 | ) | | | (21 | ) |
| | | | | | | | | | | | | | | | |
Carrying amount at the end of the year | | | 144 | | | | 183 | | | | 124 | | | | 155 | |
| | | | | | | | | | | | | | | | |
Non-lending losses, frauds and forgeries | | | | | | | | | | | | | | | | |
Carrying amount at beginning of the year | | | 169 | | | | 186 | | | | 140 | | | | 138 | |
Provisions made during the year | | | 30 | | | | 37 | | | | 29 | | | | 15 | |
Payments made during the year | | | (12 | ) | | | (38 | ) | | | (10 | ) | | | (5 | ) |
Transfer/release of provision | | | (18 | ) | | | (16 | ) | | | (13 | ) | | | (8 | ) |
| | | | | | | | | | | | | | | | |
Carrying amount at the end of the year | | | 169 | | | | 169 | | | | 146 | | | | 140 | |
| | | | | | | | | | | | | | | | |
Other provisions3 | | | | | | | | | | | | | | | | |
Carrying amount at beginning of the year | | | 421 | | | | 398 | | | | 273 | | | | 241 | |
Provisions made during the year | | | 476 | | | | 281 | | | | 238 | | | | 263 | |
Payments made during the year | | | (272 | ) | | | (186 | ) | | | (155 | ) | | | (183 | ) |
Transfer/release of provision | | | (71 | ) | | | (72 | ) | | | (60 | ) | | | (48 | ) |
| | | | | | | | | | | | | | | | |
Carrying amount at the end of the year | | | 554 | | | | 421 | | | | 296 | | | | 273 | |
| | | | | | | | | | | | | | | | |
| 1 | The aggregate liability for employee benefits largely comprises employee entitlements provisions for annual leave and long service leave. |
| 2 | Restructuring costs and surplus leased space provisions arise from exit activities related to material changes in the scope of business undertaken by the Group or the manner in which that business is undertaken and includes termination benefits. Costs related to on-going activities are not provided for. Provision is made when the Group is demonstrably committed, it is probable that the costs will be incurred, though their timing is uncertain, and the costs can be reliably estimated. |
| 3 | Other provisions comprise various other provisions including loyalty programs, workers’ compensation and make-good provisions on leased premises. |
114 ANZ Annual Report 2009
NOTES TO THE FINANCIAL STATEMENTS
26: Bonds and Notes
| | | | | | | | | | | | | | | | | | |
| | | | | Consolidated | | | The Company | |
| | | 2009
$m | | | 2008
$m | | | 2009
$m | | | 2008
$m | |
Bonds and notes by currency | | | | | | | | | | | | | | | | |
USD | | United States dollars | | | 22,199 | | | | 24,783 | | | | 14,031 | | | | 15,940 | |
GBP | | Great British pounds | | | 4,202 | | | | 7,263 | | | | 3,218 | | | | 5,608 | |
AUD | | Australian dollars | | | 2,822 | | | | 2,984 | | | | 2,772 | | | | 2,934 | |
NZD | | New Zealand dollars | | | 1,522 | | | | 1,414 | | | | 73 | | | | 131 | |
JPY | | Japanese Yen | | | 7,512 | | | | 5,644 | | | | 7,436 | | | | 4,853 | |
EUR | | Euro | | | 13,208 | | | | 17,365 | | | | 13,208 | | | | 15,479 | |
HKD | | Hong Kong dollars | | | 2,727 | | | | 3,230 | | | | 2,690 | | | | 2,975 | |
CHF | | Swiss francs | | | 2,015 | | | | 2,560 | | | | 1,713 | | | | 2,246 | |
CAD | | Canadian dollars | | | 684 | | | | 1,692 | | | | 684 | | | | 1,692 | |
NOK | | Norwegian krone | | | 53 | | | | 53 | | | | 53 | | | | 53 | |
SGD | | Singapore dollars | | | 230 | | | | 240 | | | | 69 | | | | 65 | |
CZK | | Czech koruna | | | 86 | | | | 95 | | | | 86 | | | | 95 | |
| | | | | | | | | | | | | | | | | | |
Total bonds and notes | | | 57,260 | | | | 67,323 | | | | 46,033 | | | | 52,071 | |
| | | | | | | | | | | | | | | | | | |
Financial Report115
NOTES TO THE FINANCIAL STATEMENTS
27: Loan Capital
| | | | | | | | | | | | | | | | | | | | |
| | | | | | | Consolidated | | | The Company | |
| | | Interest Rate | | | | 2009 | | | 2008 | | | 2009 | | | 2008 | |
| | | % | | | | $m | | | $m | | | $m | | | $m | |
Hybrid loan capital (subordinated)4 | | | | | | | | | | | | | | | | | | | | |
US Trust Securities | | | | | | | | | | | | | | | | | | | | |
USD 350m non-cumulative trust securities due 2053 | | 4.48 | | | | | 423 | | | | 438 | | | | 397 | | | | 438 | |
USD 750m non-cumulative trust securities due 2053 | | 5.36 | | | | | 907 | | | | 938 | | | | 853 | | | | 938 | |
UK Stapled Securities | | 6.54 | | | | | 820 | | | | 1,014 | | | | 820 | | | | 1,014 | |
ANZ Convertible Preference Shares (ANZ CPS) | | BBSW + 2.50 | | | | | 1,081 | | | | 1,081 | | | | 1,081 | | | | 1,081 | |
Convertible Notes (ANZ CN) | | BBSW + 2.00 | | | | | — | | | | 600 | | | | — | | | | 600 | |
| | | | | | | | | | | | | | | | | | | | |
| | | | | | | 3,231 | | | | 4,071 | | | | 3,151 | | | | 4,071 | |
| | | | | | | | | | | | | | | | | | | | |
| | | | | | | | | | | | | | | | | | | | | | |
Perpetual subordinated notes | | | | | | | | | | | | | | | | | | |
USD | | 300m | | floating rate notes | | LIBOR + 0.15 | | | 341 | | | | 375 | | | | 341 | | | | 375 | |
NZD | | 835m | | fixed rate notes1 | | 9.66 | | | 685 | | | | 700 | | | | — | | | | — | |
| | | | | | | | | | | | | | | | | | | | | | |
| | | | | | | | | 1,026 | | | | 1,075 | | | | 341 | | | | 375 | |
| | | | | | | | | | | | | | | | | | | | | | |
Subordinated notes4 | | | | | | | | | | | | | | | | | | |
USD | | 79m | | floating rate notes due 2008 | | LIBOR + 0.53 | | | — | | | | 12 | | | | — | | | | 12 | |
AUD | | 400m | | floating rate notes due 2010 | | BBSW + 0.29 | | | 400 | | | | 400 | | | | 400 | | | | 400 | |
AUD | | 380m | | floating rate notes due 20142 | | BBSW + 0.41 | | | — | | | | 380 | | | | — | | | | 380 | |
AUD | | 350m | | fixed notes due 20143 | | 6.50 | | | — | | | | 350 | | | | — | | | | 350 | |
USD | | 400m | | floating rate notes due 20152 | | LIBOR + 0.20 | | | 455 | | | | 500 | | | | 455 | | | | 500 | |
AUD | | 300m | | fixed notes due 20153 | | 6.00 | | | 304 | | | | 297 | | | | 304 | | | | 297 | |
GBP | | 200m | | fixed notes due 20152 | | 5.625 | | | 372 | | | | 446 | | | | 372 | | | | 446 | |
EUR | | 500m | | fixed notes due 20153 | | 4.45 | | | 830 | | | | 892 | | | | 830 | | | | 892 | |
USD | | 250m | | floating rate notes due 20162 | | LIBOR + 0.21 | | | 284 | | | | 313 | | | | 284 | | | | 313 | |
AUD | | 300m | | fixed notes due 20163 | | 6.25 | | | 299 | | | | 298 | | | | 299 | | | | 298 | |
AUD | | 300m | | floating rate notes due 20162 | | BBSW + 0.22 | | | 300 | | | | 300 | | | | 300 | | | | 300 | |
GBP | | 250m | | fixed notes due 20163 | | 4.75 | | | 479 | | | | 555 | | | | 479 | | | | 555 | |
NZD | | 350m | | fixed notes due 20163 | | 7.16 | | | 287 | | | | 293 | | | | — | | | | — | |
AUD | | 350m | | fixed notes due 20172 | | 6.50 | | | 350 | | | | 349 | | | | 350 | | | | 349 | |
AUD | | 350m | | floating rate notes due 20172 | | BBSW + 0.24 | | | 350 | | | | 350 | | | | 350 | | | | 350 | |
AUD | | 100m | | fixed notes due 20172 | | 7.30 | | | 100 | | | | 100 | | | | 100 | | | | 100 | |
AUD | | 100m | | floating rate notes due 20172 | | BBSW + 0.40 | | | 100 | | | | 100 | | | | 100 | | | | 100 | |
GBP | | 175m | | fixed notes due 20172 | | 6.38 | | | 349 | | | | 403 | | | | 349 | | | | 403 | |
NZD | | 250m | | fixed notes due 20172 | | 7.60 | | | 205 | | | | 204 | | | | — | | | | — | |
NZD | | 350m | | fixed notes due 20172 | | 8.23 | | | 287 | | | | 293 | | | | — | | | | — | |
GBP | | 400m | | fixed notes due 20183 | | 4.75 | | | 724 | | | | 821 | | | | 724 | | | | 821 | |
AUD | | 290m | | fixed notes due 20173 | | 7.75 | | | 289 | | | | 289 | | | | 289 | | | | 289 | |
AUD | | 210m | | floating rate notes due 20172 | | BBSW + 0.75 | | | 210 | | | | 210 | | | | 210 | | | | 210 | |
AUD | | 100m | | floating rate notes due 20172 | | BBSW + 0.70 | | | 100 | | | | 100 | | | | 100 | | | | 100 | |
AUD | | 365m | | floating rate notes due 20182 | | BBSW + 1.20 | | | 365 | | | | 365 | | | | 365 | | | | 365 | |
AUD | | 500m | | floating rate notes due 20182 | | BBSW + 2.05 | | | 500 | | | | 500 | | | | 500 | | | | 500 | |
EUR | | 750m | | fixed notes due 2019 | | 5.13 | | | 1,233 | | | | — | | | | 1,233 | | | | — | |
| | | | | | | | | | | | | | | | | | | | | | |
| | | | | | | | | 9,172 | | | | 9,120 | | | | 8,393 | | | | 8,330 | |
| | | | | | | | | | | | | | | | | | | | | | |
Total loan capital | | | | | 13,429 | | | | 14,266 | | | | 11,885 | | | | 12,776 | |
| | | | | | | | | | | | | | | | | | | | | | |
Loan capital by currency | | | | | | | | | | | | | | | | | | |
AUD | | Australian dollars | | | | | 4,748 | | | | 6,069 | | | | 4,748 | | | | 6,069 | |
NZD | | New Zealand dollars | | | | | 1,464 | | | | 1,490 | | | | — | | | | — | |
USD | | United States dollars | | | | | 2,410 | | | | 2,576 | | | | 2,330 | | | | 2,576 | |
GBP | | Great British pounds | | | | | 2,744 | | | | 3,239 | | | | 2,744 | | | | 3,239 | |
EUR | | Euro | | | | | 2,063 | | | | 892 | | | | 2,063 | | | | 892 | |
| | | | | | | | | | | | | | | | | | | | | | |
| | | | | | | | | 13,429 | | | | 14,266 | | | | 11,885 | | | | 12,776 | |
| | | | | | | | | | | | | | | | | | | | | | |
| 1 | Fixed until the first call date, 18 April 2013, whereupon the rate resets to the Five Year Swap Rate +2.00, if not called and remains fixed until the next call date, 18 April 2018 whereupon reverts to floating at the Three month FRA rate +3.00 and is calculable quarterly thereafter. |
| 2 | Callable five years prior to maturity. |
| 3 | Callable five years prior to maturity and reverts to floating rate if not called. |
| 4 | Included within the carrying amount are, where appropriate, revaluations associated with fair value hedge accounting or an election to fair value the note through the income statement. |
Loan capital is subordinated in right of payment to the claims of depositors and all other creditors of the Company and its controlled entities which have issued the notes. The loan capital, except for the US Trust Securities, UK Stapled Securities and ANZ CPS constitutes Tier 2 capital as defined by APRA for capital adequacy purposes. US Trust Securities constitute innovative Tier 1 capital, as defined by APRA, for capital adequacy purposes. UK Stapled Securities and ANZ CPS constitute non-innovative Tier 1 capital, as defined by APRA, for capital adequacy purposes.
116ANZ Annual Report 2009
NOTES TO THE FINANCIAL STATEMENTS
27: Loan Capital (continued)
US TRUST SECURITIES
On 27 November 2003, the Company issued 1.1 million USD non-cumulative Trust Securities (“US Trust Securities”) at USD1,000 each pursuant to an offering memorandum dated 19 November 2003 raising USD1.1 billion. US Trust Securities comprise two fully paid securities – an interest paying unsecured note (issued by Samson Funding Limited, a wholly owned NZ subsidiary of the Company) and a fully paid USD1,000 preference share (issued by the Company), which are stapled together and issued as a US Trust Security by ANZ Capital Trust I or ANZ Capital Trust II (the “Trusts”). Investors have the option to redeem the US Trust Security from the Trusts and hold the underlying stapled security.
The issue was made in two tranches:
| • | | USD350 million tranche with a coupon of 4.48% and was issued through ANZ Capital Trust I. After 15 January 2010 and at any coupon date thereafter, ANZ has the discretion to redeem the US Trust Security for cash. If it does not exercise this discretion, the investor is entitled to require ANZ to exchange the US Trust Security into a number of ordinary shares based on the formula in the offering memorandum. |
| • | | USD750 million tranche with a coupon of 5.36% and was issued through ANZ Capital Trust II. It has the same conversion features as the USD350 million tranche but from 15 December 2013. |
Distributions on US Trust Securities are non-cumulative and are payable half yearly in arrears and are funded by payments received by the respective Trusts on the underlying note. Distributions are subject to certain payment tests (i.e. APRA requirements and distributable profits being available). Distributions are expected to be payable on 15 June and 15 December of each year. Dividends are not payable on the preference share while it is stapled to the note. If distributions are not paid on the US Trust Securities, the Group may not pay dividends or distributions, or return capital on ANZ ordinary shares or any other share capital or security ranking equal or junior to the preference share component.
At any time in the Company’s discretion or upon the occurrence of certain other “conversion events”, such as the failure of the respective Trust to pay in full a distribution within seven business days of the relevant distribution payment date, the notes that are represented by the relevant US Trust Securities will be automatically assigned to a subsidiary of the Company and the preference shares that are represented by the relevant US Trust Securities will be distributed to investors in redemption of such US Trust Securities. The distributed preference shares will immediately become dividend paying and holders will receive non-cumulative dividends equivalent to the scheduled payments in respect of the US Trust Securities for which the preference shares were distributed. If the US Trust Securities are not redeemed or bought back prior to the 15 December 2053, they will be converted into preference shares, which in turn will be mandatorily converted into a variable number of ordinary shares based upon the formula in the offering memorandum.
The preference shares forming part of the US Trust Securities rank equal to the preference shares issued in connection with the UK Stapled Securities, ANZ CPS, ANZ CN and Euro Trust Securities in all respects. Except in limited circumstances, holders of US Trust Securities do not have any right to vote in general meetings of the Company.
On winding up of the Company, the rights of US Trust Security holders will be determined by the preference share component of US Trust Security. These preference shares rank behind all depositors and creditors, but ahead of ordinary shareholders.
The US Trust Securities qualify as Innovative Tier 1 capital as defined by APRA.
UK STAPLED SECURITIES
On 15 June 2007, the Company issued 9,000 non-cumulative, mandatory convertible stapled securities (“UK Stapled Securities”) at £50,000 each pursuant to a prospectus dated 12 June 2007 raising £450 million. UK Stapled Securities comprise two fully paid securities – an interest paying unsecured subordinated £50,000 note issued by the Company through its New York Branch and a £50,000 preference share issued by the Company, which are stapled together.
Distributions on UK Stapled Securities are non-cumulative and are payable half yearly in arrears at a fixed rate of 6.54% (until converted into ordinary shares or the rate is reset as provided in the prospectus). Distributions are subject to certain payment tests (including APRA requirements and distributable profits being available). Distributions are expected to be payable on 15 June and 15 December of each year. Dividends are not payable on a preference share while it is stapled to a note. If distributions are not paid on UK Stapled Securities, the Group may not pay dividends or distributions, or return capital, on ANZ ordinary shares or any other share capital or security ranking equal or junior to the preference share component.
At any time in the Company’s discretion or upon the occurrence of certain other events, such as the commencement of proceedings for the winding up of the Company, the note component of the UK Stapled Security will be assigned to the Company and the holder will retain only the preference share component of the UK Stapled Security.
On 15 June 2012 (“conversion date”), or an earlier date under certain circumstances, UK Stapled Securities will mandatorily convert into a variable number of ordinary shares in the Company determined in accordance with the formula in the prospectus. The mandatory conversion to ordinary shares is however deferred for five years if the conversion tests set out in the prospectus are not met.
The preference shares forming part of the UK Stapled Securities rank equally with the preference shares issued in connection with US Trust Securities, ANZ CPS, ANZ CN and Euro Trust Securities. Except in limited circumstances, holders of UK Stapled Securities do not have any right to vote in general meetings of the Company.
As noted above, in a winding up of the Company, the note component of the UK Stapled Security will be assigned to the Company and the holder will retain only the preference share component of the UK Stapled Security. Accordingly, the rights of investors in UK Stapled Securities in a winding up of the Company are the rights conferred by the preference share component of UK Stapled Securities. These preference shares rank behind all depositors and creditors, but ahead of ordinary shareholders.
The UK Stapled Securities qualify as Non-innovative Tier 1 capital as defined by APRA.
Financial Report117
NOTES TO THE FINANCIAL STATEMENTS
27: Loan Capital (continued)
ANZ CONVERTIBLE PREFERENCE SHARES (ANZ CPS)
On 30 September 2008, the Company issued 10.8 million ANZ CPS at $100 each pursuant to a prospectus dated 4 September 2008 raising $1,081 million (excluding issue costs of $13 million: net raising of $1,068 million). ANZ CPS are fully-paid, preferred, non-cumulative mandatorily convertible preference shares. ANZ CPS are listed on the Australian Stock Exchange.
Distributions on ANZ CPS are non-cumulative and are payable quarterly in arrears on each 15 December, 15 March, 15 June, 15 September and will be franked in line with the franking applied to the ordinary shares. The distribution will be based on a floating distribution rate equal to the aggregate of the 90 day bank bill rate plus a 250 basis point margin, multiplied by one minus the Australian tax rate. At each quarter, the 90 day bank bill rate is reset for the next quarter. Should the distribution not be fully franked, the terms of the security provide for a cash gross up for the amount of the franking benefit not provided. Distributions are subject to the absolute discretion of the Board of Directors of the Company and certain payment tests (including APRA requirements and distributable profits being available). If distributions are not paid on ANZ CPS, the Group may not pay dividends or distributions, or return capital on ANZ ordinary shares or any other share capital or security ranking equal or junior to the ANZ CPS.
On 16 June 2014 (the ‘conversion date’), or an earlier date under certain circumstances, ANZ CPS will mandatorily convert into a variable number of ordinary shares in the Company determined in accordance with the formula in the prospectus based on $100 divided by the average market price of ordinary shares over a 20 day trading period ending at the conversion date less a 2.5% discount. The mandatory conversion to ordinary shares is however deferred for a quarter if the conversion tests set out in the prospectus are not met.
The ANZ CPS rank equally with the ANZ CNs and the preference shares issued in connection with US Trust Securities, UK Stapled Securities and Euro Trust Securities. Except in limited circumstances, holders of ANZ CPS do not have any right to vote in general meeting of the Company.
In a winding up of the Company, the ANZ CPS rank behind all depositors and creditors, but ahead of ordinary shareholders. ANZ CPS qualify as Non-innovative Residual Tier 1 capital as defined by APRA.
CONVERTIBLE NOTES
On 26 September 2008, the Company through its New York branch issued 1,200 Convertible Notes at an issue price of $500,000 each. The Convertible Notes were perpetual, subordinated and non-cumulative, pay floating rate interest payments and could convert into ANZ ordinary shares on 28 September 2009 or each following quarterly interest payment date, at the holders option, or earlier following the occurrence of certain events. ANZ redeemed the Convertible Notes on 28 September 2009.
118 ANZ Annual Report 2009
NOTES TO THE FINANCIAL STATEMENTS
28: Share Capital
| | | | | | | | |
| | | The Company | |
Numbers of issued shares | | 2009 | | | 2008 | |
Ordinary shares each fully paid | | | 2,504,540,925 | | | | 2,040,656,484 | |
Preference shares each fully paid | | | 500,000 | | | | 500,000 | |
| | | | | | | | |
Total number of issued shares | | | 2,505,040,925 | | | | 2,041,156,484 | |
| | | | | | | | |
ORDINARY SHARES
Ordinary shares have no par value and entitle holders to receive dividends payable to ordinary shareholders and to participate in the proceeds available to ordinary shareholders on winding up of the Company in proportion to the number of fully paid ordinary shares held.
On a show of hands every holder of fully paid ordinary shares present at a meeting in person or by proxy is entitled to one vote, and upon a poll one vote for each share held.
| | | | | | | | |
| | | The Company | |
Numbers of issued shares | | 2009 | | | 2008 | |
Balance at start of the year | | | 2,040,656,484 | | | | 1,864,678,820 | |
Bonus option plan1 | | | 3,928,449 | | | | 2,838,335 | |
Dividend Reinvestment Plan1 | | | 52,386,890 | | | | 42,546,446 | |
Dividend Reinvestment Plan underwriting | | | 75,000,000 | | | | 61,534,092 | |
ANZ employee share acquisition plan | | | 6,224,007 | | | | 2,975,312 | |
ANZ share option plan2 | | | 818,805 | | | | 4,115,132 | |
Conversion of StEPS | | | — | | | | 61,968,347 | |
Share placement and Share Purchase Plan5,6,7 | | | 325,526,290 | | | | — | |
| | | | | | | | |
Balance at end of year | | | 2,504,540,925 | | | | 2,040,656,484 | |
| | | | | | | | |
| | | | | | | | | | | | | | | | |
| | | Consolidated | | | The Company | |
| | | 2009 | | | 2008 | | | 2009 | | | 2008 | |
| | | $m | | | $m | | | $m | | | $m | |
Ordinary share capital | | | | | | | | | | | | | | | | |
Balance at start of the year | | | 12,589 | | | | 8,946 | | | | 12,589 | | | | 8,946 | |
Dividend Reinvestment Plan1 | | | 742 | | | | 1,019 | | | | 742 | | | | 1,019 | |
Dividend Reinvestment Plan underwriting | | | 1,046 | | | | 1,487 | | | | 1,046 | | | | 1,487 | |
ANZ employee share acquisition plan2 | | | 99 | | | | 80 | | | | 99 | | | | 80 | |
Treasury shares3,4 | | | — | | | | (10 | ) | | | — | | | | (10 | ) |
ANZ share option plan2 | | | 14 | | | | 67 | | | | 14 | | | | 67 | |
Conversion of StEPS | | | — | | | | 1,000 | | | | — | | | | 1,000 | |
Share placement and Share Purchase Plan5,6,7 | | | 4,661 | | | | — | | | | 4,661 | | | | — | |
| | | | | | | | | | | | | | | | |
Balance at end of year | | | 19,151 | | | | 12,589 | | | | 19,151 | | | | 12,589 | |
| | | | | | | | | | | | | | | | |
| 1 | Refer to note 7 for details of plan. |
| 2 | Refer to note 46 for details of plan. |
| 3 | On-market purchase of shares for settlement of amounts due under share-based compensation plans. In addition, 5,948,457 shares were issued during the September 2009 year to the Group’s Employee Share Trust for settlement of amounts due under share-based compensation plans (2008: 2,356,857). |
| 4 | As at 30 September 2009, there were 7,721,314 Treasury shares outstanding (2008: 4,374,248). |
| 5 | On 3 June 2009, shares were issued under a placement to institutions and sophisticated and professional investors. The share placement was made at a fully underwritten offer price of $14.40 per share. The placement was underwritten by Deutsche Bank AG, Sydney Branch, J.P Morgan Australia Limited and UBS AG, Australia Branch. |
| 6 | On 13 July 2009 shares were issued to eligible shareholders in accordance with the terms and conditions of the Share Purchase Plan released to the ASX on 10 June 2009. The shares were issued at a price of $14.40 per share. |
| 7 | Includes capital raising costs of $25 million. |
Financial Report119
NOTES TO THE FINANCIAL STATEMENTS
28: Share Capital (continued)
PREFERENCE SHARES
Euro Trust Securities
On 13 December 2004, the Company issued 500,000 Euro Floating Rate Non-cumulative Trust Securities (“Euro Trust Securities”) at €1,000 each pursuant to the offering circular dated 9 December 2004, raising $871 million (at the spot rate at the date of issue, net of issue costs). Euro Trust Securities comprise two fully paid securities – an interest paying unsecured note (issued by ANZ Jackson Funding PLC, a United Kingdom subsidiary of the Company) and a fully paid, €1,000 preference share (issued by the Company), which are stapled together and issued as a Euro Trust Security by ANZ Capital Trust III (the Trust). Investors have the option to redeem the Euro Trust Security from the Trust and hold the underlying stapled security.
Distributions on Euro Trust Securities are non-cumulative and are payable quarterly in arrears and are funded by payments received by the Trust on the underlying note and/or preference share. The distribution is based upon a floating distribution rate equal to the 3 month EURIBOR rate plus a 66 basis point margin up until 15 December 2014, after which date the distribution rate is the 3 month EURIBOR rate plus a 166 basis point margin. At each payment date the 3 month EURIBOR rate is reset for the next quarter. Distributions are subject to certain payment tests (i.e. APRA requirements and distributable profits being available). Distributions are expected to be payable on 15 March, 15 June, 15 September and 15 December of each year. Dividends are not payable on the preference shares while they are stapled to the note, except for the period after 15 December 2014 when the preference share will pay 100 basis points to fund the increase in the margin. If distributions are not paid on Euro Trust Securities, the Group may not pay dividends or distributions, or return capital on ANZ ordinary shares or any other share capital or security ranking equal or junior to the preference share component.
At any time at ANZ’s discretion or upon the occurrence of certain other “conversion events”, such as the failure of the Trust to pay in full a distribution within seven business days of the relevant distribution payment date or the business day prior to 15 December 2053, the notes that are represented by the relevant Euro Trust Securities will be automatically assigned to a Branch of the Company and the fixed number of preference shares that are represented by the relevant Euro Trust Securities will be distributed to investors in redemption of such Euro Trust Securities. The distributed preference shares will immediately become dividend paying and holders will receive non-cumulative dividends equivalent to the scheduled payments in respect of the Euro Trust Securities for which the preference shares were distributed.
The preference shares forming part of each Euro Trust Security rank equal to the ANZ Convertible Preference Shares (ANZ CPS) and the preference shares issued in connection with the US Trust Securities and UK Stapled Securities in all respects. Except in limited circumstances, holders of Euro Trust Securities do not have any right to vote in general meetings of the Company.
On winding up of the Company, the rights of Euro Trust Security holders will be determined by the preference share component of the Euro Trust Security. These preference shares rank behind all depositors and creditors, but ahead of ordinary shareholders. The transaction costs arising on the issue of these instruments were recognised directly in equity as a reduction to the proceeds of the equity instruments to which the costs relate.
Euro Trust Securities qualify as Innovative Tier 1 Capital as defined by APRA.
| | | | | | | | | | | | | | | | |
| | | Consolidated | | | The Company | |
| | | 2009 | | | 2008 | | | 2009 | | | 2008 | |
| | | $m | | | $m | | | $m | | | $m | |
Preference share balance at start of year – Euro Trust Securities | | | 871 | | | | 871 | | | | 871 | | | | 871 | |
| | | | | | | | | | | | | | | | |
Preference share balance at end of year – Euro Trust Securities | | | 871 | | | | 871 | | | | 871 | | | | 871 | |
| | | | | | | | | | | | | | | | |
120 ANZ Annual Report 2009
NOTES TO THE FINANCIAL STATEMENTS
29: Reserves and Retained Earnings
| | | | | | | | | | | | | | | | |
| | | Consolidated | | | The Company | |
| | | 2009 | | | 2008 | | | 2009 | | | 2008 | |
| | | $m | | | $m | | | $m | | | $m | |
a) Foreign currency translation reserve | | | | | | | | | | | | | | | | |
Balance at beginning of the year | | | (816 | ) | | | (1,209 | ) | | | (153 | ) | | | (407 | ) |
Currency translation adjustments, net of hedges after tax | | | (909 | ) | | | 393 | | | | (283 | ) | | | 254 | |
| | | | | | | | | | | | | | | | |
Total foreign currency translation reserve | | | (1,725 | ) | | | (816 | ) | | | (436 | ) | | | (153 | ) |
| | | | | | | | | | | | | | | | |
b) Share option reserve1 | | | | | | | | | | | | | | | | |
Balance at beginning of the year | | | 83 | | | | 70 | | | | 83 | | | | 70 | |
Share-based payments | | | 9 | | | | 14 | | | | 9 | | | | 14 | |
Transfer of options lapsed to retained earnings2 | | | (23 | ) | | | (1 | ) | | | (23 | ) | | | (1 | ) |
| | | | | | | | | | | | | | | | |
Total share option translation reserve | | | 69 | | | | 83 | | | | 69 | | | | 83 | |
| | | | | | | | | | | | | | | | |
c) Available-for-sale revaluation reserve | | | | | | | | | | | | | | | | |
Balance at beginning of the year | | | (88 | ) | | | 97 | | | | (56 | ) | | | 93 | |
Valuation gain/(loss) recognised after tax | | | 29 | | | | (305 | ) | | | 20 | | | | (272 | ) |
Cumulative (gain)/loss transferred to the income statement | | | 18 | | | | 60 | | | | 18 | | | | 63 | |
Transfer on step acquisition of associate | | | — | | | | 60 | | | | — | | | | 60 | |
| | | | | | | | | | | | | | | | |
Total available-for-sale revaluation reserve | | | (41 | ) | | | (88 | ) | | | (18 | ) | | | (56 | ) |
| | | | | | | | | | | | | | | | |
d) Hedging reserve | | | | | | | | | | | | | | | | |
Balance at beginning of the year | | | 79 | | | | 153 | | | | 51 | | | | 80 | |
Gains/(loss) recognised after tax | | | (106 | ) | | | (39 | ) | | | (97 | ) | | | (34 | ) |
Transfer (to)/from income statement | | | (63 | ) | | | (35 | ) | | | (63 | ) | | | 5 | |
| | | | | | | | | | | | | | | | |
Total hedging reserve | | | (90 | ) | | | 79 | | | | (109 | ) | | | 51 | |
| | | | | | | | | | | | | | | | |
Total reserves | | | (1,787 | ) | | | (742 | ) | | | (494 | ) | | | (75 | ) |
| | | | | | | | | | | | | | | | |
| 1 | Further information about share based payments to employees is disclosed in note 46 to the financial statements. |
| 2 | The transfer of balances from the share option and capital reserves to retained earnings represent items of a distributable nature. |
| | | | | | | | | | | | | | | | |
| | | Consolidated | | | The Company | |
| | | 2009 | | | 2008 | | | 2009 | | | 2008 | |
| | | $m | | | $m | | | $m | | | $m | |
Retained earnings | | | | | | | | | | | | | | | | |
Balance at beginning of the year | | | 13,772 | | | | 13,082 | | | | 10,207 | | | | 9,436 | |
Profit attributable to shareholders of the Company | | | 2,943 | | | | 3,319 | | | | 2,285 | | | | 3,336 | |
Adjustment on step acquisition of associate | | | — | | | | 1 | | | | — | | | | — | |
Transfer of options lapsed from share option reserve1,2 | | | 23 | | | | 1 | | | | 23 | | | | 1 | |
Acturial gain/(loss) on defined benefit plans after tax3 | | | (124 | ) | | | (79 | ) | | | (113 | ) | | | (60 | ) |
Ordinary share dividend paid | | | (2,452 | ) | | | (2,506 | ) | | | (2,452 | ) | | | (2,506 | ) |
Preference share dividend paid | | | (33 | ) | | | (46 | ) | | | — | | | | — | |
| | | | | | | | | | | | | | | | |
Retained earnings at end of year | | | 14,129 | | | | 13,772 | | | | 9,950 | | | | 10,207 | |
| | | | | | | | | | | | | | | | |
Total reserves and retained earnings | | | 12,342 | | | | 13,030 | | | | 9,456 | | | | 10,132 | |
| | | | | | | | | | | | | | | | |
| 1 | Further information about share based payments to employees is disclosed in note 46 to the financial statements. |
| 2 | The transfer of balances from the share option, general and capital reserves to retained earnings represent items of a distributable nature. |
| 3 | ANZ has taken the option available under AASB 119 to recognise actuarial gains/losses on defined benefit superannuation plans directly in retained profits (refer note 1F(vi) and note 45). |
Financial Report121
NOTES TO THE FINANCIAL STATEMENTS
29: Reserves and Retained Earnings (continued)
a) Foreign currency translation reserve
The translation reserve comprises exchange differences, net of hedges, arising on translation of the financial statements of foreign operations, as described in note 1A(viii). When a foreign operation is sold, attributable exchange differences are recognised in the Income Statement.
b) Share option reserve
The share option reserve arises on the grant of share options to selected employees under the ANZ share option plan. Amounts are transferred out of the reserve and into share capital when the options are exercised. Refer to note 1C(iii).
c) Available-for-sale revaluation reserve
Changes in the fair value and exchange differences on the revaluation of available-for-sale financial assets are taken to the available-for-sale revaluation reserve. Where a revalued available-for-sale financial asset is sold, that portion of the reserve which relates to that financial asset, is realised and recognised in the Income Statement. Where the available-for-sale financial asset is impaired, that portion of the reserve which relates to that asset is recognised in the Income Statement. Refer to note 1E(iii).
d) Hedging reserve
The hedging reserve represents hedging gains and losses recognised on the effective portion of cash flow hedges. The cumulative deferred gain or loss on the hedge is recognised in the Income Statement when the hedged transaction impacts the Income Statement. Refer to note 1E(ii).
30: Minority Interests
| | | | | | | | |
| | | Consolidated | |
| | | 2009 | | | 2008 | |
| | | $m | | | $m | |
Share capital | | | 39 | | | | 29 | |
Retained profit | | | 26 | | | | 33 | |
| | | | | | | | |
Total Minority Interests | | | 65 | | | | 62 | |
| | | | | | | | |
31: Capital Management
ANZ pursues an active approach to capital management, which is designed to protect the interests of depositors, creditors and shareholders. This involves the on-going review and Board approval of the level and composition of the Group’s capital base, assessed against the following key policy objectives:
| • | | Regulatory compliance such that capital levels exceed the Australian Prudential Regulation Authority’s (APRA), ANZ’s primary prudential supervisor, minimum prudential capital ratios (PCRs) both at Level 1 (the Company and specified subsidiaries) and Level 2 (ANZ consolidated under Australian prudential standards); |
| • | | Capital levels are aligned with the risks in the business and to meet strategic and business development plans through ensuring that available capital (i.e. shareholders’ equity including preference shares and Tier 1 loan capital) exceeds the level of Economic Capital required to support the Ratings Agency ‘default frequency’ confidence level for a “AA” credit rating category bank. Economic Capital is an internal estimate of capital levels required to support risk and unexpected losses above a desired target solvency level; |
| • | | Capital levels are commensurate with ANZ maintaining its preferred “AA” credit rating category for senior long term unsecured debt given its risk appetite outlined in its strategic plan. ANZ’s risk appetite is the level of risk ANZ is prepared to accept in order to achieve its strategic objectives, expressed quantitatively in terms of limits and tolerances that provides a scale against which management can review ANZ’s risk profile, and as set by the Board and directs Regions in the execution of their strategic objectives; and |
| • | | An appropriate balance between maximising shareholder returns and prudent capital management principles. |
The Group achieves these objectives through an Internal Capital Adequacy Assessment Process (ICAAP) whereby the Group conducts detailed strategic and capital planning over a medium term time horizon.
Annually, ANZ conducts a detailed strategic planning process over a three year time horizon, the outcomes of which are embodied in the Strategic Plan. This process involves forecasting key economic variables which regions use to determine key financial data for their existing business. New strategic initiatives to be undertaken over the planning period and their financial impact are then determined. These processes are used for the following:
| • | | Review capital ratios, targets, and levels of different classes of capital against the Group’s risk profile and risk appetite outlined in the Strategic Plan. The Group’s capital targets reflect the key policy objectives above, and the desire to ensure that under specific stressed economic scenarios that capital levels are sufficient to remain above both Economic Capital and PCR requirements. |
| • | | Stress tests are performed under different economic conditions to ensure a comprehensive review of the Group’s capital position both before and after mitigating actions. The stress tests determine the level of additional capital (i.e. the ‘capital buffer’ above Pillar 1 minimum capital) needed to absorb losses that may be experienced during an economic downturn. |
| • | | Stress testing is integral to strengthening the predictive approach to risk management and is a key component in managing risks, asset writing strategies and business strategies. It creates greater understanding of the impacts on financial performance through modelling relationships and sensitivities between geographic, industry and business unit exposures under a range of macro economic scenarios. ANZ has a dedicated stress testing team within Risk Management that models and reports to management and the ANZ Board’s Risk Committee on a range of scenarios and stress tests. |
122ANZ Annual Report 2009
NOTES TO THE FINANCIAL STATEMENTS
31: Capital Management (continued)
Results are subsequently used to:
| • | | recalibrate the Group’s management targets for minimum and operating ranges for its respective classes of capital such that the Group will remain compliant with APRA’s PCRs; and |
| • | | identify the level of organic capital generation and hence determine current and future capital requirements for the Company (Level 1) and the Group (Level 2). |
From these processes, a Capital Plan is developed and approved by the Board which identifies the capital issuance and maturity profile, options around capital products, timing, markets and strategies under differing market and economic conditions.
The Capital Plan is maintained and updated through a monthly review of forecast financial performance, economic conditions and development of business initiatives and strategies. The Board and senior management are provided with monthly updates of the Group’s capital position. Any actions required to ensure ongoing prudent capital management are submitted to the Board for approval.
Regulatory environment
The Group’s regulatory capital calculation is governed by APRA’s Prudential Standards which adopt a risk-based capital assessment framework based on the Basel II capital measurement standards. This risk-based approach requires eligible capital to be divided by total risk weighted assets (RWAs), with the resultant ratio being used as a measure of a bank’s capital adequacy. APRA determines PCRs for Tier 1 and Total Capital, with capital as the numerator and RWAs as the denominator.
To ensure that ADIs are adequately capitalised on both a stand-alone and group basis, APRA adopts a tiered approach to the measurement of an ADI’s capital adequacy by assessing the ADIs financial strength at three levels:
| • | | Level 1 – the ADI on a stand-alone basis (i.e. the Company and approved subsidiaries which are consolidated to form the ADIs’ Extended Licensed Entity); |
| • | | Level 2 – the consolidated banking group (i.e. the consolidated financial group less certain subsidiaries and associates excluded under the prudential standards); and |
| • | | Level 3 – the conglomerate group at the widest level. |
ANZ is a Level 1 and Level 2 reporter and measures capital adequacy monthly on a Level 1 and Level 2 basis, and is not required to report on a Level 3 basis.
Regulatory capital is divided into Tier 1, carrying the highest capital elements, and Tier 2, which has lower capital elements, but still adds to the overall strength of the ADI.
Tier 1 capital is comprised of ‘Fundamental’ capital, ‘Residual’ capital, and Tier 1 deductions. Fundamental capital comprises shareholder’s equity adjusted for items which APRA does not allow as regulatory capital or classifies as lower forms of regulatory capital. Fundamental capital includes the following significant adjustments:
| • | | Reserves exclude the hedging reserve and available-for-sale revaluation reserve, and reserves of insurance and funds management subsidiaries and associates; |
| • | | Retained earnings excludes retained earnings of insurance and funds management subsidiaries and associates and includes capitalised deferred fees forming part of loan yields that meet the criteria set out in the prudential standard; and |
| • | | Current year net of tax earnings is net of any interim and special dividends paid during the current year and the expected final dividend payment, net of the expected dividend reinvestment under the Dividend Reinvestment Plan and Bonus Option Plan, and excludes profits of insurance and funds management subsidiaries and associates. |
Residual capital covers non-innovative and innovative hybrid Tier 1 instruments with limits restricting the volume that can be counted as Tier 1 capital.
Tier 1 deductions include amounts deducted solely from Tier 1, mainly intangible assets i.e. goodwill and capitalised software, capitalised brokerage and borrowing expenses and net deferred tax assets, and deductions taken 50% from Tier 1 and 50% from Tier 2, which mainly includes the tangible component of investment in other subsidiaries and associates regulated by APRA, or their overseas equivalent, and the amount of Expected Losses (EL) in excess of Eligible Provisions for Loan Losses (net of tax).
Tier 2 capital is comprised of Upper and Lower Tier 2 capital less capital deductions taken 50% from Tier 2 capital. Upper Tier 2 capital mainly comprises perpetual subordinated debt instruments, whilst Lower Tier 2 includes dated subordinated debt instruments which have a minimum term of five years.
Total Capital is the sum of Tier 1 capital and Tier 2 capital.
In addition to the prudential capital oversight that APRA conducts over the Company and the Group, the Company’s branch operations and major banking subsidiary operations are overseen by local regulators such as the Reserve Bank of New Zealand, the US Federal Reserve and the UK Financial Services Authority who may impose minimum capitalization rates on those operations.
Throughout the financial year, the Company and the Group maintained compliance with the minimum Tier 1 and Total Capital ratios set by APRA and the US Federal Reserve as well as applicable capitalization rates set by regulators in countries where the Company operates branches and subsidiaries.
Financial Report 123
NOTES TO THE FINANCIAL STATEMENTS
31: Capital Management (continued)
The table below provides the composition of capital used for regulatory purposes and capital adequacy ratios.
| | | | | | | | |
| | | 2009
$m | | | 2008
$m | |
Regulatory Capital – Qualifying Capital | | | | | | | | |
Tier 1 | | | | | | | | |
Shareholders’ equity and minority interests | | | 32,429 | | | | 26,552 | |
Prudential adjustments to shareholders’ equity | | | (2,341 | ) | | | (2,409 | ) |
| | | | | | | | |
Fundamental Tier 1 capital | | | 30,088 | | | | 24,143 | |
Non-innovative Tier 1 capital instruments | | | 1,901 | | | | 2,095 | |
Innovative Tier 1 capital instruments | | | 2,122 | | | | 2,847 | |
| | | | | | | | |
Gross Tier 1 capital | | | 34,111 | | | | 29,085 | |
| | | | | | | | |
Deductions1 | | | (7,492 | ) | | | (7,856 | ) |
| | | | | | | | |
Tier 1 capital | | | 26,619 | | | | 21,229 | |
| | | | | | | | |
Tier 2 | | | | | | | | |
Upper Tier 2 capital | | | 1,390 | | | | 1,374 | |
Subordinated notes2 | | | 9,082 | | | | 9,170 | |
Deductions | | | (2,661 | ) | | | (1,206 | ) |
| | | | | | | | |
Tier 2 capital | | | 7,811 | | | | 9,338 | |
| | | | | | | | |
Total qualifying capital | | | 34,430 | | | | 30,567 | |
| | | | | | | | |
Capital adequacy ratios | | | | | | | | |
Tier 1 | | | 10.6 | % | | | 7.7 | % |
Tier 2 | | | 3.1 | % | | | 3.4 | % |
| | | | | | | | |
Total | | | 13.7 | % | | | 11.1 | % |
| | | | | | | | |
| 1 | Includes goodwill (excluding associates) of $2,999 million (2008: $3,064 million). |
| 2 | For capital adequacy calculation, subordinated note issues are reduced by 20% of the original amount over the last four years to maturity and are limited to 50% of Tier 1 capital. |
124ANZ Annual Report 2009
NOTES TO THE FINANCIAL STATEMENTS
32: Assets Charged as Security for Liabilities and Collateral Accepted as Security for Assets
Assets charged as security for liabilities
The following assets are pledged as collateral:
| • | | Mandatory reserve deposits with local central banks in accordance with statutory requirements. These deposits are not available to finance the Group’s day to day operations. |
| • | | Securities provided as collateral for liabilities in standard lending and stock borrowing and lending activities. These transactions are conducted under terms that are customary to standard lending, and stock borrowing and lending activities. |
| • | | Debenture undertakings covering the assets of Esanda Finance Corporation Limited (Esanda) and its subsidiaries and UDC Finance Limited (UDC). The debenture stock of Esanda and its subsidiaries and UDC is secured by a trust deed and collateral debentures, giving floating charges upon the undertaking of all the tangible assets of the entity, other than land and buildings. All controlled entities of Esanda and UDC have guaranteed the payment of principal, interest and other monies in relation to all debenture stock and unsecured notes issued by Esanda and UDC respectively. The only loans pledged are those in UDC and its subsidiaries. |
| • | | Cash placed on deposit with a third party that is provided as collateral for a liability in a structured funding transaction. The funding was raised through a subsidiary, and to achieve more favourable pricing terms, ANZ provided cash collateral, given by the Company. |
| • | | Collateral provided to central banks. |
The carrying amounts of assets pledged as security are as follows:
| | | | | | | | | | | | | | | | | | | | | | | | | | | | | | | | |
| | | Consolidated | | | The Company | |
| | | Carrying Amount | | | Related Liability | | | Carrying Amount | | | Related Liability | |
| | | 2009
$m | | | 2008
$m | | | 2009
$m | | | 2008
$m | | | 2009
$m | | | 2008
$m | | | 2009
$m | | | 2008
$m | |
Regulatory deposits | | | 509 | | | | 469 | | | | n/a | | | | n/a | | | | 330 | | | | 298 | | | | n/a | | | | n/a | |
Securities sold under arrangements to repurchase | | | 3,586 | | | | 1,696 | | | | 3,586 | | | | 1,654 | | | | 1,974 | | | | 1,615 | | | | 1,974 | | | | 1,573 | |
Assets pledged as collateral under debenture undertakings | | | 4,665 | | | | 15,566 | | | | 3,398 | | | | 9,902 | | | | — | | | | — | | | | — | | | | — | |
Cash deposited in structured funding transaction | | | 1,080 | | | | 918 | | | | 2,006 | | | | 2,000 | | | | 1,080 | | | | 918 | | | | — | | | | — | |
Other | | | 97 | | | | — | | | | — | | | | — | | | | 97 | | | | — | | | | — | | | | — | |
Collateral accepted as security for assets
ANZ has accepted cash as collateral on securities loaned to other parties.
ANZ has received securities that it is permitted to sell or re-pledge without the event of default by a counterparty. Where the received securities are sold or re-pledged to third parties, ANZ is obliged to return equivalent securities.
These transactions are conducted under terms that are customary to standard stock borrowing and lending activities.
The fair value of collateral received and provided is as follows:
| | | | | | | | | | | | | | | | |
| | | Consolidated | | | The Company | |
| | | 2009 | | | 2008 | | | 2009 | | | 2008 | |
| | | $m | | | $m | | | $m | | | $m | |
Securities lending activities1 | | | | | | | | | | | | | | | | |
Cash collateral received on securities loaned | | | 746 | | | | 2,096 | | | | 746 | | | | 2,096 | |
Fair value of lent securities | | | 740 | | | | 2,093 | | | | 740 | | | | 2,093 | |
Equity financing activities1 | | | | | | | | | | | | | | | | |
Cash collateral received on securities borrowed | | | — | | | | 94 | | | | — | | | | 94 | |
Fair value of received securities | | | — | | | | 98 | | | | — | | | | 98 | |
| 1 | Additionally, ANZ has entered transactions involving the exchange of securities (scrip-for-scrip). The Group and the Company accepted stock to the value of $nil (2008: $105 million) against stock provided to counterparties to the value of $nil (2008: $86 million). |
Financial Report 125
NOTES TO THE FINANCIAL STATEMENTS
33: Financial Risk Management
STRATEGY IN USING FINANCIAL INSTRUMENTS
Financial instruments are fundamental to the Group’s business, constituting the core element of its operations. Accordingly, the risks associated with financial instruments are a significant component of the risks faced by the Group. Financial instruments create, modify or reduce the credit, market (including traded or fair value risks and non-traded or interest and foreign currency related risks) and liquidity risks of the Group’s balance sheet. These risks and the Group’s policies and objectives for managing such risks are outlined below. The Group’s overall risk management programme focuses on the unpredictability of financial markets and seeks to minimise potential adverse effects on the financial performance of the Group.
CREDIT RISK
Credit risk is the risk of financial loss from counterparties being unable to fulfil their contractual obligations. The Group assumes credit risk in a wide range of lending and other activities in diverse markets and in many jurisdictions. The credit risks arise not only from traditional lending to customers, but also from inter-bank, treasury, international trade and capital market activities around the world.
The Group has an overall lending objective of sound growth for appropriate returns. The credit risk objectives of the Group are set by the Board and are implemented and monitored within a tiered structure of delegated authority, designed to oversee multiple facets of credit risk, including asset writing strategies, credit policies/controls, single exposures, portfolio monitoring and risk concentrations.
The credit risk management framework exists to provide a structured and disciplined process to support those objectives. The integrity of the credit risk function is maintained by the independence of the credit chain and is supported by comprehensive risk analysis, risk tools, monitoring processes and policies.
CREDIT RISK MANAGEMENT
The credit risk management framework ensures a consistent approach is applied across the Group in managing, maintaining and monitoring the credit risk appetite set by the Board. In discharging its duty to oversee credit risk, the Board is assisted and advised by the Board Risk Committee, which oversees the effectiveness of the operational credit controls and processes.
The Board Risk Committee sets or recommends high level changes to credit risk appetite, credit strategies, credit principles and credit controls, as well as approving credit transactions beyond the discretion of executive management.
Responsibility for the day-to-day operational execution and management of the credit risk framework resides with the Credit and Market Risk Committee (CMRC), which is an executive management committee comprising senior risk, business and group executives, chaired by the Chief Risk Officer. CMRC receives a delegated discretion from the Board Risk Committee to set credit policies, review divisional credit risk appetite and make credit decisions within set limits. CMRC also further delegates credit responsibility to the broader organization, based on a combination of factors, including size of risk, level of risk, nature of counterparty, collateral support, risk concentration limits, location of risk and expertise of specific credit points.
Experienced and specialised risk professionals manage the credit risk framework. Skills vary greatly depending on the nature of the credit risk being managed and range widely from statistical modelling expertise required to build, validate and monitor retail decision tools; to making single judgmental credit decisions in specialist Institutional segments that require expert knowledge of not only the specific industry, but also an understanding of the risks inherent in complex financial instruments and structures in a time of volatile and uncertain financial markets.
The central risk function is broadly charged with the responsibility of monitoring and assessing both counterparty and portfolio risks. Credit risk operates in close partnership with credit originators, but reports independently to the risk management function, which in turn reports directly to the CEO. Although credit risk is an independent function, responsibility for risk is firmly a shared responsibility of both the risk and relationship functions.
COUNTRY RISK MANAGEMENT
Some customer credit risks involve country risk whereby actions or events at a national or international level could disrupt servicing of commitments. Country risk arises when payment or discharge of an obligation will, or could, involve the flow of funds from one country to another or involve transactions in a currency other than the domestic currency of the relevant country.
Country ratings are assigned to each country where ANZ incurs country risk and have a direct bearing on ANZ’s risk appetite for each country. The country rating is determined through a defined methodology based around external ratings agencies’ ratings and internal specialist opinion. It is also a key risk consideration in ANZ’s capital pricing model for cross border flows.
The recording of country limits provides the Group with a means to identify and control country risk. Country limits ensure that there is a country-by-country ceiling on exposures that involve country risk. They are recorded by time to maturity and purpose of exposure e.g. trade, markets, project finance.
Country limits are managed centrally for the Group, through a global country risk exposure management system managed by a specialist unit within Institutional Risk.
126 ANZ Annual Report 2009
NOTES TO THE FINANCIAL STATEMENTS
33: Financial Risk Management (continued)
PORTFOLIO STRESS TESTING
Stress testing is integral to strengthening the predictive approach to risk management and is a key component in managing risk appetite, asset writing strategies and business strategies. It creates greater understanding of impacts on financial performance through modelling relationships and sensitivities between geographic, industry and business unit exposures under a range of macro economic scenarios.
ANZ has a dedicated stress testing team within Risk Management that models and reports periodically to management and the Board Risk Committee on a range of scenarios and stress tests.
PORTFOLIO ANALYSIS AND REPORTING
Credit portfolios are actively monitored at each layer of the risk structure to ensure credit deterioration is quickly detected and mitigated through the implementation of remediation strategies. All businesses incurring credit risk undertake regular and comprehensive analysis of their credit portfolios. Issue identification and adherence to performance benchmarks are reported to risk and business executives through a series of reporting processes, which include a monthly ‘asset quality’ reporting function closely supported and overseen by the Group Risk function. This ensures an efficient and independent conduit exists to quickly identify and communicate emerging credit issues to Group executives and the Board.
COLLATERAL MANAGEMENT
ANZ credit principles specify to only lend when the counterparty has the capacity and ability to repay and the Group sets limits on the acceptable level of credit risk. Acceptance of credit risk is firstly based on the counterparty’s assessed capacity to meet contractual obligations, (i.e. interest and capital repayments). Obtaining collateral is only used to mitigate credit risk. Procedures are designed to ensure collateral is managed, legally enforceable, conservatively valued and adequately insured where appropriate. ANZ policy sets out the types of acceptable collateral, including:
| • | | mortgages over property; |
| • | | charges over business assets, e.g. premises, stock and debtors; |
| • | | charges over financial instruments, e.g. debt securities and equities in support of trading facilities; and |
In the event of customer default, any loan security is usually held as mortgagee in possession while the Group is actively seeking to realise it. Therefore the Group does not usually hold any real estate or other assets acquired through the enforcement of security.
ANZ uses International Swaps and Derivatives Association (ISDA) Master Agreements to document derivatives activities. Under the ISDA Master Agreement, if a default of counterparty occurs, all contracts with the counterparty are terminated. They are then settled on a net basis at market levels current at the time of default.
In addition to the terms noted above, ANZ’s preferred practice is to use a CSA (Credit Support Annex to the ISDA Master Agreement). Under a CSA, open derivative positions with the counterparty are aggregated and cash collateral is exchanged daily. The collateral is provided by the counterparty that is out of the money. Upon termination of the trade, payment is required only for the final daily mark-to-market movement rather than the mark-to-market movement since inception.
CONCENTRATIONS OF CREDIT RISK
Concentrations of credit risk arise when a number of customers are engaged in similar business activities or activities within the same geographic region, or when they have similar risk characteristics that would cause their ability to meet contractual obligations to be similarly affected by changes in economic or other conditions.
The Group monitors its portfolios, to identify and assess risk concentrations. The Group’s strategy is to maintain well-diversified low risk credit portfolios focused on achieving the best risk-return balance. Credit risk portfolios are actively monitored and frequently reviewed to identify, assess and guard against unacceptable risk concentrations. Concentration analysis will typically include, geography, industry, credit product and risk grade. Risk management also applies single customer counterparty limits (SCCLs) to protect against unacceptably large exposures to single name risk. These limits are established based on a combination of factors including nature of counterparty, probability of default and collateral provided. Analysis and reporting of concentration risk is a core focus of Divisional & Group risk functions and where appropriate the Group applies ‘concentration’ controls.
Financial Report127
NOTES TO THE FINANCIAL STATEMENTS
33: Financial Risk Management (continued)
Concentrations of credit risk analysis
Composition of financial instruments that give rise to credit risk by industry:
| | | | | | | | | | | | | | | | | | | | | | | | | | | | | | | | | | | | | | | | | | | | | | | | | | | | | | | | |
| | | Liquid assets and due
from other financial
institutions | | | Trading and AFS1assets | | | Derivatives | | | Loans and advances and
acceptances | | | Other financial assets2 | | | Credit related
commitments3 | | | Total | |
Consolidated | | 2009
$m | | | 2008
$m | | | 2009
$m | | | 2008
$m | | | 2009
$m | | | 2008
$m | | | 2009
$m | | | 2008
$m | | | 2009
$m | | | 2008
$m | | | 2009
$m | | | 2008
$m | | | 2009
$m | | | 2008
$m | |
Australia | | | | | | | | | | | | | | | | | | | | | | | | | | | | | | | | | | | | | | | | | | | | | | | | | | | | | | | | |
Agriculture, forestry fishing and mining | | | 25 | | | | 23 | | | | 184 | | | | 57 | | | | 115 | | | | 411 | | | | 10,099 | | | | 10,216 | | | | 85 | | | | 210 | | | | 6,557 | | | | 6,357 | | | | 17,065 | | | | 17,274 | |
Business Services | | | 22 | | | | 17 | | | | 14 | | | | — | | | | 51 | | | | 31 | | | | 5,507 | | | | 5,908 | | | | 46 | | | | 131 | | | | 3,181 | | | | 2,333 | | | | 8,821 | | | | 8,420 | |
Construction | | | — | | | | 2 | | | | 9 | | | | — | | | | 21 | | | | 20 | | | | 4,519 | | | | 4,560 | | | | 38 | | | | 102 | | | | 3,625 | | | | 3,446 | | | | 8,212 | | | | 8,130 | |
Entertainment, Leisure and Tourism | | | — | | | | — | | | | 182 | | | | 2 | | | | 246 | | | | 202 | | | | 5,395 | | | | 6,449 | | | | 46 | | | | 144 | | | | 2,684 | | | | 1,827 | | | | 8,553 | | | | 8,624 | |
Financial, Investment and Insurance | | | 1,805 | | | | 4,305 | | | | 18,967 | | | | 16,204 | | | | 25,413 | | | | 26,256 | | | | 8,694 | | | | 12,595 | | | | 73 | | | | 170 | | | | 4,484 | | | | 9,610 | | | | 59,436 | | | | 69,140 | |
Government and Official Institutions | | | 4,691 | | | | 3,508 | | | | 10,054 | | | | 5,341 | | | | 124 | | | | 69 | | | | 142 | | | | 95 | | | | 1 | | | | 2 | | | | 279 | | | | 492 | | | | 15,291 | | | | 9,507 | |
Manufacturing | | | 73 | | | | 139 | | | | 434 | | | | 144 | | | | 437 | | | | 316 | | | | 8,401 | | | | 9,321 | | | | 71 | | | | 206 | | | | 7,559 | | | | 8,021 | | | | 16,975 | | | | 18,147 | |
Personal Lending | | | — | | | | — | | | | — | | | | — | | | | — | | | | — | | | | 158,750 | | | | 147,067 | | | | 1,339 | | | | 1,054 | | | | 31,565 | | | | 28,046 | | | | 191,654 | | | | 176,167 | |
Property Services | | | 1 | | | | 3 | | | | 68 | | | | 25 | | | | 593 | | | | 391 | | | | 22,454 | | | | 25,103 | | | | 189 | | | | 540 | | | | 7,182 | | | | 6,678 | | | | 30,487 | | | | 32,740 | |
Retail Trade | | | 18 | | | | 38 | | | | 180 | | | | 129 | | | | 156 | | | | 51 | | | | 8,633 | | | | 9,492 | | | | 73 | | | | 212 | | | | 3,656 | | | | 2,697 | | | | 12,716 | | | | 12,619 | |
Transport and Storage | | | 8 | | | | 9 | | | | 133 | | | | 18 | | | | 302 | | | | 160 | | | | 4,525 | | | | 6,346 | | | | 38 | | | | 102 | | | | 2,367 | | | | 2,419 | | | | 7,373 | | | | 9,054 | |
Wholesale trade | | | 149 | | | | 537 | | | | — | | | | 20 | | | | 323 | | | | 237 | | | | 5,935 | | | | 6,625 | | | | 50 | | | | 143 | | | | 5,696 | | | | 5,565 | | | | 12,153 | | | | 13,127 | |
Other | | | 36 | | | | 597 | | | | 3,288 | | | | 1,595 | | | | 650 | | | | 735 | | | | 8,796 | | | | 7,135 | | | | 75 | | | | 188 | | | | 6,092 | | | | 7,589 | | | | 18,937 | | | | 17,839 | |
| | | | | | | | | | | | | | | | | | | | | | | | | | | | | | | | | | | | | | | | | | | | | | | | | | | | | | | | |
| | | 6,828 | | | | 9,178 | | | | 33,513 | | | | 23,535 | | | | 28,431 | | | | 28,879 | | | | 251,850 | | | | 250,912 | | | | 2,124 | | | | 3,204 | | | | 84,927 | | | | 85,080 | | | | 407,673 | | | | 400,788 | |
| | | | | | | | | | | | | | | | | | | | | | | | | | | | | | | | | | | | | | | | | | | | | | | | | | | | | | | | |
New Zealand | | | | | | | | | | | | | | | | | | | | | | | | | | | | | | | | | | | | | | | | | | | | | | | | | | | | | | | | |
Agriculture, forestry fishing and mining | | | 38 | | | | 86 | | | | — | | | | — | | | | 71 | | | | 62 | | | | 16,835 | | | | 15,087 | | | | 185 | | | | 118 | | | | 1,195 | | | | 3,710 | | | | 18,324 | | | | 19,063 | |
Business Services | | | 2 | | | | — | | | | — | | | | — | | | | 11 | | | | 8 | | | | 710 | | | | 1,020 | | | | 8 | | | | 8 | | | | 326 | | | | 249 | | | | 1,057 | | | | 1,285 | |
Construction | | | — | | | | — | | | | — | | | | — | | | | 2 | | | | 1 | | | | 702 | | | | 774 | | | | 8 | | | | 6 | | | | 433 | | | | 191 | | | | 1,145 | | | | 972 | |
Entertainment, Leisure and Tourism | | | — | | | | — | | | | 39 | | | | 23 | | | | 23 | | | | 6 | | | | 837 | | | | 892 | | | | 9 | | | | 7 | | | | 367 | | | | 218 | | | | 1,275 | | | | 1,146 | |
Financial, Investment and Insurance | | | 3,668 | | | | 2,959 | | | | 3,396 | | | | 1,984 | | | | 6,287 | | | | 4,290 | | | | 1,074 | | | | 1,561 | | | | 12 | | | | 12 | | | | 994 | | | | 376 | | | | 15,431 | | | | 11,182 | |
Government and Official Institutions | | | 31 | | | | 155 | | | | 1,128 | | | | 209 | | | | 144 | | | | 232 | | | | 1,169 | | | | 549 | | | | 12 | | | | 4 | | | | 617 | | | | 133 | | | | 3,101 | | | | 1,282 | |
Manufacturing | | | 66 | | | | 156 | | | | 1 | | | | 7 | | | | 79 | | | | 174 | | | | 2,307 | | | | 2,680 | | | | 26 | | | | 21 | | | | 731 | | | | 648 | | | | 3,210 | | | | 3,686 | |
Personal Lending | | | — | | | | — | | | | — | | | | — | | | | — | | | | — | | | | 45,251 | | | | 45,552 | | | | 500 | | | | 358 | | | | 8,519 | | | | 11,285 | | | | 54,270 | | | | 57,195 | |
Property Services | | | 2 | | | | — | | | | — | | | | — | | | | 30 | | | | 17 | | | | 6,817 | | | | 7,832 | | | | 75 | | | | 61 | | | | 1,135 | | | | 1,919 | | | | 8,059 | | | | 9,829 | |
Retail Trade | | | 72 | | | | 299 | | | | — | | | | — | | | | 61 | | | | 11 | | | | 1,318 | | | | 1,755 | | | | 14 | | | | 13 | | | | 908 | | | | 427 | | | | 2,373 | | | | 2,505 | |
Transport and Storage | | | 5 | | | | 26 | | | | 6 | | | | 3 | | | | 66 | | | | 17 | | | | 1,293 | | | | 1,186 | | | | 14 | | | | 9 | | | | 466 | | | | 288 | | | | 1,850 | | | | 1,529 | |
Wholesale trade | | | 15 | | | | 19 | | | | — | | | | — | | | | 5 | | | | 9 | | | | 1,413 | | | | 1,583 | | | | 15 | | | | 12 | | | | 795 | | | | 383 | | | | 2,243 | | | | 2,006 | |
Other | | | 5 | | | | 34 | | | | 32 | | | | 12 | | | | 145 | | | | 70 | | | | 1,125 | | | | 2,315 | | | | 13 | | | | 13 | | | | 808 | | | | 426 | | | | 2,128 | | | | 2,870 | |
| | | | | | | | | | | | | | | | | | | | | | | | | | | | | | | | | | | | | | | | | | | | | | | | | | | | | | | | |
| | | 3,904 | | | | 3,734 | | | | 4,602 | | | | 2,238 | | | | 6,924 | | | | 4,897 | | | | 80,851 | | | | 82,786 | | | | 891 | | | | 642 | | | | 17,294 | | | | 20,253 | | | | 114,466 | | | | 114,550 | |
| | | | | | | | | | | | | | | | | | | | | | | | | | | | | | | | | | | | | | | | | | | | | | | | | | | | | | | | |
| 1 | Available-for-sale assets. |
| 2 | Mainly comprises trade dated assets and accrued interest. |
| 3 | Credit related commitments comprise undrawn facilities and customer contingent liabilities. |
128 ANZ Annual Report 2009
NOTES TO THE FINANCIAL STATEMENTS
33: Financial Risk Management (continued)
Concentrations of credit risk analysis (continued):
Composition of financial instruments that give rise to credit risk by industry (continued):
| | | | | | | | | | | | | | | | | | | | | | | | | | | | | | | | | | | | | | | | | | | | | | | | | | | | | | | | |
| | | Liquid assets and due
from other financial
institutions | | | Trading and AFS1assets | | | Derivatives | | | Loans and advances and
acceptances | | | Other financial assets2 | | | Credit related
commitments3 | | | Total | |
Consolidated | | 2009
$m | | | 2008
$m | | | 2009
$m | | | 2008
$m | | | 2009
$m | | | 2008
$m | | | 2009
$m | | | 2008
$m | | | 2009
$m | | | 2008
$m | | | 2009
$m | | | 2008
$m | | | 2009
$m | | | 2008
$m | |
Overseas Markets | | | | | | | | | | | | | | | | | | | | | | | | | | | | | | | | | | | | | | | | | | | | | | | | | | | | | | | | |
Agriculture, forestry fishing and mining | | | 1 | | | | — | | | | 10 | | | | — | | | | 27 | | | | 90 | | | | 1,477 | | | | 2,946 | | | | 19 | | | | 55 | | | | 2,093 | | | | 2,869 | | | | 3,627 | | | | 5,960 | |
Business Services | | | — | | | | — | | | | 3 | | | | — | | | | 1 | | | | 4 | | | | 524 | | | | 1,544 | | | | 7 | | | | 29 | | | | 479 | | | | 691 | | | | 1,014 | | | | 2,268 | |
Construction | | | — | | | | — | | | | 40 | | | | 56 | | | | 7 | | | | 8 | | | | 207 | | | | 141 | | | | 3 | | | | 3 | | | | 923 | | | | 760 | | | | 1,180 | | | | 968 | |
Entertainment, Leisure and Tourism | | | — | | | | — | | | | — | | | | — | | | | 8 | | | | 58 | | | | 681 | | | | 696 | | | | 9 | | | | 13 | | | | 401 | | | | 488 | | | | 1,099 | | | | 1,255 | |
Financial, Investment and Insurance | | | 16,156 | | | | 16,927 | | | | 4,853 | | | | 4,546 | | | | 1,513 | | | | 2,634 | | | | 1,526 | | | | 1,222 | | | | 20 | | | | 23 | | | | 5,354 | | | | 7,311 | | | | 29,422 | | | | 32,663 | |
Government and Official Institutions | | | 220 | | | | 4 | | | | 3,863 | | | | 1,610 | | | | — | | | | 15 | | | | 321 | | | | 297 | | | | 4 | | | | 6 | | | | 1,085 | | | | 1,396 | | | | 5,493 | | | | 3,328 | |
Manufacturing | | | 6 | | | | 4 | | | | 39 | | | | 38 | | | | 223 | | | | 113 | | | | 4,720 | | | | 4,793 | | | | 61 | | | | 90 | | | | 10,573 | | | | 11,222 | | | | 15,622 | | | | 16,260 | |
Personal Lending | | | — | | | | — | | | | — | | | | — | | | | — | | | | — | | | | 2,355 | | | | 2,379 | | | | 30 | | | | 65 | | | | 460 | | | | 387 | | | | 2,845 | | | | 2,831 | |
Property Services | | | — | | | | — | | | | 22 | | | | 23 | | | | 27 | | | | 18 | | | | 1,454 | | | | 302 | | | | 19 | | | | 6 | | | | 237 | | | | 35 | | | | 1,759 | | | | 384 | |
Retail Trade | | | — | | | | — | | | | — | | | | — | | | | 1 | | | | 33 | | | | 360 | | | | 444 | | | | 5 | | | | 8 | | | | 303 | | | | 278 | | | | 669 | | | | 763 | |
Transport and Storage | | | — | | | | — | | | | 93 | | | | 82 | | | | 26 | | | | 31 | | | | 1,477 | | | | 1,553 | | | | 19 | | | | 29 | | | | 732 | | | | 393 | | | | 2,346 | | | | 2,088 | |
Wholesale trade | | | 5 | | | | 28 | | | | — | | | | — | | | | 63 | | | | 60 | | | | 2,064 | | | | 3,052 | | | | 27 | | | | 57 | | | | 4,584 | | | | 7,298 | | | | 6,743 | | | | 10,495 | |
Other | | | 74 | | | | 168 | | | | 69 | | | | 63 | | | | 153 | | | | 101 | | | | 2,241 | | | | 2,280 | | | | 27 | | | | 43 | | | | 2,417 | | | | 2,810 | | | | 4,981 | | | | 5,465 | |
| | | | | | | | | | | | | | | | | | | | | | | | | | | | | | | | | | | | | | | | | | | | | | | | | | | | | | | | |
| | | 16,462 | | | | 17,131 | | | | 8,992 | | | | 6,418 | | | | 2,049 | | | | 3,165 | | | | 19,406 | | | | 21,649 | | | | 250 | | | | 427 | | | | 29,641 | | | | 35,938 | | | | 76,800 | | | | 84,728 | |
| | | | | | | | | | | | | | | | | | | | | | | | | | | | | | | | | | | | | | | | | | | | | | | | | | | | | | | | |
Consolidated – aggregate | | | | | | | | | | | | | | | | | | | | | | | | | | | | | | | | | | | | | | | | | | | | | | | | | | | | | | | | |
Agriculture, forestry fishing and mining | | | 64 | | | | 109 | | | | 194 | | | | 57 | | | | 213 | | | | 563 | | | | 28,411 | | | | 28,249 | | | | 289 | | | | 383 | | | | 9,845 | | | | 12,936 | | | | 39,016 | | | | 42,297 | |
Business Services | | | 24 | | | | 17 | | | | 17 | | | | — | | | | 63 | | | | 43 | | | | 6,741 | | | | 8,472 | | | | 61 | | | | 168 | | | | 3,986 | | | | 3,273 | | | | 10,892 | | | | 11,973 | |
Construction | | | — | | | | 2 | | | | 49 | | | | 56 | | | | 30 | | | | 29 | | | | 5,428 | | | | 5,475 | | | | 49 | | | | 111 | | | | 4,981 | | | | 4,397 | | | | 10,537 | | | | 10,070 | |
Entertainment, Leisure and Tourism | | | — | | | | — | | | | 221 | | | | 25 | | | | 277 | | | | 266 | | | | 6,913 | | | | 8,037 | | | | 64 | | | | 164 | | | | 3,452 | | | | 2,533 | | | | 10,927 | | | | 11,025 | |
Financial, Investment and Insurance | | | 21,629 | | | | 24,191 | | | | 27,216 | | | | 22,734 | | | | 33,213 | | | | 33,180 | | | | 11,294 | | | | 15,378 | | | | 105 | | | | 205 | | | | 10,832 | | | | 17,297 | | | | 104,289 | | | | 112,985 | |
Government and Official Institutions | | | 4,942 | | | | 3,667 | | | | 15,045 | | | | 7,160 | | | | 268 | | | | 316 | | | | 1,632 | | | | 941 | | | | 17 | | | | 12 | | | | 1,981 | | | | 2,021 | | | | 23,885 | | | | 14,117 | |
Manufacturing | | | 145 | | | | 299 | | | | 474 | | | | 189 | | | | 739 | | | | 603 | | | | 15,428 | | | | 16,794 | | | | 158 | | | | 317 | | | | 18,863 | | | | 19,891 | | | | 35,807 | | | | 38,093 | |
Personal Lending | | | — | | | | — | | | | — | | | | — | | | | — | | | | — | | | | 206,356 | | | | 194,998 | | | | 1,869 | | | | 1,477 | | | | 40,544 | | | | 39,718 | | | | 248,769 | | | | 236,193 | |
Property Services | | | 3 | | | | 3 | | | | 90 | | | | 48 | | | | 650 | | | | 426 | | | | 30,725 | | | | 33,237 | | | | 283 | | | | 607 | | | | 8,554 | | | | 8,632 | | | | 40,305 | | | | 42,953 | |
Retail Trade | | | 90 | | | | 337 | | | | 180 | | | | 129 | | | | 218 | | | | 95 | | | | 10,311 | | | | 11,691 | | | | 92 | | | | 233 | | | | 4,867 | | | | 3,402 | | | | 15,758 | | | | 15,887 | |
Transport and Storage | | | 13 | | | | 35 | | | | 232 | | | | 103 | | | | 394 | | | | 208 | | | | 7,294 | | | | 9,085 | | | | 71 | | | | 140 | | | | 3,564 | | | | 3,100 | | | | 11,568 | | | | 12,671 | |
Wholesale trade | | | 169 | | | | 584 | | | | — | | | | 20 | | | | 391 | | | | 306 | | | | 9,412 | | | | 11,260 | | | | 92 | | | | 212 | | | | 11,075 | | | | 13,246 | | | | 21,139 | | | | 25,628 | |
Other | | | 115 | | | | 799 | | | | 3,389 | | | | 1,670 | | | | 948 | | | | 906 | | | | 12,162 | | | | 11,730 | | | | 115 | | | | 244 | | | | 9,318 | | | | 10,825 | | | | 26,047 | | | | 26,174 | |
| | | | | | | | | | | | | | | | | | | | | | | | | | | | | | | | | | | | | | | | | | | | | | | | | | | | | | | | |
Gross Total | | | 27,194 | | | | 30,043 | | | | 47,107 | | | | 32,191 | | | | 37,404 | | | | 36,941 | | | | 352,107 | | | | 355,347 | | | | 3,265 | | | | 4,273 | | | | 131,862 | | | | 141,271 | | | | 598,939 | | | | 600,066 | |
| | | | | | | | | | | | | | | | | | | | | | | | | | | | | | | | | | | | | | | | | | | | | | | | | | | | | | | | |
Individual provision for credit impairment | | | — | | | | — | | | | — | | | | — | | | | — | | | | — | | | | (1,512 | ) | | | (646 | ) | | | — | | | | — | | | | (14 | ) | | | (29 | ) | | | (1,526 | ) | | | (675 | ) |
Collective provision for credit impairment | | | — | | | | — | | | | — | | | | — | | | | — | | | | — | | | | (2,552 | ) | | | (2,062 | ) | | | — | | | | — | | | | (448 | ) | | | (759 | ) | | | (3,000 | ) | | | (2,821 | ) |
| | | | | | | | | | | | | | | | | | | | | | | | | | | | | | | | | | | | | | | | | | | | | | | | | | | | | | | | |
| | | 27,194 | | | | 30,043 | | | | 47,107 | | | | 32,191 | | | | 37,404 | | | | 36,941 | | | | 348,043 | | | | 352,639 | | | | 3,265 | | | | 4,273 | | | | 131,400 | | | | 140,483 | | | | 594,413 | | | | 596,570 | |
| | | | | | | | | | | | | | | | | | | | | | | | | | | | | | | | | | | | | | | | | | | | | | | | | | | | | | | | |
Income yet to mature | | | — | | | | — | | | | — | | | | — | | | | — | | | | — | | | | (2,372 | ) | | | (2,600 | ) | | | — | | | | — | | | | — | | | | — | | | | (2,372 | ) | | | (2,600 | ) |
Capitalised brokerage/mortgage origination fees | | | — | | | | — | | | | — | | | | — | | | | — | | | | — | | | | 560 | | | | 600 | | | | — | | | | — | | | | — | | | | — | | | | 560 | | | | 600 | |
| | | | | | | | | | | | | | | | | | | | | | | | | | | | | | | | | | | | | | | | | | | | | | | | | | | | | | | | |
| | | 27,194 | | | | 30,043 | | | | 47,107 | | | | 32,191 | | | | 37,404 | | | | 36,941 | | | | 346,231 | | | | 350,639 | | | | 3,265 | | | | 4,273 | | | | 131,400 | | | | 140,483 | | | | 592,601 | | | | 594,570 | |
| | | | | | | | | | | | | | | | | | | | | | | | | | | | | | | | | | | | | | | | | | | | | | | | | | | | | | | | |
Excluded from analysis above4 | | | 3,108 | | | | 4,849 | | | | 459 | | | | 466 | | | | — | | | | — | | | | — | | | | — | | | | — | | | | — | | | | — | | | | — | | | | 3,567 | | | | 5,315 | |
| | | | | | | | | | | | | | | | | | | | | | | | | | | | | | | | | | | | | | | | | | | | | | | | | | | | | | | | |
| | | 30,302 | | | | 34,892 | | | | 47,566 | | | | 32,657 | | | | 37,404 | | | | 36,941 | | | | 346,231 | | | | 350,639 | | | | 3,265 | | | | 4,273 | | | | 131,400 | | | | 140,483 | | | | 596,168 | | | | 599,885 | |
| | | | | | | | | | | | | | | | | | | | | | | | | | | | | | | | | | | | | | | | | | | | | | | | | | | | | | | | |
| 1 | Available-for-sale assets. |
| 2 | Mainly comprises trade dated assets and accrued interest. |
| 3 | Credit related commitments comprise undrawn facilities and customer contingent liabilities. |
| 4 | Equity instruments and cash are excluded from maximum exposure amount. |
Financial Report129
NOTES TO THE FINANCIAL STATEMENTS
33: Financial Risk Management (continued)
Concentrations of credit risk analysis (continued):
Composition of financial instruments that give rise to credit risk by industry (continued):
| | | | | | | | | | | | | | | | | | | | | | | | | | | | | | | | | | | | | | | | | | | | | | | | | | | | | | | | |
| | | Liquid assets and due
from other financial
institutions | | | Trading and AFS1assets | | | Derivatives | | | Loans and advances and
acceptances | | | Other financial assets2 | | | Credit related
commitments3 | | | Total | |
The Company | | 2009
$m | | | 2008
$m | | | 2009
$m | | | 2008
$m | | | 2009
$m | | | 2008
$m | | | 2009
$m | | | 2008
$m | | | 2009
$m | | | 2008
$m | | | 2009
$m | | | 2008
$m | | | 2009
$m | | | 2008
$m | |
Australia | | | | | | | | | | | | | | | | | | | | | | | | | | | | | | | | | | | | | | | | | | | | | | | | | | | | | | | | |
Agriculture, forestry fishing and mining | | | 24 | | | | 23 | | | | 29 | | | | 56 | | | | 114 | | | | 411 | | | | 10,073 | | | | 9,406 | | | | 68 | | | | 172 | | | | 6,550 | | | | 6,357 | | | | 16,858 | | | | 16,425 | |
Business Services | | | 21 | | | | 17 | | | | 14 | | | | — | | | | 51 | | | | 31 | | | | 5,493 | | | | 4,990 | | | | 37 | | | | 99 | | | | 3,178 | | | | 2,333 | | | | 8,794 | | | | 7,470 | |
Construction | | | — | | | | 2 | | | | 9 | | | | — | | | | 21 | | | | 20 | | | | 4,507 | | | | 3,053 | | | | 31 | | | | 61 | | | | 3,621 | | | | 3,446 | | | | 8,189 | | | | 6,582 | |
Entertainment, Leisure and Tourism | | | — | | | | — | | | | 181 | | | | 2 | | | | 245 | | | | 202 | | | | 5,382 | | | | 6,211 | | | | 37 | | | | 124 | | | | 2,681 | | | | 1,827 | | | | 8,526 | | | | 8,366 | |
Financial, Investment and Insurance5 | | | 1,684 | | | | 4,261 | | | | 18,931 | | | | 15,662 | | | | 28,077 | | | | 27,636 | | | | 9,776 | | | | 13,625 | | | | 66 | | | | 176 | | | | 4,637 | | | | 10,269 | | | | 63,171 | | | | 71,629 | |
Government and Official Institutions | | | 4,626 | | | | 3,433 | | | | 10,043 | | | | 5,215 | | | | 123 | | | | 69 | | | | 142 | | | | 94 | | | | 1 | | | | 2 | | | | 279 | | | | 492 | | | | 15,214 | | | | 9,305 | |
Manufacturing | | | 72 | | | | 136 | | | | 434 | | | | 140 | | | | 435 | | | | 316 | | | | 8,371 | | | | 9,020 | | | | 57 | | | | 178 | | | | 7,551 | | | | 8,021 | | | | 16,920 | | | | 17,811 | |
Personal Lending | | | — | | | | — | | | | — | | | | — | | | | — | | | | — | | | | 158,347 | | | | 139,854 | | | | 1,076 | | | | 868 | | | | 31,531 | | | | 28,047 | | | | 190,954 | | | | 168,769 | |
Property Services | | | 1 | | | | 3 | | | | 67 | | | | 24 | | | | 590 | | | | 391 | | | | 22,397 | | | | 24,660 | | | | 152 | | | | 474 | | | | 7,167 | | | | 6,678 | | | | 30,374 | | | | 32,230 | |
Retail Trade | | | 17 | | | | 37 | | | | 180 | | | | 126 | | | | 155 | | | | 51 | | | | 8,599 | | | | 7,265 | | | | 58 | | | | 146 | | | | 3,652 | | | | 2,471 | | | | 12,661 | | | | 10,096 | |
Transport and Storage | | | 8 | | | | 9 | | | | 133 | | | | 18 | | | | 301 | | | | 160 | | | | 4,451 | | | | 4,514 | | | | 30 | | | | 73 | | | | 2,364 | | | | 2,417 | | | | 7,287 | | | | 7,191 | |
Wholesale trade | | | 147 | | | | 526 | | | | — | | | | 20 | | | | 321 | | | | 237 | | | | 5,920 | | | | 6,385 | | | | 40 | | | | 123 | | | | 5,690 | | | | 5,565 | | | | 12,118 | | | | 12,856 | |
Other | | | 36 | | | | 583 | | | | 3,286 | | | | 1,552 | | | | 648 | | | | 635 | | | | 8,771 | | | | 7,123 | | | | 61 | | | | 131 | | | | 6,089 | | | | 6,370 | | | | 18,891 | | | | 16,394 | |
| | | | | | | | | | | | | | | | | | | | | | | | | | | | | | | | | | | | | | | | | | | | | | | | | | | | | | | | |
| | | 6,636 | | | | 9,030 | | | | 33,307 | | | | 22,815 | | | | 31,081 | | | | 30,159 | | | | 252,229 | | | | 236,200 | | | | 1,714 | | | | 2,627 | | | | 84,990 | | | | 84,293 | | | | 409,957 | | | | 385,124 | |
| | | | | | | | | | | | | | | | | | | | | | | | | | | | | | | | | | | | | | | | | | | | | | | | | | | | | | | | |
New Zealand4 | | | | | | | | | | | | | | | | | | | | | | | | | | | | | | | | | | | | | | | | | | | | | | | | | | | | | | | | |
Agriculture, forestry fishing and mining | | | — | | | | — | | | | — | | | | — | | | | — | | | | — | | | | — | | | | — | | | | — | | | | — | | | | — | | | | — | | | | — | | | | — | |
Business Services | | | — | | | | — | | | | — | | | | — | | | | — | | | | — | | | | — | | | | — | | | | — | | | | — | | | | — | | | | — | | | | — | | | | — | |
Construction | | | — | | | | — | | | | — | | | | — | | | | — | | | | — | | | | — | | | | — | | | | — | | | | — | | | | — | | | | — | | | | — | | | | — | |
Entertainment, Leisure and Tourism | | | — | | | | — | | | | — | | | | — | | | | — | | | | — | | | | — | | | | — | | | | — | | | | — | | | | — | | | | — | | | | — | | | | — | |
Financial, Investment and Insurance | | | — | | | | — | | | | — | | | | — | | | | 28 | | | | — | | | | — | | | | — | | | | — | | | | — | | | | — | | | | — | | | | 28 | | | | — | |
Government and Official Institutions | | | — | | | | — | | | | — | | | | — | | | | — | | | | — | | | | — | | | | — | | | | — | | | | — | | | | — | | | | — | | | | — | | | | — | |
Manufacturing | | | — | | | | — | | | | — | | | | — | | | | — | | | | — | | | | — | | | | — | | | | — | | | | — | | | | — | | | | — | | | | — | | | | — | |
Personal Lending | | | — | | | | — | | | | — | | | | — | | | | — | | | | — | | | | 7,194 | | | | — | | | | 271 | | | | — | | | | 28 | | | | — | | | | 7,493 | | | | — | |
Property Services | | | — | | | | — | | | | — | | | | — | | | | — | | | | — | | | | — | | | | — | | | | — | | | | — | | | | — | | | | — | | | | — | | | | — | |
Retail Trade | | | — | | | | — | | | | — | | | | — | | | | — | | | | — | | | | — | | | | — | | | | — | | | | — | | | | — | | | | — | | | | — | | | | — | |
Transport and Storage | | | — | | | | — | | | | — | | | | — | | | | — | | | | — | | | | — | | | | — | | | | — | | | | — | | | | — | | | | — | | | | — | | | | — | |
Wholesale trade | | | — | | | | — | | | | — | | | | — | | | | — | | | | — | | | | — | | | | — | | | | — | | | | — | | | | — | | | | — | | | | — | | | | — | |
Other | | | — | | | | — | | | | — | | | | — | | | | — | | | | — | | | | — | | | | — | | | | — | | | | — | | | | — | | | | — | | | | — | | | | — | |
| | | | | | | | | | | | | | | | | | | | | | | | | | | | | | | | | | | | | | | | | | | | | | | | | | | | | | | | |
| | | — | | | | — | | | | — | | �� | | — | | | | 28 | | | | — | | | | 7,194 | | | | — | | | | 271 | | | | — | | | | 28 | | | | — | | | | 7,521 | | | | — | |
| | | | | | | | | | | | | | | | | | | | | | | | | | | | | | | | | | | | | | | | | | | | | | | | | | | | | | | | |
| 1 | Available-for-sale assets. |
| 2 | Mainly comprises trade dated assets and accrued interest. |
| 3 | Credit related commitments comprise undrawn facilities and customer contingent liabilities. |
| 4 | During 2009, ANZ established a licensed banking branch in New Zealand. |
| 5 | Includes amounts due from other group entities. |
130 ANZ Annual Report 2009
NOTES TO THE FINANCIAL STATEMENTS
33: Financial Risk Management (continued)
Concentrations of credit risk analysis (continued):
Composition of financial instruments that give rise to credit risk by industry (continued):
| | | | | | | | | | | | | | | | | | | | | | | | | | | | | | | | | | | | | | | | | | | | | | | | | | | | | | | | |
| | | Liquid assets and due
from other financial
institutions | | | Trading and AFS1assets | | | Derivatives | | | Loans and advances and
acceptances | | | Other financial assets2 | | | Credit related
commitments3 | | | Total | |
The Company | | 2009
$m | | | 2008
$m | | | 2009
$m | | | 2008
$m | | | 2009
$m | | | 2008
$m | | | 2009
$m | | | 2008
$m | | | 2009
$m | | | 2008
$m | | | 2009
$m | | | 2008
$m | | | 2009
$m | | | 2008
$m | |
Overseas Markets | | | | | | | | | | | | | | | | | | | | | | | | | | | | | | | | | | | | | | | | | | | | | | | | | | | | | | | | |
Agriculture, forestry fishing and mining | | | — | | | | — | | | | 9 | | | | — | | | | 23 | | | | 80 | | | | 1,223 | | | | 2,686 | | | | 15 | | | | 42 | | | | 1,721 | | | | 2,500 | | | | 2,991 | | | | 5,308 | |
Business Services | | | — | | | | — | | | | 3 | | | | — | | | | 1 | | | | 4 | | | | 318 | | | | 1,349 | | | | 4 | | | | 22 | | | | 432 | | | | 669 | | | | 758 | | | | 2,044 | |
Construction | | | — | | | | — | | | | 38 | | | | 51 | | | | 6 | | | | 8 | | | | 89 | | | | 87 | | | | 1 | | | | 2 | | | | 917 | | | | 739 | | | | 1,051 | | | | 887 | |
Entertainment, Leisure and Tourism | | | — | | | | — | | | | — | | | | — | | | | 7 | | | | 56 | | | | 423 | | | | 515 | | | | 5 | | | | 10 | | | | 366 | | | | 445 | | | | 801 | | | | 1,026 | |
Financial, Investment and Insurance | | | 15,643 | | | | 16,207 | | | | 4,476 | | | | 3,021 | | | | 1,403 | | | | 2,638 | | | | 1,271 | | | | 998 | | | | 17 | | | | 17 | | | | 5,199 | | | | 6,995 | | | | 28,009 | | | | 29,876 | |
Government and Official Institutions | | | 197 | | | | 4 | | | | 2,522 | | | | 1,461 | | | | — | | | | 15 | | | | 255 | | | | 261 | | | | 3 | | | | 4 | | | | 1,086 | | | | 1,371 | | | | 4,063 | | | | 3,116 | |
Manufacturing | | | 6 | | | | 4 | | | | 37 | | | | 34 | | | | 199 | | | | 109 | | | | 3,830 | | | | 4,174 | | | | 48 | | | | 69 | | | | 10,233 | | | | 10,772 | | | | 14,353 | | | | 15,162 | |
Personal Lending | | | — | | | | — | | | | — | | | | — | | | | — | | | | — | | | | 1,340 | | | | 1,795 | | | | 17 | | | | 50 | | | | 66 | | | | 103 | | | | 1,423 | | | | 1,948 | |
Property Services | | | — | | | | — | | | | 21 | | | | 21 | | | | 26 | | | | 18 | | | | 1,402 | | | | 277 | | | | 18 | | | | 4 | | | | 241 | | | | 34 | | | | 1,708 | | | | 354 | |
Retail Trade | | | — | | | | — | | | | — | | | | — | | | | — | | | | 33 | | | | 162 | | | | 401 | | | | 2 | | | | 6 | | | | 201 | | | | 246 | | | | 365 | | | | 686 | |
Transport and Storage | | | — | | | | — | | | | 88 | | | | 75 | | | | 24 | | | | 31 | | | | 1,052 | | | | 1,181 | | | | 13 | | | | 22 | | | | 700 | | | | 385 | | | | 1,877 | | | | 1,694 | |
Wholesale trade | | | 5 | | | | 27 | | | | — | | | | — | | | | 60 | | | | 50 | | | | 1,617 | | | | 2,645 | | | | 20 | | | | 44 | | | | 4,294 | | | | 7,121 | | | | 5,996 | | | | 9,887 | |
Other | | | 70 | | | | 122 | | | | 60 | | | | 58 | | | | 143 | | | | 97 | | | | 2,239 | | | | 1,763 | | | | 21 | | | | 33 | | | | 1,035 | | | | 2,390 | | | | 3,568 | | | | 4,463 | |
| | | | | | | | | | | | | | | | | | | | | | | | | | | | | | | | | | | | | | | | | | | | | | | | | | | | | | | | |
| | | 15,921 | | | | 16,364 | | | | 7,254 | | | | 4,721 | | | | 1,892 | | | | 3,139 | | | | 15,221 | | | | 18,132 | | | | 184 | | | | 325 | | | | 26,491 | | | | 33,770 | | | | 66,963 | | | | 76,451 | |
| | | | | | | | | | | | | | | | | | | | | | | | | | | | | | | | | | | | | | | | | | | | | | | | | | | | | | | | |
The Company – aggregate | | | | | | | | | | | | | | | | | | | | | | | | | | | | | | | | | | | | | | | | | | | | | | | | | | | | | | | | |
Agriculture, forestry fishing and mining | | | 24 | | | | 23 | | | | 38 | | | | 56 | | | | 137 | | | | 491 | | | | 11,296 | | | | 12,092 | | | | 83 | | | | 214 | | | | 8,271 | | | | 8,857 | | | | 19,849 | | | | 21,733 | |
Business Services | | | 21 | | | | 17 | | | | 17 | | | | — | | | | 52 | | | | 35 | | | | 5,811 | | | | 6,339 | | | | 41 | | | | 121 | | | | 3,610 | | | | 3,002 | | | | 9,552 | | | | 9,514 | |
Construction | | | — | | | | 2 | | | | 47 | | | | 51 | | | | 27 | | | | 28 | | | | 4,596 | | | | 3,140 | | | | 32 | | | | 63 | | | | 4,538 | | | | 4,185 | | | | 9,240 | | | | 7,469 | |
Entertainment, Leisure and Tourism | | | — | | | | — | | | | 181 | | | | 2 | | | | 252 | | | | 258 | | | | 5,805 | | | | 6,726 | | | | 42 | | | | 134 | | | | 3,047 | | | | 2,272 | | | | 9,327 | | | | 9,392 | |
Financial, Investment and Insurance | | | 17,327 | | | | 20,468 | | | | 23,407 | | | | 18,683 | | | | 29,508 | | | | 30,274 | | | | 11,047 | | | | 14,623 | | | | 83 | | | | 193 | | | | 9,836 | | | | 17,264 | | | | 91,208 | | | | 101,505 | |
Government and Official Institutions | | | 4,823 | | | | 3,437 | | | | 12,565 | | | | 6,676 | | | | 123 | | | | 84 | | | | 397 | | | | 355 | | | | 4 | | | | 6 | | | | 1,365 | | | | 1,863 | | | | 19,277 | | | | 12,421 | |
Manufacturing | | | 78 | | | | 140 | | | | 471 | | | | 174 | | | | 634 | | | | 425 | | | | 12,201 | | | | 13,194 | | | | 105 | | | | 247 | | | | 17,784 | | | | 18,793 | | | | 31,273 | | | | 32,973 | |
Personal Lending | | | — | | | | — | | | | — | | | | — | | | | — | | | | — | | | | 166,881 | | | | 141,649 | | | | 1,364 | | | | 918 | | | | 31,625 | | | | 28,150 | | | | 199,870 | | | | 170,717 | |
Property Services | | | 1 | | | | 3 | | | | 88 | | | | 45 | | | | 616 | | | | 409 | | | | 23,799 | | | | 24,937 | | | | 170 | | | | 478 | | | | 7,408 | | | | 6,712 | | | | 32,082 | | | | 32,584 | |
Retail Trade | | | 17 | | | | 37 | | | | 180 | | | | 126 | | | | 155 | | | | 84 | | | | 8,761 | | | | 7,666 | | | | 60 | | | | 152 | | | | 3,853 | | | | 2,717 | | | | 13,026 | | | | 10,782 | |
Transport and Storage | | | 8 | | | | 9 | | | | 221 | | | | 93 | | | | 325 | | | | 191 | | | | 5,503 | | | | 5,695 | | | | 43 | | | | 95 | | | | 3,064 | | | | 2,802 | | | | 9,164 | | | | 8,885 | |
Wholesale trade | | | 152 | | | | 553 | | | | — | | | | 20 | | | | 381 | | | | 287 | | | | 7,537 | | | | 9,030 | | | | 60 | | | | 167 | | | | 9,984 | | | | 12,686 | | | | 18,114 | | | | 22,743 | |
Other | | | 106 | | | | 705 | | | | 3,346 | | | | 1,610 | | | | 791 | | | | 732 | | | | 11,010 | | | | 8,886 | | | | 82 | | | | 164 | | | | 7,124 | | | | 8,760 | | | | 22,459 | | | | 20,857 | |
| | | | | | | | | | | | | | | | | | | | | | | | | | | | | | | | | | | | | | | | | | | | | | | | | | | | | | | | |
Gross Total | | | 22,557 | | | | 25,394 | | | | 40,561 | | | | 27,536 | | | | 33,001 | | | | 33,298 | | | | 274,644 | | | | 254,332 | | | | 2,169 | | | | 2,952 | | | | 111,509 | | | | 118,063 | | | | 484,441 | | | | 461,575 | |
| | | | | | | | | | | | | | | | | | | | | | | | | | | | | | | | | | | | | | | | | | | | | | | | | | | | | | | | |
Individual provision for credit impairment | | | — | | | | — | | | | — | | | | — | | | | — | | | | — | | | | (1,050 | ) | | | (459 | ) | | | — | | | | — | | | | (12 | ) | | | (29 | ) | | | (1,062 | ) | | | (488 | ) |
Collective provision for credit impairment | | | — | | | | — | | | | — | | | | — | | | | — | | | | — | | | | (1,886 | ) | | | (1,519 | ) | | | — | | | | — | | | | (352 | ) | | | (625 | ) | | | (2,238 | ) | | | (2,144 | ) |
| | | | | | | | | | | | | | | | | | | | | | | | | | | | | | | | | | | | | | | | | | | | | | | | | | | | | | | | |
| | | 22,557 | | | | 25,394 | | | | 40,561 | | | | 27,536 | | | | 33,001 | | | | 33,298 | | | | 271,708 | | | | 252,354 | | | | 2,169 | | | | 2,952 | | | | 111,145 | | | | 117,409 | | | | 481,141 | | | | 458,943 | |
| | | | | | | | | | | | | | | | | | | | | | | | | | | | | | | | | | | | | | | | | | | | | | | | | | | | | | | | |
Income yet to mature | | | — | | | | — | | | | — | | | | — | | | | — | | | | — | | | | (2,102 | ) | | | (508 | ) | | | — | | | | — | | | | — | | | | — | | | | (2,102 | ) | | | (508 | ) |
Capitalised brokerage/mortgage origination fees | | | — | | | | — | | | | — | | | | — | | | | — | | | | — | | | | 505 | | | | 194 | | | | — | | | | — | | | | — | | | | — | | | | 505 | | | | 194 | |
| | | | | | | | | | | | | | | | | | | | | | | | | | | | | | | | | | | | | | | | | | | | | | | | | | | | | | | | |
| | | 22,557 | | | | 25,394 | | | | 40,561 | | | | 27,536 | | | | 33,001 | | | | 33,298 | | | | 270,111 | | | | 252,040 | | | | 2,169 | | | | 2,952 | | | | 111,145 | | | | 117,409 | | | | 479,544 | | | | 458,629 | |
| | | | | | | | | | | | | | | | | | | | | | | | | | | | | | | | | | | | | | | | | | | | | | | | | | | | | | | | |
Excluded from analysis above4 | | | 878 | | | | 1,260 | | | | 403 | | | | 413 | | | | — | | | | — | | | | — | | | | — | | | | — | | | | — | | | | — | | | | — | | | | 1,281 | | | | 1,673 | |
| | | | | | | | | | | | | | | | | | | | | | | | | | | | | | | | | | | | | | | | | | | | | | | | | | | | | | | | |
| | | 23,435 | | | | 26,654 | | | | 40,964 | | | | 27,949 | | | | 33,001 | | | | 33,298 | | | | 270,111 | | | | 252,040 | | | | 2,169 | | | | 2,952 | | | | 111,145 | | | | 117,409 | | | | 480,825 | | | | 460,302 | |
| | | | | | | | | | | | | | | | | | | | | | | | | | | | | | | | | | | | | | | | | | | | | | | | | | | | | | | | |
| 1 | Available-for-sale assets. |
| 2 | Mainly comprises trade dated assets and accrued interest. |
| 3 | Credit related commitments comprise undrawn facilities and customer contingent liabilities. |
| 4 | Equity instruments and cash are excluded from maximum exposure amount. |
Financial Report131
NOTES TO THE FINANCIAL STATEMENTS
33: Financial Risk Management (continued)
CREDIT QUALITY
Maximum exposure to credit risk
For financial assets recognised on the balance sheet, the maximum exposure to credit risk is the carrying amount. In certain circumstances, there may be differences between the carrying amounts reported on the balance sheet and the amounts reported in the tables below. Principally, these differences arise in respect of financial assets that are subject to risks other than credit risk, such as equity investments which are primarily subject to market risk, or bank notes and coins. For contingent exposures, the maximum exposure to credit risk is the maximum amount the Group would have to pay if the instrument is called upon. For undrawn facilities, the maximum exposure to credit risk is the full amount of the committed facilities.
The following tables present the maximum exposure to credit risk of on-balance sheet and off-balance sheet financial instruments before taking account of any collateral held or other credit enhancements.
| | | | | | | | | | | | | | | | | | | | | | | | |
| | | Reported | | | Excluded1 | | | Maximum exposure
to credit risk | |
Consolidated | | 2009
$m | | | 2008
$m | | | 2009
$m | | | 2008
$m | | | 2009
$m | | | 2008
$m | |
Liquid assets | | | 25,317 | | | | 25,030 | | | | 3,108 | | | | 4,849 | | | | 22,209 | | | | 20,181 | |
Due from other financial institutions | | | 4,985 | | | | 9,862 | | | | — | | | | — | | | | 4,985 | | | | 9,862 | |
Trading securities | | | 30,991 | | | | 15,177 | | | | — | | | | 20 | | | | 30,991 | | | | 15,157 | |
Derivative financial instruments | | | 37,404 | | | | 36,941 | | | | — | | | | — | | | | 37,404 | | | | 36,941 | |
Available-for-sale assets | | | 16,575 | | | | 17,480 | | | | 459 | | | | 446 | | | | 16,116 | | | | 17,034 | |
Net loans and advances and acceptances | | | | | | | | | | | | | | | | | | | | | | | | |
– Australia | | | 247,211 | | | | 246,537 | | | | — | | | | — | | | | 247,211 | | | | 246,537 | |
– New Zealand | | | 79,607 | | | | 81,983 | | | | — | | | | — | | | | 79,607 | | | | 81,983 | |
– Asia Pacific, Europe & America | | | 18,951 | | | | 21,331 | | | | — | | | | — | | | | 18,951 | | | | 21,331 | |
Other financial assets | | | 3,265 | | | | 4,273 | | | | — | | | | — | | | | 3,265 | | | | 4,273 | |
| | | | | | | | | | | | | | | | | | | | | | | | |
| | | 464,306 | | | | 458,614 | | | | 3,567 | | | | 5,315 | | | | 460,739 | | | | 453,299 | |
| | | | | | | | | | | | | | | | | | | | | | | | |
Undrawn facilities | | | 106,644 | | | | 111,265 | | | | — | | | | — | | | | 106,644 | | | | 111,265 | |
Contingent facilities | | | 25,218 | | | | 30,006 | | | | — | | | | — | | | | 25,218 | | | | 30,006 | |
| | | | | | | | | | | | | | | | | | | | | | | | |
| | | 131,862 | | | | 141,271 | | | | — | | | | — | | | | 131,862 | | | | 141,271 | |
| | | | | | | | | | | | | | | | | | | | | | | | |
Total | | | 596,168 | | | | 599,885 | | | | 3,567 | | | | 5,315 | | | | 592,601 | | | | 594,570 | |
| | | | | | | | | | | | | | | | | | | | | | | | |
| 1 | Includes bank notes and coins and cash at bank for liquid assets and equity instruments within trading securities and available-for-sale financial assets. |
132 ANZ Annual Report 2009
NOTES TO THE FINANCIAL STATEMENTS
33: Financial Risk Management (continued)
Maximum exposure to credit risk (continued)
| | | | | | | | | | | | | | | | | | | | | | | | |
| | | Reported | | | Excluded1 | | | Maximum exposure
to credit risk | |
The Company | | 2009
$m | | | 2008
$m | | | 2009
$m | | | 2008
$m | | | 2009
$m | | | 2008
$m | |
Liquid assets | | | 20,199 | | | | 18,081 | | | | 878 | | | | 1,260 | | | | 19,321 | | | | 16,821 | |
Due from other financial institutions | | | 3,236 | | | | 8,573 | | | | — | | | | — | | | | 3,236 | | | | 8,573 | |
Trading securities | | | 27,410 | | | | 12,846 | | | | — | | | | 20 | | | | 27,410 | | | | 12,826 | |
Derivative financial instruments | | | 33,001 | | | | 33,298 | | | | — | | | | — | | | | 33,001 | | | | 33,298 | |
Available–for–sale assets | | | 13,554 | | | | 15,103 | | | | 403 | | | | 393 | | | | 13,151 | | | | 14,710 | |
Net loans and advances and acceptances | | | | | | | | | | | | | | | | | | | | | | | | |
– Australia | | | 247,617 | | | | 233,478 | | | | — | | | | — | | | | 247,617 | | | | 233,478 | |
– New Zealand | | | 7,199 | | | | — | | | | — | | | | — | | | | 7,199 | | | | — | |
– Asia Pacific, Europe & America | | | 14,931 | | | | 17,909 | | | | — | | | | — | | | | 14,931 | | | | 17,909 | |
Other financial assets | | | 2,169 | | | | 2,952 | | | | — | | | | — | | | | 2,169 | | | | 2,952 | |
| | | | | | | | | | | | | | | | | | | | | | | | |
| | | 369,316 | | | | 342,240 | | | | 1,281 | | | | 1,673 | | | | 368,035 | | | | 340,567 | |
| | | | | | | | | | | | | | | | | | | | | | | | |
Undrawn facilities | | | 88,006 | | | | 90,026 | | | | — | | | | — | | | | 88,006 | | | | 90,026 | |
Contingent facilities | | | 23,503 | | | | 28,037 | | | | — | | | | — | | | | 23,503 | | | | 28,037 | |
| | | | | | | | | | | | | | | | | | | | | | | | |
| | | 111,509 | | | | 118,063 | | | | — | | | | — | | | | 111,509 | | | | 118,063 | |
| | | | | | | | | | | | | | | | | | | | | | | | |
Total | | | 480,825 | | | | 460,303 | | | | 1,281 | | | | 1,673 | | | | 479,544 | | | | 458,630 | |
| | | | | | | | | | | | | | | | | | | | | | | | |
| 1 | Includes bank notes and coins and cash at bank for liquid assets and equity instruments within trading securities and available-for-sale financial assets. |
A core component of the Group’s credit risk management capability is the risk grading framework used across all major Business Units and geographic areas. A set of risk grading principles and policies are supported by a complementary risk grading methodology. Pronouncements by the International Basel Committee on Banking Supervision have been encapsulated in these principles and policies including governance, validation and modelling requirements.
The Group’s risk grade profile changes dynamically through new counterparty lending acquisitions and/or existing counterparty movements in either risk or volume. All counterparty risk grades are subject to frequent review, including statistical and behavioural reviews in consumer and small business segments, and individual counterparty reviews in segments with larger single name borrowers.
ANZ uses a two-dimensional risk grading system, which measures both the customer’s ability to repay (probability of default (PD)) and the loss in the event of default (LGD) (a factor of the security taken to support the lending). ANZ also uses financial and statistical tools to assist in the risk grading of customers. Customer risk grades are actively reviewed and monitored to ensure the risk grade accurately reflects the credit risk of the customer and the prevailing economic conditions. Similarly, the performance of risk grading tools used in the risk grading process is reviewed regularly to ensure the tools remain statistically valid. ANZ applies a masterscale to the key outputs of the risk grading process, the PD and LGD, to consistently report on ANZ lending portfolios.
Financial Report133
NOTES TO THE FINANCIAL STATEMENTS
33: Financial Risk Management (continued)
Restructured items
The Group distinguishes between facilities renegotiated on a commercial basis, on terms similar to those offered to new clients with similar risk, and those renegotiated on non-commercial terms as a result of a client’s inability to meet original contractual obligations.
In the course of restructuring facilities due to financial difficulty, the Group may consider modifying its terms to include concessions such as a reduction in the principal amount, a deferral of repayments, and/or an extension of the maturity date materially beyond those typically offered to new facilities with similar risk.
Restructured facilities are classified as productive and must demonstrate sound prospects of being able to adhere to the modified contractual terms. Where doubt exists as to the capacity to sustain the modified terms, the facilities are classified as impaired and an appropriate level of individual provision is held.
Restructured items are facilities in which the original contractual terms have been modified to provide for concessions of interest, or principal, or other payments due, or for an extension in maturity for a non-commercial period for reasons related to the financial difficulties of a customer, and are not considered impaired.
DISTRIBUTION OF FINANCIAL INSTRUMENTS BY CREDIT QUALITY
| | | | | | | | | | | | | | | | | | | | | | | | | | | | | | | | | | | | | | | | |
| | | Neither past due nor impaired | | | Past due but not
impaired | | | Restructured | | | Impaired | | | Total | |
Consolidated | | 2009
$m | | | 2008
$m | | | 2009
$m | | | 2008
$m | | | 2009
$m | | | 2008
$m | | | 2009
$m | | | 2008
$m | | | 2009
$m | | | 2008
$m | |
Liquid assets | | | 22,209 | | | | 20,181 | | | | — | | | | — | | | | — | | | | — | | | | — | | | | — | | | | 22,209 | | | | 20,181 | |
Due from other financial institutions | | | 4,985 | | | | 9,862 | | | | — | | | | — | | | | — | | | | — | | | | — | | | | — | | | | 4,985 | | | | 9,862 | |
Trading securities | | | 30,991 | | | | 15,157 | | | | — | | | | — | | | | — | | | | — | | | | — | | | | — | | | | 30,991 | | | | 15,157 | |
Derivative financial instruments1 | | | 37,272 | | | | 36,886 | | | | — | | | | — | | | | 5 | | | | 55 | | | | 127 | | | | — | | | | 37,404 | | | | 36,941 | |
Available-for-sale assets2 | | | 16,116 | | | | 17,019 | | | | — | | | | — | | | | — | | | | — | | | | — | | | | 15 | | | | 16,116 | | | | 17,034 | |
Net loans and advances and acceptances | | | | | | | | | | | | | | | | | | | | | | | | | | | | | | | | | | | | | | | | |
– Australia | | | 236,197 | | | | 234,727 | | | | 7,489 | | | | 9,771 | | | | 293 | | | | 733 | | | | 3,232 | | | | 1,306 | | | | 247,211 | | | | 246,537 | |
– New Zealand | | | 76,281 | | | | 78,904 | | | | 2,352 | | | | 2,805 | | | | 1 | | | | — | | | | 973 | | | | 274 | | | | 79,607 | | | | 81,983 | |
– Asia Pacific, Europe & America | | | 17,862 | | | | 20,853 | | | | 528 | | | | 308 | | | | 374 | | | | — | | | | 187 | | | | 170 | | | | 18,951 | | | | 21,331 | |
Other financial assets | | | 3,265 | | | | 4,273 | | | | — | | | | — | | | | — | | | | — | | | | — | | | | — | | | | 3,265 | | | | 4,273 | |
Credit related commitments3 | | | 131,459 | | | | 141,159 | | | | — | | | | — | | | | — | | | | 35 | | | | 403 | | | | 77 | | | | 131,862 | | | | 141,271 | |
| | | | | | | | | | | | | | | | | | | | | | | | | | | | | | | | | | | | | | | | |
| | | 576,637 | | | | 579,021 | | | | 10,369 | | | | 12,884 | | | | 673 | | | | 823 | | | | 4,922 | | | | 1,842 | | | | 592,601 | | | | 594,570 | |
| | | | | | | | | | | | | | | | | | | | | | | | | | | | | | | | | | | | | | | | |
| | | | | | | | | | | | | | | | | | | | | | | | | | | | | | | | | | | | | | | | |
| | | Neither past due nor impaired | | | Past due but not
impaired | | | Restructured | | | Impaired | | | Total | |
The Company | | 2009
$m | | | 2008
$m | | | 2009
$m | | | 2008
$m | | | 2009
$m | | | 2008
$m | | | 2009
$m | | | 2008
$m | | | 2009
$m | | | 2008
$m | |
Liquid assets | | | 19,321 | | | | 16,821 | | | | — | | | | — | | | | — | | | | — | | | | — | | | | — | | | | 19,321 | | | | 16,821 | |
Due from other financial institutions | | | 3,236 | | | | 8,573 | | | | — | | | | — | | | | — | | | | — | | | | — | | | | — | | | | 3,236 | | | | 8,573 | |
Trading securities | | | 27,410 | | | | 12,826 | | | | — | | | | — | | | | — | | | | — | | | | — | | | | — | | | | 27,410 | | | | 12,826 | |
Derivative financial instruments1 | | | 32,869 | | | | 33,243 | | | | — | | | | — | | | | 5 | | | | 55 | | | | 127 | | | | — | | | | 33,001 | | | | 33,298 | |
Available-for-sale assets2 | | | 13,151 | | | | 14,695 | | | | — | | | | — | | | | — | | | | — | | | | — | | | | 15 | | | | 13,151 | | | | 14,710 | |
Net loans and advances and acceptances | | | | | | | | | | | | | | | | | | | | | | | | | | | | | | | | | | | | | | | | |
– Australia | | | 236,625 | | | | 222,222 | | | | 7,489 | | | | 9,322 | | | | 293 | | | | 733 | | | | 3,210 | | | | 1,201 | | | | 247,617 | | | | 233,478 | |
– New Zealand | | | 6,992 | | | | — | | | | 199 | | | | — | | | | — | | | | — | | | | 8 | | | | — | | | | 7,199 | | | | — | |
– Asia Pacific, Europe & America | | | 14,305 | | | | 17,601 | | | | 328 | | | | 162 | | | | 206 | | | | — | | | | 92 | | | | 146 | | | | 14,931 | | | | 17,909 | |
Other financial assets | | | 2,169 | | | | 2,952 | | | | — | | | | — | | | | — | | | | — | | | | — | | | | — | | | | 2,169 | | | | 2,952 | |
Credit related commitments3 | | | 111,132 | | | | 117,956 | | | | — | | | | — | | | | — | | | | 35 | | | | 377 | | | | 72 | | | | 111,509 | | | | 118,063 | |
| | | | | | | | | | | | | | | | | | | | | | | | | | | | | | | | | | | | | | | | |
| | | 467,210 | | | | 446,889 | | | | 8,016 | | | | 9,484 | | | | 504 | | | | 823 | | | | 3,814 | | | | 1,434 | | | | 479,544 | | | | 458,630 | |
| | | | | | | | | | | | | | | | | | | | | | | | | | | | | | | | | | | | | | | | |
| 1 | Derivative assets, considered impaired, net of credit valuation adjustments. |
| 2 | Impaired Available-for-sale debt security where the cumulative mark-to-market loss has been transferred from equity to the Income Statement. |
| 3 | Comprises undrawn facilities and customer contingent liabilities. |
134 ANZ Annual Report 2009
NOTES TO THE FINANCIAL STATEMENTS
33: Financial Risk Management (continued)
Credit quality of financial assets neither past due nor impaired
The credit quality of financial assets is managed by ANZ using internal ratings which aim to reflect the relative ability of counterparties to fulfil, on time, their credit-related obligations, and is based on their current probability of default.
Internal rating
| | |
Strong credit profile | | Customers that have demonstrated superior stability in their operating and financial performance over the long-term, and whose debt servicing capacity is not significantly vulnerable to foreseeable events. This rating broadly corresponds to ratings “Aaa” to “Baa3” and “AAA” to “BBB-” of Moody’s and Standard & Poor respectively. |
| |
Satisfactory risk | | Customers that have consistently demonstrated sound operational and financial stability over the medium to long term, even though some may be susceptible to cyclical trends or variability in earnings. This rating broadly corresponds to ratings “Ba1” to “Ba3” and “BB+” to “BB-” of Moody’s and Standard & Poor respectively. |
| |
Sub-standard but not past due or impaired | | Customers that have demonstrated some operational and financial instability, with variability and uncertainty in profitability and liquidity projected to continue over the short and possibly medium term. This rating broadly corresponds to ratings “B1” to “Caa” and “B+” to “CCC” of Moody’s and Standard & Poor respectively. |
| | | | | | | | | | | | | | | | | | | | | | | | | | | | | | | | |
| | | Strong credit profile | | | Satisfactory risk | | | Sub-standard but not past due or impaired | | | Total | |
Consolidated | | 2009
$m | | | 2008
$m | | | 2009
$m | | | 2008
$m | | | 2009
$m | | | 2008
$m | | | 2009
$m | | | 2008
$m | |
Liquid assets | | | 21,631 | | | | 18,526 | | | | 368 | | | | 1,496 | | | | 210 | | | | 159 | | | | 22,209 | | | | 20,181 | |
Due from other financial institutions | | | 4,959 | | | | 9,146 | | | | 20 | | | | 578 | | | | 6 | | | | 138 | | | | 4,985 | | | | 9,862 | |
Trading securities | | | 30,570 | | | | 14,304 | | | | 421 | | | | 840 | | | | — | | | | 13 | | | | 30,991 | | | | 15,157 | |
Derivative financial instruments | | | 35,317 | | | | 34,511 | | | | 1,336 | | | | 1,870 | | | | 619 | | | | 505 | | | | 37,272 | | | | 36,886 | |
Available-for-sale assets | | | 15,181 | | | | 15,842 | | | | 931 | | | | 1,077 | | | | 4 | | | | 100 | | | | 16,116 | | | | 17,019 | |
Net loans and advances and acceptances | | | | | | | | | | | | | | | | | | | | | | | | | | | | | | | | |
– Australia | | | 167,814 | | | | 166,735 | | | | 55,723 | | | | 57,687 | | | | 12,660 | | | | 10,305 | | | | 236,197 | | | | 234,727 | |
– New Zealand | | | 51,911 | | | | 54,591 | | | | 19,891 | | | | 21,710 | | | | 4,479 | | | | 2,603 | | | | 76,281 | | | | 78,904 | |
– Asia Pacific, Europe & America | | | 9,987 | | | | 14,585 | | | | 6,431 | | | | 5,853 | | | | 1,444 | | | | 415 | | | | 17,862 | | | | 20,853 | |
Other financial assets2 | | | 3,254 | | | | 4,246 | | | | 7 | | | | 27 | | | | 4 | | | | — | | | | 3,265 | | | | 4,273 | |
Credit related commitments1 | | | 105,167 | | | | 110,390 | | | | 23,072 | | | | 27,397 | | | | 3,220 | | | | 3,372 | | | | 131,459 | | | | 141,159 | |
| | | | | | | | | | | | | | | | | | | | | | | | | | | | | | | | |
| | | 445,791 | | | | 442,876 | | | | 108,200 | | | | 118,535 | | | | 22,646 | | | | 17,610 | | | | 576,637 | | | | 579,021 | |
| | | | | | | | | | | | | | | | | | | | | | | | | | | | | | | | |
| | | | | | | | | | | | | | | | | | | | | | | | | | | | | | | | |
| | | Strong credit profile | | | Satisfactory risk | | | Sub-standard but not past due or impaired | | | Total | |
The Company | | 2009
$m | | | 2008
$m | | | 2009
$m | | | 2008
$m | | | 2009
$m | | | 2008
$m | | | 2009
$m | | | 2008
$m | |
Liquid assets | | | 18,970 | | | | 15,423 | | | | 144 | | | | 1,239 | | | | 207 | | | | 159 | | | | 19,321 | | | | 16,821 | |
Due from other financial institutions | | | 3,211 | | | | 7,884 | | | | 20 | | | | 557 | | | | 5 | | | | 132 | | | | 3,236 | | | | 8,573 | |
Trading securities | | | 27,141 | | | | 11,973 | | | | 269 | | | | 840 | | | | — | | | | 13 | | | | 27,410 | | | | 12,826 | |
Derivative financial instruments | | | 31,322 | | | | 31,288 | | | | 986 | | | | 1,507 | | | | 561 | | | | 448 | | | | 32,869 | | | | 33,243 | |
Available-for-sale assets | | | 13,093 | | | | 14,542 | | | | 58 | | | | 65 | | | | — | | | | 88 | | | | 13,151 | | | | 14,695 | |
Net loans and advances and acceptances | | | | | | | | | | | | | | | | | | | | | | | | | | | | | | | | |
– Australia | | | 168,156 | | | | 165,469 | | | | 55,809 | | | | 49,317 | | | | 12,660 | | | | 7,436 | | | | 236,625 | | | | 222,222 | |
– New Zealand | | | 6,487 | | | | — | | | | 418 | | | | — | | | | 87 | | | | — | | | | 6,992 | | | | — | |
– Asia Pacific, Europe & America | | | 9,199 | | | | 12,101 | | | | 4,283 | | | | 5,159 | | | | 823 | | | | 341 | | | | 14,305 | | | | 17,601 | |
Other financial assets2 | | | 2,167 | | | | 2,927 | | | | 2 | | | | 25 | | | | — | | | | — | | | | 2,169 | | | | 2,952 | |
Credit related commitments1 | | | 90,469 | | | | 95,026 | | | | 18,397 | | | | 20,348 | | | | 2,266 | | | | 2,582 | | | | 111,132 | | | | 117,956 | |
| | | | | | | | | | | | | | | | | | | | | | | | | | | | | | | | |
| | | 370,215 | | | | 356,633 | | | | 80,386 | | | | 79,057 | | | | 16,609 | | | | 11,199 | | | | 467,210 | | | | 446,889 | |
| | | | | | | | | | | | | | | | | | | | | | | | | | | | | | | | |
| 1 | Comprises undrawn facilities and customer contingent liabilities. |
| 2 | Mainly comprises trade dated assets and accrued interest. |
Financial Report135
NOTES TO THE FINANCIAL STATEMENTS
33: Financial Risk Management (continued)
Credit quality of financial assets that are past due but not impaired
Ageing analysis of past due loans financial instruments that are not impaired:
| | | | | | | | | | | | | | | | | | | | | | | | | | | | | | | | | | | | | | | | | | | | | | | | |
| | | Consolidated | | | The Company | |
As at 30 September 2009 | | 1-5
days
$m | | | 6-29
days
$m | | | 30-59
days
$m | | | 60-89
days
$m | | | >90
days
$m | | | Total
$m | | | 1-5
days
$m | | | 6-29
days
$m | | | 30-59
days
$m | | | 60-89
days
$m | | | >90
days
$m | | | Total
$m | |
Liquid assets | | | — | | | | — | | | | — | | | | — | | | | — | | | | — | | | | — | | | | — | | | | — | | | | — | | | | — | | | | — | |
Due from other financial institutions | | | — | | | | — | | | | — | | | | — | | | | — | | | | — | | | | — | | | | — | | | | — | | | | — | | | | — | | | | — | |
Trading securities | | | — | | | | — | | | | — | | | | — | | | | — | | | | — | | | | — | | | | — | | | | — | | | | — | | | | — | | | | — | |
Derivative financial instruments | | | — | | | | — | | | | — | | | | — | | | | — | | | | — | | | | — | | | | — | | | | — | | | | — | | | | — | | | | — | |
Available-for-sale assets | | | — | | | | — | | | | — | | | | — | | | | — | | | | — | | | | — | | | | — | | | | — | | | | — | | | | — | | | | — | |
Net loans and advances and acceptances1 | | | | | | | | | | | | | | | | | | | | | | | | | | | | | | | | | | | | | | | | | | | | | | | — | |
– Australia | | | 1,478 | | | | 3,376 | | | | 1,110 | | | | 457 | | | | 1,068 | | | | 7,489 | | | | 1,478 | | | | 3,376 | | | | 1,110 | | | | 457 | | | | 1,068 | | | | 7,489 | |
– New Zealand | | | 665 | | | | 820 | | | | 315 | | | | 187 | | | | 365 | | | | 2,352 | | | | 33 | | | | 126 | | | | 22 | | | | 9 | | | | 9 | | | | 199 | |
– Asia Pacific, Europe & America4 | | | — | | | | 322 | | | | — | | | | 42 | | | | 164 | | | | 528 | | | | — | | | | 187 | | | | — | | | | 18 | | | | 123 | | | | 328 | |
Other financial assets2 | | | — | | | | — | | | | — | | | | — | | | | — | | | | — | | | | — | | | | — | | | | — | | | | — | | | | — | | | | — | |
Credit related commitments3 | | | — | | | | — | | | | — | | | | — | | | | — | | | | — | | | | — | | | | — | | | | — | | | | — | | | | — | | | | — | |
| | | | | | | | | | | | | | | | | | | | | | | | | | | | | | | | | | | | | | | | | | | | | | | | |
| | | 2,143 | | | | 4,518 | | | | 1,425 | | | | 686 | | | | 1,597 | | | | 10,369 | | | | 1,511 | | | | 3,689 | | | | 1,132 | | | | 484 | | | | 1,200 | | | | 8,016 | |
| | | | | | | | | | | | | | | | | | | | | | | | | | | | | | | | | | | | | | | | | | | | | | | | |
| | | | | | | | | | | | | | | | | | | | | | | | | | | | | | | | | | | | | | | | | | | | | | | | |
| | | Consolidated | | | The Company | |
As at 30 September 2008 | | 1-5
days
$m | | | 6-29
days
$m | | | 30-59
days
$m | | | 60-89
days
$m | | | >90
days
$m | | | Total
$m | | | 1-5
days
$m | | | 6-29
days
$m | | | 30-59
days
$m | | | 60-89
days
$m | | | >90
days
$m | | | Total
$m | |
Liquid assets | | | — | | | | — | | | | — | | | | — | | | | — | | | | — | | | | — | | | | — | | | | — | | | | — | | | | — | | | | — | |
Due from other financial institutions | | | — | | | | — | | | | — | | | | — | | | | — | | | | — | | | | — | | | | — | | | | — | | | | — | | | | — | | | | — | |
Trading securities | | | — | | | | — | | | | — | | | | — | | | | — | | | | — | | | | — | | | | — | | | | — | | | | — | | | | — | | | | — | |
Derivative financial instruments | | | — | | | | — | | | | — | | | | — | | | | — | | | | — | | | | — | | | | — | | | | — | | | | — | | | | — | | | | — | |
Available-for-sale assets | | | — | | | | — | | | | — | | | | — | | | | — | | | | — | | | | — | | | | — | | | | — | | | | — | | | | — | | | | — | |
Net loans and advances and acceptances1 | | | | | | | | | | | | | | | | | | | | | | | | | | | | | | | | | | | | | | | | | | | | | | | — | |
– Australia | | | 2,078 | | | | 4,919 | | | | 1,108 | | | | 891 | | | | 775 | | | | 9,771 | | | | 2,073 | | | | 4,692 | | | | 976 | | | | 831 | | | | 750 | | | | 9,322 | |
– New Zealand | | | 1,018 | | | | 961 | | | | 396 | | | | 171 | | | | 259 | | | | 2,805 | | | | — | | | | — | | | | — | | | | — | | | | — | | | | — | |
– Asia Pacific, Europe & America4 | | | — | | | | 240 | | | | — | | | | 42 | | | | 26 | | | | 308 | | | | — | | | | 138 | | | | — | | | | 16 | | | | 8 | | | | 162 | |
Other financial assets2 | | | — | | | | — | | | | — | | | | — | | | | — | | | | — | | | | — | | | | — | | | | — | | | | — | | | | — | | | | — | |
Credit related commitments3 | | | — | | | | — | | | | — | | | | — | | | | — | | | | — | | | | — | | | | — | | | | — | | | | — | | | | — | | | | — | |
| | | | | | | | | | | | | | | | | | | | | | | | | | | | | | | | | | | | | | | | | | | | | | | | |
| | | 3,096 | | | | 6,120 | | | | 1,504 | | | | 1,104 | | | | 1,060 | | | | 12,884 | | | | 2,073 | | | | 4,830 | | | | 976 | | | | 847 | | | | 758 | | | | 9,484 | |
| | | | | | | | | | | | | | | | | | | | | | | | | | | | | | | | | | | | | | | | | | | | | | | | |
| 1 | Includes Customers’ Liability for Acceptances. |
| 2 | Other financial assets is a subset of Other Assets that includes trade dated trading assets and accrued interest. |
| 3 | Credit related commitments comprise undrawn facilities and customer contingent liabilities. |
| 4 | For Asia Pacific, Europe and America, past due pools comprise 1-29 days (shown above in the 6-29 days band) and 30-89 days (shown above in the 60-89 days band). |
Ageing analysis of past due loans is used by the Group to measure and manage emerging credit risks. Financial assets that are past due but not impaired include those which are assessed, approved and managed on a portfolio basis within a centralised environment (for example credit cards and personal loans), those which can be held on a productive basis until they are 180 days past due and those which are managed on an individual basis.
A large portion of retail credit exposures, such as residential mortgages, are generally well secured. That is, the fair value of associated security is sufficient to ensure that ANZ will recover the entire amount owing over the life of the facility and there is reasonable assurance that collection efforts will result in payment of the amounts due in a timely manner.
136 ANZ Annual Report 2009
NOTES TO THE FINANCIAL STATEMENTS
33: Financial Risk Management (continued)
For all lending proposals, ANZ business units assess the value of the assets being financed and judge the appropriateness of taking a security interest in the assets being financed or other customer assets, based on the risk profile of the customer. Each security is held in favour of the specific ANZ entity providing the facility to which it applies. This is an important part in setting the credit appetite for loan amounts. Collateral provided is valued conservatively on a realistically recoverable basis assuming an event of default. Credit policy requires that collateral be re-valued on a regular basis with the frequency varying depending on the nature of the security. The adequacy of security valuations must also be considered at each customer review. ANZ seeks to ensure that assets of non-individual customer entities are covered by registered mortgage debenture or equivalent charge to give ANZ access to the assets in appropriate circumstances. ANZ extends value against types of collateral based on likely recovery rates in the event of default. Parameters for calculating extended values are determined after analysis of historical loss information. Extended values serve as guides in the determination of potential losses in the event of default and also in setting appetites for loan amounts.
For the purposes of this disclosure, where security is valued at more than the corresponding credit exposure, coverage is capped at the value of the credit exposure.
Estimated value of collateral and other charges related to past due financial instruments that are past due but not impaired.
| | | | | | | | | | | | | | | | | | | | | | | | | | | | | | | | | | | | | | | | | | | | | | | | |
| | | Cash and
securities | | | Real estate | | | Other | | | Total value of
collateral | | | Credit exposure | | | Unsecured
portion of credit
exposure | |
Consolidated | | 2009
$m | | | 2008
$m | | | 2009
$m | | | 2008
$m | | | 2009
$m | | | 2008
$m | | | 2009
$m | | | 2008
$m | | | 2009
$m | | | 2008
$m | | | 2009
$m | | | 2008
$m | |
Liquid assets | | | — | | | | — | | | | — | | | | — | | | | — | | | | — | | | | — | | | | — | | | | — | | | | — | | | | — | | | | — | |
Due from other financial institutions | | | — | | | | — | | | | — | | | | — | | | | — | | | | — | | | | — | | | | — | | | | — | | | | — | | | | — | | | | — | |
Trading securities | | | — | | | | — | | | | — | | | | — | | | | — | | | | — | | | | — | | | | — | | | | — | | | | — | | | | — | | | | — | |
Derivative financial instruments | | | — | | | | — | | | | — | | | | — | | | | — | | | | — | | | | — | | | | — | | | | — | | | | — | | | | — | | | | — | |
Available-for-sale assets | | | — | | | | — | | | | — | | | | — | | | | — | | | | — | | | | — | | | | — | | | | — | | | | — | | | | — | | | | — | |
Net loans and advances and acceptances1 | | | | | | | | | | | | | | | | | | | | | | | | | | | | | | | | | | | | | | | | | | | | | | | | |
– Australia | | | — | | | | — | | | | 5,238 | | | | 6,536 | | | | 1,501 | | | | 1,743 | | | | 6,739 | | | | 8,279 | | | | 7,489 | | | | 9,771 | | | | 750 | | | | 1,492 | |
– New Zealand | | | — | | | | — | | | | 1,606 | | | | 1,765 | | | | 320 | | | | 388 | | | | 1,926 | | | | 2,153 | | | | 2,352 | | | | 2,805 | | | | 426 | | | | 652 | |
– Asia Pacific, Europe & America | | | — | | | | — | | | | 76 | | | | — | | | | 287 | | | | — | | | | 363 | | | | — | | | | 528 | | | | 308 | | | | 165 | | | | 308 | |
Other financial assets2 | | | — | | | | — | | | | — | | | | — | | | | — | | | | — | | | | — | | | | — | | | | — | | | | — | | | | — | | | | — | |
Credit related commitments3 | | | — | | | | — | | | | — | | | | — | | | | — | | | | — | | | | — | | | | — | | | | — | | | | — | | | | — | | | | — | |
| | | | | | | | | | | | | | | | | | | | | | | | | | | | | | | | | | | | | | | | | | | | | | | | |
| | | — | | | | — | | | | 6,920 | | | | 8,301 | | | | 2,108 | | | | 2,131 | | | | 9,028 | | | | 10,432 | | | | 10,369 | | | | 12,884 | | | | 1,341 | | | | 2,452 | |
| | | | | | | | | | | | | | | | | | | | | | | | | | | | | | | | | | | | | | | | | | | | | | | | |
| | | | | | | | | | | | | | | | | | | | | | | | | | | | | | | | | | | | | | | | | | | | | | | | |
| | | Cash and
securities | | | Real estate | | | Other | | | Total value of
collateral | | | Credit exposure | | | Unsecured
portion of credit
exposure | |
The Company | | 2009
$m | | | 2008
$m | | | 2009
$m | | | 2008
$m | | | 2009
$m | | | 2008
$m | | | 2009
$m | | | 2008
$m | | | 2009
$m | | | 2008
$m | | | 2009
$m | | | 2008
$m | |
Liquid assets | | | — | | | | — | | | | — | | | | — | | | | — | | | | — | | | | — | | | | — | | | | — | | | | — | | | | — | | | | — | |
Due from other financial institutions | | | — | | | | — | | | | — | | | | — | | | | — | | | | — | | | | — | | | | — | | | | — | | | | — | | | | — | | | | — | |
Trading securities | | | — | | | | — | | | | — | | | | — | | | | — | | | | — | | | | — | | | | — | | | | — | | | | — | | | | — | | | | — | |
Derivative financial instruments | | | — | | | | — | | | | — | | | | — | | | | — | | | | — | | | | — | | | | — | | | | — | | | | — | | | | — | | | | — | |
Available-for-sale assets | | | — | | | | — | | | | — | | | | — | | | | — | | | | — | | | | — | | | | — | | | | — | | | | — | | | | — | | | | — | |
Net loans and advances and acceptances1 | | | | | | | | | | | | | | | | | | | | | | | | | | | | | | | | | | | | | | | | | | | | | | | | |
– Australia | | | — | | | | — | | | | 5,238 | | | | 6,535 | | | | 1,501 | | | | 1,393 | | | | 6,739 | | | | 7,928 | | | | 7,489 | | | | 9,322 | | | | 750 | | | | 1,394 | |
– New Zealand | | | — | | | | — | | | | 199 | | | | — | | | | — | | | | — | | | | 199 | | | | — | | | | 199 | | | | — | | | | — | | | | — | |
– Asia Pacific, Europe & America | | | — | | | | — | | | | 53 | | | | — | | | | 153 | | | | — | | | | 206 | | | | — | | | | 328 | | | | 162 | | | | 122 | | | | 162 | |
Other financial assets2 | | | — | | | | — | | | | — | | | | — | | | | — | | | | — | | | | — | | | | — | | | | — | | | | — | | | | — | | | | — | |
Credit related commitments3 | | | — | | | | — | | | | — | | | | — | | | | — | | | | — | | | | — | | | | — | | | | — | | | | — | | | | — | | | | — | |
| | | | | | | | | | | | | | | | | | | | | | | | | | | | | | | | | | | | | | | | | | | | | | | | |
| | | — | | | | — | | | | 5,490 | | | | 6,535 | | | | 1,654 | | | | 1,393 | | | | 7,144 | | | | 7,928 | | | | 8,016 | | | | 9,484 | | | | 872 | | | | 1,556 | |
| | | | | | | | | | | | | | | | | | | | | | | | | | | | | | | | | | | | | | | | | | | | | | | | |
| 1 | Includes Customers’ Liability for Acceptances. |
| 2 | Other financial assets is a subset of Other Assets that includes trade dated trading assets and accrued interest. |
| 3 | Credit related commitments comprise undrawn facilities and customer contingent liabilities. |
Financial Report137
NOTES TO THE FINANCIAL STATEMENTS
33: Financial Risk Management (continued)
Credit quality of financial assets that are individually impaired
ANZ regularly reviews its portfolio and monitors adherence to contractual terms. When doubt arises as to the collectability of a credit facility, the financial instrument (or ‘the facility’) is classified and reported as individually impaired and an individual provision is allocated against it. As described in the summary of significant accounting policies, provisions are recorded using allowance accounts for financial instruments that are reported on the balance sheet at amortised cost. For instruments reported at fair value, impairment provisions are treated as part of overall change in fair value and directly reduce the reported carrying amounts.
| | | | | | | | | | | | | | | | | | | | | | | | | | | | | | | | |
| | | Consolidated | | | The Company | |
| | | Impaired
instruments | | | Individual provision
balances | | | Impaired instruments | | | Individual provision
balances | |
| | | 2009
$m | | | 2008
$m | | | 2009
$m | | | 2008
$m | | | 2009
$m | | | 2008
$m | | | 2009
$m | | | 2008
$m | |
Australia | | | | | | | | | | | | | | | | | | | | | | | | | | | | | | | | |
Liquid assets | | | — | | | | — | | | | — | | | | — | | | | — | | | | — | | | | — | | | | — | |
Due from other financial institutions | | | — | | | | — | | | | — | | | | — | | | | — | | | | — | | | | — | | | | — | |
Trading securities | | | — | | | | — | | | | — | | | | — | | | | — | | | | — | | | | — | | | | — | |
Derivative financial instruments | | | 127 | | | | — | | | | — | | | | — | | | | 127 | | | | — | | | | — | | | | — | |
Available-for-sale assets | | | — | | | | — | | | | — | | | | — | | | | — | | | | — | | | | — | | | | — | |
Net loans and advances and acceptances1 | | | 3,232 | | | | 1,306 | | | | 1,048 | | | | 487 | | | | 3,210 | | | | 1,201 | | | | 1,026 | | | | 424 | |
Other financial assets2 | | | — | | | | — | | | | — | | | | — | | | | — | | | | — | | | | — | | | | — | |
Credit related commitments3 | | | 377 | | | | 72 | | | | 12 | | | | 29 | | | | 377 | | | | 72 | | | | 12 | | | | 29 | |
| | | | | | | | | | | | | | | | | | | | | | | | | | | | | | | | |
| | | 3,736 | | | | 1,378 | | | | 1,060 | | | | 516 | | | | 3,714 | | | | 1,273 | | | | 1,038 | | | | 453 | |
| | | | | | | | | | | | | | | | | | | | | | | | | | | | | | | | |
New Zealand | | | | | | | | | | | | | | | | | | | | | | | | | | | | | | | | |
Liquid assets | | | — | | | | — | | | | — | | | | — | | | | — | | | | — | | | | — | | | | — | |
Due from other financial institutions | | | — | | | | — | | | | — | | | | — | | | | — | | | | — | | | | — | | | | — | |
Trading securities | | | — | | | | — | | | | — | | | | — | | | | — | | | | — | | | | — | | | | — | |
Derivative financial instruments | | | — | | | | — | | | | — | | | | — | | | | — | | | | — | | | | — | | | | — | |
Available-for-sale assets | | | — | | | | — | | | | — | | | | — | | | | — | | | | — | | | | — | | | | — | |
Net loans and advances and acceptances1 | | | 973 | | | | 274 | | | | 389 | | | | 111 | | | | 8 | | | | — | | | | 2 | | | | — | |
Other financial assets2 | | | — | | | | — | | | | — | | | | — | | | | — | | | | — | | | | — | | | | — | |
Credit related commitments3 | | | 26 | | | | 5 | | | | 2 | | | | — | | | | | | | | — | | | | — | | | | — | |
| | | | | | | | | | | | | | | | | | | | | | | | | | | | | | | | |
| | | 999 | | | | 279 | | | | 391 | | | | 111 | | | | 8 | | | | — | | | | 2 | | | | — | |
| | | | | | | | | | | | | | | | | | | | | | | | | | | | | | | | |
Overseas Markets | | | | | | | | | | | | | | | | | | | | | | | | | | | | | | | | |
Liquid assets | | | — | | | | — | | | | — | | | | — | | | | — | | | | — | | | | — | | | | — | |
Due from other financial institutions | | | — | | | | — | | | | — | | | | — | | | | — | | | | — | | | | — | | | | — | |
Trading securities | | | — | | | | — | | | | — | | | | — | | | | — | | | | — | | | | — | | | | — | |
Derivative financial instruments | | | — | | | | — | | | | — | | | | — | | | | — | | | | — | | | | — | | | | — | |
Available-for-sale assets | | | — | | | | 15 | | | | — | | | | — | | | | — | | | | 15 | | | | — | | | | — | |
Net loans and advances and acceptances1 | | | 187 | | | | 170 | | | | 75 | | | | 48 | | | | 92 | | | | 146 | | | | 22 | | | | 35 | |
Other financial assets2 | | | — | | | | — | | | | — | | | | — | | | | — | | | | — | | | | — | | | | — | |
Credit related commitments3 | | | — | | | | — | | | | — | | | | — | | | | — | | | | — | | | | — | | | | — | |
| | | | | | | | | | | | | | | | | | | | | | | | | | | | | | | | |
| | | 187 | | | | 185 | | | | 75 | | | | 48 | | | | 92 | | | | 161 | | | | 22 | | | | 35 | |
| | | | | | | | | | | | | | | | | | | | | | | | | | | | | | | | |
Aggregate | | | | | | | | | | | | | | | | | | | | | | | | | | | | | | | | |
Liquid assets | | | — | | | | — | | | | — | | | | — | | | | — | | | | — | | | | — | | | | — | |
Due from other financial institutions | | | — | | | | — | | | | — | | | | — | | | | — | | | | — | | | | — | | | | — | |
Trading securities | | | — | | | | — | | | | — | | | | — | | | | — | | | | — | | | | — | | | | — | |
Derivative financial instruments | | | 127 | | | | — | | | | — | | | | — | | | | 127 | | | | — | | | | — | | | | — | |
Available-for-sale assets | | | — | | | | 15 | | | | — | | | | — | | | | — | | | | 15 | | | | — | | | | — | |
Net loans and advances and acceptances1 | | | 4,392 | | | | 1,750 | | | | 1,512 | | | | 646 | | | | 3,310 | | | | 1,347 | | | | 1,050 | | | | 459 | |
Other financial assets2 | | | — | | | | — | | | | — | | | | — | | | | — | | | | — | | | | — | | | | — | |
Credit related commitments3 | | | 403 | | | | 77 | | | | 14 | | | | 29 | | | | 377 | | | | 72 | | | | 12 | | | | 29 | |
| | | | | | | | | | | | | | | | | | | | | | | | | | | | | | | | |
| | | 4,922 | | | | 1,842 | | | | 1,526 | | | | 675 | | | | 3,814 | | | | 1,434 | | | | 1,062 | | | | 488 | |
| | | | | | | | | | | | | | | | | | | | | | | | | | | | | | | | |
| 1 | Includes Customers’ Liability for Acceptances. |
| 2 | Other financial assets is a subset of Other Assets that includes trade dated trading assets and accrued interest. |
| 3 | Credit related commitments comprise undrawn facilities and customer contingent liabilities. |
138ANZ Annual Report 2009
NOTES TO THE FINANCIAL STATEMENTS
33: Financial Risk Management (continued)
Credit quality of financial assets that are individually impaired (continued)
Estimated value of collateral and other charges related to financial assets that are individually impaired. For the purposes of this disclosure, where security held is valued at more than the corresponding credit exposure, coverage is capped at the value of the credit exposure.
| | | | | | | | | | | | | | | | | | | | | | | | | | | | | | | | | | | | | | | | | | | | | | | | |
| | | | | | | | | | | | | | | | | | | | | Total value of | | | | | | | | | Unsecured portion of | |
| | | Cash and securities | | | Real estate | | | Other | | | collateral | | | Credit exposure | | | credit exposure | |
Consolidated | | 2009
$m | | | 2008
$m | | | 2009
$m | | | 2008
$m | | | 2009
$m | | | 2008
$m | | | 2009
$m | | | 2008
$m | | | 2009
$m | | | 2008
$m | | | 2009
$m | | | 2008
$m | |
Liquid assets | | | — | | | | — | | | | — | | | | — | | | | — | | | | — | | | | — | | | | — | | | | — | | | | — | | | | — | | | | — | |
Due from other financial institutions | | | — | | | | — | | | | — | | | | — | | | | — | | | | — | | | | — | | | | — | | | | — | | | | — | | | | — | | | | — | |
Trading securities | | | — | | | | — | | | | — | | | | — | | | | — | | | | — | | | | — | | | | — | | | | — | | | | — | | | | — | | | | — | |
Derivative financial instruments | | | — | | | | — | | | | 53 | | | | — | | | | 74 | | | | — | | | | 127 | | | | — | | | | 127 | | | | — | | | | — | | | | — | |
Available-for-sale assets | | | — | | | | — | | | | — | | | | — | | | | — | | | | — | | | | — | | | | — | | | | — | | | | 15 | | | | — | | | | 15 | |
Net loans and advances and acceptances1 | | | | | | | | | | | | | | | | | | | | | | | | | | | | | | | | | | | | | | | | | | | | | | | | |
– Australia | | | — | | | | 7 | | | | 1,011 | | | | 469 | | | | 1,173 | | | | 343 | | | | 2,184 | | | | 819 | | | | 3,232 | | | | 1,306 | | | | 1,048 | | | | 487 | |
– New Zealand | | | — | | | | — | | | | 400 | | | | 94 | | | | 184 | | | | 69 | | | | 584 | | | | 163 | | | | 973 | | | | 274 | | | | 389 | | | | 111 | |
– Asia Pacific, Europe & America | | | — | | | | — | | | | 13 | | | | — | | | | 99 | | | | 122 | | | | 112 | | | | 122 | | | | 187 | | | | 170 | | | | 75 | | | | 48 | |
Other financial assets2 | | | — | | | | — | | | | — | | | | — | | | | — | | | | — | | | | — | | | | — | | | | — | | | | — | | | | — | | | | — | |
Credit related commitments3 | | | 5 | | | | — | | | | 9 | | | | 4 | | | | 375 | | | | 44 | | | | 389 | | | | 48 | | | | 403 | | | | 77 | | | | 14 | | | | 29 | |
| | | | | | | | | | | | | | | | | | | | | | | | | | | | | | | | | | | | | | | | | | | | | | | | |
| | | 5 | | | | 7 | | | | 1,486 | | | | 567 | | | | 1,905 | | | | 578 | | | | 3,396 | | | | 1,152 | | | | 4,922 | | | | 1,842 | | | | 1,526 | | | | 690 | |
| | | | | | | | | | | | | | | | | | | | | | | | | | | | | | | | | | | | | | | | | | | | | | | | |
| | | | | | | | | | | | | | | | | | | | | | | | | | | | | | | | | | | | | | | | | | | | | | | | |
| | | Total value of | | | Unsecured portion of | |
| | | Cash and securities | | | Real estate | | | Other | | | collateral | | | Credit exposure | | | credit exposure | |
The Company | | 2009
$m | | | 2008
$m | | | 2009
$m | | | 2008
$m | | | 2009
$m | | | 2008
$m | | | 2009
$m | | | 2008
$m | | | 2009
$m | | | 2008
$m | | | 2009
$m | | | 2008
$m | |
Liquid assets | | | — | | | | — | | | | — | | | | — | | | | — | | | | — | | | | — | | | | — | | | | — | | | | — | | | | — | | | | — | |
Due from other financial institutions | | | — | | | | — | | | | — | | | | — | | | | — | | | | — | | | | — | | | | — | | | | — | | | | — | | | | — | | | | — | |
Trading securities | | | — | | | | — | | | | — | | | | — | | | | — | | | | — | | | | — | | | | — | | | | — | | | | — | | | | — | | | | — | |
Derivative financial instruments | | | — | | | | — | | | | 53 | | | | — | | | | 74 | | | | — | | | | 127 | | | | — | | | | 127 | | | | — | | | | — | | | | — | |
Available-for-sale assets | | | — | | | | — | | | | — | | | | — | | | | — | | | | — | | | | — | | | | — | | | | — | | | | 15 | | | | — | | | | 15 | |
Net loans and advances and acceptances1 | | | | | | | | | | | | | | | | | | | | | | | | | | | | | | | | | | | | | | | | | | | | | | | | |
– Australia | | | — | | | | 5 | | | | 1,011 | | | | 469 | | | | 1,173 | | | | 303 | | | | 2,184 | | | | 777 | | | | 3,210 | | | | 1,201 | | | | 1,026 | | | | 424 | |
– New Zealand | | | — | | | | — | | | | 6 | | | | — | | | | — | | | | — | | | | 6 | | | | — | | | | 8 | | | | — | | | | 2 | | | | — | |
– Asia Pacific, Europe & America | | | — | | | | — | | | | 13 | | | | — | | | | 57 | | | | 111 | | | | 70 | | | | 111 | | | | 92 | | | | 146 | | | | 22 | | | | 35 | |
Other financial assets2 | | | — | | | | — | | | | — | | | | — | | | | — | | | | — | | | | — | | | | — | | | | — | | | | — | | | | — | | | | — | |
Credit related commitments3 | | | 5 | | | | — | | | | 2 | | | | 4 | | | | 358 | | | | 39 | | | | 365 | | | | 43 | | | | 377 | | | | 72 | | | | 12 | | | | 29 | |
| | | | | | | | | | | | | | | | | | | | | | | | | | | | | | | | | | | | | | | | | | | | | | | | |
| | | 5 | | | | 5 | | | | 1,085 | | | | 473 | | | | 1,662 | | | | 453 | | | | 2,752 | | | | 931 | | | | 3,814 | | | | 1,434 | | | | 1,062 | | | | 503 | |
| | | | | | | | | | | | | | | | | | | | | | | | | | | | | | | | | | | | | | | | | | | | | | | | |
| 1 | Includes Customers’ Liability for Acceptances. |
| 2 | Other financial assets is a subset of Other Assets that includes trade dated trading assets and accrued interest. |
| 3 | Credit related commitments comprise undrawn facilities and customer contingent liabilities. |
Financial Report 139
NOTES TO THE FINANCIAL STATEMENTS
33: Financial Risk Management (continued)
MARKET RISK
Market risk is the risk to the Group’s earnings arising from changes in interest rates, currency exchange rates, credit spreads, or from fluctuations in bond, commodity or equity prices.
Market risk arises when changes in market rates, prices and volatilities lead to a decline in the value of assets and liabilities, including financial derivatives. Market risk is generated through both trading and banking book activities.
ANZ conducts trading operations in interest rates, foreign exchange, commodities, securities and equities. Trading operations largely focus on supporting customer hedging and investing activities, rather than outright proprietary trading.
ANZ has a detailed risk management and control framework to support its trading and balance sheet activities. The framework incorporates a risk measurement approach to quantify the magnitude of market risk within trading and balance sheet portfolios. This approach and related analysis identifies the range of possible outcomes that can be expected over a given period of time, establishes the relative likelihood of those outcomes and allocates an appropriate amount of capital to support these activities.
Group-wide responsibility for the strategies and policies relating to the management of market risk lies with the Board Risk Committee. Responsibility for day to day management of both market risks and compliance with market risk policy is delegated by the Risk Committee to the Credit and Market Risk Committee (‘CMRC’) and the Group Asset & Liability Committee (‘GALCO’). The CMRC, chaired by the Chief Risk Officer, is responsible for the oversight of market risk. All committees receive regular reporting on the range of trading and balance sheet market risks that ANZ incurs.
Within overall strategies and policies, the control of market risk at the Group level is the joint responsibility of Business Units and Risk Management, with the delegation of market risk limits from the Board and CMRC allocated to both Risk Management and the Business Units.
The management of market risk is supported by a comprehensive limit and policy framework to control the amount of risk that the Group will accept. Market risk limits are allocated at various levels and are reported and monitored by Market Risk on a daily basis. The detailed limit framework allocates individual limits to manage and control asset classes (e.g. interest rates, equities), risk factors (e.g. interest rates, volatilities) and P&L limits (to monitor and manage the performance of the trading portfolios).
Market risk management and control responsibilities
To facilitate the management, measurement and reporting of market risk, ANZ has grouped market risk into two broad categories:
a) Traded market risk
This is the risk of loss from changes in the value of financial instruments due to movements in price factors for both physical and derivative trading positions. Trading positions arise from transactions where ANZ acts as principal with customers, financial exchanges or interbank counterparties.
The principal risk categories monitored are:
| • | | Currency risk is the potential loss arising from the decline in the value of a financial instrument due to changes in foreign exchange rates or their implied volatilities. |
| • | | Interest rate risk is the potential loss arising from the change in the value of a financial instrument due to changes in market interest rates or their implied volatilities. |
| • | | Credit spread risk is the potential loss arising from a change in value of an instrument due to a movement of its margin or spread relative to a benchmark. |
| • | | Commodity risk is the potential loss arising from the decline in the value of a financial instrument due to changes in commodity prices, or their implied volatilities. |
b) Non-traded market risk (or balance sheet risk)
This comprises the management of non-traded interest rate risk, liquidity, and the risk to the Australian dollar denominated value of the Group’s capital and earnings as a result of foreign exchange rate movements.
Some instruments do not fall into either category that also expose ANZ to market risk. These include equity securities classified as available-for-sale financial assets that predominantly comprise long term strategic investments.
Value at Risk (VaR) measure
A key measure of market risk is Value at Risk (VaR). VaR is a statistical estimate of the possible daily loss and is based on historical market movements.
ANZ measures VaR at a 97.5% and 99% confidence interval. This means that there is a 97.5% or 99% chance that the loss will not exceed the VaR estimate on any given day.
The Group’s standard VaR approach for both traded and non-traded risk is historical simulation. The Group calculates VaR using historical changes in market rates, prices and volatilities over the previous 500 business days. Traded and non-traded VaR is calculated using a one-day holding period.
It should be noted that because VaR is driven by actual historical observations, it is not an estimate of the maximum loss that the Group could experience from an extreme market event. As a result of this limitation, the Group utilises a number of other risk measures (e.g. stress testing) and risk sensitivity limits to measure and manage market risk.
140 ANZ Annual Report 2009
NOTES TO THE FINANCIAL STATEMENTS
33: Financial Risk Management (continued)
Traded Market Risk
Trading activities are typically focused on servicing customer hedging and investment requirements. The principal product classes include foreign exchange, interest rate, debt securities, equity and commodity markets. These activities are managed along both global and geographical product lines. The VaR exposures do not include foreign exchange translation exposure on the mark-to market for credit risk on the structured credit derivative as this is not a traded position.
Below are aggregate VaR exposures covering both derivative and non-derivative trading positions for the Group’s product classes.
| | | | | | | | | | | | | | | | | | | | | | | | | | | | | | | | |
| | | 30 September 2009 | | | 30 September 2008 | |
| | | | | | High for | | | Low for | | | Average for | | | | | | High for | | | Low for | | | Average for | |
| | | As at | | | year | | | year | | | year | | | As at | | | year | | | year | | | year | |
Consolidated | | $m | | | $m | | | $m | | | $m | | | $m | | | $m | | | $m | | | $m | |
Value at risk at 97.5% confidence | | | | | | | | | | | | | | | | | | | | | | | | | | | | | | | | |
Foreign exchange | | | 3.5 | | | | 4.6 | | | | 0.9 | | | | 2.0 | | | | 2.4 | | | | 2.4 | | | | 0.4 | | | | 0.8 | |
Interest rate | | | 9.6 | | | | 10.8 | | | | 2.4 | | | | 6.6 | | | | 2.8 | | | | 3.6 | | | | 1.2 | | | | 1.9 | |
Credit spread | | | 2.4 | | | | 3.2 | | | | 1.2 | | | | 1.8 | | | | 1.2 | | | | 2.6 | | | | 0.6 | | | | 1.0 | |
Commodity | | | 1.2 | | | | 4.3 | | | | 0.6 | | | | 1.4 | | | | 1.3 | | | | 1.5 | | | | 0.4 | | | | 1.0 | |
Diversification benefit | | | (7.1 | ) | | | n/a | | | | n/a | | | | (4.4 | ) | | | (3.6 | ) | | | n/a | | | | n/a | | | | (2.2 | ) |
| | | | | | | | | | | | | | | | | | | | | | | | | | | | | | | | |
| | | 9.6 | | | | 13.2 | | | | 3.6 | | | | 7.4 | | | | 4.1 | | | | 4.7 | | | | 1.4 | | | | 2.5 | |
| | | | | | | | | | | | | | | | | | | | | | | | | | | | | | | | |
Value at risk at 99% confidence | | | | | | | | | | | | | | | | | | | | | | | | | | | | | | | | |
Foreign exchange | | | 4.8 | | | | 7.0 | | | | 1.3 | | | | 3.2 | | | | 3.2 | | | | 3.2 | | | | 0.5 | | | | 1.2 | |
Interest rate | | | 19.0 | | | | 19.5 | | | | 3.7 | | | | 10.6 | | | | 5.0 | | | | 5.4 | | | | 1.3 | | | | 2.7 | |
Credit spread | | | 3.1 | | | | 5.3 | | | | 1.6 | | | | 2.4 | | | | 1.8 | | | | 3.9 | | | | 0.9 | | | | 1.6 | |
Commodity | | | 1.7 | | | | 8.0 | | | | 0.8 | | | | 2.3 | | | | 2.0 | | | | 2.3 | | | | 0.6 | | | | 1.4 | |
Diversification benefit | | | (10.8 | ) | | | n/a | | | | n/a | | | | (6.7 | ) | | | (6.1 | ) | | | n/a | | | | n/a | | | | (3.4 | ) |
| | | | | | | | | | | | | | | | | | | | | | | | | | | | | | | | |
| | | 17.8 | | | | 25.9 | | | | 4.5 | | | | 11.8 | | | | 5.9 | | | | 8.2 | | | | 1.7 | | | | 3.5 | |
| | | | | | | | | | | | | | | | | | | | | | | | | | | | | | | | |
| | | | | | | | | | | | | | | | | | | | | | | | | | | | | | | | |
| | | 30 September 2009 | | | 30 September 2008 | |
| | | | | | High for | | | Low for | | | Average for | | | | | | High for | | | Low for | | | Average for | |
| | | As at | | | year | | | year | | | year | | | As at | | | year | | | year | | | year | |
The Company | | $m | | | $m | | | $m | | | $m | | | $m | | | $m | | | $m | | | $m | |
Value at risk at 97.5% confidence | | | | | | | | | | | | | | | | | | | | | | | | | | | | | | | | |
Foreign exchange | | | 3.1 | | | | 3.8 | | | | 0.3 | | | | 1.9 | | | | 2.4 | | | | 2.4 | | | | 0.3 | | | | 0.8 | |
Interest rate | | | 9.4 | | | | 10.6 | | | | 2.0 | | | | 6.4 | | | | 2.3 | | | | 3.5 | | | | 0.8 | | | | 1.7 | |
Credit spread | | | 2.4 | | | | 3.2 | | | | 1.2 | | | | 1.8 | | | | 1.2 | | | | 2.6 | | | | 0.6 | | | | 1.0 | |
Commodity | | | 1.2 | | | | 4.3 | | | | 0.6 | | | | 1.4 | | | | 1.3 | | | | 1.5 | | | | 0.4 | | | | 1.0 | |
Diversification benefit | | | (5.9 | ) | | | n/a | | | | n/a | | | | (3.8 | ) | | | (4.0 | ) | | | n/a | | | | n/a | | | | (2.2 | ) |
| | | | | | | | | | | | | | | | | | | | | | | | | | | | | | | | |
| | | 10.2 | | | | 14.1 | | | | 2.9 | | | | 7.7 | | | | 3.2 | | | | 4.7 | | | | 1.4 | | | | 2.3 | |
| | | | | | | | | | | | | | | | | | | | | | | | | | | | | | | | |
Value at risk at 99% confidence | | | | | | | | | | | | | | | | | | | | | | | | | | | | | | | | |
Foreign exchange | | | 4.5 | | | | 6.6 | | | | 0.4 | | | | 3.0 | | | | 3.2 | | | | 3.2 | | | | 0.4 | | | | 1.1 | |
Interest rate | | | 18.8 | | | | 19.3 | | | | 3.1 | | | | 10.3 | | | | 4.2 | | | | 5.3 | | | | 0.7 | | | | 2.4 | |
Credit spread | | | 3.1 | | | | 5.3 | | | | 1.5 | | | | 2.4 | | | | 1.8 | | | | 3.9 | | | | 0.9 | | | | 1.6 | |
Commodity | | | 1.7 | | | | 8.0 | | | | 0.8 | | | | 2.3 | | | | 2.0 | | | | 2.3 | | | | 0.6 | | | | 1.4 | |
Diversification benefit | | | (11.4 | ) | | | n/a | | | | n/a | | | | (6.0 | ) | | | (6.4 | ) | | | n/a | | | | n/a | | | | (3.0 | ) |
| | | | | | | | | | | | | | | | | | | | | | | | | | | | | | | | |
| | | 16.7 | | | | 25.6 | | | | 3.1 | | | | 12.0 | | | | 4.8 | | | | 8.4 | | | | 2.2 | | | | 3.5 | |
| | | | | | | | | | | | | | | | | | | | | | | | | | | | | | | | |
VaR is calculated separately for Foreign Exchange/Commodities, Interest Rate and Debt Markets, as well as for the Group. The diversification benefit reflects the historical correlation between these products.
To supplement the VaR methodology, ANZ applies a wide range of stress tests, both on individual portfolios and at a Group level. ANZ ‘s stress-testing regime provides senior management with an assessment of the financial impact of identified extreme events on market risk exposures of ANZ. Standard stress tests are applied on a daily basis and measure the potential loss arising from applying extreme market movements to individual and groups of individual price factors. Extraordinary stress tests are applied monthly and measure the potential loss arising as a result of scenarios generated from major financial market events.
Financial Report141
NOTES TO THE FINANCIAL STATEMENTS
33: Financial Risk Management (continued)
Non-Traded Market Risk (Balance Sheet Risk)
The principal objectives of balance sheet management are to manage interest income sensitivity while maintaining acceptable levels of interest rate and liquidity risk and to manage the market value of the Group’s capital. Liquidity risk is dealt with in the next section.
Interest rate risk
The objective of balance sheet interest rate risk management is to secure stable and optimal net interest income over both the short (next 12 months) and long term. Non-traded interest rate risk relates to the potential adverse impact of changes in market interest rates on the Group’s future net interest income. This risk arises from two principal sources: mismatches between the repricing dates of interest bearing assets and liabilities; and the investment of capital and other non-interest bearing liabilities in interest bearing assets. Interest rate risk is reported using various techniques including: VaR and scenario analysis (to a 1% shock).
a) VaR Non-Traded Interest Rate Risk
The repricing assumptions used to determine the VaR and 1% rate shock have been revised to reflect the assumptions approved by APRA under APS 117 Capital Adequacy: Interest Rate Risk in the Banking Book. For interest rate risk modelling, assumptions are made about the interest rate sensitivity of non-bearing interest (NBI) accounts. Previously some of these accounts were profiled at zero duration, but are now profiled based on independently validated statistical analysis where this was deemed appropriate. NBIs without statistical evidence or justification have remained at zero duration. Below are aggregate VaR figures covering non-traded interest rate risk.
| | | | | | | | | | | | | | | | | | | | | | | | | | | | | | | | |
| | | 30 September 2009 | | | 30 September 2008 | |
Consolidated | | As at
$m | | | High for
year
$m | | | Low for
year
$m | | | Average for
year
$m | | | As at
$m | | | High for
year
$m | | | Low for
year
$m | | | Average for
year
$m | |
Value at risk at 97.5% confidence | | | | | | | | | | | | | | | | | | | | | | | | | | | | | | | | |
Australia | | | 18.3 | | | | 20.7 | | | | 12.5 | | | | 17.6 | | | | 11.7 | | | | 11.7 | | | | 5.6 | | | | 8.3 | |
New Zealand | | | 9.3 | | | | 9.3 | | | | 2.8 | | | | 6.0 | | | | 3.4 | | | | 3.4 | | | | 1.8 | | | | 2.7 | |
Overseas Markets | | | 6.4 | | | | 7.9 | | | | 3.3 | | | | 6.0 | | | | 3.1 | | | | 3.6 | | | | 1.7 | | | | 2.7 | |
Diversification benefit | | | (8.0 | ) | | | n/a | | | | n/a | | | | (5.7 | ) | | | (2.8 | ) | | | n/a | | | | n/a | | | | (2.9 | ) |
| | | | | | | | | | | | | | | | | | | | | | | | | | | | | | | | |
| | | 26.0 | | | | 27.1 | | | | 13.8 | | | | 23.9 | | | | 15.4 | | | | 15.4 | | | | 7.9 | | | | 10.8 | |
| | | | | | | | | | | | | | | | | | | | | | | | | | | | | | | | |
| | |
| | | 30 September 2009 | | | 30 September 2008 | |
The Company | | As at
$m | | | High for
year
$m | | | Low for
year
$m | | | Average for
year
$m | | | As at
$m | | | High for
year
$m | | | Low for
year
$m | | | Average for
year
$m | |
Value at risk at 97.5% confidence | | | | | | | | | | | | | | | | | | | | | | | | | | | | | | | | |
Australia | | | 18.3 | | | | 20.7 | | | | 12.5 | | | | 17.6 | | | | 11.7 | | | | 11.7 | | | | 5.6 | | | | 8.3 | |
Overseas Markets | | | 6.2 | | | | 7.5 | | | | 3.1 | | | | 5.8 | | | | 2.6 | | | | 3.0 | | | | 1.4 | | | | 2.2 | |
Diversification benefit | | | (1.0 | ) | | | n/a | | | | n/a | | | | (2.8 | ) | | | (2.2 | ) | | | n/a | | | | n/a | | | | (1.2 | ) |
| | | | | | | | | | | | | | | | | | | | | | | | | | | | | | | | |
| | | 23.5 | | | | 24.5 | | | | 13.5 | | | | 20.6 | | | | 12.1 | | | | 12.3 | | | | 6.6 | | | | 9.3 | |
| | | | | | | | | | | | | | | | | | | | | | | | | | | | | | | | |
VaR is calculated separately for Australia, New Zealand and Overseas Markets, as well as for the Group.
To supplement the VaR methodology, ANZ applies a wide range of stress tests, both on individual portfolios and at Group level. ANZ’s stress testing regime provides senior management with an assessment of the financial impact of identified extreme events on market risk exposures of ANZ.
b) Scenario Analysis – A 1% Shock on the Next 12 Months’ Net Interest Income
A 1% overnight parallel positive shift in the yield curve is modelled to determine the potential impact on net interest income over the succeeding 12 months. This is a standard risk quantification tool.
The figures in the table below indicate the outcome of this risk measure for the current and previous financial years – expressed as a percentage of reported net interest income. The sign indicates the nature of the rate sensitivity with a positive number signifying that a rate increase is positive for net interest income over the next 12 months. Conversely, a negative number signifies that a rate increase is negative for the next 12 months’ net interest income.
| | | | | | | | | | | | | | | | |
| | | Consolidated | | | The Company | |
| | | 2009
$m | | | 2008
$m | | | 2009
$m | | | 2008
$m | |
Impact of 1% Rate Shock | | | | | | | | | | | | | | | | |
As at 30 September | | | 0.10 | % | | | 0.94 | % | | | 0.51 | % | | | 1.62 | % |
Maximum exposure | | | 1.03 | % | | | 0.94 | % | | | 1.49 | % | | | 1.62 | % |
Minimum exposure | | | 0.10 | % | | | (0.55 | %) | | | 0.51 | % | | | (0.74 | %) |
| | | | | | | | | | | | | | | | |
Average exposure (in absolute terms) | | | 0.55 | % | | | 0.47 | % | | | 0.99 | % | | | 0.77 | % |
| | | | | | | | | | | | | | | | |
142ANZ Annual Report 2009
NOTES TO THE FINANCIAL STATEMENTS
33: Financial Risk Management (continued)
Interest rate risk (continued)
The extent of mismatching between the repricing characteristics and timing of interest bearing assets and liabilities at any point has implications for future net interest income. On a global basis, the Group quantifies the potential variation in future net interest income as a result of these repricing mismatches.
The repricing gaps themselves are constructed based on contractual repricing information. However, for those assets and liabilities where the contractual term to repricing is not considered to be reflective of the actual interest rate sensitivity (for example, products priced at the Group’s discretion), a profile based on historically observed and/or anticipated rate sensitivity is used. This treatment excludes the effect of basis risk between customer pricing and wholesale market pricing.
Equity securities classified as available-for-sale
The portfolio of financial assets, classified as available-for-sale for measurement and financial reporting purposes, also contains equity investment holdings which predominantly comprise investments held for longer term strategic intentions. These equity investments are also subject to market risk which is not captured by the VaR measures for traded and non-traded market risks. Regular reviews are performed to substantiate valuation of the investments within the portfolio and the equity investments are regularly reviewed by management for impairment. The fair value of the constituents of equity securities classified as available-for-sale can fluctuate considerably.
The table below outlines the composition of the equity holdings.
| | | | | | | | | | | | | | | | |
| | | Consolidated | | | The Company | |
| | | 2009 | | | 2008 | | | 2009 | | | 2008 | |
| | | $m | | | $m | | | $m | | | $m | |
Visa Inc. | | | 258 | | | | 243 | | | | 202 | | | | 190 | |
Sacombank | | | 114 | | | | 92 | | | | 114 | | | | 92 | |
Energy Infrastructure Trust | | | 43 | | | | 46 | | | | 43 | | | | 46 | |
Other equity holdings | | | 44 | | | | 65 | | | | 44 | | | | 65 | |
| | | | | | | | | | | | | | | | |
| | | 459 | | | | 446 | | | | 403 | | | | 393 | |
| | | | | | | | | | | | | | | | |
Impact on equity of 10% variation in value | | | 46 | | | | 45 | | | | 40 | | | | 39 | |
| | | | | | | | | | | | | | | | |
Foreign Currency Risk – structural exposures
The investment of capital in foreign operations, such as branches, subsidiaries or associates with functional currencies other than the Australian dollar, exposes the Group to the risk of changes in foreign exchange rates.
The main operating (or functional) currencies of Group entities are the Australian dollar and the New Zealand dollar, with a number of overseas undertakings operating in various other currencies. The Group presents its consolidated financial statements in Australian dollars, as the Australian dollar is the dominant currency. The Group’s consolidated balance sheet is therefore affected by exchange differences between the Australian dollar and functional currencies of foreign operations. Variations in the value of these overseas operations arising as a result of exchange differences are reflected in the foreign currency translation reserve in equity.
The Group routinely monitors this risk and conducts hedging, where it is expected to add shareholder value, in accordance with approved policies. The Group’s exposures to structural foreign currency risks are managed with the primary objective of ensuring, where practical, that the consolidated Tier 1 capital ratio is neutral to the effect of changes in exchange rates.
Selective hedges were in place during the 2009 and 2008 financial years. For details on the hedging instruments used and effectiveness of hedges of net investments in foreign operations, refer to note 12 to these financial statements.
Financial Report143
NOTES TO THE FINANCIAL STATEMENTS
33: Financial Risk Management (continued)
LIQUIDITY RISK
Liquidity risk is the risk that the Group has insufficient capacity to fund increases in assets or is unable to meet its payment obligations as they fall due, including repaying depositors or maturing wholesale debt. The timing mismatch of cashflows and the related liquidity risk is inherent in all banking operations and is closely monitored by the Group.
The Group’s liquidity and funding risks are governed by a detailed policy framework which is approved by the Board of Directors. In response to the impact of the global financial crisis, the framework has been reviewed and updated.
The core objective of the framework is to ensure that the Group has sufficient liquidity to meet obligations as they fall due without incurring unacceptable losses.
ANZ has a low appetite for liquidity risk, as determined by the Board. Key principles of ANZ’s approach to liquidity risk management include:
| • | | Maintaining the ability to meet all payment obligations in the immediate term. |
| • | | Ensuring that the Group has the ability to meet ‘survival horizons’ under a range of ANZ-specific and general market liquidity stress scenarios, at the site and Group-wide level, to meet cash flow obligations over the short to medium term. |
| • | | Maintaining strength in the Group’s balance sheet structure to ensure long term resilience in the liquidity and funding risk profile. |
| • | | Limiting the potential earnings at risk implications associated with unexpected increases in funding costs or the liquidation of assets under stress. |
| • | | Ensuring the liquidity management framework is compatible with local regulatory requirements. |
| • | | Preparation of daily liquidity reports and scenario analysis, quantifying the Group’s positions. |
| • | | Targeting a diversified funding base, avoiding undue concentrations by investor type, maturity, market source and currency. |
| • | | Holding a portfolio of high quality liquid assets to protect against adverse funding conditions and to support day-to-day operations. |
| • | | Establishing detailed contingency plans to cover different liquidity crisis events. |
Management of liquidity and funding risks are overseen by the Group Asset and Liability Committee (GALCO).
Supervision and Regulation
APRA supervises liquidity risk via its Prudential Standard APS 210 – Liquidity (last published January 2008) and has adopted guidelines based on the ‘Basel Committee’ “Sound Practices for Managing Liquidity in Banking Organisations”.
APRA supervises liquidity through individual agreements with Authorised Deposit-taking Institutions (ADIs), taking into consideration the specific risk characteristics of each organisations operation. APRA requires ADIs to have a comprehensive Board approved liquidity strategy defining: policy, systems and procedures for measuring, assessing, reporting and managing domestic and foreign currency liquidity. This must include a formal contingency plan for dealing with a liquidity crisis.
The Group maintains an APRA Compliance Plan for APS 210 – Liquidity. The Compliance Plan documents methods, processes, controls and monitoring activities required to support compliance with the Standard and assigns responsibilities for these activities.
Scenario Modelling
A key component of the Group’s liquidity management framework is scenario modelling. APRA requires ADIs to assess liquidity under different scenarios, including the ‘going-concern’ and ‘name-crisis’.
‘Going-concern’: reflects the normal behaviour of cash flows in the ordinary course of business. APRA requires that the Group must be able to meet all commitments and obligations under a going concern scenario, within the ADIs normal funding capacity (‘available to fund’ limit), over at least the following 30 calendar days. In estimating the funding requirement, the Group models expected cashflows by reference to historical behaviour and contractual maturity data.
‘Name-crisis’: refers to a potential name-specific liquidity crisis which models the behaviour of cash flows where there is a problem (real or perceived) which may include, but is not limited to, operational issues, doubts about the solvency of the Group or adverse rating changes. Under this scenario the Group may have significant difficulty rolling over or replacing funding. Under a name crisis, APRA requires the Group to be cashflow positive over a five business day period.
‘Survival horizons’: The Global financial crisis has highlighted the importance of differentiating between stressed and normal market conditions in a name-specific crisis, and the different behaviour that offshore and domestic wholesale funding markets can exhibit during market stress events. As a result, the Group has enhanced its liquidity risk scenario modelling, to supplement APRA’s statutory requirements.
During the 2009 financial year, the Group has linked its liquidity risk appetite to defined liquidity ‘survival horizons’ (i.e. the time period under which ANZ must maintain a positive cashflow position under a specific scenario or stress). Under these scenarios, customer and/ or wholesale balance sheet asset/liability flows are stressed. The following stressed scenarios are modelled:
| • | | Extreme Short Term Crisis Scenario (ESTC): A name-specific stress during a period of market stress. |
| • | | Short Term Crisis Scenario (NSTC): A name-specific stress during a period of normal markets conditions. |
| • | | Global Funding Market Disruption (GFMD): Stressed global wholesale funding markets leading to a closure of domestic and offshore markets. |
| • | | Offshore Funding Market Disruption (OFMD): Stressed global wholesale funding markets leading to a closure of offshore markets only. |
Each of ANZ’s operations is responsible for ensuring its compliance with all scenarios that are required to be modelled. Additionally, we measure, monitor and manage all modelled liquidity scenarios on an aggregated Group-wide level.
144ANZ Annual Report 2009
NOTES TO THE FINANCIAL STATEMENTS
33: Financial Risk Management (continued)
Group Funding Composition
The Group actively uses balance sheet disciplines to prudently manage funding requirements and maintain balance sheet stability. Also, the Group employs funding metrics to ensure that an appropriate proportion of the Group’s assets are funded by stable funding sources including core customer deposits, longer-dated wholesale debt (with a remaining term exceeding one year), and equity. This approach recognises that long-term wholesale debt and other core customer deposits have favourable liquidity characteristics.
ANZ’s funding composition strengthened further as a result of continued growth in customer deposits and a stable volume of term funding. Customer deposits and other funding liabilities increased by 12% to $242.4 billion (55% of total funding), from $215.6 billion (50% of total funding) at 30 September 2008. As a result, the Group’s proportional reliance on short term wholesale funding decreased to 17% from 22%. The table below outlines the Group’s funding composition.
| | | | | | | | |
| | | Consolidated | |
Funding Composition | | 2009
$m | | | 2008
$m | |
Customer deposits and other liabilities1 | | | | | | | | |
Australia | | | 153,481 | | | | 132,665 | |
Asia Pacific, Europe & America | | | 30,487 | | | | 22,530 | |
New Zealand | | | 49,173 | | | | 49,534 | |
| | | | | | | | |
Total customer deposits | | | 233,141 | | | | 204,729 | |
| | | | | | | | |
Other2 | | | 9,297 | | | | 10,870 | |
| | | | | | | | |
Total customer deposits and other liabilities (funding) | | | 242,438 | | | | 215,599 | |
| | | | | | | | |
Wholesale funding | | | | | | | | |
Bonds and notes | | | 57,260 | | | | 67,323 | |
Loan capital | | | 13,429 | | | | 14,266 | |
Certificates of deposit (wholesale) | | | 44,711 | | | | 52,346 | |
Commercial paper | | | 14,227 | | | | 22,422 | |
Liability for acceptances | | | 13,762 | | | | 15,297 | |
Due to other financial institutions | | | 19,924 | | | | 20,092 | |
Other wholesale borrowings3 | | | 1,572 | | | | (3,532 | ) |
| | | | | | | | |
Total wholesale funding | | | 164,885 | | | | 188,214 | |
| | | | | | | | |
Shareholders’ equity5 | | | 31,558 | | | | 25,681 | |
| | | | | | | | |
Total funding maturity | | | | | | | | |
Short term wholesale funding | | | 14 | % | | | 18 | % |
Liability for acceptances | | | 3 | % | | | 4 | % |
Long term wholesale funding4 | | | | | | | | |
– less than 1 year residual maturity | | | 5 | % | | | 7 | % |
– greater than 1 year residual maturity | | | 15 | % | | | 14 | % |
Total customer deposits and other liabilities (funding) | | | 55 | % | | | 50 | % |
Shareholders’ equity and hybrid debt5 | | | 8 | % | | | 7 | % |
| | | | | | | | |
Total funding and shareholders’ equity5 | | | 100 | % | | | 100 | % |
| | | | | | | | |
| 1 | Includes term deposits, other deposits excluding Collateralised Loan Obligation and securitisation deposits. |
| 2 | Includes interest accruals, payables and other liabilities, provisions and net tax provisions. |
| 3 | Includes net derivative balances, special purpose vehicles, other borrowings and preference share capital Euro hybrids. |
| 4 | Long term wholesale funding amounts are stated at original hedged exchange rates. Movements due to currency fluctuations in actual amounts borrowed are classified as short term wholesale funding. |
| 5 | Shareholders’ equity excludes preference share capital. |
Wholesale Funding
The Group’s global wholesale funding strategy is designed to deliver a sustainable portfolio of wholesale funds that balances cost efficiency against prudent duration while targeting diversification by markets, investors, currencies, maturities and funding structures. To the extent that asset growth exceeds funding generated from customer deposits, additional wholesale funds are sourced. Short-term wholesale funding requirements, with a contractual maturity of less than one year, are managed through Group Treasury and local Markets operations. Long-term wholesale funding is managed and executed through Group Treasury operations in Australia and New Zealand.
During 2009, ANZ maintained the required access to all major wholesale funding markets to meet its borrowing requirements in full. Short-term wholesale funding markets continue to function effectively, both locally and offshore.
ANZ also undertook the following actions to improve its funding capabilities, specifically:
| • | | Established a licensed banking branch in New Zealand in January 2009. The branch structure expands the range of funding options available to our New Zealand business. |
| • | | Transitioned Esanda Finance Corporation Limited (Esanda) from a wholly-owned subsidiary towards a division of ANZ, including the launch of Esanda Term Deposits. |
Financial Report 145
NOTES TO THE FINANCIAL STATEMENTS
33: Financial Risk Management (continued)
During 2009, the Group’s wholesale debt issuance program was supported by debt investor meetings held in Australia, New Zealand, the United States, Canada, United Kingdom, France, Germany, the Netherlands, Hong Kong, China, Japan, South-East Asia and the Middle East. The Australian Government Guarantee Scheme has also enabled ANZ to expand its debt investor base to a broader range of investors, including central banks, monetary authorities, sovereign wealth fund managers and insurance companies.
The Group uses maturity concentration limits and geographic diversification limits under the wholesale funding and liquidity management framework. Maturity concentration limits ensure that the Group does not become reliant on issuing large volumes of new wholesale funding within a short time period.
Funding Capacity and Debt Issuance Planning
Group Treasury provides wholesale funding plans to senior management on a regular basis (via the Group Asset and Liability Committee). These plans address targeted funding volumes, markets, investors, tenors and currencies for senior, subordinated and hybrid transactions. Plans are supplemented with a monthly forecasting process which reviews the funding position to-date in light of market conditions and balance sheet requirements.
The debt issuance plan is linked to the Group’s three-year strategic planning cycle, which is a key activity assisting the Group to understand current and future funding requirements, and to quantify and plan volumes of funding required.
In aggregate during 2009 the Group raised $25.8 billion of new term funding (greater than one year at the end of the financial year). The weighted average tenor of new term debt issuance was 3.9 years. The marginal cost of term finding has declined from the peaks established in early calendar 2009, however funding costs remain high by historical standards. The weighted average cost of term debt issuance increased by 69 basis points in 2009 (including the cost of the Government Guarantee) as a result of market conditions.
When calculating volumes of wholesale debt outstanding and the weighted average term to maturity of the term wholesale funding portfolio, the ‘effective’ maturity of callable wholesale debt instruments is conservatively assumed to be the next call date (rather than final maturity) as extension beyond the call date is uncertain.
Liquidity Portfolio Management
The Group holds a diversified portfolio of cash and high-quality, highly-liquid securities that may be sold or pledged to provide same-day liquidity. This portfolio helps protect the Group’s liquidity position by providing a source of cash in stressed conditions. All assets held in this portfolio are securities eligible for repurchase under agreements with the applicable central bank (i.e. ‘repo’ eligible).
The sizing of the Group’s Liquidity Portfolio is based on the amount of liquidity required to meet: day-to-day operational requirements; potential name crisis or potential wholesale ‘funding stress’ requirements under each of the Group’s various stress scenarios.
At 30 September 2009 the volume of eligible securities held, post any repurchase (i.e. repo) discounts applied by the applicable central bank, was $60.2 billion.
To further strengthen the Bank’s balance sheet, the Group continues to maintain strong coverage ratios of Liquidity Portfolio to maturing wholesale offshore debt maturities. Liquidity portfolio levels provide coverage of offshore wholesale funding maturities for at least one year. The Liquidity Portfolio is well diversified by counterparty, currency, and tenor. Under the liquidity policy framework securities purchased must be of a similar or better credit quality to ANZ’s external long-term or short-term credit ratings and continue to be repo eligible. Currently securities issued by approximately 84 separate counterparties – comprising bank, government and agency issuers – are held in the portfolio. Supplementing its liquidity position, the Group holds additional cash and liquid asset balances. Our Markets business also holds secondary sources of liquidity in the form of liquid instruments in its trading portfolios. These other assets are not included in the eligible securities held in the prime Liquidity Portfolio outlined below.
| | | | | | | | |
Eligible securities (Market values1) | | 2009
$m | | | 2008
$m | |
Australia | | | 18,694 | | | | 12,899 | |
New Zealand | | | 8,771 | | | | 6,620 | |
United States | | | 1,301 | | | | 2,739 | |
United Kingdom | | | 2,939 | | | | 4,157 | |
Asia | | | 1,984 | | | | — | |
Internal RMBS (Australia) | | | 24,508 | | | | 8,305 | |
Internal RMBS (New Zealand) | | | 1,954 | | | | — | |
| | | | | | | | |
Total | | | 60,151 | | | | 34,720 | |
| | | | | | | | |
| 1 | Market value is post the repo discount applied by the applicable central bank. |
146ANZ Annual Report 2009
NOTES TO THE FINANCIAL STATEMENTS
33: Financial Risk Management (continued)
Counterparty credit ratings
| | | | | | | | |
Long term counterparty Credit Rating1 | | Market
Value
$m | | | No. of
counter-
parties | |
AAA | | | 43,827 | | | | 51 | |
AA+ | | | 3,043 | | | | 4 | |
AA | | | 10,849 | | | | 11 | |
AA- | | | 1,867 | | | | 9 | |
A+ | | | 264 | | | | 5 | |
A | | | 301 | | | | 4 | |
| | | | | | | | |
Total | | | 60,151 | | | | 84 | |
| | | | | | | | |
| 1 | Where available, based on Standard & Poor’s long-term credit ratings. |
Liquidity Crisis Contingency Planning
The Group maintains APRA-endorsed liquidity crisis contingency plans defining an approach for analysing and responding to a liquidity threatening event at a country and Group-wide level. To align with the enhanced liquidity scenario analysis framework, crisis management strategies are assessed against the Group’s crisis stress scenarios.
The framework is compliant with APRA’s key liquidity contingency crisis planning requirements and guidelines and includes:
| • | | The establishment of crisis severity/stress levels; |
| • | | Clearly assigned crisis roles and responsibilities; |
| • | | Early warning signals indicative of an approaching crisis, and mechanisms to monitor and report these signals; |
| • | | Crisis Declaration Assessment processes, and related escalation triggers set against early warning signals; |
| • | | Outlined action plans, and courses of action for altering asset and liability behaviour; |
| • | | Procedures for crisis management reporting, and making up cash-flow shortfalls; |
| • | | Guidelines determining the priority of customer relationships in the event of liquidity problems; and |
| • | | Assigned responsibilities for internal and external communications. |
Contractual maturity analysis of the Group’s liabilities
The tables below analyses the Group’s contractual liabilities, within relevant maturity groupings based on the earliest date on which the Group or Company may be required to pay. The amounts represent principal and interest cash flows and hence may differ compared to the amounts reported on the balance sheet.
It should be noted that this is not how the Group manages its liquidity risk. The management of this risk is detailed above.
Contractual maturity analysis of financial liabilities at 30 September 2009:
| | | | | | | | | | | | | | | | | | | | | | | | |
Consolidated at 30 September 2009 | | Less than
3 months1
$m | | | 3 to 12
months
$m | | | 1 to
5 years
$m | | | After
5 years
$m | | | No
maturity
specified2
$m | | | Total
$m | |
Due to other financial institutions | | | 18,541 | | | | 1,428 | | | | 37 | | | | — | | | | — | | | | 20,006 | |
Deposits and other borrowings | | | | | | | | | | | | | | | | | | | | | | | | |
Certificates of deposit | | | 23,474 | | | | 9,928 | | | | 13,552 | | | | — | | | | — | | | | 46,954 | |
Term deposits | | | 77,069 | | | | 29,395 | | | | 4,062 | | | | 30 | | | | — | | | | 110,556 | |
Other deposits bearing interest | | | 111,314 | | | | — | | | | — | | | | — | | | | — | | | | 111,314 | |
Deposits not bearing interest | | | 10,174 | | | | — | | | | — | | | | — | | | | — | | | | 10,174 | |
Commercial paper | | | 8,947 | | | | 5,400 | | | | — | | | | — | | | | — | | | | 14,347 | |
Borrowing corporations’ debt | | | 1,718 | | | | 1,356 | | | | 752 | | | | — | | | | — | | | | 3,826 | |
Other borrowings | | | 2,028 | | | | — | | | | — | | | | — | | | | — | | | | 2,028 | |
Liability for acceptances | | | 13,574 | | | | 188 | | | | — | | | | — | | | | — | | | | 13,762 | |
Bonds and notes3 | | | 7,274 | | | | 7,999 | | | | 44,075 | | | | 1,699 | | | | — | | | | 61,047 | |
Loan capital3,4 | | | 179 | | | | 2,787 | | | | 9,940 | | | | 1,551 | | | | 1,026 | | | | 15,483 | |
Derivative liabilities (trading)5 | | | 23,344 | | | | — | | | | — | | | | — | | | | — | | | | 23,344 | |
Derivative assets and liabilities (balance sheet management)6 | | | | | | | | | | | | | | | | | | | | | | | | |
– funding | | | | | | | | | | | | | | | | | | | | | | | | |
Receive leg (-ve is an inflow) | | | (19,623 | ) | | | (22,830 | ) | | | (90,946 | ) | | | (6,388 | ) | | | — | | | | (139,787 | ) |
Pay leg | | | 21,242 | | | | 24,048 | | | | 96,489 | | | | 6,499 | | | | — | | | | 148,278 | |
– other balance sheet management | | | | | | | | | | | | | | | | | | | | | | | | |
Receive leg (-ve is an inflow) | | | (1,887 | ) | | | (4,485 | ) | | | (9,499 | ) | | | (2,339 | ) | | | — | | | | (18,210 | ) |
Pay leg | | | 2,194 | | | | 5,218 | | | | 9,875 | | | | 2,263 | | | | — | | | | 19,550 | |
| 1 | Includes at call instruments. |
| 2 | Includes perpetual investments brought in at face value only. |
| 3 | Any callable wholesale debt instruments have been included at their next call date. |
| 4 | Includes instruments that may be settled in cash or in equity, at the option of the Company. |
| 5 | The full mark-to-market of derivative liabilities held for trading purposes has been included in the ’less than 3 months’ category. |
| 6 | The undiscounted cash flows for all derivative instruments used for the purposes of balance sheet management have been included based on the contractual maturity of the instrument. |
Financial Report 147
NOTES TO THE FINANCIAL STATEMENTS
33: Financial Risk Management (continued)
Contractual maturity analysis of financial liabilities at 30 September 2008:
| | | | | | | | | | | | | | | | | | | | | | | | |
Consolidated at 30 September 2008 | | Less than
3 months1
$m | | | 3 to 12
months
$m | | | 1 to
5 years
$m | | | After
5 years
$m | | | No
maturity
specified2
$m | | | Total
$m | |
Due to other financial institutions | | | 17,661 | | | | 2,295 | | | | 418 | | | | — | | | | — | | | | 20,374 | |
Deposits and other borrowings | | | | | | | | | | | | | | | | | | | | | | | | |
Certificates of deposit | | | 29,616 | | | | 13,990 | | | | 11,518 | | | | 109 | | | | — | | | | 55,233 | |
Term deposits | | | 66,817 | | | | 23,325 | | | | 1,737 | | | | 111 | | | | — | | | | 91,990 | |
Other deposits bearing interest | | | 98,566 | | | | — | | | | — | | | | — | | | | — | | | | 98,566 | |
Deposits not bearing interest | | | 9,367 | | | | — | | | | — | | | | — | | | | — | | | | 9,367 | |
Commercial paper | | | 15,419 | | | | 6,455 | | | | 1,876 | | | | — | | | | — | | | | 23,750 | |
Borrowing corporations’ debt | | | 4,836 | | | | 4,481 | | | | 1,376 | | | | — | | | | — | | | | 10,693 | |
Other borrowings | | | 2,031 | | | | — | | | | — | | | | — | | | | — | | | | 2,031 | |
Liability for acceptances | | | 14,439 | | | | 1,059 | | | | — | | | | — | | | | — | | | | 15,498 | |
Bonds and notes3 | | | 8,120 | | | | 20,484 | | | | 43,101 | | | | 2,331 | | | | — | | | | 74,036 | |
Loan capital3,4 | | | 322 | | | | 1,981 | | | | 10,804 | | | | 2,997 | | | | 1,075 | | | | 17,179 | |
Derivative liabilities (trading)5 | | | 27,126 | | | | — | | | | — | | | | — | | | | — | | | | 27,126 | |
Derivative assets and liabilities (balance sheet management)6 | | | | | | | | | | | | | | | | | | | | | | | | |
– funding | | | | | | | | | | | | | | | | | | | | | | | | |
Receive leg (-ve is an inflow) | | | (20,210 | ) | | | (30,268 | ) | | | (79,793 | ) | | | (4,055 | ) | | | — | | | | (134,326 | ) |
Pay leg | | | 20,117 | | | | 31,357 | | | | 83,327 | | | | 4,457 | | | | — | | | | 139,258 | |
– other balance sheet management | | | | | | | | | | | | | | | | | | | | | | | | |
Receive leg (-ve is an inflow) | | | (3,563 | ) | | | (5,608 | ) | | | (7,994 | ) | | | (489 | ) | | | — | | | | (17,654 | ) |
Pay leg | | | 3,481 | | | | 5,290 | | | | 8,138 | | | | 455 | | | | — | | | | 17,364 | |
| 1 | Includes at call instruments. |
| 2 | Includes perpetual investments brought in at face value only. |
| 3 | Any callable wholesale debt instruments have been included at their next call date. |
| 4 | Includes instruments that may be settled in cash or in equity, at the option of the Company. |
| 5 | The full mark-to-market of derivative liabilities held for trading purposes has been included in the ’less than 3 months’ category. |
| 6 | The undiscounted cash flows for all derivative instruments used for the purposes of balance sheet management have been included based on the contractual maturity of the instrument. |
| | | | | | | | | | | | | | | | | | | | | | | | |
The Company at 30 September 2009 | | Less than
3 months1
$m | | | 3 to 12
months
$m | | | 1 to
5 years
$m | | | After
5 years
$m | | | No
maturity
specified2
$m | | | Total
$m | |
Due to other financial institutions | | | 15,726 | | | | 1,241 | | | | 19 | | | | — | | | | — | | | | 16,986 | |
Deposits and other borrowings | | | | | | | | | | | | | | | | | | | | | | | | |
Certificates of deposit | | | 20,096 | | | | 9,602 | | | | 13,552 | | | | — | | | | — | | | | 43,250 | |
Term deposits | | | 61,132 | | | | 17,399 | | | | 1,922 | | | | 29 | | | | — | | | | 80,482 | |
Other deposits bearing interest | | | 92,995 | | | | — | | | | — | | | | — | | | | — | | | | 92,995 | |
Deposits not bearing interest | | | 5,800 | | | | — | | | | — | | | | — | | | | — | | | | 5,800 | |
Commercial paper | | | 6,563 | | | | 1,720 | | | | — | | | | — | | | | — | | | | 8,283 | |
Other borrowings | | | — | | | | — | | | | — | | | | — | | | | — | | | | — | |
Liability for acceptances | | | 13,550 | | | | 188 | | | | — | | | | — | | | | — | | | | 13,738 | |
Bonds and notes3 | | | 5,452 | | | | 5,979 | | | | 35,992 | | | | 1,412 | | | | — | | | | 48,835 | |
Loan capital3,4 | | | 164 | | | | 2,741 | | | | 8,991 | | | | 1,551 | | | | 341 | | | | 13,788 | |
Derivative liabilities (trading)5 | | | 24,388 | | | | — | | | | — | | | | — | | | | — | | | | 24,388 | |
Derivative assets and liabilities (balance sheet management)6 | | | | | | | | | | | | | | | | | | | | | | | | |
– funding | | | | | | | | | | | | | | | | | | | | | | | | |
Receive leg (-ve is an inflow) | | | (13,215 | ) | | | (14,816 | ) | | | (57,583 | ) | | | (5,511 | ) | | | — | | | | (91,125 | ) |
Pay leg | | | 14,519 | | | | 15,814 | | | | 62,560 | | | | 5,653 | | | | — | | | | 98,546 | |
– other balance sheet management | | | | | | | | | | | | | | | | | | | | | | | | |
Receive leg (-ve is an inflow) | | | (1,293 | ) | | | (3,276 | ) | | | (7,472 | ) | | | (2,274 | ) | | | — | | | | (14,315 | ) |
Pay leg | | | 1,308 | | | | 3,463 | | | | 7,277 | | | | 2,175 | | | | — | | | | 14,223 | |
| 1 | Includes at call instruments. |
| 2 | Includes perpetual investments brought in at face value only. |
| 3 | Any callable wholesale debt instruments have been included at their next call date. |
| 4 | Includes instruments that may be settled in cash or in equity, at the option of the Company. |
| 5 | The full mark-to-market of derivative liabilities held for trading purposes has been included in the ’less than 3 months’ category. |
| 6 | The undiscounted cash flows for all derivative instruments used for the purposes of balance sheet management have been included based on the contractual maturity of the instrument. |
148ANZ Annual Report 2009
NOTES TO THE FINANCIAL STATEMENTS
33: Financial Risk Management (continued)
| | | | | | | | | | | | | | | | | | | | | | | | |
The Company at 30 September 2008 | | Less than
3 months1
$m | | | 3 to 12
months
$m | | | 1 to
5 years
$m | | | After
5 years
$m | | | No
maturity
specified2
$m | | | Total
$m | |
Due to other financial institutions | | | 15,859 | | | | 2,279 | | | | 22 | | | | — | | | | — | | | | 18,160 | |
Deposits and other borrowings | | | | | | | | | | | | | | | | | | | | | | | | |
Certificates of deposit | | | 25,972 | | | | 12,807 | | | | 11,487 | | | | 109 | | | | — | | | | 50,375 | |
Term deposits | | | 47,921 | | | | 14,745 | | | | 985 | | | | 110 | | | | — | | | | 63,761 | |
Other deposits bearing interest | | | 79,089 | | | | — | | | | — | | | | — | | | | — | | | | 79,089 | |
Deposits not bearing interest | | | 5,322 | | | | — | | | | — | | | | — | | | | — | | | | 5,322 | |
Commercial paper | | | 6,790 | | | | 1,516 | | | | 1,876 | | | | — | | | | — | | | | 10,182 | |
Other borrowings | | | 9 | | | | — | | | | — | | | | — | | | | — | | | | 9 | |
Liability for acceptances | | | 14,404 | | | | 1,059 | | | | — | | | | — | | | | — | | | | 15,463 | |
Bonds and notes3 | | | 6,338 | | | | 14,311 | | | | 33,832 | | | | 1,823 | | | | — | | | | 56,304 | |
Loan capital3,4 | | | 305 | | | | 1,930 | | | | 9,741 | | | | 2,997 | | | | 375 | | | | 15,348 | |
Derivative liabilities (trading)5 | | | 28,168 | | | | — | | | | — | | | | — | | | | — | | | | 28,168 | |
Derivative assets and liabilities (balance sheet management)6 | | | | | | | | | | | | | | | | | | | | | | | | |
– funding | | | | | | | | | | | | | | | | | | | | | | | | |
Receive leg (-ve is an inflow) | | | (10,343 | ) | | | (17,197 | ) | | | (56,471 | ) | | | (3,722 | ) | | | — | | | | (87,733 | ) |
Pay leg | | | 10,258 | | | | 18,370 | | | | 59,352 | | | | 4,141 | | | | — | | | | 92,121 | |
– other balance sheet management | | | | | | | | | | | | | | | | | | | | | | | | |
Receive leg (-ve is an inflow) | | | (2,341 | ) | | | (3,145 | ) | | | (4,892 | ) | | | (453 | ) | | | — | | | | (10,831 | ) |
Pay leg | | | 2,269 | | | | 2,900 | | | | 4,929 | | | | 421 | | | | — | | | | 10,519 | |
| 1 | Includes at call instruments. |
| 2 | Includes perpetual investments brought in at face value only. |
| 3 | Any callable wholesale debt instruments have been included at their next call date. |
| 4 | Includes instruments that may be settled in cash or in equity, at the option of the Company. |
| 5 | The full mark-to-market of derivative liabilities held for trading purposes has been included in the ’less than 3 months’ category. |
| 6 | The undiscounted cash flows for all derivative instruments used for the purposes of balance sheet management have been included based on the contractual maturity of the instrument. |
CREDIT RELATED CONTINGENCIES
Undrawn facilities and issued guarantees comprises the nominal principal amounts of commitments, contingencies and other undrawn facilities and represents the maximum liquidity at risk position should all facilities extended be drawn.
The majority of undrawn facilities are subject to customers maintaining specific credit and other requirements or conditions. Many of these facilities are expected to be partially used, whereas others may never be required to be drawn upon. As such, the total of the nominal principal amounts is not necessarily representative of future liquidity risks or future cash requirements.
The tables below analyses the Group’s undrawn facilities and issued guarantees into relevant maturity groupings based on the earliest date on which ANZ may be required to pay.
| | | | | | | | | | | | | | | | | | | | | | | | |
| | | Consolidated | | | The Company | |
30 September 2009 | | Less than
1 year
$m | | | More than
1 year
$m | | | Total
$m | | | Less than
1 year
$m | | | More than
1 year
$m | | | Total
$m | |
Undrawn facilities | | | 106,644 | | | | — | | | | 106,644 | | | | 88,006 | | | | — | | | | 88,006 | |
Issued guarantees | | | 25,218 | | | | — | | | | 25,218 | | | | 23,503 | | | | — | | | | 23,503 | |
| | | | | | | | | | | | | | | | | | | | | | | | |
| | | Consolidated | | | The Company | |
30 September 2008 | | Less than
1 year
$m | | | More than
1 year
$m | | | Total
$m | | | Less than
1 year
$m | | | More than
1 year
$m | | | Total
$m | |
Undrawn facilities | | | 111,265 | | | | — | | | | 111,265 | | | | 90,026 | | | | — | | | | 90,026 | |
Issued guarantees | | | 30,006 | | | | — | | | | 30,006 | | | | 28,037 | | | | — | | | | 28,037 | |
The liquidity risk of credit related commitments, contingencies and other undrawn facilities may be less than the contract amount, however the liquidity risk has been taken to be the contract amount. The amounts do not necessarily represent future cash requirements as many of these facilities are expected to be partially used or to expire unused.
Financial Report 149
NOTES TO THE FINANCIAL STATEMENTS
33: Financial Risk Management (continued)
OPERATIONAL RISK MANAGEMENT
Within ANZ, operational risk is defined as the risk of loss resulting from inadequate or failed internal processes, people and systems or from external events. This definition includes legal risk, and the risk of reputational loss or damage arising from inadequate or failed internal processes, people and systems, but excludes strategic risk. The authority for operational risk oversight is delegated by the Board to the Board Risk Committee. The Operational Risk Executive Committee (OREC) supports the Board Risk Committee in respect of operational risk oversight including compliance.
The key responsibilities of OREC include:
| • | | Approve Operational Risk and Compliance policies. |
| • | | Approve ANZ’s Group Compliance Framework. |
| • | | Endorse ANZ’s Operational Risk Framework for approval by the Risk Committee of the Board. |
| • | | Monitoring the state of operational risk management and instigating any necessary corrective actions; |
| • | | Review all material actual, potential or near miss risk events; and |
| • | | Monitor associated treatment plans. |
Membership of OREC comprises senior executives and OREC is chaired by the Chief Risk Officer.
Business unit staff and line management have first line accountability for the day-to-day management of operational risk. This includes implementation of the operational risk framework and involvement in decision making processes concerning all material operational risk matters. Divisional risk governance functions provide oversight of operational risk undertaken in the business units.
Divisional Risk Committees and Business Unit Risk Forums manage and maintain oversight of operational risks supported by thresholds for escalation and monitoring. Group Operational Risk are responsible for exercising governance over operational risk through the management of the operational risk framework, policy development, framework assurance, operational risk measurement and capital allocation, fraud strategy and reporting of operational risk issues to executive committees.
ANZ’s Operational Risk Framework outlines the approach to managing operational risk and specifically covers the minimum requirements that divisions/business units must undertake in the management of operational risk. ANZ’s Operational Risk Framework is supported by specific policies, guidelines and templates with the effectiveness of the framework assessed through a series of assurance reviews and related processes. This is supported by an independent review programme by Internal Audit.
The operational risk management process adopted by ANZ consists of a staged approach involving establishing the context, identification, analysis, treatment and monitoring of current, new and emerging operational risks. This is based on the Risk Management Standard issued by Standards Australia/New Zealand (AS/NZS 4360).
In line with industry practice, ANZ obtains insurance cover from third party and captive providers to cover those operational risks where cost-effective premiums can be obtained. In conducting their business, business units are advised to act as if uninsured and not to use insurance as a guaranteed mitigation for operational risk. Business disruption is a critical risk to a bank’s ability to operate, so ANZ has comprehensive business continuity, recovery and crisis management plans. The intention of the business continuity and recovery plans is to ensure critical business functions can be maintained, or restored in a timely fashion, in the event of material disruptions arising from internal or external events.
Group Operational Risk is responsible for maintaining ANZ’s Advanced Measurement Approach (AMA) for operational risk regulatory capital calculations. ANZ uses a scenario analysis based methodology to assess exposure to unexpected operational risk events and uses probability distributions and monte carlo simulations to model and calculate its operational risk regulatory capital (ORRC). This methodology incorporates the use of business risk profiles which consider the current business environment and internal control factors over a twelve month time horizon.
150ANZ Annual Report 2009
NOTES TO THE FINANCIAL STATEMENTS
34: Fair Value of Financial Assets and Financial Liabilities
Fair value is the amount for which an asset could be exchanged, or a liability settled, between knowledgeable, willing parties in an arm’s length transaction. The determination of the fair value of financial instruments is fundamental to the financial reporting framework as all financial instruments are recognised initially at fair value and, with the exception of those financial instruments carried at amortised cost, are remeasured at fair value in subsequent periods.
The fair value of a financial instrument on initial recognition is normally the transaction price, however, in certain circumstances the initial fair value may be based on other observable current market transactions in the same instrument, without modification or repackaging, or on a valuation technique whose variables include only data from observable markets.
Subsequent to initial recognition, the fair value of financial instruments measured at fair value is based on quoted market prices, where available. In cases where quoted market prices are not available, fair value is determined using market accepted valuation techniques that employ observable market data. In limited cases where observable market data is not available, the input is estimated based on other observable market data, historical trends and other factors that may be relevant.
(i) Fair values of financial assets and financial liabilities
A significant number of financial instruments are carried at fair value in the balance sheet. Below is a comparison of the carrying amounts, as reported on the balance sheet, and fair values of all financial assets and liabilities. The fair value disclosure does not cover those instruments that are not considered financial instruments from an accounting perspective such as income tax and intangible assets. In our view, the aggregate fair value amounts do not represent the underlying value of the Group.
In the tables below, financial instruments have been allocated based on their accounting treatment. The significant accounting policies in note 1 describe how the categories of financial assets and financial liabilities are measured and how income and expenses, including fair value gains and losses, are recognised.
Financial asset classes have been allocated into the following groups: amortised cost; financial assets at fair value through profit or loss; derivatives in effective hedging relationships; and available-for-sale financial assets. Similarly, each class of financial liability has been allocated into three groups: amortised cost; derivatives in effective hedging relationships; and financial liabilities at fair value through profit and loss.
The fair values are based on relevant information available as at the respective balance sheet dates and have not been updated to reflect changes in market condition after the balance sheet date.
FINANCIAL ASSETS
| | | | | | | | | | | | | | | | | | | | | | | | | | | | | | | | |
| | | Carrying amount | | | Fair value | |
| | | At amortised
cost | | | At fair value through profit or loss | | | Hedging | | | Available-for- sale assets | | | Total | | | Total | |
Consolidated 30 September 2009 | | $m | | | Designated
on initial
recognition
$m | | | Held for
trading
$m | | | Sub-total
$m | | | $m | | | $m | | | $m | | | $m | |
Liquid assets | | | 25,317 | | | | — | | | | — | | | | — | | | | — | | | | — | | | | 25,317 | | | | 25,317 | |
Due from other financial institutions | | | 4,985 | | | | — | | | | — | | | | — | | | | — | | | | — | | | | 4,985 | | | | 4,985 | |
Trading securities | | | — | | | | — | | | | 30,991 | | | | 30,991 | | | | — | | | | — | | | | 30,991 | | | | 30,991 | |
Derivative financial instruments1 | | | — | | | | — | | | | 35,681 | | | | 35,681 | | | | 1,723 | | | | — | | | | 37,404 | | | | 37,404 | |
Available-for-sale assets | | | — | | | | — | | | | — | | | | — | | | | — | | | | 16,575 | | | | 16,575 | | | | 16,575 | |
Loans and advances2 | | | 331,817 | | | | 190 | | | | — | | | | 190 | | | | — | | | | — | | | | 332,007 | | | | 331,991 | |
Customers’ liability for acceptances | | | 13,762 | | | | — | | | | — | | | | — | | | | — | | | | — | | | | 13,762 | | | | 13,762 | |
Other financial assets | | | 3,265 | | | | — | | | | — | | | | — | | | | — | | | | — | | | | 3,265 | | | | 3,265 | |
| | | | | | | | | | | | | | | | | | | | | | | | | | | | | | | | |
| | | 379,146 | | | | 190 | | | | 66,672 | | | | 66,862 | | | | 1,723 | | | | 16,575 | | | | 464,306 | | | | 464,290 | |
| | | | | | | | | | | | | | | | | | | | | | | | | | | | | | | | |
| | | | | | | | | | | | | | | | | | | | | | | | | | | | | | | | |
| | | Carrying amount | | | Fair value | |
| | | At amortised
cost | | | At fair value through profit or loss | | | Hedging | | | Available-for- sale assets | | | Total | | | Total | |
Consolidated 30 September 2008 | | $m | | | Designated
on initial
recognition
$m | | | Held for
trading
$m | | | Sub-total
$m | | | $m | | | $m | | | $m | | | $m | |
Liquid assets | | | 25,030 | | | | — | | | | — | | | | — | | | | — | | | | — | | | | 25,030 | | | | 25,030 | |
Due from other financial institutions | | | 9,862 | | | | — | | | | — | | | | — | | | | — | | | | — | | | | 9,862 | | | | 9,862 | |
Trading securities | | | — | | | | — | | | | 15,177 | | | | 15,177 | | | | — | | | | — | | | | 15,177 | | | | 15,177 | |
Derivative financial instruments1 | | | — | | | | — | | | | 35,237 | | | | 35,237 | | | | 1,704 | | | | — | | | | 36,941 | | | | 36,941 | |
Available-for-sale assets | | | — | | | | — | | | | — | | | | — | | | | — | | | | 17,480 | | | | 17,480 | | | | 17,480 | |
Loans and advances2 | | | 334,306 | | | | 248 | | | | — | | | | 248 | | | | — | | | | — | | | | 334,554 | | | | 333,746 | |
Customers’ liability for acceptances | | | 15,297 | | | | — | | | | — | | | | — | | | | — | | | | — | | | | 15,297 | | | | 15,297 | |
Other financial assets | | | 4,273 | | | | — | | | | — | | | | — | | | | — | | | | — | | | | 4,273 | | | | 4,273 | |
| | | | | | | | | | | | | | | | | | | | | | | | | | | | | | | | |
| | | 388,768 | | | | 248 | | | | 50,414 | | | | 50,662 | | | | 1,704 | | | | 17,480 | | | | 458,614 | | | | 457,806 | |
| | | | | | | | | | | | | | | | | | | | | | | | | | | | | | | | |
| 1 | Derivative financial instruments classified as ‘held for trading’ include derivatives entered into as economic hedges which are not designated as accounting hedges. |
| 2 | Fair value hedging is applied to financial assets within loans and advances. The resulting fair value adjustments mean that the carrying value differs from the amortised cost. |
Financial Report 151
NOTES TO THE FINANCIAL STATEMENTS
34: Fair Value of Financial Assets and Financial Liabilities (continued)
FINANCIAL ASSETS (continued)
| | | | | | | | | | | | | | | | | | | | | | | | | | | | | | | | |
| | | Carrying amount | | | Fair value | |
| | | At amortised
cost | | | At fair value through profit or loss | | | Hedging | | | Available-for- sale assets | | | Total | | | Total | |
The Company 30 September 2009 | | $m | | | Designated
on initial
recognition
$m | | | Held for
trading
$m | | | Sub-total
$m | | | $m | | | $m | | | $m | | | $m | |
Liquid assets | | | 20,199 | | | | — | | | | — | | | | — | | | | — | | | | — | | | | 20,199 | | | | 20,199 | |
Due from other financial institutions | | | 3,236 | | | | — | | | | — | | | | — | | | | — | | | | — | | | | 3,236 | | | | 3,236 | |
Trading securities | | | — | | | | — | | | | 27,410 | | | | 27,410 | | | | — | | | | — | | | | 27,410 | | | | 27,410 | |
Derivative financial instruments1 | | | — | | | | — | | | | 31,631 | | | | 31,631 | | | | 1,370 | | | | — | | | | 33,001 | | | | 33,001 | |
Available-for-sale assets | | | — | | | | — | | | | — | | | | — | | | | — | | | | 13,554 | | | | 13,554 | | | | 13,554 | |
Loans and advances2 | | | 255,818 | | | | 190 | | | | — | | | | 190 | | | | — | | | | — | | | | 256,008 | | | | 256,210 | |
Customers’ liability for acceptances | | | 13,739 | | | | — | | | | — | | | | — | | | | — | | | | — | | | | 13,739 | | | | 13,739 | |
Other financial assets | | | 2,169 | | | | — | | | | — | | | | — | | | | — | | | | — | | | | 2,169 | | | | 2,169 | |
| | | | | | | | | | | | | | | | | | | | | | | | | | | | | | | | |
| | | 295,161 | | | | 190 | | | | 59,041 | | | | 59,231 | | | | 1,370 | | | | 13,554 | | | | 369,316 | | | | 369,518 | |
| | | | | | | | | | | | | | | | | | | | | | | | | | | | | | | | |
| | | | | | | | | | | | | | | | | | | | | | | | | | | | | | | | |
| | | Carrying amount | | | Fair value | |
| | | At amortised
cost | | | At fair value through profit or loss | | | Hedging | | | Available-for- sale assets | | | Total | | | Total | |
The Company 30 September 2008 | | $m | | | Designated
on initial
recognition
$m | | | Held for
trading
$m | | | Sub-total
$m | | | $m | | | $m | | | $m | | | $m | |
Liquid assets | | | 18,081 | | | | — | | | | — | | | | — | | | | — | | | | — | | | | 18,081 | | | | 18,081 | |
Due from other financial institutions | | | 8,573 | | | | — | | | | — | | | | — | | | | — | | | | — | | | | 8,573 | | | | 8,573 | |
Trading securities | | | — | | | | — | | | | 12,846 | | | | 12,846 | | | | — | | | | — | | | | 12,846 | | | | 12,846 | |
Derivative financial instruments1 | | | — | | | | — | | | | 32,042 | | | | 32,042 | | | | 1,256 | | | | — | | | | 33,298 | | | | 33,298 | |
Available-for-sale assets | | | — | | | | — | | | | — | | | | — | | | | — | | | | 15,103 | | | | 15,103 | | | | 15,103 | |
Loans and advances2 | | | 235,876 | | | | 248 | | | | — | | | | 248 | | | | — | | | | — | | | | 236,124 | | | | 235,671 | |
Customers’ liability for acceptances | | | 15,262 | | | | — | | | | — | | | | — | | | | — | | | | — | | | | 15,262 | | | | 15,262 | |
Other financial assets | | | 2,952 | | | | — | | | | — | | | | — | | | | — | | | | — | | | | 2,952 | | | | 2,952 | |
| | | | | | | | | | | | | | | | | | | | | | | | | | | | | | | | |
| | | 280,744 | | | | 248 | | | | 44,888 | | | | 45,136 | | | | 1,256 | | | | 15,103 | | | | 342,239 | | | | 341,786 | |
| | | | | | | | | | | | | | | | | | | | | | | | | | | | | | | | |
| 1 | Derivative financial instruments classified as ‘held for trading’ include derivatives entered into as economic hedges which are not designated as accounting hedges. |
| 2 | Fair value hedging is applied to financial assets within loans and advances. The resulting fair value adjustments mean that the carrying value differs from the amortised cost. |
LIQUID ASSETS AND DUE FROM/TO OTHER FINANCIAL INSTITUTIONS
The carrying values of these financial instruments where there has been no significant change in credit risk is considered to approximate their net fair values as they are short-term in nature, defined as those which reprice or mature in 90 days or less, or are receivable on demand.
TRADING SECURITIES
Trading securities are carried at fair value. Fair value is based on quoted market prices, broker or dealer price quotations, or modelled valuations using prices for securities with similar credit risk, maturity and yield characteristics.
DERIVATIVE FINANCIAL INSTRUMENTS
Derivative financial instruments are carried at fair value. Exchange traded derivative financial instruments are valued using quoted prices. Over-the-counter derivative financial instruments are valued using accepted valuation models (including discounted cash flow models) based on current market yields for similar types of instruments and the maturity of each instrument and an adjustment reflecting the credit worthiness of the counterparty.
AVAILABLE-FOR-SALE ASSETS
Available-for-sale assets are carried at fair value. Fair value is based on quoted market prices or broker or dealer price quotations. If this information is not available, fair value is estimated using quoted market prices for securities with similar credit, maturity and yield characteristics, or market accepted valuation models as appropriate (including discounted cash flow models) based on current market yields for similar types of instruments and the maturity of each instrument.
NET LOANS AND ADVANCES AND ACCEPTANCES
The carrying value of loans and advances and acceptances includes deferred fees and expenses, and is net of provision for credit impairment and income yet to mature.
Fair value has been determined through discounting future cash flows. For fixed rate loans and advances and acceptances, the discount rate applied incorporates changes in wholesale market rates, ANZ’s cost of wholesale funding and movements in customer margin. For floating rate loans, only changes in wholesale market rates and ANZ’s cost of wholesale funding are incorporated in the discount rate. For variable rate loans where ANZ sets the applicable rate at its discretion, the fair value is set equal to the carrying value.
OTHER FINANCIAL ASSETS
Included in this category are accrued interest and fees receivable. The carrying values of accrued interest and fees receivable are considered to approximate their net fair values as they are short term in nature or are receivable on demand.
152ANZ Annual Report 2009
NOTES TO THE FINANCIAL STATEMENTS
34: Fair Value of Financial Assets and Financial Liabilities (continued)
FINANCIAL LIABILITIES
| | | | | | | | | | | | | | | | | | | | | | | | | | | | |
| | | Carrying amount | | | Fair value | |
| | | At amortised
cost | | | At fair value through profit or loss | | | Hedging | | | Total | | | Total | |
Consolidated 30 September 2009 | | $m | | | Designated
on initial
recognition
$m | | | Held for
trading
$m | | | Sub-total
$m | | | $m | | | $m | | | $m | |
Due from other financial institutions | | | 19,924 | | | | — | | | | — | | | | — | | | | — | | | | 19,924 | | | | 19,924 | |
Derivative financial instruments1 | | | — | | | | — | | | | 34,706 | | | | 34,706 | | | | 1,810 | | | | 36,516 | | | | 36,516 | |
Deposits and other borrowings | | | 288,305 | | | | 6,065 | | | | — | | | | 6,065 | | | | — | | | | 294,370 | | | | 294,593 | |
Liability for acceptances | | | 13,762 | | | | — | | | | — | | | | — | | | | — | | | | 13,762 | | | | 13,762 | |
Bonds and notes2 | | | 48,327 | | | | 8,933 | | | | — | | | | 8,933 | | | | — | | | | 57,260 | | | | 57,493 | |
Loan capital2 | | | 11,503 | | | | 1,926 | | | | — | | | | 1,926 | | | | — | | | | 13,429 | | | | 13,179 | |
Payables and other liabilities | | | 7,215 | | | | — | | | | — | | | | — | | | | — | | | | 7,215 | | | | 7,215 | |
| | | | | | | | | | | | | | | | | | | | | | | | | | | | |
| | | 389,036 | | | | 16,924 | | | | 34,706 | | | | 51,630 | | | | 1,810 | | | | 442,476 | | | | 442,682 | |
| | | | | | | | | | | | | | | | | | | | | | | | | | | | |
| | | | | | | | | | | | | | | | | | | | | | | | | | | | |
| | | Carrying amount | | | Fair value | |
| | | At amortised
cost | | | At fair value through profit or loss | | | Hedging | | | Total | | | Total | |
Consolidated 30 September 2008 | | $m | | | Designated
on initial
recognition
$m | | | Held for
trading
$m | | | Sub-total
$m | | | $m | | | $m | | | $m | |
Due from other financial institutions | | | 20,092 | | | | — | | | | — | | | | — | | | | — | | | | 20,092 | | | | 20,092 | |
Derivative financial instruments1 | | | — | | | | — | | | | 30,418 | | | | 30,418 | | | | 1,509 | | | | 31,927 | | | | 31,927 | |
Deposits and other borrowings | | | 273,098 | | | | 10,868 | | | | — | | | | 10,868 | | | | — | | | | 283,966 | | | | 284,110 | |
Liability for acceptances | | | 15,297 | | | | — | | | | — | | | | — | | | | — | | | | 15,297 | | | | 15,297 | |
Bonds and notes2 | | | 60,927 | | | | 6,396 | | | | — | | | | 6,396 | | | | — | | | | 67,323 | | | | 66,794 | |
Loan capital2 | | | 12,024 | | | | 2,242 | | | | — | | | | 2,242 | | | | — | | | | 14,266 | | | | 14,013 | |
Payables and other liabilities | | | 8,904 | | | | — | | | | — | | | | — | | | | — | | | | 8,904 | | | | 8,904 | |
| | | | | | | | | | | | | | | | | | | | | | | | | | | | |
| | | 390,342 | | | | 19,506 | | | | 30,418 | | | | 49,924 | | | | 1,509 | | | | 441,775 | | | | 441,137 | |
| | | | | | | | | | | | | | | | | | | | | | | | | | | | |
| | | | | | | | | | | | | | | | | | | | | | | | | | | | |
| | | Carrying amount | | | Fair value | |
| | | At amortised
cost | | | At fair value through profit or loss | | | Hedging | | | Total | | | Total | |
The Company 30 September 2009 | | $m | | | Designated
on initial
recognition
$m | | | Held for
trading
$m | | | Sub-total
$m | | | $m | | | $m | | | $m | |
Due from other financial institutions | | | 16,974 | | | | — | | | | — | | | | — | | | | — | | | | 16,974 | | | | 16,974 | |
Derivative financial instruments1 | | | — | | | | — | | | | 32,305 | | | | 32,305 | | | | 863 | | | | 33,168 | | | | 33,168 | |
Deposits and other borrowings | | | 227,300 | | | | — | | | | — | | | | — | | | | — | | | | 227,300 | | | | 227,478 | |
Liability for acceptances | | | 13,739 | | | | — | | | | — | | | | — | | | | — | | | | 13,739 | | | | 13,739 | |
Bonds and notes2 | | | 37,100 | | | | 8,933 | | | | — | | | | 8,933 | | | | — | | | | 46,033 | | | | 46,141 | |
Loan capital2 | | | 9,959 | | | | 1,926 | | | | — | | | | 1,926 | | | | — | | | | 11,885 | | | | 11,701 | |
Payables and other liabilities | | | 5,786 | | | | — | | | | — | | | | — | | | | — | | | | 5,786 | | | | 5,786 | |
| | | | | | | | | | | | | | | | | | | | | | | | | | | | |
| | | 310,858 | | | | 10,859 | | | | 32,305 | | | | 43,164 | | | | 863 | | | | 354,885 | | | | 354,987 | |
| | | | | | | | | | | | | | | | | | | | | | | | | | | | |
| 1 | Derivative financial instruments classified as ‘held for trading’ include derivatives entered into as economic hedges which are not designated as accounting hedges. |
| 2 | Fair value hedging is applied to financial liabilities within bonds and notes and loan capital. The resulting fair value adjustments mean that the carrying value differs from the amortised cost. |
Financial Report 153
NOTES TO THE FINANCIAL STATEMENTS
34: Fair Value of Financial Assets and Financial Liabilities (continued)
FINANCIAL LIABILITIES (continued)
| | | | | | | | | | | | | | | | | | | | | | | | | | | | |
| | | Carrying amount | | | Fair value | |
| | | At amortised
cost | | | At fair value through profit or loss | | | Hedging | | | Total | | | Total | |
The Company 30 September 2008 | | $m | | | Designated
on initial
recognition
$m | | | Held for
trading
$m | | | Sub-total
$m | | | $m | | | $m | | | $m | |
Due from other financial institutions | | | 18,001 | | | | — | | | | — | | | | — | | | | — | | | | 18,001 | | | | 18,001 | |
Derivative financial instruments1 | | | — | | | | — | | | | 30,585 | | | | 30,585 | | | | 870 | | | | 31,455 | | | | 31,455 | |
Deposits and other borrowings | | | 203,328 | | | | — | | | | — | | | | — | | | | — | | | | 203,328 | | | | 203,413 | |
Liability for acceptances | | | 15,262 | | | | — | | | | — | | | | — | | | | — | | | | 15,262 | | | | 15,262 | |
Bonds and notes2 | | | 45,675 | | | | 6,396 | | | | — | | | | 6,396 | | | | — | | | | 52,071 | | | | 51,742 | |
Loan capital2 | | | 10,534 | | | | 2,242 | | | | — | | | | 2,242 | | | | — | | | | 12,776 | | | | 12,520 | |
Payables and other liabilities | | | 6,671 | | | | — | | | | — | | | | — | | | | — | | | | 6,671 | | | | 6,671 | |
| | | | | | | | | | | | | | | | | | | | | | | | | | | | |
| | | 299,471 | | | | 8,638 | | | | 30,585 | | | | 39,223 | | | | 870 | | | | 339,564 | | | | 339,064 | |
| | | | | | | | | | | | | | | | | | | | | | | | | | | | |
| 1 | Derivative financial instruments classified as ‘held for trading’ include derivatives entered into as economic hedges which are not designated as accounting hedges. |
| 2 | Fair value hedging is applied to financial liabilities within bonds and notes and loan capital. The resulting fair value adjustments mean that the carrying value differs from the amortised cost. |
DEPOSITS AND OTHER BORROWINGS
For interest bearing fixed maturity deposits and other borrowings and acceptances with quoted market prices, market borrowing rates of interest for debt with a similar maturity are used to discount contractual cash flows. The fair value of a deposit liability without a specified maturity or at call is deemed to be the amount payable on demand at the reporting date. The fair value is not adjusted for any value expected to be derived from retaining the deposit for a future period of time.
Certain deposits and other borrowings have been designated at fair value through profit or loss and are carried at fair value.
BONDS AND NOTES AND LOAN CAPITAL
The aggregate fair value of bonds and notes and loan capital is calculated based on quoted market prices. For those debt issues where quoted market prices were not available, a discounted cash flow model using a yield curve appropriate for the remaining term to maturity of the debt instrument is used.
Certain bonds and notes and loan capital have been designated at fair value through profit or loss and are carried at fair value. The fair value is based on a discounted cash flow model based on current market yields for similar types of instruments and the maturity of each instrument. The fair value includes the effects of the appropriate credits spreads applicable to ANZ for that instrument.
PAYABLES AND OTHER FINANCIAL LIABILITIES
This category includes accrued interest and fees payable for which the carrying amount is considered to approximate the fair value.
COMMITMENTS AND CONTINGENCIES
Adjustments to fair value for commitments and contingencies that are not financial instruments recognised in the balance sheet, are not included in this note.
(ii) Valuation methodology
A significant number of financial instruments are carried on balance sheet at fair value.
The best evidence of fair value is a quoted price in an active market. Accordingly, wherever possible fair value is based on the quoted market price of the financial instrument.
In the event that there is no quoted market price for the instrument, fair value is based on present value estimates or other market accepted valuation techniques. The valuation models incorporate the impact of bid/ask spread, counterparty credit spreads and other factors that would influence the fair value determined by a market participant.
The analysis presented in this section discloses the financial instruments that are valued using a valuation technique other than a quoted marked price. The majority of valuation techniques employ only observable market data. However, for certain financial instruments the valuation technique may employ some data (valuation inputs or components) which is not readily observable in the current market. In these cases valuation inputs (or components of the overall value) are derived and extrapolated from other relevant market data and tested against historic transactions and observed market trends. Valuations using one or more non-observable data inputs require professional judgement.
ANZ has a control framework that ensures that the fair value is either determined or validated by a function independent of the party that undertakes the transaction.
Where quoted market prices are used, independent price determination or validation is obtained. For fair values determined using a valuation model, the control framework may include, as applicable, independent development or validation of: (i) valuation models; (ii) any inputs to those models; and (iii) any adjustments required outside of the valuation model, and, where possible, independent validation of model outputs.
154ANZ Annual Report 2009
NOTES TO THE FINANCIAL STATEMENTS
34: Fair Value of Financial Assets and Financial Liabilities (continued)
The tables below provide an analysis of the methodology used for valuing financial assets and financial liabilities that are required to be remeasured at fair value. The fair value of the financial instrument has been allocated in full to the category which most accurately reflects the determination of the fair value. This allocation is based on the categorisation of the lowest level input into a valuation model or a valuation component that is significant to the reported fair value of the financial instrument. In this regard, the significance of an input is assessed against the reported fair value of the financial instrument and considers various factors specific to the financial instrument. The “quoted market price” category also includes financial instruments valued using quoted yield where it is available for a specific debt security. In the prior year, these were categorised as instruments valued using a valuation technique. Comparatives have been adjusted to conform to the current classification.
The methods used in valuing different classes of financial assets or liabilities are described in section (i) on pages 151 to 154. There have been no substantial changes in the valuation techniques applied to different classes of financial instruments. ANZ continuously monitors the relevance of inputs used and calibrates its valuation models where there is evidence that changes are required to ensure that the resulting valuations remain appropriate.
In November 2008, ANZ transferred certain mortgage backed securities out of available-for-sale financial assets into loans and advances. As at September 2008 these assets were valued using either quoted market prices or models with observable inputs.
| | | | | | | | | | | | | | | | | | | | | | | | | | | | | | | | |
| | | | | | | | | Valuation technique | | | | | | | |
| | | Quoted market price | | | Using observable inputs | | | With significant non-observable inputs | | | Total | |
Consolidated | | 2009
$m | | | 2008
$m | | | 2009
$m | | | 2008
$m | | | 2009
$m | | | 2008
$m | | | 2009
$m | | | 2008
$m | |
Financial assets | | | | | | | | | | | | | | | | | | | | | | | | | | | | | | | | |
Trading securities | | | 14,130 | | | | 4,386 | | | | 16,713 | | | | 10,642 | | | | 148 | | | | 149 | | | | 30,991 | | | | 15,177 | |
Derivative financial instruments | | | 1,862 | | | | 2,428 | | | | 34,797 | | | | 33,276 | | | | 745 | | | | 1,237 | | | | 37,404 | | | | 36,941 | |
Available-for-sale financial assets | | | 12,930 | | | | 11,002 | | | | 2,764 | | | | 4,486 | | | | 881 | | | | 1,992 | | | | 16,575 | | | | 17,480 | |
Loans and advances (designated at fair value) | | | — | | | | — | | | | 190 | | | | 248 | | | | — | | | | — | | | | 190 | | | | 248 | |
| | | | | | | | | | | | | | | | | | | | | | | | | | | | | | | | |
| | | 28,922 | | | | 17,816 | | | | 54,464 | | | | 48,652 | | | | 1,774 | | | | 3,378 | | | | 85,160 | | | | 69,846 | |
| | | | | | | | | | | | | | | | | | | | | | | | | | | | | | | | |
Financial liabilities | | | | | | | | | | | | | | | | | | | | | | | | | | | | | | | | |
Derivative financial instruments | | | 1,854 | | | | 2,032 | | | | 33,608 | | | | 28,102 | | | | 1,054 | | | | 1,793 | | | | 36,516 | | | | 31,927 | |
Deposits and other borrowings (designated at fair value) | | | — | | | | — | | | | 6,065 | | | | 10,868 | | | | — | | | | — | | | | 6,065 | | | | 10,868 | |
Bonds and notes (designated at fair value) | | | — | | | | — | | | | 8,933 | | | | 6,396 | | | | — | | | | — | | | | 8,933 | | | | 6,396 | |
Loan capital (designated at fair value) | | | — | | | | — | | | | 1,926 | | | | 2,242 | | | | — | | | | — | | | | 1,926 | | | | 2,242 | |
| | | | | | | | | | | | | | | | | | | | | | | | | | | | | | | | |
| | | 1,854 | | | | 2,032 | | | | 50,532 | | | | 47,608 | | | | 1,054 | | | | 1,793 | | | | 53,440 | | | | 51,433 | |
| | | | | | | | | | | | | | | | | | | | | | | | | | | | | | | | |
| | | | | | | | | | | | | | | | | | | | | | | | | | | | | | | | |
| | | | | | | | | Valuation technique | | | | | | | |
| | | Quoted market price | | | Using observable inputs | | | With significant non-observable inputs | | | Total | |
The Company | | 2009
$m | | | 2008
$m | | | 2009
$m | | | 2008
$m | | | 2009
$m | | | 2008
$m | | | 2009
$m | | | 2008
$m | |
Financial assets | | | | | | | | | | | | | | | | | | | | | | | | | | | | | | | | |
Trading securities | | | 12,933 | | | | 3,720 | | | | 14,329 | | | | 8,977 | | | | 148 | | | | 149 | | | | 27,410 | | | | 12,846 | |
Derivative financial instruments | | | 1,808 | | | | 2,356 | | | | 30,448 | | | | 29,705 | | | | 745 | | | | 1,237 | | | | 33,001 | | | | 33,298 | |
Available-for-sale financial assets | | | 11,175 | | | | 10,912 | | | | 1,763 | | | | 3,267 | | | | 616 | | | | 924 | | | | 13,554 | | | | 15,103 | |
Loans and advances (designated at fair value) | | | — | | | | — | | | | 190 | | | | 248 | | | | — | | | | — | | | | 190 | | | | 248 | |
| | | | | | | | | | | | | | | | | | | | | | | | | | | | | | | | |
| | | 25,916 | | | | 16,988 | | | | 46,730 | | | | 42,197 | | | | 1,509 | | | | 2,310 | | | | 74,155 | | | | 61,495 | |
| | | | | | | | | | | | | | | | | | | | | | | | | | | | | | | | |
Financial liabilities | | | | | | | | | | | | | | | | | | | | | | | | | | | | | | | | |
Derivative financial instruments | | | 1,767 | | | | 2,105 | | | | 30,347 | | | | 27,557 | | | | 1,054 | | | | 1,793 | | | | 33,168 | | | | 31,455 | |
Bonds and notes (designated at fair value) | | | — | | | | — | | | | 8,933 | | | | 6,396 | | | | — | | | | — | | | | 8,933 | | | | 6,396 | |
Loan capital (designated at fair value) | | | — | | | | — | | | | 1,926 | | | | 2,242 | | | | — | | | | — | | | | 1,926 | | | | 2,242 | |
| | | | | | | | | | | | | | | | | | | | | | | | | | | | | | | | |
| | | 1,767 | | | | 2,105 | | | | 41,206 | | | | 36,195 | | | | 1,054 | | | | 1,793 | | | | 44,027 | | | | 40,093 | |
| | | | | | | | | | | | | | | | | | | | | | | | | | | | | | | | |
Financial Report155
NOTES TO THE FINANCIAL STATEMENTS
34: Fair Value of Financial Assets and Financial Liabilities (continued)
(iii) Additional information for financial instruments carried at fair value where the valuation incorporates non-observable market data
CHANGES IN FAIR VALUE AND MOVEMENTS IN AND OUT
The following table presents the composition of the financial instruments remeasured at fair value with significant non-observable inputs.
| | | | | | | | | | | | | | | | | | | | | | | | | | | | | | | | |
| | | Financial assets | | | Financial liabilities | |
| | | Trading securities | | | Derivatives | | | Available-for-sale | | | Derivatives | |
Consolidated | | 2009
$m | | | 2008
$m | | | 2009
$m | | | 2008
$m | | | 2009
$m | | | 2008
$m | | | 2009
$m | | | 2008
$m | |
Asset backed securities | | | 148 | | | | 149 | | | | — | | | | — | | | | 103 | | | | 967 | | | | — | | | | — | |
Illiquid corporate bonds and loans | | | — | | | | — | | | | — | | | | — | | | | 778 | | | | 1,025 | | | | — | | | | — | |
Structured credit products | | | — | | | | — | | | | 704 | | | | 1,212 | | | | — | | | | — | | | | 1,019 | | | | 1,704 | |
Other derivatives | | | — | | | | — | | | | 41 | | | | 25 | | | | — | | | | — | | | | 35 | | | | 89 | |
| | | | | | | | | | | | | | | | | | | | | | | | | | | | | | | | |
Total | | | 148 | | | | 149 | | | | 745 | | | | 1,237 | | | | 881 | | | | 1,992 | | | | 1,054 | | | | 1,793 | |
| | | | | | | | | | | | | | | | | | | | | | | | | | | | | | | | |
The Company | | | | | | | | | | | | | | | | | | | | | | | | | | | | | | | | |
Asset backed securities | | | 148 | | | | 149 | | | | — | | | | — | | | | — | | | | 393 | | | | — | | | | — | |
Illiquid corporate bonds and loans | | | — | | | | — | | | | — | | | | — | | | | 616 | | | | 531 | | | | — | | | | — | |
Structured credit products | | | — | | | | — | | | | 704 | | | | 1,212 | | | | — | | | | — | | | | 1,019 | | | | 1,704 | |
Other derivatives | | | — | | | | | | | | 41 | | | | 25 | | | | — | | | | — | | | | 35 | | | | 89 | |
| | | | | | | | | | | | | | | | | | | | | | | | | | | | | | | | |
Total | | | 148 | | | | 149 | | | | 745 | | | | 1,237 | | | | 616 | | | | 924 | | | | 1,054 | | | | 1,793 | |
| | | | | | | | | | | | | | | | | | | | | | | | | | | | | | | | |
Asset backed securities and illiquid corporate bonds comprise illiquid bonds where the effect on fair value of credit risk cannot be directly or indirectly observed in the market, and include long dated Australian CPI indexed bonds.
Structured credit products comprise the structured credit intermediation trades that ANZ entered into from 2004 to 2007 whereby ANZ sold protection using credit default swaps over certain structures, then to mitigate risk purchased protection via credit default swaps from eight US financial guarantors over the same trades. The underlying structures involve synthetic collateralised debt obligations, portfolios of external collateralised loan obligations or specific bonds/floating rate notes. These trades are valued using complex models with certain inputs relating to the reference assets and derivative counterparties not observable in the market.
Other derivative financial instruments comprise long dated instruments, predominantly relating to soft commodities, which extend significantly beyond the period for which market data used to derive the fair value is readily available.
The following table details movements in the balance of these financial assets and liabilities. Trading derivatives are categorised on a portfolio basis, and classified as either financial assets or financial liabilities based on whether the closing balance is a gain or a loss. This could be different to the opening balance.
| | | | | | | | | | | | | | | | |
| | | Financial
assets | | | Financial
liabilities | |
| | | Trading
securities | | | Derivatives | | | Available
-for-sale | | | Derivatives | |
| | | 2009 | | | 2009 | | | 2009 | | | 2009 | |
Consolidated | | $m | | | $m | | | $m | | | $m | |
Opening balance | | | 149 | | | | 1,237 | | | | 1,992 | | | | (1,793 | ) |
New purchases and issues | | | 32 | | | | 7 | | | | — | | | | (4 | ) |
Disposals/(sales) and cash settlements | | | (13 | ) | | | (39 | ) | | | (1,032 | ) | | | (56 | ) |
Transfers: | | | | | | | | | | | | | | | | |
Transfers into the category | | | — | | | | 2 | | | | — | | | | (19 | ) |
Transfers out of the category | | | — | | | | (3 | ) | | | (13 | ) | | | — | |
Fair value gain/(loss) recorded in the income statement | | | (20 | ) | | | (459 | ) | | | (28 | ) | | | 818 | |
Fair value gain/(loss) recognised in equity | | | — | | | | — | | | | (38 | ) | | | — | |
| | | | | | | | | | | | | | | | |
Closing balance | | | 148 | | | | 745 | | | | 881 | | | | (1,054 | ) |
| | | | | | | | | | | | | | | | |
The Company | | | | | | | | | | | | | | | | |
Opening balance | | | 149 | | | | 1,237 | | | | 924 | | | | (1,793 | ) |
New purchases and issues | | | 32 | | | | 7 | | | | 308 | | | | (4 | ) |
Disposals/(sales) and cash settlements | | | (13 | ) | | | (39 | ) | | | (541 | ) | | | (56 | ) |
Transfers: | | | | | | | | | | | | | | | | |
Transfers into the category | | | — | | | | 2 | | | | — | | | | (19 | ) |
Transfers out of the category | | | — | | | | (3 | ) | | | (13 | ) | | | — | |
Fair value gain/(loss) recorded in the income statement | | | (20 | ) | | | (459 | ) | | | (24 | ) | | | 818 | |
Fair value gain/(loss) recognised in equity | | | — | | | | — | | | | (38 | ) | | | — | |
| | | | | | | | | | | | | | | | |
Closing balance | | | 148 | | | | 745 | | | | 616 | | | | (1,054 | ) |
| | | | | | | | | | | | | | | | |
156ANZ Annual Report 2009
NOTES TO THE FINANCIAL STATEMENTS
34: Fair Value of Financial Assets and Financial Liabilities (continued)
SENSITIVITY TO DATA INPUTS
Where valuation techniques use assumptions derived from significant non-observable market inputs, changing these assumptions change the resultant estimate of fair value. The majority of these transactions are “back-to-back” in nature where ANZ either acts as a financial intermediary, or ANZ hedges market risks at inception. In these circumstances, changes in the assumptions generally have minimal impact on the income statement, with the exception of the structured credit intermediation trades that create significant exposure to market risk and/or credit risk.
Principal inputs used in the determination of fair value of financial instruments included in this group include data inputs such as counterparty credit spreads, market-quoted CDS prices, recovery rates, implied default probabilities, market-quoted credit index tranche prices and correlation curves and other inputs, some of which may not be directly observable in the market. For both the Group and the Company, the potential effect of changing prevailing assumptions to reasonably possible alternative assumptions for valuing those financial instruments could result in an increase of $37 million (2008: $73 million) or a decrease of $27 million (2008: $69 million) in net derivative financial instruments as at 30 September 2009. The ranges of reasonably possible alternative assumptions are established by application of professional judgement to an analysis of the data available to support each assumption.
DEFERRED FAIR VALUE GAINS AND LOSSES
Where the fair value of a financial instrument is determined using non-observable data that has a significant impact on the valuation of the instrument, any difference between the transaction price and the amount determined based on the valuation technique arising on initial recognition of the financial instrument (day one gain or loss) is deferred on the balance sheet. Subsequently, the day one gain or loss is recognised in the income statement only to the extent that it arises from a change in factors (including time) that a market participant would consider in setting the price for the instrument.
The table below shows movements in the aggregate amount of day one gain/(loss) not recognised in the income statement on the initial recognition of the financial instrument because the difference between the transaction price and the modelled valuation price was not fully supported by inputs that were observable in the market.
| | | | | | | | | | | | | | | | |
| | | Consolidated | | | The Company | |
| | | 2009
$m | | | 2008
$m | | | 2009
$m | | | 2008
$m | |
Opening balance | | | 5 | | | | — | | | | 5 | | | | — | |
Deferral of gain/(loss) on new transactions | | | — | | | | 5 | | | | — | | | | 5 | |
Recognised in the income statement, including exchange differences | | | (2 | ) | | | — | | | | (2 | ) | | | — | |
| | | | | | | | | | | | | | | | |
| | | 3 | | | | 5 | | | | 3 | | | | 5 | |
| | | | | | | | | | | | | | | | |
(iv) Additional information for financial instruments designated at fair value through profit or loss
FINANCIAL ASSETS DESIGNATED AT FAIR VALUE THROUGH PROFIT OR LOSS
The category loans and advances includes certain loans designated at fair value through profit or loss in order to eliminate an accounting mismatch which would arise if the asset were otherwise carried at amortised cost. This mismatch arises as the derivative financial instruments, which were acquired to mitigate interest rate risk of the loan and advances, are measured at fair value through profit or loss. By designating the economically hedged loans, the movements in the fair value attributable to changes in interest rate risks, will also be recognised in the income statement in the same periods.
At balance date, the credit exposure of the Group and the Company on these assets was $190 million (2008: $248 million). Of this, $86 million (2008: $119 million) was mitigated by collateral held.
The cumulative change in fair value attributable to change in credit risk was, for the Group and the Company, a reduction to the assets of $5 million (2008: $6 million). The amount recognised in the income statement attributable to changes in credit risk was a gain of $1 million (2008: $6 million loss).
The change in fair value of the designated financial assets attributable to changes in credit risk has been calculated by determining the change in credit rating and credit spread implicit in the loans and advances issued by entities with similar credit characteristics.
Financial Report157
NOTES TO THE FINANCIAL STATEMENTS
34: Fair Value of Financial Assets and Financial Liabilities (continued)
FINANCIAL LIABILITIES DESIGNATED AT FAIR VALUE THROUGH PROFIT OR LOSS
Parts of loan capital, bonds and notes and deposits and other borrowings have been designated as financial liabilities at fair value through profit or loss in order to eliminate an accounting mismatch which would arise if the liabilities were otherwise carried at amortised cost. This mismatch arises as the derivatives acquired to mitigate interest rate risk within the financial liabilities are measured at fair value through profit or loss. The table below compares the carrying amount of financial liabilities carried at full fair value, to the contractual amount payable at maturity and fair value gains and losses recognised during the period on liabilities carried at full fair value that are attributable to changes in ANZ’s own credit rating.
| | | | | | | | | | | | | | | | | | | | | | | | |
| | | Deposits and other
borrowing | | | Bonds and notes | | | Loan capital | |
Consolidated | | 2009
$m | | | 2008
$m | | | 2009
$m | | | 2008
$m | | | 2009
$m | | | 2008
$m | |
Carrying amount | | | 6,065 | | | | 10,868 | | | | 8,933 | | | | 6,396 | | | | 1,926 | | | | 2,242 | |
Amount at which carrying value is greater/(less) than amount payable at maturity | | | (6 | ) | | | (88 | ) | | | 92 | | | | (148 | ) | | | 2 | | | | (7 | ) |
Cumulative change in liability value attributable to own credit risk: | | | | | | | | | | | | | | | | | | | | | | | | |
– opening cumulative (gain)/loss | | | (2 | ) | | | — | | | | (166 | ) | | | (31 | ) | | | (47 | ) | | | 12 | |
– (gain)/loss recognised during the year | | | 2 | | | | (2 | ) | | | 242 | | | | (135 | ) | | | (12 | ) | | | (59 | ) |
– closing cumulative (gain)/loss | | | — | | | | (2 | ) | | | 76 | | | | (166 | ) | | | (59 | ) | | | (47 | ) |
| | | | | | | | | | | | | | | | | | | | | | | | |
| | | Deposits and other
borrowing | | | Bonds and notes | | | Loan capital | |
The Company | | 2009
$m | | | 2008
$m | | | 2009
$m | | | 2008
$m | | | 2009
$m | | | 2008
$m | |
Carrying amount | | | — | | | | — | | | | 8,933 | | | | 6,396 | | | | 1,926 | | | | 2,242 | |
Amount at which carrying value is greater/(less) than amount payable at maturity | | | — | | | | — | | | | 92 | | | | (148 | ) | | | 2 | | | | (7 | ) |
Cumulative change in liability value attributable to own credit risk: | | | | | | | | | | | | | | | | | | | | | | | | |
– opening cumulative (gain)/loss | | | — | | | | — | | | | (166 | ) | | | (31 | ) | | | (47 | ) | | | 12 | |
– (gain)/loss recognised during the year | | | — | | | | — | | | | 242 | | | | (135 | ) | | | (12 | ) | | | (59 | ) |
– closing cumulative (gain)/loss | | | — | | | | — | | | | 76 | | | | (166 | ) | | | (59 | ) | | | (47 | ) |
For each of loan capital, bonds and notes and deposits and other borrowings, the change in fair value attributable to changes in credit risk has been determined as the amount of change in fair value that is not attributable to changes in market conditions that give rise to market risks (benchmark interest rate and foreign exchange rates).
35: Maturity Analysis of Assets and Liabilities
The following is an analysis, by remaining contractual maturities at balance date, of selected asset and liability accounts and represents the actual obligation date expected for the asset or liability to be recovered or settled within one year, and greater than one year.
| | | | | | | | | | | | | | | | | | | | | | | | |
| | | 2009 | | | 2008 | |
Consolidated | | Due within
one year
$m | | | Greater than
one year
$m | | | Total
$m | | | Due within
one year
$m | | | Greater than
one year
$m | | | Total $m | |
Due from other financial institutions | | | 4,759 | | | | 226 | | | | 4,985 | | | | 9,230 | | | | 632 | | | | 9,862 | |
Available-for-sale assets | | | 12,749 | | | | 3,826 | | | | 16,575 | | | | 14,407 | | | | 3,073 | | | | 17,480 | |
Net loans and advances | | | 77,150 | | | | 254,857 | | | | 332,007 | | | | 77,626 | | | | 256,928 | | | | 334,554 | |
Customers’ liability for acceptances | | | 13,762 | | | | — | | | | 13,762 | | | | 15,297 | | | | — | | | | 15,297 | |
Due to other financial institutions | | | 19,889 | | | | 35 | | | | 19,924 | | | | 19,615 | | | | 477 | | | | 20,092 | |
Deposits and other borrowings | | | 277,889 | | | | 16,481 | | | | 294,370 | | | | 267,333 | | | | 16,633 | | | | 283,966 | |
Liability for acceptances | | | 13,762 | | | | — | | | | 13,762 | | | | 15,297 | | | | — | | | | 15,297 | |
Bonds and notes | | | 11,317 | | | | 45,943 | | | | 57,260 | | | | 16,198 | | | | 51,125 | | | | 67,323 | |
Loan capital | | | 400 | | | | 13,029 | | | | 13,429 | | | | 12 | | | | 14,254 | | | | 14,266 | |
158ANZ Annual Report 2009
NOTES TO THE FINANCIAL STATEMENTS
36: Segment Analysis
(i) Description of segments
During the year, the Group moved to a new business model and organisational structure with the creation of three segments based on the geographic regions in which the Group operates (Australia, New Zealand and the combined Asia, Pacific, Europe & America). Each geography focuses primarily on four customer based divisions being, Retail, Commercial, Wealth and Institutional. The Institutional division is also managed on a global basis.
The segments and product and services categories as reported below are consistent with internal reporting provided to the chief operating decision maker, being the Chief Executive Officer.
The primary sources of external revenue across all business units are interest, fee income and trading income.
As the composition of segments was amended during the financial year, September 2008 comparatives have been restated for consistency.
(ii) Transactions between segments
Costs are allocated between business units across segments within ANZ for management reporting comparative purposes on an arms length basis.
| | | | | | | | | | | | | | | | | | | | | | | | | | | | | | | | |
| | | Australia | | | New Zealand | | | Asia Pacific,
Europe & America | | | Total | |
Consolidated | | 2009
$m | | | 2008
$m | | | 2009
$m | | | 2008
$m | | | 2009
$m | | | 2008
$m | | | 2009
$m | | | 2008
$m | |
External interest income | | | 18,409 | | | | 22,422 | | | | 6,106 | | | | 8,171 | | | | 1,691 | | | | 2,011 | | | | 26,206 | | | | 32,604 | |
External interest expense | | | (11,653 | ) | | | (17,152 | ) | | | (3,832 | ) | | | (6,032 | ) | | | (913 | ) | | | (1,570 | ) | | | (16,398 | ) | | | (24,754 | ) |
Adjustment for intersegment interest | | | 329 | | | | 404 | | | | (397 | ) | | | (437 | ) | | | 68 | | | | 33 | | | | — | | | | — | |
| | | | | | | | | | | | | | | | | | | | | | | | | | | | | | | | |
Net interest income | | | 7,085 | | | | 5,674 | | | | 1,877 | | | | 1,702 | | | | 846 | | | | 474 | | | | 9,808 | | | | 7,850 | |
Other external operating income | | | 2,061 | | | | 2,488 | | | | 540 | | | | 847 | | | | 736 | | | | 613 | | | | 3,337 | | | | 3,948 | |
Share of net profit/(loss) of equity accounted investments | | | 76 | | | | 123 | | | | 11 | | | | 92 | | | | 378 | | | | 146 | | | | 465 | | | | 361 | |
| | | | | | | | | | | | | | | | | | | | | | | | | | | | | | | | |
Segment revenue | | | 9,222 | | | | 8,285 | | | | 2,428 | | | | 2,641 | | | | 1,960 | | | | 1,233 | | | | 13,610 | | | | 12,159 | |
| | | | | | | | | | | | | | | | | | | | | | | | | | | | | | | | |
Other external expenses | | | (4,161 | ) | | | (3,950 | ) | | | (1,130 | ) | | | (1,139 | ) | | | (934 | ) | | | (607 | ) | | | (6,225 | ) | | | (5,696 | ) |
Net intersegment expenses | | | (12 | ) | | | 15 | | | | (73 | ) | | | (67 | ) | | | 85 | | | | 52 | | | | — | | | | — | |
| | | | | | | | | | | | | | | | | | | | | | | | | | | | | | | | |
Operating expenses | | | (4,173 | ) | | | (3,935 | ) | | | (1,203 | ) | | | (1,206 | ) | | | (849 | ) | | | (555 | ) | | | (6,225 | ) | | | (5,696 | ) |
Provision for credit impairment | | | (2,008 | ) | | | (1,487 | ) | | | (722 | ) | | | (256 | ) | | | (275 | ) | | | (205 | ) | | | (3,005 | ) | | | (1,948 | ) |
| | | | | | | | | | | | | | | | | | | | | | | | | | | | | | | | |
Segment result | | | 3,041 | | | | 2,863 | | | | 503 | | | | 1,179 | | | | 836 | | | | 473 | | | | 4,380 | | | | 4,515 | |
| | | | | | | | | | | | | | | | | | | | | | | | | | | | | | | | |
Income tax expense | | | (955 | ) | | | (754 | ) | | | (344 | ) | | | (348 | ) | | | (136 | ) | | | (86 | ) | | | (1,435 | ) | | | (1,188 | ) |
Minority interests | | | (2 | ) | | | (2 | ) | | | — | | | | — | | | | — | | | | (6 | ) | | | (2 | ) | | | (8 | ) |
| | | | | | | | | | | | | | | | | | | | | | | | | | | | | | | | |
Profit after income tax attributed to shareholders of the company | | | 2,084 | | | | 2,107 | | | | 159 | | | | 831 | | | | 700 | | | | 381 | | | | 2,943 | | | | 3,319 | |
| | | | | | | | | | | | | | | | | | | | | | | | | | | | | | | | |
Acquisition of plant & equipment, intangibles and other non-current assets | | | 611 | | | | 460 | | | | 77 | | | | 40 | | | | 67 | | | | 59 | | | | 755 | | | | 559 | |
| | | | | | | | | | | | | | | | | | | | | | | | | | | | | | | | |
Non-Cash Expenses | | | | | | | | | | | | | | | | | | | | | | | | | | | | | | | | |
Depreciation and amortisation | | | (285 | ) | | | (265 | ) | | | (40 | ) | | | (39 | ) | | | (49 | ) | | | (26 | ) | | | (374 | ) | | | (330 | ) |
Equity-settled share-based payment expenses | | | (74 | ) | | | (64 | ) | | | (14 | ) | | | (11 | ) | | | (15 | ) | | | (9 | ) | | | (103 | ) | | | (84 | ) |
Provision for credit impairment | | | (2,008 | ) | | | (1,487 | ) | | | (722 | ) | | | (256 | ) | | | (275 | ) | | | (205 | ) | | | (3,005 | ) | | | (1,948 | ) |
Credit risk on derivatives | | | (129 | ) | | | (717 | ) | | | (6 | ) | | | — | | | | — | | | | 30 | | | | (135 | ) | | | (687 | ) |
Provisions for employee entitlements | | | (50 | ) | | | (69 | ) | | | (59 | ) | | | (63 | ) | | | (3 | ) | | | (2 | ) | | | (112 | ) | | | (134 | ) |
Provisions for restructuring | | | (100 | ) | | | (149 | ) | | | (20 | ) | | | (29 | ) | | | (10 | ) | | | (3 | ) | | | (130 | ) | | | (181 | ) |
Financial Position | | | | | | | | | | | | | | | | | | | | | | | | | | | | | | | | |
Total external assets1 | | | 324,918 | | | | 321,072 | | | | 101,445 | | | | 100,270 | | | | 50,121 | | | | 48,594 | | | | 476,484 | | | | 469,936 | |
Shares in associates and joint venture companies | | | 1,826 | | | | 1,862 | | | | 383 | | | | 304 | | | | 2,356 | | | | 2,209 | | | | 4,565 | | | | 4,375 | |
Total external liabilities2 | | | 312,378 | | | | 307,845 | | | | 82,589 | | | | 88,793 | | | | 49,480 | | | | 46,954 | | | | 444,447 | | | | 443,592 | |
Goodwill | | | 264 | | | | 270 | | | | 2,680 | | | | 2,733 | | | | 55 | | | | 61 | | | | 2,999 | | | | 3,064 | |
Intangibles | | | 809 | | | | 603 | | | | 49 | | | | 44 | | | | 39 | | | | 30 | | | | 897 | | | | 677 | |
| 1 | Excludes deferred tax assets. |
| 2 | Excludes deferred tax liabilities. |
Financial Report 159
NOTES TO THE FINANCIAL STATEMENTS
36: Segment Analysis (continued)
External segment revenue by products and services
The table below sets out revenue from external customers for groups of similar products and services as required by AASB 8 Operating Segments.
| | | | | | | | | | | | | | | | | | | | | | | | | | | | | | | | |
| | | Australia | | | New Zealand | | | Asia Pacific,
Europe & America | | | Total | |
| | | 2009
$m | | | 2008
$m | | | 2009
$m | | | 2008
$m | | | 2009
$m | | | 2008
$m | | | 2009
$m | | | 2008
$m | |
Retail | | | 4,060 | | | | 3,640 | | | | 1,316 | | | | 1,456 | | | | 445 | | | | 362 | | | | 5,821 | | | | 5,458 | |
Commercial | | | 2,084 | | | | 1,847 | | | | 704 | | | | 725 | | | | — | | | | — | | | | 2,788 | | | | 2,572 | |
Wealth | | | 347 | | | | 441 | | | | 45 | | | | 62 | | | | 57 | | | | 40 | | | | 449 | | | | 543 | |
Institutional | | | 3,145 | | | | 2,456 | | | | 631 | | | | 475 | | | | 1,172 | | | | 693 | | | | 4,948 | | | | 3,624 | |
Partnerships | | | — | | | | — | | | | — | | | | — | | | | 347 | | | | 199 | | | | 347 | | | | 199 | |
Other | | | (414 | ) | | | (99 | ) | | | (268 | ) | | | (77 | ) | | | (61 | ) | | | (61 | ) | | | (743 | ) | | | (237 | ) |
| | | | | | | | | | | | | | | | | | | | | | | | | | | | | | | | |
Total revenue | | | 9,222 | | | | 8,285 | | | | 2,428 | | | | 2,641 | | | | 1,960 | | | | 1,233 | | | | 13,610 | | | | 12,159 | |
| | | | | | | | | | | | | | | | | | | | | | | | | | | | | | | | |
The following disclosure represents a secondary segment view on a divisional basis, consistent with the Group matrix reporting structure.
| | | | | | | | | | | | | | | | | | | | | | | | | | | | |
Consolidated Year ended 30 September 2009 | | Australia
$m | | | Institutional
$m | | | Asia Pacific,
Europe &
America
$m | | | New Zealand
Businesses
$m | | | Other
$m | | | Less:
Institutional
Asia Pacific,
Europe &
America
$m | | | Consolidated
$m | |
Net interest income | | | 4,877 | | | | 3,041 | | | | 891 | | | | 1,580 | | | | (36 | ) | | | (545 | ) | | | 9,808 | |
Other operating income | | | 1,624 | | | | 1,907 | | | | 1,118 | | | | 506 | | | | (726 | ) | | | (627 | ) | | | 3,802 | |
Operating income | | | 6,501 | | | | 4,948 | | | | 2,009 | | | | 2,086 | | | | (762 | ) | | | (1,172 | ) | | | 13,610 | |
Operating expenses | | | (2,757 | ) | | | (1,583 | ) | | | (891 | ) | | | (1,018 | ) | | | (394 | ) | | | 418 | | | | (6,225 | ) |
Profit before credit impairment and income tax | | | 3,744 | | | | 3,365 | | | | 1,118 | | | | 1,068 | | | | (1,156 | ) | | | (754 | ) | | | 7,385 | |
Provision for credit impairment | | | (884 | ) | | | (1,408 | ) | | | (252 | ) | | | (635 | ) | | | 34 | | | | 140 | | | | (3,005 | ) |
Profit before income tax | | | 2,860 | | | | 1,957 | | | | 866 | | | | 433 | | | | (1,122 | ) | | | (614 | ) | | | 4,380 | |
Income tax expense | | | (839 | ) | | | (553 | ) | | | (164 | ) | | | (123 | ) | | | 82 | | | | 162 | | | | (1,435 | ) |
Minority interests | | | — | | | | (3 | ) | | | — | | | | — | | | | — | | | | 1 | | | | (2 | ) |
| | | | | | | | | | | | | | | | | | | | | | | | | | | | |
Profit after income tax attributed to shareholders of the Company | | | 2,021 | | | | 1,401 | | | | 702 | | | | 310 | | | | (1,040 | ) | | | (451 | ) | | | 2,943 | |
| | | | | | | | | | | | | | | | | | | | | | | | | | | | |
| | | | | | | | | | | | | | | | | | | | | | | | | | | | |
Consolidated Year ended 30 September 2008 | | Australia
$m | | | Institutional
$m | | | Asia Pacific,
Europe &
America
$m | | | New Zealand
Businesses
$m | | | Other
$m | | | Less:
Institutional
Asia Pacific,
Europe &
America
$m | | | Consolidated
$m | |
Net interest income | | | 4,244 | | | | 1,823 | | | | 570 | | | | 1,729 | | | | (234 | ) | | | (282 | ) | | | 7,850 | |
Other operating income | | | 1,699 | | | | 1,801 | | | | 735 | | | | 512 | | | | (27 | ) | | | (411 | ) | | | 4,309 | |
Operating income | | | 5,943 | | | | 3,624 | | | | 1,305 | | | | 2,241 | | | | (261 | ) | | | (693 | ) | | | 12,159 | |
Operating expenses | | | (2,644 | ) | | | (1,245 | ) | | | (590 | ) | | | (1,029 | ) | | | (456 | ) | | | 268 | | | | (5,696 | ) |
Profit before credit impairment and income tax | | | 3,299 | | | | 2,379 | | | | 715 | | | | 1,212 | | | | (717 | ) | | | (425 | ) | | | 6,463 | |
Provision for credit impairment | | | (518 | ) | | | (1,281 | ) | | | (170 | ) | | | (240 | ) | | | 135 | | | | 126 | | | | (1,948 | ) |
Profit before income tax | | | 2,781 | | | | 1,098 | | | | 545 | | | | 972 | | | | (582 | ) | | | (299 | ) | | | 4,515 | |
Income tax expense | | | (797 | ) | | | (324 | ) | | | (106 | ) | | | (313 | ) | | | 265 | | | | 87 | | | | (1,188 | ) |
Minority interests | | | — | | | | (3 | ) | | | (6 | ) | | | — | | | | — | | | | 1 | | | | (8 | ) |
| | | | | | | | | | | | | | | | | | | | | | | | | | | | |
Profit after income tax attributed to shareholders of the Company | | | 1,984 | | | | 771 | | | | 433 | | | | 659 | | | | (317 | ) | | | (211 | ) | | | 3,319 | |
| | | | | | | | | | | | | | | | | | | | | | | | | | | | |
160ANZ Annual Report 2009
NOTES TO THE FINANCIAL STATEMENTS
37: Notes to the Cash Flow Statements
| | | | | | | | |
| | | Consolidated | | The Company |
| | | 2009
$m | | 2008
$m | | 2009
$m | | 2008
$m |
a) Reconciliation of net profit after income tax to net cash provided by operating activities | | | | | | | | |
| | | | | | | | | | | | | | | | |
| | | Inflows
(Outflows) | | | Inflows
(Outflows) | | | Inflows
(Outflows) | | | Inflows
(Outflows) | |
Operating profit after income tax attributable to shareholders of the Company | | | 2,943 | | | | 3,319 | | | | 2,285 | | | | 3,336 | |
| | | | | | | | | | | | | | | | |
Adjustment to reconcile operating profit after income tax to net cash provided by/(used in) operating activities | | | | | | | | | | | | | | | | |
Provision for credit impairment | | | 3,005 | | | | 1,948 | | | | 2,079 | | | | 1,573 | |
Credit risk on derivatives | | | 135 | | | | 687 | | | | 121 | | | | 718 | |
Depreciation and amortisation | | | 375 | | | | 330 | | | | 289 | | | | 259 | |
(Profit)/loss on sale of businesses | | | 3 | | | | (2 | ) | | | 3 | | | | (4 | ) |
Provision for employee entitlements, restructuring and other provisions | | | 675 | | | | 584 | | | | 409 | | | | 418 | |
Payments from provisions | | | (571 | ) | | | (402 | ) | | | (395 | ) | | | (230 | ) |
(Profit)/loss on sale of premises and equipment | | | (5 | ) | | | (32 | ) | | | (5 | ) | | | (4 | ) |
(Profit)/loss on sale of available-for-sale assets | | | (1 | ) | | | (361 | ) | | | — | | | | (281 | ) |
Amortisation of discounts/premiums included in interest income | | | (162 | ) | | | (176 | ) | | | — | | | | 2 | |
Net foreign exchange earnings | | | (962 | ) | | | (708 | ) | | | (740 | ) | | | (340 | ) |
Net gains/losses on trading derivatives | | | (424 | ) | | | (310 | ) | | | (467 | ) | | | (164 | ) |
Net derivatives/foreign exchange adjustment | | | 1,879 | | | | (166 | ) | | | 1,687 | | | | (696 | ) |
Share based payments | | | 9 | | | | 14 | | | | 9 | | | | 14 | |
| | | | |
Net (increase)/decrease in operating assets | | | | | | | | | | | | | | | | |
Trading securities | | | (15,971 | ) | | | 31 | | | | (14,491 | ) | | | 501 | |
Liquid assets greater than three months | | | 2,253 | | | | (4,692 | ) | | | 2,427 | | | | (3,620 | ) |
Due from other banks greater than three months | | | 1,402 | | | | (739 | ) | | | 1,032 | | | | (674 | ) |
Loans and advances | | | (1,897 | ) | | | (46,855 | ) | | | (23,162 | ) | | | (37,813 | ) |
Net derivative financial instruments | | | (7,754 | ) | | | (1,628 | ) | | | (7,936 | ) | | | (796 | ) |
Net intra-group loans and advances | | | — | | | | — | | | | 6,412 | | | | 2,222 | |
Interest receivable | | | 722 | | | | (248 | ) | | | 586 | | | | (277 | ) |
Accrued income | | | 92 | | | | 40 | | | | 32 | | | | 22 | |
Net tax assets | | | 144 | | | | (1,282 | ) | | | (14 | ) | | | (1,416 | ) |
| | | | |
Net (decrease)/increase in operating liabilities | | | | | | | | | | | | | | | | |
Deposits and other borrowings | | | 12,601 | | | | 49,796 | | | | 26,171 | | | | 43,503 | |
Due to other financial institutions | | | (168 | ) | | | 976 | | | | (1,027 | ) | | | 761 | |
Payables and other liabilities | | | (994 | ) | | | (1,189 | ) | | | 259 | | | | (3,146 | ) |
Interest payable | | | (1,115 | ) | | | 754 | | | | (788 | ) | | | 560 | |
Accrued expenses | | | 294 | | | | 115 | | | | 281 | | | | 86 | |
Other | | | (190 | ) | | | (14 | ) | | | (29 | ) | | | (1,463 | ) |
| | | | | | | | | | | | | | | | |
Total adjustments | | | (6,625 | ) | | | (3,529 | ) | | | (7,257 | ) | | | (285 | ) |
| | | | | | | | | | | | | | | | |
Net cash (used in)/provided by operating activities | | | (3,682 | ) | | | (210 | ) | | | (4,972 | ) | | | 3,051 | |
| | | | | | | | | | | | | | | | |
b) Reconciliation of cash and cash equivalents
Cash and cash equivalents include liquid assets and amounts due from other financial institutions with an original term to maturity of less than three months. Cash and cash equivalents at the end of the financial year as shown in the statements of cash flows are reconciled to the related items in the statements of financial position as follows:
| | | | | | | | | | | | | | | | |
| | | Consolidated | | | The Company | |
| | | 2009
$m | | | 2008
$m | | | 2009
$m | | | 2008
$m | |
Liquid assets — less than three months | | | 18,393 | | | | 15,645 | | | | 15,228 | | | | 10,133 | |
Due from other financial institutions — less than three months | | | 4,412 | | | | 7,842 | | | | 2,823 | | | | 7,023 | |
| | | | | | | | | | | | | | | | |
Cash and cash equivalents in the statement of cashflows | | | 22,805 | | | | 23,487 | | | | 18,051 | | | | 17,156 | |
| | | | | | | | | | | | | | | | |
Financial Report 161
NOTES TO THE FINANCIAL STATEMENTS
37: Notes to the Cash Flow Statements (continued)
c) Acquisitions and disposals
| | | | | | | | | | | | | | | | |
| | | Consolidated | | | The Company | |
| | | 2009
$m | | | 2008
$m | | | 2009
$m | | | 2008
$m | |
Cash outflows from acquisitions and investments | | | | | | | | | | | | | | | | |
Purchases of controlled entities1 | | | 34 | | | | 10 | | | | 34 | | | | 6 | |
Investments in controlled entities | | | — | | | | — | | | | 194 | | | | 62 | |
Purchases of interest in associates and joint ventures | | | 229 | | | | 440 | | | | 3 | | | | 223 | |
| | | | | | | | | | | | | | | | |
| | | 263 | | | | 450 | | | | 231 | | | | 291 | |
| | | | | | | | | | | | | | | | |
Cash inflows from disposals | | | | | | | | | | | | | | | | |
Disposals of controlled entities | | | — | | | | 81 | | | | — | | | | 81 | |
Disposals of associates and joint ventures | | | 15 | | | | 47 | | | | 15 | | | | 32 | |
| | | | | | | | | | | | | | | | |
| | | 15 | | | | 128 | | | | 15 | | | | 113 | |
| | | | | | | | | | | | | | | | |
d) Non-cash financing and investing activities | | | | | | | | | | | | | | | | |
Share capital issues | | | | | | | | | | | | | | | | |
Dividends satisfied by share issue | | | 1,788 | | | | 2,506 | | | | 1,788 | | | | 2,506 | |
| | | | | | | | | | | | | | | | |
| | | 1,788 | | | | 2,506 | | | | 1,788 | | | | 2,506 | |
| | | | | | | | | | | | | | | | |
e) Financing arrangements
| | | | | | | | | | | | | | | | |
| | | Consolidated | |
| | | 2009 | | | | | | | | | 2008 | |
| | | Available
$m | | | Unused
$m | | | Available
$m | | | Unused
$m | |
Credit stand by arrangements | | | | | | | | | | | | | | | | |
Stand by lines | | | 1,186 | | | | 1,186 | | | | 1,419 | | | | 1,419 | |
Other financing arrangements | | | | | | | | | | | | | | | | |
Overdraft and other financing arrangements | | | — | | | | — | | | | — | | | | — | |
| | | | | | | | | | | | | | | | |
Total finance available | | | 1,186 | | | | 1,186 | | | | 1,419 | | | | 1,419 | |
| | | | | | | | | | | | | | | | |
| 1 | Cash outflows due to purchases of controlled entities in 2009 relate to acquisitions not yet complete. |
162ANZ Annual Report 2009
NOTES TO THE FINANCIAL STATEMENTS
38: Controlled Entities
| | | | | | | | |
| | | Incorporated in | | | Nature of business | |
Ultimate parent of the Group | | | | | | | | |
Australia and New Zealand Banking Group Limited | | | Australia | | | | Banking | |
All controlled entities are 100% unless otherwise noted. | | | | | | | | |
The material controlled entities of the Group are: | | | | | | | | |
Amerika Samoa Bank* | | | American Samoa | | | | Banking | |
ANZ Bank (Vietnam) Limited | | | Vietnam | | | | Banking | |
ANZ Capel Court Limited | | | Australia | | | | Investment Banking | |
ANZ Capital Hedging Pty Ltd | | | Australia | | | | Hedging | |
ANZ Commodity Trading Pty Ltd | | | Australia | | | | Finance | |
ANZcover Insurance Pty Ltd | | | Australia | | | | Captive-Insurance | |
ANZ Trustees Limited | | | Australia | | | | Trustee/Nominee | |
ANZ Fund Pty Ltd | | | Australia | | | | Investment | |
ANZ Bank (Europe) Limited* | | | United Kingdom | | | | Banking | |
ANZ Bank (Kiribati) Limited*1 | | | Kiribati | | | | Banking | |
ANZ Bank (Samoa) Limited* | | | Samoa | | | | Banking | |
ANZ Holdings (New Zealand) Limited* | | | New Zealand | | | | Holding Company | |
ANZ National Bank Limited* | | | New Zealand | | | | Banking | |
ANZ Investment Services (New Zealand) Limited* | | | New Zealand | | | | Fund Manager | |
ANZ National (Int’l) Limited* | | | New Zealand | | | | Finance | |
Arawata Finance Limited* | | | New Zealand | | | | Finance | |
Arawata Trust* | | | New Zealand | | | | Finance | |
Arawata Holdings Limited* | | | New Zealand | | | | Holding Company | |
Harcourt Corporation Limited* | | | New Zealand | | | | Investment | |
Arawata Trust Company* | | | New Zealand | | | | Finance | |
Endeavor Finance Limited* | | | New Zealand | | | | Finance | |
Tui Endeavor Limited* | | | New Zealand | | | | Finance | |
Private Nominees Limited* | | | New Zealand | | | | Nominee | |
UDC Finance Limited* | | | New Zealand | | | | Finance | |
ANZ International (Hong Kong) Limited* | | | Hong Kong | | | | Holding Company | |
ANZ Asia Limited* | | | Hong Kong | | | | Banking | |
ANZ Bank (Vanuatu) Limited | | | Vanuatu | | | | Banking | |
ANZ International Private Limited* | | | Singapore | | | | Holding Company | |
ANZ Singapore Limited* | | | Singapore | | | | Merchant Banking | |
ANZ Royal Bank (Cambodia) Limited*1 | | | Cambodia | | | | Banking | |
LFD Limited | | | Australia | | | | Holding Company | |
Minerva Holdings Limited* | | | United Kingdom | | | | Holding Company | |
Upspring Limited* | | | United Kingdom | | | | Finance | |
Votraint No. 1103 Pty Ltd | | | Australia | | | | Investment | |
ANZ Lenders Mortgage Insurance Pty Ltd | | | Australia | | | | Mortgage Insurance | |
ANZ Nominees Limited | | | Australia | | | | Nominee | |
ANZ Orchard Investments Pty Ltd | | | Australia | | | | Holding Company | |
Australia and New Zealand Banking Group (PNG) Limited | | | Papua New Guinea | | | | Banking | |
Chongqing Liangping ANZ Rural Bank Company Limited | | | China | | | | Banking | |
Citizens Bancorp Inc | | | Guam | | | | Holding Company | |
Citizens Security Bank (Guam) Inc* | | | Guam | | | | Banking | |
Esanda Finance Corporation Limited | | | Australia | | | | General Finance | |
ETRADE Australia Limited | | | Australia | | | | Online Stockbroking | |
Omeros II Trust1 | | | Australia | | | | Securitisation | |
PT ANZ Panin Bank*1 | | | Indonesia | | | | Banking | |
ANZ Vientiane Commercial Bank Limited*1 | | | Laos | | | | Banking | |
| * | Audited by overseas KPMG firms. |
| 1 | Minority interests hold ordinary shares or units in the controlled entities listed above as follows: Bank of Kiribati Ltd – 150,000 $1 ordinary shares (25%) (2008: 150,000 $1 ordinary shares (25%)); PT ANZ Panin Bank – 7,500 IDR 1 million shares (15%) (2008: 7,500 IDR 1 million shares (15%)); ANZ Royal Bank (Cambodia) Limited – 319,500 USD100 ordinary shares (45%) (2008: 189,000 USD100 ordinary shares (35%)); ANZ Vientiane Commercial Bank Limited – 1,000,000 $1 ordinary shares (10%) (2008: 4,000,000 $1 ordinary shares (40%)); Omeros II Trust – residual capital unitholder (2008: residual capital unitholder). |
Financial Report 163
NOTES TO THE FINANCIAL STATEMENTS
39: Associates
Significant associates of the Group are as follows:
| | | | | | | | | | | | | | | | | | |
| | | Date
became an
associate | | Ownership
interest
held | | Voting
interest | | Incorporated
in | | Carrying
value
2009
$m | | Carrying
value
2008
$m | | Fair
value2
$m | | Reporting
date | | Principal
activity |
AMMB Holdings Berhad1 | | May 2007 | | 24% | | 24% | | Malaysia | | 958 | | 999 | | 1,000 | | 31 March | | Banking |
P.T. Bank Pan Indonesia | | April 2001 | | 39% | | 39% | | Indonesia | | 516 | | 406 | | 939 | | 31 December | | Banking |
Shanghai Rural Commercial Bank | | September 2007 | | 20% | | 20% | | Peoples Republic
of China | | 461 | | 403 | | n/a | | 31 December | | Banking |
Bank of Tianjin | | June 2006 | | 20% | | 20% | | Peoples Republic
of China | | 276 | | 218 | | n/a | | 31 December | | Banking |
Saigon Securities Inc.1 | | July 2008 | | 18% | | 18% | | Vietnam | | 108 | | 150 | | 146 | | 31 December | | Stockbroking |
Diversified Infrastructure Trust3 | | March 2008 | | 54% | | 54% | | Australia | | 104 | | 100 | | n/a | | 30 September | | Investment |
Cards NZ Limited | | August 2002 | | 15% | | 15% | | New Zealand | | 70 | | 72 | | n/a | | 30 September | | Cards Services |
Metrobank Card Corporation | | October 2003 | | 40% | | 40% | | Philippines | | 34 | | 30 | | n/a | | 31 December | | Cards Issuing |
Other associates | | | | | | | | | | 185 | | 230 | | | | | | |
| | | | | | | | | | | | | | | | | | |
Total carrying value of associates | | | | | | | | | | 2,712 | | 2,608 | | | | | | |
| | | | | | | | | | | | | | | | | | |
| 1 | Significant influence was established via representation on the Board of Directors. |
| 2 | Applicable to those investments in associates where there are published price quotations. |
| 3 | ANZ has significant influence but not control over this entity (refer note 17 for further details). |
| | | | | | | | |
| | | 2009
$m | | | 2008
$m | |
Aggregated assets of significant associates (100%) | | | 88,726 | | | | 88,929 | |
Aggregated liabilities of significant associates (100%) | | | 80,817 | | | | 81,561 | |
Aggregated revenues of significant associates (100%) | | | 6,089 | | | | 5,239 | |
| | | | | | | | |
| | | Consolidated | |
| | | 2009
$m | | | 2008
$m | |
Results of Associates | | | | | | | | |
Share of associates profit before income tax | | | 294 | | | | 278 | |
Share of income tax expense | | | (74 | ) | | | (56 | ) |
| | | | | | | | |
Share of associates net profit – as disclosed by associates | | | 220 | | | | 222 | |
Adjustments1 | | | 162 | | | | (4 | ) |
| | | | | | | | |
Share of associates net profit accounted for using the equity method | | | 382 | | | | 218 | |
| | | | | | | | |
| 1 | The results differ from the published results of these entities due to the application of IFRS, Group Policies and acquisition adjustments. |
164ANZ Annual Report 2009
NOTES TO THE FINANCIAL STATEMENTS
40: Interests in Joint Venture Entities
The Group has interests in joint venture entities as follows:
| | | | | | | | | | | | | | | | | | | | | | | | |
| | | Ownership
interest held | | | Voting
interest | | | Incorporated in | | | Carrying value6
$m | | | Reporting
date | | | Principal activity | |
ING Australia Limited1,5 | | | 49 | %2 | | | 49 | % | | | Australia | | | | 1,649 | | | | 31 December | | | | Funds Management | |
| | | | | | | | | | | | | | | | | | | | | | | and Insurance | |
ING (NZ) Holdings Limited3,5 | | | 49 | %4 | | | 50 | % | | | New Zealand | | | | 204 | | | | 31 December | | | | Funds Management | |
| | | | | | | | | | | | | | | | | | | | | | | and Insurance | |
| | | | | | | | | | | | | | | | | | | | | | | | |
Total interests in Joint Venture entities | | | | | | | | | | | | | | | 1,853 | | | | | | | | | |
| | | | | | | | | | | | | | | | | | | | | | | | |
On 25 September 2009, the Company announced it had reached agreement with ING Groep to acquire ING Groep’s 51% shareholdings in the ANZ-ING wealth management and life insurance joint ventures in Australia and New Zealand for $1,760 million, taking its ownership interest to 100%. Completion is subject to various conditions, including regulatory approval, and is expected to occur during the fourth quarter of calendar 2009.
Once completed, the acquisition will result in the Group fully consolidating the assets, liabilities and operations of ING Australia Limited (“INGA”) and ING (NZ) Holdings Limited (“INGNZ”) and its subsidiary companies into the Group’s results. At acquisition date, under the step acquisition provisions of AASB3R Business Combinations (Revised), the Group will remeasure its existing 49% interests which are accounted for under the equity method at acquisition date fair values and will recognise the resulting gain or loss in the income statement.
The 49% interests in INGA and INGNZ were accounted for as joint venture entities at 30 September 2009 and accordingly equity accounting is applied. These investments were assessed for impairment by comparing the carrying values to both the fair market value and the value in use, which is based on a discounted cash flow analysis. The investments were not considered impaired as the value in use for these associates exceeds the carrying value.
| 1 | A joint venture entity from 1 May 2002. |
| 2 | This represents the Group’s 49% share of the assets and liabilities of ING Australia Limited. The Group has joint control of the joint venture, and accordingly the entity is not consolidated. Key details of the joint venture are: |
| | • | | ING Australia Limited is owned 51% by ING Groep and 49% by ANZ. |
| | • | | Both shareholders have an equal say in strategic decisions with a number of matters requiring the approval of both shareholders (i.e. require unanimous approval). These include major items of capital expenditure, acquisitions or disposals in excess of $20 million and changes to the Board structure. |
| | • | | Equal board representation with four Group nominees and four ING Groep nominees. All key issues (including business plans, major capital expenditure, acquisitions etc) require unanimous Board approval. |
| | • | | Refer to Critical Estimates and Judgements used in Applying Accounting Policies note 2 (iii) for details regarding valuation of investment in ING Australia Limited. |
| | The Joint Venture includes the majority of the Group’s and ING’s funds management and insurance activities in Australia. |
| 3 | A joint venture entity from 30 September 2005. |
| 4 | This represents the Group’s 49% share of assets and liabilities of ING (NZ) Holdings Limited. The Group has joint control of the joint venture, and accordingly the entity is not consolidated. Key details of the joint venture are: |
| | • | | ING (NZ) Holdings Limited is owned 51% by ING Groep and 49% by ANZ. |
| | • | | Both shareholders have an equal say in strategic decisions with a number of matters requiring the approval of both shareholders (i.e. require unanimous approval). These include major items of capital expenditure, acquisitions or disposals in excess of $20 million and changes to the Board structure. |
| | • | | Equal board representation with four Group nominees and four ING Group nominees. All key decisions (including business plans, major capital expenditure, acquisitions etc) require unanimous Board approval. |
| | • | | Refer to Critical Estimates and Judgements used in Applying Accounting Policies note 2 (iii) for details regarding valuation of investment in ING (NZ) Holdings Limited |
| | The joint venture includes the majority of the Group’s and ING’s funds management and insurance activities in New Zealand. |
| 5 | ING Australia Limited and ING (NZ) Holdings Limited have different reporting dates than the Consolidated Group to align with the ING Groep parent entity. |
| 6 | 2008 carrying values as follows: ING Australia Limited $1,589 million; and ING (NZ) Holdings Limited $178 million. |
Financial Report165
NOTES TO THE FINANCIAL STATEMENTS
40: Interests in Joint Venture Entities (continued)
| | | | | | | | | | | | | | | | | | | | | | | | |
| | | ING Australia Limited | | | ING (NZ) Holdings
Limited | | | Consolidated
Total | |
| | | 2009 | | | 2008 | | | 2009 | | | 2008 | | | 2009 | | | 2008 | |
| | | $m | | | $m | | | $m | | | $m | | | $m | | | $m | |
Retained profits attributable to the joint venture entity | | | | | | | | | | | | | | | | | | | | | | | | |
At the beginning of the year | | | 410 | | | | 313 | | | | 58 | | | | 39 | | | | 468 | | | | 352 | |
At the end of the year | | | 483 | | | | 410 | | | | 68 | | | | 58 | | | | 551 | | | | 468 | |
| | | | | | | | | | | | | | | | | | | | | | | | |
Movement in the carrying amount of the joint venture entity | | | | | | | | | | | | | | | | | | | | | | | | |
Carrying amount at the commencement of the year | | | 1,589 | | | | 1,519 | | | | 178 | | | | 162 | | | | 1,767 | | | | 1,681 | |
Share of net profit | | | 73 | | | | 124 | | | | 10 | | | | 19 | | | | 83 | | | | 143 | |
Dividend received | | | — | | | | (27 | ) | | | — | | | | — | | | | — | | | | (27 | ) |
Movement of reserves | | | (13 | ) | | | (27 | ) | | | — | | | | — | | | | (13 | ) | | | (27 | ) |
Additional investment | | | — | | | | — | | | | 19 | | | | — | | | | 19 | | | | — | |
Adjustment for exchange fluctuations | | | — | | | | — | | | | (3 | ) | | | (3 | ) | | | (3 | ) | | | (3 | ) |
| | | | | | | | | | | | | | | | | | | | | | | | |
Carrying amount at the end of the year | | | 1,649 | | | | 1,589 | | | | 204 | | | | 178 | | | | 1,853 | | | | 1,767 | |
| | | | | | | | | | | | | | | | | | | | | | | | |
Share of assets and liabilities1 | | | | | | | | | | | | | | | | | | | | | | | | |
Investments | | | 11,914 | | | | 12,498 | | | | 75 | | | | 65 | | | | 11,989 | | | | 12,563 | |
Other assets | | | 2,909 | | | | 2,340 | | | | 140 | | | | 134 | | | | 3,049 | | | | 2,474 | |
| | | | | | | | | | | | | | | | | | | | | | | | |
Share of total assets | | | 14,823 | | | | 14,838 | | | | 215 | | | | 199 | | | | 15,038 | | | | 15,037 | |
| | | | | | | | | | | | | | | | | | | | | | | | |
Policy holder liabilities | | | 13,176 | | | | 13,311 | | | | (38 | ) | | | (3 | ) | | | 13,138 | | | | 13,308 | |
Other liabilities | | | 575 | | | | 516 | | | | 52 | | | | 9 | | | | 627 | | | | 525 | |
| | | | | | | | | | | | | | | | | | | | | | | | |
Share of total liabilities | | | 13,751 | | | | 13,827 | | | | 14 | | | | 6 | | | | 13,765 | | | | 13,833 | |
| | | | | | | | | | | | | | | | | | | | | | | | |
Share of net assets | | | 1,072 | | | | 1,011 | | | | 201 | | | | 193 | | | | 1,273 | | | | 1,204 | |
| | | | | | | | | | | �� | | | | | | | | | | | | | |
Share of revenues, expenses and results | | | | | | | | | | | | | | | | | | | | | | | | |
Revenues | | | 343 | | | | 396 | | | | 95 | | | | 77 | | | | 438 | | | | 473 | |
Expenses | | | (229 | ) | | | (230 | ) | | | (89 | ) | | | (63 | ) | | | (318 | ) | | | (293 | ) |
| | | | | | | | | | | | | | | | | | | | | | | | |
Profit before income tax | | | 114 | | | | 166 | | | | 6 | | | | 14 | | | | 120 | | | | 180 | |
| | | | | | | | | | | | | | | | | | | | | | | | |
Income tax (expense)/benefit | | | (41 | ) | | | (42 | ) | | | 4 | | | | 5 | | | | (37 | ) | | | (37 | ) |
| | | | | | | | | | | | | | | | | | | | | | | | |
Profit after income tax | | | 73 | | | | 124 | | | | 10 | | | | 19 | | | | 83 | | | | 143 | |
| | | | | | | | | | | | | | | | | | | | | | | | |
Net equity accounted profit | | | 73 | | | | 124 | | | | 10 | | | | 19 | | | | 83 | | | | 143 | |
| | | | | | | | | | | | | | | | | | | | | | | | |
Share of commitments | | | | | | | | | | | | | | | | | | | | | | | | |
Lease commitments | | | 136 | | | | 141 | | | | 14 | | | | 7 | | | | 150 | | | | 148 | |
Other commitments | | | 43 | | | | 51 | | | | — | | | | — | | | | 43 | | | | 51 | |
| | | | | | | | | | | | | | | | | | | | | | | | |
Share of total expenditure commitments | | | 179 | | | | 192 | | | | 14 | | | | 7 | | | | 193 | | | | 199 | |
| | | | | | | | | | | | | | | | | | | | | | | | |
Share of contingent liabilities | | | | | | | | | | | | | | | | | | | | | | | | |
In relation to ANZ’s interest in the joint venture entity2 | | | 21 | | | | 27 | | | | — | | | | — | | | | 21 | | | | 27 | |
| | | | | | | | | | | | | | | | | | | | | | | | |
| | | 21 | | | | 27 | | | | — | | | | — | | | | 21 | | | | 27 | |
| | | | | | | | | | | | | | | | | | | | | | | | |
| 1 | This represents the Group’s share of the assets and liabilities of ING Australia Limited and ING (NZ) Holdings Limited, less minority interests and including goodwill on acquisition of ANZ Funds Management entities. |
| 2 | This represents Deeds of Subordination with ASIC as buyer of last resort. |
166ANZ Annual Report 2009
NOTES TO THE FINANCIAL STATEMENTS
41: Securitisations
ANZ enters into transactions in the normal course of business by which it transfers financial assets directly to third parties or to special purpose entities. These transfers may give rise to the full or partial derecognition of those financial assets.
| • | | Full derecognition occurs when ANZ transfers its contractual right to receive cash flows from the financial assets, or retains the right but assumes an obligation to pass on the cash flows from the asset, and transfers substantially all the risks and rewards of ownership. These risks include credit, interest rate, currency, prepayment and other price risks. |
| • | | Partial derecognition occurs when ANZ sells or otherwise transfers financial assets in such a way that some but not substantially all of the risks and rewards of ownership are transferred but control is retained. These financial assets are recognised on the balance sheet to the extent of ANZ’s continuing involvement. |
The following table summarises ANZ’s securitisation activities for ANZ-originated assets. The 2009 securitisation activity relates to an internal residential mortgage securitisation creating instruments eligible for repurchase arrangements with the Reserve Bank of Australia.
| | | | | | | | | | | | | | | | |
| | | Consolidated | | | The Company | |
| | | 2009
$m | | | 2008
$m | | | 2009
$m | | | 2008
$m | |
Carrying amount of assets securitised (sold) during the year | | | — | | | | — | | | | 22,971 | | | | 11,229 | |
Net cash proceeds received | | | — | | | | — | | | | — | | | | — | |
Retained interests | | | — | | | | — | | | | (22,971 | ) | | | (11,229 | ) |
| | | | | | | | | | | | | | | | |
Gain/(loss) on securitisation/sale (pre-tax) | | | — | | | | — | | | | — | | | | — | |
| | | | | | | | | | | | | | | | |
ANZ-originated financial assets that do not qualify for derecognition typically relate to loans that have been securitised under arrangements by which ANZ retains a continuing involvement in the transferred assets. Continuing involvement may entail: retaining the rights to future cash flows arising from the assets after investors have received their contractual terms; providing subordinated interests; liquidity support; continuing to service the underlying asset; or entering into derivative transactions with the securitisation vehicles. In such instances, ANZ continues to be exposed to risks associated with these transactions.
The rights and obligations that ANZ retains from its continuing involvement in securitisations are initially recorded as an allocation of the fair value of the financial asset between the portion that is derecognised and the portion that continues to be recognised on the date of transfer. The carrying amount of ANZ-originated financial assets that did not achieve derecognition during the year are set out below:
| | | | | | | | | | | | | | | | |
| | | Consolidated1 | | | The Company | |
Securitisation | | 2009
$m | | | 2008
$m | | | 2009
$m | | | 2008
$m | |
Carrying amount of assets (original) | | | — | | | | — | | | | 22,971 | | | | 11,229 | |
Carrying amount of assets (currently recognised) | | | — | | | | — | | | | 19,929 | | | | 10,360 | |
Carrying amount of associated liabilities | | | — | | | | — | | | | 19,929 | | | | 10,360 | |
| 1 | The balances are nil as the Company balances are eliminated the balance in the Company relate to an internal securitisation. |
Additional information in relation to securitisation exposures is included in Financial Information section 4 (unaudited disclosures).
42: Fiduciary Activities
The Group conducts various fiduciary activities as follows:
Investment fiduciary activities for trusts
The Group conducts investment fiduciary activities for trusts, including deceased estates. These trusts have not been consolidated as the Group does not have direct or indirect control.
Where the Company or its controlled entities incur liabilities in respect of these operations as trustee, where the primary obligation is incurred in an agency capacity as trustee of the trust rather than on the Group’s own account, a right of indemnity exists against the assets of the applicable funds or trusts. As these assets are sufficient to cover the liabilities and it is therefore not probable that the Company or its controlled entities will be required to settle the liabilities, the liabilities are not included in the financial statements.
Financial Report 167
NOTES TO THE FINANCIAL STATEMENTS
42: Fiduciary Activities (continued)
The aggregate amounts of funds concerned are as follows:
| | | | | | | | |
| | | Consolidated | |
| | | 2009
$m | | | 2008
$m | |
Trusteeships | | | 2,439 | | | | 2,338 | |
Funds management activities
Funds management activities are conducted through the ING Australia Limited and ING (NZ) Holdings Limited joint ventures and certain subsidiaries of the Group. As stated in note 1A(vii), shares in joint venture entities are stated in the consolidated balance sheet at cost plus the Group’s share of post acquisition earnings. Funds under management on behalf of customers are not consolidated because these funds invest in specified investments on behalf of clients.
The Group controlled or jointly controlled fund management companies with funds under management as follows:
| | | | | | | | |
| | | 2009
$m | | | 2008
$m | |
ING Australia Limited Joint Venture | | | 43,275 | | | | 42,507 | |
ING (NZ) Holdings Limited Joint Venture | | | 5,541 | | | | 6,764 | |
Controlled entities – New Zealand | | | 5,948 | | | | 4,908 | |
Controlled entities – Australia | | | 1,053 | | | | 1,365 | |
| | | | | | | | |
| | | 55,817 | | | | 55,544 | |
| | | | | | | | |
Custodian services activities
Custodian services are conducted through ANZ Custodian Services. ANZ Custodian Services holds investment assets under custody on behalf of external customers and as a consequence the assets are not consolidated in the Group’s accounts. As at 30 September 2009, ANZ Custodian Services had funds under custody and administration in Australia of $98.5 billion (30 September 2008: $143.2 billion) and in New Zealand of $5.4 billion (30 September 2008: $6.9 billion).
43: Commitments
| | | | | | | | | | | | | | | | |
| | | Consolidated | | | The Company | |
| | | 2009
$m | | | 2008
$m | | | 2009
$m | | | 2008
$m | |
Property | | | | | | | | | | | | | | | | |
Contracts for construction of new office building in Docklands area, Melbourne Australia | | | | | | | | | | | | | | | | |
Not later than 1 year | | | 56 | | | | 375 | | | | 56 | | | | 375 | |
Later than one year but not later than 5 years | | | — | | | | 9 | | | | — | | | | 9 | |
Capital expenditure | | | | | | | | | | | | | | | | |
Contracts for outstanding capital expenditure | | | | | | | | | | | | | | | | |
Not later than 1 year | | | 38 | | | | 53 | | | | 14 | | | | 22 | |
| | | | | | | | | | | | | | | | |
Total capital expenditure commitments1 | | | 94 | | | | 437 | | | | 70 | | | | 406 | |
| | | | | | | | | | | | | | | | |
Lease rentals | | | | | | | | | | | | | | | | |
Land and buildings | | | | | | | | | | | | | | | | |
Not later than 1 year | | | 252 | | | | 271 | | | | 187 | | | | 197 | |
Later than one year but not later than 5 years | | | 559 | | | | 597 | | | | 422 | | | | 437 | |
Later than 5 years | | | 324 | | | | 362 | | | | 298 | | | | 340 | |
| | | | | | | | | | | | | | | | |
| | | 1,135 | | | | 1,230 | | | | 907 | | | | 974 | |
| | | | | | | | | | | | | | | | |
Furniture and equipment | | | | | | | | | | | | | | | | |
Not later than 1 year | | | 38 | | | | 37 | | | | 31 | | | | 25 | |
Later than one year but not later than 5 years | | | 68 | | | | 47 | | | | 63 | | | | 35 | |
Later than 5 years | | | — | | | | — | | | | — | | | | — | |
| | | | | | | | | | | | | | | | |
| | | 106 | | | | 84 | | | | 94 | | | | 60 | |
| | | | | | | | | | | | | | | | |
Total lease rental commitments | | | 1,241 | | | | 1,314 | | | | 1,001 | | | | 1,034 | |
| | | | | | | | | | | | | | | | |
Total commitments | | | 1,335 | | | | 1,751 | | | | 1,071 | | | | 1,440 | |
| | | | | | | | | | | | | | | | |
| 1 | Relates to premises and equipment. |
In addition, as disclosed in Note 50, the Company has reached agreement to acquire ING Groep’s 51% shareholdings in the ANZ-ING wealth management and life insurance joint venture in Australia and New Zealand for $1,760 million and selected businesses from Royal Bank of Scotland Group plc for approximately USD 550 million (AUD 626 million). Both acquisitions are subject to regulatory approval.
168 ANZ Annual Report 2009
NOTES TO THE FINANCIAL STATEMENTS
44: Credit Related Commitments, Guarantees, Contingent Liabilities and Contingent Assets
CREDIT RELATED COMMITMENTS GUARANTEES AND CONTINGENT LIABILITIES
Credit related commitments
Facilities provided
| | | | | | | | | | | | | | | | |
| | | Consolidated | | | The Company | |
| | | Contract
amount
2009
$m | | | Contract
amount
2008
$m | | | Contract
amount
2009
$m | | | Contract
amount
2008
$m | |
Undrawn facilities1 | | | 106,644 | | | | 111,265 | | | | 88,006 | | | | 90,026 | |
| | | | | | | | | | | | | | | | |
Australia | | | 72,170 | | | | 71,911 | | | | 72,210 | | | | 71,109 | |
New Zealand | | | 16,180 | | | | 18,818 | | | | — | | | | — | |
Overseas Markets | | | 18,294 | | | | 20,536 | | | | 15,796 | | | | 18,917 | |
| | | | | | | | | | | | | | | | |
Total | | | 106,644 | | | | 111,265 | | | | 88,006 | | | | 90,026 | |
| | | | | | | | | | | | | | | | |
| 1 | The credit risk of the undrawn facilities may be less than the contract amount, however the credit risk has been taken to be the contract amount. The majority of undrawn facilities are subject to customers maintaining specific credit standards. The amount does not necessarily represent future cash requirements as many of these facilities are expected to be partially used or to expire unused. |
Guarantees and contingent liabilities
Details of the estimated maximum amount of guarantees and contingent liabilities that may become payable are disclosed on the following pages. These guarantees and contingent liabilities relate to transactions that the Group has entered into as principal. Financial guarantees are contracts that require the issuer to make specified payments to reimburse the holder for a loss incurred because a specified debtor fails to make payment when due in accordance with the original or modified terms of a debt instrument.
Standby letters of credit are obligations on the part of the Group to pay to third parties when customers fail to make payments when due.
Documentary letters of credit involve the issue of letters of credit guaranteeing payment in favour of an exporter secured against an underlying shipment of goods or backed by a confirmatory letter of credit from another bank.
Performance related contingencies are liabilities that oblige the Group to make payments to a third party should the customer fail to fulfil the non-monetary terms of the contract.
To reflect the risk associated with these transactions, they are subjected to the same credit origination, portfolio management and collateral requirements for customers that apply for loans. The contract amount represents the maximum potential amount that could be lost if the counterparty fails to meet its financial obligations. As the facilities may expire without being drawn upon, the notional amounts do not necessarily reflect future cash requirements.
| | | | | | | | | | | | | | | | |
| | | Consolidated | | | The Company | |
| | | Contract
amount
2009
$m | | | Contract
amount
2008
$m | | | Contract
amount
2009
$m | | | Contract
amount
2008
$m | |
Financial Guarantees | | | 4,760 | | | | 6,679 | | | | 4,561 | | | | 6,442 | |
Standby letters of credit | | | 1,528 | | | | 1,651 | | | | 1,492 | | | | 1,617 | |
Bill endorsements | | | — | | | | 10 | | | | — | | | | 10 | |
Documentary letter of credit | | | 3,195 | | | | 4,957 | | | | 2,942 | | | | 4,744 | |
Performance related contingencies | | | 14,924 | | | | 15,568 | | | | 14,004 | | | | 14,518 | |
Other | | | 811 | | | | 1,141 | | | | 504 | | | | 706 | |
| | | | | | | | | | | | | | | | |
Total | | | 25,218 | | | | 30,006 | | | | 23,503 | | | | 28,037 | |
| | | | | | | | | | | | | | | | |
Australia | | | 12,758 | | | | 13,170 | | | | 12,781 | | | | 13,184 | |
New Zealand | | | 1,113 | | | | 1,435 | | | | — | | | | — | |
Overseas Markets | | | 11,347 | | | | 15,401 | | | | 10,722 | | | | 14,853 | |
| | | | | | | | | | | | | | | | |
Total | | | 25,218 | | | | 30,006 | | | | 23,503 | | | | 28,037 | |
| | | | | | | | | | | | | | | | |
Financial Report 169
NOTES TO THE FINANCIAL STATEMENTS
44: Credit Related Commitments, Guarantees, Contingent Liabilities and Contingent Assets (continued)
OTHER BANK RELATED CONTINGENT LIABILITIES
GENERAL
There are outstanding court proceedings, claims and possible claims against the Group, the aggregate amount of which cannot readily be quantified. Appropriate legal advice has been obtained and, in the light of such advice, provisions as deemed necessary have been made. In some instances we have not disclosed the estimated financial impact as this may prejudice the interests of the Group.
i) Securities Lending
ANZ had entered into Australian Master Securities Lending Agreements (AMSLAs) with Opes Prime and a related company. Under the AMSLAs, ANZ acquired shares in various companies listed on the Australian Stock Exchange. On 27 March 2008, ANZ appointed a receiver and manager to Opes Prime and related companies.
In August 2009, the Federal Court of Australia approved a scheme of arrangement which provides a commercial resolution of claims against ANZ and Merrill Lynch by Opes Prime creditors, the liquidators of Opes Prime, and the Australian Securities and Investments Commission. ANZ, Merrill Lynch and the receiver of Opes Prime contributed assets and cash totalling approximately $253 million. Provision has been made for ANZ’s share of the cost in these financial statements.
A US class action was commenced against ANZ and certain directors and executives in December 2008 on behalf of holders of ANZ’s American Depositary Receipts (ADRs). The claim alleges that ANZ and the named individuals failed to disclose information regarding internal controls in ANZ’s securities lending business and that this affected the value of the ADRs. The proceedings are at an early stage and are being defended.
ANZ had also entered into an AMSLA with Primebroker Securities Limited. On 4 July 2008, ANZ appointed a receiver and manager to Primebroker. On 31 August 2009, a court found that ANZ’s appointment of the receiver to Primebroker was invalid. The receiver is appealing the decision. ANZ has joined in the appeal.
There are ongoing developments concerning the events surrounding ANZ’s securities lending business which may continue for some time. There is a risk that further actions (court proceedings or regulatory actions) may be commenced against various parties, including ANZ. The potential impact or outcome of future claims (if any) cannot presently be ascertained. ANZ would review and defend any claim, as appropriate.
ii) Contingent tax liability
The Australian Taxation Office (ATO) is reviewing the taxation treatment of certain transactions, including structured finance transactions, undertaken by the Group in the course of normal business activities. Some assessments have been received which are being challenged in the normal manner.
The New Zealand Inland Revenue Department (“IRD”) is reviewing a number of structured finance transactions as part of an audit of the 2000 to 2005 tax years. A number of cases are before the courts and two decisions have been issued in the High Court, on 16 July 2009 and 7 October 2009, in favour of the IRD in respect of proceedings taken against other Banks.
The Group has a provision which covers its exposure to primary tax and interest (tax–effected), net of an amount receivable from Lloyds Banking Group plc (“Lloyds”) reflecting an indemnity given by Lloyds under the agreement by which the Group acquired the NBNZ Holdings Limited Group.
All of these transactions have now either matured or been terminated.
Other audits and risk reviews are being undertaken by the ATO, the IRD and by revenue authorities in other jurisdictions, as part of normal revenue authority activity in those countries.
The Company has assessed these and other taxation claims arising in Australia, New Zealand and elsewhere, including seeking independent advice where appropriate, and considers that it holds appropriate provisions.
iii) Interbank deposit agreement
ANZ has entered into an Interbank Deposit Agreement with the major banks in the payments system. This agreement is a payment system support facility certified by the Australian Prudential Regulation Authority, where the terms are such that if any bank is experiencing liquidity problems, the other participants are required to deposit equal amounts of up to $2 billion for a period of 30 days. At the end of 30 days the deposit holder has the option to repay the deposit in cash or by way of assignment of mortgages to the value of the deposit.
iv) Nominee activities
The Group will indemnify each customer of controlled entities engaged in nominee activities against loss suffered by reason of such entities failing to perform any obligation undertaken by them to a customer in accordance with the terms of the applicable agreement (refer note 42).
v) New Zealand Commerce Commission
In November 2006, the Commerce Commission brought proceedings under the Commerce Act 1986 against Visa, MasterCard and all New Zealand issuers of Visa and MasterCard credit cards, including ANZ National Bank Limited. The Commerce Commission alleges price fixing and substantially lessening competition in relation to the setting of credit card interchange fees and is seeking penalties and orders under the Commerce Act.
Subsequently, several major New Zealand retailers have issued proceedings against ANZ National Bank Limited and the other abovementioned defendants seeking unquantified damages, based on allegations similar to those contained in the Commerce Commission proceedings. ANZ National Bank Limited settled the claims with the Commission and the retailers without any admission of liability. Similar settlements were reached by the other parties. The proceedings against all parties were discontinued in October 2009.
In addition, ANZ is aware that the Commerce Commission is looking closely at credit contract fees under the Credit Contracts and Consumer Finance Act 2003 (“CCCFA”). In its 2008-2011 Statement of Intent the Commission stated that: “The Commission is turning more to litigation under the Credit Contracts and Consumer Finance Act to ensure credit contract fees are reasonable and disclosed. Currently the credit industry is not fully compliant with the legislation and taking more action through the courts will encourage better compliance and clarify any areas of the law that may be uncertain.”
In particular ANZ is aware that the Commerce Commission is investigating the level of default fees charged on credit cards and the level of currency conversion charges on overseas transactions using credit cards under the CCCFA. The Commission is also investigating early repayment charges on fixed rate mortgages. At this stage the possible outcome of these investigations and any liability or impact on fees cannot be determined with any certainty.
170ANZ Annual Report 2009
NOTES TO THE FINANCIAL STATEMENTS
44: Credit Related Commitments, Guarantees, Contingent Liabilities and Contingent Assets (continued)
vi) Clearing and settlement obligations
In accordance with the clearing and settlement arrangements set out:
| • | | in the Australian Payments Clearing Association Limited Regulations for the Australian Paper Clearing System, the Bulk Electronic Clearing System, the Consumer Electronic Clearing System and the High Value Clearing System (HVCS), the Company has a commitment to comply with rules which could result in a bilateral exposure and loss in the event of a failure to settle by a member institution; and |
| • | | in the Austraclear System Regulations and the CLS Bank International Rules, the Company has a commitment to participate in loss-sharing arrangements in the event of a failure to settle by a member institution. |
For HVCS and Austraclear, the obligation arises only in limited circumstances.
vii) Deed of Cross Guarantee in respect of certain controlled entities
Pursuant to class order 98/1418 (as amended) dated 13 August 1998, relief was granted to a number of wholly owned controlled entities from the Corporations Act 2001 requirements for preparation, audit, and publication of individual financial statements. The results of these companies are included in the consolidated Group results. The entities to which relief was granted are:
| | | | |
• ANZ Properties (Australia) Pty Ltd1 | | • ANZ Orchard Investments Pty Ltd2 | | • ANZ Funds Pty Ltd1 |
• ANZ Capital Hedging Pty Ltd1 | | • ANZ Securities (Holdings) Limited3 | | • Votraint No. 1103 Pty Ltd2 |
• Alliance Holdings Pty Ltd1 | | • ANZ Commodity Trading Pty Ltd4 | | • ANZ Nominees Ltd5 |
| 1 | Relief originally granted on 21 August 2001. |
| 2 | Relief originally granted on 13 August 2002. |
| 3 | Relief originally granted on 9 September 2003. |
| 4 | Relief originally granted on 11 August 2008. |
| 5 | Relief originally granted on 9 February 2009. |
It is a condition of the class order that the Company and each of the above controlled entities enter into a Deed of Cross Guarantee. A Deed of Cross Guarantee under the class order was executed by them and lodged with the Australian Securities and Investments Commission. The Deed of Cross Guarantee is dated 1 March 2006. The effect of the Deed is that the Company guarantees to each creditor payment in full of any debt in the event of winding up any of the controlled entities under certain provisions of the Corporations Act 2001. If a winding up occurs, the Company will only be liable in the event that after six months any creditor has not been paid in full. The controlled entities have also given similar guarantees in the event that the Company is wound up. The consolidated income statement and consolidated balance sheet of the Company and its wholly owned controlled entities which have entered into the Deed of Cross Guarantee are:
| | | | | | | | |
| | | Consolidated | |
| | | 2009
$m | | | 2008
$m | |
Profit before tax | | | 4,063 | | | | 3,950 | |
Income tax expense | | | (921 | ) | | | (679 | ) |
| | | | | | | | |
Profit after income tax | | | 3,142 | | | | 3,271 | |
Retained profits at the start of the year | | | 10,810 | | | | 10,105 | |
| | | | | | | | |
Total available for appropriation | | | 13,952 | | | | 13,376 | |
| | | | | | | | |
Ordinary share dividends provided for or paid | | | (2,451 | ) | | | (2,506 | ) |
Transfer from reserves | | | 22 | | | | – | |
Actuarial gains/(losses) on defined benefits plans after tax | | | (113 | ) | | | (60 | ) |
| | | | | | | | |
Retained profits at the end of the year | | | 11,410 | | | | 10,810 | |
| | | | | | | | |
Assets | | | | | | | | |
Liquid assets | | | 20,200 | | | | 18,081 | |
Available-for-sale assets | | | 13,554 | | | | 15,103 | |
Net loans and advances | | | 256,017 | | | | 236,772 | |
Other assets | | | 136,913 | | | | 111,608 | |
Premises and equipment | | | 1,488 | | | | 1,043 | |
| | | | | | | | |
Total assets | | | 428,172 | | | | 382,607 | |
| | | | | | | | |
Liabilities | | | | | | | | |
Deposit and other borrowings | | | 227,301 | | | | 203,328 | |
Income tax liability | | | 137 | | | | 253 | |
Payables and other liabilities | | | 170,351 | | | | 154,526 | |
Provisions | | | 905 | | | | 908 | |
| | | | | | | | |
Total liabilities | | | 398,694 | | | | 359,015 | |
| | | | | | | | |
Net assets | | | 29,478 | | | | 23,592 | |
| | | | | | | | |
Shareholders equity1 | | | 29,478 | | | | 23,592 | |
| | | | | | | | |
| 1 | Shareholders’ equity excludes retained profits and reserves of controlled entities within the class order. |
Financial Report171
NOTES TO THE FINANCIAL STATEMENTS
44: Credit Related Commitments, Guarantees, Contingent Liabilities and Contingent Assets (continued)
viii) ING New Zealand Funds
Trading in the ING Diversified Yield Fund and the ING Regular Income Fund (“the Funds”) was suspended on 13 March 2008 due to deterioration in the liquidity and credit markets. These funds are managed by the joint venture partner (ING (NZ) Limited). Some of these funds were sold to ANZ National Bank customers.
On 5 June 2009, ING NZ AUT Investments Limited, a subsidiary of ING (NZ) Limited, made an offer to investors in the Funds. The offer closed on 13 July 2009. Investors holding approximately 99% of the funds accepted the offer to receive a payment of 60 NZ cents per unit in the ING Diversified Yield Fund or 62 NZ cents per unit in the ING Regular Income Fund, as applicable, either (i) in cash no later than 28 August 2009, or (ii) by way of deposit in an on-call account with ANZ National, paying 8.30% per annum fixed for up to five years.
Acceptance of this offer was conditional on investors waiving all claims. However, ANZ National Bank customers were offered an additional opportunity, for a limited period of time, to ask the ANZ National Bank customer complaints team (and, where still unsatisfied, the New Zealand Banking Ombudsman) to consider requests for additional compensation.
The Group considers it has adequately provided for these obligations at this time. Allowance for the estimated cost of this offer is recognised as a reduction in “other operating income” in the income statement with a corresponding provision in the balance sheet.
The ultimate cost to ANZ National Bank will depend on the final value of units in the Funds, any recoveries under insurance, the number of complaints and the results of any litigation and regulatory proceedings that may be brought in connection with the Funds or their sale. The Commerce Commission has sought information regarding the Funds and the sale of units in the Funds and is investigating this matter. At this stage it is not possible to predict the outcome of any investigation.
ix) Sale of Grindlays businesses
On 31 July 2000, ANZ completed the sale to Standard Chartered Bank (SCB) of ANZ Grindlays Bank Limited and the private banking business of ANZ in the United Kingdom and Jersey, together with ANZ Grindlays (Jersey) Holdings Limited and its subsidiaries, for USD1.3 billion in cash. ANZ provided warranties and certain indemnities relating to those businesses and, where it was anticipated that payments would be likely under the warranties or indemnities, made provisions to cover the anticipated liability. The issues below have not impacted adversely the reported results. All settlements, penalties and costs have been covered within the provisions established at the time.
FERA
In 1991 certain amounts were transferred from non-convertible Indian Rupee accounts maintained with Grindlays in India. These transactions may not have complied with the provisions of the Foreign Exchange Regulation Act, 1973. Grindlays, on its own initiative, brought these transactions to the attention of the Reserve Bank of India. The Indian authorities served notices on Grindlays and certain of its officers in India and civil penalties have been imposed which are the subject of appeals. Criminal prosecutions are pending and will be defended. The amounts in issue are not material.
Tax Indemnity
ANZ provided an indemnity relating to tax liabilities of Grindlays (and its subsidiaries) and the Jersey Sub-Group to the extent to which such liabilities were not provided for in the Grindlays accounts as at 31 July 2000. Claims have been made under this indemnity, with no material impact on the Group expected.
x) Underpinning agreement – ANZ National Bank Limited
The Company is party to an underpinning agreement with ANZ National Bank Limited whereby the Company undertakes to assume risk in relation to credit facilities extended by ANZ National Bank Limited to individual customers which exceed 35% of ANZ National Bank Limited’s capital base.
xi) Underpinning agreement – Australia and New Zealand Banking Group (PNG) Limited
The Company is party to an underpinning agreement with Australia and New Zealand Banking Group (PNG) Limited whereby the Company undertakes to assume risk in relation to credit facilities extended by Australia and New Zealand Banking Group (PNG) Limited to individual customers which exceed 25% of Australia and New Zealand Banking Group (PNG) Limited’s capital base.
CONTINGENT ASSETS
National Housing Bank
In 1992, Grindlays received a claim aggregating to approximately Indian Rupees 5.06 billion from the National Housing Bank (NHB) in India. The claim arose out of cheques drawn by NHB in favour of Grindlays, the proceeds of which were credited to the account of a Grindlays customer.
Grindlays won an arbitration award in March 1997, under which NHB paid Grindlays an award of Indian Rupees 9.12 billion. NHB subsequently won an appeal to the Special Court of Mumbai, after which Grindlays filed an appeal with the Supreme Court of India. Grindlays paid the disputed money including interest into court. Ultimately, the parties settled the matter and agreed to share the monies paid into court which by then totalled Indian Rupees 16.45 billion (AUD 661 million at 19 January 2002 exchange rates), with Grindlays receiving Indian Rupees 6.20 billion (AUD 248 million at 19 January 2002 exchange rates) of the disputed monies.
ANZ in turn received a payment of USD 124 million (USD equivalent of the Indian Rupees received by Grindlays) from Standard Chartered Bank under the terms of an indemnity given in connection with the sale of Grindlays to Standard Chartered Bank.
ANZ recovered $114 million in 2006 from its insurers in respect of the above.
In addition, ANZ is entitled to share with NHB in the proceeds of any recovery from the estate of the customer whose account was credited with the cheques drawn from NHB. However, the Indian Taxation Department is claiming a statutory priority to all of the funds available for distribution to creditors of that customer. The Special Court passed an order in late 2007 scaling down the Income Taxation Department’s priority, however, that order has been appealed by the Income Taxation Department to the Supreme Court of India. The matter has been remanded to the Special Court for deliberation on certain issues.
172ANZ Annual Report 2009
NOTES TO THE FINANCIAL STATEMENTS
45: Superannuation and Other Post Employment Benefit Schemes
Description of the Group’s post employment benefit schemes
The Group has established a number of pension, superannuation and post retirement medical benefit schemes throughout the world. The Group may be obliged to contribute to the schemes as a consequence of legislation and provisions of trust deeds. Legal enforceability is dependent on the terms of the legislation and trust deeds.
The major schemes are:
| | | | | | | | |
| | | | | | | Contribution levels |
Country | | Scheme | | Scheme type | | Employee/
participant | | Employer |
Australia | | ANZ Australian Staff | | Defined contribution scheme | | Optional8 | | Balance of cost10 |
| | Superannuation Scheme1,2 | | Section C3or | | | | |
| | | | |
| | | | Defined contribution scheme | | Optional | | 9% of salary11 |
| | | | Section Aor | | | | |
| | | | |
| | | | Defined benefit scheme | | Nil | | Balance of cost12 |
| | | | Pension Section4 | | | | |
| | | | |
New Zealand | | ANZ National Bank Staff Superannuation | | | | | | |
| | Scheme (formerly ANZ Group (New Zealand) | | Defined benefit scheme5or | | Nil | | Balance of cost13 |
| | Staff Superannuation Scheme)1,2 | | | | | | |
| | | | Defined contribution scheme | | Minimum of | | 7.5% of salary14 |
| | | | | | 2.5% of salary | | |
| | | | |
| | National Bank Staff | | Defined benefit scheme6or | | 5.0% of salary | | Balance of cost15 |
| | Superannuation Fund1,2 | | | | | | |
| | | | Defined contribution scheme7 | | Minimum of | | 11.5% of salary16 |
| | | | | | 2.0% salary | | |
| | | | |
UK | | ANZ UK Staff | | Defined benefit scheme7 | | 5.0% of salary9 | | Balance of cost17 |
| | Pension Scheme1 | | | | | | |
Balance of cost: the Group’s contribution is assessed by the actuary after taking account of members’ contributions and the value of the schemes’ assets.
| 1 | These schemes provide for pension benefits. |
| 2 | These schemes provide for lump sum benefits. |
| 3 | Closed to new members in 1997. |
| 4 | Closed to new members. Operates to make pension payments to retired members or their dependants. |
| 5 | Closed to new members on 31 March 1990. Operates to make pension payments to retired members of that section of the scheme or their dependants. |
| 6 | Closed to new members on 1 October 1991. |
| 7 | Closed to new members on 1 October 2004. |
| 8 | Optional but with minimum of 1% of salary. |
| 9 | From 1 October 2003, all member contributions are at a rate of 5% of salary. |
| 10 | As determined by the Trustee on the recommendation of the actuary – currently 9% (2008: 9%) of members’ salaries. |
| 12 | As determined by the Trustee on the recommendation of the actuary – currently nil (2008: nil). |
| 13 | As recommended by the actuary – currently nil (2008: nil). |
| 15 | As recommended by the actuary – currently 24.8% (2008: 24.8%) of members’ salaries. |
| 17 | As agreed by the Trustee and Group after taking the advice of the actuary – currently 26% (2008: 26%) of pensionable salaries and additional quarterly contributions of GBP 7.5 million until December 2015. |
Financial Report173
NOTES TO THE FINANCIAL STATEMENTS
45: Superannuation and Other Post Employment Benefit Schemes (continued)
Funding and contribution information for the defined benefit sections of the schemes
The funding and contribution information for the defined benefit sections of the schemes as extracted from the schemes’ most recent financial reports is set out below.
In this financial report, the net (liability)/asset arising from the defined benefit obligation recognised in the balance sheet has been determined in accordance with AASB 119 “Employee Benefits”. However, the excess or deficit of the net market value of assets over accrued benefits shown below has been determined in accordance with AAS 25 “Financial Reporting by Superannuation Plans”. The excess or deficit for funding purposes shown below differs from the net (liability)/asset in the balance sheet because AAS 25 prescribes a different measurement date and basis to those used for AASB 119 purposes.
| | | | | | | | | | | | |
2009 Schemes | | Accrued
benefits*
$m | | | Net market
value of
assets held
by scheme
$m | | | Excess/(deficit)
of net
market value
of assets over
accrued benefits
$m | |
ANZ Australian Staff Superannuation Scheme Pension Section1 | | | 34 | | | | 21 | | | | (13 | ) |
ANZ UK Staff Pension Scheme1 | | | 977 | | | | 649 | | | | (328 | ) |
ANZ UK Health Benefits Scheme4 | | | 9 | | | | — | | | | (9 | ) |
ANZ National Bank Staff Superannuation Scheme2 | | | 5 | | | | 5 | | | | — | |
National Bank Staff Superannuation Fund3 | | | 154 | | | | 139 | | | | (15 | ) |
Other5,6 | | | 7 | | | | 5 | | | | (2 | ) |
Total | | | 1,186 | | | | 819 | | | | (367 | ) |
| * | Determined in accordance with AAS 25 ‘Financial Reporting by Superannuation Plans’, which prescribes a different measurement date and basis to those applied in this financial report under AASB 119 ‘Employee Benefits’. Under AASB 119, the discount rates used are based on prevailing government and corporate bond rates at the reporting date (30 September 2009), rather than the expected return on scheme assets as at the most recent actuarial valuation date (set out below) as prescribed by AAS 25. |
| 1 | Amounts were measured at 31 December 2008. |
| 2 | Amounts were measured at 31 December 2007. |
| 3 | Amounts were measured at 31 March 2008. |
| 4 | Amounts were measured at 30 September 2009. |
| 5 | Amounts were measured at 30 September 2007. |
| 6 | Other includes the defined benefit arrangements in Japan, Philippines and Taiwan. |
| | | | | | | | | | | | |
2008 Schemes | | Accrued
benefits*
$m | | | Net market
value of
assets held
by scheme
$m | | | Excess/(deficit)
of net
market value
of assets over
accrued benefits
$m | |
ANZ Australian Staff Superannuation Scheme Pension Section1 | | | 35 | | | | 33 | | | | (2 | ) |
ANZ UK Staff Pension Scheme1 | | | 1,083 | | | | 959 | | | | (124 | ) |
ANZ UK Health Benefits Scheme3 | | | 12 | | | | — | | | | (12 | ) |
ANZ National Bank Staff Superannuation Scheme1 | | | 5 | | | | 5 | | | | — | |
National Bank Staff Superannuation Fund2 | | | 164 | | | | 159 | | | | (5 | ) |
Other4,5 | | | 7 | | | | 5 | | | | (2 | ) |
Total | | | 1,306 | | | | 1,161 | | | | (145 | ) |
| * | Determined in accordance with AAS 25 ‘Financial Reporting by Superannuation Plans’, which prescribes a different measurement date and basis to those applied in this financial report under AASB 119 ‘Employee Benefits’. Under AASB 119, the discount rates used are based on prevailing government and corporate bond rates at the reporting date (30 September 2008), rather than the expected return on scheme assets as at the most recent actuarial valuation date (set out below) as prescribed by AAS 25. |
| 1 | Amounts were measured at 31 December 2007. |
| 2 | Amounts were measured at 31 March 2007. |
| 3 | Amounts were measured at 30 September 2008. |
| 4 | Amounts were measured at 30 September 2007. |
| 5 | Other includes the defined benefit arrangements in Japan, Philippines and Taiwan. |
Employer contributions to the defined benefit sections are based on recommendations by the schemes’ actuaries. Funding recommendations are made by the actuaries based on assumptions of various matters such as future investment performance, interest rates, salary increases, mortality rates and turnover levels. The funding methods adopted by the actuaries are intended to ensure that the benefit entitlements of employees are fully funded by the time they become payable.
The Group expects to make contributions of $61 million to the defined benefit sections of the schemes during the next financial year.
174ANZ Annual Report 2009
NOTES TO THE FINANCIAL STATEMENTS
45: Superannuation and Other Post Employment Benefit Schemes (continued)
The current contribution recommendations for the major defined sections of the schemes are described below.
ANZ Australian Staff Superannuation Scheme Pension Section
The Pension Section of the ANZ Australian Staff Superannuation Scheme is closed to new members. An interim actuarial valuation, conducted by consulting actuaries Russell Employee Benefits as at 31 December 2008, showed a deficit of $13 million and the actuary recommended that the funding position of the Pension Section be reviewed. Group contributions to the Pension Section remain suspended until the review is completed. The next full actuarial valuation is due to be conducted as at 31 December 2010.
The following economic assumptions were used in formulating the actuary’s funding recommendations:
| | | | |
Rate of investment return | | | 8 | % p.a. |
Pension indexation rate | | | 3 | % p.a. |
The Group has no present liability under the Scheme’s Trust Deed to commence contributions or fund the deficit.
ANZ UK Staff Pension Scheme
A full actuarial valuation, conducted by consulting actuaries Watson Wyatt LLP, as at 31 December 2008 showed a deficit of GBP 180 million ($328 million at 30 September 2009 exchange rates).
Following the actuarial valuation as at 31 December 2008, the Group agreed to make regular contributions at the rate of 26% of pensionable salaries. These contributions are sufficient to cover the cost of accruing benefits. To address the deficit, the Group agreed to continue to pay additional quarterly contributions of GBP 7.5 million until 31 December 2015. These contributions will be reviewed following the next actuarial valuation which is scheduled to be undertaken as at 31 December 2010.
The following economic assumptions were used in formulating the actuary’s funding recommendations:
| | | | |
Rate of investment return on existing assets | | | | |
– to 31 December 2018 | | | 5.4 | % p.a. |
– to 31 December 2033 | | | 4.1 | % p.a. |
Rate of investment return for determining ongoing contributions | | | 6.8 | % p.a. |
Salary increases | | | 4.9 | % p.a. |
Pension increases | | | 3.1 | % p.a. |
The Group has no present liability under the Scheme’s Trust Deed to fund the deficit measured under AAS 25. A contingent liability may arise in the event that the Scheme was wound up. If this were to happen, the Trustee would be able to pursue the Group for additional contributions under the UK Employer Debt Regulations. The Group intends to continue the Scheme on an on-going basis.
On adoption of AIFRS, a net liability representing the defined benefit obligation calculated under AASB 119 was recognised on the balance sheet. The basis of calculation under AASB119 is detailed in note 1F(vi) and on page 82.
National Bank Staff Superannuation Fund
A full actuarial valuation of the National Bank Staff Superannuation Fund, conducted by consulting actuaries AON Consulting NZ, as at 31 March 2008 showed a deficit of NZD 19 million ($15 million at 30 September 2009 exchange rates). The actuary recommended that the Group make contributions of 24.8% of salaries in respect of members of the defined benefit section.
The following economic assumptions were used in formulating the actuary’s funding recommendations:
| | | | |
Rate of investment return (net of income tax) | | | 5.5 | % p.a. |
Salary increases | | | 3.0 | % p.a. |
Pension increases | | | 2.5 | % p.a. |
The Group has no present liability under the Fund’s Trust Deed to fund the deficit measured under AAS 25. A contingent liability may arise in the event that the Fund was wound up. Under the Fund’s Trust Deed, if the Fund were wound up, the Group is required to pay the Trustees of the Fund an amount sufficient to ensure members do not suffer a reduction in benefits to which they would otherwise be entitled. The Group intends to continue the Fund on an on-going basis.
On adoption of AIFRS, a net asset representing the defined benefit surplus calculated under AASB 119 was recognised on the balance sheet. The basis of calculation under AASB119 is detailed in note 1F(vi) and on page 82.
Financial Report 175
NOTES TO THE FINANCIAL STATEMENTS
45: Superannuation and Other Post Employment Benefit Schemes (continued)
The following tables summarise the components of the expense recognised in the income statement and the amounts recognised in the balance sheet under AASB 119 for the defined benefit sections of the schemes:
| | | | | | | | | | | | | | | | |
| | | Consolidated | | | The Company | |
| | | 2009
$m | | | 2008
$m | | | 2009
$m | | | 2008
$m | |
Amount recognised in income in respect of defined benefit schemes | | | | | | | | | | | | | | | | |
Current service cost | | | 8 | | | | 10 | | | | 6 | | | | 8 | |
Interest cost | | | 72 | | | | 70 | | | | 63 | | | | 60 | |
Expected return on assets | | | (67 | ) | | | (77 | ) | | | (60 | ) | | | (68 | ) |
Past service cost | | | 5 | | | | — | | | | 5 | | | | — | |
Adjustment for contributions tax | | | 2 | | | | 2 | | | | — | | | | — | |
| | | | | | | | | | | | | | | | |
Total included in personnel expenses | | | 20 | | | | 5 | | | | 14 | | | | — | |
| | | | | | | | | | | | | | | | |
Amounts included in the balance sheet in respect of its defined benefits scheme | | | | | | | | | | | | | | | | |
Present value of funded defined benefit obligation | | | (1,095 | ) | | | (1,160 | ) | | | (938 | ) | | | (1,003 | ) |
Fair value of scheme assets | | | 849 | | | | 1,006 | | | | 738 | | | | 871 | |
| | | | | | | | | | | | | | | | |
Net liability arising from defined benefit obligation | | | (246 | ) | | | (154 | ) | | | (200 | ) | | | (132 | ) |
| | | | | | | | | | | | | | | | |
Amounts recognised in the balance sheet | | | | | | | | | | | | | | | | |
Other assets | | | — | | | | — | | | | — | | | | — | |
Payables and other liabilities | | | (246 | ) | | | (154 | ) | | | (200 | ) | | | (132 | ) |
| | | | | | | | | | | | | | | | |
Net liability arising from defined benefit obligation | | | (246 | ) | | | (154 | ) | | | (200 | ) | | | (132 | ) |
| | | | | | | | | | | | | | | | |
Amounts recognised in equity in respect of defined benefit schemes | | | | | | | | | | | | | | | | |
Acturial (gains)/losses incurred during the year and recognised directly in retained earnings | | | 175 | | | | 112 | | | | 153 | | | | 84 | |
Cumulative acturial (gains)/losses recognised directly in retained earnings | | | 223 | | | | 48 | | | | 181 | | | | 28 | |
The Group has a legal liability to fund deficits in the schemes, but no legal right to use any surplus in the schemes to further its own interests. The Group has no present liability to settle deficits with an immediate contribution. For more information about the Group’s legal liability to fund deficits, refer to the earlier description of the current contribution recommendations for the schemes.
| | | | | | | | | | | | | | | | |
Movements in the present value of the defined benefit obligation in the relevant period | | | | | | | | | | | | | | | | |
Opening defined benefit obligation | | | 1,160 | | | | 1,267 | | | | 1,003 | | | | 1,112 | |
Current service cost | | | 8 | | | | 10 | | | | 6 | | | | 8 | |
Interest cost | | | 72 | | | | 70 | | | | 63 | | | | 60 | |
Contributions from scheme participants | | | 1 | | | | 1 | | | | — | | | | — | |
Actuarial gains/(losses) | | | 126 | | | | (83 | ) | | | 121 | | | | (93 | ) |
Past service cost | | | 5 | | | | — | | | | 5 | | | | — | |
Exchange difference on foreign schemes | | | (205 | ) | | | (35 | ) | | | (202 | ) | | | (32 | ) |
Benefits paid | | | (72 | ) | | | (70 | ) | | | (58 | ) | | | (52 | ) |
| | | | | | | | | | | | | | | | |
Closing defined benefit obligation | | | 1,095 | | | | 1,160 | | | | 938 | | | | 1,003 | |
| | | | | | | | | | | | | | | | |
Movements in the fair value of the scheme assets in the relevant period | | | | | | | | | | | | | | | | |
Opening fair value of scheme assets | | | 1,006 | | | | 1,199 | | | | 871 | | | | 1,037 | |
Expected return on scheme assets | | | 67 | | | | 77 | | | | 60 | | | | 68 | |
Actuarial gains/(losses) | | | (49 | ) | | | (195 | ) | | | (32 | ) | | | (177 | ) |
Exchange difference on foreign schemes | | | (161 | ) | | | (45 | ) | | | (157 | ) | | | (42 | ) |
Contributions from the employer | | | 57 | | | | 39 | | | | 54 | | | | 37 | |
Contributions from scheme participants | | | 1 | | | | 1 | | | | — | | | | — | |
Benefits paid | | | (72 | ) | | | (70 | ) | | | (58 | ) | | | (52 | ) |
| | | | | | | | | | | | | | | | |
Closing fair value of scheme assets1 | | | 849 | | | | 1,006 | | | | 738 | | | | 871 | |
| | | | | | | | | | | | | | | | |
Actual return on scheme assets | | | 18 | | | | (118 | ) | | | 28 | | | | (109 | ) |
| | | | | | | | | | | | | | | | |
| 1 | Scheme assets include the following financial instruments issued by the Group: cash and short term debt instruments $2.4 million (September 2008: $59.1 million), fixed interest securities $0.6 million (September 2008: $1.0 million) and equities $0.2 million (September 2008: $0.3 million). |
| | | | | | | | | | | | | | | | |
| | | Consolidated | | | The Company | |
| | | Fair value of scheme
assets | | | Fair value of scheme
assets | |
| | | 2009
% | | | 2008
% | | | 2009
% | | | 2008
% | |
Analysis of the scheme assets | | | | | | | | | | | | | | | | |
Equities | | | 35 | | | | 32 | | | | 33 | | | | 30 | |
Debt securities | | | 39 | | | | 37 | | | | 37 | | | | 34 | |
Property | | | 7 | | | | 11 | | | | 8 | | | | 13 | |
Other assets | | | 19 | | | | 20 | | | | 22 | | | | 23 | |
| | | | | | | | | | | | | | | | |
Total assets | | | 100 | | | | 100 | | | | 100 | | | | 100 | |
| | | | | | | | | | | | | | | | |
176ANZ Annual Report 2009
NOTES TO THE FINANCIAL STATEMENTS
45: Superannuation and Other Post Employment Benefit Schemes (continued)
| | | | | | | | |
| | | 2009
% | | | 2008
% | |
Key actuarial assumptions used (expressed as weighted averages) | | | | | | | | |
Discount rate | | | | | | | | |
ANZ Australian Staff Superannuation Scheme – Pension Section | | | 5.25 | | | | 5.25 | |
ANZ UK Staff Pension Scheme | | | 5.50 | | | | 7.00 | |
ANZ UK Health Benefits Scheme | | | 5.50 | | | | 7.20 | |
ANZ National Bank Staff Superannuation Scheme | | | 6.00 | | | | 6.04 | |
National Bank Staff Superannuation Fund | | | 6.00 | | | | 6.04 | |
Expected rate of return on scheme assets | | | | | | | | |
ANZ Australian Staff Superannuation Scheme – Pension Section | | | 8.50 | | | | 8.50 | |
ANZ UK Staff Pension Scheme | | | 6.20 | | | | 7.40 | |
ANZ UK Health Benefits Scheme | | | n/a | | | | n/a | |
ANZ National Bank Staff Superannuation Scheme | | | 4.50 | | | | 4.50 | |
National Bank Staff Superannuation Fund | | | 5.50 | | | | 5.50 | |
Future salary increases | | | | | | | | |
ANZ UK Staff Pension Scheme | | | 4.90 | | | | 5.50 | |
National Bank Staff Superannuation Fund | | | 3.00 | | | | 3.00 | |
Future pension increases | | | | | | | | |
ANZ Australian Staff Superannuation Scheme – Pension Section | | | 3.00 | | | | 3.00 | |
ANZ UK Staff Pension Scheme | | | 3.10 | | | | 3.70 | |
ANZ National Bank Staff Superannuation Scheme | | | 2.50 | | | | 2.50 | |
National Bank Staff Superannuation Fund | | | 2.50 | | | | 2.50 | |
Future medical cost trend – short term | | | | | | | | |
ANZ UK Health Benefits Scheme | | | 7.00 | | | | 11.00 | |
Future medical cost trend – long term | | | | | | | | |
ANZ UK Health Benefits Scheme | | | 5.00 | | | | 6.00 | |
To determine the expected returns of each of the asset classes held by the relevant scheme, the actuaries assessed historical return trends and market expectations for the asset class returns applicable for the period over which the obligation is to be settled. The overall expected rate of return on assets for each scheme was then determined as the weighted average of the expected returns for the classes of assets held by the relevant scheme.
Assumed medical cost trend rates do not have a material effect on the amounts recognised as income or included in the balance sheet.
| | | | | | | | | | | | | | | | | | | | | | | | | | | | | | | | | | | | | | | | |
| | | | | | | | | Consolidated | | | | | | | | | | | | | | | The Company | | | | | | | |
| | | 2009
$m | | | 2008
$m | | | 2007
$m | | | 2006
$m | | | 2005
$m | | | 2009
$m | | | 2008
$m | | | 2007
$m | | | 2006
$m | | | 2005
$m | |
History of experience adjustments | | | | | | | | | | | | | | | | | | | | | | | | | | | | | | | | | | | | | | | | |
Defined benefits obligation | | | (1,095 | ) | | | (1,160 | ) | | | (1,267 | ) | | | (1,462 | ) | | | (1,246 | ) | | | (938 | ) | | | (1,003 | ) | | | (1,112 | ) | | | (1,296 | ) | | | (1,076 | ) |
Fair value of scheme assets | | | 849 | | | | 1,006 | | | | 1,199 | | | | 1,238 | | | | 1,099 | | | | 738 | | | | 871 | | | | 1,037 | | | | 1,067 | | | | 922 | |
Surplus/(deficit) | | | (246 | ) | | | (154 | ) | | | (68 | ) | | | (224 | ) | | | (147 | ) | | | (200 | ) | | | (132 | ) | | | (75 | ) | | | (229 | ) | | | (154 | ) |
| | | | | | | | | | | | | | | | | | | | | | | | | | | | | | | | | | | | | | | | |
Experience adjustments on scheme liabilities | | | 7 | | | | 12 | | | | 9 | | | | 7 | | | | (6 | ) | | | 7 | | | | 8 | | | | 10 | | | | 5 | | | | (7 | ) |
Experience adjustments on scheme assets | | | (49 | ) | | | (195 | ) | | | 6 | | | | 48 | | | | 100 | | | | (32 | ) | | | (177 | ) | | | 12 | | | | 44 | | | | 90 | |
| | | | | | | | | | | | | | | | | | | | | | | | | | | | | | | | | | | | | | | | |
46: Employee Share and Option Plans
ANZ operates a number of employee share and option schemes under the ANZ Employee Share Acquisition Plan and the ANZ Share Option Plan.
ANZ EMPLOYEE SHARE ACQUISITION PLAN
ANZ Employee Share Acquisition Plan (ESAP) schemes that existed during the 2008 and 2009 financial years were the $1,000 Share Plan, the Restricted Share Plan, the Deferred Share Plan, Performance Shares and the Employee Share Save Scheme (ESSS). Note the ESSS is an employee salary sacrifice plan and is not captured as a share based payment expense.
$1,000 share plan
Each permanent employee (excluding senior executives) who has had continuous service for one year is eligible to participate in the $1,000 scheme enabling the grant of up to $1,000 of ANZ shares in each financial year, subject to approval of the Board. At a date approved by the Board, the shares will be granted to all eligible employees using the 1 week weighted average price of ANZ shares traded on the ASX in the week leading up to and including the date of grant.
In Australia and most overseas locations, ANZ ordinary shares are granted to eligible employees for nil consideration and vest immediately when granted, as there is no forfeiture provision. It is a requirement, however, that shares are held in trust for three years from the date of grant, after which time they may remain in trust, be transferred to the employee’s name or sold. In general, dividends received on the shares are automatically reinvested into the Dividend Reinvestment Plan.
Shares granted to eligible New Zealand employees under this plan vest subject to the satisfaction of a three year service period, after which time they may remain in trust, be transferred into the employee’s name or sold. At the time of transfer, employees are required to pay NZD 1 cent per share. Shares may be forfeited in the event of dismissal for serious misconduct or resignation. Dividends are received as cash.
During the 2009 year, 1,936,095 shares with an issue price of $14.40 were granted under the plan to employees on 8 December 2008 (2008 year: 926,878 shares with an issue price of $28.24 were granted on 13 December 2007).
Financial Report 177
NOTES TO THE FINANCIAL STATEMENTS
46: Employee Share and Option Plans (continued)
Deferred share plan
A Short Term Incentive (STI) deferral program has been implemented for 2009 bonuses, with equity deferral relating to 50% of amounts above a specified threshold. Deferred equity can be taken as shares and/or options. For Management Board members, mandatory STI equity deferral commenced in 2008 (rather than 2009), with expensing occurring in the 2009 financial year due to the 31 October 2008 grant date. Refer to page 38 of the Remuneration Report for details. Unvested STI deferred shares are forfeited on resignation or dismissal for serious misconduct.
Selected employees may also be granted Long Term Incentive (LTI) deferred shares which vest to the employee up to three years from the date of grant. Ordinary shares granted under this LTI plan may be held in trust beyond the deferral period. Unvested LTI deferred shares are forfeited on resignation, dismissal for serious misconduct or termination on notice. In the event of death or total and permanent disablement, all shares will be released to the employee in full.
STI three year deferred shares were granted under an historical ANZ STI program, and may be held in trust beyond the deferral period. The last grant of three year STI deferred shares was made on 11 May 2004 (with the vesting date being 11 May 2007). There were no 3 year STI deferred share grants in the 2008 or 2009 financial years. STI deferred shares with a two year deferral period were granted under a business unit specific incentive plan (primarily as a retention tool), and may be held in trust beyond the deferral period.
In exceptional circumstances, sign-on deferred shares are granted to certain employees upon commencement with ANZ to compensate for equity forgone from their previous employer. The vesting period generally aligns with the remaining vesting period of equity forgone, and therefore varies between grants. Retention three year deferred shares may also be granted occasionally to high performing employees who are regarded as a significant retention risk to ANZ. Sign-on and retention deferred shares will be forfeited on resignation, dismissal for serious misconduct or termination on notice. In the event of death or total and permanent disablement, all shares will be released to the employee in full.
The employee receives all dividends on deferred shares while held in trust (cash or dividend reinvestment plan). The issue price for deferred shares is based on the volume weighted average price of the shares traded on the ASX in the week leading up to and including the date of grant.
During the 2009 year, 4,322,932 deferred shares with a weighted average grant price of $17.20 were granted under the deferred share plan (2008 year: 2,445,372 shares with a weighted average grant price of $28.26 were granted).
Restricted share plan
In prior years, eligible employees were able to elect a pre-tax sacrifice of part or all of their annual cash bonus for ANZ shares. The shares were subject to a 1 year restriction period, however, they may be left in trust beyond the restriction period. The shares are subject to forfeiture on dismissal for serious misconduct. The shares are released to the employee on termination for any other reason. The employee receives all dividends on these restricted shares (cash or dividend reinvestment plan). The issue price is based on the volume weighted average price of the shares traded on the ASX on the week leading up to and including the date of grant.
During the 2009 year, 272,626 shares with an issue price of $17.18 were granted under the Restricted Share Plan (2008 year: 354,384 shares with an issue price of $29.95 were granted).
Performance share plan
Performance shares are essentially LTI deferred shares with a performance hurdle. They were granted to former employees in 2004 and 2005. The balance outstanding at the beginning of the current year has since been forfeited.
Share valuations
The fair value of shares granted in the 2009 year under the $1,000 share plan, the Deferred Share Plan and the Restricted Share Plan, measured as at the date of grant of the shares, is $107.8 million based on 6,531,653 shares at a weighted average price of $16.50 (2008 year: fair value of shares granted was $105.3 million based on 3,726,634 shares at a weighted average price of $28.26). The volume weighted average share price of all ANZ shares sold on the ASX on the date of grant is used to calculate the fair value of shares. No dividends are incorporated into the measurement of the fair value of shares.
ANZ SHARE OPTION PLAN
Selected employees may be granted options/rights, which entitle them to purchase ordinary fully paid shares in ANZ at a price fixed at the time the options/rights are granted. Voting and dividend rights will be attached to the unissued ordinary shares when the options/ rights have been exercised.
Each option/right entitles the holder to one ordinary share subject to the terms and conditions imposed on grant. The exercise price of the options, determined in accordance with the rules of the plan, is generally based on the weighted average price of the shares traded on the ASX in the week leading up to and including the date of grant. For rights, the exercise price is nil.
ANZ Share Option Plan schemes expensed in the 2008 and 2009 years are as follows:
Current Option Plans
Performance rights plan (excl. CEO performance rights)
Performance rights are granted to certain employees as part of ANZ’s LTI program. The first grant of performance rights was in November 2005, and provides the right to acquire ANZ shares at nil cost, subject to a three-year vesting period and a TSR performance hurdle. The proportion of LTI performance rights that become exercisable will depend upon the TSR achieved by ANZ relative to a comparator group of major financial services companies, measured over the same period (since grant) and calculated at the third anniversary of grant. An averaging calculation is used for TSR over a 90 day period for start and end values in order to reduce the impact of share price volatility. Performance equal to the median TSR of the comparator group will result in half the performance rights becoming exercisable. Vesting will increase on a straight-line basis until all of the performance rights become exercisable where ANZ TSR is at or above the 75th percentile of TSRs in the comparator group. Where ANZ’s performance falls between two of the comparators, TSR is measured on a pro-rata basis. The performance hurdle will only be tested once at the end of the three year vesting period. If the performance rights do not pass the hurdle on the testing date, or they are not exercised by the end of the exercise period (5 years from the date of grant), they will lapse. In the case of dismissal for serious misconduct, all unexercised performance rights will be forfeited. In the case of resignation or termination on notice, only performance rights that become exercisable (and pass the performance hurdle) by the end of the notice period may be exercised. In the case of death or total and permanent disablement, all performance rights are available for exercise (with the performance hurdle waived).
178ANZ Annual Report 2009
NOTES TO THE FINANCIAL STATEMENTS
46: Employee Share and Option Plans (continued)
CEO Performance rights
The CEO’s LTI (as approved by shareholders at the 2007 Annual General Meeting), consists of 3 tranches of performance rights, each to a maximum value of $3 million. The performance periods for each tranche begin on the date of grant of 19 December 2007 and end on the 3rd, 4th and 5th anniversaries respectively (i.e. only one performance measurement for each tranche). The level of vesting for each tranche will be based on ANZ TSR performance against a comparator group of companies consistent with the performance rights plan. Each tranche has a 1 year exercise period. In the case of resignation or dismissal for serious misconduct, all unexercised performance rights will be forfeited. In the case of termination on notice, only performance rights that become exercisable (and pass the performance hurdle) by the end of the notice period may be exercised. In the case of death or total and permanent disablement, all performance rights are available for exercise (with the performance hurdle waived).
CEO Options
At the 2008 Annual General Meeting, shareholders approved a special grant to the CEO of 700,000 options which were granted on 18 December 2008. These will be available for exercise from the date of vesting, December 2011, with the option exercise price being equal to the market value of ANZ shares at the date they were granted i.e. $14.18 per share. Upon exercise, each Option entitles the CEO to one ordinary ANZ share. At grant the options were independently valued at $2.27 each i.e. a total value of $1.589 million. However, these options will only have any value if, at the vesting date or during the subsequent exercise period (i.e. 2 years after vesting), the share price exceeds $14.18. This value will be based on the amount by which the market price exceeds the exercise price multiplied by the total number of options.
Deferred options (No performance hurdles)
Under the STI deferral program for 50% of amounts above a specified threshold, deferred equity can be taken as shares and/or options (refer to Deferred Share Plan section above).
Deferred share rights (No performance hurdles)
Deferred share rights are granted instead of deferred shares to accommodate off-shore taxation implications. They provide the right to acquire ANZ shares at nil cost after a specified vesting period. The fair value of rights is adjusted for the absence of dividends during the restriction period. Treatment of rights in respect of cessation relates to the purpose of the grant (refer to Deferred Share Plan and Restricted Share Plan sections).
Legacy Option Plans
The following legacy plans are no longer being offered to Group employees, but were expensed during the 2008 and 2009 years.
Performance option plan (No performance hurdle applies)
Performance options were granted to certain employees (below executive levels) as part of an historical LTI program, with 7 November 2005 being the last grant of LTI performance options. The options can only be exercised after a three-year vesting period and before the seventh anniversary of the grant date. There are no performance conditions attached to these options as they were primarily granted as a retention tool. All unexercised options are forfeited on dismissal for serious misconduct, resignation and termination on notice. On death or total and permanent disablement, all unvested options will become available for exercise.
Deferred share rights (No performance hurdle)
Special deferred share rights were granted to a small number of New Zealand employees in December 2004. They provide the right to acquire ANZ shares at nil cost after a three year vesting period. Rights must be exercised by the seventh anniversary of the grant date. They may be forfeited at the Company’s discretion if the employee ceases employment for any reason. The fair value of rights is adjusted for the absence of dividends during the restriction period.
Hurdled options
Hurdled options were granted to certain employees as part of an historical LTI program. The options can only be exercised subject to the satisfaction of time and performance based hurdles. Options may be exercised during the four year period commencing three years, and ending seven years after the grant date, subject to meeting the relevant performance hurdle. The performance hurdle will be measured during the exercise period by comparing ANZ’s TSR against the comparator group relevant to the hurdled option grant.
Hurdled options granted in November 2004 will be tested against a comparator group consisting of major financial services companies, excluding ANZ. The options become exercisable depending on ANZ’s ranking within the comparator group.
ANZ must rank at the 50th percentile for 50% of the options to become exercisable. For each 1% increase above the 50th percentile an additional 2% of options will become exercisable, with 100% being exercisable where ANZ ranks at or above the 75th percentile. This will be calculated as at the last trading day of any month (once the exercise period has commenced). Other hurdled option grants will be measured against the S&P/ASX 200 Banks (Industry Group) Accumulation Index, and the S&P/ASX 100 Accumulation Index. Half the options may only be exercised once ANZ’s TSR exceeds the percentage change in the S&P/ASX 200 Banks (Industry Group) Accumulation Index, measured over the same period (since grant) and calculated as at the last trading day of any month (once the exercise period has commenced); and the other half of hurdled options may only be exercised once the ANZ TSR exceeds the percentage change in the S&P/ASX 100 Accumulation Index, measured over the same period (since grant) and calculated as at the last trading day of any month (once the exercise period has commenced). The forfeiture provisions are the same as the performance option plan.
Financial Report 179
NOTES TO THE FINANCIAL STATEMENTS
46: Employee Share and Option Plans (continued)
Option Movements
Details of options over unissued ANZ shares and their related weighted average exercise prices as at the beginning and end of the 2009 financial year and movements during the 2009 financial year are set out below:
| | | | | | | | | | | | | | | | | | | | | | | | |
| | | Opening balance
1 October 2008 | | | Options
Granted | | | Options
Forfeited | | | Options
Expired1 | | | Options
Exercised | | | Closing balance
30 September 2009 | |
| | | 17,697,581 | | | | 3,260,938 | | | | (2,709,394 | ) | | | (2,191,963 | ) | | | (928,149 | ) | | | 15,129,013 | |
Weighted Average Exercise Price | | $ | 14.81 | | | $ | 11.64 | | | $ | 7.83 | | | $ | 18.71 | | | $ | 15.04 | | | $ | 14.80 | |
| 1 | Numbers in the “Options Expired” column includes any options which may have expired due to a termination of employment whereby the employee was offered a grace period in which to exercise. |
The weighted average share price during the year ended 30 September 2009 was $16.57 (2008: $21.74).
The weighted average remaining contractual life of share options outstanding at 30 September 2009 was 2.4 years (2008: 2.5 years).
The weighted average exercise price of all exercisable share options outstanding at 30 September 2009 was $18.95 (2008: $18.78).
A total of 4,015,504 exercisable share options were outstanding at 30 September 2009 (2008: 5,327,652).
Details of options over unissued ANZ shares and their related weighted average exercise prices as at the beginning and end of the 2008 financial year and movements during the 2008 financial year are set out below:
| | | | | | | | | | | | | | | | | | | | | | | | |
| | | Opening balance
1 October 2007 | | | Options
Granted | | | Options
Forfeited | | | Options
Expired1 | | | Options
Exercised | | | Closing balance
30 September 2008 | |
| | | 21,693,355 | | | | 2,001,018 | | | | 1,721,322 | | | | 123,289 | | | | 4,152,181 | | | | 17,967,581 | |
Weighted Average Exercise Price | | $ | 16.23 | | | $ | 0.00 | | | $ | 12.19 | | | $ | 17.15 | | | $ | 16.09 | | | $ | 14.81 | |
| 1 | Numbers in the “Options Expired” column includes any options which may have expired due to a termination of employment whereby the employee was offered a grace period in which to exercise. |
No options over ordinary shares have been granted since the end of the 2009 financial year up to the signing of the Directors’ Report on 5 November 2009.
Details of shares issued as a result of the exercise of options during the year ended 30 September 2009 are as follows:
| | | | | | | | | | | | | | | | | | | | |
Exercise price $ | | No. of shares issued | | | Proceeds received
$ | | | Exercise price
$ | | | No. of shares issued | | | Proceeds received
$ | |
0.00 | | | 12,481 | | | | — | | | | 17.34 | | | | 264,081 | | | | 4,579,165 | |
0.00 | | | 58,813 | | | | — | | | | 17.60 | | | | 32,616 | | | | 574,042 | |
0.00 | | | 24,619 | | | | — | | | | 17.55 | | | | 29,968 | | | | 525,938 | �� |
0.00 | | | 395 | | | | — | | | | 17.55 | | | | 1,388 | | | | 24,359 | |
0.00 | | | 738 | | | | — | | | | 18.03 | | | | 1,925 | | | | 34,708 | |
0.00 | | | 5,470 | | | | — | | | | 18.22 | | | | 1,758 | | | | 32,031 | |
0.00 | | | 1,650 | | | | — | | | | 18.22 | | | | 30,059 | | | | 547,675 | |
0.00 | | | 1,008 | | | | — | | | | 18.22 | | | | 35,264 | | | | 642,510 | |
0.00 | | | 4,170 | | | | — | | | | 20.68 | | | | 3,800 | | | | 78,584 | |
16.33 | | | 26,100 | | | | 426,213 | | | | 20.68 | | | | 18,837 | | | | 389,549 | |
16.33 | | | 371,675 | | | | 6,069,453 | | | | 23.49 | | | | 1,334 | | | | 31,336 | |
Details of shares issued as a result of the exercise of options during the year ended 30 September 2008 are as follows:
| | | | | | | | | | | | | | | | | | | | |
Exercise price $ | | No. of shares issued | | | Proceeds received
$ | | | Exercise price
$ | | | No. of shares issued | | | Proceeds received
$ | |
0.00 | | | 17,473 | | | | — | | | | 16.09 | | | | 12,750 | | | | 205,148 | |
0.00 | | | 14,507 | | | | — | | | | 16.33 | | | | 322,570 | | | | 5,267,568 | |
0.00 | | | 5,069 | | | | — | | | | 17.34 | | | | 149,062 | | | | 2,584,735 | |
12.98 | | | 451,191 | | | | 5,856,459 | | | | 17.55 | | | | 339,691 | | | | 5,961,577 | |
12.98 | | | 27,600 | | | | 358,248 | | | | 17.60 | | | | 154,991 | | | | 2,727,842 | |
13.62 | | | 194,000 | | | | 2,642,280 | | | | 18.03 | | | | 211,685 | | | | 3,816,681 | |
13.91 | | | 264,500 | | | | 3,679,195 | | | | 18.22 | | | | 395,538 | | | | 7,206,702 | |
13.91 | | | 194,050 | | | | 2,699,236 | | | | 18.55 | | | | 19,525 | | | | 362,189 | |
14.20 | | | 729,716 | | | | 10,361,967 | | | | 20.68 | | | | 584,587 | | | | 12,089,259 | |
14.61 | | | 54,750 | | | | 799,898 | | | | 23.49 | | | | 8,926 | | | | 209,672 | |
180ANZ Annual Report 2009
NOTES TO THE FINANCIAL STATEMENTS
46: Employee Share and Option Plans (continued)
Details of shares as a result of the exercise of options since the end of the 2009 financial year up to the signing of the Directors’ Report on 5 November 2009 are as follows:
| | | | | | | | | | | | | | | | | | | | |
Exercise price $ | | No. of shares issued | | | Proceeds received
$ | | | Exercise price
$ | | | No. of shares issued | | | Proceeds received
$ | |
0.00 | | | 130 | | | | — | | | | 17.55 | | | | 13,353 | | | | 234,345 | |
0.00 | | | 19 | | | | — | | | | 17.60 | | | | 11,601 | | | | 204,178 | |
0.00 | | | 16,856 | | | | — | | | | 18.22 | | | | 7,838 | | | | 142,808 | |
0.00 | | | 72,677 | | | | — | | | | 18.22 | | | | 11,566 | | | | 210,733 | |
17.18 | | | 2,065 | | | | 35,477 | | | | 20.68 | | | | 7,394 | | | | 152,908 | |
17.18 | | | 125 | | | | 2,148 | | | | 20.68 | | | | 21,034 | | | | 434,983 | |
17.34 | | | 191,731 | | | | 3,324,616 | | | | 23.49 | | | | 7,001 | | | | 164,453 | |
17.55 | | | 16,375 | | | | 287,381 | | | | | | | | | | | | | |
In determining the fair value below, we used standard market techniques for valuation including Monte Carlo and/or Black Scholes pricing models. The models take into account early exercise, non-transferability and market based performance hurdles. The significant assumptions used to measure the fair value of instruments granted during the 2009 financial year are contained in the table below.
| | | | | | | | | | | | | | | | | | | | | | | | | | | | | | | | | | | | | | | | | | | | |
Type of Equity | | Grant date | | | Number of
Options | | | Fair
value
($) | | | Exercise
price
(5 day
VWAP)
($) | | | Share
closing
price at
grant
($) | | | ANZ
expected
volatility1
(%) | | | Equity
term
(years) | | | Vesting
period
(years) | | | Expected
life
(years) | | | Expected
dividend
yield
(%) | | | Risk
free
interest
rate
(%) | |
Special Options | | | 18-Dec-08 | | | | 700,000 | | | | 2.27 | | | | 14.18 | | | | 14.27 | | | | 30 | | | | 5 | | | | 3 | | | | 4 | | | | 6.00 | | | | 3.37 | |
STI Deferred Options | | | 31-Oct-08 | | | | 1,212,216 | | | | 2.80 | | | | 17.18 | | | | 17.36 | | | | 30 | | | | 5 | | | | 1 | | | | 3 | | | | 6.00 | | | | 4.48 | |
STI Deferred Options | | | 31-Oct-08 | | | | 418,766 | | | | 2.94 | | | | 17.18 | | | | 17.36 | | | | 30 | | | | 5 | | | | 2 | | | | 3.5 | | | | 6.00 | | | | 4.64 | |
STI Deferred Share Rights | | | 31-Oct-08 | | | | 84,659 | | | | 16.38 | | | | 0.00 | | | | 17.36 | | | | 30 | | | | 5 | | | | 1 | | | | 1 | | | | 6.00 | | | | 4.28 | |
STI Deferred Share Rights | | | 31-Oct-08 | | | | 89,121 | | | | 15.45 | | | | 0.00 | | | | 17.36 | | | | 30 | | | | 5 | | | | 2 | | | | 2 | | | | 6.00 | | | | 4.48 | |
LTI Deferred Share Rights | | | 31-Oct-08 | | | | 369,598 | | | | 14.58 | | | | 0.00 | | | | 17.36 | | | | 30 | | | | 5 | | | | 3 | | | | 3 | | | | 6.00 | | | | 4.48 | |
LTI Performance Rights | | | 31-Oct-08 | | | | 368,368 | | | | 9.99 | | | | 0.00 | | | | 17.36 | | | | 30 | | | | 5 | | | | 3 | | | | 3 | | | | 6.00 | | | | 4.25 | |
Special Retention Deferred | | | | | | | | | | | | | | | | | | | | | | | | | | | | | | | | | | | | | | | | | | | | |
Share Rights | | | 9-Dec-08 | | | | 18,210 | | | | 11.84 | | | | 0.00 | | | | 14.10 | | | | 34 | | | | 5 | | | | 2 | | | | 2 | | | | 6.00 | | | | 3.49 | |
| 1 | Expected volatility represents a measure of the amount by which ANZ’s share price is expected to fluctuate over the life of the options. The measure of volatility used in the model is the annualised standard deviation of the continuously compounded rates of return on the historical share price over a defined period of time preceding the date of grant. This historical average annualised volatility is then used to estimate a reasonable expected volatility over the expected life of the options. |
The significant assumptions used to measure the fair value of instruments granted during the 2008 financial year are contained in the table below.
| | | | | | | | | | | | | | | | | | | | | | | | | | | | | | | | | | | | | | | | | | | | |
Type of Equity | | Grant date | | | Number of
Options | | | Fair
value
($) | | | Exercise
price
(5 day
VWAP)
($) | | | Share
closing
price at
grant
($) | | | ANZ
expected
volatility1
(%) | | | Option
term
(years) | | | Vesting
period
(years) | | | Expected
life
(years) | | | Expected
dividend
yield
(%) | | | Risk free
interest
rate
(%) | |
Performance Rights | | | 19-Dec-07 | | | | 258,620 | | | | 11.60 | | | | 0.00 | | | | 26.85 | | | | 17 | | | | 4 | | | | 3 | | | | 3 | | | | 4.50 | | | | 6.82 | |
Performance Rights | | | 19-Dec-07 | | | | 259,740 | | | | 11.55 | | | | 0.00 | | | | 26.85 | | | | 17 | | | | 5 | | | | 4 | | | | 4 | | | | 4.50 | | | | 6.73 | |
Performance Rights | | | 19-Dec-07 | | | | 260,642 | | | | 11.51 | | | | 0.00 | | | | 26.85 | | | | 17 | | | | 6 | | | | 5 | | | | 5 | | | | 4.50 | | | | 6.66 | |
Deferred Share Rights | | | 29-May-08 | | | | 22,633 | | | | 18.38 | | | | 0.00 | | | | 21.35 | | | | n/a | | | | 5 | | | | 3 | | | | 3 | | | | 5.00 | | | | n/a | |
Deferred Share Rights | | | 9-Nov-07 | | | | 49,717 | | | | 25.59 | | | | 0.00 | | | | 27.95 | | | | 15 | | | | 5 | | | | 2 | | | | 2 | | | | 4.50 | | | | 6.77 | |
Deferred Share Rights | | | 9-Nov-07 | | | | 208,780 | | | | 24.49 | | | | 0.00 | | | | 27.95 | | | | 15 | | | | 5 | | | | 3 | | | | 3 | | | | 4.50 | | | | 6.69 | |
Performance Rights | | | 30-Oct-07 | | | | 940,886 | | | | 12.30 | | | | 0.00 | | | | 29.69 | | | | 15 | | | | 5 | | | | 3 | | | | 3 | | | | 4.50 | | | | 6.63 | |
| 1 | Expected volatility represents a measure of the amount by which ANZ’s share price is expected to fluctuate over the life of the options. The measure of volatility used in the model is the annualised standard deviation of the continuously compounded rates of return on the historical share price over a defined period of time preceding the date of grant. This historical average annualised volatility is then used to estimate a reasonable expected volatility over the expected life of the options. |
47: Key Management Personnel Disclosures
The Key Management Personnel (KMP) of the Group and Company are the same.
SECTION A: EXECUTIVE DIRECTORS AND OTHER KEY MANAGEMENT PERSONNEL COMPENSATION
The company staff are employees of the ultimate parent entity, Australia and New Zealand Banking Group Limited (ANZ) and the KMP compensation included in the management fee expenses is as follows:
| | | | | | | | |
| | | 2009
$ | | | 2008
$ | |
Short term employee benefits | | | 18,077,463 | | | | 15,978,226 | |
Post employment benefits | | | 367,018 | | | | 186,215 | |
Long term employment benefits | | | 142,067 | | | | 282,363 | |
Termination benefits | | | 634,869 | | | | 1,334,282 | |
Share-based payments | | | 9,789,223 | | | | 10,464,699 | |
| | | 29,010,640 | | | | 28,245,785 | |
Financial Report 181
NOTES TO THE FINANCIAL STATEMENTS
47: Key Management Personnel Disclosures (continued)
SECTION B: KEY MANAGEMENT PERSONNEL LOAN TRANSACTIONS
Loans made to directors of the Company and other key management personnel of the Group are made in the ordinary course of business on an arm’s length commercial basis, including the term of the loan, security required and the interest rate.
Details of loans outstanding at the reporting date to directors of the Company and other key management personnel of the Group including their personally related parties, where the individuals aggregate loan balance exceeded $100,000 at any time in the year, are as follows:
| | | | | | | | | | | | | | | | |
| | | Opening balance
1 October
$ | | | Closing balance
30 September
$ | | | Interest paid and
payable in the
reporting period
$ | | | Highest balance
in the reporting
period
$ | |
Directors | | | | | | | | | | | | | | | | |
Executive Director 2009 | | | | | | | | | | | | | | | | |
M Smith | | | 535,611 | | | | — | | | | 62,697 | | | | 1,000,000 | |
Executive Director 2008 | | | | | | | | | | | | | | | | |
M Smith | | | 356,800 | | | | 535,611 | | | | 60,829 | | | | 2,099,851 | |
| | | | |
Non-executive Directors 2009 | | | | | | | | | | | | | | | | |
P Hay2 | | | — | | | | 1,125,000 | | | | 3,954 | | | | 1,128,856 | |
A Watkins3 | | | 3,189,724 | | | | 3,289,964 | | | | 213,132 | | | | 3,295,434 | |
| | | | |
Other key management personnel 2009 | | | | | | | | | | | | | | | | |
J Fagg4 | | | 3,641,055 | | | | 4,117,937 | | | | 208,765 | | | | 4,319,402 | |
B C Hartzer6 | | | 12,438,898 | | | | 12,105,808 | | | | 381,671 | | | | 13,039,953 | |
G K Hodges | | | 3,055,034 | | | | 10,415,975 | | | | 170,733 | | | | 10,581,121 | |
P R Marriott | | | 905,479 | | | | — | | | | 7,399 | | | | 912,467 | |
A Thursby | | | 1,931,834 | | | | 1,890,097 | | | | 99,751 | | | | 1,931,834 | |
C Page | | | — | | | | 1,750,932 | | | | 19,854 | | | | 1,843,116 | |
| | | | |
Other key management personnel 2008 | | | | | | | | | | | | | | | | |
R J Edgar5 | | | 560,291 | | | | — | | | | 14,085 | | | | 1,083,067 | |
B C Hartzer | | | 7,806,997 | | | | 12,438,898 | | | | 973,081 | | | | 14,707,145 | |
G K Hodges | | | 3,672,905 | | | | 3,055,034 | | | | 250,229 | | | | 4,391,758 | |
P R Marriott | | | 2,824,293 | | | | 905,479 | | | | 181,186 | | | | 2,883,188 | |
A Thursby | | | — | | | | 1,931,834 | | | | 139,013 | | | | 2,190,000 | |
Details regarding the aggregate of loans made, guaranteed or secured by any entity in the Group to each group of directors and other key management personnel including related parties are as follows:
| | | | | | | | | | | | | | | | |
| | | Opening balance
1 October
$ | | | Closing balance
30 September
$ | | | Interest paid and
payable in the
reporting period
$ | | | Number in group
at 30 September1 | |
Directors | | | | | | | | | | | | | | | | |
2009 | | | 3,725,335 | | | | 4,414,964 | | | | 279,783 | | | | 2 | |
2008 | | | 356,800 | | | | 535,611 | | | | 60,829 | | | | 1 | |
| | | | |
Other key management personnel | | | | | | | | | | | | | | | | |
2009 | | | 21,972,300 | | | | 30,280,749 | | | | 888,173 | | | | 5 | |
2008 | | | 14,864,486 | | | | 18,331,245 | | | | 1,557,594 | | | | 4 | |
| 1 | Number in the Group includes directors and specified executives with loan balances greater than $100,000. |
| 2 | P Hay commenced as non-executive director effective 12 November 2008. |
| 3 | A Watkins commenced as non-executive director effective 12 November 2008 and the opening balance represents the balance on commencement. |
| 4 | J Fagg commenced her role as CEO, ANZ (NZ) effective 1 May 2009 and the opening balance represents the balance on appointment to New Zealand’s CEO. |
| 5 | R Edgar retired from ANZ effective 8 May 2009 and loans outstanding during this reporting period were less than $100,000. |
| 6 | B Hartzer ceased employment with ANZ effective 31 July 2009. |
48: Transactions with Other Related Parties
Joint Venture entities
During the course of the financial year the Company and the Group conducted transactions with joint venture entities on normal commercial terms and conditions as shown below:
| | | | | | | | | | | | | | | | |
| | | Consolidated | | | The Company | |
| | | 2009
$000 | | | 2008
$000 | | | 2009
$000 | | | 2008
$000 | |
Amounts receivable from joint venture entities | | | 241,410 | | | | 253,052 | | | | 212,434 | | | | 223,224 | |
Interest revenue | | | 9,324 | | | | 16,407 | | | | 9,324 | | | | 15,264 | |
Dividend revenue | | | — | | | | 26,950 | | | | — | | | | — | |
Commissions received from joint venture entities | | | 166,467 | | | | 184,058 | | | | 134,884 | | | | 164,795 | |
Cost recovered from joint venture entities | | | 9,497 | | | | 9,423 | | | | 8,766 | | | | 8,499 | |
There have been no guarantees given or received. No outstanding amounts have been written down or recorded as allowances, as they are considered fully collectible.
182ANZ Annual Report 2009
NOTES TO THE FINANCIAL STATEMENTS
48: Transactions with Other Related Parties (continued)
Associates
During the course of the financial year the Company and Group conducted transactions with associates on normal terms and conditions as shown below:
| | | | | | | | | | | | | | | | |
| | | Consolidated | | | The Company | |
| | | 2009
$000 | | | 2008
$000 | | | 2009
$000 | | | 2008
$000 | |
Amounts receivable from associates | | | 165,986 | | | | 207,899 | | | | 149,114 | | | | 181,223 | |
Amounts payable to associates | | | 69,763 | | | | 71,693 | | | | 239 | | | | — | |
Interest revenue | | | 16,303 | | | | 19,144 | | | | 12,286 | | | | 14,780 | |
Interest payable | | | 3,339 | | | | 630 | | | | — | | | | — | |
Other revenue | | | 11,190 | | | | 12,106 | | | | 1,812 | | | | 2,400 | |
Dividend revenue | | | 36,136 | | | | 15,451 | | | | 33,936 | | | | 3,979 | |
Cost recovered from associates | | | 2,164 | | | | 1,649 | | | | 2,164 | | | | 1,649 | |
There have been no guarantees given or received. No outstanding amounts have been written down or recorded as allowances, as they are considered fully collectible.
Subsidiaries
During the course of the financial year subsidiaries conducted transactions with each other and joint ventures and associates on normal terms and conditions. They are fully eliminated on consolidation. No outstanding amounts have been written down or recorded as allowances, as they are considered fully collectible.
Other relationships
In the 2007 Annual Report, in relation to the independence of Margaret Jackson, a non-executive Director of ANZ, it was disclosed that ANZ has commercial relationships with Qantas Airways Limited (in respect of which Ms Jackson was then Chairman) as a partner in the co-branded ANZ Frequent Flyer Visa Cards, and that ANZ also acquires travel services from Qantas. Having regard to the nature and value of the commercial relationships and the Board’s materiality criteria, the Board concluded that Ms Jackson remained independent. Ms Jackson retired from the Board of Qantas in November 2007.
49: Exchange Rates
The exchange rates used in the translation of the results and the assets and liabilities of major overseas branches and controlled entities are:
| | | | | | | | | | | | | | | | |
| | | 2009 | | | 2008 | |
| | | Closing | | | Average | | | Closing | | | Average | |
Chinese Yuan | | | 6.0026 | | | | 5.0018 | | | | 5.4723 | | | | 6.4356 | |
Euro | | | 0.6014 | | | | 0.5392 | | | | 0.5568 | | | | 0.6030 | |
Great British Pound | | | 0.5486 | | | | 0.4719 | | | | 0.4440 | | | | 0.4601 | |
Indonesian Rupiah | | | 8506.3 | | | | 7837.9 | | | | 7538.8 | | | | 8382.5 | |
Malaysian Ringgit | | | 3.0548 | | | | 2.6034 | | | | 2.7641 | | | | 2.9755 | |
New Zealand Dollar | | | 1.2188 | | | | 1.2248 | | | | 1.1934 | | | | 1.1918 | |
Papua New Guinea Kina | | | 2.4154 | | | | 2.0018 | | | | 2.0765 | | | | 2.4754 | |
United States Dollar | | | 0.8792 | | | | 0.7319 | | | | 0.7995 | | | | 0.9069 | |
50: Events Since the End of the Financial Year
On 25 September 2009, the Company announced it had reached agreement with ING Groep to acquire ING Groep’s 51% shareholdings in the ANZ-ING wealth management and life insurance joint ventures in Australia and New Zealand for $1,760 million, taking its ownership interest to 100%. Completion is subject to various conditions, including regulatory approval, and is expected to occur during the fourth quarter of calendar 2009.
Once completed, the acquisition will result in the Group fully consolidating the assets, liabilities and operations of ING Australia Limited (“INGA”) and ING (NZ) Holdings Limited (“INGNZ”) and its subsidiary companies into the Group’s results. At acquisition date, under the step acquisition provisions of AASB3R Business Combinations (Revised), the Group will remeasure its existing 49% interests which are accounted for under the equity method at acquisition date fair values and will recognise the resulting gain or loss in the income statement.
On 4 August 2009 the Company announced it had reached agreement with Royal Bank of Scotland Group plc to acquire selected businesses in Taiwan, Singapore, Indonesia1, Hong Kong, Phillipines and Vietnam. The purchase price is based on the fully recapitalised net tangible book value of these businesses plus a premium of USD50 million and whilst the ultimate purchase price is not determinable until completion it is estimated to amount to approximately USD550 million (AUD626 million). Each acquisition is subject to regulatory approval in the relevant jurisdictions, which is expected to occur from late 2009 through 2010. Accordingly these acquisitions will be progressively consolidated into the 2010 results including the impacts of acquisition accounting, integration and acquisition costs.
| 1 | The Indonesian business will be acquired through ANZ’s 85% owned subsidiary P.T. Bank Pan Indonesia. |
Financial Report 183
DIRECTORS’ DECLARATION
The directors of Australia and New Zealand Banking Group Limited declare that:
| a) | in the directors’ opinion, the financial statements and notes of the Company and the consolidated entity have been prepared in accordance with the Corporations Act 2001, including that they: |
| | i) | comply with applicable Australian Accounting Standards, (including the Australian Accounting Interpretations) and the Corporations Regulations 2001; and |
| | ii) | give a true and fair view of the financial position of the Company and of the consolidated entity as at 30 September 2009 and of their performance as represented by the results of their operations and their cash flows, for the year ended on that date; and |
| | iii) | the financial statements and notes of the Company and the consolidated entity comply with International Financial Reporting Standards as described in note 1(A)(i). |
| b) | in the directors’ opinion, the remuneration disclosures that are contained on pages 27 to 51 of the Remuneration Report comply with the Corporations Act 2001; and |
| c) | the directors have received the declarations required by section 295A of the Corporations Act 2001; and |
| d) | in the directors’ opinion, there are reasonable grounds to believe that the Company will be able to pay its debts as and when they become due and payable; and |
| e) | the Company and certain of its wholly owned controlled entities (listed in note 44) have executed a Deed of Cross Guarantee enabling them to take advantage of the accounting and audit relief offered by class order 98/1418 (as amended), issued by the Australian Securities and Investments Commission. The nature of the Deed of Cross Guarantee is to guarantee to each creditor payment in full of any debt in accordance with the terms of the Deed of Cross Guarantee. At the date of this declaration, there are reasonable grounds to believe that the Company and its controlled entities which executed the Deed of Cross Guarantee are able, as an economic entity, to meet any obligations or liabilities to which they are, or may become, subject by virtue of the Deed of Cross Guarantee. |
Signed in accordance with a resolution of the directors.
| | |
 | | |
| |
| Charles B Goode | | Michael R P Smith |
| Chairman | | Director |
| |
| 5 November 2009 | | |
184 ANZ Annual Report 2009
INDEPENDENT AUDITOR’S REPORT TO THE MEMBERS OF AUSTRALIA
AND NEW ZEALAND BANKING GROUP LIMITED
REPORT ON THE FINANCIAL REPORT
We have audited the accompanying financial report of Australia and New Zealand Banking Group Limited (the Company), which comprises the balance sheets as at 30 September 2009, and the income statements, statements of recognised income and expense and cash flow statements for the year ended on that date, a summary of significant accounting policies and other explanatory notes 1 to 50 and the directors’ declaration of the Group comprising the Company and the entities it controlled at the year’s end or from time to time during the financial year.
DIRECTORS’ RESPONSIBILITY FOR THE FINANCIAL REPORT
The directors of the Company are responsible for the preparation and fair presentation of the financial report in accordance with Australian Accounting Standards (including the Australian Accounting Interpretations) and theCorporations Act 2001. This responsibility includes establishing and maintaining internal control relevant to the preparation and fair presentation of the financial report that is free from material misstatement, whether due to fraud or error; selecting and applying appropriate accounting policies; and making accounting estimates that are reasonable in the circumstances. In note 1(A)(i), the directors also state, in accordance with Australian Accounting Standard AASB 101Presentation of Financial Statements, that the financial report of the Company and the Group, comprising the financial statements and notes, comply with International Financial Reporting Standards.
AUDITOR’S RESPONSIBILITY
Our responsibility is to express an opinion on the financial report based on our audit. We conducted our audit in accordance with Australian Auditing Standards. These Auditing Standards require that we comply with relevant ethical requirements relating to audit engagements and plan and perform the audit to obtain reasonable assurance whether the financial report is free from material misstatement.
An audit involves performing procedures to obtain audit evidence about the amounts and disclosures in the financial report. The procedures selected depend on the auditor’s judgement, including the assessment of the risks of material misstatement of the financial report, whether due to fraud or error. In making those risk assessments, the auditor considers internal control relevant to the entity’s preparation and fair presentation of the financial report in order to design audit procedures that are appropriate in the circumstances, but not for the purpose of expressing an opinion on the effectiveness of the entity’s internal control. An audit also includes evaluating the appropriateness of accounting policies used and the reasonableness of accounting estimates made by the directors, as well as evaluating the overall presentation of the financial report.
We performed the procedures to assess whether in all material respects the financial report presents fairly, in accordance with theCorporations Act 2001 and Australian Accounting Standards (including the Australian Accounting Interpretations), a view which is consistent with our understanding of the Company’s and the Group’s financial position and of their performance.
We believe that the audit evidence we have obtained is sufficient and appropriate to provide a basis for our audit opinion.
INDEPENDENCE
In conducting our audit, we have complied with the independence requirements of theCorporations Act 2001.
AUDITOR’S OPINION
In our opinion:
| (a) | the financial report of Australia and New Zealand Banking Group Limited is in accordance with theCorporations Act 2001, including: |
| | (i) | giving a true and fair view of the Company’s and the Group’s financial position as at 30 September 2009 and of their performance for the year ended on that date; and |
| | (ii) | complying with Australian Accounting Standards (including the Australian Accounting Interpretations) and the Corporations Regulations 2001. |
| (b) | the financial report of the Company and the Group also complies with International Financial Reporting Standards as disclosed in note 1(A)(i). |
REPORT ON THE REMUNERATION REPORT
We have audited the Remuneration Report included in pages 27 to 51 of the directors’ report for the year ended 30 September 2009. The directors of the Company are responsible for the preparation and presentation of the remuneration report in accordance with Section 300A of theCorporations Act 2001. Our responsibility is to express an opinion on the remuneration report, based on our audit conducted in accordance with auditing standards.
AUDITOR’S OPINION
In our opinion, the remuneration report of Australia and New Zealand Banking Group Limited for the year ended 30 September 2009, complies with Section 300A of the Corporations Act 2001.
| | |
| | |
| |
| KPMG | | |
| Melbourne, Australia | | |
| |
| 5 November 2009 | | |
Financial Report185
FINANCIAL INFORMATION
1: Capital Adequacy
| | | | | | | | | | | | |
| | | | | | 2009 | | | 2008 | |
Qualifying Capital | | | | | $m | | | $m | |
Tier 1 | | | | | | | | | | | | |
Shareholders’ equity and minority interests | | | | | | | 32,429 | | | | 26,552 | |
Prudential adjustments to shareholders’ equity | | | Table 1 | | | | (2,341 | ) | | | (2,409 | ) |
| | | | | | | | | | | | |
Fundamental Tier 1 capital | | | | | | | 30,088 | | | | 24,143 | |
Non-innovative Tier 1 capital instruments | | | | | | | 1,901 | | | | 2,095 | |
Innovative Tier 1 capital instruments | | | | | | | 2,122 | | | | 2,847 | |
| | | | | | | | | | | | |
Gross Tier 1 capital | | | | | | | 34,111 | | | | 29,085 | |
| | | | | | | | | | | | |
Deductions | | | Table 2 | | | | (7,492 | ) | | | (7,856 | ) |
| | | | | | | | | | | | |
Tier 1 capital | | | | | | | 26,619 | | | | 21,229 | |
| | | | | | | | | | | | |
Tier 2 | | | | | | | | | | | | |
Upper Tier 2 capital | | | Table 3 | | | | 1,390 | | | | 1,374 | |
Subordinated notes | | | Table 4 | | | | 9,082 | | | | 9,170 | |
Deductions | | | Table 2 | | | | (2,661 | ) | | | (1,206 | ) |
| | | | | | | | | | | | |
Tier 2 capital | | | | | | | 7,811 | | | | 9,338 | |
| | | | | | | | | | | | |
Total qualifying capital | | | | | | | 34,430 | | | | 30,567 | |
| | | | | | | | | | | | |
Capital adequacy ratios | | | | | | | | | | | | |
Tier 1 | | | | | | | 10.6 | % | | | 7.7 | % |
Tier 2 | | | | | | | 3.1 | % | | | 3.4 | % |
| | | | | | | | | | | | |
Total | | | | | | | 13.7 | % | | | 11.1 | % |
| | | | | | | | | | | | |
Risk weighted assets | | | Table 5 | | | | 252,069 | | | | 275,434 | |
| | | | | | | | | | | | |
186ANZ Annual Report 2009
FINANCIAL INFORMATION
1: Capital Adequacy (continued)
| | | | | | | | | | | | |
| | | | | | 2009 | | | 2008 | |
| | | | | | $m | | | $m | |
Table 1: Prudential adjustments to shareholders’ equity | | | | | | | | | | | | |
Reclassification of preference share capital | | | | | | | (871 | ) | | | (871 | ) |
Accumulated retained profits and reserves of insurance and funds management entities and associates | | | | | | | (1,010 | ) | | | (841 | ) |
Deferred fee revenue including fees deferred as part of loan yields | | | | | | | 391 | | | | 351 | |
Hedging reserve | | | | | | | 90 | | | | (78 | ) |
Available-for-sale reserve | | | | | | | 41 | | | | 88 | |
Dividend not provided for | | | | | | | (1,403 | ) | | | (1,511 | ) |
Accrual for Dividend Reinvestment Plans | | | | | | | 421 | | | | 453 | |
| | | | | | | | | | | | |
Total | | | | | | | (2,341 | ) | | | (2,409 | ) |
| | | | | | | | | | | | |
Table 2: Deductions from Tier 1 capital | | | | | | | | | | | | |
Unamortised goodwill & other intangibles | | | | | | | (3,047 | ) | | | (4,889 | ) |
Capitalised software | | | | | | | (849 | ) | | | (625 | ) |
Capitalised expenses including loan and lease origination fees, capitalised securitisation establishment costs and costs associated with debt raisings | | | | | | | (602 | ) | | | (642 | ) |
Applicable deferred tax assets (excluding the component relating to the general reserve for impairment of financial assets) | | | | | | | (325 | ) | | | (92 | ) |
Earnings not recognised for prudential purposes | | | | | | | — | | | | (117 | ) |
Mark-to market impact of own credit spread | | | | | | | 12 | | | | (149 | ) |
Negative Available-for-sale reserve | | | | | | | (20 | ) | | | (136 | ) |
| | | | | | | | | | | | |
Sub-total | | | | | | | (4,831 | ) | | | (6,650 | ) |
Deductions taken 50% from Tier 1 and 50% from Tier 2 | | | Gross | | | | 50 | % | | | | |
Investment in ANZ insurance subsidiaries | | | (321 | ) | | | (161 | ) | | | (65 | ) |
Investment in funds management entities | | | (67 | ) | | | (33 | ) | | | (34 | ) |
Investment in joint ventures with ING in Australia and New Zealand | | | (1,474 | ) | | | (737 | ) | | | (262 | ) |
Investment in other Authorised Deposit Taking Institutions and overseas equivalents | | | (1,951 | ) | | | (976 | ) | | | (610 | ) |
Expected losses in excess of eligible provisions1 | | | (1,012 | ) | | | (506 | ) | | | (167 | ) |
Investment in other commercial operations | | | (72 | ) | | | (36 | ) | | | (36 | ) |
Other deductions | | | (424 | ) | | | (212 | ) | | | (32 | ) |
| | | | | | | | | | | | |
Sub-total | | | (5,321 | ) | | | (2,661 | ) | | | (1,206 | ) |
| | | | | | | | | | | | |
Total | | | | | | | (7,492 | ) | | | (7,856 | ) |
| | | | | | | | | | | | |
Table 3: Upper Tier 2 capital | | | | | | | | | | | | |
Eligible component of post acquisition earnings and reserves in associates and joint ventures | | | | | | | 269 | | | | 248 | |
Perpetual subordinated notes2 | | | | | | | 1,024 | | | | 1,072 | |
General reserve for impairment of financial assets net of attributable deferred tax asset3 | | | | | | | 97 | | | | 54 | |
| | | | | | | | | | | | |
Total | | | | | | | 1,390 | | | | 1,374 | |
| | | | | | | | | | | | |
| Table 4: Subordinated notes2 | | | | | | | | | | | | |
For capital adequacy calculation purposes, subordinated note issues are reduced by 20% of the original amount over the last four years to maturity and are limited to 50% of Tier 1 capital. | | | | | | | | | | | | |
| 1 | The gross deduction includes a collective provision component net of tax of $1,875 million, other eligible provisions of $1,642 million less an estimate for regulatory expected loss of $4,529 million. |
| 2 | The fair value adjustment is excluded for prudential purposes as the prudential standard only permits inclusion of cash received and makes no allowance for hedging. |
| 3 | Under Basel II, this consists of the surplus general reserve for impairment of financial assets net of tax and/or the provisions attributable to the standardised portfolio. |
Financial Report187
FINANCIAL INFORMATION
1: Capital Adequacy (continued)
| | | | | | | | |
| | | 2009 | | | 2008 | |
| | | $m | | | $m | |
Table 5: Risk weighted assets | | | | | | | | |
On balance sheet | | | 170,035 | | | | 177,570 | |
Commitments | | | 37,704 | | | | 47,398 | |
Contingents | | | 12,377 | | | | 14,519 | |
Derivatives | | | 9,695 | | | | 11,263 | |
| | | | | | | | |
Total credit risk | | | 229,811 | | | | 250,750 | |
Market risk – Traded | | | 3,553 | | | | 2,609 | |
Market risk – IRRBB | | | 2,465 | | | | 4,058 | |
Operational risk | | | 16,240 | | | | 18,017 | |
| | | | | | | | |
Total risk weighted assets | | | 252,069 | | | | 275,434 | |
| | | | | | | | |
Table 6: Credit risk weighted assets by Basel asset class | | | | | | | | |
Subject to Advanced IRB approach | | | | | | | | |
Corporate | | | 116,153 | | | | 127,365 | |
Sovereign | | | 1,408 | | | | 2,079 | |
Bank | | | 5,592 | | | | 12,624 | |
Residential Mortgage | | | 36,725 | | | | 33,727 | |
Qualifying revolving retail (credit cards) | | | 6,852 | | | | 8,703 | |
Other retail | | | 17,108 | | | | 14,218 | |
| | | | | | | | |
Credit risk weighted assets subject to Advanced IRB approach | | | 183,838 | | | | 198,716 | |
| | | | | | | | |
Credit risk specialised lending exposures subject to slotting criteria | | | 24,272 | | | | 30,250 | |
| | | | | | | | |
Subject to Standardised approach | | | | | | | | |
Corporate | | | 13,531 | | | | 12,980 | |
Sovereign | | | — | | | | — | |
Bank | | | 13 | | | | 21 | |
Residential Mortgage | | | 411 | | | | 344 | |
| | | | | | | | |
Credit risk weighted assets subject to Standardised approach | | | 13,955 | | | | 13,345 | |
| | | | | | | | |
Credit risk weighted assets relating to securitisation exposures | | | 2,658 | | | | 4,271 | |
Credit risk weighted assets relating to equity exposures | | | 1,914 | | | | 1,146 | |
Other assets | | | 3,174 | | | | 3,022 | |
| | | | | | | | |
Total credit risk weighted assets | | | 229,811 | | | | 250,750 | |
| | | | | | | | |
| | | | | | | | | | | | | | | | |
| | | Collective provision | | | Regulatory Expected Loss | |
Table 7: Collective provision and Regulatory Expected loss by Region | | 2009
$m | | | 2008
$m | | | 2009
$m | | | 2008
$m | |
Australia | | | 2,001 | | | | 2,149 | | | | 3,291 | | | | 2,327 | |
Asia Pacific, Europe & America | | | 339 | | | | 225 | | | | 214 | | | | 119 | |
New Zealand | | | 660 | | | | 447 | | | | 1,024 | | | | 606 | |
| | | | | | | | | | | | | | | | |
Total | | | 3,000 | | | | 2,821 | | | | 4,529 | | | | 3,052 | |
| | | | | | | | | | | | | | | | |
The measurement of risk weighted assets is based on: a) a credit risk-based approach whereby risk weightings are applied to balance sheet assets and to credit converted off-balance sheet exposures. Categories of risk weights are assigned based upon the nature of the counterparty and the relative liquidity of the assets concerned; and b) the recognition of risk weighted assets attributable to market risk arising from trading and commodity positions. Trading and commodity balance sheet positions do not attract a risk weighting under the credit risk-based approach.
The Basel II Accord principles took effect from 1 January 2008. For calculation of minimum capital requirements under Pillar 1 (Capital Requirements) of the Basel II Accord, ANZ has gained accreditation from APRA for use of Advanced Internal Ratings Based (AIRB) methodology for credit risk weighted assets and Advanced Measurement Approach (AMA) for operational risk weighted asset equivalent.
188ANZ Annual Report 2009
FINANCIAL INFORMATION
2: Average Balance Sheet and Related Interest
Averages used in the following table are predominantly daily averages. Interest income figures are presented on a tax-equivalent basis. Impaired loans are included under the interest earning asset category ‘loans and advances’. Intragroup interest earning assets and interest bearing liabilities are treated as external assets and liabilities for the geographic segments.
| | | | | | | | | | | | | | | | | | | | | | | | |
| | | 2009 | | | 2008 | |
| | | Average
balance
$m | | | Interest
$m | | | Average
rate
% | | | Average
balance
$m | | | Interest
$m | | | Average
rate
% | |
Interest earning assets | | | | | | | | | | | | | | | | | | | | | | | | |
| | | | | | |
Due from other financial institutions | | | | | | | | | | | | | | | | | | | | | | | | |
Australia | | | 4,501 | | | | 164 | | | | 3.6 | | | | 3,002 | | | | 193 | | | | 6.4 | |
New Zealand | | | 1,346 | | | | 49 | | | | 3.6 | | | | 1,390 | | | | 92 | | | | 6.6 | |
Overseas Markets | | | 7,479 | | | | 100 | | | | 1.3 | | | | 6,171 | | | | 250 | | | | 4.1 | |
| | | | | | |
Trading and available-for-sale assets | | | | | | | | | | | | | | | | | | | | | | | | |
Australia | | | 27,831 | | | | 1,243 | | | | 4.5 | | | | 22,733 | | | | 1,633 | | | | 7.2 | |
New Zealand | | | 2,973 | | | | 166 | | | | 5.6 | | | | 2,316 | | | | 187 | | | | 8.1 | |
Overseas Markets | | | 7,379 | | | | 258 | | | | 3.5 | | | | 6,223 | | | | 313 | | | | 5.0 | |
| | | | | | |
Loans and advances | | | | | | | | | | | | | | | | | | | | | | | | |
Australia | | | 238,521 | | | | 15,852 | | | | 6.6 | | | | 220,367 | | | | 18,884 | | | | 8.6 | |
New Zealand | | | 80,202 | | | | 5,604 | | | | 7.0 | | | | 78,103 | | | | 7,491 | | | | 9.6 | |
Overseas Markets | | | 21,980 | | | | 1,089 | | | | 5.0 | | | | 17,299 | | | | 1,042 | | | | 6.0 | |
| | | | | | |
Customers’ liability for acceptances | | | | | | | | | | | | | | | | | | | | | | | | |
Australia | | | 14,670 | | | | 915 | | | | 6.2 | | | | 15,397 | | | | 1,347 | | | | 8.7 | |
Overseas Markets | | | 425 | | | | 12 | | | | 2.8 | | | | 463 | | | | 23 | | | | 5.0 | |
| | | | | | |
Other assets | | | | | | | | | | | | | | | | | | | | | | | | |
Australia | | | 3,828 | | | | 236 | | | | 6.2 | | | | 4,512 | | | | 366 | | | | 8.1 | |
New Zealand | | | 5,472 | | | | 287 | | | | 5.2 | | | | 5,152 | | | | 401 | | | | 7.8 | |
Overseas Markets | | | 10,857 | | | | 231 | | | | 2.1 | | | | 7,647 | | | | 382 | | | | 5.0 | |
| | | | | | |
Intragroup assets | | | 「 | | | | | | | | | | | | | | | | | | | | | |
Australia | | | 8,323 | | | | 329 | | | | 4.0 | | | | 5,666 | | | | 404 | | | | 7.1 | |
Overseas Markets | | | 1,727 | | | | 68 | | | | 3.9 | | | | 563 | | | | 32 | | | | 5.7 | |
| | | | | | | | | | | | | | | | | | | | | | | | |
| | | 437,514 | | | | 26,603 | | | | | | | | 397,004 | | | | 33,040 | | | | | |
Intragroup elimination | | | (10,050 | ) | | | (397 | ) | | | | | | | (6,229 | ) | | | (436 | ) | | | | |
| | | | | | | | | | | | | | | | | | | | | | | | |
| | | 427,464 | | | | 26,206 | | | | 6.1 | | | | 390,775 | | | | 32,604 | | | | 8.3 | |
| | | | | | | | | | | | | | | | | | | | | | | | |
Non-interest earning assets | | | | | | | | | | | | | | | | | | | | | | | | |
| | | | | | |
Derivatives | | | | | | | | | | | | | | | | | | | | | | | | |
Australia | | | 48,062 | | | | | | | | | | | | 24,656 | | | | | | | | | |
New Zealand | | | 12,063 | | | | | | | | | | | | 4,358 | | | | | | | | | |
Overseas Markets | | | 795 | | | | | | | | | | | | 1,889 | | | | | | | | | |
| | | | | | |
Premises and equipment | | | 1,844 | | | | | | | | | | | | 1,513 | | | | | | | | | |
| | | | | | |
Other assets | | | 19,303 | | | | | | | | | | | | 15,136 | | | | | | | | | |
| | | | | | |
Provisions for credit impairment | | | | | | | | | | | | | | | | | | | | | | | | |
Australia | | | (2,826 | ) | | | | | | | | | | | (2,040 | ) | | | | | | | | |
New Zealand | | | (701 | ) | | | | | | | | | | | (442 | ) | | | | | | | | |
Overseas Markets | | | (341 | ) | | | | | | | | | | | (193 | ) | | | | | | | | |
| | | | | | | | | | | | | | | | | | | | | | | | |
| | | 78,199 | | | | | | | | | | | | 44,877 | | | | | | | | | |
| | | | | | | | | | | | | | | | | | | | | | | | |
Total average assets | | | 505,663 | | | | | | | | | | | | 435,652 | | | | | | | | | |
| | | | | | | | | | | | | | | | | | | | | | | | |
Total average assets | | | | | | | | | | | | | | | | | | | | | | | | |
Australia | | | 353,755 | | | | | | | | | | | | 303,530 | | | | | | | | | |
New Zealand | | | 105,509 | | | | | | | | | | | | 94,765 | | | | | | | | | |
Overseas Markets | | | 56,449 | | | | | | | | | | | | 43,586 | | | | | | | | | |
| | | | | | | | | | | | | | | | | | | | | | | | |
| | | 515,713 | | | | | | | | | | | | 441,881 | | | | | | | | | |
Intragroup elimination | | | (10,050 | ) | | | | | | | | | | | (6,229 | ) | | | | | | | | |
| | | | | | | | | | | | | | | | | | | | | | | | |
| | | 505,663 | | | | | | | | | | | | 435,652 | | | | | | | | | |
| | | | | | | | | | | | | | | | | | | | | | | | |
% of total average assets attributable to overseas activities | | | 31.7 | % | | | | | | | | | | | 31.6 | % | | | | | | | | |
| | | | | | | | | | | | | | | | | | | | | | | | |
Finincial Report 189
FINANCIAL INFORMATION
2: Average Balance Sheet and Related Interest (continued)
| | | | | | | | | | | | | | | | | | | | | | | | |
| | | 2009 | | | 2008 | |
| | | Average
balance
$m | | | Interest
$m | | | Average
rate
% | | | Average
balance
$m | | | Interest
$m | | | Average
rate
% | |
Interest bearing liabilities | | | | | | | | | | | | | | | | | | | | | | | | |
| | | | | | |
Time deposits | | | | | | | | | | | | | | | | | | | | | | | | |
Australia | | | 87,556 | | | | 4,308 | | | | 4.9 | | | | 71,698 | | | | 5,224 | | | | 7.3 | |
New Zealand | | | 30,498 | | | | 1,695 | | | | 5.6 | | | | 29,653 | | | | 2,444 | | | | 8.2 | |
Overseas Markets | | | 37,258 | | | | 640 | | | | 1.7 | | | | 25,274 | | | | 1,016 | | | | 4.0 | |
| | | | | | |
Savings deposits | | | | | | | | | | | | | | | | | | | | | | | | |
Australia | | | 18,779 | | | | 577 | | | | 3.1 | | | | 18,062 | | | | 778 | | | | 4.3 | |
New Zealand | | | 2,305 | | | | 62 | | | | 2.7 | | | | 1,819 | | | | 60 | | | | 3.3 | |
Overseas Markets | | | 640 | | | | 5 | | | | 0.8 | | | | 584 | | | | 8 | | | | 1.4 | |
| | | | | | |
Other demand deposits | | | | | | | | | | | | | | | | | | | | | | | | |
Australia | | | 63,383 | | | | 1,952 | | | | 3.1 | | | | 54,900 | | | | 3,193 | | | | 5.8 | |
New Zealand | | | 16,041 | | | | 568 | | | | 3.5 | | | | 15,720 | | | | 1,063 | | | | 6.8 | |
Overseas Markets | | | 1,860 | | | | 14 | | | | 0.8 | | | | 1,273 | | | | 19 | | | | 1.5 | |
| | | | | | |
Due to other financial institutions | | | | | | | | | | | | | | | | | | | | | | | | |
Australia | | | 5,030 | | | | 171 | | | | 3.4 | | | | 6,234 | | | | 412 | | | | 6.6 | |
New Zealand | | | 2,439 | | | | 105 | | | | 4.3 | | | | 1,746 | | | | 106 | | | | 6.1 | |
Overseas Markets | | | 10,078 | | | | 155 | | | | 1.5 | | | | 10,804 | | | | 447 | | | | 4.1 | |
| | | | | | |
Commercial paper | | | | | | | | | | | | | | | | | | | | | | | | |
Australia | | | 7,709 | | | | 393 | | | | 5.1 | | | | 11,293 | | | | 834 | | | | 7.4 | |
New Zealand | | | 7,263 | | | | 337 | | | | 4.6 | | | | 9,282 | | | | 819 | | | | 8.8 | |
| | | | | | |
Borrowing corporations’ debt | | | | | | | | | | | | | | | | | | | | | | | | |
Australia | | | 5,663 | | | | 381 | | | | 6.7 | | | | 8,637 | | | | 618 | | | | 7.2 | |
New Zealand | | | 1,371 | | | | 91 | | | | 6.6 | | | | 1,484 | | | | 123 | | | | 8.3 | |
| | | | | | |
Liability for acceptances | | | | | | | | | | | | | | | | | | | | | | | | |
Australia | | | 14,670 | | | | 635 | | | | 4.3 | | | | 15,397 | | | | 1,160 | | | | 7.5 | |
Overseas Markets | | | 425 | | | | 11 | | | | 2.6 | | | | 463 | | | | 23 | | | | 5.0 | |
| | | | | | |
Loan capital, bonds and notes | | | | | | | | | | | | | | | | | | | | | | | | |
Australia | | | 65,343 | | | | 3,221 | | | | 4.9 | | | | 62,458 | | | | 4,653 | | | | 7.4 | |
New Zealand | | | 12,668 | | | | 710 | | | | 5.6 | | | | 14,848 | | | | 1,322 | | | | 8.9 | |
Overseas Markets | | | 717 | | | | 44 | | | | 6.2 | | | | 359 | | | | 25 | | | | 7.0 | |
| | | | | | |
Other liabilities1 | | | | | | | | | | | | | | | | | | | | | | | | |
Australia | | | 3,875 | | | | 15 | | | | n/a | | | | 4,495 | | | | 280 | | | | n/a | |
New Zealand | | | 99 | | | | 265 | | | | n/a | | | | 87 | | | | 95 | | | | n/a | |
Overseas Markets | | | 31 | | | | 43 | | | | n/a | | | | 38 | | | | 32 | | | | n/a | |
| | | | | | |
Intragroup liabilities | | | | | | | | | | | | | | | | | | | | | | | | |
New Zealand | | | 10,050 | | | | 397 | | | | 4.0 | | | | 6,229 | | | | 436 | | | | 7.0 | |
| | | | | | | | | | | | | | | | | | | | | | | | |
| | | 405,751 | | | | 16,795 | | | | | | | | 372,837 | | | | 25,190 | | | | | |
Intragroup elimination | | | (10,050 | ) | | | (397 | ) | | | | | | | (6,229 | ) | | | (436 | ) | | | | |
| | | | | | | | | | | | | | | | | | | | | | | | |
| | | 395,701 | | | | 16,398 | | | | 4.1 | | | | 366,608 | | | | 24,754 | | | | 6.8 | |
| | | | | | | | | | | | | | | | | | | | | | | | |
| 1 | Includes foreign exchange swap costs. |
190ANZ Annual Report 2009
FINANCIAL INFORMATION
2: Average Balance Sheet and Related Interest (continued)
| | | | | | | | |
| | | 2009
Average
balance
$m | | | 2008
Average
balance
$m | |
Non-interest bearing liabilities | | | | | | | | |
| | |
Deposits | | | | | | | | |
Australia | | | 4,951 | | | | 4,787 | |
New Zealand | | | 3,253 | | | | 3,432 | |
Overseas Markets | | | 1,540 | | | | 1,200 | |
| | |
Derivative financial instruments | | | | | | | | |
Australia | | | 50,399 | | | | 22,841 | |
New Zealand | | | 11,958 | | | | 3,542 | |
Overseas Markets | | | (3,147 | ) | | | (884 | ) |
| | |
Other liabilities | | | 11,944 | | | | 10,603 | |
| | | | | | | | |
| | | 80,898 | | | | 45,521 | |
| | | | | | | | |
Total average liabilities | | | 476,599 | | | | 412,129 | |
| | | | | | | | |
Total average liabilities | | | | | | | | |
Australia | | | 336,219 | | | | 288,656 | |
New Zealand | | | 99,387 | | | | 89,022 | |
Overseas Markets | | | 51,043 | | | | 40,680 | |
| | | | | | | | |
| | | 486,649 | | | | 418,358 | |
Intragroup elimination | | | (10,050 | ) | | | (6,229 | ) |
| | | | | | | | |
| | | 476,599 | | | | 412,129 | |
| | | | | | | | |
% of total average assets attributable to overseas activities | | | 29.5 | % | | | 30.0 | % |
| | | | | | | | |
Total average shareholders’ equity | | | | | | | | |
Ordinary share capital1 | | | 28,193 | | | | 22,652 | |
Preference share capital | | | 871 | | | | 871 | |
| | | | | | | | |
| | | 29,064 | | | | 23,523 | |
| | | | | | | | |
Total average liabilities and shareholders’ equity | | | 505,663 | | | | 435,652 | |
| | | | | | | | |
| 1 | Includes reserves and retained earnings. |
Financial Report 191
FINANCIAL INFORMATION
3: Interest Spreads and Net Interest Average Margins
| | | | | | | | |
| | | 2009 | | | 2008 | |
| | | $m | | | $m | |
Net interest income | | | | | | | | |
Australia | | | 7,085 | | | | 5,674 | |
New Zealand | | | 1,877 | | | | 1,702 | |
Overseas Markets | | | 846 | | | | 474 | |
| | | | | | | | |
| | | 9,808 | | | | 7,850 | |
| | | | | | | | |
Average interest earning assets | | | | | | | | |
Australia | | | 297,674 | | | | 271,677 | |
New Zealand | | | 89,993 | | | | 86,961 | |
Overseas Markets | | | 49,847 | | | | 38,366 | |
less intragroup elimination | | | (10,050 | ) | | | (6,229 | ) |
| | | | | | | | |
| | | 427,464 | | | | 390,775 | |
| | | | | | | | |
| | |
| | | % | | | % | |
Gross earnings rate1 | | | | | | | | |
Australia | | | 6.30 | | | | 8.40 | |
New Zealand | | | 6.79 | | | | 9.40 | |
Overseas Markets | | | 3.53 | | | | 5.33 | |
Group | | | 6.13 | | | | 8.34 | |
| | | | | | | | |
Interest spread and net interest average margin may be analysed as follows: | | | | | | | | |
Australia | | | | | | | | |
Net interest spread | | | 2.01 | | | | 1.63 | |
Interest attributable to net non-interest bearing items | | | 0.37 | | | | 0.46 | |
| | | | | | | | |
Net interest margin – Australia | | | 2.38 | | | | 2.09 | |
| | | | | | | | |
New Zealand | | | | | | | | |
Net interest spread | | | 1.68 | | | | 1.40 | |
Interest attributable to net non-interest bearing items | | | 0.41 | | | | 0.56 | |
| | | | | | | | |
Net interest margin – New Zealand | | | 2.09 | | | | 1.96 | |
| | | | | | | | |
Overseas Markets | | | | | | | | |
Net interest spread | | | 1.74 | | | | 1.27 | |
Interest attributable to net non-interest bearing items | | | (0.04 | ) | | | (0.04 | ) |
| | | | | | | | |
Net interest margin – Overseas Markets | | | 1.70 | | | | 1.23 | |
| | | | | | | | |
Group | | | | | | | | |
Net interest spread | | | 1.98 | | | | 1.59 | |
Interest attributable to net non-interest bearing items | | | 0.31 | | | | 0.42 | |
| | | | | | | | |
Net interest margin | | | 2.29 | | | | 2.01 | |
| | | | | | | | |
| 1 | Average interest rate received on interest earning assets. Overseas Markets includes intragroup assets. |
192ANZ Annual Report 2009
FINANCIAL INFORMATION
4: Special Purpose and Off-Balance Sheet Entities
Below is an analysis of the assets of consolidated and non-consolidated special purpose entities (SPEs) which ANZ has established or manages. This note is designed to reflect the Group’s main exposures to SPEs and does not include every transaction the Group has entered into with an SPE. This analysis excludes vehicles that are used in connection with stock-based compensation programs.
| | | | | | | | | | | | | | | | |
| | | Non-Consolidated | | | Consolidated | |
| | | SPEs | | | SPEs | |
| | | 2009 | | | 2008 | | | 2009 | | | 2008 | |
| | | $m | | | $m | | | $m | | | $m | |
Total Assets of SPEs | | | | | | | | | | | | | | | | |
Securitisation vehicles | | | 7,110 | | | | 8,021 | | | | 33,788 | | | | 11,884 | |
Structured finance entities1 | | | n/a | | | | n/a | | | | 350 | | | | 147 | |
Credit protection | | | — | | | | 2,145 | | | | — | | | | — | |
| | | | | | | | | | | | | | | | |
| | | 7,110 | | | | 10,166 | | | | 34,138 | | | | 12,031 | |
| | | | | | | | | | | | | | | | |
| 1 | ANZ’s net investment in non-consolidated Structured Finance entities is $163 million at 30 September 2009 (30 September 2008: $166 million). |
Total assets of SPEs:
| | | | | | | | | | | | | | | | | | | | | | | | | | | | | | | | |
| | | Australia | | | New Zealand | | | Other | | | Total | |
| | | 2009 | | | 2008 | | | 2009 | | | 2008 | | | 2009 | | | 2008 | | | 2009 | | | 2008 | |
| | | $m | | | $m | | | $m | | | $m | | | $m | | | $m | | | $m | | | $m | |
Non-consolidated SPEs which ANZ established or manage | | | | | | | | | | | | | | | | | | | | | | | | | | | | | | | | |
Corporate loans | | | — | | | | 2,145 | | | | — | | | | 557 | | | | — | | | | — | | | | — | | | | 2,702 | |
Rural loans | | | 2,217 | | | | 2,064 | | | | — | | | | — | | | | — | | | | — | | | | 2,217 | | | | 2,064 | |
Trade receivables | | | 2,164 | | | | 2,096 | | | | — | | | | — | | | | — | | | | — | | | | 2,164 | | | | 2,096 | |
Residential mortgages | | | 1,099 | | | | 1,442 | | | | — | | | | — | | | | — | | | | — | | | | 1,099 | | | | 1,442 | |
Credit cards and other personal loans | | | — | | | | 13 | | | | — | | | | — | | | | — | | | | — | | | | — | | | | 13 | |
Car loans and equipment finance | | | 1,029 | | | | 1,009 | | | | — | | | | — | | | | — | | | | — | | | | 1,029 | | | | 1,009 | |
Other | | | 446 | | | | 586 | | | | 155 | | | | 254 | | | | — | | | | — | | | | 601 | | | | 840 | |
| | | | | | | | | | | | | | | | | | | | | | | | | | | | | | | | |
| | | 6,955 | | | | 9,355 | | | | 155 | | | | 811 | | | | — | | | | — | | | | 7,110 | | | | 10,166 | |
| | | | | | | | | | | | | | | | | | | | | | | | | | | | | | | | |
Consolidated SPEs | | | | | | | | | | | | | | | | | | | | | | | | | | | | | | | | |
Corporate loans | | | — | | | | — | | | | — | | | | — | | | | — | | | | 410 | | | | — | | | | 410 | |
Trade receivables | | | — | | | | 185 | | | | — | | | | — | | | | — | | | | — | | | | — | | | | 185 | |
Residential mortgages | | | 28,763 | | | | 10,731 | | | | 4,633 | | | | — | | | | — | | | | — | | | | 33,396 | | | | 10,731 | |
Car loans and equipment finance | | | — | | | | 69 | | | | — | | | | — | | | | 88 | | | | 77 | | | | 88 | | | | 146 | |
Other | | | 654 | | | | 559 | | | | — | | | | — | | | | — | | | | — | | | | 654 | | | | 559 | |
| | | | | | | | | | | | | | | | | | | | | | | | | | | | | | | | |
| | | 29,417 | | | | 11,544 | | | | 4,633 | | | | — | | | | 88 | | | | 487 | | | | 34,138 | | | | 12,031 | |
| | | | | | | | | | | | | | | | | | | | | | | | | | | | | | | | |
| | | | | | | | |
| | | Non-Consolidated | |
| | | SPEs | |
| | | 2009 | | | 2008 | |
| | | $m | | | $m | |
Maximum exposure to non-consolidated SPEs1 | | | | | | | | |
Liquidity support facilities (drawn) | | | 1,446 | | | | 1,237 | |
Liquidity support facilities (undrawn) | | | 2,495 | | | | 3,290 | |
Credit default swaps (net fair value) | | | 30 | | | | 33 | |
Other facilities (drawn) | | | 1,520 | | | | 1,768 | |
Other facilities (undrawn) | | | 791 | | | | 958 | |
Notes held in credit protection entities | | | — | | | | 393 | |
Other derivatives (net fair value) | | | 41 | | | | 21 | |
| | | | | | | | |
| | | 6,323 | | | | 7,700 | |
| | | | | | | | |
| 1 | Excluding Structured Finance entities. |
Financial Report 193
FINANCIAL INFORMATION
5: Leveraged Finance
The Group has a dedicated Leveraged & Acquisition Finance team, which provides secured financing for the acquisition of companies through the use of debt.
Leveraged & Acquisition Finance provides acquisition finance for private equity firms and other corporations with operations in Australia, New Zealand and Asia Pacific and Europe & America and concentrates on company cash flows. Target businesses are those with stable and established earnings and the ability to reduce borrowing levels.
The tables below provide an analysis of the credit exposures arising from the provision of leverage finance.
| | | | | | | | | | | | | | | | | | | | | | | | | | | | | | | | | | | | | | | | |
| | | Unfunded commitments | | | Funded exposures | | | Total gross exposures | | | Individual provisions | | | Net exposure | |
| | | 2009 | | | 2008 | | | 2009 | | | 2008 | | | 2009 | | | 2008 | | | 2009 | | | 2008 | | | 2009 | | | 2008 | |
| | | $m | | | $m | | | $m | | | $m | | | $m | | | $m | | | $m | | | $m | | | $m | | | $m | |
Exposure by industry | | | | | | | | | | | | | | | | | | | | | | | | | | | | | | | | | | | | | | | | |
Manufacturing | | | 278 | | | | 155 | | | | 782 | | | | 744 | | | | 1,060 | | | | 899 | | | | (19 | ) | | | (9 | ) | | | 1,041 | | | | 890 | |
Business services | | | 310 | | | | 156 | | | | 609 | | | | 628 | | | | 919 | | | | 784 | | | | (2 | ) | | | (13 | ) | | | 917 | | | | 771 | |
Healthcare | | | 82 | | | | 50 | | | | 334 | | | | 131 | | | | 416 | | | | 181 | | | | — | | | | — | | | | 416 | | | | 181 | |
Retail | | | 75 | | | | 112 | | | | 308 | | | | 532 | | | | 383 | | | | 644 | | | | (3 | ) | | | — | | | | 380 | | | | 644 | |
Media | | | 32 | | | | 38 | | | | 145 | | | | 146 | | | | 177 | | | | 184 | | | | — | | | | — | | | | 177 | | | | 184 | |
Other | | | 128 | | | | 67 | | | | 468 | | | | 666 | | | | 596 | | | | 733 | | | | (6 | ) | | | — | | | | 590 | | | | 733 | |
| | | | | | | | | | | | | | | | | | | | | | | | | | | | | | | | | | | | | | | | |
| | | 905 | | | | 578 | | | | 2,646 | | | | 2,847 | | | | 3,551 | | | | 3,425 | | | | (30 | ) | | | (22 | ) | | | 3,521 | | | | 3,403 | |
| | | | | | | | | | | | | | | | | | | | | | | | | | | | | | | | | | | | | | | | |
Exposure by geography | | | | | | | | | | | | | | | | | | | | | | | | | | | | | | | | | | | | | | | | |
Australia | | | 474 | | | | 327 | | | | 1,325 | | | | 1,507 | | | | 1,799 | | | | 1,834 | | | | (30 | ) | | | (22 | ) | | | 1,769 | | | | 1,812 | |
New Zealand | | | 246 | | | | 177 | | | | 1,009 | | | | 1,156 | | | | 1,255 | | | | 1,333 | | | | — | | | | — | | | | 1,255 | | | | 1,333 | |
Asia Pacific and Europe & America | | | 185 | | | | 74 | | | | 312 | | | | 184 | | | | 497 | | | | 258 | | | | — | | | | — | | | | 497 | | | | 258 | |
| | | | | | | | | | | | | | | | | | | | | | | | | | | | | | | | | | | | | | | | |
| | | 905 | | | | 578 | | | | 2,646 | | | | 2,847 | | | | 3,551 | | | | 3,425 | | | | (30 | ) | | | (22 | ) | | | 3,521 | | | | 3,403 | |
| | | | | | | | | | | | | | | | | | | | | | | | | | | | | | | | | | | | | | | | |
| | | | | | | | |
| | | 2009 | | | 2008 | |
Total individual provision balance | | $m | | | $m | |
Movements in individual provision | | | | | | | | |
Balance at start of year | | | 22 | | | | 10 | |
Charge to income statement | | | 118 | | | | 30 | |
Bad debts written off | | | (110 | ) | | | (18 | ) |
| | | | | | | | |
| | | 30 | | | | 22 | |
| | | | | | | | |
194ANZ Annual Report 2009
FINANCIAL INFORMATION
6: Asset-Backed Securities
The Group may acquire asset-backed securities primarily as part of the trading activities (classified as trading securities), liquidity management (classified as available-for-sale assets) or through investments in special purpose vehicles. Asset-backed securities are debt instruments that are based on pools of assets or are collateralised by the cash flows from a specified pool of underlying assets. All asset-backed securities held by the Group are carried at fair value on the balance sheet.
The following terminology relates to residential mortgage backed securities originated in the US:
| • | | Subprime mortgages — sub-prime represents mortgages granted to borrowers with a poor or limited credit history. Sub-prime loans carry higher interest rates to compensate for potential losses from default. |
| • | | Alt-A mortgages — these are loans that are underwritten with lower or alternative documentation than a full documentation mortgage loan. As a result, Alt-A mortgage loans may have a higher risk of default than non-Alt-A mortgage loans (excluding subprime mortgages). In reporting our Alt-A exposure, we have classified mortgage loans as Alt-A if mortgage-related securities that we hold in our portfolio were labelled as Alt-A when we bought them. |
While note 33 Financial Risk Management provides a comprehensive analysis of the quality of all financial instruments giving rise to credit risk, the tables below contain a similar analysis for held asset-backed securities only.
| | | | | | | | | | | | | | | | |
| | | Face value | | | Carrying amount1 | |
| | | 2009 | | | 2008 | | | 2009 | | | 2008 | |
| | | $m | | | $m | | | $m | | | $m | |
Exposure by industry | | | | | | | | | | | | | | | | |
Collateralised debt obligations1 | | | — | | | | 395 | | | | — | | | | 393 | |
Commercial mortgage backed securities | | | 142 | | | | 140 | | | | 139 | | | | 138 | |
Residential mortgage backed securities | | | 650 | | | | 892 | | | | 455 | | | | 655 | |
Other asset-backed securities | | | — | | | | 461 | | | | — | | | | 453 | |
| | | | | | | | | | | | | | | | |
| | | 792 | | | | 1,888 | | | | 594 | | | | 1,639 | |
| | | | | | | | | | | | | | | | |
| | | | | | | | | | | | | | | | | | | | | | | | | | | | | | | | |
| | | Trading portfolio | | | Liquidity portfolio | | | Other | | | Total | |
| | | 2009 | | | 2008 | | | 2009 | | | 2008 | | | 2009 | | | 2008 | | | 2009 | | | 2008 | |
| | | $m | | | $m | | | $m | | | $m | | | $m | | | $m | | | $m | | | $m | |
Carrying amount by classification of underlying assets | | | | | | | | | | | | | | | | | | | | | | | | | | | | | | | | |
Sub-prime | | | — | | | | — | | | | — | | | | — | | | | — | | | | — | | | | — | | | | — | |
Alt-A | | | — | | | | — | | | | 273 | | | | 423 | | | | — | | | | — | | | | 273 | | | | 423 | |
A rated (mortgage) paper and other assets | | | 124 | | | | 161 | | | | 94 | | | | 106 | | | | 103 | | | | 949 | | | | 321 | | | | 1,216 | |
| | | | | | | | | | | | | | | | | | | | | | | | | | | | | | | | |
| | | 124 | | | | 161 | | | | 367 | | | | 529 | | | | 103 | | | | 949 | | | | 594 | | | | 1,639 | |
| | | | | | | | | | | | | | | | | | | | | | | | | | | | | | | | |
| | | | | | | | | | | | | | | | | | | | | | | | | | | | | | | | | | | | | | | | |
| | | | | | | | | | | | | | | | | | | | | BB and below inc | | | | | | | |
| | | AAA & AA | | | A | | | BBB | | | not rated | | | Total | |
| | | 2009 | | | 2008 | | | 2009 | | | 2008 | | | 2009 | | | 2008 | | | 2009 | | | 2008 | | | 2009 | | | 2008 | |
| | | $m | | | $m | | | $m | | | $m | | | $m | | | $m | | | $m | | | $m | | | $m | | | $m | |
Carrying amount by rating and location of underlying assets | | | | | | | | | | | | | | | | | | | | | | | | | | | | | | | | | | | | | | | | |
Australia and New Zealand | | | 226 | | | | 1,109 | | | | — | | | | — | | | | 1 | | | | 1 | | | | — | | | | — | | | | 227 | | | | 1,110 | |
United States | | | 94 | | | | 412 | | | | — | | | | 117 | | | | 73 | | | | — | | | | 200 | | | | — | | | | 367 | | | | 529 | |
| | | | | | | | | | | | | | | | | | | | | | | | | | | | | | | | | | | | | | | | |
| | | 320 | | | | 1,521 | | | | — | | | | 117 | | | | 74 | | | | 1 | | | | 200 | | | | — | | | | 594 | | | | 1,639 | |
| | | | | | | | | | | | | | | | | | | | | | | | | | | | | | | | | | | | | | | | |
| 1 | September 2008 comprises notes held in a credit protection SPE, refer page 88. |
Financial Report195
GLOSSARY
AAS –Australian Accounting Standards.
AASB –Australian Accounting Standards Board.
AFS– Available-for-sale assets.
AIFRS– Australian Equivalents to International Financial Reporting Standards.
Alt-A– Alternative A-paper, US mortgages underwritten with lower or alternative documentation than a full documentation mortgage loan or with higher loan to valuation ratios than mortgages guaranteed by US Government sponsored enterprises. Alt-A mortgages have a stronger risk profile than sub-prime mortgages.
APRA– Australian Prudential Regulation Authority.
Asia Pacific, Europe & America –Includes the following:
| • | | Retailwhich provides retail and small business banking services to customers in the Asia Pacific region. |
| • | | Asia Partnershipswhich is a portfolio of strategic retail partnerships in Asia. This includes partnerships or joint venture investments in Indonesia with P.T. Panin Bank, in the Philippines with Metrobank, in Cambodia with the Royal Group, in China with Bank of Tianjin and Shanghai Rural Commercial Bank, in Malaysia with AMMB Holdings Berhad and in Vietnam with Sacombank and Saigon Securities Incorporation. |
| • | | Wealthwhich includes investment and insurance products and services across Asia Pacific and under the Private Bank banner assisting customers in the Asia Pacific region to manage, grow and preserve their assets |
| • | | Executive & Supportwhich includes the central support functions for the division. |
| • | | Institutional Asia Pacific, Europe & Americamatrix reports to the Asia Pacific, Europe & America division and is referred to in the paragraph below entitled “Institutional”. |
| • | | Bangalorewhich includes operations, technology and shared services support services across all geographic regions. |
In August 2009, ANZ announced it had reached agreement with the Royal Bank of Scotland Group plc (“RBS”) to acquire selected RBS businesses in Asia. The acquisition of each business is subject to regulatory approvals, including local prudential regulatory approval, with completion and integration into the Asia Pacific, Europe &America Retail, Wealth and Institutional segments anticipated progressively from late 2009 calendar year.
Australia –Includes the following:
Retail
| • | | Retail Distributionoperates the Australian branch network, Australian call centre, specialist businesses (including specialist mortgage sales staff, mortgage broking and franchisees, direct channels (Mortgage Direct and One Direct)) and distribution services. |
| • | | Retail Productsis responsible for delivering a range of products including mortgages, cards, unsecured lending, transaction banking, savings and deposits: |
| | • | | Mortgages provide housing finance to consumers in Australia for both owner occupied and investment purposes. |
| | • | | Cards and Unsecured Lending provides consumer credit cards, ePayment products, personal loans and ATM facilities in Australia. |
| | • | | Deposits provide transaction banking and savings products, such as term deposits and cash management accounts. |
Commercial
| • | | Esandaprovides motor vehicle and equipment finance and investment products. |
| • | | Regional Commercial Bankingprovides a full range of banking services to personal customers and to small business and agribusiness customers in rural and regional Australia. |
| • | | Business Bankingprovides a full range of banking services, including risk management, to metropolitan based small to medium sized business clients with a turnover of up to A$50 million. |
| • | | Small Business Banking Productsprovides a full range of banking services for metropolitan-based small businesses in Australia with unsecured loans up to A$100,000. |
Institutional
| • | | A full range of financial services to institutional customers within Australia along the product lines of Transaction Banking, Markets and Specialised Lending. Also includes Balance Sheet Management and Relationship and Infrastructure. Refer detailed description of the Institutional business under the paragraph below entitled “Institutional”. |
Wealth
| • | | Private Bankspecialises in assisting high net worth individuals and families to manage, grow and preserve their family assets. |
| • | | Investments and Insurance Productscomprises Australia’s Financial Planning, Margin Lending, Insurance distribution and Trustees businesses in addition to ETrade, an online broking business. |
| • | | ING Australia Limited (“INGA”)is a joint venture between ANZBGL and the ING Group. ANZBGL owns 49% of INGA and receives proportional equity accounted earnings. |
Group Centre
| • | | Group Centreincludes the Australian portion of Operations, Technology & Shared Services, Treasury, Group Human Resources, Group Strategy, Group Financial Management, Group Risk Management and Group Items. |
Collective provisionis the provision for Credit Losses that are inherent in the portfolio but not able to be individually identified. A collective provision may only be recognised when a loss event has already occurred. Losses expected as a result of future events, no matter how likely, are not recognised.
Credit equivalentrepresents the calculation of on-balance sheet equivalents for market related items.
Customer Depositsrepresent term deposits, other deposits bearing interest, deposits not bearing interest and borrowing corporations debt excluding collateralised loan obligation and securitisation vehicle funding.
IFRS– International Financial Reporting Standards.
Impaired assetsare those financial assets where doubt exists as to whether the full contractual amount will be received in a timely manner, or where concessional terms have been provided because of the financial difficulties of the customer. Financial Assets are impaired if there is objective evidence of impairment as a result of a loss event that occurred prior to the reporting date, and that loss event has had impact, which can be reliably estimated, on the expected future cash flows of the individual asset or portfolio of assets.
196ANZ Annual Report 2009
GLOSSARY (Continued)
Impaired commitments and contingenciescomprises undrawn facilities and contingent facilities where the customer’s status is defined as impaired.
Impaired loans comprises drawn facilities where the customer’s status is defined as impaired.
Income includes external interest income and other external operating income.
Individual provision chargeis the amount of expected credit losses on those financial instruments assessed for impairment on an individual basis (as opposed to on a collective basis). It takes into account expected cash flow over the lives of those financial instruments.
INGA includes the equity accounted earnings from our 49% stake in ING Australia Ltd, a joint venture between ANZ and ING.
Institutionaldivision provides a full range of financial services to institutional customers in all geographies. Multinationals, institutions and corporates with sophisticated needs and multiple relationships are served globally. Institutional has a major presence in Australia and New Zealand and also has operations in Asia, Europe and the United States.
| • | | Transaction Banking provides working capital solutions including lending and deposit products, cash transaction banking management, trade finance, international payments, securities lending, clearing and custodian services principally to institutional and corporate customers. |
| • | | Global Marketsprovides risk management services to corporate and institutional clients globally in relation to foreign exchange, interest rates, credit and commodities. This includes the business providing origination, underwriting, structuring and risk management services, advice and sale of credit and derivative products globally. Markets also manages the Group’s interest rate risk position. |
| • | | Specialised Lending provides complex financing and advisory services, structured financial products, leasing, project finance, leveraged finance and infrastructure investment products to the Group’s global client set. |
| • | | Balance Sheet Management manages the Institutional and Corporate balance sheets with a particular focus on credit quality, diversification and maximising risk adjusted returns. |
| • | | Relationship and infrastructure includes client relationship teams for global institutional customers and corporate customers in Australia, and central support functions. |
Liquid assets are cash and cash equivalent assets. Cash equivalent assets are highly liquid investments with short periods to maturity, are readily convertible to cash at ANZ’s option and are subject to an insignificant risk of changes in value.
Net advances include gross loans and advances and acceptances and capitalised brokerage/mortgage origination fees, less income yet to mature and allowance for credit impairment.
Net interest average margin is net interest income as a percentage of average interest earning assets. Non-assessable interest income is grossed up to the equivalent before tax amount for the purpose of these calculations.
Net interest spread is the average interest rate received on interest earning assets less the average interest rate paid on interest bearing liabilities. Non-assessable interest income is grossed up to the equivalent before tax amount for the purpose of these calculations.
Net non-interest bearing items, which are referred to in the analysis of interest spread and net interest average margin, includes shareholders’ equity, impairment of loans and advances, deposits not bearing interest and other liabilities not bearing interest, offset by premises and equipment and other non-interest earning assets. Non-performing loans are included within interest bearing loans, advances and bills discounted.
Net tangible assetsequals share capital and reserves attributable to shareholders of the Group less preference share capital and unamortised intangible assets (including goodwill and software).
New Zealand –includes the following: New Zealand comprises three customer segments, Retail, Commercial and Institutional, a Wealth segment and an operations and support area which includes Treasury funding:
Retail
| • | | National Bank Retail, operating under the National Bank brand in New Zealand, provides a full range of banking services to personal and business banking customers. |
| • | | ANZ Retail, operating under the ANZ brand in New Zealand, provides a full range of banking services to personal and business banking customers. |
Commercial
| • | | Corporate & Commercial Banking incorporates the ANZBGL and ANZ National Bank brands and provides financial solutions through a relationship management model for medium-sized businesses with a turnover of up to NZ$150 million. |
| • | | Rural Banking provides a full range of banking services to rural and agribusiness customers. |
| • | | UDC provides motor vehicle and equipment finance, operating leases and investment products. |
Institutional
| • | | A full range of financial services to institutional customers within New Zealand along the product lines of Transaction Banking, Markets and Specialised Lending. Also includes Balance Sheet Management and Relationship and infrastructure. Refer detailed description of the Institutional business under the paragraph below entitled “Institutional”. |
Wealth
| • | | Private Banking includes the private banking operations under the ANZBGL and ANZ National Bank brands and Bonus Bonds. |
| • | | ING New Zealand Limited (“INGNZ”) is a joint venture between ANZBGL and ING. ANZBGL owns 49% of INGNZ and receives proportional equity accounted earnings. |
| • | | Operations and Support includes the back-office processing, customer account maintenance, and central support areas including Treasury funding. |
Non-core itemsare disclosed separately in the income statement to remove volatility from the underlying business result, and include significant items, and non-core income arising from the use of derivatives in economic hedges on fair value through profit and loss.
Glossary 197
GLOSSARY (continued)
Operating expenses exclude the provision for impairment of loans and advances charge.
Operating income in business segments includes net interest and other operating income.
Operations, Technology & Shared Services comprises the Group’s core support units responsible for operating the Group’s global technology platforms, development and maintenance of business applications, information security, the Group’s payments back-office processing, and the provision of other essential shared services to the Group, including property, people capital operations, procurement and outsourcing.
Overseas includes the results of all operations outside Australia, except if New Zealand is separately shown.
Overseas Markets (also known as Asia Pacific, Europe & America) includes all operations outside of Australia and New Zealand.
Repo discountis a discount applicable on the repurchase by a central bank of an eligible security pursuant to a repurchase agreement.
Restructured items refers to customers who have been provided concessions due to their financial difficulties. In the course of restructuring facilities, the following concessions might be considered: a reduction in the principal amount; a deferral of repayments; and/or an extension of the maturity date materially beyond those typically offered to new facilities with similar risk.
Revenue includes net interest income and other operating income.
Segment assets/liabilities represents total external assets/liabilities excluding deferred tax balances.
Segment result represents profit before income tax expense.
Segment revenue includes net interest income and other operating income.
Significant itemsare items that have a substantial impact on profit after tax, or the earnings used in the earnings per share calculation. Significant items also do not arise in the normal course of business and are infrequent in nature. Divestments are typically defined as significant items.
Sub-prime represents mortgages granted to borrowers with a poor or limited credit history. Sub-prime loans carry higher interest rates to compensate for potential losses from default.
Sub-standard assetsare customers that have demonstrated some operational and financial instability, with variablility and uncertainty in profitability and liquidity projected to continue over the short and possibly medium term.
Total advancesinclude gross loans and advances and acceptances less income yet to mature (for both as at and average volumes). Loans and advances classified as available-for-sale are excluded from total advances.
Underlying profit represents the directors’ assessment of the profit for the ongoing business activities of the Group, and is based on guidelines published by the Australian Institute of Company Directors and the Financial Services Institute of Australasia. ANZ applies this guidance by adjusting statutory profit for material items that are not part of the normal ongoing operations of the Group including one-off gains and losses, gains and losses on the sale of businesses, non-continuing businesses, timing differences on economic hedges, and acquisition related costs.
198ANZ Annual Report 2009
This page has been intentionally left blank
Glossary 199
ALPHABETICAL INDEX
| | | | |
Asset-Backed Securities | | | 195 | |
Assets Charged as Security for Liabilities and Collateral Accepted as Security for Assets | | | 125 | |
Associates | | | 164 | |
Available-for-sale Assets | | | 103 | |
Average Balance Sheet and Related Interest | | | 189 | |
Balance Sheets | | | 73 | |
Bonds and Notes | | | 115 | |
Capital Adequacy | | | 186 | |
Capital Management | | | 122 | |
Cash Flow Statements | | | 75 | |
Chairman’s Report | | | 2 | |
Chief Executive Officer’s Report | | | 4 | |
Chief Financial Officer’s Report | | | 6 | |
Commitments | | | 168 | |
Compensation of Auditors | | | 92 | |
Controlled Entities | | | 163 | |
Corporate Governance Statement | | | 52 | |
Credit Related Commitments, Guarantees, Contingent Liabilities and Contingent Assets | | | 169 | |
Critical Estimates and Judgements Used in Applying Accounting Policies | | | 88 | |
Current Income Tax Expense | | | 93 | |
Deposits and Other Borrowings | | | 113 | |
Derivative Financial Instruments | | | 97 | |
Directors’ Declaration | | | 184 | |
Directors’ Report | | | 18 | |
Dividends | | | 94 | |
Due from Other Financial Institutions | | | 96 | |
Earnings per Ordinary Share | | | 95 | |
Employee Share and Option Plans | | | 177 | |
Events Since the End of the Financial Year | | | 183 | |
Exchange Rates | | | 183 | |
Expenses | | | 91 | |
Fair Value of Financial Assets and Financial Liabilities | | | 151 | |
Fiduciary Activities | | | 167 | |
Financial Information | | | 186 | |
Financial Report | | | 72 | |
Financial Risk Management | | | 126 | |
Glossary of Financial Terms | | | 196 | |
Goodwill and Other Intangible Assets | | | 110 | |
| | | | |
Impaired Financial Assets | | | 105 | |
Income Statements | | | 72 | |
Income Tax Liabilities | | | 113 | |
Income | | | 90 | |
Independent Auditor’s Report | | | 185 | |
Interest Spreads and Net Interest Average Margins | | | 192 | |
Interests in Joint Venture Entities | | | 165 | |
Key Management Personnel Disclosures | | | 181 | |
Leveraged Finance | | | 194 | |
Liquid Assets | | | 96 | |
Loan Capital | | | 116 | |
Maturity Analysis of Assets and Liabilities | | | 158 | |
Minority Interests | | | 122 | |
Net Loans and Advances | | | 104 | |
Notes to the Cash Flow Statements | | | 161 | |
Notes to the Financial Statements | | | 76 | |
Other Assets | | | 111 | |
Payables and Other Liabilities | | | 114 | |
Premises and Equipment | | | 111 | |
Provision for Credit Impairment | | | 105 | |
Provisions | | | 114 | |
Remuneration Report | | | 23 | |
Reserves and Retained Earnings | | | 121 | |
Securitisations | | | 167 | |
Segment Analysis | | | 159 | |
Share Capital | | | 119 | |
Shareholder Information | | | 68 | |
Shares in Controlled Entities, Associates and Joint Venture Entities | | | 108 | |
Significant Accounting Policies | | | 76 | |
Special Purpose and Off-Balance Sheet Entities | | | 193 | |
Statements of Recognised Income and Expense | | | 74 | |
Superannuation and Other Post Employment Benefit Schemes | | | 173 | |
Tax Assets | | | 109 | |
Ten Year Summary | | | 16 | |
Trading Securities | | | 96 | |
Transactions with Other Related Parties | | | 182 | |
200ANZ Annual Report 2009