Exhibit 99.1


WHO WE ARE AND HOW WE OPERATE
ANZ’s history of expansion and growth stretches over 175 years. We have a strong franchise in Retail, Commercial and Institutional banking in our home markets of Australia and New Zealand and we have been operating in Asia Pacific for more than 30 years.
Today, ANZ operates in 32 markets globally. We are the third largest bank in Australia, the largest banking group in New Zealand and the Pacific, and among the top 20 banks in the world. |
 |
OUR SUPER REGIONAL STRATEGY
» Strengthening our business in Australia, New Zealand and the Pacific, while establishing a significant presence in key markets in Asia.
» Building connectivity to support customers who are operating increasingly within and across our region.
» Providing our customers with the right financial solutions and insights to help them progress.
» Growing and strengthening the bank by diversifying our earnings.
|


| 2012 | 2011 | |||||||
Profitability | ||||||||
Profit attributable to shareholders of the Company ($m) | 5,661 | 5,355 | ||||||
Underlying profit1 ($m) | 6,011 | 5,652 | ||||||
Return on: | ||||||||
Average ordinary shareholders’ equity2 | 14.6% | 15.3% | ||||||
Average ordinary shareholders’ equity (underlying profit basis)1,2 | 15.6% | 16.2% | ||||||
Average assets3 | 0.90% | 0.94% | ||||||
Net interest margin3 | 2.31% | 2.42% | ||||||
Net interest margin (excluding Global Markets)3 | 2.71% | 2.80% | ||||||
Underlying profit per average FTE ($)1,4 | 122,681 | 116,546 | ||||||
Efficiency ratios | ||||||||
Operating expenses to operating income | 48.1% | 47.4% | ||||||
Operating expenses to average assets3 | 1.36% | 1.40% | ||||||
Operating expenses to operating income (underlying)1 | 45.6% | 45.9% | ||||||
Operating expenses to average assets (underlying)1,3 | 1.28% | 1.35% | ||||||
Credit impairment provisioning | ||||||||
Collective provision charge/(release) ($m) | (379 | ) | 7 | |||||
Individual provision charge ($m) | 1,577 | 1,230 | ||||||
Total provision charge ($m) | 1,198 | 1,237 | ||||||
Individual provision charge as a % of average net advances | 0.38% | 0.32% | ||||||
Total provision charge as a % of average net advances | 0.29% | 0.32% | ||||||
Ordinary share dividends | ||||||||
Interim – 100% franked (cents) | 66 | 64 | ||||||
Final – 100% franked (cents) | 79 | 76 | ||||||
Total dividend (cents) | 145 | 140 | ||||||
Ordinary share dividend payout ratio5 | 69.3% | 68.6% | ||||||
Underlying ordinary share dividend payout ratio1,5 | 65.3% | 65.0% | ||||||
Preference share dividend ($m) | ||||||||
Dividend paid6 | 11 | 12 | ||||||
| 1 | Profit has been adjusted for certain non-core items to arrive at underlying profit, the result for the ongoing business activities of the Group. These adjustments have been determined on a consistent basis with those made in prior years. The adjustments made in arriving at underlying profit are included in statutory profit which is subject to audit within the context of the Group statutory audit opinion. Underlying profit is not audited, however, the external auditor has informed the Audit Committee that the adjustments, and the presentation thereof, are based on the guidelines released by the Australian Institute of Company Directors (AICD) and the Financial Services Institute of Australasia (FINSIA), and have been determined on a consistent basis with those made in prior years. Refer to page 204 to 206 for analysis of the adjustments between statutory profit and underlying profit. |
| 2 | Average ordinary shareholders’ equity excludes non-controlling interests and preference shares. |
| 3 | Comparative information has been restated to reflect the impact of the current period reporting treatment of derivative related collateral posted/received and the associated interest income/expense. Refer to note 1 of the financial statement for further details. |
| 4 | Comparative amounts have changed reflecting an amendment to FTE to align to the current year methodology. |
| 5 | The 2012 dividend payout ratio is calculated using the March 2012 interim and the proposed September 2012 final dividend. The 2011 dividend payout ratio is calculated using the March 2011 interim and September 2011 final dividend. |
| 6 | Represents dividends paid on Euro Trust Securities issued on 13 December 2004. |
FINANCIAL HIGHLIGHTS  5
5

I am pleased to report that ANZ’s statutory profit after tax for the year ended 30 September 2012 was $5.7 billion, up 6%. This good performance reflected continued progress with our super regional strategy which saw growth across our key businesses in Australia, New Zealand and Asia Pacific, together with renewed focus on cost management.
The final dividend of 79 cents per share brings the total dividend for the year to 145 cents per share fully franked, an increase of 4%.
Our capital position remains strong, placing ANZ among the world’s best capitalised banks and we remain one of only a small number of banks globally which have maintained a AA rating from all three credit ratings agencies.
Super Regional Strategy
Over the past five years we have had a consistent focus on creating the region’s best connected and most respected bank.
2012 has been another year of achievement. In Asia, we continued to invest. For example, in our subsidiary bank in China we increased capital to support growth. Greater China, including Hong Kong and Taiwan, is now ANZ’s largest market outside Australia and New Zealand. We also opened our first Malaysian branch in Labuan.
In Australia and New Zealand, our largest markets, we also continued to invest in customer service and innovation, and in leveraging connectivity with our international network. This is increasingly a source of differentiation, particularly in Commercial and Institutional banking.
At the same time, we have increased our focus on simplifying the bank and on containing cost growth. Alistair Currie was appointed to the role of Group Chief Operating Officer to deliver a more integrated approach to technology, shared services and operations. In New Zealand, we made significant progress with our simplification program, including our migration to one banking and technology platform, a decision to move to a single brand.
Customers, our People and the Community
Since the onset of the global financial crisis, the reputation of banks throughout the world has been challenged. Although Australian banks have remained strong throughout this period, we have also had to face up to community concerns about our industry and increase our efforts with customers and with the wider community.
As we made structural changes to our business in 2012 to adjust to the more difficult operating environment, our leading position on retail customer satisfaction slipped in Australia but has since regained momentum. Although we have maintained strong customer satisfaction in New Zealand, management refocused their efforts on improving satisfaction in Australia. There was early recognition of our
| 1 | Money magazine Bank of the Year and Home Lender of the Year. AFR Capital Business Bank of the Year 2012. Top 5 Corporate Bank, Greenwich Associates Survey 2012. |
progress with ANZ receiving awards1 as Bank of the Year, Mortgage Lender of the Year and Business Bank of the Year in 2012.
We were also pleased to be recognised for our long-term commitment to building the money management skills and savings of disadvantaged groups, receiving two major awards at the MoneySmart Week Awards in Australia.
Throughout 2012, we have continued to equip our people for high performance, continuing to support them to make ethically, socially and environmentally responsible decisions while promoting their wellbeing.
We have linked ANZ’s super regional strategy to our corporate responsibility framework and continued to work with stakeholders to guide our activities. This includes reviewing and improving our responsible lending practices which have been built into our training programs.
ANZ was ranked the most sustainable bank globally in the 2012 Dow Jones Sustainability Index.
Outlook
The global economy is softening as we enter our 2013 financial year with many European economies contracting and the United States continuing to recover slowly.
Although China’s economy is also in a managed slow-down we expect it will continue to grow at 7–8% in 2013. This will see Asia remain the best performing region in the world. In Australia and New Zealand consumer and business confidence remains weak and growth during 2013 is expected to be around 2.7% and 2.5% respectively.
Although the year ahead looks challenging with headwinds in a number of areas, ANZ’s unique strategy and the momentum we have in adapting to the new environment means for banks we are well placed to deliver value to our shareholders, our customers and the community.
Finally, on behalf of shareholders, I would like to acknowledge the commitment and dedication of our management team and of all our 48,000 staff who have worked so hard in 2012. My thanks also go to my fellow Directors for their commitment and support during the year.

JOHN MORSCHEL
CHAIRMAN
| 6 |

ANZ has delivered another good performance1 in 2012 through a consistent focus on delivering our super regional strategy by strengthening our domestic businesses in Australia, New Zealand and the Pacific while driving significant growth in Asia.
Revenue grew 5% with market share gains across key segments and geographies. We continued to invest in our strategy and future growth with costs up by 4%, but at the same time we have increased our focus on productivity which saw cost growth trend lower during the year.
Our focus on costs resulted in significant change across ANZ which impacted many of our staff and so I am pleased to report that employee engagement remained steady at 70%. Our aim remains to reach global best-in-class standards through a bank-wide commitment to customer service and to ensure ANZ is a great place to work.
Divisional Performance
In the Australia Division we produced a solid result with profit up 4% benefiting from market share gains, tighter management of margins and a strong productivity focus. Retail lending grew 7% while average deposits grew at 12%. Commercial also performed well, with average growth in customer numbers and continued leverage of our regional capabilities.
Profit grew 3% in the International and Institutional Banking Division. The division continues to grow and diversify its earnings by geography, product and customer with 43% of revenue and 54% deposits now derived from outside Australia and New Zealand. This includes significant growth in many of our priority segments based on the connectivity of our international network, although this was offset by softer demand for loans and significant margin contraction in Australia.
New Zealand delivered a good performance with profit up 12%. Business simplification showed benefits with improved financial results based on productivity improvements and market share growth in key segments. We also announced we would move to one brand in New Zealand – the ANZ brand, and in late October 2012 we reached a significant milestone when we moved to a single technology platform.
Profit from the newly-formed Global Wealth and Private Banking Division was flat, in line with market conditions, however we saw improving performance trends during the year, particularly in insurance and investment earnings, and through productivity gains.
Credit quality was stable with ANZ’s provision charge of $1.25 billion broadly in line with 2011 and the Group’s provision coverage remains strong.
Our Strategy and the Environment for Banking
While ANZ delivered a good performance in 2012, just as important has been our strategic progress.
Five years ago, we articulated an ambition to create value for our shareholders, our customers and the wider community by becoming a super regional bank – a bank of global quality with regional focus. This included an aspiration to source 20% of our revenues from outside Australia and New Zealand.
I am pleased to report, despite having endured the global financial crisis, our network in Asia Pacific, Europe and America contributed 21% of Group revenue in 2012.
To deliver this outcome, the scale of transformation has been significant involving a systematic and coordinated program of action in every area of the bank. In our separate Shareholder Review we have provided a five-year progress report showing how we have strengthened ANZ in our key domestic markets in Australia and New Zealand while building a much bigger business in the growth markets of Asia Pacific.
While we have made significant progress, the journey is not over. We have set new aspirations which will see further growth, particularly in Asia, while also adapting the bank to the post-financial-crisis world.
We believe the lower growth business environment that we have seen following the financial crisis will be with us for the foreseeable future. We have been actively responding to these fast-changing and challenging conditions in different markets by driving both growth and productivity.
Our 2012 results highlight that after five years, ANZ’s super regional strategy has growing momentum. ANZ has moved from being a largely domestic bank to an integrated and growing, regionally focused international bank that is increasingly delivering differentiated value and performance.

MICHAEL SMITH
CHIEF EXECUTIVE OFFICER
| 1 | All figures on an underlying basis unless noted otherwise. |
CHAIRMAN’S REPORT AND CHIEF EXECUTIVE OFFICER’S REPORT 7
Principal Activities
The Group provides a broad range of banking and financial products and services to retail, small business, corporate and institutional clients.
The Group conducts its operations primarily in Australia, New Zealand and the Asia Pacific region. It also operates in a number of other countries including the United Kingdom and the United States.
The Group operates on a divisional structure with Australia, International and Institutional Banking, New Zealand and Global Wealth and Private Banking being the major operating divisions.
At 30 September 2012, the Group had 1,337 branches and other points of representation worldwide excluding Automatic Teller Machines (ATMs).
Results
Consolidated profit after income tax attributable to shareholders of the Company was $5,661 million, an increase of 6% over the prior year.
Operating income growth of $779 million or 5% was primarily driven by higher net interest income following a 10% increase in average interest earning assets, partially offset by an 11 basis point decline in net interest margin. Operating expenses increased $496 million or 6%, impacted by a software impairment charge of $274 million and an increase in restructuring expenses of $126 million.
Provision for credit impairment decreased by $39 million or 3% with improvements across the Australia and New Zealand divisions.
Balance sheet growth was strong with total assets increasing by $37.9 billion (6%) and total liabilities increasing by $34.6 billion (6%). Movements within the major components include:
| n | Net loans and advances increased by $30.5 billion (8%) primarily driven by above system housing lending growth of $12.2 billion (7%) in the Australia division and growth of $10.4 billion (11%) in International and Institutional Banking, mainly in Global Loans and Transaction Banking. |
| n | Growth in customer deposits of $31.1 billion (10%) was concentrated in the second half, and reflected growth in Australia of $13.8 billion (11%), growth in International and Institutional Banking of $13.0 billion (10%) driven by strong momentum in Asia Pacific, Europe and America (APEA) and strong customer deposit growth in New Zealand of $3.7 billion (10%) driven by Retail and Small Business Banking. |
Further details are contained on pages 55 to 61 of this Annual Report.
State of Affairs
In the Directors’ opinion there have been no significant changes in the state of affairs of the Group during the financial year.
Further review of matters affecting the Group’s state of affairs is also contained in the Review of Operating Results on pages 55 to 61 of this Annual Report.
Dividends
The Directors propose that a fully franked final dividend of 79 cents per fully paid ordinary share will be paid on 19 December 2012. The proposed payment amounts to approximately $2,149 million.
During the financial year, the following fully franked dividends were paid on fully paid ordinary shares:
| Type | Cents per share | Amount before bonus option plan adjustment $m | Date of payment | |||||||
Final 2011 | 76 | 2,002 | 16 December 2011 | |||||||
Interim 2012 | 66 | 1,769 | 2 July 2012 | |||||||
The proposed final dividend of 79 cents together with the interim dividend of 66 cents brings total dividends in relation to the year ended 30 September 2012 to 145 cents fully franked.
Further details of dividends provided for or paid during the year ended 30 September 2012 on ANZ’s ordinary and preference shares are set out in notes 7, 29 and 30 to the financial statements.
Review of Operations
A review of the Group during the financial year and the results of those operations, including an assessment of the financial position and business strategies of the Group, is contained in the Chairman’s Report, the Chief Executive Officer’s Report and the Review of Operating Results of this Annual Report.
8

Events Since the End of the Financial Year
There were no significant events from 30 September 2012 to the date of this report.
Future Developments
Details of likely developments in the operations of the Group and its prospects in future financial years are contained in this Annual Report under the Chairman’s Report and Chief Executive Officer’s Report. In the opinion of the Directors, disclosure of any further information would be likely to result in unreasonable prejudice to the Group.
Environmental Regulation
The Company recognises the expectations of its stakeholders – customers, shareholders, staff and the community – to operate in a way that mitigates the Company’s environmental impact.
The Company sets and reports against public targets regarding its environmental performance.
The Company is subject to two relevant pieces of legislation. The Company’s operations in Australia are categorised as a ‘high energy user’ under the Energy Efficiency Opportunities Act 2006 (Cth) (EEO). The Company has a mandatory obligation to identify energy efficiency opportunities and report to the Australian Federal Government progress with the implementation of the opportunities identified. As required under the legislation, the Company completed its first five-year assessment cycle through submission of its final report in December 2011. It has now commenced the second five-year cycle of the program and is required to submit an updated assessment plan by December 2012 that assesses cost-effective opportunities across 90% of its usage. The Company complies with its obligations under the EEO.
The National Greenhouse Energy Reporting Act 2007 (Cth) has been designed to create a national framework for energy and associated greenhouse gas emissions reporting. The Act makes registration and reporting mandatory for corporations whose energy production, energy use, or greenhouse gas emissions trigger the specified corporate or facility threshold. The Company is over the corporate threshold defined within this legislation and as a result was required to submit its first report on 31 October 2009. Subsequent reports have been submitted in 2010, 2011 and 2012.
The Company’s operations are not subject to any site specific or license requirements which could be considered particular or significant environmental regulation under any law of the Australian Commonwealth Government or of any state or territory thereof.
The Company may become subject to environmental regulation as a result of its lending activities in the ordinary course of business. The Company has developed policies to manage such environmental risks.
Having made due enquiry, and to the best of the Company’s knowledge, no entity of the Group has incurred any material environmental liability during the year.
Further details on the Company’s environmental performance, including progress against its targets and details of its emissions profile, are available on anz.com > About us > Corporate Responsibility.
Directors’ Qualifications, Experience
and Special Responsibilities
At the date of this report, the Board comprises eight Non-Executive Directors who have a diversity of business and community experience and one Executive Director, the Chief Executive Officer, who has extensive banking experience. The names of Directors and details of their skills, qualifications, experience and when they were appointed to the Board are contained on pages 37 to 40 of this Annual Report.
Details of the number of Board and Board Committee meetings held during the year, Directors’ attendance at those meetings and details of Directors’ special responsibilities, are shown on pages 37 to 49 of this Annual Report. No Directors retired during the 2012 financial year.
Details of directorships of other listed companies held by each current Director in the three years prior to the end of the 2012 financial year are listed on pages 37 to 40.
| DIRECTOR’S REPORT 9 |

Company Secretaries’ Qualifications
and Experience
Currently there are two people appointed as Company Secretaries of the Company. Details of their roles are contained on page 44. Their qualifications and experience are as follows:
| n | Bob Santamaria, BCom, LLB (Hons) |
Group General Counsel.
Mr Santamaria joined ANZ in 2007. He had previously been a Partner at the law firm Allens Arthur Robinson since 1987. He was Executive Partner Corporate, responsible for client liaison with some of Allens Arthur Robinson’s largest corporate clients.
Mr Santamaria brings to ANZ a strong background in leadership of a major law firm, together with significant experience in securities, mergers and acquisitions. He holds a Bachelor of Commerce and Bachelor of Laws (Honours) from the University of Melbourne. He is also an Affiliate of Chartered Secretaries Australia.
| n | John Priestley, BEc, LLB, FCIS |
Company Secretary.
Mr Priestley, a qualified lawyer, joined ANZ in 2004. Prior to ANZ, he had a long career with Mayne Group and held positions which included responsibility for the legal, company secretarial, compliance and insurance functions. He is a Fellow of Chartered Secretaries Australia and also a member of Chartered Secretaries Australia’s National Legislation Review Committee.
Non-audit Services
The Company’s Stakeholder Engagement Model for Relationship with the External Auditor (which incorporates requirements of the Corporations Act 2001) states that the external auditor may not provide services that are perceived to impair or impact the independence of the external auditor or be in conflict with the role of the external auditor. These include consulting advice and sub-contracting of operational activities normally undertaken by management, and engagements where the external auditor may ultimately be required to express an opinion on their own work.
Specifically the Stakeholder Engagement Model:
| n | limits the non-audit services that may be provided; |
| n | requires that audit, audit-related and permitted non-audit services must be pre-approved by the Audit Committee, or pre-approved by the Chairman of the Audit Committee (or up to a specified amount by a limited number of authorised senior members of management) and notified to the Audit Committee; and |
| n | requires the external auditor to not commence any engagement for the Group, until the Group has confirmed that the engagement has been pre-approved. |
Further details about the Stakeholder Engagement Model can be found in the Corporate Governance Statement on page 49.
The Audit Committee has reviewed a summary of non-audit services provided by the external auditor for 2012, and has confirmed that the provision of non-audit services for 2012 is consistent with the Stakeholder Engagement Model and compatible with the general standard of independence for external auditors imposed by the Corporations Act 2001. This has been formally advised by the Audit Committee to the Board of Directors.
The external auditor has confirmed to the Audit Committee that they have:
| n | implemented procedures to ensure they comply with independence rules both in Australia and the United States (US); and |
| n | complied with domestic policies and regulations, together with the regulatory requirements of the US Securities and Exchange Commission (SEC), and ANZ’s policy regarding the provision of non-audit services by the external auditor. |
The non-audit services supplied to the Group by the Group’s external auditor, KPMG, and the amount paid or payable by the Group by type of non-audit service during the year ended 30 September 2012 are as follows:
| Amount paid/payable $’000’s | ||||||||
| Non-audit services | 2012 | 2011 | ||||||
Review of Wealth internal capital adequacy assessment process | 83 | – | ||||||
Benchmarking review of Wealth IT data centre transfer | 75 | – | ||||||
Review application of new Australian consumer cards legislation | 50 | – | ||||||
Regulatory benchmarking review (Taiwan) | 49 | – | ||||||
Review of accounts in relation to potential divestment | 35 | – | ||||||
Accounting advice | 28 | 5 | ||||||
Assist with Taiwanese brokerage license application | 11 | – | ||||||
Group collective provision review (on behalf of APRA) | – | 101 | ||||||
Wealth managed investment schemes distribution model review | – | 81 | ||||||
Review of Wealth scrip for scrip audit validation model and trust voting analysis models | – | 46 | ||||||
Wealth R&D claim review | – | 40 | ||||||
Review output from Group counterparty credit risk review project | – | 20 | ||||||
Presentations | – | 18 | ||||||
Solomon Islands prudential standard impact assessment | – | 11 | ||||||
Training courses in China | – | 9 | ||||||
Witness branch transfer of deposit boxes in Singapore
|
| –
|
|
| 4
|
| ||
Total | 331 | 335 | ||||||
Further details on the compensation paid to KPMG is provided in note 5 to the financial statements. Note 5 also provides details of audit-related services provided during the year of $4.313 million (2011: $4.444 million).
For the reasons set out above, the Directors are satisfied that the provision of non-audit services by the external auditor during the year ended 30 September 2012 is compatible with the general standard of independence for external auditors imposed by the Corporations Act 2001.
10

Directors and Officers who were previously Partners
of the Auditor
Mr Marriott, the Company’s Chief Financial Officer up to 31 May 2012, was a Partner of KPMG at a time when KPMG was the auditor of the Company. In particular, Mr Marriott was a Partner in the Melbourne office of the then KPMG Peat Marwick prior to joining the Company in 1993.
Chief Executive Officer/Chief Financial Officer
Declaration
The Chief Executive Officer and the Chief Financial Officer have given the declarations to the Board concerning the Group’s financial statements and other matters as required under section 295A(2) of the Corporations Act 2001 and Recommendation 7.3 of the ASX Corporate Governance Principles and Recommendations.
Directors’ and Officers’ Indemnity
The Company’s Constitution (Rule 11.1) permits the Company to indemnify each officer or employee of the Company against liabilities (so far as may be permitted under applicable law) incurred in the execution and discharge of the officer’s or employee’s duties. It is the Company’s policy that its employees should not incur any liability to any third party as a result of acting in the course of their employment, subject to appropriate conditions.
Under the policy, the Company will indemnify employees against any liability they incur in carrying out their role. The indemnity protects employees and former employees who incur a liability when acting as an employee, trustee or officer of the Company, another corporation or other body at the request of the Company or a related body corporate.
The indemnity is subject to applicable law and in addition will not apply to liability arising from:
| n | serious misconduct, gross negligence or lack of good faith; |
| n | illegal, dishonest or fraudulent conduct; or |
| n | material non-compliance with the Company’s policies, processes or discretions. |
The Company has entered into Indemnity Deeds with each of its Directors, with certain secretaries and former Directors of the Company, and with certain employees and other individuals who act as directors or officers of related bodies corporate or of another company. To the extent permitted by law, the Company indemnifies the individual for all liabilities, including costs, damages and expenses incurred in their capacity as an officer of the company to which they have been appointed.
The Company has indemnified the trustees and former trustees of certain of the Company’s superannuation funds and directors, former directors, officers and former officers of trustees of various Company sponsored superannuation schemes in Australia. Under the relevant Deeds of Indemnity, the Company must indemnify each indemnified person if the assets of the relevant fund are insufficient to cover any loss, damage, liability or cost incurred by the indemnified person in connection with the fund, being loss, damage, liability or costs for which the indemnified person would have been entitled to be indemnified out of the assets of the fund in accordance with the trust deed and the Superannuation Industry (Supervision) Act 1993. This indemnity survives the termination of the fund. Some of the indemnified persons are or were Directors or executive officers of the Company.
The Company has also indemnified certain employees of the Company, being trustees and administrators of a trust, from and against any loss, damage, liability, tax, penalty, expense or claim of any kind or nature arising out of or in connection with the creation, operation or dissolution of the trust or any act or omission performed or omitted by them in good faith and in a manner that they reasonably believed to be within the scope of the authority conferred by the trust.
Except for the above, neither the Company nor any related body corporate of the Company has indemnified or made an agreement to indemnify any person who is or has been an officer or auditor of the Company against liabilities incurred as an officer or auditor of the Company.
During the financial year, the Company has paid premiums for insurance for the benefit of the directors and employees of the Company and related bodies corporate of the Company. In accordance with common commercial practice, the insurance prohibits disclosure of the nature of the liability insured against and the amount of the premium.
Rounding of Amounts
The Company is a company of the kind referred to in Australian Securities and Investments Commission class order 98/100 (as amended) pursuant to section 341(1) of the Corporations Act 2001.
As a result, amounts in this Directors’ Report and the accompanying financial statements have been rounded to the nearest million dollars except where otherwise indicated.
DIRECTORS’ REPORT 11

Key Management Personnel and Employee Share
and Option Plans
Details of equity holdings of Non-Executive Directors, the Chief Executive Officer and Disclosed Executives during the 2012 financial year and as at the date of this report are detailed in note 46 of the financial statements.
Details of options/rights issued over shares granted to the Chief Executive Officer and Disclosed Executives during the 2012 financial year and as at the date of this report are detailed in the Remuneration Report.
Details of options/rights issued over shares granted to employees and on issue as at the date of this report are detailed in note 45 of the 2012 financial statements.
Details of shares issued as a result of the exercise during the 2012 financial year of options/rights granted to employees are detailed in note 45 of the 2012 financial statements.
Other details about the share options/rights issued, including any rights to participate in any share issues of the Company, are set out in note 45 of the 2012 financial statements. No person entitled to exercise any option/right has or had, by virtue of an option/right, a right to participate in any share issue of any other body corporate. The names of all persons who currently hold options/rights are entered in the register kept by the Company pursuant to section 170 of the Corporations Act 2001. This register may be inspected free of charge.
Lead Auditor’s Independence Declaration
The lead auditor’s independence declaration given under section 307C of the Corporations Act 2001 is set out below and forms part of this Directors’ Report for the year ended 30 September 2012.
THE AUDITOR’S INDEPENDENCE DECLARATION
Lead Auditor’s Independence Declaration under Section 307C of the Corporations Act 2001
To: the Directors of Australia and New Zealand Banking Group Limited
I declare that, to the best of my knowledge and belief, in relation to the audit for the financial year ended 30 September 2012, there have been:
(i) no contraventions of the auditor independence requirements as set out in the Corporations Act 2001 in relation to the audit; and
(ii) no contraventions of any applicable code of professional conduct in relation to the audit.
 |  | |
| KPMG | Andrew Yates | |
| Partner | ||
| Melbourne | ||
| 5 November 2012 | ||
12

Contents
| 1 | Basis of Preparation | 14 | ||||||
| 2 | Key Management Personnel | 14 | ||||||
| 3 | Role of the Board in Remuneration | 15 | ||||||
| 4 | HR Committee Activities | 15 | ||||||
| 5 | Remuneration Strategy and Objectives | 16 | ||||||
| 6 | The Composition of Remuneration at ANZ | 16 | ||||||
| 6.1 | Fixed Remuneration | 18 | ||||||
| 6.2 | Variable Remuneration | 18 | ||||||
| 6.2.1 Short Term Incentives | 18 | |||||||
| 6.2.2 Long Term Incentives | 19 | |||||||
| 6.3 | Other Remuneration Elements | 20 | ||||||
| 7 | Linking Remuneration to Balanced Scorecard Performance | 21 | ||||||
| 7.1 | ANZ Performance | 21 | ||||||
| 7.2 | STI – Performance and Outcomes | 22 | ||||||
| 8 | 2012 Remuneration | 23 | ||||||
| 8.1 | Non-Executive Directors (NEDs) | 23 | ||||||
| 8.2 | Chief Executive Officer (CEO) | 25 | ||||||
| 8.3 | Disclosed Executives | 27 | ||||||
| 8.4 | Remuneration Tables – CEO and Disclosed Executives | 30 | ||||||
| Non Statutory Remuneration Table | 30 | |||||||
| Statutory Remuneration Table | 32 | |||||||
| 8.5 | STI – Performance and STI Correlation | 34 | ||||||
| 9 | Equity | 34 | ||||||
| 9.1 | Equity Valuations | 34 | ||||||
| 9.2 | Legacy LTI Program | 35 | ||||||
REMUNERATION REPORT 13

1. Basis of Preparation
This Directors’ Remuneration Report has been prepared in accordance with section 300A of the Corporations Act 2001 for the Company and the consolidated entity for 2011 and 2012. Information in Table 6: Non Statutory Remuneration has been prepared in accordance with the presentation basis set out in Section 8.4. The information provided in this Remuneration Report has been audited as required by section 308(3C) of the Corporations Act 2001, unless indicated otherwise, and forms part of the Directors’ Report.
The Directors’ Remuneration Report is designed to provide shareholders with an understanding of ANZ’s remuneration policies and the link between our remuneration approach and ANZ’s performance, in particular regarding Key Management Personnel (KMP) as defined under the Corporations Act 2001. Individual outcomes are provided for ANZ’s Non-Executive Directors (NEDs), the Chief Executive Officer (CEO) and Disclosed Executives (current and former).
The Disclosed Executives are defined as those direct reports to the CEO with key responsibility for the strategic direction and management of a major revenue generating Division or who control material revenue and expenses that fall within the definition of KMP of the Company and of the Group.
2. Key Management Personnel (KMP)
The KMP disclosed in this year’s report are detailed in Table 1. A number of movements occurred during 2012 which are summarised as follows:
NEDs
| n | Effective 1 April 2012, Ms Paula Dwyer was appointed as a NED. |
DISCLOSED EXECUTIVES
| n | In November 2011 ANZ announced the retirement of Mr Chris Page, Chief Risk Officer (CRO), effective 16 December 2011, and confirmed the promotion of Mr Nigel Williams into the role of CRO immediately following Mr Page’s departure. |
| n | In February 2012 ANZ announced a number of senior management and organisational changes to accelerate its super regional strategy, support its growth and transformation, and strengthen succession planning within its senior leadership group. Effective 1 March 2012: |
| – | Mr Shayne Elliott was promoted from CEO Institutional to Chief Financial Officer (CFO) (CFO designate from 1 March until 31 May 2012), succeeding Mr Peter Marriott who concluded in the role on 31 May 2012. Mr Elliott also took on responsibility for Group Strategy and Mergers and Acquisitions (M&A). |
| – | Mr Alex Thursby was promoted from CEO Asia Pacific, Europe and America to CEO International and Institutional Banking which is focused on ANZ’s largest multi-national clients globally and the growth and transformation of ANZ’s international franchise. |
| – | Ms Joyce Phillips was promoted from Group Managing Director Strategy, M&A, Marketing and Innovation to a new role of CEO Global Wealth and Private Banking with responsibility for Wealth Management and Private Banking globally. Ms Phillips retained responsibility for Marketing, Innovation and Digital. |
TABLE 1: KEY MANAGEMENT PERSONNEL
Name
| Position
| Term as KMP
| ||
Non-Executive Directors (NEDs) | ||||
J Morschel | Chairman – Appointed Chairman March 2010 (Director October 2004) | Full Year | ||
G Clark | Director – Appointed February 2004 | Full Year | ||
P Dwyer | Director – Appointed 1 April 2012 | Part Year | ||
P Hay | Director – Appointed November 2008 | Full Year | ||
H Lee | Director – Appointed February 2009 | Full Year | ||
I Macfarlane | Director – Appointed February 2007 | Full Year | ||
D Meiklejohn | Director – Appointed October 2004 | Full Year | ||
A Watkins
| Director – Appointed November 2008
| Full Year
| ||
Chief Executive Officer (CEO) | ||||
M Smith | CEO | Full Year | ||
Disclosed Executives – Current | ||||
P Chronican | Chief Executive Officer, Australia | Full Year | ||
S Elliott | Chief Financial Officer – appointed 1 June 2012; Chief Financial Officer Designate from 1 March until 31 May 2012 | Full Year | ||
D Hisco | Chief Executive Officer, New Zealand – appointed 13 October 2010 | Full Year | ||
G Hodges | Deputy Chief Executive Officer | Full Year | ||
J Phillips | CEO Global Wealth and Private Banking – appointed 1 March 2012 | Part Year | ||
A Thursby | Chief Executive Officer, International & Institutional Banking – appointed 1 March 2012 | Full Year | ||
N Williams | Chief Risk Officer – appointed 17 December 2011 | Part Year | ||
Disclosed Executives – Former | ||||
P Marriott | Former Chief Financial Officer – concluded in role 31 May 2012, ceased employment 31 August 2012 | Part Year | ||
C Page
| Former Chief Risk Officer – retired 16 December 2011
| Part Year
| ||
14

3. Role of the Board in Remuneration
The Board Human Resources (HR) Committee is a Committee of the Board. The Board HR Committee is responsible for:
| n | reviewing and making recommendations to the Board in relation to remuneration governance, director and senior executive remuneration and senior executive succession; |
| n | specifically making recommendations to the Board on remuneration and succession matters related to the CEO, and individual remuneration arrangements for other key executives covered by the Group’s Remuneration Policy; |
| n | the design of significant incentive plans (such as the ANZ Employee Reward Scheme (ANZERS) and the Institutional Incentive Plan); and |
| n | remuneration structures for senior executives and others specifically covered by the Remuneration Policy. |
More details about the role of the HR Committee can be found on the ANZ website1.
The link between remuneration and risk is considered a key requirement by the Board, with Committee membership structured to ensure overlap of representation across the Board HR Committee and Board Risk Committee, with two Non Executive Directors currently on both committees.
Throughout the year the HR Committee and management received information from external providers (Ernst & Young, Freehills, Mercer (Australia) Pty Ltd, Hay Group and PricewaterhouseCoopers). This information related to remuneration market data and analysis, market practice on the structure and design of incentive programs (both short and long term), legislative requirements and interpretation of governance and regulatory requirements both in Australia and globally.
The HR Committee did not receive any recommendations from remuneration consultants during the year in relation to the remuneration arrangements of KMP. ANZ employs in house remuneration professionals who provide recommendations to the Board, taking into consideration information from external providers. The Board’s decisions were made independently using the information provided and having careful regard to ANZ’s strategic objectives and Remuneration Policy and principles.
4. HR Committee Activities
During 2012, the HR Committee met on five occasions, with remuneration matters a standing agenda item on each occasion. The HR Committee has a strong focus on the relationship between business performance, risk management and remuneration, with the following key activities occurring during the year:
| n | annual review of the effectiveness of the Remuneration Policy; |
| n | adjustment of the Short Term Incentive (STI) mandatory deferral threshold downward from $200,000 to $100,000. Refer to page 19 for more detail on STI mandatory deferral; |
| n | review of terms and conditions of key senior executive appointments and terminations; |
| n | engagement with APRA on remuneration compliance and application of the APRA Remuneration Standard; |
| n | involvement of the Risk function in remuneration regulatory and compliance related activities; and |
| n | monitoring of domestic and international regulatory and compliance matters relating to remuneration governance. |
| 1 | Go to anz.com, about us, our company, corporate governance, HR Committee Charter |
REMUNERATION REPORT 15

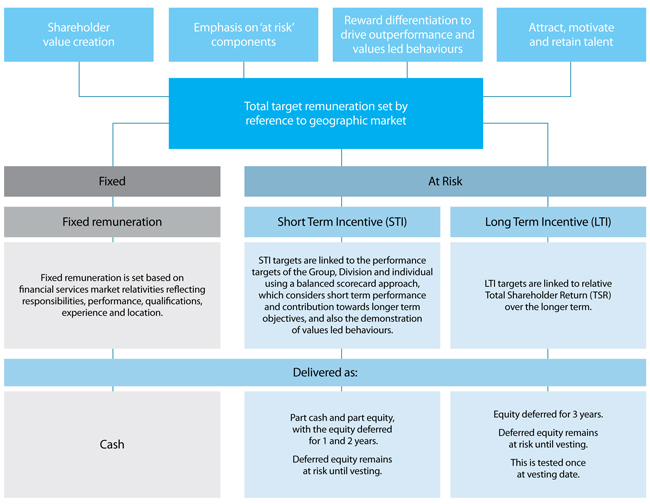
5. Remuneration Strategy and Objectives
ANZ’s remuneration strategies and initiatives shape the Group’s Remuneration Policy, which is approved by the Board. The following principles underpin ANZ’s Remuneration Policy, which is applied globally across ANZ:
| n | creating and enhancing value for all ANZ stakeholders; |
| n | emphasis on ‘at risk’ components of total rewards to increase alignment with shareholders and encourage behaviour that supports both the long term financial soundness and the risk management framework of ANZ, and to deliver superior long term total shareholder returns; |
| n | differentiated rewards in line with ANZ’s culture of rewarding for outperformance and demonstration of values led behaviours; and |
| n | provide a competitive reward proposition to attract, motivate and retain the highest quality individuals in order to deliver ANZ’s business and growth strategies. |
The key aspects of ANZ’s remuneration strategy for the CEO and Disclosed Executives are set out below:
REMUNERATION OBJECTIVES
6. The Composition of Remuneration at ANZ
The Board aims to find a balance between:
| n | fixed and at-risk remuneration; |
| n | short term and long term incentives; and |
| n | amounts paid in cash and deferred equity. |
Refer Figure 1 for an overview of the target remuneration mix for the CEO and Disclosed Executives.
16

FIGURE 1: ANNUAL TOTAL REWARD MIX PERCENTAGE (% BASED ON ‘AT TARGET’ LEVELS OF PERFORMANCE)
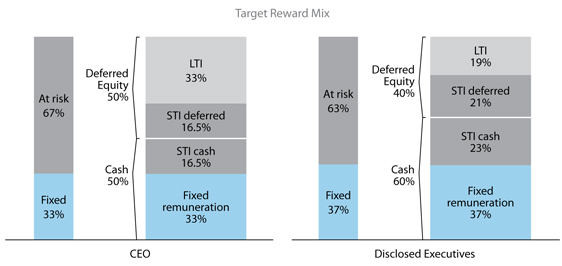
The CEO’s target remuneration mix is equally weighted between fixed remuneration, STI and LTI, with approximately half of total target remuneration payable in cash in the current year and half allocated as equity and deferred over one, two or three years. The deferred remuneration remains at risk until vesting date.
The target remuneration mix for Disclosed Executives is weighted between fixed remuneration (37%), STI (44%) and LTI (19%), with approximately 60% of total target remuneration payable in cash in the current year and 40% allocated as equity and deferred over one,
two or three years. The deferred remuneration remains at risk until vesting date. The Board has adopted this mix as the most effective reward mechanism to drive strong performance and value for the shareholder in both the short and longer term. In line with that, the STI balanced scorecard contains a combination of short and long term objectives. See page 22.
The following diagram demonstrates the time horizon associated with STI and LTI awards.
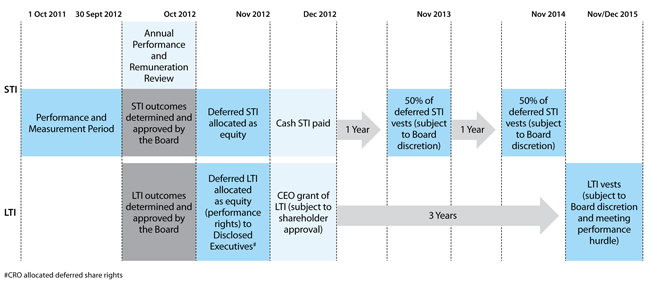
The reward structure for the CEO and Disclosed Executives is as detailed below. The only exception is the CRO whose remuneration arrangements have been structured differently to preserve the independence of this role and to minimise any conflicts of interest in carrying out the risk control function across the organisation.
The CRO’s role has a greater weighting on fixed remuneration with more limited STI leverage for individual performance and none (either positive or negative) for Group performance. LTI is delivered as unhurdled deferred share rights, with a three year time based hurdle, and is therefore not subject to meeting a TSR performance hurdle.
REMUNERATION REPORT 17

6.1 FIXED REMUNERATION
The fixed remuneration amount is expressed as a total dollar amount which can be taken as cash salary, superannuation contributions, and other nominated benefits.
ANZ positions fixed remuneration for the CEO and Disclosed Executives against the relevant financial services market (referencing both domestic and international financial services companies) and takes into consideration role responsibilities, performance, qualifications, experience and location. The financial services market is considered the most relevant comparator as this is the key pool for sourcing talent and where key talent may be lost.
6.2 VARIABLE REMUNERATION
Variable remuneration forms a significant part of the CEO’s and Disclosed Executives’ potential remuneration, providing at risk components that are designed to drive performance in the short, medium and long term. The term ‘variable remuneration’ within ANZ covers both the STI and LTI arrangements.
6.2.1 SHORT TERM INCENTIVES (STI)
The STI provides an annual opportunity for an incentive award. It is assessed against Group, Divisional and individual objectives based on a balanced scorecard of measures and positive demonstration of values led behaviours. Many of the measures relate to contribution towards medium to longer term performance outcomes aligned to ANZ’s strategic objectives as well as annual goals. For the CEO and Disclosed Executives, the weighting of measures in the balanced scorecard will vary to reflect the responsibilities of each role.
STI ARRANGEMENTS
| Purpose | The STI arrangements support ANZ’s strategic objectives by providing rewards that are significantly differentiated on the basis of achievement against annual performance targets coupled with demonstration of values led behaviours.
ANZ’s Employee Reward Scheme (ANZERS) structure and pool is reviewed by the HR Committee and approved by the Board. The size of the overall pool is based on an assessment of the balanced scorecard of measures of the Group. This pool is then distributed between the different Divisions based on their relative performance against a balanced scorecard of quantitative and qualitative measures.
| |||
Performance targets | In order to focus on achieving individual, Divisional and Group performance objectives a mix of quantitative and qualitative short, medium and long term measures are assessed. Examples of these are given below and further detail is provided on page 22, Section 7.2, STI – Performance and Outcomes: | |||
n |
Finance – profit, capital and liquidity, return on equity, core funding ratio and cost to income ratio; | |||
| n |
Customer – customer satisfaction and market share; | |||
| n |
Shareholder returns – total shareholder returns and credit rating; | |||
| n |
People – employee engagement, leadership and diversity; | |||
| n |
Connectivity – growth in Asia Pacific, Europe and America; and | |||
| n |
Process/risk – risk management, audit and compliance measures/standards. | |||
Targets are set considering prior year performance, industry standards and ANZ’s strategic agenda. Many of the measures also focus on targets which are set for the current year in the context of progress towards longer term goals. The specific targets and features relating to all these measures have not been provided in detail due to their commercial sensitivity.
The validation of performance and achievements against these objectives for:
| ||||
| n | the CEO involve an independent review and endorsement by the CRO and CFO, followed by review and endorsement by the HR Committee with final outcomes approved by the Board; and | |||
| n | Disclosed Executives involve a review at the end of the year by the CEO, input on each individual’s risk management from the CRO and input on the financial performance of all key Divisions from the CFO. Preliminary and final review is completed by the HR Committee and final outcomes are approved by the Board. | |||
The Board reviews performance outcomes against target for each metric, combined with a judgmental assessment of the prioritisation and impact of each outcome relative to overall business performance for both the short and longer term.
The method of assessment used to measure performance has been adopted to ensure validation from a risk management and financial performance perspective, along with independent input and recommendation from the HR Committee to the Board for approval.
| ||||
Rewarding performance |
The 2012 target STI award level for the CEO represents one third of total target remuneration and for Disclosed Executives approximately 44% of their total target remuneration. The maximum STI opportunity for top performers is up to 250% of the target whereas weaker performers receive a significantly reduced or no incentive payment at all. | |||
18

| Mandatory deferral | Mandatory deferral of a portion of the STI places an increased emphasis on having a variable structure that is flexible, continues to be performance linked, has significant retention elements and aligns the interests of the CEO and Disclosed Executives to shareholders to drive continued performance over the longer term. | |
For the financial year ending September 2012, the mandatory deferral threshold for STI payments was reduced from $200,000 to $100,000 (subject to a minimum deferral amount of $25,000) with: | ||
n the first $100,000 of STI paid in cash; | ||
n 50% of STI above $100,000 paid in cash; | ||
n 25% of STI above $100,000 deferred in ANZ equity for one year; and | ||
n 25% of STI above $100,000 deferred in ANZ equity for two years. | ||
The deferred component of bonuses paid in relation to the 2012 year is delivered as ANZ deferred shares or deferred share rights. Where deferred share rights are granted, for grants made after 1 November 2012 at the Board’s discretion, any portion of the award which vests may be satisfied by a cash equivalent payment rather than shares. | ||
As the incentive amount has already been earned, there are no further performance measures attached to the shares or share rights, however, they do remain at risk and subject to clawback until the vesting date. |
6.2.2 LONG TERM INCENTIVES (LTI)
The LTI provides an annual opportunity for an equity award deferred for three years that aligns a significant portion of overall remuneration to shareholder value over the longer term.
LTI awards remain at risk and subject to clawback until vesting and must meet or exceed a relative TSR performance hurdle (excluding the CRO who is allocated deferred share rights).
LTI ARRANGEMENTS
| Type of equity awarded | LTI is delivered to the CEO and Disclosed Executives as 100% performance rights. A performance right is a right to acquire a share at nil cost, subject to meeting time and performance hurdles. Upon exercise, each performance right entitles the CEO and Disclosed Executives to one ordinary share.
The future value of the grant may range from zero to an undefined amount depending on performance against the hurdle and the share price at the time of exercise.
For grants made after 1 November 2012, at the Board’s discretion, any portion of the award which vests may be satisfied by a cash equivalent payment rather than shares.
| |||
Time restrictions |
Performance rights awarded to the CEO and Disclosed Executives will be tested against the performance hurdle at the end of three years. A three year time based hurdle provides a reasonable period to align reward with shareholder return and also acts as a vehicle to retain the CEO and Disclosed Executives. If the performance rights do not achieve the required performance hurdle they are forfeited at that time.
| |||
Performance hurdle |
The performance rights granted to the CEO and Disclosed Executives have a single long term performance measure.
The performance rights are designed to reward the CEO and Disclosed Executives if the Group’s TSR is at or above the median TSR of a group of peer companies over a three year period. TSR represents the change in the value of a share plus the value of reinvested dividends paid. TSR was chosen as the most appropriate comparative measure as it focuses on the delivery of shareholder value and is a well understood and tested mechanism to measure performance.
| |||
Vesting schedule |
The proportion of performance rights that become exercisable will depend upon the TSR achieved by ANZ relative to the companies in the comparator group at the end of the three year period. | |||
An averaging calculation is used for TSR over a 90 day period for start and end values in order to reduce the impact of share price volatility. To ensure an independent TSR measurement, ANZ engages the services of an external organisation (Mercer (Australia) Pty Ltd) to calculate ANZ’s performance against the TSR hurdle. The level of performance required for each level of vesting, and the percentage of vesting associated with each level of performance, are set out below. The performance rights lapse if the performance condition is not met. There is no re-testing.
| ||||
| If the TSR of ANZ: | The percentage of performance rights which will vest is: | |||
| ||||
| Does not reach the 50th percentile of the TSR of the Comparator Group | 0% | |||
| ||||
| Reaches or exceeds the 50th percentile of the TSR of the Comparator Group but does not reach the 75th percentile | 50%, plus 2% for every one percentile increase above the 50th percentile | |||
| ||||
| Reaches or exceeds the 75th percentile of the TSR of the Comparator Group | 100% | |||
REMUNERATION REPORT 19

| Comparator group | The ANZ comparator group currently consists of the following nine companies: | |||||
n |
AMP Limited | n National Australia Bank Limited | ||||
n |
ASX Limited | n QBE Insurance Group Limited | ||||
n |
Commonwealth Bank of Australia Limited | n Suncorp-Metway Limited | ||||
n |
Insurance Australia Group Limited | n Westpac Banking Corporation | ||||
n |
Macquarie Group Limited | |||||
These companies represent domestic financial services companies and are considered by the Board as the most appropriate comparator for ANZ at this time, given the majority of our business is generated in Australia and New Zealand.
| ||||||
Size of LTI grants |
Refer to Section 8.2, Chief Executive Officer (CEO) for details on the CEO’s LTI arrangements.
The size of individual LTI grants for Disclosed Executives is determined by reference to market practice, an individual’s level of responsibility, their performance and the assessed potential of the Disclosed Executive. The target LTI for Disclosed Executives is around 19% of total target remuneration. Disclosed Executives are advised of the dollar value of their LTI grant, which is then converted into a number of performance rights based on an independent valuation. Refer to section 9.1, Equity Valuations for further details on the valuation approach and inputs. | |||||
LTI allocations are made annually after the annual performance and remuneration review which occurs in October. The following example uses the November 2011 allocation value: | ||||||
n |
LTI award value (communicated value) | $500,000 | ||||
n |
approved allocation value per performance right (independently valued by external advisors) | $9.03 | ||||
n |
number of performance rights allocated ($500,000/$9.03) | 55,370 | ||||
LTI ARRANGEMENTS FOR THE CRO
Deferred share rights |
The CRO is the only Disclosed Executive to receive LTI deferred share rights. | |
Deferred share rights are subject to a time-based vesting hurdle of three years, during which time they are held in trust. The value used to determine the number of LTI deferred share rights to be allocated is based on an independent valuation, as detailed in Section 9.1, Equity Valuations.
For grants made after 1 November 2012, at the Board’s discretion, any portion of the award which vests may be satisfied by a cash equivalent payment rather than shares. |
6.3 OTHER REMUNERATION ELEMENTS
CLAWBACK
The Board has on-going and absolute discretion to adjust performance-based components of remuneration (including previously deferred equity or cash) downwards, or to zero, at any time, including after the grant of such remuneration, where the Board considers such an adjustment is necessary to protect the financial soundness of ANZ or to meet unexpected or unknown regulatory requirements, or if the Board subsequently considers that having regard to information which has come to light after the grant of deferred equity/cash, the deferred equity/ cash was not justified.
Prior to any scheduled release of deferred equity/cash, the Board considers whether any downward adjustment should be made.
HEDGING AND MARGIN LENDING PROHIBITION
As specified in the Trading in ANZ Securities Policy and in accordance with the Corporations Act 2001, equity allocated under ANZ incentive schemes must remain at risk until fully vested (in the case of deferred shares) or exercisable (in the case of options, deferred share rights or performance rights). As such, it is a condition of grant that no schemes are entered into, by an individual or their associated persons, that specifically protects the unvested value of shares, options, deferred share rights or performance rights allocated.
Doing so would constitute a breach of the grant conditions and would result in the forfeiture of the relevant shares, options, deferred share rights or performance rights.
ANZ also prohibits the CEO and Disclosed Executives providing ANZ securities in connection with a margin loan or similar financing arrangements which maybe subject to a margin call or loan to value ratio breach.
To monitor adherence to this policy, ANZ’s CEO and Disclosed Executives are required to sign an annual declaration stating that they and their associated persons have not entered into (and are not currently involved in) any schemes to protect the value of their interests in any ANZ securities. Based on the 2012 declarations, ANZ can advise that the CEO and Disclosed Executives are fully compliant with this policy.
SHAREHOLDING GUIDELINES
The CEO and Disclosed Executives are:
| n | expected to accumulate ANZ shares over a five year period, to the value of 200% of their fixed remuneration and to maintain this shareholding while an executive of ANZ; |
| n | shareholdings for this purpose include all vested and allocated (but unvested) equity which is not subject to performance hurdles; and |
| n | the CEO and all Disclosed Executives have met or, if less than five years tenure, are on track to meet their minimum shareholding guidelines requirement. |
| 20 |

CESSATION OF EMPLOYMENT PROVISIONS
The provisions that apply for STI and LTI awards in the case of cessation of employment are detailed in Sections 8.2 CEO’s Contract Terms and 8.3 Disclosed Executives’ Contract Terms.
CONDITIONS OF GRANT
The conditions under which STI (deferred shares and deferred share rights) and LTI (performance rights and deferred share rights) are granted are approved by the Board in accordance with the rules of the ANZ Employee Share Acquisition Plan and/or the ANZ Share Option Plan.
7. Linking Remuneration to Balanced Scorecard Performance
7.1 ANZ PERFORMANCE
TABLE 2: ANZ’S FINANCIAL PERFORMANCE 2008 – 2012
| 2012 | 2011 | 2010 | 2009 | 2008 | ||||||||||||||
Statutory profit ($m) | 5,661 | 5,355 | 4,501 | 2,943 | 3,319 | |||||||||||||
Underlying profit1 (Unaudited) | 6,011 | 5,652 | 5,025 | 3,772 | 3,426 | |||||||||||||
Underlying return on equity (ROE) (%) | 15.6% | 16.2% | 15.5% | 13.3% | 15.1% | |||||||||||||
Underlying earnings per share (EPS) | 225.3 | 218.4 | 198.7 | 168.3 | 175.9 | |||||||||||||
Share price at 30 September ($) | 24.75 | 19.52 | 23.68 | 24.39 | 18.75 | |||||||||||||
Total dividend (cents per share) | 145 | 140 | 126 | 102 | 136 | |||||||||||||
Total shareholder return (12 month %) | 35.4 | (12.6) | 1.9 | 40.3 | (33.5) | |||||||||||||
| 1 | Profit has been adjusted for non-core items to arrive at underlying profit, the result for the ongoing business activities of the Group. These adjustments have been determined on a consistent basis with those made in prior periods. The adjustments made in arriving at underlying earnings are included in statutory profit which is subject to audit within the context of the Group statutory audit opinion. Underlying profit is not audited; however, |
| the external auditor has informed the Audit Committee that the adjustments, and the presentation thereof, are based on the guidelines released by the Australian Institute of Company Directors (AICD) and the Financial Services Institute of Australasia (FINSIA). Further details on underlying profit are provided on page 55. |
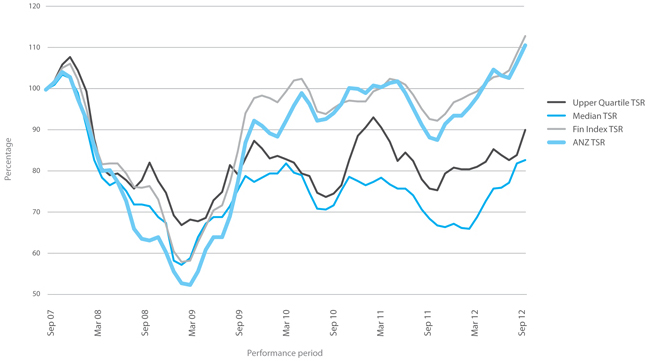
Figure 2 compares ANZ’s TSR performance against the median TSR and upper quartile TSR of the LTI comparator group and the S&P/ASX 200 Banks Accumulation Index (Fin Index) over the 2008 to 2012
measurement period. ANZ’s TSR performance has well exceeded the upper quartile TSR of the LTI comparator group during 2012.
FIGURE 2: ANZ 5-YEAR CUMULATIVE TOTAL SHAREHOLDER RETURN PERFORMANCE
REMUNERATION REPORT 21

7.2 STI – PERFORMANCE AND OUTCOMES
ANZ uses a balanced scorecard to measure performance in relation to the Group’s main incentive programs. The scorecard provides a framework whereby a combination of measures can be applied to ensure a broader long term strategic focus on driving shareholder value as well as a focus on annual priorities.
In 2012, the Human Resources Committee refined the balanced scorecard to align it to the Group’s key strategic priorities, resulting in six categories containing a range of measures. Each of the six categories are broadly equal in weight. These measures were agreed at the beginning of the financial year.
The Board has assessed the Bank’s overall 2012 performance as solid across the range of balanced score card measures. Overall spend approved by the Board for the main short-term incentive pools was at below target levels with a range of underlying outcomes for business units and individuals, in line with ANZ’s objectives of differentiating reward based on performance.
The following table provides examples of some of the key measures used in 2012 for assessing performance for the purpose of determining short term incentive pools. The list provides examples of some of the measures under each of the balanced scorecard categories.
Category
| Measure
| Outcome1
| ||
Finance |
On Target: | |||
Profit | �� |
A record underlying profit after tax of $6,011m, up 6% on the prior year. The total dividend for 2012 was $1.45 per share up 4%. Economic profit2 of $2,539 million was up 1% on 2011 and was impacted by continuing regulatory requirements to hold higher capital levels and by the impact of lower interest rates on capital earnings. | ||
Capital and Liquidity |
Building long term shareholder value requires a resilient balance sheet. In the current economic environment, measures for Capital, Liquidity and Funding are regarded as particularly important. At balance date the Group’s Tier 1 Capital Ratio was 10.8% and Liquid Assets held were well in excess of regulatory requirements.
The Bank is currently carrying $17 billion more in capital than pre the Global Financial Crisis (with $11 billion being balance sheet strengthening and $6 billion to support growth). | |||
Return on Equity |
Underlying ROE is measured against longer-term targets and while 2012 was slightly lower than 2011, this was as a result of the requirement to build our capital ratios in a lower interest environment. | |||
Core Funding Ratio (CFR) |
Over the year, ANZ has maintained its CFR at comfortable levels. | |||
Cost to Income Ratio |
Overall business growth was good and in line with strategic objectives. Productivity improved with the cost to income ratio reduced 20bps year on year and 110bps half on half based on significant cost reduction programs across the bank.
| |||
Customer |
Slightly below Target: | |||
Customer satisfaction (based on external survey outcomes) |
ANZ tracks customer satisfaction across its businesses as part of a group of indicators of longer term performance trends. ANZ aims to achieve top quartile customer satisfaction scores in each business based on external surveys. | |||
In 2012 top quartile scores were achieved in Australia in the Corporate and Institutional segments and in the Institutional segment in New Zealand. Asia scores improved significantly and New Zealand Retail scores remained steady.
However, in Australia Retail the initial reaction to changes to our mortgage pricing methodology contributed to a decline in scores although they have started to return to a competitive level and there was no impact to customer acquisition, retention or market share.
| ||||
Shareholder returns |
Out Performed: | |||
Total Shareholder return (TSR) |
ANZ aims to outperform peers both in terms of financial strength and earnings performance. TSR in 2012 was very strong at 35.4% placing us in the top quartile of Australian peers (comparator group). | |||
Maintain Strong Credit Rating |
The maintenance of a strong credit rating is fundamental to the ongoing stability of the Group and there have been no changes to the Group’s rating during the period. |
22

| Category | Measure | Outcome1 | ||
People |
On Target: | |||
Employee engagement | An engaged workforce is regarded as an important driver of long term performance. Despite difficult business conditions and significant bank-wide changes over the year, employee engagement remained steady at 70% in 2012. | |||
| Senior leaders as role models | Strong score improvements were seen in key areas like ‘Inspirational Leadership’ with various programs and activities re-energising the approach and focus on values-led leadership. | |||
| Workforce Diversity | ANZ is focused on increasing the diversity of its workforce and targeted an increase in women in management; however results at senior levels remained flat year on year.
| |||
Connectivity |
On Target: | |||
| Growth in Asia Pacific, Europe and America | ANZ aspires to be the most respected bank in the Asia Pacific region using super regional connectivity to better meet the needs of customers which are increasingly linked to regional capital, trade and wealth flows. One important measure of the success of the super regional strategy is the growth in total Network revenues (revenue arising from having a meaningful business in Asia Pacific, Europe and America regardless of whether the revenue is subsequently booked within the region or in Australia or New Zealand). Network revenues reached 21% of Group revenue in 2012. This significantly differentiates ANZ against its Australian peer group.
| |||
Process/ Risk |
On Target: | |||
| Number of outstanding internal audit items | ANZ Global Internal Audit conducts an ongoing and rigorous review process to identify weaknesses in procedures and compliance with policies. In 2012 there was a low, stable number of outstanding items. | |||
Risk Culture
| During 2012 there was a continued strengthening of the risk culture across ANZ.
| |||
| 1 | Software impairment charges of $274 million have been taken into account in assessing performance against measures. |
| 2 | Economic profit is an unaudited risk adjusted profit measure determined by adjusting underlying profit for economic credit costs, the benefit of imputation credits and the cost of capital. |
8. 2012 Remuneration
8.1 NON EXECUTIVE DIRECTORS (NEDs)
Principles underpinning the remuneration policy for NEDs.
| Principle | Comment | |
Aggregate Board and Committee fees are within the maximum annual aggregate limit approved by shareholders |
The current aggregate fee pool for NEDs of $3.5 million was approved by shareholders at the 2008 Annual General Meeting. The annual total of NEDs’ fees, including superannuation contributions, is within this agreed limit. Retirement benefits accrued as at September 2005 are not included within this limit. | |
Shareholder approval will be sought at the 2012 Annual General Meeting for an increase to the NED fee pool from $3.5 million to $4 million, the first increase to the pool since 2008. Refer to the 2012 Notice of Meeting for more detail.
| ||
Fees are set by reference to key considerations |
Board and Committee fees are set by reference to a number of relevant considerations including: | |
n general industry practice and best principles of corporate governance;
n the responsibilities and risks attached to the role of NEDs;
n the time commitment expected of the NEDs on Group and Company matters; and
n reference to fees paid to NEDs of comparable companies. | ||
ANZ compares NED fees to a comparator group of Australian listed companies with a similar size market capitalisation, with particular focus on the major financial services institutions. This is considered an appropriate group, given similarity in size, nature of work and time commitment required by NEDs.
| ||
The remuneration structure preserves independence whilst aligning interests of NEDs and shareholders
|
So that independence and impartiality is maintained, fees are not linked to the performance of the Company and NEDs are not eligible to participate in any of the Group’s incentive arrangements. |
REMUNERATION REPORT 23

Components of NED Remuneration
NEDs receive a fee for being a Director of the Board, and additional fees for either chairing or being a member of a Board Committee. The Chairman of the Board does not receive additional fees for service on a Board Committee.
The Board agreed not to increase the individual NED fees for 2012. For details of remuneration paid to NEDs for the years 2011 and 2012, refer to Table 3.
| Elements | Details | |||||||
| Board/Committee fees | Board Chairman Fee | $775,000 | ||||||
| per annum – 2012 | Board NED Base Fee | $210,000 | ||||||
| Committee Fees | Committee Chair | Committee Member | ||||||
| Audit | $65,000 | $32,500 | ||||||
| Governance | $35,000 | $15,000 | ||||||
| Human Resources | $55,000 | $25,000 | ||||||
| Risk | $57,000 | $30,000 | ||||||
Technology
| $35,000 | $15,000 | ||||||
Post – employment Benefits |
Superannuation contributions are made at a rate of 9% of base fee (but only up to the Government’s prescribed maximum contributions limit) which satisfies the Company’s statutory superannuation contributions. Contributions are not included in the base fee. | |||||||
| The ANZ Directors’ Retirement Scheme was closed effective 30 September 2005. Accrued entitlements relating to the ANZ Directors’ Retirement Scheme were fixed at 30 September 2005 and NEDs had the option to convert these entitlements into ANZ shares. Such entitlements, either in ANZ shares or cash, have been carried forward or will be transferred to the NED when they retire from the ANZ Board (including interest accrued at the 30 day bank bill rate for cash entitlements). | ||||||||
| The accrued entitlements for current NEDs fixed under the ANZ Directors’ Retirement Scheme as at 30 September 2005 were as follows: | ||||||||
n G Clark | $83,197 | |||||||
n D Meiklejohn | $64,781 | |||||||
n J Morschel
| $60,459 | |||||||
Shareholdings of NEDs
The movement in shareholdings during the reporting period (held directly, indirectly and by related parties) is provided in Notes to the Financial Statements – note 46 on page 184.
The NED shareholding guidelines require Directors to accumulate shares, over a five year period from appointment, to the value of 100% (200% for the Chairman) of the base annual NED fee and to maintain this shareholding while a Director of ANZ. Directors have agreed that where their holding is below this guideline they will direct a minimum of 25% of their fees each year toward achieving this shareholding.
All NEDs have met or, if less than five years appointment, are on track to meet their minimum shareholding guidelines requirement.
NED Statutory Remuneration
Remuneration details of NEDs for 2011 and 2012 are set out in Table 3. There was no increase in NED fees throughout the year. Overall, there is an increase in total NED remuneration year on year due to the commencement of Ms Dwyer in April 2012 and the prescribed increase in Superannuation Guarantee Contributions.
24

TABLE 3: NED REMUNERATION FOR 2012 AND 2011
| Short-Term NED Benefits | Post-Employment | |||||||||||||||||
Financial Year | Fees1 $ | Non monetary benefits $ | Super contributions $ | Total remuneration2,3 $ | ||||||||||||||
Non-Executive Directors (NEDs) | ||||||||||||||||||
J Morschel | 2012 | 775,000 | – | 15,949 | 790,949 | |||||||||||||
| 2011 | 775,000 | – | 15,343 | 790,343 | ||||||||||||||
G Clark | 2012 | 300,000 | – | 15,949 | 315,949 | |||||||||||||
| 2011 | 300,000 | – | 15,343 | 315,343 | ||||||||||||||
P Dwyer4 | 2012 | 136,250 | – | 8,061 | 144,311 | |||||||||||||
P Hay | 2012 | 302,500 | – | 15,949 | 318,449 | |||||||||||||
| 2011 | 302,500 | – | 15,343 | 317,843 | ||||||||||||||
H Lee | 2012 | 280,000 | – | 15,949 | 295,949 | |||||||||||||
| 2011 | 280,000 | – | 15,343 | 295,343 | ||||||||||||||
I Macfarlane | 2012 | 314,500 | – | 15,949 | 330,449 | |||||||||||||
| 2011 | 314,500 | – | 15,343 | 329,843 | ||||||||||||||
D Meiklejohn5 | 2012 | 320,000 | 1,322 | 15,949 | 337,271 | |||||||||||||
| 2011 | 320,000 | 186 | 15,343 | 335,529 | ||||||||||||||
A Watkins | 2012 | 312,500 | – | 15,949 | 328,449 | |||||||||||||
| 2011 | 312,500 | – | 15,343 | 327,843 | ||||||||||||||
Total of all Non-Executive Directors | 2012 | 2,740,750 | 1,322 | 119,704 | 2,861,776 | |||||||||||||
| 2011 | 2,604,500 | 186 | 107,401 | 2,712,087 | ||||||||||||||
| 1 | Fees is the sum of Board fees and Committee fees, as included in the Annual Report. |
| 2 | Long-term benefits and share-based payments are not applicable for the Non-Executive Directors. There were no termination benefits for the Non-Executive Directors in either 2011 or 2012. |
| 3 | Amounts disclosed for remuneration of Directors exclude insurance premiums paid by the Group in respect of Directors’ and officers’ liability insurance contracts. The total premium, |
| which cannot be disclosed because of confidentiality requirements, has not been allocated to the individuals covered by the insurance policy as, based on all available information, the Directors believe that no reasonable basis for such allocation exists. |
| 4 | P Dwyer commenced as a Non-Executive Director on 1 April 2012 so remuneration reflects amounts received for the partial service for the 2012 year. |
| 5 | For D Meiklejohn, non monetary benefits relate to the provision of office space. |
8.2 CHIEF EXECUTIVE OFFICER (CEO)
Actual remuneration provided to the CEO in 2012 is detailed below, with remuneration tables provided on pages 30 to 33.
Fixed pay:The CEO’s fixed remuneration remains unchanged at $3.15 million (with his only increase since commencement being two years ago, effective 1 October 2010).
Short Term Incentive (STI): The CEO has a target STI opportunity of $3.15 million. The actual amount paid can increase or decrease from this number dependent on his performance as CEO and the performance of the organisation as a whole. Specifically, if, in the Board’s view the CEO has performed above/below his targets, the Board may exercise its discretion to increase/decrease the STI beyond his target payment.
The Board approved the CEO’s 2012 balanced scorecard objectives at the start of the year and then assessed his performance against these objectives at the end of the year. The CEO’s STI payment for 2012 was then determined having regard to his delivery against these objectives including ANZ’s productivity performance and focus on capital efficiency, his demonstration of values led behaviours, as well as progress achieved in relation to ANZ’s long term strategic goals. The STI payment for 2012 will be $3.7 million with $1.9 million paid in cash and the balance ($1.8 million) awarded as deferred shares, half deferred for one year and half for two years.
Long Term Incentive (LTI): Three tranches of performance rights were granted to the CEO in December 2007, covering his first three years in the role. Two tranches have now vested. The second tranche was tested on 19 December 2011 and as a result of the testing 100% (259,740) of the performance rights vested. There is no re-testing of these grants.
At the 2011 Annual General Meeting shareholders approved an LTI grant to the CEO equivalent to 100% of his 2011 fixed pay, being $3.15 million. This equated to 326,424 performance rights being granted, at an allocation value of $9.65 per right, deferred for three years and subject to testing against a relative TSR hurdle.
For 2012, it is proposed to grant $3.15 million (100% of Fixed Pay) LTI, subject to shareholder approval at the 2012 Annual General Meeting, to be delivered as performance rights which will be subject to testing against the relative TSR hurdle after three years, i.e. December 2015.
Special Equity Allocation: At the 2008 Annual General Meeting, shareholders approved a grant of 700,000 options to the CEO at an exercise price of $14.18 and with a vesting date of 18 December 2011. The amortised value of these options has been disclosed as part of Mr Smith’s remuneration since 2009. At vesting, the one day volume weighted average price (VWAP) was $20.9407 per share. No options have been granted subsequently.
| REMUNERATION REPORT 25 |

CEO Equity
Details of deferred shares, options and performance rights granted to the CEO during the 2012 year and in prior years which vested,
were exercised/sold or which lapsed/were forfeited during the 2012 year are set out in Table 4 below.
TABLE 4: CEO EQUITY GRANTED, VESTED, EXERCISED/SOLD AND LAPSED/FORFEITED
| Vested | Lapsed/Forfeited | Exercised/Sold | ||||||||||||||||||||||||||||||||||||||||||||||||||||||||||||
| Name | Type of equity | Number granted1 | Grant date | First date exercisable | Date of expiry | Number | % | Value2 $ | Number | % | Value2 $ | Number | % | Value2 $ | Vested and exercisable as at 30 Sep 2012 | Unexer -cisable 30 Sep | ||||||||||||||||||||||||||||||||||||||||||||||
CEO |
| |||||||||||||||||||||||||||||||||||||||||||||||||||||||||||||
M Smith | STI deferred shares | 46,052 | 13-Nov-09 | 13-Nov-11 | – | 46,052 | 100 | 953,640 | – | – | – | (46,052) | 100 | 961,916 | – | – | ||||||||||||||||||||||||||||||||||||||||||||||
STI deferred shares | 47,448 | 12-Nov-10 | 12-Nov-11 | – | 47,448 | 100 | 982,548 | – | – | – | (47,448) | 100 | 991,075 | – | – | |||||||||||||||||||||||||||||||||||||||||||||||
STI deferred shares3 | 36,730 | 14-Nov-11 | 14-Nov-12 | – | – | – | – | – | – | – | – | – | – | – | 36,730 | |||||||||||||||||||||||||||||||||||||||||||||||
STI deferred shares3 | 36,729 | 14-Nov-11 | 14-Nov-13 | – | – | – | – | – | – | – | – | – | – | – | 36,729 | |||||||||||||||||||||||||||||||||||||||||||||||
Special options4 | 700,000 | 18-Dec-08 | 18-Dec-11 | 17-Dec-13 | 700,000 | 100 | 4,732,490 | – | – | – | (260,000) | 37 | 2,022,904 | |||||||||||||||||||||||||||||||||||||||||||||||||
| (440,000) | 63 | 4,624,356 | – | – | ||||||||||||||||||||||||||||||||||||||||||||||||||||||||||
LTI performance rights | 259,740 | 19-Dec-07 | 19-Dec-11 | 18-Dec-12 | 259,740 | 100 | 5,370,176 | – | – | – | (259,740) | 100 | 5,359,579 | – | – | |||||||||||||||||||||||||||||||||||||||||||||||
LTI performance rights5 | 326,424 | 16-Dec-11 | 17-Dec-14 | 16-Dec-16 | – | – | – | – | – | – | – | – | – | – | 326,424 | |||||||||||||||||||||||||||||||||||||||||||||||
| 1 | The maximum value at the time of the grant is determined by multiplying the number granted by the fair value of the equity instruments. The minimum value of the grants, if the applicable conditions are not met at vesting date, is nil. Options/rights granted include those granted as remuneration to the CEO. No options/rights have been granted since the end of 2012 up to the signing of the Director’s Report on 5 November 2012. |
| 2 | The value of shares and/or performance rights is based on the one day VWAP of the Company’s shares traded on the ASX on the date of vesting, lapsing/forfeiture or exercising, multiplied by the number of shares and/or performance rights. The value of options is based on the difference between the one day VWAP and the exercise price, multiplied by the number of options. |
| 3 | The CEO had a proportion of his STI amount deferred as equity. The Board determined the deferred amount for the CEO. Refer to Table 9 for details of the valuation methodology, inputs and fair value. |
| 4 | Of the 700,000 special options granted 18 December 2008, 260,000 were exercised on 21 February 2012. One day VWAP on date of exercise was $21.9604. The remaining 440,000 special options were exercised on 20 August 2012. One day VWAP on date of exercise was $24.6899. The exercise price was $14.18. LTI performance rights granted 19 December 2007 were exercised on 22 December 2011. One day VWAP on date of exercise was $20.6344. |
| 5 | The 2011 LTI grant for the CEO was delivered as performance rights. Refer to section CEO LTI for further details of the LTI grant and Table 8 for details of the valuation, inputs and fair value. |
The movement during the reporting period in shareholdings, options and performance rights of the CEO (held directly, indirectly and by related parties) is provided in Notes to the Financial Statements – note 46 on page 184.
CEO’s Contract Terms
The following sets out details of the contract terms relating to the CEO. The contract terms are in line with industry practice (based on external advice on Australian and international peer company benchmarks) and ASX Corporate Governance Principles.
| Length of contract | Mr Smith commenced as CEO and Executive Director of ANZ on 1 October 2007 and is on a permanent contract, which is an ongoing employment contract until notice is given by either party.
| |
| ||
| Notice periods |
Mr Smith or ANZ may terminate the employment agreement by providing 12 months’ written notice.
| |
| ||
Resignation |
On resignation, all unvested STI deferred shares, all unexercised performance rights (or cash equivalent) and all unvested and all vested unexercised options will be forfeited.
| |
| ||
Termination on notice by ANZ |
ANZ may terminate Mr Smith’s employment by providing 12 months’ written notice or payment in lieu of the notice period based on fixed remuneration.
On termination on notice by ANZ all unvested STI deferred shares will be released at the original vesting date unless the Board determines otherwise; all performance rights (or cash equivalent) which have vested or vest during the notice period will be retained and become exercisable; all performance rights (or cash equivalent) which have not yet vested will be retained and will vest and become exercisable subject to the relevant time and performance hurdles being satisfied. All unvested options will be forfeited.
| |
| ||
Death or total and permanent disablement
|
On death or total and permanent disablement, all unvested STI deferred shares, all performance rights (or cash equivalent) and all options will vest. | |
| ||
26

| Change of control | In the event of takeover, scheme of arrangement or other change of control event occurring, the performance condition applying to the performance rights will be tested and the performance rights will vest based on the extent the performance condition is satisfied. No pro rata reduction in vesting will occur based on the period of time from the date of grant to the date of the change of control event occurring, and vesting will only be determined by the extent to which the performance condition is satisfied.
Any performance rights which vest based on satisfaction of the performance condition will vest at a time (being no later than the final date on which the change of control event will occur) determined by the Board.
Any performance rights which do not vest will lapse with effect from the date of the change of control event occurring, unless the Board determines otherwise.
Any unvested STI deferred shares will vest at a time (being no later than the final date on which the change of control event will occur) determined by the Board.
| |
| ||
Termination for serious misconduct |
ANZ may immediately terminate Mr Smith’s employment at any time in the case of serious misconduct, and Mr Smith will only be entitled to payment of fixed remuneration up to the date of termination.
On termination without notice by ANZ in the event of serious misconduct all STI deferred shares remaining in trust, performance rights (or cash equivalent) and options will be forfeited.
| |
| ||
Statutory Entitlements
|
Payment of statutory entitlements of long service leave and annual leave applies in all events of separation.
| |
| ||
8.3 DISCLOSED EXECUTIVES
Actual remuneration provided to the Disclosed Executives in 2012 is summarised below, with remuneration tables provided on pages 30 to 33.
Fixed pay: During 2012, fixed pay for Disclosed Executives remained unchanged except where individuals were promoted to roles to reflect increased responsibilities. The annual review of ANZ’s fixed remuneration levels for Disclosed Executives identified they were generally competitively positioned within the market and there were no increases to fixed pay.
During the year, two Disclosed Executives from 2011 (Mr Thursby and Mr Elliott) were promoted into new roles. At this time, the Board undertook a review of their remuneration arrangements against the relevant financial services market for roles of similar size and accountability. The Board made the decision to adjust fixed remuneration levels for both individuals at the time of their promotion to reflect their expanded roles.
Short Term Incentive (STI): All incentives actually paid in the 2012 financial year related to performance from the 2011 financial year, and all deferred components are subject to the Board’s discretion to reduce or adjust to zero before vesting.
For the 2012 year, the Board took into consideration overall Company performance against the balanced scorecard of measures, along with individual performance against set objectives. Overall, the total amount of STI payments to Disclosed Executives for the 2012 year (which are paid in the 2013 financial year) has increased from 2011, reflecting the improvement in company performance, the focus on productivity and capital efficiency, and progress towards the achievement of longer term targets, demonstrating the link between performance and variable reward outcomes.
The range in payments to individuals was broad, and for the five Executives disclosed in both 2012 and 2011, two received the same amount, one received a minimal increase and two received more significant year on year increases.
Long Term Incentive (LTI): LTI performance rights granted to Disclosed Executives during the 2012 financial year were allocated in November 2011. Subject to meeting the relative TSR performance hurdle, these performance rights will vest in November 2014.
The LTI grants made in October 2008 were tested against the TSR performance of the comparator group in October 2011. ANZ’s TSR performance was ranked the highest, and hence above the 75th percentile of the comparator group. Accordingly, 100% of the performance rights vested in October 2011.
For the 2012 year, the Board elected to grant LTI awards to Disclosed Executives on average above target, reflecting the importance of focusing Disclosed Executives on the achievement of longer term strategic objectives and alignment with shareholders interests, and recognising the capabilities of these individuals and the need to retain their expertise over the longer term.
Disclosed Executives Equity
Details of deferred shares, options and performance rights granted to the Disclosed Executives during the 2012 year and granted to the Disclosed Executives in prior years which vested, were exercised/sold or which lapsed/were forfeited during the 2012 year are set out in Table 5 following.
The movement in shareholdings, options and performance rights of the Disclosed Executives (held directly, indirectly and by related parties) during the reporting period is provided in Notes to the Financial Statements – note 46 on page 184.
| REMUNERATION REPORT 27 |

| TABLE 5: DISCLOSED EXECUTIVES EQUITY GRANTED, VESTED, EXERCISED/SOLD AND LAPSED/FORFEITED | Vested | Lapsed/Forfeited | Exercised/Sold | |||||||||||||||||||||||||||||||||||||||||||||||||||
| Vested and exercisable | Unexer -cisable | |||||||||||||||||||||||||||||||||||||||||||||||||||||
| Name | Type of equity | Number granted1 | Grant date | First date exercisable | Date of expiry | Number | % | Value2 $ | Number | % | Value2 $ | Number | % | Value2 $ | as at 30 Sep 20123 | 30 Sep 2012 | ||||||||||||||||||||||||||||||||||||||
Current Disclosed Executives |
| |||||||||||||||||||||||||||||||||||||||||||||||||||||
P Chronican | STI deferred shares | 12,653 | 12-Nov-10 | 12-Nov-11 | – | 12,653 | 100 | 262,017 | – | – | – | (12,653) | 100 | 266,275 | – | – | ||||||||||||||||||||||||||||||||||||||
STI deferred shares11 | 16,588 | 14-Nov-11 | 14-Nov-12 | – | – | – | – | – | – | – | – | – | – | – | 16,588 | |||||||||||||||||||||||||||||||||||||||
STI deferred shares11 | 16,587 | 14-Nov-11 | 14-Nov-13 | – | – | – | – | – | – | – | – | – | – | – | 16,587 | |||||||||||||||||||||||||||||||||||||||
LTI performance rights12 | 71,982 | 14-Nov-11 | 14-Nov-14 | 14-Nov-16 | – | – | – | – | – | – | – | – | – | – | 71,982 | |||||||||||||||||||||||||||||||||||||||
S Elliott | Other deferred shares | 7,530 | 11-Jun-09 | 11-Jun-10 | – | – | – | – | – | – | – | (7,530) | 100 | 163,384 | – | – | ||||||||||||||||||||||||||||||||||||||
Other deferred shares | 7,530 | 11-Jun-09 | 11-Jun-11 | – | – | – | – | – | – | – | (7,530) | 100 | 163,384 | – | – | |||||||||||||||||||||||||||||||||||||||
STI deferred shares | 1,096 | 13-Nov-09 | 13-Nov-10 | – | – | – | – | – | – | – | (1,096) | 100 | 23,781 | – | – | |||||||||||||||||||||||||||||||||||||||
STI deferred shares | 1,096 | 13-Nov-09 | 13-Nov-11 | – | 1,096 | 100 | 22,696 | – | – | – | (1,096) | 100 | 23,781 | – | – | |||||||||||||||||||||||||||||||||||||||
STI deferred shares | 12,126 | 12-Nov-10 | 12-Nov-11 | – | 12,126 | 100 | 251,104 | – | – | – | (12,126) | 100 | 263,106 | – | – | |||||||||||||||||||||||||||||||||||||||
STI deferred shares11 | 9,573 | 14-Nov-11 | 14-Nov-12 | – | – | – | – | – | – | – | – | – | – | – | 9,573 | |||||||||||||||||||||||||||||||||||||||
STI deferred shares11 | 9,573 | 14-Nov-11 | 14-Nov-13 | – | – | – | – | – | – | – | – | – | – | – | 9,573 | |||||||||||||||||||||||||||||||||||||||
STI deferred options | 5,307 | 13-Nov-09 | 13-Nov-11 | 12-Nov-14 | 5,307 | 100 | – | – | – | – | – | – | – | 5,307 | – | |||||||||||||||||||||||||||||||||||||||
STI deferred options | 69,238 | 12-Nov-10 | 12-Nov-11 | 11-Nov-15 | 69,238 | 100 | – | – | – | – | – | – | – | 69,238 | – | |||||||||||||||||||||||||||||||||||||||
LTI performance rights12 | 71,982 | 14-Nov-11 | 14-Nov-14 | 14-Nov-16 | – | – | – | – | – | – | – | – | – | – | 71,982 | |||||||||||||||||||||||||||||||||||||||
D Hisco4 | STI deferred shares | 5,866 | 13-Nov-09 | 13-Nov-10 | – | – | – | – | – | – | – | (5,866) | 100 | 126,516 | – | – | ||||||||||||||||||||||||||||||||||||||
STI deferred shares | 5,866 | 13-Nov-09 | 13-Nov-11 | – | 5,866 | 100 | 121,473 | – | – | – | (5,866) | 100 | 126,516 | – | – | |||||||||||||||||||||||||||||||||||||||
LTI deferred shares | 23,282 | 31-Oct-08 | 31-Oct-11 | – | 23,282 | 100 | 508,199 | – | – | – | – | – | – | 23,282 | – | |||||||||||||||||||||||||||||||||||||||
Hurdled options | 10,530 | 5-Nov-04 | 5-Nov-07 | 4-Nov-11 | – | – | – | (527) | 5 | 363 | (10,003) | 95 | 3,134 | – | – | |||||||||||||||||||||||||||||||||||||||
STI deferred share rights | 8,480 | 12-Nov-10 | 12-Nov-11 | 11-Nov-15 | 8,480 | 100 | 175,603 | – | – | – | (8,480) | 100 | 177,127 | – | – | |||||||||||||||||||||||||||||||||||||||
STI deferred share rights11 | 19,072 | 14-Nov-11 | 14-Nov-12 | 14-Nov-14 | – | – | – | – | – | – | – | – | – | – | 19,072 | |||||||||||||||||||||||||||||||||||||||
STI deferred share rights11 | 20,318 | 14-Nov-11 | 14-Nov-13 | 14-Nov-15 | – | – | – | – | – | – | – | – | – | – | 20,318 | |||||||||||||||||||||||||||||||||||||||
LTI performance rights12 | 55,370 | 14-Nov-11 | 14-Nov-14 | 14-Nov-16 | – | – | – | – | – | – | – | – | – | – | 55,370 | |||||||||||||||||||||||||||||||||||||||
G Hodges5 | STI deferred shares | 7,236 | 13-Nov-09 | 13-Nov-11 | – | 7,236 | 100 | 149,842 | – | – | – | – | – | – | 7,236 | – | ||||||||||||||||||||||||||||||||||||||
STI deferred shares | 9,911 | 12-Nov-10 | 12-Nov-11 | – | 9,911 | 100 | 205,236 | – | – | – | – | – | – | 9,911 | – | |||||||||||||||||||||||||||||||||||||||
STI deferred shares11 | 11,848 | 14-Nov-11 | 14-Nov-12 | – | – | – | – | – | – | – | – | – | – | – | 11,848 | |||||||||||||||||||||||||||||||||||||||
STI deferred shares11 | 11,848 | 14-Nov-11 | 14-Nov-13 | – | – | – | – | – | – | – | – | – | – | – | 11,848 | |||||||||||||||||||||||||||||||||||||||
Hurdled options | 60,000 | 5-Nov-04 | 5-Nov-07 | 4-Nov-11 | – | – | – | (3,000) | 5 | 2,067 | (5,400) | 9 | 1,692 | – | – | |||||||||||||||||||||||||||||||||||||||
LTI performance rights | 50,050 | 31-Oct-08 | 31-Oct-11 | 30-Oct-13 | 50,050 | 100 | 1,092,491 | – | – | – | (50,050) | 100 | 1,092,822 | – | – | |||||||||||||||||||||||||||||||||||||||
LTI performance rights12 | 55,370 | 14-Nov-11 | 14-Nov-14 | 14-Nov-16 | – | – | – | – | – | – | – | – | – | – | 55,370 | |||||||||||||||||||||||||||||||||||||||
J Phillips6 | – | – | – | – | – | – | – | – | – | – | – | – | – | – | – | – | ||||||||||||||||||||||||||||||||||||||
A Thursby7 | Other deferred shares | 62,735 | 28-Aug-08 | 28-Aug-11 | – | – | – | – | – | – | – | (62,735) | 100 | 1,369,794 | – | – | ||||||||||||||||||||||||||||||||||||||
Other deferred shares | 43,610 | 22-Sep-09 | 22-Sep-12 | – | 43,610 | 100 | 1,081,040 | – | – | – | – | – | – | 43,610 | – | |||||||||||||||||||||||||||||||||||||||
STI deferred shares | 26,315 | 13-Nov-09 | 13-Nov-11 | – | 26,315 | 100 | 544,928 | – | – | – | (26,315) | 100 | 549,657 | – | – | |||||||||||||||||||||||||||||||||||||||
STI deferred shares | 24,251 | 12-Nov-10 | 12-Nov-11 | – | 24,251 | 100 | 502,187 | – | – | – | (24,251) | 100 | 506,545 | – | – | |||||||||||||||||||||||||||||||||||||||
STI deferred shares11 | 16,588 | 14-Nov-11 | 14-Nov-12 | – | – | – | – | – | – | – | – | – | – | – | 16,588 | |||||||||||||||||||||||||||||||||||||||
STI deferred shares11 | 16,587 | 14-Nov-11 | 14-Nov-13 | – | – | – | – | – | – | – | – | – | – | – | 16,587 | |||||||||||||||||||||||||||||||||||||||
LTI performance rights | 55,055 | 31-Oct-08 | 31-Oct-11 | 30-Oct-13 | 55,055 | 100 | 1,201,741 | – | – | – | (55,055) | 100 | 1,155,786 | – | – | |||||||||||||||||||||||||||||||||||||||
LTI performance rights12 | 77,519 | 14-Nov-11 | 14-Nov-14 | 14-Nov-16 | – | – | – | – | – | – | – | – | – | – | 77,519 | |||||||||||||||||||||||||||||||||||||||
N Williams8 | – | – | – | – | – | – | – | – | – | – | – | – | – | – | – | – | ||||||||||||||||||||||||||||||||||||||
Former Disclosed Executives |
| |||||||||||||||||||||||||||||||||||||||||||||||||||||
P Marriott9 | STI deferred shares | 5,962 | 24-Oct-01 | 24-Oct-02 | – | – | – | – | – | – | – | (5,962) | 100 | 124,532 | – | – | ||||||||||||||||||||||||||||||||||||||
STI deferred shares | 5,963 | 24-Oct-01 | 24-Oct-04 | – | – | – | – | – | – | – | (5,963) | 100 | 124,553 | – | – | |||||||||||||||||||||||||||||||||||||||
STI deferred shares | 5,476 | 24-Apr-02 | 24-Apr-03 | – | – | – | – | – | – | – | (5,476) | 100 | 128,649 | – | – | |||||||||||||||||||||||||||||||||||||||
STI deferred shares | 5,475 | 24-Apr-02 | 24-Apr-05 | – | – | – | – | – | – | – | (5,475) | 100 | 128,625 | – | – | |||||||||||||||||||||||||||||||||||||||
STI deferred shares | 7,127 | 13-Nov-09 | 13-Nov-11 | – | 7,127 | 100 | 147,585 | – | – | – | – | – | – | 7,127 | – | |||||||||||||||||||||||||||||||||||||||
STI deferred shares | 9,911 | 12-Nov-10 | 12-Nov-11 | – | 9,911 | 100 | 205,236 | – | – | – | – | – | – | 9,911 | – | |||||||||||||||||||||||||||||||||||||||
STI deferred shares11 | 14,692 | 14-Nov-11 | 14-Nov-12 | – | – | – | – | – | – | – | – | – | – | – | 14,692 | |||||||||||||||||||||||||||||||||||||||
STI deferred shares11 | 14,691 | 14-Nov-11 | 14-Nov-13 | – | – | – | – | – | – | – | – | – | – | – | 14,691 | |||||||||||||||||||||||||||||||||||||||
LTI deferred shares | 5,700 | 24-Oct-01 | 24-Oct-04 | – | – | – | – | – | – | – | (5,700) | 100 | 119,059 | – | – | |||||||||||||||||||||||||||||||||||||||
LTI deferred shares | 5,500 | 24-Apr-02 | 24-Apr-05 | – | – | – | – | – | – | – | (5,500) | 100 | 129,213 | – | – | |||||||||||||||||||||||||||||||||||||||
Hurdled options | 67,600 | 5-Nov-04 | 5-Nov-07 | 4-Nov-11 | – | – | – | (3,380) | 5 | 2,329 | (64,220) | 95 | 20,120 | – | – | |||||||||||||||||||||||||||||||||||||||
STI deferred options | 24,193 | 31-Oct-08 | 31-Oct-09 | 30-Oct-13 | – | – | – | – | – | – | (24,193) | 100 | 118,284 | – | – | |||||||||||||||||||||||||||||||||||||||
STI deferred options | 24,192 | 31-Oct-08 | 31-Oct-10 | 30-Oct-13 | – | – | – | – | – | – | (24,192) | 100 | 118,280 | – | – | |||||||||||||||||||||||||||||||||||||||
LTI performance rights | 50,050 | 31-Oct-08 | 31-Oct-11 | 30-Oct-13 | 50,050 | 100 | 1,092,491 | – | – | – | (50,050) | 100 | 1,031,115 | – | – | |||||||||||||||||||||||||||||||||||||||
LTI performance rights | 41,084 | 13-Nov-09 | 31-Aug-12 | 3-Dec-12 | 38,310 | 93 | 951,345 | (2,774) | 7 | 68,886 | – | – | – | 38,310 | – | |||||||||||||||||||||||||||||||||||||||
LTI performance rights | 41,806 | 12-Nov-10 | 12-Nov-13 | 11-Nov-15 | – | – | – | (8,583) | 21 | 213,140 | – | – | – | – | 33,223 | |||||||||||||||||||||||||||||||||||||||
LTI performance rights12 | 55,370 | 14-Nov-11 | 14-Nov-14 | 14-Nov-16 | – | – | – | (29,908) | 54 | 742,699 | – | – | – | – | 25,462 | |||||||||||||||||||||||||||||||||||||||
C Page10 | STI deferred shares | 15,350 | 13-Nov-09 | 13-Nov-11 | – | 15,350 | 100 | 317,866 | – | – | – | (15,350) | 100 | 315,375 | – | – | ||||||||||||||||||||||||||||||||||||||
STI deferred shares | 11,809 | 12-Nov-10 | 12-Nov-11 | – | 11,809 | 100 | 244,540 | – | – | – | (11,809) | 100 | 242,623 | – | – | |||||||||||||||||||||||||||||||||||||||
STI deferred shares11 | 15,403 | 14-Nov-11 | 14-Nov-12 | – | – | – | – | – | – | – | – | – | – | – | 15,403 | |||||||||||||||||||||||||||||||||||||||
STI deferred shares11 | 15,402 | 14-Nov-11 | 14-Nov-13 | – | – | – | – | – | – | – | – | – | – | – | 15,402 | |||||||||||||||||||||||||||||||||||||||
LTI performance rights | 38,038 | 31-Oct-08 | 31-Oct-11 | 30-Oct-13 | 38,038 | 100 | 830,293 | – | – | – | (38,038) | 100 | 794,523 | – | – | |||||||||||||||||||||||||||||||||||||||
LTI performance rights | 34,921 | 13-Nov-09 | 16-Dec-11 | 16-Mar-12 | 24,250 | 69 | 507,812 | (10,671) | 31 | 223,458 | – | – | – | 24,250 | – | |||||||||||||||||||||||||||||||||||||||
28

| 1 | The maximum value at the time of the grant is determined by multiplying the number granted by the fair value of the equity instruments. The minimum value of the grants, if the applicable conditions are not met at vesting date, is nil. Options/rights granted include those granted as remuneration to the five highest paid executives in the Company and the Group (being the five highest paid, relevant Group and Company executives who participate in making decisions that affect the whole, or a substantial part, of the business of the Company or who have the capacity to significantly affect the Company’s financial standing). No options/rights have been granted since the end of 2012 up to the signing of the Director’s Report on 5 November 2012. |
| 2 | The value of shares and/or share rights and/or performance rights is based on the one day VWAP of the Company’s shares traded on the ASX on the date of vesting, lapsing or exercising, multiplied by the number of shares and/or share rights and/or performance rights. The value of options is based on the difference between the one day VWAP and the exercise price, multiplied by the number of options. |
| 3 | For KMP who ceased employment during 2012, the number of equity instruments “Vested and exercisable” are as at their date of cessation. |
| 4 | D Hisco – Hurdled options granted 5 November 2004 were exercised on 4 November 2011. One day VWAP on date of exercise was $20.9933. The exercise price was $20.68. STI deferred share rights granted 12 November 2010 were exercised on 14 November 2011. One day VWAP on date of exercise was $20.8876. |
| 5 | G Hodges – Hurdled options granted 5 November 2004 were exercised on 4 November 2011. One day VWAP on date of exercise was $20.9933. The exercise price was $20.68. LTI performance rights granted 31 October 2008 were exercised on 9 November 2011. One day VWAP on date of exercise was $21.8346. |
| 6 | J Phillips – was appointed to the CEO Global Wealth & Private Banking role on 1 March 2012 and no equity transactions were applicable for the period. |
| 7 | A Thursby – LTI performance rights granted 31 October 2008 were exercised on 4 November 2011. One day VWAP on date of exercise was $20.9933. |
| 8 | N Williams – was appointed to the Chief Risk Officer role on 17 December 2011 and no equity transactions were applicable for the period. |
| 9 | P Marriott – ceased employment 31 August 2012 so equity transactions are to that date. Transactions include those that transpired prior to cessation and those that were forfeited on cessation. Hurdled options granted 5 November 2004 were exercised on 4 November 2011. One day VWAP on date of exercise was $20.9933. The exercise price was $20.68. STI deferred options granted 31 October 2008 were exercised on 11 May 2012. One day VWAP on date of exercise was $22.0692. The exercise price was $17.18. LTI performance rights granted 31 October 2008 were exercised on 10 November 2011. One day VWAP on date of exercise was $20.6017. |
| 10 | C Page – retired 16 December 2011 so equity transactions are to that date. Transactions include those that transpired prior to cessation and those that were forfeited on cessation. Treatment of equity on retirement is in line with treatment of equity on redundancy. LTI performance rights granted 31 October 2008 were exercised on 14 November 2011. One day VWAP on date of exercise was $20.8876. Due to cessation, 11,452 LTI deferred shares granted 12 November 2010 were forfeited and processed by Computershare on 20 December 2011. |
| 11 | The Disclosed Executives had a proportion of their STI amount deferred as equity. In 2012 D Hisco received share rights rather than shares due to taxation regulations in New Zealand. A share right effectively provides a right in the future to acquire a share in ANZ at nil cost to the employee. Refer to the STI arrangements section for further details of the mandatory deferral arrangements for the Disclosed Executives and Tables 8 and 9 for details of the valuation methodology, inputs and fair value. |
| 12 | The 2011 LTI grants for Disclosed Executives were delivered as performance rights excluding for the CRO. Refer to section 6.2.2 LTI Arrangements for further details and Table 8 for details of the valuation, inputs and fair value. |
Disclosed Executives’ Contract Terms
The following sets out details of the contract terms relating to the Disclosed Executives. The contract terms for all Disclosed Executives are similar, but do on occasion, vary to suit different needs.
| Length of contract | Disclosed Executives are on a permanent contract, which is an ongoing employment contract until notice is given by either party.
| |||
| ||||
Notice periods |
In order to terminate the employment arrangements, Disclosed Executives are required to provide the Company with six months’ written notice. ANZ must provide Disclosed Executives with 12 months’ written notice.
| |||
| ||||
Resignation |
On resignation, unless the Board determines otherwise, all unvested deferred shares, all unvested or vested but unexercised performance rights, all options and all deferred share rights are forfeited.
| |||
| ||||
Termination on notice by ANZ |
ANZ may terminate the Disclosed Executive’s employment by providing 12 months’ written notice or payment in lieu of the notice period based on fixed remuneration. On termination on notice by ANZ, unless the Board determines otherwise: | |||
| n | all unvested deferred shares, performance rights, options and deferred share rights are forfeited at the time notice is given to the Disclosed Executive; and | |||
| n | only performance rights, options and deferred share rights that are vested may be exercised. | |||
| ||||
Redundancy |
If ANZ terminates employment for reasons of redundancy, a severance payment will be made that is equal to 12 months’ fixed remuneration.
All STI deferred shares and STI deferred share rights remain subject to clawback and are released at the original vesting date. Options, performance rights, LTI deferred shares and LTI deferred share rights are either released in full or on a pro-rata basis, at the discretion of the Board with regard to the circumstances.
| |||
| ||||
Death or total and permanent disablement
|
On death or total and permanent disablement all unvested STI deferred shares, all deferred share rights, performance rights and all options will vest. | |||
| ||||
Termination for serious misconduct |
ANZ may immediately terminate the Disclosed Executive’s employment at any time in the case of serious misconduct, and the employee will only be entitled to payment of fixed remuneration up to the date of termination.
On termination without notice by ANZ in the event of serious misconduct any options, performance rights, deferred shares and deferred share rights still held in trust will be forfeited.
| |||
| ||||
Statutory Entitlements
|
Payment of statutory entitlements of long service leave and annual leave applies in all events of separation. | |||
| ||||
Other arrangements |
P Chronican
As Mr Chronican joined ANZ in November 2009 he was not included in the LTI grants made to other Management Board members in early November 2009. Accordingly, a separate LTI grant was made in December 2009 providing performance rights on the same terms and conditions as those provided to Management Board for 2009, apart from the allocation value which varied to reflect the different values at the respective grant dates.
A Thursby
As part of Mr Thursby’s employment arrangement, he was granted three separate tranches of deferred shares to the value of $1 million per annum, subject to Board approval. The first tranche was granted in September 2007 and vested in September 2010, the second tranche was granted in August 2008 and vested in August 2011, and the third tranche was granted in September 2009 and vested in September 2012.
| |||
| ||||
REMUNERATION REPORT 29

8.4 REMUNERATION TABLES – CEO AND DISCLOSED EXECUTIVES
Table 6: Non Statutory Remuneration, has been prepared to provide shareholders with a view of remuneration structure and how remuneration was paid or communicated to the CEO and Disclosed Executives for 2011 and 2012. The Board believes presenting
information in this way provides the shareholder with increased clarity and transparency of the CEO and Disclosed Executives’ remuneration, clearly showing the amounts awarded for each remuneration component (fixed remuneration, STI and LTI) within the financial year. Details of prior year awards which may have vested in 2011 and 2012 are provided in the footnotes.
Individuals included in table
| Fixed remuneration
| Non monetary benefits
| Long service leave
| |||||
Non Statutory Table | CEO and
(pro rated for period
| Total of cash salary and superannuation contributions | Non monetary benefits which typically consists of company-funded benefits and fringe benefits tax payable on these benefits | Not included | ||||
Statutory Table | CEO, Current and
(pro rated for period of year as a KMP)
| Cash salary and superannuation contributions, when totalled the value is the same as above | As above | Long service leave accrued during the year | ||||
| 1 | Subject to Shareholder approval for the CEO |
| TABLE 6: NON STATUTORY REMUNERATION | Fixed | |||||||||||||||||||||
Financial |
Remuneration1
$ |
Non monetary
$ |
Cash
$ |
Deferred as
$ | ||||||||||||||||||
CEO and Current Disclosed Executives | ||||||||||||||||||||||
M Smith2 Chief Executive Officer | 2012 2011 |
| 3,150,000 3,150,000 |
|
| 121,900 105,515 |
|
| 1,900,000 1,750,000 |
|
| 1,800,000 1,550,000 |
| |||||||||
P Chronican3 Chief Executive Officer, Australia | 2012 2011 |
| 1,300,000 1,300,000 |
|
| 7,590 5,744 |
|
| 850,000 900,000 |
|
| 750,000 700,000 |
| |||||||||
S Elliott4 Chief Financial Officer | 2012 2011 |
| 1,187,000 1,050,000 |
|
| 40,853 10,191 |
|
| 1,100,000 604,000 |
|
| 1,000,000 404,000 |
| |||||||||
D Hisco5 Chief Executive Officer, New Zealand | 2012 2011 |
| 1,000,000 960,000 |
|
| 309,757 357,283 |
|
| 900,000 902,400 |
|
| 800,000 710,400 |
| |||||||||
G Hodges6 Deputy Chief Executive Officer | 2012 2011 |
| 1,000,000 1,000,000 |
|
| 13,789 24,350 |
|
| 650,000 700,000 |
|
| 550,000 500,000 |
| |||||||||
J Phillips7 CEO Global Wealth & Private Banking | 2012 | 580,000 | 5,500 | 377,000 | 319,000 | |||||||||||||||||
A Thursby8 Chief Executive Officer, International & Institutional Banking | 2012 2011 |
| 1,187,000 1,050,000 |
|
| 7,590 7,375 |
|
| 1,100,000 900,000 |
|
| 1,000,000 700,000 |
| |||||||||
N Williams9 Chief Risk Officer | 2012 | 790,000 | 32,675 | 533,250 | 454,250 | |||||||||||||||||
| 1 | Fixed remuneration was unchanged for Disclosed Executives, other than those promoted during the year whose remuneration was increased to reflect expanded responsibilities. |
| 2 | M Smith – The 2012 LTI relates to the LTI grant that is proposed for 2012, subject to approval by shareholders at the 2012 Annual General Meeting. The 2011 LTI relates to the LTI grant approved by shareholders at the 2011 Annual General Meeting. Non monetary benefits include car parking, life insurance and taxation services. In 2012 equity to the value of $1,936,189 vested in respect of previously disclosed deferred STI granted in 2009 and 2010. Also, equity to the value of $5,370,176 vested in respect of previously disclosed deferred LTI granted in 2007, as approved by shareholders. In addition, equity to the value of $4,732,490 vested in respect of previously disclosed Special Options granted in 2008, as approved by shareholders. |
| 3 | P Chronican – Non monetary benefits include car parking expenses. In 2012 equity to the value of $262,017 vested in respect of previously disclosed deferred STI granted in 2010. |
| 4 | S Elliott – Fixed remuneration represents what was paid during the year (an increase to $1,250,000 occurred at date of promotion, 1 March 2012 – this figure has been referenced to calculate STI as a % of target and maximum opportunity). Non monetary benefits include car parking and taxation services/expenses. In 2012 equity to the value of $273,800 vested in respect of previously disclosed deferred STI granted in 2009 and 2010. |
| 5 | D Hisco – Commenced in role on 13 October 2010 so 2011 remuneration reflects amounts received for the partial service for the 2011 year. Non monetary benefits include relocation expenses such as housing assistance, and car parking and taxation services expenses. |
30
The information provided in Table 6 is non statutory information and differs from the information provided in Table 7: Statutory
Remuneration on page 32, which has been prepared in accordance with Australian Accounting Standards. A description of the difference between the two tables is provided below:
Retirement benefits
| STI
| LTI
| Other equity allocations
| |||||
| Not included | STI awarded in Nov 2012 expressed as a cash value plus a deferred equity grant value
| Communicated value of LTI granted in Nov/Dec1 2012 | Nil, as nothing awared in 2011 or 2012 | |||||
The equity fair value multiplied
| ||||||||
Retirement benefit accrued during the year. This relates to a retirement allowance available to individuals employed prior to Nov 1992 | Includes cash STI (Nov 2012 element only) and amortised STI for deferred equity from prior year awards
Amortised STI values relate 2010 and 2011
| Amortised LTI values relate to LTI awards made in Nov 2008 and 2009, and Nov/Dec 2010 and 2011 | Amortised values for equity awards made in prior years, excluding STI and LTI awards | |||||
Equity is equally amortised over the vesting period of the award.
| ||||||||
| STI | LTI | Total Remuneration | ||||||||||||||||||||||
Total
$ | As % of target
% |
As % of maximum
% |
Total (deferred as
$ | Received
$ | Deferred as equity
$ | Total
$ | ||||||||||||||||||
3.700.000 3.300.000 |
| 117% 105% |
| 47% 42% |
| 3,150,000 3,150,000 |
|
| 5,171,900 5,005,515 |
|
| 4,950,000 4,700,000 |
|
| 10,121,900 9,705,515 |
| ||||||||
1,600,000 1,600,000 |
| 103% 103% |
| 41% 41% |
| 650,000 650,000 |
|
| 2,157,590 2,205,744 |
|
| 1,400,000 1,350,000 |
|
| 3,557,590 3,555,744 |
| ||||||||
2,100,000 1,008,000 |
| 140% 80% |
| 56% 32% |
| 1,200,000 650,000 |
|
| 2,327,853 1,664,191 |
|
| 2,200,000 1,054,000 |
|
| 4,527,853 2,718,191 |
| ||||||||
1,700,000 1,612,800 |
| 142% 140% |
| 57% 56% |
| 500,000 480,000 |
|
| 2,209,757 2,219,683 |
|
| 1,300,000 1,190,400 |
|
| 3,509,757 3,410,083 |
| ||||||||
1,200,000 1,200,000 |
| 100% 100% |
| 40% 40% |
| 500,000 500,000 |
|
| 1,663,789 1,724,350 |
|
| 1,050,000 1,000,000 |
|
| 2,713,789 2,724,350 |
| ||||||||
| 696,000 | 100% | 40% | 290,000 | 962,500 | 609,000 |
| 1,571,500
|
| ||||||||||||||||
2,100,000 1,600,000 |
| 140% 127% |
| 56% 51% |
| 1,200,000 700,000 |
|
| 2,294,590 1,957,375 |
|
| 2,200,000 1,400,000 |
|
| 4,494,590 3,357,375 |
| ||||||||
| 987,500 | 104% | 42% | 474,000 | 1,355,925 | 928,250 |
| 2,284,175
|
| ||||||||||||||||
| In 2012 equity to the value of $297,076 vested in respect of deferred STI granted in 2009 and 2010. In addition, equity to the value of $508,199 vested in respect of deferred LTI granted in 2008. |
| 6 | G Hodges – Non monetary benefits include car parking and taxation services. In 2012 equity to the value of $355,078 vested in respect of previously disclosed deferred STI granted in 2009 and 2010. In addition, equity to the value of $1,092,491 vested in respect of previously disclosed deferred LTI granted in 2008. |
| 7 | J Phillips – Commenced in role 1 March 2012 so remuneration (fixed, STI and LTI) reflects amounts received for the partial service for the 2012 year. Non monetary benefits include taxation services. |
| 8 | A Thursby – Fixed remuneration represents what was paid during the year (an increase to $1,250,000 occurred at date of promotion, 1 March 2012 – this figure has been referenced to calculate STI as a % of target and maximum opportunity). Non monetary benefits include car parking expenses. In 2012 equity to the value of $1,047,116 vested in respect of previously disclosed deferred STI granted in 2009 and 2010 and equity to the value of $1,201,741 vested in respect of previously disclosed deferred LTI granted in 2008. In addition, equity to the value of $1,081,040 vested in respect of previously disclosed equity granted in 2009 in connection with his commencement with ANZ. |
| 9 | N Williams – Commenced in role 17 December 2011 so remuneration (fixed, STI and LTI) reflects amounts received for the partial service for the 2012 year. Non monetary benefits include relocation, car parking and taxation services expenses. |
REMUNERATION REPORT 31

TABLE 7: STATUTORY REMUNERATION – CEO AND DISCLOSED EXECUTIVE REMUNERATION FOR 2012 AND 2011
Short-Term Employee Benefits
| Post-Employment
| |||||||||||||||||||||||||
Financial Year
| Cash salary
$ | Non monetary
$ | Total cash incentive2,3
$ | Super contributions4
$ | Retirement benefit accrued during year5
$ | |||||||||||||||||||||
CEO and Current Disclosed Executives | ||||||||||||||||||||||||||
M Smith10 | 2012 | 3,150,000 | 121,900 | 1,900,000 | – | – | ||||||||||||||||||||
Chief Executive Officer | 2011 | 3,150,000 | 105,515 | 1,750,000 | – | – | ||||||||||||||||||||
P Chronican | 2012 | 1,192,661 | 7,590 | 850,000 | 107,339 | – | ||||||||||||||||||||
Chief Executive Officer, Australia | 2011 | 1,191,030 | 5,744 | 900,000 | 107,339 | – | ||||||||||||||||||||
S Elliott | 2012 | 1,088,991 | 40,853 | 1,100,000 | 98,009 | – | ||||||||||||||||||||
Chief Financial Officer | 2011 | 963,303 | 10,191 | 604,000 | 86,697 | – | ||||||||||||||||||||
D Hisco11, 12 | 2012 | 1,000,000 | 309,757 | 900,000 | – | 4,237 | ||||||||||||||||||||
Chief Executive Officer, New Zealand | 2011 | 960,000 | 357,283 | 902,400 | – | 4,107 | ||||||||||||||||||||
G Hodges12 | 2012 | 917,431 | 13,789 | 650,000 | 82,569 | 4,237 | ||||||||||||||||||||
Deputy Chief Executive Officer | 2011 | 917,431 | 24,350 | 700,000 | 82,569 | 4,278 | ||||||||||||||||||||
J Phillips11 CEO Global Wealth & Private Banking | 2012 | 532,110 | 5,500 | 377,000 | 47,890 | – | ||||||||||||||||||||
A Thursby | 2012 | 1,187,000 | 7,590 | 1,100,000 | – | – | ||||||||||||||||||||
Chief Executive Officer International & Institutional Banking | 2011 | 1,050,000 | 7,375 | 900,000 | – | – | ||||||||||||||||||||
N Williams11 Chief Risk Officer | 2012 | 724,771 | 32,675 | 533,250 | 65,229 | 20,477 | ||||||||||||||||||||
Former Disclosed Executives | ||||||||||||||||||||||||||
P Marriott11 | 2012 | 886,239 | 20,229 | 412,500 | 79,761 | – | ||||||||||||||||||||
| Former Chief Financial Officer | 2011 | 915,830 | 5,774 | 820,000 | 82,569 | – | ||||||||||||||||||||
C Page11 | 2012 | 211,927 | 14,257 | – | 19,073 | – | ||||||||||||||||||||
| Former Chief Risk Officer | 2011 | 1,009,174 | 7,375 | 850,000 | 90,826 | – | ||||||||||||||||||||
Total of all Executive KMPs13 | 2012 | 10,891,130 | 574,140 | 7,822,750 | 499,870 | 28,951 | ||||||||||||||||||||
| 2011 | 10,156,768 | 523,607 | 7,426,400 | 450,000 | 8,385 | |||||||||||||||||||||
| 1 | Non monetary benefits generally consist of company-funded benefits such as car parking and taxation services. This item also includes costs met by the company in relation to relocation, such as housing assistance, gifts received on leaving ANZ for former Disclosed Executives, and for the CEO, life insurance. The fringe benefits tax payable on any benefits is also included in this item. |
| 2 | The total cash incentive relates to the cash component only, with the deferred equity component to be amortised from the grant date. The relevant amortisation of the 2011 STI deferred components are included in share-based payments. The 2012 STI deferred components will be amortised from the grant date in the 2013 Remuneration Report. The cash incentive component was approved by the Board on 23 October 2012. 100% of the cash incentive awarded for the 2011 and 2012 years vested to the Disclosed Executive in the applicable financial year. |
| 3 | The possible range of STI is between 0 and 2.5 times target STI. The actual STI received is dependent on ANZ, Division and individual performance (refer to Section 6.2.1 for more details). The 2012 STI awarded (cash and equity component) as a percentage of target STI was: M Smith 117% (2011: 105%); P Chronican 103% (2011: 103%); S Elliott 140% (2011: 80%); D Hisco 142% (2011: 140%); G Hodges 100% (2011: 100%); J Phillips 100%; A Thursby 140% (2011: 127%); N Williams 104%; P Marriott 86% – prorated to date ceased in role, 31 May 2012 (2011: 120%); C Page (2011: 114%). Anyone who received less than 100% of target forfeited the rest of their STI entitlement. The minimum value is nil and the maximum value is what was actually paid. |
| 4 | As M Smith and A Thursby are holders of long stay visas, their fixed remuneration does not include the 9% Superannuation Guarantee Contribution, however they are able to elect voluntary superannuation contributions. For all other Australian based Disclosed Executives, the superannuation contribution reflects the 9% Superannuation Guarantee Contribution – individuals may elect to take this contribution as superannuation or a combination of superannuation and cash. |
| 5 | Accrual relates to Retirement Allowance. As a result of being employed with ANZ prior to November 1992, D Hisco, G Hodges and N Williams are eligible to receive a Retirement Allowance on retirement, retrenchment, death, or resignation for illness, incapacity or domestic reasons. The Retirement Allowance is calculated as follows: three months of preserved notional salary (which is 65% of Fixed Remuneration) plus an additional 3% of notional salary for each year of fulltime service above 10 years, less the total accrual value of long service leave (including taken and untaken). |
| 6 | In accordance with the requirements of AASB 2, the amortisation value includes a proportion of the fair value (taking into account market-related vesting conditions) of all equity that had not yet fully vested as at the commencement of the financial year. It is assumed that deferred shares will vest after three years. Assumptions for options/rights are detailed in Table 8. The fair value is determined at grant date and is allocated on a straight-line basis over the relevant vesting period. The amount included as remuneration is not related to nor indicative of the benefit (if any) that may ultimately be realised should the options/rights become exercisable. For deferred shares, the fair value is the volume weighted average price of the Company’s shares traded on the ASX on the day the shares were granted. |
| 7 | Amortisation of other equity allocations for M Smith relates to the special equity allocation which was approved by shareholders at the 2008 Annual General Meeting. Amortisation for S Elliott and A Thursby relates to equity granted on commencement. |
| 8 | Remuneration amounts disclosed exclude insurance premiums paid by the consolidated entity in respect of directors’ and officers’ liability insurance contracts which cover current and former KMP of the controlled entities. The total premium, which cannot be disclosed because of confidentiality requirements, has not been allocated to the individuals covered by the insurance policy as, based on all available information, the directors believe that no reasonable basis for such allocation exists. |
32

Long-Term Employee Benefits | Share-Based Payments6
| |||||||||||||||||||
| Total amortisation value of | ||||||||||||||||||||
| STI | LTI | Other equity allocations7 | ||||||||||||||||||
Long service
$ | Shares
$ | Options and
$ | Shares
$ | Rights
$ | Shares
$ | Options
$ | Termination benefits
$ | Grand total
$ | ||||||||||||
| ||||||||||||||||||||
| 48,079 | 1,750,829 | – | – | 2,590,496 | – | 113,189 | – | 9,674,493 | ||||||||||||
| 54,804 | 2,103,407 | – | – | 2,346,954 | – | 528,216 | – | 10,038,896 | ||||||||||||
| 19,842 | 637,349 | – | – | 623,306 | – | – | – | 3,438,087 | ||||||||||||
| 19,788 | 390,271 | – | – | 406,838 | – | – | – | 3,021,010 | ||||||||||||
| 22,985 | 438,387 | 178,342 | – | 540,049 | – | – | – | 3,507,616 | ||||||||||||
| 16,998 | 389,245 | 386,466 | – | 327,641 | 43,921 | – | – | 2,828,462 | ||||||||||||
| 15,263 | 7,788 | 602,172 | 10,958 | 412,856 | – | – | – | 3,263,031 | ||||||||||||
| 14,613 | 78,245 | 238,076 | 127,644 | 248,567 | – | – | – | 2,930,935 | ||||||||||||
| 15,263 | 477,366 | – | – | 493,164 | – | – | – | 2,653,819 | ||||||||||||
| 15,222 | 406,248 | 7,688 | – | 498,629 | – | – | – | 2,656,415 | ||||||||||||
|
| 10,710
|
| 225,957 | – | – | 258,774 | – | – | – | 1,457,941 | ||||||||||
| 26,625 | 838,469 | – | – | 586,415 | 329,842 | – | – | 4,075,941 | ||||||||||||
|
| 18,326
|
| 1,121,512 | 9,938 | – | 542,653 | 642,574 | – | – | 4,292,378 | ||||||||||
|
| 120,504
|
| 494,744 | – | 373,958 | 9,198 | – | – | – | 2,374,806 | ||||||||||
|
|
|
| ||||||||||||||||||
| – | 778,868 | – | – | 646,594 | – | – | 1,154,384 | 3,978,575 | ||||||||||||
| 15,222 | 407,040 | 2,923 | – | 498,629 | – | – | – | 2,747,987 | ||||||||||||
| – | 849,289 | – | 27,986 | 39,377 | – | – | 16,842 | 1,178,751 | ||||||||||||
| 16,744 | 577,532 | – | 122,803 | 267,465 | – | – | – | 2,941,919 | ||||||||||||
| 279,271 | 6,499,046 | 780,514 | 412,902 | 6,200,229 | 329,842 | 113,189 | 1,171,226 | 35,603,060 | ||||||||||||
| 171,717 | 5,473,500 | 645,091 | 250,447 | 5,137,376 | 686,495 | 528,216 | – | 31,458,002 | ||||||||||||
| 9 | The disclosed amortised value of rights/options for each KMP as a percentage of Grand Total Remuneration is: M Smith 28%; P Chronican 18%; S Elliott 20%; D Hisco 31%; G Hodges 19%; J Phillips 18%; A Thursby 14%; N Williams 0.5%; P Marriott 16%; C Page 3%. |
| 10 | While the CEO is an Executive Director, he has been included in this table with the Disclosed Executives. |
| 11 | D Hisco was appointed to the CEO, New Zealand role on 13 October 2010 so remuneration reflects amounts received for the partial service for the 2011 year. J Phillips was appointed to the CEO, Global Wealth & Private Banking role on 1 March 2012 so remuneration reflects amounts received for the partial service for the 2012 year. N Williams was appointed to the Chief Risk Officer role on 17 December 2011 so remuneration reflects amounts received for the partial service for the 2012 year. P Marriott ceased employment 31 August 2012 and remuneration is to this date; the STI has been pro-rated to date ceased in role, 31 May 2012. C Page retired 16 December 2011 and remuneration is to this date. |
| 12 | 2011 amortisation of STI shares and STI share rights for G Hodges and D Hisco, included in the 2011 Annual Report under STI shares and share rights, has been included separately with the amortisation of STI shares and STI options and rights in the table above. |
| 13 | For those Disclosed Executives who were disclosed in both 2011 and 2012, the following are noted: |
| – | P Chronican – moderate uplift on year-on-year remuneration, driven by an increase in the amortised value of equity. |
| – | S Elliott – uplift on year-on-year remuneration, driven by a combination of factors including increases in fixed remuneration on promotion, non monetary benefits and cash STI. |
| – | D Hisco – 2011 remuneration only reflected a partial year as he moved from Australia to take up the assignment of CEO, New Zealand in that year. Uplift on year-on-year remuneration due to an increase in the amortised value of equity. |
| – | G Hodges – fixed remuneration remains unchanged and year on year remuneration is similar. |
| – | A Thursby – a decrease year-on-year overall, despite an increase in fixed remuneration and cash STI, due to a decrease in the amortised value of equity. |
| – | P Marriott – 2012 remuneration only reflected a partial year as he concluded in the Chief Financial Officer role 31 May 2012 and ceased employment 31 August 2012. Uplift on year-on-year remuneration with a decrease in partial year cash STI, an increase in amortised value of equity and the receipt of termination benefits (of which nearly half were statutory leave entitlements). |
| – | C Page – 2012 remuneration only reflected a partial year as he retired and therefore concluded in the Chief Risk Officer role 16 December 2011. Only in role partial year (2.5 months), accordingly year-on-year comparisons are not appropriate. |
J Phillips and N Williams are disclosed only for part of the 2012 year from commencement in KMP roles.
REMUNERATION REPORT 33

8.5 STI – PERFORMANCE AND STI CORRELATION
ANZ has had another successful year with performance assessed by the Board as largely being solid and on target across the full range of quantitative and qualitative measures. Metrics associated with shareholder returns have outperformed overall, metrics associated with finance, connectivity and people have been on target overall, and customer satisfaction was assessed as slightly below target overall. The Board has given full consideration to the performance of the Group and the Disclosed Executives in determining their rewards.
For 2012 the average STI for the CEO and Disclosed Executives was 117% of target compared to 110% of target for the prior year. This increase (7%) broadly aligns with the year on year increase in underlying profit (6%).
Figure 3 illustrates the relationship between the average actual STI (cash and deferred equity components) against target and the Group’s performance measured using underlying profit over the last 5 years. The average STI payments for each year are based on those executives (including the CEO) disclosed in each relevant reporting period.
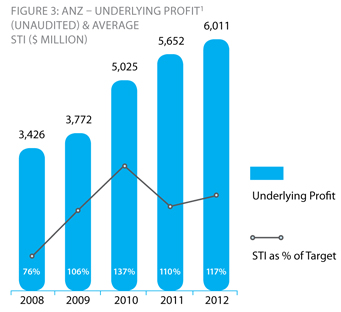
| 1 | Profit has been adjusted for non-core items to arrive at underlying profit, the result for the ongoing business activities of the Group. These adjustments have been determined on a consistent basis with those made in prior periods. The adjustments made in arriving at underlying earnings are included in statutory profit which is subject to audit within the context of the Group statutory audit opinion. Underlying profit is not audited, however, the external auditor has informed the Audit Committee that the adjustments, and the presentation thereof, are based on the guidelines released by the Australian Institute of Company Directors (AICD) and the Financial Services Institute of Australasia (FINSIA). Further details on underlying profit are provided on page 55. |
9. Equity
All shares underpinning equity awards may be purchased on market, or be newly issued shares or a combination of both. For the 2011 equity granted to the CEO and Disclosed Executives, all STI deferred shares were purchased on market and for LTI performance rights, the approach to satisfy awards will be determined closer to the time of vesting.
9.1 EQUITY VALUATIONS
ANZ engages two external experts (Mercer (Australia) Pty Ltd and PricewaterhouseCoopers) to independently value any required options, deferred share rights and performance rights, taking into account factors including the performance conditions, share price volatility, life of instrument, dividend yield and share price at grant date. These valuations are then audited by KPMG and ANZ Global Internal Audit. The higher of the two valuations is then approved by the HR Committee as the allocation and/or expensing/disclosure value (referencing the higher valuation results in fewer instruments being granted). The following table provides details of the valuations of the various equity instruments issued during the year:
TABLE 8: EQUITY VALUATION INPUTS – OPTIONS/RIGHTS
| Recipients | Type of equity | Grant date | Exercise price $ | Equity fair value $ | Share price at grant $ | ANZ expected volatility % | Equity term (years) | Vesting period (years) | Expected life (years) | Expected dividend yield % | Risk free interest rate % | |||||||||||||||||||||||||||||
Executives | STI deferred share rights | 14-Nov-11 | 0.00 | 19.40 | 20.66 | 25 | 3 | 1 | 1 | 6.50 | 3.70 | |||||||||||||||||||||||||||||
Executives | STI deferred share rights | 14-Nov-11 | 0.00 | 18.21 | 20.66 | 25 | 4 | 2 | 2 | 6.50 | 3.65 | |||||||||||||||||||||||||||||
Executives | LTI performance rights | 14-Nov-11 | 0.00 | 9.03 | 20.66 | 25 | 5 | 3 | 3 | 6.50 | 3.53 | |||||||||||||||||||||||||||||
CEO | LTI performance rights | 16-Dec-11 | 0.00 | 9.65 | 20.93 | 25 | 5 | 3 | 3 | 7.00 | 3.06 | |||||||||||||||||||||||||||||
TABLE 9: EQUITY VALUATION INPUTS – DEFERRED SHARES
| Recipients | Type of equity | Grant date | Equity fair value1 $ | Share closing price at grant $ | Vesting period (years) | |||||||||||
CEO and Executives | STI deferred shares | 14-Nov-11 | 20.89 | 20.66 | 1 | |||||||||||
CEO and Executives | STI deferred shares | 14-Nov-11 | 20.89 | 20.66 | 2 | |||||||||||
| 1 | The volume weighted average share price of all ANZ shares sold on the ASX on the date of grant is used to calculate the fair value of shares. No dividends are incorporated into the measurement of the fair value of shares. |
34

9.2 LEGACY LTI PROGRAM
Following are details relating to a legacy LTI program which is no longer offered but which has existing participants.
Type of Equity
| Details
| |||||
Hurdled options (Hurdled B) (granted November 2004) |
In November 2004 hurdled options were granted with a relative TSR performance hurdle attached. The proportion of options that become exercisable will depend upon the TSR achieved by ANZ relative to the companies in the comparator group. Performance equal to the median TSR of the comparator group will result in half the options becoming exercisable. Performance above median will result in further options becoming exercisable, increasing on a straight-line basis until all of the options become exercisable where ANZ’s TSR is at or above the 75th percentile in the comparator group. Where ANZ’s performance falls between two of the comparators, TSR is measured on a pro rata basis. The exercise period concluded on 4 November 2011.
| |||||
Plan Features |
n |
an exercise price is set equal to the weighted average sale price of all fully paid ordinary shares in the Company sold on the ASX during the one week prior to and including the date of grant; | ||||
n |
a maximum life of seven years and an exercise period that commences three years after the date of grant, subject to performance hurdles being met; | |||||
n |
options are re-tested monthly (if required) after the commencement of the exercise period; | |||||
n |
upon exercise, each option entitles the option-holder to one ordinary share; | |||||
n |
in case of resignation or termination on notice or dismissal for misconduct: options are forfeited; | |||||
n |
in case of redundancy: options are pro-rated and a grace period is provided in which to exercise the remaining options (with hurdles waived, if applicable); and | |||||
n |
in case of retirement, death or total and permanent disablement: a grace period is provided in which to exercise all options (with hurdles waived, if applicable).
| |||||
Signed in accordance with a resolution of the Directors.
 |  | |
| John Morschel | Michael R P Smith | |
| Chairman | Director | |
| 5 November 2012 | ||
REMUNERATION REPORT 35

2012 Key Areas of Focus and Achievements
| ||||||||||||
| n | Oversight of strategic initiatives, including ANZ’s growth in the Asia Pacific region and the challenges facing the banking industry in the Australian and New Zealand domestic environments. | n | Completion of a performance review of the Board by an independent external assessor who presented the outcomes to Directors in October 2011. | |||||||||
n |
Continued careful monitoring of increasing regulatory requirements in relation to capital and funding, and of the management of ANZ’s businesses in that changing environment. | n | Appointment of Ms Dwyer as a new Non-Executive Director as part of a managed succession plan having regard to the scheduled retirement of three Non-Executive Directors in late 2013. | |||||||||
n |
Review of the impacts arising from the continuing volatility and uncertainties in global markets (including Europe in particular) and the implications for ANZ, including both the potential risks and opportunities. |
n |
Recognition of ANZ as the leading bank globally on the Dow Jones Sustainability Index. ANZ has sustained a high level of performance on this Index for eleven years in succession. This year ANZ received a rating of 95/100 for Corporate Governance as part of the assessment – this represents the global sector leading score compared to a global sector average of 71/100.
| |||||||||
Approach to Governance
In relation to corporate governance, the Board seeks to:
| n | embrace principles and practices it considers to be best practice internationally; |
| n | be an ‘early adopter’, where appropriate, by complying before a published law or recommendation takes effect; and |
| n | take an active role in discussions of corporate governance best practice and associated regulation in Australia and overseas. |
Compliance with Corporate Governance Codes
ANZ has equity securities listed on the Australian Securities Exchange (ASX) and the New Zealand Stock Exchange (NZX), and debt securities listed on these and other overseas Securities Exchanges. ANZ must therefore comply (and has complied) with a range of listing and corporate governance requirements from Australia and overseas.
AUSTRALIA
As a company listed on the ASX, ANZ is required to disclose how it has applied the Recommendations contained within the ASX Corporate Governance Council’s Corporate Governance Principles and Recommendations (ASX Governance Principles) during the financial year, explaining any departures from them. ANZ confirms it has followed the Recommendations of the ASX Corporate Governance Council during the reporting period.
Full details of the location of the references in this statement (and elsewhere in this Annual Report) which specifically set out how ANZ applies each Recommendation of the ASX Governance Principles are contained on anz.com > About us > Our company > Corporate governance.
Changes to the ASX Governance Principles came into effect for ANZ’s financial year beginning on 1 October 2011. ANZ has taken steps to comply with these changed requirements.
NEW ZEALAND
As an overseas listed issuer on the NZX, ANZ is deemed to comply with the NZX Listing Rules provided that it remains listed on the ASX, complies with the ASX Listing Rules and provides the NZX with all the information and notices that it provides to the ASX.
The ASX Governance Principles may materially differ from the NZX’s corporate governance rules and the principles of the NZX’s Corporate Governance Best Practice Code. More information about the corporate governance rules and principles of the ASX can be found at asx.com.au and, in respect of the NZX, at nzx.com.
ANZ has complied with all applicable governance principles in New Zealand throughout the financial year.
OTHER JURISDICTIONS
ANZ also monitors best practice developments in corporate governance across other relevant jurisdictions.
ANZ deregistered from the US Securities Exchange Commission (SEC) with effect from October 2007. Despite no longer being required to comply with United States of America (US) corporate governance rules, ANZ’s corporate governance practices continue to have regard to US corporate governance regulations in relation to the independence of Directors, the independence of the external auditor and the financial expertise of the Audit Committee, as described in this statement.
| 36 |

Website
Further details of ANZ’s governance framework are set out at anz.com > About us > Our company > Corporate governance.
This section of ANZ’s website also contains copies of all the Board/ Board Committee charters and summaries of many of the documents and policies mentioned in this statement, as well as summaries of other ANZ policies of interest to shareholders and stakeholders. The website is regularly updated to ensure it reflects ANZ’s most recent corporate governance information.
Directors
The information below relates to the Directors in office and sets out their Board Committee memberships and other details, as at 30 September 2012.
Mr J P Morschel Chairman, Independent Non-Executive Director
DIPQS, FAICD
Non-Executive Director since October 2004. Ex officio member of all Board Committees.
Skills, experience and expertise
Mr Morschel has a strong background in banking, financial services and property and brings the experience of being a Chairman and Director of major Australian and international companies.
Current Directorships
Director: CapitaLand Limited (from 2010), Tenix Group Pty Limited (from 2008) and Gifford Communications Pty Limited (from 2000).
Former Directorships include
Former Chairman: Rinker Group Limited (Chairman and Director 2003-2007), Leighton Holdings Limited (Chairman and Director 2001-2004) and CSR Limited (Director 1996-2003, Chairman 2001-2003).
Former Director: Singapore Telecommunications Limited (20012010), Rio Tinto Plc (1998-2005), Rio Tinto Limited (1998-2005), Westpac Banking Corporation (1993-2001), Lend Lease Corporation Limited (1983-1995) and Tenix Pty Ltd (1998-2008).
Age: 69. Residence: Sydney, Australia.
Mr M R P Smith, OBE, Chief Executive Officer, Executive Director
BSC (HONS)
Chief Executive Officer since 1 October 2007.
Skills, experience and expertise
Mr Smith is an international banker with over 30 years experience in banking operations in Asia, Australia and internationally. Until June 2007, he was President and Chief Executive Officer, The Hongkong and Shanghai Banking Corporation Limited, Chairman, Hang Seng Bank Limited, Global Head of Commercial Banking for the HSBC Group and Chairman, HSBC Bank Malaysia Berhad. Previously, Mr Smith was Chief Executive Officer of HSBC Argentina Holdings SA.
Mr Smith joined the HSBC Group in 1978 and during his international career he has held a wide variety of roles in Commercial, Institutional and Investment Banking, Planning and Strategy, Operations and General Management.
Current Directorships
Chairman: Australian Bankers’ Association Incorporated (from 2011, Member from 2007).
Director: ANZ Bank New Zealand Limited (from 2007), the Financial Markets Foundation for Children (from 2008), Financial Literacy Australia Limited (from 2012), the International Monetary Conference (from 2012) and the Institute of International Finance (from 2010).
Member: Chongqing Mayor’s International Economic Advisory Council (from 2006), Business Council of Australia (from 2007), Asia Business Council (from 2008), Australian Government Financial Literacy Advisory Board (from 2008) and Shanghai International Financial Advisory Council (from 2009).
Fellow: The Hong Kong Management Association (from 2005).
Former Directorships include
Former Chairman: HSBC Bank Malaysia Berhad (2004-2007) and Hang Seng Bank Limited (2005-2007).
Former CEO and Director: The Hongkong and Shanghai Banking Corporation Limited (2004-2007).
Former Director: HSBC Australia Limited (2004-2007), HSBC Finance Corporation (2006-2007) and HSBC Bank (China) Company Limited (2007).
Former Board Member: Visa International (Asia Pacific) Limited (2005-2007).
Age 56. Residence: Melbourne, Australia.
| CORPORATE GOVERNANCE 37 |

Dr G J Clark Independent Non-Executive Director, Chair of the Technology Committee
BSC (HONS), PHD, FAPS, FTSE
Non-Executive Director since February 2004. Member of the Risk Committee and Human Resources Committee.
Skills, experience and expertise
Dr Clark brings to the Board international business experience and a distinguished career in micro-electronics, computing and communications. He was previously Principal of Clark Capital Partners, a US based firm that has advised internationally on technology and the technology market place, and he has held senior executive positions in IBM, News Corporation and Loral Space and Communications.
Current Directorships
Chairman: KaComm Communications Pty Ltd (from 2006) and CUDOS Advisory Board (from 2011).
Member: The Royal Institution of Australia (from 2010).
Former Directorships include
Former Director: Eircom Holdings Ltd (formerly Babcock & Brown Capital Limited) (2006–2009).
Former Principal: Clark Capital Partners (2003–2010).
Age: 69. Residence: Based in New York, United States of America and also resides in Sydney, Australia.
Ms P J Dwyer Independent Non-Executive Director
BCOM, FCA, F FIN, FAICD
Non-Executive Director since April 2012. Member of the Audit Committee and Risk Committee.
Skills, experience and expertise
Ms Dwyer is an established non-executive director with extensive experience in financial services and a strong accounting background, and has previously held executive roles in the investment management, corporate finance and accounting industries.
Current Directorships
Chairman: Tabcorp Holdings Limited (from 2011, Director from 2005). Deputy Chairman: Baker IDI Heart and Diabetes Institute (from 2005).
Director: Leighton Holdings Limited (from 2012) and Lion Pty Ltd (from 2012).
Member: Australian Government Takeovers Panel (from 2008).
Former Directorships include
Former Director: Suncorp Group Limited (2007-2012), Foster’s Group Limited (2011), Astro Japan Property Group Limited (2005-2011), Healthscope Limited (2010) and CCI Investment Management Limited (1999-2011).
Age: 52. Residence: Melbourne, Australia.
Mr P A F Hay Independent Non-Executive Director, Chair of the Governance Committee
LLB (MELB), FAICD
Non-Executive Director since November 2008. Member of the Audit Committee and Human Resources Committee.
Skills, experience and expertise
Mr Hay has a strong background in company law and investment banking advisory work, with a particular expertise in relation to mergers and acquisitions. He has also had significant involvement in advising governments and government-owned enterprises.
Current Directorships
Chairman: Lazard Pty Ltd Advisory Board (from 2009).
Director: Alumina Limited (from 2002), Landcare Australia Limited (from 2008), GUD Holdings Limited (from 2009) and Myer Holdings Limited (from 2010).
Member: Australian Government Takeovers Panel (from 2009).
Former Directorships include
Former Chief Executive Officer: Freehills (2000–2005).
Former Director: NBN Co Limited (2009–2012), Myer Pty Limited (2010-2011) and Lazard Pty Ltd (2007–2009).
Age: 62. Residence: Melbourne, Australia.
38

Mr Lee Hsien Yang Independent Non-Executive Director
MSC, BA
Non-Executive Director since February 2009. Member of the Technology Committee, Risk Committee and Human Resources Committee.
Skills, experience and expertise
Mr Lee has considerable knowledge and operating experience in Asia. He has a background in engineering and brings to the Board his international business and management experience across a wide range of sectors including telecommunications, food and beverages, properties, publishing and printing, financial services, education, civil aviation and land transport.
Current Directorships
Chairman: Fraser & Neave, Limited (from 2007), The Islamic Bank of Asia Limited (from 2012, Director from 2007), Asia Pacific Investments
Pte Ltd (from 2012, Director from 2009) and Civil Aviation Authority of Singapore (from 2009).
Director: Singapore Exchange Limited (from 2004) and Kwa Geok Choo Pte Ltd (from 1979).
Member: Governing Board of Lee Kuan Yew School of Public Policy (from 2005) and Rolls Royce International Advisory Council (from 2007).
Consultant: Capital International Inc Advisory Board (from 2007).
Former Directorships include
Former Chairman: Republic Polytechnic (2002–2009).
Former Member: Merrill Lynch PacRim Advisory Council (2007–2010).
Former Chief Executive Officer: Singapore Telecommunications Limited (1995–2007).
Age: 55. Residence: Singapore.
Mr I J Macfarlane, AC, Independent Non-Executive Director, Chair of the Risk Committee
BEC (HONS), MEC, HON DSC (SYD), HON DSC (UNSW), HON DCOM (MELB), HON DLITT (MACQ), HON LLD (MONASH)
Non-Executive Director since February 2007. Member of the Governance Committee and Audit Committee.
Skills, experience and expertise
During his 28 year career at the Reserve Bank of Australia including a 10 year term as Governor, Mr Macfarlane made a significant contribution to economic policy in Australia and internationally. He has a deep understanding of financial markets as well as a long involvement with Asia.
Current Directorships
Director: Woolworths Limited (from 2007), Leighton Holdings Limited (from 2007) and the Lowy Institute for International Policy (from 2004).
Member: Council of International Advisors to the China Banking Regulatory Commission (from 2009), International Advisory Board of Goldman Sachs JB Were (from 2007) and International Advisory Board of CHAMP Private Equity (from 2007).
Former Directorships include
Former Chairman: Payments System Board (1998–2006) and Australian Council of Financial Regulators (1998–2006).
Former Governor: Reserve Bank of Australia (Member 1992–2006, Chairman 1996-2006).
Age: 66. Residence: Sydney, Australia.
Mr D E Meiklejohn, AM, Independent Non-Executive Director, Chair of the Audit Committee
BCOM, DIPED, FCPA, FAICD, FAIM
Non-Executive Director since October 2004. Member of the Technology Committee and Risk Committee.
Skills, experience and expertise
Mr Meiklejohn has a strong background in finance and accounting. He also brings to the Board his experience across a number of directorships of major Australian companies spanning a range of industries.
Current Directorships
Chairman: Manningham Centre Association Board of Governance (from 2011).
Director: Coca Cola Amatil Limited (from 2005) and Mirrabooka Investments Limited (from 2006).
Former Directorships include
Former Chairman: PaperlinX Limited (1999–2011).
Former Director and Chief Financial Officer: Amcor Limited (1985–2000).
Former President: Melbourne Cricket Club (2007–2011).
Age: 70. Residence: Melbourne, Australia.
| CORPORATE GOVERNANCE 39 |

Ms A M Watkins Independent Non-Executive Director, Chair of the Human Resources Committee
BCOM, FCA, F FIN, FAICD
Non-Executive Director since November 2008. Member of the Audit Committee and Governance Committee.
Skills, experience and expertise
Ms Watkins is an experienced CEO and established director with a grounding in strategy, finance and accounting. Her industry experience includes retailing, agriculture, food processing and financial services. Ms Watkins held senior executive roles with ANZ from 1999 to 2002.
Current Directorships
Chief Executive Officer and Managing Director: GrainCorp Limited (from 2010).
Chairman: Allied Mills Australia Pty Limited (from 2010).
Member: Australian Government Takeovers Panel (from 2010).
Former Directorships include
Former CEO: Bennelong Group (2008-2010).
Former Director: Woolworths Limited (2007-2010) and AICD National Board and Victorian Council (2009-2011).
Former Member: The Nature Conservancy Australian Advisory Board (2007-2011).
Age: 49. Residence: Melbourne, Australia.
Corporate Governance Framework
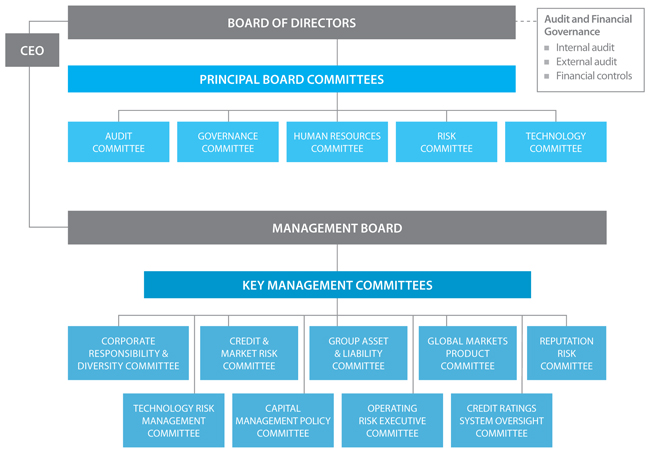
40

Board Responsibility and Delegation of Authority
The Board is chaired by an independent Non-Executive Director. The roles of the Chairman and Chief Executive Officer are separate, and the Chief Executive Officer is the only executive Director on the Board.
Role of the Chairman
The Chairman plays an important leadership role and is involved in:
| n | chairing meetings of the Board and providing effective leadership to it; |
| n | monitoring the performance of the Board and the mix of skills and effectiveness of individual contributions; |
| n | being an ex officio member of all principal Board Committees; |
| n | maintaining ongoing dialogue with the Chief Executive Officer and providing appropriate mentoring and guidance; and |
| n | being a respected ambassador for ANZ, including chairing meetings of shareholders and dealing with key customer, political and regulatory bodies. |
Board Charter
The Board Charter sets out the Board’s purpose, powers, and specific responsibilities.
The Board is responsible for:
| n | charting the direction, strategies and financial objectives for ANZ, and monitoring the implementation of these strategies and financial objectives; |
| n | monitoring compliance with regulatory requirements, ethical standards and external commitments, and the implementation of related policies; and |
| n | appointing and reviewing the performance of the Chief Executive Officer. |
In addition to the above and any matters expressly required by law to be approved by the Board, powers specifically reserved for the Board include:
| n | approval of ANZ’s Remuneration Policy, including various remuneration matters as detailed in the Charter; |
| n | any matters in excess of any discretions delegated to Board Committees or the Chief Executive Officer; |
| n | annual approval of the budget and strategic plan; |
| n | significant changes to organisational structure; and |
| n | the acquisition, establishment, disposal or cessation of any significant business. |
Under ANZ’s Constitution, the Board may delegate any of its powers and responsibilities to Committees of the Board. The roles of the principal Board Committees are set out on pages 46 to 48. The Charters of the Board and each of its principal Committees are set out on anz.com in the Corporate Governance section.
Board Meetings
The Board normally meets at least eight times each year, including a meeting to review in detail the Group’s strategy.
Typically at Board meetings the agenda will include:
| n | minutes of the previous meeting, and outstanding issues raised by Directors at previous meetings; |
| n | the Chief Executive Officer’s report; |
| n | the Chief Financial Officer’s report; |
| n | reports on major projects and current business issues; |
| n | specific business proposals; |
| n | reports from Chairs of Committees which have met shortly prior to the Board meeting on matters considered at those meetings; and |
| n | the minutes of previous Committee meetings for review. |
There are two private sessions held at the end of each Board meeting which are each chaired by the Chairman of the Board.
The first involves all Directors including the CEO, and the second involves only the Non-Executive Directors.
The Chief Financial Officer, Group General Counsel and Company Secretary are also present at all Board meetings. Members of Senior Management attend Board meetings when an issue under their area of responsibility is being considered or as otherwise requested by the Board.
CEO and Delegation to Management
The Board has delegated to the Chief Executive Officer, and through the Chief Executive Officer to other Senior Management, the authority and responsibility for managing the everyday affairs of ANZ. The Board monitors Management and their performance on behalf of shareholders.
The Group Discretions Policy details the comprehensive discretions framework that applies within ANZ and to employees appointed to operational roles or directorships of controlled entities and minority interest entities.
The Group Discretions Policy is maintained by the Chief Financial Officer and reviewed annually by the Audit Committee with the outcome of this review reported to the Board.
At a Senior Management level, ANZ has a Management Board which comprises the Chief Executive Officer and ANZ’s most senior executives.
As at 30 September 2012, the following Senior Management, in addition to the Chief Executive Officer, were members of the Management Board: Graham Hodges – Deputy Chief Executive Officer; Shayne Elliott – Chief Financial Officer; Phil Chronican – Chief Executive Officer, Australia; David Hisco – Chief Executive Officer, New Zealand; Joyce Phillips – Chief Executive Officer, Global Wealth and Private Banking and Group Managing Director, Marketing, Innovation and Digital; Alex Thursby – Chief Executive Officer, International & Institutional Banking; Susie Babani – Group Managing Director, Human Resources; Alistair Currie – Group Chief Operating Officer; Anne Weatherston – Chief Information Officer; and Nigel Williams – Chief Risk Officer.
Typically, a sub-group of Management Board meets every week with all Management Board members meeting each month to discuss business performance, review shared initiatives and build collaboration and synergy across the Group.
| CORPORATE GOVERNANCE 41 |

Board Composition, Selection and Appointment
The Board strives to achieve an appropriate mix of skills, tenure, experience and diversity among its Directors. Details regarding each Director in office at the date of this Annual Report can be found on pages 37 to 40.
The Governance Committee (see page 46) has been delegated responsibility to review and make recommendations to the Board regarding Board composition, and to assist in relation to the Director nomination process.
The Governance Committee conducts an annual review of the size and composition of the Board, to assess whether there is a need for any new Non-Executive Director appointments. This review takes the following factors into account:
| n | relevant guidelines/legislative requirements in relation to Board composition; |
| n | Board membership requirements as articulated in the Board Charter; and |
| n | other considerations including ANZ’s strategic goals and the importance of having appropriate diversity within the Board including in relation to matters such as skills, tenure, experience, age and gender. |
The overarching guiding principle is that the Board’s composition should reflect an appropriate mix having regard to the following matters:
| n | specialist skill representation relating to both functions (such as accounting/finance, law and technology) and industry background (such as banking/ financial services, retail and professional services); |
| n | tenure; |
| n | Board experience (amongst the members of the Board, there should be a significant level of familiarity with formal board and governance processes and a considerable period of time previously spent working at senior level within one or more organisations of significant size); |
| n | age spread; |
| n | diversity in general (including gender diversity); and |
| n | geographic experience. |
Other matters for explicit consideration by the Committee are personal qualities, communication capabilities, ability and commitment to devote appropriate time to the task, the complementary nature of the distinctive contribution each Director might make, professional reputation and community standing.
Potential candidates for new Directors may be provided at any time by a Board member to the Chair of the Governance Committee. The Chair of the Governance Committee maintains a list of nominees to assist the Board in the succession planning process.
Where there is a need for any new appointments, a formal assessment of nominees will be conducted by the Governance Committee.
In assessing nominees, the Governance Committee has regard to the principles set out above.
Professional intermediaries may be used from time to time where deemed necessary and appropriate to assist in the process of identifying and considering potential candidates for Board membership.
If found suitable, potential candidates are recommended to the Board. The Chairman of the Board is responsible for approaching potential candidates.
The Committee also reviews and recommends the process for the election of the Chairman of the Board and reviews succession planning for the Chairman of the Board, making recommendations to the Board as appropriate.
APPOINTMENT DOCUMENTATION
Each new Non-Executive Director receives an appointment letter accompanied by a:
| n | Directors’ handbook –the handbook includes information on a broad range of matters relating to the role of a Director, including details of all applicable policies; and |
| n | Directors’ Deed – each Director signs a Deed in a form approved by shareholders at the 2005 Annual General Meeting which covers a number of issues including indemnity, directors’ and officers’ liability insurance, the right to obtain independent advice and requirements concerning confidential information. |
UNDERTAKING INDUCTION TRAINING
Every new Director takes part in a formal induction program which involves the provision of information regarding ANZ’s values and culture, the Group’s governance framework, the Non-Executive Directors Code of Conduct and Ethics, Director related policies, Board and Committee policies, processes and key issues, financial management and business operations. Briefings are also provided by Senior Management about matters concerning their areas of responsibility.
MEETING SHARE QUALIFICATION
Non-Executive Directors are required to accumulate within five years of appointment, and thereafter maintain, a holding in ANZ shares that is equivalent to at least 100% of a Non-Executive Director’s base fee (and 200% of this fee in the case of the Chairman).
NON-EXECUTIVE DIRECTOR REMUNERATION
Details of the structure of the Non-Executive Directors’ remuneration (which is clearly distinguished from the structure of the remuneration of the Chief Executive Officer and other senior executives) is set out in the Remuneration Report on pages 23 to 25.
The ANZ Directors’ Retirement Scheme was closed effective 30 September 2005. Accrued entitlements were fixed on that date for Non-Executive Directors in office at the time who had the option to convert those entitlements into ANZ shares. Such entitlements, either in ANZ shares or cash, will be carried forward and transferred to the Non-Executive Director when they retire (including interest accrued at the 30 day bank bill rate for cash entitlements). Only three current Non-Executive Directors have entitlements under the Scheme, namely Messrs Morschel and Meiklejohn and Dr Clark. Further details are set out in the Remuneration Report.
| 42 |

ELECTION AT NEXT ANNUAL GENERAL MEETING
Subject to the provisions of ANZ’s Constitution and the Corporations Act 2001, the Board may appoint a person as a Non-Executive Director of ANZ at any time but that person must retire and, if they wish to continue in that role, must seek election by shareholders at the next Annual General Meeting.
FIT AND PROPER
ANZ has an effective and robust framework in place to ensure that individuals appointed to relevant senior positions within the Group have the appropriate fitness and propriety to properly discharge their prudential responsibilities on appointment and during the course of their appointment.
The framework, set out in ANZ’s Fit and Proper Policy, addresses the requirements of APRA’s Fit and Proper Prudential Standard. It involves assessments being carried out for each Director, relevant senior executives and the lead partner of ANZ’s external auditor prior to a new appointment being made. These assessments are carried out against a benchmark of documented competencies which have been prepared for each role, and also involve attestations being completed by each individual, as well as the obtaining of evidence of material qualifications and the carrying out of checks such as criminal record, bankruptcy and regulatory disqualification checks. These assessments are reviewed thereafter on an annual basis.
The Governance Committee and the Board have responsibility for assessing the fitness and propriety of Non-Executive Directors.
The Human Resources Committee has primary responsibility for assessing the fitness and propriety of the Chief Executive Officer and key senior executives, and the Audit Committee carries out assessments of the fitness and propriety of the external auditor.
Fit and Proper assessments were successfully carried out in respect of each Non-Executive Director, the Chief Executive Officer, key senior executives and the external auditor during the 2012 financial year.
DIRECTOR INDEPENDENCE
Under ANZ’s Board Charter, the Board must include a majority of Non-Executive Directors who satisfy ANZ’s criteria for independence.
The Board Charter sets out criteria that are considered in order to determine whether a Non-Executive Director is to be regarded as independent.
All Non-Executive Directors are required to notify the Chairman before accepting any new outside appointment. The Chairman will review the proposed new appointment and will consider the issue on an individual basis and, where applicable, also the issue of more than one Director serving on the same outside board or other body. When carrying out the review, the Chairman will consider whether the proposed new appointment is likely to impair the Director’s ability to devote the necessary time and focus to their role as an ANZ Director and, where it will involve more than one ANZ Director serving on an outside board or other entity, whether that would create an unacceptable risk to the effective operation of the ANZ Board. Non-Executive Directors are not to accept a new outside appointment until confirmed with the Chairman who will consult the other Directors as the Chairman deems appropriate.
In the 2012 financial year, the Governance Committee conducted its annual review of the criteria for independence against the ASX Governance Principles and APRA Prudential Standards, as well as US director independence requirements.
ANZ’s criteria are more comprehensive than those set in many jurisdictions including in particular the additional criteria stipulated specifically for Audit Committee members in the Audit Committee Charter. Further details of the criteria and review process are set out in the Corporate Governance section of ANZ’s website.
In summary, a relationship with ANZ is regarded as material if a reasonable person in the position of a Non-Executive Director of ANZ would expect there to be a real and sensible possibility that it would influence a Director’s mind in:
| n | making decisions on matters likely to come regularly before the Board or its Committees; |
| n | objectively assessing information and advice given by Management; |
| n | setting policy for general application across ANZ; and |
| n | generally carrying out the performance of his or her role as a Director. |
During 2012, the Board reviewed each Non-Executive Director’s independence and concluded that the independence criteria were met by each Non-Executive Director.
Directors’ biographies on pages 37 to 40 and on anz.com highlight their major associations outside ANZ.
CONFLICTS OF INTEREST
Over and above the issue of independence, each Director has a continuing responsibility to determine whether he or she has a potential or actual conflict of interest in relation to any material matter which comes before the Board. Such a situation may arise from external associations, interests or personal relationships.
Under the Directors Disclosure of Interest Protocol and Procedures for Handling Conflicts of Interest, a Director may not exercise any influence over the Board if an actual or potential conflict of interest exists.
In such circumstances, unless a majority of other Directors who do not have an interest in the matter resolve to the contrary, the Director may not be present for Board deliberations on the subject, and may not vote on any related Board resolutions. In addition, the Director may not receive relevant Board papers. These matters, should they occur, are recorded in the Board minutes.
INDEPENDENT ADVICE
In order to assist Directors in fulfilling their responsibilities, each Director has the right (with the prior approval of the Chairman) to seek independent professional advice regarding his/her responsibilities, at the expense of ANZ. In addition, the Board and each Committee, at the expense of ANZ, may obtain whatever professional advice it requires to assist in its work.
TENURE AND RETIREMENT
ANZ’s Constitution, consistent with the ASX Listing Rules, provides that a Non-Executive Director must seek re-election by shareholders every three years if they wish to continue in their role as a Non-Executive Director.
In addition, ANZ’s Board Renewal and Performance Evaluation Protocol confirms that Non-Executive Directors will retire once they have served a maximum of three 3-year terms after first being elected by shareholders, unless invited by the Board to extend their tenure due to special circumstances.
| CORPORATE GOVERNANCE 43 |

CONTINUING EDUCATION
ANZ Directors take part in a range of training and continuing education programs. In addition to a formal induction program (see page 42), Directors also receive regular bulletins designed to keep them abreast of matters relating to their duties and responsibilities as Directors.
Each Committee also conducts its own continuing education sessions from time to time as appropriate. Internal and/or external experts are engaged to conduct all education sessions. Directors also receive regular business briefings at Board meetings. These briefings are intended to provide Directors with information on each area of ANZ’s business, in particular regarding performance, key issues, risks and strategies for growth. In addition, Directors have the opportunity to participate in site visits from time to time.
ACCESS IN RELATION TO DIRECTORS
Management is able to consult Directors as required. Employees have access to the Directors directly or through the Company Secretary. Shareholders who wish to communicate with the Directors may direct correspondence to a particular Director, or to the Non-Executive Directors as a whole.
Directors have unrestricted access to Management and, in addition to the regular presentations made by Management to Board and Board Committee meetings, Directors may seek briefings or other additional information from Management on specific matters where appropriate. The Company Secretary also provides advice and support to the Directors as required.
Role of Company Secretary
The Board is responsible for the appointment of ANZ’s Company Secretaries. The Board has appointed two Company Secretaries.
The Group General Counsel provides legal advice to the Board as and when required. He works closely with the Chair of the Governance Committee to develop and maintain ANZ’s corporate governance principles, and is responsible to the Board for the Company Secretary’s Office function.
The Company Secretary is responsible for the day-to-day operations of the Company Secretary’s Office including lodgements with relevant Securities Exchanges and other regulators, the administration of Board and Board Committee meetings (including preparation of meeting minutes), the management of dividend payments and associated share plans, the administration of the Group’s Australian subsidiaries and oversight of the relationship with ANZ’s Share Registrar.
The former Chief Financial Officer (Peter Marriott) was also a Company Secretary of ANZ during the year, until he ceased in this role at the end of May 2012. Profiles of ANZ’s Company Secretaries in office as at 30 September 2012 can be found in the Directors’ Report on page 10.
Performance Evaluations
OVERVIEW
The framework used to assess the performance of Directors is based on the expectation that they are performing their duties:
| n | in the interests of shareholders; |
| n | in a manner that recognises the great importance that ANZ places on the values of honesty, integrity, quality and trust; |
| n | in accordance with the duties and obligations imposed upon them by ANZ’s Constitution, ANZ’s Non-Executive Directors Code of Conduct and Ethics, and the law; and |
| n | having due regard to ANZ’s corporate responsibility objectives, and the importance of ANZ’s relationships with all its stakeholders and the communities and environments in which ANZ operates. |
The performance criteria also take into account the Director’s contribution to:
| n | charting the direction, strategy and financial objectives of ANZ; |
| n | monitoring compliance with regulatory requirements and ethical standards; |
| n | monitoring and assessing Management’s performance in achieving strategies and budgets approved by the Board; |
| n | setting criteria for and evaluating the Chief Executive Officer’s performance; and |
| n | the regular and continuing review of executive succession planning and executive development activities. |
The performance evaluation process is set out in ANZ’s Board Renewal and Performance Evaluation Protocol.
NON-EXECUTIVE DIRECTORS
Performance evaluations of the Non-Executive Directors are conducted in two ways:
| n | Annual review – on an annual basis, or more frequently if appropriate, the Chairman has a one-on-one meeting with each Non-Executive Director specifically addressing the performance criteria including compliance with the Non-Executive Directors Code of Conduct and Ethics. To assist the effectiveness of these meetings, the Chairman is provided with objective information about each Director (e.g. number of meetings attended, Committee memberships, other current directorships/roles etc) and a guide for discussion to ensure consistency. When considering the Director’s meeting attendance record during the previous year and also their other roles outside ANZ, the Chairman reviews generally whether the Director has sufficient time to properly carry out their duties as an ANZ Director and more specifically whether they are making a sufficient time commitment to the role both at and outside meetings. A report on the outcome of these meetings is provided to the Governance Committee and to the Board; and |
| n | Re-election statement – when nominating for re-election, NonExecutive Directors are given the opportunity to submit a written or oral statement to the Board setting out their reasons for seeking re-election. In the Non-Executive Director’s absence, the Board evaluates the statement, has regard to the performance criteria used in evaluating the performance of Non-Executive Directors as referred to above, and also considers their capacity to commit the necessary time to their role as a Director before deciding whether to endorse the relevant Director’s re-election. |
| 44 |

CHAIRMAN OF THE BOARD
An annual review of the performance of the Chairman of the Board is facilitated by the Chair of the Governance Committee who seeks input from each Director individually on the performance of the Chairman of the Board against the competencies for the Chairman’s role approved by the Board.
The Chair of the Governance Committee collates the input in order to provide an overview report to the Governance Committee and to the Board, as well as feedback to the Chairman of the Board.
THE BOARD
For the year ended 30 September 2011 the performance of the Board was assessed using an independent external assessor, who sought input from each Director and certain members of Senior Management when carrying out the assessment.
The assessment was conducted in accordance with broad terms of reference agreed by the Governance Committee, and included a review of Board papers and decision processes for a range of key decisions made over the previous year.
Based on the information and materials reviewed, the external assessor rated the Board’s practices as delivering superior capabilities across all of the critical elements of board effectiveness. The results of the assessment were discussed with the Chair of the Governance Committee and were presented at a meeting of the Governance Committee in October 2011 which was attended by all Directors.
It is expected that externally facilitated reviews of the Board will occur approximately every three years. The review process with respect to the intervening years (including the year ended 30 September 2012) is conducted internally based on input sought from each Director and also members of the Management Board, and considers progress against any recommendations implemented arising from the most recent externally facilitated review, together with any new issues that may have arisen.
BOARD COMMITTEES
Each of the principal Board Committees conducts an annual Committee performance self-assessment to review performance using Guidelines approved by the Governance Committee.
The Guidelines set out that at a minimum, the self-assessments should review and consider the following:
| n | the Committee’s performance having regard to its role and responsibilities as set out in its Charter; |
| n | whether the Committee’s Charter is fit for purpose, or whether any changes are required; and |
| n | the identification of future topics for training/education of the Committee. |
The outcomes of the performance self-assessments are reported to the Governance Committee (or to the Board, if there are any material issues relating to the Governance Committee) for discussion and noting.
SENIOR MANAGEMENT
Details of how the performance evaluation process is undertaken by the Board in respect of the Chief Executive Officer and other key Senior Management, including how financial, customer, operational and qualitative measures are assessed, are set out in the Remuneration Report on pages 15 to 23.
REVIEW PROCESSES UNDERTAKEN
Board, Director, Board Committee and relevant Senior Management evaluations in accordance with the above processes have been undertaken in respect of the 2012 financial year.
Board Committees
As set out on page 41 of this statement, the Board has the ability under its Constitution to delegate its powers and responsibilities to Committees of the Board. This allows the Board to spend additional and more focused time on specific issues. The Board has five principal Board Committees: Audit Committee, Governance Committee, Human Resources Committee, Risk Committee and Technology Committee.
MEMBERSHIP AND ATTENDANCE
Each of the principal Board Committees is comprised solely of independent Non-Executive Directors (a minimum of three is required), has its own Charter and has the power to initiate any special investigations it deems necessary.
Membership criteria are based on each Director’s skills and experience, as well as his/her ability to add value and commit time to the Committee. Board Committee composition is reviewed annually.
The Chairman is an ex-officio member of each principal Board Committee but does not chair any of the Committees. The Chief Executive Officer is invited to attend Board Committee meetings as appropriate. His presence is not automatic, however, and he does not attend where his remuneration is considered or discussed, nor does he attend the Non-Executive Director private sessions of Committees unless invited. Non-Executive Directors may attend any meeting of any Committee.
Each Board Committee may, within the scope of its responsibilities, have unrestricted access to Management, employees and information it considers relevant to the carrying out of its responsibilities under its Charter.
Each Board Committee may require the attendance of any ANZ officer or employee, or request the attendance of any external party, at meetings as appropriate.
MEETINGS
Prior to the commencement of each year, each principal Board Committee prepares a calendar of business which details the items to be included on the agenda for each scheduled Committee meeting in the coming year. In addition, any training/education topics that have been identified as part of the Committee’s annual performance self-assessment process are also included in the calendar. In advance of each Board Committee meeting, at least one planning session is held by the Committee Chair with relevant internal and external stakeholders to ensure that all emerging issues are also captured in the agenda for the forthcoming meeting as appropriate.
Minutes from Committee meetings are included in the papers for the following Board meeting. In addition, Committee Chairs update the Board regularly about matters relevant to the Committee’s role, responsibilities, activities and matters considered, discussed and resolved at Committee meetings. When there is a cross-Committee item, the Committees will communicate with each other through their Chairs.
| CORPORATE GOVERNANCE 45 |

| ANZ BOARD COMMITTEE MEMBERSHIPS – as at 30 September 2012 | ||||||||
Audit
| Governance
| Human Resources
| Risk
| Technology
| ||||
Mr D E MeiklejohnFE, C | Mr P A F HayC | Ms A M WatkinsC | Mr I J MacfarlaneC | Dr G J ClarkC | ||||
Ms P J DwyerFE | Mr I J Macfarlane | Dr G J Clark | Dr G J Clark | Mr Lee Hsien Yang | ||||
Mr P A F Hay | Ms A M Watkins | Mr P A F Hay | Ms P J Dwyer | Mr D E Meiklejohn | ||||
Mr I J Macfarlane | Mr J P Morschel (ex officio) | Mr Lee Hsien Yang | Mr Lee Hsien Yang | Mr J P Morschel (ex officio) | ||||
Ms A M WatkinsFE | Mr J P Morschel (ex officio) | Mr D E Meiklejohn | ||||||
Mr J P Morschel (ex officio) | Mr J P Morschel (ex officio)
| |||||||
C – Chair FE – Financial Expert
AUDIT COMMITTEE
The Audit Committee is responsible for reviewing:
| n | ANZ’s financial reporting principles and policies, controls and procedures; |
| n | the effectiveness of ANZ’s internal control and risk management framework; |
| n | the work of Global Internal Audit which reports directly to the Chair of the Audit Committee (refer to Global Internal Audit on page 49 for more information); |
| n | the activities of the audit committees of key subsidiary companies; |
| n | prudential supervision procedures required by regulatory bodies to the extent relating to financial reporting; |
| n | the integrity of ANZ’s financial statements and the independent audit thereof, compliance with related legal and regulatory requirements; and |
| n | any due diligence procedures. |
The Audit Committee is also responsible for:
| n | the appointment, annual evaluation and oversight of the external auditor, including reviewing their independence, fitness and propriety and qualifications; |
| n | compensation of the external auditor; |
| n | where deemed appropriate, replacement of the external auditor; and |
| n | reviewing the performance and remuneration of the Group General Manager, Global Internal Audit and making recommendations to the Board as appropriate. |
Under the Committee Charter, all members of the Audit Committee must be appropriately financially literate. Mr Meiklejohn (Chair), Ms Dwyer and Ms Watkins were determined to be ‘financial experts’ during the 2012 financial year under the definition set out in the Audit Committee Charter. While the Board determined that Mr Meiklejohn, Ms Dwyer and Ms Watkins each have the necessary attributes to be a ‘financial expert’ in accordance with the relevant requirements, it is important to note that this does not give rise to Mr Meiklejohn, Ms Dwyer or Ms Watkins having responsibilities additional to those of other members of the Audit Committee.
The Audit Committee meets with the external auditor and internal auditor without Management being present. The Chair of the Audit Committee meets separately and regularly with Global Internal Audit, the external auditor and Management.
The Deputy Chief Financial Officer is the executive responsible for assisting the Chair of the Committee in connection with the administration and efficient operation of the Committee.
Substantive areas of focus in the 2012 financial year included:
| n | Global Internal and External Audit – the Committee approved the annual plans for Global Internal and External Audit and kept progress against those plans under regular review. Adjustments to the Global Internal Audit Plan were made during the year to accommodate changing circumstances, risk profiles and business unit requests; |
| n | Accounting and regulatory developments – reports on developments were provided to the Committee outlining relevant changes and implications for ANZ; |
| n | Financial Reporting Governance Program – the Committee monitored the financial reporting process and the controls in place to ensure the integrity of the financial statements; and |
| n | Whistleblowing – the Committee received and reviewed information on disclosures made under ANZ’s Global Whistleblower Protection Policy. |
GOVERNANCE COMMITTEE
The Governance Committee is responsible for:
| n | identifying and recommending prospective Board members and ensuring appropriate succession planning for the position of Chairman (see page 42); |
| n | ensuring there is a robust and effective process for evaluating the performance of the Board, Board Committees and Non-Executive Directors (see pages 44 to 45); |
| n | monitoring the effectiveness of the Gender Balance and Diversity Policy to the extent it relates to Board diversity and reviewing and approving measurable objectives for achieving gender diversity on the Board (see page 42); |
| n | ensuring an appropriate Board and Board Committee structure is in place; |
| n | reviewing and approving the Charters for each Board Committee except its own, which is reviewed and approved by the Board; |
| n | reviewing the development of and approving corporate governance policies and principles applicable to ANZ; and |
| n | approving corporate responsibility objectives for ANZ, and reviewing progress in achieving them. |
| 46 |

The Group General Counsel is the executive responsible for assisting the Chair of the Committee in connection with the administration and efficient operation of the Committee.
Substantive areas of focus in the 2012 financial year included:
| n | Board succession planning – the Committee monitored the process in place to identify potential candidates to replace the three Non-Executive Directors who are scheduled to retire in late 2013 (including the succession planning process for the Chairman of the Board). Ms Dwyer was appointed as a new Non-Executive Director with effect from 1 April 2012; |
| n | New diversity requirements – the Committee approved a measurable objective in relation to gender diversity at Board level and reviewed progress against that objective; |
| n | Board governance framework – the Committee conducted its annual review of the Board’s governance framework and principles including in relation to Board composition and size, Director tenure, outside commitments, Board and Committee education, nomination procedures and Director independence criteria; |
| n | Performance evaluation processes – the Committee reviewed existing processes relating to the annual performance reviews of the Board, Chairman of the Board, Non-Executive Directors and Board Committees; |
| n | Board and Committee performance evaluations – the Committee reviewed the report from the independent external assessor who was engaged to facilitate the 2011 performance review of the Board, as well as the outcomes of the annual performance self-assessments conducted in relation to each of the other principal Board Committees; and |
| n | Review and approval of Group policies – the Committee reviewed and, where appropriate, approved amendments to existing Group policies including the Continuous Disclosure Policy, Board Renewal and Performance Evaluation Protocol, Fit and Proper Policy, and Trading in ANZ Securities Policy. |
HUMAN RESOURCES COMMITTEE
The Human Resources Committee assists and makes recommendations to the Board in relation to remuneration matters and senior executive succession, including for the Chief Executive Officer. The Committee also assists the Board by reviewing and approving certain policies, as well as monitoring performance with respect to health and safety issues and diversity (excluding Board diversity which is monitored by the Governance Committee).
The Committee is responsible for reviewing and making recommendations to the Board on:
| n | remuneration matters relating to the Chief Executive Officer (details in the Remuneration Report on pages 25 to 27); |
| n | remuneration matters, including incentive arrangements, for other Board Appointees (other than the Group General Manager, Global Internal Audit); |
| n | the design of remuneration structures and significant incentive plans; and |
| n | the Group’s Remuneration Policy. |
In addition, the Committee considers and approves the appointment of Board Appointees (other than the Group General Manager Global Internal Audit) and senior executive succession plans, and monitors the effectiveness of ANZ’s health, safety and diversity programs.
The Group Managing Director, Human Resources is the executive responsible for assisting the Chair of the Committee in connection with the administration and efficient operation of the Committee.
Substantive areas of focus in the 2012 financial year included:
| n | Management roles and performance – the Committee reviewed the performance of the Chief Executive Officer, the Chief Executive Officer’s direct reports and other key roles, and the succession plans in place for Management Board and business critical roles; |
| n | Regulatory changes – the Committee closely monitored regulatory developments and the implications for ANZ both in Australia and globally; |
| n | Fitness and propriety – the Committee completed fit and proper assessments for all existing and new Board Appointees; |
| n | Remuneration – the Committee conducted an annual review of remuneration for Non-Executive Directors and also reviewed the compensation structure for the Chief Executive Officer and Senior Management. The Committee also agreed with the Board the contractual arrangements for a number of senior appointments and departures at Board Appointee level; |
| n | Remuneration Policy – the Committee reviewed ANZ’s Remuneration Policy to ensure it remains appropriate for its intended purpose; and |
| n | Health, Safety and Diversity – the Committee received reports on health and safety performance and related initiatives, and reviewed ANZ’s diversity strategy and performance towards stated targets. |
For more details on the activities of the Human Resources Committee, please refer to the Remuneration Report on pages 14 to 35.
RISK COMMITTEE
The Board is principally responsible for approving the Group’s risk appetite and risk tolerance, related strategies and major policies, for the oversight of policy compliance, and for the effectiveness of the risk and compliance management framework that is in place.
The purpose of the Risk Committee is to assist the Board in the effective discharge of its responsibilities for business, market, credit, equity and other investment, financial, operational, liquidity and reputational risk management and for the oversight of the management of ANZ’s compliance obligations.
The Committee is also authorised to approve credit transactions and other related matters beyond the approval discretion of the Chief Risk Officer.
The Chief Risk Officer is the executive responsible for assisting the Chair of the Committee in connection with the administration and efficient operation of the Committee.
| CORPORATE GOVERNANCE 47 |

Substantive areas of focus in the 2012 financial year included:
| n | Regulatory change – the Committee monitored proposed new regulations, both local and global, including in particular in relation to capital and liquidity requirements for banks; |
| n | Credit portfolios – the Committee received regular updates on the quality of ANZ’s credit portfolios and the status of the more significant exposures; |
| n | Market, Funding and Liquidity Risk – the Committee received regular updates on the Group’s exposures and responses to changes in market conditions; |
| n | Operational Risk and Compliance – the Committee received regular updates on the Group’s approach and policy implementation in response to market developments; and |
| n | Business updates – the Committee received updates from businesses across the Group. |
A risk management and internal control system to manage ANZ’s material business risks is in place, and Management reported to the Board during the year as to the effectiveness of the management of ANZ’s material business risks. In addition, the Board received assurance from the Chief Executive Officer and the Chief Financial Officer that the declaration provided in accordance with section 295A of the Corporations Act is founded on a sound system of risk management and internal control and that the system is operating effectively in all material respects in relation to financial reporting risks.
For further information on how ANZ manages its material financial risks, please see the disclosures in relation to AASB 7 ‘Financial instruments: Disclosure’ in the notes to the financial statements.
For further information on risk management governance and ANZ’s approach in relation to risk oversight and the management of material business risks, please see the Corporate Governance section of anz.com.
TECHNOLOGY COMMITTEE
The Technology Committee assists the Board in the effective discharge of its responsibilities in relation to technology and related operations. The Committee is responsible for making recommendations to the Board on material technology investments, investigating and reviewing security issues relevant to ANZ’s technology processes and systems, reviewing and approving Management recommendations for long-term technology and related operations planning, and the approval of policies, strategies and control frameworks for the management of technology risk.
The Chief Information Officer is the executive responsible for assisting the Chair of the Committee in connection with the administration and efficient operation of the Committee.
Substantive areas of focus in the 2012 financial year included:
| n | Operational performance and major projects – the Committee reviewed reports on operational performance (including service and systems stability and performance) and monitored the progress of major projects; |
| n | Strategy – the Committee received updates on the progress of ANZ’s long-term strategy and reviewed the priorities set for 2012/13; |
| n | Investment – the Committee reviewed Management’s progress in delivering the business investment agenda; and |
| n | Information Security – the Committee monitored the continuing process of improving information security capability to address constantly evolving security threats and increasing regulatory requirements. |
DIRECTORS’ MEETINGS
The number of Board meetings and meetings of Committees during the year the Director was eligible to attend, and the number of meetings attended by each Director were:
| Board | Audit Committee | Governance Committee | Human Resources Committee | Risk Committee | Technology Committee | Executive Committee1 | Shares Committee1 | Committee of the Board1 | ||||||||||||||||||||||||||||
| A | B | A | B | A | B | A | B | A | B | A | B | A | B | A | B | A | B | |||||||||||||||||||
G J Clark | 9 | 9 | 5 | 5 | 8 | 8 | 3 | 3 | 1 | 1 | 1 | 1 | ||||||||||||||||||||||||
P J Dwyer | 4 | 4 | 2 | 2 | 4 | 4 | 1 | 1 | ||||||||||||||||||||||||||||
P A F Hay | 9 | 9 | 6 | 6 | 4 | 4 | 5 | 5 | 1 | 1 | 1 | 1 | ||||||||||||||||||||||||
Lee Hsien Yang | 9 | 9 | 5 | 5 | 8 | 8 | 3 | 3 | 1 | 1 | 1 | 1 | ||||||||||||||||||||||||
I J Macfarlane | 9 | 9 | 6 | 5 | 4 | 4 | 8 | 8 | 1 | 1 | 1 | 1 | ||||||||||||||||||||||||
D E Meiklejohn | 9 | 9 | 6 | 6 | 8 | 8 | 3 | 3 | 1 | 1 | 1 | 1 | 5 | 5 | ||||||||||||||||||||||
J P Morschel | 9 | 9 | 6 | 6 | 4 | 4 | 5 | 5 | 8 | 8 | 3 | 3 | 1 | 1 | 1 | 1 | 5 | 5 | ||||||||||||||||||
M R P Smith | 9 | 9 | 1 | 1 | 1 | 1 | 3 | 3 | ||||||||||||||||||||||||||||
A M Watkins | 9 | 9 | 6 | 6 | 4 | 4 | 5 | 5 | 1 | 1 | 1 | 1 | 2 | 2 | ||||||||||||||||||||||
Column A – Indicates the number of meetings the Director was eligible to attend.
Column B – Indicates the number of meetings attended. The Chairman is an ex-officio member of the Audit, Governance, Human Resources, Risk and Technology Committees.
With respect to Committee meetings, the table above records attendance of Committee members. Any Director is entitled to attend these meetings and from time to time Directors attend meetings of Committees of which they are not a member.
| 1 | The meetings of the Executive Committee, Shares Committee and Committee of the Board as referred to in the table above include those conducted by written resolution. |
48

ADDITIONAL COMMITTEES
In addition to the five principal Board Committees, the Board has constituted an Executive Committee and a Shares Committee, each consisting solely of Directors, to assist in carrying out specific tasks.
The Executive Committee has the full power of the Board and is convened as necessary between regularly scheduled Board meetings to deal with urgent matters. The Shares Committee has the power to manage on behalf of the Board the issue of shares and options (including under ANZ’s Employee Share Plan and Share Option Plan). The Board also forms and delegates authority to ad-hoc Committees of the Board as and when needed to carry out specific tasks.
Audit and Financial Governance
GLOBAL INTERNAL AUDIT
Global Internal Audit is a function independent of Management whose role is to provide the Board and Management with an effective and independent appraisal of the internal controls established by Management. Operating under a Board approved Charter, the reporting line for the outcomes of work conducted by Global Internal Audit is direct to the Chair of the Audit Committee, with a direct communication line to the Chief Executive Officer and the external auditor.
The Global Internal Audit Plan is developed utilising a risk based approach and is refreshed on a quarterly basis. The Audit Committee approves the plan, the associated budget and any changes thereto.
All audit activities are conducted in accordance with ANZ policies and values, as well as local and international auditing standards, and the results thereof are reported to the Audit Committee, Risk Committee and Management. These results influence the performance assessment of business heads.
Furthermore, Global Internal Audit monitors the remediation of audit issues and highlights the current status of any outstanding audits.
EXTERNAL AUDIT
The external auditor’s role is to provide an independent opinion that ANZ’s financial reports are true and fair and comply with applicable regulations. The external auditor performs an independent audit in accordance with Australian Auditing Standards. The Audit Committee oversees ANZ’s Stakeholder Engagement Model for Relationship with the External Auditor. Under the Stakeholder Engagement Model, the Audit Committee is responsible for the appointment (subject to ratification by shareholders) and also the compensation, retention and oversight of the external auditor.
The Stakeholder Engagement Model also stipulates that the Audit Committee:
| n | pre-approves all audit and non-audit services on an engagement by engagement basis or pursuant to specific pre-approval policies adopted by the Committee; |
| n | regularly reviews the independence of the external auditor; and |
| n | evaluates the effectiveness of the external auditor. |
The Stakeholder Engagement Model also requires that all services provided by the external auditor, including the non-audit services that may be provided by the external auditor, must be in accordance with the following principles:
| n | the external auditor should not have a mutual or conflicting interest with ANZ; |
| n | the external auditor should not audit its own work; |
| n | the external auditor should not function as part of Management or as an employee; and |
| n | the external auditor should not act as an advocate of ANZ. |
The Stakeholder Engagement Model, which sets out in detail the types of services the external auditor may and may not provide, can be found on the Corporate Governance section of anz.com.
Details of the non-audit services provided by the external auditor, KPMG, during the 2012 financial year, including their dollar value, together with the statement from the Board as to their satisfaction with KPMG’s compliance with the related independence requirements of the Corporations Act 2001, are set out in the Directors’ Report on page 10. In addition, the auditor has provided an independence declaration under Section 307C of the Corporations Act 2001.
ANZ requires a two year period before any former partner or employee of the external auditor is appointed as a Director or senior executive of ANZ. The lead partner of the external auditor is required to rotate off the audit after five years and cannot return for a further five years. Certain other senior audit staff are required to rotate off after a maximum of seven years. Any appointments of ex-partners or ex-employees of the external auditor as ANZ finance staff, at senior manager level or higher, must be pre-approved by the Chair of the Audit Committee.
FINANCIAL CONTROLS
The Audit Committee oversees ANZ’s financial reporting policies and controls, the integrity of ANZ’s financial statements, the relationship with the external auditor, the work of Global Internal Audit, and the audit committees of various significant subsidiary companies.
ANZ maintains a Financial Reporting Governance (FRG) Program which evaluates the design and tests the operational effectiveness of key financial reporting controls. In addition, half-yearly certifications are completed by Senior Management, including senior finance executives. These certifications comprise representations and questions about financial results, disclosures, processes and controls and are aligned with ANZ’s external obligations. This process is tested by the FRG Program.
Any issues arising from the evaluation and testing are reported to the Audit Committee. This process assists the Chief Executive Officer and Chief Financial Officer in making the certifications to the Board under the Corporations Act and ASX Governance Principles as referred to in the Directors’ Report on page 11.
| CORPORATE GOVERNANCE 49 |

Ethical and Responsible Decision-making
CODES OF CONDUCT AND ETHICS
ANZ has two main Codes of Conduct and Ethics, the Employee Code and the Non-Executive Directors Code. These Codes provide employees and Directors with a practical set of guiding principles to help them make decisions in their day to day work. Having two Codes recognises the different responsibilities that Directors have under law but enshrines the same values and principles.
The Codes embody honesty, integrity, quality and trust, and employees and Directors are required to demonstrate these behaviours and comply with the Codes whenever they are identified as representatives of ANZ.
The principles underlying ANZ’s Codes of Conduct and Ethics are:
| n | We act in ANZ’s best interests and value ANZ’s reputation; |
| n | We act with honesty and integrity; |
| n | We treat others with respect, value difference and maintain a safe working environment; |
| n | We identify conflicts of interest and manage them responsibly; |
| n | We respect and maintain privacy and confidentiality; |
| n | We do not make or receive improper payments, benefits or gains; |
| n | We comply with the Codes, the law and ANZ’s policies and procedures; and |
| n | We immediately report any breaches of the Codes, the law or ANZ policies and procedures. |
The Codes are supported by the following detailed policies that together form ANZ’s Conduct and Ethics Policy Framework:
| n | ANZ Anti-Money Laundering and Counter-Terrorism Financing Program; |
| n | ANZ Use of Systems, Equipment and Information Policy; |
| n | ANZ Global Fraud and Corruption Policy; |
| n | ANZ Group Expenses Policy; |
| n | ANZ Equal Opportunity, Bullying and Harassment Policy; |
| n | ANZ Health and Safety Policy; |
| n | ANZ Global Employee Securities Trading and Conflict of Interest Policy; |
| n | ANZ Global Anti-Bribery Policy; and |
| n | ANZ Global Whistleblower Protection Policy. |
Leaders are encouraged to run sessions for new direct reports and ensure they, in turn, brief their teams where required on ANZ’s values and ethical decision making within the team. The sessions are designed to build line manager capability, equipping ANZ leaders and their teams with tools and knowledge to make carefully considered, values-based and ethical business decisions and to create team behaviour standards that are in line with the ANZ Values.
Within two months of starting work with ANZ, and thereafter on an annual basis, all employees are required to complete a training course that takes each employee through the eight Code principles and a summary of their obligations under each of the policies in the Conduct and Ethics Policy Framework. Employees are required to declare that they have read, understand and have complied with the principles of the Employee Code, including key relevant extracts of the policies set out above.
To support the Employee Code of Conduct and Ethics, ANZ’s Global Performance Improvement and Unacceptable Behaviour Policy sets out the process to be followed to determine whether the Code has been breached and the consequences that should be applied to employees who are found to have breached the Code. Under the ANZ Global Performance Management Framework, any breach of the Code that leads to a consequence (such as a warning) will result in an unacceptable risk/compliance/behaviour flag being given at the time of the performance assessment. A flag must be taken into account when determining an employee’s performance and remuneration outcome and will almost always negatively impact those outcomes for the financial year in question.
Directors’ compliance with the Non-Executive Directors Code continues to form part of their annual performance review.
SECURITIES TRADING
The Trading in ANZ Securities Policy prohibits trading in ANZ securities by all employees and Directors who are aware of unpublished price-sensitive information.
The Policy specifically prohibits certain ‘restricted persons’ (which includes ANZ Directors, senior executives and their associates) from trading in ANZ securities during ‘blackout periods’ as defined in the Policy. The Policy also provides that certain types of trading are excluded from the operation of the trading restrictions under the Policy, and for exceptional circumstances where trading may be permitted during a prohibited period with prior written clearance.
ANZ Directors are required to obtain written approval from the Chairman in advance before they or their associates trade in ANZ securities. The Chairman of the Board is required to seek written approval from the Chair of the Audit Committee. Senior executives and other restricted persons are also required to obtain written approval before they, or their associates, trade in ANZ securities.
The Policy also prohibits employees from hedging interests that have been granted under any ANZ employee equity plan that are either unvested or subject to a holding lock. Any breach of this prohibition would result in the forfeiture of the relevant shares, options or rights.
ANZ Directors and Management Board members are also prohibited from providing ANZ securities as security in connection with any margin loan or similar financing arrangement under which they may be subject to a margin call or loan to value ratio breach.
WHISTLEBLOWER PROTECTION
The ANZ Global Whistleblower Protection Policy provides a mechanism by which ANZ employees, contractors and consultants may report serious issues on a confidential basis, without fear of victimisation or disadvantage.
Complaints may be made under the Policy to Managers, designated Whistleblower Protection Officers, or via an independently managed Whistleblower Protection hotline.
Commitment to Shareholders
Shareholders are the owners of ANZ and the approaches described below are enshrined in ANZ’s Shareholder Charter, a copy of which can be found on the Corporate Governance section of anz.com.
| 50 |

COMMUNICATION
In order to make informed decisions about ANZ, and to communicate views to ANZ, it is important for shareholders to have an understanding of ANZ’s business operations and performance.
ANZ encourages shareholders to take an active interest in ANZ, and seeks to provide shareholders with quality information in a timely fashion through ANZ’s reporting of results, the Annual Report, the Shareholder Review, announcements and briefings to the market, half yearly newsletters and via its dedicated shareholder site on anz.com. ANZ strives for transparency in all its business practices, and recognises the impact of quality disclosure on the trust and confidence of shareholders, the wider investor market and the community. To this end, ANZ, outside of its scheduled results announcements, issued additional Trading Updates to the market during the 2012 financial year.
Should shareholders require any information, contact details for ANZ and its Share Registrar are set out in ANZ’s Annual Report, the 2012 Shareholder Review, the half yearly shareholder newsletter, and the Shareholder centre section of anz.com.
MEETINGS
To allow as many shareholders as possible to have an opportunity to attend shareholder meetings, ANZ rotates meetings around capital cities and makes them available to be viewed online using webcast technology.
Further details on meetings and presentations held throughout this financial year are available on anz.com > About us >Shareholder centre > My shareholding > Presentations and Webcasts. Prior to the Annual General Meeting, shareholders are provided the opportunity to submit any questions they have for the Chairman or Chief Executive Officer to enable key common themes to be considered.
The external auditor is present at ANZ Annual General Meetings and available to answer shareholder questions on any matter that concerns them in their capacity as auditor.
Directors are also required to attend the Annual General Meeting each year, barring unusual circumstances, and be available afterwards to meet with and answer questions of shareholders.
Shareholders have the right to vote on various resolutions related to company matters. Shareholders are encouraged to attend and participate in meetings but, if shareholders are unable to attend a meeting, they can submit their proxies via post or electronically. Where votes are taken on a poll, which is usual ANZ practice, shareholders are able to cast their votes on a confidential basis. ANZ appoints an independent party to verify the results, normally KPMG, which are reported as soon as possible to the ASX and posted on anz.com.
Continuous Disclosure
ANZ’s practice is to release all price-sensitive information to the ASX in a timely manner as required under the ASX Listing Rules and then to all relevant overseas Securities Exchanges on which ANZ’s securities are listed, and to the market and community generally through ANZ’s media releases, website and other appropriate channels.
Through ANZ’s Continuous Disclosure Policy, ANZ demonstrates its commitment to achieving best practice in terms of disclosure by acting in accordance with the spirit, intention and purposes of the applicable regulatory requirements and by looking beyond form to substance. The Policy reflects relevant obligations under applicable securities exchange listing rules and legislation.
For disclosure purposes, price-sensitive information is information that a reasonable person would expect to have a material effect on the price or value of ANZ’s securities. Designated Disclosure Officers have responsibility for reviewing proposed disclosures and making decisions in relation to what information can be or should be disclosed to the market. Each ANZ employee is required to inform a Disclosure Officer regarding any potentially price-sensitive information concerning ANZ as soon as they become aware of it.
A committee of senior executives (the Continuous Disclosure Review Sub-Committee) also meets on a regular basis each quarter to overview the effectiveness of ANZ’s systems and procedures for achieving compliance with applicable regulatory requirements in relation to the disclosure of price-sensitive information. This Sub-Committee reports to the Governance Committee of the Board on an annual basis.
Corporate Responsibility
ANZ aims to be a role model for responsible business growth and business behaviour as it pursues its goal to become a super regional bank.
ANZ’s corporate responsibility framework responds to the priorities of customers, shareholders, employees, community groups, regulators and governments across ANZ’s business. It emphasises the role ANZ plays in society – helping to create prosperity and build thriving communities while growing ANZ’s business responsibly.
The following five priority areas guide ANZ’s behaviour, corporate responsibility investments, initiatives and decisions globally:
| n | responsible practices; |
| n | education and employment; |
| n | financial inclusion and capability; |
| n | bridging urban and rural social and economic divides; and |
| n | urban sustainability. |
The Corporate Responsibility and Diversity Committee is chaired by the Chief Executive Officer. The Committee provides strategic leadership on the corporate responsibility agenda and monitors progress and results.
Each year, ANZ sets public targets and a business-wide program of work to respond to the most material issues and opportunities for ANZ as a bank and with regard to the wider industry. This year ANZ achieved or made strong progress on 90% of its public targets, which are reported in more detail in ANZ’s 2012 Shareholder Review and specialist Corporate Responsibility reporting online.
ANZ keeps interested stakeholders abreast of developments through a monthly e-bulletin, and annual and interim corporate responsibility reporting. ANZ reports on issues that are material to its business and reflect its stakeholders’ stated interests. ANZ follows the guidelines of the Global Reporting Initiative for its full online Corporate Responsibility reporting. Detailed information on ANZ’s approach and results is available on anz.com> About us> Corporate Responsibility.
| CORPORATE GOVERNANCE 51 |

Diversity at ANZ
GENDER BALANCE AT ANZ
ANZ considers a gender-balanced, diverse and inclusive workforce, where employee differences in areas like gender, age, culture, disability and sexual orientation are valued, a strategic asset for its business and critical to achieving its super regional strategy. The ANZ Corporate Responsibility and Diversity Committee, established in 2004, is responsible for setting the strategic direction and identifying focus areas in relation to diversity. It consists of senior executives and is chaired by the Chief Executive Officer.
Gender balance is a key priority in this strategy and ANZ’s commitment includes Management Board level accountability for year-on-year improvements in gender balance, particularly across senior executives, as well as other management positions.
GENDER BALANCE AT BOARD, SENIOR EXECUTIVE AND MANAGEMENT LEVELS
ANZ’s Board currently comprises nine Directors, and it is not the Board’s current intention to make any new Board appointments to increase the size of the Board, other than as a part of the succession planning process referred to below.
The Board has two female Directors (22% of the Board), namely Ms Watkins and Ms Dwyer who joined the Board in November 2008 and April 2012 respectively as Non-Executive Directors. Ms Watkins is Chair of the Human Resources Committee and a member of the Audit Committee and Governance Committee. Ms Dwyer is a member of the Audit Committee, Risk Committee and Human Resources Committee.
The Board has a tenure policy which limits the period of service of a Non-Executive Director to three 3-year terms after first being elected by shareholders. In accordance with this policy, three Non-Executive Directors are scheduled to retire at the 2013 AGM.
The Board’s objective is that the new Director appointments who will replace the retiring Directors will include at least one woman. This objective is being effectively progressed with Ms Dwyer being the first of these three new appointments. It is expected the remaining two appointments will be made in the period leading up to the 2013 AGM in order to provide an appropriate transition.
ANZ has the highest proportion of women on its Management Board of any Australian bank at 27%. There are female leaders of at least three of ANZ’s major global businesses including Global Wealth and Private Banking, Global Loans and Transaction Banking and Global Relationship Banking. Women also lead key countries in the capacity of CEO or Country Manager in ANZ’s Asia Pacific growth markets of Hong Kong, American Samoa, Malaysia, Philippines and Thailand.
Annual gender targets have been set since 2004. ANZ’s goals for the year ended 30 September 2012 and the results achieved are set out in the table following. While ANZ did not achieve targets over all the sub-categories, performance improved at the Senior Executive level. With respect to the total number of women across the organisation, the percentage fell slightly from 55% to 54.5%. See ’Future Goals’ below for ANZ’s 2013 measurable objectives for achieving gender diversity.
| Group | Baseline (30 Sept 2011) | 30 September 2012 Target | 30 September 2012 results | |||
Senior executives | 22.8% | 24.0% | 23.9% | |||
Senior manager | 28.5% | 31.5% | 28.1% | |||
Manager | 40.3% | 42.0% | 39.6% | |||
Total women in management | 38.2% | 40.0% | 37.8% |
PROGRESSION AND DEVELOPMENT PRACTICES
ANZ aims to achieve gender balance in its key talent development and learning programs.
This year ANZ invested significantly in its core Leadership Pathway programs which target entry level managers through to enterprise leaders, and provide comprehensive training in the skills and competencies required to lead at ANZ. 46% of participants in all Leadership Pathway programs were female.
The total of all current Generalist Bankers and Graduate cohorts from 2012 comprises 44% and 45% female participation respectively; and 62% and 46% people from an Asian or Pacific cultural background respectively. The graduate intake for 2013 will comprise 53% women (up from 48% in 2011) and 43% people from an Asian or Pacific cultural background.
ANZ introduced a new Building Enterprise Talent approach in 2012. This process targets executive employees, and of the 2012 participants, 40% are female and 12% are from an Asian or Pacific cultural background. This percentage meets the target representation of females in management positions. Achieving further gender balance and cultural diversity in this program is an ongoing priority.
ANZ launched a new program “Accelerating Banking Experiences for Women”. The program has been sponsored by the CEO Australia Division and is designed to give more of ANZ’s talented women the opportunity to develop broad based banking careers at ANZ.
Awareness and education programs to eliminate any unconscious bias in ANZ’s policies, practice and workplace culture are underway. ANZ is a key partner in Melbourne Business School’s Gender Equality Project. Through this partnership significant research has been completed on gender equality along with ANZ investing in the development and launch of a learning program to better understand the economic and business case for gender balancing ANZ and how to best understand, inspire and capitalise on the talents of both female and male employees in ANZ’s workforce.
PAY EQUITY
ANZ is committed to achieving pay equity for like roles across its business. ANZ tracks its progress annually and publicly reports its performance (see the 2012 Shareholder Review, which is available at anz.com).
The gender pay differential between males and females (with comparisons based on like-for-like job size) continues to be minimal, and reductions in the gender differentials in fixed pay were achieved.
Every year ANZ conducts a review of performance-based compensation to ensure there is no systemic gender bias in its reward allocation. In 2012, the proportion of women achieving ANZ’s two highest levels of relative performance outcome (RPO), which determines bonus levels, was equal to men. 5% of females and males achieved RPO 1 and 17% of females and males achieved RPO 2.
In addition, 57% of award recipients in ANZ’s prestigious annual CEO Recognition Program were women.
| 52 |

FLEXIBLE ARRANGEMENTS AND PARENTAL LEAVE
ANZ offers flexible work arrangements, breaks from work and support in special circumstances to help balance life priorities with work and to manage careers. These include formal and informal arrangements, such as compressed work weeks (where employees work the usual number of hours in fewer days), flexible start and finish times, job sharing, telecommuting, part time work arrangements and lifestyle leave (which offers up to four weeks unpaid leave for any purpose). See the 2012 Shareholder Review for information on the number of employees in flexible work arrangements.
ANZ provides equal paid parental leave to males and females in Australia along with a lumpsum childcare allowance to help the transition back to work after parental leave. Superannuation is also paid on all forms of paid parental leave.
WORKPLACE CULTURE
ANZ is building a vibrant, diverse and inclusive culture as a critical foundation for its super regional strategy. This year, in the annual My Voice employee survey, 79% of all respondents supported the statement that ‘ANZ is creating a work environment that is open and accepting of individual differences’ and 80% of respondents agreed that ‘My manager supports my efforts to balance my work and personal life’ – key indicators of the success of ANZ’s diversity priorities.
SUPPORT FOR GENDER EQUALITY IN OUR COMMUNITIES
The ANZ Chairman is actively involved in the Australian Institute of Company Directors Chairman’s Mentoring Program to advance more women into Board positions.
The Chief Executive Officer is a member of the Male Champions of Change program (MCC), through which CEOs and Directors use their influence to ensure that the issues of gender equality and women’s representation in leadership are elevated onto the national business agenda.
In 2012 ANZ was recognised as an Employer of Choice for Women by the Australian Equal Opportunity in the Workplace Agency for the eighth time. This followed similar achievements in the last year, including the Australian Human Resources Institute (AHRI) Indigenous Employment Award and the AHRI Disability Employment Award.
Also in 2012, ANZ was recognised as the Banking sector leader in the Dow Jones Sustainability Index for effective labour practices and its strong focus on diversity – with particular mention made of ANZ’s full public disclosure of workforce diversity and the high retention of females in management positions. ANZ’s best in class performance is reflected in the last Dow Jones Sustainability Index report, highlighting the value placed on performance-linked gender diversity targets, low gender pay differential and the organisation’s public reporting of progress in achieving a gender equal workforce.
Saver Plus, MoneyMinded, MoneyBusiness and Progress Loans, ANZ’s financial capability initiatives, include mostly female participants and aim to encourage and support their economic empowerment, education and broader inclusion in society. ANZ was awarded an ‘Outstanding’ award for two of the four categories, in the inaugural MoneySmart Week Awards. The awards recognised two ANZ initiatives that have greatly contributed to financial wellbeing in Australia over the past ten years: the ANZ Survey of Adult Financial Literacy in Australia and some Pacific and Asian countries, which won within the research category, and ANZ’s Saver Plus Program which received an award for the ‘Community’ category. ANZ’s long term, multi-million dollar investment in these programs continues to benefit tens of thousands of women on low incomes and from disadvantaged communities.
FUTURE GOALS
ANZ has set the following global goals for gender balance and diversity for 2013. The 2012 Shareholder Review contains further information on these targets.
| Public Gender Balance and Diversity Targets |
Improve employee engagement to at least 73%, with a long term target of 83%.
|
Improve perceptions of “values-based leadership” amongst our employees to at least 70%, with a long term target of 80%.
|
Achieve a 1% increase in the representation of women in management in 2013, with a medium term goal of 40% and a long term target of 45% representation.
|
Achieve gender balance and greater cultural diversity in our key recruitment, talent development and learning programs
|
Play a leadership role in advancing women in society and improving cultural diversity in business through high profile business, government and community partnerships.
|
Provide 230 positions to people from traditionally excluded groups and disadvantaged backgrounds through our traineeships, graduate program and permanent employment.
|
Develop and commence implementation of a global approach to improving age diversity across our business.
|
Publicly report outcomes of ANZ’s current Reconciliation Action Plan and Disability Action Plan.
|
Donations and Community Investment
ANZ has made a long term public commitment to invest in the communities in which it operates and contributed around $14.9 million in cash, time and in-kind services during the year ended 30 September 2012. This does not include ‘forgone revenue’ such as the cost of providing low or fee free accounts to government benefit recipients.
Building financial capability is a key element of ANZ’s Corporate Responsibility framework, targeting especially those in disadvantaged communities who are most at risk of financial exclusion. For this reason more than $3.5 million of this contribution was invested in financial literacy and inclusion programs such as Saver Plus, MoneyMinded and MoneyBusiness. MoneyMinded is the most widely used financial literacy program in Australia and in 2011-12 was adapted for use in India, Indonesia, Vietnam, the Solomon Islands, Timor-Leste and Vanuatu, taking to 13 the number of countries where MoneyMinded is delivered.
ANZ offers all staff at least one day of paid volunteer leave per year to make a difference in their local communities. Where possible activities have been aligned with ANZ’s corporate responsibility focus areas of financial inclusion and capability, education and employment opportunities and bridging urban and rural social and economic divides. In the past year, ANZ staff volunteered almost 87,000 hours. A number of staff contribute to non-profit organisations through workplace giving, which ANZ matches.
Further details can be accessed at anz.com/cr.
In addition, for the year to 30 September 2012, ANZ donated $80,000 to the Liberal Party of Australia and $80,000 to the Australian Labor Party.
| CORPORATE GOVERNANCE 53 |


ANZ reported a profit after tax of $5,661 million for the year ended 30 September 2012.
| Income Statement | 2012 $m | 2011 $m | Movt | |||||||
Net interest income1 | 12,110 | 11,500 | 5% | |||||||
Other operating income1 | 5,601 | 5,432 | 3% | |||||||
Operating income | 17,711 | 16,932 | 5% | |||||||
Operating expenses | (8,519 | ) | (8,023 | ) | 6% | |||||
Profit before credit impairment and income tax | 9,192 | 8,909 | 3% | |||||||
Provision for credit impairment | (1,198 | ) | (1,237 | ) | -3% | |||||
Profit before income tax | 7,994 | 7,672 | 4% | |||||||
Income tax expense | (2,327 | ) | (2,309 | ) | 1% | |||||
Non-controlling interests | (6 | ) | (8 | ) | -25% | |||||
Profit attributable to shareholders of the Company | 5,661 | 5,355 | 6% | |||||||
| 1 | Comparative information has been changed. Refer to note 1 of the financial statements for further details. |
NON-IFRS INFORMATION
The Group provides an additional measure of performance which is prepared on a basis other than in accordance with the accounting standards; namely underlying profit. The guidance provided in Australian Securities and Investments Commission Regulatory Guide 230 has been followed when presenting this information.
UNDERLYING PROFIT
Profit has been adjusted for certain non-core items to arrive at underlying profit, the result for the ongoing business activities of the Group. These adjustments have been determined on a consistent basis with those made in prior years. The adjustments made in arriving at underlying profit are included in statutory profit, which is subject to audit within the context of the Group audit opinion. Underlying profit is not audited, however, the external auditor has informed the Audit Committee that the adjustments, and the presentation thereof, are based on the guidelines released by the Australian Institute of Company Directors (AICD) and the Financial Services Institute of Australasia (FINSIA), and have been determined on a consistent basis with those made in prior years.
2012 $m | 2011 $m | Movt | ||||||||
Statutory profit attributable to shareholders of the Company | 5,661 | 5,355 | 6% | |||||||
Adjustments between statutory profit and underlying profit | 350 | 297 | 18% | |||||||
Underlying profit | 6,011 | 5,652 | 6% | |||||||
Adjustments between statutory profit and underlying profit ($m) | 2012 | 2011 | Movt | |||||||
Gain on sale of Visa shares | (224 | ) | – | n/a | ||||||
New Zealand Simplification programme | 105 | 86 | 22% | |||||||
Acquisition related adjustments | 41 | 126 | -67% | |||||||
Treasury shares adjustment | 96 | (41 | ) | large | ||||||
Changes in New Zealand tax legislation | – | (2 | ) | -100% | ||||||
Economic hedging – fair value (gains)/losses | 229 | 117 | 96% | |||||||
Revenue and net investment hedges (gains)/losses | (53 | ) | 51 | large | ||||||
Capitalised software impairment | 220 | – | n/a | |||||||
NZ managed funds impacts | 1 | (39 | ) | large | ||||||
Non continuing businesses | (65 | ) | (1 | ) | large | |||||
Total adjustments between statutory profit and underlying profit | 350 | 297 | 18% | |||||||
Refer pages 204 to 206 for analysis of the adjustments between statutory profit and underlying profit.
REVIEW OF OPERATING RESULTS 55

| Income Statement | 2012 $m | 2011 $m | Movt | |||||||
Net interest income1 | 12,111 | 11,498 | 5% | |||||||
Other operating income1 | 5,468 | 5,314 | 3% | |||||||
Operating income | 17,579 | 16,812 | 5% | |||||||
Operating expenses | (8,022 | ) | (7,718 | ) | 4% | |||||
Profit before credit impairment and income tax | 9,557 | 9,094 | 5% | |||||||
Provision for credit impairment | (1,246 | ) | (1,211 | ) | 3% | |||||
Profit before income tax | 8,311 | 7,883 | 5% | |||||||
Income tax expense | (2,294 | ) | (2,222 | ) | 3% | |||||
Non-controlling interests | (6 | ) | (9 | ) | -33% | |||||
Underlying profit | 6,011 | 5,652 | 6% | |||||||
| 1 | Comparative information has been changed. Refer to note 1 of the financial statements for further details. |
Analysis of the business performance by major income and expense, and by Division, is on an underlying basis.
Net Interest Income
Net Interest income increased 5% with growth in average interest earning assets partially offset by a decline in the net interest margin.
Growth in average interest earning assets (+$49.2 billion or 10%). Major movements include:
| n | Australia division increased $16.3 billion (7%): Mortgages increased $13.0 billion (8%) and Commercial increased $3.1 billion (6.9%), primarily in Business Banking; and |
| n | International and Institutional Banking increased $32.3 billion (18%): Global Markets increased $16.6 billion (19%) due to growth in liquid assets, trading and investment securities, combined with a $7.6 billion (2%) growth in Global Loans and a $6.3 billion (50%) uplift in trade finance lending in Transaction Banking. |
Growth in average deposits and other borrowings was $45.3 billion (13%). Major movements include:
| n | Australia division increased $13.9 billion (12%): reflecting increased customer deposits in Retail from higher volumes on Progress, Online and Business Premium Saver products and term deposits, along with growth in deposits in Commercial; |
| n | International and Institutional Banking increased $15.8 billion (12%) mainly due to increased customer deposits within the APEA region; and |
| n | Group Centre increased $11.3 billion (25%) reflecting increased wholesale funding raised during the year. |
Net interest margin decreased by 11 basis points to 2.31%. Excluding the impact of the Global Markets business, the Group margin decreased by 9 basis points. The main drivers of margin performance, including Global Markets, were:
| n | funding and asset mix changes (+1 bps): reduced the reliance on more expensive wholesale funding due to increased customer deposits, partially offset by unfavourable asset mix with higher growth in lower margin products (for example Trade Loans); |
| n | funding costs (-8 bps): increased wholesale funding costs and lower returns on capital due to declining interest rate environment in Australia and New Zealand; |
| n | deposit costs (-10 bps): reflecting strong competition for retail and commercial deposits, predominantly in Australia; and |
| n | assets (+6 bps): primarily benefits of re-pricing mortgages in Australia, partially offset by margin compression in Global Loans. |
Other Operating Income
Other Operating Income increased 3%. Major movements include:
| n | fee income (excluding Global Markets) increased $35 million (2%): Transaction Banking increased $34 million driven by volume growth; |
| n | foreign exchange earnings (excluding Global Markets) decreased $17 million (-6%): Group Centre decreased $43 million mainly due to lower realised revenue hedge gains. Transaction Banking increased $15 million driven by higher volumes and Consumer Cards and Unsecured Lending increased $6 million driven by pricing initiatives and increased travel card volumes. |
56

| n | net income from Wealth Management increased $3 million (0%): Global Wealth and Private Banking increased $43 million primarily due to the impact of interest and inflation rates on insurance and annuity reserves, higher advice income and higher income from Asian operations, partially offset by lower funds management income. Retail Asia Pacific increased $11 million mainly due to improved performance in Taiwan, Indonesia and Singapore. Group Centre decreased $53 million due to an increase in the elimination on consolidation of OnePath investments in ANZ products; |
| n | share of associates’ profit decreased $20 million (-5%): Shanghai Rural Commercial Bank (SRCB) decreased $63 million mainly as a result of one-off adjustments included in the prior year and higher provision charges in 2012. Panin Bank increased $18 million mainly due to underlying business growth. Bank of Tianjin (BoT) increased $18 million as a result of underlying business growth; |
| n | other income (excluding Global Markets) decreased $16 million (-11%): Group Centre decreased $21 million due to the profit on sale of 20 Martin Place (Sydney) in 2011. Global Wealth and Private Banking decreased $19 million mainly driven by adverse investor sentiment and the uncertain economic environment which negatively impacted on E*Trade brokerage volumes. Global Institutional decreased $10 million due to mark-to-market movements on credit default swap bought protection. Asia Partnerships increased $20 million reflecting a $10 million gain on sale of Sacombank and $10 million dilution gain relating to the Bank of Tianjin investment. Global Loans increased $11 million mainly due to a gain on restructuring a transaction. Mortgages increased $9 million mainly due to the gain on sale of the Origin business; and |
| n | Global Markets income increased through both other operating income and net interest income categories. Total Global Markets income increased $241 million (14%) with Foreign Exchange up $109 million (17%) and Fixed Income up $153 million (25%), with increasing contribution coming from APEA. Sales continues to be the primary revenue driver, now representing over 60% of income. Trading and Balance Sheet results experienced strong growth with more stable markets and tightening credit spreads. |
Operating Expenses
Operating expense growth was contained at 4%, with Australia and New Zealand delivering solid cost outcomes (2% growth year on year), driven primarily by cost savings from productivity initiatives and greater utilisation of our hub resources. This was partially offset by International and Institutional Banking and Group Centre due to higher amortisation charges, restructuring costs and increased technology investments.
Movement by expense category was:
| n | personnel expenses increased $87 million (2%) as a result of annual salary increases and the continued build out of our regional capability, partly offset by a 4% reduction in staff numbers; |
| n | premises expenses increased $35 million (5%) reflecting rent increases and our regional expansion; |
| n | computer expenses increased $84 million (8%) due to increased depreciation and amortisation from increased investment in technology; and |
| n | restructuring expenses increased $103 million as a result of productivity initiatives being undertaken across the Group. |
Provision for Credit Impairment
Total credit impairment charge relating to lending assets, commitments, impaired derivative exposures and debt securities classified as available-for-sale assets increased by $35 million from September 2011 to $1,246 million.
The individual provision charge increased $426 million over the year, due mainly to an increase in International and Institutional Banking, reflecting an increase in provisions for a few legacy loans and lower levels of recoveries and writebacks than in 2011, partially offset by a decrease in New Zealand division.
The collective provision charge reduced by $391 million during the year, due mainly to a release in International and Institutional Banking of $300 million driven by a reduction in the concentration risk provision associated with a few legacy exposures and an improved risk profile across most portfolios in 2012, partially offset by underlying growth across the portfolio. A release in New Zealand division of $45 million was driven by economic cycle releases and an improving risk portfolio, partially offset by portfolio growth.
REVIEW OF OPERATING RESULTS 57

Balance Sheet Summary1
2012 $m | 2011 $m | Movt | ||||||||||
Assets | ||||||||||||
Liquid assets | 36,578 | 25,627 | 43% | |||||||||
Due from other financial institutions | 17,103 | 13,298 | 29% | |||||||||
Trading and available-for-sale assets | 61,164 | 58,338 | 5% | |||||||||
Derivative financial instruments | 48,929 | 58,641 | -17% | |||||||||
Net loans and advances | 427,823 | 397,307 | 8% | |||||||||
Regulatory deposits | 1,478 | 1,505 | -2% | |||||||||
Investments backing policy liabilities | 29,895 | 29,859 | 0% | |||||||||
Other | 19,157 | 19,638 | -2% | |||||||||
Total Assets | 642,127 | 604,213 | 6% | |||||||||
Liabilities | ||||||||||||
Due to other financial institutions | 30,538 | 27,535 | 11% | |||||||||
Customer deposits | 327,876 | 296,754 | 10% | |||||||||
Other deposits and other borrowings | 69,247 | 71,975 | -4% | |||||||||
Deposits and other borrowings | 397,123 | 368,729 | 8% | |||||||||
Derivative financial instruments | 52,639 | 55,290 | -5% | |||||||||
Bonds and notes | 63,098 | 56,551 | 12% | |||||||||
Policy liabilities/external unit holder liabilities | 33,486 | 32,536 | 3% | |||||||||
Other | 24,023 | 25,618 | -6% | |||||||||
Total Liabilities | 600,907 | 566,259 | 6% | |||||||||
Total equity | 41,220 | 37,954 | 9% | |||||||||
| 1 | Certain comparative amounts have changed. Refer to note 1 of the Financial Statements for details. |
The Group’s balance sheet continued to strengthen during 2012 with increased capital ratios, a higher level of liquidity, an increased proportion of funding from customer deposits and a reduction in the proportion of impaired assets to gross loans and advances.
The Group’s Common Equity Tier 1 ratio increased 30 basis points to 8.8% based upon the APRA Basel II standards, with underlying earnings and capital initiatives (including divestments) outweighing dividends, incremental risk weighted assets and deductions.
The level of prime and supplementary liquid asset holdings increased from September 2011 by $23.1 billion to $114.6 billion at September 2012, sufficient to cover the maturities of all short and long term offshore wholesale debt securities.
During the year to September 2012 the total increase in customer funding was $29.5 billion. The proportion of customer funding stands at 61%.
Gross impaired assets decreased 7% to $5.2 billion driven by a reduction in impaired loans and a reduction in the restructured items,
partially offset by an increase in non-performing commitments and contingencies. Net impaired assets as a % of net advances decreased from 0.98% in 2011 to 0.80% in 2012.
Asset growth of $37.9 billion (6%) was principally driven by:
| n | net loans and advances increased $30.5 billion (8%) primarily driven by a $16.2 billion (7%) increase in the Australia division from above system growth in Mortgages (8%) and growth in Business Banking (11%) and International and Institutional Banking increased $10.4 billion (11%) with strong growth across all business lines in the APEA geography. |
Liabilities growth of $34.6 billion (6%) is principally driven by:
| n | deposits and other borrowings increased $28.4 billion (8%) due to growth in customer deposits of $31.1 billion (10%), driven by $13.8 billion (11%) in Australia and $12.9 billion from Institutional and International Banking, with solid growth from new retail savings products and greater penetration in APEA region respectively. |
58

Australia
| Income statement | 2012 $m | 2011 $m | Movt | |||||||||
Net interest income | 5,924 | 5,782 | 2% | |||||||||
Other operating income | 1,194 | 1,185 | 1% | |||||||||
Operating income | 7,118 | 6,967 | 2% | |||||||||
Operating expenses | (2,893 | ) | (2,836 | ) | 2% | |||||||
Profit before credit impairment and income tax | 4,225 | 4,131 | 2% | |||||||||
Provision for credit impairment | (666 | ) | (719 | ) | -7% | |||||||
Profit before income tax | 3,559 | 3,412 | 4% | |||||||||
Income tax expense | (1,067 | ) | (1,022 | ) | 4% | |||||||
Profit | 2,492 | 2,390 | 4% | |||||||||
| ||||||||||||
Number of employees | 13,982 | 14,635 | -4% | |||||||||
Profit increased 4%, with profit before credit impairment and income tax up 2%.
Key factors affecting the result were:
| n | net interest income increased 2% as a result of strong growth in average net loans and advances of 7%, partially offset by a decline in net interest margin of 12 basis points; |
| n | growth in average net loans and advances of 7% was driven by above system growth in Mortgages of 8% and growth in Business Banking of 11%. Asset growth was largely self-funded with average deposit growth of 12% in the year coming primarily from savings products. |
| n | net interest margin declined 12 basis points over the year as a result of deposit pricing pressures and higher wholesale funding costs partly offset by benefits from asset pricing and disciplined margin management; |
| n | operating expenses increased 2% due to higher restructuring costs and annual salary increases, partially offset by the benefits from productivity initiatives (reducing average FTE) procurement saves and lower discretionary spending throughout the year; and |
| n | provision for credit impairment decreased 7% reflecting lower collective provisions due to the release of surplus flood provisions partly offset by an increase in individual provisions due to a large provision raised for a merchant facility and the impact of softer economic conditions. |
International and Institutional Banking
| Income statement | 2012 $m | 2011 $m | Movt | |||||||||
Net interest income1 | 3,842 | 3,667 | 5% | |||||||||
Other operating income1 | 2,750 | 2,523 | 9% | |||||||||
Operating income | 6,592 | 6,190 | 6% | |||||||||
Operating expenses | (2,933 | ) | (2,757 | ) | 6% | |||||||
Profit before credit impairment and income tax | 3,659 | 3,433 | 7% | |||||||||
Provision for credit impairment | (427 | ) | (293 | ) | 46% | |||||||
Profit before income tax | 3,232 | 3,140 | 3% | |||||||||
Income tax expense | (854 | ) | (830 | ) | 3% | |||||||
Non-controlling interests | (6 | ) | (9 | ) | -33% | |||||||
Profit | 2,372 | 2,301 | 3% | |||||||||
| ||||||||||||
Number of employees2 | 16,049 | 16,527 | -3% | |||||||||
| 1 | Comparative information has been changed. Refer to note 1 of the financial statement for further details. |
| 2 | Comparative information has changed to align to the current year methodology. |
Profit increased 3%, with strong growth in Global Markets and Transaction Banking partially offset by by higher individual provision charges in the Global Loans business.
Key factors affecting the result were:
| n | net interest income increased 5%. Solid growth in APEA accounted for most of the overall increases in customer deposits (up 10%) and net loans and advances (up 11%). However, net interest margin (excluding Global Markets) declined 40 basis points reflecting the higher funding costs, margin compression in the competitive environment in Australia and the impact of the change in lending mix tilted towards Asia where margins are lower; |
| n | other operating income increased 9% mainly from increases in Global Institutional in APEA (in particular, Transaction Banking and Global Markets); |
| n | operating expenses were up 6%, driven by higher amortisation charges and restructuring costs with continued re-investment in the business, partially offset by cost savings from productivity gains and greater utilisation of our hub resources; and |
| n | Provision charges for credit impairment were 46% higher, driven by individual provision charges on a few legacy Global Institutional loans in Australia, partially offset by collective provision releases from associated concentration risk provisions. |
| REVIEW OF OPERATING RESULTS 59 |

New Zealand
| Income statement | 2012 $m | 2011 $m | Movt | |||||||||
Net interest income | 1,772 | 1,701 | 4% | |||||||||
Other external operating income | 325 | 316 | 3% | |||||||||
Operating income | 2,097 | 2,017 | 4% | |||||||||
Operating expenses | (921 | ) | (906 | ) | 2% | |||||||
Profit before credit impairment and income tax | 1,176 | 1,111 | 6% | |||||||||
Provision for credit impairment | (148 | ) | (166 | ) | -11% | |||||||
Profit before income tax | 1,028 | 945 | 9% | |||||||||
Income tax expense | (285 | ) | (283 | ) | 1% | |||||||
Profit | 743 | 662 | 12% | |||||||||
| ||||||||||||
Number of employees | 7,841 | 8,195 | -4% | |||||||||
Profit increased by 12% driven by strong balance sheet growth, improved margins, lower provisions and the benefit of a lower tax rate.
Key factors affecting the result were:
| n | lending volumes increased 4%, driven primarily by strong growth in mortgages; |
| n | strong customer deposits growth 10%, driven by Retail and Small Business Banking, resulted in an improvement in the funding mix year on year; |
| n | net interest margin improved by 10 basis points, driven by a favorable lending mix, a reduction in unproductive balances and lower mortgage break costs; |
| n | productivity initiatives enabled costs to be held flat during the year, resulting in the cost to income ratio falling 100bps to 43.9%. |
| n | provisioning was 11% lower over the year, reflecting an improvement in the quality of the loan book and improved recovery rates; |
The individual provision loss rate is down 9 basis points to 0.29% and net impaired assets fell 23% to represent 1.11% of net advances; and
| n | tax benefit of NZD26 million from the reduction in the corporate tax rate from 30% to 28% during the year. |
Global Wealth and Private Banking
| Income statement | 2012 $m | 2011 $m | Movt | |||||||||
Net interest income | 123 | 135 | -9% | |||||||||
Other operating income | 172 | 191 | -10% | |||||||||
Net funds management and insurance income | 1,183 | 1,159 | 2% | |||||||||
Operating income | 1,478 | 1,485 | 0% | |||||||||
Operating expenses | (857 | ) | (853 | ) | 0% | |||||||
Profit before credit impairment and income tax | 621 | 632 | -2% | |||||||||
Provision for credit impairment | (4 | ) | 8 | large | ||||||||
Profit before income tax | 617 | 640 | -4% | |||||||||
Income tax expense | (166 | ) | (183 | ) | -9% | |||||||
Profit | 451 | 457 | -1% | |||||||||
| ||||||||||||
Number of employees1 | 2,109 | 2,183 | -3% | |||||||||
| 1 | Comparative information has changed to align to the current year methodology. |
Profit was 1% lower driven by adverse investor sentiment and subdued market returns negatively impacting volumes and resulting in lower net interest and other operating income.
Key factors affecting the result were:
| n | net interest income and other operating income declined by 9% and 10% respectively as a result of challenging market conditions in 2012; |
| n | net funds management and insurance income increased by 2% mainly due to higher capital investment earnings as a result of the positive impact of interest and inflation rates on insurance and annuity reserves; and |
| n | flat operating expenses were mainly driven by the investment in growth initiatives, offsetting benefits realised from business simplification initiatives. |
60

Global Technology, Services and Operations1
| Income statement | 2012 $m | 2011 $m | Movt | |||||||||
Net interest income | 450 | 213 | large | |||||||||
Other operating income | (156 | ) | (60 | ) | large | |||||||
Operating income | 294 | 153 | 92% | |||||||||
Operating expenses | (418 | ) | (366 | ) | 14% | |||||||
Profit before credit impairment and income tax | (124 | ) | (213 | ) | -42% | |||||||
Provision for credit impairment | (1 | ) | (41 | ) | -98% | |||||||
Profit before income tax | (125 | ) | (254 | ) | -51% | |||||||
Income tax expense | 78 | 96 | -19% | |||||||||
Profit | (47 | ) | (158 | ) | -70% | |||||||
| ||||||||||||
Number of employees2 | 5,919 | 5,981 | -1% | |||||||||
| 1 | Includes Group Centre and shareholder functions. |
| 2 | Comparative information has changed to align to the current year methodology. |
The underlying loss of $47 million was $111 million lower than the prior year, with higher income and lower credit impairment charges, partially offset by higher expense.
Key factors affecting the result were:
| n | operating income improved $141 million largely due to higher earnings on centrally held capital partly offset by lower realised revenue hedge profits in 2012 and the 2011 benefit from the sale of Martin Place; |
| n | operating expenses increased $52 million largely as a result of increased investment in technology infrastructure; and |
| n | provision for credit impairment reduced $40 million due to a centrally held provision made in 2011 for emerging issues resulting from global uncertainty. |
REVIEW OF OPERATING RESULTS 61

1. Introduction
The Group’s activities are subject to risks that can adversely impact its business, operations and financial condition. The risks and uncertainties described below are not the only ones that the Group may face. Additional risks and uncertainties that the Group is unaware of, or that the Group currently deems to be immaterial, may also become important factors that affect it. If any of the listed or unlisted risks actually occur, the Group’s business, operations, financial condition, or reputation could be materially and adversely affected, with the result that the trading price of the Group’s equity or debt securities could decline, and investors could lose all or part of their investment.
2. Changes in general business and economic conditions, including disruption in regional or global credit and capital markets, may adversely affect the Group’s business, operations and financial condition
The Group’s financial performance is primarily influenced by the economic conditions and the level of business activity in the major countries and regions in which it operates or trades, i.e. Australia, New Zealand, the Asia Pacific region, Europe and the United States of America. The Group’s business, operations, and financial condition can be negatively affected by changes to these economic and business conditions.
The economic and business conditions that prevail in the Group’s major operating and trading markets are affected by domestic and international economic events, political events and natural disasters, and by movements and events that occur in global financial markets.
The global financial crisis in 2008 and 2009 saw a sudden and prolonged dislocation in credit and equity capital markets, a contraction in global economic activity and the creation of many challenges for financial services institutions worldwide that still persist in many regions. More recently, sovereign risk (particularly in Europe) and its potential impact on financial institutions in Europe and globally has emerged as a significant risk to the growth prospects of the global economy. The impact of the global financial crisis and its aftermath (such as heightened sovereign risk) continue to affect global economic activity, confidence and capital markets.
The economic effects of the global financial crisis and the more recent European sovereign debt crisis have been widespread and far-reaching with unfavourable ongoing impacts on retail spending, personal and business credit growth, housing credit, and business and consumer confidence. While some of these economic factors have since improved, lasting impacts from the global financial crisis and subsequent volatility in financial markets and the more recent European sovereign debt crisis (and potential contagion from it) suggest ongoing vulnerability and potential adjustment of consumer and business behaviour.
The sovereign debt crisis could have serious implications for the European Union and the euro which, depending on the circumstances in which they take place, could adversely impact the Group’s business operations and financial condition. The New Zealand economy is also vulnerable to more volatile markets and deteriorating funding conditions. Economic conditions in Australia, New Zealand, and some Asia Pacific countries remain difficult for many businesses, albeit less so than in many European countries and in the United States of America.
Should the difficult economic conditions of these countries persist or worsen, asset values in the housing, commercial or rural property markets could decline, unemployment could rise and corporate and personal incomes could suffer. Also, deterioration in global markets, including equity, property, currency and other asset markets, could impact the Group’s customers and the security the Group holds against loans and other credit exposures, which may impact its ability to recover some loans and other credit exposures.
All or any of these negative economic and business impacts could cause a reduction in demand for the Group’s products and services and/or an increase in loan and other credit defaults and bad debts, which could adversely affect the Group’s business, operations, and financial condition.
The Group’s financial performance could also be adversely affected if it were unable to adapt cost structures, products, pricing or activities in response to a drop in demand or lower than expected revenues. Similarly, higher than expected costs (including credit and funding costs) could be incurred because of adverse changes in the economy, general business conditions or the operating environment in the countries in which it operates.
Other economic and financial factors or events which may adversely affect the Group’s performance and results, include, but are not limited to, the level of and volatility in foreign exchange rates and interest rates, changes in inflation and money supply, fluctuations in both debt and equity capital markets, declining commodity prices due to, for example, reduced demand in Asia, especially North Asia/ China, and decreasing consumer and business confidence.
Geopolitical instability, such as threats of, potential for, or actual conflict, occurring around the world, such as the ongoing unrest and conflicts in the Middle East, may also adversely affect global financial markets, general economic and business conditions and the Group’s ability to continue operating or trading in a country, which in turn may adversely affect the Group’s business, operations, and financial condition.
Natural disasters such as (but not restricted to) cyclones, floods and earthquakes, and the economic and financial market implications of such disasters on domestic and global conditions can adversely impact the Group’s ability to continue operating or trading in the country or countries directly or indirectly affected, which in turn may adversely affect the Group’s business, operations and financial condition. For more specific risks in relation to earthquakes and the recent Christchurch earthquakes, see the risk factor entitled “The Group may be exposed to the impact of future climate change, geological events, plant and animal diseases, and other extrinsic events which may adversely affect its business, operations and financial condition”.
| 62 |

3. Changes in exchange rates may adversely affect the Group’s business, operations and financial condition
The previous appreciation in and continuing high level of the value of the Australian and New Zealand dollars relative to other currencies has adversely affected, and could continue to have an adverse effect on, certain portions of the Australian and New Zealand economies, including some agricultural exports, tourism, manufacturing, retailing subject to internet competition, and import-competing producers. Recently, commodity prices have fallen and the Australian and New Zealand dollars have remained high, removing some of the traditional “natural hedge” the currencies have played for commodity producers and the broader economy. A depreciation in the Australian or New Zealand dollars relative to other currencies would increase the debt service obligations in Australia or New Zealand dollar terms of unhedged exposures. Appreciation of the Australian dollar against the New Zealand, United States dollar and other currencies has a negative earnings translation effect, and future appreciation could have a greater negative impact, on the Group’s results from its other non-Australian businesses, particularly its New Zealand and Asian businesses, which are largely based on non-Australian dollar revenues. The Group has put in place hedges to partially mitigate the impact of currency appreciation, but notwithstanding this there can be no assurance that the Group’s hedges will be sufficient or effective, and any further appreciation could have an adverse impact upon the Group’s earnings.
4. Competition may adversely affect the Group’s business, operations and financial condition, especially in Australia, New Zealand and the Asian markets in which it operates
The markets in which the Group operates are highly competitive and could become even more so, particularly in those countries and segments that are considered to provide higher growth prospects or are in greatest demand (for example, customer deposits or the Asian region). Factors that contribute to competition risk include industry regulation, mergers and acquisitions, changes in customers’ needs and preferences, entry of new participants, development of new distribution and service methods, increased diversification of products by competitors, and regulatory changes in the rules governing the operations of banks and non-bank competitors. For example, changes in the financial services sector in Australia and New Zealand have made it possible for non-banks to offer products and services traditionally provided by banks, such as automatic payments systems, mortgages, and credit cards. In addition, banks organised in jurisdictions outside Australia and New Zealand are subject to different levels of regulation and consequently some may have lower cost structures. Increasing competition for customers could also potentially lead to a compression in the Group’s net interest margins, or increased advertising and related expenses to attract and retain customers.
Additionally, the Australian Government announced in late 2010 a set of measures with the stated purpose of promoting a competitive and sustainable banking system in Australia. Any regulatory or behavioural change that occurs in response to this policy shift could have the effect of limiting or reducing the Group’s revenue earned from its banking products or operations. These regulatory changes could also result in higher operating costs. A reduction or limitation in revenue or an increase in operating costs could adversely affect the Group’s profitability.
The effect of competitive market conditions, especially in the Group’s main markets and products, may lead to erosion in the Group’s market share or margins, and adversely affect the Group’s business, operations, and financial condition.
5. Changes in monetary policies may adversely affect the Group’s business, operations and financial condition
Central monetary authorities (including the Reserve Bank of Australia (RBA) and the Reserve Bank of New Zealand (RBNZ), the US Federal Reserve and the monetary authorities in Asian jurisdictions in which ANZ carries out business) set official interest rates so as to affect the demand for money and credit in their relevant jurisdictions (in some Asian jurisdictions currency policy is used to influence general business conditions and the demand for money and credit). These policies can significantly affect the Group’s cost of funds for lending and investing and the return that the Group will earn on those loans and investments. Both these factors impact the Group’s net interest margin and can affect the value of financial instruments it holds, such as debt securities and hedging instruments. The policies of the central monetary authorities can also affect the Group’s borrowers, potentially increasing the risk that they may fail to repay loans. Changes in such policies are difficult to predict.
6. Sovereign risk may destabilise global financial markets adversely affecting all participants, including the Group
Sovereign risk, or the risk that foreign governments will default on their debt obligations, increase borrowings as and when required or be unable to refinance their debts as they fall due or nationalise participants in their economy, has emerged as a risk to the recovery prospects of many economies. This risk is particularly relevant to a number of European countries though it is not limited to these places and includes the US. Should one sovereign default, there could be a cascading effect to other markets and countries, the consequences of which, while difficult to predict, may be similar to or worse than those currently being experienced or which were experienced during the global financial crisis. Such an event could destabilise global financial markets adversely affecting all participants, including the Group.
| PRINCIPAL RISKS AND UNCERTAINTIES 63 |

7. The Group is exposed to liquidity and funding risk, which may adversely affect its business, operations and financial condition
Liquidity risk is the risk that the Group is unable to meet its payment obligations as they fall due, including repaying depositors or maturing wholesale debt, or that the Group has insufficient capacity to fund increases in assets. Liquidity risk is inherent in all banking operations due to the timing mismatch between cash inflows and cash outflows.
Reduced liquidity could lead to an increase in the cost of the Group’s borrowings and possibly constrain the volume of new lending, which could adversely affect the Group’s profitability. A significant deterioration in investor confidence in the Group could materially impact the Group’s cost of borrowing, and the Group’s ongoing operations and funding.
The Group raises funding from a variety of sources including customer deposits and wholesale funding in Australia and offshore markets to ensure that it continues to meet its funding obligations and to maintain or grow its business generally. In times of systemic liquidity stress, in the event of damage to market confidence in the Group or in the event that funding inside or outside of Australia is not available or constrained, the Group’s ability to access sources of funding and liquidity may be constrained and it will be exposed to liquidity risk. In any such cases, ANZ may be forced to seek alternative funding. The availability of such alternative funding, and the terms on which it may be available, will depend on a variety of factors, including prevailing market conditions and ANZ’s credit ratings. Even if available, the cost of these alternatives may be more expensive or on unfavourable terms.
Future deterioration in market conditions may limit the Group’s ability to replace maturing liabilities and access funding in a timely and cost-effective manner necessary to fund and grow its business.
8. The Group is exposed to the risk that its credit ratings could change, which could adversely affect its ability to raise capital and wholesale funding
ANZ’s credit ratings have a significant impact on both its access to, and cost of, capital and wholesale funding. Credit ratings are not a recommendation by the relevant rating agency to invest in securities offered by ANZ. Credit ratings may be withdrawn, subject to qualifiers, revised or suspended by the relevant credit rating agency at any time and the methodologies by which they are determined may be revised. A downgrade or potential downgrade to ANZ’s credit rating may reduce access to capital and wholesale debt markets, potentially leading to an increase in funding costs, as well as affecting the willingness of counterparties to transact with it.
In addition, the ratings of individual securities (including, but not limited to, certain Tier 1 capital and Tier 2 capital securities) issued by ANZ (and banks globally) could be impacted from time to time by changes in the ratings methodologies used by rating agencies. Ratings agencies may also revise their methodologies in response to legal or regulatory changes or other market developments.
9. The Group may experience challenges in managing its capital base, which could give rise to greater volatility in capital ratios
The Group’s capital base is critical to the management of its businesses and access to funding. The Group is required by regulators including, but not limited to, APRA, RBNZ, the UK Financial Services Authority, United States of America regulators and regulators in various Asia Pacific jurisdictions (such as KKMA, MAS) where the Group has operations, to maintain adequate regulatory capital.
Under current regulatory requirements, risk-weighted assets and expected loan losses increase as a counterparty’s risk grade worsens. These additional regulatory capital requirements compound any reduction in capital resulting from lower profits in times of stress. As a result, greater volatility in capital ratios may arise and may require the Group to raise additional capital. There can be no certainty that any additional capital required would be available or could be raised on reasonable terms.
The Group’s capital ratios may be affected by a number of factors, such as lower earnings (including lower dividends from its deconsolidated subsidiaries including insurance and funds management businesses and associates), increased asset growth, changes in the value of the Australian dollar against other currencies in which the Group operates (particularly the New Zealand dollar and U.S. dollar) which impacts risk weighted assets or the foreign currency translation reserve and changes in business strategy (including acquisitions and investments or an increase in capital intensive businesses).
Global and domestic regulators have released proposals, including the Basel III proposals, to strengthen, among other things, the liquidity and capital requirements of banks, funds management entities, and insurance entities. These proposals, together with any risks arising from any regulatory changes, are described below in the risk factor entitled “Regulatory changes or a failure to comply with regulatory standards, law or policies may adversely affect the Group’s business, operations or financial condition”.
10. The Group is exposed to credit risk, which may adversely affect its business, operations and financial condition
As a financial institution, the Group is exposed to the risks associated with extending credit to other parties. Less favourable business or economic conditions, whether generally or in a specific industry sector or geographic region, or natural disasters, could cause customers or counterparties to fail to meet their obligations in accordance with agreed terms. For example, our customers and counterparties in the natural resources sector could be adversely impacted in the event of a prolonged slowdown in the Chinese economy. Also, our customers and counterparties in the agriculture, tourism and manufacturing industries may have been adversely impacted by the sustained strength of the Australian and New Zealand dollar relative to other currencies. The Group holds provisions for credit impairment. The amount of these provisions is determined by assessing the extent of impairment inherent within the current lending portfolio, based on current information. This process, which is critical to the Group’s financial condition and results, requires difficult, subjective and complex judgments, including forecasts of how current and future economic conditions might impair the ability of borrowers to repay their loans. However,
| 64 |

if the information upon which the assessment is made proves to be inaccurate or if the Group fails to analyse the information correctly, the provisions made for credit impairment may be insufficient, which could have a material adverse effect on the Group’s business, operations and financial condition.
In addition, in assessing whether to extend credit or enter into other transactions with customers, the Group relies on information provided by or on behalf of customers, including financial statements and other financial information. The Group may also rely on representations of customers as to the accuracy and completeness of that information and, with respect to financial statements, on reports of independent auditors. The Group’s financial performance could be negatively impacted to the extent that it relies on information that is inaccurate or materially misleading.
11. An increase in the failure of third parties to honor their commitments in connection with the Group’s trading, lending, derivatives and other activities may adversely affect its business, operations and financial condition
The Group is exposed to the potential risk of credit-related losses that can occur as a result of a counterparty being unable or unwilling to honour its contractual obligations. As with any financial services organisation, the Group assumes counterparty risk in connection with its lending, trading, derivatives and other businesses where it relies on the ability of a third party to satisfy its financial obligations to the Group on a timely basis. The Group is also subject to the risk that its rights against third parties may not be enforceable in certain circumstances.
Credit exposure may also be increased by a number of factors including deterioration in the financial condition of the economy, including a sustained high level unemployment, a deterioration of the financial condition of the Group’s counterparties, the value of assets the Group holds as collateral, and the market value of the counterparty instruments, and obligations it holds. Credit losses can and have resulted in financial services organisations realising significant losses and in some cases failing altogether. Should material unexpected credit losses occur they could have a materially adverse effect on the Group’s business, operations and financial condition.
12. Weakening of the real estate markets in Australia, New Zealand or other markets where it does business may adversely affect the Group’s business, operations and financial condition
Residential, commercial and rural property lending, together with property finance, including real estate development and investment property finance, constitute important businesses to the Group.
A decrease in property valuations in Australia, New Zealand or other markets where it does business could decrease the amount of new lending the Group is able to write and/or increase the losses that the Group may experience from existing loans, which, in either case, could materially and adversely impact the Group’s financial condition and results of operations. A significant slowdown in the Australian and New Zealand housing markets or in other markets where it does business could adversely affect the Group’s business, operations and financial conditions.
13. The Group is exposed to market risk which may adversely affect its business, operations and financial condition
The Group is subject to market risk, which is the risk to the Group’s earnings arising from changes in interest rates, foreign exchange rates, credit spreads, equity prices and indices, prices of commodities, debt securities and other financial contracts, including derivatives. Losses arising from these risks may have a material adverse effect on the Group. As the Group conducts business in several different currencies, its businesses may be affected by a change in currency exchange rates. Additionally, the Group’s annual and interim reports are prepared and stated in Australian dollars, any appreciation in the Australian dollar against other currencies in which the Group earns revenues (particularly to the New Zealand dollar and U.S. dollar) may adversely affect the reported earnings.
The profitability of the Group’s funds management and insurance businesses is also affected by changes in investment markets and weaknesses in global securities markets.
14. The Group is exposed to the risks associated with credit intermediation and financial guarantors which may adversely affect its business, operations and financial condition
The Group entered into a series of structured credit intermediation trades from 2004 to 2007. The Group sold protection using credit default swaps over these structures and then, to mitigate risk, purchased protection via credit default swaps over the same structures from eight U.S. financial guarantors. The underlying structures involve credit default swaps (CDSs) over synthetic collateralised debt obligations (CDOs), portfolios of external collateralised loan obligations (CLOs) or specific bonds/floating rate notes (FRNs).
Being derivatives, both the sold protection and purchased protection are marked-to-market. Prior to the commencement of the global financial crisis, movements in valuations of these positions were not significant and the credit valuation adjustment (CVA) charge on the protection bought from the non-collateralised financial guarantors was minimal.
During and after the global financial crisis, the market value of the structured credit transactions increased and the financial guarantors were downgraded. The combined impact of this was to increase the CVA charge on the purchased protection from financial guarantors. Volatility in the market value and hence CVA will continue to persist given the volatility in credit spreads and USD/AUD rates.
Credit valuation adjustments are included as part of the Group’s profit and loss statement, and accordingly, increases in the CVA charge or volatility in that charge could adversely affect the Group’s profitability.
| PRINCIPAL RISKS AND UNCERTAINTIES 65 |

15. The Group is exposed to operational risk, which may adversely affect its business, operations and financial condition
Operational Risk is the risk of loss resulting from inadequate or failed internal processes, people and systems or from external events. This definition includes legal risk, and the risk of reputational loss or damage arising from inadequate or failed internal processes, people and systems, but excludes strategic risk.
Loss from operational risk events could adversely affect the Group’s financial results. Such losses can include fines, penalties, loss or theft of funds or assets, legal costs, customer compensation, loss of shareholder value, reputation loss, loss of life or injury to people, and loss of property and/or information.
Operational risk is typically classified into risk event type categories to measure and compare risks on a consistent basis. Examples of operational risk events according to category are as follows:
| n | Internal Fraud: Risk that fraudulent acts are planned, initiated or executed by employees (permanent, temporary or contractors) from inside ANZ e.g. Rogue Trader. |
| n | External Fraud: Fraudulent acts or attempts which originate from outside ANZ e.g. valueless cheques, counterfeit credit cards, loan applications in false names, stolen identity etc. |
| n | Employment Practices & Workplace Safety: Employee relations, diversity and discrimination, and health and safety risks to ANZ employees. |
| n | Clients, Products & Business Practices: Risk of market manipulation, product defects, incorrect advice, money laundering, misuse of customer information etc. |
| n | Business Disruption (including Systems Failures): Risk that ANZ’s banking operating systems are disrupted or fail. At ANZ, technology risks are key Operational Risks which fall under this category. |
| n | Damage to Physical Assets: Risk that a natural disaster, terrorist or vandalism attack damages ANZ’s buildings or property. |
| n | Execution, Delivery & Process Management: Risk that ANZ experiences losses as a result of data entry errors, accounting errors, vendor, supplier or outsource provider errors, or failed mandatory reporting. |
Direct or indirect losses that occur as a result of operational failures, breakdowns, omissions or unplanned events could adversely affect the Group’s financial results.
16. Disruption of information technology systems or failure to successfully implement new technology systems could significantly interrupt the Group’s business which may adversely affect its business, operations and financial condition
The Group is highly dependent on information systems and technology and there is a risk that these, or the services the Group uses or is dependent upon, might fail, including because of unauthorised access or use.
Most of the Group’s daily operations are computer-based and information technology systems are essential to maintaining effective communications with customers. The exposure to systems risks includes the complete or partial failure of information technology systems or data centre infrastructure, the inadequacy of internal and third-party information technology systems due to, among other things, failure to keep pace with industry developments and the capacity of the existing systems to effectively accommodate growth, prevent unauthorised access and integrate existing and future acquisitions and alliances.
To manage these risks, the Group has disaster recovery and information technology governance practices and security in place. However, any failure of these systems could result in business interruption, loss of customers, financial compensation, damage to reputation and/or a weakening of the Group’s competitive position, which could adversely impact the Group’s business and have a material adverse effect on the Group’s financial condition and operations.
In addition, the Group has an ongoing need to update and implement new information technology systems, in part to assist it to satisfy regulatory demands, ensure information security, enhance computer-based banking services for the Group’s customers and integrate the various segments of its business. The Group may not implement these projects effectively or execute them efficiently, which could lead to increased project costs, delays in the ability to comply with regulatory requirements, failure of the Group’s information security controls or a decrease in the Group’s ability to service its customers.
17. The Group is exposed to risks associated with information security, which may adversely affect its financial results and reputation
Information security means protecting information and information systems from unauthorised access, use, disclosure, disruption, modification, perusal, inspection, recording or destruction. As a bank, the Group handles a considerable amount of personal and confidential information about its customers and its own internal operations. The Group also uses third parties to process and manage information on its behalf. The Group employs a team of information security subject matter experts who are responsible for the development and implementation of the Group’s Information Security Policy. The Group is conscious that threats to information security are continuously evolving and as such the Group conducts regular internal and external reviews to ensure new threats are identified, evolving risks are mitigated, policies and procedures are updated, and good practice is maintained. However, there is a risk that information may be inadvertently or inappropriately accessed or distributed or illegally accessed or stolen. Any unauthorised use of confidential information could potentially result in breaches of privacy laws, regulatory sanctions, legal action, and claims for compensation or erosion to the Group’s competitive market position, which could adversely affect the Group’s financial position and reputation.
| 66 |

18. The Group is exposed to reputation risk, which may adversely impact its business, operations and financial condition
Damage to the Group’s reputation may have wide-ranging impacts, including adverse effects on the Group’s profitability, capacity and cost of sourcing funding, and availability of new business opportunities.
Reputation risk may arise as a result of an external event or the Group’s own actions, and adversely affect perceptions about the Group held by the public (including the Group’s customers), shareholders, investors, regulators or rating agencies. The impact of a risk event on the Group’s reputation may exceed any direct cost of the risk event itself and may adversely impact the Group’s business, operations and financial condition.
19. The unexpected loss of key staff or inadequate management of human resources may adversely affect the Group’s business, operations and financial condition
The Group’s ability to attract and retain suitably qualified and skilled employees is an important factor in achieving its strategic objectives. The Chief Executive Officer and the management team of the Chief Executive Officer have skills and reputation that are critical to setting the strategic direction, successful management and growth of the Group, and whose unexpected loss due to resignation, retirement, death or illness may adversely affect its operations and financial condition. In addition, the Group may in the future have difficulty attracting highly qualified people to fill important roles, which could adversely affect its business, operations and financial condition.
20. The Group may be exposed to the impact of future climate change, geological events, plant and animal diseases, and other extrinsic events which may adversely affect its business, operations and financial condition
ANZ is exposed to climate related events (including climate change). These events may include severe storms, drought, fires, cyclones, hurricanes, floods and rising sea levels. The impact of these events may temporarily interrupt or restrict the provision of some Group services, and also adversely affect the Group’s collateral position in relation to credit facilities extended to customers.
ANZ may also be exposed to other events such as geological events (volcanic or seismic activity, tsunamis); plant and animal diseases or a flu pandemic. These may severely disrupt normal business activity and have a negative effect on the Group’s business, operations and financial condition. The most recent example of this would be the major earthquakes in Christchurch New Zealand. Whilst much of the widespread property damage was covered by public (Earthquake Commission) and private insurance, there will potentially be negative impacts on property (and hence security) values and on future levels of insurance and reinsurance coverage across New Zealand. A reduction in value of New Zealand property as a result of geological events such as earthquakes could increase lending losses which may adversely affect the Group’s business, operations and financial condition.
21. Regulatory changes or a failure to comply with regulatory standards, law or policies may adversely affect the Group’s business, operations or financial condition
The Group is subject to laws, regulations, policies and codes of practice in Australia, New Zealand, the United Kingdom, the United States of America, Hong Kong, Singapore, Japan, China and other countries within the Asia Pacific region in which it has operations, trades or raises funds or in respect of which it has some other connection. In particular, the Group’s banking, funds management and insurance activities are subject to extensive regulation, mainly relating to its liquidity levels, capital, solvency, provisioning, and insurance policy terms and conditions.
Regulations vary from country to country but generally are designed to protect depositors, insured parties, customers with other banking products, and the banking and insurance system as a whole. Some of the jurisdictions in which the Group operates do not permit local deposits to be used to fund operations outside of that jurisdiction. In the event the Group experiences reduced liquidity, these deposits may not be available to fund the operations of the Group.
The Australian Government and its agencies, including APRA, the RBA and other financial industry regulatory bodies including the Australian Securities and Investments Commission (ASIC), and the Australian Competition and Consumer Commission (ACCC), have supervisory oversight of the Group. The New Zealand Government and its agencies, including the RBNZ, the Financial Markets Authority and the Commerce Commission, have supervisory oversight of the Group's operations in New Zealand. To the extent that the Group has operations, trades or raises funds in, or has some other connection with, countries other than Australia or New Zealand, then such activities may be subject to the laws of, and regulation by agencies in, those countries. Such regulatory agencies include, by way of example, the U.S. Federal Reserve Board, the U.S. Department of Treasury, the U.S. Office of the Comptroller of the Currency, the U.S. Office of Foreign Assets Control, the UK Financial Services Authority, the Monetary Authority of Singapore, the Hong Kong Monetary Authority, the China Banking Regulatory Commission, the Kanto Local Finance Bureau of Japan, and other financial regulatory bodies in those countries and in other relevant countries. In addition, the Group's expansion and growth in the Asia Pacific region gives rise to a requirement to comply with a number of different legal and regulatory regimes across that region.
A failure to comply with any standards, laws, regulations or policies in any of those jurisdictions could result in sanctions by these or other regulatory agencies, the exercise of any discretionary powers that the regulators hold or compensatory action by affected persons, which may in turn cause substantial damage to the Group’s reputation. To the extent that these regulatory requirements limit the Group’s operations or flexibility, they could adversely impact the Group’s profitability and prospects.
| PRINCIPAL RISKS AND UNCERTAINTIES 67 |

These regulatory and other governmental agencies (including revenue and tax authorities) frequently review banking and tax laws, regulations, codes of practice and policies. Changes to laws, regulations, codes of practice or policies, including changes in interpretation or implementation of laws, regulations, codes of practice or policies, could affect the Group in substantial and unpredictable ways and may even conflict with each other. These may include increasing required levels of bank liquidity and capital adequacy, limiting the types of financial services and products the Group can offer, and/or increasing the ability of non-banks to offer competing financial services or products, as well as changes to accounting standards, taxation laws and prudential regulatory requirements.
As a result of the global financial crisis, regulators have proposed various amendments to financial regulation that will affect the Group. APRA, the Basel Committee on Banking Supervision (the “Basel Committee”) and regulators in other jurisdictions where the Group has a presence have released discussion papers and in some instances draft regulations in regard to strengthening the resilience of the banking and insurance sectors, including proposals to strengthen capital and liquidity requirements for the banking sector. In addition, the U.S. has passed into law the Dodd-Frank Wall Street Reform and Consumer Protection Act which significantly affects financial institutions and financial activities in the U.S.
Uncertainty remains as to the final form that the proposed regulatory changes will take in Australia, New Zealand, the U.S. and other countries in which the Group operates and any such changes could adversely affect the Group’s business, operations and financial condition. The changes may lead the Group to, among other things, change its business mix, incur additional costs as a result of increased management attention, raise additional amounts of higher-quality capital (such as ordinary shares) or retain capital (through lower dividends), and hold significant levels of additional liquid assets and undertake additional long-term wholesale funding to replace short-term wholesale funding to more closely match the Group’s asset maturity profile.
22. Unexpected changes to the Group’s license to operate in any jurisdiction may adversely affect its business, operations and financial condition
The Group is licensed to operate in the various countries, states and territories. Unexpected changes in the conditions of the licenses to operate by governments, administrations or regulatory agencies which prohibit or restrict the Group from trading in a manner that was previously permitted may adversely impact the Group’s operations and subsequent financial results.
23. The Group is exposed to insurance risk, which may adversely affect its business, operations and financial condition
Insurance risk is the risk of loss due to unexpected changes in current and future insurance claim rates. In life insurance business, insurance risk arises primarily through mortality (death) and morbidity (illness and injury) risks being greater than expected and, in the case of annuity business, should annuitants live longer than expected. For general insurance business, insurance risk arises mainly through weather-related incidents (including floods and bushfires) and other calamities, such as earthquakes, tsunamis and volcanic activities, as well as adverse variability in home, contents, motor, travel and other insurance claim amounts. For further details on climate and geological events see also the risk factor entitled “The Group may be exposed to the impact of future climate change, geological events, plant and animal diseases, and other extrinsic events which may adversely affect its business, operations and financial condition”. The Group has exposure to insurance risk in both life insurance and general insurance business, which may adversely affect its business, operations and financial condition.
24. The Group may experience reductions in the valuation of some of its assets, resulting in fair value adjustments that may have a material adverse effect on its earnings
Under Australian Accounting Standards, the Group recognises at fair value:
| n | financial instruments classified as “held-for-trading” or “designated as at fair value through profit or loss”; |
| n | financial assets classified as “available-for-sale”; and |
| n | derivatives. |
Generally, in order to establish the fair value of these instruments, the Group relies on quoted market prices or, where the market for a financial instrument is not sufficiently active, fair values are based on present value estimates or other accepted valuation techniques. In certain circumstances, the data for individual financial instruments or classes of financial instruments used by such estimates or techniques may not be available or may become unavailable due to changes in market conditions. In these circumstances, the fair value is determined using data derived and extrapolated from market data, and tested against historic transactions and observed market trends.
The valuation models incorporate the impact of factors that would influence the fair value determined by a market participant. Principal inputs used in the determination of the fair value of financial instruments based on valuation techniques include data inputs such as statistical data on delinquency rates, foreclosure rates, actual losses, counterparty credit spreads, recovery rates, implied default probabilities, credit index tranche prices and correlation curves. These assumptions, judgments and estimates need to be updated to reflect changing trends and market conditions. The resulting change in the fair values of the financial instruments could have a material adverse effect on the Group’s earnings.
| 68 |

25. Changes to accounting policies may adversely affect the Group’s business, operations and financial condition
The accounting policies and methods that the Group applies are fundamental to how it records and reports its financial position and results of operations. Management must exercise judgment in selecting and applying many of these accounting policies and methods so that they not only comply with generally accepted accounting principles but they also reflect the most appropriate manner in which to record and report on the financial position and results of operations. However, these accounting policies may be applied inaccurately, resulting in a misstatement of financial position and results of operations.
In some cases, management must select an accounting policy or method from two or more alternatives, any of which might comply with generally accepted accounting principles and be reasonable under the circumstances, yet might result in reporting materially different outcomes than would have been reported under another alternative.
26. The Group may be exposed to the risk of impairment to capitalised software, goodwill and other intangible assets that may adversely affect its business, operations and financial condition
In certain circumstances the Group may be exposed to a reduction in the value of intangible assets. As at 30 September 2012, the Group carried goodwill principally related to its investments in New Zealand and Australia, intangible assets principally relating to assets recognised on acquisition of subsidiaries, and capitalised software balances.
The Group is required to assess the recoverability of the goodwill balances on at least an annual basis. For this purpose the Group uses either a discounted cash flow or a multiple of earnings calculation. Changes in the assumptions upon which the calculation is based, together with expected changes in future cash flows, could materially impact this assessment, resulting in the potential write-off of a part or all of the goodwill balances.
Capitalised software and other intangible assets (including Acquired portfolio of insurance and investment business and deferred acquisition costs) are assessed for indicators of impairment at least annually. In the event that an asset is no longer in use, or that the cash flows generated by the asset do not support the carrying value, an impairment may be recorded, adversely impacting the Group’s financial condition.
27. Litigation and contingent liabilities may adversely affect the Group’s business, operations and financial condition
From time to time, the Group may be subject to material litigation, regulatory actions, legal or arbitration proceedings and other contingent liabilities which, if they crystallise, may adversely affect the Group’s results. The Group’s material contingent liabilities are described in note 43 of the 2012 financial statements. There is a risk that these contingent liabilities may be larger than anticipated or that additional litigation or other contingent liabilities may arise.
28. The Group regularly considers acquisition and divestment opportunities, and there is a risk that ANZ may undertake an acquisition or divestment that could result in a material adverse effect on its business, operations and financial condition
The Group regularly examines a range of corporate opportunities, including material acquisitions and disposals, with a view to determining whether those opportunities will enhance the Group’s financial performance and position. Any corporate opportunity that is pursued could, for a variety of reasons, turn out to have a material adverse effect on the Group.
The successful implementation of the Group’s corporate strategy, including its strategy to expand in the Asia Pacific region, will depend on a range of factors including potential funding strategies, and challenges associated with integrating and adding value to acquired businesses, as well as new regulatory, market and other risks associated with increasing operations outside of Australia and New Zealand.
There can be no assurance that any acquisition would have the anticipated positive results, including results relating to the total cost of integration, the time required to complete the integration, the amount of longer-term cost savings, the overall performance of the combined entity, or an improved price for the Group’s securities. Integration of an acquired business can be complex and costly, sometimes including combining relevant accounting and data processing systems, and management controls, as well as managing relevant relationships with employees, customers, counterparties, suppliers and other business partners. Integration efforts could divert management attention and resources, which could adversely affect the Group’s operations or results. Additionally, there can be no assurance that employees, customers, counterparties, suppliers and other business partners of newly acquired businesses will remain as such post-acquisition, and the loss of employees, customers, counterparties, suppliers and other business partners could adversely affect the Group’s operations or results.
Acquisitions and disposals may also result in business disruptions that cause the Group to lose customers or cause customers to remove their business from the Group to competing financial institutions. It is possible that the integration process related to acquisitions could result in the disruption of the Group’s ongoing businesses or inconsistencies in standards, controls, procedures and policies that could adversely affect the Group’s ability to maintain relationships with employees, customers, counterparties, suppliers and other business partners, which could adversely affect the Group’s ability to conduct its business successfully. The Group’s operating performance, risk profile or capital structure may also be affected by these corporate opportunities and there is a risk that any of the Group’s credit ratings may be placed on credit watch or downgraded if these opportunities are pursued.
| PRINCIPAL RISKS AND UNCERTAINTIES 69 |

2012 $m | 2011 $m | 2010 $m | 2009 $m | 2008 $m | ||||||||||||||||||
Underlying financial performance1 | ||||||||||||||||||||||
Net interest income2 | 12,111 | 11,498 | 10,862 | 9,890 | 7,855 | |||||||||||||||||
Other operating income2 | 5,468 | 5,314 | 4,920 | 4,477 | 4,440 | |||||||||||||||||
Operating expenses | (8,022 | ) | (7,718 | ) | (6,971 | ) | (6,068 | ) | (5,406) | |||||||||||||
Profit before credit impairment and income tax | 9,557 | 9,094 | 8,811 | 8,299 | 6,889 | |||||||||||||||||
Provision for credit impairment | (1,246 | ) | (1,211 | ) | (1,820 | ) | (3,056 | ) | (2,090) | |||||||||||||
Income tax expense | (2,294 | ) | (2,222 | ) | (1,960 | ) | (1,469 | ) | (1,365) | |||||||||||||
Non-controlling interests | (6 | ) | (9 | ) | (6 | ) | (2 | ) | (8) | |||||||||||||
Underlying profit1 | 6,011 | 5,652 | 5,025 | 3,772 | 3,426 | |||||||||||||||||
Adjustments between statutory profit and underlying profit1 | (350 | ) | (297 | ) | (524 | ) | (829 | ) | (107) | |||||||||||||
Profit attributable to shareholders of the Company | 5,661 | 5,355 | 4,501 | 2,943 | 3,319 | |||||||||||||||||
Financial position | ||||||||||||||||||||||
Assets2,3 | 642,127 | 604,213 | 531,703 | 476,987 | 470,293 | |||||||||||||||||
Net assets | 41,220 | 37,954 | 34,155 | 32,429 | 26,552 | |||||||||||||||||
Tier 1 capital ratio4 | 10.8% | 10.9% | 10.1% | 10.6% | 7.7% | |||||||||||||||||
Return on average ordinary equity5 | 14.6% | 15.3% | 13.9% | 10.3% | 14.5% | |||||||||||||||||
Return on average assets2 | 0.9% | 0.9% | 0.9% | 0.6% | 0.8% | |||||||||||||||||
Cost to income ratio1 | 45.6% | 45.9% | 44.2% | 42.2% | 44.0% | |||||||||||||||||
Shareholder value – ordinary shares | ||||||||||||||||||||||
Total return to shareholders (share price movement plus dividends) | 35.4% | -12.6% | 1.9% | 40.3% | -33.5% | |||||||||||||||||
Market capitalisation | 67,255 | 51,319 | 60,614 | 61,085 | 38,263 | |||||||||||||||||
Dividend | 145 cents | 140 cents | 126 cents | 102 cents | 136 cents | |||||||||||||||||
Franked portion | – interim | 100% | 100% | 100% | 100% | 100% | ||||||||||||||||
– final | 100% | 100% | 100% | 100% | 100% | |||||||||||||||||
Share price | – high | $25.12 | $25.96 | $26.23 | $24.99 | $31.74 | ||||||||||||||||
– low | $20.26 | $17.63 | $19.95 | $11.83 | $15.07 | |||||||||||||||||
– closing | $24.75 | $19.52 | $23.68 | $24.39 | $18.75 | |||||||||||||||||
Share information | ||||||||||||||||||||||
(per fully paid ordinary share) | ||||||||||||||||||||||
Earnings per share | 213.4c | 208.2c | 178.9c | 131.0c | 170.4c | |||||||||||||||||
Dividend payout ratio | 69.3% | 68.6% | 71.6% | 82.3% | 82.6% | |||||||||||||||||
Net tangible assets per ordinary share6 | $12.22 | $11.44 | $10.38 | $11.02 | $10.72 | |||||||||||||||||
No. of fully paid ordinary shares issued (millions) | 2,717.4 | 2,629.0 | 2,559.7 | 2,504.5 | 2,040.7 | |||||||||||||||||
Dividend Reinvestment Plan (DRP) issue price | ||||||||||||||||||||||
– interim | $20.44 | $21.69 | $21.32 | $15.16 | $20.82 | |||||||||||||||||
– final | – | $19.09 | $22.60 | $21.75 | $13.58 | |||||||||||||||||
Other information | ||||||||||||||||||||||
Points of representation7 | 1,337 | 1,381 | 1,394 | 1,352 | 1,346 | |||||||||||||||||
No. of employees (full time equivalents)8 | 48,239 | 50,297 | 47,099 | 37,687 | 36,925 | |||||||||||||||||
No. of shareholders9 | 438,958 | 442,943 | 411,692 | 396,181 | 376,813 | |||||||||||||||||
| 1 | Profit has been adjusted for certain non-core items to arrive at underlying profit, the result for the ongoing business activities of the Group. These adjustments have been determined on a consistent basis with those made in prior years. The adjustments made in arriving at underlying profit are included in statutory profit which is subject to audit within the context of the Group statutory audit opinion. Underlying profit is not audited, however, the external auditor has informed the Audit Committee that the adjustments, and the presentation thereof, are based on the guidelines released by the Australian Institute of Company Directors (AICD) and the Financial Services Institute of Australasia (FINSIA), and have been determined on a consistent basis with those made in prior years. Refer to page 204 to 206 for analysis of the adjustments between statutory profit and underlying profit. |
| 2 | The 2011 comparative information has been restated to reflect the impact of the current period reporting treatment of derivative related collateral posted/received and the associated interest income/expense. Refer to note 1 of the financial statement for further details. The 2008 to 2010 comparative information has not been restated. |
| 3 | In 2010, consolidated assets included assets from ANZ Wealth Australia (formerly OnePath Australia), OnePath NZ (formerly ING NZ), Landmark and RBS acquired during the financial year. |
| 4 | Calculated in accordance with APRA requirements effective at the relevant date. Basel II has been applied from 1 January 2008. |
| 5 | Average ordinary equity excludes non-controlling interests and preference shares. |
| 6 | Equals shareholders’ equity less preference share capital, goodwill, software and other intangible assets divided by the number of ordinary shares. |
| 7 | Includes branches, offices, representative offices and agencies. |
| 8 | Comparative amounts have changed reflecting an amendment to FTE to align to the current year methodology (2011: FTE increased by 1,359). |
| 9 | Excludes employees whose only ANZ shares are held in trust under ANZ employee share schemes. |
70
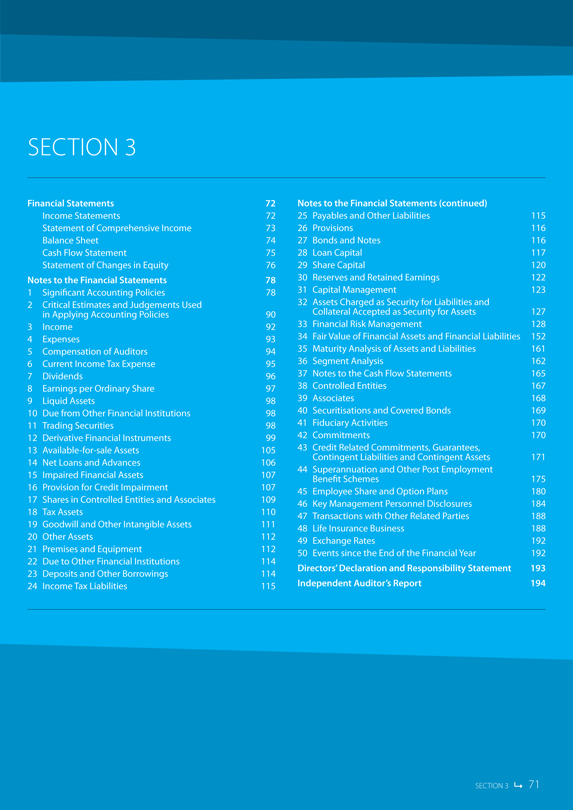

| Consolidated | The Company | |||||||||||||||||||
| Note |
2012 $m | 2011 $m |
2012 $m | 2011 $m | ||||||||||||||||
Interest income | 3 | 30,538 | 30,443 | 27,340 | 27,070 | |||||||||||||||
Interest expense | 4 | (18,428 | ) | (18,943 | ) | (18,372 | ) | (18,542) | ||||||||||||
Net interest income | 12,110 | 11,500 | 8,968 | 8,528 | ||||||||||||||||
Other operating income | 3 | 4,003 | 3,591 | 5,015 | 4,111 | |||||||||||||||
Net funds management and insurance income | 3 | 1,203 | 1,405 | 207 | 183 | |||||||||||||||
Share of associates’ profit | 3 | 395 | 436 | – | – | |||||||||||||||
Operating income | 17,711 | 16,932 | 14,190 | 12,822 | ||||||||||||||||
Operating expense | 4 | (8,519 | ) | (8,023 | ) | (6,715 | ) | (6,256) | ||||||||||||
Profit before credit impairment and income tax | 9,192 | 8,909 | 7,475 | 6,566 | ||||||||||||||||
Provision for credit impairment | 16 | (1,198 | ) | (1,237 | ) | (985 | ) | (994) | ||||||||||||
Profit before income tax | 7,994 | 7,672 | 6,490 | 5,572 | ||||||||||||||||
Income tax expense | 6 | (2,327 | ) | (2,309 | ) | (1,615 | ) | (1,421) | ||||||||||||
Profit for the year | 5,667 | 5,363 | 4,875 | 4,151 | ||||||||||||||||
Comprising: | ||||||||||||||||||||
Profit attributable to non-controlling interests | (6 | ) | (8 | ) | – | – | ||||||||||||||
Profit attributable to shareholders of the Company | 5,661 | 5,355 | 4,875 | 4,151 | ||||||||||||||||
Earnings per ordinary share (cents) | ||||||||||||||||||||
Basic | 8 | 213.4 | 208.2 | n/a | n/a | |||||||||||||||
Diluted | 8 | 205.6 | 198.8 | n/a | n/a | |||||||||||||||
Dividend per ordinary share (cents) | 7 | 145 | 140 | 145 | 140 | |||||||||||||||
The notes appearing on pages 78 to 192 form an integral part of these financial statements.
72

| Consolidated | The Company | |||||||||||||||||||
| Note |
2012 $m | 2011 $m |
2012 $m | 2011 $m | ||||||||||||||||
Profit for the year | 5,667 | 5,363 | 4,875 | 4,151 | ||||||||||||||||
Other comprehensive income | ||||||||||||||||||||
Foreign currency translation reserve | ||||||||||||||||||||
Exchange differences taken to equity | 30 | (416 | ) | 330 | (174 | ) | 97 | |||||||||||||
Available-for-sale assets | ||||||||||||||||||||
Valuation gain/(loss) taken to equity | 30 | 259 | 77 | 153 | (10) | |||||||||||||||
(Gain)/loss transferred to the income statement | (246 | ) | 19 | (171 | ) | 57 | ||||||||||||||
Cash flow hedges reserve | ||||||||||||||||||||
Valuation gain/(loss) taken to equity | 30 | 43 | 229 | 32 | 183 | |||||||||||||||
Transferred to income statement for the period | 17 | (9 | ) | 27 | (12) | |||||||||||||||
Share of associates’ other comprehensive income1 | (31 | ) | (15 | ) | – | – | ||||||||||||||
Actuarial gain/(loss) on defined benefit plans | 44 | (54 | ) | (15 | ) | (35 | ) | 34 | ||||||||||||
Income tax on items transferred directly to/from equity | ||||||||||||||||||||
Foreign currency translation reserve | (1 | ) | (5 | ) | – | – | ||||||||||||||
Available-for-sale reserve | (17 | ) | (35 | ) | 4 | (17) | ||||||||||||||
Cash flow hedge reserve | (17 | ) | (63 | ) | (17 | ) | (51) | |||||||||||||
Actuarial gain/(loss) on defined benefits plan | 10 | 5 | 6 | (10) | ||||||||||||||||
Other comprehensive income net of tax | (453 | ) | 518 | (175 | ) | 271 | ||||||||||||||
Total comprehensive income for the year | 5,214 | 5,881 | 4,700 | 4,422 | ||||||||||||||||
Comprising total comprehensive income attributable to: | ||||||||||||||||||||
Non-controlling interests | 3 | 8 | – | – | ||||||||||||||||
Shareholders of the Company | 5,211 | 5,873 | 4,700 | 4,422 | ||||||||||||||||
| 1 | Share of associates’ other comprehensive income for 2012 comprises available-for-sale assets $(28) million (2011: $(15) million), foreign currency translation reserve $1 million (2011: $(1) million) and cash flow hedge reserve $(4) million (2011: $1 million). |
The notes appearing on pages 78 to 192 form an integral part of these financial statements.
FINANCIAL STATEMENTS 73

| Consolidated | The Company | |||||||||||||||||||
| Note |
2012 $m | 2011 $m |
2012 $m | 2011 $m | ||||||||||||||||
Assets | ||||||||||||||||||||
Liquid assets | 9 | 36,578 | 25,627 | 32,782 | 21,283 | |||||||||||||||
Due from other financial institutions | 10 | 17,103 | 13,298 | 14,167 | 10,070 | |||||||||||||||
Trading securities | 11 | 40,602 | 36,074 | 30,490 | 28,367 | |||||||||||||||
Derivative financial instruments | 12 | 48,929 | 58,641 | 43,266 | 51,720 | |||||||||||||||
Available-for-sale assets | 13 | 20,562 | 22,264 | 17,841 | 19,017 | |||||||||||||||
Net loans and advances | 14 | 427,823 | 397,307 | 350,060 | 323,974 | |||||||||||||||
Regulatory deposits | 1,478 | 1,505 | 514 | 497 | ||||||||||||||||
Due from controlled entities | – | – | 63,660 | 46,446 | ||||||||||||||||
Shares in controlled entities | 17 | – | – | 11,516 | 9,098 | |||||||||||||||
Shares in associates | 17 | 3,520 | 3,513 | 897 | 971 | |||||||||||||||
Current tax assets | 18 | 33 | 41 | 13 | 40 | |||||||||||||||
Deferred tax assets | 18 | 785 | 599 | 768 | 552 | |||||||||||||||
Goodwill and other intangible assets | 19 | 7,082 | 6,964 | 1,752 | 1,544 | |||||||||||||||
Investments backing policy liabilities | 48 | 29,895 | 29,859 | – | – | |||||||||||||||
Other assets | 20 | 5,623 | 6,396 | 3,747 | 3,856 | |||||||||||||||
Premises and equipment | 21 | 2,114 | 2,125 | 1,534 | 1,502 | |||||||||||||||
Total assets | 642,127 | 604,213 | 573,007 | 518,937 | ||||||||||||||||
Liabilities | ||||||||||||||||||||
Due to other financial institutions | 22 | 30,538 | 27,535 | 28,394 | 24,709 | |||||||||||||||
Deposits and other borrowings | 23 | 397,123 | 368,729 | 333,536 | 307,254 | |||||||||||||||
Derivative financial instruments | 12 | 52,639 | 55,290 | 46,047 | 48,747 | |||||||||||||||
Due to controlled entities | – | – | 57,729 | 38,561 | ||||||||||||||||
Current tax liabilities | 24 | 781 | 1,128 | 726 | 1,079 | |||||||||||||||
Deferred tax liabilities | 24 | 18 | 28 | 12 | 27 | |||||||||||||||
Policy liabilities | 48 | 29,537 | 27,503 | – | – | |||||||||||||||
External unit holder liabilities (life insurance funds) | 3,949 | 5,033 | – | – | ||||||||||||||||
Payables and other liabilities | 25 | 10,109 | 11,221 | 7,554 | 7,696 | |||||||||||||||
Provisions | 26 | 1,201 | 1,248 | 745 | 798 | |||||||||||||||
Bonds and notes | 27 | 63,098 | 56,551 | 49,975 | 44,870 | |||||||||||||||
Loan capital | 28 | 11,914 | 11,993 | 11,246 | 10,817 | |||||||||||||||
Total liabilities | 600,907 | 566,259 | 535,964 | 484,558 | ||||||||||||||||
Net assets | 41,220 | 37,954 | 37,043 | 34,379 | ||||||||||||||||
Shareholders’ equity | ||||||||||||||||||||
Ordinary share capital | 29 | 23,070 | 21,343 | 23,350 | 21,701 | |||||||||||||||
Preference share capital | 29 | 871 | 871 | 871 | 871 | |||||||||||||||
Reserves | 30 | (2,498 | ) | (2,095 | ) | (686 | ) | (544) | ||||||||||||
Retained earnings | 30 | 19,728 | 17,787 | 13,508 | 12,351 | |||||||||||||||
Share capital and reserves attributable to shareholders of the Company | 41,171 | 37,906 | 37,043 | 34,379 | ||||||||||||||||
Non-controlling interests | 29 | 49 | 48 | – | – | |||||||||||||||
Total equity | 41,220 | 37,954 | 37,043 | 34,379 | ||||||||||||||||
Commitments | 43 | |||||||||||||||||||
Contingent liabilities | 43 | |||||||||||||||||||
The notes appearing on pages 78 to 192 form an integral part of these financial statements.
74

| Consolidated | The Company | |||||||||||||||||||
| Note |
Inflows 2012 $m |
Inflows 2011 $m |
Inflows 2012 $m |
Inflows 2011 $m | ||||||||||||||||
Cash flows from operating activities | ||||||||||||||||||||
Interest received | 30,421 | 30,310 | 27,255 | 26,948 | ||||||||||||||||
Interest paid | (18,827) | (18,797) | (18,742) | (17,874) | ||||||||||||||||
Dividends received | 80 | 84 | 1,437 | 974 | ||||||||||||||||
Other operating income received | 2,698 | 3,879 | 2,613 | 3,747 | ||||||||||||||||
Personnel expenses paid | (4,773) | (4,547) | (3,718) | (3,560) | ||||||||||||||||
Other operating expenses paid | (3,062) | (2,630) | (2,736) | (2,535) | ||||||||||||||||
Net cash (paid)/received on derivatives | 4,734 | (2,038) | 3,687 | (3,751) | ||||||||||||||||
Income taxes (paid)/received refunds received | (2,835) | (2,033) | (2,454) | (1,792) | ||||||||||||||||
Net cash flows from funds management & insurance business | ||||||||||||||||||||
Premiums, other income and life investment deposits received | 5,955 | 5,858 | 150 | 134 | ||||||||||||||||
Investment income and policy deposits received/(paid) | 78 | (21) | – | – | ||||||||||||||||
Claims and policy liability payments | (4,428) | (4,531) | – | – | ||||||||||||||||
Commission expense paid | (439) | (491) | 58 | 49 | ||||||||||||||||
Cash flows from operating activities before changes in operating assets and liabilities: | 9,602 | 5,043 | 7,550 | 2,340 | ||||||||||||||||
Changes in operating assets and liabilities arising from cash flow movements: | ||||||||||||||||||||
(Increase)/decrease in operating assets: | ||||||||||||||||||||
Liquid assets | 435 | 1,593 | 419 | 1,106 | ||||||||||||||||
Due from other financial institutions | (4,256) | (1,476) | (3,886) | (1,586) | ||||||||||||||||
Trading Securities | (4,589) | (7,614) | (2,275) | (5,558) | ||||||||||||||||
Loans and advances | (32,748) | (25,568) | (28,592) | (25,753) | ||||||||||||||||
Net intragroup loans and advances | – | – | (283) | 336 | ||||||||||||||||
Net cash flows from investments backing policy liabilities | ||||||||||||||||||||
Purchase of insurance assets | (7,949) | (9,127) | – | – | ||||||||||||||||
Proceeds from sale/maturity of insurance assets | 7,866 | 10,182 | – | – | ||||||||||||||||
Increase/(decrease) in operating liabilities: | ||||||||||||||||||||
Deposits and other borrowings | 33,662 | 43,834 | 30,834 | 42,542 | ||||||||||||||||
Due to other financial institutions | 4,184 | 1,350 | 4,836 | 1,415 | ||||||||||||||||
Payables and other liabilities | 209 | 584 | 441 | 835 | ||||||||||||||||
Changes in operating assets and liabilities arising from cash flow movements: | (3,186) | 13,758 | 1,494 | 13,337 | ||||||||||||||||
Net cash provided by/(used in) operating activities | 37(a | ) | 6,416 | 18,801 | 9,044 | 15,677 | ||||||||||||||
Cash flows from investing activities | ||||||||||||||||||||
Available-for-sale assets | ||||||||||||||||||||
Purchases | (30,441) | (40,657) | (28,558) | (37,402) | ||||||||||||||||
Proceeds from sale or maturity | 31,200 | 39,518 | 28,839 | 35,409 | ||||||||||||||||
Controlled entities and associates | ||||||||||||||||||||
Purchased (net of cash acquired) | (1) | (304) | (327) | (260) | ||||||||||||||||
Proceeds from sale (net of cash disposed) | 18 | 74 | 36 | 36 | ||||||||||||||||
Premises and equipment | ||||||||||||||||||||
Purchases | (319) | (319) | (264) | (194) | ||||||||||||||||
Proceeds from sale | 20 | 6 | – | – | ||||||||||||||||
Other assets | (702) | (849) | (473) | (127) | ||||||||||||||||
Net cash provided by/(used in) investing activities | (225) | (2,531) | (747) | (2,538) | ||||||||||||||||
Cash flows from financing activities | ||||||||||||||||||||
Bonds and notes | ||||||||||||||||||||
Issue proceeds | 24,352 | 12,213 | 19,442 | 10,600 | ||||||||||||||||
Redemptions | (15,662) | (17,193) | (12,038) | (15,415) | ||||||||||||||||
Loan capital | ||||||||||||||||||||
Issue proceeds | 2,724 | 1,341 | 2,502 | 1,341 | ||||||||||||||||
Redemptions | (2,593) | (1,579) | (2,121) | (1,322) | ||||||||||||||||
Dividends paid | (2,219) | (2,113) | (2,230) | (2,124) | ||||||||||||||||
Share capital issues | 60 | 43 | 60 | 43 | ||||||||||||||||
On market share purchases | (55) | (137) | (55) | (137) | ||||||||||||||||
Net cash provided by/(used in) by financing activities | 6,607 | (7,425) | 5,560 | (7,014) | ||||||||||||||||
Net cash provided by/(used in) operating activities | 6,416 | 18,801 | 9,044 | 15,677 | ||||||||||||||||
Net cash provided by/(used in) investing activities | (225) | (2,531) | (747) | (2,538) | ||||||||||||||||
Net cash provided by/(used in) financing activities | 6,607 | (7,425) | 5,560 | (7,014) | ||||||||||||||||
Net increase/(decrease) in cash and cash equivalents | 12,798 | 8,845 | 13,857 | 6,125 | ||||||||||||||||
Cash and cash equivalents at beginning of period | 30,021 | 20,610 | 23,651 | 16,934 | ||||||||||||||||
Effects of exchange rate changes on cash and cash equivalents | (1,369) | 566 | (1,240) | 592 | ||||||||||||||||
Cash and cash equivalents at end of period | 37(b | ) | 41,450 | 30,021 | 36,268 | 23,651 | ||||||||||||||
The notes appearing on pages 78 to 192 form an integral part of these financial statements.
FINANCIAL STATEMENTS 75

| Consolidated | Ordinary share capital $m | Preference shares $m | Reserves1 $m | Retained earnings $m | Shareholders’ the Bank $m | Non-controlling interests $m | Total shareholders’ equity $m | |||||||||||||||||||||
As at 1 October 2010 | 19,886 | 871 | (2,587) | 15,921 | 34,091 | 64 | 34,155 | |||||||||||||||||||||
Profit for the year | – | – | – | 5,355 | 5,355 | 8 | 5,363 | |||||||||||||||||||||
Other comprehensive income | – | – | 528 | (10 | ) | 518 | – | 518 | ||||||||||||||||||||
Total comprehensive income for the year | – | – | 528 | 5,345 | 5,873 | 8 | 5,881 | |||||||||||||||||||||
Transactions with equity holders in their capacity as equity holders: | ||||||||||||||||||||||||||||
Dividends paid | – | – | – | (3,503 | ) | (3,503 | ) | – | (3,503) | |||||||||||||||||||
Dividend income on Treasury shares held within the Group’s life insurance statutory funds | – | – | – | 23 | 23 | – | 23 | |||||||||||||||||||||
Dividend reinvestment plan | 1,367 | – | – | – | 1,367 | – | 1,367 | |||||||||||||||||||||
Transactions with non-controlling interests | – | – | (22) | – | (22 | ) | (22 | ) | (44) | |||||||||||||||||||
Other equity movements: | ||||||||||||||||||||||||||||
ANZ employee share acquisition scheme | 45 | – | – | – | 45 | – | 45 | |||||||||||||||||||||
Share-based payments/(exercises) | – | – | (14) | – | (14 | ) | – | (14) | ||||||||||||||||||||
Treasury shares OnePath Australia adjustment | 2 | – | – | – | 2 | – | 2 | |||||||||||||||||||||
ANZ employee share option scheme | 43 | – | – | – | 43 | – | 43 | |||||||||||||||||||||
Other changes | – | – | – | 1 | 1 | (2 | ) | (1) | ||||||||||||||||||||
As at 30 September 2011 | 21,343 | 871 | (2,095) | 17,787 | 37,906 | 48 | 37,954 | |||||||||||||||||||||
Profit for the year | – | – | – | 5,661 | 5,661 | 6 | 5,667 | |||||||||||||||||||||
Other comprehensive income | – | – | (406) | (44 | ) | (450 | ) | (3 | ) | (453) | ||||||||||||||||||
Total comprehensive income for the year | – | – | (406) | 5,617 | 5,211 | 3 | 5,214 | |||||||||||||||||||||
Transactions with equity holders in their capacity as equity holders: | ||||||||||||||||||||||||||||
Dividends paid | – | – | – | (3,702 | ) | (3,702 | ) | (2 | ) | (3,704) | ||||||||||||||||||
Dividend income on Treasury shares held within the Group’s life insurance statutory funds | – | – | – | 24 | 24 | – | 24 | |||||||||||||||||||||
Dividend reinvestment plan | 1,461 | – | – | – | 1,461 | – | 1,461 | |||||||||||||||||||||
Transactions with non-controlling interests | – | – | (1) | – | (1 | ) | – | (1) | ||||||||||||||||||||
Other equity movements: | ||||||||||||||||||||||||||||
ANZ employee share acquisition plan | 128 | – | – | – | 128 | – | 128 | |||||||||||||||||||||
Share-based payments/(exercises) | – | – | 6 | – | 6 | – | 6 | |||||||||||||||||||||
Treasury shares OnePath Australia adjustment | 78 | – | – | – | 78 | – | 78 | |||||||||||||||||||||
ANZ employee share option plan | 60 | – | – | – | 60 | – | 60 | |||||||||||||||||||||
Other changes | – | – | (2) | 2 | – | – | – | |||||||||||||||||||||
As at 30 September 2012 | 23,070 | 871 | (2,498) | 19,728 | 41,171 | 49 | 41,220 | |||||||||||||||||||||
| 1 | Further information on other comprehensive income is disclosed in note 30 to the financial statements. |
The notes appearing on pages 78 to 192 form an integral part of these financial statements.
76

| The Company | Ordinary share capital $m | Preference shares $m | Reserves1 $m | Retained earnings $m | Shareholders’ $m | Non-controlling interests $m | Total shareholders’ equity $m | |||||||||||||||||||||
As at 1 October 2010 | 20,246 | 871 | (777) | 11,666 | 32,006 | – | 32,006 | |||||||||||||||||||||
Profit for the year | – | – | – | 4,151 | 4,151 | – | 4,151 | |||||||||||||||||||||
Other comprehensive income | – | – | 247 | 24 | 271 | – | 271 | |||||||||||||||||||||
Total comprehensive income for the year | – | – | 247 | 4,175 | 4,422 | – | 4,422 | |||||||||||||||||||||
Transactions with equity holders in their capacity as equity holders: | ||||||||||||||||||||||||||||
Dividends paid | – | – | – | (3,491 | ) | (3,491 | ) | – | (3,491) | |||||||||||||||||||
Dividend reinvestment plan | 1,367 | – | – | – | 1,367 | – | 1,367 | |||||||||||||||||||||
Other equity movements: | ||||||||||||||||||||||||||||
Share-based payments/(exercises) | – | – | (14) | – | (14 | ) | – | (14) | ||||||||||||||||||||
ANZ employee share option scheme | 43 | – | – | – | 43 | – | 43 | |||||||||||||||||||||
ANZ employee share acquisition scheme | 45 | – | – | – | 45 | – | 45 | |||||||||||||||||||||
Other changes | – | – | – | 1 | 1 | – | 1 | |||||||||||||||||||||
As at 30 September 2011 | 21,701 | 871 | (544) | 12,351 | 34,379 | – | 34,379 | |||||||||||||||||||||
Profit for the year | – | ��� | – | 4,875 | 4,875 | – | 4,875 | |||||||||||||||||||||
Other comprehensive income | – | – | (146) | (29 | ) | (175 | ) | – | (175) | |||||||||||||||||||
Total comprehensive income for the year | – | – | (146) | 4,846 | 4,700 | – | 4,700 | |||||||||||||||||||||
Transactions with equity holders in their capacity as equity holders: | ||||||||||||||||||||||||||||
Dividends paid | – | – | – | (3,691 | ) | (3,691 | ) | – | (3,691) | |||||||||||||||||||
Dividend reinvestment plan | 1,461 | – | – | – | 1,461 | – | 1,461 | |||||||||||||||||||||
Other equity movements: | ||||||||||||||||||||||||||||
Share-based payments/(exercises) | – | – | 6 | – | 6 | – | 6 | |||||||||||||||||||||
ANZ employee share option plan | 60 | – | – | – | 60 | – | 60 | |||||||||||||||||||||
ANZ employee share acquisition plan | 128 | – | – | – | 128 | – | 128 | |||||||||||||||||||||
Other changes | – | – | (2) | 2 | – | – | – | |||||||||||||||||||||
As at 30 September 2012 | 23,350 | 871 | (686) | 13,508 | 37,043 | – | 37,043 | |||||||||||||||||||||
| 1 | Further information on other comprehensive income is disclosed in note 30 to the financial statements. |
The notes appearing on pages 78 to 192 form an integral part of these financial statements.
FINANCIAL STATEMENTS 77

1: Significant Accounting Policies
The financial statements of Australia and New Zealand Banking Group Limited (the Company) and its controlled entities (the Group) for the year ended 30 September 2012 was authorised for issue in accordance with the resolution of the Directors on 5 November, 2012.
The principal accounting policies adopted in the preparation of these financial statements are set out below. These policies have been consistently applied by the Company and all consolidated entities and to all years presented in these financial statements.
The Company is incorporated and domiciled in Australia. The address of the Company’s registered office is ANZ Centre, Level 9, 833 Collins Street, Docklands, Victoria, Australia 3008.
The Company and Group are for-profit entities.
A) BASIS OF PREPARATION
i) Statement of compliance
The financial statements of the Company and Group are general purpose financial statements which have been prepared in accordance with the accounts provisions of the Banking Act 1959 (as amended), Australian Accounting Standards (AASs) and the Australian Accounting Interpretations issued by the Australian Accounting Standards Board (AASB), other authoritative pronouncements of the AASB and the Corporations Act 2001.
International Financial Reporting Standards (IFRS) are Standards and Interpretations adopted by the International Accounting Standards Board (IASB). IFRS forms the basis of AASs and Interpretations issued by the AASB. The Group’s application of AASs and Interpretations ensures that the financial statements of the Company and Group comply with IFRS.
ii) Use of estimates and assumptions
The preparation of these financial statements requires the use of management judgement, estimates and assumptions that affect reported amounts and the application of accounting policies. The estimates and associated assumptions are based on historical experience and various other factors that are believed to be reasonable. Actual results may differ from these estimates. Discussion of the critical accounting treatments, which include complex or subjective decisions or assessments, are covered in note 2. Such estimates and judgements are reviewed on an ongoing basis.
iii) Basis of measurement
The financial information has been prepared in accordance with the historical cost basis except that the following assets and liabilities are stated at their fair value:
| n | derivative financial instruments, including in the case of fair value hedging (refer note 1 (E)(ii)) the fair value adjustment on the underlying hedged exposure; |
| n | available-for-sale financial assets; |
| n | financial instruments held for trading; and |
| n | assets and liabilities designated at fair value through profit and loss. |
In accordance with AASB 1038 Life Insurance Contracts, life insurance liabilities are measured using the Margin on Services model.
In accordance with AASB 119 Employee Benefits, defined benefit obligations are measured using the Projected Unit Credit Method.
iv) Changes in Accounting Policy and early adoptions
All new Accounting Standards and Interpretations applicable to annual reporting periods beginning on or after 1 October 2011 have been applied to the Group effective from the required date of application. The initial application of these Standards and Interpretations has not had a material impact on the financial position or the financial results of the Group.
There has been no other change in accounting policy during the year.
v) Rounding
The Parent entity is an entity of the kind referred to in Australian Securities and Investments Commission class order 98/100 dated 10 July 1998 (as amended). Consequently, amounts in the financial statements have been rounded to the nearest million dollars, except where otherwise indicated.
vi) Principles of consolidation
Subsidiaries
The consolidated financial statements of the Group comprise the financial statements of the Company and all its subsidiaries where it is determined that there is a capacity to control.
Control means the power to govern, directly or indirectly, the financial and operating policies of an entity so as to obtain benefits from its activities. All the facts of a particular situation are considered when determining whether control exists. Control is usually present when an entity has:
| n | power over more than one-half of the voting rights of the other entity; or |
| n | power to govern the financial and operating policies of the other entity; or |
| n | power to appoint or remove the majority of the members of the board of directors or equivalent governing body; or |
| n | power to cast the majority of votes at meetings of the board of directors or equivalent governing body of the entity. |
In addition, potential voting rights that are presently exercisable or convertible are taken into account in determining whether control exists.
In relation to special purpose entities, control is deemed to exist where:
| n | in substance, the majority of the residual risks and rewards from their activities accrue to the Group; or |
| n | in substance, the Group controls decision making powers so as to obtain the majority of the risks and rewards from their activities. |
Further detail on special purpose entities is provided in note 2(iii).
Where subsidiaries have been sold or acquired during the year, their operating results have been included to the date of disposal or from the date of acquisition.
In the Company’s financial statements investments in subsidiaries are carried at cost less accumulated impairment losses.
| 78 |

1: Significant Accounting Policies(continued)
Associates
The Group applies the equity method of accounting for associates.
The Group’s share of results of associates is included in the consolidated income statement. Shares in associates are carried in the consolidated balance sheet at cost plus the Group’s share of post-acquisition net assets less any impairment. Interests in associates are reviewed for any indication of impairment at least at each reporting date. This impairment review uses a discounted cash flow (DCF) methodology and other methodologies to determine the reasonableness of the valuation, including the capitalisation of earnings methodology (CEM).
In the Company’s financial statements, investments in associates are carried at cost less accumulated impairment losses.
vii) Foreign currency translation
Functional and presentation currency
Items included in the financial statements of each of the Group’s entities are measured using the currency of the primary economic environment in which the entity operates (the functional currency).
The consolidated financial statements are presented in Australian dollars, which is the Company’s functional and presentation currency.
Foreign currency transactions
Foreign currency transactions are translated into the functional currency using the exchange rates prevailing at the dates of the transactions.
Monetary assets and liabilities resulting from foreign currency transactions are subsequently translated at the spot rate at reporting date.
Exchange differences arising on the settlement of monetary items or on translating monetary items at rates different to those at which they were initially recognised or included in a previous financial report, are recognised in the income statement in the period in which they arise.
Translation differences on non-monetary items measured at fair value through profit or loss, are reported as part of the fair value gain or loss on these items.
Translation differences on non-monetary items measured at fair value through equity, such as equities classified as available-for-sale financial assets, are included in the available-for-sale reserve in equity.
Translation to presentation currency
The results and financial position of all Group entities (none of which has the currency of a hyperinflationary economy), that have a functional currency different from the Group’s presentation currency, are translated into the Group’s presentation currency as follows:
| n | assets and liabilities are translated at the rates of exchange ruling at balance date; |
| n | revenue and expenses are translated at the average exchange rate for the period, unless this average is not a reasonable approximation of the rate prevailing on transaction date, in which case revenue and expenses are translated at the exchange rate ruling at transaction date; and |
| n | all resulting exchange differences are recognised in the foreign currency translation reserve. |
When a foreign operation is disposed, exchange differences are recognised in the income statement as part of the gain or loss on sale.
Goodwill arising on the acquisition of a foreign operation is treated as an asset of the foreign operation and translated at the rate ruling at balance date.
B) INCOME RECOGNITION
i) Interest income
Interest income is recognised as it accrues using the effective interest rate method.
The effective interest rate method calculates the amortised cost of a financial asset or financial liability and allocates the interest income or interest expense over the expected life of the financial asset or financial liability so as to achieve a constant yield on the financial asset or liability.
For assets subject to prepayment, expected life is determined on the basis of the historical behaviour of the particular asset portfolio, taking into account contractual obligations and prepayment experience. This is assessed on a regular basis.
ii) Fee and commission income
Fees and commissions received that are integral to the effective interest rate of a financial asset are recognised using the effective interest method. For example, loan origination fees, together with related direct costs, are deferred and recognised as an adjustment to the effective interest rate on a loan once drawn.
Fees and commissions that relate to the execution of a significant act (for example, advisory or arrangement services, placement fees and underwriting fees) are recognised when the significant act has been completed.
Fees charged for providing ongoing services (for example, maintaining and administering existing facilities) are recognised as income over the period the service is provided.
iii) Dividend income
Dividends are recognised as revenue when the right to receive payment is established.
iv) Leasing income
Finance income on finance leases is recognised on a basis that reflects a constant periodic return on the net investment in the finance lease.
v) Gain or loss on sale of assets
The gain or loss on the disposal of assets is determined as the difference between the carrying amount of the asset at the time of disposal and the proceeds of disposal. This is recognised as an item of other income in the year in which the significant risks and rewards of ownership transfer to the buyer.
| NOTES TO THE FINANCIAL STATEMENTS 79 |

1: Significant Accounting Policies(continued)
C) EXPENSE RECOGNITION
i) Interest expense
Interest expense on financial liabilities measured at amortised cost is recognised in the income statement as it accrues using the effective interest rate method.
ii) Loan origination expenses
Certain loan origination expenses that are an integral part of the effective interest rate of a financial asset measured at amortised cost. These loan origination expenses include:
| n | fees and commissions payable to brokers and certain customer incentive payments in respect of originating lending business; and |
| n | other expenses of originating lending business, such as external legal costs and valuation fees, provided these are direct and incremental costs related to the issue of a financial asset. |
Such loan origination expenses are initially recognised as part of the cost of acquiring the financial asset and amortised as part of the effective yield of the financial asset over its expected life using the effective interest rate method.
iii) Share-based compensation expense
The Group has various equity settled share-based compensation plans. These are described in note 45 and comprise the ANZ Employee Share Acquisition Plan and the ANZ Share Option Plan.
ANZ Employee Share Acquisition Plan
The fair value of ANZ ordinary shares granted under the Employee Share Acquisition Plan is measured at grant date, using the one-day volume weighted average market price of ANZ shares. The fair value is expensed immediately when shares vest or on a straight-line basis over the relevant vesting period.
ANZ Share Option Plan
The fair value of share options is measured at grant date, using an option pricing model. The fair value is expensed on a straight-line basis over the relevant vesting period. This is recognised as share- based compensation expense with a corresponding increase in the share options reserve.
The option pricing model takes into account the exercise price of the option, the risk-free interest rate, the expected volatility of ANZ’s ordinary share price and other factors. Market vesting conditions are taken into account in estimating the fair value.
A performance right is a right to acquire a share at nil cost to the employee subject to satisfactorily meeting time and/or performance hurdles. Upon exercise, each performance right entitles the holder to one ordinary share in ANZ. The fair value of performance rights is determined at grant date using an option pricing model, taking into account market-based performance conditions. The fair value is expensed over the relevant vesting period. This is recognised as share-based compensation expense with a corresponding increase in the share options reserve.
Other adjustments
Subsequent to the grant of an equity-based award, the amount recognised as an expense is reversed when an employee fails to satisfy the minimum service period specified in the award. However, the expense is not reversed where the award does not vest due to the failure to meet a market-based performance condition.
iv) Lease payments
Leases entered into by the Group as lessee are predominantly operating leases. Operating lease payments are recognised as an expense on a straight-line basis over the lease term.
D) INCOME TAX
i) Income tax expense
Income tax on earnings for the year comprises current and deferred tax and is based on the applicable tax law in each jurisdiction. It is recognised in the income statement as tax expense, except when it relates to items credited directly to equity, in which case it is recorded in equity, or where it arises from the initial accounting for a business combination, in which case it is included in the determination of goodwill.
ii) Current tax
Current tax is the expected tax payable on taxable income for the year, based on tax rates (and tax laws) which are enacted at the reporting date, including any adjustment for tax payable in previous periods. Current tax for current and prior periods is recognised as a liability (or asset) to the extent that it is unpaid (or refundable).
iii) Deferred tax
Deferred tax is accounted for using the comprehensive tax balance sheet method. It is generated by temporary differences between the carrying amounts of assets and liabilities for financial reporting purposes and their tax base.
Deferred tax assets, including those related to the tax effects of income tax losses and credits available to be carried forward, are recognised only to the extent that it is probable that future taxable profits will be available against which the deductible temporary differences or unused tax losses and credits can be utilised.
Deferred tax liabilities are recognised for all taxable temporary differences, other than those relating to taxable temporary differences arising from goodwill. They are also recognised for taxable temporary differences arising on investments in controlled entities, branches, and associates, except where the Group is able to control the reversal of the temporary differences and it is probable that temporary differences will not reverse in the foreseeable future. Deferred tax assets associated with these interests are recognised only to the extent that it is probable that the temporary difference will reverse in the foreseeable future and there will be sufficient taxable profits against which to utilise the benefits of the temporary difference.
Deferred tax assets and liabilities are measured at the tax rates that are expected to apply to the period(s) when the asset and liability giving rise to them are realised or settled, based on tax rates (and tax laws) that have been enacted or substantively enacted by the reporting date. The measurement reflects the tax consequences that would follow from the manner in which the Group, at the reporting date, recovers or settles the carrying amount of its assets and liabilities.
iv) Offsetting
Current and deferred tax assets and liabilities are offset only to the extent that they relate to income taxes imposed by the same taxation authority, there is a legal right and intention to settle on a net basis and it is allowed under the tax law of the relevant jurisdiction.
| 80 |

1: Significant Accounting Policies(continued)
E) ASSETS
Financial assets
i) Financial assets and liabilities at fair value through profit or loss
Trading securities are financial instruments acquired principally for the purpose of selling in the short-term or which are a part of a portfolio which is managed for short-term profit-taking. Trading securities are initially recognised and subsequently measured in the balance sheet at their fair value.
Derivatives that are neither financial guarantee contracts nor effective hedging instruments are carried at fair value through profit or loss.
Certain financial assets and liabilities may be designated and measured at fair value through profit or loss where any of the following applies:
| n | the asset represents investments backing policy liabilities (refer note 1 (I)(viii)); |
| n | it is a life investment contract liability (refer note 1 (I)(i)); |
| n | doing so eliminates or significantly reduces a measurement or recognition inconsistency that would otherwise arise from measuring assets and liabilities, or recognising the gains or losses thereon, on different bases; |
| n | a group of financial assets or financial liabilities or both is managed and its performance evaluated on a fair value basis; or |
| n | the financial instrument contains an embedded derivative, unless the embedded derivative does not significantly modify the cash flows or it is clear, with little or no analysis, that it would not be separately recorded. |
Changes in the fair value (gains or losses) of these financial instruments are recognised in the income statement in the period in which they occur.
Purchases and sales of trading securities are recognised on trade date.
ii) Derivative financial instruments
Derivative financial instruments are contracts whose value is derived from one or more underlying price, index or other variable. They include swaps, forward rate agreements, futures, options and combinations of these instruments.
Derivative financial instruments are entered into for trading purposes (including customer-related reasons), or for hedging purposes where the derivative instruments are used to hedge the Group’s exposures to interest rate risk, currency risk, price risk, credit risk and other exposures relating to non-trading positions.
Derivative financial instruments are recognised initially at fair value with gains or losses from subsequent measurement at fair value being recognised in the income statement. Included in the determination of the fair value of derivatives is a credit valuation adjustment to reflect the credit worthiness of the counterparty. The valuation adjustment is influenced by the mark-to-market of the derivative trades and by movement in credit spreads.
Where the derivative is effective as a hedging instrument and is designated as such, the timing of the recognition of any resultant gain or loss in the income statement is dependent on the hedging designation. These hedging designations and associated accounting are as follows:
Fair value hedge
Where the Group hedges the fair value of a recognised asset or liability or firm commitment, changes in the fair value of the derivative designated as a fair value hedge are recognised in the income statement. Changes in the fair value of the hedged item attributable to the hedged risk are reflected in adjustments to the carrying value of the hedged item, which are also recognised in the income statement.
Hedge accounting is discontinued when the hedge instrument expires or is sold, terminated, exercised or no longer qualifies for hedge accounting. The resulting adjustment to the carrying amount of the hedged item arising from the hedged risk is amortised to the income statement over the period to maturity of the hedged item.
If the hedged item is sold or repaid, the unamortised fair value adjustment is recognised immediately in the income statement.
Cash flow hedge
The Group designates derivatives as cash flow hedges where the instrument hedges the variability in cash flows of a recognised asset or liability, a foreign exchange component of a firm commitment or a highly probable forecast transaction. The effective portion of changes in the fair value of derivatives qualifying and designated as cash flow hedges is deferred in the hedging reserve, which forms part of shareholders’ equity. Any ineffective portion is recognised immediately in the income statement. Amounts deferred in equity are recognised in the income statement in the period during which the hedged forecast transactions take place. When the hedging instrument expires, is sold, terminated, or no longer qualifies for hedge accounting, the cumulative amount deferred in equity remains in the hedging reserve, and is subsequently transferred to the income statement when the hedged item is recognised in the income statement.
When a forecast hedged transaction is no longer expected to occur, the amount deferred in equity is recognised immediately in the income statement.
Net investment hedge
Hedges of net investments in foreign operations are accounted for similarly to cash flow hedges. The gain or loss from remeasuring the fair value of the hedging instrument relating to the effective portion of the hedge is deferred in the foreign currency translation reserve in equity and the ineffective portion is recognised immediately in the income statement.
Derivatives that do not qualify for hedge accounting
All gains and losses from changes in the fair value of derivatives that are not designated in a hedging relationship but are entered into to manage the interest rate and foreign exchange risk of funding instruments are recognised in the income statement. Under certain circumstances, the component of the fair value change in the derivative which relates to current period realised and accrued interest is included in net interest income. The remainder of the fair value movement is included in other income.
| NOTES TO THE FINANCIAL STATEMENTS 81 |

1: Significant Accounting Policies(continued)
iii) Available-for-sale financial assets
Available-for-sale financial assets comprise non-derivative financial assets which the Group designates as available-for-sale but which are not deemed to be held principally for trading purposes, and include equity investments, certain loans and advances, and quoted debt securities.
They are initially recognised at fair value plus transaction costs. Subsequent gains or losses arising from changes in fair value are included as a separate component of equity in the available-for-sale revaluation reserve except for interest, dividends and foreign exchange gains and losses on monetary assets, which are recognised directly in the income statement. When the asset is sold, the cumulative gain or loss relating to the asset is transferred from the available-for-sale revaluation reserve to the income statement.
Where there is objective evidence of impairment on an available-for-sale financial asset, the cumulative loss related to that asset is removed from equity and recognised in the income statement, as an impairment expense for debt instruments or as other non-interest income for equity instruments. If, in a subsequent period, the amount of an impairment loss relating to an available-for-sale debt instrument decreases and the decrease can be linked objectively to an event occurring after the impairment event, the loss is reversed through the income statement through the impairment expense line.
Purchases and sales of available-for-sale financial assets are recognised on trade date being the date on which the Group commits to purchase or sell the asset.
iv) Net loans and advances
Net loans and advances are non-derivative financial assets with fixed or determinable payments that are not quoted in an active market. They arise when the Group provides money to a debtor with no intention of trading the loans and advances. The loans and advances are initially recognised at fair value plus transaction costs that are directly attributable to the issue of the loan or advance. They are subsequently measured at amortised cost using the effective interest rate method (refer note 1 (B)(i)) unless specifically designated on initial recognition at fair value through profit or loss.
All loans are graded according to the level of credit risk.
Net loans and advances includes direct finance provided to customers such as bank overdrafts, credit cards, term loans, finance lease receivables and commercial bills.
Impairment of loans and advances
Loans and advances are reviewed at least at each reporting date for impairment.
Credit impairment provisions are raised for exposures that are known to be impaired. Exposures are impaired and impairment losses are recorded if, and only if, there is objective evidence of impairment as a result of one or more loss events that occurred after the initial recognition of the loan and prior to the reporting date, and that loss event, or events, has had an impact on the estimated future cash flows of the individual loan or the collective portfolio of loans that can be reliably estimated.
Impairment is assessed for assets that are individually significant (or on a portfolio basis for small value loans) and then on a collective basis for those exposures not individually known to be impaired.
Exposures that are assessed collectively are placed in pools of similar assets with similar risk characteristics. The required provision is estimated on the basis of historical loss experience for assets with credit risk characteristics similar to those in the collective pool. The historical loss experience is adjusted based on current observable data such as changed economic conditions. The provision also takes account of the impact of inherent risk of large concentrated losses within the portfolio and an assessment of the economic cycle.
The estimated impairment losses are measured as the difference between the asset’s carrying amount and the estimated future cash flows discounted to their present value. As the discount unwinds during the period between recognition of impairment and recovery of the cash flow, it is recognised in interest income. The process of estimating the amount and timing of cash flows involves considerable management judgement. These judgements are reviewed regularly to reduce any differences between loss estimates and actual loss experience.
Impairment of capitalised acquisition-related expenses is assessed through comparing the actual behaviour of the portfolio against initial expected life assumptions.
The provision for impairment loss (individual and collective) is deducted from loans and advances in the balance sheet and the movement for the reporting period is reflected in the income statement.
When a loan is uncollectable, either partially or in full, it is written-off against the related provision for loan impairment. Unsecured facilities are normally written-off when they become 180 days past due or earlier in the event of the customer’s bankruptcy or similar legal release from the obligation.
However, a certain level of recoveries is expected after the write-off, which is reflected in the amount of the provision for credit losses. In the case of secured facilities, remaining balances are written-off after proceeds from the realisation of collateral have been received if there is a shortfall.
Where impairment losses recognised in previous periods have subsequently decreased or no longer exist, such impairment losses are reversed in the income statement.
A provision is also raised for off-balance sheet items such as loan commitments that are considered to be onerous.
v) Lease receivables
Contracts to lease assets and hire purchase agreements are classified as finance leases if they transfer substantially all the risks and rewards of ownership of the asset to the customer or an unrelated third party. All other lease contracts are classified as operating leases.
vi) Repurchase agreements
Securities sold under repurchase agreements are retained in the financial statements where substantially all the risks and rewards of ownership remain with the Group. A counterparty liability is recognised and classified as due to other financial institutions or payables and other liabilities. The difference between the sale price and the repurchase price is accrued over the life of the repurchase agreement and charged to interest expense in the income statement.
| 82 |

1: Significant Accounting Policies(continued)
Securities purchased under agreements to resell, where the Group does not acquire the risks and rewards of ownership, are recorded as receivables in liquid assets, or due from other financial institutions. The security is not included in the balance sheet. Interest income is accrued on the underlying loan amount.
Securities borrowed are not recognised in the balance sheet, unless these are sold to third parties, at which point the obligation to repurchase is recorded as a financial liability at fair value with fair value movements included in the income statement.
vii) Derecognition
The Group enters into transactions where it transfers financial assets recognised on its balance sheet yet retains either all or a portion of the risks and rewards of the transferred assets. If all, or substantially all, of the risks and rewards are retained, the transferred assets are not derecognised from the balance sheet.
In transactions where substantially all the risks and rewards of ownership of a financial asset are neither retained nor transferred, the Group derecognises the asset if control over the asset is lost. In transfers where control over the asset is retained, the Group continues to recognise the asset to the extent of its continuing involvement, determined by the extent to which it is exposed to changes in the value of the transferred asset. The rights and obligations retained or created in the transfer are recognised separately as assets and liabilities as appropriate.
Non-financial assets
viii) Goodwill
Goodwill represents the excess of the purchase consideration over the fair value of the identifiable net assets of a controlled entity at the date of gaining control. Goodwill is recognised as an asset and not amortised, but assessed for impairment at least annually or more frequently if there is an indication that the goodwill may be impaired. This involves using the DCF or CEM methodology to determine the expected future benefits of the cash-generating units (CGU) to which the goodwill relates. Where the goodwill balance exceeds the assessed value of expected future benefits, the difference is charged to the income statement. Any impairment of goodwill is not subsequently reversed.
ix) Software and computer system costs
Software and computer system costs include costs incurred in acquiring and building software and computer systems (software).
Software is amortised using the straight-line method over its expected useful life to the Group. The period of amortisation is between 3 and 5 years, except for certain major core infrastructure projects where the useful life has been determined to be 7 or 10 years.
At each reporting date, software assets are reviewed for impairment indicators. If any such indication exists, the recoverable amount of the assets are estimated and compared against the existing carrying value. Where the existing carrying value exceeds the recoverable amount, the difference is charged to the income statement.
Costs incurred in planning or evaluating software proposals, or in maintaining systems after implementation, are not capitalised.
x) Acquired portfolio of insurance and life investment business
Identifiable intangible assets in respect of acquired portfolios of insurance and life investment business acquired in a business combination are stated initially at fair value at acquisition date. These are amortised over the period of expected benefit of between 15 to 23 years.
xi) Deferred acquisition costs
Refer to note 1(I)(vi).
xii) Other intangible assets
Other intangible assets include management fee rights, distribution relationships and distribution agreements where they are clearly identifiable, can be reliably measured and where it is probable they will lead to future economic benefits that the Group can control.
Where, based on historical observation, there is an expectation that, for the foreseeable future, the level of investment in the funds will not decline significantly and the Group will continue to manage the fund, the management fee right is assessed to have an indefinite life and is carried at cost less any impairment losses.
Other management fee rights, distribution relationships, distribution agreements and licenses are amortised over the expected useful lives to the Group using the straight line method. The period of amortisation is as follows:
Management fee rights | 7 years | |||
Aligned advisor relationships | 15 years | |||
Distribution agreements | 3 years | |||
xiii) Premises and equipment
Assets other than freehold land are depreciated at rates based upon their expected useful lives to the Group, using the straight-line method. The depreciation rates used for each class of asset are:
Buildings | 1.5 | % | ||
Building integrals | 10 | % | ||
Furniture & equipment | 10 | % | ||
Computer & office equipment | 12.5%–33 | % | ||
Leasehold improvements are amortised on a straight-line basis over the shorter of their useful lives or remaining terms of the lease.
At each reporting date, the carrying amounts of premises and equipment are reviewed for impairment. If any such indication exists, the recoverable amount of the assets are estimated and compared against the existing carrying value. Where the existing carrying value exceeds the recoverable amount, the difference is charged to the income statement. If it is not possible to estimate the recoverable amount of an individual asset, the Group estimates the recoverable amount of the cash generating unit to which the asset belongs.
A previously recognised impairment loss is reversed if there has been a change in the estimates used to determine the recoverable amount.
xiv) Borrowing costs
Borrowing costs incurred for the construction of qualifying assets are capitalised into the cost of the qualifying asset during the period of time that is required to complete and prepare the asset for its intended use. The calculation of borrowing costs is based on an internal measure of the costs associated with the borrowing of funds.
| NOTES TO THE FINANCIAL STATEMENTS 83 |

1: Significant Accounting Policies(continued)
F) LIABILITIES
Financial liabilities
i) Deposits and other borrowings
Deposits and other borrowings include certificates of deposit, interest bearing deposits, debentures and other related interest bearing financial instruments. Deposits and other borrowings not designated at fair value through profit or loss on initial recognition are measured at amortised cost. The interest expense is recognised using the effective interest rate method.
ii) Financial liabilities at fair value through profit or loss
Refer to note 1(E)(i).
iii) Acceptances
The exposure arising from the acceptance of bills of exchange that are sold into the market is recognised as a liability. An asset of equal value is recognised to reflect the offsetting claim against the drawer of the bill. Bill acceptances generate fee income that is recognised in the income statement when earned.
iv) Bonds, notes and loan capital
Bonds, notes and loan capital are accounted for in the same way as deposits and other borrowings, except for those bonds and notes which are designated as at fair value through profit or loss on initial recognition.
v) Financial guarantee contracts
Financial guarantee contracts that require the issuer to make specified payments to reimburse the holder for a loss the holder incurs because a specified debtor fails to make payments when due, are initially recognised in the financial statements at fair value on the date the guarantee was given; typically this is the premium received. Subsequent to initial recognition, the Group’s liabilities under such guarantees are measured at the higher of their amortised amount and the best estimate of the expenditure required to settle any financial obligation arising at the balance sheet date. These estimates are determined based on experience of similar transactions and the history of past losses.
vi) Derecognition
Financial liabilities are derecognised when the obligation specified in the contract is discharged, cancelled or expires.
Non-financial liabilities
vii) Employee benefits
Leave benefits
The liability for long service leave is calculated and accrued for in respect of all applicable employees (including on-costs) using an actuarial valuation. The amounts expected to be paid in respect of employees’ entitlements to annual leave are accrued at expected salary rates including on-costs. Expected future payments for long service leave are discounted using market yields at the reporting date on national government bonds with terms to maturity that match, as closely as possible, the estimated future cash outflows.
Defined contribution superannuation schemes
The Group operates a number of defined contribution schemes and also contributes, according to local law, in the various countries in which it operates, to government and other plans that have the characteristics of defined contribution schemes.
The Group’s contributions to these schemes are recognised as an expense in the income statement when incurred.
Defined benefit superannuation schemes
The Group operates a small number of defined benefit schemes. The liability and expense related to providing benefits to employees under each defined benefit scheme are calculated by independent actuaries.
A defined benefit liability is recognised to the extent that the present value of the defined benefit obligation of each scheme, calculated using the Projected Unit Credit Method, is greater than the fair value of each scheme’s assets. Where this calculation results in an asset of the Group, a defined benefit asset is recognised, which is capped at the recoverable amount. In each subsequent reporting period, ongoing movements in the defined benefit liability or asset carrying value is treated as follows:
| n | the net movement relating to the current period’s service cost, interest cost, expected return on scheme assets, past service costs and other costs (such as the effects of any curtailments and settlements) is recognised as an employee expense in the income statement; |
| n | movements relating to actuarial gains and losses are recognised directly in retained earnings; and |
| n | contributions made by the Group are recognised directly against the net defined benefit position. |
viii) Provisions
The Group recognises provisions when there is a present obligation, the future sacrifice of economic benefits is probable, and the amount of the provision can be measured reliably.
The amount recognised is the best estimate of the consideration required to settle the present obligation at reporting date, taking into account the risks and uncertainties surrounding the obligation at reporting date. Where a provision is measured using the cash flows estimated to settle the present obligation, its carrying amount is the present value of those cash flows.
G) EQUITY
i) Ordinary shares
Ordinary shares in the Company are recognised at the amount paid per ordinary share net of directly attributable issue costs.
ii) Treasury shares
Shares in the Company which are purchased on-market by the ANZ Employee Share Acquisition Plan or issued by the Company to the ANZ Employee Share Acquisition Plan are classified as treasury shares (to the extent that they relate to unvested employee share-based awards) and are deducted from Capital.
In addition, the life insurance business may also purchase and hold shares in the Company to back policy liabilities in the life insurance statutory funds. These shares are also classified as treasury shares and deducted from Capital. These assets, plus any corresponding income statement fair value movement on the assets and dividend income, are eliminated when the life statutory funds are consolidated into the Group. The cost of the investment in the shares is deducted from Capital. However, the corresponding life investment contract and insurance contract liabilities, and related changes in the liabilities recognised in the income statement, remain upon consolidation.
Treasury shares are excluded from the weighted average number of ordinary shares used in the earnings per share calculations.
| 84 |

1: Significant Accounting Policies(continued)
iii) Non-controlling interest
Non-controlling interests represent the share in the net assets of subsidiaries attributable to equity interests not owned directly or indirectly by the Company.
iv) Reserves
Foreign currency translation reserve
As indicated in note 1 (A)(vii), exchange differences arising on translation of the assets and liabilities of all Group entities are reflected in the foreign currency translation reserve. Any offsetting gains or losses on hedging these balances, together with any tax effect, are also reflected in this reserve.
Available-for-sale revaluation reserve
This reserve includes changes in the fair value of available-for-sale financial assets, net of tax. These changes are transferred to the income statement (in other operating income) when the asset is derecognised. Where the asset is impaired, the changes are transferred to impairment expense in the income statement for debt instruments and in the case of equity instruments to other income.
Cash flow hedging reserve
This reserve includes the fair value gains and losses associated with the effective portion of designated cash flow hedging instruments.
Share-based payment reserves
Share-based payment reserves include the share options reserve and other equity reserves which arise on the recognition of share-based compensation expense (see note 1 (C)(iii)).
H) PRESENTATION
i) Offsetting of income and expenses
Income and expenses are not offset unless required or permitted by an accounting standard. At the Group level, this generally arises in the following circumstances:
| n | where transaction costs form an integral part of the effective interest rate of a financial instrument which is measured at amortised cost, these are offset against the interest income generated by the financial instrument; or |
| n | where gains and losses relating to fair value hedges are assessed as being effective; or |
| n | where gains and losses arise from a group of similar transactions, such as foreign exchange gains and losses. |
ii) Offsetting assets and liabilities
Assets and liabilities are offset and the net amount reported in the balance sheet only where there is:
| n | a current enforceable legal right to offset the asset and liability; and |
| n | an intention to settle on a net basis, or to realise the asset and settle the liability simultaneously. |
iii) Cash and cash equivalents
For cash flow statement presentation purposes, cash and cash equivalents includes cash on hand, deposits held at call with other financial institutions and other short-term highly liquid investments with terms to maturity of three months from the date of acquisition or less that are readily convertible to known amounts of cash and which are subject to an insignificant risk of changes in value.
iv) Segment reporting
An operating segment is a component of the Group that engages in business activities from which it may earn revenues and incur expenses, whose operating results are regularly reviewed by the Chief Executive Officer to make decisions about resources to be allocated to the segment and assess its performance and for which discrete information is available. Changes in the internal organisational structure of the Group can cause the composition of the Group’s reportable segments to change. Where this occurs corresponding segment information for the previous financial year is changed, unless the information is not available and the cost to develop it would be excessive.
v) Goods and services tax
Income, expenses and assets are recognised net of the amount of goods and services tax (GST), except where the amount of GST incurred is not recoverable from the Australian Tax Office (ATO). In these circumstances the GST is recognised as part of the cost of acquisition of the asset or as part of the expense.
Receivables and payables are stated with the amount of GST included. The net amount of GST recoverable from or payable to the ATO is included as an other asset or liability in the balance sheet.
Cash flows are included in the cash flow statement on a gross basis. The GST components of cash flows arising from investing and financing activities which are recoverable from or payable to the ATO are classified as operating cash flows.
I) LIFE INSURANCE AND FUNDS MANAGEMENT BUSINESS
The Group conducts its life insurance and funds management business (the Life Business) in Australia primarily through OnePath Life Limited, which is registered under the Life Insurance Act 1995 (Life Act), amended by the Financial Sector Legislation Amendment (Simplifying Regulation and Review) Act 2007 (SRR Act) and in New Zealand through OnePath Life (NZ) Limited and OnePath Insurance Services (NZ) Limited which are registered under the New Zealand Life Insurance Act 1908.
The operations of the Life Business in Australia are conducted within separate statutory funds as required by the Life Act. The assets of the Life Business are allocated between policyholder and shareholder funds in accordance with the requirements of the Life Act. Under AASs, the financial statements must include all assets, liabilities, revenues, expenses and equity, irrespective of whether they are designated as relating to shareholders or policyholders. Accordingly, the consolidated financial statements include both policyholder (statutory) and shareholders’ funds.
(i) Policy liabilities
Policy liabilities include liabilities arising from life insurance contracts and life investment contracts.
Life insurance contracts are insurance contracts regulated under the Life Act and similar contracts issued by entities operating outside Australia. An insurance contract is a contract under which an insurer accepts significant insurance risk from another party (the policyholder) by agreeing to compensate the policyholder if a specified uncertain future event adversely affects the policyholder.
All contracts written by registered life insurers that do not meet the definition of an insurance contract are referred to as life investment contracts. Life investment contract business relates to funds management products in which the Group issues a contract where the resulting liability to policyholders is linked to the performance and value of the assets that back those liabilities.
| NOTES TO THE FINANCIAL STATEMENTS 85 |

1: Significant Accounting Policies(continued)
Whilst the underlying assets are registered in the name of the life insurer and the policyholder has no direct access to the specific assets, the contractual arrangements are such that the policyholder bears the risks and rewards of the fund’s investment performance with the exception of guaranteed products where the policyholder is guaranteed a minimum return or asset value. The Group derives fee income from the administration of the underlying assets.
Life investment contracts that include a discretionary participation feature (participating contracts) are accounted for as if they are life insurance contracts under AASB 1038 Life Insurance Contracts.
Life insurance liabilities
Life insurance liabilities are determined using the ‘Margin on Services’ (MoS) model using a projection method or using an accumulation method. Under the projection method, the liability is determined as the net present value of the expected future cash flows, plus planned margins of revenues over expenses relating to services yet to be provided, discounted using a risk-free discount rate that reflects the nature, structure and term of the liabilities. Expected future cash flows include premiums, expenses, redemptions and benefit payments, including bonuses.
An accumulation method is used where the policy liabilities determined are not materially different from those determined under the projection method.
Profits from life insurance contracts are brought to account using the MoS model in accordance with Actuarial Standard LPS 1.04 Valuation of Policy Liabilities (formerly AS 1.04) as issued by the APRA under the Life Act and Professional Standard 3 Determination of Life Insurance Policy Liabilities as issued by the New Zealand Society of Actuaries. Under MoS, profit is recognised as premiums are received and services are provided to policyholders. When premiums are received but the service has not been provided, the profit is deferred. Losses are expensed when identified.
Costs associated with the acquisition of policies are recognised over the life of the policy. Costs may only be deferred, however, to the extent that a contract is expected to be profitable.
Participating contracts, defined as those contracts that entitle the policyholder to participate in the performance and value of certain assets in addition to the guaranteed benefit, are entitled to share in the profits that arise from participating business. This profit sharing is governed by the Life Act and the life insurance company’s constitution. The profit sharing entitlement is treated as an expense in the consolidated financial statements. Any benefits which remain payable at the end of the reporting period are recognised as part of life insurance liabilities.
Life investment contract liabilities
Life investment contracts involve both the origination of a financial instrument and the provision of investment management services.
The financial instrument component of the life investment contract liabilities is designated as at fair value through profit or loss. The management services component, including associated acquisition costs, is recognised as revenue as services are performed. See note 1 (I)(vi) for the deferral and amortisation of life investment contract acquisition costs and entry fees.
For investment-linked products, the life investment contract liability is directly linked to the performance and value of the assets that back them and is determined as the fair value of those assets after tax. For fixed income policies the liability is determined as the net present value of expected cash flows subject to a minimum of current surrender value.
(ii) External unit holder liabilities (life insurance funds)
The life insurance business includes controlling interests in trusts and companies, and the total amounts of each underlying asset, liability, revenue and expense of the controlled entities are recognised in the Group’s consolidated financial statements. When a controlled unit trust is consolidated, the share of the unit holder liability attributable to the Group is eliminated but amounts due to external unit holders remain as liabilities in the Group’s consolidated balance sheet.
(iii) Claims
Claims are recognised when the liability to the policyholder under the policy contract has been established or upon notification of the insured event depending on the type of claim.
Claims incurred in respect of life investment contracts represent withdrawals and are recognised as a reduction in life investment contract liabilities.
Claims incurred that relate to the provision of services and bearing of insurance risks are treated as expenses and these are recognised on an accruals basis once the liability to the policyholder has been established under the terms of the contract.
(iv) Revenue
Life insurance premiums
Life insurance premiums earned by providing services and bearing risks are treated as revenue. Life insurance deposit premiums are recognised as an increase in policy liabilities. For annuity, risk and traditional business, all premiums are recognised as revenue. Premiums with no due date are recognised as revenue on a cash received basis. Premiums with a regular due date are recognised as revenue on an accruals basis. Unpaid premiums are only recognised as revenue during the days of grace or where secured by the surrender value of the policy and are included as ‘Other assets’ in the balance sheet.
Life investment contract premiums
There is no premium revenue in respect of life investment contracts. Amounts received from policyholders in respect of life investment contracts are recognised as an investment contract liability where the receipt is in the nature of a deposit.
Fees
Fees are charged to policyholders in connection with life insurance and life investment contracts and are recognised when the service has been provided. Entry fees from life investment contracts are deferred and recognised over the average expected life of the contracts. Deferred entry fees are presented within ‘Other liabilities’ in the balance sheet.
| 86 |

1: Significant Accounting Policies(continued)
(v) Reinsurance contracts
Reinsurance premiums, commissions and claim settlements, as well as the reinsurance element of insurance contract liabilities, are accounted for on the same basis as the underlying direct insurance contracts for which the reinsurance was purchased.
(vi) Policy acquisition costs
Life insurance contract acquisition costs
Policy acquisition costs are the fixed and variable costs of acquiring new business. The appointed actuary assesses the value and future recoverability of these costs in determining policy liabilities. The net profit impact is presented in the income statement as a change in policy liabilities. The deferral is determined as the actual costs are incurred subject to an overall limit that future profits are anticipated to cover these costs. Losses arising on acquisition are recognised in the income statement in the year in which they occur. Amounts which are deemed recoverable from future premiums or policy charges are deferred and amortised over the life of the policy.
Life investment contract acquisition costs
Incremental acquisition costs, such as commissions, that are directly attributable to securing a life investment contract are recognised as an asset where they can be identified separately and measured reliably and if it is probable that they will be recovered. These deferred acquisition costs are presented in the balance sheet as an intangible asset and are amortised over the period that they will be recovered from future policy charges.
Any impairment losses arising on deferred acquisition costs are recognised in the income statement in the period in which they occur.
(vii) Basis of expense apportionment
All life investment contracts and insurance contracts are categorised based on individual policy or products. Expenses for these products are then allocated between acquisition, maintenance, investment management and other expenses.
Expenses which are directly attributable to an individual policy or product are allocated directly to a particular expense category, fund, class of business and product line as appropriate. Where expenses are not directly attributable to an individual policy or product, they are appropriately apportioned based on detailed expense analysis having regard to the objective in incurring that expense and the outcome achieved. The apportionment has been made in accordance with Actuarial Standard LPS 1.04 Valuation of Policy Liabilities (formerly AS 1.04), issued by the Australian Prudential Regulation Authority, and on an equitable basis to the different classes of business in accordance with Division 2 of Part 6 of the Life Act.
(viii) Investments backing policy liabilities
All investments backing policy liabilities are designated as at fair value through profit or loss. For OnePath Australia, all policy holder assets, being those assets held within the statutory funds of the life company that are not segregated and managed under a distinct shareholder investment mandate are held to back life insurance and life investment contract liabilities (collectively referred to as policy liabilities). These investments are designated as at fair value through profit or loss.
J) OTHER
i) Contingent liabilities
Contingent liabilities acquired in a business combination are individually measured at fair value at the acquisition date. At subsequent reporting dates the value of such contingent liabilities is reassessed based on the estimate of the expenditure required to settle the contingent liability.
Other contingent liabilities are not recognised in the balance sheet but disclosed in note 43 unless it is considered remote that the Group will be liable to settle the possible obligation.
ii) Earnings per share
The Group presents basic and diluted earnings per share (EPS) data for its ordinary shares. Basic EPS is calculated by dividing the profit or loss attributable to ordinary shareholders of the Company by the weighted average number of ordinary shares outstanding during the period after eliminating treasury shares.
Diluted EPS is determined by adjusting the profit or loss attributable to ordinary shareholders and the weighted average number of ordinary shares outstanding for the effect of dilutive ordinary shares.
| NOTES TO THE FINANCIAL STATEMENTS 87 |

1: Significant Accounting Policies(continued)
iii) Comparatives
Certain amounts in the comparative information have been reclassified to conform with current period financial statement presentations. Below is an overview of material adjustments for comparatives:
| n | “Customer liability for acceptances” and “liability for acceptances” previously shown on the face of the balance sheet have been included in “net loans and advances” and “payables and other liabilities” respectively. The comparative balances of $970 million for the Group and $688 million for the Company have been reclassified accordingly; |
| n | “Regulatory deposits” previously included in “other assets” has been shown as a separate item on the face of the balance sheet with the comparative balances reclassified accordingly; |
| n | “Securities purchased under agreement to resell” previously presented as “Due from other financial institutions” was reclassified to “Liquid assets” to ensure consistent classification across the Group. The comparative balances of $728 million for the Group and Company have been reclassified accordingly; |
| n | September 2011 undrawn facilities have been restated by $2,646 million using the revised methodology for undrawn overdrafts that was implemented during 2012; and |
| n | the reporting treatment of collateral received on derivative asset positions and collateral posted on derivative liability positions has changed to better reflect the nature of the asset/liabilities and to be consistent with market practice. The table below sets out the consequential changes to previously reported balance sheet classifications, with no impact on net assets. |
The income statement presentation of interest paid/received on collateral balances has changed to align with the revised balance sheet classification. Comparative information has been reclassified and the net interest earned on collateral of $17 million for the Group and $17 million for the Company previously shown as “other income” has been presented on a gross basis as “interest income” ($75 million for the Group and $73 million for the Company) and “interest expense” ($58 million for the Group and $56 million for the Company).
| Sep 11 | ||||||||||||
| Consolidated | Previously reported $m | Change $m | Currently $m | |||||||||
Liquid assets1 | 24,899 | 728 | 25,627 | |||||||||
Due from other financial institutions1 | 8,824 | 4,474 | 13,298 | |||||||||
Derivative financial instruments | 54,118 | 4,523 | 58,641 | |||||||||
Total assets | 594,488 | 9,725 | 604,213 | |||||||||
Due to other financial institutions | 23,012 | 4,523 | 27,535 | |||||||||
Derivative financial instruments | 50,088 | 5,202 | 55,290 | |||||||||
Total liabilities | 556,534 | 9,725 | 566,259 | |||||||||
1 “Due from other financial institutions” at 30 September 2011 was also reduced by the reclassification of $728 million of “securities purchased under agreements to resell” to “liquid assets”. |
| |||||||||||
| Sep 11 | ||||||||||||
| The Company | Previously reported $m | Change $m | Currently $m | |||||||||
Liquid assets1 | 20,555 | 728 | 21,283 | |||||||||
Due from other financial institutions1 | 6,338 | 3,732 | 10,070 | |||||||||
Derivative financial instruments | 48,356 | 3,364 | 51,720 | |||||||||
Total assets | 511,113 | 7,824 | 518,937 | |||||||||
Due to other financial institutions | 21,345 | 3,364 | 24,709 | |||||||||
Derivative financial instruments | 44,287 | 4,460 | 48,747 | |||||||||
Total liabilities | 476,734 | 7,824 | 484,558 | |||||||||
1 “Due from other financial institutions” at 30 September 2011 was also reduced by the reclassification of $728 million of “securities purchased under agreements to resell” to “liquid assets”. |
| |||||||||||
88

1: Significant Accounting Policies(continued)
iv) Accounting Standards not early adopted
The following standards were available for early adoption, but have not been applied by the Company or Group in these financial statements.
| AASB standard | Possible impact on the Company and the Group’s financial report in period of initial adoption | Mandatory application date for the Company and Group | ||||
| ||||||
| AASB 9 Financial Instruments | This standard specifies new recognition and measurement requirements for financial assets and financial liabilities previously addressed by AASB 139 Financial Instruments: Recognition and Measurement. This standard represents the first phase of the project to replace AASB 139 and will result in fundamental changes in the way that the Company and the Group accounts for financial instruments.
The main changes from AASB 139 include:
n all financial assets, except for certain equity instruments, will be classified into two categories: – amortised cost, where they generate solely payments of interest and principal and the business model is to collect contractual cash flows that represent principal and interest; or
– fair value through the income statement;
n equity instruments not held for trading purposes will be classified at fair value through the income statement except for certain instruments which may be classified at fair value through other comprehensive income (OCI) with dividends recognised in net income;
n financial assets which meet the requirements for classification at amortised cost are permitted to be measured at fair value if that eliminates or significantly reduces an accounting mismatch; and
n financial liabilities – gains and losses attributable to own credit arising from financial liabilities designated at fair value through profit or loss will be taken to OCI.
Future phases of the project to replace AASB 139 will cover impairment of financial assets measured at amortised cost and hedge accounting.
The Group is currently assessing the impact of this standard. | 1 October 2015 | ||||
|
|
| ||||
|
|
| ||||
| ||||||
| AASB 10 Consolidated Financial Statements | This standard replaces the guidance on control and consolidation in AASB 127 Consolidated and Financial Statements and Interpretation 112 Consolidation – Special Purpose Entities. The standard provides a single definition of ‘control’ based on whether the investor is exposed to, or has rights to, the variable returns from its involvement with an investee and has the ability to affect those returns through its power over the investee. The standard also provides guidance on how the control principle is applied in certain situations, such as where potential voting rights exist or where voting rights are not the dominant factor in determining whether control exists, e.g. where relevant activities are directed through contractual means.
The assessment of the impact of this standard is well progressed and is not expected to have any material impact on the net assets or earnings of the Group. | 1 October 2013 | ||||
|
|
| ||||
|
|
| ||||
| ||||||
| AASB 12 Disclosure of Interests in Other Entities | This standard applies where an entity has an ‘interest in another entity’ (essentially, any contractual or non-contractual interest that exposes an entity to the returns from the performance of the other entity). Such interests include a subsidiary, joint arrangement, associate or an unconsolidated structured entity. A range of disclosures is required which assist users to evaluate the nature, extent and financial effects and risks associated with an entity’s interest in other entities. These disclosures replace and significantly enhance those in other standards applicable to subsidiaries, joint arrangements or associates and impose new disclosures. As the amendments are only related to disclosure, there will be no material impact on the Group. | 1 October 2013 | ||||
|
|
| ||||
|
|
| ||||
| ||||||
| AASB 13 Fair Value Measurement | This standard provides a single source of guidance on fair value measurement and requires certain disclosures regarding fair value. This standard aims to improve the consistency and reduce the complexity of fair value measurement. The Group is currently assessing the impact of this standard. | 1 October 2013 | ||||
|
|
| ||||
|
|
| ||||
| ||||||
| AASB 119 Employee Benefits | Amendments to this standard will result in changes to the recognition and measurement of defined benefit pension expense and termination benefits, as well as disclosures for all employee benefits. The amendments are not expected to have a material impact on the Group. | 1 October 2013 | ||||
|
|
| ||||
|
|
| ||||
| ||||||
A number of other AASB standards are also available for early adoption, but have not been applied by the Company or Group in these financial statements. These relate to standards that have limited application to the Company or Group.
NOTES TO THE FINANCIAL STATEMENTS 89

2: Critical Estimates and Judgements Used in Applying Accounting Policies
The preparation of the financial statements of the Company and Group involves making estimates and judgements that affect the reported amounts within the financial statements. The estimates and judgements are continually evaluated and are based on historical factors, including expectations of future events, that are believed to be reasonable under the circumstances. All material changes to accounting policies and estimates and the application of these policies and judgements are approved by the Audit Committee of the Board.
A brief explanation of the critical estimates and judgements follows.
i) Provisions for credit impairment
The measurement of impairment of loans and advances requires management’s best estimate of the losses incurred in the loan portfolio at balance date.
Individual and collective provisioning involves the use of assumptions for estimating the amount and timing of expected future cash flows. These assumptions are regularly revised to reduce any differences between loss estimates and actual loss experience.
The collective provision involves estimates regarding the historical loss experience for assets with credit characteristics similar to those in the collective pool. The historical loss experience is adjusted based on current observable data and events and an assessment of the impact of model risk. The provision also takes into account management’s assessment of the impact of large concentrated losses within the portfolio and the economic cycle.
The use of such judgements and reasonable estimates is considered by management to be an essential part of the process and does not impact on reliability.
ii) Impairment of non-lending assets
The carrying values of non-lending assets are subject to impairment assessments at each reporting date. Judgement is required in identifying the cash-generating units to which goodwill and other assets are allocated for the purpose of impairment testing.
Where there is an indicator of impairment, the recoverable amount of the asset is determined based on the higher of the asset’s fair value less costs to sell and its value in use. Impairment is recognised where the recoverable amount is less than the carrying value. This assessment involves consideration of both internal and external indicators of potential impairment. Where an indicator exists, judgement is applied when determining the assumptions supporting the recoverable amount calculations.
During the second half of the year, the results of the impairment testing of software assets resulted in an impairment charge of $273 million (before tax) being recognised (full year impairment, $274 million before tax).
iii) Special purpose and off-balance sheet entities
The Group invests in or establishes special purpose entities (SPEs) to enable it to undertake specific types of transactions such as structured finance arrangements, covered bond issuances and securitisations.
An SPE is consolidated where it is controlled by the Group in accordance with the Group’s policy outlined in note 1 (A)(vi). As it can be complex to determine whether the Group has control of a SPE, the Group makes judgements about its exposure to the risks and rewards of the SPE, as well as about its ability to make operational decisions regarding the SPE.
The main types of unconsolidated SPEs with which the Group is involved are structured finance entities. These entities are set up to assist with the structuring of client financing. ANZ may manage these vehicles, hold minor amounts of capital in these vehicles or provide financing or derivatives to these vehicles. Any resulting lending arrangements with these SPEs are at arm’s length and ANZ typically has limited ongoing involvement with the entity.
iv) Financial instruments at fair value
The Group’s financial instruments measured at fair value are stated in note 1 (A)(iii). In estimating fair value the Group uses, wherever possible, quoted market prices in an active market for the financial instrument.
In the event that there is no active market for the instrument, fair value is based on present value estimates or other market accepted valuation techniques. The valuation models incorporate the impact of bid/ask spread, counterparty credit spreads and other factors that would influence the fair value determined by a market participant. The selection of appropriate valuation techniques, methodology and inputs requires judgement. These are reviewed and updated as market practice evolves.
The majority of valuation techniques employ only observable market data. However, for certain financial instruments, the fair value cannot be determined with reference to current market transactions or valuation techniques whose variables only include data from observable markets. In respect of the valuation component where market observable data is not available, the fair value is determined using data derived and extrapolated from market data and tested against historic transactions and observed market trends. These valuations are based upon assumptions established by application of professional judgement to analyse the data available to support each assumption. Changing the assumptions changes the resulting estimate of fair value.
| 90 |

2: Critical Estimates and Judgements Used in Applying Accounting Policies(continued)
The majority of outstanding derivative positions are transacted over-the-counter and therefore need to be valued using valuation techniques. Included in the determination of the fair value of derivatives is a credit valuation adjustment to reflect the credit worthiness of the counterparty, representing the credit risk component of the overall fair value movement on a particular derivative asset. The total valuation adjustment is influenced by the mark-to-market of the derivative trades and by the movement in the market cost of credit.
v) Provisions (other than loan impairment)
The Group holds provisions for various obligations including employee entitlements, restructurings and litigation related claims. The provision for long-service leave is supported by an independent actuarial report and involves assumptions regarding employee turnover, future salary growth rates and discount rates. Other provisions involve judgements regarding the outcome of future events including estimates of expenditure required to satisfy such obligations.
vi) Life insurance contract liabilities
Policy liabilities for life insurance contracts are computed using statistical or mathematical methods, which are expected to give approximately the same results as if an individual liability was calculated for each contract. The computations are made by suitably qualified personnel on the basis of recognised actuarial methods, with due regard to relevant actuarial principles and standards. The methodology takes into account the risks and uncertainties of the particular class of life insurance business written. Deferred policy acquisition costs are connected with the measurement basis of life insurance liabilities and are equally sensitive to the factors that are considered in the liability measurement.
The key factors that affect the estimation of these liabilities and related assets are:
| n | the cost of providing the benefits and administering these insurance contracts; |
| n | mortality and morbidity experience on life insurance products, including enhancements to policyholder benefits; |
| n | discontinuance experience, which affects the Company’s ability to recover the cost of acquiring new business over the lives of the contracts; and |
| n | the amounts credited to policyholders’ accounts compared to the returns on invested assets through asset-liability management and strategic and tactical asset allocation. |
In addition, factors such as regulation, competition, interest rates, taxes and general economic conditions affect the level of these liabilities.
The total value of policy liabilities for life insurance contracts have been appropriately calculated in accordance with these principles.
vii) Taxation
Judgement is required in determining provisions held in respect of uncertain tax positions. The Group estimates its tax liabilities based on its understanding of the relevant law in each of the countries in which it operates.
NOTES TO THE FINANCIAL STATEMENTS 91

3: Income
| Consolidated | The Company | |||||||||||||||
2012 $m | 2011 $m | 2012 $m | 2011 $m | |||||||||||||
Interest income | ||||||||||||||||
Other financial institutions | 329 | 295 | 260 | 240 | ||||||||||||
Trading securities | 1,368 | 1,481 | 1,010 | 1,166 | ||||||||||||
Available-for-sale assets | 621 | 570 | 531 | 481 | ||||||||||||
Loans and advances | 27,737 | 27,614 | 22,896 | 22,716 | ||||||||||||
Other | 483 | 483 | 308 | 299 | ||||||||||||
| 30,538 | 30,443 | 25,005 | 24,902 | |||||||||||||
Controlled entities | – | – | 2,335 | 2,168 | ||||||||||||
Total interest income | 30,538 | 30,443 | 27,340 | 27,070 | ||||||||||||
Interest income is analysed by types of financial assets as follows | ||||||||||||||||
Financial assets not at fair value through profit or loss | 29,159 | 28,947 | 26,325 | 25,895 | ||||||||||||
Trading securities | 1,368 | 1,481 | 1,010 | 1,166 | ||||||||||||
Financial assets designated at fair value through profit or loss | 11 | 15 | 5 | 9 | ||||||||||||
| 30,538 | 30,443 | 27,340 | 27,070 | |||||||||||||
i) Fee and commission income | ||||||||||||||||
Lending fees1 | 697 | 652 | 621 | 583 | ||||||||||||
Non-lending fees and commissions | 2,060 | 2,053 | 1,504 | 1,511 | ||||||||||||
| 2,757 | 2,705 | 2,125 | 2,094 | |||||||||||||
Controlled entities | – | – | 753 | 651 | ||||||||||||
Total fee and commission income | 2,757 | 2,705 | 2,878 | 2,745 | ||||||||||||
Fee and commission expense2 | (345) | (314) | (265) | (236) | ||||||||||||
Net fee and commission income | 2,412 | 2,391 | 2,613 | 2,509 | ||||||||||||
ii) Other income | ||||||||||||||||
Net foreign exchange earnings | 1,081 | 817 | 707 | 528 | ||||||||||||
Net gains from trading securities and derivatives3 | 280 | 295 | 265 | 280 | ||||||||||||
Credit risk on intermediation trades | 73 | 4 | 73 | 2 | ||||||||||||
Movement on financial instruments measured at fair value through profit or loss4 | (327) | (167) | (284) | (87) | ||||||||||||
Dividends received from controlled entities5 | – | – | 1,411 | 941 | ||||||||||||
Brokerage income | 55 | 61 | – | – | ||||||||||||
NZ managed funds impacts | – | 61 | – | – | ||||||||||||
Write-down of assets in non-continuing business | – | (13) | – | (13) | ||||||||||||
Write-down of investment in Saigon Securities Inc | (31) | – | (31) | – | ||||||||||||
Gain on sale/(write-down) of investment in Sacombank | 10 | (35) | 10 | (35) | ||||||||||||
Private equity and infrastructure earnings | 28 | 26 | 28 | 26 | ||||||||||||
Profit on sale of property | 1 | 24 | – | – | ||||||||||||
Gain on sale of Visa shares | 291 | – | 224 | – | ||||||||||||
Dilution gain on investment in Bank of Tianjin | 10 | – | 10 | – | ||||||||||||
Write-down of investment in subsidiaries and branches | – | – | (34) | (39) | ||||||||||||
Other | 120 | 127 | 23 | (1) | ||||||||||||
Total other income | 1,591 | 1,200 | 2,402 | 1,602 | ||||||||||||
Other operating income | 4,003 | 3,591 | 5,015 | 4,111 | ||||||||||||
iii) Net funds management and insurance income | ||||||||||||||||
Funds management income | 825 | 868 | 111 | 101 | ||||||||||||
Investment income | 2,730 | (511) | – | – | ||||||||||||
Insurance premium income | 1,237 | 1,184 | 38 | 33 | ||||||||||||
Commission income (expense) | (438) | (490) | 58 | 49 | ||||||||||||
Claims | (598) | (548) | – | – | ||||||||||||
Changes in policy liabilities | (2,449) | 854 | – | – | ||||||||||||
Elimination of treasury share (gain)/loss | (104) | 48 | – | – | ||||||||||||
Total net funds management and insurance income | 1,203 | 1,405 | 207 | 183 | ||||||||||||
Total other operating income | 5,206 | 4,996 | 5,222 | 4,294 | ||||||||||||
Share of associates’ profit | 395 | 436 | – | – | ||||||||||||
Total income6,7 | 36,139 | 35,875 | 32,562 | 31,364 | ||||||||||||
1 Lending fees exclude fees treated as part of the effective yield calculation and included in interest income (refer note 1 B(ii)). 2 Includes interchange fees paid. 3 Does not include interest income relating to trading securities. 4 Includes fair value movements (excluding realised and accrued interest) on derivatives entered into for management of interest rate and foreign exchange risk on funding instruments, and not designated as accounting hedges (refer to note 12 for further discussion on Balance Sheet Management), ineffective portions of cash flow hedges, and fair value movements in financial assets and liabilities designated at fair value. The net gain (loss) on financial assets and liabilities designated at fair value was $(171) million (2011: $219 million) for the Group and $(170) million (2011: $223 million) for the Company. 5 Dividends received from controlled entities are subject to meeting applicable regulatory and corporate law requirements, including solvency requirements. 6 Total income includes external dividend income of $4 million (2011: $11 million) for the Group and $3 million (2011: $9 million) for the Company. 7 Comparative information has changed for certain income line items. Refer to note 1 for details of material changes. |
92

4: Expenses
| Consolidated | The Company | |||||||||||||||
2012 $m | 2011 $m | 2012 $m | 2011 $m | |||||||||||||
Interest expense | ||||||||||||||||
Financial institutions | 473 | 585 | 422 | 542 | ||||||||||||
Deposits | 12,962 | 12,661 | 11,299 | 10,900 | ||||||||||||
Borrowing corporations’ debt | 69 | 101 | – | – | ||||||||||||
Commercial paper | 633 | 489 | 510 | 378 | ||||||||||||
Loan capital, bonds and notes | 4,127 | 4,828 | 3,387 | 4,018 | ||||||||||||
Other | 164 | 279 | 138 | 216 | ||||||||||||
| 18,428 | 18,943 | 15,756 | 16,054 | |||||||||||||
Controlled entities | – | – | 2,616 | 2,488 | ||||||||||||
Total interest expense | 18,428 | 18,943 | 18,372 | 18,542 | ||||||||||||
Interest expense is analysed by types of financial liabilities as follows: | ||||||||||||||||
Financial liabilities not at fair value through profit or loss | 17,801 | 18,202 | 17,868 | 17,912 | ||||||||||||
Financial liabilities designated at fair value through profit or loss | 627 | 741 | 504 | 630 | ||||||||||||
| 18,428 | 18,943 | 18,372 | 18,542 | |||||||||||||
Operating expenses | ||||||||||||||||
i) Personnel | ||||||||||||||||
Employee entitlements and taxes | 288 | 306 | 218 | 238 | ||||||||||||
Salaries and wages | 3,066 | 2,960 | 2,382 | 2,321 | ||||||||||||
Superannuation costs – defined benefit plans | 13 | 13 | 8 | 7 | ||||||||||||
– defined contribution plans | 292 | 287 | 251 | 249 | ||||||||||||
Equity-settled share-based payments | 189 | 165 | 160 | 145 | ||||||||||||
Temporary staff | 218 | 250 | 158 | 192 | ||||||||||||
Other | 699 | 743 | 564 | 581 | ||||||||||||
Total personnel expenses (excl restructuring) | 4,765 | 4,724 | 3,741 | 3,733 | ||||||||||||
ii) Premises | ||||||||||||||||
Amortisation and depreciation of buildings and integrals (refer note 21) | 90 | 89 | 54 | 50 | ||||||||||||
Rent | 412 | 387 | 300 | 251 | ||||||||||||
Utilities and other outgoings | 168 | 165 | 117 | 114 | ||||||||||||
Other | 46 | 44 | 43 | 38 | ||||||||||||
Total premises expenses (excl restructuring) | 716 | 685 | 514 | 453 | ||||||||||||
iii) Computer | ||||||||||||||||
Computer contractors | 150 | 143 | 133 | 117 | ||||||||||||
Data communication | 106 | 125 | 64 | 83 | ||||||||||||
Depreciation and amortisation1 | 424 | 348 | 337 | 266 | ||||||||||||
Rentals and repairs | 131 | 130 | 87 | 91 | ||||||||||||
Software purchased | 253 | 241 | 188 | 181 | ||||||||||||
Software impairment2 | 274 | 20 | 239 | 7 | ||||||||||||
Other | 45 | 33 | 19 | 7 | ||||||||||||
Total computer expenses (excl restructuring) | 1,383 | 1,040 | 1,067 | 752 | ||||||||||||
iv) Other | ||||||||||||||||
Advertising and public relations | 229 | 235 | 141 | 139 | ||||||||||||
Audit fees and other fees (refer note 5) | 18 | 18 | 10 | 10 | ||||||||||||
Depreciation of furniture and equipment (refer note 21) | 99 | 97 | 84 | 81 | ||||||||||||
Freight and cartage | 65 | 65 | 51 | 51 | ||||||||||||
Loss on sale and write-off of equipment | 8 | 4 | 5 | 2 | ||||||||||||
Non-lending losses, frauds and forgeries | 52 | 53 | 42 | 27 | ||||||||||||
Postage and stationery | 137 | 130 | 91 | 88 | ||||||||||||
Professional fees | 253 | 269 | 210 | 230 | ||||||||||||
Telephone | 69 | 75 | 40 | 38 | ||||||||||||
Travel and entertainment expenses | 170 | 208 | 125 | 150 | ||||||||||||
Amortisation and impairment of other intangible assets (refer note 19) | 110 | 122 | 8 | 8 | ||||||||||||
Other | 171 | 150 | 460 | 471 | ||||||||||||
Total other expenses (excl restructuring) | 1,381 | 1,426 | 1,267 | 1,295 | ||||||||||||
v) Restructuring3 | 274 | 148 | 126 | 23 | ||||||||||||
Total operating expenses | 8,519 | 8,023 | 6,715 | 6,256 | ||||||||||||
Total expenses4 | 26,947 | 26,966 | 25,087 | 24,798 | ||||||||||||
1 Comprises software amortisation $320 million (2011: $249 million) (refer note 19) and computer depreciation $104 million (2011: $99 million) (refer note 21). The Company comprises software amortisation $268 million (2011: $199 million) (refer note 19) and computer depreciation $69 million (2011: $67 million) (refer note 21). 2 In 2011, $24 million of software impairment expense has been booked as restructuring expenses by the Group (2012: nil). 3 Consolidated includes $148 million (2011: $125 million) relating to costs associated with the New Zealand simplification program. 4 Comparative information has changed for certain expense line items. Refer to note 1 for details of material changes. |
NOTES TO THE FINANCIAL STATEMENTS 93

5: Compensation of Auditors
| Consolidated | The Company | |||||||||||||||
2012 $‘000 | 2011 $‘000 | 2012 $‘000 | 2011 $‘000 | |||||||||||||
KPMG Australia1 | ||||||||||||||||
Audit or review of financial reports of the Company or Group entities | 8,752 | 8,620 | 5,614 | 5,479 | ||||||||||||
Audit-related services2 | 3,147 | 3,636 | 2,216 | 2,806 | ||||||||||||
Non-audit services3 | 236 | 266 | 160 | 138 | ||||||||||||
| 12,135 | 12,522 | 7,990 | 8,423 | |||||||||||||
Overseas related practices of KPMG Australia | ||||||||||||||||
Audit or review of financial reports of the Company or Group entities | 4,955 | 4,522 | 1,483 | 1,187 | ||||||||||||
Audit-related services2 | 1,166 | 808 | 571 | 454 | ||||||||||||
Non-audit services3 | 95 | 69 | 60 | 15 | ||||||||||||
| 6,216 | 5,399 | 2,114 | 1,656 | |||||||||||||
Total compensation of auditors | 18,351 | 17,921 | 10,104 | 10,079 | ||||||||||||
1 Inclusive of goods and services tax. 2 For the Group, comprises prudential and regulatory services of $3.067 million (2011: $3.578 million), comfort letters $0.930 million (2011: $0.446 million) and other $0.316 million (2011: $0.420 million). 3 The nature of the non-audit services include training, reviews of compliance with legal and regulatory requirements, benchmarking reviews, accounting advice and project assurance. Further details are provided in the Directors’ Report. |
Group Policy allows KPMG Australia or any of its related practices to provide assurance and other audit-related services that, while outside the scope of the statutory audit, are consistent with the role of external auditor. These include regulatory and prudential reviews requested by the Company’s regulators such as APRA. Any other services that are not audit or audit-related services are non-audit services. Group Policy allows certain non-audit services to be provided where the service would not contravene auditor independence requirements. KPMG Australia or any of its related practices may not provide services that are perceived to be in conflict with the role of the external auditor. These include consulting advice and subcontracting of operational activities normally undertaken by management, and engagements where the auditor may ultimately be required to express an opinion on its own work.
94

6: Current Income Tax Expense
| Consolidated | The Company | |||||||||||||||
2012 $m | 2011 $m | 2012 $m | 2011 $m | |||||||||||||
Income tax recognised in the income statement | ||||||||||||||||
Tax expense/(income) comprises: | ||||||||||||||||
Current tax expense/(income) | 2,523 | 2,364 | 1,690 | 1,624 | ||||||||||||
Adjustments recognised in the current year in relation to the current tax of prior years | 2 | 3 | (3) | 3 | ||||||||||||
Deferred tax expense/(income) relating to the origination and reversal of temporary differences | (198) | (58) | (72) | (206) | ||||||||||||
Total income tax expense charged in the income statement | 2,327 | 2,309 | 1,615 | 1,421 | ||||||||||||
Reconciliation of the prima facie income tax expense on pre-tax profit with the income tax expense charged in the Income statement | ||||||||||||||||
Profit before income tax | 7,994 | 7,672 | 6,490 | 5,572 | ||||||||||||
Prima facie income tax expense at 30% | 2,398 | 2,302 | 1,947 | 1,672 | ||||||||||||
Tax effect of permanent differences: | ||||||||||||||||
Overseas tax rate differential | (48) | (29) | (9) | (18) | ||||||||||||
Rebateable and non-assessable dividends | (4) | (5) | (423) | (282) | ||||||||||||
Profit from associates | (118) | (131) | – | – | ||||||||||||
(Gain on sale)/write-down of investment in Sacombank | (3) | 11 | (3) | 11 | ||||||||||||
Write-down of investment in Saigon Securities Inc. | 9 | – | 9 | – | ||||||||||||
Offshore Banking Units | (12) | – | (12) | – | ||||||||||||
Foreign exchange translation of US hybrid loan capital | – | – | (16) | (2) | ||||||||||||
OnePath Australia – policyholder income and contributions tax | 106 | 146 | – | – | ||||||||||||
Tax provisions no longer required | (70) | (43) | (60) | (40) | ||||||||||||
Interest on Convertible Preference Shares | 68 | 50 | 68 | 50 | ||||||||||||
Adjustment between members of the Australian tax-consolidated group | – | – | 108 | – | ||||||||||||
Other | (1) | 5 | 9 | 27 | ||||||||||||
| 2,325 | 2,306 | 1,618 | 1,418 | |||||||||||||
Income tax (over) provided in previous years | 2 | 3 | (3) | 3 | ||||||||||||
Total income tax expense charged in the income statement | 2,327 | 2,309 | 1,615 | 1,421 | ||||||||||||
Effective tax rate | 29.1% | 30.1% | 24.9% | 25.5% | ||||||||||||
Australia | 1,823 | 1,845 | 1,511 | 1,322 | ||||||||||||
Overseas | 504 | 464 | 104 | 99 | ||||||||||||
Tax consolidation
The Company and all its wholly owned Australian resident entities are part of a tax-consolidated group under Australian taxation law. The Company is the head entity in the tax-consolidated group. Tax expense/income and deferred tax liabilities/assets arising from temporary differences of the members of the tax-consolidated group are recognised in the separate financial statements of the members of the tax-consolidated group on a ‘group allocation’ basis. Current tax liabilities and assets of the tax consolidated group are recognised by the Company (as head entity in the tax-consolidated group).
Due to the existence of a tax funding arrangement between the entities in the tax-consolidated group, amounts are recognised as payable to or receivable by the Company and each member of the group in relation to the tax contribution amounts paid or payable between the Company and the other members of the tax-consolidated group in accordance with the arrangement.
Members of the tax-consolidated group have also entered into a tax sharing agreement that provides for the allocation of income tax liabilities between the entities should the head entity default on its income tax payment obligations.
Taxation of Financial Arrangements ‘TOFA’
The Group adopted the new tax regime for financial arrangements (TOFA) in Australia effective from 1 October 2009. The regime aims to more closely align the tax and accounting recognition and measurement of the financial arrangements within scope and their related flows. Deferred tax balances for financial arrangements that existed on adoption at 1 October 2009 will reverse over a four year period.
NOTES TO THE FINANCIAL STATEMENTS 95

7: Dividends
| Consolidated1 | The Company | |||||||||||||||
2012 $m | 2011 $m | 2012 $m | 2011 $m | |||||||||||||
Ordinary share dividends2 | ||||||||||||||||
Interim dividend | 1,769 | 1,662 | 1,769 | 1,662 | ||||||||||||
Final dividend | 2,002 | 1,895 | 2,002 | 1,895 | ||||||||||||
Bonus option plan adjustment | (80 | ) | (66 | ) | (80 | ) | (66 | ) | ||||||||
Dividend on ordinary shares | 3,691 | 3,491 | 3,691 | 3,491 | ||||||||||||
| 1 | Dividends paid to ordinary equity holders of the Company. Excludes dividends paid by subsidiaries of the Group to non-controlling equity holders (2012: $2 million; 2011: nil). |
| 2 | Dividends are not accrued and are recorded when paid. |
A final dividend of 79 cents, fully franked, is proposed to be paid on each eligible fully paid ordinary share on 19 December 2012 (2011: final dividend of 76 cents, paid 16 December 2011, fully franked). The 2012 interim dividend of 66 cents, paid 2 July 2012, was fully franked (2011: interim dividend of 64 cents, paid 1 July 2011, fully franked).
The tax rate applicable to the franking credits attached to the 2012 interim dividend and to be attached to the proposed 2012 final dividend is 30% (2011: 30%).
Dividends paid in cash or satisfied by the issue of shares under the Dividend Reinvestment Plan during the years ended 30 September 2012 and 2011 were as follows:
| Consolidated | The Company | |||||||||||||||
2012 $m | 2011 $m | 2012 $m | 2011 $m | |||||||||||||
Paid in cash1 | 2,230 | 2,124 | 2,230 | 2,124 | ||||||||||||
Satisfied by share issue2 | 1,461 | 1,367 | 1,461 | 1,367 | ||||||||||||
| 3,691 | 3,491 | 3,691 | 3,491 | |||||||||||||
| Consolidated | The Company | |||||||||||||||
2012 $m | 2011 $m | 2012 $m | 2011 $m | |||||||||||||
Preference share dividend3 | ||||||||||||||||
Euro Trust Securities4 | 11 | 12 | – | – | ||||||||||||
Dividend on preference shares | 11 | 12 | – | – | ||||||||||||
| 1 | Refers to cash paid to shareholders who did not elect to participate in the dividend reinvestment plan or the bonus option plan. |
| 2 | Includes shares issued to participating shareholders under the dividend reinvestment plan. |
| 3 | Dividends are not accrued and are recorded when paid. |
| 4 | Refer to note 29 for details. |
Dividend franking account
The amount of franking credits available to the Company for the subsequent financial year is $386 million (2011: $363 million) after adjusting for franking credits that will arise from the payment of tax on Australian profits for the 2012 financial year, $921 million of franking credits which will be utilised in franking the proposed 2012 final dividend and franking credits that may not be accessible by the Company at present.
Restrictions which limit the payment of dividends
There are presently no significant restrictions on the payment of dividends from material controlled entities to the Company. Various capital adequacy, liquidity, foreign currency controls, statutory reserve and other prudential and legal requirements must be observed by certain controlled entities and the impact of these requirements on the payment of cash dividends is monitored.
There are presently no significant restrictions on the payment of dividends by the Company, although reductions in shareholders’ equity through the payment of cash dividends is monitored having regard to the following:
| n | There are regulatory and other legal requirements to maintain specified capitalisations. Further, APRA has advised that a bank under its supervision must consult with it before declaring |
a coupon payment or dividend on a Tier 1 or Upper Tier 2 instrument, if the bank proposes to pay coupons or dividends on Tier 1 or Upper Tier 2 instruments which exceed its after tax prudential profits (as defined by APRA from time to time); |
| n | The Corporations Act 2001 (Cth) provides that the Company must not pay a dividend on any instrument unless (i) it has sufficient net assets for the payment, (ii) the payment is fair and reasonable to the Company’s shareholders as a whole, and (iii) the payment does not materially prejudice the Company’s ability to pay its creditors; |
| n | The Company may not pay a dividend if to do so would result in the Company becoming, or likely to become, insolvent or breaching specified capital adequacy ratios or if APRA so directs; and |
| n | If any dividend, interest or redemption payments or other distributions are not paid on the scheduled payment date, or shares or other qualifying Tier 1 securities are not issued on the applicable conversion or redemption dates, on the Group’s Euro Trust Securities, US Trust Securities or ANZ Convertible Preference Shares in accordance with their terms, the Group may be restricted from declaring or paying any dividends or other distributions on Tier 1 securities including ANZ ordinary shares and preference shares. This restriction is subject to a number of exceptions. |
| 96 |
7: Dividends(continued)
Dividend Reinvestment Plan
During the year ended 30 September 2012, 39,662,663 ordinary shares were issued at $19.09 per share and 34,448,302 ordinary shares at $20.44 per share to participating shareholders under the Dividend Reinvestment Plan (2011: 31,506,936 ordinary shares at $22.60 per share, and 30,178,811 ordinary shares at $21.69 per share). All eligible shareholders can elect to participate in the Dividend Reinvestment Plan.
For the 2012 final dividend, no discount will be applied when calculating the ‘Acquisition Price’ used in determining the number of ordinary shares to be provided under the Dividend Reinvestment Plan and Bonus Option Plan terms and conditions, and the ‘Pricing Period’ under the Dividend Reinvestment Plan and Bonus Option Plan terms and conditions will be the seven trading days commencing on 16 November 2012 (unless otherwise determined by the Directors and announced on the ASX).
Bonus Option Plan
The amount paid in dividends during the year has been reduced as a result of certain eligible shareholders participating in the Bonus Option Plan and foregoing all or part of their right to dividends. These shareholders were issued ordinary shares under the Bonus Option Plan.
During the year ended 30 September 2012, 4,090,494 ordinary shares were issued under the Bonus Option Plan (2011: 3,013,239 ordinary shares).
8: Earnings per Ordinary Share
| Consolidated | ||||||||||
2012 $m | 2011 $m | |||||||||
Basic earnings per share (cents) | 213.4 | 208.2 | ||||||||
Earnings reconciliation ($millions) | ||||||||||
Profit for the year | 5,667 | 5,363 | ||||||||
Less: profit attributable to minority interests | 6 | 8 | ||||||||
Less: preference share dividend paid | 11 | 12 | ||||||||
Earnings used in calculating basic earnings per share | 5,650 | 5,343 | ||||||||
Weighted average number of ordinary shares (millions) | 2,647.4 | 2,565.9 | ||||||||
Diluted earnings per share (cents) | 205.6 | 198.8 | ||||||||
Earnings reconciliation ($millions) | ||||||||||
Earnings used in calculating basic earnings per share | 5,650 | 5,343 | ||||||||
Add: US Trust Securities interest expense | 30 | 28 | ||||||||
Add: UK Stapled Securities interest expense | 31 | 46 | ||||||||
Add: ANZ Convertible Preference Shares interest expense | 225 | 168 | ||||||||
Earnings used in calculating diluted earnings per share | 5,936 | 5,585 | ||||||||
Weighted average number of ordinary shares (millions) | ||||||||||
Used in calculating basic earnings per share | 2,647.4 | 2,565.9 | ||||||||
Add: | weighted average number of options/rights potentially convertible to ordinary shares | 5.3 | 4.5 | |||||||
weighted average number of convertible US Trust Securities at current market prices | 30.5 | 41.6 | ||||||||
weighted average number of convertible UK Hybrid Securities | 24.6 | 38.9 | ||||||||
weighted average number of ANZ Convertible Preference Shares | 179.8 | 158.7 | ||||||||
Used in calculating diluted earnings per share | 2,887.6 | 2,809.6 | ||||||||
The weighted average number of converted and lapsed options, weighted with reference to the date of conversion or lapse, and included in the calculation of diluted earnings per share is approximately 0.5 million (2011: approximately 1.5 million).
NOTES TO THE FINANCIAL STATEMENTS 97

9: Liquid Assets
| Consolidated | The Company | |||||||||||||||
2012 $m | 2011 $m | 2012 $m | 2011 $m | |||||||||||||
Coins, notes and cash at bank | 3,056 | 2,805 | 1,010 | 958 | ||||||||||||
Money at call, bills receivable and remittances in transit | 21,112 | 12,769 | 19,792 | 11,539 | ||||||||||||
Other banks’ certificates of deposit | 2,257 | 3,377 | 2,177 | 2,149 | ||||||||||||
Securities purchased under agreements to resell in less than three months | 10,153 | 6,676 | 9,803 | 6,637 | ||||||||||||
Total liquid assets | 36,578 | 25,627 | 32,782 | 21,283 | ||||||||||||
10: Due from Other Financial Institutions
| Consolidated | The Company | |||||||||||||||
2012 $m | 2011 $m | 2012 $m | 2011 $m | |||||||||||||
Cash collateral | 6,878 | 5,202 | 5,875 | 4,460 | ||||||||||||
Other receivables from financial institutions | 10,225 | 8,096 | 8,292 | 5,610 | ||||||||||||
Total due from other financial institutions | 17,103 | 13,298 | 14,167 | 10,070 | ||||||||||||
11: Trading Securities
| Consolidated | The Company | |||||||||||||||
2012 $m | 2011 $m | 2012 $m | 2011 $m | |||||||||||||
Commonwealth securities | 2,168 | 4,505 | 2,073 | 4,505 | ||||||||||||
Local, semi-government and other government securities | 14,332 | 13,563 | 7,468 | 8,879 | ||||||||||||
Other securities and equity securities | 24,102 | 18,006 | 20,949 | 14,983 | ||||||||||||
Total trading securities | 40,602 | 36,074 | 30,490 | 28,367 | ||||||||||||
98

12: Derivative Financial Instruments
Derivative financial instruments are contracts whose value is derived from one or more underlying variables or indices, require little or no initial net investment and are settled at a future date. Derivatives include contracts traded on registered exchanges and contracts agreed between counterparties. The use of derivatives and their sale to customers as risk management products is an integral part of the Group’s trading and sales activities. Derivatives are also used to manage the Group’s own exposure to fluctuations in foreign exchange and interest rates as part of its asset and liability management activities.
Derivative financial instruments are subject to market and credit risk, and these risks are managed in a manner consistent with the risks arising on other financial instruments.
Types of derivative financial instruments
The Group transacts principally in foreign exchange, interest rate, commodity and credit derivative contracts. The principal types of derivative contracts include swaps, forwards, futures and options contracts and agreements.
Derivatives, except for those that are specifically designated as effective hedging instruments, are classified as held for trading. The held for trading classification includes two categories of derivative financial instruments: those held as trading positions and those used in the Group’s balance sheet risk management activities.
Trading positions
Trading positions arise from both sales to customers and market making activities. Sales to customers include the structuring and marketing of derivative products which enable customers to manage their own risks. Market making activities consist of derivatives entered into principally for the purpose of generating profits from short-term fluctuations in prices or margins. Positions may be traded actively or held over a period of time to benefit from expected changes in market rates.
Gains or losses, including any current period interest, from the change in fair value of trading positions are recognised in the income statement as ‘other income’ in the period in which they occur.
Balance sheet risk management
The Group designates balance sheet risk management derivatives into hedging relationships in order to minimise income statement volatility. This volatility is created by differences in the timing of recognition of gains and losses between the derivative and the hedged item. Hedge accounting is not applied to all balance sheet risk management positions.
Gains or losses from the change in fair value of balance sheet risk management derivatives that form part of an effective hedging relationship are recognised in the income statement based on the hedging relationship. Any ineffectiveness is recognised in the income statement as ‘other income’ in the period in which it occurs.
Gains or losses, excluding any current period interest, from the change in fair value of balance sheet risk management positions that are not designated into hedging relationships are recognised in the income statement as ‘other income’ in the period in which they occur. Current period interest is included in interest income and expense.
The tables on the following pages provide an overview of the Group’s and the Company’s foreign exchange, interest rate, commodity and credit derivatives. They include all trading and balance sheet risk management contracts. Notional principal amounts measure the amount of the underlying physical or financial commodity and represent the volume of outstanding transactions. They are not a measure of the risk associated with a derivative. The derivative instruments become favourable (assets) or unfavourable (liabilities) as a result of fluctuations in market rates relative to the terms of the derivative. The aggregate notional amount of derivative financial instruments on hand, the extent to which instruments are favourable or unfavourable, and as a consequence the aggregate fair values of derivative financial assets and liabilities, can fluctuate significantly from time to time. The fair values of derivative instruments held and their notional principal amounts are set out below.
NOTES TO THE FINANCIAL STATEMENTS 99

12: Derivative Financial Instruments(continued)
Consolidated at 30 September 2012 | Fair Value | |||||||||||||||||||||||||||||||||||||||||||||||
| Trading | Hedging | Total fair value of derivatives | ||||||||||||||||||||||||||||||||||||||||||||||
| Notional | Fair value | Cash flow | Net investment | |||||||||||||||||||||||||||||||||||||||||||||
Principal Amount $m | Assets $m | Liabilities $m | Assets $m | Liabilities $m | Assets $m | Liabilities $m | Assets $m | Liabilities $m | Assets $m | Liabilities $m | ||||||||||||||||||||||||||||||||||||||
Foreign exchange contracts | ||||||||||||||||||||||||||||||||||||||||||||||||
Spot and forward contracts | 390,756 | 4,112 | (5,336 | ) | – | – | – | – | 35 | – | 4,147 | (5,336) | ||||||||||||||||||||||||||||||||||||
Swap agreements | 280,664 | 7,608 | (11,681 | ) | 171 | (4 | ) | – | – | 84 | – | 7,863 | (11,685) | |||||||||||||||||||||||||||||||||||
Futures contracts | 954 | 99 | (134 | ) | – | – | – | – | – | – | 99 | (134) | ||||||||||||||||||||||||||||||||||||
Options purchased | 66,348 | 1,228 | – | – | – | – | – | – | – | 1,228 | – | |||||||||||||||||||||||||||||||||||||
Options sold | 71,318 | – | (1,091 | ) | – | – | – | – | – | – | – | (1,091) | ||||||||||||||||||||||||||||||||||||
| 810,040 | 13,047 | (18,242 | ) | 171 | (4 | ) | – | – | 119 | – | 13,337 | (18,246) | ||||||||||||||||||||||||||||||||||||
Commodity contracts | ||||||||||||||||||||||||||||||||||||||||||||||||
Derivative contracts | 34,820 | 1,600 | (1,803 | ) | – | – | – | – | – | – | 1,600 | (1,803) | ||||||||||||||||||||||||||||||||||||
Interest rate contracts | ||||||||||||||||||||||||||||||||||||||||||||||||
Forward rate agreements | 240,576 | 24 | (23 | ) | – | – | – | – | – | – | 24 | (23) | ||||||||||||||||||||||||||||||||||||
Swap agreements | 1,583,257 | 29,185 | (29,035 | ) | 1,811 | (788 | ) | 1,288 | (922 | ) | – | – | 32,284 | (30,745) | ||||||||||||||||||||||||||||||||||
Futures contracts | 113,974 | 148 | (138 | ) | – | (30 | ) | 9 | (8 | ) | – | – | 157 | (176) | ||||||||||||||||||||||||||||||||||
Options purchased | 26,040 | 963 | – | – | – | – | – | – | – | 963 | – | |||||||||||||||||||||||||||||||||||||
Options sold | 35,367 | – | (1,116 | ) | – | – | – | – | – | – | – | (1,116) | ||||||||||||||||||||||||||||||||||||
| 1,999,214 | 30,320 | (30,312 | ) | 1,811 | (818 | ) | 1,297 | (930 | ) | – | – | 33,428 | (32,060) | |||||||||||||||||||||||||||||||||||
Credit default swaps | ||||||||||||||||||||||||||||||||||||||||||||||||
Structured credit derivatives purchased | 7,634 | 243 | – | – | – | – | – | – | – | 243 | – | |||||||||||||||||||||||||||||||||||||
Other credit derivatives purchased | 11,632 | 277 | (62 | ) | – | – | – | – | – | – | 277 | (62) | ||||||||||||||||||||||||||||||||||||
Total credit derivatives purchased | 19,266 | 520 | (62 | ) | – | – | – | – | – | – | 520 | (62) | ||||||||||||||||||||||||||||||||||||
Structured credit derivatives sold | 7,634 | – | (346 | ) | – | – | – | – | – | – | – | (346) | ||||||||||||||||||||||||||||||||||||
Other credit derivatives sold | 10,870 | 44 | (122 | ) | – | – | – | – | – | – | 44 | (122) | ||||||||||||||||||||||||||||||||||||
Total credit derivatives sold | 18,504 | 44 | (468 | ) | – | – | – | – | – | – | 44 | (468) | ||||||||||||||||||||||||||||||||||||
| 37,770 | 564 | (530 | ) | – | – | – | – | – | – | 564 | (530) | |||||||||||||||||||||||||||||||||||||
Total | 2,881,844 | 45,531 | (50,887 | ) | 1,982 | (822 | ) | 1,297 | (930 | ) | 119 | – | 48,929 | (52,639) | ||||||||||||||||||||||||||||||||||
100

12: Derivative Financial Instruments(continued)
| Fair Value | ||||||||||||||||||||||||||||||||||||||||||||||||
| Trading | Hedging | Total fair value of derivatives | ||||||||||||||||||||||||||||||||||||||||||||||
| Notional | Fair value | Cash flow | Net investment | |||||||||||||||||||||||||||||||||||||||||||||
Consolidated at 30 September 2011 | Principal Amount $m | Assets $m | Liabilities $m | Assets $m | Liabilities $m | Assets $m | Liabilities $m | Assets $m | Liabilities $m | Assets $m | Liabilities $m | |||||||||||||||||||||||||||||||||||||
Foreign exchange contracts | ||||||||||||||||||||||||||||||||||||||||||||||||
Spot and forward contracts | 328,740 | 10,657 | (8,940 | ) | – | – | – | – | 1 | – | 10,658 | (8,940) | ||||||||||||||||||||||||||||||||||||
Swap agreements | 223,074 | 15,536 | (16,034 | ) | 289 | (114 | ) | – | – | 12 | – | 15,837 | (16,148) | |||||||||||||||||||||||||||||||||||
Futures contracts | 886 | 812 | (949 | ) | – | – | – | – | – | – | 812 | (949) | ||||||||||||||||||||||||||||||||||||
Options purchased | 57,053 | 1,318 | – | – | – | – | – | – | – | 1,318 | – | |||||||||||||||||||||||||||||||||||||
Options sold | 60,182 | – | (1,290 | ) | – | – | – | – | – | – | – | (1,290) | ||||||||||||||||||||||||||||||||||||
| 669,935 | 28,323 | (27,213 | ) | 289 | (114 | ) | – | – | 13 | – | 28,625 | (27,327) | ||||||||||||||||||||||||||||||||||||
Commodity contracts | ||||||||||||||||||||||||||||||||||||||||||||||||
Derivative contracts | 25,916 | 1,885 | (1,386 | ) | – | – | – | – | – | – | 1,885 | (1,386) | ||||||||||||||||||||||||||||||||||||
Interest rate contracts | ||||||||||||||||||||||||||||||||||||||||||||||||
Forward rate agreements | 155,215 | 34 | (29 | ) | – | – | 1 | (1 | ) | – | – | 35 | (30) | |||||||||||||||||||||||||||||||||||
Swap agreements | 1,478,261 | 22,621 | (22,356 | ) | 1,525 | (417 | ) | 893 | (612 | ) | – | – | 25,039 | (23,385) | ||||||||||||||||||||||||||||||||||
Futures contracts | 86,253 | 1,029 | (1,011 | ) | – | – | 3 | (13 | ) | – | – | 1,032 | (1,024) | |||||||||||||||||||||||||||||||||||
Options purchased | 43,926 | 611 | – | – | – | – | – | – | – | 611 | – | |||||||||||||||||||||||||||||||||||||
Options sold | 40,221 | – | (765 | ) | – | – | – | – | – | – | – | (765) | ||||||||||||||||||||||||||||||||||||
| 1,803,876 | 24,295 | (24,161 | ) | 1,525 | (417 | ) | 897 | (626 | ) | – | – | 26,717 | (25,204) | |||||||||||||||||||||||||||||||||||
Credit default swaps | ||||||||||||||||||||||||||||||||||||||||||||||||
Structured credit derivatives purchased | 8,976 | 609 | – | – | – | – | – | – | – | 609 | – | |||||||||||||||||||||||||||||||||||||
Other credit derivatives purchased | 15,641 | 781 | (29 | ) | – | – | – | – | – | – | 781 | (29) | ||||||||||||||||||||||||||||||||||||
Total credit derivatives purchased | 24,617 | 1,390 | (29 | ) | – | – | – | – | – | – | 1,390 | (29) | ||||||||||||||||||||||||||||||||||||
Structured credit derivatives sold | 8,475 | – | (788 | ) | – | – | – | – | – | – | – | (788) | ||||||||||||||||||||||||||||||||||||
Other credit derivatives sold | 14,867 | 24 | (556 | ) | – | – | – | – | – | – | 24 | (556) | ||||||||||||||||||||||||||||||||||||
Total credit derivatives sold | 23,342 | 24 | (1,344 | ) | – | – | – | – | – | – | 24 | (1,344) | ||||||||||||||||||||||||||||||||||||
| 47,959 | 1,414 | (1,373 | ) | – | – | – | – | – | – | 1,414 | (1,373) | |||||||||||||||||||||||||||||||||||||
Total1 | 2,547,686 | 55,917 | (54,133 | ) | 1,814 | (531 | ) | 897 | (626 | ) | 13 | – | 58,641 | (55,290) | ||||||||||||||||||||||||||||||||||
| 1 | Comparative information has been restated to reflect the impact of the current period reporting treatment of the derivative related collateral posted/received. Refer to note 1 for further details. |
NOTES TO THE FINANCIAL STATEMENTS 101

12: Derivative Financial Instruments(continued)
| Fair Value | ||||||||||||||||||||||||||||||||||||||||||||||||
| Trading | Hedging | Total fair value of derivatives | ||||||||||||||||||||||||||||||||||||||||||||||
| Notional | Fair value | Cash Flow | Net investment | |||||||||||||||||||||||||||||||||||||||||||||
The Company at 30 September 2012 | Principal Amount $m | Assets $m | Liabilities $m | Assets $m | Liabilities $m | Assets $m | Liabilities $m | Assets $m | Liabilities $m | Assets $m | Liabilities $m | |||||||||||||||||||||||||||||||||||||
Foreign exchange contracts | ||||||||||||||||||||||||||||||||||||||||||||||||
Spot and forward contracts | 390,283 | 3,921 | (4,603 | ) | – | – | – | – | – | – | 3,921 | (4,603) | ||||||||||||||||||||||||||||||||||||
Swap agreements | 236,951 | 7,511 | (10,675 | ) | 169 | (4 | ) | – | – | 84 | – | 7,764 | (10,679) | |||||||||||||||||||||||||||||||||||
Futures contracts | 840 | 99 | (134 | ) | – | – | – | – | – | – | 99 | (134) | ||||||||||||||||||||||||||||||||||||
Options purchased | 65,803 | 1,224 | – | – | – | – | – | – | – | 1,224 | – | |||||||||||||||||||||||||||||||||||||
Options sold | 70,877 | – | (1,073 | ) | – | – | – | – | – | – | – | (1,073) | ||||||||||||||||||||||||||||||||||||
| 764,754 | 12,755 | (16,485 | ) | 169 | (4 | ) | – | – | 84 | – | 13,008 | (16,489) | ||||||||||||||||||||||||||||||||||||
Commodity contracts | ||||||||||||||||||||||||||||||||||||||||||||||||
Derivative contracts | 34,288 | 1,595 | (1,801 | ) | – | – | – | – | – | – | 1,595 | (1,801) | ||||||||||||||||||||||||||||||||||||
Interest rate contracts | ||||||||||||||||||||||||||||||||||||||||||||||||
Forward rate agreements | 204,539 | 22 | (21 | ) | – | – | – | – | – | – | 22 | (21) | ||||||||||||||||||||||||||||||||||||
Swap agreements | 1,247,578 | 24,240 | (24,420 | ) | 1,624 | (633 | ) | 1,096 | (864 | ) | – | – | 26,960 | (25,917) | ||||||||||||||||||||||||||||||||||
Futures contracts | 90,176 | 146 | (135 | ) | – | (30 | ) | 9 | (8 | ) | – | – | 155 | (173) | ||||||||||||||||||||||||||||||||||
Options purchased | 26,173 | 962 | – | – | – | – | – | – | – | 962 | – | |||||||||||||||||||||||||||||||||||||
Options sold | 35,822 | – | (1,116 | ) | – | – | – | – | – | – | – | (1,116) | ||||||||||||||||||||||||||||||||||||
| 1,604,288 | 25,370 | (25,692 | ) | 1,624 | (663 | ) | 1,105 | (872 | ) | – | – | 28,099 | (27,227) | |||||||||||||||||||||||||||||||||||
Credit default swaps | ||||||||||||||||||||||||||||||||||||||||||||||||
Structured credit derivatives purchased | 7,634 | 243 | – | – | – | – | – | – | – | 243 | – | |||||||||||||||||||||||||||||||||||||
Other credit derivatives purchased | 11,632 | 277 | (62 | ) | – | – | – | – | – | – | 277 | (62) | ||||||||||||||||||||||||||||||||||||
Total credit derivatives purchased | 19,266 | 520 | (62 | ) | – | – | – | – | – | – | 520 | (62) | ||||||||||||||||||||||||||||||||||||
Structured credit derivatives sold | 7,634 | – | (346 | ) | – | – | – | – | – | – | – | (346) | ||||||||||||||||||||||||||||||||||||
Other credit derivatives sold | 10,870 | 44 | (122 | ) | – | – | – | – | – | – | �� | 44 | (122) | |||||||||||||||||||||||||||||||||||
Total credit derivatives sold | 18,504 | 44 | (468 | ) | – | – | – | – | – | – | 44 | (468) | ||||||||||||||||||||||||||||||||||||
| 37,770 | 564 | (530 | ) | – | – | – | – | – | – | 564 | (530) | |||||||||||||||||||||||||||||||||||||
Total | 2,441,100 | 40,284 | (44,508 | ) | 1,793 | (667 | ) | 1,105 | (872 | ) | 84 | – | 43,266 | (46,047) | ||||||||||||||||||||||||||||||||||
102

12: Derivative Financial Instruments(continued)
| Fair Value | ||||||||||||||||||||||||||||||||||||||||||||||||
| Trading | Hedging | Total fair value of derivatives | ||||||||||||||||||||||||||||||||||||||||||||||
| Notional | Fair value | Cash flow | Net investment | |||||||||||||||||||||||||||||||||||||||||||||
The Company at 30 September 2011 | Principal Amount $m | Assets $m | Liabilities $m | Assets $m | Liabilities $m | Assets $m | Liabilities $m | Assets $m | Liabilities $m | Assets $m | Liabilities $m | |||||||||||||||||||||||||||||||||||||
Foreign exchange contracts | ||||||||||||||||||||||||||||||||||||||||||||||||
Spot and forward contracts | 326,868 | 9,748 | (8,718 | ) | – | – | – | – | – | – | 9,748 | (8,718) | ||||||||||||||||||||||||||||||||||||
Swap agreements | 196,031 | 14,758 | (14,375 | ) | 286 | (114 | ) | – | – | 12 | – | 15,056 | (14,489) | |||||||||||||||||||||||||||||||||||
Futures contracts | 886 | 812 | (949 | ) | – | – | – | – | – | – | 812 | (949) | ||||||||||||||||||||||||||||||||||||
Options purchased | 57,706 | 1,299 | – | – | – | – | – | – | – | 1,299 | – | |||||||||||||||||||||||||||||||||||||
Options sold | 60,790 | – | (1,267 | ) | – | – | – | – | – | – | – | (1,267) | ||||||||||||||||||||||||||||||||||||
| 642,281 | 26,617 | (25,309 | ) | 286 | (114 | ) | – | – | 12 | – | 26,915 | (25,423) | ||||||||||||||||||||||||||||||||||||
Commodity contracts | ||||||||||||||||||||||||||||||||||||||||||||||||
Derivative contracts | 25,874 | 1,881 | (1,382 | ) | – | – | – | – | – | – | 1,881 | (1,382) | ||||||||||||||||||||||||||||||||||||
Interest rate contracts | ||||||||||||||||||||||||||||||||||||||||||||||||
Forward rate agreements | 98,700 | 24 | (20 | ) | – | – | 1 | (1 | ) | – | – | 25 | (21) | |||||||||||||||||||||||||||||||||||
Swap agreements | 1,125,305 | 17,888 | (18,119 | ) | 1,304 | (117 | ) | 677 | (557 | ) | – | – | 19,869 | (18,793) | ||||||||||||||||||||||||||||||||||
Futures contracts | 65,610 | 1,015 | (1,004 | ) | – | – | 3 | (6 | ) | – | – | 1,018 | (1,010) | |||||||||||||||||||||||||||||||||||
Options purchased | 41,321 | 598 | – | – | – | – | – | – | – | 598 | – | |||||||||||||||||||||||||||||||||||||
Options sold | 37,238 | – | (745 | ) | – | – | – | – | – | – | – | (745) | ||||||||||||||||||||||||||||||||||||
| 1,368,174 | 19,525 | (19,888 | ) | 1,304 | (117 | ) | 681 | (564 | ) | – | – | 21,510 | (20,569) | |||||||||||||||||||||||||||||||||||
Credit default swaps | ||||||||||||||||||||||||||||||||||||||||||||||||
Structured credit derivatives purchased | 8,976 | 609 | – | – | – | – | – | – | – | 609 | – | |||||||||||||||||||||||||||||||||||||
Other credit derivatives purchased | 15,641 | 781 | (29 | ) | – | – | – | – | – | – | 781 | (29) | ||||||||||||||||||||||||||||||||||||
Total credit derivatives purchased | 24,617 | 1,390 | (29 | ) | – | – | – | – | – | – | 1,390 | (29) | ||||||||||||||||||||||||||||||||||||
Structured credit derivatives sold | 8,475 | – | (788 | ) | – | – | – | – | – | – | – | (788) | ||||||||||||||||||||||||||||||||||||
Other credit derivatives sold | 14,867 | 24 | (556 | ) | – | – | – | – | – | – | 24 | (556) | ||||||||||||||||||||||||||||||||||||
Total credit derivatives sold | 23,342 | 24 | (1,344 | ) | – | – | – | – | – | – | 24 | (1,344) | ||||||||||||||||||||||||||||||||||||
| 47,959 | 1,414 | (1,373 | ) | – | – | – | – | – | – | 1,414 | (1,373) | |||||||||||||||||||||||||||||||||||||
Total1 | 2,084,288 | 49,437 | (47,952 | ) | 1,590 | (231 | ) | 681 | (564 | ) | 12 | – | 51,720 | (48,747) | ||||||||||||||||||||||||||||||||||
| 1 | Comparative information has been restated to reflect the impact of the current period reporting treatment of the derivative related collateral posted/received. Refer to note 1 for further details. |
NOTES TO THE FINANCIAL STATEMENTS 103

12: Derivative Financial Instruments(continued)
Hedging relationships
There are three types of hedging relationships: fair value hedges, cash flow hedges and hedges of a net investment in a foreign operation. Each type of hedging has specific requirements when accounting for the fair value changes in the hedging relationship. For details on the accounting treatment of each type of hedging relationship refer to note 1.
Fair value hedges
The risk being hedged in a fair value hedge is a change in the fair value of an asset or liability or unrecognised firm commitment that may affect the income statement. Changes in fair value might arise through changes in interest rates or foreign exchange rates. The Group’s fair value hedges consist principally of interest rate swaps and cross currency swaps that are used to protect against changes
in the fair value of fixed-rate long-term financial instruments due to movements in market interest rates and exchange rates.
The application of fair value hedge accounting results in the fair value adjustment on the hedged item attributable to the hedged risk being recognised in the income statement at the same time the hedging instrument impacts the income statement. If a hedging relationship is terminated, the fair value adjustment to the hedged item continues to be recognised as part of the carrying amount of the item or group of items and is amortised to the income statement as a part of the effective yield over the period to maturity. Where the hedged item is derecognised from the Group’s balance sheet, the fair value adjustment is included in the income statement as ‘other income’ as a part of the gain or loss on disposal.
| Consolidated | The Company | |||||||||||||||
2012 $m | 2011 $m | 2012 $m | 2011 $m | |||||||||||||
Gain/(loss) arising from fair value hedges | ||||||||||||||||
Hedged item | 91 | (15 | ) | 63 | (43) | |||||||||||
Hedging Instrument | (103 | ) | 19 | (68 | ) | 43 | ||||||||||
Cash flow hedges
The risk being hedged in a cash flow hedge is the potential variability in future cash flows that may affect the income statement. Variability in the future cash flows may result from changes in interest rates or exchange rates affecting recognised financial assets and liabilities and highly probable forecast transactions. The Group’s cash flow hedges consist principally of interest rate swaps, forward rate agreements and cross currency swaps that are used to protect against exposures to variability in future cash flows on non-trading assets and liabilities which bear interest at variable rates or which are expected to be refunded or reinvested in the future. The Group primarily applies cash flow hedge accounting to its variable rate loan assets, variable rate liabilities and short-term re-issuances of fixed rate customer and wholesale deposit liabilities. The amounts and timing of future cash flows, representing both principal and interest flows, are projected for
each portfolio of financial assets and liabilities on the basis of their forecast repricing profile. This forms the basis for identifying gains and losses on the effective portions of derivatives designated as cash flow hedges.
The effective portion of changes in the fair value of derivatives qualifying and designated as cash flow hedges is deferred to the hedging reserve which forms part of shareholders’ equity. Amounts deferred in equity are recognised in the income statement in the period during which the hedged forecast transactions take place. The ineffective portion of a designated cash flow hedge relationship is recognised immediately in the income statement. The schedule below shows the movements in the hedging reserve:
| Consolidated | The Company | |||||||||||||||
2012 $m | 2011 $m | 2012 $m | 2011 $m | |||||||||||||
Opening | 169 | 11 | 47 | (73) | ||||||||||||
Item recorded in net interest income | 17 | (9 | ) | 27 | (12) | |||||||||||
Tax effect on items recorded in net interest income | (5 | ) | 3 | (8 | ) | 4 | ||||||||||
Valuation gain taken to equity | 39 | 230 | 32 | 183 | ||||||||||||
Tax effect on net gain on cash flow hedges | (12 | ) | (66 | ) | (9 | ) | (55) | |||||||||
Closing Balance | 208 | 169 | 89 | 47 | ||||||||||||
The table below shows the breakdown of the hedging reserve attributable to each type of cash flow hedging relationship:
| Consolidated | The Company | |||||||||||||||
2012 $m | 2011 $m | 2012 $m | 2011 $m | |||||||||||||
Variable rate assets | 922 | 614 | 755 | 445 | ||||||||||||
Variable rate liabilities | (330 | ) | (188 | ) | (307 | ) | (163) | |||||||||
Re-issuances of short term fixed rate liabilities | (384 | ) | (257 | ) | (359 | ) | (235) | |||||||||
Total hedging reserve | 208 | 169 | 89 | 47 | ||||||||||||
104

12: Derivative Financial Instruments(continued)
The mechanics of a cash flow hedge results in the gain (or loss) in the hedging reserve being released into the income statement at the same time that the corresponding loss (or gain) attributable to the hedged item impacts the income statement. It will not necessarily be released to the income statement uniformly over the period of the hedging relationship as the fair value of the derivative is driven by changes in market rates over the term of the instrument. As market rates do not always move uniformly across all time periods, a change in market rates may drive more value in one forecast period than another, which impacts when the hedging reserve balance is released to the income statement.
All underlying hedged cash flows are expected to be recognised in the income statement in the period in which they occur which is anticipated to take place over the next 0 -10 years (2011: 0-10 years).
All gains and losses associated with the ineffective portion of the hedging derivatives are recognised immediately as ‘other income’
in the income statement. Ineffectiveness recognised in the income statement in respect of cash flow hedges amounted to a $3 million loss for the Group (2011: $9 million loss) and a $3 million loss for the Company (2011: $9 million loss).
Hedges of net investments in foreign operations
In a hedge of a net investment in a foreign operation, the risk being hedged is the exposure to exchange rate differences arising on consolidation of foreign operations with a functional currency other than the Australian Dollar. Hedging is undertaken using foreign exchange derivative contracts or by financing with borrowings in the same currency as the applicable foreign functional currency.
Ineffectiveness arising from hedges of net investments in foreign operations and recognised as ‘other income’ in the income statement amounted to nil (2011: $3 million gain).
13: Available-for-sale Assets
| Consolidated | The Company | |||||||||||||||
2012 $m | 2011 $m | 2012 $m | 2011 $m | |||||||||||||
Listed | ||||||||||||||||
Other government securities | 756 | 2,223 | 313 | 1,755 | ||||||||||||
Other securities and equity securities | 3,664 | 3,065 | 3,569 | 2,791 | ||||||||||||
Total listed | 4,420 | 5,288 | 3,882 | 4,546 | ||||||||||||
Unlisted | ||||||||||||||||
Local and semi-government securities | 7,311 | 4,219 | 6,131 | 2,946 | ||||||||||||
Other government securities | 5,323 | 7,517 | 4,871 | 6,657 | ||||||||||||
Other securities and equity securities | 3,508 | 4,885 | 2,957 | 4,513 | ||||||||||||
Loans and advances1 | – | 355 | – | 355 | ||||||||||||
Total unlisted | 16,142 | 16,976 | 13,959 | 14,471 | ||||||||||||
Total available-for-sale assets | 20,562 | 22,264 | 17,841 | 19,017 | ||||||||||||
| 1 | In July 2012, the Group reclassified loans of $300 million (2011: $236 million) from Available-for-sale into loans and advances measured at amortised cost as it is now the Groups intention to hold these assets for the foreseeable future. The Available-for-sale reserve at that date was insignificant. |
During the year a net gain of $281 million was recognised in the income statement in respect of Available-for-sale assets for the Group (2011: $18 million) and $206 million for the Company (2011: $20 million net loss). This includes a gain on the sale of investments in Visa Inc. and Sacombank of $301 million for the Group and $234 million for the company. In 2011 an impairment loss of $35 million was recognised in relation to the investment in Sacombank for both Group and Company.
In addition, a loss of $35 million (2011: $37 million) for both Group and Company was recycled from equity (the Available-for-sale revaluation reserve) into the income statement on the impairment of assets previously reclassified from available-for-sale into loans and advances (refer note 16).
Available-for-sale by maturities at 30 September 2012
Less than $m | Between $m | Between 5 years $m | Between $m | After $m | No maturity specified $m | Total fair value $m | ||||||||||||||||||||||
Local and semi-government securities | 1,325 | 464 | 1,406 | 2,880 | 1,236 | – | 7,311 | |||||||||||||||||||||
Other government securities | 4,896 | 808 | 369 | – | 6 | – | 6,079 | |||||||||||||||||||||
Other securities and equity securities | 421 | 1,022 | 2,443 | 296 | 2,858 | 132 | 7,172 | |||||||||||||||||||||
Loans and advances | – | – | – | – | – | – | – | |||||||||||||||||||||
Total available-for-sale assets | 6,642 | 2,294 | 4,218 | 3,176 | 4,100 | 132 | 20,562 | |||||||||||||||||||||
Available-for-sale by maturities at 30 September 2011 |
| |||||||||||||||||||||||||||
| Less than 3 months $m | Between 3 and 12 months $m | Between 5 years | Between 5 and 10 years $m | After 10 years | No maturity specified $m | Total fair value $m | ||||||||||||||||||||||
Local and semi-government securities | 3,397 | 764 | 24 | 2 | 32 | – | 4,219 | |||||||||||||||||||||
Other government securities | 7,471 | 1,551 | 628 | 31 | 59 | – | 9,740 | |||||||||||||||||||||
Other securities and equity securities | 2,491 | 2,256 | 1,634 | 298 | 736 | 535 | 7,950 | |||||||||||||||||||||
Loans and advances | – | – | 100 | 255 | – | – | 355 | |||||||||||||||||||||
Total available-for-sale assets | 13,359 | 4,571 | 2,386 | 586 | 827 | 535 | 22,264 | |||||||||||||||||||||
NOTES TO THE FINANCIAL STATEMENTS 105

14: Net Loans and Advances
| Consolidated | The Company | |||||||||||||||
2012 $m | 2011 $m | 2012 $m | 2011 $m | |||||||||||||
Overdrafts | 8,014 | 8,133 | 6,598 | 6,626 | ||||||||||||
Credit card outstandings | 10,741 | 11,189 | 9,222 | 9,662 | ||||||||||||
Term loans – housing | 230,706 | 215,382 | 192,912 | 179,992 | ||||||||||||
Term loans – non-housing | 150,499 | 136,388 | 114,247 | 101,767 | ||||||||||||
Hire purchase | 10,385 | 9,968 | 9,767 | 9,481 | ||||||||||||
Lease receivables | 1,885 | 2,084 | 1,363 | 1,452 | ||||||||||||
Commercial bills1 | 19,469 | 18,334 | 19,342 | 18,228 | ||||||||||||
Other | 861 | 1,319 | 243 | 1,083 | ||||||||||||
Total gross loans and advances | 432,560 | 402,797 | 353,694 | 328,291 | ||||||||||||
Less: Provision for credit impairment (refer note 16) | (4,538 | ) | (4,873 | ) | (3,407 | ) | (3,646) | |||||||||
Less: Unearned income | (2,235 | ) | (2,216 | ) | (1,946 | ) | (1,961) | |||||||||
Add: Capitalised brokerage/mortgage origination fees | 797 | 629 | 707 | 602 | ||||||||||||
Add: Customer’s liability for acceptances2 | 1,239 | 970 | 1,012 | 688 | ||||||||||||
| (4,737 | ) | (5,490 | ) | (3,634 | ) | (4,317) | ||||||||||
Net loans and advances | 427,823 | 397,307 | 350,060 | 323,974 | ||||||||||||
Lease receivables | ||||||||||||||||
a) Finance lease receivables | ||||||||||||||||
Gross finance lease receivables | ||||||||||||||||
Less than 1 year | 438 | 507 | 226 | 395 | ||||||||||||
1 to 5 years | 647 | 838 | 507 | 576 | ||||||||||||
Later than 5 years | 286 | 260 | 129 | 39 | ||||||||||||
Less: unearned future finance income on finance leases | (141 | ) | (84 | ) | (107 | ) | (59) | |||||||||
Net investment in finance lease receivables | 1,230 | 1,521 | 755 | 951 | ||||||||||||
b) Operating lease receivables | ||||||||||||||||
Gross operating lease receivables | ||||||||||||||||
Less than 1 year | 76 | 71 | 71 | 58 | ||||||||||||
1 to 5 years | 374 | 408 | 366 | 384 | ||||||||||||
Later than 5 years | 64 | – | 64 | – | ||||||||||||
Total operating lease receivables | 514 | 479 | 501 | 442 | ||||||||||||
Net lease receivables | 1,744 | 2,000 | 1,256 | 1,393 | ||||||||||||
Present value of net investment in finance lease receivables | ||||||||||||||||
Less than 1 year | 409 | 491 | 210 | 389 | ||||||||||||
1 to 5 years | 586 | 791 | 467 | 527 | ||||||||||||
Later than 5 years | 235 | 239 | 78 | 35 | ||||||||||||
| 1,230 | 1,521 | 755 | 951 | |||||||||||||
Hire purchase receivables | ||||||||||||||||
Less than 1 year | 3,412 | 3,310 | 3,200 | 3,132 | ||||||||||||
1 to 5 years | 6,927 | 6,577 | 6,521 | 6,268 | ||||||||||||
Later than 5 years | 46 | 81 | 46 | 81 | ||||||||||||
| 10,385 | 9,968 | 9,767 | 9,481 | |||||||||||||
| 1 | In 2011 the Group ceased re-discounting Commercial bill acceptances. This has impacted balance sheet classifications as there is no intention to trade the Commercial bills as negotiable instruments. |
| 2 | Previously customer liability for acceptances was presented as a separate balance on the face of the Balance Sheet; Net Loans and Advances comparatives have been restated accordingly. |
106

15: Impaired Financial Assets
Presented below is a summary of impaired financial assets that are measured on the balance sheet at amortised cost. For these items, impairment losses are recorded through the provision for credit impairment. This contrasts to financial assets carried on the balance sheet at fair value, for which any impairment loss is recognised as a component of the overall fair value.
Detailed information on impaired financial assets is provided in note 33 Financial Risk Management.
| Consolidated | The Company | |||||||||||||||
2012 $m | 2011 $m | 2012 $m | 2011 $m | |||||||||||||
Summary of impaired financial assets | ||||||||||||||||
Impaired loans | 4,364 | 4,650 | 3,146 | 3,038 | ||||||||||||
Restructured items1 | 525 | 700 | 377 | 684 | ||||||||||||
Non-performing commitments and contingencies | 307 | 231 | 287 | 211 | ||||||||||||
Gross impaired financial assets | 5,196 | 5,581 | 3,810 | 3,933 | ||||||||||||
Individual provisions | ||||||||||||||||
Impaired loans | (1,729 | ) | (1,687 | ) | (1,242 | ) | (1,144) | |||||||||
Non-performing commitments and contingencies | (44 | ) | (10 | ) | (27 | ) | (6) | |||||||||
Net impaired financial assets | 3,423 | 3,884 | 2,541 | 2,783 | ||||||||||||
Accruing loans past due 90 days or more2 | ||||||||||||||||
These amounts are not classified as impaired assets as they are either 90 days or more past due and well secured, or are portfolio managed facilities that can be held on an accrual basis for up to 180 days past due | 1,713 | 1,834 | 1,455 | 1,510 | ||||||||||||
| 1 | Restructured items are facilities in which the original contractual terms have been modified for reasons related to the financial difficulties of the customer. Restructuring may consist of reduction of interest, principal or other payments legally due, or an extension in maturity materially beyond those typically offered to new facilities with similar risk. |
| 2 | Includes unsecured credit card and personal loans 90 day past due accounts which are allowed by APRA to be retained on a performing basis for up to 180 days past due amounting to $127 million (2011: $137 million) for the Group and $104 million (2011: $106 million) for the Company. |
16: Provision for Credit Impairment
| Consolidated | The Company | |||||||||||||||
| Provision movement analysis | 2012 $m | 2011 $m | 2012 $m | 2011 $m | ||||||||||||
New and increased provisions | ||||||||||||||||
Australia | 1,730 | 1,362 | 1,628 | 1,347 | ||||||||||||
New Zealand | 376 | 459 | 16 | 15 | ||||||||||||
Asia Pacific, Europe & America | 187 | 212 | 154 | 80 | ||||||||||||
| 2,293 | 2,033 | �� | 1,798 | 1,442 | ||||||||||||
Write-backs | (537 | ) | (613 | ) | (333 | ) | (402) | |||||||||
| 1,756 | 1,420 | 1,465 | 1,040 | |||||||||||||
Recoveries of amounts previously written off | (214 | ) | (227 | ) | (180 | ) | (203) | |||||||||
Individual provision charge | 1,542 | 1,193 | 1,285 | 837 | ||||||||||||
Impairment on available-for-sale assets | 35 | 37 | 35 | 37 | ||||||||||||
Collective provision charge/(credit) to income statement | (379 | ) | 7 | (335 | ) | 120 | ||||||||||
Charge to income statement | 1,198 | 1,237 | 985 | 994 | ||||||||||||
NOTES TO THE FINANCIAL STATEMENTS 107

16: Provision for Credit Impairment(continued)
Movement in provision for credit impairment by financial asset class
| Liquid assets and due from other financial institutions | Net loans and advances | Other financial assets | Credit related commitments1 | Total provisions | ||||||||||||||||||||||||||||||||
| Consolidated | 2012 $m | 2011 $m | 2012 $m | 2011 $m | 2012 $m | 2011 $m | 2012 $m | 2011 $m | 2012 $m | 2011 $m | ||||||||||||||||||||||||||
Collective provision | ||||||||||||||||||||||||||||||||||||
Balance at start of year | – | – | 2,604 | 2,577 | – | – | 572 | 576 | 3,176 | 3,153 | ||||||||||||||||||||||||||
Adjustment for exchange rate fluctuations and transfers | – | – | (21) | 13 | – | – | (7) | 3 | (28) | 16 | ||||||||||||||||||||||||||
Disposal | – | – | (4) | – | – | – | – | – | (4) | – | ||||||||||||||||||||||||||
Charge/(credit) to income statement | – | – | (343) | 14 | – | – | (36) | (7 | ) | (379) | 7 | |||||||||||||||||||||||||
Total collective provision | – | – | 2,236 | 2,604 | – | – | 529 | 572 | 2,765 | 3,176 | ||||||||||||||||||||||||||
Individual provision | ||||||||||||||||||||||||||||||||||||
Balance at start of year | – | – | 1,687 | 1,849 | – | – | 10 | 26 | 1,697 | 1,875 | ||||||||||||||||||||||||||
New and increased provisions | – | – | 2,259 | 2,049 | – | – | 34 | (16 | ) | 2,293 | 2,033 | |||||||||||||||||||||||||
Write-backs | – | – | (537) | (613 | ) | – | – | – | – | (537) | (613) | |||||||||||||||||||||||||
Adjustment for exchange rate fluctuations | – | – | (34) | 8 | – | – | – | – | (34) | 8 | ||||||||||||||||||||||||||
Discount unwind | – | – | (143) | (185 | ) | – | – | – | – | (143) | (185) | |||||||||||||||||||||||||
Bad debts written off | – | – | (1,503) | (1,421 | ) | – | – | – | – | (1,503) | (1,421) | |||||||||||||||||||||||||
Total individual provision | – | – | 1,729 | 1,687 | – | – | 44 | 10 | 1,773 | 1,697 | ||||||||||||||||||||||||||
Total provision for credit impairment | – | – | 3,965 | 4,291 | – | – | 573 | 582 | 4,538 | 4,873 | ||||||||||||||||||||||||||
| 1 | Comprises undrawn facilities and customer contingent liabilities. |
The table below contains a detailed analysis of the movements in individual provision for net loans and advances.
| Australia | International and Institutional Banking | New Zealand | Global Wealth and Private Banking | Other | Total | |||||||||||||||||||||||||||||||||||||||||||
| Consolidated | 2012 $m | 2011 $m | 2012 $m | 2011 $m | 2012 $m | 2011 $m | 2012 $m | 2011 $m | 2012 $m | 2011 $m | 2012 $m | 2011 $m | ||||||||||||||||||||||||||||||||||||
Individual provision | ||||||||||||||||||||||||||||||||||||||||||||||||
Balance at start of year | 561 | 447 | 709 | 947 | 399 | 436 | 12 | 20 | 6 | (1 | ) | 1,687 | 1,849 | |||||||||||||||||||||||||||||||||||
New and increased provisions | 1,002 | 940 | 925 | 595 | 359 | 454 | 9 | 3 | (36 | ) | 57 | 2,259 | 2,049 | |||||||||||||||||||||||||||||||||||
Write-backs | (202 | ) | (190 | ) | (169 | ) | (234 | ) | (159 | ) | (185) | (4 | ) | (4 | ) | (3 | ) | – | (537 | ) | (613) | |||||||||||||||||||||||||||
Adjustment for exchange rate fluctuations | – | – | (76 | ) | 18 | 5 | 16 | 1 | (1 | ) | 36 | (25 | ) | (34 | ) | 8 | ||||||||||||||||||||||||||||||||
Discount unwind | (21 | ) | (25 | ) | (81 | ) | (98 | ) | (41 | ) | (60) | – | (1 | ) | – | (1 | ) | (143 | ) | (185) | ||||||||||||||||||||||||||||
Bad debts written off | (717 | ) | (611 | ) | (565 | ) | (519 | ) | (215 | ) | (262) | (3 | ) | (5 | ) | (3 | ) | (24 | ) | (1,503 | ) | (1,421) | ||||||||||||||||||||||||||
Total individual provision | 623 | 561 | 743 | 709 | 348 | 399 | 15 | 12 | – | 6 | 1,729 | 1,687 | ||||||||||||||||||||||||||||||||||||
| Consolidated | ||||||||
2012 % | 2011 % | |||||||
Ratios (as a percentage of total gross loans and advances) | ||||||||
Individual provision | 0.41 | 0.42 | ||||||
Collective provision | 0.64 | 0.79 | ||||||
Bad debts written off | 0.35 | 0.35 | ||||||
108

16: Provision for Credit Impairment(continued)
Movement in provision for credit impairment by financial asset class(continued)
| Liquid assets and due from other financial institutions | Net loans and advances | Other financial assets | Credit related commitments1 | Total provisions | ||||||||||||||||||||||||||||||||
| The Company | 2012 $m | 2011 $m | 2012 $m | 2011 $m | 2012 $m | 2011 $m | 2012 $m | 2011 $m | 2012 $m | 2011 $m | ||||||||||||||||||||||||||
Collective provision | ||||||||||||||||||||||||||||||||||||
Balance at start of year | – | – | 2,042 | 1,950 | – | – | 454 | 436 | 2,496 | 2,386 | ||||||||||||||||||||||||||
Adjustment for exchange rate fluctuations and transfers | (8) | (8 | ) | – | – | (11) | (2 | ) | (19) | (10) | ||||||||||||||||||||||||||
Disposal | – | – | (4) | – | – | – | – | – | (4) | – | ||||||||||||||||||||||||||
Change/(credit) to income statement | – | – | (302) | 100 | – | – | (33) | 20 | (335) | 120 | ||||||||||||||||||||||||||
Total collective provision | – | – | 1,728 | 2,042 | – | – | 410 | 454 | 2,138 | 2,496 | ||||||||||||||||||||||||||
Individual provision | ||||||||||||||||||||||||||||||||||||
Balance at start of year | – | – | 1,144 | 1,253 | – | – | 6 | 20 | 1,150 | 1,273 | ||||||||||||||||||||||||||
New and increased provisions | – | – | 1,777 | 1,456 | – | – | 21 | (14 | ) | 1,798 | 1,442 | |||||||||||||||||||||||||
Write-backs | – | – | (333) | (402 | ) | – | – | – | – | (333) | (402) | |||||||||||||||||||||||||
Adjustment for exchange rate fluctuations | – | – | (45) | (3 | ) | – | – | – | – | (45) | (3) | |||||||||||||||||||||||||
Discount unwind | – | – | (91) | (123 | ) | – | – | – | – | (91) | (123) | |||||||||||||||||||||||||
Bad debts written off | – | – | (1,210) | (1,037 | ) | – | – | – | – | (1,210) | (1,037) | |||||||||||||||||||||||||
Total individual provision | – | – | 1,242 | 1,144 | – | – | 27 | 6 | 1,269 | 1,150 | ||||||||||||||||||||||||||
Total provision for credit impairment | – | – | 2,970 | 3,186 | – | – | 437 | 460 | 3,407 | 3,646 | ||||||||||||||||||||||||||
| 1 | Comprises undrawn facilities and customer contingent liabilities. |
| The Company | ||||||||
2012 % | 2011 % | |||||||
Ratios (as a percentage of total gross loans and advances) | ||||||||
Individual provision | 0.36 | 0.35 | ||||||
Collective provision | 0.61 | 0.76 | ||||||
Bad debts written off | 0.34 | 0.32 | ||||||
17: Shares in Controlled Entities and Associates
| Consolidated | The Company | |||||||||||||||
| 2012 $m | 2011 $m | 2012 $m | 2011 $m | |||||||||||||
Total shares in controlled entities | – | – | 11,516 | 9,098 | ||||||||||||
Total shares in associates1 (refer note 39) | 3,520 | 3,513 | 897 | 971 | ||||||||||||
Total shares in controlled entities and associates | 3,520 | 3,513 | 12,413 | 10,069 | ||||||||||||
| 1 | Investments in associates are accounted for using the equity method of accounting by the Group and are carried at cost by the Company. |
Acquisition or disposal of controlled entities
There were no material controlled entities acquired or disposed of during the year ended 30 September 2012 or the year ended 30 September 2011.
NOTES TO THE FINANCIAL STATEMENTS 109

18: Tax Assets
| Consolidated | The Company | |||||||||||||||
2012 $m | 2011 $m | 2012 $m | 2011 $m | |||||||||||||
Australia | ||||||||||||||||
Current tax asset | 13 | 25 | 13 | 25 | ||||||||||||
Deferred tax asset | 520 | 276 | 610 | 372 | ||||||||||||
| 533 | 301 | 623 | 397 | |||||||||||||
New Zealand | ||||||||||||||||
Current tax asset | 20 | – | – | – | ||||||||||||
Deferred tax asset | 73 | 98 | 6 | 6 | ||||||||||||
| 93 | 98 | 6 | 6 | |||||||||||||
Asia Pacific, Europe & America | ||||||||||||||||
Current tax asset | – | 16 | – | 15 | ||||||||||||
Deferred tax asset | 192 | 225 | 152 | 174 | ||||||||||||
| 192 | 241 | 152 | 189 | |||||||||||||
Total current and deferred tax assets | 818 | 640 | 781 | 592 | ||||||||||||
Total current tax assets | 33 | 41 | 13 | 40 | ||||||||||||
Total deferred tax assets | 785 | 599 | 768 | 552 | ||||||||||||
Deferred tax assets recognised in profit and loss | ||||||||||||||||
Collective provision for loans and advances | 732 | 862 | 578 | 707 | ||||||||||||
Individual provision for impaired loans and advances | 454 | 411 | 333 | 282 | ||||||||||||
Other provisions | 310 | 334 | 188 | 192 | ||||||||||||
Provision for employee entitlements | 154 | 156 | 119 | 123 | ||||||||||||
Policyholder tax assets | 269 | 261 | – | – | ||||||||||||
Other | 349 | 347 | 156 | 148 | ||||||||||||
| 2,268 | 2,371 | 1,374 | 1,452 | |||||||||||||
Deferred tax assets recognised directly in equity | ||||||||||||||||
Defined benefits obligation | 37 | 39 | 14 | 20 | ||||||||||||
Available-for-sale revaluation reserve | – | – | 5 | – | ||||||||||||
| 37 | 39 | 19 | 20 | |||||||||||||
Set-off of deferred tax assets pursuant to set-off provisions1 | (1,520 | ) | (1,811 | ) | (625 | ) | (920) | |||||||||
Net deferred tax assets | 785 | 599 | 768 | 552 | ||||||||||||
Unrecognised deferred tax assets | ||||||||||||||||
The following deferred tax assets will only be recognised if: | ||||||||||||||||
n assessable income is derived of a nature and an amount sufficient to enable the benefit to be realised; n the conditions for deductibility imposed by tax legislation are complied with; and n no changes in tax legislation adversely affect the Group in realising the benefit. | ||||||||||||||||
Unused realised tax losses (on revenue account) | 5 | 5 | – | – | ||||||||||||
Unrealised losses on investments2 | 205 | 386 | – | – | ||||||||||||
Total unrecognised deferred tax assets | 210 | 391 | – | – | ||||||||||||
| 1 | Deferred tax assets and liabilities are set-off where they relate to income tax levied by the same taxation authority on either the same taxable entity or different taxable entities within the same taxable group. |
| 2 | The Group has unrecognised deferred tax assets arising from superannuation funds in OnePath Life Limited. |
110

19: Goodwill and Other Intangible Assets
| Consolidated | The Company | |||||||||||||||
2012 $m | 2011 $m | 2012 $m | 2011 $m | |||||||||||||
Goodwill1 | ||||||||||||||||
Balance at start of the year | 4,163 | 4,086 | 87 | 102 | ||||||||||||
Additions through business combinations | 11 | (5 | ) | 10 | (16) | |||||||||||
Reclassification3 | 7 | – | – | – | ||||||||||||
Impairment/write off expense | (1 | ) | – | – | – | |||||||||||
Foreign currency exchange differences | 32 | 82 | (5 | ) | 1 | |||||||||||
Balance at end of year | 4,212 | 4,163 | 92 | 87 | ||||||||||||
Software | ||||||||||||||||
Balance at start of the year | 1,572 | 1,217 | 1,402 | 1,059 | ||||||||||||
Software capitalised during the period | 786 | 645 | 720 | 549 | ||||||||||||
Amortisation expense | (320 | ) | (249 | ) | (268 | ) | (199) | |||||||||
Impairment/write off expense | (274 | ) | (44 | ) | (239 | ) | (7) | |||||||||
Foreign currency exchange differences | (2 | ) | 3 | (2 | ) | – | ||||||||||
Balance at end of year | 1,762 | 1,572 | 1,613 | 1,402 | ||||||||||||
Cost | 3,502 | 2,850 | 3,180 | 2,553 | ||||||||||||
Accumulated amortisation | (1,537 | ) | (1,273 | ) | (1,372 | ) | (1,146) | |||||||||
Accumulated impairment | (203 | ) | (5 | ) | (195 | ) | (5) | |||||||||
Carrying amount | 1,762 | 1,572 | 1,613 | 1,402 | ||||||||||||
Acquired Portfolio of Insurance and Investment Business | ||||||||||||||||
Balance at start of the year | 1,013 | 1,100 | – | – | ||||||||||||
Amortisation expense | (85 | ) | (89 | ) | – | – | ||||||||||
Foreign currency exchange differences | – | 2 | – | – | ||||||||||||
Balance at end of year | 928 | 1,013 | – | – | ||||||||||||
Cost | 1,179 | 1,179 | – | – | ||||||||||||
Accumulated amortisation | (251 | ) | (166 | ) | – | – | ||||||||||
Carrying amount | 928 | 1,013 | – | – | ||||||||||||
Other intangible assets | ||||||||||||||||
Balance at start of the year | 216 | 227 | 55 | 37 | ||||||||||||
Additions through business combinations | – | 30 | – | 26 | ||||||||||||
Other additions | 5 | 5 | 1 | – | ||||||||||||
Reclassification3 | (7 | ) | – | – | – | |||||||||||
Amortisation expense2 | (24 | ) | (20 | ) | (8 | ) | (8) | |||||||||
Impairment expense | (1 | ) | (13 | ) | – | – | ||||||||||
Derecognised on disposal | (8 | ) | (15 | ) | – | – | ||||||||||
Foreign currency exchange differences | (1 | ) | 2 | (1 | ) | – | ||||||||||
Balance at end of year | 180 | 216 | 47 | 55 | ||||||||||||
Cost | 260 | 272 | 74 | 74 | ||||||||||||
Accumulated amortisation | (76 | ) | (53 | ) | (27 | ) | (19) | |||||||||
Accumulated impairment | (4 | ) | (3 | ) | – | – | ||||||||||
Carrying amount | 180 | 216 | 47 | 55 | ||||||||||||
Total goodwill and other intangible assets | ||||||||||||||||
Net book value | ||||||||||||||||
Balance at start of the year | 6,964 | 6,630 | 1,544 | 1,198 | ||||||||||||
Balance at end of year | 7,082 | 6,964 | 1,752 | 1,544 | ||||||||||||
| 1 | Excludes notional goodwill in equity accounted entities. |
| 2 | Comprises brand names $1 million (2011: $1 million), aligned advisor relationships $6 million (2011: $4 million), distribution agreements and management fee rights $8 million (2011: $4 million), credit card relationships $2 million (2011: $2 million) and other intangibles $7 million (2011: $9 million). The Company comprises distribution agreements and management fee rights $2 million (2011: $2 million), card relationships $2 million (2011: $2 million) and other intangibles $4 million (2011: $4 million). |
| 3 | Reclassification of $7 million from other intangible assets to goodwill. |
NOTES TO THE FINANCIAL STATEMENTS 111

19: Goodwill and Other Intangible Assets(continued)
Goodwill allocated to cash–generating units
The goodwill balance above largely comprises the goodwill purchased on acquisition of NBNZ Holdings Limited in December 2003 (included in the New Zealand division) and ANZ Wealth Australia Limited (formerly OnePath Australia Limited) on 30 November 2009 (included in the Global Wealth and Private Banking division).
The recoverable amount of the CGU to which each goodwill component is allocated is estimated using a market multiple approach as representative of the fair value less cost to sell of each CGU. The price earnings multiples are based on observable multiples reflecting the businesses and markets in which each CGU operates. The earnings are based on the current forecast earnings of the divisions. The aggregate fair value less cost to sell across the Group is compared to the Group’s market capitalisation to validate the conclusion that goodwill is not impaired.
Key assumptions on which management has based its determination of fair value less cost to sell include assumptions as to the market multiples being reflective of the segment’s businesses, cost to sell estimates and the ability to achieve forecast earnings. Changes in assumptions upon which the valuation is based could materially impact the assessment of the recoverable amount of each CGU. As at 30 September 2012, the impairment testing performed did not result in any material impairment being identified.
Following a change to the organisational structure during the year, the operating segments changed from those reported previously and goodwill has been reallocated accordingly.
20: Other Assets1
| Consolidated | The Company | |||||||||||||||
2012 $m | 2011 $m | 2012 $m | 2011 $m | |||||||||||||
Accrued interest/prepaid discounts | 1,433 | 1,323 | 1,087 | 999 | ||||||||||||
Accrued commissions | 144 | 163 | 100 | 112 | ||||||||||||
Prepaid expenses | 232 | 169 | 96 | 74 | ||||||||||||
Insurance contract liabilities ceded (refer to note 48) | 509 | 427 | – | – | ||||||||||||
Outstanding premiums | 273 | 267 | – | – | ||||||||||||
Issued securities settlements | 1,481 | 2,235 | 1,349 | 1,560 | ||||||||||||
Operating leases residual value | 331 | 290 | 321 | 274 | ||||||||||||
Capitalised expenses | 21 | 12 | 21 | 12 | ||||||||||||
Other | 1,199 | 1,510 | 773 | 825 | ||||||||||||
Total other assets | 5,623 | 6,396 | 3,747 | 3,856 | ||||||||||||
| 1 | Previously Regulatory deposits were included in Other Assets. In the current period these have been presented on the face of the Balance Sheet, and comparative information for Other Assets has been restated accordingly. |
21: Premises and Equipment
| Consolidated | The Company | |||||||||||||||
2012 $m | 2011 $m | 2012 $m | 2011 $m | |||||||||||||
Freehold and leasehold land and buildings | ||||||||||||||||
At cost | 1,207 | 1,187 | 696 | 696 | ||||||||||||
Accumulated depreciation | (281 | ) | (251) | (88 | ) | (71) | ||||||||||
| 926 | 936 | 608 | 625 | |||||||||||||
Leasehold improvements | ||||||||||||||||
At cost | 548 | 518 | 373 | 314 | ||||||||||||
Accumulated amortisation | (353 | ) | (325) | (232 | ) | (212) | ||||||||||
| 195 | 193 | 141 | 102 | |||||||||||||
Furniture and equipment | ||||||||||||||||
At cost | 1,327 | 1,283 | 1,084 | 1,041 | ||||||||||||
Accumulated depreciation | (811 | ) | (742) | (633 | ) | (570) | ||||||||||
| 516 | 541 | 451 | 471 | |||||||||||||
Computer equipment | ||||||||||||||||
At cost | 1,244 | 1,177 | 923 | 851 | ||||||||||||
Accumulated depreciation | (895 | ) | (853) | (667 | ) | (628) | ||||||||||
| 349 | 324 | 256 | 223 | |||||||||||||
Capital works in progress | ||||||||||||||||
At cost | 128 | 131 | 78 | 81 | ||||||||||||
Total premises and equipment | 2,114 | 2,125 | 1,534 | 1,502 | ||||||||||||
112

21: Premises and Equipment(continued)
Reconciliations of the carrying amounts for each class of premises and equipment are set out below:
| Consolidated | The Company | |||||||||||||||
2012 $m | 2011 $m | 2012 $m | 2011 $m | |||||||||||||
Freehold and leasehold land and buildings | ||||||||||||||||
Carrying amount at beginning of year | 936 | 1,009 | 625 | 646 | ||||||||||||
Additions1 | 33 | 30 | 5 | – | ||||||||||||
Disposals | (6 | ) | (68) | (2 | ) | (1) | ||||||||||
Depreciation | (35 | ) | (40) | (19 | ) | (20) | ||||||||||
Foreign currency exchange difference | (2 | ) | 5 | (1 | ) | – | ||||||||||
Carrying amount at end of year | 926 | 936 | 608 | 625 | ||||||||||||
Leasehold improvements | ||||||||||||||||
Carrying amount at beginning of year | 193 | 197 | 102 | 110 | ||||||||||||
Additions1 | 64 | 46 | 79 | 22 | ||||||||||||
Disposals | (5 | ) | (2) | (3 | ) | – | ||||||||||
Amortisation | (55 | ) | (49) | (35 | ) | (30) | ||||||||||
Foreign currency exchange difference | (2 | ) | 1 | (2 | ) | – | ||||||||||
Carrying amount at end of year | 195 | 193 | 141 | 102 | ||||||||||||
Furniture and equipment | ||||||||||||||||
Carrying amount at beginning of year | 541 | 567 | 471 | 498 | ||||||||||||
Additions1 | 83 | 72 | 73 | 57 | ||||||||||||
Disposals | (8 | ) | (3) | (7 | ) | (2) | ||||||||||
Depreciation | (99 | ) | (97) | (84 | ) | (81) | ||||||||||
Foreign currency exchange difference | (1 | ) | 2 | (2 | ) | (1) | ||||||||||
Carrying amount at end of year | 516 | 541 | 451 | 471 | ||||||||||||
Computer equipment | ||||||||||||||||
Carrying amount at beginning of year | 324 | 317 | 223 | 224 | ||||||||||||
Additions1 | 137 | 104 | 108 | 64 | ||||||||||||
Disposals | (6 | ) | (1) | (5 | ) | – | ||||||||||
Depreciation | (104 | ) | (99) | (69 | ) | (67) | ||||||||||
Foreign currency exchange difference | (2 | ) | 3 | (1 | ) | 2 | ||||||||||
Carrying amount at end of year | 349 | 324 | 256 | 223 | ||||||||||||
Capital works in progress | ||||||||||||||||
Carrying amount at beginning of year | 131 | 68 | 81 | 30 | ||||||||||||
Net transfers/additions | (3 | ) | 63 | (3 | ) | 51 | ||||||||||
Carrying amount at end of year | 128 | 131 | 78 | 81 | ||||||||||||
Total premises and equipment | 2,114 | 2,125 | 1,534 | 1,502 | ||||||||||||
| 1 | Includes transfers. |
NOTES TO THE FINANCIAL STATEMENTS 113

22: Due to Other Financial Institutions
| Consolidated | The Company | |||||||||||||||
2012 $m | 2011 $m | 2012 $m | 2011 $m | |||||||||||||
Deposits from central banks | 13,185 | 8,789 | 13,026 | 8,750 | ||||||||||||
Cash collateral | 2,531 | 4,524 | 2,326 | 3,365 | ||||||||||||
Other | 14,822 | 14,222 | 13,042 | 12,594 | ||||||||||||
Total due to other financial institutions | 30,538 | 27,535 | 28,394 | 24,709 | ||||||||||||
23: Deposits and Other Borrowings
| ||||||||||||||||
| Consolidated | The Company | |||||||||||||||
2012 $m | 2011 $m | 2012 $m | 2011 $m | |||||||||||||
Certificates of deposit | 56,838 | 55,554 | 55,326 | 53,904 | ||||||||||||
Term deposits | 172,313 | 153,200 | 141,042 | 123,625 | ||||||||||||
Other deposits bearing interest and other borrowings | 142,753 | 132,812 | 122,794 | 113,182 | ||||||||||||
Deposits not bearing interest | 11,782 | 11,334 | 6,556 | 5,974 | ||||||||||||
Commercial paper | 12,164 | 14,333 | 7,818 | 10,569 | ||||||||||||
Borrowing corporations’ debt1 | 1,273 | 1,496 | – | – | ||||||||||||
Total deposits and other borrowings | 397,123 | 368,729 | 333,536 | 307,254 | ||||||||||||
| 1 | Included in this balance is debenture stock of $0.1 billion (September 2011: $0.2 billion) of Esanda Finance Corporation Limited (Esanda), together with accrued interest thereon which is secured by a trust deed and collateral debentures, giving floating charges upon the undertaking and all the assets of the entity $0.4 billion (September 2011: $0.6 billion) other than land and buildings. All controlled entities of Esanda have guaranteed the payment of principal, interest and other monies in relation to all debenture stock and unsecured notes issued by Esanda. The only loans pledged as collateral are those in Esanda and its subsidiaries. Effective from 18 March 2009, Esanda ceased to write new debentures and since September 2009 stopped writing new loans. |
In addition, this balance also includes NZD 1.5 billion (September 2011: NZD 1.5 billion) of secured debenture stock of the consolidated subsidiary UDC Finance Limited (UDC), and the accrued interest thereon, which are secured by a floating charge over all assets of UDC NZD 2.1 billion (September 2011: NZD 2.0 billion).
114

24: Income Tax Liabilities
| Consolidated | The Company | |||||||||||||||
2012 $m | 2011 $m | 2012 $m | 2011 $m | |||||||||||||
Australia | ||||||||||||||||
Current tax payable | 660 | 1,007 | 660 | 1,007 | ||||||||||||
Deferred tax liabilities | – | – | – | – | ||||||||||||
| 660 | 1,007 | 660 | 1,007 | |||||||||||||
New Zealand | ||||||||||||||||
Current tax payable | – | 3 | 15 | 16 | ||||||||||||
Deferred tax liabilities | – | – | – | – | ||||||||||||
| – | 3 | 15 | 16 | |||||||||||||
Asia Pacific, Europe & America | ||||||||||||||||
Current tax payable | 121 | 118 | 51 | 56 | ||||||||||||
Deferred tax liabilities | 18 | 28 | 12 | 27 | ||||||||||||
| 139 | 146 | 63 | 83 | |||||||||||||
Total current and deferred income tax liability | 799 | 1,156 | 738 | 1,106 | ||||||||||||
Total current tax payable | 781 | 1,128 | 726 | 1,079 | ||||||||||||
Total deferred income tax liabilities | 18 | 28 | 12 | 27 | ||||||||||||
Deferred tax liabilities recognised in profit and loss | ||||||||||||||||
Acquired portfolio of insurance and investment business | 278 | 303 | – | – | ||||||||||||
Insurance related deferred acquisition costs | 99 | 79 | – | – | ||||||||||||
Lease finance | 230 | 229 | 59 | 90 | ||||||||||||
Treasury instruments | 149 | 317 | 148 | 319 | ||||||||||||
Capitalised expenses | 46 | 76 | 46 | 79 | ||||||||||||
Other | 570 | 701 | 345 | 435 | ||||||||||||
| 1,372 | 1,705 | 598 | 923 | |||||||||||||
Deferred tax liabilities recognised directly in equity | ||||||||||||||||
Cash flow hedges | 82 | 65 | 39 | 22 | ||||||||||||
Foreign currency translation reserve | 38 | 37 | – | – | ||||||||||||
Available-for-sale revaluation reserve | 46 | 32 | – | 2 | ||||||||||||
| 166 | 134 | 39 | 24 | |||||||||||||
Set-off of deferred tax liabilities pursuant to set-off provision1 | (1,520) | (1,811) | (625) | (920 | ) | |||||||||||
Net deferred tax liability | 18 | 28 | 12 | 27 | ||||||||||||
Unrecognised deferred tax liabilities | ||||||||||||||||
The following deferred tax liabilities have not been bought to account as liabilities: | �� | |||||||||||||||
Other unrealised taxable temporary differences2 | 163 | 126 | 23 | 17 | ||||||||||||
Total unrecognised deferred tax liabilities | 163 | 126 | 23 | 17 | ||||||||||||
1 Deferred tax assets and liabilities are set-off where they relate to income tax levied by the same taxation authority on either the same taxable entity or different taxable entities within the same taxable group. |
| |||||||||||||||
2 Represents additional potential foreign tax costs should all retained earnings in offshore branches and subsidiaries be repatriated. |
| |||||||||||||||
25: Payables and Other Liabilities
|
| |||||||||||||||
| Consolidated | The Company | |||||||||||||||
2012 $m | 2011 $m | 2012 $m | 2011 $m | |||||||||||||
Creditors | 984 | 896 | 468 | 308 | ||||||||||||
Accrued interest and unearned discounts | 2,539 | 2,735 | 2,032 | 2,212 | ||||||||||||
Defined benefits plan obligations | 149 | 148 | 67 | 82 | ||||||||||||
Accrued expenses | 1,478 | 1,413 | 1,174 | 1,127 | ||||||||||||
Security settlements | 1,115 | 2,026 | 915 | 1,219 | ||||||||||||
Other Liabilities | 2,605 | 3,033 | 1,886 | 2,060 | ||||||||||||
Liability for acceptances1 | 1,239 | 970 | 1,012 | 688 | ||||||||||||
Total payables and other liabilities | 10,109 | 11,221 | 7,554 | 7,696 | ||||||||||||
1 Previously customer liability for acceptances was presented as a separate balance on the face of the Balance Sheet; comparatives for Payables and Other Liabilities have been restated accordingly. |
| |||||||||||||||
NOTES TO THE FINANCIAL STATEMENTS 115

26: Provisions
| Consolidated | The Company | |||||||||||||||
| 2012 $m | 2011 $m | 2012 $m | 2011 $m | |||||||||||||
Employee entitlements1 | 533 | 540 | 404 | 418 | ||||||||||||
Restructuring costs and surplus leased space2 | 140 | 135 | 51 | 78 | ||||||||||||
Non-lending losses, frauds and forgeries | 163 | 205 | 139 | 149 | ||||||||||||
Other | 365 | 368 | 151 | 153 | ||||||||||||
| 1,201 | 1,248 | 745 | 798 | |||||||||||||
Reconciliations of the carrying amounts of each class of provision, except for employee entitlements, are set out below:
|
| |||||||||||||||
| Consolidated | The Company | |||||||||||||||
| 2012 $m | 2011 $m | 2012 $m | 2011 $m | |||||||||||||
Restructuring costs and surplus leased space2 | ||||||||||||||||
Carrying amount at beginning of the year | 135 | 119 | 78 | 100 | ||||||||||||
Provisions made during the year | 189 | 148 | 82 | 23 | ||||||||||||
Payments made during the year | (157 | ) | (125 | ) | (86 | ) | (53) | |||||||||
Transfer/release of provision | (27 | ) | (7 | ) | (23 | ) | 8 | |||||||||
Carrying amount at the end of the year | 140 | 135 | �� | 51 | 78 | |||||||||||
Non-lending losses, frauds and forgeries | ||||||||||||||||
Carrying amount at beginning of the year | 205 | 188 | 149 | 153 | ||||||||||||
Provisions made during the year | 29 | 53 | 17 | 27 | ||||||||||||
Payments made during the year | (16 | ) | (17 | ) | (6 | ) | (3) | |||||||||
Transfer/release of provision | (55 | ) | (19 | ) | (21 | ) | (28) | |||||||||
Carrying amount at the end of the year | 163 | 205 | 139 | 149 | ||||||||||||
Other provisions3 | ||||||||||||||||
Carrying amount at beginning of the year | 368 | 493 | 153 | 220 | ||||||||||||
Provisions made during the year | 353 | 350 | 75 | 81 | ||||||||||||
Payments made during the year | (305 | ) | (333 | ) | (30 | ) | (34) | |||||||||
Transfer/release of provision | (51 | ) | (142 | ) | (47 | ) | (114) | |||||||||
Carrying amount at the end of the year | 365 | 368 | 151 | 153 | ||||||||||||
| 1 | The aggregate liability for employee entitlements largely comprises provisions for annual leave and long service leave. |
| 2 | Restructuring costs and surplus leased space provisions arise from activities related to material changes in the scope of business undertaken by the Group or the manner in which that business is undertaken and includes termination benefits. Costs relating to on-going activities are not provided for. Provision is made when the Group is demonstrably committed, it is probable that the costs will be incurred, though their timing is uncertain, and the costs can be reliably estimated. |
| 3 | Other provisions comprise various other provisions including loyalty programs, workers’ compensation, make-good provisions on leased premises and contingent liabilities recognised as part of a business combination. |
27: Bonds and Notes
ANZ utilises a variety of established and flexible funding programmes issuing medium term notes featuring either senior or subordinated debt status (details of subordinated debt are presented in note 28: Loan Capital). All risks associated with originating term funding are closely managed. Refer to description of ANZ risk management practices in note 33 Financial Risk Management in relation to market risks such as interest rate and foreign currency risks, as well as liquidity risk.
The table below presents Bonds and Notes by currency of issue which broadly is representative of the investor base location.
| Consolidated | The Company | |||||||||||||||||
2012 $m | 2011 $m | 2012 $m | 2011 $m | |||||||||||||||
Bonds and notes by currency | ||||||||||||||||||
USD | United States dollars | 27,035 | 29,089 | 20,718 | 21,321 | |||||||||||||
GBP | Great British pounds | 2,114 | 1,782 | 1,725 | 917 | |||||||||||||
AUD | Australian dollars | 6,054 | 1,701 | 5,691 | 1,897 | |||||||||||||
NZD | New Zealand dollars | 2,531 | 2,148 | 392 | 325 | |||||||||||||
JPY | Japanese yen | 9,532 | 8,555 | 9,167 | 8,230 | |||||||||||||
EUR | Euro | 9,109 | 7,679 | 7,256 | 7,679 | |||||||||||||
HKD | Hong Kong dollars | 1,422 | 2,265 | 1,310 | 2,125 | |||||||||||||
CHF | Swiss francs | 3,253 | 2,218 | 1,823 | 1,420 | |||||||||||||
CAD | Canadian dollar | 857 | 800 | 857 | 800 | |||||||||||||
NOK | Norwegian krone | 557 | 47 | 557 | 47 | |||||||||||||
SGD | Singapore dollars | 265 | 235 | 110 | 77 | |||||||||||||
CNH | Chinese yuan | 179 | 32 | 179 | 32 | |||||||||||||
Other | 190 | – | 190 | – | ||||||||||||||
Total bonds and notes | 63,098 | 56,551 | 49,975 | 44,870 | ||||||||||||||
116

28: Loan Capital
| Consolidated | The Company | |||||||||||||||||||
2012 $m | 2011 $m | 2012 $m | 2011 $m | |||||||||||||||||
Hybrid loan capital (subordinated) | ||||||||||||||||||||
US Trust Securities | 752 | 835 | 715 | 768 | ||||||||||||||||
UK Stapled Securities1 | – | 720 | – | 720 | ||||||||||||||||
ANZ Convertible Preference Shares (ANZ CPS)2 | ||||||||||||||||||||
ANZ CPS1 | 1,078 | 1,075 | 1,078 | 1,075 | ||||||||||||||||
ANZ CPS2 | 1,958 | 1,954 | 1,958 | 1,954 | ||||||||||||||||
ANZ CPS3 | 1,326 | 1,322 | 1,326 | 1,322 | ||||||||||||||||
| 5,114 | 5,906 | 5,077 | 5,839 | |||||||||||||||||
Perpetual subordinated notes | ||||||||||||||||||||
USD | 300m | floating rate notes | 287 | 308 | 287 | 308 | ||||||||||||||
NZD | 835m | fixed rate notes3 | 666 | 656 | – | – | ||||||||||||||
| 953 | 964 | 287 | 308 | |||||||||||||||||
Subordinated notes | ||||||||||||||||||||
USD | 250m | floating rate notes due 20164 | – | 257 | – | 257 | ||||||||||||||
AUD | 350m | fixed rate notes due 20174 | – | 342 | – | 350 | ||||||||||||||
AUD | 350m | floating rate notes due 20174 | – | 347 | – | 350 | ||||||||||||||
AUD | 100m | fixed rate notes due 20174 | – | 100 | – | 100 | ||||||||||||||
AUD | 100m | floating rate notes due 20174 | – | 100 | – | 100 | ||||||||||||||
GBP | 175m | fixed rate notes due 20174 | – | 292 | – | 292 | ||||||||||||||
NZD | 250m | fixed rate notes due 20175 | – | 195 | – | – | ||||||||||||||
NZD | 350m | fixed rate notes due 20175 | – | 275 | – | – | ||||||||||||||
AUD | 290m | fixed rate notes due 20175 | 285 | 289 | 290 | 289 | ||||||||||||||
AUD | 310m | floating rate notes due 20174 | 297 | 310 | 310 | 310 | ||||||||||||||
GBP | 400m | fixed rate notes due 20185 | 633 | 638 | 633 | 638 | ||||||||||||||
AUD | 365m | floating rate notes due 20184 | 355 | 359 | 365 | 365 | ||||||||||||||
AUD | 500m | floating rate notes due 20184 | 500 | 500 | 500 | 500 | ||||||||||||||
EUR | 750m | fixed rate notes due 2019 | 1,057 | 1,119 | 1,060 | 1,119 | ||||||||||||||
AUD | 500m | floating rate notes due 20224 | 500 | – | 500 | – | ||||||||||||||
AUD | 1,509m | floating rate notes due 20224 | 1,505 | – | 1,509 | – | ||||||||||||||
USD | 750m | fixed rate notes due 20224 | 715 | – | 715 | – | ||||||||||||||
| 5,847 | 5,123 | 5,882 | 4,670 | |||||||||||||||||
Total loan capital | 11,914 | 11,993 | 11,246 | 10,817 | ||||||||||||||||
Loan capital by currency | ||||||||||||||||||||
AUD | Australian dollars | 7,804 | 6,698 | 7,836 | 6,715 | |||||||||||||||
NZD | New Zealand dollars | 666 | 1,126 | – | – | |||||||||||||||
USD | United States dollars | 1,754 | 1,400 | 1,717 | 1,333 | |||||||||||||||
GBP | Great British pounds | 633 | 1,650 | 633 | 1,650 | |||||||||||||||
EUR | Euro | 1,057 | 1,119 | 1,060 | 1,119 | |||||||||||||||
| 11,914 | 11,993 | 11,246 | 10,817 | |||||||||||||||||
1 The UK stapled securities were bought back and cancelled on 15 June 2012. |
| |||||||||||||||||||
2 Fully franked preference share dividends recognised as interest expense during the year ended 30 September 2012: |
| |||||||||||||||||||
| Consolidated | The Company | |||||||||||||||||
| 2012 $m | 2011 $m | 2012 $m | 2011 $m | |||||||||||||||
ANZ CPS1 | 53 | 57 | 53 | 57 | ||||||||||||||
ANZ CPS2 | 105 | 111 | 105 | 111 | ||||||||||||||
ANZ CPS3 (issued in September 2011) | 67 | – | 67 | – | ||||||||||||||
| 3 | Fixed until the first call date, 18 April 2013, whereupon the rate resets to the five year swap rate +2.00% if not called and remains fixed until the next call date, 18 April 2018, whereupon, if not called, reverts to a floating rate at the three month FRA rate +3.00% and is callable on any interest payment date thereafter. | |||||||||||||
| 4 | Callable five years prior to maturity. | |||||||||||||
| 5 | Callable five years prior to maturity and reverts to floating rate if not called. | |||||||||||||
NOTES TO THE FINANCIAL STATEMENTS 117

28: Loan Capital(continued)
Loan capital is subordinated in right of payment to the claims of depositors and other creditors of the Company and its controlled entities which have issued the notes. As defined by APRA for capital adequacy purposes, the US Trust Securities currently constitute Innovative Residual Tier 1 capital, whereas the UK Stapled Securities constituted and each of the ANZ CPS currently constitute Non-innovative Residual Tier 1 capital, all other subordinated notes constitute Tier 2 capital. The loan capital outstanding on 31 December 2012 is expected to be eligible for transitional Basel III treatment from 1 January 2013 as agreed with APRA.
US TRUST SECURITIES
On 27 November 2003, the Company issued 750,000 non-cumulative Trust Securities (‘US Trust Securities’) at USD1,000 each raising USD750 million. US Trust Securities comprise an interest paying unsecured note and a preference share, which are stapled together and issued by ANZ Capital Trust II (the ‘Trust’).
Dividends are not payable on the preference share while it is stapled to the note. Distributions on US Trust Securities are non-cumulative and are payable half yearly in arrears at a fixed rate of 5.36%. Distributions are subject to certain payment tests (i.e. APRA requirements and distributable profits being available) and are expected to be payable on 15 June and 15 December of each year. If distributions are not paid on the US Trust Securities, the Group may not pay dividends or distributions, or return capital, on ANZ ordinary shares or any other share capital or security ranking equal or junior to the preference share component (subject to certain exceptions).
On 15 December 2013 and at any coupon date thereafter, ANZ has the discretion to redeem the US Trust Securities for cash. If it does not exercise this discretion, the investor is entitled to exchange the US Trust Security into a variable number of ANZ ordinary shares at a 5% discount.
At any time at the Company’s discretion or upon the occurrence of certain other ‘conversion events’, the notes that are represented by the US Trust Securities will be automatically assigned to a subsidiary of the Company and the preference shares that are represented by the US Trust Securities will be distributed to investors on redemption of such US Trust Securities. The distributed preference shares will immediately become dividend paying and holders will receive non-cumulative dividends equivalent to the scheduled
payments in respect of the US Trust Securities. If the US Trust Securities are not redeemed or bought back prior to the 15 December 2053, they will be converted into preference shares, which in turn will be mandatorily converted into a variable number of ANZ ordinary shares.
The preference share forming part of the US Trust Securities confers protective voting rights that allow the holder to vote in the Company, in limited circumstances, such as a capital reduction, Company restructure involving a disposal of the whole of the Company’s business and undertaking, proposals affecting rights attached to the preference shares, and similar.
On winding up of the Company, the rights of US Trust Security holders will be determined by the preference share component of US Trust Security. The preference shares forming part of the US Trust Securities and rank equally with each of the ANZ CPS and the preferences shares issued in connection with the Euro Trust Securities.
UK STAPLED SECURITIES
On 15 June 2007, the Company issued 9,000 non-cumulative, mandatory convertible stapled securities (‘UK Stapled Securities’) at £50,000 each raising £450 million. UK Stapled Securities comprised an interest paying unsecured subordinated £50,000 note and a £50,000 preference share, which were stapled together.
Dividends were not payable on a preference share while it was stapled to a note. Distributions on UK Stapled Securities were non-cumulative and were payable half yearly in arrears at a fixed rate of 6.54%. Distributions were subject to certain payment tests (including APRA requirements and distributable profits being available). Distributions were payable on 15 June and 15 December of each year. If distributions were not paid on UK Stapled Securities, the Group may not pay dividends or distributions, or returning capital, on ANZ ordinary shares or any other share capital or security ranking equal or junior to the preference share component (subject to certain exceptions).
The preference shares forming part of the UK Stapled Securities ranked equally with each of the ANZ CPS and the preference shares issued in connection with US Trust Securities and Euro Trust Securities.
On 15 June 2012 the UK Stapled Securities were bought back and cancelled by ANZ.
118

28: Loan Capital(continued)
ANZ CONVERTIBLE PREFERENCE SHARES (ANZ CPS)
| n | On 30 September 2008, the Company issued 10.8 million convertible preference shares (‘ANZ CPS1’) at $100 each, raising $1,081 million before issue costs. |
| n | On 17 December 2009, the Company issued 19.7 million convertible preference shares (‘ANZ CPS2’) at $100 each, raising $1,969 million before issue costs. |
| n | On 28 September 2011, the Company issued 13.4 million convertible preference shares (‘ANZ CPS3’) at $100 each raising $1,340 million before issue costs. |
ANZ CPS are fully paid, preferred, non-cumulative, mandatorily convertible preference shares. ANZ CPS are listed on the Australian Stock Exchange.
Dividends on ANZ CPS are non-cumulative and are payable quarterly in arrears in December, March, June and September (in the case of ANZ CPS1 and ANZ CPS2) and semi-annually in arrears in March and September (in the case of ANZ CPS3) in each year and will be franked in line with the franking applied to ANZ ordinary shares. The dividends will be based on a floating rate equal to the aggregate of the 90 day bank bill rate plus a 250 basis point margin (ANZ CPS1) and a 310 basis point margin (ANZ CPS2) and the 180 day bank bill rate plus 310 basis point margin (ANZ CPS3), multiplied by one minus the Australian Company tax rate. Should the dividend not be fully franked, the terms of the securities provide for a cash gross up for the amount of the franking benefit not provided. Dividends are subject to the absolute discretion of the Board of Directors of the Company and certain payment tests (including APRA requirements and distributable profits being available). If dividends are not paid on
ANZ CPS, the Group may not pay dividends or distributions, or return capital, on ANZ ordinary shares or (in the case of ANZ CPS1 and ANZ CPS2 only) any other share capital or security ranking equal or junior to the ANZ CPS for a specified period (subject to certain exceptions).
On 16 June 2014 (ANZ CPS1), 15 December 2016 (ANZ CPS2) or 1 September 2019 (ANZ CPS3) (each a ‘conversion date’), or an earlier date under certain circumstances, the relevant ANZ CPS will mandatorily convert into a variable number of ANZ ordinary shares based on the average market price of ordinary shares less a 2.5% discount (ANZ CPS1) or 1.0% discount (ANZ CPS2 and ANZ CPS3).
The mandatory conversion to ANZ ordinary shares is however deferred for a specified period if the conversion tests are not met.
In respect of ANZ CPS3 only, if a common equity trigger event occurs the ANZ CPS3 will immediately convert into ANZ ordinary shares, subject to a maximum conversion number of 10.2407 ANZ ordinary shares per ANZ CPS3. A common equity capital trigger event occurs if ANZ’s Common Equity Tier 1 capital ratio is equal to or less than 5.125%.
In respect of ANZ CPS3 only, on 1 September 2017 and each subsequent semi annual Dividend Payment Date, subject to receiving APRA’s prior approval and satisfying certain conditions, the Company has the right to redeem or convert into ANZ ordinary shares all or some ANZ CPS3 at its discretion on the same terms as mandatory conversion on a conversion date.
The ANZ CPS rank equally with each other and the preference shares issued in connection with US Trust Securities and Euro Trust Securities. Except in limited circumstances, holders of ANZ CPS do not have any right to vote in general meetings of the Company.
NOTES TO THE FINANCIAL STATEMENTS 119

29: Share Capital
| The Company | ||||||||
| Numbers of issued shares | 2012 | 2011 | ||||||
Ordinary shares each fully paid | 2,717,356,961 | 2,629,034,037 | ||||||
Preference shares each fully paid | 500,000 | 500,000 | ||||||
Total number of issued shares | 2,717,856,961 | 2,629,534,037 | ||||||
ORDINARY SHARES
Ordinary shares have no par value and entitle holders to receive dividends payable to ordinary shareholders and to participate in the proceeds available to ordinary shareholders on winding up of the Company in proportion to the number of fully paid ordinary shares held.
On a show of hands every holder of fully paid ordinary shares present at a meeting in person or by proxy is entitled to one vote, and upon a poll one vote for each share held.
| The Company | ||||||||
| Numbers of issued shares | 2012 | 2011 | ||||||
Balance at start of the year | 2,629,034,037 | 2,559,662,425 | ||||||
Bonus option plan1 | 4,090,494 | 3,013,239 | ||||||
Dividend reinvestment plan1 | 74,110,965 | 61,685,747 | ||||||
ANZ employee share acquisition plan2 | 6,983,162 | 2,340,296 | ||||||
ANZ share option plan2 | 3,138,303 | 2,332,330 | ||||||
Balance at end of year | 2,717,356,961 | 2,629,034,037 | ||||||
| Consolidated | The Company | |||||||||||||||
| 2012 $m | 2011 $m | 2012 $m | 2011 $m | |||||||||||||
Ordinary share capital | ||||||||||||||||
Balance at start of the year | 21,343 | 19,886 | 21,701 | 20,246 | ||||||||||||
Dividend reinvestment plan1 | 1,461 | 1,367 | 1,461 | 1,367 | ||||||||||||
ANZ employee share acquisition plan2,3 | 128 | 45 | 128 | 45 | ||||||||||||
OnePath Australia Treasury shares4 | 78 | 2 | – | – | ||||||||||||
ANZ share option plan2 | 60 | 43 | 60 | 43 | ||||||||||||
Balance at end of year | 23,070 | 21,343 | 23,350 | 21,701 | ||||||||||||
NON-CONTROLLING INTERESTS
| Consolidated | ||||||||
| 2012 $m | 2011 $m | |||||||
Share capital | 40 | 43 | ||||||
Retained profit | 9 | 5 | ||||||
Total non-controlling interests | 49 | 48 | ||||||
| 1 | Refer to note 7 for details of plan. |
| 2 | Refer to note 45 for details of plan. |
| 3 | Includes on-market purchase of shares for settlement of amounts due under share-based compensation plans. In addition, 6,983,162 shares were issued during the year ended 30 September 2012 to the Group’s Employee Share Trust for settlement of amounts due under share-based compensation plans (2011: 2,340,296). As at 30 September 2012, there were 15,673,505 Treasury Shares outstanding (2011: 13,795,601). |
| 4 | ANZ acquired OnePath Australia Limited (OPA) on 30 November 2009. OPA Treasury Shares include shares held in statutory funds as assets backing policyholder liabilities. OPA Treasury Shares outstanding as at 30 September 2012 were 13,081,042 (2011: 16,469,102). |
120

29: Share Capital(continued)
PREFERENCE SHARES
Euro Trust Securities
On 13 December 2004, the Company issued 500,000 Euro Floating Rate Non-cumulative Trust Securities (‘Euro Trust Securities’) at€1,000 each, raising $871 million net of issue costs. Euro Trust Securities comprise an interest paying unsecured note and a€1,000 preference share, which are stapled together and issued as a Euro Trust Security by ANZ Capital Trust III (the Trust). Investors have the option to redeem the Euro Trust Security from the Trust and hold the underlying stapled security.
Dividends are not payable on the preference shares while they are stapled to the note, except for the period after 15 December 2014 when the preference share will pay 100 basis points in addition to the distributions on the note. Distributions on Euro Trust Securities are non-cumulative and are payable quarterly in arrears. The distributions are based upon a floating rate equal to the three month EURIBOR rate plus a 66 basis point margin up until 15 December 2014, after which date the distribution rate is the three month EURIBOR rate plus a 166 basis point margin. At each payment date the three month EURIBOR rate is reset for the next quarter.
Distributions are subject to certain payment tests (i.e. APRA requirements and distributable profits being available). Distributions are expected to be payable on 15 March, 15 June, 15 September and 15 December of each year. If distributions are not paid on Euro Trust Securities, the Group may not pay dividends or distributions, or return capital on ANZ ordinary shares or any other share capital or security ranking equal or junior to the preference share component (subject to certain exceptions).
At any time at ANZ’s discretion or upon the occurrence of certain other ‘conversion events’, the notes that are represented by the relevant Euro Trust Securities will be automatically assigned to a branch of the Company and the preference shares that are represented by the relevant Euro Trust Securities will be distributed to investors in redemption of such Euro Trust Securities. The distributed preference shares will immediately become dividend paying and holders will receive non-cumulative dividends equivalent to the scheduled payments in respect of the Euro Trust Securities.
The preference share forming part of the Euro Trust Securities confers protective voting rights that allow the holder to vote in the Company, in limited circumstances, such as a capital reduction, Company restructure involving a disposal of the whole of the Company’s business and undertaking, proposals affecting rights attached to the preference shares, and similar.
On winding up of the Company, the rights of Euro Trust Security holders will be determined by the preference share component of the Euro Trust Security. These preference shares rank behind all depositors and creditors, but ahead of ordinary shareholders.
The preference shares forming each part of each Euro Trust Security rank equally with each of the ANZ CPS and the preferences shares issued in connection with the US Trust Securities.
Euro Trust Securities currently qualify as Innovative Residual Tier 1 Capital as defined by APRA, for capital adequacy purposes and are expected to be eligible for transitional Basel III treatment from 1 January 2013 as agreed with APRA.
| Consolidated | The Company | |||||||||||||||
| 2012 $m | 2011 $m | 2012 $m | 2011 $m | |||||||||||||
Preference share balance at start of year | ||||||||||||||||
– Euro Trust Securities | 871 | 871 | 871 | 871 | ||||||||||||
Preference share balance at end of year | ||||||||||||||||
– Euro Trust Securities | 871 | 871 | 871 | 871 | ||||||||||||
NOTES TO THE FINANCIAL STATEMENTS 121

30: Reserves and Retained Earnings
| Consolidated | The Company | |||||||||||||||
2012 $m | 2011 $m | 2012 $m | 2011 $m | |||||||||||||
a) Foreign currency translation reserve | ||||||||||||||||
Balance at beginning of the year | (2,418 | ) | (2,742 | ) | (676 | ) | (773 | ) | ||||||||
Currency translation adjustments, net of hedges after tax | (413 | ) | 324 | (174 | ) | 97 | ||||||||||
Total foreign currency translation reserve | (2,831 | ) | (2,418 | ) | (850 | ) | (676 | ) | ||||||||
b) Share option reserve1 | ||||||||||||||||
Balance at beginning of the year | 50 | 64 | 50 | 64 | ||||||||||||
Share-based payments/(exercises) | 6 | (13 | ) | 6 | (13 | ) | ||||||||||
Transfer of options/rights lapsed to retained earnings2 | (2 | ) | (1 | ) | (2 | ) | (1 | ) | ||||||||
Total share option reserve | 54 | 50 | 54 | 50 | ||||||||||||
c) Available-for-sale revaluation reserve | ||||||||||||||||
Balance at beginning of the year | 126 | 80 | 35 | 5 | ||||||||||||
Valuation gain/(loss) recognised after tax | 193 | 30 | 110 | (13 | ) | |||||||||||
Cumulative (gain)/loss transferred to the income statement | (225 | ) | 16 | (124 | ) | 43 | ||||||||||
Total available-for-sale revaluation reserve | 94 | 126 | 21 | 35 | ||||||||||||
d) Hedging reserve | ||||||||||||||||
Balance at beginning of the year | 169 | 11 | 47 | (73 | ) | |||||||||||
Gains/(loss) recognised after tax | 27 | 164 | 23 | 128 | ||||||||||||
Transfer (to)/from income statement | 12 | (6 | ) | 19 | (8 | ) | ||||||||||
Total hedging reserve | 208 | 169 | 89 | 47 | ||||||||||||
e) Transactions with non-controlling interests reserve | ||||||||||||||||
Balance at beginning of the year | (22 | ) | – | – | – | |||||||||||
Transactions with non-controlling interests3 | (1 | ) | (22 | ) | – | – | ||||||||||
Total transactions with non-controlling interests reserve | (23 | ) | (22 | ) | – | – | ||||||||||
Total reserves | (2,498 | ) | (2,095 | ) | (686 | ) | (544 | ) | ||||||||
1 Further information about share-based payments to employees is disclosed in note 45. |
| |||||||||||||||
2 The transfer of balances from the share option reserve to retained earnings represents items of a distributable nature. |
| |||||||||||||||
3 The premium in excess of the book value paid to acquire an additional interest in a controlled entity from the non-controlling shareholder.
|
| |||||||||||||||
| Consolidated | The Company | |||||||||||||||
2012 $m | 2011 $m | 2012 $m | 2011 $m | |||||||||||||
Retained earnings | ||||||||||||||||
Balance at beginning of the year | 17,787 | 15,921 | 12,351 | 11,666 | ||||||||||||
Profit attributable to shareholders of the Company | 5,661 | 5,355 | 4,875 | 4,151 | ||||||||||||
Transfer of options/rights lapsed from share option reserve1,2 | 2 | 1 | 2 | 1 | ||||||||||||
Actuarial gain/(loss) on defined benefit plans after tax3 | (44 | ) | (10 | ) | (29 | ) | 24 | |||||||||
Dividend income on Treasury shares | 24 | 23 | – | – | ||||||||||||
Ordinary share dividends paid | (3,691 | ) | (3,491 | ) | (3,691 | ) | (3,491 | ) | ||||||||
Preference share dividends paid | (11 | ) | (12 | ) | – | – | ||||||||||
Retained earnings at end of year | 19,728 | 17,787 | 13,508 | 12,351 | ||||||||||||
Total reserves and retained earnings | 17,230 | 15,692 | 12,822 | 11,807 | ||||||||||||
1 Further information about share-based payments to employees is disclosed in note 45. |
| |||||||||||||||
2 The transfer of balances from the share option reserve to retained earnings represents items of a distributable nature. |
| |||||||||||||||
3 ANZ has taken the option available under AASB 119 to recognise actuarial gains/losses on defined benefit superannuation plans directly in retained profits (refer note 1 F(vii) and note 44). |
| |||||||||||||||
122

30: Reserves and Retained Earnings(continued)
a) Foreign currency translation reserve
The translation reserve comprises exchange differences, net of hedges, arising on translation of the financial statements of foreign operations, as described in note 1 A(vii). When a foreign operation is sold, attributable exchange differences are recognised in the income statement.
b) Share option reserve
The share option reserve arises on the grant of options, performance rights and deferred share rights to selected employees under the ANZ share option plan. Amounts are transferred out of the reserve and into share capital when the equity investments are exercised. Refer to note 1 C(iii).
c) Available-for-sale revaluation reserve
Changes in the fair value and exchange differences on the revaluation of available-for-sale financial assets are taken to the available-for-sale revaluation reserve. Where a revalued available-for-sale financial asset is sold, that portion of the reserve which relates to that financial asset, is realised and recognised in the income statement. Where the available-for-sale financial asset is impaired, that portion of the reserve which relates to that asset is recognised in the income statement. Refer to note 1 E(iii).
d) Hedging reserve
The hedging reserve represents hedging gains and losses recognised on the effective portion of cash flow hedges. The cumulative deferred gain or loss on the hedge is recognised in the income statement when the hedged transaction impacts the income statement. Refer to note 1 E(ii).
31: Capital Management
ANZ pursues an active approach to capital management, which is designed to protect the interests of depositors, creditors and shareholders. This involves the on-going review and Board approval of the level and composition of ANZ’s capital base, assessed against the following key policy objectives:
| n | Regulatory compliance such that capital levels exceed APRA’s, ANZ’s primary prudential supervisor, minimum Prudential Capital Ratios (PCRs) both at Level 1 (the Company and specified subsidiaries) and Level 2 (ANZ consolidated under Australian prudential standards), along with US Federal Reserve’s minimum Level 2 requirements under ANZ’s Foreign Holding Company Licence in the United States of America; |
| n | Capital levels are aligned with the risks in the business and to meet strategic and business development plans through ensuring that available capital exceeds the level of Economic Capital required to support the Ratings Agency ‘default frequency’ confidence level for a ‘AA’ credit rating category bank. Economic Capital is an internal estimate of capital levels required to support risk and unexpected losses above a desired target solvency level; |
| n | Capital levels are commensurate with ANZ maintaining its preferred ‘AA’ credit rating category for senior long-term unsecured debt given its risk appetite outlined in its strategic plan; and |
| n | An appropriate balance between maximising shareholder returns and prudent capital management principles. |
ANZ achieves these objectives through an Internal Capital Adequacy Assessment Process (ICAAP) whereby ANZ conducts detailed strategic and capital planning over a medium term time horizon.
NOTES TO THE FINANCIAL STATEMENTS 123

31: Capital Management(continued)
Annually, ANZ conducts a detailed strategic planning process over a three year time horizon, the outcomes of which are embodied in the Strategic Plan. This process involves forecasting key economic variables which Divisions use to determine key financial data for their existing business. New strategic initiatives to be undertaken over the planning period and their financial impact are then determined. These processes are used for the following:
| n | Review capital ratios, targets, and levels of different classes of capital against ANZ’s risk profile and risk appetite outlined in the Strategic Plan. ANZ’s capital targets reflect the key policy objectives above, and the desire to ensure that under specific stressed economic scenarios that capital levels have sufficient capital to remain above both Economic Capital and Prudential Capital Ratio (PCR) requirements; |
| n | Stress tests are performed under different economic conditions to ensure a comprehensive review of ANZ’s capital position both before and after mitigating actions. The stress tests determine the level of additional capital (i.e. the ‘capital buffer’) needed to absorb losses that may be experienced during an economic downturn; and |
| n | Stress testing is integral to strengthening the predictive approach to risk management and is a key component in managing risks, asset writing strategies and business strategies. It creates greater understanding of the impacts on financial performance through modelling relationships and sensitivities between geographic, industry and Divisional exposures under a range of macro economic scenarios. ANZ has a dedicated stress testing team within Risk Management that models and reports to management and the Board’s Risk Committee on a range of scenarios and stress tests. |
Results are subsequently used to:
| n | recalibrate ANZ’s management targets for minimum and operating ranges for its respective classes of capital such that ANZ will have sufficient capital to remain above both Economic Capital and PCR requirements; and |
| n | identify the level of organic capital generation and hence determine current and future capital issuance requirements for Level 1 and Level 2. |
From these processes, a Capital Plan is developed and approved by the Board which identifies the capital issuance requirements, capital securities maturity profile, and options around capital products, timing and markets to execute the Capital Plan under differing market and economic conditions.
The Capital Plan is maintained and updated through a monthly review of forecast financial performance, economic conditions and development of business initiatives and strategies. The Board and senior management are provided with monthly updates of ANZ’s capital position. Any actions required to ensure ongoing prudent capital management are submitted to the Board for approval.
Regulatory environment
ANZ’s regulatory capital calculation is governed by APRA’s Prudential Standards which adopt a risk-based capital assessment framework based on the Basel II capital measurement standards. This risk-based approach requires eligible capital to be divided by total risk weighted assets (RWAs), with the resultant ratio being used as a measure of an Authorised Deposit-taking Institution’s (ADIs) capital adequacy. APRA determines PCRs for Tier 1 and Total Capital, with capital as the numerator and RWAs as the denominator.
To ensure that ADIs are adequately capitalised on both a stand-alone and group basis, APRA adopts a tiered approach to the measurement of an ADI’s capital adequacy by assessing the ADIs financial strength at three levels:
| n | Level 1 – the ADI on a stand-alone basis (i.e. the Company and approved subsidiaries which are consolidated to form the ADIs’ Extended Licensed Entity); |
| n | Level 2 – the consolidated banking group (i.e. the consolidated financial group less certain subsidiaries and associates excluded under the prudential standards); and |
| n | Level 3 – the conglomerate group at the widest level. |
ANZ is a Level 1 and Level 2 reporter, and measures capital adequacy monthly on a Level 1 and Level 2 basis, and is not required to report on a Level 3 basis.
Regulatory capital is divided into Tier 1, carrying the highest capital elements, and Tier 2, which has lower capital elements, but still adds to the overall strength of the ADI.
Tier 1 capital is comprised of ‘Fundamental’ capital, ‘Residual’ capital, and Tier 1 deductions. Fundamental capital comprises shareholders’ equity adjusted for items which APRA does not allow as regulatory capital or classifies as lower forms of regulatory capital. Fundamental capital includes the following significant adjustments:
| n | Residual Tier 1 capital instruments included within shareholders’ equity are excluded; |
| n | Reserves exclude the hedging reserve and available-for-sale revaluation reserve, and reserves of insurance and funds management subsidiaries and associates excluded for Level 2 purposes; |
| n | Retained earnings excludes retained earnings of insurance and funds management subsidiaries and associates excluded for Level 2 purposes, but includes capitalised deferred fees forming part of loan yields that meet the criteria set out in the prudential standard; and |
| n | Current year net of tax earnings is net of any interim and special dividends paid during the current year, and the expected final dividend payment, net of the expected dividend reinvestment under the Dividend Reinvestment Plan and Bonus Option Plan, and excludes profits of insurance and funds management subsidiaries and associates excluded for Level 2 purposes. |
124

31: Capital Management(continued)
Residual capital covers Non-innovative and Innovative Tier 1 capital instruments with limits restricting the volume that can be counted as Tier 1 capital.
Tier 1 capital deductions include amounts deducted solely from Tier 1 capital. These deductions are mainly intangible assets being:
| n | goodwill; |
| n | value in force as to acquired insurance/investment business portfolios; |
| n | capitalised software; |
| n | capitalised brokerage and borrowing expenses; and |
| n | net deferred tax assets. |
Tier 1 deductions also include deductions taken 50% from Tier 1 and 50% from Tier 2, which mainly include the investments in associates regulated by APRA, or their overseas equivalent, the tangible component of investments in insurance and funds management subsidiaries excluded for Level 2 purposes and the amount of Expected Losses (EL) in excess of Eligible Provisions for Loan Losses (net of tax).
Tier 2 capital is comprised of Upper and Lower Tier 2 capital less capital deductions taken 50% from Tier 2 capital. Upper Tier 2 capital mainly comprises perpetual subordinated debt instruments, whilst Lower Tier 2 capital includes dated subordinated debt instruments which have a minimum term of five years at issue date.
Total Capital is the sum of Tier 1 capital and Tier 2 capital.
In addition to the prudential capital oversight that APRA conducts over the Company and the Group, the Company’s branch operations and major banking subsidiary operations are overseen by local regulators such as the Reserve Bank of New Zealand, the US Federal Reserve, the UK Financial Services Authority, the Monetary Authority of Singapore, the Hong Kong Monetary Authority and the China Banking Regulatory Commission who may impose minimum capitalisation rates on those operations.
Throughout the financial year, the Company and the Group maintained compliance with the minimum Tier 1 and Total Capital ratios set by APRA and the US Federal Reserve (as applicable) as well as applicable capitalisation rates set by regulators in countries where the Company operates branches and subsidiaries.
Regulatory change
The Basel Committee on Banking Supervision has released a series of consultation papers (Basel III) containing a number of proposals to strengthen the global capital and liquidity framework to improve the banking sector’s ability to absorb shocks arising from financial and economic stress.
Following on from the December 2010 Basel Committee paper on prudential capital reforms, APRA released its new prudential capital standards in September 2012 detailing the implementation of the majority of Basel III capital reforms in Australia. APRA is adopting the Basel III reforms with increased capital deductions from Common Equity Tier 1 (CET1) capital, an increase in capitalisation rates (including prescribed minimum capital buffers), tighter requirements around new Tier 1 and Tier 2 securities and transitional arrangements for existing Tier 1 and Tier 2 securities that do not conform to the new regulations.
Based upon the APRA Basel III standards, ANZ would have reported a CET1 capital ratio of 8.0% as at 30 September 2012.
ANZ is well placed to meet APRA’s early adoption of the Basel III capital reforms on 1 January 2013, and the implementation of the capital conservation measures, including the capital conservation buffer, on 1 January 2016.
APRA is still to finalise capital standards on the Basel III reforms dealing with the improvements in capital disclosures, leverage ratio, counterparty credit risk, contingent capital and measures to address systematic and inter-connected risks.
Level 3 Conglomerates (Level 3)
APRA has announced that it will proceed with implementing Level 3 Conglomerates Prudential Standards in 2014, with an update to the March 2010 discussion paper expected in early 2013. The standards will regulate a bancassurance group such as ANZ as a single economic entity with minimum capital requirements and additional reporting on risk exposure levels. Based on APRA’s March 2010 Discussion Paper, ANZ is not expecting any material impact on its operations.
NOTES TO THE FINANCIAL STATEMENTS 125

31: Capital Management(continued)
The table below provides the composition of Basel II capital used for regulatory purposes and capital adequacy ratios.
2012 $m | 2011 $m | |||||||
Regulatory capital – qualifying capital | ||||||||
Tier 1 | ||||||||
Shareholders’ equity and minority interests | 41,220 | 37,954 | ||||||
Prudential adjustments to shareholders’ equity | (3,857 | ) | (3,479 | ) | ||||
Fundamental capital | 37,363 | 34,475 | ||||||
Deductions1 | (10,839 | ) | (10,611 | ) | ||||
Common Equity Tier 1 capital | 26,524 | 23,864 | ||||||
Non-innovative Tier 1 capital instruments | 4,390 | 5,111 | ||||||
Innovative Tier 1 capital instruments | 1,587 | 1,641 | ||||||
Tier 1 capital | 32,501 | 30,616 | ||||||
Tier 2 | ||||||||
Upper Tier 2 capital | 1,185 | 1,228 | ||||||
Subordinated notes2 | 5,702 | 5,017 | ||||||
Deductions | (2,814 | ) | (3,071 | ) | ||||
Tier 2 capital | 4,073 | 3,174 | ||||||
Total qualifying capital | 36,574 | 33,790 | ||||||
Capital adequacy ratios | ||||||||
Common Equity Tier 1 | 8.8% | 8.5% | ||||||
Tier 1 | 10.8% | 10.9% | ||||||
Tier 2 | 1.4% | 1.2% | ||||||
Total | 12.2% | 12.1% | ||||||
| 1 | Includes goodwill (excluding ANZ Wealth Australia Limited (formerly OnePath Australia Limited) and OnePath New Zealand Limited) of $3,008 million (2011: $2,968 million) and $2,074 million (2011: $2,071 million) intangible component of investment in OnePath Australia Limited and OnePath New Zealand Limited. |
| 2 | For capital adequacy calculation, subordinated note issues are reduced by 20% of the original amount over the last four years to maturity and are limited to 50% of Tier 1 capital. |
Regulatory environment – insurance and funds management business
Under APRA’s Prudential Standards, life insurance and funds management activities are de-consolidated for the purposes of calculating capital adequacy and excluded from the risk based capital adequacy framework for the ANZ Level 2 Group. The intangible component of the investment in these controlled entities is deducted from Tier 1 capital with the balance of the investment deducted 50% from Tier 1 and 50% from Tier 2 capital. Additionally any profits from these activities included in ANZ’s results are excluded from the determination of Tier 1 capital to the extent they have not been remitted to the Level 2 Group.
ANZ’s life insurance business in Australia is regulated by APRA as a separate business. The Life Act (1995) includes a two tiered framework for the calculation of regulatory capital requirements for life insurance companies – ‘solvency’ and ‘capital adequacy’. Life insurance companies in New Zealand are required to meet minimum capital requirements as determined by the Insurance (Prudential Supervision) Act 2010 and professional standards of the New Zealand Society of Actuaries.
Fund managers in Australia are subject to ‘Responsible Entity’ regulation by the Australian Securities and Investment Commission (ASIC). The regulatory capital requirements vary depending on the type of Australian Financial Services Licence or Authorised Representatives’ Licence held, but a requirement of up to $5 million of net tangible assets applies.
APRA supervises approved trustees of superannuation funds and requires them to also maintain net tangible assets of at least $5 million. These requirements are not cumulative where an entity is both an approved trustee for superannuation purposes and a responsible entity.
ANZ’s insurance and funds management companies held assets in excess of regulatory capital requirements at 30 September 2012.
126

32: Assets Charged as Security for Liabilities and Collateral Accepted as Security for Assets
Assets charged as security for liabilities
The following assets are pledged as collateral:
| n | Mandatory reserve deposits with local central banks in accordance with statutory requirements. These deposits are not available to finance the Group’s day to day operations. |
| n | Securities provided as collateral for repurchase transactions. These transactions are governed by standard industry agreements. |
| n | Debenture undertakings covering the assets of Esanda Finance Corporation Limited (Esanda), and its subsidiaries, and UDC Finance Limited (UDC). The debenture stock of Esanda, and its subsidiaries, and UDC is secured by a trust deed and collateral debentures, giving floating charges upon the undertakings and all the tangible assets of the entity, other than land and buildings (of Esanda only). All controlled entities of Esanda and UDC have guaranteed the payment of principal, interest and other monies in relation to all debenture stock and unsecured notes issued by Esanda and UDC respectively. The only loans pledged as collateral are those in Esanda, UDC and their subsidiaries. |
| n | Cash placed on deposit with a third party that was provided as collateral for a liability in a structured funding transaction. The funding was raised through a subsidiary, and to achieve more favourable pricing terms, ANZ provided cash collateral, given by the Company. |
| n | Collateral provided to central banks. |
| n | Specified residential mortgages provided as security for notes and bonds issued to investors as part of our securitisation and covered bond programs. |
The carrying amounts of assets pledged as security are as follows1:
| Consolidated | The Company | |||||||||||||||||||||||||||||||
| Carrying Amount | Related Liability | Carrying Amount | Related Liability | |||||||||||||||||||||||||||||
2012 $m | 2011 $m | 2012 $m | 2011 $m | 2012 $m | 2011 $m | 2012 $m | 2011 $m | |||||||||||||||||||||||||
Regulatory deposits | 1,478 | 1,505 | n/a | n/a | 514 | 497 | n/a | n/a | ||||||||||||||||||||||||
Securities sold under arrangements to repurchase | 536 | 1,872 | 528 | 1,869 | 289 | 1,511 | 286 | 1,510 | ||||||||||||||||||||||||
Assets pledged as collateral under debenture undertakings | 2,073 | 2,146 | 1,274 | 1,372 | – | – | – | – | ||||||||||||||||||||||||
Cash deposited in structured funding transaction | – | 840 | – | 2,000 | – | 840 | – | – | ||||||||||||||||||||||||
Securitisation | – | 166 | – | 166 | – | – | – | – | ||||||||||||||||||||||||
Covered bonds2 | 15,276 | – | 11,162 | – | 11,304 | – | 8,798 | – | ||||||||||||||||||||||||
Other | 165 | 52 | 58 | 42 | 164 | 52 | 58 | 42 | ||||||||||||||||||||||||
Collateral accepted as security for assets1
ANZ has received collateral as part of entering reverse repurchase agreements. These transactions are governed by standard industry agreements.
The fair value of collateral received and sold or repledged is as follows:
| Consolidated | The Company | |||||||||||||||
2012 $m | 2011 $m | 2012 $m | 2011 $m | |||||||||||||
Collateral received on standard repurchase agreement3 | ||||||||||||||||
Fair value of assets which can be sold or repledged | 10,007 | 7,238 | 9,661 | 6,451 | ||||||||||||
Amount of collateral that has been resold or repledged | 3,246 | 4,125 | 2,903 | 3,341 | ||||||||||||
| 1 | The value of cash collateral for derivatives is included in notes 10 and 22. The terms and conditions of the collateral agreements are included in the standard Credit Support Annex that forms part of the International Swaps and Derivatives Association Master Agreement. |
| 2 | The related liability for Covered Bonds represents the Covered Bonds issued by entities in the Group to external investors. |
| 3 | Balance in 2012 includes $143 million where the underlying securities are equities (2011: $36 million). |
NOTES TO THE FINANCIAL STATEMENTS 127

33: Financial Risk Management
STRATEGY IN USING FINANCIAL INSTRUMENTS
Financial instruments are fundamental to the Group’s business, constituting the core element of its operations. Accordingly, the risks associated with financial instruments are a significant component of the risks faced by the Group. Financial instruments create, modify or reduce the credit, market (including traded or fair value risks and non-traded or interest and foreign currency related risks) and liquidity risks of the Group’s balance sheet. These risks, and the Group’s objectives, policies and processes for managing and methods used to measure such risks are outlined below.
CREDIT RISK
Credit risk is the risk of financial loss resulting from the failure of ANZ’s customers and counterparties to honour or perform fully the terms of a loan or contract. The Group assumes credit risk in a wide range of lending and other activities in diverse markets and in many jurisdictions. Credit risks arise not only from traditional lending to customers, but also from inter-bank, treasury, international trade and capital market activities around the world.
The Group has an overall objective of sound growth for appropriate returns. The credit risk principles of the Group have been set by the Board and are implemented and monitored within a tiered structure of delegated authority designed to oversee multiple facets of credit risk, including business writing strategies, credit policies/controls, portfolio monitoring and risk concentrations.
CREDIT RISK MANAGEMENT OVERVIEW
The credit risk management framework ensures a consistent approach is applied across the Group in measuring, monitoring and managing the credit risk appetite set by the Board.
The Board is assisted and advised by the Board Risk Committee in discharging its duty to oversee credit risk. The Board Risk Committee sets the credit risk appetite and credit strategies, as well as approving credit transactions beyond the discretion of executive management.
Responsibility for the oversight and control of the credit risk framework (including the risk appetite) resides with the Credit and Market Risk Committee (CMRC), which is an executive management committee comprising senior risk, business and Group executives, chaired by the Chief Risk Officer (CRO).
Central to the Group’s management of credit risk is the existence of an independent credit risk management function that is staffed by risk specialists. Independence is achieved by having all credit risk staff ultimately report to the CRO, including where they are embedded in business units. The primary responsibility for prudent and profitable management of credit risk and customer relationships rests with the business units.
The authority to make credit decisions is delegated by the Board to the CEO who in turn delegates authority to the CRO. The CRO in turn delegates some of his credit discretion to individuals as part of a ‘cascade’ of authority from senior to the most junior credit officers. Individuals must be suitably skilled and accredited in order to be granted and retain a credit discretion. Credit discretions are reviewed on an annual basis, and may be varied based on the holder’s performance.
The Group has two main approaches to assessing credit risk arising from transactions:
| n | The larger and more complex credit transactions are assessed on a judgemental credit basis. Rating models provide a consistent and structured assessment, with judgement required around the use of out-of-model factors. Credit approval for judgemental lending is typically on a dual approval basis, jointly by the business writer in the business unit and an independent credit officer. |
| n | Programmed credit assessment typically covers retail and some small business lending, and refers to the automated assessment of credit applications using a combination of scoring (application and behavioural), policy rules and external credit reporting information. Where an application does not meet the automated assessment criteria it will be referred out for manual assessment, with assessors considering the decision tool recommendation. |
Central and divisional credit risk teams perform key roles in portfolio management such as the development and validation of credit risk measurement systems, loan asset quality reporting, stress testing, and the development of credit policies and requirements. Credit policies and requirements cover all aspects of the credit life cycle such as transaction structuring, risk grading, initial approval, ongoing management and problem debt management, as well as specialist policy topics.
The Group’s grading system is fundamental to the management of credit risk, seeking to measure the probability of default (PD), the exposure at default (EAD) and the loss in the event of default (LGD) for all transactions.
From an operational perspective, the Group’s credit grading system has two separate and distinct dimensions that:
| n | Measure the PD, which is expressed by a 27-grade Customer Credit Rating (CCR), reflecting the ability to service and repay debt. Within the programmed credit assessment sphere, the CCR is typically expressed as a score which maps back to the PD. |
| n | Measure the LGD, which is expressed by a Security Indicator (SI) ranging from A to G. The SI is calculated by reference to the percentage of loan covered by security which can be realised in the event of default. The security-related SIs are supplemented with a range of other SIs to cover situations where ANZ’s LGD research indicates certain transaction characteristics have different recovery outcomes. Within the programmed credit assessment sphere, exposures are grouped into large homogenous pools – and the LGD is assigned at the pool level. |
128

33: Financial Risk Management(continued)
The development and regular validation of rating models is undertaken by specialist central risk teams. The outputs from these models drive many day-to-day credit decisions, such as origination, pricing, approval levels, regulatory capital adequacy, economic capital allocation and provisioning. The risk grading process includes monitoring of model-generated results to ensure appropriate judgement is exercised (such as overrides to take into account any out-of-model factors).
COLLATERAL MANAGEMENT
Collateral is used to mitigate credit risk, as the secondary source of repayment in case the counterparty cannot meet its contractual repayment obligations.
ANZ credit principles specify to only lend when the counterparty has the capacity and ability to repay, and the Group sets limits on the acceptable level of credit risk. Acceptance of credit risk is firstly based on the counterparty’s assessed capacity to meet contractual obligations (such as the scheduled repayment of principal and interest).
In certain cases, such as where the customer risk profile is considered very sound or by the nature of the product (for instance, small limit products such as credit cards), a transaction may not be supported by collateral. For some products, the collateral provided is fundamental to its structuring so is not strictly the secondary source of repayment. For example, lending secured by trade receivables is typically repaid by the collection of those receivables.
The most common types of collateral typically taken by ANZ include:
| n | Charges over cash deposits. |
| n | Security over real estate including residential, commercial, industrial or rural property. |
| n | Other security includes charges over business assets, security over specific plant and equipment, charges over listed shares, bonds or securities and guarantees and pledges. |
Credit policy and requirements set out the acceptable types of collateral, as well as a process by which additional instruments and/or asset types can be considered for approval. ANZ’s credit risk modelling approach uses historical internal loss data and other relevant external data to assist in determining the discount that each type would be expected to incur in a forced sale. This discounted value is used in the determination of the SI for LGD purposes.
In the event of customer default, any loan security is usually held as mortgagee in possession while the Group is actively seeking to realise it. Therefore the Group does not usually hold any real estate or other assets acquired through the enforcement of security.
The Group generally uses Master Agreements with its counterparties for derivatives activities. Generally, International Swaps and Derivatives Association (ISDA) Master Agreements will be used. Under the ISDA Master Agreement, if a default of a counterparty occurs, all contracts with the counterparty are terminated. They are then settled on a net basis at market levels current at the time of default.
In addition to the terms noted above, ANZ’s preferred practice is to use a Credit Support Annex (CSA) to the ISDA Master Agreement. Under a CSA, open derivative positions with the counterparty are aggregated and cash collateral (or other forms of eligible collateral) is exchanged daily. The collateral is provided by the counterparty that is out of the money. Upon termination of the trade, payment is required only for the final daily mark-to-market movement rather than the mark-to-market movement since inception.
CONCENTRATIONS OF CREDIT RISK
Concentrations of credit risk arise when a number of customers are engaged in similar business activities or activities within the same geographic region, or when they have similar risk characteristics that would cause their ability to meet contractual obligations to be similarly affected by changes in economic or other conditions.
The Group monitors its portfolios, to identify and assess risk concentrations. The Group’s strategy is to maintain well-diversified credit portfolios focused on achieving an acceptable risk-return balance. Credit risk portfolios are actively monitored and frequently reviewed to identify, assess and guard against unacceptable risk concentrations. Concentration analysis will typically include geography, industry, credit product and risk grade. The Group also applies single customer counterparty limits to protect against unacceptably large exposures to single name risk. These limits are established based on a combination of factors including nature of counterparty, probability of default and collateral provided.
NOTES TO THE FINANCIAL STATEMENTS 129

33: Financial Risk Management(continued)
Concentrations of credit risk analysis
Composition of financial instruments that give rise to credit risk by industry:
| Liquid assets and due from other financial institutions | Trading and AFS1 assets | Derivatives | Loans and advances2 | Other financial assets3 | Credit related commitments4 | Total | ||||||||||||||||||||||||||||||||||||||||||||||||||
| Consolidated | 2012 $m | 2011 $m | 2012 $m | 2011 $m | 2012 $m | 2011 $m | 2012 $m | 2011 $m | 2012 $m | 2011 $m | 2012 $m | 2011 $m | 2012 $m | 2011 $m | ||||||||||||||||||||||||||||||||||||||||||
Australia | ||||||||||||||||||||||||||||||||||||||||||||||||||||||||
Agriculture, forestry fishing and mining | 101 | – | 6 | – | 83 | 264 | 12,666 | 12,143 | 154 | 176 | 8,136 | 7,106 | 21,146 | 19,689 | ||||||||||||||||||||||||||||||||||||||||||
Business services | 11 | 28 | – | 2 | 65 | 91 | 5,490 | 5,384 | 68 | 78 | 3,003 | 2,485 | 8,637 | 8,068 | ||||||||||||||||||||||||||||||||||||||||||
Construction | 23 | 10 | 4 | 2 | 109 | 150 | 5,121 | 5,156 | 66 | 75 | 3,650 | 3,352 | 8,973 | 8,745 | ||||||||||||||||||||||||||||||||||||||||||
Electricity, gas and water supply | – | – | 162 | 458 | 928 | 593 | 3,316 | 2,309 | – | – | 2,245 | 2,795 | 6,651 | 6,155 | ||||||||||||||||||||||||||||||||||||||||||
Entertainment, leisure and tourism | 40 | – | 2 | – | 264 | 283 | 7,075 | 6,151 | 78 | 89 | 2,370 | 2,860 | 9,829 | 9,383 | ||||||||||||||||||||||||||||||||||||||||||
Financial, investment and insurance5 | 9,131 | 5,771 | 18,853 | 16,427 | 30,680 | 36,710 | 8,986 | 7,921 | 101 | 115 | 4,051 | 6,885 | 71,802 | 73,829 | ||||||||||||||||||||||||||||||||||||||||||
Government and official institutions | 32 | 907 | 16,642 | 15,311 | 281 | 187 | 484 | 218 | 3 | 3 | 312 | 228 | 17,754 | 16,854 | ||||||||||||||||||||||||||||||||||||||||||
Manufacturing | 63 | 292 | 53 | 358 | 906 | 676 | 8,124 | 8,252 | 105 | 120 | 7,646 | 7,986 | 16,897 | 17,684 | ||||||||||||||||||||||||||||||||||||||||||
Personal lending | – | – | – | – | – | – | 202,710 | 191,052 | 2,428 | 2,771 | 34,525 | 34,931 | 239,663 | 228,754 | ||||||||||||||||||||||||||||||||||||||||||
Property services | 345 | 1 | 24 | 40 | 1,007 | 810 | 25,006 | 24,108 | 307 | 350 | 8,681 | 8,037 | 35,370 | 33,346 | ||||||||||||||||||||||||||||||||||||||||||
Retail trade | 35 | 10 | 122 | 85 | 194 | 176 | 9,397 | 9,295 | 118 | 135 | 4,074 | 3,529 | 13,940 | 13,230 | ||||||||||||||||||||||||||||||||||||||||||
Transport and storage | 5 | 12 | 104 | 59 | 669 | 469 | 6,413 | 5,533 | 70 | 80 | 3,208 | 2,889 | 10,469 | 9,042 | ||||||||||||||||||||||||||||||||||||||||||
Wholesale trade | 264 | 295 | 6 | 2 | 207 | 390 | 6,429 | 5,826 | 74 | 84 | 5,739 | 4,801 | 12,719 | 11,398 | ||||||||||||||||||||||||||||||||||||||||||
Other | 14 | 41 | 280 | 953 | 705 | 493 | 8,675 | 5,976 | 105 | 120 | 5,012 | 4,665 | 14,791 | 12,248 | ||||||||||||||||||||||||||||||||||||||||||
| 10,064 | 7,367 | 36,258 | 33,697 | 36,098 | 41,292 | 309,892 | 289,324 | 3,677 | 4,196 | 92,652 | 92,549 | 488,641 | 468,425 | |||||||||||||||||||||||||||||||||||||||||||
New Zealand | ||||||||||||||||||||||||||||||||||||||||||||||||||||||||
Agriculture, forestry fishing and mining | 19 | 30 | – | – | 59 | 84 | 14,555 | 14,023 | 75 | 79 | 1,491 | 1,404 | 16,199 | 15,620 | ||||||||||||||||||||||||||||||||||||||||||
Business services | 10 | 4 | – | – | 9 | 15 | 1,154 | 898 | 6 | 5 | 428 | 320 | 1,607 | 1,242 | ||||||||||||||||||||||||||||||||||||||||||
Construction | – | – | – | – | 2 | 3 | 812 | 732 | 4 | 4 | 491 | 536 | 1,309 | 1,275 | ||||||||||||||||||||||||||||||||||||||||||
Electricity, gas and water supply | 10 | 17 | 23 | 18 | 463 | 305 | 748 | 697 | 4 | 5 | 1,251 | 746 | 2,499 | 1,788 | ||||||||||||||||||||||||||||||||||||||||||
Entertainment, leisure and tourism | – | – | – | – | 33 | 33 | 931 | 880 | 5 | 5 | 306 | 252 | 1,275 | 1,170 | ||||||||||||||||||||||||||||||||||||||||||
Financial, investment and insurance5 | 1,232 | 3,137 | 2,950 | 2,751 | 6,880 | 9,023 | 400 | 728 | 59 | 682 | 832 | 1,153 | 12,353 | 17,474 | ||||||||||||||||||||||||||||||||||||||||||
Government and official institutions | 283 | 184 | 6,843 | 4,913 | 322 | 451 | 1,063 | 1,136 | 5 | 6 | 855 | 803 | 9,371 | 7,493 | ||||||||||||||||||||||||||||||||||||||||||
Manufacturing | 34 | – | 5 | 8 | 78 | 155 | 2,327 | 2,015 | 12 | 11 | 1,632 | 1,513 | 4,088 | 3,702 | ||||||||||||||||||||||||||||||||||||||||||
Personal lending | – | – | – | – | – | – | 45,304 | 43,574 | 234 | 247 | 6,973 | 6,482 | 52,511 | 50,303 | ||||||||||||||||||||||||||||||||||||||||||
Property services | 5 | – | – | – | 32 | 25 | 6,056 | 5,855 | 31 | 33 | 899 | 652 | 7,023 | 6,565 | ||||||||||||||||||||||||||||||||||||||||||
Retail trade | 22 | – | 5 | 2 | 34 | 33 | 1,416 | 1,222 | 7 | 7 | 807 | 583 | 2,291 | 1,847 | ||||||||||||||||||||||||||||||||||||||||||
Transport and storage | 20 | – | 40 | 45 | 74 | 83 | 1,322 | 1,247 | 7 | 7 | 462 | 463 | 1,925 | 1,845 | ||||||||||||||||||||||||||||||||||||||||||
Wholesale trade | 43 | 12 | – | – | 17 | 17 | 954 | 925 | 5 | 5 | 1,055 | 873 | 2,074 | 1,832 | ||||||||||||||||||||||||||||||||||||||||||
Other | – | 11 | 26 | 25 | 18 | – | 689 | 759 | 4 | 5 | 415 | 913 | 1,152 | 1,713 | ||||||||||||||||||||||||||||||||||||||||||
| 1,678 | 3,395 | 9,892 | 7,762 | 8,021 | 10,227 | 77,731 | 74,691 | 458 | 1,101 | 17,897 | 16,693 | 115,677 | 113,869 | |||||||||||||||||||||||||||||||||||||||||||
| 1 | Available-for-sale assets. |
| 2 | Excludes individual and collective provisions for credit impairment held in respect of credit related commitments. |
| 3 | Mainly comprises trade dated assets and accrued interest. |
| 4 | Credit related commitments comprise undrawn facilities and customer contingent liabilities. |
| 5 | Includes amounts due from other Group entities. |
130

33: Financial Risk Management(continued)
Concentrations of credit risk analysis (continued):
Composition of financial instruments that give rise to credit risk by industry (continued):
| Liquid assets and due from other financial institutions | Trading and AFS1 assets | Derivatives | Loans and advances2 | Other financial assets3 | Credit related commitments4,5 | Total | ||||||||||||||||||||||||||||||||||||||||||||||||||
| Consolidated | 2012 $m | 2011 $m | 2012 $m | 2011 $m | 2012 $m | 2011 $m | 2012 $m | 2011 $m | 2012 $m | 2011 $m | 2012 $m | 2011 $m | 2012 $m | 2011 $m | ||||||||||||||||||||||||||||||||||||||||||
Asia Pacific, Europe & America | ||||||||||||||||||||||||||||||||||||||||||||||||||||||||
Agriculture, forestry fishing and mining | 7 | 43 | – | – | 48 | 63 | 1,590 | 1,389 | 36 | 24 | 4,002 | 3,721 | 5,683 | 5,240 | ||||||||||||||||||||||||||||||||||||||||||
Business services | 1 | 9 | – | – | 2 | 5 | 492 | 914 | 24 | 16 | 2,155 | 1,255 | 2,674 | 2,199 | ||||||||||||||||||||||||||||||||||||||||||
Construction | 1 | – | – | – | 10 | 51 | 457 | 336 | 9 | 6 | 2,662 | 1,978 | 3,139 | 2,371 | ||||||||||||||||||||||||||||||||||||||||||
Electricity, gas and water supply | – | 7 | 29 | 10 | 127 | 244 | 1,603 | 1,952 | – | – | 1,687 | 1,861 | 3,446 | 4,074 | ||||||||||||||||||||||||||||||||||||||||||
Entertainment, leisure and tourism | – | – | – | – | 5 | – | 825 | 730 | 18 | 12 | 258 | 282 | 1,106 | 1,024 | ||||||||||||||||||||||||||||||||||||||||||
Financial, investment and insurance6 | 38,629 | 24,687 | 8,442 | 6,512 | 3,992 | 5,654 | 6,686 | 2,382 | 59 | 40 | 6,836 | 9,103 | 64,644 | 48,378 | ||||||||||||||||||||||||||||||||||||||||||
Government and official institutions | 29 | 104 | 5,525 | 8,839 | 8 | 52 | 281 | 437 | 10 | 7 | 1,059 | 1,340 | 6,912 | 10,779 | ||||||||||||||||||||||||||||||||||||||||||
Manufacturing | 11 | 160 | 220 | 2 | 269 | 484 | 11,404 | 11,121 | 279 | 189 | 18,804 | 16,591 | 30,987 | 28,547 | ||||||||||||||||||||||||||||||||||||||||||
Personal lending | – | – | – | – | – | – | 6,469 | 5,817 | 147 | 99 | 6,444 | 6,580 | 13,060 | 12,496 | ||||||||||||||||||||||||||||||||||||||||||
Property services | – | – | – | – | 111 | 100 | 3,312 | 3,309 | 83 | 56 | 1,349 | 581 | 4,855 | 4,046 | ||||||||||||||||||||||||||||||||||||||||||
Retail trade | 1 | – | 13 | – | 22 | 3 | 934 | 921 | 24 | 16 | 690 | 692 | 1,684 | 1,632 | ||||||||||||||||||||||||||||||||||||||||||
Transport and storage | 3 | – | 1 | – | 78 | 82 | 2,416 | 2,343 | 59 | 40 | 1,211 | 1,102 | 3,768 | 3,567 | ||||||||||||||||||||||||||||||||||||||||||
Wholesale trade | 74 | 140 | 4 | – | 86 | 182 | 7,315 | 5,289 | 133 | 90 | 13,171 | 10,139 | 20,783 | 15,840 | ||||||||||||||||||||||||||||||||||||||||||
Other | 127 | 208 | 709 | 1,037 | 52 | 202 | 2,392 | 2,812 | 120 | 81 | 2,861 | 1,986 | 6,261 | 6,326 | ||||||||||||||||||||||||||||||||||||||||||
| 38,883 | 25,358 | 14,943 | 16,400 | 4,810 | 7,122 | 46,176 | 39,752 | 1,001 | 676 | 63,189 | 57,211 | 169,002 | 146,519 | |||||||||||||||||||||||||||||||||||||||||||
Consolidated – aggregate | ||||||||||||||||||||||||||||||||||||||||||||||||||||||||
Agriculture, forestry fishing and mining | 127 | 73 | 6 | – | 190 | 411 | 28,811 | 27,555 | 265 | 279 | 13,629 | 12,231 | 43,028 | 40,549 | ||||||||||||||||||||||||||||||||||||||||||
Business services | 22 | 41 | – | 2 | 76 | 111 | 7,136 | 7,196 | 98 | 99 | 5,586 | 4,060 | 12,918 | 11,509 | ||||||||||||||||||||||||||||||||||||||||||
Construction | 24 | 10 | 4 | 2 | 121 | 204 | 6,390 | 6,224 | 79 | 85 | 6,803 | 5,866 | 13,421 | 12,391 | ||||||||||||||||||||||||||||||||||||||||||
Electricity, gas and water supply | 10 | 24 | 214 | 486 | 1,518 | 1,142 | 5,667 | 4,958 | 4 | 5 | 5,183 | 5,402 | 12,596 | 12,017 | ||||||||||||||||||||||||||||||||||||||||||
Entertainment, leisure and tourism | 40 | – | 2 | – | 302 | 316 | 8,831 | 7,761 | 101 | 106 | 2,934 | 3,394 | 12,210 | 11,577 | ||||||||||||||||||||||||||||||||||||||||||
Financial, investment and insurance6 | 48,992 | 33,595 | 30,245 | 25,690 | 41,552 | 51,387 | 16,072 | 11,031 | 219 | 837 | 11,719 | 17,141 | 148,799 | 139,681 | ||||||||||||||||||||||||||||||||||||||||||
Government and official institutions | 344 | 1,195 | 29,010 | 29,063 | 611 | 690 | 1,828 | 1,791 | 18 | 16 | 2,226 | 2,371 | 34,037 | 35,126 | ||||||||||||||||||||||||||||||||||||||||||
Manufacturing | 108 | 452 | 278 | 368 | 1,253 | 1,315 | 21,855 | 21,388 | 396 | 320 | 28,082 | 26,090 | 51,972 | 49,933 | ||||||||||||||||||||||||||||||||||||||||||
Personal lending | – | – | – | – | – | – | 254,483 | 240,443 | 2,809 | 3,117 | 47,942 | 47,993 | 305,234 | 291,553 | ||||||||||||||||||||||||||||||||||||||||||
Property services | 350 | 1 | 24 | 40 | 1,150 | 935 | 34,374 | 33,272 | 421 | 439 | 10,929 | 9,270 | 47,248 | 43,957 | ||||||||||||||||||||||||||||||||||||||||||
Retail trade | 58 | 10 | 140 | 87 | 250 | 212 | 11,747 | 11,438 | 149 | 158 | 5,571 | 4,804 | 17,915 | 16,709 | ||||||||||||||||||||||||||||||||||||||||||
Transport and storage | 28 | 12 | 145 | 104 | 821 | 634 | 10,151 | 9,123 | 136 | 127 | 4,881 | 4,454 | 16,162 | 14,454 | ||||||||||||||||||||||||||||||||||||||||||
Wholesale trade | 381 | 447 | 10 | 2 | 310 | 589 | 14,698 | 12,040 | 212 | 179 | 19,965 | 15,813 | 35,576 | 29,070 | ||||||||||||||||||||||||||||||||||||||||||
Other | 141 | 260 | 1,015 | 2,015 | 775 | 695 | 11,756 | 9,547 | 229 | 206 | 8,288 | 7,564 | 22,204 | 20,287 | ||||||||||||||||||||||||||||||||||||||||||
Gross Total | 50,625 | 36,120 | 61,093 | 57,859 | 48,929 | 58,641 | 433,799 | 403,767 | 5,136 | 5,973 | 173,738 | 166,453 | 773,320 | 728,813 | ||||||||||||||||||||||||||||||||||||||||||
Individual provision for credit impairment | – | – | – | – | – | – | (1,729 | ) | (1,687 | ) | – | – | (44 | ) | (10 | ) | (1,773 | ) | (1,697 | ) | ||||||||||||||||||||||||||||||||||||
Collective provision for credit impairment | – | – | – | – | – | – | (2,236 | ) | (2,604 | ) | – | – | (529 | ) | (572 | ) | (2,765 | ) | (3,176 | ) | ||||||||||||||||||||||||||||||||||||
| 50,625 | 36,120 | 61,093 | 57,859 | 48,929 | 58,641 | 429,834 | 399,476 | 5,136 | 5,973 | 173,165 | 165,871 | 768,782 | 723,940 | |||||||||||||||||||||||||||||||||||||||||||
Unearned income | – | – | – | – | – | – | (2,235 | ) | (2,216 | ) | – | – | – | – | (2,235 | ) | (2,216 | ) | ||||||||||||||||||||||||||||||||||||||
Capitalised brokerage/ mortgage origination fees | – | – | – | – | – | – | 797 | 629 | – | – | – | – | 797 | 629 | ||||||||||||||||||||||||||||||||||||||||||
| 50,625 | 36,120 | 61,093 | 57,859 | 48,929 | 58,641 | 428,396 | 397,889 | 5,136 | 5,973 | 173,165 | 165,871 | 767,344 | 722,353 | |||||||||||||||||||||||||||||||||||||||||||
Excluded from analysis above7 | 3,056 | 2,805 | 71 | 479 | – | – | – | – | – | – | – | – | 3,127 | 3,284 | ||||||||||||||||||||||||||||||||||||||||||
| 53,681 | 38,925 | 61,164 | 58,338 | 48,929 | 58,641 | 428,396 | 397,889 | 5,136 | 5,973 | 173,165 | 165,871 | 770,471 | 725,637 | |||||||||||||||||||||||||||||||||||||||||||
| 1 | Available-for-sale assets. |
| 2 | Excludes individual and collective provisions for credit impairment held in respect of credit related commitments. |
| 3 | Mainly comprises trade dated assets and accrued interest. |
| 4 | Credit related commitments comprise undrawn facilities and customer contingent liabilities. |
| 5 | September 2011 undrawn facilities have been restated by $2,646 million using the revised methodology for undrawn overdrafts that was implemented during 2012. |
| 6 | Includes amounts due from other Group entities. |
| 7 | Equity instruments and cash are excluded from maximum exposure amount. |
NOTES TO THE FINANCIAL STATEMENTS 131

33: Financial Risk Management(continued)
Concentrations of credit risk analysis (continued):
Composition of financial instruments that give rise to credit risk by industry (continued):
| Liquid assets and due from other financial institutions | Trading and AFS1 assets | Derivatives | Loans and advances2 | Other financial assets3 | Credit related commitments4 | Total | ||||||||||||||||||||||||||||||||||||||||||||||||||
| The Company | 2012 $m | 2011 $m | 2012 $m | 2011 $m | 2012 $m | 2011 $m | 2012 $m | 2011 $m | 2012 $m | 2011 $m | 2012 $m | 2011 $m | 2012 $m | 2011 $m | ||||||||||||||||||||||||||||||||||||||||||
Australia | ||||||||||||||||||||||||||||||||||||||||||||||||||||||||
Agriculture, forestry fishing and mining | 101 | – | 6 | – | 83 | 263 | 12,295 | 11,425 | 103 | 118 | 6,362 | 7,099 | 18,950 | 18,905 | ||||||||||||||||||||||||||||||||||||||||||
Business services | 11 | 30 | – | 2 | 65 | 90 | 5,451 | 5,373 | 48 | 55 | 2,354 | 2,482 | 7,929 | 8,032 | ||||||||||||||||||||||||||||||||||||||||||
Construction | 23 | 11 | 4 | 2 | 109 | 150 | 5,084 | 5,145 | 46 | 53 | 2,860 | 3,349 | 8,126 | 8,710 | ||||||||||||||||||||||||||||||||||||||||||
Electricity, gas and water supply | – | – | 56 | 359 | 928 | 591 | 3,292 | 2,304 | – | – | – | 2,793 | 4,276 | 6,047 | ||||||||||||||||||||||||||||||||||||||||||
Entertainment, leisure and tourism | 40 | – | 2 | – | 264 | 282 | 7,021 | 6,130 | 55 | 63 | 1,857 | 2,858 | 9,239 | 9,333 | ||||||||||||||||||||||||||||||||||||||||||
Financial, investment and insurance5 | 9,169 | 5,815 | 19,224 | 16,786 | 35,149 | 42,794 | 10,299 | 8,651 | 78 | 89 | 23,885 | 6,878 | 97,804 | 81,013 | ||||||||||||||||||||||||||||||||||||||||||
Government and official institutions | 32 | 1,280 | 16,642 | 15,653 | 281 | 187 | 481 | 218 | 3 | 3 | 244 | 228 | 17,683 | 17,569 | ||||||||||||||||||||||||||||||||||||||||||
Manufacturing | 63 | 314 | 53 | 366 | 906 | 676 | 8,059 | 8,227 | 74 | 85 | 5,991 | 7,978 | 15,146 | 17,646 | ||||||||||||||||||||||||||||||||||||||||||
Personal lending | – | – | – | – | – | – | 201,254 | 190,661 | 1,710 | 1,956 | 27,056 | 34,892 | 230,020 | 227,509 | ||||||||||||||||||||||||||||||||||||||||||
Property services | 345 | 1 | 24 | 41 | 1,007 | 807 | 24,826 | 24,056 | 217 | 248 | 6,828 | 8,029 | 33,247 | 33,182 | ||||||||||||||||||||||||||||||||||||||||||
Retail trade | 35 | 11 | 122 | 87 | 194 | 176 | 9,329 | 9,275 | 83 | 95 | 3,192 | 3,525 | 12,955 | 13,169 | ||||||||||||||||||||||||||||||||||||||||||
Transport and storage | 5 | 13 | 104 | 60 | 669 | 468 | 6,358 | 5,491 | 50 | 57 | 2,513 | 2,887 | 9,699 | 8,976 | ||||||||||||||||||||||||||||||||||||||||||
Wholesale trade | 264 | 316 | 6 | 2 | 207 | 390 | 6,383 | 5,811 | 52 | 60 | 4,497 | 4,796 | 11,409 | 11,375 | ||||||||||||||||||||||||||||||||||||||||||
Other | 14 | 45 | 280 | 974 | 705 | 492 | 8,665 | 5,955 | 75 | 86 | 4,996 | 4,660 | 14,735 | 12,212 | ||||||||||||||||||||||||||||||||||||||||||
| 10,102 | 7,836 | 36,523 | 34,332 | 40,567 | 47,366 | 308,797 | 288,722 | 2,594 | 2,968 | 92,635 | 92,454 | 491,218 | 473,678 | |||||||||||||||||||||||||||||||||||||||||||
New Zealand | ||||||||||||||||||||||||||||||||||||||||||||||||||||||||
Agriculture, forestry fishing and mining | – | – | – | – | – | – | – | – | – | – | – | – | – | – | ||||||||||||||||||||||||||||||||||||||||||
Business services | – | – | – | – | – | – | – | – | – | – | – | – | – | – | ||||||||||||||||||||||||||||||||||||||||||
Construction | – | – | – | – | – | – | – | – | – | – | – | – | – | – | ||||||||||||||||||||||||||||||||||||||||||
Electricity, gas and water supply | – | – | – | – | – | – | – | – | – | – | – | – | – | – | ||||||||||||||||||||||||||||||||||||||||||
Entertainment, leisure and tourism | – | – | – | – | – | – | – | – | – | – | – | – | – | – | ||||||||||||||||||||||||||||||||||||||||||
Financial, investment and insurance5 | – | – | – | – | 10 | 21 | – | – | – | – | – | – | 10 | 21 | ||||||||||||||||||||||||||||||||||||||||||
Government and official institutions | – | – | – | – | – | – | – | – | – | – | – | – | – | – | ||||||||||||||||||||||||||||||||||||||||||
Manufacturing | – | – | – | – | – | – | – | – | – | – | – | – | – | – | ||||||||||||||||||||||||||||||||||||||||||
Personal lending | – | – | – | – | – | – | 7,518 | 7,820 | – | – | 82 | 69 | 7,600 | 7,889 | ||||||||||||||||||||||||||||||||||||||||||
Property services | – | – | – | – | – | – | – | – | – | – | – | – | – | – | ||||||||||||||||||||||||||||||||||||||||||
Retail trade | – | – | – | – | – | – | – | – | – | – | – | – | – | – | ||||||||||||||||||||||||||||||||||||||||||
Transport and storage | – | – | – | – | – | – | – | – | – | – | – | – | – | – | ||||||||||||||||||||||||||||||||||||||||||
Wholesale trade | – | – | – | – | – | – | – | – | – | – | – | – | – | – | ||||||||||||||||||||||||||||||||||||||||||
Other | – | – | – | – | – | – | – | – | – | – | – | – | – | – | ||||||||||||||||||||||||||||||||||||||||||
| – | – | – | – | 10 | 21 | 7,518 | 7,820 | – | – | 82 | 69 | 7,610 | 7,910 | |||||||||||||||||||||||||||||||||||||||||||
| 1 | Available-for-sale assets. |
| 2 | Excludes individual and collective provisions for credit impairment held in respect of credit related commitments. |
| 3 | Mainly comprises trade dated assets and accrued interest. |
| 4 | Credit related commitments comprise undrawn facilities and customer contingent liabilities. |
| 5 | Includes amounts due from other Group entities. |
132

33: Financial Risk Management(continued)
Concentrations of credit risk analysis (continued):
Composition of financial instruments that give rise to credit risk by industry (continued):
Liquid assets and due from other financial institutions | Trading and AFS1 assets | Derivatives | Loans and advances2 | Other financial assets3 | Credit related commitments4 | Total | ||||||||||||||||||||||||||||||||||||||||||||||||||
| The Company | 2012 $m | 2011 $m | 2012 $m | 2011 $m |
2012 $m | 2011 $m | 2012 $m | 2011 $m | 2012 $m | 2011 $m | 2012 $m | 2011 $m | 2012 $m | 2011 $m | ||||||||||||||||||||||||||||||||||||||||||
Asia Pacific, Europe & America | ||||||||||||||||||||||||||||||||||||||||||||||||||||||||
Agriculture, forestry fishing and mining | 2 | 40 | – | – | 25 | 38 | 988 | 817 | 18 | 13 | 3,655 | 3,032 | 4,688 | 3,940 | ||||||||||||||||||||||||||||||||||||||||||
Business services | – | 8 | – | – | 1 | 3 | 422 | 604 | 14 | 10 | 2,040 | 1,071 | 2,477 | 1,696 | ||||||||||||||||||||||||||||||||||||||||||
Construction | – | – | – | – | 5 | 30 | 296 | 176 | 4 | 3 | 2,560 | 1,829 | 2,865 | 2,038 | ||||||||||||||||||||||||||||||||||||||||||
Electricity, gas and water supply | – | 6 | 27 | – | 69 | 149 | 1,493 | 1,742 | – | – | – | 1,542 | 1,589 | 3,439 | ||||||||||||||||||||||||||||||||||||||||||
Entertainment, leisure and tourism | – | – | – | – | 3 | – | 598 | 558 | 12 | 9 | 180 | 258 | 793 | 825 | ||||||||||||||||||||||||||||||||||||||||||
Financial, investment and insurance5 | 35,720 | 22,035 | 6,671 | 5,601 | 2,269 | 3,440 | 6,466 | 2,035 | 49 | 36 | 6,731 | 8,291 | 57,906 | 41,438 | ||||||||||||||||||||||||||||||||||||||||||
Government and official institutions | 25 | 2 | 4,332 | 6,305 | 5 | 30 | 255 | 362 | 8 | 6 | 1,053 | 1,259 | 5,678 | 7,964 | ||||||||||||||||||||||||||||||||||||||||||
Manufacturing | 3 | 142 | 204 | 2 | 113 | 293 | 9,149 | 9,544 | 207 | 154 | 16,021 | 14,682 | 25,697 | 24,817 | ||||||||||||||||||||||||||||||||||||||||||
Personal lending | – | – | – | – | – | – | 5,300 | 4,465 | 98 | 72 | 5,672 | 5,587 | 11,070 | 10,124 | ||||||||||||||||||||||||||||||||||||||||||
Property services | – | – | – | – | 79 | 61 | 2,938 | 3,111 | 68 | 50 | 1,165 | 534 | 4,250 | 3,756 | ||||||||||||||||||||||||||||||||||||||||||
Retail trade | 1 | – | – | – | 11 | 3 | 563 | 596 | 14 | 10 | 454 | 527 | 1,043 | 1,136 | ||||||||||||||||||||||||||||||||||||||||||
Transport and storage | 3 | – | 1 | – | 40 | 51 | 1,940 | 1,760 | 38 | 28 | 1,191 | 982 | 3,213 | 2,821 | ||||||||||||||||||||||||||||||||||||||||||
Wholesale trade | 46 | 128 | – | – | 41 | 111 | 6,117 | 4,471 | 98 | 72 | 11,780 | 9,166 | 18,082 | 13,948 | ||||||||||||||||||||||||||||||||||||||||||
Other | 37 | 198 | 507 | 766 | 28 | 124 | 1,866 | 2,196 | 85 | 63 | 2,861 | 1,447 | 5,384 | 4,794 | ||||||||||||||||||||||||||||||||||||||||||
| 35,837 | 22,559 | 11,742 | 12,674 | 2,689 | 4,333 | 38,391 | 32,437 | 713 | 526 | 55,363 | 50,207 | 144,735 | 122,736 | |||||||||||||||||||||||||||||||||||||||||||
The Company – aggregate | ||||||||||||||||||||||||||||||||||||||||||||||||||||||||
Agriculture, forestry fishing and mining | 103 | 40 | 6 | – | 108 | 301 | 13,283 | 12,242 | 121 | 131 | 10,017 | 10,131 | 23,638 | 22,845 | ||||||||||||||||||||||||||||||||||||||||||
Business services | 11 | 38 | – | 2 | 66 | 93 | 5,873 | 5,977 | 62 | 65 | 4,394 | 3,553 | 10,406 | 9,728 | ||||||||||||||||||||||||||||||||||||||||||
Construction | 23 | 11 | 4 | 2 | 114 | 180 | 5,380 | 5,321 | 50 | 56 | 5,420 | 5,178 | 10,991 | 10,748 | ||||||||||||||||||||||||||||||||||||||||||
Electricity, gas and water supply | – | 6 | 83 | 359 | 997 | 740 | 4,785 | 4,046 | – | – | – | 4,335 | 5,865 | 9,486 | ||||||||||||||||||||||||||||||||||||||||||
Entertainment, leisure and tourism | 40 | – | 2 | – | 267 | 282 | 7,619 | 6,688 | 67 | 72 | 2,037 | 3,116 | 10,032 | 10,158 | ||||||||||||||||||||||||||||||||||||||||||
Financial, investment and insurance5 | 44,889 | 27,850 | 25,895 | 22,387 | 37,428 | 46,255 | 16,765 | 10,686 | 127 | 125 | 30,616 | 15,169 | 155,720 | 122,472 | ||||||||||||||||||||||||||||||||||||||||||
Government and official institutions | 57 | 1,282 | 20,974 | 21,958 | 286 | 217 | 736 | 580 | 11 | 9 | 1,297 | 1,487 | 23,361 | 25,533 | ||||||||||||||||||||||||||||||||||||||||||
Manufacturing | 66 | 456 | 257 | 368 | 1,019 | 969 | 17,208 | 17,771 | 281 | 239 | 22,012 | 22,660 | 40,843 | 42,463 | ||||||||||||||||||||||||||||||||||||||||||
Personal lending | – | – | – | – | – | – | 214,072 | 202,946 | 1,808 | 2,028 | 32,810 | 40,548 | 248,690 | 245,522 | ||||||||||||||||||||||||||||||||||||||||||
Property services | 345 | 1 | 24 | 41 | 1,086 | 868 | 27,764 | 27,167 | 285 | 298 | 7,993 | 8,563 | 37,497 | 36,938 | ||||||||||||||||||||||||||||||||||||||||||
Retail trade | 36 | 11 | 122 | 87 | 205 | 179 | 9,892 | 9,871 | 97 | 105 | 3,646 | 4,052 | 13,998 | 14,305 | ||||||||||||||||||||||||||||||||||||||||||
Transport and storage | 8 | 13 | 105 | 60 | 709 | 519 | 8,298 | 7,251 | 88 | 85 | 3,704 | 3,869 | 12,912 | 11,797 | ||||||||||||||||||||||||||||||||||||||||||
Wholesale trade | 310 | 444 | 6 | 2 | 248 | 501 | 12,500 | 10,282 | 150 | 132 | 16,277 | 13,962 | 29,491 | 25,323 | ||||||||||||||||||||||||||||||||||||||||||
Other | 51 | 243 | 787 | 1,740 | 733 | 616 | 10,531 | 8,151 | 160 | 149 | 7,857 | 6,107 | 20,119 | 17,006 | ||||||||||||||||||||||||||||||||||||||||||
Gross Total | 45,939 | 30,395 | 48,265 | 47,006 | 43,266 | 51,720 | 354,706 | 328,979 | 3,307 | 3,494 | 148,080 | 142,730 | 643,563 | 604,324 | ||||||||||||||||||||||||||||||||||||||||||
Individual provision for credit impairment | – | – | – | – | – | – | (1,242 | ) | (1,144 | ) | – | – | (27 | ) | (6 | ) | (1,269 | ) | (1,150 | ) | ||||||||||||||||||||||||||||||||||||
Collective provision for credit impairment | – | – | – | – | – | – | (1,728 | ) | (2,042 | ) | – | – | (410 | ) | (454 | ) | (2,138 | ) | (2,496 | ) | ||||||||||||||||||||||||||||||||||||
| 45,939 | 30,395 | 48,265 | 47,006 | 43,266 | 51,720 | 351,736 | 325,793 | 3,307 | 3,494 | 147,643 | 142,270 | 640,156 | 600,678 | |||||||||||||||||||||||||||||||||||||||||||
Unearned income | – | – | – | – | – | – | (1,946 | ) | (1,961 | ) | – | – | – | – | (1,946 | ) | (1,961 | ) | ||||||||||||||||||||||||||||||||||||||
Capitalised brokerage/ mortgage origination fees | – | – | – | – | – | – | 707 | 602 | – | – | – | – | 707 | 602 | ||||||||||||||||||||||||||||||||||||||||||
| 45,939 | 30,395 | 48,265 | 47,006 | 43,266 | 51,720 | 350,497 | 324,434 | 3,307 | 3,494 | 147,643 | 142,270 | 638,917 | 599,319 | |||||||||||||||||||||||||||||||||||||||||||
Excluded from analysis above6 | 1,010 | 958 | 66 | 378 | – | – | – | – | – | – | – | – | 1,076 | 1,336 | ||||||||||||||||||||||||||||||||||||||||||
| 46,949 | 31,353 | 48,331 | 47,384 | 43,266 | 51,720 | 350,497 | 324,434 | 3,307 | 3,494 | 147,643 | 142,270 | 639,993 | 600,655 | |||||||||||||||||||||||||||||||||||||||||||
| 1 | Available-for-sale assets. |
| 2 | Excludes individual and collective provisions for credit impairment held in respect of credit related commitments. |
| 3 | Mainly comprises trade dated assets and accrued interest. |
| 4 | Credit related commitments comprise undrawn facilities and customer contingent liabilities. |
| 5 | Includes amounts due from other Group entities. |
| 6 | Equity instruments and cash are excluded from maximum exposure amount. |
NOTES TO THE FINANCIAL STATEMENTS 133

33: Financial Risk Management(continued)
CREDIT QUALITY
Maximum exposure to credit risk
For financial assets recognised on the balance sheet, the maximum exposure to credit risk is the carrying amount. In certain circumstances, there may be differences between the carrying amounts reported on the balance sheet and the amounts reported in the tables below. Principally, these differences arise in respect of financial assets that are subject to risks other than credit risk, such as equity investments which are primarily subject to market risk, or bank notes and coins. For contingent exposures, the maximum exposure to credit risk is the maximum amount the Group would have to pay if the instrument is called upon. For undrawn facilities, the maximum exposure to credit risk is the full amount of the committed facilities.
The following tables present the maximum exposure to credit risk of on-balance sheet and off-balance sheet financial assets before taking account of any collateral held or other credit enhancements.
| Reported | Excluded1 | Maximum exposure to credit risk | ||||||||||||||||||||||
| Consolidated | 2012 $m | 2011 $m |
2012 $m | 2011 $m | 2012 $m | 2011 $m | ||||||||||||||||||
Liquid assets | 36,578 | 25,627 | 3,056 | 2,805 | 33,522 | 22,822 | ||||||||||||||||||
Due from other financial institutions | 17,103 | 13,298 | – | – | 17,103 | 13,298 | ||||||||||||||||||
Trading securities | 40,602 | 36,074 | – | – | 40,602 | 36,074 | ||||||||||||||||||
Derivative financial instruments | 48,929 | 58,641 | – | – | 48,929 | 58,641 | ||||||||||||||||||
Available-for-sale assets | 20,562 | 22,264 | 71 | 479 | 20,491 | 21,785 | ||||||||||||||||||
Net loans and advances | ||||||||||||||||||||||||
– Australia | 244,684 | 228,507 | – | – | 244,684 | 228,507 | ||||||||||||||||||
– International and Institutional Banking | 107,636 | 96,497 | – | – | 107,636 | 96,497 | ||||||||||||||||||
– New Zealand | 70,142 | 67,166 | – | – | 70,142 | 67,166 | ||||||||||||||||||
– Global Wealth and Private Banking | 5,361 | 5,137 | – | – | 5,361 | 5,137 | ||||||||||||||||||
Other financial assets2 | 5,136 | 5,973 | – | – | 5,136 | 5,973 | ||||||||||||||||||
| 596,733 | 559,184 | 3,127 | 3,284 | 593,606 | 555,900 | |||||||||||||||||||
Undrawn facilities | 141,355 | 135,243 | – | – | 141,355 | 135,243 | ||||||||||||||||||
Contingent facilities | 32,383 | 31,210 | – | – | 32,383 | 31,210 | ||||||||||||||||||
| 173,738 | 166,453 | – | – | 173,738 | 166,453 | |||||||||||||||||||
Total | 770,471 | 725,637 | 3,127 | 3,284 | 767,344 | 722,353 | ||||||||||||||||||
| 1 | Includes bank notes and coins and cash at bank within liquid assets and equity instruments within available-for-sale financial assets. |
| 2 | Mainly comprises trade dated assets and accrued interest. |
134

33: Financial Risk Management(continued)
Maximum exposure to credit risk (continued)
| Reported | Excluded1 | Maximum exposure to credit risk | ||||||||||||||||||||||||||
| The Company | 2012 $m | 2011 $m | 2012 $m | 2011 $m | 2012 $m | 2011 $m | ||||||||||||||||||||||
Liquid assets | 32,782 | 21,283 | 1,010 | 958 | 31,772 | 20,325 | ||||||||||||||||||||||
Due from other financial institutions | 14,167 | 10,070 | – | – | 14,167 | 10,070 | ||||||||||||||||||||||
Trading securities | 30,490 | 28,367 | – | – | 30,490 | 28,367 | ||||||||||||||||||||||
Derivative financial instruments | 43,266 | 51,720 | – | – | 43,266 | 51,720 | ||||||||||||||||||||||
Available-for-sale assets | 17,841 | 19,017 | 66 | 378 | 17,775 | 18,639 | ||||||||||||||||||||||
Net loans and advances | 350,060 | 323,974 | – | – | 350,060 | 323,974 | ||||||||||||||||||||||
Other financial assets2 | 3,307 | 3,494 | – | – | 3,307 | 3,494 | ||||||||||||||||||||||
| 491,913 | 457,925 | 1,076 | 1,336 | 490,837 | 456,589 | |||||||||||||||||||||||
Undrawn facilities | 118,461 | 114,461 | – | – | 118,461 | 114,461 | ||||||||||||||||||||||
Contingent facilities | 29,619 | 28,269 | – | – | 29,619 | 28,269 | ||||||||||||||||||||||
| 148,080 | 142,730 | – | – | 148,080 | 142,730 | |||||||||||||||||||||||
Total | 639,993 | 600,655 | 1,076 | 1,336 | 638,917 | 599,319 | ||||||||||||||||||||||
| 1 | Includes bank notes and coins and cash at bank within liquid assets and equity instruments within available-for-sale financial assets. |
| 2 | Mainly comprises trade dated assets and accrued interest. |
NOTES TO THE FINANCIAL STATEMENTS 135

33: Financial Risk Management(continued)
DISTRIBUTION OF FINANCIAL ASSETS BY CREDIT QUALITY
The Group has a comprehensive rating system that is used to quantify credit risk. The use of masterscales ensures consistency across exposure types at the Group, providing a consistent framework for reporting and analysis.
All customers with whom ANZ has a credit relationship including guarantors, are assigned a Customer Credit Rating (CCR) or score at origination either by programmed credit assessment or by judgemental assessment. In addition, the CCR or score is reviewed on an ongoing basis to ensure it accurately reflects the credit risk of the customer and the prevailing economic conditions.
The Group’s risk grade profile therefore changes dynamically through new lending, repayment and/or existing counterparty movements in either risk or volume.
Restructured items
Restructured items are facilities in which the original contractual terms have been modified for reasons related to the financial difficulties of the customer. Restructuring may consist of reduction of interest, principal or other payments legally due or an expansion in maturity materially beyond those typically offered to new facilities with similar risk.
Neither past due nor impaired | Past due but not impaired | Restructured | Net Impaired | Total | ||||||||||||||||||||||||||||||||||||
| Consolidated |
2012 $m | 2011 $m | 2012 $m | 2011 $m | 2012 $m | 2011 $m | 2012 $m | 2011 $m | 2012 $m | 2011 $m | ||||||||||||||||||||||||||||||
Liquid assets | 33,522 | 22,822 | – | – | – | – | – | – | 33,522 | 22,822 | ||||||||||||||||||||||||||||||
Due from other financial institutions | 17,103 | 13,298 | – | – | – | – | – | – | 17,103 | 13,298 | ||||||||||||||||||||||||||||||
Trading securities | 40,602 | 36,074 | – | – | – | – | – | – | 40,602 | 36,074 | ||||||||||||||||||||||||||||||
Derivative financial instruments | 48,784 | 58,602 | – | – | 29 | 1 | 116 | 38 | 48,929 | 58,641 | ||||||||||||||||||||||||||||||
Available-for-sale assets | 20,491 | 21,785 | – | – | – | – | – | – | 20,491 | 21,785 | ||||||||||||||||||||||||||||||
Net loans and advances | ||||||||||||||||||||||||||||||||||||||||
– Australia | 235,392 | 218,861 | 8,538 | 9,007 | – | – | 754 | 639 | 244,684 | 228,507 | ||||||||||||||||||||||||||||||
– International and Institutional Banking | 105,428 | 93,787 | 635 | 712 | 349 | 683 | 1,224 | 1,315 | 107,636 | 96,497 | ||||||||||||||||||||||||||||||
– New Zealand | 67,495 | 64,148 | 1,863 | 2,014 | 148 | 16 | 636 | 988 | 70,142 | 67,166 | ||||||||||||||||||||||||||||||
– Global Wealth and Private Banking | 5,241 | 4,998 | 99 | 118 | – | – | 21 | 21 | 5,361 | 5,137 | ||||||||||||||||||||||||||||||
Other financial assets1 | 5,136 | 5,973 | – | – | – | – | – | – | 5,136 | 5,973 | ||||||||||||||||||||||||||||||
Credit related commitments2 | 173,591 | 166,270 | – | – | – | – | 147 | 183 | 173,738 | 166,453 | ||||||||||||||||||||||||||||||
| 752,785 | 706,618 | 11,135 | 11,851 | 526 | 700 | 2,898 | 3,184 | 767,344 | 722,353 | |||||||||||||||||||||||||||||||
Neither past due nor impaired | Past due but not impaired | Restructured | Net Impaired | Total | ||||||||||||||||||||||||||||||||||||
| The Company |
2012 $m | 2011 $m | 2012 $m | 2011 $m | 2012 $m | 2011 $m | 2012 $m | 2011 $m | 2012 $m | 2011 $m | ||||||||||||||||||||||||||||||
Liquid assets | 31,772 | 20,325 | – | – | – | – | – | – | 31,772 | 20,325 | ||||||||||||||||||||||||||||||
Due from other financial institutions | 14,167 | 10,070 | – | – | – | – | – | – | 14,167 | 10,070 | ||||||||||||||||||||||||||||||
Trading securities | 30,490 | 28,367 | – | – | – | – | – | – | 30,490 | 28,367 | ||||||||||||||||||||||||||||||
Derivative financial instruments | 43,122 | 51,681 | – | – | 29 | 1 | 115 | 38 | 43,266 | 51,720 | ||||||||||||||||||||||||||||||
Available-for-sale assets | 17,775 | 18,639 | – | – | – | – | – | – | 17,775 | 18,639 | ||||||||||||||||||||||||||||||
Net loans and advances | 338,717 | 311,902 | 9,091 | 9,495 | 348 | 683 | 1,904 | 1,894 | 350,060 | 323,974 | ||||||||||||||||||||||||||||||
Other financial assets1 | 3,307 | 3,494 | – | – | – | – | – | – | 3,307 | 3,494 | ||||||||||||||||||||||||||||||
Credit related commitments2 | 147,935 | 142,563 | – | – | – | – | 145 | 167 | 148,080 | 142,730 | ||||||||||||||||||||||||||||||
| 627,285 | 587,041 | 9,091 | 9,495 | 377 | 684 | 2,164 | 2,099 | 638,917 | 599,319 | |||||||||||||||||||||||||||||||
| 1 | Mainly comprises trade dated assets and accrued interest. |
| 2 | Comprises undrawn facilities and customer contingent liabilities. |
136

33: Financial Risk Management(continued)
Credit quality of financial assets neither past due nor impaired
The credit quality of financial assets is managed by the Group using internal CCRs based on their current probability of default. The Group’s masterscales are mapped to external rating agency scales, to enable wider comparisons.
Internal rating
Strong credit profile |
Customers that have demonstrated superior stability in their operating and financial performance over the long-term, and whose debt servicing capacity is not significantly vulnerable to foreseeable events. This rating broadly corresponds to ratings ‘Aaa’ to ‘Baa3’ and ‘AAA’ to ‘BBB-’ of Moody’s and Standard & Poor’s respectively. | |
Satisfactory risk |
Customers that have consistently demonstrated sound operational and financial stability over the medium to long-term, even though some may be susceptible to cyclical trends or variability in earnings. This rating broadly corresponds to ratings ‘Ba2’ to ‘Ba3’ and ‘BB’ to ‘BB-’ of Moody’s and Standard & Poor’s respectively. | |
Sub-standard but not past due or impaired |
Customers that have demonstrated some operational and financial instability, with variability and uncertainty in profitability and liquidity projected to continue over the short and possibly medium term. This rating broadly corresponds to ratings ‘B1’ to ‘Caa’ and ‘B+’ to ‘CCC’ of Moody’s and Standard & Poor’s respectively. |
| Strong credit profile | Satisfactory risk | Sub-standard but not past due or impaired | Total | |||||||||||||||||||||||||||||
| Consolidated |
2012 $m | 2011 $m | 2012 $m | 2011 $m | 2012 $m | 2011 $m | 2012 $m | 2011 $m | ||||||||||||||||||||||||
Liquid assets | 32,790 | 22,212 | 664 | 552 | 68 | 58 | 33,522 | 22,822 | ||||||||||||||||||||||||
Due from other financial institutions | 16,296 | 12,091 | 792 | 980 | 15 | 227 | 17,103 | 13,298 | ||||||||||||||||||||||||
Trading securities | 40,503 | 35,528 | 99 | 546 | – | – | 40,602 | 36,074 | ||||||||||||||||||||||||
Derivative financial instruments | 46,577 | 56,451 | 1,962 | 1,461 | 245 | 690 | 48,784 | 58,602 | ||||||||||||||||||||||||
Available-for-sale assets | 19,065 | 20,081 | 1,420 | 1,664 | 6 | 40 | 20,491 | 21,785 | ||||||||||||||||||||||||
Net loans and advances | ||||||||||||||||||||||||||||||||
– Australia | 175,758 | 163,338 | 48,861 | 45,421 | 10,773 | 10,102 | 235,392 | 218,861 | ||||||||||||||||||||||||
– International and Institutional Banking | 78,599 | 70,301 | 23,234 | 17,814 | 3,595 | 5,672 | 105,428 | 93,787 | ||||||||||||||||||||||||
– New Zealand | 43,406 | 39,376 | 21,262 | 20,474 | 2,827 | 4,298 | 67,495 | 64,148 | ||||||||||||||||||||||||
– Global Wealth and Private Banking | 2,464 | 2,354 | 2,701 | 2,507 | 76 | 137 | 5,241 | 4,998 | ||||||||||||||||||||||||
Other financial assets1 | 4,742 | 5,412 | 334 | 431 | 60 | 130 | 5,136 | 5,973 | ||||||||||||||||||||||||
Credit related commitments2 | 142,037 | 133,612 | 29,535 | 29,759 | 2,019 | 2,899 | 173,591 | 166,270 | ||||||||||||||||||||||||
| 602,237 | 560,756 | 130,864 | 121,609 | 19,684 | 24,253 | 752,785 | 706,618 | |||||||||||||||||||||||||
| Strong credit profile | Satisfactory risk | Sub-standard but not past due or impaired | Total | |||||||||||||||||||||||||||||
| The Company |
2012 $m | 2011 $m | 2012 $m | 2011 $m | 2012 $m | 2011 $m | 2012 $m | 2011 $m | ||||||||||||||||||||||||
Liquid assets | 31,107 | 19,813 | 609 | 473 | 56 | 39 | 31,772 | 20,325 | ||||||||||||||||||||||||
Due from other financial institutions | 13,806 | 9,328 | 357 | 738 | 4 | 4 | 14,167 | 10,070 | ||||||||||||||||||||||||
Trading securities | 30,460 | 28,017 | 30 | 350 | – | – | 30,490 | 28,367 | ||||||||||||||||||||||||
Derivative financial instruments | 41,090 | 49,782 | 1,837 | 1,226 | 195 | 673 | 43,122 | 51,681 | ||||||||||||||||||||||||
Available-for-sale assets | 17,707 | 18,336 | 62 | 263 | 6 | 40 | 17,775 | 18,639 | ||||||||||||||||||||||||
Net loans and advances | 253,522 | 229,212 | 71,334 | 67,548 | 13,861 | 15,142 | 338,717 | 311,902 | ||||||||||||||||||||||||
Other financial assets1 | 3,032 | 3,040 | 230 | 346 | 45 | 108 | 3,307 | 3,494 | ||||||||||||||||||||||||
Credit related commitments2 | 125,774 | 117,272 | 20,500 | 23,598 | 1,661 | 1,693 | 147,935 | 142,563 | ||||||||||||||||||||||||
| 516,498 | 474,800 | 94,959 | 94,542 | 15,828 | 17,699 | 627,285 | 587,041 | |||||||||||||||||||||||||
| 1 | Mainly comprises trade dated assets and accrued interest. |
| 2 | Comprises undrawn facilities and customer contingent liabilities. |
NOTES TO THE FINANCIAL STATEMENTS 137

33: Financial Risk Management(continued)
Ageing analysis of financial assets that are past due but not impaired
Ageing analysis of past due loans is used by the Group to measure and manage emerging credit risks. Financial assets that are past due but not impaired include those which are assessed, approved and managed on a portfolio basis within a centralised environment (for example credit cards and personal loans) that can be held on a productive basis until they are 180 days past due, as well as those which are managed on an individual basis.
A large portion of retail credit exposures, such as residential mortgages, are generally well secured. That is, the value of associated security is sufficient to cover amounts outstanding.
2012 Consolidated | 2011 Consolidated | |||||||||||||||||||||||||||||||||||||||||||||||||
1-5 days $m | 6-29 days $m | 30-59 days $m | 60-89 days $m | >90 days $m | Total $m | 1-5 days $m | 6-29 days $m | 30-59 days $m | 60-89 days $m | >90 days $m | Total $m | |||||||||||||||||||||||||||||||||||||||
Liquid assets | – | – | – | – | – | – | – | – | – | – | – | – | ||||||||||||||||||||||||||||||||||||||
Due from other financial institutions | – | – | – | – | – | – | – | – | – | – | – | – | ||||||||||||||||||||||||||||||||||||||
Trading securities | – | – | – | – | – | – | – | – | – | – | – | – | ||||||||||||||||||||||||||||||||||||||
Derivative financial instruments | – | – | – | – | – | – | – | – | – | – | – | – | ||||||||||||||||||||||||||||||||||||||
Available-for-sale assets | – | – | – | – | – | – | – | – | – | – | – | – | ||||||||||||||||||||||||||||||||||||||
Net loans and advances: | ||||||||||||||||||||||||||||||||||||||||||||||||||
– Australia | 1,454 | 3,812 | 1,262 | 561 | 1,449 | 8,538 | 2,123 | 3,446 | 1,280 | 639 | 1,519 | 9,007 | ||||||||||||||||||||||||||||||||||||||
– International and Institutional Banking | 46 | 420 | 5 | 80 | 84 | 635 | 29 | 458 | 29 | 124 | 72 | 712 | ||||||||||||||||||||||||||||||||||||||
– New Zealand | 772 | 619 | 208 | 84 | 180 | 1,863 | 858 | 550 | 274 | 92 | 240 | 2,014 | ||||||||||||||||||||||||||||||||||||||
– Global Wealth and Private Banking | 13 | 75 | 3 | 8 | – | 99 | 18 | 86 | 1 | 10 | 3 | 118 | ||||||||||||||||||||||||||||||||||||||
Other financial assets | – | – | – | – | – | – | – | – | – | – | – | – | ||||||||||||||||||||||||||||||||||||||
Credit related commitments1 | – | – | – | – | – | – | – | – | – | – | – | – | ||||||||||||||||||||||||||||||||||||||
| 2,285 | 4,926 | 1,478 | 733 | 1,713 | 11,135 | 3,028 | 4,540 | 1,584 | 865 | 1,834 | 11,851 | |||||||||||||||||||||||||||||||||||||||
| The Company | The Company | |||||||||||||||||||||||||||||||||||||||||||||||||
| 1-5 days $m | 6-29 days $m | 30-59 days $m | 60-89 days $m | >90 days $m | Total $m | 1-5 days $m | 6-29 days $m | 30-59 days $m | 60-89 days $m | >90 days $m | Total $m | |||||||||||||||||||||||||||||||||||||||
Liquid assets | – | – | – | – | – | – | – | – | – | – | – | – | ||||||||||||||||||||||||||||||||||||||
Due from other financial institutions | – | – | – | – | – | – | – | – | – | – | – | – | ||||||||||||||||||||||||||||||||||||||
Trading securities | – | – | – | – | – | – | – | – | – | – | – | – | ||||||||||||||||||||||||||||||||||||||
Derivative financial instruments | – | – | – | – | – | – | – | �� | – | – | – | – | – | |||||||||||||||||||||||||||||||||||||
Available-for-sale assets | – | – | – | – | – | – | – | – | – | – | – | – | ||||||||||||||||||||||||||||||||||||||
Net loans and advances | 1,544 | 4,197 | 1,289 | 606 | 1,455 | 9,091 | 2,222 | 3,760 | 1,308 | 695 | 1,510 | 9,495 | ||||||||||||||||||||||||||||||||||||||
Other financial assets | – | – | – | – | – | – | – | – | – | – | – | – | ||||||||||||||||||||||||||||||||||||||
Credit related commitments1 | – | – | – | – | – | – | – | – | – | – | – | – | ||||||||||||||||||||||||||||||||||||||
| 1,544 | 4,197 | 1,289 | 606 | 1,455 | 9,091 | 2,222 | 3,760 | 1,308 | 695 | 1,510 | 9,495 | |||||||||||||||||||||||||||||||||||||||
| 1 | Comprises undrawn facilities and customer contingent liabilities. |
138

33: Financial Risk Management(continued)
Estimated value of collateral for all financial assets
Financial effect of collateral1 | Maximum exposure to credit risk | Unsecured portion of credit exposure | ||||||||||||||||||||||
| Consolidated |
2012 $m | 2011 $m | 2012 $m | 2011 $m | 2012 $m | 2011 $m | ||||||||||||||||||
Liquid assets | 9,103 | 7,716 | 33,522 | 22,822 | 24,419 | 15,106 | ||||||||||||||||||
Due from other financial institutions | – | – | 17,103 | 13,298 | 17,103 | 13,298 | ||||||||||||||||||
Trading securities | 705 | 644 | 40,602 | 36,074 | 39,897 | 35,430 | ||||||||||||||||||
Derivative financial instruments | 2,531 | 4,524 | 48,929 | 58,641 | 46,398 | 54,117 | ||||||||||||||||||
Available-for-sale assets | 210 | 421 | 20,491 | 21,785 | 20,281 | 21,364 | ||||||||||||||||||
Net loans and advances | ||||||||||||||||||||||||
– Australia | 220,067 | 205,423 | 244,684 | 228,507 | 24,617 | 23,084 | ||||||||||||||||||
– International and Institutional Banking | 44,958 | 38,237 | 107,636 | 96,497 | 62,678 | 58,260 | ||||||||||||||||||
– New Zealand | 66,047 | 63,810 | 70,142 | 67,166 | 4,095 | 3,356 | ||||||||||||||||||
– Global Wealth and Private Banking | 5,088 | 4,971 | 5,361 | 5,137 | 273 | 166 | ||||||||||||||||||
Other financial assets2 | 1,263 | 1,205 | 5,136 | 5,973 | 3,873 | 4,768 | ||||||||||||||||||
Credit related commitments3 | 35,604 | 30,369 | 173,738 | 166,453 | 138,134 | 136,084 | ||||||||||||||||||
| 385,576 | 357,320 | 767,344 | 722,353 | 381,768 | 365,033 | |||||||||||||||||||
Financial effect of collateral1 | Maximum exposure to credit risk | Unsecured portion of credit exposure | ||||||||||||||||||||||
| The Company |
2012 $m | 2011 $m | 2012 $m | 2011 $m | 2012 $m | 2011 $m | ||||||||||||||||||
Liquid assets | 8,619 | 6,846 | 31,772 | 20,325 | 23,153 | 13,479 | ||||||||||||||||||
Due from other financial institutions | – | – | 14,167 | 10,070 | 14,167 | 10,070 | ||||||||||||||||||
Trading securities | 346 | 385 | 30,490 | 28,367 | 30,144 | 27,982 | ||||||||||||||||||
Derivative financial instruments | 2,326 | 3,365 | 43,266 | 51,720 | 40,940 | 48,355 | ||||||||||||||||||
Available-for-sale assets | 102 | 267 | 17,775 | 18,639 | 17,673 | 18,372 | ||||||||||||||||||
Net loans and advances | 270,895 | 251,011 | 350,060 | 323,974 | 79,165 | 72,963 | ||||||||||||||||||
Other financial assets2 | 1,008 | 792 | 3,307 | 3,494 | 2,299 | 2,702 | ||||||||||||||||||
Credit related commitments3 | 29,744 | 23,946 | 148,080 | 142,730 | 118,336 | 118,784 | ||||||||||||||||||
| 313,040 | 286,612 | 638,917 | 599,319 | 325,877 | 312,707 | |||||||||||||||||||
| 1 | Represents the security held against the exposure, limited to the maximum exposure to the secured credit risk. |
| 2 | Mainly comprises trade dated assets and accrued interest. |
| 3 | Comprises undrawn facilities and customer contingent liabilities. |
NOTES TO THE FINANCIAL STATEMENTS 139

33: Financial Risk Management(continued)
Financial assets that are individually impaired
| Consolidated | The Company | |||||||||||||||||||||||||||||||||||||
| Impaired assets | Individual provision balances | Impaired assets | Individual provision balances | |||||||||||||||||||||||||||||||||||
2012 $m | 2011 $m | 2012 $m | 2011 $m | 2012 $m | 2011 $m | 2012 $m | 2011 $m | |||||||||||||||||||||||||||||||
Australia | ||||||||||||||||||||||||||||||||||||||
Liquid assets | – | – | – | – | – | – | – | – | ||||||||||||||||||||||||||||||
Due from other financial institutions | – | – | – | – | – | – | – | – | ||||||||||||||||||||||||||||||
Trading securities | – | – | – | – | – | – | – | – | ||||||||||||||||||||||||||||||
Derivative financial instruments | 111 | 35 | – | – | 111 | 35 | – | – | ||||||||||||||||||||||||||||||
Available-for-sale assets | – | – | – | – | – | – | – | – | ||||||||||||||||||||||||||||||
Net loans and advances | 2,838 | 2,592 | 1,100 | 902 | 2,664 | 2,430 | 1,009 | 864 | ||||||||||||||||||||||||||||||
Other financial assets1 | – | – | – | – | – | – | – | – | ||||||||||||||||||||||||||||||
Credit related commitments2 | 173 | 180 | 27 | 7 | 172 | 173 | 27 | 6 | ||||||||||||||||||||||||||||||
| 3,122 | 2,807 | 1,127 | 909 | 2,947 | 2,638 | 1,036 | 870 | |||||||||||||||||||||||||||||||
New Zealand | ||||||||||||||||||||||||||||||||||||||
Liquid assets | – | – | – | – | – | – | – | – | ||||||||||||||||||||||||||||||
Due from other financial institutions | – | – | – | – | – | – | – | – | ||||||||||||||||||||||||||||||
Trading securities | – | – | – | – | – | – | – | – | ||||||||||||||||||||||||||||||
Derivative financial instruments | – | – | – | – | – | – | – | – | ||||||||||||||||||||||||||||||
Available-for-sale assets | – | – | – | – | – | – | – | – | ||||||||||||||||||||||||||||||
Net loans and advances | 991 | 1,392 | 351 | 398 | 31 | 52 | 9 | 14 | ||||||||||||||||||||||||||||||
Other financial assets1 | – | – | – | – | – | – | – | – | ||||||||||||||||||||||||||||||
Credit related commitments2 | 18 | 13 | 17 | 3 | – | – | – | – | ||||||||||||||||||||||||||||||
| 1,009 | 1,405 | 368 | 401 | 31 | 52 | 9 | 14 | |||||||||||||||||||||||||||||||
Asia Pacific, Europe & America | ||||||||||||||||||||||||||||||||||||||
Liquid assets | – | – | – | – | – | – | – | – | ||||||||||||||||||||||||||||||
Due from other financial institutions | – | – | – | – | – | – | – | – | ||||||||||||||||||||||||||||||
Trading securities | – | – | – | – | – | – | – | – | ||||||||||||||||||||||||||||||
Derivative financial instruments | 5 | 3 | – | – | 4 | 3 | – | – | ||||||||||||||||||||||||||||||
Available-for-sale assets | – | – | – | – | – | – | – | – | ||||||||||||||||||||||||||||||
Net loans and advances | 535 | 666 | 277 | 387 | 451 | 556 | 224 | 266 | ||||||||||||||||||||||||||||||
Other financial assets1 | – | – | – | – | – | – | – | – | ||||||||||||||||||||||||||||||
Credit related commitments2 | – | – | – | – | – | – | – | – | ||||||||||||||||||||||||||||||
| 540 | 669 | 277 | 387 | 455 | 559 | 224 | 266 | |||||||||||||||||||||||||||||||
Aggregate | ||||||||||||||||||||||||||||||||||||||
Liquid assets | – | – | – | – | – | – | – | – | ||||||||||||||||||||||||||||||
Due from other financial institutions | – | – | – | – | – | – | – | – | ||||||||||||||||||||||||||||||
Trading securities | – | – | – | – | – | – | – | – | ||||||||||||||||||||||||||||||
Derivative financial instruments | 116 | 38 | – | – | 115 | 38 | – | – | ||||||||||||||||||||||||||||||
Available-for-sale assets | – | – | – | – | – | – | – | – | ||||||||||||||||||||||||||||||
Net loans and advances | 4,364 | 4,650 | 1,729 | 1,687 | 3,146 | 3,038 | 1,242 | 1,144 | ||||||||||||||||||||||||||||||
Other financial assets1 | – | – | – | – | – | – | – | – | ||||||||||||||||||||||||||||||
Credit related commitments2 | 191 | 193 | 44 | 10 | 172 | 173 | 27 | 6 | ||||||||||||||||||||||||||||||
| 4,671 | 4,881 | 1,773 | 1,697 | 3,433 | 3,249 | 1,269 | 1,150 | |||||||||||||||||||||||||||||||
| 1 | Mainly comprises trade dated trading assets and accrued interest. |
| 2 | Comprises undrawn facilities and customer contingent liabilities. |
140

33: Financial Risk Management(continued)
MARKET RISK (Excludes Insurance and Funds Management
Market risk is the risk to the Group’s earnings arising from changes in interest rates, currency exchange rates, credit spreads, or from fluctuations in bond, commodity or equity prices.
Market risk arises when changes in market rates, prices and volatilities lead to a decline in the value of assets and liabilities, including financial derivatives. Market risk is generated through both trading and banking book activities.
ANZ conducts trading operations in interest rates, foreign exchange, commodities, securities and equities.
ANZ has a detailed risk management and control framework to support its trading and balance sheet activities. The framework incorporates a risk measurement approach to quantify the magnitude of market risk within trading and balance sheet portfolios. This approach and related analysis identifies the range of possible outcomes that can be expected over a given period of time, establishes the relative likelihood of those outcomes and allocates an appropriate amount of capital to support these activities.
Group-wide responsibility for the strategies and policies relating to the management of market risk lies with the Board Risk Committee. Responsibility for day to day management of both market risks and compliance with market risk policy is delegated by the Risk Committee to the Credit and Market Risk Committee (CMRC) and the Group Asset & Liability Committee (GALCO).
The CMRC, chaired by the Chief Risk Officer, is responsible for the oversight of market risk. All committees receive regular reporting on the range of trading and balance sheet market risks that ANZ incurs.
Within overall strategies and policies, the control of market risk at the Group level is the joint responsibility of Business Units and Risk Management, with the delegation of market risk limits from the Board and CMRC allocated to both Risk Management and the Business Units.
The management of Risk Management is supported by a comprehensive limit and policy framework to control the amount of risk that the Group will accept. Market risk limits are allocated at various levels and are reported and monitored by Market Risk on a daily basis. The detailed limit framework allocates individual limits to manage and control asset classes (e.g. interest rates, equities), risk factors (e.g. interest rates, volatilities) and profit and loss limits (to monitor and manage the performance of the trading portfolios).
Market risk management and control responsibilities
To facilitate the management, measurement and reporting of market risk, ANZ has grouped market risk into two broad categories:
a) Traded market risk
This is the risk of loss from changes in the value of financial instruments due to movements in price factors for both physical and derivative trading positions. Trading positions arise from transactions where ANZ acts as principal with customers, financial exchanges or interbank counterparties.
The principal risk categories monitored are:
| n | Currency risk is the potential loss arising from the decline in the value of a financial instrument due to changes in foreign exchange rates or their implied volatilities. |
| n | Interest rate risk is the potential loss arising from the change in the value of a financial instrument due to changes in market interest rates or their implied volatilities. |
| n | Credit spread risk is the potential loss arising from a change in value of an instrument due to a movement of its margin or spread relative to a benchmark. |
| n | Commodity risk is the potential loss arising from the decline in the value of a financial instrument due to changes in commodity prices or their implied volatilities. |
| n | Equity risk is the potential loss arising from the decline in the value of a financial instrument due to changes in stock prices or their implied volatilities. |
b) Non-traded market risk (or balance sheet risk)
This comprises the management of non-traded interest rate risk, liquidity, and the risk to the Australian dollar denominated value of the Group’s capital and earnings as a result of foreign exchange rate movements.
Some instruments do not fall into either category that also expose ANZ to market risk. These include equity securities classified as available-for-sale financial assets.
Value at Risk (VaR) measure
A key measure of market risk is Value at Risk (VaR). VaR is a statistical estimate of the possible daily loss and is based on historical market movements.
ANZ measures VaR at a 99% confidence interval. This means that there is a 99% chance that the loss will not exceed the VaR estimate on any given day.
The Group’s standard VaR approach for both traded and non-traded risk is historical simulation. The Group calculates VaR using historical changes in market rates, prices and volatilities over the previous 500 business days. Traded and non-traded VaR is calculated using a one-day holding period.
It should be noted that because VaR is driven by actual historical observations, it is not an estimate of the maximum loss that the Group could experience from an extreme market event. As a result of this limitation, the Group utilises a number of other risk measures (e.g. stress testing) and risk sensitivity limits to measure and manage market risk.
| NOTES TO THE FINANCIAL STATEMENTS 141 |

33: Financial Risk Management(continued)
Traded Market Risk
Below are the aggregate Value at Risk (VaR) exposures at a 99% confidence level covering both physical and derivatives trading positions for the Bank’s principal trading centres.
| 30 September 2012 | 30 September 2011 | |||||||||||||||||||||||||||||||||
| Consolidated | As at $m | High for $m | Low for $m | Average for $m | As at $m | High for $m | Low for year $m | Average for $m | ||||||||||||||||||||||||||
Value at risk at 99% confidence | ||||||||||||||||||||||||||||||||||
Foreign exchange | 3.5 | 10.0 | 3.5 | 5.9 | 7.8 | 10.9 | 1.0 | 4.2 | ||||||||||||||||||||||||||
Interest rate | 4.5 | 8.1 | 2.8 | 5.4 | 7.0 | 26.4 | 5.4 | 13.5 | ||||||||||||||||||||||||||
Credit | 4.0 | 7.5 | 2.6 | 4.7 | 4.9 | 10.5 | 3.2 | 6.9 | ||||||||||||||||||||||||||
Commodity | 1.8 | 4.8 | 1.5 | 3.3 | 3.2 | 6.5 | 2.4 | 4.1 | ||||||||||||||||||||||||||
Equity | 1.2 | 4.0 | 0.7 | 1.6 | 3.4 | 3.5 | 0.6 | 1.3 | ||||||||||||||||||||||||||
Diversification benefit | (6.9 | ) | n/a | n/a | (11.6) | (14.6 | ) | n/a | n/a | (14.2) | ||||||||||||||||||||||||
| 8.1 | 13.6 | 5.7 | 9.3 | 11.7 | 29.5 | 8.3 | 15.8 | |||||||||||||||||||||||||||
| 30 September 2012 | 30 September 2011 | |||||||||||||||||||||||||||||||||
| The Company | As at $m | High for $m | Low for $m | Average for $m | As at $m | High for $m | Low for $m | Average for $m | ||||||||||||||||||||||||||
Value at risk at 99% confidence | ||||||||||||||||||||||||||||||||||
Foreign exchange | 3.5 | 9.9 | 3.5 | 5.9 | 7.8 | 10.9 | 1.0 | 4.2 | ||||||||||||||||||||||||||
Interest rate | 4.0 | 7.5 | 2.3 | 4.6 | 6.7 | 26.3 | 5.0 | 13.2 | ||||||||||||||||||||||||||
Credit | 4.0 | 7.5 | 2.6 | 4.6 | 4.8 | 10.5 | 3.2 | 6.9 | ||||||||||||||||||||||||||
Commodity | 1.8 | 4.8 | 1.5 | 3.3 | 3.2 | 6.5 | 2.4 | 4.1 | ||||||||||||||||||||||||||
Equity | 1.2 | 4.0 | 0.7 | 1.6 | 3.4 | 3.5 | 0.6 | 1.3 | ||||||||||||||||||||||||||
Diversification benefit | (6.7 | ) | n/a | n/a | (11.1) | (14.4 | ) | n/a | n/a | (14.2) | ||||||||||||||||||||||||
| 7.8 | 13.3 | 5.4 | 8.9 | 11.5 | 29.3 | 8.1 | 15.5 | |||||||||||||||||||||||||||
VaR is calculated separately for foreign exchange, interest rate, credit, commodity and equities and for the Group. The diversification benefit reflects the historical correlation between these products. Electricity commodities risk is measured under the standard approach for regulatory purposes.
To supplement the VaR methodology, ANZ applies a wide range of stress tests, both on individual portfolios and at a Group level. ANZ ‘s stress-testing regime provides senior management with an assessment of the financial impact of identified extreme events on market risk exposures of ANZ. Standard stress tests are applied on a daily basis and measure the potential loss arising from applying extreme market movements to individual and groups of individual price factors. Extraordinary stress tests are applied monthly and measure the potential loss arising as a result of scenarios generated from major financial market events.
142

33: Financial Risk Management(continued)
Non-Traded Market Risk (Balance Sheet Risk)
The principal objectives of balance sheet management are to manage interest income sensitivity while maintaining acceptable levels of interest rate and liquidity risk and to manage the market value of the Group’s capital. Liquidity risk is dealt with in the next section.
Interest rate risk
The objective of balance sheet interest rate risk management is to secure stable and optimal net interest income over both the short (next 12 months) and long-term. Non-traded interest rate risk relates to the potential adverse impact of changes in market interest rates on the Group’s future net interest income. This risk arises from two principal sources: mismatches between the repricing dates of interest bearing assets and liabilities; and the investment of capital and other non-interest bearing liabilities in interest bearing assets. Interest rate risk is reported using various techniques including: VaR and scenario analysis (to a 1% shock).
a) VaR non-traded interest rate risk
The repricing assumptions used to determine the VaR and 1% rate shock have been independently validated. Below are aggregate VaR figures covering non-traded interest rate risk.
| 2012 | 2011 | |||||||||||||||||||||||||||||||||
| Consolidated | As at $m | High for $m | Low for $m | Average for $m | As at $m | High for $m | Low for $m | Average for $m | ||||||||||||||||||||||||||
Value at risk at 99% confidence | ||||||||||||||||||||||||||||||||||
Australia | 25.9 | 28.5 | 13.7 | 20.4 | 15.3 | 28.0 | 13.2 | 19.7 | ||||||||||||||||||||||||||
New Zealand | 11.2 | 14.6 | 10.3 | 12.3 | 9.7 | 18.9 | 9.7 | 12.2 | ||||||||||||||||||||||||||
Asia Pacific, Europe & America | 5.5 | 6.0 | 4.5 | 5.2 | 4.8 | 7.2 | 2.8 | 4.6 | ||||||||||||||||||||||||||
Diversification benefit | (14.9 | ) | n/a | n/a | (15.3) | (10.8 | ) | n/a | n/a | (12.2) | ||||||||||||||||||||||||
| 27.7 | 29.4 | 15.7 | 22.6 | 19.0 | 32.8 | 16.4 | 24.3 | |||||||||||||||||||||||||||
| 2012 | 2011 | |||||||||||||||||||||||||||||||||
| The Company | As at $m | High for $m | Low for $m | Average for $m | As at $m | High for $m | Low for $m | Average for $m | ||||||||||||||||||||||||||
Value at risk at 99% confidence | ||||||||||||||||||||||||||||||||||
Australia | 25.9 | 28.5 | 13.7 | 20.4 | 15.3 | 28.0 | 13.2 | 19.7 | ||||||||||||||||||||||||||
New Zealand | 0.1 | 0.2 | 0.1 | 0.1 | 0.1 | 0.7 | 0.1 | 0.2 | ||||||||||||||||||||||||||
Asia Pacific, Europe & America | 4.5 | 5.1 | 3.9 | 4.5 | 3.9 | 6.5 | 2.0 | 3.8 | ||||||||||||||||||||||||||
Diversification benefit | (3.8 | ) | n/a | n/a | (4.7) | (3.6 | ) | n/a | n/a | (3.1) | ||||||||||||||||||||||||
| 26.7 | 28.9 | 12.9 | 20.3 | 15.7 | 27.4 | 14.0 | 20.6 | |||||||||||||||||||||||||||
VaR is calculated separately for the Australia, New Zealand and APEA geographies, as well as for the Group.
To supplement the VaR methodology, ANZ applies a wide range of stress tests, both on individual portfolios and at Group level. ANZ’s stress testing regime provides senior management with an assessment of the financial impact of identified extreme events on market risk exposures of ANZ.
b) Scenario Analysis – a 1% shock on the next 12 months’ net interest income
A 1% overnight parallel positive shift in the yield curve is modelled to determine the potential impact on net interest income over the succeeding 12 months. This is a standard risk measure which assumes the parallel shift is reflected in all wholesale and customer rates.
The figures in the table below indicate the outcome of this risk measure for the current and previous financial years – expressed as a percentage of reported net interest income. The sign indicates the nature of the rate sensitivity with a positive number signifying that a rate increase is positive for net interest income over the next 12 months.
| Consolidated | The Company | |||||||||||||||
2012 $m | 2011 $m | 2012 $m | 2011 $m | |||||||||||||
Impact of 1% rate shock | ||||||||||||||||
As at period end | 1.55% | 1.36% | 1.92% | 1.53% | ||||||||||||
Maximum exposure | 2.45% | 1.51% | 2.99% | 1.85% | ||||||||||||
Minimum exposure | 1.26% | 0.50% | 1.47% | 0.54% | ||||||||||||
Average exposure (in absolute terms) | 1.95% | 1.08% | 2.36% | 1.26% | ||||||||||||
NOTES TO THE FINANCIAL STATEMENTS 143

33: Financial Risk Management(continued)
Interest rate risk (continued)
The extent of mismatching between the repricing characteristics and timing of interest bearing assets and liabilities at any point has implications for future net interest income. On a global basis, the Group quantifies the potential variation in future net interest income as a result of these repricing mismatches.
The repricing gaps themselves are constructed based on contractual repricing information. However, for those assets and liabilities where the contractual term to repricing is not considered to be reflective of the actual interest rate sensitivity (for example, products priced at the Group’s discretion), a profile based on historically observed and/or anticipated rate sensitivity is used. This treatment excludes the effect of basis risk between customer pricing and wholesale market pricing.
Equity securities classified as available-for-sale
The portfolio of financial assets, classified as available-for-sale for measurement and financial reporting purposes, also contains equity investment holdings which predominantly comprise investments held for longer term strategic intentions. These equity investments are also subject to market risk which is not captured by the VaR measures for traded and non-traded market risks. Regular reviews are performed to substantiate valuation of the investments within the portfolio and the equity investments are regularly reviewed by management for impairment. The fair value of the constituents of equity securities classified as available-for-sale can fluctuate considerably.
The table below outlines the composition of the equity holdings.
| Consolidated | The Company | |||||||||||||||
2012 $m | 2011 $m | 2012 $m | 2011 $m | |||||||||||||
Visa Inc.1 | – | 315 | – | 247 | ||||||||||||
Sacombank1 | – | 73 | – | 73 | ||||||||||||
Other equity holdings | 71 | 91 | 66 | 58 | ||||||||||||
| 71 | 479 | 66 | 378 | |||||||||||||
Impact on equity of 10% variation in value | 7 | 48 | 7 | 38 | ||||||||||||
| 1 | Disposed during 2012. |
Foreign currency risk – structural exposures
The investment of capital in foreign operations, such as branches, subsidiaries or associates with functional currencies other than the Australian dollar, exposes the Group to the risk of changes in foreign exchange rates.
The main operating (or functional) currencies of Group entities are the Australian dollar, the New Zealand dollar and the US dollar, with a number of overseas undertakings operating in various other currencies. The Group presents its consolidated financial statements in Australian dollars, as the Australian dollar is the dominant currency. The Group’s consolidated balance sheet is therefore affected by exchange differences between the Australian dollar and functional currencies of foreign operations. Variations in the value of these overseas operations arising as a result of exchange differences are reflected in the foreign currency translation reserve in equity.
The Group routinely monitors this risk and conducts hedging, where it is expected to add shareholder value, in accordance with approved policies. The Group’s exposures to structural foreign currency risks are managed with the primary objective of ensuring, where practical, that the consolidated capital ratios are neutral to the effect of changes in exchange rates.
Selective hedges were in place during the 2012 and 2011 financial years. For details on the hedging instruments used and effectiveness of hedges of net investments in foreign operations, refer to note 12 to these financial statements. The Group’s economic hedges against New Zealand Dollar and US Dollar revenue streams are included within ‘Trading derivatives’ at note 12.
LIQUIDITY RISK (Excludes Insurance and Funds Management)
Liquidity risk is the risk that the Group is unable to meet its payment obligations as they fall due, including repaying depositors or maturing wholesale debt, or that the Group has insufficient capacity to fund increases in assets. The timing mismatch of cash flows and the related liquidity risk is inherent in all banking operations and is closely monitored by the Group. The Group maintains a portfolio of liquid assets to manage potential stresses in funding sources. The minimum level of liquidity portfolio assets to hold is based on a range of ANZ specific and general market liquidity stress scenarios such that potential cash flow obligations can be met over the short to medium term.
The Group’s liquidity and funding risks are governed by a set of principles which are approved by the ANZ Board. The core objective of the overall framework is to ensure that the Group has sufficient liquidity to meet obligations as they fall due, without incurring unacceptable losses. In response to the impact of the global financial crisis, the framework has been reviewed and updated. The following key components underpin the overall framework:
| n | maintaining the ability to meet all payment obligations in the immediate term; |
144

33: Financial Risk Management(continued)
LIQUIDITY RISK (Excludes Insurance and Funds Management)
| n | ensuring that the Group has the ability to meet ‘survival horizons’ under a range of ANZ specific and general market liquidity stress scenarios, at the site and Group-wide level, to meet cash flow obligations over the short to medium term; |
| n | maintaining strength in the Group’s balance sheet structure to ensure long term resilience in the liquidity and funding risk profile; |
| n | limiting the potential earnings at risk implications associated with unexpected increases in funding costs or the liquidation of assets under stress; |
| n | ensuring the liquidity management framework is compatible with local regulatory requirements; |
| n | preparation of daily liquidity reports and scenario analysis, quantifying the Group’s positions; |
| n | targeting a diversified funding base, avoiding undue concentrations by investor type, maturity, market source and currency; |
| n | holding a portfolio of high quality liquid assets to protect against adverse funding conditions and to support day-to-day operations; and |
| n | establishing detailed contingency plans to cover different liquidity crisis events. |
Management of liquidity and funding risks are overseen by the Group Asset and Liability Committee (GALCO).
Scenario modelling
A key component of the Group’s liquidity management framework is scenario modelling. APRA requires ADIs to assess liquidity under different scenarios, including the ‘going-concern’ and ‘name-crisis’.
‘Going-concern’: reflects the normal behaviour of cash flows in the ordinary course of business. APRA requires that the Group must be able to meet all commitments and obligations under a going concern scenario, within the ADIs normal funding capacity (‘available to fund’ limit), over at least the following 30 calendar days. In estimating the funding requirement, the Group models expected cash flows by reference to historical behaviour and contractual maturity data.
‘Name-crisis’: refers to a potential name-specific liquidity crisis which models the behaviour of cash flows where there is a problem (real or perceived) which may include, but is not limited to, operational issues, doubts about the solvency of the Group or adverse rating changes. Under this scenario the Group may have significant difficulty rolling over or replacing funding. Under a name crisis, APRA requires the Group to be cash flow positive over a five business day period.
‘Survival horizons’: The Global financial crisis has highlighted the importance of differentiating between stressed and normal market conditions in a name-specific crisis, and the different behaviour that offshore and domestic wholesale funding markets can exhibit during market stress events. As a result, the Group has enhanced its liquidity risk scenario modelling, to supplement APRA’s statutory requirements.
The Group has linked its liquidity risk appetite to defined liquidity ‘survival horizons’ (i.e. the time period under which ANZ must maintain a positive cash flow position under a specific scenario or stress). Under these scenarios, customer and/or wholesale balance sheet asset/liability flows are stressed. The following stressed scenarios are modelled:
| n | Extreme Short Term Crisis Scenario (ESTC): A name-specific stress during a period of market stress. |
| n | Short Term Crisis Scenario (NSTC): A name-specific stress during a period of normal markets conditions. |
| n | Global Funding Market Disruption (GFMD): Stressed global wholesale funding markets leading to a closure of domestic and offshore markets. |
| n | Offshore Funding Market Disruption (OFMD): Stressed global wholesale funding markets leading to a closure of offshore markets only. |
Each of ANZ’s operations is responsible for ensuring its compliance with all scenarios that are required to be modelled. Additionally, we measure, monitor and manage all modelled liquidity scenarios on an aggregated Group-wide level.
Liquidity portfolio management
The Group holds a diversified portfolio of cash and high credit quality securities that may be sold or pledged to provide same-day liquidity. This portfolio helps protect the Group’s liquidity position by providing cash in a severely stressed environment. All assets held in the prime portfolio are securities eligible for repurchase under agreements with the applicable central bank (i.e. ‘repo eligible’).
The liquidity portfolio is well diversified by counterparty, currency and tenor. Under the liquidity policy framework, securities purchased for ANZ’s liquidity portfolio must be of a similar or better credit quality to ANZ’s external long-term or short-term credit ratings and continue to be repo eligible.
NOTES TO THE FINANCIAL STATEMENTS 145

33: Financial Risk Management(continued)
Supplementing the prime liquid asset portfolio, the Group holds additional liquidity:
| n | central bank deposits with the US Federal Reserve, Bank of England, Bank of Japan and European Central Bank of $18.0 billion; |
| n | Australian Commonwealth and State Government securities and gold of $12.6 billion; and |
| n | cash and other securities to satisfy local country regulatory liquidity requirements which are not included in the liquid assets below: |
Eligible securities
| Prime liquidity portfolio (market values1) | 2012 $m | 2011 $m | ||||||
Australia | 24,050 | 20,815 | ||||||
New Zealand | 10,990 | 9,141 | ||||||
United States | 1,367 | 1,353 | ||||||
United Kingdom | 3,260 | 2,654 | ||||||
Singapore | 4,491 | 6,409 | ||||||
Hong Kong | 608 | 273 | ||||||
Japan | 1,340 | – | ||||||
Prime Liquidity Portfolio (excluding Internal RMBS) | 46,106 | 40,645 | ||||||
Internal RMBS (Australia) | 34,871 | 26,831 | ||||||
Internal RMBS (New Zealand) | 2,981 | 3,899 | ||||||
Total Prime Portfolio | 83,958 | 71,375 | ||||||
Other Eligible Securities including gold and cash on deposit with central banks | 30,605 | 20,130 | ||||||
Total | 114,563 | 91,505 | ||||||
| 1 | Market value is post the repo discount applied by the applicable central bank |
Liquidity crisis contingency planning
The Group maintains APRA-endorsed liquidity crisis contingency plans defining an approach for analysing and responding to a liquidity threatening event at a country and Group-wide level. To align with the enhanced liquidity scenario analysis framework, crisis management strategies are assessed against the Group’s crisis stress scenarios.
The framework is compliant with APRA’s key liquidity contingency crisis planning requirements and guidelines and includes:
| n | the establishment of crisis severity/stress levels; |
| n | clearly assigned crisis roles and responsibilities; |
| n | early warning signals indicative of an approaching crisis, and mechanisms to monitor and report these signals; |
| n | crisis declaration assessment processes, and related escalation triggers set against early warning signals; |
| n | outlined action plans, and courses of action for altering asset and liability behaviour; |
| n | procedures for crisis management reporting, and making up cash-flow shortfalls; |
| n | guidelines determining the priority of customer relationships in the event of liquidity problems; and |
| n | assigned responsibilities for internal and external communications. |
146

33: Financial Risk Management(continued)
Regulatory Change
The Basel III Liquidity proposals remain subject to finalisation from both the Basel Committee and APRA. The proposed changes include the introduction of two new liquidity ratios to measure liquidity risk (the Liquidity Coverage Ratio (LCR) and the Net Stable Funding Ratio (NSFR)). A component of the liquidity required under the proposed standards will likely be met via the previously announced Committed Liquidity Facility from the Reserve Bank of Australian (RBA), however the size and availability of the facility is not yet agreed with APRA and the RBA. While ANZ has an existing stress scenario framework and structural liquidity risk metrics and limits in place, the requirements proposed are in general more challenging. These changes may impact the future composition and size of ANZ’s liquidity portfolio, the size and composition of the Bank’s funding base and consequently could affect future profitability. APRA is proposing to release further details on its requirements during the first quarter of 2013 following an anticipated release of further information from the Basel Committee on Banking Supervision early in 2013. APRA currently proposes to implement the LCR on 1 January 2015 and the NSFR on 1 January 2018 in line with the Basel Committee’s timetable for liquidity risk.
Group funding
ANZ manages its funding profile using a range of funding metrics and balance sheet disciplines. This approach is designed to ensure that an appropriate proportion of the Group’s assets are funded by stable funding sources including core customer deposits, longer-dated wholesale funding (with a remaining term exceeding one year) and equity.
The Group’s global wholesale funding strategy is designed to deliver a sustainable portfolio of wholesale funds that balances cost efficiency against prudent duration.
Funding plans and performance relative to those plans are reported regularly to senior management via the GALCO. These plans address customer balance sheet growth and changes in wholesale funding including, targeted funding volumes, markets, investors, tenors and currencies for senior, subordinated and hybrid transactions. Plans are supplemented with a monthly forecasting process which reviews the funding position to-date in light of market conditions and balance sheet requirements.
Funding plans are generated through the three-year strategic planning process. Asset and deposit plans are submitted at the business segment level with the wholesale funding requirements then derived at the geographic level. To the extent that asset growth exceeds funding generated from customer deposits, additional wholesale funds are sourced.
Short-term wholesale funding requirements, with a contractual maturity of less than one year, are managed through Group Treasury and local Markets operations. Long-term wholesale funding is managed and executed through Group Treasury operations in Australia and New Zealand.
Funding position 2012
ANZ targets a diversified funding base, avoiding undue concentrations by investor type, maturity, market source and currency. Diversification was further enhanced during the year with the introduction of a covered bond funding programme.
As at September 2012, the composition of the Group’s funding profile was:
| n | Term wholesale funding with a remaining maturity of more than one year of $68.4 billion (12% of total funding) |
| n | Term wholesale funding with a remaining maturity of one year or less of $25.4 billion (5% of total funding) |
| n | Short-term wholesale funding (including central bank deposits) of $78.9 billion (14% of total funding) |
| n | Shareholders’ equity and hybrids of $46.3 billion (8% of total funding) |
$25.8 billion of term wholesale debt (with a remaining term greater than one year as at 30 September 2012) was issued during the September 2012 financial year, of which $4.5 billion is pre-funding for the September 2013 financial year.
ANZ maintained access to all major global wholesale funding markets during 2012:
| n | Benchmark term debt issues were completed in AUD, USD, EUR, JPY, CHF, GBP, CNH and NZD. |
| n | All short-term wholesale funding needs were met. |
| n | The weighted average tenor of new term debt issuance remained relatively flat at 4.6 years (4.7yrs in 2011). |
| n | The weighted average cost of new term debt issuance increased further in 2012 as a result of volatility in global markets. Conditions improved towards the end of the year, however average portfolio costs remain substantially above pre-crisis levels and continue to increase as maturing term wholesale funding is replaced at higher spreads. |
NOTES TO THE FINANCIAL STATEMENTS 147

33: Financial Risk Management(continued)
The following tables show the Group’s funding composition:
| Consolidated | ||||||||
| Funding composition | 2012 $m | 2011 $m | ||||||
Customer deposits and other liabilities1 | ||||||||
Australia | 140,798 | 126,969 | ||||||
International & Institutional Banking | 142,662 | 129,683 | ||||||
New Zealand | 39,622 | 35,938 | ||||||
Global Wealth & Private Banking | 9,449 | 8,129 | ||||||
Group Centre | (4,655 | ) | (3,965) | |||||
Total customer deposits | 327,876 | 296,754 | ||||||
Other2 | 9,841 | 11,450 | ||||||
Total customer deposits and other liabilities (funding) | 337,717 | 308,204 | ||||||
Wholesale funding4,5 | ||||||||
Bonds and notes6 | 62,693 | 56,551 | ||||||
Loan capital | 11,914 | 11,993 | ||||||
Certificates of deposit (wholesale) | 56,838 | 55,554 | ||||||
Commercial paper | 12,164 | 14,333 | ||||||
Due to other financial institutions | 30,538 | 27,535 | ||||||
Other wholesale borrowings3 | 4,585 | (450) | ||||||
Total wholesale funding | 178,732 | 165,516 | ||||||
Shareholders’ equity | 40,349 | 37,083 | ||||||
Total funding maturity | ||||||||
Short term wholesale funding (excl Central Banks) | 11% | 11% | ||||||
Central Bank Deposits | 3% | 2% | ||||||
Long term wholesale funding | ||||||||
– Less than 1 year residual maturity | 5% | 6% | ||||||
– Greater than 1 year residual maturity5 | 12% | 12% | ||||||
Total customer deposits and other liabilities (funding) | 61% | 60% | ||||||
Shareholders’ equity and hybrid debt | 8% | 9% | ||||||
Total funding and shareholders’ equity | 100% | 100% | ||||||
| 1 | Includes term deposits, other deposits and an adjustment to the Group Centre to eliminate OnePath Australia investments in ANZ deposit products. |
| 2. | Includes interest accruals, payables and other liabilities, provisions and net tax provisions, excluding other liabilities in OnePath. |
| 3. | Includes net derivative balances, special purpose vehicles, other borrowings and preference share capital Euro hybrids. |
| 4. | Long term wholesale funding amounts are stated at original hedged exchange rates. Movements due to currency fluctuations in actual amounts borrowed are classified as short term wholesale funding. |
| 5. | Liability for acceptances have been removed as they do not provide net funding. |
| 6. | Excludes term debt issued externally by OnePath. |
Liquidity risk – Insurance and Funds Management
The Group’s insurance and fund management businesses, such as ANZ Wealth Australia Limited (formerly OnePath Australia Limited), also apply their own liquidity and funding methods to address their specific needs.
As at 30 September 2012 a number of investment options in the life insurance statutory funds were suspended due to the prescribed limits on their liquidity facilities being reached. These suspensions are not a consequence of any performance issue of the Life Company and do not affect the Group’s future performance or distributions. The Net Market Value of suspended funds is $282 million (2011: $524 million).
148

33: Financial Risk Management(continued)
Contractual maturity analysis of the Group’s liabilities
The tables below analyse the Group’s and Company’s contractual liabilities, within relevant maturity groupings based on the earliest date on which the Group or Company may be required to pay. The amounts represent principal and interest cash flows and hence may differ compared to the amounts reported on the balance sheet.
It should be noted that this is not how the Group manages its liquidity risk. The management of this risk is detailed above.
Contractual maturity analysis of financial liabilities at 30 September:
| Consolidated at 30 September 2012 |
| Less than 3 months $m | 1
|
| 3 to 12 months $m |
|
| 1 to 5 years $m |
|
| After 5 years $m |
|
| No maturity specified $m |
2
|
| Total $m |
| ||||||
Due to other financial institutions | 29,345 | 1,177 | 36 | – | – | 30,558 | ||||||||||||||||||
Deposits and other borrowings | ||||||||||||||||||||||||
Certificates of deposit | 30,058 | 13,462 | 15,072 | – | – | 58,592 | ||||||||||||||||||
Term deposits | 126,137 | 43,676 | 5,918 | 108 | – | 175,839 | ||||||||||||||||||
Other deposits bearing interest | 142,527 | – | – | – | – | 142,527 | ||||||||||||||||||
Deposits not bearing interest | 11,782 | – | – | – | – | 11,782 | ||||||||||||||||||
Commercial paper | 7,373 | 4,795 | – | – | – | 12,168 | ||||||||||||||||||
Borrowing corporations’ debt | 353 | 715 | 269 | – | – | 1,337 | ||||||||||||||||||
Other borrowings | 246 | – | – | – | – | 246 | ||||||||||||||||||
Liability for acceptances | 1,239 | – | – | – | – | 1,239 | ||||||||||||||||||
Bonds and notes3 | 5,708 | 11,133 | 41,813 | 8,770 | – | 67,424 | ||||||||||||||||||
Loan capital3,4 | 722 | 2,028 | 7,768 | 2,552 | 953 | 14,023 | ||||||||||||||||||
Policy liabilities | 28,763 | – | – | – | 774 | 29,537 | ||||||||||||||||||
External unit holder liabilities (life insurance funds) | 3,949 | – | – | – | – | 3,949 | ||||||||||||||||||
Derivative liabilities (trading)5 | 39,725 | – | – | – | – | 39,725 | ||||||||||||||||||
Derivative assets and liabilities (balance sheet management) | ||||||||||||||||||||||||
– Funding | ||||||||||||||||||||||||
Receive leg (-ve is an inflow) | (23,932 | ) | (35,200 | ) | (69,846 | ) | (18,033 | ) | – | (147,011) | ||||||||||||||
Pay leg | 25,714 | 36,402 | 75,419 | 19,073 | – | 156,608 | ||||||||||||||||||
– Other balance sheet management | ||||||||||||||||||||||||
Receive leg (-ve is an inflow) | (5,570 | ) | (6,471 | ) | (11,254 | ) | (3,475 | ) | – | (26,770) | ||||||||||||||
Pay leg | 5,593 | 6,663 | 11,009 | 3,263 | – | 26,528 | ||||||||||||||||||
| Consolidated at 30 September 2011 |
| Less than 3 months $m | 1
|
| 3 to 12 months $m |
|
| 1 to 5 years $m |
|
| After 5 years $m |
|
| No maturity specified $m |
2
|
| Total $m |
| ||||||
Due to other financial institutions | 26,049 | 1,427 | 37 | 49 | – | 27,562 | ||||||||||||||||||
Deposits and other borrowings | ||||||||||||||||||||||||
Certificates of deposit | 33,740 | 5,949 | 18,440 | – | – | 58,129 | ||||||||||||||||||
Term deposits | 110,265 | 42,039 | 4,230 | 38 | – | 156,572 | ||||||||||||||||||
Other deposits bearing interest | 130,741 | – | – | – | – | 130,741 | ||||||||||||||||||
Deposits not bearing interest | 11,334 | – | – | – | – | 11,334 | ||||||||||||||||||
Commercial paper | 9,907 | 4,433 | – | – | – | 14,340 | ||||||||||||||||||
Borrowing corporations’ debt | 773 | 487 | 328 | – | – | 1,588 | ||||||||||||||||||
Other borrowings | 2,053 | – | – | – | – | 2,053 | ||||||||||||||||||
Liability for acceptances | 921 | 49 | – | – | – | 970 | ||||||||||||||||||
Bonds and notes3 | 4,854 | 11,777 | 36,773 | 6,997 | – | 60,401 | ||||||||||||||||||
Loan capital3,4 | 352 | 2,211 | 5,166 | 5,273 | 964 | 13,966 | ||||||||||||||||||
Policy liabilities | 26,619 | – | – | – | 884 | 27,503 | ||||||||||||||||||
External unit holder liabilities (life insurance funds) | 5,033 | – | – | – | – | 5,033 | ||||||||||||||||||
Derivative liabilities (trading)5 | 44,263 | – | – | – | – | 44,263 | ||||||||||||||||||
Derivative assets and liabilities (balance sheet management) | ||||||||||||||||||||||||
– Funding | ||||||||||||||||||||||||
Receive leg (-ve is an inflow) | (24,477 | ) | (24,133 | ) | (78,670 | ) | (13,827 | ) | – | (141,107) | ||||||||||||||
Pay leg | 25,202 | 26,749 | 81,837 | 14,970 | – | 148,758 | ||||||||||||||||||
– Other balance sheet management | ||||||||||||||||||||||||
Receive leg (-ve is an inflow) | (2,763 | ) | (4,677 | ) | (10,865 | ) | (1,812 | ) | – | (20,117) | ||||||||||||||
Pay leg | 2,785 | 4,835 | 10,910 | 1,746 | – | 20,276 | ||||||||||||||||||
| 1 | Includes at call instruments. |
| 2 | Includes perpetual investments brought in at face value only. |
| 3 | Any callable wholesale debt instruments have been included at their next call date. |
| 4 | Includes instruments that may be settled in cash or in equity, at the option of the Company. |
| 5 | The full mark-to-market of derivative liabilities held for trading purposes has been included in the ‘less than 3 months’ category. |
NOTES TO THE FINANCIAL STATEMENTS 149

33: Financial Risk Management(continued)
| The Company at 30 September 2012 |
| Less than 3 months $m | 1
|
| 3 to 12 months $m |
|
| 1 to 5 years $m |
|
| After 5 years $m |
|
| No maturity specified $m |
2
|
| Total $m |
| ||||||
Due to other financial institutions | 27,198 | 1,173 | 36 | – | – | 28,407 | ||||||||||||||||||
Deposits and other borrowings | ||||||||||||||||||||||||
Certificates of deposit | 28,685 | 13,322 | 15,072 | – | – | 57,079 | ||||||||||||||||||
Term deposits | 109,924 | 30,023 | 3,587 | 106 | – | 143,640 | ||||||||||||||||||
Other deposits bearing interest | 122,614 | – | – | – | – | 122,614 | ||||||||||||||||||
Deposits not bearing interest | 6,556 | – | – | – | – | 6,556 | ||||||||||||||||||
Commercial paper | 5,272 | 2,549 | – | – | – | 7,821 | ||||||||||||||||||
Other borrowings | 197 | – | – | – | – | 197 | ||||||||||||||||||
Liability for acceptances | 1,012 | – | – | – | – | 1,012 | ||||||||||||||||||
Bonds and notes3 | 3,883 | 8,841 | 33,466 | 7,047 | – | 53,237 | ||||||||||||||||||
Loan capital3,4 | 669 | 2,010 | 7,803 | 2,552 | 287 | 13,321 | ||||||||||||||||||
Derivative liabilities (trading)5 | 36,070 | – | – | – | – | 36,070 | ||||||||||||||||||
Derivative assets and liabilities (balance sheet management) | ||||||||||||||||||||||||
– Funding | ||||||||||||||||||||||||
Receive leg (-ve is an inflow) | (16,166 | ) | (21,771 | ) | (53,558 | ) | (15,506 | ) | – | (107,001) | ||||||||||||||
Pay leg | 17,511 | 23,142 | 57,983 | 16,523 | – | 115,159 | ||||||||||||||||||
– Other balance sheet management | ||||||||||||||||||||||||
Receive leg (-ve is an inflow) | (5,028 | ) | (4,816 | ) | (9,030 | ) | (3,197 | ) | – | (22,071) | ||||||||||||||
Pay leg | 4,992 | 4,962 | 8,703 | 2,988 | – | 21,645 | ||||||||||||||||||
| The Company at 30 September 2011 | | Less than 3 months $m | 1 | | 3 to 12 months $m | | | 1 to 5 years | | | After 5 years | |
| No maturity specified $m |
2
|
| Total $m |
| ||||||
Due to other financial institutions | 23,353 | 1,344 | 37 | – | – | 24,734 | ||||||||||||||||||
Deposits and other borrowings | ||||||||||||||||||||||||
Certificates of deposit | 32,165 | 5,867 | 18,440 | – | – | 56,472 | ||||||||||||||||||
Term deposits | 93,805 | 30,048 | 2,142 | 39 | – | 126,034 | ||||||||||||||||||
Other deposits bearing interest | 113,140 | – | – | – | – | 113,140 | ||||||||||||||||||
Deposits not bearing interest | 5,974 | – | – | – | – | 5,974 | ||||||||||||||||||
Commercial paper | 7,259 | 3,317 | – | – | – | 10,576 | ||||||||||||||||||
Other borrowings | – | – | – | – | – | – | ||||||||||||||||||
Liability for acceptances | 645 | 42 | – | – | – | 687 | ||||||||||||||||||
Bonds and notes3 | 3,626 | 9,596 | 27,775 | 6,736 | – | 47,733 | ||||||||||||||||||
Loan capital3,4 | 271 | 2,175 | 5,183 | 4,803 | 308 | 12,741 | ||||||||||||||||||
Derivative liabilities (trading)5 | 39,878 | – | – | – | – | 39,878 | ||||||||||||||||||
Derivative assets and liabilities (balance sheet management) | ||||||||||||||||||||||||
– Funding | ||||||||||||||||||||||||
Receive leg (-ve is an inflow) | (8,773 | ) | (14,565 | ) | (53,934 | ) | (13,827 | ) | – | (91,099) | ||||||||||||||
Pay leg | 10,122 | 16,550 | 57,263 | 14,970 | – | 98,905 | ||||||||||||||||||
– Other balance sheet management | ||||||||||||||||||||||||
Receive leg (-ve is an inflow) | (2,167 | ) | (3,485 | ) | (8,808 | ) | (1,619 | ) | – | (16,079) | ||||||||||||||
Pay leg | 2,109 | 3,539 | 8,759 | 1,547 | – | 15,954 | ||||||||||||||||||
| 1 | Includes at call instruments. |
| 2 | Includes perpetual investments brought in at face value only. |
| 3 | Any callable wholesale debt instruments have been included at their next call date. |
| 4 | Includes instruments that may be settled in cash or in equity, at the option of the Company. |
| 5 | The full mark-to-market of derivative liabilities held for trading purposes has been included in the ‘less than 3 months’ category. |
150

33: Financial Risk Management(continued)
CREDIT RELATED CONTINGENCIES
Undrawn facilities and issued guarantees comprise the nominal principal amounts of commitments, contingencies and other undrawn facilities and represents the maximum liquidity at risk position should all facilities extended be drawn.
The majority of undrawn facilities are subject to customers maintaining specific credit and other requirements or conditions. Many of these facilities are expected to be partially used, whereas others may never be required to be drawn upon. As such, the total of the nominal principal amounts is not necessarily representative of future liquidity risks or future cash requirements.
The tables below analyse the Group’s and Company’s undrawn facilities and issued guarantees into relevant maturity groupings based on the earliest date on which ANZ may be required to pay.
| Consolidated | The Company | |||||||||||||||||||||||||
| 30 September 2012 | Less than 1 year $m | More than $m | Total $m | Less than 1 year $m | More than $m | Total $m | ||||||||||||||||||||
Undrawn facilities | 141,355 | – | 141,355 | 118,461 | – | 118,461 | ||||||||||||||||||||
Issued guarantees | 32,383 | – | 32,383 | 29,619 | – | 29,619 | ||||||||||||||||||||
| Consolidated | The Company | |||||||||||||||||||||||||
| 30 September 2011 | Less than $m | More than $m | Total $m | Less than $m | More than $m | Total $m | ||||||||||||||||||||
Undrawn facilities1 | 135,243 | – | 135,243 | 114,461 | – | 114,461 | ||||||||||||||||||||
Issued guarantees | 31,210 | – | 31,210 | 28,269 | – | 28,269 | ||||||||||||||||||||
| 1 | September 2011 undrawn facilities have been restated by $2,646 million using the revised methodology for undrawn overdrafts that was implemented during 2012. |
LIFE INSURANCE RISK
Although not a significant contributor to the Group’s balance sheet, the Group’s insurance businesses give rise to unique risks which are managed separately from the Group’s banking businesses. The nature of these risks and the manner in which they are managed is set out in note 48.
OPERATIONAL RISK MANAGEMENT
Within ANZ, operational risk is defined as the risk of loss resulting from inadequate or failed internal processes, people and systems or from external events. This definition includes legal risk, and the risk of reputational loss or damage arising from inadequate or failed internal processes, people and systems, but excludes strategic risk.
The authority for operational risk oversight is delegated by the Board to the Board Risk Committee. The Operational Risk Executive Committee (OREC) supports the Board Risk Committee in respect of operational risk oversight which includes compliance with regulatory obligations.
The key responsibilities of OREC include:
| n | endorse ANZ’s Operational Risk Management and Measurement Framework for approval by the Risk Committee of the Board; |
| n | approve Operational Risk and Compliance policies; |
| n | approve ANZ’s Group Compliance Framework; |
| n | monitoring the state of operational risk management and instigating any necessary corrective actions; |
| n | review all material actual, potential or near miss risk events; |
| n | approve extreme rated risk treatment plans; and |
| n | monitor associated treatment plans. |
NOTES TO THE FINANCIAL STATEMENTS 151

33: Financial Risk Management(continued)
Membership of OREC comprises senior executives and the committee is chaired by the Chief Risk Officer.
Business unit staff and line management have first line accountability for the day-to-day management of operational risk. This includes implementation of the operational risk framework and involvement in decision making processes concerning all material operational risk matters. Divisional risk governance functions provide oversight of operational risk undertaken in the business units.
Divisional Risk Committees and Business Unit Risk Forums manage and maintain oversight of operational risks supported by thresholds for escalation and monitoring. Group Operational Risk are responsible for exercising governance over operational risk through the management of the operational risk framework, policy development, framework assurance, operational risk measurement and capital allocation, fraud strategy and reporting of operational risk matters to executive committees.
ANZ’s Operational Risk Management and Measurement Framework outlines the approach to managing operational risk and specifically covers the minimum requirements that divisions/business units must undertake in the management of operational risk. ANZ’s Operational Risk Management and Measurement Framework is supported by specific policies and procedures with the effectiveness of the framework assessed through a series of assurance reviews. This is supported by an independent review programme by Internal Audit.
The operational risk management process adopted by ANZ consists of a staged approach involving establishing the context, identification, analysis, assessment, treatment and monitoring of current, new and emerging operational risks.
In line with industry practice, ANZ obtains insurance cover from third party and captive providers to cover those operational risks where cost-effective premiums can be obtained. In conducting their business, business units are advised to act as if uninsured and not to use insurance as a guaranteed mitigation for operational risk. Business disruption is a critical risk to a bank’s ability to operate, so ANZ has comprehensive business continuity, recovery and crisis management plans. The intention of the business continuity and recovery plans is to ensure critical business functions can be maintained, or restored in a timely fashion, in the event of material disruptions arising from internal or external events.
Group Operational Risk is responsible for maintaining ANZ’s Advanced Measurement Approach (AMA) for operational risk regulatory capital calculations. ANZ uses a scenario analysis based methodology to assess exposure to unexpected operational risk events and uses probability distributions and monte carlo simulations to model, calculate and allocate its operational risk regulatory capital (ORRC). This methodology incorporates the use of business risk profiles which consider the current business environment and internal control factors over a 12 month time horizon along with external loss event data.
34: Fair value of financial assets and financial liabilities
Fair value is the amount for which an asset could be exchanged, or a liability settled, between knowledgeable, willing parties in an arm’s length transaction. The determination of the fair value of financial instruments is fundamental to the financial reporting framework as all financial instruments are recognised initially at fair value and, with the exception of those financial instruments carried at amortised cost, are remeasured at fair value in subsequent periods.
The fair value of a financial instrument on initial recognition is normally the transaction price, however, in certain circumstances the initial fair value may be based on other observable current market transactions in the same instrument, without modification or repackaging, or on a valuation technique whose variables include only data from observable markets.
Subsequent to initial recognition, the fair value of financial instruments measured at fair value is based on quoted market prices, where available. In cases where quoted market prices are not available, fair value is determined using market accepted valuation techniques that employ observable market data. In limited cases where observable market data is not available, the input is estimated based on other observable market data, historical trends and other factors that may be relevant.
(i) Fair values of financial assets and financial liabilities
A significant number of financial instruments are carried at fair value in the balance sheet. Below is a comparison of the carrying amounts, as reported on the balance sheet, and fair values of all financial assets and liabilities. The fair value disclosure does not cover those instruments that are not considered financial instruments from an accounting perspective such as income tax and intangible assets. In management’s view, the aggregate fair value amounts do not represent the underlying value of the Group.
In the tables below, financial instruments have been allocated based on their accounting treatment. The significant accounting policies in note 1 describe how the categories of financial assets and financial liabilities are measured and how income and expenses, including fair value gains and losses, are recognised.
Financial asset classes have been allocated into the following groups: amortised cost; financial assets at fair value through profit or loss; derivatives in effective hedging relationships; and available-for-sale financial assets. Similarly, each class of financial liability has been allocated into three groups: amortised cost; derivatives in effective hedging relationships; and financial liabilities at fair value through profit and loss.
The fair values are based on relevant information available as at the respective balance sheet dates and have not been updated to reflect changes in market condition after the balance sheet date.
152

34: Fair Value of Financial Assets and Financial Liabilities(continued)
FINANCIAL ASSETS
| Carrying amount | Fair value | |||||||||||||||||||||||||||||||||
| At amortised cost | At fair value through profit or loss | Hedging | Available-for- sale assets | Total | Total | |||||||||||||||||||||||||||||
| Consolidated 30 September 2012 | $m | Designated on initial recognition $m | Held for trading $m | Sub-total $m | $m | $m | $m | $m | ||||||||||||||||||||||||||
Liquid assets | 36,578 | – | – | – | – | – | 36,578 | 36,578 | ||||||||||||||||||||||||||
Due from other financial institutions | 17,103 | – | – | – | – | – | 17,103 | 17,103 | ||||||||||||||||||||||||||
Trading securities | – | – | 40,602 | 40,602 | – | – | 40,602 | 40,602 | ||||||||||||||||||||||||||
Derivative financial instruments1 | – | – | 45,531 | 45,531 | 3,398 | – | 48,929 | 48,929 | ||||||||||||||||||||||||||
Available-for-sale assets | – | – | – | – | – | 20,562 | 20,562 | 20,562 | ||||||||||||||||||||||||||
Loans and advances2 | 427,719 | 104 | – | 104 | – | – | 427,823 | 428,483 | ||||||||||||||||||||||||||
Investments backing policy liabilities | – | 29,895 | – | 29,895 | – | – | 29,895 | 29,895 | ||||||||||||||||||||||||||
Other financial assets | 5,794 | – | – | – | – | – | 5,794 | 5,794 | ||||||||||||||||||||||||||
| 487,194 | 29,999 | 86,133 | 116,132 | 3,398 | 20,562 | 627,286 | 627,946 | |||||||||||||||||||||||||||
| Carrying amount | Fair value | |||||||||||||||||||||||||||||||||
| At amortised cost | At fair value through profit or loss | Hedging | Available-for- sale assets | Total | Total | |||||||||||||||||||||||||||||
| Consolidated 30 September 2011 | $m | Designated on initial recognition $m | Held for trading $m | Sub-total $m | $m | $m | $m | $m | ||||||||||||||||||||||||||
Liquid assets | 25,627 | – | – | – | – | – | 25,627 | 25,627 | ||||||||||||||||||||||||||
Due from other financial institutions | 13,298 | – | – | – | – | – | 13,298 | 13,298 | ||||||||||||||||||||||||||
Trading securities | – | – | 36,074 | 36,074 | – | – | 36,074 | 36,074 | ||||||||||||||||||||||||||
Derivative financial instruments1 | – | – | 55,917 | 55,917 | 2,724 | – | 58,641 | 58,641 | ||||||||||||||||||||||||||
Available-for-sale assets | – | – | – | – | – | 22,264 | 22,264 | 22,264 | ||||||||||||||||||||||||||
Loans and advances2 | 397,169 | 138 | – | 138 | – | – | 397,307 | 397,596 | ||||||||||||||||||||||||||
Investments backing policy liabilities | – | 29,859 | – | 29,859 | – | – | 29,859 | 29,859 | ||||||||||||||||||||||||||
Other financial assets | 6,485 | – | – | – | – | – | 6,485 | 6,485 | ||||||||||||||||||||||||||
| 442,579 | 29,997 | 91,991 | 121,988 | 2,724 | 22,264 | 589,555 | 589,844 | |||||||||||||||||||||||||||
| Carrying amount | Fair value | |||||||||||||||||||||||||||||||||
| At amortised cost | At fair value through profit or loss | Hedging | Available-for- sale assets | Total | Total | |||||||||||||||||||||||||||||
| The Company 30 September 2012 | $m | Designated on initial recognition $m | Held for trading $m | Sub-total $m | $m | $m | $m | $m | ||||||||||||||||||||||||||
Liquid assets | 32,782 | – | – | – | – | – | 32,782 | 32,782 | ||||||||||||||||||||||||||
Due from other financial institutions | 14,167 | – | – | – | – | – | 14,167 | 14,167 | ||||||||||||||||||||||||||
Trading securities | – | – | 30,490 | 30,490 | – | – | 30,490 | 30,490 | ||||||||||||||||||||||||||
Derivative financial instruments1 | – | – | 40,284 | 40,284 | 2,982 | – | 43,266 | 43,266 | ||||||||||||||||||||||||||
Available-for-sale assets | – | – | – | – | – | 17,841 | 17,841 | 17,841 | ||||||||||||||||||||||||||
Loans and advances2 | 349,995 | 65 | – | 65 | – | – | 350,060 | 350,572 | ||||||||||||||||||||||||||
Other financial assets | 3,473 | – | – | – | – | – | 3,473 | 3,473 | ||||||||||||||||||||||||||
| 400,417 | 65 | 70,774 | 70,839 | 2,982 | 17,841 | 492,079 | 492,591 | |||||||||||||||||||||||||||
| 1 | Derivative financial instruments classified as ‘held for trading’ include derivatives entered into as economic hedges which are not designated as accounting hedges. |
| 2 | Fair value hedging is applied to financial assets within loans and advances. The resulting fair value adjustments mean that the carrying value differs from the amortised cost. |
NOTES TO THE FINANCIAL STATEMENTS 153

34: Fair Value of Financial Assets and Financial Liabilities(continued)
FINANCIAL ASSETS (continued)
| Carrying amount | Fair value | |||||||||||||||||||||||||||||||||
| At amortised cost | At fair value through profit or loss | Hedging | Available-for- sale assets | Total | Total | |||||||||||||||||||||||||||||
| The Company 30 September 2011 | $m | Designated on initial recognition $m | Held for trading $m | Sub-total $m | $m | $m | $m | $m | ||||||||||||||||||||||||||
Liquid assets | 21,283 | – | – | – | – | – | 21,283 | 21,283 | ||||||||||||||||||||||||||
Due from other financial institutions | 10,070 | – | – | – | – | – | 10,070 | 10,070 | ||||||||||||||||||||||||||
Trading securities | – | – | 28,367 | 28,367 | – | – | 28,367 | 28,367 | ||||||||||||||||||||||||||
Derivative financial instruments1 | – | – | 49,437 | 49,437 | 2,283 | – | 51,720 | 51,720 | ||||||||||||||||||||||||||
Available-for-sale assets | – | – | – | – | – | 19,017 | 19,017 | 19,017 | ||||||||||||||||||||||||||
Loans and advances2 | 323,877 | 97 | – | 97 | – | – | 323,974 | 324,087 | ||||||||||||||||||||||||||
Other financial assets | 3,463 | – | – | – | – | – | 3,463 | 3,463 | ||||||||||||||||||||||||||
| 358,693 | 97 | 77,804 | 77,901 | 2,283 | 19,017 | 457,894 | 458,007 | |||||||||||||||||||||||||||
| 1 | Derivative financial instruments classified as ‘held for trading’ include derivatives entered into as economic hedges which are not designated as accounting hedges. |
| 2 | Fair value hedging is applied to financial assets within loans and advances. The resulting fair value adjustments mean that the carrying value differs from the amortised cost. |
LIQUID ASSETS AND DUE FROM/TO OTHER FINANCIAL INSTITUTIONS
The carrying values of these financial instruments where there has been no significant change in credit risk is considered to approximate their net fair values as they are short-term in nature, defined as those which reprice or mature in 90 days or less, or are receivable on demand.
TRADING SECURITIES
Trading securities are carried at fair value. Fair value is based on quoted market prices, broker or dealer price quotations, or modelled valuations using prices for securities with similar credit risk, maturity and yield characteristics.
DERIVATIVE FINANCIAL INSTRUMENTS
Derivative financial instruments are carried at fair value. Exchange traded derivative financial instruments are valued using quoted prices. Over-the-counter derivative financial instruments are valued using accepted valuation models (including discounted cash flow models) based on current market yields for similar types of instruments and the maturity of each instrument and an adjustment reflecting the credit worthiness of the counterparty.
AVAILABLE-FOR-SALE ASSETS
Available-for-sale assets are carried at fair value. Fair value is based on quoted market prices or broker or dealer price quotations. If this information is not available, fair value is estimated using quoted market prices for securities with similar credit, maturity and yield characteristics, or market accepted valuation models as appropriate (including discounted cash flow models) based on current market yields for similar types of instruments and the maturity of each instrument.
NET LOANS AND ADVANCES
The carrying value of loans and advances includes deferred fees and expenses, and is net of provision for credit impairment and unearned income.
Fair value has been determined through discounting future cash flows. For fixed rate loans and advances, the discount rate applied incorporates changes in wholesale market rates, the Group’s cost of wholesale funding and the customer margin. For floating rate loans, only changes in wholesale market rates and the Group’s cost of wholesale funding are incorporated in the discount rate. For variable rate loans where the Group sets the applicable rate at its discretion, the fair value is set equal to the carrying value.
INVESTMENTS BACKING POLICY LIABILITIES
Investments backing policy liabilities are carried at fair value. Fair value is based on quoted market prices, broker or dealer price quotations where available. Where substantial trading markets do not exist for a specific financial instrument modelled valuations are used to estimate their approximate fair values.
OTHER FINANCIAL ASSETS
Included in this category are accrued interest and fees receivable. The carrying values of accrued interest and fees receivable are considered to approximate their net fair values as they are short-term in nature or are receivable on demand.
| 154 |

34: Fair Value of Financial Assets and Financial Liabilities(continued)
FINANCIAL LIABILITIES
| Carrying amount | Fair value | |||||||||||||||||||||||||||||
| At amortised cost | At fair value through profit or loss | Hedging | Total | Total | ||||||||||||||||||||||||||
| Consolidated 30 September 2012 | $m | Designated on initial recognition $m | Held for trading $m | Sub-total $m | $m | $m | $m | |||||||||||||||||||||||
Due to other financial institutions | 30,538 | – | – | – | – | 30,538 | 30,538 | |||||||||||||||||||||||
Derivative financial instruments1 | – | – | 50,887 | 50,887 | 1,752 | 52,639 | 52,639 | |||||||||||||||||||||||
Deposits and other borrowings | 392,777 | 4,346 | – | 4,346 | – | 397,123 | 397,571 | |||||||||||||||||||||||
Bonds and notes2 | 56,633 | 6,465 | – | 6,465 | – | 63,098 | 63,780 | |||||||||||||||||||||||
Loan capital2 | 11,281 | 633 | – | 633 | – | 11,914 | 11,869 | |||||||||||||||||||||||
Policy liabilities3 | 774 | 28,763 | – | 28,763 | – | 29,537 | 29,537 | |||||||||||||||||||||||
External unit holder liabilities (life insurance funds) | – | 3,949 | – | 3,949 | – | 3,949 | 3,949 | |||||||||||||||||||||||
Payables and other liabilities | 8,095 | – | – | – | – | 8,095 | 8,095 | |||||||||||||||||||||||
| 500,098 | 44,156 | 50,887 | 95,043 | 1,752 | 596,893 | 597,978 | ||||||||||||||||||||||||
| Carrying amount | Fair value | |||||||||||||||||||||||||||||
| At amortised cost | At fair value through profit or loss | Hedging | Total | Total | ||||||||||||||||||||||||||
| Consolidated 30 September 2011 | $m | Designated on initial recognition $m | Held for trading $m | Sub-total $m | $m | $m | $m | |||||||||||||||||||||||
Due to other financial institutions | 27,535 | – | – | – | – | 27,535 | 27,535 | |||||||||||||||||||||||
Derivative financial instruments1 | – | – | 54,133 | 54,133 | 1,157 | 55,290 | 55,290 | |||||||||||||||||||||||
Deposits and other borrowings | 364,965 | 3,764 | – | 3,764 | – | 368,729 | 369,035 | |||||||||||||||||||||||
Bonds and notes2 | 48,559 | 7,992 | – | 7,992 | – | 56,551 | 56,403 | |||||||||||||||||||||||
Loan capital2 | 11,355 | 638 | – | 638 | – | 11,993 | 11,849 | |||||||||||||||||||||||
Policy liabilities3 | 884 | 26,619 | – | 26,619 | – | 27,503 | 27,503 | |||||||||||||||||||||||
External unit holder liabilities (life insurance funds) | – | 5,033 | – | 5,033 | – | 5,033 | 5,033 | |||||||||||||||||||||||
Payables and other liabilities | 9,391 | – | – | – | – | 9,391 | 9,391 | |||||||||||||||||||||||
| 462,689 | 44,046 | 54,133 | 98,179 | 1,157 | 562,025 | 562,039 | ||||||||||||||||||||||||
| Carrying amount | Fair value | |||||||||||||||||||||||||||||
| At amortised cost | At fair value through profit or loss | Hedging | Total | Total | ||||||||||||||||||||||||||
| The Company 30 September 2012 | $m | Designated on initial recognition $m | Held for trading $m | Sub-total $m | $m | $m | $m | |||||||||||||||||||||||
Due to other financial institutions | 28,394 | – | – | – | – | 28,394 | 28,394 | |||||||||||||||||||||||
Derivative financial instruments1 | – | – | 44,508 | 44,508 | 1,539 | 46,047 | 46,047 | |||||||||||||||||||||||
Deposits and other borrowings | 333,536 | – | – | – | – | 333,536 | 333,917 | |||||||||||||||||||||||
Bonds and notes2 | 43,510 | 6,465 | – | 6,465 | – | 49,975 | 50,476 | |||||||||||||||||||||||
Loan capital2 | 10,613 | 633 | – | 633 | – | 11,246 | 11,230 | |||||||||||||||||||||||
Payables and other liabilities | 5,821 | – | – | – | – | 5,821 | 5,821 | |||||||||||||||||||||||
| 421,874 | 7,098 | 44,508 | 51,606 | 1,539 | 475,019 | 475,885 | ||||||||||||||||||||||||
| 1 | Derivative financial instruments classified as ‘held for trading’ include derivatives entered into as economic hedges which are not designated as accounting hedges. |
| 2 | Fair value hedging is applied to financial liabilities within bonds and notes and loan capital. The resulting fair value adjustments mean that the carrying value differs from the amortised cost. |
| 3 | Includes life insurance contract liabilities of $774 million (2011: $884 million) measured in accordance with AASB 1038 Life insurance contract liabilities and life investment contract liabilities of $28,763 million (2011: $26,619 million) which have been designated at fair value through profit or loss in terms under AASB 139. None of the fair value is attributable to changes in the credit risk of the life investment contract liabilities. |
NOTES TO THE FINANCIAL STATEMENTS 155

34: Fair Value of Financial Assets and Financial Liabilities(continued)
FINANCIAL LIABILITIES (continued)
| Carrying amount | Fair value | |||||||||||||||||||||||||||||
| At amortised cost | At fair value through profit or loss | Hedging | Total | Total | ||||||||||||||||||||||||||
| The Company 30 September 2011 | $m | Designated on initial recognition $m | Held for trading $m | Sub-total $m | $m | $m | $m | |||||||||||||||||||||||
Due to other financial institutions | 24,709 | – | – | – | – | 24,709 | 24,709 | |||||||||||||||||||||||
Derivative financial instruments1 | – | – | 47,952 | 47,952 | 795 | 48,747 | 48,747 | |||||||||||||||||||||||
Deposits and other borrowings | 307,254 | – | – | – | – | 307,254 | 307,477 | |||||||||||||||||||||||
Bonds and notes2 | 36,878 | 7,992 | – | 7,992 | – | 44,870 | 44,677 | |||||||||||||||||||||||
Loan capital2 | 10,179 | 638 | – | 638 | – | 10,817 | 10,705 | |||||||||||||||||||||||
Payables and other liabilities | 6,332 | – | – | – | – | 6,332 | 6,332 | |||||||||||||||||||||||
| 385,352 | 8,630 | 47,952 | 56,582 | 795 | 442,729 | 442,647 | ||||||||||||||||||||||||
| 1 | Derivative financial instruments classified as ‘held for trading’ include derivatives entered into as economic hedges which are not designated as accounting hedges. |
| 2 | Fair value hedging is applied to financial liabilities within bonds and notes and loan capital. The resulting fair value adjustments mean that the carrying value differs from the amortised cost. |
DEPOSITS AND OTHER BORROWINGS
For interest bearing fixed maturity deposits and other borrowings and acceptances with quoted market prices, market borrowing rates of interest for debt with a similar maturity are used to discount contractual cash flows. The fair value of a deposit liability without a specified maturity or at call is deemed to be the amount payable on demand at the reporting date. The fair value is not adjusted for any value expected to be derived from retaining the deposit for a future period of time.
Certain deposits and other borrowings have been designated at fair value through profit or loss and are carried at fair value.
BONDS AND NOTES AND LOAN CAPITAL
The aggregate fair value of bonds and notes and loan capital is calculated based on quoted market prices or observable inputs where applicable. For those debt issues where quoted market prices were not available, a discounted cash flow model using a yield curve appropriate for the remaining term to maturity of the debt instrument is used.
Certain bonds and notes and loan capital have been designated at fair value through profit or loss and are carried at fair value. The fair value is based on a discounted cash flow model based on current market yields for similar types of instruments and the maturity of each instrument. The fair value includes the effects of the appropriate credit spreads applicable to ANZ for that instrument.
EXTERNAL UNIT HOLDER LIABILITIES (LIFE INSURANCE FUNDS)
The carrying amount represents the external unit holder’s share of net assets which are carried at fair value in the fund.
POLICY LIABILITIES
Life investment contract liabilities are carried at fair value.
PAYABLES AND OTHER FINANCIAL LIABILITIES
This category includes accrued interest and fees payable for which the carrying amount is considered to approximate the fair value.
COMMITMENTS AND CONTINGENCIES
Adjustments to fair value for commitments and contingencies that are not financial instruments recognised in the balance sheet, are not included in this note.
(ii) Valuation methodology
A significant number of financial instruments are carried on balance sheet at fair value.
The best evidence of fair value is a quoted price in an active market. Accordingly, wherever possible fair value is based on the quoted market price of the financial instrument.
In the event that there is no quoted market price for the instrument, fair value is based on present value estimates or other market accepted valuation techniques. The valuation models incorporate the impact of bid/ask spreads, counterparty credit spreads and other factors that would influence the fair value determined by a market participant.
The majority of valuation techniques employ only observable market data. However, for certain financial instruments the valuation technique may employ some data (valuation inputs or components) which is not readily observable in the current market. In these cases valuation inputs (or components of the overall value) are derived and extrapolated from other relevant market data and tested against historic transactions and observed market trends. Valuations using one or more non-observable data inputs require professional judgement.
ANZ has a control framework that ensures that the fair value is either determined or validated by a function independent of the party that undertakes the transaction.
Where quoted market prices are used, independent price determination or validation is obtained. For fair values determined using a valuation model, the control framework may include, as applicable, independent development or validation of: (i) valuation models; (ii) any inputs to those models; and (iii) any adjustments required outside of the valuation model, and, where possible, independent validation of model outputs.
| 156 |

34: Fair Value of Financial Assets and Financial Liabilities(continued)
The tables below provide an analysis of the methodology used for valuing financial assets and financial liabilities carried at fair value. The fair value of the financial instrument has been allocated in full to the category in a fair value hierarchy which most appropriately reflects the determination of the fair value. This allocation is based on the categorisation of the lowest level input into a valuation model or a valuation component that is significant to the reported fair value of the financial instrument. The significance of an input is assessed against the reported fair value of the financial instrument and considers various factors specific to the financial instrument.
The allocation into the fair value hierarchy is determined as follows:
| n | Level 1 – Financial instruments that have been valued by reference to unadjusted quoted prices in active markets for identical financial assets or liabilities. This category includes financial instruments valued using quoted yields where available for specific debt securities. |
| n | Level 2 – Financial instruments that have been valued through valuation techniques incorporating inputs other than quoted prices within Level 1 that are observable for the financial asset or liability, either directly or indirectly. |
| n | Level 3 – Financial instruments that have been valued using valuation techniques which incorporate significant inputs for the financial asset or liability that are not based on observable market data (unobservable inputs). |
The methods used in valuing different classes of financial assets or liabilities are described in section (i) on pages 152 to 156. There have been no substantial changes in the valuation techniques applied to different classes of financial instruments since the previous year. The Group continuously monitors the relevance of inputs used and calibrates its valuation models where there is evidence that changes are required to ensure that the resulting valuations remain appropriate.
| Valuation techniques | ||||||||||||||||||||||||||||||||||
| Quoted market price (Level 1) | Using observable inputs (Level 2) | With significant non-observable inputs (Level 3) | Total | |||||||||||||||||||||||||||||||
| Consolidated | 2012 $m | 2011 $m | 2012 $m | 2011 $m | 2012 $m | 2011 $m | 2012 $m | 2011 $m | ||||||||||||||||||||||||||
Financial assets | ||||||||||||||||||||||||||||||||||
Trading securities1 | 33,105 | 30,598 | 7,496 | 5,414 | 1 | 62 | 40,602 | 36,074 | ||||||||||||||||||||||||||
Derivative financial instruments | 678 | 2,711 | 47,916 | 55,321 | 335 | 609 | 48,929 | 58,641 | ||||||||||||||||||||||||||
Available-for-sale financial assets | 16,098 | 19,219 | 4,433 | 2,526 | 31 | 519 | 20,562 | 22,264 | ||||||||||||||||||||||||||
Investment backing policy liabilities | 14,968 | 14,766 | 14,614 | 14,734 | 313 | 359 | 29,895 | 29,859 | ||||||||||||||||||||||||||
Loans and advances (designated at fair value) | – | – | 104 | 138 | – | – | 104 | 138 | ||||||||||||||||||||||||||
| 64,849 | 67,294 | 74,563 | 78,133 | 680 | 1,549 | 140,092 | 146,976 | |||||||||||||||||||||||||||
Financial liabilities | ||||||||||||||||||||||||||||||||||
Derivative financial instruments | 750 | 2,847 | 51,414 | 51,654 | 475 | 789 | 52,639 | 55,290 | ||||||||||||||||||||||||||
Deposits and other borrowings (designated at fair value) | – | – | 4,346 | 3,764 | – | – | 4,346 | 3,764 | ||||||||||||||||||||||||||
Bonds and notes (designated at fair value) | – | – | 6,465 | 7,992 | – | – | 6,465 | 7,992 | ||||||||||||||||||||||||||
Life investment contract liabilities | – | – | 28,763 | 26,619 | – | – | 28,763 | 26,619 | ||||||||||||||||||||||||||
External unit holder liabilities (life insurance funds) | – | – | 3,949 | 5,033 | – | – | 3,949 | 5,033 | ||||||||||||||||||||||||||
Loan capital (designated at fair value) | – | – | 633 | 638 | – | – | 633 | 638 | ||||||||||||||||||||||||||
Total | 750 | 2,847 | 95,570 | 95,700 | 475 | 789 | 96,795 | 99,336 | ||||||||||||||||||||||||||
| 1 | $6.3 billion (Company: $6.3 billion) of Trading securities which were categorised as level 2 in 2011 have been restated to level 1 in 2011 since they are valued using quoted yields. |
| Valuation techniques | ||||||||||||||||||||||||||||||||||
| Quoted market price (Level 1) | Using observable inputs (Level 2) | With significant non-observable inputs (Level 3) | Total | |||||||||||||||||||||||||||||||
| The Company | 2012 $m | 2011 $m | 2012 $m | 2011 $m | 2012 $m | 2011 $m | 2012 $m | 2011 $m | ||||||||||||||||||||||||||
Financial assets | ||||||||||||||||||||||||||||||||||
Trading securities1 | 26,855 | 26,033 | 3,634 | 2,272 | 1 | 62 | 30,490 | 28,367 | ||||||||||||||||||||||||||
Derivative financial instruments | 676 | 2,689 | 42,255 | 48,422 | 335 | 609 | 43,266 | 51,720 | ||||||||||||||||||||||||||
Available-for-sale financial assets | 14,901 | 17,724 | 2,914 | 921 | 26 | 372 | 17,841 | 19,017 | ||||||||||||||||||||||||||
Loans and advances (designated at fair value) | – | – | 65 | 97 | – | – | 65 | 97 | ||||||||||||||||||||||||||
| 42,432 | 46,446 | 48,868 | 51,712 | 362 | 1,043 | 91,662 | 99,201 | |||||||||||||||||||||||||||
Financial liabilities | ||||||||||||||||||||||||||||||||||
Derivative financial instruments | 746 | 2,833 | 44,826 | 45,125 | 475 | 789 | 46,047 | 48,747 | ||||||||||||||||||||||||||
Bonds and notes (designated at fair value) | – | – | 6,465 | 7,992 | – | – | 6,465 | 7,992 | ||||||||||||||||||||||||||
Loan capital (designated at fair value) | – | – | 633 | 638 | – | – | 633 | 638 | ||||||||||||||||||||||||||
| 746 | 2,833 | 51,924 | 53,755 | 475 | 789 | 53,145 | 57,377 | |||||||||||||||||||||||||||
| 1 | $6.3 billion (Company: $6.3 billion) of Trading securities which were categorised as level 2 in 2011 have been restated to level 1 in 2011 since they are valued using quoted yields. |
NOTES TO THE FINANCIAL STATEMENTS 157

34: Fair Value of Financial Assets and Financial Liabilities(continued)
(iii) Additional information for financial instruments carried at fair value where the valuation incorporates non-observable market data
CHANGES IN FAIR VALUE
The following table presents the composition of financial instruments measured at fair value with significant non-observable inputs.
| Financial assets | Financial liabilities | |||||||||||||||||||||||||||||||||||||||||
| Trading securities | Derivatives | Available-for-sale | Investments backing policy liabilities | Derivatives | ||||||||||||||||||||||||||||||||||||||
| Consolidated | 2012 $m | 2011 $m | 2012 $m | 2011 $m | 2012 $m | 2011 $m | 2012 $m | 2011 $m | 2012 $m | 2011 $m | ||||||||||||||||||||||||||||||||
Asset backed securities | 1 | 62 | – | – | 2 | 5 | – | – | – | – | ||||||||||||||||||||||||||||||||
Illiquid corporate bonds | – | – | – | – | 9 | 514 | – | – | – | – | ||||||||||||||||||||||||||||||||
Structured credit products | – | – | 243 | 605 | – | – | 94 | 110 | (346) | (788) | ||||||||||||||||||||||||||||||||
Managed funds (suspended) | – | – | – | – | – | – | 133 | 159 | – | – | ||||||||||||||||||||||||||||||||
Alternative assets | – | – | – | – | 20 | – | 86 | 90 | – | – | ||||||||||||||||||||||||||||||||
Other derivatives | – | – | 92 | 4 | – | – | – | – | (129) | (1) | ||||||||||||||||||||||||||||||||
Total | 1 | 62 | 335 | 609 | 31 | 519 | 313 | 359 | (475) | (789) | ||||||||||||||||||||||||||||||||
| The Company | ||||||||||||||||||||||||||||||||||||||||||
Asset backed securities | 1 | 62 | – | – | – | – | n/a | n/a | – | – | ||||||||||||||||||||||||||||||||
Illiquid corporate bonds | – | – | – | – | 6 | 372 | n/a | n/a | – | – | ||||||||||||||||||||||||||||||||
Structured credit products | – | – | 243 | 605 | – | – | n/a | n/a | (346) | (788) | ||||||||||||||||||||||||||||||||
Alternative assets | – | – | – | – | 20 | – | n/a | n/a | – | – | ||||||||||||||||||||||||||||||||
Other derivatives | – | – | 92 | 4 | – | – | n/a | n/a | (129) | (1) | ||||||||||||||||||||||||||||||||
Total | 1 | 62 | 335 | 609 | 26 | 372 | n/a | n/a | (475) | (789) | ||||||||||||||||||||||||||||||||
Asset backed securities and illiquid corporate bonds comprise illiquid bonds where the effect on fair value of issuer credit cannot be directly or indirectly observed in the market.
Structured credit products categorised in derivatives comprise the structured credit intermediation trades that the Group entered into from 2004 to 2007 whereby it sold protection using credit default swaps over certain structures, and mitigated risk by purchasing protection via credit default swaps from US financial guarantors over the same structures. These trades are valued using complex models with certain inputs relating to the reference assets and derivative counterparties not being observable in the market.
Structured credit products catergorised in investments backing policy liabilities comprise collateralised debt and loan obligations where there is a lack of active trading and limited observable market data.
Managed funds (suspended) are comprised of fixed income and mortgage investments in managed funds that are illiquid and are not currently redeemable.
Alternative assets are largely comprised of various investments in unlisted equity securities. No active market exists for these securities and the valuation model incorporates significant unobservable inputs.
Other derivatives predominantly comprise interest rate swaptions containing multi-callable features. Modelling uncertainties and complexities are inherent in the valuation model which result in a significant range of possible valuation outcomes for these financial assets and liabilities.
158

34: Fair Value of Financial Assets and Financial Liabilities(continued)
The following table details movements in the balance of level 3 financial assets and liabilities. Derivatives are categorised on a portfolio basis and classified as either financial assets or financial liabilities based on whether the closing balance is an unrealised gain or loss. This could be different to the opening balance.
| Financial assets | Financial liabilities | |||||||||||||||||||||||||||||||||||||||||||
| Trading securities | Derivatives | Available-for-sale | Investments backing policy liabilities | Derivatives | ||||||||||||||||||||||||||||||||||||||||
| Consolidated | 2012 $m | 2011 $m | 2012 $m | 2011 $m | 2012 $m | 2011 $m | 2012 $m | 2011 $m | 2012 $m | 2011 $m | ||||||||||||||||||||||||||||||||||
Opening balance | 62 | 50 | 609 | 450 | 519 | 646 | 359 | 471 | (789) | (646) | ||||||||||||||||||||||||||||||||||
New purchases and issues | – | – | 5 | – | – | 9 | 29 | – | (1) | – | ||||||||||||||||||||||||||||||||||
Disposals (sales) and cash settlements | (60) | – | – | (18) | – | (139) | (79) | (92) | – | 21 | ||||||||||||||||||||||||||||||||||
Transfers: | – | – | – | – | – | – | – | – | – | – | ||||||||||||||||||||||||||||||||||
Transfers into the category | – | – | 84 | – | 24 | – | – | – | (128) | – | ||||||||||||||||||||||||||||||||||
Transfers out of the category | – | – | (4) | (3) | (508) | – | – | – | 1 | 17 | ||||||||||||||||||||||||||||||||||
Fair value gain/(loss) recorded in the income statement | (1) | 12 | (359) | 180 | (4) | 20 | 4 | (20) | 442 | (181) | ||||||||||||||||||||||||||||||||||
Fair value gain (loss) recognised in equity | – | – | – | – | – | (17) | – | – | – | – | ||||||||||||||||||||||||||||||||||
Closing balance | 1 | 62 | 335 | 609 | 31 | 519 | 313 | 359 | (475) | (789) | ||||||||||||||||||||||||||||||||||
| The Company | ||||||||||||||||||||||||||||||||||||||||||||
Opening balance | 62 | 50 | 609 | 450 | 372 | 409 | n/a | n/a | (789) | (646) | ||||||||||||||||||||||||||||||||||
New purchases and issues | – | – | 5 | – | – | – | n/a | n/a | (1) | – | ||||||||||||||||||||||||||||||||||
Disposals (sales) and cash settlements | (60) | – | – | (18) | – | (7) | n/a | n/a | – | 21 | ||||||||||||||||||||||||||||||||||
Transfers: | – | – | – | – | – | – | n/a | n/a | – | – | ||||||||||||||||||||||||||||||||||
Transfers into the category | – | – | 84 | – | 20 | – | n/a | n/a | (128) | – | ||||||||||||||||||||||||||||||||||
Transfers out of the category | – | – | (4) | (3) | (366) | – | n/a | n/a | 1 | 17 | ||||||||||||||||||||||||||||||||||
Fair value gain/(loss) recorded in the income statement | (1) | 12 | (359) | 180 | – | – | n/a | n/a | 442 | (181) | ||||||||||||||||||||||||||||||||||
Fair value gain (loss) recognised in equity | – | – | – | – | – | (30) | n/a | n/a | – | – | ||||||||||||||||||||||||||||||||||
Closing balance | 1 | 62 | 335 | 609 | 26 | 372 | n/a | n/a | (475) | (789) | ||||||||||||||||||||||||||||||||||
Transfers out of level 3 relate principally to certain assets where the credit spread component has become observable during the year or where assets have been reclassified and are no longer measured at fair value.
Transfers into level 3 predominantly comprise interest rate swaptions containing multi-callable features. Market conditions prevalent in the current financial year have generated modelling uncertainties and complexities in their valuation, resulting in a significant range of possible valuation outcomes for these exposures. Transfers-in are assumed to occur at the time these instruments were deemed to be level 3. Transfers-out are assumed to occur at the beginning of the reporting period.
NOTES TO THE FINANCIAL STATEMENTS 159

34: Fair Value of Financial Assets and Financial Liabilities(continued)
SENSITIVITY TO DATA INPUTS
Where valuation techniques use assumptions due to significant data inputs not being directly observed in the market place, changing these assumptions changes the resultant estimate of fair value. The majority of transactions in this category are ‘back-to-back’ in nature where ANZ either acts as a financial intermediary or hedges market risks. Similarly, the performance of investments backing policyholder liabilities directly impacts the associated life investment contracts they relate to. In these circumstances, changes in the assumptions generally have minimal impact on the income statement and net assets of ANZ. An exception to this is the ‘back-to-back’ structured credit intermediation trades which create significant exposure to market risk and/or credit risk.
Principal inputs used in the determination of fair value of financial instruments included in this group include counterparty credit spreads, market-quoted CDS prices, recovery rates, default probabilities, correlation curves and other inputs, some of which may not be directly observable in the market. For both the Group and the Company, the potential effect of changing prevailing assumptions to reasonably possible alternative assumptions for valuing those financial instruments could result in an increase of $27 million (2011: $46 million) or a decrease of $18 million (2011: $30 million) in net derivative financial instruments as at 30 September 2012. The ranges of reasonably possible alternative assumptions are established by application of professional judgement and analysis of the data available to support each assumption.
DEFERRED FAIR VALUE GAINS AND LOSSES
Where the fair value of a financial instrument is determined using non-observable data that has a significant impact on the valuation of the instrument, any difference between the transaction price and the amount determined based on the valuation technique arising on initial recognition of the financial instrument (day one gain or loss) is deferred on the balance sheet. Subsequently, the day one gain or loss is recognised in the income statement only to the extent that it arises from a change in factors (including time) that a market participant would consider in setting the price for the instrument.
The aggregate amount of day one gain/(loss) not recognised in the income statement on the initial recognition of the financial instrument, because the difference between the transaction price and the modelled valuation price was not fully supported by inputs that were observable, amounted to $4 million (2011: $2 million). $3 million (2011: $nil) in unrecognised gains was added during the year with $1 million (2011: $1 million) being recognised in the income statement during the year through the amortisation process.
(iv) Additional information for financial instruments designated at fair value through profit or loss
FINANCIAL ASSETS DESIGNATED AT FAIR VALUE THROUGH PROFIT OR LOSS
The category loans and advances includes certain loans designated at fair value through profit or loss in order to eliminate an accounting mismatch which would arise if the asset were otherwise carried at amortised cost. This mismatch arises as the derivative financial instruments, which were acquired to mitigate interest rate risk of the loan and advances, are measured at fair value through profit or loss. By designating the economically hedged loans, the movements in the fair value attributable to changes in interest rate risk will also be recognised in the income statement in the same periods.
At balance date, the credit exposure of the Group on these assets was $104 million (2011: $138 million) and for the Company was $65 million (2011: $97 million). For the Group and Company $66 million (2011: $84 million) was mitigated by collateral held.
The cumulative change in fair value attributable to change in credit risk was, for the Group, a reduction to the assets of $4 million (2011: $3 million). For the Company the cumulative change to the assets was $nil (2011: $nil). The amount recognised in the income statement attributable to changes in credit risk for the Group was a loss of $1 million (2011: $1 million gain) and for the Company $nil (2011: $nil).
The change in fair value of the designated financial assets attributable to changes in credit risk has been calculated by determining the change in credit rating and credit spread implicit in the loans and advances issued by entities with similar credit characteristics.
160

34: Fair Value of Financial Assets and Financial Liabilities(continued)
FINANCIAL LIABILITIES DESIGNATED AT FAIR VALUE THROUGH PROFIT OR LOSS
Parts of loan capital, bonds and notes and deposits and other borrowings have been designated as financial liabilities at fair value through profit or loss in order to eliminate an accounting mismatch which would arise if the liabilities were otherwise carried at amortised cost. This mismatch arises as the derivatives acquired to mitigate interest rate risk within the financial liabilities are measured at fair value through profit or loss.
Life investment contracts are designated at fair value through profit or loss in accordance with AASB 1038.
The table below compares the carrying amount of financial liabilities carried at full fair value, to the contractual amount payable at maturity and fair value gains and losses recognised during the period on liabilities carried at full fair value that are attributable to changes in ANZ’s own credit rating.
Life investment contract liabilities and external unitholder liabilities | Deposits and other borrowings | Bonds and notes | Loan capital | |||||||||||||||||||||||||||||||||||||
| Consolidated | 2012 $m | 2011 $m | 2012 $m | 2011 $m | 2012 $m | 2011 $m | 2012 $m | 2011 $m | ||||||||||||||||||||||||||||||||
Carrying Amount | 32,712 | 31,652 | 4,346 | 3,764 | 6,465 | 7,992 | 633 | 638 | ||||||||||||||||||||||||||||||||
Amount at which carrying value is greater/(less) than amount payable at maturity | – | – | (3 | ) | – | (123 | ) | 8 | (12 | ) | 3 | |||||||||||||||||||||||||||||
Cumulative change in liability value attributable to own credit risk: | ||||||||||||||||||||||||||||||||||||||||
– opening cumulative increase/(decrease) | – | – | – | – | (151 | ) | (10 | ) | (32 | ) | (18) | |||||||||||||||||||||||||||||
– increase/(decrease) recognised during the year | – | – | – | – | 91 | (141 | ) | 28 | (14) | |||||||||||||||||||||||||||||||
– closing cumulative increase/(decrease) | – | – | – | – | (60 | ) | (151 | ) | (4 | ) | (32) | |||||||||||||||||||||||||||||
| Bonds and notes | Loan capital | |||||||||||||||
| The Company | 2012 $m | 2011 $m | 2012 $m | 2011 $m | ||||||||||||
Carrying amount | 6,465 | 7,992 | 633 | 638 | ||||||||||||
Amount at which carrying value is greater/(less) than amount payable at maturity | (123 | ) | 8 | (12 | ) | 3 | ||||||||||
Cumulative change in liability value attributable to own credit risk: | ||||||||||||||||
– opening cumulative increase/(decrease) | (151 | ) | (10 | ) | (32 | ) | (18) | |||||||||
– increase/(decrease) recognised during the year | 91 | (141 | ) | 28 | (14) | |||||||||||
– closing cumulative increase/(decrease) | (60 | ) | (151 | ) | (4 | ) | (32) | |||||||||
For each of loan capital, bonds and notes and deposits and other borrowings, the change in fair value attributable to changes in credit risk has been determined as the amount of change in fair value that is not attributable to changes in market conditions that give rise to market risks (benchmark interest rate and foreign exchange rates).
35: Maturity Analysis of Assets and Liabilities
The following is an analysis, by remaining contractual maturities at balance date, of selected asset and liability accounts and represents the actual obligation date expected for the asset or liability to be recovered or settled within one year, and greater than one year.
| 2012 | 2011 | |||||||||||||||||||||||||
| Consolidated | | Due within one year $m | | | Greater than one year $m | 1 |
| Total $m |
| | Due within one year $m | | | Greater than one year $m | 1 |
| Total $m |
| ||||||||
Due from other financial institutions | 17,037 | 66 | 17,103 | 13,168 | 130 | 13,298 | ||||||||||||||||||||
Available-for-sale assets | 8,936 | 11,626 | 20,562 | 17,930 | 4,334 | 22,264 | ||||||||||||||||||||
Net loans and advances | 101,577 | 326,246 | 427,823 | 97,459 | 299,848 | 397,307 | ||||||||||||||||||||
Investments backing policy liabilities | 3,938 | 25,957 | 29,895 | 2,242 | 27,617 | 29,859 | ||||||||||||||||||||
Due to other financial institutions | 30,502 | 36 | 30,538 | 27,449 | 86 | 27,535 | ||||||||||||||||||||
Deposits and other borrowings | 377,113 | 20,010 | 397,123 | 347,885 | 20,844 | 368,729 | ||||||||||||||||||||
Bonds and notes | 15,005 | 48,093 | 63,098 | 13,874 | 42,677 | 56,551 | ||||||||||||||||||||
Policy liabilities | 28,763 | 774 | 29,537 | 26,619 | 884 | 27,503 | ||||||||||||||||||||
External unit holder liabilities (life insurance funds) | 3,949 | – | 3,949 | 5,033 | – | 5,033 | ||||||||||||||||||||
Loan capital | – | 11,914 | 11,914 | 720 | 11,273 | 11,993 | ||||||||||||||||||||
| 1 | Includes items where no maturity is specified. |
NOTES TO THE FINANCIAL STATEMENTS 161

36: Segment Analysis
(i) Description of segments
The Group operates on a divisional structure with Australia, International and Institutional Banking (IIB), New Zealand and Global Wealth and Private Banking being the major operating divisions. The IIB and Global Wealth and Private Banking divisions are co-ordinated globally.
The segments and product and services categories as reported below are consistent with internal reporting provided to the chief operating decision maker, being the Chief Executive Officer.
In order to support the Group’s super regional strategy and give focus to the Group’s areas of growth and opportunity, the divisional segments were changed from those used in the prior year. This involved the combination of the former APEA and Institutional divisions into one division, IIB, and the creation of a new division, Global Wealth and Private Banking. Comparative information has been restated accordingly.
The primary sources of external revenue across all divisions are interest, fee income and trading income. The Australia and New Zealand divisions derive revenue from products and services from retail banking and commercial banking. IIB derives its revenue from retail banking, and institutional and commercial products and services. Global Wealth and Private Banking derives revenue from wealth products and private banking. Group Centre provides support to all divisions, including risk management, financial management, strategy and marketing, human resources and corporate affairs.
(ii) Operating segments
Transactions between business units across segments within ANZ are conducted on an arms length basis.
| Year ended 30 September 2012 ($m) | Australia | International and Institutional Banking | New Zealand | Global Wealth and Private Banking | Group Centre | Other items1 | Group Total | |||||||||||||||||||||
External interest income | 17,175 | 8,631 | 4,285 | 325 | 119 | 3 | 30,538 | |||||||||||||||||||||
External interest expense | (6,463 | ) | (3,327 | ) | (1,857 | ) | (416 | ) | (6,365 | ) | – | (18,428) | ||||||||||||||||
Adjustment for intersegment interest | (4,788 | ) | (1,462 | ) | (656 | ) | 214 | 6,696 | (4) | – | ||||||||||||||||||
Net interest income | 5,924 | 3,842 | 1,772 | 123 | 450 | (1) | 12,110 | |||||||||||||||||||||
Other external operating income | 1,196 | 2,351 | 325 | 1,355 | (157 | ) | 136 | 5,206 | ||||||||||||||||||||
Share of net profit/(loss) of equity accounted investments | (2 | ) | 399 | – | – | 1 | (3) | 395 | ||||||||||||||||||||
Segment revenue | 7,118 | 6,592 | 2,097 | 1,478 | 294 | 132 | 17,711 | |||||||||||||||||||||
Other external expenses | (2,045 | ) | (2,543 | ) | (948 | ) | (744 | ) | (1,771 | ) | (467) | (8,518) | ||||||||||||||||
Net intersegment expenses | (848 | ) | (390 | ) | 27 | (113 | ) | 1,353 | (30) | (1) | ||||||||||||||||||
Operating expenses | (2,893 | ) | (2,933 | ) | (921 | ) | (857 | ) | (418 | ) | (497) | (8,519) | ||||||||||||||||
Profit before income tax and provision for credit impairment | 4,225 | 3,659 | 1,176 | 621 | (124 | ) | (365) | 9,192 | ||||||||||||||||||||
Provision for credit impairment | (666 | ) | (427 | ) | (148 | ) | (4 | ) | (1 | ) | 48 | (1,198) | ||||||||||||||||
Segment result before tax | 3,559 | 3,232 | 1,028 | 617 | (125 | ) | (317) | 7,994 | ||||||||||||||||||||
Income tax expense | (1,067 | ) | (854 | ) | (285 | ) | (166 | ) | 78 | (33) | (2,327) | |||||||||||||||||
Non-controlling interests | – | (6 | ) | – | – | – | – | (6) | ||||||||||||||||||||
Profit after income tax attributed to shareholders of the company | 2,492 | 2,372 | 743 | 451 | (47 | ) | (350) | 5,661 | ||||||||||||||||||||
Non-cash expenses | ||||||||||||||||||||||||||||
Depreciation and amortisation | (114 | ) | (196 | ) | (55 | ) | (39 | ) | (206 | ) | (3) | (613) | ||||||||||||||||
Equity-settled share-based payment expenses | (26 | ) | (106 | ) | (16 | ) | (12 | ) | (29 | ) | – | (189) | ||||||||||||||||
Provision for credit impairment | (666 | ) | (427 | ) | (148 | ) | (4 | ) | (1 | ) | 48 | (1,198) | ||||||||||||||||
Financial position | ||||||||||||||||||||||||||||
Goodwill | – | 1,014 | 1,604 | 1,594 | – | – | 4,212 | |||||||||||||||||||||
Shares in associates | 6 | 3,426 | 2 | 9 | 68 | 9 | 3,520 | |||||||||||||||||||||
Total external assets | 247,531 | 276,306 | 71,816 | 45,351 | 1,232 | (109) | 642,127 | |||||||||||||||||||||
Total external liabilities | 154,666 | 231,966 | 57,842 | 46,251 | 110,209 | (27) | 600,907 | |||||||||||||||||||||
| 1 | In evaluating the performance of the operating segments, certain items are removed from the operating segment results, where they are not considered integral to the ongoing performance of the segment and are evaluated separately. These items are set out in part (iii) of this note (refer pages 204 to 206 for further analysis). |
162

36: Segment Analysis(continued)
| Year ended 30 September 2011 ($m) | Australia |
| International and Institutional Banking |
|
| New Zealand |
| | Global Wealth and Private Banking | |
| Group Centre |
|
| Other items | 1 |
| Group Total |
| |||||||||
External interest income | 17,197 | 8,194 | 4,513 | 345 | 189 | 5 | 30,443 | |||||||||||||||||||||
External interest expense | (6,197 | ) | (3,631 | ) | (1,948 | ) | (342 | ) | (6,826 | ) | 1 | (18,943) | ||||||||||||||||
Adjustment for intersegment interest | (5,218 | ) | (896 | ) | (864 | ) | 132 | 6,850 | (4 | ) | – | |||||||||||||||||
Net interest income | 5,782 | 3,667 | 1,701 | 135 | 213 | 2 | 11,500 | |||||||||||||||||||||
Other external operating income | 1,187 | 2,092 | 316 | 1,350 | (61 | ) | 112 | 4,996 | ||||||||||||||||||||
Share of net profit/(loss) of equity accounted investments | (2 | ) | 431 | – | – | 1 | 6 | 436 | ||||||||||||||||||||
Segment revenue | 6,967 | 6,190 | 2,017 | 1,485 | 153 | 120 | 16,932 | |||||||||||||||||||||
Other external expenses | (1,995 | ) | (2,402 | ) | (929 | ) | (746 | ) | (1,667 | ) | (284 | ) | (8,023) | |||||||||||||||
Net intersegment expenses | (841 | ) | (355 | ) | 23 | (107 | ) | 1,301 | (21 | ) | – | |||||||||||||||||
Operating expenses | (2,836 | ) | (2,757 | ) | (906 | ) | (853 | ) | (366 | ) | (305 | ) | (8,023) | |||||||||||||||
Profit before income tax and provision for credit impairment | 4,131 | 3,433 | 1,111 | 632 | (213 | ) | (185 | ) | 8,909 | |||||||||||||||||||
Provision for credit impairment | (719 | ) | (293 | ) | (166 | ) | 8 | (41 | ) | (26 | ) | (1,237) | ||||||||||||||||
Segment result before tax | 3,412 | 3,140 | 945 | 640 | (254 | ) | (211 | ) | 7,672 | |||||||||||||||||||
Income tax expense | (1,022 | ) | (830 | ) | (283 | ) | (183 | ) | 96 | (87 | ) | (2,309) | ||||||||||||||||
Non-controlling interests | – | (9 | ) | – | – | – | 1 | (8) | ||||||||||||||||||||
Profit after income tax attributed to shareholders of the company | 2,390 | 2,301 | 662 | 457 | (158 | ) | (297 | ) | 5,355 | |||||||||||||||||||
Non-cash expenses | ||||||||||||||||||||||||||||
Depreciation and amortisation | (114 | ) | (148 | ) | (49 | ) | (47 | ) | (175 | ) | (1 | ) | (534) | |||||||||||||||
Equity-settled share-based payment expenses | (22 | ) | (90 | ) | (16 | ) | (2 | ) | (35 | ) | – | (165) | ||||||||||||||||
Provision for credit impairment | (719 | ) | (293 | ) | (166 | ) | 8 | (41 | ) | (26 | ) | (1,237) | ||||||||||||||||
Financial position | ||||||||||||||||||||||||||||
Goodwill | – | 1,009 | 1,579 | 1,575 | – | – | 4,163 | |||||||||||||||||||||
Shares in associates | 9 | 3,376 | 2 | 21 | 67 | 38 | 3,513 | |||||||||||||||||||||
Total external assets | 231,113 | 259,397 | 69,072 | 43,970 | 593 | 68 | 604,213 | |||||||||||||||||||||
Total external liabilities | 138,168 | 223,420 | 53,039 | 43,456 | 108,137 | 39 | 566,259 |
| 1 | In evaluating the performance of the operating segments, the results are adjusted for certain non-core items where they are not considered integral to the ongoing performance of the segment and are evaluated separately. These items are set out in part (iii) of this note (refer pages 205 to 206 for further analysis). |
(iii) Other items
The table below sets out the profit after tax impact of other items.
| Profit after tax | ||||||||||
| Item | Related segment | 2012 $m | 2011 $m | |||||||
Gain on sale of Visa shares | New Zealand and Group Centre | 224 | – | |||||||
New Zealand Simplification programme | New Zealand | (105 | ) | (86) | ||||||
Acquisition related adjustments | Global Wealth and Private Banking and IIB | (41 | ) | (126) | ||||||
Treasury shares adjustment | Global Wealth and Private Banking | (96 | ) | 41 | ||||||
Changes in New Zealand tax legislation | New Zealand and IIB | – | 2 | |||||||
Economic hedging – fair value (gains)/losses | IIB | (229 | ) | (117) | ||||||
Revenue and net investment hedges (gains)/losses | Group Centre | 53 | (51) | |||||||
Capitalised software impairment | Australia, IIB, Global Wealth and Private Banking, and Group Centre | (220 | ) | – | ||||||
New Zealand managed funds impacts | New Zealand | (1 | ) | 39 | ||||||
Non continuing businesses | IIB | 65 | 1 | |||||||
Total | (350 | ) | (297) | |||||||
NOTES TO THE FINANCIAL STATEMENTS 163

36: Segment Analysis(continued)
(iv) External segment revenue by products and services
The table below sets out revenue from external customers for groups of similar products and services.
| Revenue | ||||||||
2012 $m | 2011 $m | |||||||
Retail | 6,312 | 6,112 | ||||||
Commercial | 3,786 | 3,700 | ||||||
Wealth | 1,478 | 1,485 | ||||||
Institutional | 5,320 | 4,961 | ||||||
Partnerships | 328 | 327 | ||||||
Other | 487 | 347 | ||||||
| 17,711 | 16,932 | |||||||
(v) Geographical information
The following table sets out revenue and non-current assets1 based on the geographical locations in which the Group operates.
| Australia | APEA | New Zealand | Total | |||||||||||||||||||||||||||||
| Consolidated | 2012 $m | 2011 $m | 2012 $m | 2011 $m | 2012 $m | 2011 $m | 2012 $m | 2011 $m | ||||||||||||||||||||||||
Total external revenue | 12,117 | 11,904 | 2,801 | 2,425 | 2,793 | 2,603 | 17,711 | 16,932 | ||||||||||||||||||||||||
Non-current assets1 | 288,171 | 260,004 | 21,162 | 22,401 | 54,562 | 49,524 | 363,895 | 331,929 | ||||||||||||||||||||||||
| 1 | Non-current assets referred to are assets that are expected to be recovered more than 12 months after balance date. They do not include financial instruments, deferred tax assets, post-employment benefits assets or rights under insurance contracts. |
164

37: Notes to the Cash Flow Statements
a) Reconciliation of net profit after income tax to net cash provided by/(used in) operating activities
| Consolidated | The Company | |||||||||||||||
Inflows $m | Inflows $m | Inflows $m | Inflows $m | |||||||||||||
Operating profit after income tax attributable to shareholders of the Company | 5,661 | 5,355 | 4,875 | 4,151 | ||||||||||||
Adjustment to reconcile operating profit after income tax to net cash provided by/(used in) operating activities | ||||||||||||||||
Provision for credit impairment | 1,198 | 1,237 | 985 | 994 | ||||||||||||
Impairment on available for sale assets transferred to profit and loss | 44 | 72 | 35 | 72 | ||||||||||||
Credit risk on intermediation trades | (73) | (4) | (73) | (2) | ||||||||||||
Depreciation and amortisation | 723 | 645 | 483 | 403 | ||||||||||||
(Profit)/Loss on sale of businesses | (4) | (6) | (20) | – | ||||||||||||
Provision for employee entitlements, restructuring and other provisions | 798 | 822 | 373 | 345 | ||||||||||||
Payments from provisions | (845) | (852) | (426) | (518) | ||||||||||||
(Profit)/loss on sale of premises and equipment | 23 | (20) | 17 | 7 | ||||||||||||
(Profit)/loss on sale of available-for-sale assets | (225) | (68) | (164) | (31) | ||||||||||||
Amortisation of discounts/premiums included in interest income | (7) | (13) | 3 | 6 | ||||||||||||
Share-based payments expense | 189 | 167 | 189 | 167 | ||||||||||||
Change in policy liabilities | 2,449 | (854) | – | – | ||||||||||||
Net derivatives/foreign exchange adjustment | (1,093) | 187 | (1,230) | 711 | ||||||||||||
Net (increase)/decrease in operating assets | ||||||||||||||||
Trading securities | (4,589) | (7,614) | (2,275) | (5,558) | ||||||||||||
Liquid assets | 435 | 1,593 | 419 | 1,106 | ||||||||||||
Due from other banks | (4,256) | (1,476) | (3,886) | (1,586) | ||||||||||||
Loans and advances | (32,748) | (25,568) | (28,592) | (25,753) | ||||||||||||
Investments backing policy liabilities | (2,569) | 1,319 | – | – | ||||||||||||
Net derivative financial instruments | 4,734 | (2,038) | 3,687 | (3,751) | ||||||||||||
Net intra-group loans and advances | – | – | (283) | 336 | ||||||||||||
Interest receivable | (110) | (45) | (88) | (55) | ||||||||||||
Accrued income | 25 | 80 | 4 | 82 | ||||||||||||
Net tax assets | (525) | 277 | (839) | (371) | ||||||||||||
Net (decrease)/increase in operating liabilities: | ||||||||||||||||
Deposits and other borrowings | 33,662 | 43,834 | 30,834 | 42,542 | ||||||||||||
Due to other financial institutions | 4,184 | 1,350 | 4,836 | 1,415 | ||||||||||||
Payables and other liabilities | 209 | 584 | 441 | 835 | ||||||||||||
Interest payable | (399) | 124 | (179) | 119 | ||||||||||||
Accrued expenses | (455) | 21 | (368) | 23 | ||||||||||||
Other | (20) | (308) | 286 | (12) | ||||||||||||
Total adjustments | 755 | 13,446 | 4,169 | 11,526 | ||||||||||||
Net cash provided by/(used in) operating activities | 6,416 | 18,801 | 9,044 | 15,677 | ||||||||||||
NOTES TO THE FINANCIAL STATEMENTS 165

37: Notes to the Cash Flow Statements(continued)
b) Reconciliation of cash and cash equivalents
Cash and cash equivalents include liquid assets and amounts due from other financial institutions with an original term to maturity of less than three months, from the date of acquisition. Cash and cash equivalents at the end of the financial year as shown in the statements of cash flows are reconciled to the related items in the statements of financial position as follows:
| Consolidated | The Company | |||||||||||||||
2012 $m | 2011 $m | 2012 $m | 2011 $m | |||||||||||||
Liquid assets | 35,583 | 24,129 | 31,787 | 19,801 | ||||||||||||
Due from other financial institutions | 5,867 | 5,892 | 4,481 | 3,850 | ||||||||||||
Cash and cash equivalents in the statement of cash flows | 41,450 | 30,021 | 36,268 | 23,651 | ||||||||||||
| c) Acquisitions and disposals | ||||||||||||||||
| Consolidated | The Company | |||||||||||||||
2012 $m | 2011 $m | 2012 $m | 2011 $m | |||||||||||||
Cash (inflows)/outflows from acquisitions and investments (net of cash acquired) | ||||||||||||||||
Purchases of controlled entities and businesses | 11 | 44 | 10 | – | ||||||||||||
Investments in controlled entities | – | – | 327 | – | ||||||||||||
Purchases of interest in associates | – | 260 | – | 260 | ||||||||||||
| 11 | 304 | 337 | 260 | |||||||||||||
Cash inflows from disposals (net of cash disposed) | ||||||||||||||||
Disposals of controlled entities | – | 6 | – | – | ||||||||||||
Disposals of associates | 18 | 68 | 36 | 36 | ||||||||||||
| 18 | 74 | 36 | 36 | |||||||||||||
d) Non-cash financing and investing activities
| ||||||||||||||||
Share capital issues | ||||||||||||||||
Dividends satisfied by share issue | 1,461 | 1,367 | 1,461 | 1,367 | ||||||||||||
Dividends satisfied by bonus share issue | 80 | 66 | 80 | 66 | ||||||||||||
| 1,541 | 1,433 | 1,541 | 1,433 | |||||||||||||
e) Financing arrangements
| ||||||||||||||||
| Consolidated | ||||||||||||||||
| 2012 | 2011 | |||||||||||||||
Available $m | Unused $m | Available $m | Unused $m | |||||||||||||
Credit stand by arrangements | ||||||||||||||||
Standby lines | – | – | 978 | 978 | ||||||||||||
Other financing arrangements | ||||||||||||||||
Over and other financing arrangements | – | – | – | – | ||||||||||||
Total finance available | – | – | 978 | 978 | ||||||||||||
166

38: Controlled Entities
| Incorporated in | Nature of business | |||||
Ultimate parent of the Group | ||||||
Australia and New Zealand Banking Group Limited | Australia | Banking | ||||
All controlled entities are 100% owned unless otherwise noted. | ||||||
The material controlled entities of the Group are: | ||||||
ANZ Bank (Lao) Limited1 | Laos | Banking | ||||
ANZ Bank (Vietnam) Limited1 | Vietnam | Banking | ||||
ANZ Capel Court Limited | Australia | Investment Banking | ||||
ANZ Capital Hedging Pty Ltd | Australia | Hedging | ||||
ANZ Commodity Trading Pty Ltd | Australia | Finance | ||||
ANZcover Insurance Pty Ltd | Australia | Captive-Insurance | ||||
ANZ Trustees Limited | Australia | Trustee/Nominee | ||||
ANZ Funds Pty Ltd | Australia | Holding Company | ||||
ANZ Bank (Europe) Limited1 | United Kingdom | Banking | ||||
ANZ Bank (Kiribati) Limited1,2 | Kiribati | Banking | ||||
ANZ Bank (Samoa) Limited1 | Samoa | Banking | ||||
ANZ Holdings (New Zealand) Limited1 | New Zealand | Holding Company | ||||
ANZ Bank New Zealand Limited1 (formerly ANZ National Bank Limited3) | New Zealand | Banking | ||||
ANZ Investment Services (New Zealand) Limited1 | New Zealand | Funds Management | ||||
ANZ New Zealand (Int’l) Limited1 (formerly ANZ National (Int’l) Limited3) | New Zealand | Finance | ||||
OnePath Holdings (NZ) Limited1 | New Zealand | Holding Company | ||||
OnePath Insurance Holdings (NZ) Limited1 | New Zealand | Holding Company | ||||
OnePath Life (NZ) Limited1 | New Zealand | Insurance | ||||
Private Nominees Limited1 | New Zealand | Nominee | ||||
UDC Finance Limited1 | New Zealand | Finance | ||||
ANZ International (Hong Kong) Limited1 | Hong Kong | Holding Company | ||||
ANZ Asia Limited1 | Hong Kong | Banking | ||||
ANZ Bank (Vanuatu) Limited4 | Vanuatu | Banking | ||||
ANZ International Private Limited1 | Singapore | Holding Company | ||||
ANZ Singapore Limited1 | Singapore | Merchant Banking | ||||
ANZ Royal Bank (Cambodia) Limited1,2 | Cambodia | Banking | ||||
Votraint No.1103 Pty Ltd | Australia | Investment | ||||
ANZ Lenders Mortgage Insurance Pty Ltd | Australia | Mortgage Insurance | ||||
ANZ Orchard Investments Pty Ltd | Australia | Holding Company | ||||
ANZ Wealth Australia Limited (formerly OnePath Australia Limited) | Australia | Holding Company | ||||
OnePath Life Limited | Australia | Insurance | ||||
OnePath General Insurance Pty Limited | Australia | Insurance | ||||
OnePath Funds Management Limited | Australia | Funds Management | ||||
OnePath Custodians Limited | Australia | Trustee | ||||
Australia and New Zealand Banking Group (PNG) Limited1 | Papua New Guinea | Banking | ||||
Australia and New Zealand Bank (China) Company Limited1 | China | Banking | ||||
Chongqing Liangping ANZ Rural Bank Company Limited1 | China | Banking | ||||
Citizens Bancorp Inc | Guam | Holding Company | ||||
ANZ Guam Inc.5 | Guam | Banking | ||||
Esanda Finance Corporation Limited | Australia | General Finance | ||||
ETRADE Australia Limited | Australia | Holding Company | ||||
ETRADE Australia Securities Limited | Australia | Online Stockbroking | ||||
LFD Pty Ltd | Australia | Holding Company | ||||
PT Bank ANZ Indonesia (formerly PT ANZ Panin Bank)1,2 | Indonesia | Banking | ||||
| 1 | Audited by overseas KPMG firms. |
| 2 | Non-controlling interests hold ordinary shares or units in the controlled entities listed above as follows: ANZ Bank (Kiribati) Limited – 150,000 $1 ordinary shares (25%) (2011: 150,000 $1 ordinary shares (25%)); PT Bank ANZ Indonesia – 16,500 IDR 1 million shares (1%) (2011: 16,500 IDR 1 million shares (1%)); ANZ Royal Bank (Cambodia) Limited – 319,500 USD100 ordinary shares (45%) (2011: 319,500 USD100 ordinary shares (45%)). |
| 3 | Name changes occurred on 29 October 2012. |
| 4 | Audited by Hawkes Law. |
| 5 | Audited by Deloitte Guam. |
NOTES TO THE FINANCIAL STATEMENTS 167

39: Associates
Significant associates of the Group are as follows:
|
| Date became an associate |
|
| Ownership interest held |
|
| Voting interest |
|
| Incorporated in |
|
| Carrying value 2012 $m |
|
| Carrying value 2011 $m |
|
| Fair value $m | 1
|
| Reporting date |
|
| Principal activity |
| ||||||||||
AMMB Holdings Berhad | May 2007 | 24% | 24% | Malaysia | 1,143 | 1,111 | 1,421 | 31 March | Banking | |||||||||||||||||||||||||||
PT Bank Pan Indonesia2 | April 2001 | 39% | 39% | Indonesia | 668 | 685 | 644 | 31 December | Banking | |||||||||||||||||||||||||||
Shanghai Rural Commercial Bank3 | September 2007 | 20% | 20% |
| Peoples Republic of China |
| 959 | 952 | n/a | 31 December | Banking | |||||||||||||||||||||||||
Bank of Tianjin4 | June 2006 | 18% | 18% | | Peoples Republic of China | | 448 | 384 | n/a | 31 December | Banking | |||||||||||||||||||||||||
Saigon Securities Inc.2,5 | July 2008 | 18% | 18% | Vietnam | 74 | 115 | 46 | 31 December | Stockbroking | |||||||||||||||||||||||||||
Diversified Infrastructure Trust | March 2008 | 37% | 37% | Australia | 81 | 82 | 118 | 30 September | Investment | |||||||||||||||||||||||||||
Metrobank Card Corporation | October 2003 | 40% | 40% | Philippines | 50 | 44 | n/a | 31 December | Cards Issuing | |||||||||||||||||||||||||||
Other associates | 97 | 140 | ||||||||||||||||||||||||||||||||||
Total carrying value of associates | 3,520 | 3,513 |
| 1 | Applicable to those investments in associates where there are published price quotations. Fair value is based on a price per share and does not include any adjustments for holding size. |
| 2 | A value-in-use estimation supports the carrying value of this investment. |
| 3 | During the year ended 30 September 2011 the Group invested an additional RMB 1.65 billion ($255 million) in Shanghai Rural Commercial Bank (SRCB) as part of a major capital raising by SRCB. |
| 4 | In the current year the Group elected not to participate in the rights issue of Bank of Tianjin. Consequently, the Group’s ownership interest has reduced from 20% to 18%. The Group maintains significant influence via the representation on the Board of Directors. A net dilution gain of $10 million was recognised as a result of the dilution of the Group’s ownership interest. |
| 5 | Significant influence was established via representation on the Board of Directors. |
2012 $m | 2011 $m | |||||||
Aggregated assets of significant associates (100%) | 140,610 | 131,297 | ||||||
Aggregated liabilities of significant associates (100%) | 128,245 | 119,664 | ||||||
Aggregated revenues of significant associates (100%) | 8,244 | 6,898 | ||||||
Aggregated profits of significant associates (100%) | 1,761 | 1,465 | ||||||
| Consolidated | ||||||||
2012 $m | 2011 $m | |||||||
Results of associates | ||||||||
Share of associates profit before income tax | 542 | 476 | ||||||
Share of income tax expense | (135 | ) | (121) | |||||
Share of associates net profit – as disclosed by associates | 407 | 355 | ||||||
Adjustments1 | (12 | ) | 81 | |||||
Share of associates net profit accounted for using the equity method | 395 | 436 | ||||||
| 1 | The results differ from the published results of these entities due to the application of IFRS, Group Policies and acquisition adjustments. |
168

40: Securitisations and Covered Bonds
The Group enters into transactions in the normal course of business by which it transfers financial assets directly to third parties or to special purpose entities. These transfers may give rise to the full or partial derecognition of those financial assets.
| n | Full derecognition occurs when the Group transfers its contractual right to receive cash flows from the financial assets, or retains the right but assumes an obligation to pass on the cash flows from the asset, and transfers substantially all the risks and rewards of ownership. These risks include credit, interest rate, currency, prepayment and other price risks. |
| n | Partial derecognition occurs when the Group sells or otherwise transfers financial assets in such a way that some but not substantially all of the risks and rewards of ownership are transferred but control is retained. These financial assets continue to be recognised on the balance sheet to the extent of the Group’s continuing involvement. |
Group-originated financial assets that do not qualify for derecognition typically relate to loans that have been transferred under arrangements by which the Group retains a continuing involvement in the transferred assets. Continuing involvement may entail retaining the rights to future cash flows arising from the assets after investors have received their contractual terms, providing subordinated interests, liquidity support, continuing to service the underlying asset and entering into derivative transactions with the securitisation vehicles. In such instances, the Group continues to be exposed to risks associated with these transactions.
Securitisations
Net loans and advances include residential mortgages securitised under the Group’s securitisation programs which are assigned to bankruptcy remote special purpose entities (SPEs) to provide security for obligations payable on the notes issued by the SPEs. This includes mortgages that are held for potential repurchase agreement (REPO) with central banks. The noteholders have full recourse to the pool of residential mortgages which have been securitised. The Company cannot otherwise pledge or dispose of the transferred assets.
As holder of the securitised notes the Company retains the credit risk associated with the securitised mortgages. In addition, the Company is entitled to any residual income of the SPEs and, where the SPEs include interest rate and foreign currency derivatives that have not been externalised, the interest rate and foreign currency risk are held in the Company. The Company is therefore deemed to have retained the majority of the risks and rewards of the residential mortgages and as such continues to recognise the mortgages as financial assets. The obligations to repay this amount to the SPE is recognised as a financial liability of the Company. As the Group has control over the SPEs activities, they are consolidated by the Group.
Covered bonds
During the financial year ended 30 September 2012, the Group established two global covered bond programs. Net loans and advances include residential mortgages assigned to bankruptcy remote SPEs associated with these covered bond programs to provide security for the obligations payable on the covered bonds issued by the Group. The covered bond holders have dual recourse to the issuer and the covered pool assets. The Company cannot otherwise pledge or dispose of the transferred assets, however, it may repurchase and substitute assets as long as the required cover is maintained.
The Company, as issuer of the covered bonds, is required to maintain the cover pool at a level sufficient to cover the bond obligations. Therefore, the majority of the credit risk associated with the underlying mortgages within the cover pool is retained by the Company. In addition, the Company is entitled to any residual income of the covered bond SPEs and where the SPEs include interest rate and foreign currency derivatives that have not been externalised, the interest rate and foreign currency risk are held in the Company. The Company is therefore deemed to have retained the majority of the risks and rewards of the residential mortgages and as such continues to recognise the mortgages as financial assets. The obligation to repay this amount to the SPE is recognised as a financial liability of the Company. As the Group has control over the SPE’s activities, they are consolidated by the Group. The external covered bonds issued are included within the Bonds and Notes.
The table below sets out the balance of assets transferred by the Company to special purpose entities (consolidated by the Group) that continue to be recognised by the Company because they do not qualify for derecognition, along with the associated liabilities.
| Consolidated1 | The Company | |||||||||||||||
2012 $m |
2011 $m |
2012 $m |
2011 $m | |||||||||||||
Securitisations2 | ||||||||||||||||
Current carrying amount of assets recognised | – | – | 41,789 | 31,280 | ||||||||||||
Carrying amount of associated liabilities | – | – | 41,789 | 31,280 | ||||||||||||
Covered bonds | ||||||||||||||||
Current carrying amount of assets recognised | – | – | 11,304 | – | ||||||||||||
Carrying amount of associated liabilities3 | – | – | 8,798 | – | ||||||||||||
| 1 | The balances are nil as the Company balances relate to transfers to internal special purpose vehicles. The total covered bonds issued by the Group to external investors at 30 September 2012 was $11,162 million, secured by $15,276 million of specified residential mortgages. |
| 2 | The securisation noteholders have recourse only to the pool of residential mortgages which have been securitised. The carrying value of securitised assets and the associated liabilities approximate their fair value value. |
| 3 | The associated liability represents the Covered Bonds issued by the Company to external investors. As a result of over collateralisation held in the covered bond SPE, the Company’s liability to the covered bond SPE is $11,304 million (2011: $nil). |
NOTES TO THE FINANCIAL STATEMENTS 169

41: Fiduciary Activities
The Group conducts various fiduciary activities as follows:
Investment fiduciary activities for trusts
The Group conducts investment fiduciary activities for trusts, including deceased estates. These trusts have not been consolidated as the Group does not have direct or indirect control.
Where the Company or its controlled entities incur liabilities in respect of these operations as trustee, where the primary obligation is incurred in an agency capacity as trustee of the trust rather than on the Group’s own account, a right of indemnity exists against the assets of the applicable funds or trusts. As these assets are sufficient to cover the liabilities and it is therefore not probable that the Company or its controlled entities will be required to settle the liabilities, the liabilities are not included in the financial statements.
The aggregate amounts of funds concerned are as follows:
2012 $m | 2011 $m | |||||||
Trusteeships | 3,958 | 3,418 | ||||||
Funds management activities
Funds management activities are conducted through Group controlled entities ANZ Wealth Australia Limited (formerly OnePath Australia Limited) and OnePath Holdings (NZ) Limited and certain other subsidiaries of the Group. Funds under management in these entities are included in these consolidated financial statements where they are controlled by the Group.
The aggregate funds under management which are not included in these consolidated financial statements are as follows:
2012 $m | 2011 $m | |||||||
ANZ Wealth Australia Limited | 7,079 | 6,420 | ||||||
OnePath Holdings (NZ) Limited | 5,845 | 5,271 | ||||||
Other controlled entities – New Zealand | 6,673 | 6,295 | ||||||
Other controlled entities – Australia | 22 | 50 | ||||||
| 19,619 | 18,036 | |||||||
42: Commitments
| Consolidated | The Company | |||||||||||||||
2012 $m |
2011 $m |
2012 $m |
2011 $m | |||||||||||||
Property | ||||||||||||||||
Capital expenditure | ||||||||||||||||
Contracts for outstanding capital expenditure | 78 | 61 | 70 | 51 | ||||||||||||
Total capital expenditure commitments1 | 78 | 61 | 70 | 51 | ||||||||||||
Lease rentals | ||||||||||||||||
Land and buildings | 1,561 | 1,502 | 1,313 | 1,306 | ||||||||||||
Furniture and equipment | 177 | 130 | 161 | 116 | ||||||||||||
Total lease rental commitments | 1,738 | 1,632 | 1,474 | 1,422 | ||||||||||||
Not later than 1 year | 400 | 377 | 330 | 307 | ||||||||||||
Later than one year but not later than 5 years | 887 | 863 | 767 | 746 | ||||||||||||
Later than 5 years | 451 | 392 | 377 | 369 | ||||||||||||
Total lease rental commitments | 1,738 | 1,632 | 1,474 | 1,422 | ||||||||||||
| 1 | Relates to premises and equipment. |
170

43: Credit Related Commitments, Guarantees, Contingent Liabilities and Contingent Assets
CREDIT RELATED COMMITMENTS, GUARANTEES AND CONTINGENT LIABILITIES
Credit related commitments
Facilities provided
| Consolidated | The Company | |||||||||||||||
Contract amount 2012 $m |
Contract amount 2011 $m |
Contract amount 2012 $m |
Contract amount 2011 $m | |||||||||||||
Undrawn facilities | 141,355 | 135,243 | 118,461 | 114,461 | ||||||||||||
Australia1 | 77,137 | 77,367 | 77,119 | 77,273 | ||||||||||||
New Zealand | 16,822 | 15,569 | – | – | ||||||||||||
Asia Pacific, Europe & America | 47,396 | 42,307 | 41,342 | 37,188 | ||||||||||||
Total | 141,355 | 135,243 | 118,461 | 114,461 | ||||||||||||
| 1 | September 2011 undrawn facilities have been restated by $2,646 million using the revised methodology for undrawn overdrafts that was implemented during 2012. |
Guarantees and contingent liabilities
Details of the estimated maximum amount of guarantees and contingent liabilities that may become payable are disclosed on the following pages. These guarantees and contingent liabilities relate to transactions that the Group has entered into as principal.
Documentary letters of credit involve the issue of letters of credit guaranteeing payment in favour of an exporter secured against an underlying shipment of goods or backed by a confirmatory letter of credit from another bank.
Performance related contingencies are liabilities that oblige the Group to make payments to a third party should the customer fail to fulfil the non-monetary terms of the contract.
To reflect the risk associated with these transactions, they are subjected to the same credit origination, portfolio management and collateral requirements for customers that apply for loans. The contract amount represents the maximum potential amount that could be lost if the counterparty fails to meet its financial obligations. As the facilities may expire without being drawn upon, the notional amounts do not necessarily reflect future cash requirements.
| Consolidated | The Company | |||||||||||||||
Contract amount 2012 $m |
Contract amount 2011 $m |
Contract $m |
Contract $m | |||||||||||||
Financial guarantees | 6,711 | 6,923 | 5,812 | 5,942 | ||||||||||||
Standby letters of credit | 2,450 | 2,672 | 2,156 | 2,307 | ||||||||||||
Documentary letter of credit | 3,201 | 2,964 | 2,689 | 2,561 | ||||||||||||
Performance related contingencies | 19,440 | 17,770 | 18,330 | 16,793 | ||||||||||||
Other | 581 | 881 | 632 | 666 | ||||||||||||
Total | 32,383 | 31,210 | 29,619 | 28,269 | ||||||||||||
Australia | 15,516 | 15,182 | 15,516 | 15,182 | ||||||||||||
New Zealand | 1,075 | 1,122 | – | – | ||||||||||||
Asia Pacific, Europe & America | 15,792 | 14,906 | 14,103 | 13,087 | ||||||||||||
Total | 32,383 | 31,210 | 29,619 | 28,269 | ||||||||||||
NOTES TO THE FINANCIAL STATEMENTS 171

43: Credit Related Commitments, Guarantees, Contingent Liabilities and Contingent Assets(continued)
OTHER BANK RELATED CONTINGENT LIABILITIES
GENERAL
There are outstanding court proceedings, claims and possible claims against the Group, the aggregate amount of which cannot readily be quantified. Appropriate legal advice has been obtained and, in the light of such advice, provisions as deemed necessary have been made. In some instances we have not disclosed the estimated financial impact as this may prejudice the interests of the Group.
i) Exception fees class action
In September 2010, litigation funder IMF (Australia) Ltd commenced a class action against ANZ. The action is claimed to be on behalf of approximately 38,000 ANZ customers for more than $50 million in exception fees claimed to have been charged to those customers. The case is at an early stage. ANZ is defending it. There is a risk that further claims could emerge.
ii) Security recovery actions
Various claims have been made or are anticipated, arising from security recovery actions taken to resolve impaired assets over recent years. ANZ will defend these claims and any future claims.
iii) Contingent tax liability
The Australian Taxation Office (ATO) is reviewing the taxation treatment of certain transactions undertaken by the Group in the course of normal business activities.
Risk reviews and audits are also being undertaken by revenue authorities in other jurisdictions, as part of normal revenue authority activity in those countries.
The Group has assessed these and other taxation claims arising in Australia and elsewhere, including seeking independent advice where appropriate, and considers that it holds appropriate provisions.
iv) Interbank Deposit Agreement
ANZ has entered into an Interbank Deposit Agreement with the major banks in the payment system. This agreement is a payment system support facility certified by APRA, where the terms are such that if any bank is experiencing liquidity problems, the other participants are required to deposit equal amounts of up to $2 billion for a period of 30 days. At the end of 30 days the deposit holder has the option to repay the deposit in cash or by way of assignment of mortgages to the value of the deposit.
v) Clearing and settlement obligations
In accordance with the clearing and settlement arrangements set out:
| n | in the Australian Payments Clearing Association Limited’s Regulations for the Australian Paper Clearing System, the Bulk Electronic Clearing System, the Consumer Electronic Clearing System and the High Value Clearing System (HVCS), the Company has a commitment to comply with rules which could result in a bilateral exposure and loss in the event of a failure to settle by a member institution; and |
| n | in the Austraclear System Regulations (Austraclear) and the CLS Bank International Rules, the Company has a commitment to participate in loss-sharing arrangements in the event of a failure to settle by a member institution. |
For HVCS and Austraclear, the obligation arises only in limited circumstances.
vi) Deed of Cross Guarantee in respect of certain controlled entities
Pursuant to class order 98/1418 (as amended) dated 13 August 1998, relief was granted to a number of wholly owned controlled entities from the Corporations Act 2001 requirements for preparation, audit, and lodgement of individual financial statements in Australia. The results of these companies are included in the consolidated Group results.
The entities to which relief was granted are:
| n | ANZ Properties (Australia) Pty Ltd1 |
| n | ANZ Capital Hedging Pty Ltd1 |
| n | Alliance Holdings Pty Ltd1,6 |
| n | ANZ Orchard Investments Pty Ltd2 |
| n | ANZ Securities (Holdings) Limited3 |
| n | ANZ Commodity Trading Pty Ltd4 |
| n | ANZ Funds Pty Ltd1 |
| n | Votraint No.1103 Pty Ltd2 |
| n | ANZ Nominees Limited5 |
| 1 | Relief originally granted on 21 August 2001. |
| 2 | Relief originally granted on 13 August 2002. |
| 3 | Relief originally granted on 9 September 2003. |
| 4 | Relief originally granted on 2 September 2008. |
| 5 | Relief originally granted on 11 February 2009. |
| 6 | Removed by a Revocation Deed on 10 August 2012. |
172

43: Credit Related Commitments, Guarantees, Contingent Liabilities and Contingent Assets(continued)
It is a condition of the class order that the Company and each of the above controlled entities enter into a Deed of Cross Guarantee. A Deed of Cross Guarantee or subsequent Assumption Deeds under the class order were executed by them and lodged with the Australian Securities and Investments Commission. The Deed of Cross Guarantee is dated 1 March 2006. The effect of the Deed is that the Company guarantees to each creditor payment in full of any debt in the event of winding up any of the controlled entities under certain provisions of the Corporations Act 2001. If a winding up occurs in any other case, the Company will only be liable in the event that after six months any creditor has not been paid in full. The controlled entities have also given similar guarantees in the event that the Company is wound up. The consolidated statement of comprehensive income and consolidated balance sheet of the Company and its wholly owned controlled entities which have entered into the Deed of Cross Guarantee are:
| Consolidated | ||||||||
2012 $m | 2011 $m | |||||||
Profit before tax | 6,497 | 5,809 | ||||||
Income tax expense | (1,549 | ) | (1,476) | |||||
Profit after income tax | 4,948 | 4,333 | ||||||
Foreign exchange differences taken to equity, net of tax | (275 | ) | 103 | |||||
Change in fair value of available-for-sale financial assets, net of tax | (15 | ) | 26 | |||||
Change in fair value of cash flow hedges, net of tax | 39 | 121 | ||||||
Actuarial gains/(loss) on defined benefit plans, net of tax | (28 | ) | 24 | |||||
Other comprehensive income, net of tax | (279 | ) | 274 | |||||
Total comprehensive income | 4,669 | 4,607 | ||||||
Retained profits at start of year | 13,914 | 13,047 | ||||||
Profit after income tax | 4,948 | 4,333 | ||||||
Ordinary share dividends provided for or paid | (3,691 | ) | (3,491) | |||||
Transfer from reserves | 2 | 1 | ||||||
Actuarial gains/(loss) on defined benefit plans after tax | (28 | ) | 24 | |||||
Retained profits at end of year | 15,145 | 13,914 | ||||||
Assets | ||||||||
Liquid assets1 | 32,782 | 21,284 | ||||||
Available-for-sale assets/investment securities | 17,841 | 19,017 | ||||||
Net loans and advances | 349,048 | 323,286 | ||||||
Other assets1 | 171,362 | 147,394 | ||||||
Premises and equipment | 1,573 | 1,539 | ||||||
Total assets | 572,606 | 512,520 | ||||||
Liabilities | ||||||||
Deposits and other borrowings | 333,536 | 307,254 | ||||||
Income tax liability | 804 | 1,169 | ||||||
Payables and other liabilities1 | 200,479 | 168,920 | ||||||
Provisions | 745 | 798 | ||||||
Total liabilities | 535,564 | 478,141 | ||||||
Net assets | 37,042 | 34,379 | ||||||
Shareholders’ equity2 | 37,042 | 34,379 | ||||||
| 1 | Following the restatements set out in note 1 to the financial statements, comparative information in this note has been restated. |
| 2 | Shareholders’ equity excludes retained profits and reserves of controlled entities within the class order. |
NOTES TO THE FINANCIAL STATEMENTS 173

43: Credit Related Commitments, Guarantees, Contingent Liabilities and Contingent Assets(continued)
vii) Sale of Grindlays businesses
On 31 July 2000, ANZ completed the sale to Standard Chartered Bank (SCB) of ANZ Grindlays Bank Limited and the private banking business of ANZ in the United Kingdom and Jersey, together with ANZ Grindlays (Jersey) Holdings Limited and its subsidiaries, for USD1.3 billion in cash. ANZ provided warranties and certain indemnities relating to those businesses and, where it was anticipated that payments would be likely under the warranties or indemnities, made provisions to cover the anticipated liability. The issues below have not impacted adversely the reported results. All settlements, penalties and costs have been covered within the provisions established at the time.
FERA
In 1991 certain amounts were transferred from non-convertible Indian Rupee accounts maintained with Grindlays in India. These transactions may not have complied with the provisions of the Foreign Exchange Regulation Act, 1973. Grindlays, on its own initiative, brought these transactions to the attention of the Reserve Bank of India. The Indian authorities served notices on Grindlays and certain of its officers in India and civil penalties have been imposed which are the subject of appeals. Criminal prosecutions are pending and will be defended. The amounts in issue are not material.
Tax Indemnity
ANZ provided an indemnity relating to tax liabilities of Grindlays (and its subsidiaries) and the Jersey Sub-Group to the extent to which such liabilities were not provided for in the Grindlays accounts as at 31 July 2000. Claims have been made under this indemnity, with no material impact on the Group expected.
CONTINGENT ASSETS
National Housing Bank
In 1992, Grindlays received a claim aggregating to approximately Indian Rupees 5.06 billion from the National Housing Bank (NHB) in India. The claim arose out of cheques drawn by NHB in favour of Grindlays, the proceeds of which were credited to the account of a Grindlays customer.
Grindlays won an arbitration award in March 1997, under which NHB paid Grindlays an award of Indian Rupees 9.12 billion. NHB subsequently won an appeal to the Special Court of Mumbai, after which Grindlays filed an appeal with the Supreme Court of India. Grindlays paid the disputed money including interest into court. Ultimately, the parties settled the matter and agreed to share the monies paid into court which by then totalled Indian Rupees 16.45 billion (AUD 661 million at 19 January 2002 exchange rates), with Grindlays receiving Indian Rupees 6.20 billion (AUD 248 million at 19 January 2002 exchange rates) of the disputed monies.
ANZ in turn received a payment of USD124 million (USD equivalent of the Indian Rupees received by Grindlays) from Standard Chartered Bank under the terms of an indemnity given in connection with the sale of Grindlays to Standard Chartered Bank.
ANZ recovered $114 million in 2006 from its insurers in respect of the above.
In addition, ANZ is entitled to share with NHB in the proceeds of any recovery from the estate of the customer whose account was credited with the cheques drawn from NHB. Recovery is still being pursued.
174

44: Superannuation and Other Post Employment Benefit Schemes
Description of the Group’s post employment benefit schemes
The Group has established a number of pension, superannuation and post-retirement medical benefit schemes throughout the world. The Group may be obliged to contribute to the schemes as a consequence of legislation and provisions of trust deeds. Legal enforceability is dependent on the terms of the legislation and trust deeds.
The major schemes are:
Contribution levels
| ||||||||
| Country | Scheme | Scheme type | Employee/ participant | Employer | ||||
| ||||||||
| Australia | ANZ Australian Staff Superannuation Scheme1,2 | Defined contribution scheme Section C3or
| Optional8 | Balance of cost10 | ||||
| ||||||||
Defined contribution scheme Section Aor
| Optional | 9% of salary11 | ||||||
| ||||||||
Defined benefit scheme Pension Section4
| Nil | Balance of cost12 | ||||||
| ||||||||
| New Zealand | ANZ National Bank Staff Superannuation Scheme (formerly ANZ Group (New Zealand) Staff Superannuation Scheme)1,2
| Defined benefit scheme5or | Nil | Balance of cost13 | ||||
| ||||||||
| Defined contribution scheme | Minimum of 2.5% of salary
| 7.5% of salary14 | ||||||
| ||||||||
National Bank Staff Superannuation Fund1,2
| Defined benefit scheme6or | 5.0% of salary | Balance of cost15 | |||||
| ||||||||
| Defined contribution scheme7 | Minimum of 2.0% of salary
| 11.5% of salary16 | ||||||
| ||||||||
| United Kingdom | ANZ UK Staff Pension Scheme1
| Defined benefit scheme7 | 5.0% of salary9 | Balance of cost17 | ||||
| ||||||||
Balance of cost: the Group’s contribution is assessed by the actuary after taking account of members’ contributions and the value of the schemes’ assets.
| 1 | These schemes provide for pension benefits. |
| 2 | These schemes provide for lump sum benefits. |
| 3 | Closed to new members in 1997. |
| 4 | Closed to new members. Operates to make pension payments to retired members or their dependants. |
| 5 | Closed to new members on 31 March 1990. Operates to make pension payments to retired members of that section of the scheme or their dependants. |
| 6 | Closed to new members on 1 October 1991. |
| 7 | Closed to new members on 1 October 2004. |
| 8 | Optional but with minimum of 1% of salary. |
| 9 | From 1 October 2003, all member contributions are at a rate of 5% of salary. |
| 10 | As determined by the Trustee on the recommendation of the actuary – currently 9% (2011: 9%) of members’ salaries. |
| 11 | 2011: 9% of salary. |
| 12 | As determined by the Trustee on the recommendation of the actuary – $4.7 million p.a. (2011: $1.2 million p.a.). |
| 13 | As recommended by the actuary – currently nil (2011: nil). |
| 14 | 2011: 7.5% of salary. |
| 15 | As recommended by the actuary – currently 24.8% (2011: 24.8%) of members’ salaries and additional contributions of NZD 5 million p.a. |
| 16 | 2011: 11.5% of salary. |
| 17 | As agreed by the Trustee and Group after taking the advice of the actuary – currently 26% (2011: 26%) of pensionable salaries and additional quarterly contributions of GBP 7.5 million until December 2015. |
NOTES TO THE FINANCIAL STATEMENTS 175

44: Superannuation and Other Post Employment Benefit Schemes(continued)
Funding and contribution information for the defined benefit sections of the schemes
The funding and contribution information for the defined benefit sections of the schemes, as extracted from the schemes’ most recent financial reports, is set out below.
In this financial report, the net (liability)/asset arising from the defined benefit obligation recognised in the balance sheet has been determined in accordance with AASB 119 Employee Benefits. However, the excess or deficit of the net market value of assets over accrued benefits shown below has been determined in accordance with AAS 25 Financial Reporting by Superannuation Plans. The excess or deficit for funding purposes shown below differs from the net (liability)/asset in the balance sheet because AAS 25 prescribes a different measurement date and basis to those used for AASB 119 purposes.
| 2012 Schemes | Accrued benefits1 $m | Net market value of assets held by scheme $m | Excess/(deficit) market value of assets over $m | |||||||||
ANZ Australian Staff Superannuation Scheme Pension Section2 | 26 | 15 | (11) | |||||||||
ANZ UK Staff Pension Scheme2 | 1,028 | 749 | (279) | |||||||||
ANZ UK Health Benefits Scheme5 | 7 | – | (7) | |||||||||
ANZ National Bank Staff Superannuation Scheme3 | 4 | 4 | – | |||||||||
National Bank Staff Superannuation Fund4 | 294 | 267 | (27) | |||||||||
Other6,7 | 38 | 28 | (10) | |||||||||
Total | 1,397 | 1,063 | (334) | |||||||||
| 1 | Determined in accordance with AAS 25 Financial Reporting by Superannuation Plans, which prescribes a different measurement date and basis to those applied in this financial report under AASB 119 Employee Benefits. Under AASB 119, the discount rates used are based on prevailing government and corporate bond rates at the reporting date (30 September 2012), rather than the expected return on scheme assets as at the most recent actuarial valuation date (set out below) as prescribed by AAS 25. |
| 2 | Amounts were measured at 31 December 2011. |
| 3 | Amounts were measured at 31 December 2010. |
| 4 | Amounts were measured at 31 March 2012. |
| 5 | Amounts were measured at 30 September 2012. |
| 6 | Amounts were measured at 30 September 2012. |
| 7 | Other includes the defined benefit arrangements in Japan, Philippines and Taiwan. |
| 2011 Schemes | Accrued benefits1 $m | Net market value of assets held $m | Excess/(deficit) of net market value of assets over accrued benefits $m | |||||||||
ANZ Australian Staff Superannuation Scheme Pension Section2 | 27 | 17 | (10) | |||||||||
ANZ UK Staff Pension Scheme2 | 912 | 727 | (185) | |||||||||
ANZ UK Health Benefits Scheme5 | 6 | – | (6) | |||||||||
ANZ National Bank Staff Superannuation Scheme3 | 4 | 4 | – | |||||||||
National Bank Staff Superannuation Fund4 | 296 | 282 | (14) | |||||||||
Other6,7 | 39 | 29 | (10) | |||||||||
Total | 1,284 | 1,059 | (225) | |||||||||
| 1 | Determined in accordance with AAS 25 Financial Reporting by Superannuation Plans, which prescribes a different measurement date and basis to those applied in this financial report under AASB 119 Employee Benefits. Under AASB 119, the discount rates used are based on prevailing government and corporate bond rates at the reporting date (30 September 2011), rather than the expected return on scheme assets as at the most recent actuarial valuation date (set out below) as prescribed by AAS 25. |
| 2 | Amounts were measured at 31 December 2010. |
| 3 | Amounts were measured at 31 December 2010. |
| 4 | Amounts were measured at 31 March 2011. |
| 5 | Amounts were measured at 30 September 2011. |
| 6 | Amounts were measured at 30 September 2011. |
| 7 | Other includes the defined benefit arrangements in Japan, Philippines and Taiwan. |
Employer contributions to the defined benefit sections are based on recommendations by the schemes’ actuaries. Funding recommendations are made by the actuaries based on assumptions of various matters such as future investment performance, interest rates, salary increases, mortality rates and turnover levels. The funding methods adopted by the actuaries are intended to ensure that the benefit entitlements of employees are fully funded by the time they become payable.
The Group expects to make contributions of $61 million (2011: $58 million) to the defined benefit sections of the schemes during the next financial year.
176
 |
44: Superannuation and Other Post Employment Benefit Schemes(continued)
The current contribution recommendations for the major defined sections of the schemes are described below.
ANZ Australian Staff Superannuation Scheme Pension Section
The Pension Section of the ANZ Australian Staff Superannuation Scheme is closed to new members. An interim actuarial valuation, conducted by consulting actuaries Russell Employee Benefits as at 31 December 2011, showed a deficit of $11 million and the actuary recommended that the Group make contributions to the Pension Section of $4.7 million p.a. for the three years to 31 December 2014. The next full actuarial valuation is due to be conducted as at 31 December 2013.
The following economic assumptions were used in formulating the actuary’s funding recommendations:
Rate of investment return | 7.5% p.a. | |||
Pension indexation rate | 2.75% p.a. |
The Group has no present liability under the Scheme’s Trust Deed to commence contributions or fund the deficit.
ANZ UK Staff Pension Scheme
An interim actuarial valuation, conducted by consulting actuaries Towers Watson as at 31 December 2010, showed a deficit of GBP 180 million ($279 million at 30 September 2012 exchange rates).
Following the actuarial valuation as at 31 December 2010, the Group agreed to make regular contributions at the rate of 26% of pensionable salaries. These contributions are sufficient to cover the cost of accruing benefits. To address the deficit, the Group agreed to continue to pay additional quarterly contributions of GBP 7.5 million. These contributions will be reviewed following the next actuarial valuation which is scheduled to be undertaken as at 31 December 2012.
The following economic assumptions were used for the interim actuarial valuation as at 31 December 2011:
Rate of investment return on existing assets | ||||
– to 31 December 2018 | 4.1% p.a. | |||
– to 31 December 2033 | 2.8% p.a. | |||
Rate of investment return for determining ongoing contributions | 6.7% p.a. | |||
Salary increases | 4.8% p.a. | |||
Pension increases | 3.0% p.a. | |||
In deferment increases | 2.3% p.a. |
The Group has no present liability under the Scheme’s Trust Deed to fund the deficit measured under AAS 25. A contingent liability may arise in the event that the Scheme was wound up. If this were to happen, the Trustee would be able to pursue the Group for additional contributions under the UK Employer Debt Regulations. The Group intends to continue the Scheme on an on-going basis.
National Bank Staff Superannuation Fund
A full actuarial valuation of the National Bank Staff Superannuation Fund, conducted by consulting actuaries AON Consulting NZ, as at 31 March 2012 showed a deficit of NZD 34 million ($27 million at 30 September 2012 exchange rates). The actuary recommended that the Group make contributions of 24.8% of salaries plus a lump sum contribution of NZD 5 million p.a. (net of employer superannuation contribution tax) in respect of members of the defined benefit section.
The following economic assumptions were used in formulating the actuary’s funding recommendations:
Rate of investment return (net of income tax) | 5.0% p.a. | |||
Salary increases | 3.0% p.a. | |||
Pension increases | 2.5% p.a. |
The Group has no present liability under the Fund’s Trust Deed to fund the deficit measured under AAS 25. A contingent liability may arise in the event that the Fund was wound up. Under the Fund’s Trust Deed, if the Fund were wound up, the Group is required to pay the Trustees of the Fund an amount sufficient to ensure members do not suffer a reduction in benefits to which they would otherwise be entitled. The Group intends to continue the Fund on an on-going basis.
The basis of calculation under AASB119 is detailed in note 1 F(vii).
NOTES TO THE FINANCIAL STATEMENTS 177

44: Superannuation and Other Post Employment Benefit Schemes(continued)
The following tables summarise the components of the expense recognised in the income statement and the amounts recognised in the balance sheet under AASB 119 for the defined benefit sections of the schemes:
| Consolidated | The Company | |||||||||||||||
2012 $m | 2011 $m | 2012 $m | 2011 $m | |||||||||||||
Amount recognised in income in respect of defined benefit schemes | ||||||||||||||||
Current service cost | 7 | 8 | 5 | 6 | ||||||||||||
Interest cost | 48 | 50 | 42 | 42 | ||||||||||||
Expected return on assets | (44 | ) | (47 | ) | (39 | ) | (41) | |||||||||
Adjustment for contributions tax | 2 | 2 | – | – | ||||||||||||
Total included in personnel expenses | 13 | 13 | 8 | 7 | ||||||||||||
Amounts recognised in the balance sheet in respect of defined benefit schemes | ||||||||||||||||
Present value of funded defined benefit obligation | (1,109 | ) | (1,033 | ) | (913 | ) | (857) | |||||||||
Fair value of scheme assets | 960 | 885 | 846 | 775 | ||||||||||||
Net liability arising from defined benefit obligation | (149 | ) | (148 | ) | (67 | ) | (82) | |||||||||
Amounts recognised in the balance sheet | ||||||||||||||||
Payables and other liabilities | (149 | ) | (148 | ) | (67 | ) | (82) | |||||||||
Net liability arising from defined benefit obligation | (149 | ) | (148 | ) | (67 | ) | (82) | |||||||||
Amounts recognised in equity in respect of defined benefit schemes | ||||||||||||||||
Actuarial (gains)/losses incurred during the year and recognised directly in retained earnings | 54 | 15 | 35 | (34) | ||||||||||||
Cumulative actuarial (gains)/losses recognised directly in retained earnings | 298 | 244 | 208 | 173 | ||||||||||||
The Group has a legal liability to fund deficits in the schemes, but no legal right to use any surplus in the schemes to further its own interests. The Group has no present liability to settle deficits with an immediate contribution.
Movements in the present value of the defined benefit obligation in the relevant period | ||||||||||||||||
Opening defined benefit obligation | 1,033 | 1,059 | 857 | 928 | ||||||||||||
Current service cost | 7 | 8 | 5 | 6 | ||||||||||||
Interest cost | 48 | 50 | 42 | 42 | ||||||||||||
Contributions from scheme participants | 1 | 1 | – | – | ||||||||||||
Actuarial (gains)/losses | 105 | (10 | ) | 79 | (55) | |||||||||||
Exchange difference on foreign schemes | (24 | ) | (18 | ) | (25 | ) | (22) | |||||||||
Benefits paid | (61 | ) | (57 | ) | (45 | ) | (42) | |||||||||
Closing defined benefit obligation | 1,109 | 1,033 | 913 | 857 | ||||||||||||
Movements in the fair value of the scheme assets in the relevant period | ||||||||||||||||
Opening fair value of scheme assets | 885 | 873 | 775 | 761 | ||||||||||||
Expected return on scheme assets | 44 | 47 | 39 | 41 | ||||||||||||
Actuarial gains/(losses) | 51 | (25 | ) | 44 | (21) | |||||||||||
Exchange difference on foreign schemes | (21 | ) | (13 | ) | (22 | ) | (17) | |||||||||
Contributions from the employer | 61 | 59 | 55 | 53 | ||||||||||||
Contributions from scheme participants | 1 | 1 | – | – | ||||||||||||
Benefits paid | (61 | ) | (57 | ) | (45 | ) | (42) | |||||||||
Closing fair value of scheme assets1 | 960 | 885 | 846 | 775 | ||||||||||||
Actual return on scheme assets | 95 | 22 | 83 | 20 |
| 1 | Scheme assets include the following financial instruments issued by the Group: cash and short-term debt instruments $1.4 million (September 2011: $1.0 million), fixed interest securities $0.6 million (September 2011: $0.6 million) and equities nil (September 2011: nil). |
| Consolidated | The Company | |||||||||||||||
Fair value of scheme assets | Fair value of scheme assets | |||||||||||||||
2012 % | 2011 % | 2012 % | 2011 % | |||||||||||||
Analysis of the scheme assets | ||||||||||||||||
Equities | 38 | 36 | 36 | 34 | ||||||||||||
Debt securities | 43 | 47 | 44 | 48 | ||||||||||||
Property | 7 | 8 | 8 | 9 | ||||||||||||
Other assets | 12 | 9 | 12 | 9 | ||||||||||||
Total assets | 100 | 100 | 100 | 100 | ||||||||||||
178

44: Superannuation and Other Post Employment Benefit Schemes(continued)
2012 % | 2011 % | |||||||
Key actuarial assumptions used (expressed as weighted averages) | ||||||||
Discount rate | ||||||||
ANZ Australian Staff Superannuation Scheme – Pension Section | 2.75 | 4.25 | ||||||
ANZ UK Staff Pension Scheme | 4.40 | 5.40 | ||||||
ANZ UK Health Benefits Scheme | 4.40 | 5.40 | ||||||
ANZ National Bank Staff Superannuation Scheme | 3.50 | 4.40 | ||||||
National Bank Staff Superannuation Fund | 3.50 | 4.40 | ||||||
Expected rate of return on scheme assets | ||||||||
ANZ Australian Staff Superannuation Scheme – Pension Section | 6.50 | 8.00 | ||||||
ANZ UK Staff Pension Scheme | 4.70 | 5.30 | ||||||
ANZ UK Health Benefits Scheme | n/a | n/a | ||||||
ANZ National Bank Staff Superannuation Scheme | 4.50 | 4.50 | ||||||
National Bank Staff Superannuation Fund | 5.00 | 5.50 | ||||||
Future salary increases | ||||||||
ANZ UK Staff Pension Scheme | 4.50 | 4.90 | ||||||
National Bank Staff Superannuation Fund | 3.00 | 3.00 | ||||||
Future pension increases | ||||||||
ANZ Australian Staff Superannuation Scheme – Pension Section | 2.50 | 2.75 | ||||||
ANZ UK Staff Pension Scheme | ||||||||
– In payment | 2.70 | 3.10 | ||||||
– In deferment | 2.00 | 2.10 | ||||||
ANZ National Bank Staff Superannuation Scheme | 2.50 | 2.50 | ||||||
National Bank Staff Superannuation Fund | 2.50 | 2.50 | ||||||
Future medical cost trend – short-term | ||||||||
ANZ UK Health Benefits Scheme | 6.60 | 4.50 | ||||||
Future medical cost trend – long-term | ||||||||
ANZ UK Health Benefits Scheme | 6.60 | 6.50 | ||||||
To determine the expected returns of each of the asset classes held by the relevant scheme, the actuaries assessed historical return trends and market expectations for the asset class returns applicable for the period over which the obligation is to be settled. The overall expected rate of return on assets for each scheme was then determined as the weighted average of the expected returns for the classes of assets held by the relevant scheme.
Assumed medical cost trend rates do not have a material effect on the amounts recognised as income or included in the balance sheet.
| Consolidated | The Company | |||||||||||||||||||||||||||||||||||||||
2012 $m | 2011 $m | 2010 $m | 2009 $m | 2008 $m | 2012 $m | 2011 $m | 2010 $m | 2009 $m | 2008 $m | |||||||||||||||||||||||||||||||
History of experience adjustments | ||||||||||||||||||||||||||||||||||||||||
Defined benefits obligation | (1,109 | ) | (1,033 | ) | (1,059 | ) | (1,095 | ) | (1,160 | ) | (913 | ) | (857 | ) | (928 | ) | (938 | ) | (1,003) | |||||||||||||||||||||
Fair value of scheme assets | 960 | 885 | 873 | 849 | 1,006 | 846 | 775 | 761 | 738 | 871 | ||||||||||||||||||||||||||||||
Surplus/(deficit) | (149 | ) | (148 | ) | (186 | ) | (246 | ) | (154 | ) | (67 | ) | (82 | ) | (167 | ) | (200 | ) | (132) | |||||||||||||||||||||
Experience adjustments on scheme liabilities | 1 | (11 | ) | (2 | ) | 7 | 12 | 2 | (10 | ) | 1 | 7 | 8 | |||||||||||||||||||||||||||
Experience adjustments on scheme assets | 51 | (25 | ) | 36 | (49 | ) | (195 | ) | 45 | (21 | ) | 26 | (32 | ) | (177) | |||||||||||||||||||||||||
NOTES TO THE FINANCIAL STATEMENTS 179

45: Employee Share and Option Plans
ANZ operates a number of employee share and option schemes under the ANZ Employee Share Acquisition Plan and the ANZ Share Option Plan.
ANZ EMPLOYEE SHARE ACQUISITION PLAN
ANZ Employee Share Acquisition Plan (ESAP) schemes that existed during the 2011 and 2012 years were the Employee Share Offer (previously known as the $1,000 Share Plan), the Deferred Share Plan and the Employee Share Save Scheme (ESSS). Note the ESSS is an employee salary sacrifice plan and is not captured as a share based payment expense.
Employee Share Offer (previously known as the $1,000 Share Plan)
Each permanent employee (excluding senior executives) who has had continuous service for one year is eligible to participate in the Employee Share Offer enabling the grant of up to $1,000 of ANZ shares in each financial year, subject to approval of the Board. At a date approved by the Board, the shares will be granted to all eligible employees using the one week weighted average price of ANZ shares traded on the ASX in the week leading up to and including the date of grant.
In Australia and three overseas locations (Cook Islands, Kiribati and Solomon Islands), ANZ ordinary shares are granted to eligible employees for nil consideration and vest immediately when granted, as there is no forfeiture provision. It is a requirement, however, that shares are held in trust for three years from the date of grant, after which time they may remain in trust, be transferred to the employee’s name or sold. Dividends received on the shares are automatically reinvested into the Dividend Reinvestment Plan.
In New Zealand shares are granted to eligible employees upon payment of NZD one cent per share.
From 2011, shares granted in New Zealand and the remaining overseas locations under this plan vest subject to the satisfaction of a three year service period, after which time they may remain in trust, be transferred into the employee’s name or sold. Unvested shares are forfeited in the event of resignation or dismissal for serious misconduct. Dividends are either received as cash or reinvested into the Dividend Reinvestment Plan.
During the 2012 year, 1,822,760 shares with an issue price of $20.21 were granted under the plan to employees on 5 December 2011 (2011 year: 1,472,882 shares with an issue price of $23.05 were granted on 6 December 2010).
Deferred Share Plan
A Short Term Incentive (STI) mandatory deferral program was implemented from 2009, with equity deferral relating to half of all STI amounts above a specified threshold. Prior to 2011, deferred equity could be taken as 100% shares or 50% shares and 50% options. From 2011, all deferred equity is taken as 100% shares. Unvested STI deferred shares are forfeited on resignation, termination on notice or dismissal for serious misconduct.
Selected employees may also be granted Long Term Incentive (LTI) deferred shares which vest to the employee three years from the date of grant. Ordinary shares granted under this LTI plan may be held in trust beyond the deferral period. Unvested LTI deferred shares are forfeited on resignation, termination on notice or dismissal for serious misconduct.
In exceptional circumstances, deferred shares are granted to certain employees upon commencement with ANZ to compensate for remuneration forgone from their previous employer. The vesting period generally aligns with the remaining vesting period of remuneration forgone, and therefore varies between grants. Retention deferred shares may also be granted occasionally to high performing employees who are regarded as a significant retention risk to ANZ. Unvested deferred shares are forfeited on resignation, termination on notice or dismissal for serious misconduct.
The employee receives dividends on deferred shares while those shares are held in trust (cash or Dividend Reinvestment Plan).
Deferred share rights are granted instead of deferred shares to accommodate offshore taxation regulations (refer to Deferred Share Rights section).
The issue price for deferred shares is based on the volume weighted average price of the shares traded on the ASX in the week leading up to and including the date of grant.
During the 2012 year, 7,001,566 deferred shares with a weighted average grant price of $21.19 were granted under the deferred share plan (2011 year: 6,393,787 shares with a weighted average grant price of $23.55 were granted).
Share Valuations
The fair value of shares granted in the 2012 year under the Employee Share Offer and the Deferred Share Plan, measured as at the date of grant of the shares, is $185.4 million based on 8,824,326 shares at a volume weighted average price of $21.01 (2011 year: fair value of shares granted was $182.7 million based on 7,866,669 shares at a weighted average price of $23.22). The volume weighted average share price of all ANZ shares sold on the ASX on the date of grant is used to calculate the fair value of shares. No dividends are incorporated into the measurement of the fair value of shares.
ANZ SHARE OPTION PLAN
Selected employees may be granted options/rights, which entitle them to acquire ordinary fully paid shares in ANZ at a price fixed at the time the options/rights are granted. Voting and dividend rights will be attached to the ordinary shares allocated on exercise of the options/rights.
Each option/right entitles the holder to one ordinary share subject to the terms and conditions imposed on grant. The exercise price of the options, determined in accordance with the rules of the plan, is generally based on the weighted average price of the shares traded on the ASX in the week leading up to and including the date of grant. For rights, the exercise price is nil.
| 180 |

45: Employee Share and Option Plans(continued)
The option plan rules set out the entitlements a holder of options/ rights has prior to exercise in the event of a bonus issue, pro-rata new issue or reorganisation of ANZ’s share capital. In summary:
| n | if ANZ has issued bonus shares during the life of an option and prior to the exercise of the option, then when the option is exercised the option holder is also entitled to be issued such number of bonus shares as the holder would have been entitled to if the option holder had held the underlying shares at the time of the bonus issue; |
| n | if ANZ makes a pro-rata offer of securities during the life of an option and prior to the exercise of the option, the exercise price of the option will be adjusted in the manner set out in the ASX Listing Rules; and |
| n | in respect of rights, if there is a bonus issue or reorganisation of the Bank’s share capital, the number of rights or the number of underlying shares may be adjusted so that there is no advantage or disadvantage to the holder. |
Holders otherwise have no other entitlements to participate in any new issue of ANZ securities prior to exercise of their options/rights. Holders also have no right to participate in a share issue of a body corporate other than ANZ (e.g. a subsidiary).
ANZ Share Option Plan schemes expensed in the 2011 and 2012 years are as follows:
Current Option Plans
Performance Rights Plan (excluding CEO Performance Rights)
Performance rights are granted to selected employees as part of ANZ’s LTI program. Performance rights provide the right to acquire ANZ shares at nil cost, subject to a three year vesting period and a Total Shareholder Return (TSR) performance hurdle. Further details in relation to performance rights are detailed in Section 6.2.2 Long Term Incentives in the 2012 Remuneration Report.
The provisions that apply in the case of cessation of employment are detailed in Section 8.3 Disclosed Executives in the 2012 Remuneration Report, pages 27 to 29.
During the 2012 year, 586,925 performance rights (excluding CEO performance rights) were granted (2011: 466,133).
CEO Performance Rights
At the 2011 Annual General Meeting shareholders approved an LTI grant to the CEO equivalent to 100% of his 2011 Total Employment Cost (TEC), being $3.15 million. This equated to a total of 326,424 performance rights being allocated, which will be subject to testing against a TSR hurdle after three years, i.e. December 2014.
At the 2010 Annual General Meeting shareholders approved an LTI grant to the CEO equivalent to 100% of his 2010 TEC, being $3 million. This equated to a total of 253,164 performance rights being allocated, which will be subject to testing against a TSR hurdle after three years, i.e. December 2013.
At the 2007 Annual General Meeting shareholders approved an LTI grant consisting of three tranches of performance rights, each to a maximum value of $3 million. The performance periods for each tranche begin on the date of grant of 19 December 2007 and end on the third, fourth and fifth anniversaries respectively (i.e. only one performance measurement for each tranche). The first of these tranches was tested against a relative TSR hurdle after three years, i.e. December 2010. As a result of the testing, 258,620 performance rights vested and were exercised during the year. The second tranche was tested in December 2011 against a relative TSR hurdle. As a result of the testing, 259,740 performance rights vested and were exercised during the year.
The provisions that apply in the case of cessation of employment are detailed in Section 8.2 Chief Executive Officer in the 2012 Remuneration Report, pages 25 to 27.
CEO Options
At the 2008 Annual General Meeting, shareholders approved a special grant to the CEO of 700,000 options, granted on 18 December 2008. At grant the options were independently valued with a fair value of $2.27 each (total value of $1.589 million) and an option exercise price $14.18 per share. Upon exercise, each option entitles the CEO to one ordinary ANZ share. The options vested on 18 December 2011 and were exercised during the year.
Deferred Options (no performance hurdles)
Under the STI deferral program half of all amounts above a specified threshold are provided as deferred equity. Previously deferred equity could be taken as 100% shares or 50% shares and 50% options. From 2011, all deferred equity is taken as 100% shares (refer to Deferred Share Plan section above).
During the 2012 year no deferred options (no performance hurdles) were granted (2011: 395,564).
Deferred Share Rights (no performance hurdles)
Deferred share rights are granted instead of deferred shares to accommodate offshore taxation regulations. They provide the right to acquire ANZ shares at nil cost after a specified vesting period. The fair value of rights is adjusted for the absence of dividends during the restriction period. Treatment of rights in respect of cessation relates to the purpose of the grant (refer to Deferred Share Plan section above).
During the 2012 year 1,013,185 deferred share rights (no performance hurdles) were granted (2011: 541,213).
Options, deferred share rights and performance rights on issue
As at 5 November 2012, there were 178 holders of 1,175,199 options on issue, 840 holders of 1,649,971 deferred share rights on issue and 13 holders of 2,511,050 performance rights on issue.
| NOTES TO THE FINANCIAL STATEMENTS 181 |

45: Employee Share and Option Plans(continued)
Option Movements
Details of options/rights over unissued ANZ shares and their related weighted average exercise prices as at the beginning and end of 2012 and movements during 2012 follow:
| Opening balance 1 October 2011 | Options/rights granted | Options/rights forfeited | Options/rights expired | Options/rights exercised | Closing balance 30 September 2012 | |||||||||||||||||
| 8,961,579 | 1,926,534 | (192,972 | ) | (474,499) | (4,279,351) | 5,941,291 | ||||||||||||||||
Weighted average exercise price | $12.44 | $0.00 | $9.63 | $21.37 | $14.18 | $6.53 | ||||||||||||||||
The weighted average closing share price during the year ended 30 September 2012 was $21.88 (2011: $22.35).
The weighted average remaining contractual life of options/rights outstanding at 30 September 2012 was 2.5 years (2011: 2.1 years).
The weighted average exercise price of all exercisable options/rights outstanding at 30 September 2012 was $20.93 (2011: $20.87).
A total of 1,629,751 exercisable options/rights were outstanding at 30 September 2012 (2011: 4,286,317).
Details of options/rights over unissued ANZ shares and their related weighted average exercise prices as at the beginning and end of 2011 and movements during 2011 are set out below:
| Opening balance 1 October 2010 | Options/rights granted | Options/rights forfeited | Options/rights expired | Options/rights exercised | Closing balance 30 September 2011 | |||||||||||||||||
| 11,539,878 | 1,656,074 | (131,689 | ) | (160,071) | (3,942,613) | 8,961,579 | ||||||||||||||||
Weighted average exercise price | $13.01 | $5.66 | $12.72 | $20.34 | $10.93 | $12.44 | ||||||||||||||||
No options/rights over ordinary shares have been granted since the end of 2012 up to the signing of the Directors’ Report on 5 November 2012.
Details of shares issued as a result of the exercise of options/rights during 2012 are as follows:
Exercise price $ | No. of shares issued | Proceeds received $ | Exercise price $ | No. of shares issued | Proceeds received $ | |||||||||
0.00 | 3,486 | – | 0.00 | 259,740 | – | |||||||||
0.00 | 13,491 | – | 0.00 | 268,268 | – | |||||||||
0.00 | 19 | – | 0.00 | 90,520 | – | |||||||||
0.00 | 59 | – | 0.00 | 25,748 | – | |||||||||
0.00 | 63 | – | 0.00 | 399 | – | |||||||||
0.00 | 249,166 | – | 14.18 | 700,000 | 9,926,000 | |||||||||
0.00 | 3,945 | – | 17.18 | 314,660 | 5,405,859 | |||||||||
0.00 | 1,224 | – | 17.18 | 124,835 | 2,144,665 | |||||||||
0.00 | 17,474 | – | 17.18 | 124,832 | 2,144,614 | |||||||||
0.00 | 78,287 | – | 17.18 | 13,841 | 237,788 | |||||||||
0.00 | 20,677 | – | 17.18 | 380 | 6,528 | |||||||||
0.00 | 8,576 | – | 17.18 | 760 | 13,057 | |||||||||
0.00 | 3,259 | – | 20.68 | 218,637 | 4,521,413 | |||||||||
0.00 | 1,860 | – | 20.68 | 785,411 | 16,242,299 | |||||||||
0.00 | 2,916 | – | 22.80 | 35,823 | 816,764 | |||||||||
0.00 | 10,741 | – | 22.80 | 2,388 | 54,446 | |||||||||
0.00 | 65,994 | – | 22.80 | 35,822 | 816,742 | |||||||||
0.00 | 3,658 | – | 22.80 | 2,388 | 54,446 | |||||||||
0.00 | 8,329 | – | 23.49 | 778,526 | 18,287,576 | |||||||||
0.00 | 3,149 | – |
Details of shares issued as a result of the exercise of options/rights during 2011 are as follows:
Exercise price $ | No. of shares issued | Proceeds received $ | Exercise price $ | No. of shares issued | Proceeds received $ | |||||||||
0.00 | 12,481 | – | 0.00 | 3,118 | – | |||||||||
0.00 | 185,723 | – | 0.00 | 5,347 | – | |||||||||
0.00 | 10,421 | – | 0.00 | 2,439 | – | |||||||||
0.00 | 9,623 | – | 0.00 | 19 | – | |||||||||
0.00 | 1,662 | – | 17.55 | 440,251 | 7,726,405 | |||||||||
0.00 | 15,420 | – | 17.55 | 69,106 | 1,212,810 | |||||||||
0.00 | 648,296 | – | 18.22 | 829,957 | 15,121,817 | |||||||||
0.00 | 6,089 | – | 18.22 | 270,465 | 4,927,872 | |||||||||
0.00 | 119,251 | – | 20.68 | 2,908 | 60,137 | |||||||||
0.00 | 17,351 | – | 20.68 | 127,788 | 2,642,656 | |||||||||
0.00 | 22,633 | – | 20.68 | 202,802 | 4,193,945 | |||||||||
0.00 | 258,620 | – | 23.49 | 74,259 | 1,744,344 | |||||||||
0.00 | 82 | – | 17.18 | 101,861 | 1,749,972 | |||||||||
0.00 | 33,459 | – | 17.18 | 36,096 | 620,129 | |||||||||
0.00 | 83,197 | – | 17.18 | 129,283 | 2,221,082 | |||||||||
0.00 | 65,687 | – | 17.18 | 3,081 | 52,932 | |||||||||
0.00 | 12,696 | – | 17.18 | 1,587 | 27,265 | |||||||||
0.00 | 78,422 | – | 17.18 | 35,456 | 609,134 | |||||||||
0.00 | 5,095 | – | 22.80 | 7,430 | 169,404 | |||||||||
0.00 | 13,152 | – |
182

45: Employee Share and Option Plans(continued)
Details of shares as a result of the exercise of options/rights since the end of 2012 up to the signing of the Directors’ Report on 5 November 2012 are as follows:
Exercise price $ | No. of shares issued | Proceeds received $ | Exercise price $ | No. of shares issued | Proceeds received $ | |||||||
| 0.00 | 336 | – | 23.49 | 477,006 | 11,204,871 | |||||||
0.00 | 1,601 | – | 17.18 | 6,529 | 112,168 | |||||||
0.00 | 253 | – | 17.18 | 82,255 | 1,413,141 | |||||||
0.00 | 285 | – | 17.18 | 1,233 | 21,183 | |||||||
0.00 | 1,102 | – | 22.80 | 8,792 | 200,458 | |||||||
0.00 | 2,799 | – | 22.80 | 8,791 | 200,435 | |||||||
0.00 | 43 | – | 23.71 | 10,000 | 237,100 |
In determining the fair value below, the standard market techniques for valuation including Monte Carlo and/or Black Scholes pricing models were applied in accordance with the requirements of AASB 2 Share-based Payment. The models take into account early exercise of vested equity, non-transferability and market based performance hurdles (if any). The significant assumptions used to measure the fair value of instruments granted during 2012 are contained in the table below:
| Type of equity | Grant date | | Number of options/rights | |
| Equity fair value ($) |
| | Exercise price (5 day | |
| Share closing price at grant ($) |
|
| ANZ expected volatility (%) |
1
|
| Equity term (years) |
|
| Vesting period (years) |
|
| Expected life (years) |
|
| Expected dividend yield (%) |
| Risk free interest rate (%) | |||||||||||||
STI deferred share rights | 14-Nov-11 | 51,241 | 20.66 | 0.00 | 20.66 | 25 | 2.4 | 0.4 | 0.4 | 6.50 | 4.48 | |||||||||||||||||||||||||||||||
| 14-Nov-11 | 143,711 | 19.40 | 0.00 | 20.66 | 25 | 3 | 1 | 1 | 6.50 | 3.70 | ||||||||||||||||||||||||||||||||
| 14-Nov-11 | 153,099 | 18.21 | 0.00 | 20.66 | 25 | 4 | 2 | 2 | 6.50 | 3.65 | ||||||||||||||||||||||||||||||||
| 14-Nov-11 | 21,968 | 17.10 | 0.00 | 20.66 | 25 | 5 | 3 | 3 | 6.50 | 3.53 | ||||||||||||||||||||||||||||||||
LTI deferred share rights | 14-Nov-11 | 510,804 | 17.10 | 0.00 | 20.66 | 25 | 5 | 3 | 3 | 6.50 | 3.53 | |||||||||||||||||||||||||||||||
LTI performance rights | 14-Nov-11 | 586,925 | 9.03 | 0.00 | 20.66 | 25 | 5 | 3 | 3 | 6.50 | 3.53 | |||||||||||||||||||||||||||||||
| 16-Dec-11 | 326,424 | 9.65 | 0.00 | 20.93 | 25 | 5 | 3 | 3 | 7.00 | 3.06 | ||||||||||||||||||||||||||||||||
Deferred share rights | 14-Nov-11 | 11,524 | 19.09 | 0.00 | 20.66 | 25 | 3.3 | 1.3 | 1.3 | 6.50 | 3.70 | |||||||||||||||||||||||||||||||
| 14-Nov-11 | 13,989 | 18.80 | 0.00 | 20.66 | 25 | 3.5 | 1.5 | 1.5 | 6.50 | 3.65 | ||||||||||||||||||||||||||||||||
| 14-Nov-11 | 12,081 | 18.21 | 0.00 | 20.66 | 25 | 4 | 2 | 2 | 6.50 | 3.65 | ||||||||||||||||||||||||||||||||
| 14-Nov-11 | 12,269 | 17.93 | 0.00 | 20.66 | 25 | 4.3 | 2.3 | 2.3 | 6.50 | 3.65 | ||||||||||||||||||||||||||||||||
| 5-Dec-11 | 13,211 | 17.42 | 0.00 | 21.05 | n/a | 3 | 3 | 3 | 6.30 | n/a | ||||||||||||||||||||||||||||||||
| 27–Feb–12 | 788 | 20.73 | 0.00 | 22.08 | n/a | 3 | 1 | 1 | 6.30 | n/a | ||||||||||||||||||||||||||||||||
| 27–Feb–12 | 839 | 19.46 | 0.00 | 22.08 | n/a | 4 | 2 | 2 | 6.30 | n/a | ||||||||||||||||||||||||||||||||
| 8–Jun–12 | 3,295 | 20.73 | 0.00 | 21.56 | 25 | 2.8 | 0.8 | 0.8 | 5.20 | 2.70 | ||||||||||||||||||||||||||||||||
| 8–Jun–12 | 3,301 | 19.21 | 0.00 | 21.56 | 25 | 3.7 | 1.7 | 1.7 | 6.90 | 2.41 | ||||||||||||||||||||||||||||||||
| 8–Jun–12 | 2,172 | 17.63 | 0.00 | 21.56 | n/a | 4.8 | 2.8 | 2.8 | 7.50 | 2.31 | ||||||||||||||||||||||||||||||||
| 23–Jul–12 | 10,610 | 21.91 | 0.00 | 22.82 | 25 | 2.7 | 0.7 | 0.7 | 6.50 | 3.43 | ||||||||||||||||||||||||||||||||
| 23–Jul–12 | 11,455 | 21.43 | 0.00 | 22.82 | 25 | 3 | 1 | 1 | 6.50 | 2.40 | ||||||||||||||||||||||||||||||||
| 23–Jul–12 | 7,491 | 20.62 | 0.00 | 22.82 | 25 | 3.6 | 1.6 | 1.6 | 6.50 | 2.28 | ||||||||||||||||||||||||||||||||
| 23–Jul–12 | 12,822 | 20.12 | 0.00 | 22.82 | 25 | 4 | 2 | 2 | �� | 6.50 | 2.28 | |||||||||||||||||||||||||||||||
| 23–Jul–12 | 5,928 | 19.31 | 0.00 | 22.82 | 25 | 4.7 | 2.7 | 2.7 | 6.50 | 2.17 | ||||||||||||||||||||||||||||||||
| 23–Jul–12 | 10,587 | 18.89 | 0.00 | 22.82 | 25 | 5 | 3 | 3 | 6.50 | 2.17 |
The significant assumptions used to measure the fair value of instruments granted during 2011 are contained in the table below:
| Type of equity | Grant date | | Number of options/rights | |
| Equity fair value ($) |
| | Exercise price (5 day | |
| Share closing price at grant ($) |
|
| ANZ expected volatility (%) |
1
|
| Equity term (years) |
|
| Vesting period (years) |
|
| Expected life (years) |
|
| Expected dividend yield (%) |
| Risk free interest rate (%) | |||||||||||||
STI deferred options | 12-Nov-10 | 197,786 | 3.96 | 23.71 | 23.22 | 30 | 5 | 1 | 3 | 5.00 | 5.04 | |||||||||||||||||||||||||||||||
| 12-Nov-10 | 197,778 | 4.20 | 23.71 | 23.22 | 30 | 5 | 2 | 3.5 | 5.00 | 5.11 | ||||||||||||||||||||||||||||||||
STI deferred share rights | 12-Nov-10 | 83,125 | 22.11 | 0.00 | 23.22 | 30 | 5 | 1 | 1 | 5.00 | 4.70 | |||||||||||||||||||||||||||||||
| 12-Nov-10 | 87,273 | 21.06 | 0.00 | 23.22 | 30 | 5 | 2 | 2 | 5.00 | 4.97 | ||||||||||||||||||||||||||||||||
LTI deferred share rights | 12-Nov-10 | 323,757 | 20.06 | 0.00 | 23.22 | 30 | 5 | 3 | 3 | 5.00 | 5.04 | |||||||||||||||||||||||||||||||
LTI performance rights | 12-Nov-10 | 466,133 | 11.96 | 0.00 | 23.22 | 30 | 5 | 3 | 3 | 5.00 | 5.04 | |||||||||||||||||||||||||||||||
| 17-Dec-10 | 253,164 | 11.85 | 0.00 | 23.59 | 30 | 4 | 3 | 3 | 5.00 | 5.15 | ||||||||||||||||||||||||||||||||
Deferred share rights | 12-Nov-10 | 3,988 | 20.06 | 0.00 | 23.22 | 30 | 5 | 3 | 3 | 5.00 | 5.04 | |||||||||||||||||||||||||||||||
| 6-Dec-10 | 3,130 | 20.10 | 0.00 | 23.27 | 30 | 3 | 3 | 3 | 5.00 | 4.94 | ||||||||||||||||||||||||||||||||
| 10-May-11 | 8,329 | 21.97 | 0.00 | 23.07 | 25 | 2 | 1 | 1 | 5.00 | 4.96 | ||||||||||||||||||||||||||||||||
| 10-May-11 | 1,625 | 20.92 | 0.00 | 23.07 | 25 | 3 | 2 | 2 | 5.00 | 5.02 | ||||||||||||||||||||||||||||||||
| 25-Jul-11 | 2,799 | 20.10 | 0.00 | 21.31 | 25 | 2 | 1 | 1 | 6.00 | 4.41 | ||||||||||||||||||||||||||||||||
| 25-Jul-11 | 3,115 | 18.96 | 0.00 | 21.31 | 25 | 3 | 2 | 2 | 6.00 | 4.34 | ||||||||||||||||||||||||||||||||
| 25-Jul-11 | 1,055 | 19.90 | 0.00 | 21.31 | 25 | 2.2 | 1.2 | 1.2 | 6.00 | 4.41 | ||||||||||||||||||||||||||||||||
| 25-Jul-11 | 1,119 | 18.78 | 0.00 | 21.31 | 25 | 3.2 | 2.2 | 2.2 | 6.00 | 4.34 | ||||||||||||||||||||||||||||||||
| 29-Aug-11 | 3,149 | 19.05 | 0.00 | 20.21 | n/a | 2 | 1 | 1 | 5.90 | n/a | ||||||||||||||||||||||||||||||||
| 29-Aug-11 | 17,037 | 17.96 | 0.00 | 20.21 | n/a | 3 | 2 | 2 | 5.90 | n/a | ||||||||||||||||||||||||||||||||
| 29-Aug-11 | 1,712 | 16.93 | 0.00 | 20.21 | n/a | 4 | 3 | 3 | 5.90 | n/a |
| 1 | Expected volatility represents a measure of the amount by which ANZ’s share price is expected to fluctuate over the life of the options/rights. The measure of volatility used in the model is the annualised standard deviation of the continuously compounded rates of return on the historical share price over a defined period of time preceding the date of grant. This historical average annualised volatility is then used to estimate a reasonable expected volatility over the expected life of the options/rights. |
NOTES TO THE FINANCIAL STATEMENTS 183

46: Key Management Personnel Disclosures
SECTION A: KEY MANAGEMENT PERSONNEL COMPENSATION
The Key Management Personnel (KMP) compensation included in the personnel disclosure expenses is as follows:
| 2012 | 2011 | |||||||||||||||||||||
Non- Executives $ | Executives $ | Total $ | Non- Executives $ | Executives $ | Total $ | |||||||||||||||||
Short-term benefits | 2,742,072 | 19,288,020 | 22,030,092 | 2,604,686 | 18,106,775 | 20,711,461 | ||||||||||||||||
Post-employment benefits | 119,704 | 528,821 | 648,525 | 107,401 | 458,385 | 565,786 | ||||||||||||||||
Long-term benefits | – | 279,271 | 279,271 | – | 171,717 | 171,717 | ||||||||||||||||
Termination benefits | – | 1,171,226 | 1,171,226 | – | – | – | ||||||||||||||||
Share-based payments | – | 14,335,722 | 14,335,722 | – | 12,721,125 | 12,721,125 | ||||||||||||||||
| 2,861,776 | 35,603,060 | 38,464,836 | 2,712,087 | 31,458,002 | 34,170,089 | |||||||||||||||||
SECTION B: KEY MANAGEMENT PERSONNEL LOAN TRANSACTIONS
Loans made to directors of the Company and other key management personnel of the Group are made in the ordinary course of business on an arm’s length commercial basis, including the term of the loan, security required and the interest rate.
Details of loans outstanding at the reporting date to directors of the Company and other key management personnel of the Group including their related parties, where the individuals aggregate loan balance exceeded $100,000 at any time in the year, are as follows:
Opening balance $ | Closing balance $ | Interest paid and $ | Highest balance period $ | |||||||||||||
Directors | ||||||||||||||||
Executive Director 2012 | ||||||||||||||||
M Smith | 18,380,409 | 1,000,000 | 81,957 | 18,380,409 | ||||||||||||
Executive Director 2011 | ||||||||||||||||
M Smith | 6,840,953 | 18,380,409 | 1,510,088 | 18,403,779 | ||||||||||||
Non–Executive Directors 2012 | ||||||||||||||||
P Hay | 661,793 | – | 12,746 | 674,539 | ||||||||||||
A Watkins | 3,320,081 | 3,600,000 | 233,540 | 3,600,146 | ||||||||||||
Non–Executive Directors 2011 | ||||||||||||||||
P Hay | 1,125,000 | 661,793 | 63,607 | 1,131,263 | ||||||||||||
A Watkins | 3,490,211 | 3,320,081 | 237,748 | 3,490,388 | ||||||||||||
Other key management personnel 2012 | ||||||||||||||||
G Hodges | 5,202,380 | 5,150,773 | 311,475 | 5,671,775 | ||||||||||||
A Thursby | 2,984,500 | 2,859,500 | 161,276 | 2,984,500 | ||||||||||||
C Page1 | 511,605 | 739,500 | 5,115 | 739,777 | ||||||||||||
D Hisco | 2,000,000 | 2,000,000 | 84,031 | 2,000,000 | ||||||||||||
S Elliott | – | 3,200,000 | 79,362 | 3,900,000 | ||||||||||||
N Williams2 | 729,218 | – | 22,115 | 864,755 | ||||||||||||
Other key management personnel 2011 | ||||||||||||||||
G Hodges | 8,018,058 | 5,202,380 | 441,857 | 8,753,988 | ||||||||||||
A Thursby | 1,596,910 | 2,984,500 | 248,615 | 4,581,410 | ||||||||||||
C Page | 559,471 | 511,605 | �� | 6,624 | 559,471 | |||||||||||
D Hisco3 | 2,000,000 | 2,000,000 | 140,564 | 2,000,000 | ||||||||||||
Details regarding the aggregate of loans made, guaranteed or secured by any entity in the Group to each group of Directors and other KMP, including their related parties, are as follows:
|
| Opening balance 1 October $ |
|
| Closing balance 30 September $ |
|
| Interest paid and payable in the reporting period $ |
| | Number in Group at | | |||||
Directors | ||||||||||||||||
2012 | 22,362,283 | 4,600,000 | 328,243 | 3 | ||||||||||||
2011 | 11,456,164 | 22,362,283 | 1,811,443 | 3 | ||||||||||||
Other key management personnel | ||||||||||||||||
2012 | 11,427,703 | 13,949,773 | 663,374 | 6 | ||||||||||||
2011 | 12,174,439 | 10,698,485 | 837,660 | 4 | ||||||||||||
| 1 | The closing balance represents the balance on cessation as a KMP on 16 December 2011. |
| 2 | The opening balance represents the balance on appointment as a KMP on 17 December 2011. |
| 3 | The opening balance represents the balance on appointment as a KMP on 13 October 2010. |
| 4 | Number in the Group includes directors and other KMP with loan balances greater than $100,000 at any time during the year. |
184

46: Key Management Personnel Disclosures(continued)
SECTION C: KEY MANAGEMENT PERSONNEL EQUITY INSTRUMENT HOLDINGS
i) Options, deferred share rights and performance rights
Details of options, deferred share rights and performance rights held directly, indirectly or beneficially by each KMP, including their related parties, are provided below:
| Name | Type of options/rights | Opening balance at 1 October | Granted during the year as remuneration1 | Exercised the year | Resulting from any other change during the year | Closing balance at 30 September2 | Vested and exercisable at 30 September3 | |||||||||||||||||||
Executive Director 2012 | ||||||||||||||||||||||||||
M Smith | Special options | 700,000 | – | (700,000 | ) | – | – | – | ||||||||||||||||||
| LTI performance rights | 773,546 | 326,424 | (259,740 | ) | – | 840,230 | – | |||||||||||||||||||
Executive Director 2011 | ||||||||||||||||||||||||||
M Smith | Special options | 700,000 | – | – | – | 700,000 | – | |||||||||||||||||||
| LTI performance rights | 779,002 | 253,164 | (258,620 | ) | – | 773,546 | – | |||||||||||||||||||
Other Key Management Personnel 2012 | ||||||||||||||||||||||||||
P Chronican | LTI performance rights | 112,073 | 71,982 | – | – | 184,055 | – | |||||||||||||||||||
S Elliott | STI deferred options | 149,090 | – | – | – | 149,090 | 79,852 | |||||||||||||||||||
| LTI performance rights | 87,070 | 71,982 | – | – | 159,052 | – | ||||||||||||||||||||
D Hisco | Hurdled options | 10,530 | – | (10,003 | ) | (527 | ) | – | – | |||||||||||||||||
| LTI performance rights | 66,311 | 55,370 | – | – | 121,681 | – | ||||||||||||||||||||
| STI deferred share rights | 17,383 | 39,390 | (8,480 | ) | – | 48,293 | – | |||||||||||||||||||
G Hodges | Hurdled options | 8,400 | – | (5,400 | ) | (3,000 | ) | – | – | |||||||||||||||||
| LTI performance rights | 132,940 | 55,370 | (50,050 | ) | – | 138,260 | – | |||||||||||||||||||
| STI deferred share rights | 5,663 | – | – | – | 5,663 | 5,663 | ||||||||||||||||||||
J Phillips4 | LTI performance rights | 129,971 | – | – | – | 129,971 | – | |||||||||||||||||||
A Thursby | STI deferred options | 164,509 | – | – | – | 164,509 | 164,509 | |||||||||||||||||||
| LTI performance rights | 146,234 | 77,519 | (55,055 | ) | – | 168,698 | – | |||||||||||||||||||
P Marriott5 | Hurdled options | 67,600 | – | (64,220 | ) | (3,380 | ) | – | – | |||||||||||||||||
| STI deferred options | 48,385 | – | (48,385 | ) | – | – | – | |||||||||||||||||||
| LTI performance rights | 132,940 | 55,370 | (50,050 | ) | (41,265 | ) | 96,995 | 38,310 | ||||||||||||||||||
C Page6 | LTI performance rights | 72,959 | – | (38,038 | ) | (10,671 | ) | 24,250 | 24,250 | |||||||||||||||||
Other Key Management Personnel 2011 | ||||||||||||||||||||||||||
P Chronican | LTI performance rights | 57,726 | 54,347 | – | – | 112,073 | – | |||||||||||||||||||
S Elliott | STI deferred options | 10,614 | 138,476 | – | – | 149,090 | 5,307 | |||||||||||||||||||
| LTI performance rights | 41,084 | 45,986 | – | – | 87,070 | – | ||||||||||||||||||||
D Hisco7 | Hurdled options | 32,506 | – | (21,976 | ) | – | 10,530 | 10,003 | ||||||||||||||||||
| LTI performance rights | 74,631 | 33,444 | (41,764 | ) | – | 66,311 | – | |||||||||||||||||||
| STI deferred share rights | – | 17,383 | – | – | 17,383 | – | ||||||||||||||||||||
G Hodges | Hurdled options | 52,191 | – | (43,791 | ) | – | 8,400 | 5,400 | ||||||||||||||||||
| STI deferred options | 33,869 | – | (33,869 | ) | – | – | – | |||||||||||||||||||
| LTI performance rights | 149,004 | 41,806 | (57,870 | ) | – | 132,940 | – | |||||||||||||||||||
| STI deferred share rights | 5,663 | – | – | – | 5,663 | 5,663 | ||||||||||||||||||||
A Thursby | STI deferred options | 164,509 | – | – | – | 164,509 | 164,509 | |||||||||||||||||||
| LTI performance rights | 146,544 | 45,986 | (46,296 | ) | – | 146,234 | – | |||||||||||||||||||
P Marriott | Hurdled options | 136,863 | – | (69,263 | ) | – | 67,600 | 64,220 | ||||||||||||||||||
| STI deferred options | 48,385 | – | – | – | 48,385 | 48,385 | ||||||||||||||||||||
| LTI performance rights | 149,004 | 41,806 | (57,870 | ) | – | 132,940 | – | |||||||||||||||||||
C Page | LTI performance rights | 72,959 | – | – | – | 72,959 | – | |||||||||||||||||||
| 1 | Details of options/rights granted as remuneration during 2012 are provided in Tables 4 and 5 of the 2012 Remuneration Report. Details of options/rights granted as remuneration during 2011 are provided in Table 11 of the 2011 Remuneration Report. |
| 2 | There was no change in the balance as at report sign-off date except for A Thursby whose STI deferred options balance at report sign-off date was 82,254. |
| 3 | No options/rights were vested and unexerciseable as at 30 September 2012, or at cessation date for those who ceased being a KMP in 2012 (2011: nil). |
| 4 | Opening balance is based on holdings at the date of appointment as a KMP on 1 March 2012. |
| 5 | Closing balance is based on holdings at the date of cessation as a KMP on 31 August 2012. |
| 6 | Closing balance is based on holdings at the date of cessation as a KMP on 16 December 2011. |
| 7 | Opening balance is based on holdings at the date of appointment as a KMP on 13 October 2010. |
NOTES TO THE FINANCIAL STATEMENTS 185

46: Key Management Personnel Disclosures(continued)
ii) Shares
Details of shares held directly, indirectly or beneficially by each KMP, including their related parties, are provided below:
| Name | Type | Opening balance at 1 October | Shares granted during the year as remuneration1 | Received during the year on exercise of options or rights | Resulting from any other change during the year2 | Closing balance at 30 September3,4 | ||||||||||||||||
Non-Executive Directors 2012 | ||||||||||||||||||||||
J Morschel | Directors’ Share Plan | 7,860 | – | – | – | 7,860 | ||||||||||||||||
| Ordinary shares | 11,042 | – | – | 4,700 | 15,742 | |||||||||||||||||
| CPS2 | – | – | – | 1,000 | 1,000 | |||||||||||||||||
G Clark | Directors’ Share Plan | 5,479 | – | – | – | 5,479 | ||||||||||||||||
| Ordinary shares | 10,000 | – | – | – | 10,000 | |||||||||||||||||
P Dwyer5 | Ordinary shares | – | – | – | 4,000 | 4,000 | ||||||||||||||||
P Hay6 | Directors’ Share Plan | 2,990 | – | – | 219 | 3,209 | ||||||||||||||||
| Ordinary shares | 8,653 | – | – | 637 | 9,290 | |||||||||||||||||
H Lee | Directors’ Share Plan | 1,759 | – | – | 129 | 1,888 | ||||||||||||||||
| Ordinary shares | 8,000 | – | – | – | 8,000 | |||||||||||||||||
I Macfarlane | Ordinary shares | 17,616 | – | – | – | 17,616 | ||||||||||||||||
| CPS2 | 500 | – | – | – | 500 | |||||||||||||||||
| CPS3 | 1,000 | – | – | – | 1,000 | |||||||||||||||||
D Meiklejohn | Ordinary shares | 16,198 | – | – | – | 16,198 | ||||||||||||||||
A Watkins | Directors’ Share Plan | 3,419 | – | – | (3,419) | – | ||||||||||||||||
| Ordinary shares | 16,042 | – | – | 3,419 | 19,461 | |||||||||||||||||
Non-Executive Directors 2011 | ||||||||||||||||||||||
J Morschel | Directors’ Share Plan | 7,860 | – | – | – | 7,860 | ||||||||||||||||
| Ordinary shares | 8,042 | – | – | 3,000 | 11,042 | |||||||||||||||||
G Clark | Directors’ Share Plan | 5,479 | – | – | – | 5,479 | ||||||||||||||||
| Ordinary shares | 10,000 | – | – | – | 10,000 | |||||||||||||||||
P Hay6 | Directors’ Share Plan | 2,812 | – | – | 178 | 2,990 | ||||||||||||||||
| Ordinary shares | 6,231 | – | – | 2,422 | 8,653 | |||||||||||||||||
H Lee | Directors’ Share Plan | 1,654 | – | – | 105 | 1,759 | ||||||||||||||||
| Ordinary shares | 8,000 | – | – | – | 8,000 | |||||||||||||||||
I Macfarlane | Directors’ Share Plan | 2,574 | – | – | (2,574) | – | ||||||||||||||||
| Ordinary shares | 11,042 | – | – | 6,574 | 17,616 | |||||||||||||||||
| CPS2 | 500 | – | – | – | 500 | |||||||||||||||||
| CPS3 | – | – | – | 1,000 | 1,000 | |||||||||||||||||
D Meiklejohn | Ordinary shares | 16,198 | – | – | – | 16,198 | ||||||||||||||||
A Watkins | Directors’ Share Plan | 3,419 | – | – | – | 3,419 | ||||||||||||||||
| Ordinary shares | 16,042 | – | – | – | 16,042 | |||||||||||||||||
Executive Director 2012 | ||||||||||||||||||||||
M Smith | Deferred shares | 150,600 | 73,459 | – | (94,279) | 129,780 | ||||||||||||||||
| Ordinary shares | 679,698 | – | �� | 959,740 | (596,848) | 1,042,590 | ||||||||||||||||
Executive Director 2011 | ||||||||||||||||||||||
M Smith | Deferred shares | 204,362 | 94,896 | – | (148,658) | 150,600 | ||||||||||||||||
| Ordinary shares | 265,014 | – | 258,620 | 156,064 | 679,698 | |||||||||||||||||
| 1 | Details of shares granted as remuneration during 2012 are provided in Tables 4 and 5 of the 2012 Remuneration Report. Details of shares granted as remuneration during 2011 are provided in Table 11 of the 2011 Remuneration Report. |
| 2 | Shares resulting from any other change during the year include the net result of any shares purchased, sold or acquired under the Dividend Reinvestment Plan. |
| 3 | The following shares (included in the holdings above) were held on behalf of the KMP (i.e. indirect beneficially held shares) as at 30 September 2012 (and for former KMPs as at cessation date): J Morschel – 17,560 (2011: 11,860); G Clark – 15,479 (2011: 15,479); P Dwyer – 4,000; P Hay – 12,204 (2011: 11,369); H Lee – 1,888 (2011: 1,759); I Macfarlane – 19,116 (2011: 19,116); D Meiklejohn – 13,698 (2011: 13,698); A Watkins – 19,461 (2011: 18,419); M Smith – 129,780 (2011: 150,600). |
| 4 | There was no change in the balance as at report sign-off date except for P Hay whose ordinary shares balance at report sign-off date was 11,290. |
| 5 | Opening balance is based on holdings at the date of appointment as a KMP on 1 April 2012. |
| 6 | Shareholdings for P Hay excludes 19,855 shares (2011: 19,855) which are held indirectly where P Hay has no beneficial interest. |
186

46: Key Management Personnel Disclosures(continued)
ii) Shares (continued)
| Name | Type | Opening balance at 1 October | Shares granted during the year as remuneration1 | Received during the year on exercise of options or rights | Resulting from any other change during the year2 | Closing balance at 30 September3,4 | ||||||||||||||||
Other Key Management Personnel 2012 | ||||||||||||||||||||||
P Chronican | Deferred shares | 26,051 | 33,175 | – | (9,485) | 49,741 | ||||||||||||||||
| Ordinary shares | 6,000 | – | – | 19,399 | 25,399 | |||||||||||||||||
| CPS2 | 1,499 | – | – | – | 1,499 | |||||||||||||||||
S Elliott | Deferred shares | 44,177 | 19,146 | – | (31,043) | 32,280 | ||||||||||||||||
| Ordinary shares | – | – | – | 1,116 | 1,116 | |||||||||||||||||
D Hisco | Deferred shares | 47,364 | – | – | (12,777) | 34,587 | ||||||||||||||||
| Ordinary shares | 9,023 | – | 18,483 | (17,506) | 10,000 | |||||||||||||||||
G Hodges | Deferred shares | 120,181 | 23,696 | – | 4,394 | 148,271 | ||||||||||||||||
| Ordinary shares | 109,735 | – | 55,450 | (75,400) | 89,785 | |||||||||||||||||
J Phillips5 | Deferred shares | 70,471 | – | – | 1,290 | 71,761 | ||||||||||||||||
A Thursby | Deferred shares | 278,230 | 33,175 | – | (104,503) | 206,902 | ||||||||||||||||
| Ordinary shares | – | – | 55,055 | (55,055) | – | |||||||||||||||||
N Williams6 | Deferred shares | 113,307 | – | – | 1,504 | 114,811 | ||||||||||||||||
P Marriott7 | Deferred shares | 156,072 | 29,383 | – | (28,634) | 156,821 | ||||||||||||||||
| Ordinary shares | 480,052 | – | 162,655 | (253,529) | 389,178 | |||||||||||||||||
| CPS3 | 5,000 | – | – | – | 5,000 | |||||||||||||||||
C Page8 | Deferred shares | 59,075 | 30,805 | – | (25,235) | 64,645 | ||||||||||||||||
| Ordinary shares | 12,129 | – | 38,038 | (24,028) | 26,139 | |||||||||||||||||
| CPS3 | 2,500 | – | – | – | 2,500 | |||||||||||||||||
Other Key Management Personnel 2011 | ||||||||||||||||||||||
P Chronican | Deferred shares | – | 25,305 | – | 746 | 26,051 | ||||||||||||||||
| Ordinary shares | 3,000 | – | – | 3,000 | 6,000 | |||||||||||||||||
| CPS2 | 1,499 | – | – | – | 1,499 | |||||||||||||||||
S Elliott | Deferred shares | 18,069 | 24,251 | – | 1,857 | 44,177 | ||||||||||||||||
D Hisco9 | Deferred shares | 46,605 | – | – | 759 | 47,364 | ||||||||||||||||
| Ordinary shares | 6,042 | – | 63,740 | (60,759) | 9,023 | |||||||||||||||||
G Hodges | Deferred shares | 98,838 | 19,822 | – | 1,521 | 120,181 | ||||||||||||||||
| Ordinary shares | 148,042 | – | 135,530 | (173,837) | 109,735 | |||||||||||||||||
P Marriott | Deferred shares | 134,218 | 19,822 | – | 2,032 | 156,072 | ||||||||||||||||
| Ordinary shares | 419,596 | – | 127,133 | (66,677) | 480,052 | |||||||||||||||||
| CPS3 | – | – | – | 5,000 | 5,000 | |||||||||||||||||
C Page | Deferred shares | 31,449 | 41,542 | – | (13,916) | 59,075 | ||||||||||||||||
| Ordinary shares | – | – | – | 12,129 | 12,129 | |||||||||||||||||
| CPS3 | – | – | – | 2,500 | 2,500 | |||||||||||||||||
A Thursby | Deferred shares | 223,103 | 48,502 | 46,296 | (39,671) | 278,230 | ||||||||||||||||
| 1 | Details of shares granted as remuneration during 2012 are provided in Tables 4 and 5 of the 2012 Remuneration Report. Details of shares granted as remuneration during 2011 are provided in Table 11 of the 2011 Remuneration Report. |
| 2 | Shares resulting from any other change during the year include the net result of any shares purchased, sold or acquired under the Dividend Reinvestment Plan. |
| 3 | The following shares (included in the holdings above) were held on behalf of the KMP (i.e. indirect beneficially held shares) as at 30 September 2012 (and for former KMPs as at cessation date): P Chronican – 49,741 (2011: 26,051); S Elliott – 32,280 (2011: 44,177); D Hisco – 39,587 (2011: 52,364); G Hodges – 191,006 (2011: 162,916); J Phillips – 71,761; A Thursby – 206,902 (2011: 278,230); N Williams – 114,811; P Marriott – 156,821 (2011: 156,072); C Page – 64,645 (2011: 59,075). |
| 4 | There was no change in the balance as at report sign-off date except for A Thursby whose deferred shares balance at report sign-off date was 163,292 and whose ordinary shares balance at report sign-off date was 125,865. |
| 5 | Opening balance is based on holdings at the date of appointment as a KMP on 1 March 2012. |
| 6 | Opening balance is based on holdings at the date of appointment as a KMP on 17 December 2011. |
| 7 | Closing balance is based on holdings at 31 August 2012. |
| 8 | Closing balance is based on holdings as at the date of cessation as a KMP on 16 December 2011. Due to cessation, 11,452 LTI deferred shares granted to C Page on 12 November 2010 were forfeited and processed by Computershare on 20 December 2011. |
| 9 | Opening balance is based on holdings at the date of appointment as a KMP on 13 October 2010. |
NOTES TO THE FINANCIAL STATEMENTS 187

47: Transactions with Other Related Parties
Associates
During the course of the financial year the Company and Group conducted transactions with associates on terms equivalent to those on an arm’s length basis as shown below:
| Consolidated | The Company | |||||||||||||||
2012 $000 | 2011 $000 | 2012 $000 | 2011 $000 | |||||||||||||
Amounts receivable from associates1 | 11,780 | 56,686 | 7,819 | 25,891 | ||||||||||||
Amounts payable to associates | 70,918 | 70,199 | 3,105 | 3,433 | ||||||||||||
Interest revenue | 331 | 4,428 | – | – | ||||||||||||
Interest expense | 1,844 | 1,864 | – | – | ||||||||||||
Dividend revenue1 | 74,804 | 80,435 | 20,110 | 28,471 | ||||||||||||
Cost recovered from associates | 1,930 | 1,921 | 328 | 255 | ||||||||||||
| 1 | In the prior year the Company amounts included entities only related at a consolidated level. The 2011 comparative has been restated to exclude these entities. |
There have been no guarantees given or received. No outstanding amounts have been written down or recorded as allowances, as they are considered fully collectible.
48: Life Insurance Business
The Group conducts its life insurance business through OnePath Life Limited, OnePath Life (NZ) Limited and OnePath Insurance Services (NZ) Limited. This note is intended to provide disclosures in relation to the life businesses conducted through these controlled entities.
SOLVENCY POSITION OF LIFE INSURER
Australian life insurers are required to hold reserves in excess of policy liabilities to meet certain solvency requirements under the Life Act.
Subsidiaries
During the course of the financial year subsidiaries conducted transactions with each other and associates on terms equivalent to those on an arm’s length basis. As of 30 September 2012, all outstanding amounts are considered fully collectible.
The life insurance business in New Zealand is not governed by the Life Act as these are foreign domiciled life insurance companies. These companies are however required to meet similar solvency tests.
The summarised solvency information below in respect of solvency requirements under the Life Act has been extracted from the financial statements prepared by OnePath Life Limited. For detailed solvency information on a statutory fund basis, users of this annual financial report should refer to the separate financial statements prepared by OnePath Life Limited.
| OnePath Life Limited | ||||||||
2012 $m | 2011 $m | |||||||
Solvency requirements as at 30 September represented by: | 32,132 | 29,946 | ||||||
– minimum termination value | 31,105 | 28,735 | ||||||
– other liabilities | 688 | 855 | ||||||
– solvency reserve | 339 | 356 | ||||||
Assets available for solvency reserves | 652 | 619 | ||||||
Coverage of solvency reserves (times) | 1.92 | 1.74 | ||||||
LIFE INSURANCE BUSINESS PROFIT ANALYSIS
| Life insurance contracts | Life investment contracts | Consolidated | ||||||||||||||||||||||
2012 $m | 2011 $m | 2012 $m | 2011 $m | 2012 $m | 2011 $m | |||||||||||||||||||
Net shareholder profit after income tax | 259 | 251 | 115 | 126 | 374 | 377 | ||||||||||||||||||
Net shareholder profit after income tax is represented by: | ||||||||||||||||||||||||
Emergence of planned profit margins | 178 | 173 | 77 | 136 | 255 | 309 | ||||||||||||||||||
Difference between actual and assumed experience | (29 | ) | – | 30 | (15 | ) | 1 | (15 | ) | |||||||||||||||
(Loss recognition)/reversal of previous losses on groups of related products | 1 | (10 | ) | – | – | 1 | (10 | ) | ||||||||||||||||
Investment earnings on retained profits and capital | 88 | 83 | 8 | 5 | 96 | 88 | ||||||||||||||||||
Changes in assumptions
| 21 | 5 | – | – | 21 | 5 | ||||||||||||||||||
Net policyholder profit in statutory funds after income tax | 18 | 12 | – | – | 18 | 12 | ||||||||||||||||||
Net policyholder profit in statutory funds after income tax is represented by: | ||||||||||||||||||||||||
Emergence of planned profits | 10 | 11 | – | – | 10 | 11 | ||||||||||||||||||
Investment earnings on retained profits | 8 | 1 | – | – | 8 | 1 | ||||||||||||||||||
188

48: Life Insurance Business(continued)
INVESTMENTS RELATING TO INSURANCE BUSINESS
| Consolidated | ||||||||
2012 $m | 2011 $m | |||||||
Equity securities | 9,383 | 9,980 | ||||||
Debt securities | 9,226 | 9,040 | ||||||
Investments in managed investment schemes | 9,195 | 8,913 | ||||||
Derivative financial assets | 28 | 27 | ||||||
Other investments | 2,063 | 1,899 | ||||||
Total investments backing policy liabilities designated at fair value through profit or loss1 | 29,895 | 29,859 | ||||||
| 1 | This includes $3,949 million (2011: $5,033 million) in respect of investments relating to external unitholders. In addition, the investment balance has been reduced by $4,203 million (2011: $3,106 million) in respect of the elimination of intercompany balances, Treasury Shares and the re-allocation of policyholder tax balances. |
Investments held in statutory funds can only be used to meet the liabilities and expenses of that fund, or to make profit distributions when solvency and capital adequacy requirements of the Life Act are met. Accordingly, with the exception of permitted profit distributions, the investments held in the statutory funds are not available for use by other parties of the Group.
INSURANCE POLICY LIABILITIES
a) Policy liabilities
| Consolidated | ||||||||
2012 $m | 2011 $m | |||||||
Life insurance contract liabilities | ||||||||
Best estimate liability | ||||||||
Value of future policy benefits | 6,651 | 6,059 | ||||||
Value of future expenses | 1,891 | 1,736 | ||||||
Value of future premium | (10,021 | ) | (8,882 | ) | ||||
Value of declared bonuses | 15 | 11 | ||||||
Value of future profits | ||||||||
Policyholder bonus | 21 | 34 | ||||||
Shareholder profit margin | 1,663 | 1,454 | ||||||
Business valued by non-projection method | 3 | 3 | ||||||
Total net life insurance contract liabilities | 223 | 415 | ||||||
Unvested policyholder benefits | 42 | 42 | ||||||
Liabilities ceded under reinsurance contracts1 (refer note 20) | 509 | 427 | ||||||
Total life insurance contract liabilities | 774 | 884 | ||||||
Life investment contract liabilities2,3 | 28,763 | 26,619 | ||||||
Total policy liabilities | 29,537 | 27,503 | ||||||
| 1 | Liabilities ceded under insurance contracts are shown as ‘other assets’. |
| 2 | Designated at fair value through profit or loss. |
| 3 | Life investment contract liabilities that relate to the capital guaranteed element is $1,803 million (2011: $1,946 million). Life investment contract liabilities subject to investment performance guarantees is $1,108 million (2011: $1,107 million). |
b) Reconciliation of movements in policy liabilities
| Life investment contracts | Life insurance contracts | Consolidated | ||||||||||||||||||||||
2012 $m | 2011 $m | 2012 $m | 2011 $m | 2012 $m | 2011 $m | |||||||||||||||||||
Policy liabilities | ||||||||||||||||||||||||
Gross liability brought forward | 26,619 | 28,002 | 884 | 979 | 27,503 | 28,981 | ||||||||||||||||||
Movements in policy liabilities reflected in the income statement | 2,559 | (759 | ) | (110 | ) | (95 | ) | 2,449 | (854 | ) | ||||||||||||||
Deposit premium recognised as a change in life investment contract liability | 3,920 | 3,834 | – | – | 3,920 | 3,834 | ||||||||||||||||||
Fees recognised as a change in life investment contract liabilities | (435 | ) | (471 | ) | – | – | (435 | ) | (471 | ) | ||||||||||||||
Withdrawal recognised as a change in other life investment contract liability | (3,900 | ) | (3,987 | ) | – | – | (3,900 | ) | (3,987 | ) | ||||||||||||||
Gross policy liability closing balance | 28,763 | 26,619 | 774 | 884 | 29,537 | 27,503 | ||||||||||||||||||
Liabilities ceded under reinsurance1 | ||||||||||||||||||||||||
Balance brought forward | – | – | 427 | 360 | 427 | 360 | ||||||||||||||||||
Increase in reinsurance asset | – | – | 82 | 67 | 82 | 67 | ||||||||||||||||||
Closing balance | – | – | 509 | 427 | 509 | 427 | ||||||||||||||||||
Total policy liability net of reinsurance asset | 28,763 | 26,619 | 265 | 457 | 29,028 | 27,076 | ||||||||||||||||||
| 1 | Liabilities ceded under insurance contracts are shown as ‘other assets’. |
NOTES TO THE FINANCIAL STATEMENTS 189

48: Life Insurance Business(continued)
c) Sensitivity analysis – Life investment contract liability
Market risk arises on the Group’s life insurance business in respect of contracts where an element of the liability to the policyholder is guaranteed by the Group. The value of the guarantee is impacted by changes in underlying asset values and interest rates. As at September 2012, a 10% decline in equity markets would have decreased profit by $20 million (2011: $26 million) and a 10% increase would have increased profit by $3 million (2011: $10 million). A 1% increase in interest rates at 30 September would have decreased profit by $14 million (2011: $16 million) and 1% decrease would have increased profit by $3 million (2011: $10 million).
METHODS AND ASSUMPTIONS LIFE INSURANCE CONTRACTS
Significant actuarial methods
The effective date of the actuarial report on policy liabilities (which includes insurance contract liabilities and life investment contract liabilities) and solvency requirements is 30 September 2012.
In Australia, the actuarial report was prepared by Mr Nick Kulikov, FIAA, Appointed Actuary. The actuarial reports indicate Mr Kulikov is satisfied as to the accuracy of the data upon which policy liabilities have been determined.
The amount of policy liabilities has been determined in accordance with methods and assumptions disclosed in this financial report and the requirements of the Life Act, which includes applicable standards of the APRA.
Policy liabilities have been calculated in accordance with Prudential Standard LPS 1.04 Valuation of Policy Liabilities issued by the APRA in accordance with the requirements of the Life Insurance Act (LIA). For life insurance contracts the Standard requires the policy liabilities to be calculated in a way which allows for the systematic release of planned margins as services are provided to policyholders.
The profit carriers used to achieve the systematic release of planned margins are based on the product groups.
In New Zealand, the actuarial report was prepared by Mr Michael Bartram FIAA FNZSA, who is a fellow of the Institute of Actuaries of Australia and a fellow of the New Zealand Society of Actuaries. The amount of policy liabilities has been determined in accordance with Professional Standard 3: Determination of Life Insurance Policy Liabilities of the New Zealand Society of Actuaries. The actuarial reports indicate that Mr Bartram is satisfied as to the accuracy of the data upon which policy liabilities have been determined.
Critical assumptions
The valuation of the policy liabilities is dependant on a number of variables including interest rate, equity prices, future expenses, mortality, morbidity and inflation. The critical estimates and judgements used in determining the policy liability is set out in note 2 (vi) on page 91.
Sensitivity analysis – life insurance contracts
The Group conducts sensitivity analyses to quantify the exposure of the life insurance contracts to risk of changes in the key underlying variables such as interest rate, equity prices, mortality, morbidity and inflation. The valuations included in the reported results and the Group’s best estimate of future performance is calculated using certain assumptions about these variables. The movement in any key variable will impact the performance and net assets of the Group and as such represents a risk. The table below illustrates how changes in key assumptions would impact the reported profit, policy liabilities and equity at 30 September 2012.
| Variable | Impact of movement in underlying variable | Change in variable | Profit/(loss) net of reinsurance | Insurance contract liabilities net of reinsurance | Equity | |||||||||||||
| % change | $m | $m | $m | |||||||||||||||
Market interest rates | A change in market interest rates affects the value placed on future cash flows. This changes profit and shareholder equity. |
| -1% +1% |
|
| 57 (45 | ) |
| (71 56 | )
|
| 57 (45 | ) | |||||
Expense rate | An increase in the level or inflationary growth of expenses over assumed levels will decrease profit and shareholder equity. |
| -10% +10% |
|
| 1 (1 | ) |
| (1 1 | )
|
| 1 (1 | ) | |||||
Mortality rate | Greater mortality rates would lead to higher levels of claims occurring, increasing associated claims cost and therefore reducing profit and shareholder equity. |
| -10% +10% |
|
| (17 (1 | ) ) |
| 24 1 |
|
| (17 (1 | ) ) | |||||
Morbidity rate | The cost of health-related claims depends on both the incidence of policyholders becoming ill and the duration which they remain ill. Higher than expected incidence and duration would increase claim costs, reducing profit and shareholder equity. |
| -10% +10% |
|
| 2 (11 | ) |
| (2 14 | )
|
| 2 (11 | ) | |||||
190

48: Life Insurance Business(continued)
LIFE INSURANCE RISK
Insurance risk is the risk of loss due to increases in policy benefits arising from variations in the incidence or severity of insured events.
Insurance risk exposure arises in insurance business as the risk that claims payments are greater than expected. In the life insurance business this arises primarily through mortality (death) or morbidity (illness or injury) risks being greater than expected.
Insurance risks are controlled through the use of underwriting procedures and reinsurance arrangements. Controls are also maintained over claims management practices to assist in the correct and timely payment of insurance claims. Regular monitoring of experience is conducted at a sufficiently detailed level in order to identify any deviation from expected claim levels.
Financial risks relating to the Group’s insurance business are generally monitored and controlled by selecting appropriate assets to back insurance and life investment contract liabilities. Wherever possible within regulatory constraints, the Group segregates policyholders funds from shareholders funds and sets investment mandates that are appropriate for each. The assets are regularly monitored by the Global Wealth and Private Bank Investment Risk Management Committee to ensure that there are no material asset and liability mismatching issues and other risks such as liquidity risk and credit risk are maintained within acceptable limits.
All financial assets within the life insurance statutory funds directly support either the Group’s life insurance or life investment contracts. Market risk arises for the Group on contracts where the liabilities to policyholders are guaranteed by the life company. The Group manages this risk by the monthly monitoring and rebalancing of assets to policy liabilities. However, for some contracts the ability to match asset characteristics with policy obligations is constrained by a number of factors including regulatory constraints, the lack of suitable investments as well as by the nature of the policy liabilities themselves.
A market risk also arises from those life investment contracts where the benefits paid are directly impacted by the value of the underlying assets. The Group is exposed to the risk of future decreased asset management fees as a result of a decline in assets under management and operational risk associated with the possible failure to administer life investment contracts in accordance with the product terms and conditions.
Risk strategy
In compliance with contractual and regulatory requirements, a strategy is in place to monitor that the risks underwritten satisfy policyholders’ risk and reward objectives whilst not adversely affecting the Group’s ability to pay benefits and claims when due. The strategy involves the identification of risks by type, impact and likelihood, the implementation of processes and controls to mitigate the risks, and continuous monitoring and improvement of the procedures in place to minimise the chance of an adverse compliance or operational risk event occurring. Included in this strategy are the processes and controls over underwriting, claims management and product pricing. Capital management is also a key aspect of the Group’s risk management strategy.
Allocation of capital
The Group’s insurance businesses are subject to regulatory capital requirements which prescribe the amount of capital to be held depending on the contract liability.
Solvency margin requirements established by APRA are in place to reinforce safeguards for policyholders’ interest, which are primarily the ability to meet future claims payments in respect of existing policies.
Methods to limit or transfer insurance risk exposures
Reinsurance – Reinsurance treaties are analysed using a number of analytical modeling tools to assess the impact on the Group’s exposure to risk with the objective of achieving the desired choice of type of reinsurance and retention levels.
Underwriting procedures – Strategic underwriting decisions are put into effect using the underwriting procedures detailed in the Group’s underwriting manual. Such procedures include limits to delegated authorities and signing powers.
Claims management – Strict claims management procedures are in place to assist in the timely and correct payment of claims in accordance with policy conditions.
NOTES TO THE FINANCIAL STATEMENTS 191

49: Exchange Rates
The exchange rates used in the translation of the results and the assets and liabilities of major overseas branches and controlled entities are:
| 2012 | 2011 | |||||||||||||||
| Closing | Average | Closing | Average | |||||||||||||
Chinese Yuan | 6.5848 | 6.5150 | 6.2149 | 6.7036 | ||||||||||||
Euro | 0.8092 | 0.7914 | 0.7194 | 0.7353 | ||||||||||||
Great British Pound | 0.6437 | 0.6522 | 0.6243 | 0.6386 | ||||||||||||
Indian Rupee | 55.1714 | 53.9494 | 47.5992 | 46.2575 | ||||||||||||
Indonesian Rupiah | 10,022.6 | 9,476.4 | 8,573.0 | 8,985.7 | ||||||||||||
Malaysian Ringgit | 3.2077 | 3.1998 | 3.1052 | 3.1270 | ||||||||||||
New Zealand Dollar | 1.2529 | 1.2883 | 1.2727 | 1.3051 | ||||||||||||
Papua New Guinea Kina | 2.1773 | 2.1657 | 2.1794 | 2.5413 | ||||||||||||
United States Dollar | 1.0462 | 1.0278 | 0.9731 | 1.0251 | ||||||||||||
50: Events Since the End of the Financial Year
There have been no material events since the end of the financial year.
192

Directors’ Declaration
The Directors of Australia and New Zealand Banking Group Limited declare that:
| a) | in the Directors’ opinion, the financial statements and notes of the Company and the consolidated entity are in accordance with the Corporations Act 2001, including that they: |
| i) | comply with applicable Australian Accounting Standards (including the Australian Accounting Interpretations) and the Corporations Regulations 2001; and |
| ii) | give a true and fair view of the financial position of the Company and of the consolidated entity as at 30 September 2012 and of their performance for the year ended on that date; and |
| b) | the notes of the Company and the consolidated entity include a statement that the financial statements and notes of the Company and the consolidated entity comply with International Financial Reporting Standards; and |
| c) | the Directors have been given the declarations required by section 295A of the Corporations Act 2001; and |
| d) | in the Directors’ opinion, there are reasonable grounds to believe that the Company will be able to pay its debts as and when they become due and payable; and |
| e) | the Company and certain of its wholly owned controlled entities (listed in note 43) have executed a Deed of Cross Guarantee enabling them to take advantage of the accounting and audit relief offered by class order 98/1418 (as amended), issued by the Australian Securities and Investments Commission. The nature of the Deed of Cross Guarantee is to guarantee to each creditor payment in full of any debt in accordance with the terms of the Deed of Cross Guarantee. At the date of this declaration, there are reasonable grounds to believe that the Company and its controlled entities which executed the Deed of Cross Guarantee are able, as an economic entity, to meet any obligations or liabilities to which they are, or may become, subject by virtue of the Deed of Cross Guarantee. |
Signed in accordance with a resolution of the Directors.
 |  | |
| John Morschel | Michael R P Smith | |
| Chairman | Director | |
| 5 November 2012 | ||
Responsibility statement of the Directors in accordance with the Disclosure and Transparency Rule 4.1.12 (3)(b) of the United Kingdom Financial Services Authority
The Directors of Australia and New Zealand Banking Group Limited confirm to the best of their knowledge that:
The Group’s Annual Report includes:
| i) | a fair review of the development and performance of the business and the position of the Group and the undertakings included in the consolidation taken as a whole; together with |
| ii) | a description of the principal risks and uncertainties faced by the Group. |
Signed in accordance with a resolution of the Directors.
 |  | |
| John Morschel | Michael R P Smith | |
| Chairman | Director | |
| 5 November 2012 | ||
DIRECTORS’ DECLARATION 193


REPORT ON THE FINANCIAL REPORT
We have audited the accompanying financial report of Australia and New Zealand Banking Group Limited (the Company), which comprises the balance sheets as at 30 September 2012, and income statements, statements of comprehensive income, statements of changes in equity and cash flow statements for the year ended on that date, notes 1 to 50 comprising a summary of significant accounting policies and other explanatory information and the directors’ declaration of the Company and the Group comprising the Company and the entities it controlled at the year’s end or from time to time during the financial year.
DIRECTORS’ RESPONSIBILITY FOR THE FINANCIAL REPORT
The directors of the Company are responsible for the preparation of the financial report that gives a true and fair view in accordance with Australian Accounting Standards and theCorporations Act 2001 and for such internal control as the directors determine is necessary to enable the preparation of the financial report that is free from material misstatement whether due to fraud or error. In note 1(A) (i), the directors also state, in accordance with Australian Accounting Standard AASB 101Presentation of Financial Statements, that the financial statements comply with International Financial Reporting Standards.
AUDITOR’S RESPONSIBILITY
Our responsibility is to express an opinion on the financial report based on our audit. We conducted our audit in accordance with Australian Auditing Standards. These Auditing Standards require that we comply with relevant ethical requirements relating to audit engagements and plan and perform the audit to obtain reasonable assurance whether the financial report is free from material misstatement.
An audit involves performing procedures to obtain audit evidence about the amounts and disclosures in the financial report. The procedures selected depend on the auditor’s judgement, including the assessment of the risks of material misstatement of the financial report, whether due to fraud or error. In making those risk assessments, the auditor considers internal control relevant to the entity’s preparation of the financial report that gives a true and fair view in order to design audit procedures that are appropriate in the circumstances, but not for the purpose of expressing an opinion on the effectiveness of the entity’s internal control. An audit also includes evaluating the appropriateness of accounting policies used and the reasonableness of accounting estimates made by the directors, as well as evaluating the overall presentation of the financial report.
We performed the procedures to assess whether in all material respects the financial report presents fairly, in accordance with theCorporations Act 2001 and Australian Accounting Standards, a true and fair view which is consistent with our understanding of the Company’s and the Group’s financial position and of their performance.
We believe that the audit evidence we have obtained is sufficient and appropriate to provide a basis for our audit opinion.
INDEPENDENCE
In conducting our audit, we have complied with the independence requirements of theCorporations Act 2001.
AUDITOR’S OPINION
In our opinion:
| (a) | the financial report of Australia and New Zealand Banking Group Limited is in accordance with theCorporations Act 2001, including: |
| (i) | giving a true and fair view of the Company’s and the Group’s financial position as at 30 September 2012 and of their performance for the year ended on that date; and |
| (ii) | complying with Australian Accounting Standards and the Corporations Regulations 2001. |
| (b) | the financial report also complies with International Financial Reporting Standards as disclosed in note 1(A)(i). |
REPORT ON THE REMUNERATION REPORT
We have audited the remuneration report included in pages 13 to 35 of the directors’ report for the year ended 30 September 2012. The directors of the Company are responsible for the preparation and presentation of the remuneration report in accordance with Section 300A of theCorporations Act 2001. Our responsibility is to express an opinion on the remuneration report, based on our audit conducted in accordance with Australian Auditing Standards
AUDITOR’S OPINION
In our opinion, the remuneration report of Australia and New Zealand Banking Group Limited for the year ended 30 September 2012, complies with Section 300A of theCorporations Act 2001.
 |  | |
| KPMG | Andrew Yates | |
Melbourne | Partner | |
| 5 November 2012 | ||
KPMG, an Australian partnership and a member firm of the KPMG network of independent member firms affiliated with KPMG International Cooperative (“KPMG International”), a Swiss entity.
Liability limited by a scheme approved under Professional Standards Legislation.
| 194 |


1: Capital Adequacy
| Qualifying capital | 2012 $m | 2011 $m | ||||||||||||
Regulatory capital – qualifying capital | ||||||||||||||
Tier 1 | ||||||||||||||
Shareholders’ equity and minority interests | 41,220 | 37,954 | ||||||||||||
Prudential adjustments to shareholders’ equity | Table 1 | (3,857 | ) | (3,479 | ) | |||||||||
Fundamental Tier 1 capital | 37,363 | 34,475 | ||||||||||||
Deductions | Table 2 | (10,839 | ) | (10,611 | ) | |||||||||
Common Equity Tier 1 capital | 26,524 | 23,864 | ||||||||||||
Non-innovative Tier 1 capital instruments | 4,390 | 5,111 | ||||||||||||
Innovative Tier 1 capital instruments | 1,587 | 1,641 | ||||||||||||
Tier 1 capital | 32,501 | 30,616 | ||||||||||||
Tier 2 | ||||||||||||||
Upper Tier 2 capital | Table 3 | 1,185 | 1,228 | |||||||||||
Subordinated notes | Table 4 | 5,702 | 5,017 | |||||||||||
Deductions | Table 2 | (2,814 | ) | (3,071 | ) | |||||||||
Tier 2 capital | 4,073 | 3,174 | ||||||||||||
Total qualifying capital | 36,574 | 33,790 | ||||||||||||
Capital adequacy ratios | ||||||||||||||
Core Tier 1 | 8.8% | 8.5% | ||||||||||||
Tier 1 | 10.8% | 10.9% | ||||||||||||
Tier 2 | 1.4% | 1.2% | ||||||||||||
Total | 12.2% | 12.1% | ||||||||||||
Risk weighted assets | Table 5 | 300,119 | 279,964 | |||||||||||
| 196 |

1: Capital Adequacy(continued)
2012 $m | 2011 $m | |||||||||||||||||
Table 1: Prudential adjustments to shareholders’ equity | ||||||||||||||||||
Treasury shares attributable to OnePath policy holders | 280 | 358 | ||||||||||||||||
Reclassification of preference share capital | (871 | ) | (871) | |||||||||||||||
Accumulated retained profits and reserves of insurance, funds management and securitisation entities and associates | (1,660 | ) | (1,686) | |||||||||||||||
Deferred fee revenue including fees deferred as part of loan yields | 415 | 414 | ||||||||||||||||
Hedging reserve | (208 | ) | (169) | |||||||||||||||
Available-for-sale reserve | (94 | ) | (126) | |||||||||||||||
Dividend not provided for | (2,149 | ) | (1,999) | |||||||||||||||
Accrual for Dividend Reinvestment Plans | 430 | 600 | ||||||||||||||||
Total | (3,857 | ) | (3,479) | |||||||||||||||
Table 2: Deductions from Tier 1 capital | ||||||||||||||||||
Unamortised goodwill & other intangibles (excluding OnePath Australia and New Zealand) | (3,052 | ) | (3,027) | |||||||||||||||
Intangible component of investments in OnePath Australia and New Zealand1 | (2,074 | ) | (2,071) | |||||||||||||||
Capitalised software | (1,702 | ) | (1,490) | |||||||||||||||
Capitalised expenses including loan and lease origination fees | (850 | ) | (688) | |||||||||||||||
Applicable deferred tax assets (excluding the component relating to the general reserve for impairment of financial assets) | (301 | ) | (136) | |||||||||||||||
Mark-to-market impact of own credit spread | (44 | ) | (128) | |||||||||||||||
Negative Available-for-sale reserve | (2 | ) | – | |||||||||||||||
Sub-total | (8,025 | ) | (7,540) | |||||||||||||||
Deductions taken 50% from Tier 1 and 50% from Tier 2 | Gross | 50% | 50% | |||||||||||||||
Investment in ANZ insurance subsidiaries | (599 | ) | (300 | ) | (200) | |||||||||||||
Investment in funds management entities | (55 | ) | (27 | ) | (29) | |||||||||||||
Investment in OnePath in Australia and New Zealand | (1,441 | ) | (721 | ) | (906) | |||||||||||||
Investment in other Authorised Deposit Taking Institutions and overseas equivalents | (2,141 | ) | (1,070 | ) | (1,151) | |||||||||||||
Expected losses in excess of eligible provisions2 | (1,083 | ) | (542 | ) | (475) | |||||||||||||
Other deductions | (309 | ) | (154 | ) | (310) | |||||||||||||
Sub-total | (5,628 | ) | (2,814 | ) | (3,071) | |||||||||||||
Total | (10,839 | ) | (10,611) | |||||||||||||||
Table 3: Upper Tier 2 capital | ||||||||||||||||||
Perpetual subordinated notes | 951 | 962 | ||||||||||||||||
General reserve for impairment of financial assets net of attributable deferred tax asset2 | 234 | 266 | ||||||||||||||||
Total | 1,185 | 1,228 | ||||||||||||||||
Table 4: Subordinated notes3 | ||||||||||||||||||
For capital adequacy calculation purposes, subordinated note issues are reduced by 20% of the original amount over the last four years to maturity and are limited to 50% of Tier 1 capital. | ||||||||||||||||||
| 1 | Calculation based on prudential requirements. |
| 2 | Under Basel II, this consists of the surplus general reserve for impairment of financial assets net of tax and/or the provisions attributable to the standardised portfolio. |
| 3 | The fair value adjustment is excluded for prudential purposes as the prudential standard only permits inclusion of cash received and makes no allowance for hedging. |
| SUPPLEMENTARY INFORMATION 197 |

1: Capital Adequacy(continued)
2012 $m | 2011 $m | |||||||||
Table 5: Risk Weighted Assets | ||||||||||
On Balance Sheet | 190,210 | 183,039 | ||||||||
Commitments RWA | 42,807 | 43,041 | ||||||||
Contingents RWA | 9,962 | 9,536 | ||||||||
Derivatives RWA | 11,896 | 13,212 | ||||||||
Total credit risk | 254,875 | 248,828 | ||||||||
Market Risk – Traded | 4,664 | 3,046 | ||||||||
Market Risk – IRRBB | 12,455 | 8,439 | ||||||||
Operational risk | 28,125 | 19,651 | ||||||||
Total Risk Weighted Assets | 300,119 | 279,964 | ||||||||
Table 6: Credit risk weighted assets by Basel asset class | ||||||||||
Subject to Advanced IRB approach | ||||||||||
Corporate | 111,796 | 106,120 | ||||||||
Sovereign | 4,088 | 4,365 | ||||||||
Bank | 11,077 | 9,456 | ||||||||
Residential Mortgage | 42,959 | 41,041 | ||||||||
Qualifying revolving retail (credit cards) | 7,092 | 7,468 | ||||||||
Other retail | 21,277 | 19,240 | ||||||||
Credit risk weighted assets subject to advanced approach | 198,289 | 187,690 | ||||||||
Credit risk specialised lending exposures subject to slotting criteria | 27,628 | 27,757 | ||||||||
Subject to Standardised approach | ||||||||||
Corporate | 18,168 | 22,484 | ||||||||
Residential mortgage | 1,812 | 845 | ||||||||
Qualifying revolving retail (credit cards) | 2,028 | 2,344 | ||||||||
Other retail | 1,165 | 1,650 | ||||||||
Credit risk weighted assets subject to standardised approach | 23,173 | 27,323 | ||||||||
Credit risk weighted assets relating to securitisation exposures | 1,170 | 1,136 | ||||||||
Credit risk weighted assets relating to equity exposures | 1,030 | 1,399 | ||||||||
Other Assets | 3,585 | 3,523 | ||||||||
Total credit risk weighted assets | 254,875 | 248,828 | ||||||||
198

1: Capital Adequacy(continued)
| Collective provision | Regulatory Expected Loss | |||||||||||||||||||||
2012 $m | 2011 $m | 2012 $m | 2011 $m | |||||||||||||||||||
Table 7: Collective provision and regulatory expected loss | ||||||||||||||||||||||
Australia | 1,015 | 1,058 | 2,154 | 1,878 | ||||||||||||||||||
International and Institutional Banking | 1,282 | 1,610 | 1,446 | 1,450 | ||||||||||||||||||
New Zealand | 413 | 454 | 814 | 896 | ||||||||||||||||||
Global Wealth and Private Banking | 11 | 12 | 23 | 21 | ||||||||||||||||||
Group Centre | 41 | 39 | – | – | ||||||||||||||||||
Underlying collective provision and regulatory expected loss | 2,762 | 3,173 | 4,437 | 4,245 | ||||||||||||||||||
Adjustments between statutory and underlying | 3 | 3 | – | 16 | ||||||||||||||||||
Collective provision and regulatory expected loss | 2,765 | 3,176 | 4,437 | 4,261 | ||||||||||||||||||
2012 $m | 2011 $m | |||||||||||||||||||||
Table 8: Expected loss in excess of eligible provisions | ||||||||||||||||||||||
Basel expected loss | ||||||||||||||||||||||
Defaulted | 2,168 | 1,975 | ||||||||||||||||||||
Non-defaulted | 2,269 | 2,286 | ||||||||||||||||||||
| 4,437 | 4,261 | |||||||||||||||||||||
Less: Qualifying collective provision after tax | ||||||||||||||||||||||
Collective provision | (2,765 | ) | (3,176) | |||||||||||||||||||
Non-qualifying collective provision | 334 | 375 | ||||||||||||||||||||
Standardised collective provision | 269 | 340 | ||||||||||||||||||||
Deferred tax asset | 625 | 730 | ||||||||||||||||||||
| (1,537 | ) | (1,731) | ||||||||||||||||||||
Less: Qualifying individual provision after tax | ||||||||||||||||||||||
Individual provision | (1,773 | ) | (1,697) | |||||||||||||||||||
Standardised individual provision | 268 | 477 | ||||||||||||||||||||
Collective provision on advanced defaulted | (312 | ) | (359) | |||||||||||||||||||
| (1,817 | ) | (1,579) | ||||||||||||||||||||
Gross deduction | 1,083 | 951 | ||||||||||||||||||||
50/50 deduction (refer table 2) | 542 | 475 | ||||||||||||||||||||
The measurement of risk weighted assets is based on:
| n | a credit risk-based approach whereby risk weightings are applied to balance sheet assets and to credit converted off-balance sheet exposures, categories of risk weights are assigned based upon the nature of the counterparty and the relative liquidity of the assets concerned; and |
| n | the recognition of risk weighted assets attributable to market risk arising from trading positions. |
The Basel II Accord principles took effect from 1 January 2008. For calculation of minimum capital requirements under Pillar 1 (Capital Requirements) of the Basel II Accord, ANZ has gained accreditation from APRA for use of Advanced Internal Ratings Based (AIRB) methodology for credit risk weighted assets and Advanced Measurement Approach (AMA) for operational risk weighted asset equivalent.
SUPPLEMENTARY INFORMATION 199

2: Average Balance Sheet and Related Interest1
Averages used in the following tables are predominantly daily averages. Interest income figures are presented on a tax-equivalent basis. Impaired loans are included under the interest earning asset category, ‘loans and advances’ Intra-group interest earning assets and interest bearing liabilities are treated as external assets and liabilities for the geographic segments.
| 2012 | 2011 | |||||||||||||||||||||||||||||||||
Average balance $m | Interest $m | Average rate % | Average balance $m | Interest $m | Average rate % | |||||||||||||||||||||||||||||
Interest earning assets | ||||||||||||||||||||||||||||||||||
Due from other financial institutions | ||||||||||||||||||||||||||||||||||
Australia | 3,283 | 125 | 3.8% | 3,284 | 152 | 4.6% | ||||||||||||||||||||||||||||
Asia Pacific, Europe & America | 12,461 | 188 | 1.5% | 11,642 | 127 | 1.1% | ||||||||||||||||||||||||||||
New Zealand | 1,509 | 16 | 1.1% | 1,720 | 16 | 0.9% | ||||||||||||||||||||||||||||
Trading and available-for-sale assets | ||||||||||||||||||||||||||||||||||
Australia | 33,568 | 1,372 | 4.1% | 32,685 | 1,520 | 4.7% | ||||||||||||||||||||||||||||
Asia Pacific, Europe & America | 15,022 | 265 | 1.8% | 11,460 | 192 | 1.7% | ||||||||||||||||||||||||||||
New Zealand | 8,877 | 353 | 4.0% | 7,212 | 336 | 4.7% | ||||||||||||||||||||||||||||
Net loans and advances | ||||||||||||||||||||||||||||||||||
Australia | 302,063 | 21,400 | 7.1% | 280,821 | 21,533 | 7.7% | ||||||||||||||||||||||||||||
Asia Pacific, Europe & America | 41,905 | 1,766 | 4.2% | 32,832 | 1,426 | 4.3% | ||||||||||||||||||||||||||||
New Zealand | 73,994 | 4,572 | 6.2% | 73,736 | 4,654 | 6.3% | ||||||||||||||||||||||||||||
Other assets | ||||||||||||||||||||||||||||||||||
Australia | 4,216 | 175 | 4.2% | 4,370 | 220 | 5.0% | ||||||||||||||||||||||||||||
Asia Pacific, Europe & America | 24,330 | 174 | 0.7% | 12,305 | 115 | 0.9% | ||||||||||||||||||||||||||||
New Zealand | 2,233 | 132 | 5.9% | 2,235 | 152 | 6.8% | ||||||||||||||||||||||||||||
Intragroup assets | ||||||||||||||||||||||||||||||||||
Australia | 4,318 | 575 | 13.3% | 2,977 | 574 | 19.3% | ||||||||||||||||||||||||||||
Asia Pacific, Europe & America | 7,293 | (24 | ) | -0.3% | 9,073 | 9 | 0.1% | |||||||||||||||||||||||||||
| 535,072 | 31,089 | 486,352 | 31,026 | |||||||||||||||||||||||||||||||
Intragroup elimination | (11,611 | ) | (551 | ) | (12,050 | ) | (583 | ) | ||||||||||||||||||||||||||
| 523,461 | 30,538 | 5.8% | 474,302 | 30,443 | 6.4% | |||||||||||||||||||||||||||||
Non-interest earning assets | ||||||||||||||||||||||||||||||||||
Derivatives | ||||||||||||||||||||||||||||||||||
Australia | 36,492 | 28,632 | ||||||||||||||||||||||||||||||||
Asia Pacific, Europe & America | 4,783 | 4,977 | ||||||||||||||||||||||||||||||||
New Zealand | 9,974 | 8,377 | ||||||||||||||||||||||||||||||||
Premises and equipment | 2,085 | 2,163 | ||||||||||||||||||||||||||||||||
Insurance assets | 29,973 | 32,448 | ||||||||||||||||||||||||||||||||
Other assets | 25,217 | 26,300 | ||||||||||||||||||||||||||||||||
Provisions for credit impairment | ||||||||||||||||||||||||||||||||||
Australia | (3,037 | ) | (3,046 | ) | ||||||||||||||||||||||||||||||
Asia Pacific, Europe & America | (793 | ) | (877 | ) | ||||||||||||||||||||||||||||||
New Zealand | (885 | ) | (973 | ) | ||||||||||||||||||||||||||||||
| 103,809 | 98,001 | |||||||||||||||||||||||||||||||||
Total average assets | 627,270 | 572,303 | ||||||||||||||||||||||||||||||||
| 1 | As set out in note 1 to the financial statements comparative information has been restated to reflect the impact of the current period reporting treatment of derivative related collateral posted/ received and the associated interest income/expense. Previously, collateral received was shown as part of the non-interest earning derivative asset balance and collateral posted as part of the non-interest earning derivative liability balance. In line with the current treatment, comparative information has been restated to reflect collateral received as part of the interest earning “Due from other financial institutions” balance and derivative collateral posted as part of the interest bearing “Due to other financial institutions” balance. |
| Following the restatements set out in note 1 to the financial statements, comparative information in this note has been restated. As a result, the comparative average interest earning assets increased by $6.9 billion (associated interest income increased by $75 million and average interest rate percentage reduced by 10 basis points) and average non-interest earning assets increased by $1.6 billion. The comparative average interest earning liabilities increased by $2.8 billion (associated interest expense increased by $58 million and average interest rate percentage was unchanged) and average non-interest earning liabilities increased by $5.7 billion. |
200

2: Average Balance Sheet and Related Interest(continued)
| 2012 | 2011 | |||||||||||||||||||||||||||||||||
Average balance $m | Interest $m | Average rate % | Average balance $m | Interest $m | Average rate % | |||||||||||||||||||||||||||||
Interest bearing liabilities | ||||||||||||||||||||||||||||||||||
Time deposits | ||||||||||||||||||||||||||||||||||
Australia | 134,508 | 6,821 | 5.1% | 124,080 | 6,862 | 5.5% | ||||||||||||||||||||||||||||
Asia Pacific, Europe & America | 60,643 | 741 | 1.2% | 46,364 | 549 | 1.2% | ||||||||||||||||||||||||||||
New Zealand | 27,981 | 1,130 | 4.0% | 29,310 | 1,305 | 4.5% | ||||||||||||||||||||||||||||
Savings deposits | ||||||||||||||||||||||||||||||||||
Australia | 21,779 | 862 | 4.0% | 20,109 | 821 | 4.1% | ||||||||||||||||||||||||||||
Asia Pacific, Europe & America | 4,280 | 24 | 0.6% | 5,097 | 23 | 0.5% | ||||||||||||||||||||||||||||
New Zealand | 3,757 | 119 | 3.2% | 2,023 | 47 | 2.3% | ||||||||||||||||||||||||||||
Other demand deposits | ||||||||||||||||||||||||||||||||||
Australia | 77,581 | 2,845 | 3.7% | 66,053 | 2,646 | 4.0% | ||||||||||||||||||||||||||||
Asia Pacific, Europe & America | 9,817 | 29 | 0.3% | 6,985 | 28 | 0.4% | ||||||||||||||||||||||||||||
New Zealand | 15,135 | 391 | 2.6% | 13,696 | 379 | 2.8% | ||||||||||||||||||||||||||||
Due to other financial institutions | ||||||||||||||||||||||||||||||||||
Australia | 7,308 | 260 | 3.6% | 9,249 | 420 | 4.5% | ||||||||||||||||||||||||||||
Asia Pacific, Europe & America | 21,624 | 181 | 0.8% | 16,222 | 141 | 0.9% | ||||||||||||||||||||||||||||
New Zealand | 1,851 | 32 | 1.7% | 1,352 | 24 | 1.8% | ||||||||||||||||||||||||||||
Commercial paper | ||||||||||||||||||||||||||||||||||
Australia | 11,676 | 510 | 4.4% | 7,570 | 378 | 5.0% | ||||||||||||||||||||||||||||
New Zealand | 3,669 | 123 | 3.4% | 3,384 | 111 | 3.3% | ||||||||||||||||||||||||||||
Borrowing corporations’ debts | ||||||||||||||||||||||||||||||||||
Australia | 220 | 14 | 6.4% | 519 | 34 | 6.6% | ||||||||||||||||||||||||||||
New Zealand | 1,124 | 55 | 4.9% | 1,190 | 68 | 5.7% | ||||||||||||||||||||||||||||
Loan capital, bonds and notes | ||||||||||||||||||||||||||||||||||
Australia | 63,620 | 3,461 | 5.4% | 67,517 | 4,102 | 6.1% | ||||||||||||||||||||||||||||
Asia Pacific, Europe & America1 | 89 | 2 | 1.8% | 39 | – | 0.7% | ||||||||||||||||||||||||||||
New Zealand | 13,278 | 664 | 5.0% | 15,042 | 725 | 4.8% | ||||||||||||||||||||||||||||
Other liabilities | ||||||||||||||||||||||||||||||||||
Australia | 2,060 | 206 | n/a | 4,260 | 328 | n/a | ||||||||||||||||||||||||||||
Asia Pacific, Europe & America | 1,394 | 53 | n/a | 745 | 29 | n/a | ||||||||||||||||||||||||||||
New Zealand | 200 | (95 | ) | n/a | 141 | (77 | ) | n/a | ||||||||||||||||||||||||||
Intragroup liabilities | ||||||||||||||||||||||||||||||||||
New Zealand | 11,611 | 551 | 4.7% | 12,050 | 583 | 4.8% | ||||||||||||||||||||||||||||
| 495,205 | 18,979 | 452,997 | 19,526 | |||||||||||||||||||||||||||||||
Intragroup elimination | (11,611 | ) | (551 | ) | (12,050 | ) | (583 | ) | ||||||||||||||||||||||||||
| 483,594 | 18,428 | 3.8% | 440,947 | 18,943 | 4.3% | |||||||||||||||||||||||||||||
Non-interest bearing liabilities | ||||||||||||||||||||||||||||||||||
Deposits | ||||||||||||||||||||||||||||||||||
Australia | 5,103 | 4,947 | ||||||||||||||||||||||||||||||||
Asia Pacific, Europe & America | 2,387 | 2,034 | ||||||||||||||||||||||||||||||||
New Zealand | 3,863 | 3,718 | ||||||||||||||||||||||||||||||||
Derivatives | ||||||||||||||||||||||||||||||||||
Australia | 31,329 | 23,437 | ||||||||||||||||||||||||||||||||
Asia Pacific, Europe & America | 5,044 | 4,055 | ||||||||||||||||||||||||||||||||
New Zealand | 9,207 | 7,067 | ||||||||||||||||||||||||||||||||
Insurance liabilities | 28,386 | 29,285 | ||||||||||||||||||||||||||||||||
External unitholder liabilities | 4,779 | 5,476 | ||||||||||||||||||||||||||||||||
Other liabilities | 14,014 | 15,470 | ||||||||||||||||||||||||||||||||
| 104,112 | 95,489 | |||||||||||||||||||||||||||||||||
Total average liabilities | 587,706 | 536,436 | ||||||||||||||||||||||||||||||||
| 1 | Includes foreign exchange swap costs. |
SUPPLEMENTARY INFORMATION 201

2: Average Balance Sheet and Related Interest(continued)
2012 $m | 2011 $m | |||||||
Total average assets | ||||||||
Australia | 425,515 | 398,297 | ||||||
Asia Pacific, Europe & America | 113,341 | 89,107 | ||||||
New Zealand | 100,025 | 96,949 | ||||||
| 638,881 | 584,353 | |||||||
Less intragroup elimination | (11,611 | ) | (12,050) | |||||
| 627,270 | 572,303 | |||||||
% of total average assets attributable to overseas activities | 32.9% | 30.9% | ||||||
Average interest earning assets | ||||||||
Australia | 347,448 | 324,137 | ||||||
Asia Pacific, Europe & America | 101,011 | 77,312 | ||||||
New Zealand | 86,613 | 84,903 | ||||||
| 535,072 | 486,352 | |||||||
Less intragroup elimination | (11,611 | ) | (12,050) | |||||
| 523,461 | 474,302 | |||||||
Total average liabilities | ||||||||
Australia | 398,639 | 374,008 | ||||||
Asia Pacific, Europe & America | 107,562 | 83,733 | ||||||
New Zealand | 93,116 | 90,745 | ||||||
| 599,317 | 548,486 | |||||||
Less intragroup elimination | (11,611 | ) | (12,050) | |||||
| 587,706 | 536,436 | |||||||
% of total average assets attributable to overseas activities | 32.2% | 30.3% | ||||||
Average interest bearing liabilities | ||||||||
Australia | 318,752 | 299,357 | ||||||
Asia Pacific, Europe & America | 97,847 | 75,452 | ||||||
New Zealand | 78,606 | 78,188 | ||||||
| 495,205 | 452,997 | |||||||
Less intragroup elimination | (11,611 | ) | (12,050) | |||||
| 483,594 | 440,947 | |||||||
Total average shareholders’ equity | ||||||||
Ordinary share capital, reserves and retained earnings | 38,693 | 34,996 | ||||||
Preference share capital | 871 | 871 | ||||||
| 39,564 | 35,867 | |||||||
Total average liabilities and shareholders’ equity | 627,270 | 572,303 | ||||||
202

3: Interest Spreads and Net Interest Average Margins1
2012 $m | 2011 $m | |||||||
Net interest income | ||||||||
Australia | 8,668 | 8,410 | ||||||
Asia Pacific, Europe & America | 1,339 | 1,097 | ||||||
New Zealand | 2,103 | 1,993 | ||||||
| 12,110 | 11,500 | |||||||
| % | % | |||||||
Gross earnings rate2 | ||||||||
Australia | 6.81 | 7.40 | ||||||
Asia Pacific, Europe & America | 2.35 | 2.42 | ||||||
New Zealand | 5.86 | 6.07 | ||||||
Total Group | 5.83 | 6.42 | ||||||
Interest spread and net interest average margin may be analysed as follows: | ||||||||
Australia | ||||||||
Net interest spread | 2.10 | 2.19 | ||||||
Interest attributable to net non-interest bearing items | 0.39 | 0.40 | ||||||
Net interest margin – Australia | 2.49 | 2.59 | ||||||
Asia Pacific, Europe & America | ||||||||
Net interest spread | 1.30 | 1.40 | ||||||
Interest attributable to net non-interest bearing items | 0.03 | 0.02 | ||||||
Net interest margin – Asia Pacific, Europe & America | 1.33 | 1.42 | ||||||
New Zealand | ||||||||
Net interest spread | 2.08 | 2.03 | ||||||
Interest attributable to net non-interest bearing items | 0.35 | 0.32 | ||||||
Net interest margin – New Zealand | 2.43 | 2.35 | ||||||
Group | ||||||||
Net interest spread | 2.02 | 2.12 | ||||||
Interest attributable to net non-interest bearing items | 0.29 | 0.30 | ||||||
Net interest margin | 2.31 | 2.42 | ||||||
Net interest margin (excluding Global Markets) | 2.71 | 2.80 | ||||||
| 1 | Comparative information has been restated to reflect the impact of the current period reporting treatment of derivative related collateral posted/received and the associated interest income/ expense. Further information is included in note 1 to the financial statements, with the average balance sheet impact discussed on page 200. |
| 2 | Average interest rate received on average interest earning assets. |
SUPPLEMENTARY INFORMATION 203

4. Explanation of adjustments between statutory profit and underlying profit
GAIN ON SALE OF VISA SHARES
During the year the Group disposed of its equity interest in Visa International which it has held since Visa’s initial IPO in 2008. The gain recognised on the sale has not been recognised in underlying profit as the gain is not reflective of the core business performance.
NEW ZEALAND SIMPLIFICATION PROGRAMME
The New Zealand Simplification programme (which commenced in 2011) will deliver a single core banking system, a single banking brand and an optimised branch network in New Zealand. This programme is expected to result in lower operational and technology costs. Costs of $105 million after tax (2011: $86 million), pre-tax $146 million (2011: $123 million), were incurred in the year. This includes a restructuring provision raised in September 2012 upon the announcement of the brand and branch phase of the programme. Given the size and significance of the changes to the operations in New Zealand, the associated costs have been excluded from underlying profit.
ACQUISITION RELATED ADJUSTMENTS
Acquisition related adjustments arose following the acquisition of OnePath Australia, OnePath New Zealand and selected Royal Bank of Scotland Group PLC businesses in Asia during 2010 and include the following:
| Pre-tax | After tax | |||||||||||||||
2012 |
2011 |
2012 |
2011 $m | |||||||||||||
Available-for-sale reserve write-off recovery1 | (6 | ) | (3 | ) | (4 | ) | (2) | |||||||||
Integration and transaction costs | 17 | 110 | 12 | 89 | ||||||||||||
Amortisation of acquisition related intangibles2 | 44 | 54 | 33 | 39 | ||||||||||||
Total | 55 | 161 | 41 | 126 | ||||||||||||
| 1 | Adjusted to reverse recoveries on available-for-sale assets written down through equity by OnePath Australia before obtaining control |
| 2 | The acquisition of OnePath and RBS resulted in the recognition of intangible assets which previously were not recognised in the underlying business acquired |
These items are not recognised in underlying profit as they are not representative of the Group’s expected ongoing financial performance following integration.
TREASURY SHARES ADJUSTMENT
ANZ shares held by ANZ in the consolidated managed funds and life business are deemed to be Treasury shares. Realised and unrealised gains and losses from these shares and dividends received on these shares are reversed as these are not permitted to be recognised in income for statutory reporting purposes. In deriving underlying profit, these earnings are included to ensure there is no asymmetrical impact on the Group’s profits because the Treasury shares support policyholder liabilities which are revalued in deriving income. Accordingly, an adjustment to statutory profit of $96 million gain after tax (2011: $41 million loss after tax), pre-tax $104 million gain (2011: $48 million loss) has been recognised.
CHANGES IN NEW ZEALAND TAX LEGISLATION
In 2010 legislation was passed to reduce the New Zealand corporate tax rate from 30% to 28% and to remove the ability to claim tax depreciation on buildings with an estimated useful life greater than 50 years, effective for the 2011-2012 income tax year. A residual component relating to the impact on the value of deferred tax was recognised in 2011. There was no impact in the current year.
ECONOMIC HEDGING – FAIR VALUE GAINS/(LOSSES) AND MARK-TO-MARKET ADJUSTMENTS ON REVENUE AND NET INVESTMENT HEDGES
The Group enters into economic hedges to manage its interest rate and foreign exchange risk. The application of AASB 139: Financial Instruments – Recognition and Measurement results in fair value gains/(losses) and mark-to-market adjustments being recognised within the income statement. ANZ includes the mark-to-market adjustments relating to economic hedges as an adjustment to underlying profit as the profit or loss resulting from the transactions will reverse over time to match with the profit or loss from the economically hedged item as part of underlying profit. This includes income/(loss) arising from:
| n | approved classes of derivatives not designated in accounting hedge relationships but which are considered to be economic hedges, including hedges of NZD and USD revenue; |
| n | the use of the fair value option (principally arising from the valuation of the ‘own name’ credit spread on debt issues designated at fair value); and |
| n | ineffectiveness from designated accounting cash flow, fair value and net investment hedges. |
204

4. Explanation of adjustments between statutory profit and underlying profit(continued)
In the table below, funding and lending related swaps are primarily foreign exchange rate swaps which are being used to convert the proceeds of foreign currency debt issuances into floating rate Australian dollar and New Zealand dollar debt (‘funding swaps’). As these swaps do not qualify for hedge accounting, movements in the fair values are recorded in the Income Statement. The main drivers of these fair values are currency basis spreads and the Australian dollar and New Zealand dollar fluctuation against other major funding currencies. This category also includes economic hedges of select structured finance and leasing transactions that do not qualify for hedge accounting. The main drivers of these fair value adjustments are Australian and New Zealand yield curves.
Losses in 2012 from funding and lending related swaps have been strongly impacted by the falling yield curves in both Australia and New Zealand. Additionally, the appreciation of the Australian dollar during 2012 drove losses from the currency components of the Group’s offshore funding hedges.
Losses arising from the use of the fair value option on own name debt hedged by derivatives have been driven by contraction of credit spreads during the year.
The gains from revenue and net investment hedges for 2012 were principally attributable to the appreciation of the AUD against the USD in 2012.
2012 $m | 2011 $m | |||||||
Impact on income statement | ||||||||
Timing differences where IFRS results in asymmetry between the hedge and hedged items | ||||||||
Funding and lending related swaps | (194 | ) | (317) | |||||
Use of the fair value option on own debt hedged by derivatives | (119 | ) | 155 | |||||
Revenue and net investment hedges | 75 | (76) | ||||||
Ineffective portion of cash flow and fair value hedges | (16 | ) | (5) | |||||
Profit/(loss) before tax | (254 | ) | (243) | |||||
Profit/(loss) after tax | (176 | ) | (168) | |||||
| As at | ||||||||
2012 $m |
2011 $m | |||||||
Cumulative pre-tax timing differences relating to economic hedging | ||||||||
Timing differences where IFRS results in asymmetry between the hedge and hedged items (before tax) | ||||||||
Funding and lending related swaps | (756 | ) | (562) | |||||
Use of the fair value option on own debt hedged by derivatives | 64 | 183 | ||||||
Revenue and net investment hedges | 45 | (30) | ||||||
Ineffective portion of cash flow and fair value hedges | 17 | 33 | ||||||
| (630 | ) | (376) | ||||||
CAPITALISED SOFTWARE IMPAIRMENT
Following the identification of impairment triggers, an impairment assessment was performed on intangible assets, including internally generated software assets. A detailed review of the recoverable amount was performed, and where the benefits associated with the asset were substantially reduced from what had originally been anticipated, the assets were written down to their recoverable amount. This resulted in a write-down of $220 million after tax ($273 million pre-tax) during the second half of the year. Given the size and nature of the write-down and the infrequency of such large impairments, the write-down has been excluded from underlying profit.
NZ MANAGED FUNDS IMPACTS
During 2011, the collateralised debt obligations held within the Diversified Yield Fund and the Regular Income Fund were sold and the funds wound up. This resulted in a profit after tax of $39 million ($61 million pre-tax). There was no material impact in the current year.
CREDIT RISK ON IMPAIRED DERIVATIVES (NIL PROFIT AFTER TAX IMPACT)
Reclassification of a charge to income for credit valuation adjustments on defaulted and impaired derivative exposures to provision for credit impairment of $60 million (2011: $17 million reversal). The reclassification has been made to reflect the manner in which the defaulted and impaired derivatives are managed.
POLICYHOLDERS TAX GROSS UP (NIL PROFIT AFTER TAX IMPACT)
For statutory reporting purposes policyholder income tax and other related taxes paid on behalf of policyholders are included in net income from wealth management and the Group’s income tax expense. The gross up of $151 million (2011: $208 million) has been excluded from the underlying results as it does not reflect the underlying performance of the business which is assessed on a net of policyholder tax basis.
SUPPLEMENTARY INFORMATION 205

4. Explanation of adjustments between statutory profit and underlying profit(continued)
NON CONTINUING BUSINESSES
In 2009, Global Institutional reviewed its existing business portfolio in light of its new strategic and business goals to determine the optimal structure for the division. As a result, new business ceased in several product areas, including the Alternative Assets and Private Equity businesses. The Group’s structured credit intermediation trades are also included within non continuing businesses and will result in the profit/ (loss) fluctuating as the credit risk adjustment is impacted by market movements in credit spreads and exchange rates. These have been excluded from underlying earnings in line with how management assesses the performance of the underlying business. A summary of the impact of non continuing businesses including structured credit intermediation trades follows:
| Non continuing businesses | 2012 $m | 2011 $m | ||||||
Net interest income | 1 | (2) | ||||||
Other operating income | 100 | 23 | ||||||
Operating income | 101 | 21 | ||||||
Operating expenses | (14 | ) | (14) | |||||
Profit before credit impairment and income tax | 87 | 7 | ||||||
Provision for credit impairment | (12 | ) | (9) | |||||
Profit before income tax | 75 | (2) | ||||||
Income tax expense | (10 | ) | 3 | |||||
Profit | 65 | 1 | ||||||
STRUCTURED CREDIT INTERMEDIATION TRADES
ANZ entered into a series of structured credit intermediation trades from 2004 to 2007. The underlying structures involve credit default swaps (CDS) over synthetic collateralised debt obligations (CDOs), portfolios of external collateralised loan obligations (CLOs) or specific bonds/floating rate notes (FRNs). ANZ sold protection using credit default swaps over these structures and then to mitigate risk, purchased protection via credit default swaps over the same structures from eight US financial guarantors.
Being derivatives, both the sold protection and purchased protection are marked-to-market. Prior to the commencement of the global credit crisis, movements in valuations of these positions were not significant and largely offset each other in income. Following the onset of the credit crisis, the purchased protection has provided only a partial offset against movements in valuation of the sold protection because:
| n | one of the counterparties to the purchased protection defaulted and many of the remaining counterparties were downgraded; and |
| n | a credit valuation adjustment is applied to the remaining counterparties to the purchased protection reflective of changes to their credit worthiness. |
ANZ is actively monitoring this portfolio with a view to reducing the exposure via termination and restructuring of both the bought and sold protection if and when ANZ deems it cost effective relative to the perceived risk associated with a specific trade or counterparty. Costs were incurred in prior periods managing these positions. The notional amount on the outstanding sold trades was US$8.0 billion at 30 September 2012 (2011: $8.3 billion).
The cumulative costs include realised losses relating to restructuring of trades in order to reduce risks and realised losses on termination of sold protection trades. It also includes foreign exchange hedging losses.
The credit risk expense on structured credit derivatives remains volatile reflecting the impact of market movements in credit spreads and AUD/ USD rates. It is likely there will continue to be volatility in this market value.
The (gain)/loss included in income for these transactions is set out below.
2012 $m | 2011 $m | |||||||
Credit risk on intermediation trades | (73 | ) | (4) | |||||
| As at | ||||||||
2012 $m |
2011 $m | |||||||
Financial impacts on credit intermediation trades | ||||||||
Mark-to-market exposure to financial guarantors | 359 | 803 | ||||||
Cumulative costs relating to financial guarantors | ||||||||
Credit valuation adjustment for outstanding transactions | 116 | 197 | ||||||
Realised close out and hedge costs | 322 | 314 | ||||||
Cumulative life to date charges | 438 | 511 | ||||||
206

Ordinary Shares
At 12 October 2012, the twenty largest holders of ordinary shares held 1,621,761,030 ordinary shares, equal to 59.68% of the total issued ordinary capital.
| Name | Number of shares | % of shares | Name | Number of shares | % of shares | |||||||||||||||||
| ||||||||||||||||||||||
1. | HSBC CUSTODY NOMINEES (AUSTRALIA) LIMITED | 496,877,028 | 18.28 | 11. | BNP PARIBAS NOMS PTY LTD <DRP> | 12,947,217 | 0.48 | |||||||||||||||
2. | J P MORGAN NOMINEES AUSTRALIA LIMITED | 388,520,632 | 14.30 | 12. | ANZEST PTY LTD <DEFERRED SHARE PLAN A/C> | 12,643,018 | 0.47 | |||||||||||||||
3. | NATIONAL NOMINEES LIMITED | 355,787,235 | 13.09 | 13. | UBS WEALTH MANAGEMENT AUSTRALIA NOMINEES PTY LTD | 11,245,296 | 0.41 | |||||||||||||||
4. | CITICORP NOMINEES PTY LIMITED | 95,326,902 | 3.51 | 14. | HSBC CUSTODY NOMINEES (AUSTRALIA) LIMITED <NT-COMNWLTH SUPER CORP A/C> | 10,414,732 | 0.38 | |||||||||||||||
5. | BNP PARIBAS NOMS PTY LTD <MASTER CUST DRP> | 52,382,287 | 1.93 | 15. | AUSTRALIAN FOUNDATION INVESTMENT COMPANY LIMITED | 8,187,710 | 0.30 | |||||||||||||||
6. | CITICORP NOMINEES PTY LIMITED <COLONIAL FIRST STATE INV A/C> | 48,693,510 | 1.79 | 16. | ARGO INVESTMENTS LIMITED | 7,902,915 | 0.29 | |||||||||||||||
7. | JP MORGAN NOMINEES AUSTRALIA LIMITED <CASH INCOME A/C> | 36,747,189 | 1.35 | 17. | PERPETUAL TRUSTEE COMPANY LIMITED | 6,936,856 | 0.26 | |||||||||||||||
8. | AMP LIFE LIMITED | 26,021,302 | 0.96 | 18. | HSBC CUSTODY NOMINEES (AUSTRALIA) LIMITED-GSCO ECA | 5,961,974 | 0.22 | |||||||||||||||
9. | RBC INVESTOR SERVICES AUSTRALIA NOMINEES PTY LIMITED <PI POOLED A/C> | 20,089,562 | 0.74 | 19. | QIC LIMITED | 5,787,257 | 0.21 | |||||||||||||||
10. | BNP PARIBAS NOMS PTY LTD <SMP ACCOUNTS DRP> | 14,032,348 | 0.52 | 20. | ANZEST PTY LTD <ESAP SHARE PLAN A/C> | 5,256,060 | 0.19 | |||||||||||||||
| ||||||||||||||||||||||
Total |
|
1,621,761,030 |
|
|
59.68 |
| ||||||||||||||||
| ||||||||||||||||||||||
Distribution of shareholdings
At 12 October 2012 Range of shares | Number of holders | % of holders | Number of shares | % of shares | ||||||||||||
| ||||||||||||||||
1 to 1,000 | 231,911 | 52.87 | 96,665,046 | 3.56 | ||||||||||||
1,001 to 5,000 | 166,971 | 38.07 | 377,204,439 | 13.88 | ||||||||||||
5,001 to 10,000 | 25,627 | 5.84 | 177,598,813 | 6.53 | ||||||||||||
10,001 to 100,000 | 13,681 | 3.12 | 277,923,886 | 10.23 | ||||||||||||
Over 100,000 | 429 | 0.10 | 1,788,065,328 | 65.80 | ||||||||||||
| ||||||||||||||||
Total |
|
438,619 |
|
|
100.00 |
|
|
2,717,457,512 |
|
|
100.00 |
| ||||
| ||||||||||||||||
At 12 October 2012:
| n | there were no persons with a substantial shareholding in the Company; |
| n | the average size of holdings of ordinary shares was 6,195 (2011: 5,935) shares; and |
| n | there were 9,505 holdings (2011: 10,698 holdings) of less than a marketable parcel (less than $500 in value or 20 shares based on the market price of $25.66 per share), which is less than 2.17% of the total holdings of ordinary shares. |
Voting rights of ordinary shares
The Constitution provides for votes to be cast as follows:
| i) | on show of hands, 1 vote for each shareholder; and |
| ii) | on a poll, 1 vote for each fully paid ordinary share. |
A register of holders of ordinary shares is held at:
452 Johnston Street
Abbotsford
Victoria, Australia
(Telephone: +61 3 9415 4010)
SUPPLEMENTARY INFORMATION 207

ANZ Convertible Preference Shares (ANZ CPS)
ANZ CPS1
On 30 September 2008 ANZ issued convertible preference shares (ANZ CPS1) which were offered pursuant to a prospectus dated 4 September 2008.
At 12 October 2012, the twenty largest holders of ANZ CPS1 held 2,367,385 securities, equal to 21.90% of the total issued securities.
| Name | Number of securities | % of securities | Name | Number of securities | % of securities | |||||||||||||||||
| ||||||||||||||||||||||
1. | UBS WEALTH MANAGEMENT AUSTRALIA NOMINEES PTY LTD | 454,217 | 4.20 | 11. | NATIONAL NOMINEES LIMITED | 69,280 | 0.64 | |||||||||||||||
2. | UCA CASH MANAGEMENT FUND LTD | 230,244 | 2.13 | 12. | BNP PARIBAS NOMS PTY LTD <MASTER CUST DRP> | 68,307 | 0.63 | |||||||||||||||
3. | QUESTOR FINANCIAL SERVICES LIMITED <TPS RF A/C> | 213,074 | 1.97 | 13. | AUSTRALIAN EXECUTOR TRUSTEES LIMITED <NO 1 ACCOUNT> | 58,376 | 0.54 | |||||||||||||||
4. | NAVIGATOR AUSTRALIA LTD <MLC INVESTMENT SETT A/C> | 210,662 | 1.95 | 14. | RBC INVESTOR SERVICES AUSTRALIA NOMINEES PTY LIMITED <NMSMT A/C> | 57,658 | 0.53 | |||||||||||||||
5. | HSBC CUSTODY NOMINEES (AUSTRALIA) LIMITED | 189,723 | 1.76 | 15. | BALLARD BAY PTY LTD <BALLARD BAY DISCRETIONARY AC> | 50,000 | 0.46 | |||||||||||||||
6. | J P MORGAN NOMINEES AUSTRALIA LIMITED | 172,300 | 1.59 | 16. | JMB PTY LIMITED | 50,000 | 0.46 | |||||||||||||||
7. | NULIS NOMINEES (AUSTRALIA) LIMITED <NAVIGATOR MAST PLAN SETT A/C> | 124,973 | 1.16 | 17. | SPINETTA PTY LTD | 45,000 | 0.42 | |||||||||||||||
8. | UBS NOMINEES PTY LTD | 92,935 | 0.86 | 18. | CITICORP NOMINEES PTY LIMITED | 42,063 | 0.39 | |||||||||||||||
9. | CITICORP NOMINEES PTY LIMITED <DPSL> | 83,002 | 0.77 | 19. | HSBC CUSTODY NOMINEES (AUSTRALIA) LIMITED – A/C 2 | 41,980 | 0.39 | |||||||||||||||
10. | NETWEALTH INVESTMENTS LIMITED <WRAP SERVICES A/C> | 73,591 | 0.68 | 20. | KOLL PTY LTD <NO 1 ACCOUNT> | 40,000 | 0.37 | |||||||||||||||
| ||||||||||||||||||||||
Total |
|
2,367,385 |
|
|
21.90 |
| ||||||||||||||||
| ||||||||||||||||||||||
Distribution of ANZ CPS1 holdings
At 12 October 2012 Range of securities | Number of holders | % of holders | Number of securities | % of securities | ||||||||||||
| ||||||||||||||||
1 to 1,000 | 15,822 | 92.42 | 4,762,373 | 44.05 | ||||||||||||
1,001 to 5,000 | 1,166 | 6.81 | 2,393,151 | 22.14 | ||||||||||||
5,001 to 10,000 | 73 | 0.43 | 592,863 | 5.48 | ||||||||||||
10,001 to 100,000 | 51 | 0.30 | 1,468,544 | 13.58 | ||||||||||||
Over 100,000 | 7 | 0.04 | 1,595,193 | 14.75 | ||||||||||||
| ||||||||||||||||
Total |
|
17,119 |
|
|
100.00 |
|
|
10,812,124 |
|
|
100.00 |
| ||||
| ||||||||||||||||
At 12 October 2012: There were 5 holdings (2011: 6 holdings) of less than a marketable parcel (less than $500 in value or 6 securities based on the market price of $99.48 per security), which is less than 0.03% of the total holdings of ANZ CPS1.
Voting rights of ANZ CPS1
An ANZ CPS1 does not entitle its holder to vote at any general meeting of ANZ except in the following circumstances:
| i) | on any proposal to reduce ANZ’s share capital, other than a resolution to approve a Redemption of the ANZ CPS1; |
| ii) | on a proposal that affects the rights attached to the ANZ CPS1; |
| iii) | on any resolution to approve the terms of a buy-back agreement, other than a resolution to approve a Redemption of ANZ CPS1; |
| iv) | on a proposal to wind up ANZ; |
| v) | on a proposal for the disposal of the whole of ANZ’s property, business and undertaking; |
| vi) | on any matter during a winding up of ANZ; and |
| vii) | on any matter during a period in which a dividend remains unpaid. |
On a resolution or proposal on which an ANZ CPS1 holder is entitled to vote, the ANZ CPS1 holder has:
| i) | on a show of hands, one vote; and |
| ii) | on a poll, one vote for each ANZ CPS1 held. |
A register of holders of ANZ CPS1 is held at:
452 Johnston Street
Abbotsford
Victoria, Australia
(Telephone: +61 3 9415 4010)
208

ANZ CPS2
On 17 December 2009 ANZ issued convertible preference shares (ANZ CPS2) which were offered pursuant to a prospectus dated 18 November 2009.
At 12 October 2012, the twenty largest holders of ANZ CPS2 held 3,355,266 securities, equal to 17.04% of the total issued securities.
| Name | Number of securities | % of securities | Name | Number of securities | % of securities | |||||||||||||||||
| ||||||||||||||||||||||
1. | UBS WEALTH MANAGEMENT AUSTRALIA NOMINEES PTY LTD | 669,741 | 3.40 | 11. | JMB PTY LIMITED | 100,600 | 0.51 | |||||||||||||||
2. | J P MORGAN NOMINEES AUSTRALIA LIMITED | 415,655 | 2.11 | 12. | RHI HOLDINGS PTY LTD <RONI HUBAY INVESTMENT A/C> | 100,000 | 0.51 | |||||||||||||||
3. | QUESTOR FINANCIAL SERVICES LIMITED <TPS RF A/C> | 302,910 | 1.54 | 13. | NATIONAL NOMINEES LIMITED | 97,667 | 0.50 | |||||||||||||||
4. | NAVIGATOR AUSTRALIA LTD <MLC INVESTMENT SETT A/C> | 255,411 | 1.30 | 14. | NETWEALTH INVESTMENTS LIMITED <WRAP SERVICES A/C> | 91,687 | 0.47 | |||||||||||||||
5. | HSBC CUSTODY NOMINEES (AUSTRALIA) LIMITED | 244,602 | 1.24 | 15. | CITICORP NOMINEES PTY LIMITED | 84,068 | 0.43 | |||||||||||||||
6. | NULIS NOMINEES (AUSTRALIA) LIMITED <NAVIGATOR MAST PLAN SETT A/C> | 175,909 | 0.89 | 16. | RANDAZZO C & G DEVELOPMENTS PTY LTD | 78,500 | 0.40 | |||||||||||||||
7. | RBC INVESTOR SERVICES AUSTRALIA NOMINEES PTY LIMITED <NMSMT A/C> | 149,501 | 0.76 | 17. | CITICORP NOMINEES PTY LIMITED <COLONIAL FIRST STATE INV A/C> | 68,000 | 0.35 | |||||||||||||||
8. | AUSTRALIAN EXECUTOR TRUSTEES LIMITED <NO 1 ACCOUNT> | 125,547 | 0.64 | 18. | MR PHILIP WILLIAM DOYLE | 60,000 | 0.30 | |||||||||||||||
9. | ABN AMRO CLEARING SYDNEY NOMINEES PTY LTD <NEXT CUSTODIAN A/C> | 113,086 | 0.57 | 19. | W MITCHELL INVESTMENTS PTY LTD <W MITCHELL SUPER FUND> | 60,000 | 0.30 | |||||||||||||||
10. | WINCHELADA PTY LIMITED | 102,976 | 0.52 | 20. | AVANTEOS INVESTMENTS LIMITED <ENCIRCLE IMA A/C> | 59,406 | 0.30 | |||||||||||||||
| ||||||||||||||||||||||
Total |
|
3,355,266 |
|
|
17.04 |
| ||||||||||||||||
| ||||||||||||||||||||||
Distribution of ANZ CPS2 holdings
At 12 October 2012 Range of securities | Number of holders | % of holders | Number of securities | % of securities | ||||||||||||
| ||||||||||||||||
1 to 1,000 | 28,386 | 92.03 | 8,777,303 | 44.58 | ||||||||||||
1,001 to 5,000 | 2,199 | 7.13 | 4,665,034 | 23.70 | ||||||||||||
5,001 to 10,000 | 162 | 0.52 | 1,266,997 | 6.44 | ||||||||||||
10,001 to 100,000 | 86 | 0.28 | 2,321,952 | 11.79 | ||||||||||||
Over 100,000 | 11 | 0.04 | 2,655,938 | 13.49 | ||||||||||||
| ||||||||||||||||
Total |
|
30,844 |
|
|
100.00 |
|
|
19,687,224 |
|
|
100.00 |
| ||||
| ||||||||||||||||
At 12 October 2012: There were 10 holdings (2011: 7 holdings) of less than a marketable parcel (less than $500 in value or 6 securities based on the market price of $99.98 per security), which is less than 0.04% of the total holdings of ANZ CPS2.
Voting rights of ANZ CPS2
An ANZ CPS2 does not entitle its holder to vote at any general meeting of ANZ except in the following circumstances:
| i) | on any proposal to reduce ANZ’s share capital, other than a resolution to approve a Redemption of the ANZ CPS2; |
| ii) | on a proposal that affects the rights attached to the ANZ CPS2; |
| iii) | on any resolution to approve the terms of a buy-back agreement, other than a resolution to approve a Redemption of ANZ CPS2; |
| iv) | on a proposal to wind up ANZ; |
| v) | on a proposal for the disposal of the whole of ANZ’s property, business and undertaking; |
| vi) | on any matter during a winding up of ANZ; and |
| vii) | on any matter during a period in which a dividend remains unpaid. |
On a resolution or proposal on which an ANZ CPS2 holder is entitled to vote, the ANZ CPS2 holder has:
| i) | on a show of hands, one vote; and |
| ii) | on a poll, one vote for each ANZ CPS2 held. |
A register of holders of ANZ CPS2 is held at:
452 Johnston Street
Abbotsford
Victoria, Australia
(Telephone: +61 3 9415 4010)
SHAREHOLDER INFORMATION 209

ANZ CPS3
On 28 September 2011 ANZ issued convertible preference shares (ANZ CPS3) which were offered pursuant to a prospectus dated 31 August 2011.
At 12 October 2012, the twenty largest holders of ANZ CPS3 held 2,233,178 securities, equal to 16.67% of the total issued securities.
Name | Number of securities | % of securities | Name | Number of securities | % of securities | |||||||||||||||||
| ||||||||||||||||||||||
1. | UBS WEALTH MANAGEMENT AUSTRALIA NOMINEES PTY LTD | 531,994 | 3.97 | 10. | MICHAEL COPPEL VENTURES P/L <MICHAEL COPPEL VENTURES A/C> | 80,000 | 0.60 | |||||||||||||||
2. | RAKIO PTY LTD <PIEKARSKI GYMPIE A/C> | 200,000 | 1.50 | 11. | JMB PTY LIMITED | 70,000 | 0.52 | |||||||||||||||
3. | NAVIGATOR AUSTRALIA LTD <MLC INVESTMENT SETT A/C> | 198,041 | 1.48 | 12. | EASTCOTE PTY LTD <VAN LIESHOUT FAMILY A/C> | 50,000 | 0.37 | |||||||||||||||
4. | CITICORP NOMINEES PTY LIMITED | 195,910 | 1.46 | 13. | MR TERRENCE E PEABODY + MRS MARY G PEABODY <SUPER FUND A/C> | 50,000 | 0.37 | |||||||||||||||
5. | QUESTOR FINANCIAL SERVICES LIMITED <TPS RF A/C> | 140,821 | 1.05 | 14. | RANDAZZO C & G DEVELOPMENTS PTY LTD | 50,000 | 0.37 | |||||||||||||||
6. | RBC INVESTOR SERVICES AUSTRALIA NOMINEES PTY LIMITED <NMSMT A/C> | 120,164 | 0.90 | 15. | TANDOM PTY LTD | 50,000 | 0.37 | |||||||||||||||
7. | HSBC CUSTODY NOMINEES (AUSTRALIA) LIMITED | 104,537 | 0.78 | 16. | WINCHELADA PTY LIMITED | 50,000 | 0.37 | |||||||||||||||
8. | NULIS NOMINEES (AUSTRALIA) LIMITED <NAVIGATOR MAST PLAN SETT A/C> | 92,571 | 0.69 | 17. | SIR MOSES MONTEFIORE JEWISH HOME <INCOME A/C> | 44,140 | 0.33 | |||||||||||||||
9. | DIMBULU PTY LTD | 85,000 | 0.64 | 18. | BNP PARIBAS NOMS PTY LTD <MASTER CUST DRP> | 40,000 | 0.30 | |||||||||||||||
| 19. | MR RONALD MAURICE BUNKER | 40,000 | 0.30 | |||||||||||||||||||
| 20. | GAINSDALE PTY LTD <G F TURNER FAMILY A/C> | 40,000 | 0.30 | |||||||||||||||||||
| ||||||||||||||||||||||
Total |
|
2,233,178 |
|
|
16.67 |
| ||||||||||||||||
| ||||||||||||||||||||||
Distribution of ANZ CPS3 holdings
At 12 October 2012 Range of securities | Number of holders | % of holders | Number of securities | % of securities | ||||||||||||||
| ||||||||||||||||||
1 to 1,000 | 18,302 | 91.73 | 5,788,413 | 43.20 | ||||||||||||||
1,001 to 5,000 | 1,473 | 7.38 | 3,326,986 | 24.83 | ||||||||||||||
5,001 to 10,000 | 97 | 0.49 | 780,910 | 5.83 | ||||||||||||||
10,001 to 100,000 | 72 | 0.36 | 2,012,224 | 15.01 | ||||||||||||||
Over 100,000 | 7 | 0.04 | 1,491,467 | 11.13 | ||||||||||||||
| ||||||||||||||||||
Total |
|
19,951 |
|
|
100.00 |
|
|
13,400,000 |
|
|
100.00 |
| ||||||
| ||||||||||||||||||
At 12 October 2012: There was 1 holding (2011: nil) of less than a marketable parcel (less than $500 in value or 6 securities based on the market price of $98.80 per security), which is less than 0.01% of the total holdings of ANZ CPS3.
Voting rights of ANZ CPS3
An ANZ CPS3 does not entitle its holder to vote at any general meeting of ANZ except in the following circumstances:
| i) | on any proposal to reduce ANZ’s share capital, other than a resolution to approve a Redemption of the ANZ CPS3; |
| ii) | on a proposal that affects the rights attached to the ANZ CPS3; |
| iii) | on any resolution to approve the terms of a buy-back agreement, other than a resolution to approve a Redemption of ANZ CPS3; |
| iv) | on a proposal to wind up ANZ; |
| v) | on a proposal for the disposal of the whole of ANZ’s property, business and undertaking; |
| vi) | on any matter during a winding up of ANZ; and |
| vii) | on any matter during a period in which a dividend remains unpaid. |
On a resolution or proposal on which an ANZ CPS3 holder is entitled to vote, the ANZ CPS3 holder has:
| i) | on a show of hands, one vote; and |
| ii) | on a poll, one vote for each ANZ CPS3 held. |
A register of holders of ANZ CPS3 is held at:
452 Johnston Street
Abbotsford
Victoria, Australia
(Telephone: +61 3 9415 4010)
210

US Trust Securities
On 27 November 2003, the Company issued 750,000 USD non-cumulative Trust Securities (‘US Trust Securities’). For more details on the US Trust Securities refer to page 118.
The US Trust Securities were issued in global form and are registered in the name of Cede & Co as the sole holder. The fully paid preference shares and the unsecured notes that form part of the US Trust Securities are registered in the name of The Bank of New York (Delaware) (as trustee of ANZ Capital Trust II) as the sole holder.
The preference shares forming part of the US Trust Securities confer voting rights in the Company in the following limited circumstances:
| n | any proposal to reduce the Company’s share capital; |
| n | on a proposal that affects rights attached to the preference shares; |
| n | any resolution to approve the terms of a share buy-back agreement; |
| n | any proposal for the disposal of the whole of the Company’s property, business and undertaking; |
| n | on any proposal to wind up the Company and any matter during the Company’s winding up, and |
| n | on all matters on which the holders of ANZ ordinary shares are entitled to vote during a special voting period. A “special voting period” is a period from any dividend payment date where preference share dividends are not paid in full in respect of the immediately preceding semi-annual dividend period or the 24th business day after the failure of Samson Funding Limited to make an interest payment in full on the notes that form part of the US Trust Securities and the Company does not make the payment pursuant to the relevant guarantee or pay an optional dividend on the preference shares within a prescribed time period. |
On a resolution or proposal on which a preference share holder is entitled to vote, the holder has on a poll one vote per preference share held.
Euro Trust Securities
On 13 December 2004, the Company issued 500,000 Euro Floating Rate Non-cumulative Trust Securities (‘Euro Trust Securities’). For more details on the Euro Trust Securities refer to page 121.
The Euro Trust Securities were issued in global form and are registered in the name of The Bank of New York Depositary (Nominees) Limited as the sole holder. The fully paid preference shares and unsecured notes that form part of the Euro Trust Securities are registered in the name of The Bank of New York (as trustee for ANZ Capital Trust III) as the sole holder.
The preference shares forming part of the Euro Trust Securities confer voting rights in the Company in the following limited circumstances:
| n | any proposal to reduce the Company’s share capital, other than a resolution to approve a redemption or reduction of capital in connection with the preference shares; |
| n | on a proposal that affects rights attached to the preference shares; |
| n | any resolution to approve the terms of a share buy-back agreement, other than a resolution to approve a buy-back (other than an on market buy-back) of preference shares; |
| n | any proposal for the disposal of the whole of the Company’s property, business and undertaking; |
| n | on any proposal to wind up the Company and any matter during the Company’s winding-up; and |
| n | on all matters on which the holders of ANZ ordinary shares are entitled to vote during a special voting period. A “special voting period” is a period from any dividend payment date where preference share dividends are not paid in full in respect of the immediately preceding quarterly dividend period or the 24th business day after the failure of ANZ Jackson Funding plc to make an interest payment in full on the notes that form part of the Euro Trust Securities and the Company does not make the payment pursuant to the relevant guarantee or pay an optional dividend on the preference shares within a prescribed time period. |
On a resolution or proposal on which a preference share holder is entitled to vote, the holder has on a show of hands one vote, and on a poll, one vote per preference share held.
Employee Shareholder Information
At the Annual General Meeting in January 1994, shareholders approved an aggregate limit of 7% of all classes of shares and options, which remain subject to the rules of a relevant incentive plan, being held by employees and directors. At 30 September 2012 participants held 1.21% (2011: 1.27%) of the issued shares and options of ANZ under the following incentive plans:
| n | ANZ Employee Share Acquisition Plan; |
| n | ANZ Employee Share Save Scheme; |
| n | ANZ Share Option Plan; |
| n | ANZ Directors’ Share Plan; and |
| n | ANZ Directors’ Retirement Benefit Plan. |
Stock Exchange Listings
Australia and New Zealand Banking Group Limited’s ordinary shares are listed on the Australian Securities Exchange and the New Zealand Stock Exchange.
The Group’s other stock exchange listings include:
| n | Australian Securities Exchange – ANZ Convertible Preference Shares (ANZ CPS1, CPS2 and CPS3) [Australia and New Zealand Banking Group Limited]; senior (including covered bonds) and subordinated (including ANZ Subordinated Notes) debt [Australia and New Zealand Banking Group Limited]; |
| n | Channel Islands Stock Exchange – Senior debt [ANZ Jackson Funding 4 Limited]; subordinated debt [ANZ Jackson Funding plc]; |
| n | London Stock Exchange – Senior (including covered bonds) and subordinated debt [Australia and New Zealand Banking Group Limited]; senior (including covered bonds) debt [ANZ New Zealand (Int’l) Limited]; |
| n | Luxembourg Stock Exchange – Senior and subordinated debt [Australia and New Zealand Banking Group Limited]; non-cumulative Trust Securities (Euro Trust Securities) [ANZ Capital Trust III]; |
| n | New Zealand Stock Exchange – Senior debt and perpetual callable subordinated notes [ANZ Bank New Zealand Limited]; and |
| n | SIX Swiss Exchange – Senior debt (including covered bonds) [Australia and New Zealand Banking Group Limited and ANZ New Zealand (Int’l) Limited]. |
For more information on the Euro Trust Securities and ANZ CPS please refer to notes 28 and 29 to the Financial Statements.
| SHAREHOLDER INFORMATION 211 |

American Depositary Receipts
The Group has American Depositary Receipts (ADRs) representing American Depositary Shares (ADSs) that are traded on the over-the- counter securities market “OTC Pink” electronic platform operated by OTC Markets Group Inc. in the United States under the ticker symbol: ANZBY and the CUSIP number: 052528304.
With effect from 23 July 2008, the ADR ratio changed from one ADS representing five ANZ ordinary shares to one ADS representing one ANZ ordinary share.
The Bank of New York Mellon Corporation (BNY Mellon) is the Depositary for the Company’s ADR program in the United States.
Holders of the Company’s ADRs should deal directly with BNY Mellon on all matters relating to their ADR holdings. Registered Depositary Receipt shareholders can sell shares, access account balances and transaction history, find answers to frequently asked questions and download commonly needed forms. To speak directly to a BNY Mellon representative, please call 1-888-BNY-ADRS (1-888-269-2377) if you are calling from within the United States. If you are calling from outside the United States, please call 201-680-6825. You may also send an e-mail inquiry to shrrelations@bnymellon.com or visit the website at www.bnymellon.com/shareowner.
212

AASs – Australian Accounting Standards.
AASB – Australian Accounting Standards Board.
ADIs – Authorised Deposit-taking Institutions.
AFS – Available-for-sale financial assets.
AIFRS – Australian Equivalents to International Financial Reporting Standards.
APRA – Australian Prudential Regulation Authority.
Australia division
The Australia division comprises Retail and Commercial and business units. Retail includes Mortgages, Consumer Cards and Unsecured Lending and Deposits. Commercial includes Esanda, Regional and Commercial Banking, Business Banking and Small Business Banking.
| n | Retail |
| – | Retail Distribution delivers banking solutions to customers via the Australian branch network, ANZ Direct and specialist sales channels. |
| – | Retail Products is responsible for delivering a range of products including mortgages, credit cards, personal loans, transaction banking, savings accounts and deposits, using capabilities in product, analytics, customer research, segmentation, strategy and marketing. It also provides online and electronic payment solutions for businesses: |
| – | Mortgages provides housing finance to consumers in Australia for both owner occupied and investment purposes. |
| – | Cards and Payments provides consumer and commercial credit cards, personal loans and merchant services. |
| – | Deposits provides transaction banking, savings and investment products, such as term deposits and cash management accounts. |
| n | Commercial |
| – | Esanda provides motor vehicle and equipment finance and investment products. |
| – | Regional Commercial Banking provides a full range of banking services to personal customers and to small business and agribusiness customers in rural and regional Australia, and includes the acquisition of loans and deposits from Landmark Financial Services. |
| – | Business Banking provides a full range of banking services, including risk management, to metropolitan based small to medium sized business clients with a turnover of up to A$125 million. |
| – | Small Business Banking provides a full range of banking services for metropolitan-based small businesses in Australia with lending up to A$1 million. |
Collective provision is the provision for credit losses that are inherent in the portfolio but not able to be individually identified. A collective provision may only be recognised when a loss event has already occurred. Losses expected as a result of future events, no matter how likely, are not recognised.
Covered Bonds are bonds issued by an ADI to external investors secured against a pool of the ADI’s assets (the cover pool) assigned to a bankruptcy remote special purpose entity. The primary assets forming the cover pool are mortgage loans. The mortgages remain on the issuer’s balance sheet. The covered bond holders have dual recourse to the issuer and the cover pool assets. The mortgages included in the cover pool cannot be otherwise pledged or disposed of but may be repurchased and substituted in order to maintain the credit quality of the pool. The Group issues covered bonds as part of its funding activities.
Credit equivalent represents the calculation of on-balance sheet equivalents for market related items.
Customer deposits represent term deposits, other deposits bearing interest, deposits not bearing interest and borrowing corporations debt excluding securitisation deposits.
Global Wealth and Private Banking division
The Global Wealth and Private Banking division comprises Funds Management, Insurance and Private Banking which provides investment, superannuation, insurance products and services (including Private Banking) for customers across Australia, New Zealand and Asia
| n | Private Banking specialises in assisting individuals and families to manage, grow and preserve their wealth. The businesses within Private Banking & Other Wealth include Private Bank, ANZ Trustees, E*Trade, Investment Lending, Super Concepts and Other Wealth. |
| n | Funds Banking Management and Insurance includes OnePath Group (in Australia and New Zealand), ANZ Financial Planning, ANZ General insurance, Lender’s Mortgage Insurance and Online Investment Account. |
Group Centre comprises Global Services & Operations, Group Technology, Group Human Resources, Group Risk, Group Strategy, Group Corporate Affairs, Group Corporate Communications, Group Treasury, Global Internal Audit, Group Finance, and Group Marketing, Innovation and Digital and Shareholder Functions.
IFRS – International Financial Reporting Standards.
Impaired assets are those financial assets where doubt exists as to whether the full contractual amount will be received in a timely manner, or where concessional terms have been provided because of the financial difficulties of the customer. Financial assets are impaired if there is objective evidence of impairment as a result of a loss event that occurred prior to the reporting date, and that loss event has had an impact, which can be reliably estimated, on the expected future cash flows of the individual asset or portfolio of assets.
Impaired commitments and contingencies comprises undrawn facilities and contingent facilities where the customer’s status is defined as impaired.
Impaired loans comprises drawn facilities where the customer’s status is defined as impaired.
Income includes external interest income, funds management and insurance income, share of associates’ profit and other external operating income.
Individual provision charge is the amount of expected credit losses on financial instruments assessed for impairment on an individual basis (as opposed to on a collective basis). It takes into account expected cash flow over the lives of those financial instruments.
| GLOSSARY 213 |

International and Institutional Banking division
The International and Institutional Banking division comprises Global Institutional, Retail Asia Pacific and Asia Partnerships business units, together with Relationship & Infrastructure.
| n | Global Institutional provides global financial services to government, corporate and institutional clients with a focus on solutions for clients with complex financial needs based on a deep understanding of their businesses and industries with particular expertise in natural resources, agriculture and infrastructure. Institutional delivers transaction banking, specialised lending and markets solutions in Australia, New Zealand, Asia Pacific, Europe and America. |
| n | Transaction Banking provides working capital solutions including deposit products, cash transaction banking management, trade finance, international payments, and clearing services principally to institutional and corporate customers. |
| n | Global Markets provides risk management services to corporate and institutional clients globally in relation to foreign exchange, interest rates, credit, commodities, debt capital markets, wealth solutions and equity derivatives. Markets provides origination, underwriting, structuring and risk management services, advice and sale of credit and derivative products globally. Markets also manages the Group’s interest rate risk position and liquidity portfolio. |
| n | Global Loans (including Corporate Banking) provides term loans, working capital facilities and specialist loan structuring. It provides specialist credit analysis, structuring, execution and ongoing monitoring of strategically significant customer transactions, including project and structured finance, debt structuring and acquisition finance, loan product structuring and management, structured asset and export finance. |
| n | Retail provides retail and small business banking services to customers in the Asia Pacific region and also includes investment and insurance products and services for Asia Pacific customers. |
| n | Asia Partnerships which is a portfolio of strategic partnerships in Asia. This includes investments in Indonesia with PT Bank Pan Indonesia, in the Philippines with Metrobank Cards Corporation, in China with Bank of Tianjin and Shanghai Rural Commercial Bank, in Malaysia with AMMB Holdings Berhad and in Vietnam with Saigon Thuong Tin Commercial Joint-Stock (Sacombank) and Saigon Securities Incorporation. During the March 2012 half, the investment in Saigon Thuong Tin Commercial Joint-Stock (Sacombank) was sold. |
| n | Relationship & Infrastructure includes client relationship management teams for global institutional and financial institution and corporate customers in Australia and Asia, corporate advisory and central support functions. Relationship and infrastructure also includes businesses within IIB which are discontinued. |
Net interest average margin is net interest income as a percentage of average interest earning assets.
Net interest spread is the average interest rate received on interest earning assets less the average interest rate paid on interest bearing liabilities. Non-assessable interest income is grossed up to the equivalent before tax amount for the purpose of these calculations.
Net loans and advances include gross loans and advances and acceptances and capitalised brokerage/mortgage origination fees, less unearned income and provisions for credit impairment.
Net non-interest bearing items, which are referred to in the analysis of interest spread and net interest average margin, includes shareholders’ equity, impairment of loans and advances, deposits not bearing interest and other liabilities not bearing interest, offset by premises and equipment and other non-interest earning assets. Non-performing loans are included within interest bearing loans, advances and bills discounted.
Net tangible assets equals share capital and reserves attributable to shareholders of the Group less preference share capital and unamortised intangible assets (including goodwill and software).
New Zealand division
The New Zealand division comprises Retail and Commercial business units, and Operations and Support which includes the central support functions (including Treasury funding).
| n | Retail |
| – | Includes Mortgages, Credits Cards and Unsecured Lending to personal customers in New Zealand. |
| n | Commercial |
| – | Commercial & Agri provides financial solutions through a relationship management model for medium-sized businesses, including agri-business, with a turnover of up to NZ$150 million. Asset Finance (including motor vehicle and equipment finance), operating leases and investment products are provided under the UDC brand. |
| – | Small Business Banking provides a full range of banking services to small enterprises, typically with turnover of less than NZ$5 million. |
Operating expenses includes personnel expenses, premises expense and other operating expenses (excluding the provision for impairment of loans and advances charge).
Operating income includes net interest income, funds management and insurance income, share of associates’ profit and other operating income.
Regulatory deposits are mandatory reserve deposits lodged with local central banks in accordance with statutory requirements.
Return on asset ratio include net intra group assets.
Repo discount is a discount applicable on the repurchase by a central bank of an eligible security pursuant to a repurchase agreement.
Restructured items comprise facilities in which the original contractual terms have been modified for reasons related to the financial difficulties of the customer. Restructuring may consist of a reduction of interest, principal or other payments legally due or an extension in maturity materially beyond those typically offered to new facilities with similar risk.
Segment revenue includes net interest income, share of associates’ profit and other operating income.
214

Sub-standard assets are customers that have demonstrated some operational and financial instability, with variability and uncertainty in profitability and liquidity projected to continue over the short and possibly medium term.
Total advances include gross loans and advances and acceptances less unearned income (for both as at and average volumes). Loans and advances classified as available-for-sale are excluded from total advances.
Underlying profit is a measure of profit which is prepared on a basis other than in accordance with accounting standards. Underlying profit represents the profit from the ongoing business activities of the Group, and is based on guidelines published by the Australian Institute of Company Directors (AICD) and the Financial Services Institute of Australasia (FINSIA). ANZ applies this guidance by adjusting statutory profit to exclude non-core items to arrive at underlying profit, the result for the ongoing business activities of the Group. These adjustments have been determined on a consistent basis with those made in prior periods. The adjustments made in arriving at underlying profit are included in statutory profit which is subject to audit within the context of the Group audit opinion. Underlying profit is not audited, however, the external auditor has informed the Audit Committee that the adjustments, and the presentation thereof, are based on the guidelines released by the AICD and FINSIA, and have been determined on a consistent basis with those made in prior periods.
NOTES TO THE FINANCIAL STATEMENTS 215

Assets Charged as Security for Liabilities and Collateral Accepted as Security for Assets | 127 | |||
Associates | 168 | |||
Available-for-sale Assets | 105 | |||
Average Balance Sheet and Related Interest | 200 | |||
Balance Sheet | 74 | |||
Bonds and Notes | 116 | |||
Capital Adequacy | 196 | |||
Capital Management | 123 | |||
Cash Flow Statement | 75 | |||
Chairman’s Report | 6 | |||
Chief Executive Officer’s Report | 7 | |||
Commitments | 170 | |||
Compensation of Auditors | 94 | |||
Controlled Entities | 167 | |||
Corporate Governance Statement | 36 | |||
Credit Related Commitments, Guarantees, Contingent Liabilities and Contingent Assets | 171 | |||
Critical Estimates and Judgements Used in Applying Accounting Policies | 90 | |||
Current Income Tax Expense | 95 | |||
Deposits and Other Borrowings | 114 | |||
Derivative Financial Instruments | 99 | |||
Directors’ Declaration and Responsibility Statement | 193 | |||
Directors’ Report | 8 | |||
Dividends | 96 | |||
Due from Other Financial Institutions | 98 | |||
Due to Other Financial Institutions | 114 | |||
Earnings per Ordinary Share | 97 | |||
Employee Share and Option Plans | 180 | |||
Events Since the End of the Financial Year | 192 | |||
Exchange Rates | 192 | |||
Expenses | 93 | |||
Fair Value of Financial Assets and Financial Liabilities | 152 | |||
Fiduciary Activities | 170 | |||
Financial Statements | 72 | |||
Financial Risk Management | 128 | |||
Five Year Summary | 70 | |||
Glossary | 213 | |||
Goodwill and Other Intangible Assets | 111 | |||
Impaired Financial Assets | 107 | |||
Income Statements | 72 | |||
Income Tax Liabilities | 115 | |||
Income | 92 | |||
Independent Auditor’s Report | 194 | |||
Interest Spreads and Net Interest Average Margins | 203 | |||
Key Management Personnel Disclosures | 184 | |||
Life Insurance Business | 188 | |||
Liquid Assets | 98 | |||
Loan Capital | 117 | |||
Maturity Analysis of Assets and Liabilities | 161 | |||
Net Loans and Advances | 106 | |||
Notes to the Cash Flow Statements | 165 | |||
Notes to the Financial Statements | 78 | |||
Other Assets | 112 | |||
Payables and Other Liabilities | 115 | |||
Premises and Equipment | 112 | |||
Provision for Credit Impairment | 107 | |||
Provisions | 116 | |||
Remuneration Report | 13 | |||
Reserves and Retained Earnings | 122 | |||
Review of Operating Results | 55 | |||
Securitisations and Covered Bonds | 169 | |||
Segment Analysis | 162 | |||
Share Capital | 120 | |||
Shareholder Information | 207 | |||
Shares in Controlled Entities and Associates | 109 | |||
Significant Accounting Policies | 78 | |||
Statement of Changes in Equity | 76 | |||
Statement of Comprehensive Income | 73 | |||
Superannuation and Other Post Employment Benefit Schemes | 175 | |||
Supplementary Information | 196 | |||
Tax Assets | 110 | |||
Trading Securities | 98 | |||
Transactions with Other Related Parties | 188 | |||
216