Exhibit 99.1

Australia and New Zealand Banking Group Limited
ABN 11 005 357 522
Half Year
31 March 2014
Consolidated Financial Report
Dividend Announcement
and Appendix 4D
The Consolidated Financial Report and Dividend Announcement contains information required by Appendix 4D of the Australian Securities Exchange Listing Rules. It should be read in conjunction with ANZ’s 2013 Annual Report and is lodged with the Australian Securities Exchange under listing rule 4.2A.
| RESULTS FOR ANNOUNCEMENT TO THE MARKET | APPENDIX 4D |
| Name of Company: | Australia and New Zealand Banking Group Limited | |
| ABN 11 005 357 522 |
Report for the half year ended 31 March 2014
| Operating Results1 | A$ million | |||||||
Operating income | ñ | 7% to | 9,518 | |||||
Net statutory profit attributable to shareholders | ñ | 15% to | 3,381 | |||||
Cash profit2 | ñ | 11% to | 3,515 | |||||
| Dividends3 | Cents per share | Franked amount4 per share | ||||||
Proposed interim dividend | 83 | 100 | % | |||||
Record date for determining entitlements to the proposed 2014 interim dividend | 13 May 2014 | |||||||
Payment date for the proposed 2014 interim dividend | 1 July 2014 | |||||||
Dividend Reinvestment Plan and Bonus Option Plan
Australia and New Zealand Banking Group Limited (ANZ) has a Dividend Reinvestment Plan (DRP) and a Bonus Option Plan (BOP) that will operate in respect of the 2014 interim dividend. For the 2014 interim dividend, ANZ intends to provide shares under the DRP and BOP through the issue of new shares. The ‘Acquisition Price’ to be used in determining the number of shares to be provided under the DRP and BOP will be calculated by reference to the arithmetic average of the daily volume weighted average sale price of all fully paid ANZ ordinary shares sold in the ordinary course of trading on the ASX during the ten trading days commencing on 16 May 2014, and then rounded to the nearest whole cent. Shares provided under the DRP and BOP will rank equally in all respects with existing fully paid ANZ ordinary shares. Election notices from shareholders wanting to commence, cease or vary their participation in the DRP or BOP for the 2014 interim dividend must be received by ANZ’s Share Registrar by 5.00pm (Australian Eastern Standard Time) on 14 May 2014. Subject to receiving effective contrary instructions from the shareholder, dividends payable to shareholders with a registered address in the United Kingdom (including the Channel Islands and the Isle of Man) or New Zealand will be converted to Pounds Sterling and New Zealand dollars respectively at an exchange rate calculated on 16 May 2014.
| 1 | Compared to prior comparable period (half year ended 31 March 2013). |
| 2 | Statutory profit has been adjusted to exclude non-core items to arrive at cash profit, and has been provided to assist readers to understand the results for the ongoing activities of the Group. The net after tax adjustment was an increase to cash profit of $134 million made up of several items. Refer pages 83 to 92 for further details. |
| 3 | There is no conduit foreign income attributed to the dividends. |
| 4 | It is proposed that the interim dividend will be fully franked for Australian tax purposes (30% tax rate) and carry New Zealand imputation credits of NZD 10 cents per ordinary share. |
| AUSTRALIA AND NEW ZEALAND BANKING GROUP LIMITED | ABN 11 005 357 522 |
CONSOLIDATED FINANCIAL REPORT, DIVIDEND ANNOUNCEMENT AND APPENDIX 4D
Half year ended 31 March 2014
| CONTENTS | PAGE | |||
Section 1 - Media release | 3 | |||
Section 2 - Snapshot | 7 | |||
Section 3 - CEO overview | 13 | |||
Section 4 - CFO overview | 15 | |||
Section 5 - Segment review | 41 | |||
Section 6 - Geographic review | 75 | |||
Section 7 - Profit reconciliation | 83 | |||
Section 8 - Condensed consolidated financial statements | 93 | |||
Section 9 - Supplementary information | 131 | |||
Definitions | 145 | |||
ASX Appendix 4D Cross Reference Index | 148 | |||
Alphabetical Index | 149 | |||
This Consolidated Financial Report and Dividend Announcement has been prepared for Australia and New Zealand Banking Group Limited (the “Company”) together with its subsidiaries which are variously described as “ANZ”, “Group”, “ANZ Group”, “us”, “we” or “our”.
All amounts are in Australian dollars unless otherwise stated. The information on which the Condensed Consolidated Financial Statements are based, has been reviewed by the Group’s auditors, KPMG. The Company has a formally constituted Audit Committee of the Board of Directors. The signing of these Condensed Consolidated Financial Statements was approved by resolution of a Committee of the Board of Directors on 30 April 2014.
When used in this Results Announcement the words “estimate”, “project”, “intend”, “anticipate”, “believe”, “expect”, “should” and similar expressions, as they relate to ANZ and its management, are intended to identify forward-looking statements. Readers are cautioned not to place undue reliance on these forward-looking statements, which speak only as of the date hereof. ANZ does not undertake any obligation to publicly release the result of any revisions to these forward-looking statements to reflect events or circumstances after the date hereof or to reflect the occurrence of unanticipated events.
Unless otherwise noted, all figures relate to the half year ended 31 March 2014. The term “prior comparable period” (PCP) refers to the half year ended 31 March 2013 and the term “previous half” (HOH) refers to the half year ended 30 September 2013.
| AUSTRALIA AND NEW ZEALAND BANKING GROUP LIMITED | ABN 11 005 357 522 |
This page has been left blank intentionally
| AUSTRALIA AND NEW ZEALAND BANKING GROUP LIMITED | ABN 11 005 357 522 |
Media Release
ANZ 2014 Half Year Result
– good result demonstrates strategy is delivering diversified growth and stronger returns –
Performance Highlights – 1H 2014 compared to 1H 2013 (PCP)1
| • | Statutory profit $3.4 billion up 15%; Cash profit2$3.5 billion up 11%. |
| • | Fully franked Interim Dividend of 83 cents per share an increase of 14%. |
| • | Income up 3.6% and expenses up 1.7% (FX adjusted). |
| • | Cost to income ratio improved a further 20 basis points to 44.3%. |
| • | Return on equity steady at 15.5% with earnings per share up 10% to 128.7 cents. |
| • | Customer deposits grew 13%, net loans and advances up 12%. |
| • | Provision charge of $528 million, 12% lower. |
ANZ Chief Executive Officer Mike Smith said: “This is a good set of results. They demonstrate consistent progress with ANZ’s long-term strategy to grow in our core franchises in Australia and New Zealand, to build a significant and profitable franchise in Asia Pacific, and to establish common infrastructure and processes that improve productivity and reduce risk.
“The diversification this strategy provides is now delivering a differentiated proposition for our customers and improved returns for shareholders.
“Our international business, particularly Asia, is firing on all cylinders with revenue and profits again growing strongly, and a sustained improvement in returns. Profits from International and Institutional in Asia Pacific, Europe and Americas (APEA) are up 43% based on significant growth in customer numbers and in products that support regional trade and investment flows such as foreign exchange, cash management and trade finance.
“Since we launched our strategy six years ago, the compound annual growth rate in earnings from Asia has been 37% and ANZ is now being consistently rated a top 4 Corporate Bank in Asia by Greenwich Associates3.
“In Australia we are seeing ongoing benefits emerge from the investment in our Banking on Australia program which includes new digital solutions for our customers. We have developed greater scale based on market share growth in home lending, small business lending and retail deposits. Business confidence in Australia is recovering more slowly than expected however, and in some segments growth remains subdued with competition placing pressure on margins. Costs were carefully managed in this environment.
“In New Zealand after several years of hard work our business is in a winning position. ANZ’s move to a single brand and technology platform together with New Zealand’s economic recovery saw volume growth, improved productivity and lower provisions.
“Global Wealth continues to focus on improving the customer experience with wealth solutions increasingly integrated with our banking offering and more options for self directed customers. Our revenue performance was positive, underpinned by strong growth in funds under management, favourable claims and lapse experience along with growth in Private Wealth.
“Across the Group, operational and risk outcomes continue to be strong. Operational productivity continues to improve, we increased the volume of transactions globally by around 8% on average while reducing operations costs 4% (FX adjusted) on the prior year.
“Management actions are driving further improvements in the quality of the lending book. In International and Institutional Banking 77% of Institutional customers are now rated investment grade up from 60% in 2008, and this continues to drive a significant reductions in Group impaired assets.
| 1 | All comparisons are Half Year to 31 March 2014 compared to Half Year to 31 March 2013 and on a cash basis unless otherwise noted. |
| 2 | Statutory profit has been adjusted to exclude non-core items to arrive at Cash profit, the result for the ongoing activities of the Group. |
| 3 | Greenwich Associates 2013 Asian Large Corporate Banking Study |
3
| AUSTRALIA AND NEW ZEALAND BANKING GROUP LIMITED | ABN 11 005 357 522 |
“Our focus on the customer and productivity program coupled with momentum from our diversified growth opportunities has set us up for a good performance this year,” Mr Smith said.
PERFORMANCE BY DIVISION4
AUSTRALIA
Building on a strong performance in 2013, the Australia Division grew profit 5%, reflecting 4% income growth, a 2% increase in expenses and a 4% increase in the provision charge. Lending grew 6% with customer deposits up 7%.
ANZ had the strongest home loan growth of the major banks over the past year and has grown home loans at above system for 17 consecutive quarters. Small Business Banking has performed particularly strongly with lending up 16%. To date ANZ has lent $1.2 billion to new Australian small businesses as part of our $2 billion pledge, while maintaining credit quality.
Execution of the Banking on Australia program is building business momentum. Simpler products, streamlined processes and improving distribution capability has seen growth in customer numbers. We’ve brought 110,000 net new customers on board across Retail and Commercial in the last year while simultaneously reducing average monthly customer complaints by 9%.
Back office efficiency programs, increased training and iPad enablement have increased frontline Commercial team customer contact by 20%. ANZ is now equal first in Commercial customer satisfaction, up from fourth and customer numbers are up 26,000 year on year.
We have strengthened our position in mobile and digital channels. More than half our customers are digital users including 1.1 million active ANZ goMoney users with $78 billion in goMoney transactions processed to date and we have rolled out 400 Smart ATMs across the branch network. Commercial FastPay transactions have grown at a compound monthly rate of 43% since launch in October 2012.
INTERNATIONAL AND INSTITUTIONAL BANKING (IIB)5
International and Institutional Banking profit grew 9% with income up 4% and expenses up 3%, along with further credit quality improvements driving provisions down 18%. The business continues to diversify its earnings with 52% of income now coming from outside Australia and New Zealand and cash profit from APEA up 31%.
Ongoing focus on higher return less capital intensive flow products delivered volume increases in Foreign Exchange turnover (up 37%), Cash Management deposits (up 20%) and funded Trade and Supply Chain (up 6%).
The Global Markets business which services customers Foreign Exchange, Interest Rate management and Commodities needs, delivered another strong result with income up 5% primarily driven by customer sales. Income from servicing customers in Asia increased by 34% with particularly strong sales in Foreign Exchange.
Institutional and Commercial customer numbers grew 12%. Our strong relationship focus is being recognised in key customer surveys, including the Greenwich Associates 2013 Asian Large Corporate Banking Study in which ANZ has achieved the fastest growth in ranking in the study’s history and a consistent top 5 outcome over the past 3 years, including a top 4 in the last two years.6
Targeted growth in Asia Pacific is delivering a shorter duration, lower risk balance sheet with just under half of our Institutional lending assets in Asia Pacific being Trade Finance related.
NEW ZEALAND(all comparisons are in NZD)
The New Zealand Division grew profit 21%. Market share growth, productivity and credit quality improvements were key features of the result with income up 3%, expenses down 6% and the provision charge declining by $73 million. Lending grew 5% with customer deposits up 7%.
Under a single ANZ brand the business is now beginning to leverage its scale while also improving customer experience. Brand consideration is at an all time high and leads the major banks. ANZ is now number one for new mortgages in all of the larger New Zealand cities including Christchurch and Auckland.
| 4 | All comparisons are Half Year to 31 March 2014 compared to Half Year to 31 March 2013 and on a cash basis unless otherwise noted. |
| 5 | All figures are FX adjusted |
| 6 | Greenwich Associates 2013 Asian Large Corporate Banking Study |
4
| AUSTRALIA AND NEW ZEALAND BANKING GROUP LIMITED | ABN 11 005 357 522 |
Our Commercial business has grown across all regions with overall growth faster than system year to date. Small Business Banking has been particularly strong, up 14% driven by growth in customer numbers (up 29% on the prior year).
We are investing in digital capability to grow customer numbers and increase customer satisfaction and to improve our frontline capability and productivity. Active ANZ goMoney users are up 96% with the App rated the number one Finance app in both the Apple App store and on Google Play7. In Commercial, ANZ FastPay has had over 4,000 downloads since its launch in December 2013. Over the counter transactions in branches have reduced by 11% over the year as customers take advantage of our self service technology including Smart ATMs.
GLOBAL WEALTH
The Global Wealth Division grew profit 11% with operating income up 8% and expenses up 7%. Underlying performance was strong driven by growth in funds under management (FUM) and inforce insurance premiums, as well as an improved claims and lapse experience, with retail lapse rates in Australia declining a further 120 bps across the year.
Global Wealth is focused on making it easier for customers to connect, protect and grow their wealth using simple, direct solutions such as ANZ Smart Choice Super which now has over 270,000 customers and continues to build momentum. Wealth solutions are increasingly being integrated into broader customer banking options with wealth solutions held by ANZ customers up 10% across the year.
Private Wealth grew operating income by 28%, with customer deposits up 26% and lending up 4%.
CREDIT QUALITY
The quality of the loan book continues to strengthen with the provision charge of $528 million 12% lower.
Gross impaired assets decreased 23%. Impaired assets are down 32% over the last two years, and are lower than at any point since September 2008 despite 46% growth in the lending book in that time8. While ANZ continues to expect that the provision charge for FY14 will be around 10% lower than for FY139 it maintains a strong provision balance.
CAPITAL
ANZ remains well capitalised with an APRA Common Equity Tier One ratio at 31 March of 8.33% or 10.5% on an internationally harmonised Basel 3 basis.
DIVIDEND
The fully franked dividend of 83 cps, up 14%, equates to a payment of $2.3 billion to shareholders. The increased dividend reflects our stronger performance and a gradual rebalancing towards a more even split between the Interim and Final Dividend amounts, maintaining a payout ratio towards the upper end of the 65 to 70% of Cash Profit range.
| For media enquiries contact: | ||
| Paul Edwards | Stephen Ries | |
| Group GM, Corporate Communications | Head of Media Relations | |
| Tel: +61-3-8654 9999 or +61-434-070101 | Tel: +61-3-8654 3659 or +61-409-655551 | |
| Email:Paul.Edwards@anz.com | Email:Stephen.Ries@anz.com | |
| For investor and analyst enquiries contact: | ||
| Jill Craig | Ben Heath | |
| Group GM, Investor Relations | Senior Manager, Investor Relations | |
| Tel: +61-3-8654 7749 or +61-412-047448 | Tel: +61-3-8654 7793 or +61-435-655033 | |
| Email:Jill.Craig@anz.com | Email:Ben.Heath@anz.com | |
| 7 | Refers to the New Zealand App Store and Google Play sites. ANZ is the top ranked free finance App. |
| 8 | Net lending assets increased 46% from $349.85 billion to $509.25 billion between 30 September 2008 and 31 March 2014. |
| 9 | The ANZ Group Full Year 2013 provision charge was $1.197 billion. |
5
| AUSTRALIA AND NEW ZEALAND BANKING GROUP LIMITED | ABN 11 005 357 522 |
This page has been left blank intentionally
6
SNAPSHOT
CONTENTS
Section 2 – Snapshot
Statutory Profit Results | 8 | |||
Cash Profit Results | 9 | |||
Key Balance Sheet Metrics | 10 | |||
FX Adjusted - Cash Profit Results and Net Loans and Advances | 11 | |||
7
SNAPSHOT
Statutory Profit Results
| Half Year | Movement | |||||||||||||||||||
| Mar 14 $M | Sep 13 $M | Mar 13 $M | Mar 14 v. Sep 13 | Mar 14 v. Mar 13 | ||||||||||||||||
Net interest income | 6,778 | 6,558 | 6,200 | 3 | % | 9 | % | |||||||||||||
Other operating income | 2,740 | 2,965 | 2,736 | -8 | % | 0 | % | |||||||||||||
|
|
|
|
|
|
|
|
|
| |||||||||||
Operating income | 9,518 | 9,523 | 8,936 | 0 | % | 7 | % | |||||||||||||
Operating expenses | (4,286 | ) | (4,213 | ) | (4,044 | ) | 2 | % | 6 | % | ||||||||||
|
|
|
|
|
|
|
|
|
| |||||||||||
Profit before credit impairment and income tax | 5,232 | 5,310 | 4,892 | -1 | % | 7 | % | |||||||||||||
Credit impairment charge | (527 | ) | (600 | ) | (588 | ) | -12 | % | -10 | % | ||||||||||
|
|
|
|
|
|
|
|
|
| |||||||||||
Profit before income tax | 4,705 | 4,710 | 4,304 | 0 | % | 9 | % | |||||||||||||
Income tax expense | (1,318 | ) | (1,376 | ) | (1,362 | ) | -4 | % | -3 | % | ||||||||||
Non-controlling interests | (6 | ) | (5 | ) | (5 | ) | 20 | % | 20 | % | ||||||||||
|
|
|
|
|
|
|
|
|
| |||||||||||
Profit attributable to shareholders of the Company | 3,381 | 3,329 | 2,937 | 2 | % | 15 | % | |||||||||||||
|
|
|
|
|
|
|
|
|
| |||||||||||
Earnings per ordinary share (cents)
| Half Year | Movement | |||||||||||||||||||||
Reference Page | Mar 14 | Sep 13 | Mar 13 | Mar 14 v. Sep 13 | Mar 14 v. Mar 13 | |||||||||||||||||
Basic | 105 | 124.4 | 122.5 | 108.5 | 2 | % | 15 | % | ||||||||||||||
Diluted | 105 | 120.2 | 118.5 | 105.3 | 1 | % | 14 | % | ||||||||||||||
| Half Year | ||||||||||||||
| Ordinary share dividends (cents) | Reference Page | Mar 14 | Sep 13 | Mar 13 | ||||||||||
Interim - 100% franked1 | 104 | 83 | n/a | 73 | ||||||||||
Final - 100% franked1 | 104 | n/a | 91 | n/a | ||||||||||
Ordinary share dividend payout ratio2 | 104 | 67.4 | % | 75.1 | % | 68.3 | % | |||||||
Preference share dividend ($M) | ||||||||||||||
Dividend paid3 | 104 | 3 | 3 | 3 | ||||||||||
Profitability ratios | ||||||||||||||
Return on average ordinary shareholders’ equity4 | 15.0 | % | 15.3 | % | 14.4 | % | ||||||||
Return on average assets | 0.92 | % | 0.95 | % | 0.90 | % | ||||||||
Net interest margin | 2.15 | % | 2.20 | % | 2.24 | % | ||||||||
Efficiency ratios | ||||||||||||||
Operating expenses to operating income | 45.0 | % | 44.2 | % | 45.3 | % | ||||||||
Operating expenses to average assets | 1.17 | % | 1.21 | % | 1.24 | % | ||||||||
Credit impairment charge/(release) | ||||||||||||||
Individual credit impairment charge ($M) | 601 | 574 | 584 | |||||||||||
Collective credit impairment charge/(release) ($M) | (74 | ) | 26 | 4 | ||||||||||
|
|
|
|
|
| |||||||||
Total credit impairment charge ($M) | 107 | 527 | 600 | 588 | ||||||||||
Individual credit impairment charge as a % of average net advances | 0.24 | % | 0.24 | % | 0.26 | % | ||||||||
Total credit impairment charge as a % of average net advances | 0.21 | % | 0.25 | % | 0.27 | % | ||||||||
|
|
|
|
|
| |||||||||
| 1. | Fully franked for Australian tax purposes and carry New Zealand imputation credits of NZD 10 cents per ordinary share for the proposed 2014 interim dividend (2013 final dividend: NZD 10 cents; 2013 interim dividend: NZD 9 cents). |
| 2. | Dividend payout ratio is calculated using 2013 interim, 2013 final dividends and the proposed 2014 interim dividend. |
| 3. | Represents dividends paid on Euro Trust Securities (preference shares) issued on 13 December 2004. |
| 4. | Average ordinary shareholders’ equity excludes non-controlling interests and preference shares. |
8
SNAPSHOT
Cash Profit Results1
| Half Year | Movement | |||||||||||||||||||
Mar 14 $M | Sep 13 $M | Mar 13 $M | Mar 14 v. Sep 13 | Mar 14 v. Mar 13 | ||||||||||||||||
Net interest income | 6,764 | 6,536 | 6,236 | 3 | % | 8 | % | |||||||||||||
Other operating income | 2,904 | 2,763 | 2,856 | 5 | % | 2 | % | |||||||||||||
|
|
|
|
|
|
|
|
|
| |||||||||||
Operating income | 9,668 | 9,299 | 9,092 | 4 | % | 6 | % | |||||||||||||
Operating expenses | (4,286 | ) | (4,213 | ) | (4,044 | ) | 2 | % | 6 | % | ||||||||||
|
|
|
|
|
|
|
|
|
| |||||||||||
Profit before credit impairment and income tax | 5,382 | 5,086 | 5,048 | 6 | % | 7 | % | |||||||||||||
Credit impairment charge | (528 | ) | (598 | ) | (599 | ) | -12 | % | -12 | % | ||||||||||
|
|
|
|
|
|
|
|
|
| |||||||||||
Profit before income tax | 4,854 | 4,488 | 4,449 | 8 | % | 9 | % | |||||||||||||
Income tax expense | (1,333 | ) | (1,170 | ) | (1,265 | ) | 14 | % | 5 | % | ||||||||||
Non-controlling interests | (6 | ) | (5 | ) | (5 | ) | 20 | % | 20 | % | ||||||||||
|
|
|
|
|
|
|
|
|
| |||||||||||
Cash profit1 | 3,515 | 3,313 | 3,179 | 6 | % | 11 | % | |||||||||||||
|
|
|
|
|
|
|
|
|
| |||||||||||
| Earnings per ordinary share (cents) | Half Year | Movement | ||||||||||||||||||||
| Reference Page | Mar 14 | Sep 13 | Mar 13 | Mar 14 v. Sep 13 | Mar 14 v. Mar 13 | |||||||||||||||||
Basic | 30 | 128.7 | 121.4 | 116.9 | 6 | % | 10 | % | ||||||||||||||
Diluted | 30 | 124.3 | 117.4 | 113.1 | 6 | % | 10 | % | ||||||||||||||
| Half Year | ||||||||||||||
| Ordinary share dividends (cents) | Reference Page | Mar 14 | Sep 13 | Mar 13 | ||||||||||
Ordinary share dividend payout ratio2 | 31 | 64.9 | % | 75.4 | % | 63.1 | % | |||||||
|
|
|
|
|
| |||||||||
Profitability ratios | ||||||||||||||
Return on average ordinary shareholders’ equity3 | 15.5 | % | 15.1 | % | 15.5 | % | ||||||||
Return on average assets | 0.96 | % | 0.95 | % | 0.97 | % | ||||||||
Net interest margin | 19 | 2.15 | % | 2.19 | % | 2.25 | % | |||||||
Profit per average FTE ($)4 | 73,266 | 67,972 | 62,429 | |||||||||||
|
|
|
|
|
| |||||||||
Efficiency ratios | ||||||||||||||
Operating expenses to operating income | 44.3 | % | 45.3 | % | 44.5 | % | ||||||||
Operating expenses to average assets | 1.17 | % | 1.21 | % | 1.23 | % | ||||||||
|
|
|
|
|
| |||||||||
Credit impairment charge/(release) | ||||||||||||||
Individual credit impairment charge ($M) | 25 | 602 | 572 | 595 | ||||||||||
Collective credit impairment charge/(release) ($M) | 26 | (74 | ) | 26 | 4 | |||||||||
|
|
|
|
|
| |||||||||
Total credit impairment charge ($M) | 25 | 528 | 598 | 599 | ||||||||||
Individual credit impairment charge as a % of average net advances | 0.24 | % | 0.24 | % | 0.27 | % | ||||||||
Total credit impairment charge as a % of average net advances | 0.21 | % | 0.25 | % | 0.27 | % | ||||||||
|
|
|
|
|
| |||||||||
| Cash profit by division/geography | Half Year | Movement | ||||||||||||||||||
Mar 14 $M | Sep 13 $M | Mar 13 $M | Mar 14 v. Sep 13 | Mar 14 v. Mar 13 | ||||||||||||||||
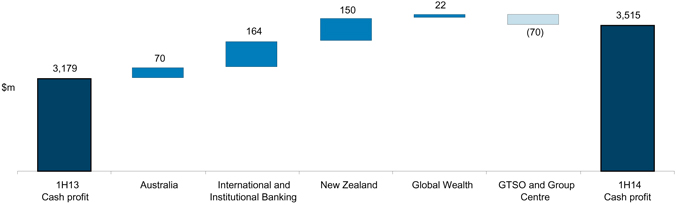
Australia | 1,479 | 1,449 | 1,409 | 2 | % | 5 | % | |||||||||||||
International and Institutional Banking | 1,372 | 1,244 | 1,208 | 10 | % | 14 | % | |||||||||||||
New Zealand | 546 | 482 | 396 | 13 | % | 38 | % | |||||||||||||
Global Wealth | 226 | 268 | 204 | -16 | % | 11 | % | |||||||||||||
GTSO and Group Centre | (108 | ) | (130 | ) | (38 | ) | -17 | % | large | |||||||||||
|
|
|
|
|
|
|
|
|
| |||||||||||
Cash profit by division | 3,515 | 3,313 | 3,179 | 6 | % | 11 | % | |||||||||||||
|
|
|
|
|
|
|
|
|
| |||||||||||
Australia | 2,025 | 2,136 | 2,164 | -5 | % | -6 | % | |||||||||||||
Asia Pacific, Europe & America | 681 | 554 | 459 | 23 | % | 48 | % | |||||||||||||
New Zealand | 809 | 623 | 556 | 30 | % | 46 | % | |||||||||||||
|
|
|
|
|
|
|
|
|
| |||||||||||
Cash profit by geography | 3,515 | 3,313 | 3,179 | 6 | % | 11 | % | |||||||||||||
|
|
|
|
|
|
|
|
|
| |||||||||||
| 1. | Statutory profit has been adjusted to exclude non-core items to arrive at cash profit, and has been provided to assist readers to understand the result for the ongoing business activities of the Group. Refer to page 83 for the reconciliation between statutory and cash profit. |
| 2. | Dividend payout ratio is calculated using 2013 interim, 2013 final dividends and the proposed 2014 interim dividend. |
| 3. | Average ordinary shareholders’ equity excludes non-controlling interests and preference shares. |
| 4. | Comparative information has been restated to include technology contractors, consistent with how FTE are reported and managed internally. |
9
SNAPSHOT
Key Balance Sheet Metrics
| As at | Movement | |||||||||||||||||||||
| Reference Page | Mar 14 | Sep 13 | Mar 13 | Mar 14 v. Sep 13 | Mar 14 v. Mar 13 | |||||||||||||||||
Capital adequacy ratio (%) | ||||||||||||||||||||||
Common Equity Tier 1 | ||||||||||||||||||||||
- APRA Basel 3 | 35 | 8.3 | % | 8.5 | % | 8.2 | % | |||||||||||||||
- Internationally Harmonised Basel 31 | 35 | 10.5 | % | 10.8 | % | 10.3 | % | |||||||||||||||
Credit risk weighted assets ($B) | 135 | 305.3 | 287.7 | 275.0 | 6 | % | 11 | % | ||||||||||||||
Total risk weighted assets ($B) | 135 | 360.7 | 339.3 | 322.6 | 6 | % | 12 | % | ||||||||||||||
|
|
|
|
|
|
|
|
|
| |||||||||||||
Balance Sheet: Key Items | ||||||||||||||||||||||
Gross loans & advances ($B) | 512.4 | 486.9 | 457.6 | 5 | % | 12 | % | |||||||||||||||
Net loans & advances ($B) | 509.3 | 483.3 | 454.3 | 5 | % | 12 | % | |||||||||||||||
Total assets ($B) | 737.8 | 703.0 | 672.6 | 5 | % | 10 | % | |||||||||||||||
Customer deposits ($B) | 388.0 | 368.8 | 344.1 | 5 | % | 13 | % | |||||||||||||||
Total equity ($B) | 47.0 | 45.6 | 42.5 | 3 | % | 11 | % | |||||||||||||||
|
|
|
|
|
|
|
|
|
| |||||||||||||
Impaired assets | ||||||||||||||||||||||
Gross impaired assets ($M) | 27 | 3,620 | 4,264 | 4,685 | -15 | % | -23 | % | ||||||||||||||
Net impaired assets ($M) | 27 | 2,150 | 2,797 | 3,142 | -23 | % | -32 | % | ||||||||||||||
Net impaired assets as a % of net advances | 0.42 | % | 0.58 | % | 0.69 | % | ||||||||||||||||
Net impaired assets as a % of shareholders’ equity | 4.6 | % | 6.1 | % | 7.4 | % | ||||||||||||||||
Individual provision ($M) | 107 | 1,470 | 1,467 | 1,543 | 0 | % | -5 | % | ||||||||||||||
Individual provision as a % of gross impaired assets | 40.6 | % | 34.4 | % | 32.9 | % | ||||||||||||||||
Collective provision ($M) | 107 | 2,843 | 2,887 | 2,769 | -2 | % | 3 | % | ||||||||||||||
Collective provision as a % of credit risk weighted assets | 0.93 | % | 1.00 | % | 1.01 | % | ||||||||||||||||
|
|
|
|
|
|
|
|
|
| |||||||||||||
Net Assets | ||||||||||||||||||||||
Net tangible assets per ordinary share ($) | 13.90 | 13.48 | 12.55 | 3 | % | 11 | % | |||||||||||||||
Net tangible assets attributable to ordinary shareholders ($B) | 38.1 | 37.0 | 34.4 | 3 | % | 11 | % | |||||||||||||||
|
|
|
|
|
|
|
|
|
| |||||||||||||
Other information | ||||||||||||||||||||||
Full time equivalent staff (FTE)2 | 48,857 | 48,865 | 48,871 | 0 | % | 0 | % | |||||||||||||||
Assets per FTE ($M) | 15.1 | 14.4 | 13.8 | 5 | % | 9 | % | |||||||||||||||
Share price | ||||||||||||||||||||||
- high | $ | 34.06 | $ | 32.09 | $ | 29.46 | 6 | % | 16 | % | ||||||||||||
- low | $ | 28.84 | $ | 26.30 | $ | 23.42 | 10 | % | 23 | % | ||||||||||||
- closing | $ | 33.06 | $ | 30.78 | $ | 28.53 | 7 | % | 16 | % | ||||||||||||
Market capitalisation of ordinary shares ($B) | 90.7 | 84.5 | 78.3 | 7 | % | 16 | % | |||||||||||||||
|
|
|
|
|
|
|
|
|
| |||||||||||||
| 1. | ANZ’s interpretation of the regulations documented in the Basel Committee publications; “Basel 3: A global regulatory framework for more resilient banks and banking systems” (June 2011) and “International Convergence of Capital Measurement and Capital Standards” (June 2006). See page 36 for a reconciliation between APRA Basel 3 and Internationalised harmonised Basel 3 standards. |
| 2. | Comparative information has been restated to include technology contractors, consistent with how FTE are reported and managed internally. |
| Net loans & advances by division/geography | As at ($B) | Movement | ||||||||||||||||||
| Mar 14 | Sep 13 | Mar 13 | Mar 14 v. Sep 13 | Mar 14 v. Mar 13 | ||||||||||||||||
Australia | 278.3 | 271.6 | 262.0 | 2 | % | 6 | % | |||||||||||||
International and Institutional Banking | 136.3 | 123.5 | 114.5 | 10 | % | 19 | % | |||||||||||||
New Zealand | 88.2 | 81.5 | 71.7 | 8 | % | 23 | % | |||||||||||||
Global Wealth | 6.0 | 6.2 | 5.8 | -3 | % | 3 | % | |||||||||||||
GTSO and Group Centre | 0.5 | 0.5 | 0.3 | 0 | % | 67 | % | |||||||||||||
|
|
|
|
|
|
|
|
|
| |||||||||||
Net loans & advances by division | 509.3 | 483.3 | 454.3 | 5 | % | 12 | % | |||||||||||||
|
|
|
|
|
|
|
|
|
| |||||||||||
Australia | 336.5 | 324.3 | 314.6 | 4 | % | 7 | % | |||||||||||||
Asia Pacific, Europe & America | 76.6 | 69.9 | 61.2 | 10 | % | 25 | % | |||||||||||||
New Zealand | 96.2 | 89.1 | 78.5 | 8 | % | 23 | % | |||||||||||||
|
|
|
|
|
|
|
|
|
| |||||||||||
Net loans & advances by geography | 509.3 | 483.3 | 454.3 | 5 | % | 12 | % | |||||||||||||
|
|
|
|
|
|
|
|
|
| |||||||||||
10
SNAPSHOT
FX Adjusted1– Cash Profit Results and Net Loans and Advances
Cash profit - FX adjusted
| Half Year | Movement | |||||||||||||||||||
Mar 14 $M | Sep 13 $M | Mar 13 $M | Mar 14 v. Sep 13 | Mar 14 v. Mar 13 | ||||||||||||||||
Net interest income | 6,764 | 6,640 | 6,459 | 2 | % | 5 | % | |||||||||||||
Other operating income | 2,904 | 2,769 | 2,876 | 5 | % | 1 | % | |||||||||||||
|
|
|
|
|
|
|
|
|
| |||||||||||
Operating income | 9,668 | 9,409 | 9,335 | 3 | % | 4 | % | |||||||||||||
Operating expenses | (4,286 | ) | (4,280 | ) | (4,213 | ) | 0 | % | 2 | % | ||||||||||
|
|
|
|
|
|
|
|
|
| |||||||||||
Profit before credit impairment and income tax | 5,382 | 5,129 | 5,122 | 5 | % | 5 | % | |||||||||||||
Credit impairment charge | (528 | ) | (596 | ) | (615 | ) | -11 | % | -14 | % | ||||||||||
|
|
|
|
|
|
|
|
|
| |||||||||||
Profit before income tax | 4,854 | 4,533 | 4,507 | 7 | % | 8 | % | |||||||||||||
Income tax expense | (1,333 | ) | (1,180 | ) | (1,266 | ) | 13 | % | 5 | % | ||||||||||
Non-controlling interests | (6 | ) | (5 | ) | (5 | ) | 20 | % | 20 | % | ||||||||||
|
|
|
|
|
|
|
|
|
| |||||||||||
Cash profit (FX adjusted) | 3,515 | 3,348 | 3,236 | 5 | % | 9 | % | |||||||||||||
|
|
|
|
|
|
|
|
|
| |||||||||||
| Cash profit - FX adjusted by division and geography | Half Year | Movement | ||||||||||||||||||
Mar 14 $M | Sep 13 $M | Mar 13 $M | Mar 14 v. Sep 13 | Mar 14 v. Mar 13 | ||||||||||||||||
Australia | 1,479 | 1,449 | 1,409 | 2 | % | 5 | % | |||||||||||||
International and Institutional Banking | 1,372 | 1,256 | 1,264 | 9 | % | 9 | % | |||||||||||||
New Zealand | 546 | 515 | 443 | 6 | % | 23 | % | |||||||||||||
Global Wealth | 226 | 270 | 209 | -16 | % | 8 | % | |||||||||||||
GTSO and Group Centre | (108 | ) | (142 | ) | (89 | ) | -24 | % | 21 | % | ||||||||||
|
|
|
|
|
|
|
|
|
| |||||||||||
Cash profit - FX adjusted by division | 3,515 | 3,348 | 3,236 | 5 | % | 9 | % | |||||||||||||
|
|
|
|
|
|
|
|
|
| |||||||||||
Australia | 2,025 | 2,117 | 2,098 | -4 | % | -3 | % | |||||||||||||
Asia Pacific, Europe & America | 681 | 561 | 501 | 21 | % | 36 | % | |||||||||||||
New Zealand | 809 | 670 | 637 | 21 | % | 27 | % | |||||||||||||
|
|
|
|
|
|
|
|
|
| |||||||||||
Cash profit - FX adjusted by geography | 3,515 | 3,348 | 3,236 | 5 | % | 9 | % | |||||||||||||
|
|
|
|
|
|
|
|
|
| |||||||||||
| Net loans & advances by division/geography - FX adjusted | As at ($B) | Movement | ||||||||||||||||||
| Mar 14 | Sep 13 | Mar 13 | Mar 14 v. Sep 13 | Mar 14 v. Mar 13 | ||||||||||||||||
Australia | 278.3 | 271.6 | 262.1 | 2 | % | 6 | % | |||||||||||||
International and Institutional Banking | 136.3 | 124.1 | 122.2 | 10 | % | 12 | % | |||||||||||||
New Zealand | 88.2 | 85.9 | 83.8 | 3 | % | 5 | % | |||||||||||||
Global Wealth | 6.0 | 6.3 | 6.2 | -5 | % | -3 | % | |||||||||||||
GTSO and Group Centre | 0.5 | 0.4 | 0.3 | 25 | % | 67 | % | |||||||||||||
|
|
|
|
|
|
|
|
|
| |||||||||||
Net loans & advances by division - FX adjusted | 509.3 | 488.3 | 474.6 | 4 | % | 7 | % | |||||||||||||
|
|
|
|
|
|
|
|
|
| |||||||||||
Australia | 336.5 | 324.3 | 314.6 | 4 | % | 7 | % | |||||||||||||
Asia Pacific, Europe & America | 76.6 | 70.2 | 68.3 | 9 | % | 12 | % | |||||||||||||
New Zealand | 96.2 | 93.8 | 91.7 | 2 | % | 5 | % | |||||||||||||
|
|
|
|
|
|
|
|
|
| |||||||||||
Net loans & advances by geography - FX adjusted | 509.3 | 488.3 | 474.6 | 4 | % | 7 | % | |||||||||||||
|
|
|
|
|
|
|
|
|
| |||||||||||
| 1. | Comparative period data has been adjusted to remove the impact of foreign exchange movements. |
11
SNAPSHOT
This page has been left blank intentionally
12
CEO OVERVIEW
CEO Overview1
Strategy and Performance
ANZ is executing a focused strategy to build the best connected, most respected bank across the Asia Pacific region, and in doing so provide shareholders with above-peer earnings growth.
The bank is pursuing significant organic growth opportunities in the Asia Pacific region, and with our strong domestic businesses in Australia and New Zealand, our distinctive footprint and super regional connectivity, we are uniquely positioned to meet the needs of customers, who are increasingly linked to regional capital, trade and wealth flows.
This half our differentiated strategy delivered a cash profit of $3.5 billion, up 11% from $3.2 billion over the prior corresponding period, and 6% on the half, with a Return on Equity of 15.5%, earnings per share of $1.287 cents and a fully-franked dividend per share of 83 cents. This result was driven by 6% revenue growth and 6% expense growth on a cash basis, and a 12% reduction in provisions. Total shareholder returns for the past twelve months were 19%.
Pleasingly, profits sourced from the Asia Pacific region increased to 25% of total Group profits putting the Group within range of its stated target of achieving 25-30% of profit driven by network revenue by 2017. While ANZ has ongoing growth aspirations in the region, we are now sufficiently advanced with our strategy to place a greater emphasis on improving returns, hence the goal to lift Group RoE to 16% or above by 2016 in part driven by improving returns outside Australia and New Zealand.
Strategic Progress
While economic conditions across the Asia Pacific region remain more robust by comparison to much of the rest of the world, conditions for banking remain challenging – particularly for institutional banking where relatively subdued economic conditions and margin compression have impacted growth.
Within that environment, management continued to focus on balancing the need for investment to meet the needs of our customers and drive longer-term growth, and the need to generate attractive returns for our shareholders in the near-term. This has been achieved by focusing on both productivity initiatives and capital management to improve returns and support strong EPS growth.
| • | We are building stronger positions in our home markets of Australia and New Zealand, led by further gains in productivity and market share, and further penetration of Wealth products into our existing customer base in these markets. |
| • | We have continued to build Asia quickly, focused on intermediating the fast growing trade and capital flows in the region with particular emphasis on regional treasury centres like Hong Kong and Singapore and products like Trade, FX and Cash Management for Institutional customers. Notable achievements include 52% of International and Institutional Banking profit now coming from outside Australia and New Zealand; and significant increases in volume for higher return less capital intensive flow products like Foreign Exchange (up 37%), Cash Management Deposits (up 20%) and funded Trade and Supply Chain (up 6%). |
| • | Our Operations and Technology functions continue to deliver economies of scale, speed to market and a stronger control environment to the business, particularly from our regional hubs and our use of common platforms and processes, resulting in lower unit costs, better quality and lower risk. While average volumes increased by 8% over the past year, operations expenses reduced 4% (fx adjusted) on the prior comparative period. |
| • | The Group generated around $1.9 billion of additional capital over the year, and remains well capitalised with a Common Equity Tier 1 ratio of 10.5% at 31 March 2014 on a Basel 3 harmonised basis, or 8.3% under APRA’s Basel 3 standards. Customer funding remained stable at 62% of total funding. |
| • | Gross impaired assets reduced both HOH and PCP, and the Group’s coverage ratios remain strong with CP to CRWA at 0.93% and the total provision ratio at 1.41%. |
| • | Finally, we focused on strengthening management depth and the alignment between business, operations, support and technology. |
Medium to Long Term Strategic Goals
ANZ is committed to delivering strong total shareholder returns and above-peer earnings growth over the business cycle, targeting a Group cost to income ratio below 43% and return on equity above 16% by 2016. The target dividend payout ratio remains at 65-70% of cash profit, which we believe to be a sustainable level in a Basel 3 environment.
To do this we will continue to:
| • | Strengthen our position in our core markets of Australia and New Zealand by growing our Retail and Commercial operations, driving productivity benefits, leveraging our super regional strategy and using technology to drive better functionality. |
| • | In Australia, we are transforming the way we serve our customers by investing in physical, mobile and digital channels to support our retail customers, by increasing sales capacity to support our business banking customers, and by investing in customer analytics. |
| • | In New Zealand, we will work under one brand on one platform with more efficient market coverage. |
| • | Focus our Asian expansion primarily on Institutional Banking, supporting our Australian and New Zealand customers, targeting profitable markets and segments in which we have expertise and which are connected through trade and capital flows. |
| • | Achieve greater efficiency and control through the use of scalable common infrastructure and platforms. |
| • | Maintain strong liquidity and actively manage capital to enhance ROE. |
| • | Build on our Super Regional capabilities – utilising our management bench-strength and continuing to deepen our international talent pool. |
| • | Apply strict criteria when reviewing existing investment and new inorganic opportunities. |
| 1 | The CEO Overview is reported on a cash basis |
13
| CEO OVERVIEW |
This page has been left blank intentionally
14
CFO OVERVIEW
CONTENTS
Section 4 – CFO Overview
Cash profit | 16 | |||
Divisional performance | 17 | |||
Review of Group results | 19 | |||
Credit risk | 25 | |||
Income and expenses | 19 | |||
Income tax expense | 29 | |||
Impact of exchange rate movements/revenue hedges | 29 | |||
Earnings per share and dividends | 30-31 | |||
Economic profit | 31 | |||
Balance sheet, liquidity and capital | 32 | |||
Deferred acquisition costs and deferred income | 37 | |||
Investment spend | 38 | |||
Software capitalisation | 39 | |||
15
CFO OVERVIEW
Non-IFRS information
The Group provides two additional measures of performance in the Results Announcement which are prepared on a basis other than in accordance with accounting standards – cash profit and economic profit. The guidance provided in Australian Securities and Investments Commission Regulatory Guide 230 has been followed when presenting this information.
Cash profit
Statutory profit has been adjusted to exclude non-core items to arrive at cash profit, and has been provided to assist readers to understand the results for the ongoing business activities of the Group. The adjustments made in arriving at cash profit are included in statutory profit which is subject to review within the context of the external auditor’s review of the Condensed Consolidated Financial Statements. Cash profit is not subject to review by the external auditor, however, the external auditor has informed the Audit Committee that the adjustments have been determined on a consistent basis across each period presented.
The CFO Overview is reported on a cash basis.
| Half Year | Movement | |||||||||||||||||||
| Mar 14 $M | Sep 13 $M | Mar 13 $M | Mar 14 v. Sep 13 | Mar 14 v. Mar 13 | ||||||||||||||||
Statutory profit attributable to shareholders of the Company | 3,381 | 3,329 | 2,937 | 2 | % | 15 | % | |||||||||||||
Adjustments between statutory profit and cash profit1 | 134 | (16 | ) | 242 | large | -45 | % | |||||||||||||
|
|
|
|
|
|
|
|
|
| |||||||||||
Cash profit | 3,515 | 3,313 | 3,179 | 6 | % | 11 | % | |||||||||||||
|
|
|
|
|
|
|
|
|
| |||||||||||
| Half Year | Movement | |||||||||||||||||||
| Mar 14 $M | Sep 13 $M | Mar 13 $M | Mar 14 v. Sep 13 | Mar 14 v. Mar 13 | ||||||||||||||||
Adjustments between statutory profit and cash profit1 | ||||||||||||||||||||
Treasury shares adjustment | 37 | 31 | 53 | 19 | % | -30 | % | |||||||||||||
Revaluation of policy liabilities | (3 | ) | 27 | 19 | large | large | ||||||||||||||
Economic hedging | 89 | (205 | ) | 192 | large | -54 | % | |||||||||||||
Revenue and net investment hedges | 18 | 143 | 16 | -87 | % | 13 | % | |||||||||||||
Structured credit intermediation trades | (7 | ) | (12 | ) | (38 | ) | -42 | % | -82 | % | ||||||||||
|
|
|
|
|
|
|
|
|
| |||||||||||
Total adjustments between statutory profit and cash profit1 | 134 | (16 | ) | 242 | large | -45 | % | |||||||||||||
|
|
|
|
|
|
|
|
|
| |||||||||||
1. Refer to pages 83 to 92 for analysis of the reconciliation of statutory profit to cash profit. |
| |||||||||||||||||||
Cash Profit1
|
| |||||||||||||||||||
| Half Year | Movement | |||||||||||||||||||
| Mar 14 $M | Sep 13 $M | Mar 13 $M | Mar 14 v. Sep 13 | Mar 14 v. Mar 13 | ||||||||||||||||
Net interest income | 6,764 | 6,536 | 6,236 | 3 | % | 8 | % | |||||||||||||
Other operating income | 2,904 | 2,763 | 2,856 | 5 | % | 2 | % | |||||||||||||
|
|
|
|
|
|
|
|
|
| |||||||||||
Operating income | 9,668 | 9,299 | 9,092 | 4 | % | 6 | % | |||||||||||||
Operating expenses | (4,286 | ) | (4,213 | ) | (4,044 | ) | 2 | % | 6 | % | ||||||||||
|
|
|
|
|
|
|
|
|
| |||||||||||
Profit before credit impairment and income tax | 5,382 | 5,086 | 5,048 | 6 | % | 7 | % | |||||||||||||
Credit impairment charge | (528 | ) | (598 | ) | (599 | ) | -12 | % | -12 | % | ||||||||||
|
|
|
|
|
|
|
|
|
| |||||||||||
Profit before income tax | 4,854 | 4,488 | 4,449 | 8 | % | 9 | % | |||||||||||||
Income tax expense | (1,333 | ) | (1,170 | ) | (1,265 | ) | 14 | % | 5 | % | ||||||||||
Non-controlling interests | (6 | ) | (5 | ) | (5 | ) | 20 | % | 20 | % | ||||||||||
|
|
|
|
|
|
|
|
|
| |||||||||||
Cash profit | 3,515 | 3,313 | 3,179 | 6 | % | 11 | % | |||||||||||||
|
|
|
|
|
|
|
|
|
| |||||||||||
1. Refer to page 29 for the impact of exchange rates and revenue hedges on cash profit. |
| |||||||||||||||||||
16
CFO OVERVIEW
Divisional performance
There have been no major changes to Divisional segments since 30 September 2013, however certain amounts in the comparatives have been reclassified to conform with current period financial statement presentations.
| Half Year | Movement | |||||||||||||||||||
| Cash profit by division | Mar 14 $M | Sep 13 $M | Mar 13 $M | Mar 14 v. Sep 13 | Mar 14 v. Mar 13 | |||||||||||||||
Australia | 1,479 | 1,449 | 1,409 | 2 | % | 5 | % | |||||||||||||
International and Institutional Banking | 1,372 | 1,244 | 1,208 | 10 | % | 14 | % | |||||||||||||
New Zealand | 546 | 482 | 396 | 13 | % | 38 | % | |||||||||||||
Global Wealth | 226 | 268 | 204 | -16 | % | 11 | % | |||||||||||||
GTSO and Group Centre | (108 | ) | (130 | ) | (38 | ) | -17 | % | large | |||||||||||
|
|
|
|
|
|
|
|
|
| |||||||||||
Cash profit/(loss) by division | 3,515 | 3,313 | 3,179 | 6 | % | 11 | % | |||||||||||||
|
|
|
|
|
|
|
|
|
| |||||||||||
Cash profit by division – March 2014 Half Year v March 2013 Half Year
| • | March 2014 half year v March 2013 half year |
Australia
| • | Profit increased 5% primarily due to a 7% increase in average net loans and advances, partially offset by a 4% increase in credit impairment charges, higher operating expenses from the investment in the ‘Banking on Australia’ program and a 5 bp contraction in net interest margin. |
International and Institutional Banking
| • | Profit increased 14% due to stronger operating income in Global Markets (primarily from strong customer demand for foreign exchange and commodity products in Asia) and Transaction Banking, volume driven income growth from both Retail Asia Pacific and Asia Partnerships, and lower credit impairment charges, partially offset by 10% growth in operating expenses. Excluding the impact of favourable foreign exchange translations, profit was up 9%. |
New Zealand
| • | Profit increased 38% primarily due to above system growth in mortgages, a reduction in credit impairment charges (reflecting strong improvements in credit quality across the lending book), a 6% decrease in operating expenses and favourable foreign exchange translation. |
Global Wealth
| • | Profit increased 11% primarily due to higher funds management operating income (average funds under management (FUM) increased 14%), strong income growth in Private Wealth (strong growth in average customer deposits and loans and advances), partially offset by a decline in insurance income and higher operating expenses from strategic growth initiatives and regulatory spend. |
GTSO and Group Centre
| • | Net loss increased $70 million primarily due to realised losses from hedges of Group foreign currency revenues (offsetting translation gains elsewhere in the Group) and annual salary increases. |
| • | March 2014 half year v September 2013 half year |
Australia
| • | Profit increased 2% primarily due to a 3% increase in average net loans and advances and a 7% decrease in credit impairment charges, partially offset by 1% uplift in expenses and a 3 bp contraction in net interest margin. |
International and Institutional Banking
| • | Profit increased 10% due to stronger operating income in Global Markets (primarily from stronger customer demand for foreign exchange and commodity products in Asia) and volume driven income growth in Retail Asia Pacific and Asia Partnerships, partially offset by 4% growth in operating expenses and higher credit impairment charges. |
17
CFO OVERVIEW
New Zealand
| • | Profit increased 13% primarily due to solid growth in mortgages and small business banking, a significant reduction in credit impairment charges (reflecting strong improvements in credit quality across the lending book), a 1% decrease in operating expenses and favourable foreign exchange translation. |
Global Wealth
| • | Profit decreased 16% mainly due to a favourable one off tax consolidation adjustment in the September 2013 half. Profit before tax increased 9% driven by strong growth in Private Wealth operating income (mainly from customer deposits) and higher funds management income (reflecting 7% average FUM growth), partially offset by lower insurance operating income and higher operating expenses from strategic growth initiatives and regulatory spend. |
GTSO and Group Centre
| • | Net loss decreased 17% primarily due to lower restructuring costs in the current period, partially offset by higher realised losses from hedges of Group foreign currency revenues (offsetting translation gains elsewhere in the Group). |
Refer to Section 5 – Segment Review on pages 41 to 74 for further details
18
CFO OVERVIEW
Review of Group results
Income and expenses
Net interest income
| Half Year | Movement | |||||||||||||||||||
| Group | Mar 14 $M | Sep 13 $M | Mar 13 $M | Mar 14 v. Sep 13 | Mar 14 v. Mar 13 | |||||||||||||||
Cash net interest income | 6,764 | 6,536 | 6,236 | 3 | % | 8 | % | |||||||||||||
Average interest earning assets | 632,400 | 595,998 | 556,264 | 6 | % | 14 | % | |||||||||||||
Average deposit and other borrowings | 498,484 | 466,261 | 433,780 | 7 | % | 15 | % | |||||||||||||
Net interest margin (%) - cash | 2.15 | 2.19 | 2.25 | -4 bps | -10 bps | |||||||||||||||
Group (excluding Global Markets) | ||||||||||||||||||||
Cash net interest income | 6,241 | 6,095 | 5,860 | 2 | % | 7 | % | |||||||||||||
Average interest earning assets | 492,602 | 466,006 | 440,110 | 6 | % | 12 | % | |||||||||||||
Average deposit and other borrowings | 381,118 | 360,113 | 334,212 | 6 | % | 14 | % | |||||||||||||
Net interest margin (%) - cash | 2.54 | 2.61 | 2.67 | -7 bps | -13 bps | |||||||||||||||
| Half Year | Movement | |||||||||||||||||||
| Cash net interest margin by major division | Mar 14 $M | Sep 13 $M | Mar 13 $M | Mar 14 v. Sep 13 | Mar 14 v. Mar 13 | |||||||||||||||
Australia | ||||||||||||||||||||
Net interest margin (%) | 2.48 | 2.51 | 2.53 | -3 bps | -5 bps | |||||||||||||||
Average interest earning assets ($M) | 276,779 | 268,795 | 259,721 | 3 | % | 7 | % | |||||||||||||
Average deposits and other borrowings ($M) | 155,314 | 148,675 | 144,277 | 4 | % | 8 | % | |||||||||||||
International and Institutional Banking | ||||||||||||||||||||
Net interest margin (%) | 1.55 | 1.58 | 1.65 | -3 bps | -10 bps | |||||||||||||||
Average interest earning assets ($M) | 258,222 | 240,370 | 216,536 | 7 | % | 19 | % | |||||||||||||
Average deposits and other borrowings ($M) | 216,062 | 195,535 | 182,389 | 10 | % | 18 | % | |||||||||||||
New Zealand | ||||||||||||||||||||
Net interest margin (%) | 2.48 | 2.49 | 2.50 | -1 bp | -2 bps | |||||||||||||||
Average interest earning assets ($M) | 85,864 | 77,786 | 71,497 | 10 | % | 20 | % | |||||||||||||
Average deposits and other borrowings ($M) | 54,516 | 48,311 | 45,023 | 13 | % | 21 | % | |||||||||||||
Group net interest margin – March 2014 Half Year v March 2013 Half Year
| • | March 2014 half year v March 2013 half year |
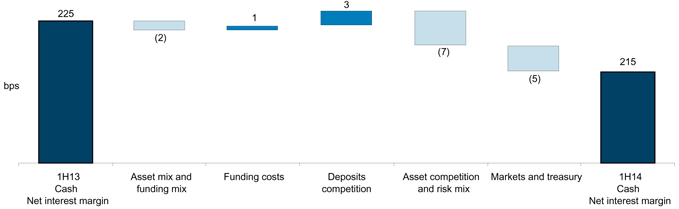
Net interest margin (-10 bps)
| • | Asset mix and funding mix (-2 bps): adverse asset mix from an increased proportion of lower margin home loans and trade loans. |
| • | Funding costs (+1 bp): impact from slightly favourable wholesale funding costs. |
| • | Deposit competition (+3 bps): benefit from active margin management across deposit products as a result of lower deposit competition, particularly term deposits. |
| • | Asset competition and risk mix (-7 bps): continued pressure on lending margins, including competition and switching from variable to fixed in the home loan market in Australia and New Zealand, competition in Global Loans and lower spreads within Corporate and Commercial Banking. |
19
CFO OVERVIEW
| • | Markets and treasury (-5 bps): primarily Treasury due to adverse impact of lower earnings on capital from lower interest rates. |
Average interest earning assets (+$76.1 billion or 14%)
| • | Australia (+$17.1 billion or 7%): driven by growth in net loans and advances, largely home loans and commercial lending facilities. |
| • | International and Institutional Banking (+$41.7 billion or 19%): $7.5 billion increase in Global Loans and $7.3 billion increase in Transaction Banking loans which grew in line with strategy. Reverse repos, investment in government securities, bonds and liquidity portfolio within Global Markets increased by $23.2 billion. |
| • | New Zealand (+$14.4 billion or 20%): increased Commercial and Retail lending, primarily in shorter term fixed rate home loans, as well as the impact of stronger NZD. |
| • | GTSO and Group Centre (+$2.4 billion): Increase in cash balance to facilitate interbank overnight settlement driven by new RBA requirements. |
Average deposits and other borrowings (+$65 billion or 15%)
| • | Australia (+$11.0 billion or 8%): driven by growth in customer deposits across the retail and commercial portfolios, largely at call products. |
| • | International and Institutional Banking (+$33.7 billion or 18%): primarily due to increased customer deposits within APEA and Australia. Increase of $17.8 billion in Global Markets driven by customer deposits and external repos for funding purposes. |
| • | New Zealand (+$9.5 billion or 21%): increasing volumes in Retail and Commercial banking, including a focus on growing higher margin savings products, as well as the impact of a stronger NZD. |
| • | GTSO and Group Centre (+$8.4 billion): reflecting increased short term Negotiable Certificates of Deposit issuance and an increase in cash borrowing balance related to the new RBA requirements. |
Group net interest margin – September 2013 Half Year v March 2013 Half Year
| • | March 2014 half year v September 2013 half year |
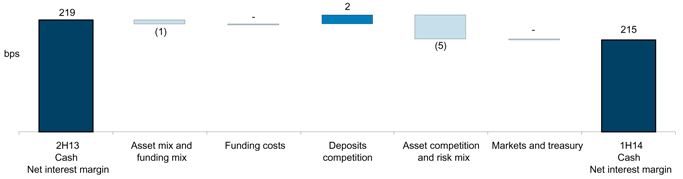
Net interest margin (-4 bps)
| • | Asset mix and funding mix (-1 bp): unfavourable asset mix impact from faster growth in lower margin Home Loans business and slower growth in higher margin Cards and Payments business. |
| • | Deposit competition (+2 bps): benefit from active margin management across deposit products as a result of lower deposit competition, particularly term deposits. |
| • | Asset competition and risk mix (-5 bps): continued pressure on lending margins, including significant competition and switching from variable to fixed in the home loan market in Australia and New Zealand, competition in Global Loans within IIB and lower spreads within Corporate and Commercial Banking. |
Average interest earning assets (+$36.4 billion or 6%)
| • | Australia (+$8.0 billion or 3%): driven by growth in net loans and advances, largely in the variable home loan portfolio. |
| • | International and Institutional Banking (+$17.9 billion or 7%): Global Loans increased by $5.0 billion with strong re-financing levels in Australia and Transaction Banking loans increased by $1.6 billion, primarily in Asia. Reverse repos, investment in government securities and liquidity portfolio within Global Markets increased by $8.6 billion. |
| • | New Zealand (+$8.1 billion or 10%): Increased Commercial and Retail lending volumes, particularly shorter term fixed rate home loans as the economic environment improved, as well as the impact of a stronger NZD. |
| • | GTSO and Group Centre (+$2.5 billion): Increase in cash balance to facilitate interbank overnight settlement attributed to new RBA requirements. |
Average deposits and other borrowings (+$32 billion or 7%)
| • | Australia (+$6.6 billion or 4%): driven by growth in customer deposits across the retail and commercial portfolios, largely at call products. |
| • | International and Institutional Banking (+$20.5 billion or 10%): increase in term deposits, with growth concentrated in APEA and Australia. Increase of $11.2 billion in deposits within Global Markets driven by customers and external repos for funding purposes and commodities trading in Asia. |
| • | New Zealand (+$6.2 billion or 13%): increased customer deposits in both Commercial and Retail, as well as the impact of a stronger NZD. |
| • | GTSO and Group Centre (-$2.1 billion): decreased short term wholesale funding borrowings, partially offset by increased cash borrowings balance related to the new RBA requirements. |
20
CFO OVERVIEW
Income and expenses, cont’d
Other operating income
| Half Year | Movement | |||||||||||||||||||
| Mar 14 $M | Sep 13 $M | Mar 13 $M | Mar 14 v. Sep 13 | Mar 14 v. Mar 13 | ||||||||||||||||
Fee income1 | 1,191 | 1,171 | 1,145 | 2 | % | 4 | % | |||||||||||||
Foreign exchange earnings1 | 43 | 75 | 134 | -43 | % | -68 | % | |||||||||||||
Net income from wealth management | 617 | 622 | 594 | -1 | % | 4 | % | |||||||||||||
Share of associates’ profit1 | 243 | 269 | 209 | -10 | % | 16 | % | |||||||||||||
Other1 | 90 | 59 | 31 | 52 | % | large | ||||||||||||||
Global Markets other operating income | 720 | 567 | 743 | 27 | % | -3 | % | |||||||||||||
|
|
|
|
|
|
|
|
|
| |||||||||||
Cash other operating income | 2,904 | 2,763 | 2,856 | 5 | % | 2 | % | |||||||||||||
|
|
|
|
|
|
|
|
|
| |||||||||||
1. Excluding Global Markets. |
| |||||||||||||||||||
| Global Markets income | ||||||||||||||||||||
Net interest income | 523 | 441 | 376 | 19 | % | 39 | % | |||||||||||||
Other operating income | 720 | 567 | 743 | 27 | % | -3 | % | |||||||||||||
|
|
|
|
|
|
|
|
|
| |||||||||||
Cash Global Markets income | 1,243 | 1,008 | 1,119 | 23 | % | 11 | % | |||||||||||||
|
|
|
|
|
|
|
|
|
| |||||||||||
| Half Year | Movement | |||||||||||||||||||
| Other operating income by division | Mar 14 $M | Sep 13 $M | Mar 13 $M | Mar 14 v. Sep 13 | Mar 14 v. Mar 13 | |||||||||||||||
Australia | 588 | 602 | 588 | -2 | % | 0 | % | |||||||||||||
International and Institutional Banking | 1,599 | 1,409 | 1,502 | 13 | % | 6 | % | |||||||||||||
New Zealand | 178 | 186 | 162 | -4 | % | 10 | % | |||||||||||||
Global Wealth | 726 | 705 | 680 | 3 | % | 7 | % | |||||||||||||
GTSO and Group Centre | (187 | ) | (139 | ) | (76 | ) | 35 | % | large | |||||||||||
|
|
|
|
|
|
|
|
|
| |||||||||||
Cash other operating income | 2,904 | 2,763 | 2,856 | 5 | % | 2 | % | |||||||||||||
|
|
|
|
|
|
|
|
|
| |||||||||||
Other operating income – March 2014 Half Year v March 2013 Half Year
| • | March 2014 half year v March 2013 half year |
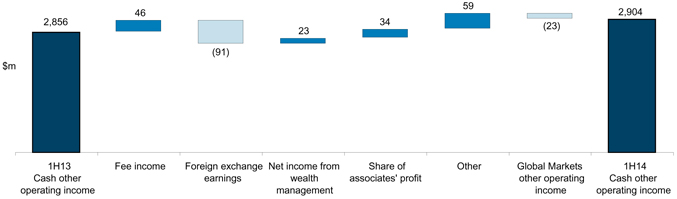
Fee income (+$46 million or +4%)
| • | Transaction Banking increased $17 million, primarily due to an $8 million increase in fees relating to issuance of Letters of Credit in China, Korea and Singapore, $3 million increase in fees from guarantees and Letters of Credit issued in Europe and $3 million increase in fees earned in the Pacific due to volume growth. |
| • | Retail Asia Pacific increased $13 million, primarily due to higher income from investment and insurance products in Hong Kong and Singapore and weakening of the AUD during the March 2014 half. |
| • | New Zealand increased $13 million, mainly due to weakening of the AUD during the March 2014 half. |
| • | Cards and Payments decreased $5 million, primarily due to reduced income as a result of improved customer payment behaviour on consumer credit card products. |
Foreign Exchange (-$91 million or -68%)
| • | Group Centre decreased $126 million, primarily due to realised losses on foreign currency revenue hedges (offsetting translation gains elsewhere in the Group). |
| • | IIB (excluding Global Markets) increased $32 million, mainly driven by growth in cross border transaction volumes in Transaction Banking and higher gains in Retail Asia Pacific due to the weakening of AUD. |
21
CFO OVERVIEW
Net Income from Wealth Management (+$23 million or +4%)
| • | Global Wealth increased $6 million due to improved funds management results driven by higher average funds under management, partially offset by lower insurance income arising from the exit of a large group Iife insurance plan. |
| • | Group Centre increased $13 million due to a reduction in the elimination of Global Wealth investments in ANZ products (offset in net interest income). |
Share of associates profit (+$34 million or +16%)
| • | AMMB Holdings Berhad (AMMB) increased by $13 million mainly due to strong non-interest income growth driven by Retail and Insurance segments. |
| • | Bank of Tianjin (BoT) increased $12 million due to increased earnings driven by strong lending growth in both Enterprise and Retail clients, growth in interbank assets and weakening of the AUD. |
| • | Shanghai Rural Commercial Bank (SRCB) increased $5 million mainly due to weakening of the AUD. |
| • | P.T. Bank Pan Indonesia increased by $2 million due to increased earnings driven by lending growth more than offsetting the weakening of the IDR. |
Other income (+$59 million or large %)
| • | Global Wealth increased $33 million, primarily due to resolution of an insurance settlement relating to a legacy New Zealand funds management matter. |
| • | Global Loans increased $7 million mainly due to the profit on the restructuring of structured lease assets. |
| • | Asia Partnerships increased $12 million due to the BoT dilution gain (from non-participation in a rights issue) recorded in the March 2014 half. |
Global Markets Income (+$124 million or +11%)
In relatively similar trading conditions the customer franchise has been the key driver in increasing revenue by $124 million:
| • | Sales revenue increased $74 million, mainly due to the foreign exchange business where increased volatility has led to increased customer hedging activity. |
| • | Trading income increased $20 million, primarily due to strong growth across the foreign exchange business, with high levels of customer demand in China, Hong Kong and Taiwan. |
| • | Income from management of the Group’s balance sheet and liquidity portfolio increased $30 million due to tightening of credit spreads on mark to market valuation. |
Refer to page 56 for further information.
| • | March 2014 half year v September 2013 half year |
Fee income (+$20 million or +2%)
| • | Transaction Banking increased $13 million, primarily due to a $10 million increase in fees relating to the issuance of Letters of Credit in China, Korea, and Singapore and $3 million increase in guarantee fees in Australia. |
| • | Retail Asia Pacific increased $9 million, primarily due to higher income from investment and insurance products in Hong Kong and Singapore. |
Foreign Exchange (-$32 million or -43%)
| • | Group Centre decreased $25 million driven by realised losses on foreign currency revenue hedges (offsetting translation gains elsewhere in the Group). |
| • | Cards and Payments decreased $12 million due to seasonally lower travel card volumes. |
Net Income from Wealth Management (-$5 million or -1%)
| • | Global Wealth decreased $5 million driven by a decline in insurance income arising from the exit of a large group life insurance plan, partially offset by growth in funds management income. |
Share of associates profit (-$26 million or -10%)
| • | AMMB decreased $12 million mainly due to seasonal factors impacting non-annuity earnings. |
| • | BoT increased $7 million due to increased earnings driven by growth in both Corporate lending and interbank assets. |
| • | SRCB decreased $12 million mainly due to an impairment of an investment held by SRCB. |
| • | P.T. Bank Pan Indonesia decreased $6 million mainly due to seasonal factors impacting earnings and the weakening of the IDR. |
Other income (+$31 million or +52%)
| • | Asia Partnerships increased by $39 million due to a write down of the investment in Saigon Securities Inc. (SSI) of $26 million in the September 2013 half and a dilution gain of $12 million (from non-participation in a rights issue) relating to BoT recorded in the March 2014 half. |
| • | Global Wealth increased $21 million, primarily due to resolution of an insurance settlement relating to a legacy New Zealand funds management matter. |
| • | Global Loans increased by $8 million mainly due to the profit on the restructuring of structured lease assets. |
| • | New Zealand decreased $14 million as the September 2013 results included the gain on sale of EFTPOS New Zealand Limited. |
22
CFO OVERVIEW
Global Markets Income (+$235 million or +23%)
A sustained period of strong client acquisition and favourable trading conditions has increased revenue by $235 million:
| • | Sales revenues increased $45 million mainly attributable to the foreign exchange business where increased volatility has led to increased customer hedging activity. |
| • | Trading income (primarily on customer foreign exchange hedging and precious metals) increased $68 million on improved trading conditions and higher customer flows. |
| • | Income from management of the Group’s balance sheet and liquidity portfolio increased $122 million in part due to tightening of credit spreads from September 2013 half. |
Refer to page 56 for further information.
23
CFO OVERVIEW
Income and expenses, cont’d
| Half Year | Movement | |||||||||||||||||||
| Expenses | Mar 14 $M | Sep 13 $M | Mar 13 $M | Mar 14 v. Sep 13 | Mar 14 v. Mar 13 | |||||||||||||||
Personnel expenses | 2,493 | 2,417 | 2,347 | 3 | % | 6 | % | |||||||||||||
Premises expenses | 391 | 377 | 356 | 4 | % | 10 | % | |||||||||||||
Computer expenses | 640 | 625 | 618 | 2 | % | 4 | % | |||||||||||||
Restructuring expenses | 35 | 28 | 57 | 25 | % | -39 | % | |||||||||||||
Other expenses | 727 | 766 | 666 | -5 | % | 9 | % | |||||||||||||
|
|
|
|
|
|
|
|
|
| |||||||||||
Total cash operating expenses | 4,286 | 4,213 | 4,044 | 2 | % | 6 | % | |||||||||||||
|
|
|
|
|
|
|
|
|
| |||||||||||
Total full time equivalent staff (FTE)1,2 | 48,857 | 48,865 | 48,871 | 0 | % | 0 | % | |||||||||||||
|
|
|
|
|
|
|
|
|
| |||||||||||
| 1. | Refer to page 142 for a summary of full time equivalent staff movements during the period. |
| 2. | Comparative information has been restated to include technology contractors, consistent with how FTE are reported and managed internally. |
| Half Year | Movement | |||||||||||||||||||
| Expenses by division | Mar 14 $M | Sep 13 $M | Mar 13 $M | Mar 14 v. Sep 13 | Mar 14 v. Mar 13 | |||||||||||||||
Australia | 1,500 | 1,492 | 1,475 | 1 | % | 2 | % | |||||||||||||
International and Institutional Banking | 1,598 | 1,531 | 1,456 | 4 | % | 10 | % | |||||||||||||
New Zealand | 514 | 486 | 475 | 6 | % | 8 | % | |||||||||||||
Global Wealth | 494 | 489 | 463 | 1 | % | 7 | % | |||||||||||||
GTSO and Group Centre | 180 | 215 | 175 | -16 | % | 3 | % | |||||||||||||
|
|
|
|
|
|
|
|
|
| |||||||||||
Total cash operating expenses | 4,286 | 4,213 | 4,044 | 2 | % | 6 | % | |||||||||||||
|
|
|
|
|
|
|
|
|
| |||||||||||
Operating expenses – March 2014 Half Year v March 2013 Half Year
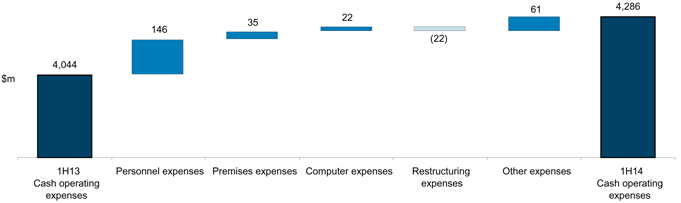
| • | March 2014 half year v March 2013 half year |
| • | Personnel expenses increased $146 million (6%), primarily due to annual salary increases and the adverse impact of foreign exchange movements, partially offset by lower redundancy costs in the March 2014 half. |
| • | Premises expenses increased $35 million (10%), driven by increased rental space, including our new Sydney premises, along with rent and utility cost increases and adverse foreign exchange translation. |
| • | Computer expenses increased $22 million (4%) due to increased depreciation and amortisation and higher spend on computer contractors and communication costs, partially offset by lower software purchases. |
| • | Restructuring expenses decreased $22 million (-39%) due to the completion of “NZ Simplification” and lower restructuring initiatives in GTSO and Group Centre. |
| • | Other expenses increased $61 million (9%), primarily due to adverse impact of foreign exchange movements, the impact of a one off GST credit in the March 2013 half and higher advertising costs, partially offset by lower spend on project consultants. |
| • | March 2014 half year v September 2013 half year |
| • | Personnel expenses increased $76 million (3%), primarily due to annual salary increases and the adverse impact of foreign exchange movements. |
| • | Premises expenses increased $14 million (4%) due to increased depreciation and amortisation on new office buildings and fixtures. |
| • | Computer expenses increased $15 million (2%) due to increased depreciation and amortisation and higher computer contractors costs, partially offset by lower software purchases. |
| • | Restructuring expenses increased $7 million (25%) due mainly to increased restructuring in GTSO and Group Centre. |
| • | Other expenses decreased $39 million (-5%) primarily due to lower spend on project consultants and decreased travel and entertainment costs. |
24
CFO OVERVIEW
Credit risk
Overall asset quality has improved compared to the prior comparable period in 2013, with gross impaired assets reducing $1,065 million (23%) to $3,620 million at 31 March 2014. This was driven by a focus on portfolio credit quality resulting in lower levels of impaired exposures across Australia, IIB and New Zealand.
The Group continues to maintain a prudent approach to provisioning, with total provisions for impairment losses of $4,313 million as at 31 March 2014, down $41 million (1%) from 30 September 2013, up $1 million compared to the 31 March 2013.
The total credit impairment charge of $528 million reduced by $71 million (12%) compared to the prior comparable period and by $70 million (12%) compared to the September 2013 half.
| Half Year | Movement | |||||||||||||||||||
| Credit impairment charge | Mar 14 $M | Sep 13 $M | Mar 13 $M | Mar 14 v. Sep 13 | Mar 14 v. Mar 13 | |||||||||||||||
Individual credit impairment charge | 602 | 572 | 595 | 5 | % | 1 | % | |||||||||||||
Collective credit impairment charge/(release) | (74 | ) | 26 | 4 | large | large | ||||||||||||||
|
|
|
|
|
|
|
|
|
| |||||||||||
Total credit impairment charge | 528 | 598 | 599 | -12 | % | -12 | % | |||||||||||||
|
|
|
|
|
|
|
|
|
| |||||||||||
| Half Year | Movement | |||||||||||||||||||
| Credit impairment charge/(release) | Mar 14 $M | Sep 13 $M | Mar 13 $M | Mar 14 v. Sep 13 | Mar 14 v. Mar 13 | |||||||||||||||
Australia | 403 | 434 | 386 | -7 | % | 4 | % | |||||||||||||
International and Institutional Banking | 161 | 133 | 184 | 21 | % | -13 | % | |||||||||||||
New Zealand | (34 | ) | 9 | 28 | large | large | ||||||||||||||
Global Wealth | (1 | ) | 3 | 1 | large | large | ||||||||||||||
GTSO and Group Centre | (1 | ) | 19 | — | large | n/a | ||||||||||||||
|
|
|
|
|
|
|
|
|
| |||||||||||
Total credit impairment charge | 528 | 598 | 599 | -12 | % | -12 | % | |||||||||||||
|
|
|
|
|
|
|
|
|
| |||||||||||
| Half Year | Movement | |||||||||||||||||||
| Individual credit impairment charge | Mar 14 $M | Sep 13 $M | Mar 13 $M | Mar 14 v. Sep 13 | Mar 14 v. Mar 13 | |||||||||||||||
Australia | 374 | 401 | 370 | -7 | % | 1 | % | |||||||||||||
International and Institutional Banking | 215 | 113 | 167 | 90 | % | 29 | % | |||||||||||||
New Zealand | 13 | 37 | 58 | -65 | % | -78 | % | |||||||||||||
Global Wealth | — | 2 | — | -100 | % | n/a | ||||||||||||||
GTSO and Group Centre | — | 19 | — | -100 | % | n/a | ||||||||||||||
|
|
|
|
|
|
|
|
|
| |||||||||||
Total individual credit impairment charge | 602 | 572 | 595 | 5 | % | 1 | % | |||||||||||||
|
|
|
|
|
|
|
|
|
| |||||||||||
| Half Year | Movement | |||||||||||||||||||
| New and increased individual credit impairments | Mar 14 $M | Sep 13 $M | Mar 13 $M | Mar 14 v. Sep 13 | Mar 14 v. Mar 13 | |||||||||||||||
Australia | 557 | 582 | 550 | -4 | % | 1 | % | |||||||||||||
International and Institutional Banking | 295 | 205 | 245 | 44 | % | 20 | % | |||||||||||||
New Zealand | 112 | 145 | 150 | -23 | % | -25 | % | |||||||||||||
Global Wealth | 3 | 4 | — | -25 | % | n/a | ||||||||||||||
GTSO and Group Centre | — | 19 | — | -100 | % | n/a | ||||||||||||||
|
|
|
|
|
|
|
|
|
| |||||||||||
New and increased credit impairments for loans and advances | 967 | 955 | 945 | 1 | % | 2 | % | |||||||||||||
|
|
|
|
|
|
|
|
|
| |||||||||||
Recoveries and writebacks | ||||||||||||||||||||
Australia | (183 | ) | (181 | ) | (180 | ) | 1 | % | 2 | % | ||||||||||
International and Institutional Banking | (80 | ) | (92 | ) | (78 | ) | -13 | % | 3 | % | ||||||||||
New Zealand | (99 | ) | (108 | ) | (92 | ) | -8 | % | 8 | % | ||||||||||
Global Wealth | (3 | ) | (2 | ) | — | 50 | % | n/a | ||||||||||||
|
|
|
|
|
|
|
|
|
| |||||||||||
Recoveries and writebacks | (365 | ) | (383 | ) | (350 | ) | -5 | % | 4 | % | ||||||||||
|
|
|
|
|
|
|
|
|
| |||||||||||
Total individual credit impairment charge | 602 | 572 | 595 | 5 | % | 1 | % | |||||||||||||
|
|
|
|
|
|
|
|
|
| |||||||||||
| • | March 2014 half year v March 2013 half year |
The total individual credit impairment charge increased by $7 million (1%) over the March 2013 half primarily due to higher credit impairment charges in IIB, partially offset by lower credit impairment charges in New Zealand due to an improvement in credit quality.
| • | March 2014 half year v September 2013 half year |
The total individual credit impairment charge increased $30 million (5%) over the half, primarily due to larger provisions being raised in IIB, partially offset by reductions in Australia and New Zealand.
25
CFO OVERVIEW
| Half Year | Movement | |||||||||||||||||||
| Collective credit impairment charge/(release) by source | Mar 14 $M | Sep 13 $M | Mar 13 $M | Mar 14 v. Sep 13 | Mar 14 v. Mar 13 | |||||||||||||||
Lending growth | 85 | 67 | 69 | 27 | % | 23 | % | |||||||||||||
Risk profile | (190 | ) | (23 | ) | (20 | ) | large | large | ||||||||||||
Portfolio mix | (10 | ) | (9 | ) | (20 | ) | 11 | % | -50 | % | ||||||||||
Economic cycle and concentration risk adjustment | 41 | (9 | ) | (25 | ) | large | large | |||||||||||||
|
|
|
|
|
|
|
|
|
| |||||||||||
Collective credit impairment charge/(release) | (74 | ) | 26 | 4 | large | large | ||||||||||||||
|
|
|
|
|
|
|
|
|
| |||||||||||
Collective credit impairment charge/(release) by division | ||||||||||||||||||||
Australia | 29 | 33 | 16 | -12 | % | 81 | % | |||||||||||||
International and Institutional Banking | (54 | ) | 20 | 17 | large | large | ||||||||||||||
New Zealand | (47 | ) | (28 | ) | (30 | ) | 68 | % | 57 | % | ||||||||||
Global Wealth | (1 | ) | 1 | 1 | large | large | ||||||||||||||
GTSO and Group Centre | (1 | ) | — | — | n/a | n/a | ||||||||||||||
|
|
|
|
|
|
|
|
|
| |||||||||||
Collective credit impairment charge/(release) | (74 | ) | 26 | 4 | large | large | ||||||||||||||
|
|
|
|
|
|
|
|
|
| |||||||||||
| • | March 2014 half year v March 2013 half year |
The collective credit impairment charge decreased by $78 million from the March 2013 half, driven by a significant improvement in the risk profile following the crystallisation of individual provisions on a few large IIB exposures, and as a result of upgrades to a number of large customer exposures in IIB and New Zealand. This was partially offset by a net increase in economic cycle provision, primarily related to the mining services industry.
The $54 million release in IIB was due to a combination of the crystallisation of individual provisions on a few large exposures and improved customer credit ratings, partially offset by an increase in the economic cycle provision. The New Zealand release of $47 million was driven by improved credit quality and a reduction in the economic cycle provision, partially offset by lending growth and a few exposures returning to performing. The $29 million charge in Australia was primarily due to lending growth and an increase in the economic cycle provision.
| • | March 2014 half year v September 2013 half year |
The collective credit impairment charge decreased $100 million from the September 2013 half, driven by a significant improvement in the risk profile following the crystallisation of individual provisions on a few large IIB exposures, and as a result of upgrades to a number of large customer exposures in IIB and New Zealand. This was partially offset by a net increase in economic cycle provision, primarily related to the mining services industry.
The drivers of the current period collective provision are as described above.
26
CFO OVERVIEW
Credit risk, cont’d
Provision for credit impairment balance
| As at ($M) | Movement | |||||||||||||||||||
| Mar 14 $M | Sep 13 $M | Mar 13 $M | Mar 14 v. Sep 13 | Mar 14 v. Mar 13 | ||||||||||||||||
Collective provision1 | 2,843 | 2,887 | 2,769 | -2 | % | 3 | % | |||||||||||||
Individual provision | 1,470 | 1,467 | 1,543 | 0 | % | -5 | % | |||||||||||||
|
|
|
|
|
|
|
|
|
| |||||||||||
Total provision for credit impairment | 4,313 | 4,354 | 4,312 | -1 | % | 0 | % | |||||||||||||
|
|
|
|
|
|
|
|
|
| |||||||||||
| 1. | The collective provision includes amounts for off-balance sheet credit exposures: $597 million at 31 March 2014 (Sep 13: $595 million; Mar 13: $531 million). The impact on the income statement for the half year ended 31 March 2014 was a $8 million release (Sep 13 half: $35 million charge; Mar 13 half: $2 million charge). |
Gross impaired assets
| As at ($M) | Movement | |||||||||||||||||||
| Mar 14 | Sep 13 | Mar 13 | Mar 14 v. Sep 13 | Mar 14 v. Mar 13 | ||||||||||||||||
Impaired loans | 3,314 | 3,751 | 3,978 | -12 | % | -17 | % | |||||||||||||
Restructured items | 60 | 341 | 524 | -82 | % | -89 | % | |||||||||||||
Non-performing commitments and contingencies | 246 | 172 | 183 | 43 | % | 34 | % | |||||||||||||
|
|
|
|
|
|
|
|
|
| |||||||||||
Gross impaired assets | 3,620 | 4,264 | 4,685 | -15 | % | -23 | % | |||||||||||||
Individual provisions | ||||||||||||||||||||
Impaired loans | (1,396 | ) | (1,440 | ) | (1,518 | ) | -3 | % | -8 | % | ||||||||||
Non-performing commitments and contingencies | (74 | ) | (27 | ) | (25 | ) | large | large | ||||||||||||
|
|
|
|
|
|
|
|
|
| |||||||||||
Net impaired assets | 2,150 | 2,797 | 3,142 | -23 | % | -32 | % | |||||||||||||
|
|
|
|
|
|
|
|
|
| |||||||||||
| As at ($M) | Movement | |||||||||||||||||||
| Gross impaired assets by division | Mar 14 $M | Sep 13 $M | Mar 13 $M | Mar 14 v. Sep 13 | Mar 14 v. Mar 13 | |||||||||||||||
Australia | 1,463 | 1,685 | 1,746 | -13 | % | -16 | % | |||||||||||||
International and Institutional Banking | 1,471 | 1,758 | 1,893 | -16 | % | -22 | % | |||||||||||||
New Zealand | 668 | 765 | 1,013 | -13 | % | -34 | % | |||||||||||||
Global Wealth | 18 | 30 | 33 | -40 | % | -45 | % | |||||||||||||
GTSO and Group Centre | — | 26 | — | -100 | % | n/a | ||||||||||||||
|
|
|
|
|
|
|
|
|
| |||||||||||
Gross impaired assets | 3,620 | 4,264 | 4,685 | -15 | % | -23 | % | |||||||||||||
|
|
|
|
|
|
|
|
|
| |||||||||||
Impaired and restructured items by size of exposure
| As at ($M) | Movement | |||||||||||||||||||
| Mar 14 | Sep 13 | Mar 13 | Mar 14 v. Sep 13 | Mar 14 v. Mar 13 | ||||||||||||||||
Less than $10 million | 2,204 | 2,235 | 2,246 | -1 | % | -2 | % | |||||||||||||
$10 million to $100 million | 897 | 1,491 | 1,659 | -40 | % | -46 | % | |||||||||||||
Greater than $100 million | 519 | 538 | 780 | -4 | % | -33 | % | |||||||||||||
|
|
|
|
|
|
|
|
|
| |||||||||||
Gross impaired assets | 3,620 | 4,264 | 4,685 | -15 | % | -23 | % | |||||||||||||
Less: Individually assessed provisions for impairment | (1,470 | ) | (1,467 | ) | (1,543 | ) | 0 | % | -5 | % | ||||||||||
|
|
|
|
|
|
|
|
|
| |||||||||||
Net impaired assets | 2,150 | 2,797 | 3,142 | -23 | % | -32 | % | |||||||||||||
|
|
|
|
|
|
|
|
|
| |||||||||||
| • | March 2014 half year v March 2013 half year |
Gross impaired assets decreased 23% primarily due to several exposures returning to performing in IIB and New Zealand, combined with lending book credit quality improvements. The Group has an individual provision coverage ratio on impaired assets of 40.6% at 31 March 2014, up from 32.9% as at 31 March 2013.
| • | March 2014 half year v September 2013 half year |
Gross impaired assets decreased 15% primarily due to several exposures returning to performing in IIB and New Zealand, combined with asset realisations and write-offs. The Group has an individual provision coverage ratio on impaired assets of 40.6% at 31 March 2014, up from 34.4% as at 30 September 2013.
27
CFO OVERVIEW
Credit risk, cont’d
New Impaired Assets
| Half Year | Movement | |||||||||||||||||||
| Mar 14 $M | Sep 13 $M | Mar 13 $M | Mar 14 v. Sep 13 | Mar 14 v. Mar 13 | ||||||||||||||||
Impaired loans | 1,431 | 1,687 | 1,551 | -15 | % | -8 | % | |||||||||||||
Restructured items | 10 | 24 | 13 | -58 | % | -23 | % | |||||||||||||
Non-performing commitments and contingencies | 100 | 5 | 7 | large | large | |||||||||||||||
|
|
|
|
|
|
|
|
|
| |||||||||||
Total new impaired assets | 1,541 | 1,716 | 1,571 | -10 | % | -2 | % | |||||||||||||
|
|
|
|
|
|
|
|
|
| |||||||||||
| New impaired assets by division | Mar 14 $M | Sep 13 $M | Mar 13 $M | Mar 14 v. Sep 13 | Mar 14 v. Mar 13 | |||||||||||||||
Australia | 758 | 940 | 782 | -19 | % | -3 | % | |||||||||||||
International and Institutional Banking | 516 | 446 | 453 | 16 | % | 14 | % | |||||||||||||
New Zealand | 263 | 296 | 335 | -11 | % | -21 | % | |||||||||||||
Global Wealth | 4 | 8 | 1 | -50 | % | large | ||||||||||||||
GTSO and Group Centre | — | 26 | — | -100 | % | n/a | ||||||||||||||
|
|
|
|
|
|
|
|
|
| |||||||||||
Total new impaired assets | 1,541 | 1,716 | 1,571 | -10 | % | -2 | % | |||||||||||||
|
|
|
|
|
|
|
|
|
| |||||||||||
| • | March 2014 half year v March 2013 half year |
New impaired assets decreased 2% primarily due to decreases in Australia and New Zealand divisions as portfolio credit quality improved. This was partially offset by some increases in IIB due to the downgrade of a few large customers.
| • | March 2014 half year v September 2013 half year |
New impaired assets decreased 10% primarily due to decreases in the Australia and New Zealand as portfolio credit quality improved. This was partially offset by some increases in IIB due to the downgrade of a few large customers.
| As at ($M) | Movement | |||||||||||||||||||
| Ageing analysis of net loans and advances that are past due but not impaired | Mar 14 | Sep 13 | Mar 13 | Mar 14 v. Sep 13 | Mar 14 v. Mar 13 | |||||||||||||||
1-5 days | 3,345 | 3,096 | 2,088 | 8 | % | 60 | % | |||||||||||||
6-29 days | 4,660 | 4,416 | 5,294 | 6 | % | -12 | % | |||||||||||||
30-59 days | 2,037 | 1,506 | 1,870 | 35 | % | 9 | % | |||||||||||||
60-89 days | 980 | 927 | 889 | 6 | % | 10 | % | |||||||||||||
>90 days | 2,061 | 1,818 | 1,696 | 13 | % | 22 | % | |||||||||||||
|
|
|
|
|
|
|
|
|
| |||||||||||
Total | 13,083 | 11,763 | 11,837 | 11 | % | 11 | % | |||||||||||||
|
|
|
|
|
|
|
|
|
| |||||||||||
| • | March 2014 half year v March 2013 half year |
The 90 past due but not impaired volumes increased by 22%, compared with the March 2013 half, predominantly due to increases within the Australian mortgage portfolio. This was driven by a combination of portfolio growth, hardship ageing treatment changes, seasonality and specific state-based increases.
| • | March 2014 half year v September 2013 half year |
The 90 past due but not impaired volumes increased by 13%, compared with the September 2013 half, predominantly due to increases within the Australian mortgage portfolio. This was driven by a combination of portfolio growth, hardship ageing treatment changes, seasonality and specific state-based increases. Along with the above, the 30-59 days delinquencies were also impacted by pending loan extension approvals and loan re-documentation for three large customers.
28
CFO OVERVIEW
Income tax expense
| Half Year | Movement | |||||||||||||||||||
| Mar 14 $M | Sep 13 $M | Mar 13 $M | Mar 14 v. Sep 13 | Mar 14 v. Mar 13 | ||||||||||||||||
Income tax expense on cash profit | 1,333 | 1,170 | 1,265 | 14 | % | 5 | % | |||||||||||||
Effective tax rate (cash profit) | 27.5 | % | 26.1 | % | 28.4 | % | ||||||||||||||
| • | March 2014 half year v March 2013 half year |
The effective tax rate decreased 0.9% primarily due to a favourable increase in the overseas tax rate differential during the March 2014 half.
| • | March 2014 half year v September 2013 half year |
The effective tax rate increased 1.4% primarily due to a favourable Global Wealth tax consolidation adjustment during the September 2013 half.
Impact of exchange rate movements/revenue hedges
The Group uses derivative instruments to economically hedge against the adverse impact on future offshore revenue streams from exchange rate movements.
Movements in average exchange rates, net of realised hedges, resulted in an increase of $57 million in the Group’s cash profit over the prior comparable period. Hedges reduced cash profit by $107 million (pre-tax) compared to the March 2013 half year and by $27 million (pre-tax) compared to the September 2013 half. Hedge revenue/cost is recorded against other operating income in the Group Centre. Excluding the impact of hedges, operating income (FX unadjusted) would have increased 4% on the September 2013 half year and by 8% on the March 2013 half year.
| Half Year Mar 2014 v. Half Year Sep 2013 | Half Year Mar 2014 v. Half Year Mar 2013 | |||||||||||||||||||||||
| FX unadjusted % growth | FX adjusted % growth | FX Impact $M | FX unadjusted % growth | FX adjusted % growth | FX Impact $M | |||||||||||||||||||
Net interest income | 3 | % | 2 | % | 104 | 8 | % | 5 | % | 223 | ||||||||||||||
Other operating income | 5 | % | 5 | % | 6 | 2 | % | 1 | % | 20 | ||||||||||||||
|
|
|
|
|
|
|
|
|
|
|
| |||||||||||||
Operating income | 4 | % | 3 | % | 110 | 6 | % | 4 | % | 243 | ||||||||||||||
Operating expenses | 2 | % | 0 | % | (67 | ) | 6 | % | 2 | % | (169 | ) | ||||||||||||
|
|
|
|
|
|
|
|
|
|
|
| |||||||||||||
Profit before credit impairment and income tax | 6 | % | 5 | % | 43 | 7 | % | 5 | % | 74 | ||||||||||||||
Credit impairment charge | -12 | % | -11 | % | 2 | -12 | % | -14 | % | (16 | ) | |||||||||||||
|
|
|
|
|
|
|
|
|
|
|
| |||||||||||||
Profit before income tax | 8 | % | 7 | % | 45 | 9 | % | 8 | % | 58 | ||||||||||||||
Income tax expense | 14 | % | 13 | % | (10 | ) | 5 | % | 5 | % | (1 | ) | ||||||||||||
Non-controlling interests | 20 | % | 20 | % | — | 20 | % | 20 | % | — | ||||||||||||||
|
|
|
|
|
|
|
|
|
|
|
| |||||||||||||
Cash profit | 6 | % | 5 | % | 35 | 11 | % | 9 | % | 57 | ||||||||||||||
|
|
|
|
|
|
|
|
|
|
|
| |||||||||||||
The Group’s cash profit adjusted for exchange rate movements is as follows:
| Half Year | Movement | |||||||||||||||||||
| Mar 14 $M | Sep 13 $M | Mar 13 $M | Mar 14 v. Sep 13 | Mar 14 v. Mar 13 | ||||||||||||||||
Net interest income | 6,764 | 6,640 | 6,459 | 2 | % | 5 | % | |||||||||||||
Other operating income | 2,904 | 2,769 | 2,876 | 5 | % | 1 | % | |||||||||||||
|
|
|
|
|
|
|
|
|
| |||||||||||
Operating income | 9,668 | 9,409 | 9,335 | 3 | % | 4 | % | |||||||||||||
Operating expenses | (4,286 | ) | (4,280 | ) | (4,213 | ) | 0 | % | 2 | % | ||||||||||
|
|
|
|
|
|
|
|
|
| |||||||||||
Profit before credit impairment and income tax | 5,382 | 5,129 | 5,122 | 5 | % | 5 | % | |||||||||||||
Credit impairment charge | (528 | ) | (596 | ) | (615 | ) | -11 | % | -14 | % | ||||||||||
|
|
|
|
|
|
|
|
|
| |||||||||||
Profit before income tax | 4,854 | 4,533 | 4,507 | 7 | % | 8 | % | |||||||||||||
Income tax expense | (1,333 | ) | (1,180 | ) | (1,266 | ) | 13 | % | 5 | % | ||||||||||
Non-controlling interests | (6 | ) | (5 | ) | (5 | ) | 20 | % | 20 | % | ||||||||||
|
|
|
|
|
|
|
|
|
| |||||||||||
Cash profit (FX adjusted) | 3,515 | 3,348 | 3,236 | 5 | % | 9 | % | |||||||||||||
|
|
|
|
|
|
|
|
|
| |||||||||||
29
CFO OVERVIEW
Earnings related hedges
The Group has taken out economic hedges against New Zealand Dollar and US Dollar (and USD correlated) revenue and expense streams. New Zealand dollar exposure relate to the New Zealand geography (refer page 81) and the debt component of New Zealand dollar intra-group funding of this business, which amounted to NZD 1.766 billion at 31 March 2014. Most of our US dollar earnings are in APEA (refer page 78). Details of these hedges are set out below.
| Half Year | ||||||||||||
| NZD Economic hedges | Mar 14 $M | Sep 13 $M | Mar 13 $M | |||||||||
Net open NZD position (notional principal)1 | 2,275 | 1,549 | 1,315 | |||||||||
Amount taken to income (pre tax statutory basis)2 | (104 | ) | (175 | ) | (3 | ) | ||||||
Amount taken to income (pre tax cash basis)3 | (71 | ) | (40 | ) | (2 | ) | ||||||
USD Economic hedges | ||||||||||||
Net open USD position (notional principal)1 | 900 | 1,294 | 728 | |||||||||
Amount taken to income (pre tax statutory basis)2 | (5 | ) | (88 | ) | 13 | |||||||
Amount taken to income (pre tax cash basis)3 | (15 | ) | (19 | ) | 23 | |||||||
| 1. | Value in AUD at original contract rate. |
| 2. | Unrealised valuation movement plus realised revenue from closed out hedges. |
| 3. | Realised revenue from closed out hedges. |
As at 31 March 2014, the following hedges are in place to partially hedge future earnings against adverse movements in exchange rates:
| • | NZD 2.6 billion at a forward rate of approximately NZD 1.16 / AUD. |
| • | USD 0.8 billion at a forward rate of approximately USD 0.94 / AUD. |
During the March 2014 half year:
| • | NZD 0.8 billion of economic hedges matured and a realised loss of $71 million (pre-tax) was recorded in cash profit. |
| • | USD 0.4 billion of economic hedges matured and a realised loss of $15 million (pre-tax) was recorded in cash profit. |
| • | An unrealised loss of $23 million (pre-tax) on the outstanding NZD and USD economic hedges was recorded in the income statement during the half and has been treated as an adjustment to statutory profit as these are hedges of future periods’ NZD and USD revenues. |
Earnings per share (cents)
| Half Year | Movement | |||||||||||||||||||
| Mar 14 | Sep 13 | Mar 13 | Mar 14 v. Sep 13 | Mar 14 v. Mar 13 | ||||||||||||||||
Cash earnings per share (cents) | ||||||||||||||||||||
Basic1 | 128.7 | 121.4 | 116.9 | 6 | % | 10 | % | |||||||||||||
Diluted | 124.3 | 117.4 | 113.1 | 6 | % | 10 | % | |||||||||||||
Cash weighted average number of ordinary shares (M)2 | ||||||||||||||||||||
Basic | 2,728.0 | 2,727.5 | 2,716.6 | 0 | % | 0 | % | |||||||||||||
Diluted | 2,918.8 | 2,915.4 | 2,904.4 | 0 | % | 0 | % | |||||||||||||
Cash profit ($M) | 3,515 | 3,313 | 3,179 | 6 | % | 11 | % | |||||||||||||
Preference share dividends ($M) | (3 | ) | (3 | ) | (3 | ) | 0 | % | 0 | % | ||||||||||
|
|
|
|
|
|
|
|
|
| |||||||||||
Cash profit less preference share dividends ($M)1 | 3,512 | 3,310 | 3,176 | 6 | % | 11 | % | |||||||||||||
|
|
|
|
|
|
|
|
|
| |||||||||||
Diluted cash profit less preference share dividends ($M) | 3,628 | 3,424 | 3,286 | 6 | % | 10 | % | |||||||||||||
|
|
|
|
|
|
|
|
|
| |||||||||||
| 1. | The earnings per share calculation excludes the Euro Trust Securities (preference shares). |
| 2. | Includes Treasury shares held in Global Wealth. |
30
CFO OVERVIEW
Dividends
| Half Year | Movement | |||||||||||||||||||
| Dividend per ordinary share (cents) | Mar 14 $M | Sep 13 $M | Mar 13 $M | Mar 14 v. Sep 13 | Mar 14 v. Mar 13 | |||||||||||||||
Interim (fully franked)1 | 83 | n/a | 73 | n/a | 14 | % | ||||||||||||||
Final (fully franked) | n/a | 91 | n/a | n/a | n/a | |||||||||||||||
Ordinary share dividends used in payout ratio ($M)2 | 2,278 | 2,497 | 2,003 | -9 | % | 14 | % | |||||||||||||
Cash profit ($M) | 3,515 | 3,313 | 3,179 | 6 | % | 11 | % | |||||||||||||
Less: Preference share dividends paid | (3 | ) | (3 | ) | (3 | ) | 0 | % | 0 | % | ||||||||||
Ordinary share dividend payout ratio (cash basis) | 64.9 | % | 75.4 | % | 63.1 | % | ||||||||||||||
| 1. | 2014 interim is proposed. |
| 2. | Dividend payout ratio is calculated using proposed 2014 interim dividend of $2,278 million, which is based on the forecast number of ordinary shares on issue at the dividend record date. Dividend payout ratios for the September 2013 half year and March 2013 half year are calculated using actual dividend paid of $2,497 million and $2,003 million respectively. Dividend payout ratio is calculated by adjusting profit attributable to shareholders of the company by the amount of preference share dividends paid. |
The Directors propose that an interim dividend of 83 cents be paid on each eligible fully paid ANZ ordinary share on 1 July 2014. The proposed 2014 interim dividend will be fully franked for Australian tax purposes and New Zealand imputation credits of NZD 10 cents per ordinary share will also be attached.
Economic profit
| Half Year | Movement | |||||||||||||||||||
| Mar 14 $M | Sep 13 $M | Mar 13 $M | Mar 14 v. Sep 13 | Mar 14 v. Mar 13 | ||||||||||||||||
Statutory profit attributable to shareholders of the company | 3,381 | 3,329 | 2,937 | 2 | % | 15 | % | |||||||||||||
Adjustments between statutory profit and cash profit | 134 | (16 | ) | 242 | large | -45 | % | |||||||||||||
|
|
|
|
|
|
|
|
|
| |||||||||||
Cash profit | 3,515 | 3,313 | 3,179 | 6 | % | 11 | % | |||||||||||||
Economic credit cost adjustment | (256 | ) | (205 | ) | (171 | ) | 25 | % | 50 | % | ||||||||||
Imputation credits | 566 | 585 | 644 | -3 | % | -12 | % | |||||||||||||
|
|
|
|
|
|
|
|
|
| |||||||||||
Economic return | 3,825 | 3,693 | 3,652 | 4 | % | 5 | % | |||||||||||||
Cost of capital | (2,485 | ) | (2,402 | ) | (2,242 | ) | 3 | % | 11 | % | ||||||||||
|
|
|
|
|
|
|
|
|
| |||||||||||
Economic profit | 1,340 | 1,291 | 1,410 | 4 | % | -5 | % | |||||||||||||
|
|
|
|
|
|
|
|
|
| |||||||||||
Economic profit is a risk adjusted profit measure used to evaluate business unit performance and is considered in determining the variable component of remuneration packages. This is used for internal management purposes and is not subject to review by the external auditor.
Economic profit is calculated via a series of adjustments to cash profit. The economic credit cost adjustment replaces the actual credit loss charge with internal expected loss based on the average loss per annum on the portfolio over an economic cycle. The benefit of imputation credits is recognised, measured at 70% of Australian tax. The cost of capital is a major component of economic profit. At an ANZ Group level, this is calculated using average ordinary shareholders’ equity (excluding non-controlling interests), multiplied by the cost of capital rate (11% used consistently over a number of years) plus the dividend on preference shares. At a business unit level, capital is allocated based on economic capital, whereby higher risk businesses attract higher levels of capital. This method is designed to help drive appropriate risk management and ensure business returns align with the relevant risk. Key risks covered include credit risk, operating risk, market risk and other risks.
Economic profit decreased 5% against the prior comparative period due to higher cash profit of 11% being more than offset by lower imputation tax credits due to lower Australian tax expense, higher economic credit cost adjustment and the cost of higher capital levels.
Economic profit increased 4% against the prior half due to higher cash profit of 6%, partially offset by a higher economic credit cost adjustment and the cost of higher capital levels.
31
CFO OVERVIEW
Balance sheet, liquidity and capital
Condensed balance sheet
| As at ($B) | Movement | |||||||||||||||||||
| Mar 14 | Sep 131 | Mar 131 | Mar 14 v. Sep 13 | Mar 14 v. Mar 13 | ||||||||||||||||
Assets | ||||||||||||||||||||
Cash / Settlement balances owed to ANZ / Collateral paid | 56.1 | 51.0 | 62.3 | 10 | % | -10 | % | |||||||||||||
Trading and available-for-sale assets | 73.5 | 69.6 | 63.0 | 6 | % | 17 | % | |||||||||||||
Derivative financial instruments | 43.8 | 45.9 | 41.7 | -5 | % | 5 | % | |||||||||||||
Net loans and advances | 509.3 | 483.3 | 454.3 | 5 | % | 12 | % | |||||||||||||
Investments backing policy liabilities | 33.2 | 32.1 | 31.2 | 3 | % | 6 | % | |||||||||||||
Other | 21.9 | 21.1 | 20.1 | 4 | % | 9 | % | |||||||||||||
|
|
|
|
|
|
|
|
|
| |||||||||||
Total assets | 737.8 | 703.0 | 672.6 | 5 | % | 10 | % | |||||||||||||
|
|
|
|
|
|
|
|
|
| |||||||||||
Liabilities | ||||||||||||||||||||
Settlement balances owed by ANZ / Collateral received | 12.0 | 12.6 | 16.3 | -5 | % | -26 | % | |||||||||||||
Deposits and other borrowings | 498.3 | 466.9 | 451.1 | 7 | % | 10 | % | |||||||||||||
Derivative financial instruments | 45.9 | 47.5 | 45.1 | -3 | % | 2 | % | |||||||||||||
Bonds and notes | 73.6 | 70.4 | 60.2 | 5 | % | 22 | % | |||||||||||||
Policy liabilities and external unit holder liabilities | 36.7 | 35.9 | 34.8 | 2 | % | 5 | % | |||||||||||||
Other | 24.3 | 24.1 | 22.6 | 1 | % | 8 | % | |||||||||||||
|
|
|
|
|
|
|
|
|
| |||||||||||
Total liabilities | 690.8 | 657.4 | 630.1 | 5 | % | 10 | % | |||||||||||||
|
|
|
|
|
|
|
|
|
| |||||||||||
Total equity | 47.0 | 45.6 | 42.5 | 3 | % | 11 | % | |||||||||||||
|
|
|
|
|
|
|
|
|
| |||||||||||
| 1. | Comparative amounts have been amended. Refer to Note 21 of the Condensed Consolidated Financial Statements for details. |
| • | March 2014 half year v March 2013 half year |
| • | Trading securities and available-for-sale assets increased by $11 billion, primarily due to a $1 billion increase in fixed income securities held for trading and increases in the Australia and New Zealand prime liquidity portfolios of $8 billion. |
| • | Net loans and advances increased $55 billion, driven by a $16 billion increase in Australia primarily from home loan growth; a $17 billion increase in New Zealand due to home loan growth and favourable foreign exchange rate impact; and a $22 billion increase in IIB relating to Global Markets in Australia, Transaction Banking in Asia and Global Loans in both Australia and Asia. |
| • | Deposits and other borrowings increased $47 billion, driven by a $11 billion increase in Australia from growth in Retail and Corporate & Commercial Banking; a $12 billion increase in New Zealand from growth in Retail and Commercial (and the impact of foreign exchange movements); a $21 billion increase in IIB from growth in Transaction Banking and Retail term deposits; and a $7 billion increase in Group Centre. |
| • | Bonds and notes increased $13 billion, attributable to a $7 billion increase in net issuances and a $5 billion increase due to foreign exchange movements. |
| • | March 2014 half year v September 2013 half year |
| • | Trading securities and available-for-sale assets increased by $4 billion, primarily due to increases in the Australia and New Zealand prime liquidity portfolios. |
| • | Net loans and advances increased $26 billion, driven by a $7 billion increase in Australia primarily from home loan growth; a $7 billion increase in the New Zealand division due to home loan growth and favourable foreign exchange rate impact; and a $13 billion increase in IIB relating to Global Markets in Australia, Transaction Banking in Asia and Global Loans in both Australia and Asia. |
| • | Deposits and other borrowings increased $31 billion, driven by a $4 billion increase in Australia from growth in Retail and Corporate & Commercial Banking; a $6 billion increase in New Zealand from growth in Retail and Commercial (and the impact of foreign exchange movements); a $13 billion increase in IIB from growth in Transaction Banking and Retail accounts; and a $7 billion increase in Group Centre. |
| • | Bonds and notes increased $3 billion due to net issuances and foreign exchange movements. |
32
CFO OVERVIEW
Liquidity risk
Liquidity risk is the risk that the Group is unable to meet its payment obligations as they fall due, including repaying depositors or maturing wholesale debt, or that the Group has insufficient capacity to fund increases in assets. The timing mismatch of cash flows and the related liquidity risk is inherent in all banking operations and is closely monitored by the Group. The Group maintains a portfolio of liquid assets to manage potential stresses in funding sources. The minimum level of liquidity portfolio assets to hold is based on a range of ANZ specific and general market liquidity stress scenarios such that potential cash flow obligations can be met over the short to medium term.
The Group’s approach to liquidity risk management incorporates the following key components:
| • | Scenario modelling of funding sources |
The Global Financial Crisis (GFC) highlighted the importance of differentiating between stressed and normal market conditions in a name-specific crisis and the different behaviour that offshore and domestic wholesale funding markets can exhibit during market stress events. ANZ’s short term liquidity scenario modelling stresses cash flow projections against multiple ‘survival horizons’ over which the Group is required to remain cash flow positive. In addition, longer term scenarios are in place that measure the structural liquidity position of the balance sheet. Scenarios modelled are either based on prudential requirements or Board mandated scenarios. Under these scenarios, customer and wholesale balance sheet asset/liability flows are stressed.
| • | Liquidity portfolio |
The Group holds a diversified portfolio of cash and high credit quality securities that may be sold or pledged to provide same-day liquidity. This portfolio helps protect the Group’s liquidity position by providing cash in a severely stressed environment. All assets held in the prime portfolio are securities eligible for repurchase under agreements with the applicable central bank (i.e. ‘repo eligible’).
The liquidity portfolio is well diversified by counterparty, currency and tenor. Under the liquidity policy framework, securities purchased for ANZ’s liquidity portfolio must be of a similar or better credit quality to ANZ’s external long-term or short-term credit ratings and continue to be repo eligible.
Supplementing the prime liquid asset portfolio, the Group holds additional liquidity in the following:
| • | central bank deposits with the US Federal Reserve, Bank of England and Bank of Japan of $17.2 billion; |
| • | Australian Commonwealth and State Government securities of $6.9 billion and gold and precious metals of $2.5 billion, and |
| • | cash and other securities to satisfy local country regulatory liquidity requirements which are not included in the liquid assets below. |
| As at | ||||||||||||
| Prime liquidity portfolio (Market values post haircut)1 | Mar 14 AUD $B | Sep 13 AUD $B | Mar 13 AUD $B | |||||||||
Australia | 28.9 | 27.8 | 25.3 | |||||||||
New Zealand | 12.5 | 11.1 | 10.5 | |||||||||
United States | 3.8 | 2.1 | 1.3 | |||||||||
United Kingdom | 5.2 | 5.1 | 4.4 | |||||||||
Singapore | 3.2 | 3.1 | 3.2 | |||||||||
Hong Kong | 0.8 | 0.6 | 0.3 | |||||||||
Japan | 1.3 | 1.4 | 1.4 | |||||||||
|
|
|
|
|
| |||||||
Total excluding internal Residential Mortgage Backed Securities (RMBS) | 55.7 | 51.2 | 46.4 | |||||||||
Internal Residential Mortgage Backed Securities (Australia)2 | 29.6 | 35.7 | 35.3 | |||||||||
Internal Residential Mortgage Backed Securities (New Zealand) | 5.1 | 3.7 | 3.3 | |||||||||
|
|
|
|
|
| |||||||
Total prime portfolio | 90.4 | 90.6 | 85.0 | |||||||||
Other eligible securities including gold and cash on deposit with central banks3 | 26.6 | 31.0 | 36.8 | |||||||||
|
|
|
|
|
| |||||||
Total liquidity portfolio | 117.0 | 121.6 | 121.8 | |||||||||
|
|
|
|
|
| |||||||
| 1. | Market value is post the repo discount applied by the applicable central bank. |
| 2. | Reduction in internal RMBS in Australia during the March 2014 half is due to higher prescribed haircuts from the RBA effective Nov 13. |
| 3. | Liquid Asset holdings in Australia netted down against overnight interbank repo treasury borrowings. |
Regulatory Change
The Basel 3 Liquidity changes include the introduction of two liquidity ratios to measure liquidity risk (the Liquidity Coverage Ratio (LCR) in 2015 and the Net Stable Funding Ratio (NSFR), expected implementation 2018). A component of the liquidity required under the new standards will be met via the Committed Liquidity Facility from the Reserve Bank of Australian (RBA). The size and composition of this facility for 2015 will be confirmend with APRA during 2014, however the results of a trial exercise completed in 2013 confirmed our expectation that the Group remains well placed to meet future requirements.
APRA has released its final Prudential Standard on its requirements in December 2013 which largely adopted the recalibrated Basel runoff factors for the LCR. The Basel 3 revised standard on NSFR, released in January 2014, is currently undergoing a global review with the expectation of it being implemented in 2018.
Wholesale Funding
ANZ targets a diversified funding base, avoiding undue concentrations by investor type, maturity, market source and currency.
$13.1 billion of term wholesale debt (with a remaining term greater than one year as at 31 March 2014) was issued during the March 2014 half year. In addition, $1.6 billion of ANZ Capital Notes were issued.
| • | Access to all major global wholesale funding markets remained available to ANZ during the March 2014 half year. |
| • | All wholesale funding needs were comfortably met. |
| • | The weighted average tenor of new term debt was 5.3 years (4.3 years in 2013). |
| • | The average term debt portfolio costs are slowly reducing, however, remain substantially above pre-GFC levels. |
33
CFO OVERVIEW
Liquidity risk, cont’d
The following tables show the Group’s funding composition:
| As at ($M) | Movement | |||||||||||||||||||
| Mar 14 | Sep 13 | Mar 13 | Mar 14 v. Sep 13 | Mar 14 v. Mar 13 | ||||||||||||||||
Customer deposits and other liabilities1 | ||||||||||||||||||||
Australia | 156,310 | 152,371 | 145,535 | 3 | % | 7 | % | |||||||||||||
International and Institutional Banking | 172,023 | 163,151 | 151,847 | 5 | % | 13 | % | |||||||||||||
New Zealand | 51,749 | 46,494 | 41,423 | 11 | % | 25 | % | |||||||||||||
Global Wealth | 12,699 | 11,569 | 10,042 | 10 | % | 26 | % | |||||||||||||
GTSO and Group Centre | (4,759 | ) | (4,756 | ) | (4,712 | ) | 0 | % | 1 | % | ||||||||||
|
|
|
|
|
|
|
|
|
| |||||||||||
Customer deposits | 388,022 | 368,829 | 344,135 | 5 | % | 13 | % | |||||||||||||
Other2 | 10,895 | 13,158 | 12,373 | -17 | % | -12 | % | |||||||||||||
|
|
|
|
|
|
|
|
|
| |||||||||||
Total customer deposits and other liabilities (funding) | 398,917 | 381,987 | 356,508 | 4 | % | 12 | % | |||||||||||||
|
|
|
|
|
|
|
|
|
| |||||||||||
Wholesale funding3 | ||||||||||||||||||||
Bonds and notes4 | 72,747 | 69,570 | 59,422 | 5 | % | 22 | % | |||||||||||||
Loan capital | 13,226 | 12,804 | 11,666 | 3 | % | 13 | % | |||||||||||||
Certificates of deposit | 57,707 | 58,276 | 61,564 | -1 | % | -6 | % | |||||||||||||
Commercial paper issued | 16,041 | 12,255 | 14,486 | 31 | % | 11 | % | |||||||||||||
Other wholesale borrowings5 | 43,871 | 38,813 | 42,920 | 13 | % | 2 | % | |||||||||||||
|
|
|
|
|
|
|
|
|
| |||||||||||
Total wholesale funding | 203,592 | 191,718 | 190,058 | 6 | % | 7 | % | |||||||||||||
|
|
|
|
|
|
|
|
|
| |||||||||||
Shareholders’ equity (excl preference shares) | 46,167 | 44,732 | 41,632 | 3 | % | 11 | % | |||||||||||||
|
|
|
|
|
|
|
|
|
| |||||||||||
Total funding | 648,676 | 618,437 | 588,198 | 5 | % | 10 | % | |||||||||||||
|
|
|
|
|
|
|
|
|
| |||||||||||
Wholesale funding maturity3,6 | ||||||||||||||||||||
Short term wholesale funding (excluding Central Banks)7,8 | 82,937 | 73,650 | 72,351 | 13 | % | 15 | % | |||||||||||||
Central Bank deposits | 17,512 | 15,374 | 18,360 | 14 | % | -5 | % | |||||||||||||
|
|
|
|
|
|
|
|
|
| |||||||||||
Total short term wholesale funding | 100,449 | 89,024 | 90,711 | 13 | % | 11 | % | |||||||||||||
Long term wholesale funding | ||||||||||||||||||||
- Less than 1 year residual maturity | 18,695 | 20,292 | 31,977 | -8 | % | -42 | % | |||||||||||||
- Greater than 1 year residual maturity | 77,127 | 75,240 | 61,392 | 3 | % | 26 | % | |||||||||||||
Hybrid capital including preference shares | 7,321 | 7,162 | 5,978 | 2 | % | 22 | % | |||||||||||||
|
|
|
|
|
|
|
|
|
| |||||||||||
Total wholesale funding and preference share capital excluding shareholders’ equity | 203,592 | 191,718 | 190,058 | 6 | % | 7 | % | |||||||||||||
|
|
|
|
|
|
|
|
|
| |||||||||||
Total funding maturity | ||||||||||||||||||||
Total short term wholesale funding | 15 | % | 15 | % | 15 | % | ||||||||||||||
Long term wholesale funding | ||||||||||||||||||||
- Less than 1 year residual maturity | 3 | % | 3 | % | 5 | % | ||||||||||||||
- Greater than 1 year residual maturity | 12 | % | 12 | % | 11 | % | ||||||||||||||
Total customer liabilities (funding) | 62 | % | 62 | % | 61 | % | ||||||||||||||
Shareholders’ equity and hybrid debt | 8 | % | 8 | % | 8 | % | ||||||||||||||
|
|
|
|
|
|
|
|
|
| |||||||||||
Total wholesale funding and shareholder equity excluding preference share capital | 100 | % | 100 | % | 100 | % | ||||||||||||||
|
|
|
|
|
|
|
|
|
| |||||||||||
| 1. | Includes term deposits, other deposits and an adjustment recognised in Group Centre to eliminate Global Wealth investments in ANZ deposit products. |
| 2. | Includes interest accruals, payables and other liabilities, provisions and net tax provisions, excluding other liabilities in Global Wealth. |
| 3. | Liability for acceptances have been removed as they do not provide net funding. |
| 4. | Excludes term debt issued externally by Global Wealth. |
| 5. | Includes borrowings from banks, net derivative balances, special purpose vehicles, other borrowings and Euro Trust Securities (preference shares). |
| 6. | Long term wholesale funding amounts are stated at original hedged exchange rates. Movements due to currency fluctuations in actual amounts borrowed are classified as short term wholesale funding. |
| 7. | RBA open-repo arrangement netted down by the exchange settlement account cash balance. |
| 8. | Liquid Asset holdings in Australia netted down against overnight interbank repo treasury borrowings. |
34
CFO OVERVIEW
Capital Management
Capital Ratios
| As at | ||||||||||||||||||||||||
| APRA Basel 3 | Internationally Harmonised Basel 31 | |||||||||||||||||||||||
| Mar 14 | Sep 13 | Mar 13 | Mar 14 | Sep 13 | Mar 13 | |||||||||||||||||||
Common Equity Tier 1 | 8.3 | % | 8.5 | % | 8.2 | % | 10.5 | % | 10.8 | % | 10.3 | % | ||||||||||||
Tier 1 | 10.3 | % | 10.4 | % | 9.8 | % | 12.6 | % | 12.8 | % | 12.1 | % | ||||||||||||
Total capital | 12.1 | % | 12.2 | % | 11.7 | % | 14.5 | % | 14.7 | % | 14.0 | % | ||||||||||||
|
|
|
|
|
|
|
|
|
|
|
| |||||||||||||
Risk weighted assets ($B) | 360.7 | 339.3 | 322.6 | 339.5 | 318.5 | 307.6 | ||||||||||||||||||
|
|
|
|
|
|
|
|
|
|
|
| |||||||||||||
| 1. | Internationally Harmonised ratios do not include additional items identified as differences between APRA and Basel 3 capital regulations in the recently released Basel Committee’s Regulatory Consistency Assessment Programme (RCAP) on Basel 3 implementation in Australia (March 2014). These items are subject to further clarification from APRA and the Basel Committee and are not expected to have a material impact on ANZ’s Internationally Harmonised capital ratios. |
APRA Basel 3 Common Equity Tier 1 (CET1) – March 2014 half year v September 2013 half year
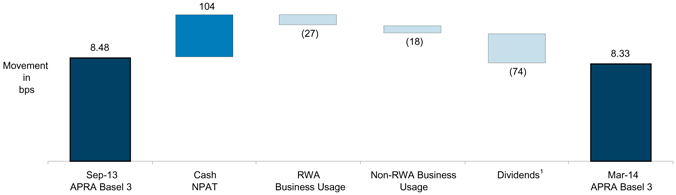
| 1. | Following the issue of 16.2 million ordinary shares under the Dividend Reinvestment Plan and Bonus Option Plan for the 2013 final dividend, the Company repurchased $500 million of ordinary shares via an on-market share buy-back resulting in 15.9 million ordinary shares being cancelled. |
35
CFO OVERVIEW
APRA Basel 3 to Internationally Harmonised1 Basel 3 Common Equity Tier 1 (CET1) – March 2014 half year
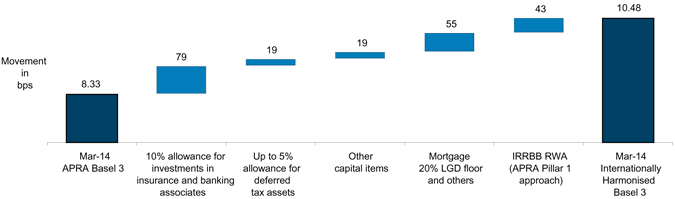
| 1. | ANZ’s interpretation of the regulations documented in the Basel Committee publications; “Basel 3: A global regulatory framework for more resilient banks and banking systems” (June 2011) and “International Convergence of Capital Measurement and Capital Standards” (June 2006). |
The above table provides a reconciliation of CET1 ratio under APRA’s Basel 3 prudential capital standards to Internationally Harmonised Basel 3 standards. APRA views the Basel 3 reforms as a minimum requirement and hence has not incorporated some of the concessions proposed in the Basel 3 rules and has also set higher requirements in other areas. As a result, Australian banks’ Basel 3 reported capital ratios will not be directly comparable with international peers (Internationally Harmonised Basel 3).
In addition, APRA has implemented an accelerated implementation timetable for the Basel 3 capital reforms, particularly in relation to minimum capital ratios and deductions which became effective 1 January 2013. Introduction of the prescribed minimum capital buffers, which now includes higher loss absorbency capital requirements for Domestic Systematically Important Banks (D-SIB) will be fully effective from 1 January 2016.
APRA is still yet to finalise capital standards on the Basel 3 reforms dealing with the leverage ratio and contingent capital.
Level 3 Conglomerates (“Level 3”)
APRA has announced that it will proceed with implementing Level 3 Conglomerates framework on 1 January 2015, with final Level 3 capital adequacy standards expected to be released during 2014. The standards will regulate a bancassurance group such as ANZ as a single economic entity with minimum capital requirements and additional reporting on risk exposure levels. Based upon APRA’s draft Level 3 standards covering capital adequacy, group governance, risk management and risk exposures, ANZ is not expecting any material impact on its operations.
Domestic Systematically Important Bank (D-SIB) Framework
APRA has released details of its D-SIB framework for implementation in Australia and have classified ANZ and three other major Australian banks as domestic systematically important banks. As a result the Capital Conservation Buffer (CCB) applied to the four major Australian banks will increase by 100 basis points from 1 January 2016, further strengthening the capital position of Australia D-SIBs. ANZ’s current capital position is already in excess of APRA’s requirements including the D-SIB overlay. ANZ may modestly increase its capital buffers from current levels over time through organic capital generation.
36
CFO OVERVIEW
Deferred acquisition costs and deferred income
The Group recognises as assets deferred acquisition costs relating to the acquisition of interest earning assets or the issuance of funding. The Group also recognises deferred income that is integral to the yield of an originated financial instrument, net of any direct incremental costs. This income is deferred and recognised as net interest income over the expected life of the financial instrument under AASB 139: ‘Financial Instruments: Recognition and Measurement’. Deferred acquisition costs that do not relate to interest earning assets, for example those relating to the acquisition of life investment contracts, are excluded from this analysis.
The balances of deferred acquisition costs and deferred income were:
| Deferred Acquisition Costs1 | Deferred Income | |||||||||||||||||||||||
| Mar 14 $M | Sep 13 $M | Mar 13 $M | Mar 14 $M | Sep 13 $M | Mar 13 $M | |||||||||||||||||||
Australia | 794 | 780 | 745 | 67 | 69 | 70 | ||||||||||||||||||
International and Institutional Banking | 34 | 18 | 17 | 271 | 262 | 251 | ||||||||||||||||||
New Zealand | 170 | 142 | 106 | 50 | 47 | 38 | ||||||||||||||||||
Global Wealth | 2 | 2 | 1 | 3 | 3 | 3 | ||||||||||||||||||
GTSO and Group Centre | 63 | 49 | 44 | — | — | — | ||||||||||||||||||
|
|
|
|
|
|
|
|
|
|
|
| |||||||||||||
Total | 1,063 | 991 | 913 | 391 | 381 | 362 | ||||||||||||||||||
|
|
|
|
|
|
|
|
|
|
|
| |||||||||||||
| 1. | Deferred acquisition costs largely include the amounts of brokerage capitalised and amortised in the Australia and New Zealand divisions. Deferred acquisition costs also include capitalised debt raising expenses. |
Deferred acquisition costs and associated amortisation during the period were:
| Half Year Mar 2014 | Half Year Sep 2013 | |||||||||||||||
| Amortisation Charge $M | Capitalised Costs1 $M | Amortisation Charge $M | Capitalised Costs1 $M | |||||||||||||
Australia | 203 | 217 | 203 | 238 | ||||||||||||
International and Institutional Banking | 14 | 30 | 7 | 8 | ||||||||||||
New Zealand | 30 | 58 | 24 | 60 | ||||||||||||
Global Wealth | — | — | — | 1 | ||||||||||||
GTSO and Group Centre | 12 | 26 | 13 | 18 | ||||||||||||
|
|
|
|
|
|
|
| |||||||||
Total | 259 | 331 | 247 | 325 | ||||||||||||
|
|
|
|
|
|
|
| |||||||||
| 1. | Costs capitalised during the period exclude brokerage trailer commissions paid. |
37
CFO OVERVIEW
Investment spend
Investment spend includes expenditure that develops and enhances the Group’s infrastructure to meet business and strategic objectives and to improve capabilities and efficiencies. Over the March 2014 half the Group continued to invest strongly with spend of $527 million. Key initiatives included the “Banking on Australia” program with a focus on building digital capabilities, continued investment in IIB with the implementation of the core banking system in Hong Kong and continued development of our Transaction Banking capabilities. Risk and Compliance remains a significant focus with investment in technology security and regulatory requirements across the region.
| Half Year | Movement | |||||||||||||||||||
| Mar 14 $M | Sep 13 $M | Mar 13 $M | Mar 14 v. Sep 13 | Mar 14 v. Mar 13 | ||||||||||||||||
Expensed investment spend | 161 | 204 | 181 | -21 | % | -11 | % | |||||||||||||
Capitalised investment spend | 366 | 551 | 333 | -34 | % | 10 | % | |||||||||||||
|
|
|
|
|
|
|
|
|
| |||||||||||
Investment spend | 527 | 755 | 514 | -30 | % | 3 | % | |||||||||||||
|
|
|
|
|
|
|
|
|
| |||||||||||
Comprising
| Half Year | Movement | |||||||||||||||||||
| Mar 14 $M | Sep 13 $M | Mar 13 $M | Mar 14 v. Sep 13 | Mar 14 v. Mar 13 | ||||||||||||||||
Growth | 229 | 313 | 209 | -27 | % | 10 | % | |||||||||||||
Transformation and productivity | 104 | 139 | 116 | -25 | % | -10 | % | |||||||||||||
Risk and compliance | 137 | 209 | 129 | -34 | % | 6 | % | |||||||||||||
Maintenance and infrastructure | 57 | 94 | 60 | -39 | % | -5 | % | |||||||||||||
|
|
|
|
|
|
|
|
|
| |||||||||||
Investment spend | 527 | 755 | 514 | -30 | % | 3 | % | |||||||||||||
|
|
|
|
|
|
|
|
|
| |||||||||||
38
CFO OVERVIEW
Software capitalisation
At 31 March 2014, the Group’s intangibles included $2,332 million in relation to costs incurred in acquiring and developing software. Details are set out in the table below:
| Half Year | Movement | |||||||||||||||||||
| Mar 14 $M | Sep 13 $M | Mar 13 $M | Mar 14 v. Sep 13 | Mar 14 v. Mar 13 | ||||||||||||||||
Balance at start of period | 2,170 | 1,857 | 1,762 | 17 | % | 23 | % | |||||||||||||
Software capitalised during the period | 362 | 496 | 284 | -27 | % | 27 | % | |||||||||||||
Amortisation during the period | (205 | ) | (202 | ) | (181 | ) | 1 | % | 13 | % | ||||||||||
Software impaired/written-off | (1 | ) | — | (8 | ) | n/a | -88 | % | ||||||||||||
Foreign exchange differences | 6 | 19 | — | -68 | % | n/a | ||||||||||||||
|
|
|
|
|
|
|
|
|
| |||||||||||
Total capitalised software | 2,332 | 2,170 | 1,857 | 7 | % | 26 | % | |||||||||||||
|
|
|
|
|
|
|
|
|
| |||||||||||
| Capitalised cost analysis by Division | Half Year | Movement | ||||||||||||||||||
| Mar 14 $M | Sep 13 $M | Mar 13 $M | Mar 14 v. Sep 13 | Mar 14 v. Mar 13 | ||||||||||||||||
Australia | 106 | 136 | 76 | -22 | % | 39 | % | |||||||||||||
International and Institutional Banking | 111 | 162 | 115 | -31 | % | -3 | % | |||||||||||||
New Zealand | 14 | 10 | 12 | 40 | % | 17 | % | |||||||||||||
Global Wealth | 19 | 36 | 14 | -47 | % | 36 | % | |||||||||||||
GTSO and Group Centre | 112 | 152 | 67 | -26 | % | 67 | % | |||||||||||||
|
|
|
|
|
|
|
|
|
| |||||||||||
Total | 362 | 496 | 284 | -27 | % | 27 | % | |||||||||||||
|
|
|
|
|
|
|
|
|
| |||||||||||
| Net book value by Division | Half Year | Movement | ||||||||||||||||||
| Mar 14 $M | Sep 13 $M | Mar 13 $M | Mar 14 v. Sep 13 | Mar 14 v. Mar 13 | ||||||||||||||||
Australia | 510 | 453 | 359 | 13 | % | 42 | % | |||||||||||||
International and Institutional Banking | 1,039 | 1,008 | 914 | 3 | % | 14 | % | |||||||||||||
New Zealand | 81 | 75 | 84 | 8 | % | -4 | % | |||||||||||||
Global Wealth | 101 | 97 | 75 | 4 | % | 35 | % | |||||||||||||
GTSO and Group Centre | 601 | 537 | 425 | 12 | % | 41 | % | |||||||||||||
|
|
|
|
|
|
|
|
|
| |||||||||||
Total | 2,332 | 2,170 | 1,857 | 7 | % | 26 | % | |||||||||||||
|
|
|
|
|
|
|
|
|
| |||||||||||
39
CFO OVERVIEW
This page has been left blank intentionally
40
SEGMENT REVIEW
CONTENTS
Section 5 – Segment Review
Segment performance | 42 | |||
Australia | 44 | |||
International and Institutional Banking (IIB) | 50 | |||
New Zealand | 62 | |||
Global Wealth | 68 | |||
Global Technology, Services and Operations (GTSO) and Group Centre | 73 | |||
41
SEGMENT REVIEW
Segment Performance
The Group operates on a divisional structure with Australia, International and Institutional Banking (IIB), New Zealand, and Global Wealth being the major operating divisions. The IIB and Global Wealth divisions are coordinated globally. GTSO and Group Centre provide support to the operating divisions, including technology, operations, risk management, financial management, strategy and marketing, human resources and corporate affairs. Additionally, Group Centre includes Group Treasury, Shareholder Functions and Discontinued Businesses.
There have been no major structural changes to Divisional segments since 30 September 2013, however certain amounts in the comparatives have been reclassified to conform with current period financial statement presentations.
The Segment Review section is reported on a cash basis.
March 2014 Half Year
| AUD M | Australia | International & Institutional Banking | New Zealand | Global Wealth | GTSO and Group Centre | Group | ||||||||||||||||||
Net interest income | 3,429 | 1,993 | 1,061 | 80 | 201 | 6,764 | ||||||||||||||||||
Other operating income | 588 | 1,599 | 178 | 726 | (187 | ) | 2,904 | |||||||||||||||||
|
|
|
|
|
|
|
|
|
|
|
| |||||||||||||
Operating income | 4,017 | 3,592 | 1,239 | 806 | 14 | 9,668 | ||||||||||||||||||
Operating expenses | (1,500 | ) | (1,598 | ) | (514 | ) | (494 | ) | (180 | ) | (4,286 | ) | ||||||||||||
|
|
|
|
|
|
|
|
|
|
|
| |||||||||||||
Profit before credit impair’t and income tax | 2,517 | 1,994 | 725 | 312 | (166 | ) | 5,382 | |||||||||||||||||
Credit impairment (charge)/release | (403 | ) | (161 | ) | 34 | 1 | 1 | (528 | ) | |||||||||||||||
|
|
|
|
|
|
|
|
|
|
|
| |||||||||||||
Profit before income tax | 2,114 | 1,833 | 759 | 313 | (165 | ) | 4,854 | |||||||||||||||||
Income tax expense and non-controlling interests | (635 | ) | (461 | ) | (213 | ) | (87 | ) | 57 | (1,339 | ) | |||||||||||||
|
|
|
|
|
|
|
|
|
|
|
| |||||||||||||
Cash profit | 1,479 | 1,372 | 546 | 226 | (108 | ) | 3,515 | |||||||||||||||||
|
|
|
|
|
|
|
|
|
|
|
| |||||||||||||
| September 2013 Half Year | ||||||||||||||||||||||||
| AUD M | Australia | International & Institutional Banking | New Zealand | Global Wealth | GTSO and Group Centre | Group | ||||||||||||||||||
Net interest income | 3,389 | 1,906 | 973 | 75 | 193 | 6,536 | ||||||||||||||||||
Other operating income | 602 | 1,409 | 186 | 705 | (139 | ) | 2,763 | |||||||||||||||||
|
|
|
|
|
|
|
|
|
|
|
| |||||||||||||
Operating income | 3,991 | 3,315 | 1,159 | 780 | 54 | 9,299 | ||||||||||||||||||
Operating expenses | (1,492 | ) | (1,531 | ) | (486 | ) | (489 | ) | (215 | ) | (4,213 | ) | ||||||||||||
|
|
|
|
|
|
|
|
|
|
|
| |||||||||||||
Profit before credit impair’t and income tax | 2,499 | 1,784 | 673 | 291 | (161 | ) | 5,086 | |||||||||||||||||
Credit impairment charge | (434 | ) | (133 | ) | (9 | ) | (3 | ) | (19 | ) | (598 | ) | ||||||||||||
|
|
|
|
|
|
|
|
|
|
|
| |||||||||||||
Profit before income tax | 2,065 | 1,651 | 664 | 288 | (180 | ) | 4,488 | |||||||||||||||||
Income tax expense and non-controlling interests | (616 | ) | (407 | ) | (182 | ) | (20 | ) | 50 | (1,175 | ) | |||||||||||||
|
|
|
|
|
|
|
|
|
|
|
| |||||||||||||
Cash profit | 1,449 | 1,244 | 482 | 268 | (130 | ) | 3,313 | |||||||||||||||||
|
|
|
|
|
|
|
|
|
|
|
| |||||||||||||
March 2014 Half Year vs September 2013 Half Year
| % | Australia | International & Institutional Banking | New Zealand | Global Wealth | GTSO and Group Centre | Group | ||||||||||||||||||
Net interest income | 1 | % | 5 | % | 9 | % | 7 | % | 4 | % | 3 | % | ||||||||||||
Other operating income | -2 | % | 13 | % | -4 | % | 3 | % | 35 | % | 5 | % | ||||||||||||
|
|
|
|
|
|
|
|
|
|
|
| |||||||||||||
Operating income | 1 | % | 8 | % | 7 | % | 3 | % | -74 | % | 4 | % | ||||||||||||
Operating expenses | 1 | % | 4 | % | 6 | % | 1 | % | -16 | % | 2 | % | ||||||||||||
|
|
|
|
|
|
|
|
|
|
|
| |||||||||||||
Profit before credit impair’t and income tax | 1 | % | 12 | % | 8 | % | 7 | % | 3 | % | 6 | % | ||||||||||||
Credit impairment charge | -7 | % | 21 | % | large | large | large | -12 | % | |||||||||||||||
|
|
|
|
|
|
|
|
|
|
|
| |||||||||||||
Profit before income tax | 2 | % | 11 | % | 14 | % | 9 | % | -8 | % | 8 | % | ||||||||||||
Income tax expense and non-controlling interests | 3 | % | 13 | % | 17 | % | large | 14 | % | 14 | % | |||||||||||||
|
|
|
|
|
|
|
|
|
|
|
| |||||||||||||
Cash profit | 2 | % | 10 | % | 13 | % | -16 | % | -17 | % | 6 | % | ||||||||||||
|
|
|
|
|
|
|
|
|
|
|
| |||||||||||||
42
SEGMENT REVIEW
March 2014 Half Year
| AUD M | Australia | International & Institutional Banking | New Zealand | Global Wealth | GTSO and Group Centre | Group | ||||||||||||||||||
Net interest income | 3,429 | 1,993 | 1,061 | 80 | 201 | 6,764 | ||||||||||||||||||
Other operating income | 588 | 1,599 | 178 | 726 | (187 | ) | 2,904 | |||||||||||||||||
|
|
|
|
|
|
|
|
|
|
|
| |||||||||||||
Operating income | 4,017 | 3,592 | 1,239 | 806 | 14 | 9,668 | ||||||||||||||||||
Operating expenses | (1,500 | ) | (1,598 | ) | (514 | ) | (494 | ) | (180 | ) | (4,286 | ) | ||||||||||||
|
|
|
|
|
|
|
|
|
|
|
| |||||||||||||
Profit before credit impair’t and income tax | 2,517 | 1,994 | 725 | 312 | (166 | ) | 5,382 | |||||||||||||||||
Credit impairment (charge)/release | (403 | ) | (161 | ) | 34 | 1 | 1 | (528 | ) | |||||||||||||||
|
|
|
|
|
|
|
|
|
|
|
| |||||||||||||
Profit before income tax | 2,114 | 1,833 | 759 | 313 | (165 | ) | 4,854 | |||||||||||||||||
Income tax expense and non-controlling interests | (635 | ) | (461 | ) | (213 | ) | (87 | ) | 57 | (1,339 | ) | |||||||||||||
|
|
|
|
|
|
|
|
|
|
|
| |||||||||||||
Cash profit | 1,479 | 1,372 | 546 | 226 | (108 | ) | 3,515 | |||||||||||||||||
|
|
|
|
|
|
|
|
|
|
|
| |||||||||||||
| March 2013 Half Year | ||||||||||||||||||||||||
| AUD M | Australia | International & Institutional Banking | New Zealand | Global Wealth | GTSO and Group Centre | Group | ||||||||||||||||||
Net interest income | 3,281 | 1,785 | 891 | 64 | 215 | 6,236 | ||||||||||||||||||
Other operating income | 588 | 1,502 | 162 | 680 | (76 | ) | 2,856 | |||||||||||||||||
|
|
|
|
|
|
|
|
|
|
|
| |||||||||||||
Operating income | 3,869 | 3,287 | 1,053 | 744 | 139 | 9,092 | ||||||||||||||||||
Operating expenses | (1,475 | ) | (1,456 | ) | (475 | ) | (463 | ) | (175 | ) | (4,044 | ) | ||||||||||||
|
|
|
|
|
|
|
|
|
|
|
| |||||||||||||
Profit before credit impair’t and income tax | 2,394 | 1,831 | 578 | 281 | (36 | ) | 5,048 | |||||||||||||||||
Credit impairment charge | (386 | ) | (184 | ) | (28 | ) | (1 | ) | — | (599 | ) | |||||||||||||
|
|
|
|
|
|
|
|
|
|
|
| |||||||||||||
Profit before income tax | 2,008 | 1,647 | 550 | 280 | (36 | ) | 4,449 | |||||||||||||||||
Income tax expense and non-controlling interests | (599 | ) | (439 | ) | (154 | ) | (76 | ) | (2 | ) | (1,270 | ) | ||||||||||||
|
|
|
|
|
|
|
|
|
|
|
| |||||||||||||
Cash profit | 1,409 | 1,208 | 396 | 204 | (38 | ) | 3,179 | |||||||||||||||||
|
|
|
|
|
|
|
|
|
|
|
| |||||||||||||
| March 2014 Half Year vs March 2013 Half Year | ||||||||||||||||||||||||
| % | Australia | International & Institutional Banking | New Zealand | Global Wealth | GTSO and Group Centre | Group | ||||||||||||||||||
Net interest income | 5 | % | 12 | % | 19 | % | 25 | % | -7 | % | 8 | % | ||||||||||||
Other operating income | 0 | % | 6 | % | 10 | % | 7 | % | large | 2 | % | |||||||||||||
|
|
|
|
|
|
|
|
|
|
|
| |||||||||||||
Operating income | 4 | % | 9 | % | 18 | % | 8 | % | -90 | % | 6 | % | ||||||||||||
Operating expenses | 2 | % | 10 | % | 8 | % | 7 | % | 3 | % | 6 | % | ||||||||||||
|
|
|
|
|
|
|
|
|
|
|
| |||||||||||||
Profit before credit impair’t and income tax | 5 | % | 9 | % | 25 | % | 11 | % | large | 7 | % | |||||||||||||
Credit impairment charge | 4 | % | -13 | % | large | large | n/a | -12 | % | |||||||||||||||
|
|
|
|
|
|
|
|
|
|
|
| |||||||||||||
Profit before income tax | 5 | % | 11 | % | 38 | % | 12 | % | large | 9 | % | |||||||||||||
Income tax expense and non-controlling interests | 6 | % | 5 | % | 38 | % | 14 | % | large | 5 | % | |||||||||||||
|
|
|
|
|
|
|
|
|
|
|
| |||||||||||||
Cash profit | 5 | % | 14 | % | 38 | % | 11 | % | large | 11 | % | |||||||||||||
|
|
|
|
|
|
|
|
|
|
|
| |||||||||||||
43
SEGMENT REVIEW
Australia
Philip Chronican
The Australia Division comprises the Retail and Corporate and Commercial Banking (C&CB) business units.
Cash profit – March 2014 Half Year v March 2013 Half Year
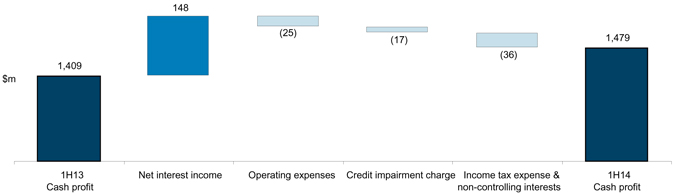
Banking on Australia Transformation Program
Our “Banking on Australia” program is transforming the business to position ANZ for growth in a changing environment. We are building our lead in digital and mobile channels to enhance the customer experience, expand our reach and deepen customer loyalty by making it easier for our customers to bank with us, while delivering a lower cost to serve. We are transforming our distribution networks to focus on sales and bringing the whole of ANZ to our customers, reducing branch footprint costs, building our contact centre capability and improving frontline banker effectiveness. Compared to the March 2013 half year the expense to income ratio reduced by 78 bps to 37.3%.
We are improving the customer experience by providing flexible banking options for our customers. ANZ goMoneyTM continues to be the leading mobile offering in the market with $78 billion in transactions processed since launch in September 2010, the number of ANZ FastPayTM transactions has increased at a compound monthly rate of 43% since its launch in October 2012 and all C&CB frontline bankers are enabled with mobility tools (iPads). 85 branches have been transformed to a sales focused format and 400 Smart ATMs rolled out across the network, resulting in 26% of targeted transactions being migrated from branches to these ATMs. Customer complaints have reduced 24% since the start of the “Banking on Australia” program in October 2012.
Retail continues to perform well underpinned by strong volumes and active margin management, a continued focus on productivity and a disciplined approach to credit quality. ANZ has grown Home Loans at above system levels for 17 consecutive quarters1 and 53% of Home Loans were sold through our proprietary channels (v 51% March 2013 half year). ANZ also grew deposits at above system levels.
Despite a subdued middle market business environment and customer de-leveraging, C&CB lending grew 3% compared to March 2013 half year. The small business segment is performing strongly with lending up 16%, aided by ANZ’s $2 billion lending pledge. Other business foundations remain strong with deposits growing 8% and cross-sell revenue increasing 4% through sales of retail and wealth products to our customer base. Customer numbers2 have increased by approximately 26,000 and we are now equal first in customer satisfaction3. We are continuing to leverage ANZ’s Super Regional advantage with cross border referrals up 120% since the March 2013 half year. Cost discipline has been maintained and our underlying asset quality remains sound.
| • | March 2014 half year v March 2013 half year |
Cash profit increased 5%, with 4% income growth, a 2% increase in expenses and a 4% increase in credit impairment charges.
Key factors affecting the result were:
| • | Net interest income increased 5% driven by a 7% rise in average net loans and advances from above system home loan growth and strong growth in Small Business Banking. Net interest margin contracted 5 bps, with increased lending competition outweighing the benefits of disciplined deposit pricing. |
| • | Operating expenses increased by 2%. Increased personnel expenses, Banking on Australia investment and volume growth were partly offset by productivity gains. |
| • | Credit impairment charges increased by 4%, driven primarily by a higher collective provision charge as a result of lending growth and an increase in the economic cycle provision. Individual provisions increased slightly, with increases in Corporate Banking and Esanda largely offset by improvements in Business Banking, and Retail from improved Home Loan asset realisations and lower delinquencies in Cards and Payments. |
| • | March 2014 half year v September 2013 half year |
Cash profit increased 2% in the half, with 1% income growth, a 1% increase in expenses and a 7% decline in credit impairment charges.
Key factors affecting the result were:
| • | Net interest income increased 1% driven by a 3% increase in average net loans and advances (from above system home loan growth), partially offset by subdued C&CB lending conditions. Net interest margin contracted 3 bps, reflecting increased lending competition, partially offset by disciplined deposit pricing. |
| • | Operating expenses increased 1%. Increased personnel expenses, Banking on Australia investment and volume growth were partly offset by lower discretionary expenditure and productivity gains. |
| • | Credit impairment charges decreased 7% driven by lower individual provisions in Retail from improved Home Loan asset realisations and lower delinquencies in Cards and Payments. In C&CB, increased individual provisions in Corporate Banking were more than offset by improvements across all other C&CB segments. |
| 1 | Source: APRA Monthly Banking Statistics 12 months to Mar-14. |
| 2 | Customer numbers exclude Esanda. |
| 3 | Source: DBM, Business Financial Services Monitor, ranked against other ‘Big 4’ banks, commercial Banking includes majority of businesses with turnover <$100 million, data sourced in the 6 months to March 2014. |
44
SEGMENT REVIEW
Australia
Philip Chronican
Australia Total
| Half Year | Movement | |||||||||||||||||||
| Mar 14 $M | Sep 13 $M | Mar 13 $M | Mar 14 v. Sep 13 | Mar 14 v. Mar 13 | ||||||||||||||||
Net interest income | 3,429 | 3,389 | 3,281 | 1 | % | 5 | % | |||||||||||||
Other operating income | 588 | 602 | 588 | -2 | % | 0 | % | |||||||||||||
|
|
|
|
|
|
|
|
|
| |||||||||||
Operating income | 4,017 | 3,991 | 3,869 | 1 | % | 4 | % | |||||||||||||
Operating expenses | (1,500 | ) | (1,492 | ) | (1,475 | ) | 1 | % | 2 | % | ||||||||||
|
|
|
|
|
|
|
|
|
| |||||||||||
Profit before credit impairment and income tax | 2,517 | 2,499 | 2,394 | 1 | % | 5 | % | |||||||||||||
Credit impairment charge | (403 | ) | (434 | ) | (386 | ) | -7 | % | 4 | % | ||||||||||
|
|
|
|
|
|
|
|
|
| |||||||||||
Profit before tax | 2,114 | 2,065 | 2,008 | 2 | % | 5 | % | |||||||||||||
Income tax expense and non-controlling interests | (635 | ) | (616 | ) | (599 | ) | 3 | % | 6 | % | ||||||||||
|
|
|
|
|
|
|
|
|
| |||||||||||
Cash profit | 1,479 | 1,449 | 1,409 | 2 | % | 5 | % | |||||||||||||
|
|
|
|
|
|
|
|
|
| |||||||||||
Consisting of: | ||||||||||||||||||||
Retail | 933 | 902 | 827 | 3 | % | 13 | % | |||||||||||||
Corporate and Commercial Banking | 546 | 547 | 586 | 0 | % | -7 | % | |||||||||||||
Other | — | — | (4 | ) | n/a | large | ||||||||||||||
|
|
|
|
|
|
|
|
|
| |||||||||||
Cash profit | 1,479 | 1,449 | 1,409 | 2 | % | 5 | % | |||||||||||||
|
|
|
|
|
|
|
|
|
| |||||||||||
Balance Sheet | ||||||||||||||||||||
Net loans & advances | 278,279 | 271,589 | 262,065 | 2 | % | 6 | % | |||||||||||||
Other external assets | 2,912 | 2,736 | 2,886 | 6 | % | 1 | % | |||||||||||||
|
|
|
|
|
|
|
|
|
| |||||||||||
External assets | 281,191 | 274,325 | 264,951 | 3 | % | 6 | % | |||||||||||||
|
|
|
|
|
|
|
|
|
| |||||||||||
Customer deposits | 156,310 | 152,371 | 145,535 | 3 | % | 7 | % | |||||||||||||
Other external liabilities | 12,330 | 13,397 | 14,636 | -8 | % | -16 | % | |||||||||||||
|
|
|
|
|
|
|
|
|
| |||||||||||
External liabilities | 168,640 | 165,768 | 160,171 | 2 | % | 5 | % | |||||||||||||
|
|
|
|
|
|
|
|
|
| |||||||||||
Risk weighted assets | 109,839 | 109,596 | 105,523 | 0 | % | 4 | % | |||||||||||||
Average net loans and advances | 274,910 | 266,956 | 257,914 | 3 | % | 7 | % | |||||||||||||
Average deposits and other borrowings | 155,314 | 148,675 | 144,277 | 4 | % | 8 | % | |||||||||||||
Ratios | ||||||||||||||||||||
Return on assets | 1.07 | % | 1.07 | % | 1.08 | % | ||||||||||||||
Net interest margin | 2.48 | % | 2.51 | % | 2.53 | % | ||||||||||||||
Operating expenses to operating income | 37.3 | % | 37.4 | % | 38.1 | % | ||||||||||||||
Operating expenses to average assets | 1.08 | % | 1.10 | % | 1.14 | % | ||||||||||||||
|
|
|
|
|
|
|
|
|
| |||||||||||
Individual credit impairment charge/(release) | 374 | 401 | 370 | -7 | % | 1 | % | |||||||||||||
Individual credit impairment charge/(release) as a % of average net advances | 0.27 | % | 0.30 | % | 0.29 | % | ||||||||||||||
Collective credit impairment charge/(release) | 29 | 33 | 16 | -12 | % | 81 | % | |||||||||||||
Collective credit impairment charge/(release) as a % of average net advances | 0.02 | % | 0.02 | % | 0.01 | % | ||||||||||||||
Net impaired assets | 717 | 939 | 1,016 | -24 | % | -29 | % | |||||||||||||
Net impaired assets as a % of net advances | 0.26 | % | 0.35 | % | 0.39 | % | ||||||||||||||
|
|
|
|
|
|
|
|
|
| |||||||||||
Total full time equivalent staff (FTE)1 | 14,735 | 14,623 | 14,551 | 1 | % | 1 | % | |||||||||||||
|
|
|
|
|
|
|
|
|
| |||||||||||
| 1. | Comparative information has been restated to include technology contractors, consistent with how FTE are reported and managed internally. |
45
SEGMENT REVIEW
Australia
Philip Chronican
| Individual credit impairment charge/(release) | Half Year | Movement | ||||||||||||||||||
| Mar 14 $M | Sep 13 $M | Mar 13 $M | Mar 14 v. Sep 13 | Mar 14 v. Mar 13 | ||||||||||||||||
Retail | 170 | 198 | 186 | -14 | % | -9 | % | |||||||||||||
Home Loans | 13 | 23 | 22 | -43 | % | -41 | % | |||||||||||||
Cards & Payments | 149 | 165 | 155 | -10 | % | -4 | % | |||||||||||||
Deposits1 | 8 | 10 | 9 | -20 | % | -11 | % | |||||||||||||
Corporate and Commercial Banking | 204 | 203 | 184 | 0 | % | 11 | % | |||||||||||||
Corporate Banking | 70 | (16 | ) | 13 | large | large | ||||||||||||||
Esanda | 70 | 73 | 53 | -4 | % | 32 | % | |||||||||||||
Regional Business Banking | 21 | 53 | 43 | -60 | % | -51 | % | |||||||||||||
Business Banking | 4 | 43 | 33 | -91 | % | -88 | % | |||||||||||||
Small Business Banking | 39 | 50 | 42 | -22 | % | -7 | % | |||||||||||||
|
|
|
|
|
|
|
|
|
| |||||||||||
Individual credit impairment charge/(release) | 374 | 401 | 370 | -7 | % | 1 | % | |||||||||||||
|
|
|
|
|
|
|
|
|
| |||||||||||
| Collective credit impairment charge/(release) | Half Year | Movement | ||||||||||||||||||
| Mar 14 $M | Sep 13 $M | Mar 13 $M | Mar 14 v. Sep 13 | Mar 14 v. Mar 13 | ||||||||||||||||
Retail | 10 | — | 19 | n/a | -47 | % | ||||||||||||||
Home Loans | 9 | 7 | 5 | 29 | % | 80 | % | |||||||||||||
Cards & Payments | (1 | ) | (7 | ) | 15 | -86 | % | large | ||||||||||||
Deposits2 | 2 | — | (1 | ) | n/a | large | ||||||||||||||
Corporate and Commercial Banking | 19 | 33 | (3 | ) | -42 | % | large | |||||||||||||
Corporate Banking | 10 | 18 | (6 | ) | -44 | % | large | |||||||||||||
Esanda | (2 | ) | 6 | (2 | ) | large | 0 | % | ||||||||||||
Regional Business Banking | (4 | ) | 6 | (8 | ) | large | -50 | % | ||||||||||||
Business Banking | 2 | — | 4 | n/a | -50 | % | ||||||||||||||
Small Business Banking | 13 | 3 | 9 | large | 44 | % | ||||||||||||||
|
|
|
|
|
|
|
|
|
| |||||||||||
Collective credit impairment charge/(release) | 29 | 33 | 16 | -12 | % | 81 | % | |||||||||||||
|
|
|
|
|
|
|
|
|
| |||||||||||
Total credit impairment charge/(release) | 403 | 434 | 386 | -7 | % | 4 | % | |||||||||||||
|
|
|
|
|
|
|
|
|
| |||||||||||
| 1. | Represents individual credit impairment charge/(release) on Overdraft balances. |
| 2. | Represents collective credit impairment charge/(release) on Overdraft balances. |
46
SEGMENT REVIEW
Australia
Philip Chronican
| Net loans & advances | As at ($M) | Movement | ||||||||||||||||||
| Mar 14 | Sep 13 | Mar 13 | Mar 14 v. Sep 13 | Mar 14 v. Mar 13 | ||||||||||||||||
Retail | 213,112 | 206,269 | 198,883 | 3 | % | 7 | % | |||||||||||||
Home Loans | 201,646 | 194,991 | 187,920 | 3 | % | 7 | % | |||||||||||||
Cards & Payments | 11,370 | 11,184 | 10,894 | 2 | % | 4 | % | |||||||||||||
Other | 96 | 94 | 69 | 2 | % | 39 | % | |||||||||||||
Corporate and Commercial Banking | 65,167 | 65,320 | 63,182 | 0 | % | 3 | % | |||||||||||||
Corporate Banking | 9,074 | 9,466 | 9,296 | -4 | % | -2 | % | |||||||||||||
Esanda | 16,297 | 16,503 | 16,352 | -1 | % | 0 | % | |||||||||||||
Regional Business Banking | 11,955 | 12,121 | 11,373 | -1 | % | 5 | % | |||||||||||||
Business Banking | 16,525 | 16,628 | 16,403 | -1 | % | 1 | % | |||||||||||||
Small Business Banking | 11,316 | 10,602 | 9,758 | 7 | % | 16 | % | |||||||||||||
|
|
|
|
|
|
|
|
|
| |||||||||||
Net loans & advances | 278,279 | 271,589 | 262,065 | 2 | % | 6 | % | |||||||||||||
|
|
|
|
|
|
|
|
|
| |||||||||||
| Customer deposits | As at ($M) | Movement | ||||||||||||||||||
| Mar 14 | Sep 13 | Mar 13 | Mar 14 v. Sep 13 | Mar 14 v. Mar 13 | ||||||||||||||||
Retail | 109,376 | 106,998 | 101,986 | 2 | % | 7 | % | |||||||||||||
Home Loans | 16,308 | 15,114 | 14,093 | 8 | % | 16 | % | |||||||||||||
Cards & Payments | 326 | 343 | 322 | -5 | % | 1 | % | |||||||||||||
Deposits | 92,742 | 91,541 | 87,571 | 1 | % | 6 | % | |||||||||||||
Corporate and Commercial Banking1 | 46,934 | 45,373 | 43,549 | 3 | % | 8 | % | |||||||||||||
Esanda | 1 | 19 | 66 | -95 | % | -98 | % | |||||||||||||
Regional Business Banking | 4,955 | 4,926 | 5,059 | 1 | % | -2 | % | |||||||||||||
Business Banking | 13,185 | 12,618 | 12,331 | 4 | % | 7 | % | |||||||||||||
Small Business Banking | 28,793 | 27,810 | 26,093 | 4 | % | 10 | % | |||||||||||||
|
|
|
|
|
|
|
|
|
| |||||||||||
Customer deposits | 156,310 | 152,371 | 145,535 | 3 | % | 7 | % | |||||||||||||
|
|
|
|
|
|
|
|
|
| |||||||||||
| 1. | Corporate Banking deposits are included in the International and Institutional Banking division deposits. |
47
SEGMENT REVIEW
Australia
Philip Chronican
Retail
| Half Year | Movement | |||||||||||||||||||
| Mar 14 $M | Sep 13 $M | Mar 13 $M | Mar 14 v. Sep 13 | Mar 14 v. Mar 13 | ||||||||||||||||
Net interest income | 2,066 | 2,014 | 1,915 | 3 | % | 8 | % | |||||||||||||
Other operating income | 449 | 459 | 453 | -2 | % | -1 | % | |||||||||||||
|
|
|
|
|
|
|
|
|
| |||||||||||
Operating income | 2,515 | 2,473 | 2,368 | 2 | % | 6 | % | |||||||||||||
Operating expenses | (1,002 | ) | (993 | ) | (981 | ) | 1 | % | 2 | % | ||||||||||
|
|
|
|
|
|
|
|
|
| |||||||||||
Profit before credit impairment and income tax | 1,513 | 1,480 | 1,387 | 2 | % | 9 | % | |||||||||||||
Credit impairment charge | (180 | ) | (198 | ) | (205 | ) | -9 | % | -12 | % | ||||||||||
|
|
|
|
|
|
|
|
|
| |||||||||||
Profit before tax | 1,333 | 1,282 | 1,182 | 4 | % | 13 | % | |||||||||||||
Income tax expense and non-controlling interests | (400 | ) | (380 | ) | (355 | ) | 5 | % | 13 | % | ||||||||||
|
|
|
|
|
|
|
|
|
| |||||||||||
Cash profit | 933 | 902 | 827 | 3 | % | 13 | % | |||||||||||||
|
|
|
|
|
|
|
|
|
| |||||||||||
Risk weighted assets | 54,950 | 53,143 | 50,801 | 3 | % | 8 | % | |||||||||||||
|
|
|
|
|
|
|
|
|
| |||||||||||
| Half Year | Movement | |||||||||||||||||||
| Individual credit impairment charge/(release) | Mar 14 $M | Sep 13 $M | Mar 13 $M | Mar 14 v. Sep 13 | Mar 14 v. Mar 13 | |||||||||||||||
Home Loans | 13 | 23 | 22 | -43 | % | -41 | % | |||||||||||||
Cards & Payments | 149 | 165 | 155 | -10 | % | -4 | % | |||||||||||||
Deposits1 | 8 | 10 | 9 | -20 | % | -11 | % | |||||||||||||
|
|
|
|
|
|
|
|
|
| |||||||||||
Individual credit impairment charge/(release) | 170 | 198 | 186 | -14 | % | -9 | % | |||||||||||||
|
|
|
|
|
|
|
|
|
| |||||||||||
1. Represents individual credit impairment charge/(release) on Overdraft balances. |
| |||||||||||||||||||
Collective credit impairment charge/(release) | ||||||||||||||||||||
Home Loans | 9 | 7 | 5 | 29 | % | 80 | % | |||||||||||||
Cards & Payments | (1 | ) | (7 | ) | 15 | -86 | % | Large | ||||||||||||
Deposits2 | 2 | — | (1 | ) | n/a | Large | ||||||||||||||
|
|
|
|
|
|
|
|
|
| |||||||||||
Collective credit impairment charge/(release) | 10 | — | 19 | n/a | -47 | % | ||||||||||||||
|
|
|
|
|
|
|
|
|
| |||||||||||
Total credit impairment charge/(release) | 180 | 198 | 205 | -9 | % | -12 | % | |||||||||||||
|
|
|
|
|
|
|
|
|
| |||||||||||
2. Represents collective impairment charge/(release) on Overdraft balances. |
| |||||||||||||||||||
| As at ($M) | Movement | |||||||||||||||||||
| Net loans & advances | Mar 14 | Sep 13 | Mar 13 | Mar 14 v. Sep 13 | Mar 14 v. Mar 13 | |||||||||||||||
Home Loans | 201,646 | 194,991 | 187,920 | 3 | % | 7 | % | |||||||||||||
Cards & Payments | 11,370 | 11,184 | 10,894 | 2 | % | 4 | % | |||||||||||||
Other | 96 | 94 | 69 | 2 | % | 39 | % | |||||||||||||
|
|
|
|
|
|
|
|
|
| |||||||||||
Net loans & advances | 213,112 | 206,269 | 198,883 | 3 | % | 7 | % | |||||||||||||
|
|
|
|
|
|
|
|
|
| |||||||||||
Customer deposits | ||||||||||||||||||||
Home Loans | 16,308 | 15,114 | 14,093 | 8 | % | 16 | % | |||||||||||||
Cards & Payments | 326 | 343 | 322 | -5 | % | 1 | % | |||||||||||||
Deposits | 92,742 | 91,541 | 87,571 | 1 | % | 6 | % | |||||||||||||
|
|
|
|
|
|
|
|
|
| |||||||||||
Customer deposits | 109,376 | 106,998 | 101,986 | 2 | % | 7 | % | |||||||||||||
|
|
|
|
|
|
|
|
|
| |||||||||||
48
SEGMENT REVIEW
Australia
Philip Chronican
Corporate and Commercial Banking
| Half Year | Movement | |||||||||||||||||||
| Mar 14 $M | Sep 13 $M | Mar 13 $M | Mar 14 v. Sep 13 | Mar 14 v. Mar 13 | ||||||||||||||||
Net interest income | 1,363 | 1,375 | 1,366 | -1 | % | 0 | % | |||||||||||||
Other external operating income | 139 | 143 | 135 | -3 | % | 3 | % | |||||||||||||
|
|
|
|
|
|
|
|
|
| |||||||||||
Operating income | 1,502 | 1,518 | 1,501 | -1 | % | 0 | % | |||||||||||||
Operating expenses | (498 | ) | (499 | ) | (489 | ) | 0 | % | 2 | % | ||||||||||
|
|
|
|
|
|
|
|
|
| |||||||||||
Profit before credit impairment and income tax | 1,004 | 1,019 | 1,012 | -1 | % | -1 | % | |||||||||||||
Credit impairment charge | (223 | ) | (236 | ) | (181 | ) | -6 | % | 23 | % | ||||||||||
|
|
|
|
|
|
|
|
|
| |||||||||||
Profit before tax | 781 | 783 | 831 | 0 | % | -6 | % | |||||||||||||
Income tax expense and non-controlling interests | (235 | ) | (236 | ) | (245 | ) | 0 | % | -4 | % | ||||||||||
|
|
|
|
|
|
|
|
|
| |||||||||||
Cash profit | 546 | 547 | 586 | 0 | % | -7 | % | |||||||||||||
|
|
|
|
|
|
|
|
|
| |||||||||||
Risk weighted assets | 53,716 | 55,289 | 53,606 | -3 | % | 0 | % | |||||||||||||
|
|
|
|
|
|
|
|
|
| |||||||||||
| Half Year | Movement | |||||||||||||||||||
| Individual credit impairment charge/(release) | Mar 14 $M | Sep 13 $M | Mar 13 $M | Mar 14 v. Sep 13 | Mar 14 v. Mar 13 | |||||||||||||||
Corporate Banking | 70 | (16 | ) | 13 | large | large | ||||||||||||||
Esanda | 70 | 73 | 53 | -4 | % | 32 | % | |||||||||||||
Regional Business Banking | 21 | 53 | 43 | -60 | % | -51 | % | |||||||||||||
Business Banking | 4 | 43 | 33 | -91 | % | -88 | % | |||||||||||||
Small Business Banking | 39 | 50 | 42 | -22 | % | -7 | % | |||||||||||||
|
|
|
|
|
|
|
|
|
| |||||||||||
Individual credit impairment charge/(release) | 204 | 203 | 184 | 0 | % | 11 | % | |||||||||||||
|
|
|
|
|
|
|
|
|
| |||||||||||
Collective credit impairment charge/(release) | ||||||||||||||||||||
Corporate Banking | 10 | 18 | (6 | ) | -44 | % | large | |||||||||||||
Esanda | (2 | ) | 6 | (2 | ) | large | 0 | % | ||||||||||||
Regional Business Banking | (4 | ) | 6 | (8 | ) | large | -50 | % | ||||||||||||
Business Banking | 2 | — | 4 | n/a | -50 | % | ||||||||||||||
Small Business Banking | 13 | 3 | 9 | large | 44 | % | ||||||||||||||
|
|
|
|
|
|
|
|
|
| |||||||||||
Collective credit impairment charge/(release) | 19 | 33 | (3 | ) | -42 | % | large | |||||||||||||
|
|
|
|
|
|
|
|
|
| |||||||||||
Total credit impairment charge/(release) | 223 | 236 | 181 | -6 | % | 23 | % | |||||||||||||
|
|
|
|
|
|
|
|
|
| |||||||||||
| As at ($M) | Movement | |||||||||||||||||||
| Net loans & advances | Mar 14 | Sep 13 | Mar 13 | Mar 14 v. Sep 13 | Mar 14 v. Mar 13 | |||||||||||||||
Corporate Banking | 9,074 | 9,466 | 9,296 | -4 | % | -2 | % | |||||||||||||
Esanda | 16,297 | 16,503 | 16,352 | -1 | % | 0 | % | |||||||||||||
Regional Business Banking | 11,955 | 12,121 | 11,373 | -1 | % | 5 | % | |||||||||||||
Business Banking | 16,525 | 16,628 | 16,403 | -1 | % | 1 | % | |||||||||||||
Small Business Banking | 11,316 | 10,602 | 9,758 | 7 | % | 16 | % | |||||||||||||
|
|
|
|
|
|
|
|
|
| |||||||||||
Net loans & advances | 65,167 | 65,320 | 63,182 | 0 | % | 3 | % | |||||||||||||
|
|
|
|
|
|
|
|
|
| |||||||||||
Customer deposits1 | ||||||||||||||||||||
Esanda | 1 | 19 | 66 | -95 | % | -98 | % | |||||||||||||
Regional Business Banking | 4,955 | 4,926 | 5,059 | 1 | % | -2 | % | |||||||||||||
Business Banking | 13,185 | 12,618 | 12,331 | 4 | % | 7 | % | |||||||||||||
Small Business Banking | 28,793 | 27,810 | 26,093 | 4 | % | 10 | % | |||||||||||||
|
|
|
|
|
|
|
|
|
| |||||||||||
Customer deposits | 46,934 | 45,373 | 43,549 | 3 | % | 8 | % | |||||||||||||
|
|
|
|
|
|
|
|
|
| |||||||||||
| 1. | Corporate Banking deposits are included in the International and Institutional Banking division deposits. |
49
SEGMENT REVIEW
International and Institutional Banking
Andrew Geczy
The International and Institutional Banking division comprises Global Institutional, Retail Asia Pacific and Asia Partnerships business units, along with Relationship & Infrastructure.
Cash profit – March 2014 Half Year v March 2013 Half Year
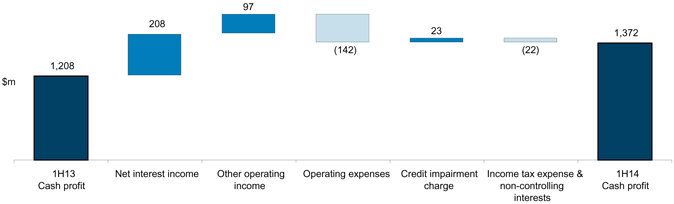
International and Institutional Banking’s result demonstrates the continuing development of a profitable franchise in Asia (with cash profit in APEA increasing by 43% from the March 2013 half), delivery of our product and geographic diversification strategy and ongoing focus on improving portfolio credit quality.
Our continued expansion into Asia is illustrated by APEA now accounting for 79% of the division’s employees, serving 2 million customers and generating $653 million of cash profit. The build of scale and capability in Asia has allowed us to access stronger system growth in Asian markets, compared to the more constrained business environments in Australia and New Zealand. IIB is a significant contributor to the Group’s net funding.
| • | March 2014 half year v March 2013 half year |
Cash profit increased by 14% (9% FX adjusted), with a significant increase in operating income in Global Markets and Transaction Banking and a reduction in credit impairment being partially offset by higher operating expenses.
Key factors affecting the result were:
| • | Net interest income increased 12% (7% FX adjusted), driven by growth mainly in targeted products in Transaction Banking and Global Markets. Average deposits were 18% higher and average net loans and advances increased 20%, with growth across all regions, particularly APEA. Net interest margin declined by 10 basis points, driven by price competition (particularly in Australia) and growth focused on higher credit quality in Global Loans, movements in the structured trade finance mix to lower risk products with tighter margins and lower earnings on capital, partially offset by the impact of the management of the Group’s liquidity portfolio and derivative positions within Global Markets. |
| • | Other operating income increased by 6% (0% FX adjusted), driven by volume increases across most lines of business. Fee income increased in Transaction Banking and Global Loans. Investment and insurance income increased in Retail Asia Pacific, and Asia Partnerships recorded better underlying income as well as a gain arising from the dilution of our Bank of Tianjin stake. |
| • | Operating expenses increased 10%. FX adjusted operating expenses increased 3% reflecting productivity gains and investment in targeted growth areas. |
| • | Credit impairment charges decreased 13%. Collective credit impairment releases due to counterparty credit rating upgrades, provisions no longer required and crystallisation of individual provisions, were partially offset by an increase in economic cycle provision for exposures impacted by global commodity prices and higher individual credit impairment charges in Transaction Banking and Global Markets. |
| • | March 2014 half year v September 2013 half year |
Cash profit increased by 10% (9% FX adjusted), driven primarily by an increase in operating income in Global Markets and Transaction Banking, partially offset by an increase in operating expenses and credit impairments.
Key factors affecting the result were:
| • | Net interest income increased 5% (3% FX adjusted), driven by Global Markets and Transaction Banking. Average deposits were 10% higher and average net loans and advances increased 9%, with growth concentrated largely in APEA and Australia. Net interest margin declined by 3 basis points driven by price competition (particularly in Australia) and growth focused on higher credit quality in Global Loans, movements in the structured trade finance mix to lower risk products with tighter margins and lower earnings on capital, partially offset by the impact of the management of the Group’s liquidity portfolio and derivative positions within Global Markets. |
| • | Other operating income increased 13% (12% FX adjusted), driven by Global Markets from higher FX sales revenue, favourable trading conditions in the March 2014 half and strong demand for FX hedging products in the APEA region. Transaction Banking improved mainly due to volume driven growth in trade fee income. |
| • | Operating expenses increased 4%. FX adjusted operating expenses were 3% higher reflecting productivity gains and investment in targeted growth areas. |
| • | Credit impairment charges increased 21%, due to higher individual credit impairment charges in Transaction Banking and Global Markets, partially offset by collective provision releases relating to the crystallisation of individual provisions, counterparty credit rating upgrades and releases of provisions no longer required. |
50
SEGMENT REVIEW
International and Institutional Banking
Andrew Geczy
International and Institutional Banking Total
| Half Year | Movement | |||||||||||||||||||
| Mar 14 $M | Sep 13 $M | Mar 13 $M | Mar 14 v. Sep 13 | Mar 14 v. Mar 13 | ||||||||||||||||
Net interest income | 1,993 | 1,906 | 1,785 | 5 | % | 12 | % | |||||||||||||
Other operating income | 1,599 | 1,409 | 1,502 | 13 | % | 6 | % | |||||||||||||
|
|
|
|
|
|
|
|
|
| |||||||||||
Operating income | 3,592 | 3,315 | 3,287 | 8 | % | 9 | % | |||||||||||||
Operating expenses | (1,598 | ) | (1,531 | ) | (1,456 | ) | 4 | % | 10 | % | ||||||||||
|
|
|
|
|
|
|
|
|
| |||||||||||
Profit before credit impairment and income tax | 1,994 | 1,784 | 1,831 | 12 | % | 9 | % | |||||||||||||
Credit impairment charge | (161 | ) | (133 | ) | (184 | ) | 21 | % | -13 | % | ||||||||||
|
|
|
|
|
|
|
|
|
| |||||||||||
Profit before income tax | 1,833 | 1,651 | 1,647 | 11 | % | 11 | % | |||||||||||||
Income tax expense and non-controlling interests | (461 | ) | (407 | ) | (439 | ) | 13 | % | 5 | % | ||||||||||
|
|
|
|
|
|
|
|
|
| |||||||||||
Cash profit | 1,372 | 1,244 | 1,208 | 10 | % | 14 | % | |||||||||||||
|
|
|
|
|
|
|
|
|
| |||||||||||
Consisting of: | ||||||||||||||||||||
Global Institutional | 1,142 | 1,065 | 1,011 | 7 | % | 13 | % | |||||||||||||
Asia Partnerships | 239 | 221 | 194 | 8 | % | 23 | % | |||||||||||||
Retail Asia Pacific | 43 | 22 | 27 | 95 | % | 59 | % | |||||||||||||
Relationship & Infrastructure | (52 | ) | (64 | ) | (24 | ) | -19 | % | large | |||||||||||
|
|
|
|
|
|
|
|
|
| |||||||||||
Cash profit | 1,372 | 1,244 | 1,208 | 10 | % | 14 | % | |||||||||||||
|
|
|
|
|
|
|
|
|
| |||||||||||
Balance Sheet | ||||||||||||||||||||
Net loans & advances | 136,343 | 123,472 | 114,460 | 10 | % | 19 | % | |||||||||||||
Other external assets | 178,670 | 173,050 | 170,983 | 3 | % | 4 | % | |||||||||||||
|
|
|
|
|
|
|
|
|
| |||||||||||
External assets | 315,013 | 296,522 | 285,443 | 6 | % | 10 | % | |||||||||||||
|
|
|
|
|
|
|
|
|
| |||||||||||
Customer deposits | 172,023 | 163,151 | 151,847 | 5 | % | 13 | % | |||||||||||||
Other deposits and borrowings | 38,172 | 33,643 | 37,053 | 13 | % | 3 | % | |||||||||||||
|
|
|
|
|
|
|
|
|
| |||||||||||
Deposits and other borrowings | 210,195 | 196,794 | 188,900 | 7 | % | 11 | % | |||||||||||||
Other external liabilities | 62,165 | 57,910 | 54,713 | 7 | % | 14 | % | |||||||||||||
|
|
|
|
|
|
|
|
|
| |||||||||||
External liabilities | 272,360 | 254,704 | 243,613 | 7 | % | 12 | % | |||||||||||||
|
|
|
|
|
|
|
|
|
| |||||||||||
Risk weighted assets | 189,945 | 174,602 | 166,303 | 9 | % | 14 | % | |||||||||||||
Average net loans and advances | 132,129 | 120,912 | 110,331 | 9 | % | 20 | % | |||||||||||||
Average deposits and other borrowings | 216,062 | 195,535 | 182,389 | 10 | % | 18 | % | |||||||||||||
Ratios | ||||||||||||||||||||
Return on assets | 0.87 | % | 0.83 | % | 0.88 | % | ||||||||||||||
Net interest margin | 1.55 | % | 1.58 | % | 1.65 | % | ||||||||||||||
Net interest margin (excluding Global Markets) | 2.49 | % | 2.65 | % | 2.81 | % | ||||||||||||||
Operating expenses to operating income | 44.5 | % | 46.2 | % | 44.3 | % | ||||||||||||||
Operating expenses to average assets | 1.01 | % | 1.02 | % | 1.06 | % | ||||||||||||||
|
|
|
|
|
|
|
|
|
| |||||||||||
Individual credit impairment charge/(release) | 215 | 113 | 167 | 90 | % | 29 | % | |||||||||||||
Individual credit impairment charge/(release) as a % of average net advances | 0.32 | % | 0.19 | % | 0.30 | % | ||||||||||||||
Collective credit impairment charge/(release) | (54 | ) | 20 | 17 | large | large | ||||||||||||||
Collective credit impairment charge/(release) as a % of average net advances | (0.08 | %) | 0.03 | % | 0.03 | % | ||||||||||||||
Net impaired assets | 975 | 1,326 | 1,401 | -26 | % | -30 | % | |||||||||||||
Net impaired assets as a % of net advances | 0.72 | % | 1.07 | % | 1.22 | % | ||||||||||||||
|
|
|
|
|
|
|
|
|
| |||||||||||
Total full time equivalent staff (FTE)1 | 13,040 | 13,196 | 13,312 | -1 | % | -2 | % | |||||||||||||
|
|
|
|
|
|
|
|
|
| |||||||||||
| 1. | Comparative information has been restated to include technology contractors, consistent with how FTE are reported and managed internally. |
51
SEGMENT REVIEW
International and Institutional Banking
Andrew Geczy
International and Institutional Banking by Geography
| Half Year | Movement | |||||||||||||||||||
| Australia | Mar 14 $M | Sep 13 $M | Mar 13 $M | Mar 14 v. Sep 13 | Mar 14 v. Mar 13 | |||||||||||||||
Net interest income | 1,002 | 982 | 936 | 2 | % | 7 | % | |||||||||||||
Other operating income | 442 | 459 | 575 | -4 | % | -23 | % | |||||||||||||
|
|
|
|
|
|
|
|
|
| |||||||||||
Operating income | 1,444 | 1,441 | 1,511 | 0 | % | -4 | % | |||||||||||||
Operating expenses | (551 | ) | (551 | ) | (551 | ) | 0 | % | 0 | % | ||||||||||
|
|
|
|
|
|
|
|
|
| |||||||||||
Profit before credit impairment and income tax | 893 | 890 | 960 | 0 | % | -7 | % | |||||||||||||
Credit impairment charge | (77 | ) | (33 | ) | (80 | ) | large | -4 | % | |||||||||||
|
|
|
|
|
|
|
|
|
| |||||||||||
Profit before income tax | 816 | 857 | 880 | -5 | % | -7 | % | |||||||||||||
Income tax expense and non-controlling interests | (246 | ) | (251 | ) | (264 | ) | -2 | % | -7 | % | ||||||||||
|
|
|
|
|
|
|
|
|
| |||||||||||
Cash profit | 570 | 606 | 616 | -6 | % | -7 | % | |||||||||||||
|
|
|
|
|
|
|
|
|
| |||||||||||
Individual credit impairment charge/(release) | 81 | 12 | 77 | large | 5 | % | ||||||||||||||
Collective credit impairment charge/(release) | (4 | ) | 21 | 3 | large | large | ||||||||||||||
Net loans & advances | 55,106 | 49,528 | 49,483 | 11 | % | 11 | % | |||||||||||||
Customer deposits | 60,891 | 56,881 | 52,115 | 7 | % | 17 | % | |||||||||||||
|
|
|
|
|
|
|
|
|
| |||||||||||
Asia Pacific, Europe and America | ||||||||||||||||||||
Net interest income | 831 | 775 | 706 | 7 | % | 18 | % | |||||||||||||
Other operating income | 1,028 | 865 | 804 | 19 | % | 28 | % | |||||||||||||
|
|
|
|
|
|
|
|
|
| |||||||||||
Operating income | 1,859 | 1,640 | 1,510 | 13 | % | 23 | % | |||||||||||||
Operating expenses | (962 | ) | (897 | ) | (826 | ) | 7 | % | 16 | % | ||||||||||
|
|
|
|
|
|
|
|
|
| |||||||||||
Profit before credit impairment and income tax | 897 | 743 | 684 | 21 | % | 31 | % | |||||||||||||
Credit impairment charge | (85 | ) | (89 | ) | (99 | ) | -4 | % | -14 | % | ||||||||||
|
|
|
|
|
|
|
|
|
| |||||||||||
Profit before income tax | 812 | 654 | 585 | 24 | % | 39 | % | |||||||||||||
Income tax expense and non-controlling interests | (159 | ) | (118 | ) | (127 | ) | 35 | % | 25 | % | ||||||||||
|
|
|
|
|
|
|
|
|
| |||||||||||
Cash profit | 653 | 536 | 458 | 22 | % | 43 | % | |||||||||||||
|
|
|
|
|
|
|
|
|
| |||||||||||
Individual credit impairment charge/(release) | 127 | 92 | 87 | 38 | % | 46 | % | |||||||||||||
Collective credit impairment charge/(release) | (42 | ) | (3 | ) | 12 | large | large | |||||||||||||
Net loans & advances | 74,798 | 67,689 | 59,282 | 11 | % | 26 | % | |||||||||||||
Customer deposits | 98,402 | 94,199 | 89,442 | 4 | % | 10 | % | |||||||||||||
|
|
|
|
|
|
|
|
|
| |||||||||||
New Zealand | ||||||||||||||||||||
Net interest income | 160 | 149 | 143 | 7 | % | 12 | % | |||||||||||||
Other operating income | 129 | 85 | 123 | 52 | % | 5 | % | |||||||||||||
|
|
|
|
|
|
|
|
|
| |||||||||||
Operating income | 289 | 234 | 266 | 24 | % | 9 | % | |||||||||||||
Operating expenses | (85 | ) | (83 | ) | (79 | ) | 2 | % | 8 | % | ||||||||||
|
|
|
|
|
|
|
|
|
| |||||||||||
Profit before credit impairment and income tax | 204 | 151 | 187 | 35 | % | 9 | % | |||||||||||||
Credit impairment (charge)/release | 1 | (11 | ) | (5 | ) | large | large | |||||||||||||
|
|
|
|
|
|
|
|
|
| |||||||||||
Profit before income tax | 205 | 140 | 182 | 46 | % | 13 | % | |||||||||||||
Income tax expense and non-controlling interests | (56 | ) | (38 | ) | (48 | ) | 47 | % | 17 | % | ||||||||||
|
|
|
|
|
|
|
|
|
| |||||||||||
Cash profit | 149 | 102 | 134 | 46 | % | 11 | % | |||||||||||||
|
|
|
|
|
|
|
|
|
| |||||||||||
Individual credit impairment charge/(release) | 7 | 9 | 3 | -22 | % | large | ||||||||||||||
Collective credit impairment charge/(release) | (8 | ) | 2 | 2 | large | large | ||||||||||||||
Net loans & advances | 6,439 | 6,255 | 5,695 | 3 | % | 13 | % | |||||||||||||
Customer deposits | 12,730 | 12,071 | 10,290 | 5 | % | 24 | % | |||||||||||||
|
|
|
|
|
|
|
|
|
| |||||||||||
52
SEGMENT REVIEW
International and Institutional Banking
Andrew Geczy
| Individual credit impairment charge/(release) | Half Year | Movement | ||||||||||||||||||
| Mar 14 $M | Sep 13 $M | Mar 13 $M | Mar 14 v. Sep 13 | Mar 14 v. Mar 13 | ||||||||||||||||
Retail Asia Pacific | 38 | 38 | 23 | 0 | % | 65 | % | |||||||||||||
Global Institutional | 174 | 74 | 144 | large | 21 | % | ||||||||||||||
Transaction Banking | 101 | 11 | 15 | large | large | |||||||||||||||
Global Loans | 52 | 64 | 122 | -19 | % | -57 | % | |||||||||||||
Global Markets | 21 | (1 | ) | 7 | large | large | ||||||||||||||
Relationship & Infrastructure | 3 | 1 | — | large | n/a | |||||||||||||||
|
|
|
|
|
|
|
|
|
| |||||||||||
Individual credit impairment charge/(release) | 215 | 113 | 167 | 90 | % | 29 | % | |||||||||||||
|
|
|
|
|
|
|
|
|
| |||||||||||
| Collective credit impairment charge/(release) | Half Year | Movement | ||||||||||||||||||
| Mar 14 $M | Sep 13 $M | Mar 13 $M | Mar 14 v. Sep 13 | Mar 14 v. Mar 13 | ||||||||||||||||
Retail Asia Pacific | (31 | ) | (20 | ) | (6 | ) | 55 | % | large | |||||||||||
Global Institutional | (21 | ) | 39 | 21 | large | large | ||||||||||||||
Transaction Banking | 18 | 9 | 10 | 100 | % | 80 | % | |||||||||||||
Global Loans | (40 | ) | 31 | 8 | large | large | ||||||||||||||
Global Markets | 1 | (1 | ) | 3 | large | -67 | % | |||||||||||||
Relationship & Infrastructure | (2 | ) | 1 | 2 | large | large | ||||||||||||||
|
|
|
|
|
|
|
|
|
| |||||||||||
Collective credit impairment charge/(release) | (54 | ) | 20 | 17 | large | large | ||||||||||||||
|
|
|
|
|
|
|
|
|
| |||||||||||
Total credit impairment charge/(release) | 161 | 133 | 184 | 21 | % | -13 | % | |||||||||||||
|
|
|
|
|
|
|
|
|
| |||||||||||
| Net loans & advances | As at ($M) | Movement | ||||||||||||||||||
| Mar 14 | Sep 13 | Mar 13 | Mar 14 v. Sep 13 | Mar 14 v. Mar 13 | ||||||||||||||||
Retail Asia Pacific | 7,851 | 7,222 | 5,694 | 9 | % | 38 | % | |||||||||||||
Global Institutional | 126,503 | 114,532 | 107,451 | 10 | % | 18 | % | |||||||||||||
Transaction Banking | 30,772 | 28,775 | 26,277 | 7 | % | 17 | % | |||||||||||||
Global Loans | 80,459 | 72,625 | 69,348 | 11 | % | 16 | % | |||||||||||||
Global Markets | 15,272 | 13,132 | 11,826 | 16 | % | 29 | % | |||||||||||||
Relationship & Infrastructure | 1,989 | 1,718 | 1,315 | 16 | % | 51 | % | |||||||||||||
|
|
|
|
|
|
|
|
|
| |||||||||||
Net loans & advances | 136,343 | 123,472 | 114,460 | 10 | % | 19 | % | |||||||||||||
|
|
|
|
|
|
|
|
|
| |||||||||||
| Customer deposits | As at ($M) | Movement | ||||||||||||||||||
| Mar 14 | Sep 13 | Mar 13 | Mar 14 v. Sep 13 | Mar 14 v. Mar 13 | ||||||||||||||||
Retail Asia Pacific | 13,336 | 12,916 | 10,932 | 3 | % | 22 | % | |||||||||||||
Global Institutional | 157,084 | 148,716 | 139,547 | 6 | % | 13 | % | |||||||||||||
Transaction Banking | 79,689 | 74,641 | 62,511 | 7 | % | 27 | % | |||||||||||||
Global Loans | 889 | 730 | 722 | 22 | % | 23 | % | |||||||||||||
Global Markets | 76,506 | 73,345 | 76,314 | 4 | % | 0 | % | |||||||||||||
Relationship & Infrastructure | 1,603 | 1,519 | 1,368 | 6 | % | 17 | % | |||||||||||||
|
|
|
|
|
|
|
|
|
| |||||||||||
Customer deposits | 172,023 | 163,151 | 151,847 | 5 | % | 13 | % | |||||||||||||
|
|
|
|
|
|
|
|
|
| |||||||||||
53
SEGMENT REVIEW
International and Institutional Banking
Andrew Geczy
Global Institutional
| Half Year | Movement | |||||||||||||||||||
| Mar 14 $M | Sep 13 $M | Mar 13 $M | Mar 14 v. Sep 13 | Mar 14 v. Mar 13 | ||||||||||||||||
Net interest income | 1,730 | 1,656 | 1,551 | 4 | % | 12 | % | |||||||||||||
Other operating income | 1,161 | 991 | 1,136 | 17 | % | 2 | % | |||||||||||||
|
|
|
|
|
|
|
|
|
| |||||||||||
Operating income | 2,891 | 2,647 | 2,687 | 9 | % | 8 | % | |||||||||||||
Operating expenses | (1,163 | ) | (1,082 | ) | (1,115 | ) | 7 | % | 4 | % | ||||||||||
|
|
|
|
|
|
|
|
|
| |||||||||||
Profit before credit impairment and income tax | 1,728 | 1,565 | 1,572 | 10 | % | 10 | % | |||||||||||||
Credit impairment charge | (153 | ) | (113 | ) | (165 | ) | 35 | % | -7 | % | ||||||||||
|
|
|
|
|
|
|
|
|
| |||||||||||
Profit before income tax | 1,575 | 1,452 | 1,407 | 8 | % | 12 | % | |||||||||||||
Income tax expense and non-controlling interests | (433 | ) | (387 | ) | (396 | ) | 12 | % | 9 | % | ||||||||||
|
|
|
|
|
|
|
|
|
| |||||||||||
Cash profit | 1,142 | 1,065 | 1,011 | 7 | % | 13 | % | |||||||||||||
|
|
|
|
|
|
|
|
|
| |||||||||||
Consisting of: | ||||||||||||||||||||
Transaction Banking | 228 | 303 | 255 | -25 | % | -11 | % | |||||||||||||
Global Loans | 433 | 398 | 357 | 9 | % | 21 | % | |||||||||||||
Global Markets | 481 | 364 | 399 | 32 | % | 21 | % | |||||||||||||
|
|
|
|
|
|
|
|
|
| |||||||||||
Cash profit | 1,142 | 1,065 | 1,011 | 7 | % | 13 | % | |||||||||||||
|
|
|
|
|
|
|
|
|
| |||||||||||
Balance Sheet | ||||||||||||||||||||
Net loans & advances | 126,503 | 114,532 | 107,451 | 10 | % | 18 | % | |||||||||||||
Other external assets | 171,924 | 166,648 | 166,054 | 3 | % | 4 | % | |||||||||||||
|
|
|
|
|
|
|
|
|
| |||||||||||
External assets | 298,427 | 281,180 | 273,505 | 6 | % | 9 | % | |||||||||||||
|
|
|
|
|
|
|
|
|
| |||||||||||
Customer deposits | 157,084 | 148,716 | 139,547 | 6 | % | 13 | % | |||||||||||||
Other deposits and borrowings | 38,168 | 33,636 | 37,045 | 13 | % | 3 | % | |||||||||||||
|
|
|
|
|
|
|
|
|
| |||||||||||
Deposits and other borrowings | 195,252 | 182,352 | 176,592 | 7 | % | 11 | % | |||||||||||||
Other external liabilities | 60,945 | 56,994 | 53,964 | 7 | % | 13 | % | |||||||||||||
|
|
|
|
|
|
|
|
|
| |||||||||||
External liabilities | 256,197 | 239,346 | 230,556 | 7 | % | 11 | % | |||||||||||||
|
|
|
|
|
|
|
|
|
| |||||||||||
Risk weighted assets | 180,445 | 165,922 | 158,117 | 9 | % | 14 | % | |||||||||||||
Average net loans and advances | 122,457 | 112,681 | 103,749 | 9 | % | 18 | % | |||||||||||||
Average deposits and other borrowings | 201,211 | 181,940 | 170,086 | 11 | % | 18 | % | |||||||||||||
Ratios | ||||||||||||||||||||
Return on assets | 0.76 | % | 0.75 | % | 0.77 | % | ||||||||||||||
Net interest margin | 1.40 | % | 1.42 | % | 1.48 | % | ||||||||||||||
Net interest margin (excluding Global Markets) | 2.23 | % | 2.38 | % | 2.51 | % | ||||||||||||||
Operating expenses to operating income | 40.2 | % | 40.9 | % | 41.5 | % | ||||||||||||||
Operating expenses to average assets | 0.78 | % | 0.76 | % | 0.85 | % | ||||||||||||||
|
|
|
|
|
|
|
|
|
| |||||||||||
Individual credit impairment charge/(release) | 174 | 74 | 144 | large | 21 | % | ||||||||||||||
Individual credit impairment charge/(release) as a % of average net advances | 0.28 | % | 0.13 | % | 0.28 | % | ||||||||||||||
Collective credit impairment charge/(release) | (21 | ) | 39 | 21 | large | large | ||||||||||||||
Collective credit impairment charge/(release) as a % of average net advances | (0.03 | %) | 0.07 | % | 0.04 | % | ||||||||||||||
Net impaired assets | 877 | 1,237 | 1,351 | -28 | % | -35 | % | |||||||||||||
Net impaired assets as a % of net advances | 0.69 | % | 1.08 | % | 1.26 | % | ||||||||||||||
|
|
|
|
|
|
|
|
|
| |||||||||||
54
SEGMENT REVIEW
International and Institutional Banking
Andrew Geczy
Global Institutional by Product
| Half Year | Movement | |||||||||||||||||||
| Transaction Banking | Mar 14 $M | Sep 13 $M | Mar 13 $M | Mar 14 v. Sep 13 | Mar 14 v. Mar 13 | |||||||||||||||
Net interest income | 442 | 425 | 385 | 4 | % | 15 | % | |||||||||||||
Other operating income | 373 | 359 | 348 | 4 | % | 7 | % | |||||||||||||
|
|
|
|
|
|
|
|
|
| |||||||||||
Operating income | 815 | 784 | 733 | 4 | % | 11 | % | |||||||||||||
Operating expenses | (379 | ) | (355 | ) | (352 | ) | 7 | % | 8 | % | ||||||||||
|
|
|
|
|
|
|
|
|
| |||||||||||
Profit before credit impairment and income tax | 436 | 429 | 381 | 2 | % | 14 | % | |||||||||||||
Credit impairment charge | (119 | ) | (20 | ) | (25 | ) | large | large | ||||||||||||
|
|
|
|
|
|
|
|
|
| |||||||||||
Profit before income tax | 317 | 409 | 356 | -22 | % | -11 | % | |||||||||||||
Income tax expense and non-controlling interests | (89 | ) | (106 | ) | (101 | ) | -16 | % | -12 | % | ||||||||||
|
|
|
|
|
|
|
|
|
| |||||||||||
Cash profit | 228 | 303 | 255 | -25 | % | -11 | % | |||||||||||||
|
|
|
|
|
|
|
|
|
| |||||||||||
Risk weighted assets | 37,918 | 35,590 | 34,834 | 7 | % | 9 | % | |||||||||||||
|
|
|
|
|
|
|
|
|
| |||||||||||
Individual credit impairment charge/(release) | 101 | 11 | 15 | large | large | |||||||||||||||
Collective credit impairment charge/(release) | 18 | 9 | 10 | 100 | % | 80 | % | |||||||||||||
Net loans & advances | 30,772 | 28,775 | 26,277 | 7 | % | 17 | % | |||||||||||||
Customer deposits | 79,689 | 74,641 | 62,511 | 7 | % | 27 | % | |||||||||||||
|
|
|
|
|
|
|
|
|
| |||||||||||
Global Loans | ||||||||||||||||||||
Net interest income | 765 | 790 | 790 | -3 | % | -3 | % | |||||||||||||
Other operating income | 68 | 65 | 45 | 5 | % | 51 | % | |||||||||||||
|
|
|
|
|
|
|
|
|
| |||||||||||
Operating income | 833 | 855 | 835 | -3 | % | 0 | % | |||||||||||||
Operating expenses | (222 | ) | (209 | ) | (209 | ) | 6 | % | 6 | % | ||||||||||
|
|
|
|
|
|
|
|
|
| |||||||||||
Profit before credit impairment and income tax | 611 | 646 | 626 | -5 | % | -2 | % | |||||||||||||
Credit impairment charge | (12 | ) | (95 | ) | (130 | ) | -87 | % | -91 | % | ||||||||||
|
|
|
|
|
|
|
|
|
| |||||||||||
Profit before income tax | 599 | 551 | 496 | 9 | % | 21 | % | |||||||||||||
Income tax expense and non-controlling interests | (166 | ) | (153 | ) | (139 | ) | 8 | % | 19 | % | ||||||||||
|
|
|
|
|
|
|
|
|
| |||||||||||
Cash profit | 433 | 398 | 357 | 9 | % | 21 | % | |||||||||||||
|
|
|
|
|
|
|
|
|
| |||||||||||
Risk weighted assets | 87,788 | 81,215 | 74,992 | 8 | % | 17 | % | |||||||||||||
|
|
|
|
|
|
|
|
|
| |||||||||||
Individual credit impairment charge/(release) | 52 | 64 | 122 | -19 | % | -57 | % | |||||||||||||
Collective credit impairment charge/(release) | (40 | ) | 31 | 8 | large | large | ||||||||||||||
Net loans & advances | 80,459 | 72,625 | 69,348 | 11 | % | 16 | % | |||||||||||||
Customer deposits | 889 | 730 | 722 | 22 | % | 23 | % | |||||||||||||
|
|
|
|
|
|
|
|
|
| |||||||||||
Global Markets | ||||||||||||||||||||
Net interest income | 523 | 441 | 376 | 19 | % | 39 | % | |||||||||||||
Other operating income | 720 | 567 | 743 | 27 | % | -3 | % | |||||||||||||
|
|
|
|
|
|
|
|
|
| |||||||||||
Operating income | 1,243 | 1,008 | 1,119 | 23 | % | 11 | % | |||||||||||||
Operating expenses | (562 | ) | (518 | ) | (554 | ) | 8 | % | 1 | % | ||||||||||
|
|
|
|
|
|
|
|
|
| |||||||||||
Profit before credit impairment and income tax | 681 | 490 | 565 | 39 | % | 21 | % | |||||||||||||
Credit impairment (charge)/release | (22 | ) | 2 | (10 | ) | large | large | |||||||||||||
|
|
|
|
|
|
|
|
|
| |||||||||||
Profit before income tax | 659 | 492 | 555 | 34 | % | 19 | % | |||||||||||||
Income tax expense and non-controlling interests | (178 | ) | (128 | ) | (156 | ) | 39 | % | 14 | % | ||||||||||
|
|
|
|
|
|
|
|
|
| |||||||||||
Cash profit | 481 | 364 | 399 | 32 | % | 21 | % | |||||||||||||
|
|
|
|
|
|
|
|
|
| |||||||||||
Risk weighted assets | 54,739 | 49,117 | 48,291 | 11 | % | 13 | % | |||||||||||||
|
|
|
|
|
|
|
|
|
| |||||||||||
Individual credit impairment charge/(release) | 21 | (1 | ) | 7 | large | large | ||||||||||||||
Collective credit impairment charge/(release) | 1 | (1 | ) | 3 | large | -67 | % | |||||||||||||
Net loans & advances | 15,272 | 13,132 | 11,826 | 16 | % | 29 | % | |||||||||||||
Customer deposits | 76,506 | 73,345 | 76,314 | 4 | % | 0 | % | |||||||||||||
|
|
|
|
|
|
|
|
|
| |||||||||||
55
SEGMENT REVIEW
International and Institutional Banking
Andrew Geczy
Analysis of Global Markets operating income
| Half Year | Movement | |||||||||||||||||||
| Composition of Global Markets operating income by product class | Mar 14 $M | Sep 13 $M | Mar 13 $M | Mar 14 v. Sep 13 | Mar 14 v. Mar 13 | |||||||||||||||
Fixed income | 504 | 330 | 472 | 53 | % | 7 | % | |||||||||||||
Foreign exchange | 526 | 460 | 414 | 14 | % | 27 | % | |||||||||||||
Capital markets | 118 | 104 | 122 | 13 | % | -3 | % | |||||||||||||
Other | 95 | 114 | 111 | -17 | % | -14 | % | |||||||||||||
|
|
|
|
|
|
|
|
|
| |||||||||||
Global Markets operating income | 1,243 | 1,008 | 1,119 | 23 | % | 11 | % | |||||||||||||
|
|
|
|
|
|
|
|
|
| |||||||||||
| Half Year | Movement | |||||||||||||||||||
| Composition of Global Markets operating income by geography | Mar 14 $M | Sep 13 $M | Mar 13 $M | Mar 14 v. Sep 13 | Mar 14 v. Mar 13 | |||||||||||||||
Australia | 493 | 461 | 527 | 7 | % | -6 | % | |||||||||||||
Asia Pacific, Europe & America | 602 | 451 | 451 | 33 | % | 33 | % | |||||||||||||
New Zealand | 148 | 96 | 141 | 54 | % | 5 | % | |||||||||||||
|
|
|
|
|
|
|
|
|
| |||||||||||
Global Markets operating income | 1,243 | 1,008 | 1,119 | 23 | % | 11 | % | |||||||||||||
|
|
|
|
|
|
|
|
|
| |||||||||||
| Half Year | Movement | |||||||||||||||||||
| Composition of Global Markets operating income by activity | Mar 14 $M | Sep 13 $M | Mar 13 $M | Mar 14 v. Sep 13 | Mar 14 v. Mar 13 | |||||||||||||||
Sales1 | 635 | 590 | 561 | 8 | % | 13 | % | |||||||||||||
Trading2 | 322 | 254 | 302 | 27 | % | 7 | % | |||||||||||||
Balance sheet3 | 286 | 164 | 256 | 74 | % | 12 | % | |||||||||||||
|
|
|
|
|
|
|
|
|
| |||||||||||
Global Markets operating income | 1,243 | 1,008 | 1,119 | 23 | % | 11 | % | |||||||||||||
|
|
|
|
|
|
|
|
|
| |||||||||||
| Half Year | Movement | |||||||||||||||||||
| Composition of Global Markets Sales income by geography1 | Mar 14 $M | Sep 13 $M | Mar 13 $M | Mar 14 v. Sep 13 | Mar 14 v. Mar 13 | |||||||||||||||
Australia | 248 | 236 | 253 | 5 | % | -2 | % | |||||||||||||
Asia Pacific, Europe & America | 318 | 287 | 259 | 11 | % | 23 | % | |||||||||||||
New Zealand | 69 | 67 | 49 | 3 | % | 41 | % | |||||||||||||
|
|
|
|
|
|
|
|
|
| |||||||||||
Global Markets Sales income | 635 | 590 | 561 | 8 | % | 13 | % | |||||||||||||
|
|
|
|
|
|
|
|
|
| |||||||||||
| Half Year | Movement | |||||||||||||||||||
| Composition of Global Markets Trading and Balance Sheet income by geography2,3 | Mar 14 $M | Sep 13 $M | Mar 13 $M | Mar 14 v. Sep 13 | Mar 14 v. Mar 13 | |||||||||||||||
Australia | 245 | 225 | 274 | 9 | % | -11 | % | |||||||||||||
Asia Pacific, Europe & America | 284 | 164 | 192 | 73 | % | 48 | % | |||||||||||||
New Zealand | 79 | 29 | 92 | large | -14 | % | ||||||||||||||
|
|
|
|
|
|
|
|
|
| |||||||||||
Global Markets Trading and Balance Sheet income | 608 | 418 | 558 | 45 | % | 9 | % | |||||||||||||
|
|
|
|
|
|
|
|
|
| |||||||||||
| 1. | Sales represents direct client flow business on core products such as fixed income, FX, commodities and capital markets. |
| 2. | Trading primarily represents management of the Group’s strategic positions and those taken as part of direct client sales flow. |
| 3. | Balance sheet represents hedging of interest rate risk on the Group’s loan and deposit books and the management of the Group’s liquidity portfolio. |
56
SEGMENT REVIEW
International and Institutional Banking
Andrew Geczy
Analysis of Global Markets operating income
Global Markets continues to benefit from its expansion into APEA, which now accounts for 48% of operating income. Across the APEA region, particularly Asia, there is significant customer demand for foreign exchange and commodity products.
Improvements in the New Zealand economy have created favourable trading conditions that have driven growth across the Fixed Income business.
Operating income from Australia decreased 6% relative to the prior comparable period, as movements in interest rates and credit spreads resulted in reduced levels of fixed income trading gains being recorded as well as decreased levels of debt capital markets activity as customers preferred loans to fixed income instruments.
| • | March 2014 half year v March 2013 half year |
In relatively similar trading conditions the customer franchise was the key driver in increasing revenue by 11%:
| • | Sales growth continues to be propelled by foreign exchange and commodity products. |
| • | APEA operating income increased 33%, driven by strong growth across the foreign exchange business, with high levels of customer demand in China, Hong Kong and Taiwan. |
| • | Although credit spreads have tightened, the magnitude relative to the March 2013 half is not as significant when compared to September 2013. |
| • | March 2014 half year v September 2013 half year |
A sustained period of strong client acquisition and favourable trading conditions has increased revenue by 23%:
| • | The increase in sales revenues (including Capital Markets) are mainly attributable to the foreign exchange business where the weakening AUD and higher CNY volatility have led to increased customer hedging activity. |
| • | APEA operating income increased 33%, driven by strong demand for foreign exchange hedging and precious metals products. |
| • | Further tightening of credit spreads has benefited the Fixed Income business in Australia and New Zealand. |
57
SEGMENT REVIEW
International and Institutional Banking
Andrew Geczy
Market risk
Traded market risk
Below are aggregate Value at Risk (VaR) exposures at 99% confidence level covering both physical and derivatives trading positions for the Bank’s principal trading centres. All figures are in AUD.
99% confidence level (1 day holding period)
| As at Mar 14 | High for period Mar 14 | Low for period Mar 14 | Avg for period Mar 14 | As at Sep 13 | High for year Sep 13 | Low for year Sep 13 | Avg for year Sep 13 | |||||||||||||||||||||||||
| $M | $M | $M | $M | $M | $M | $M | $M | |||||||||||||||||||||||||
Value at Risk at 99% confidence | ||||||||||||||||||||||||||||||||
Foreign exchange | 8.4 | 13.5 | 2.8 | 6.9 | 3.0 | 12.6 | 2.3 | 5.2 | ||||||||||||||||||||||||
Interest rate | 9.5 | 16.6 | 3.2 | 7.7 | 3.9 | 11.6 | 2.8 | 5.8 | ||||||||||||||||||||||||
Credit | 2.8 | 5.2 | 2.8 | 3.9 | 4.2 | 8.6 | 2.8 | 4.2 | ||||||||||||||||||||||||
Commodities | 1.2 | 2.1 | 1.1 | 1.5 | 1.6 | 4.2 | 1.2 | 2.3 | ||||||||||||||||||||||||
Equity | 0.7 | 2.2 | 0.4 | 1.0 | 1.4 | 3.4 | 0.6 | 1.6 | ||||||||||||||||||||||||
Diversification benefit | (7.4 | ) | n/a | n/a | (9.3 | ) | (8.5 | ) | n/a | n/a | (10.4 | ) | ||||||||||||||||||||
|
|
|
|
|
|
|
|
|
|
|
|
|
|
|
| |||||||||||||||||
Total VaR | 15.2 | 18.0 | 5.5 | 11.7 | 5.6 | 13.6 | 4.9 | 8.7 | ||||||||||||||||||||||||
|
|
|
|
|
|
|
|
|
|
|
|
|
|
|
| |||||||||||||||||
Non-traded interest rate risk
Non-traded interest rate risk is managed by Global Markets and relates to the potential adverse impact of changes in market interest rates on future net interest income for the Group. Interest rate risk is reported using various techniques including VaR and scenario analysis to a 1% rate shock.
99% confidence level (1 day holding period)
| As at Mar 14 | High for period Mar 14 | Low for period Mar 14 | Avg for period Mar 14 | As at Sep 13 | High for year Sep 13 | Low for year Sep 13 | Avg for year Sep 13 | |||||||||||||||||||||||||
| $M | $M | $M | $M | $M | $M | $M | $M | |||||||||||||||||||||||||
Value at Risk at 99% confidence | ||||||||||||||||||||||||||||||||
Australia | 54.3 | 64.5 | 52.0 | 57.9 | 66.3 | 71.8 | 25.5 | 49.3 | ||||||||||||||||||||||||
New Zealand | 10.9 | 11.4 | 10.1 | 10.9 | 12.6 | 17.9 | 10.0 | 13.2 | ||||||||||||||||||||||||
Asia Pacific, Europe & America | 10.4 | 10.6 | 9.3 | 10.0 | 9.7 | 11.1 | 4.2 | 6.3 | ||||||||||||||||||||||||
Diversification benefit | (19.3 | ) | n/a | n/a | (12.8 | ) | (11.4 | ) | n/a | n/a | (16.1 | ) | ||||||||||||||||||||
|
|
|
|
|
|
|
|
|
|
|
|
|
|
|
| |||||||||||||||||
Total VaR | 56.3 | 76.3 | 56.3 | 66.0 | 77.2 | 79.6 | 27.3 | 52.7 | ||||||||||||||||||||||||
|
|
|
|
|
|
|
|
|
|
|
|
|
|
|
| |||||||||||||||||
Impact of 1% rate shock on the next 12 months’ net interest income1
| As at | ||||||||
| Mar 14 | Sep 13 | |||||||
As at period end | 0.76 | % | 1.00 | % | ||||
Maximum exposure | 1.51 | % | 1.72 | % | ||||
Minimum exposure | 0.76 | % | 1.00 | % | ||||
Average exposure (in absolute terms) | 1.14 | % | 1.29 | % | ||||
| 1. | The impact is expressed as a percentage of net interest income. A positive result indicates that a rate increase is positive for net interest income. Conversely, a negative indicates a rate increase is negative for net interest income. |
58
SEGMENT REVIEW
International and Institutional Banking
Andrew Geczy
Global Institutional by Geography
| Half Year | Movement | |||||||||||||||||||
| Australia | Mar 14 $M | Sep 13 $M | Mar 13 $M | Mar 14 v. Sep 13 | Mar 14 v. Mar 13 | |||||||||||||||
Net interest income | 1,001 | 980 | 934 | 2 | % | 7 | % | |||||||||||||
Other operating income | 442 | 459 | 575 | -4 | % | -23 | % | |||||||||||||
|
|
|
|
|
|
|
|
|
| |||||||||||
Operating income | 1,443 | 1,439 | 1,509 | 0 | % | -4 | % | |||||||||||||
Operating expenses | (544 | ) | (537 | ) | (574 | ) | 1 | % | -5 | % | ||||||||||
|
|
|
|
|
|
|
|
|
| |||||||||||
Profit before credit impairment and income tax | 899 | 902 | 935 | 0 | % | -4 | % | |||||||||||||
Credit impairment charge | (77 | ) | (33 | ) | (80 | ) | large | -4 | % | |||||||||||
|
|
|
|
|
|
|
|
|
| |||||||||||
Profit before income tax | 822 | �� | 869 | 855 | -5 | % | -4 | % | ||||||||||||
Income tax expense and non-controlling interests | (248 | ) | (254 | ) | (256 | ) | -2 | % | -3 | % | ||||||||||
|
|
|
|
|
|
|
|
|
| |||||||||||
Cash profit | 574 | 615 | 599 | -7 | % | -4 | % | |||||||||||||
|
|
|
|
|
|
|
|
|
| |||||||||||
Risk weighted assets | 83,814 | 79,118 | 79,711 | 6 | % | 5 | % | |||||||||||||
|
|
|
|
|
|
|
|
|
| |||||||||||
Individual credit impairment charge/(release) | 81 | 11 | 77 | large | 5 | % | ||||||||||||||
Collective credit impairment charge/(release) | (4 | ) | 22 | 3 | large | large | ||||||||||||||
Net loans & advances | 55,106 | 49,527 | 49,483 | 11 | % | 11 | % | |||||||||||||
Customer deposits | 60,890 | 56,881 | 52,115 | 7 | % | 17 | % | |||||||||||||
|
|
|
|
|
|
|
|
|
| |||||||||||
Asia Pacific, Europe & America | ||||||||||||||||||||
Net interest income | 569 | 528 | 474 | 8 | % | 20 | % | |||||||||||||
Other operating income | 590 | 449 | 437 | 31 | % | 35 | % | |||||||||||||
|
|
|
|
|
|
|
|
|
| |||||||||||
Operating income | 1,159 | 977 | 911 | 19 | % | 27 | % | |||||||||||||
Operating expenses | (530 | ) | (462 | ) | (462 | ) | 15 | % | 15 | % | ||||||||||
|
|
|
|
|
|
|
|
|
| |||||||||||
Profit before credit impairment and income tax | 629 | 515 | 449 | 22 | % | 40 | % | |||||||||||||
Credit impairment charge | (77 | ) | (69 | ) | (80 | ) | 12 | % | -4 | % | ||||||||||
|
|
|
|
|
|
|
|
|
| |||||||||||
Profit before income tax | 552 | 446 | 369 | 24 | % | 50 | % | |||||||||||||
Income tax expense and non-controlling interests | (129 | ) | (95 | ) | (91 | ) | 36 | % | 42 | % | ||||||||||
|
|
|
|
|
|
|
|
|
| |||||||||||
Cash profit | 423 | 351 | 278 | 21 | % | 52 | % | |||||||||||||
|
|
|
|
|
|
|
|
|
| |||||||||||
Risk weighted assets | 83,495 | 75,080 | 67,771 | 11 | % | 23 | % | |||||||||||||
|
|
|
|
|
|
|
|
|
| |||||||||||
Individual credit impairment charge/(release) | 86 | 54 | 64 | 59 | % | 34 | % | |||||||||||||
Collective credit impairment charge/(release) | (9 | ) | 15 | 16 | large | large | ||||||||||||||
Net loans & advances | 64,960 | 58,751 | 52,273 | 11 | % | 24 | % | |||||||||||||
Customer deposits | 83,464 | 79,765 | 77,142 | 5 | % | 8 | % | |||||||||||||
|
|
|
|
|
|
|
|
|
| |||||||||||
New Zealand | ||||||||||||||||||||
Net interest income | 160 | 148 | 143 | 8 | % | 12 | % | |||||||||||||
Other operating income | 129 | 83 | 124 | 55 | % | 4 | % | |||||||||||||
|
|
|
|
|
|
|
|
|
| |||||||||||
Operating income | 289 | 231 | 267 | 25 | % | 8 | % | |||||||||||||
Operating expenses | (89 | ) | (83 | ) | (79 | ) | 7 | % | 13 | % | ||||||||||
|
|
|
|
|
|
|
|
|
| |||||||||||
Profit before credit impairment and income tax | 200 | 148 | 188 | 35 | % | 6 | % | |||||||||||||
Credit impairment (charge)/release | 1 | (11 | ) | (5 | ) | large | large | |||||||||||||
|
|
|
|
|
|
|
|
|
| |||||||||||
Profit before income tax | 201 | 137 | 183 | 47 | % | 10 | % | |||||||||||||
Income tax expense and non-controlling interests | (56 | ) | (38 | ) | (49 | ) | 47 | % | 14 | % | ||||||||||
|
|
|
|
|
|
|
|
|
| |||||||||||
Cash profit | 145 | 99 | 134 | 46 | % | 8 | % | |||||||||||||
|
|
|
|
|
|
|
|
|
| |||||||||||
Risk weighted assets | 13,136 | 11,724 | 10,635 | 12 | % | 24 | % | |||||||||||||
|
|
|
|
|
|
|
|
|
| |||||||||||
Individual credit impairment charge/(release) | 7 | 9 | 3 | -22 | % | large | ||||||||||||||
Collective credit impairment charge/(release) | (8 | ) | 2 | 2 | large | large | ||||||||||||||
Net loans & advances | 6,437 | 6,254 | 5,695 | 3 | % | 13 | % | |||||||||||||
Customer deposits | 12,730 | 12,070 | 10,290 | 5 | % | 24 | % | |||||||||||||
|
|
|
|
|
|
|
|
|
| |||||||||||
59
SEGMENT REVIEW
International and Institutional Banking
Andrew Geczy
Retail Asia Pacific
| Half Year | Movement | |||||||||||||||||||
| Mar 14 $M | Sep 13 $M | Mar 13 $M | Mar 14 v. Sep 13 | Mar 14 v. Mar 13 | ||||||||||||||||
Net interest income | 225 | 218 | 206 | 3 | % | 9 | % | |||||||||||||
Other operating income | 177 | 165 | 159 | 7 | % | 11 | % | |||||||||||||
|
|
|
|
|
|
|
|
|
| |||||||||||
Operating income | 402 | 383 | 365 | 5 | % | 10 | % | |||||||||||||
Operating expenses | (345 | ) | (337 | ) | (313 | ) | 2 | % | 10 | % | ||||||||||
|
|
|
|
|
|
|
|
|
| |||||||||||
Profit before credit impairment and income tax | 57 | 46 | 52 | 24 | % | 10 | % | |||||||||||||
Credit impairment charge | (7 | ) | (18 | ) | (17 | ) | -61 | % | -59 | % | ||||||||||
|
|
|
|
|
|
|
|
|
| |||||||||||
Profit before income tax | 50 | 28 | 35 | 79 | % | 43 | % | |||||||||||||
Income tax expense and non-controlling interests | (7 | ) | (6 | ) | (8 | ) | 17 | % | -13 | % | ||||||||||
|
|
|
|
|
|
|
|
|
| |||||||||||
Cash profit | 43 | 22 | 27 | 95 | % | 59 | % | |||||||||||||
|
|
|
|
|
|
|
|
|
| |||||||||||
Risk weighted assets | 6,747 | 6,359 | 6,857 | 6 | % | -2 | % | |||||||||||||
|
|
|
|
|
|
|
|
|
| |||||||||||
Individual credit impairment charge/(release) | 38 | 38 | 23 | 0 | % | 65 | % | |||||||||||||
Collective credit impairment charge/(release) | (31 | ) | (20 | ) | (6 | ) | 55 | % | large | |||||||||||
Net loans & advances | 7,851 | 7,222 | 5,694 | 9 | % | 38 | % | |||||||||||||
Customer deposits | 13,336 | 12,916 | 10,932 | 3 | % | 22 | % | |||||||||||||
|
|
|
|
|
|
|
|
|
| |||||||||||
Asia Partnerships
| Half Year | Movement | |||||||||||||||||||
| Mar 14 $M | Sep 13 $M | Mar 13 $M | Mar 14 v. Sep 13 | Mar 14 v. Mar 13 | ||||||||||||||||
Net interest income | (8 | ) | (7 | ) | (6 | ) | 14 | % | 33 | % | ||||||||||
Other operating income | 252 | 236 | 206 | 7 | % | 22 | % | |||||||||||||
|
|
|
|
|
|
|
|
|
| |||||||||||
Operating income | 244 | 229 | 200 | 7 | % | 22 | % | |||||||||||||
Operating expenses | (4 | ) | (5 | ) | (4 | ) | -20 | % | 0 | % | ||||||||||
|
|
|
|
|
|
|
|
|
| |||||||||||
Profit before credit impairment and income tax | 240 | 224 | 196 | 7 | % | 22 | % | |||||||||||||
Credit impairment charge | — | — | — | n/a | n/a | |||||||||||||||
|
|
|
|
|
|
|
|
|
| |||||||||||
Profit before income tax | 240 | 224 | 196 | 7 | % | 22 | % | |||||||||||||
Income tax expense and non-controlling interests | (1 | ) | (3 | ) | (2 | ) | -67 | % | -50 | % | ||||||||||
|
|
|
|
|
|
|
|
|
| |||||||||||
Cash profit | 239 | 221 | 194 | 8 | % | 23 | % | |||||||||||||
|
|
|
|
|
|
|
|
|
| |||||||||||
60
SEGMENT REVIEW
This page has been left blank intentionally
61
SEGMENT REVIEW
New Zealand
David Hisco
The New Zealand division comprises Retail and Commercial business units.
New Zealand’s results and commentary are reported in NZD. AUD results are shown on page 67.
Cash profit – March 2014 Half Year v March 2013 Half Year
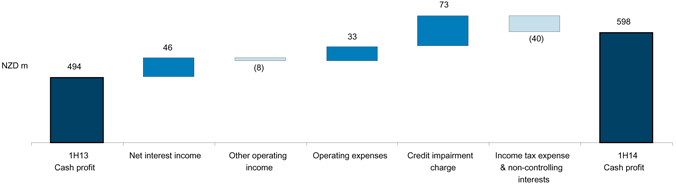
The completion of brand and systems integration in 2013 has positioned the New Zealand division to realise ongoing productivity gains. We are continuing to simplify the business and leverage scale. Productivity has given the business the capacity to invest in growth. We are investing in our digital channels, optimising our branch network and simplifying products and processes. We are enhancing the experience for our customers, and making it easier for them to do business with us.
We are growing our market share in target segments, and in the March 2014 half we grew both lending and deposits in excess of system1. At the same time we are improving the quality of our portfolio. We have created a platform for consistent, sustainable earnings growth.
Retail
Sound execution of the ‘simplify, leverage scale’ strategy is delivering a stronger Retail bank. Our staff are spending more time on the frontline with customers, growing revenue per FTE and per branch, and meeting more needs per customer. We are also achieving good lending growth whilst holding net interest margin in a competitive credit environment.
Commercial
The Commercial business has focused on growing Small Business Banking which continues to achieve above-system lending growth. Resources invested in improving credit quality in CommAgri have resulted in a significantly improved credit provisioning result. This business is now building new momentum in lending growth.
| • | March 2014 half year v March 2013 half year |
Cash profit increased 21%, driven by lending growth, cost productivity and credit quality improvement.
Key factors affecting the result were:
| • | Net interest income increased 4%, driven by lending growth. Average net loans and advances grew 5%, led by above-system growth in mortgages. Net interest margin contracted 2 bps. This was driven by lending competition and unfavourable lending mix as customers continue to favour lower margin fixed rate products over higher margin variable rate products. Return on capital was also lower in a low rate environment. These margin impacts were mostly offset by lower wholesale funding costs and improved deposit margins. |
| • | Other operating income decreased 4% due to income foregone following the divestment of EFTPOS New Zealand Limited (‘EFTPOS’). Excluding this factor, other operating income increased 4%, reflecting strong growth in credit card earnings. |
| • | Operating expenses decreased 6%. The March 2013 half included NZD 19 million of restructuring costs relating to the systems integration project. Excluding these costs, operating expenses decreased 2% as productivity gains exceeded inflationary and investment impacts. |
| • | Credit impairment charge decreased NZD 73 million. The individual credit impairment charge decreased 79% reflecting a slowing in the level of new provisions, particularly in the CommAgri book. The level of write-backs remain high. Although releases from the economic cycle provision decreased by NZD 11 million compared to the March 2013 half, improved credit quality resulted in the collective credit impairment release increasing 41%. |
| • | March 2014 half year v September 2013 half year |
The above factors have similarly driven a 5% increase in cash profit compared with the September 2013 half.
Key factors affecting the result were:
| • | Net interest income increased 2%, with the benefit from strong lending growth more than offsetting the impact of margin contraction. Net interest margin contracted 1 bp due to lending competition and unfavourable lending mix. |
| • | Other operating income decreased 11% as the September 2013 half included a gain from the divestment of EFTPOS. This impact was partly offset by strong growth in cards income. |
| • | Operating expenses decreased 1% with productivity gains from business simplification and leveraging business scale more than offsetting inflationary and investment impacts. |
| • | Credit impairment charge decreased NZD 47 million with the individual credit impairment charge 64% lower. The levels of new provisions have slowed, and write-backs remain high. The collective credit impairment release increased 63% despite lending growth, which reflected strong improvements in credit quality across the lending book. |
| 1 | Source: RBNZ schedules S7 and S8 : 5 months to February 2014. |
62
SEGMENT REVIEW
New Zealand
David Hisco
New Zealand Total
Table reflects NZD for New Zealand
AUD results shown on page 67
| Half Year | Movement | |||||||||||||||||||
| Mar 14 NZD M | Sep 13 NZD M | Mar 13 NZD M | Mar 14 v. Sep 13 | Mar 14 v. Mar 13 | ||||||||||||||||
Net interest income | 1,162 | 1,144 | 1,116 | 2 | % | 4 | % | |||||||||||||
Other operating income | 195 | 220 | 203 | -11 | % | -4 | % | |||||||||||||
|
|
|
|
|
|
|
|
|
| |||||||||||
Operating income | 1,357 | 1,364 | 1,319 | -1 | % | 3 | % | |||||||||||||
Operating expenses | (563 | ) | (571 | ) | (596 | ) | -1 | % | -6 | % | ||||||||||
|
|
|
|
|
|
|
|
|
| |||||||||||
Profit before credit impairment and income tax | 794 | 793 | 723 | 0 | % | 10 | % | |||||||||||||
Credit impairment (charge)/release | 37 | (10 | ) | (36 | ) | large | large | |||||||||||||
|
|
|
|
|
|
|
|
|
| |||||||||||
Profit before income tax | 831 | 783 | 687 | 6 | % | 21 | % | |||||||||||||
Income tax expense and non-controlling interests | (233 | ) | (214 | ) | (193 | ) | 9 | % | 21 | % | ||||||||||
|
|
|
|
|
|
|
|
|
| |||||||||||
Cash profit | 598 | 569 | 494 | 5 | % | 21 | % | |||||||||||||
|
|
|
|
|
|
|
|
|
| |||||||||||
Consisting of: | ||||||||||||||||||||
Retail | 222 | 202 | 177 | 10 | % | 25 | % | |||||||||||||
Commercial | 377 | 369 | 332 | 2 | % | 14 | % | |||||||||||||
Other | (1 | ) | (2 | ) | (15 | ) | -50 | % | -93 | % | ||||||||||
|
|
|
|
|
|
|
|
|
| |||||||||||
Cash profit | 598 | 569 | 494 | 5 | % | 21 | % | |||||||||||||
|
|
|
|
|
|
|
|
|
| |||||||||||
Balance Sheet | ||||||||||||||||||||
Net loans & advances | 94,140 | 91,628 | 89,414 | 3 | % | 5 | % | |||||||||||||
Other external assets | 4,075 | 3,903 | 3,807 | 4 | % | 7 | % | |||||||||||||
|
|
|
|
|
|
|
|
|
| |||||||||||
External assets | 98,215 | 95,531 | 93,221 | 3 | % | 5 | % | |||||||||||||
|
|
|
|
|
|
|
|
|
| |||||||||||
Customer deposits | 55,205 | 52,244 | 51,650 | 6 | % | 7 | % | |||||||||||||
Other deposits and borrowings | 5,401 | 4,765 | 4,337 | 13 | % | 25 | % | |||||||||||||
|
|
|
|
|
|
|
|
|
| |||||||||||
Deposits and other borrowings | 60,606 | 57,009 | 55,987 | 6 | % | 8 | % | |||||||||||||
Other external liabilities | 15,995 | 15,480 | 16,515 | 3 | % | -3 | % | |||||||||||||
|
|
|
|
|
|
|
|
|
| |||||||||||
External liabilities | 76,601 | 72,489 | 72,502 | 6 | % | 6 | % | |||||||||||||
|
|
|
|
|
|
|
|
|
| |||||||||||
Risk weighted assets | 53,798 | 50,049 | 50,488 | 7 | % | 7 | % | |||||||||||||
Average net loans and advances | 92,882 | 90,326 | 88,667 | 3 | % | 5 | % | |||||||||||||
Average deposits and other borrowings | 59,743 | 56,817 | 56,429 | 5 | % | 6 | % | |||||||||||||
Ratios | ||||||||||||||||||||
Return on assets | 1.24 | % | 1.21 | % | 1.08 | % | ||||||||||||||
Net interest margin | 2.48 | % | 2.49 | % | 2.50 | % | ||||||||||||||
Operating expenses to operating income | 41.5 | % | 41.9 | % | 45.2 | % | ||||||||||||||
Operating expenses to average assets | 1.17 | % | 1.22 | % | 1.29 | % | ||||||||||||||
|
|
|
|
|
|
|
|
|
| |||||||||||
Individual credit impairment charge/(release) | 15 | 42 | 73 | -64 | % | -79 | % | |||||||||||||
Individual credit impairment charge/(release) as a % of average net advances | 0.03 | % | 0.09 | % | 0.17 | % | ||||||||||||||
Collective credit impairment charge/(release) | (52 | ) | (32 | ) | (37 | ) | 63 | % | 41 | % | ||||||||||
Collective credit impairment charge/(release) as a % of average net advances | (0.11 | %) | (0.07 | %) | (0.08 | %) | ||||||||||||||
Net impaired assets | 477 | 573 | 881 | -17 | % | -46 | % | |||||||||||||
Net impaired assets as a % of net advances | 0.51 | % | 0.63 | % | 0.98 | % | ||||||||||||||
|
|
|
|
|
|
|
|
|
| |||||||||||
Total full time equivalent staff (FTE) | 7,323 | 7,400 | 7,755 | -1 | % | -6 | % | |||||||||||||
|
|
|
|
|
|
|
|
|
| |||||||||||
63
SEGMENT REVIEW
New Zealand
David Hisco
| Individual credit impairment charge/(release) | Half Year | Movement | ||||||||||||||||||
| Mar 14 NZD M | Sep 13 NZD M | Mar 13 NZD M | Mar 14 v. Sep 13 | Mar 14 v. Mar 13 | ||||||||||||||||
Retail | 28 | 37 | 39 | -24 | % | -28 | % | |||||||||||||
Commercial | (13 | ) | 5 | 34 | large | large | ||||||||||||||
CommAgri | (25 | ) | 4 | 28 | large | large | ||||||||||||||
Small Business Banking | 12 | 1 | 6 | large | 100 | % | ||||||||||||||
|
|
|
|
|
|
|
|
|
| |||||||||||
Individual credit impairment charge/(release) | 15 | 42 | 73 | -64 | % | -79 | % | |||||||||||||
|
|
|
|
|
|
|
|
|
| |||||||||||
| Collective credit impairment charge/(release) | Half Year | Movement | ||||||||||||||||||
| Mar 14 NZD M | Sep 13 NZD M | Mar 13 NZD M | Mar 14 v. Sep 13 | Mar 14 v. Mar 13 | ||||||||||||||||
Retail | (16 | ) | (10 | ) | (9 | ) | 60 | % | 78 | % | ||||||||||
Commercial | (36 | ) | (22 | ) | (28 | ) | 64 | % | 29 | % | ||||||||||
CommAgri | (33 | ) | (30 | ) | (19 | ) | 10 | % | 74 | % | ||||||||||
Small Business Banking | (3 | ) | 8 | (9 | ) | large | -67 | % | ||||||||||||
|
|
|
|
|
|
|
|
|
| |||||||||||
Collective credit impairment charge/(release) | (52 | ) | (32 | ) | (37 | ) | 63 | % | 41 | % | ||||||||||
|
|
|
|
|
|
|
|
|
| |||||||||||
Total credit impairment charge/(release) | (37 | ) | 10 | 36 | large | large | ||||||||||||||
|
|
|
|
|
|
|
|
|
| |||||||||||
| Net loans & advances | As at (NZD M) | Movement | ||||||||||||||||||
| Mar 14 | Sep 13 | Mar 13 | Mar 14 v. Sep 13 | Mar 14 v. Mar 13 | ||||||||||||||||
Retail | 36,875 | 36,422 | 35,806 | 1 | % | 3 | % | |||||||||||||
Commercial | 57,265 | 55,206 | 53,608 | 4 | % | 7 | % | |||||||||||||
CommAgri | 35,429 | 34,759 | 34,395 | 2 | % | 3 | % | |||||||||||||
Small Business Banking | 21,836 | 20,447 | 19,213 | 7 | % | 14 | % | |||||||||||||
|
|
|
|
|
|
|
|
|
| |||||||||||
Net loans & advances | 94,140 | 91,628 | 89,414 | 3 | % | 5 | % | |||||||||||||
|
|
|
|
|
|
|
|
|
| |||||||||||
| Customer deposits | As at (NZD M) | Movement | ||||||||||||||||||
| Mar 14 | Sep 13 | Mar 13 | Mar 14 v. Sep 13 | Mar 14 v. Mar 13 | ||||||||||||||||
Retail | 32,656 | 32,077 | 31,392 | 2 | % | 4 | % | |||||||||||||
Commercial | 22,549 | 20,167 | 20,258 | 12 | % | 11 | % | |||||||||||||
CommAgri | 10,832 | 9,414 | 9,644 | 15 | % | 12 | % | |||||||||||||
Small Business Banking | 11,717 | 10,753 | 10,614 | 9 | % | 10 | % | |||||||||||||
|
|
|
|
|
|
|
|
|
| |||||||||||
Customer deposits | 55,205 | 52,244 | 51,650 | 6 | % | 7 | % | |||||||||||||
|
|
|
|
|
|
|
|
|
| |||||||||||
64
SEGMENT REVIEW
New Zealand
David Hisco
Retail
| Half Year | Movement | |||||||||||||||||||
| Mar 14 NZD M | Sep 13 NZD M | Mar 13 NZD M | Mar 14 v. Sep 13 | Mar 14 v. Mar 13 | ||||||||||||||||
Net interest income | 482 | 475 | 451 | 1 | % | 7 | % | |||||||||||||
Other operating income | 154 | 152 | 145 | 1 | % | 6 | % | |||||||||||||
|
|
|
|
|
|
|
|
|
| |||||||||||
Operating income | 636 | 627 | 596 | 1 | % | 7 | % | |||||||||||||
Operating expenses | (316 | ) | (319 | ) | (320 | ) | -1 | % | -1 | % | ||||||||||
|
|
|
|
|
|
|
|
|
| |||||||||||
Profit before credit impairment and income tax | 320 | 308 | 276 | 4 | % | 16 | % | |||||||||||||
Credit impairment (charge)/release | (12 | ) | (27 | ) | (30 | ) | -56 | % | -60 | % | ||||||||||
|
|
|
|
|
|
|
|
|
| |||||||||||
Profit before income tax | 308 | 281 | 246 | 10 | % | 25 | % | |||||||||||||
Income tax expense and non-controlling interests | (86 | ) | (79 | ) | (69 | ) | 9 | % | 25 | % | ||||||||||
|
|
|
|
|
|
|
|
|
| |||||||||||
Cash profit | 222 | 202 | 177 | 10 | % | 25 | % | |||||||||||||
|
|
|
|
|
|
|
|
|
| |||||||||||
Risk weighted assets | 19,271 | 19,367 | 19,508 | 0 | % | -1 | % | |||||||||||||
|
|
|
|
|
|
|
|
|
| |||||||||||
| Half Year | Movement | |||||||||||||||||||
| Mar 14 NZD M | Sep 13 NZD M | Mar 13 NZD M | Mar 14 v. Sep 13 | Mar 14 v. Mar 13 | ||||||||||||||||
Individual credit impairment charge/(release) | 28 | 37 | 39 | -24 | % | -28 | % | |||||||||||||
Collective credit impairment charge/(release) | (16 | ) | (10 | ) | (9 | ) | 60 | % | 78 | % | ||||||||||
Net loans & advances | 36,875 | 36,422 | 35,806 | 1 | % | 3 | % | |||||||||||||
Customer deposits | 32,656 | 32,077 | 31,392 | 2 | % | 4 | % | |||||||||||||
65
SEGMENT REVIEW
New Zealand
David Hisco
Commercial
| Half Year | Movement | |||||||||||||||||||
| Mar 14 NZD M | Sep 13 NZD M | Mar 13 NZD M | Mar 14 v. Sep 13 | Mar 14 v. Mar 13 | ||||||||||||||||
Net interest income | 672 | 661 | 655 | 2 | % | 3 | % | |||||||||||||
Other operating income | 47 | 67 | 59 | -30 | % | -20 | % | |||||||||||||
|
|
|
|
|
|
|
|
|
| |||||||||||
Operating income | 719 | 728 | 714 | -1 | % | 1 | % | |||||||||||||
Operating expenses | (244 | ) | (240 | ) | (247 | ) | 2 | % | -1 | % | ||||||||||
|
|
|
|
|
|
|
|
|
| |||||||||||
Profit before credit impairment and income tax | 475 | 488 | 467 | -3 | % | 2 | % | |||||||||||||
Credit impairment (charge)/release | 49 | 17 | (6 | ) | large | large | ||||||||||||||
|
|
|
|
|
|
|
|
|
| |||||||||||
Profit before income tax | 524 | 505 | 461 | 4 | % | 14 | % | |||||||||||||
Income tax expense and non-controlling interests | (147 | ) | (136 | ) | (129 | ) | 8 | % | 14 | % | ||||||||||
|
|
|
|
|
|
|
|
|
| |||||||||||
Cash profit | 377 | 369 | 332 | 2 | % | 14 | % | |||||||||||||
|
|
|
|
|
|
|
|
|
| |||||||||||
Risk weighted assets | 34,196 | 30,407 | 30,797 | 12 | % | 11 | % | |||||||||||||
|
|
|
|
|
|
|
|
|
| |||||||||||
| Half Year | Movement | |||||||||||||||||||
| Individual credit impairment charge/(release) | Mar 14 NZD M | Sep 13 NZD M | Mar 13 NZD M | Mar 14 v. Sep 13 | Mar 14 v. Mar 13 | |||||||||||||||
CommAgri | (25 | ) | 4 | 28 | large | large | ||||||||||||||
Small Business Banking | 12 | 1 | 6 | large | 100 | % | ||||||||||||||
|
|
|
|
|
|
|
|
|
| |||||||||||
Individual credit impairment charge/(release) | (13 | ) | 5 | 34 | large | large | ||||||||||||||
|
|
|
|
|
|
|
|
|
| |||||||||||
Collective credit impairment charge/(release) | ||||||||||||||||||||
CommAgri | (33 | ) | (30 | ) | (19 | ) | 10 | % | 74 | % | ||||||||||
Small Business Banking | (3 | ) | 8 | (9 | ) | large | -67 | % | ||||||||||||
|
|
|
|
|
|
|
|
|
| |||||||||||
Collective credit impairment charge/(release) | (36 | ) | (22 | ) | (28 | ) | 64 | % | 29 | % | ||||||||||
|
|
|
|
|
|
|
|
|
| |||||||||||
Total credit impairment charge/(release) | (49 | ) | (17 | ) | 6 | large | large | |||||||||||||
|
|
|
|
|
|
|
|
|
| |||||||||||
| As at (NZD M) | Movement | |||||||||||||||||||
| Net loans & advances | Mar 14 | Sep 13 | Mar 13 | Mar 14 v. Sep 13 | Mar 14 v. Mar 13 | |||||||||||||||
CommAgri | 35,429 | 34,759 | 34,395 | 2 | % | 3 | % | |||||||||||||
Small Business Banking | 21,836 | 20,447 | 19,213 | 7 | % | 14 | % | |||||||||||||
|
|
|
|
|
|
|
|
|
| |||||||||||
Net loans & advances | 57,265 | 55,206 | 53,608 | 4 | % | 7 | % | |||||||||||||
|
|
|
|
|
|
|
|
|
| |||||||||||
Customer deposits | ||||||||||||||||||||
CommAgri | 10,832 | 9,414 | 9,644 | 15 | % | 12 | % | |||||||||||||
Small Business Banking | 11,717 | 10,753 | 10,614 | 9 | % | 10 | % | |||||||||||||
|
|
|
|
|
|
|
|
|
| |||||||||||
Customer deposits | 22,549 | 20,167 | 20,258 | 12 | % | 11 | % | |||||||||||||
|
|
|
|
|
|
|
|
|
| |||||||||||
66
SEGMENT REVIEW
New Zealand
David Hisco
New Zealand Total
Table reflects AUD for New Zealand
NZD results shown on page 63
| Half Year | Movement | |||||||||||||||||||
| Mar 14 $M | Sep 13 $M | Mar 13 $M | Mar 14 v. Sep 13 | Mar 14 v. Mar 13 | ||||||||||||||||
Net interest income | 1,061 | 973 | 891 | 9 | % | 19 | % | |||||||||||||
Other operating income | 178 | 186 | 162 | -4 | % | 10 | % | |||||||||||||
|
|
|
|
|
|
|
|
|
| |||||||||||
Operating income | 1,239 | 1,159 | 1,053 | 7 | % | 18 | % | |||||||||||||
Operating expenses | (514 | ) | (486 | ) | (475 | ) | 6 | % | 8 | % | ||||||||||
|
|
|
|
|
|
|
|
|
| |||||||||||
Profit before credit impairment and income tax | 725 | 673 | 578 | 8 | % | 25 | % | |||||||||||||
Credit impairment (charge)/release | 34 | (9 | ) | (28 | ) | large | large | |||||||||||||
|
|
|
|
|
|
|
|
|
| |||||||||||
Profit before income tax | 759 | 664 | 550 | 14 | % | 38 | % | |||||||||||||
Income tax expense and non-controlling interests | (213 | ) | (182 | ) | (154 | ) | 17 | % | 38 | % | ||||||||||
|
|
|
|
|
|
|
|
|
| |||||||||||
Cash profit | 546 | 482 | 396 | 13 | % | 38 | % | |||||||||||||
|
|
|
|
|
|
|
|
|
| |||||||||||
Consisting of: | ||||||||||||||||||||
Retail | 203 | 171 | 142 | 19 | % | 43 | % | |||||||||||||
Commercial | 344 | 313 | 265 | 10 | % | 30 | % | |||||||||||||
Other | (1 | ) | (2 | ) | (11 | ) | -50 | % | -91 | % | ||||||||||
|
|
|
|
|
|
|
|
|
| |||||||||||
Cash profit | 546 | 482 | 396 | 13 | % | 38 | % | |||||||||||||
|
|
|
|
|
|
|
|
|
| |||||||||||
Balance Sheet | ||||||||||||||||||||
Net loans & advances | 88,247 | 81,542 | 71,710 | 8 | % | 23 | % | |||||||||||||
Other external assets | 3,819 | 3,473 | 3,053 | 10 | % | 25 | % | |||||||||||||
|
|
|
|
|
|
|
|
|
| |||||||||||
External assets | 92,066 | 85,015 | 74,763 | 8 | % | 23 | % | |||||||||||||
|
|
|
|
|
|
|
|
|
| |||||||||||
Customer deposits | 51,749 | 46,494 | 41,423 | 11 | % | 25 | % | |||||||||||||
Other deposits and borrowings | 5,063 | 4,240 | 3,478 | 19 | % | 46 | % | |||||||||||||
|
|
|
|
|
|
|
|
|
| |||||||||||
Deposits and other borrowings | 56,812 | 50,734 | 44,901 | 12 | % | 27 | % | |||||||||||||
Other external liabilities | 14,994 | 13,776 | 13,246 | 9 | % | 13 | % | |||||||||||||
|
|
|
|
|
|
|
|
|
| |||||||||||
External liabilities | 71,806 | 64,510 | 58,147 | 11 | % | 23 | % | |||||||||||||
|
|
|
|
|
|
|
|
|
| |||||||||||
Risk weighted assets | 50,430 | 44,540 | 40,491 | 13 | % | 25 | % | |||||||||||||
Average net loans and advances | 84,756 | 76,777 | 70,745 | 10 | % | 20 | % | |||||||||||||
Average deposits and other borrowings | 54,516 | 48,311 | 45,023 | 13 | % | 21 | % | |||||||||||||
Ratios | ||||||||||||||||||||
Return on assets | 1.24 | % | 1.21 | % | 1.08 | % | ||||||||||||||
Net interest margin | 2.48 | % | 2.49 | % | 2.50 | % | ||||||||||||||
Operating expenses to operating income | 41.5 | % | 41.9 | % | 45.2 | % | ||||||||||||||
Operating expenses to average assets | 1.17 | % | 1.22 | % | 1.29 | % | ||||||||||||||
|
|
|
|
|
|
|
|
|
| |||||||||||
Individual credit impairment charge/(release) | 13 | 37 | 58 | -65 | % | -78 | % | |||||||||||||
Individual credit impairment charge/(release) as a % of average net advances | 0.03 | % | 0.09 | % | 0.17 | % | ||||||||||||||
Collective credit impairment charge/(release) | (47 | ) | (28 | ) | (30 | ) | 68 | % | 57 | % | ||||||||||
Collective credit impairment charge/(release) as a % of average net advances | (0.11 | %) | (0.07 | %) | (0.08 | %) | ||||||||||||||
Net impaired assets | 446 | 510 | 706 | -13 | % | -37 | % | |||||||||||||
Net impaired assets as a % of net advances | 0.51 | % | 0.63 | % | 0.98 | % | ||||||||||||||
|
|
|
|
|
|
|
|
|
| |||||||||||
Total full time equivalent staff (FTE) | 7,323 | 7,400 | 7,755 | -1 | % | -6 | % | |||||||||||||
|
|
|
|
|
|
|
|
|
| |||||||||||
67
SEGMENT REVIEW
Global Wealth
Joyce Phillips
The Global Wealth division comprises Funds Management, Insurance and Private Wealth business units that provide investment, superannuation, pension, insurance and private banking solutions to customers across Australia, New Zealand and Asia.
Cash profit – March 2014 Half Year v March 2013 Half Year
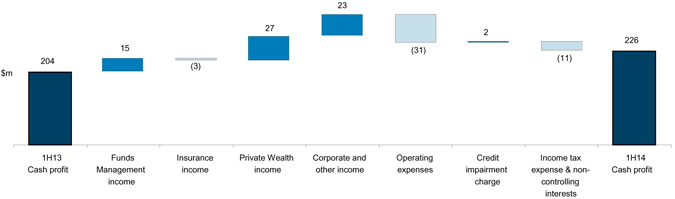
Global Wealth provides a range of innovative solutions to customers across the region to make it easier for them to connect, protect and grow their wealth.
Global Wealth serves over 2.3 million customers and manages $62 billion in investment and retirement savings. Customers can access ANZ’s wealth solutions through teams of highly qualified financial planners and advisers, innovative digital platforms, ANZ Private Bankers and ANZ’s branch and direct channels. For ANZ customers, wealth solutions are becoming increasingly integrated with their banking making it easier and more convenient for them to successfully manage their financial affairs.
Global Wealth is investing in strategic growth initiatives to help customers engage with their wealth. This includes delivering more options for the self-directed customer, new digital solutions and new physical environments. Global Wealth is also investing in programs to leverage capabilities across the region to deliver service and scale efficiencies.
Funds Management
The Funds Management business helps customers grow their wealth through investment, superannuation and pension solutions. Global Wealth has embraced the changing regulatory environment to reshape the business, simplifying operational processes and delivering innovative solutions like ANZ Smart Choice Super and new digital platforms. The business experienced positive netflows driven by increased productivity of financial planners and strong growth for ANZ Smart Choice Super which now has over 270,000 customers.
Insurance
The Insurance business provides protection for all life stages through a comprehensive range of life and general insurance products distributed via intermediated and direct channels. Global Wealth’s focus on retail risk resulted in a 13% growth in inforce premiums, while continued investment in claims management and retention initiatives in Australia improved claim ratios and reduced lapse rates by 120 bps.
Private Wealth
Operating in six countries across the region we continue to strengthen our Private Wealth operations by building core capabilities and developing the suite of global investment solutions. This includes leveraging the expertise of strategic partners such as Swiss Private Bank Vontobel. Private Wealth has delivered strong growth across deposits, investments and loans.
| • | March 2014 half year v March 2013 half year |
Cash profit improved by 11%, with an 8% increase in operating income and 7% increase in expenses.
Key factors affecting the result were:
| • | Funds Management operating income increased by 6%. This was driven by 14% growth in average FUM as a result of strong gains from investment markets and growth of over $1 billion in netflows due to improved planner productivity. |
| • | Insurance operating income declined by 1% reflecting the exit of one large group life insurance plan. Excluding this $47 million impact, insurance operating income grew 16% driven by strong underlying business performance along with improved claims and lapse experience. |
| • | Private Wealth operating income increased by 28% mainly driven by solid growth in wealth investment solutions. Average customer deposits grew by 24% and average net loans and advances increased by 10%. |
| • | Corporate and other operating income benefited from a $26 million non-recurring insurance settlement. |
| • | Operating expenses grew by 7% reflecting increased investment in strategic growth initiatives focusing on innovations to enable customers to be self-directed, as well as regulatory spend. |
| • | March 2014 half year v September 2013 half year |
Cash profit reduced by 16%, due to inclusion of a one off tax consolidation adjustment in September 2013. Profit before tax grew by 9%.
Key factors affecting the result were:
| • | Funds Management operating income improved by 1%. This was mainly driven by an increase in average FUM of 7% reflecting strong market performance and a significant improvement in netflows as a result of improved planner productivity. |
| • | Insurance operating income decreased by 5% due to the exit of one large group life insurance plan. Excluding this $47 million impact, insurance operating income grew 11% due to improved claims and lapse experience and strong growth in inforce premiums. |
| • | Private Wealth operating income improved by 14% with solid growth in average customer deposits and average net loans and advances of 10% and 1% respectively. |
| • | Corporate and other operating income benefited from a $26 million non-recurring insurance settlement. |
| • | Operating expenses were up slightly reflecting productivity gains offsetting the cost growth of digital innovations and regulatory spend. |
| 68 |
SEGMENT REVIEW
Global Wealth
Joyce Phillips
Global Wealth Total
| Half Year | Movement | |||||||||||||||||||
| Mar 14 $M | Sep 13 $M | Mar 13 $M | Mar 14 v. Sep 13 | Mar 14 v. Mar 13 | ||||||||||||||||
Net interest income | 80 | 75 | 64 | 7 | % | 25 | % | |||||||||||||
Other operating income | 120 | 94 | 80 | 28 | % | 50 | % | |||||||||||||
Net funds management and insurance income | 606 | 611 | 600 | -1 | % | 1 | % | |||||||||||||
|
|
|
|
|
|
|
|
|
| |||||||||||
Operating income | 806 | 780 | 744 | 3 | % | 8 | % | |||||||||||||
Operating expenses | (494 | ) | (489 | ) | (463 | ) | 1 | % | 7 | % | ||||||||||
|
|
|
|
|
|
|
|
|
| |||||||||||
Profit before credit impairment and income tax | 312 | 291 | 281 | 7 | % | 11 | % | |||||||||||||
Credit impairment (charge)/release | 1 | (3 | ) | (1 | ) | large | large | |||||||||||||
|
|
|
|
|
|
|
|
|
| |||||||||||
Profit before income tax | 313 | 288 | 280 | 9 | % | 12 | % | |||||||||||||
Income tax expense and non-controlling interests | (87 | ) | (20 | ) | (76 | ) | large | 14 | % | |||||||||||
|
|
|
|
|
|
|
|
|
| |||||||||||
Cash profit | 226 | 268 | 204 | -16 | % | 11 | % | |||||||||||||
|
|
|
|
|
|
|
|
|
| |||||||||||
Consisting of: | ||||||||||||||||||||
Business Segment | ||||||||||||||||||||
Funds Management1 | 62 | 78 | 53 | -21 | % | 17 | % | |||||||||||||
Insurance | 98 | 113 | 110 | -13 | % | -11 | % | |||||||||||||
Private Wealth | 40 | 27 | 22 | 48 | % | 82 | % | |||||||||||||
Corporate and Other2 | 26 | 50 | 19 | -48 | % | 37 | % | |||||||||||||
|
|
|
|
|
|
|
|
|
| |||||||||||
Total Global Wealth | 226 | 268 | 204 | -16 | % | 11 | % | |||||||||||||
|
|
|
|
|
|
|
|
|
| |||||||||||
Australia | 156 | 237 | 175 | -34 | % | -11 | % | |||||||||||||
New Zealand3 | 71 | 36 | 30 | 97 | % | large | ||||||||||||||
Asia Pacific, Europe & America | (1 | ) | (5 | ) | (1 | ) | -80 | % | 0 | % | ||||||||||
|
|
|
|
|
|
|
|
|
| |||||||||||
Total Global Wealth | 226 | 268 | 204 | -16 | % | 11 | % | |||||||||||||
|
|
|
|
|
|
|
|
|
| |||||||||||
Income from invested capital4 | 28 | 26 | 31 | 8 | % | -10 | % | |||||||||||||
|
|
|
|
|
|
|
|
|
| |||||||||||
Balance Sheet | ||||||||||||||||||||
Funds under management | 61,652 | 58,578 | 54,805 | 5 | % | 12 | % | |||||||||||||
Average funds under management | 60,552 | 56,507 | 53,218 | 7 | % | 14 | % | |||||||||||||
In-force premiums | 1,955 | 1,986 | 1,893 | -2 | % | 3 | % | |||||||||||||
Customer deposits | 12,699 | 11,569 | 10,042 | 10 | % | 26 | % | |||||||||||||
Net loans & advances | 6,009 | 6,187 | 5,776 | -3 | % | 4 | % | |||||||||||||
Average net loans and advances | 6,121 | 6,060 | 5,541 | 1 | % | 10 | % | |||||||||||||
Average customer deposits | 12,278 | 11,112 | 9,929 | 10 | % | 24 | % | |||||||||||||
|
|
|
|
|
|
|
|
|
| |||||||||||
Ratios5 | ||||||||||||||||||||
Operating expenses to operating income | 61.3 | % | 62.7 | % | 62.2 | % | ||||||||||||||
Funds management expenses to average FUM | ||||||||||||||||||||
Australia | 0.60 | % | 0.57 | % | 0.65 | % | ||||||||||||||
New Zealand | 0.41 | % | 0.46 | % | 0.49 | % | ||||||||||||||
Insurance expenses to in-force premiums | ||||||||||||||||||||
Australia | 11.7 | % | 11.7 | % | 10.7 | % | ||||||||||||||
New Zealand | 34.6 | % | 36.1 | % | 41.6 | % | ||||||||||||||
Retail insurance lapse rates | ||||||||||||||||||||
Australia | 12.1 | % | 14.1 | % | 13.3 | % | ||||||||||||||
New Zealand | 14.9 | % | 16.7 | % | 15.7 | % | ||||||||||||||
|
|
|
|
|
|
|
|
|
| |||||||||||
Total full time equivalent staff (FTE)6 | 4,090 | 4,271 | 4,176 | -4 | % | -2 | % | |||||||||||||
|
|
|
|
|
|
|
|
|
| |||||||||||
Aligned adviser numbers7 | 2,061 | 2,133 | 2,160 | -3 | % | -5 | % | |||||||||||||
|
|
|
|
|
|
|
|
|
| |||||||||||
| 1. | Funds management includes Pensions & Investments business and E*TRADE. |
| 2. | Corporate and other includes income from invested capital, profits from the Advice and Distribution business and unallocated corporate tax credits. |
| 3. | Includes the cross border settlement of an insurance claim involving both Australia and New Zealand on a net basis. For statutory purposes, the individual components of the settlement have been recognised in their respective geographies. |
| 4. | Income from invested capital represents after tax revenue generated from investing insurance and investment business’ capital balances (required for regulatory purposes) net of group funding charges and borrowing costs which is included as part of Corporate and Other results. The invested capital as at 31 March 2014 was $2.1 billion (Sep 13: $2.1 billion), which comprises fixed interest securities of 36% and cash and term deposits of 64% (Sep 13: 33% fixed interest securities and 67% cash and term deposits). |
| 5. | Funds management expense and FUM only relates to the Pensions & Investments business. |
| 6. | Comparative information has been restated to include technology contractors, consistent with how FTE are reported and managed internally. |
| 7. | Includes corporate authorised representatives of dealer groups wholly or partially controlled by Global Wealth and ANZ financial planners. |
69
SEGMENT REVIEW
Global Wealth
Joyce Phillips
Major business segments
| Half Year | Movement | |||||||||||||||||||
| Funds Management1 | Mar 14 $M | Sep 13 $M | Mar 13 $M | Mar 14 v. Sep 13 | Mar 14 v. Mar 13 | |||||||||||||||
Net interest income | 17 | 17 | 18 | 0 | % | -6 | % | |||||||||||||
Other operating income | 33 | 36 | 33 | -8 | % | 0 | % | |||||||||||||
Funds management income | 416 | 406 | 389 | 2 | % | 7 | % | |||||||||||||
Funds management volume related expenses | (194 | ) | (191 | ) | (183 | ) | 2 | % | 6 | % | ||||||||||
|
|
|
|
|
|
|
|
|
| |||||||||||
Operating income | 272 | 268 | 257 | 1 | % | 6 | % | |||||||||||||
Operating expenses | (184 | ) | (175 | ) | (185 | ) | 5 | % | -1 | % | ||||||||||
|
|
|
|
|
|
|
|
|
| |||||||||||
Profit before credit impairment and income tax | 88 | 93 | 72 | -5 | % | 22 | % | |||||||||||||
Credit impairment charge | — | — | — | n/a | n/a | |||||||||||||||
|
|
|
|
|
|
|
|
|
| |||||||||||
Profit before income tax | 88 | 93 | 72 | -5 | % | 22 | % | |||||||||||||
Income tax expense and non-controlling interests | (26 | ) | (15 | ) | (19 | ) | 73 | % | 37 | % | ||||||||||
|
|
|
|
|
|
|
|
|
| |||||||||||
Cash profit | 62 | 78 | 53 | -21 | % | 17 | % | |||||||||||||
|
|
|
|
|
|
|
|
|
| |||||||||||
| Half Year | Movement | |||||||||||||||||||
| Insurance | Mar 14 $M | Sep 13 $M | Mar 13 $M | Mar 14 v. Sep 13 | Mar 14 v. Mar 13 | |||||||||||||||
Net interest income | 14 | 14 | 14 | 0 | % | 0 | % | |||||||||||||
Other operating income | 33 | 33 | 25 | 0 | % | 32 | % | |||||||||||||
Insurance income | 357 | 383 | 366 | -7 | % | -2 | % | |||||||||||||
Insurance volume related expenses | (135 | ) | (146 | ) | (133 | ) | -8 | % | 2 | % | ||||||||||
|
|
|
|
|
|
|
|
|
| |||||||||||
Operating income | 269 | 284 | 272 | -5 | % | -1 | % | |||||||||||||
Operating expenses | (135 | ) | (133 | ) | (122 | ) | 2 | % | 11 | % | ||||||||||
|
|
|
|
|
|
|
|
|
| |||||||||||
Profit before credit impairment and income tax | 134 | 151 | 150 | -11 | % | -11 | % | |||||||||||||
Credit impairment charge | — | — | — | n/a | n/a | |||||||||||||||
|
|
|
|
|
|
|
|
|
| |||||||||||
Profit before income tax | 134 | 151 | 150 | -11 | % | -11 | % | |||||||||||||
Income tax expense and non-controlling interests | (36 | ) | (38 | ) | (40 | ) | -5 | % | -10 | % | ||||||||||
|
|
|
|
|
|
|
|
|
| |||||||||||
Cash profit | 98 | 113 | 110 | -13 | % | -11 | % | |||||||||||||
|
|
|
|
|
|
|
|
|
| |||||||||||
| Half Year | Movement | |||||||||||||||||||
| Private Wealth | Mar 14 $M | Sep 13 $M | Mar 13 $M | Mar 14 v. Sep 13 | Mar 14 v. Mar 13 | |||||||||||||||
Net interest income | 67 | 59 | 49 | 14 | % | 37 | % | |||||||||||||
Other operating income | 30 | 25 | 23 | 20 | % | 30 | % | |||||||||||||
Net funds management income | 25 | 23 | 23 | 9 | % | 9 | % | |||||||||||||
|
|
|
|
|
|
|
|
|
| |||||||||||
Operating income | 122 | 107 | 95 | 14 | % | 28 | % | |||||||||||||
Operating expenses | (67 | ) | (65 | ) | (62 | ) | 3 | % | 8 | % | ||||||||||
|
|
|
|
|
|
|
|
|
| |||||||||||
Profit before credit impairment and income tax | 55 | 42 | 33 | 31 | % | 67 | % | |||||||||||||
Credit impairment charge | 1 | (3 | ) | (1 | ) | large | large | |||||||||||||
|
|
|
|
|
|
|
|
|
| |||||||||||
Profit before income tax | 56 | 39 | 32 | 44 | % | 75 | % | |||||||||||||
Income tax expense and non-controlling interests | (16 | ) | (12 | ) | (10 | ) | 33 | % | 60 | % | ||||||||||
|
|
|
|
|
|
|
|
|
| |||||||||||
Cash profit | 40 | 27 | 22 | 48 | % | 82 | % | |||||||||||||
|
|
|
|
|
|
|
|
|
| |||||||||||
| 1. | Funds management includes Pensions & Investments business and E*TRADE. |
70
SEGMENT REVIEW
Global Wealth
Joyce Phillips
| Half Year | Movement | |||||||||||||||||||
| Insurance operating margin | Mar 14 $M | Sep 13 $M | Mar 13 $M | Mar 14 v. Sep 13 | Mar 14 v. Mar 13 | |||||||||||||||
Life Insurance Planned profit margin | ||||||||||||||||||||
Group & Individual | 52 | 69 | 62 | -25 | % | -16 | % | |||||||||||||
Experience profit/(loss)1 | (25 | ) | (23 | ) | (6 | ) | 9 | % | large | |||||||||||
Assumption changes2 | — | — | — | n/a | n/a | |||||||||||||||
General Insurance operating profit margin3 | 45 | 46 | 37 | -2 | % | 22 | % | |||||||||||||
|
|
|
|
|
|
|
|
|
| |||||||||||
Australia | 72 | 92 | 93 | -22 | % | -23 | % | |||||||||||||
|
|
|
|
|
|
|
|
|
| |||||||||||
Life Insurance Planned profit margin | ||||||||||||||||||||
Individual | 21 | 20 | 16 | 5 | % | 31 | % | |||||||||||||
Experience profit/(loss)1 | 5 | 1 | 1 | large | large | |||||||||||||||
Assumption changes2 | — | — | — | n/a | n/a | |||||||||||||||
|
|
|
|
|
|
|
|
|
| |||||||||||
New Zealand | 26 | 21 | 17 | 24 | % | 53 | % | |||||||||||||
|
|
|
|
|
|
|
|
|
| |||||||||||
Total | 98 | 113 | 110 | -13 | % | -11 | % | |||||||||||||
|
|
|
|
|
|
|
|
|
| |||||||||||
| Half Year | Movement | |||||||||||||||||||
| Operating expenses by business segment | Mar 14 $M | Sep 13 $M | Mar 13 $M | Mar 14 v. Sep 13 | Mar 14 v. Mar 13 | |||||||||||||||
Funds management4 | 184 | 175 | 185 | 5 | % | -1 | % | |||||||||||||
Insurance | 135 | 133 | 122 | 2 | % | 11 | % | |||||||||||||
Private Wealth | 67 | 65 | 62 | 3 | % | 8 | % | |||||||||||||
Corporate and Other | 108 | 116 | 94 | -7 | % | 15 | % | |||||||||||||
|
|
|
|
|
|
|
|
|
| |||||||||||
Total | 494 | 489 | 463 | 1 | % | 7 | % | |||||||||||||
|
|
|
|
|
|
|
|
|
| |||||||||||
| Half Year | Movement | |||||||||||||||||||
| Operating expenses by geography | Mar 14 $M | Sep 13 $M | Mar 13 $M | Mar 14 v. Sep 13 | Mar 14 v. Mar 13 | |||||||||||||||
Australia | 402 | 400 | 382 | 1 | % | 5 | % | |||||||||||||
New Zealand | 60 | 58 | 53 | 3 | % | 13 | % | |||||||||||||
Asia Pacific, Europe & America | 32 | 31 | 28 | 3 | % | 14 | % | |||||||||||||
|
|
|
|
|
|
|
|
|
| |||||||||||
Total | 494 | 489 | 463 | 1 | % | 7 | % | |||||||||||||
|
|
|
|
|
|
|
|
|
| |||||||||||
| As at ($M) | Movement | |||||||||||||||||||
| Funds under management | Mar 14 | Sep 13 | Mar 13 | Mar 14 v. Sep 13 | Mar 14 v. Mar 13 | |||||||||||||||
Funds under management - average | 60,552 | 56,507 | 53,218 | 7 | % | 14 | % | |||||||||||||
Funds under management - end of period | 61,652 | 58,578 | 54,805 | 5 | % | 12 | % | |||||||||||||
|
|
|
|
|
|
|
|
|
| |||||||||||
Composed of: | ||||||||||||||||||||
Australian equities | 19,947 | 19,164 | 18,208 | 4 | % | 10 | % | |||||||||||||
Global equities | 13,468 | 11,583 | 10,301 | 16 | % | 31 | % | |||||||||||||
Cash and fixed interest | 24,350 | 24,153 | 22,775 | 1 | % | 7 | % | |||||||||||||
Property and infrastructure | 3,887 | 3,678 | 3,521 | 6 | % | 10 | % | |||||||||||||
|
|
|
|
|
|
|
|
|
| |||||||||||
Total | 61,652 | 58,578 | 54,805 | 5 | % | 12 | % | |||||||||||||
|
|
|
|
|
|
|
|
|
| |||||||||||
| As at ($M) | Movement | |||||||||||||||||||
| Funds under management by region | Mar 14 | Sep 13 | Mar 13 | Mar 14 v. Sep 13 | Mar 14 v. Mar 13 | |||||||||||||||
Australia | 48,746 | 47,362 | 45,385 | 3 | % | 7 | % | |||||||||||||
New Zealand | 12,906 | 11,216 | 9,420 | 15 | % | 37 | % | |||||||||||||
|
|
|
|
|
|
|
|
|
| |||||||||||
Total | 61,652 | 58,578 | 54,805 | 5 | % | 12 | % | |||||||||||||
|
|
|
|
|
|
|
|
|
| |||||||||||
| 1. | Experience profit/(loss) variations are gains or losses arising from actual experience differing from plan on Group and Individual business (Australia) and Individual business (New Zealand). |
| 2. | Assumption changes are gains or losses arising from a change in valuation methods and best estimate assumptions. |
| 3. | General insurance operating profit margin includes ANZ Lender’s Mortgage Insurance. |
| 4. | Funds management includes Pensions & Investments business and E*TRADE. |
71
SEGMENT REVIEW
Global Wealth
Joyce Phillips
| Funds Management cashflows by product | Mar 14 $M | In- flows | Out- flows | Other1 | Sep 13 $M | |||||||||||||||
OneAnswer | 18,925 | 1,368 | (1,216 | ) | 472 | 18,301 | ||||||||||||||
Other Personal Investment | 5,549 | 333 | (460 | ) | 125 | 5,551 | ||||||||||||||
Employer Super | 14,306 | 996 | (1,163 | ) | 445 | 14,028 | ||||||||||||||
Oasis | 6,079 | 466 | (432 | ) | 160 | 5,885 | ||||||||||||||
ANZ Trustees | 3,887 | 501 | (318 | ) | 107 | 3,597 | ||||||||||||||
Kiwisaver | 4,604 | 582 | (174 | ) | 383 | 3,813 | ||||||||||||||
Private Bank - New Zealand | 4,392 | 402 | (229 | ) | 340 | 3,879 | ||||||||||||||
Other New Zealand | 3,910 | 518 | (488 | ) | 356 | 3,524 | ||||||||||||||
|
|
|
|
|
|
|
|
|
| |||||||||||
Total | 61,652 | 5,166 | (4,480 | ) | 2,388 | 58,578 | ||||||||||||||
|
|
|
|
|
|
|
|
|
| |||||||||||
| As at ($M) | Movement | |||||||||||||||||||
| Insurance annual in-force premiums | Mar 14 | Sep 13 | Mar 13 | Mar 14 v. Sep 13 | Mar 14 v. Mar 13 | |||||||||||||||
Group | 336 | 447 | 439 | -25 | % | -23 | % | |||||||||||||
Individual | 1,132 | 1,067 | 1,006 | 6 | % | 13 | % | |||||||||||||
General Insurance | 487 | 472 | 448 | 3 | % | 9 | % | |||||||||||||
|
|
|
|
|
|
|
|
|
| |||||||||||
Total | 1,955 | 1,986 | 1,893 | -2 | % | 3 | % | |||||||||||||
|
|
|
|
|
|
|
|
|
| |||||||||||
Insurance annual in-force premiums by region | ||||||||||||||||||||
Australia | 1,780 | 1,839 | 1,756 | -3 | % | 1 | % | |||||||||||||
New Zealand | 175 | 147 | 137 | 19 | % | 28 | % | |||||||||||||
|
|
|
|
|
|
|
|
|
| |||||||||||
Total | 1,955 | 1,986 | 1,893 | -2 | % | 3 | % | |||||||||||||
|
|
|
|
|
|
|
|
|
| |||||||||||
| Insurance in-force book movement | Mar 14 $M | New business $M2 | Lapses $M | Sep 13 $M | ||||||||||||
Group | 336 | 17 | (128 | ) | 447 | |||||||||||
Individual | 1,132 | 138 | (73 | ) | 1,067 | |||||||||||
General Insurance | 487 | 81 | (66 | ) | 472 | |||||||||||
|
|
|
|
|
|
|
| |||||||||
Total | 1,955 | 236 | (267 | ) | 1,986 | |||||||||||
|
|
|
|
|
|
|
| |||||||||
Insurance in-force book movement by region | ||||||||||||||||
Australia | 1,780 | 200 | (259 | ) | 1,839 | |||||||||||
New Zealand | 175 | 36 | (8 | ) | 147 | |||||||||||
|
|
|
|
|
|
|
| |||||||||
Total | 1,955 | 236 | (267 | ) | 1,986 | |||||||||||
|
|
|
|
|
|
|
| |||||||||
| Embedded value and value of new business (insurance and investments only) | Australia $M | New Zealand $M | Total $M | |||||||||
Embedded value as at September 20133 | 3,244 | 422 | 3,666 | |||||||||
Value of new business4 | 70 | 9 | 79 | |||||||||
Expected return5 | 156 | 18 | 174 | |||||||||
Experience deviations and assumption changes6 | (2 | ) | 5 | 3 | ||||||||
|
|
|
|
|
| |||||||
Embedded value before economic assumption changes and net transfer | 3,468 | 454 | 3,922 | |||||||||
Economic assumptions change7 | (21 | ) | 62 | 41 | ||||||||
Net transfer8 | (160 | ) | (38 | ) | (198 | ) | ||||||
|
|
|
|
|
| |||||||
Embedded value as at March 2014 | 3,287 | 478 | 3,765 | |||||||||
|
|
|
|
|
| |||||||
| 1. | Other includes investment income net of taxes, fees and charges and distributions; and the impact of translation differences on foreign currency balances. |
| 2. | New business includes the impact of foreign currency gains on translation. |
| 3. | Embedded value represents the present value of future profits and releases of capital arising from the business in force at the valuation date, and adjusted net assets. It is determined using best estimate assumptions with franking credits included at 70% of face value. Projected cash flows have been discounted using capital asset pricing model risk discount rates of 9.00%-10.75%. ANZ Lenders Mortgage Insurance business is not included in the valuation. |
| 4. | Value of new business represents the present value of future profits less the cost of capital arising from the new business written over the period. |
| 5. | Expected return represents expected increase in value over the period. |
| 6. | Experience deviations and assumption changes arise from deviations from and changes to best estimate assumptions underlying the prior period embedded value. The adverse movement for the Australian business is primarily due to higher lapse experience in the Group Insurance business partially offset by better claim experience in the Retail Insurance and General Insurance. |
| 7. | Risk discount rates have increased by 25 bps over the half year leading to a negative impact. A higher exchange rate for New Zealand dollar has led to a positive value impact. |
| 8. | Net transfer represents net capital movements over the period including restructuring of the business, capital injections, transfer of cash dividends and value of franking credits. There was a $127 million cash dividend and $35 million in franking credits transferred to the ANZ Group. |
72
SEGMENT REVIEW
Global Technology, Services and Operations and Group Centre
GTSO and Group Centre provide support to the operating divisions, including technology, operations, risk management, financial management, strategy and marketing, human resources and corporate affairs. Additionally, Group Centre includes Group Treasury, Shareholder Functions and Discontinued Businesses.
| Half Year | Movement | |||||||||||||||||||
| Mar 14 $M | Sep 13 $M | Mar 13 $M | Mar 14 v. Sep 13 | Mar 14 v. Mar 13 | ||||||||||||||||
Net interest income | 201 | 193 | 215 | 4 | % | -7 | % | |||||||||||||
Other operating income1 | (187 | ) | (139 | ) | (76 | ) | 35 | % | large | |||||||||||
|
|
|
|
|
|
|
|
|
| |||||||||||
Operating income1 | 14 | 54 | 139 | -75 | % | -90 | % | |||||||||||||
Operating expenses | (180 | ) | (215 | ) | (175 | ) | -16 | % | 3 | % | ||||||||||
|
|
|
|
|
|
|
|
|
| |||||||||||
Profit/(Loss) before credit impairment and income tax | (166 | ) | (161 | ) | (36 | ) | 3 | % | large | |||||||||||
Credit impairment charge | 1 | (19 | ) | — | large | n/a | ||||||||||||||
|
|
|
|
|
|
|
|
|
| |||||||||||
Profit/(Loss) before income tax | (165 | ) | (180 | ) | (36 | ) | -8 | % | large | |||||||||||
Income tax expense and non-controlling interests | 57 | 50 | (2 | ) | 14 | % | large | |||||||||||||
|
|
|
|
|
|
|
|
|
| |||||||||||
Cash profit/(loss) | (108 | ) | (130 | ) | (38 | ) | -17 | % | large | |||||||||||
|
|
|
|
|
|
|
|
|
| |||||||||||
Total full time equivalent staff (FTE)2 | 9,669 | 9,375 | 9,077 | 3 | % | 7 | % | |||||||||||||
|
|
|
|
|
|
|
|
|
| |||||||||||
| 1. | Includes offsetting variances between net interest and other income as a result of elimination entries associated with the consolidation of Global Wealth. |
| 2. | Comparative information has been restated to include technology contractors, consistent with how FTE are reported and managed internally. |
Cash profit – March 2014 Half Year v March 2013 Half Year
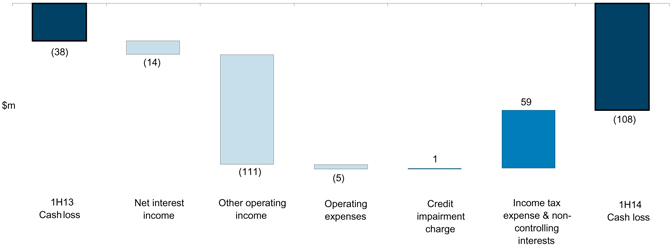
| • | March 2014 half year v March 2013 half year |
Key factors affecting the result were:
| • | Operating income decreased 90% largely due to realised losses from foreign currency hedges (offsetting translation gains elsewhere in the Group). |
| • | Operating expenses increased 3% due to annual salary increases. |
| • | The increase in FTEs relate to the transfer of activities into central operations, global enablement and hubs. These are offset in the Divisions. |
| • | March 2014 half year v September 2013 half year |
Key factors affecting the result were:
| • | Operating income decreased 75% largely due to realised losses from foreign currency hedges (offsetting translation gains elsewhere in the Group). |
| • | Operating expenses decreased 16% largely due to lower restructuring costs. |
| • | Credit impairment charges decreased $20 million due to provisions relating to discontinued businesses in the September 2013 half. |
| • | The increase in FTEs relate to the transfer of activities into central operations, global enablement and hubs. These are offset in the Divisions. |
73
SEGMENT REVIEW
This page has been left blank intentionally
74
GEOGRAPHIC REVIEW
CONTENTS
Section 6 – Geographic Review
Geographic performance | 76 | |||
Australia geography | 77 | |||
Asia Pacific, Europe & America geography | 78 | |||
New Zealand geography | 81 | |||
75
GEOGRAPHIC REVIEW
Geographic Performance
| Half Year | Movement | |||||||||||||||||||
| Statutory Profit | Mar 14 $M | Sep 13 $M | Mar 13 $M | Mar 14 v. Sep 13 | Mar 14 v. Mar 13 | |||||||||||||||
Australia | 1,920 | 2,140 | 1,958 | -10 | % | -2 | % | |||||||||||||
Asia Pacific, Europe & America | 683 | 583 | 459 | 17 | % | 49 | % | |||||||||||||
New Zealand | 778 | 606 | 520 | 28 | % | 50 | % | |||||||||||||
|
|
|
|
|
|
|
|
|
| |||||||||||
| 3,381 | 3,329 | 2,937 | 2 | % | 15 | % | ||||||||||||||
|
|
|
|
|
|
|
|
|
| |||||||||||
| Half Year | Movement | |||||||||||||||||||
| Cash Profit | Mar 14 $M | Sep 13 $M | Mar 13 $M | Mar 14 v. Sep 13 | Mar 14 v. Mar 13 | |||||||||||||||
Australia | 2,025 | 2,136 | 2,164 | -5 | % | -6 | % | |||||||||||||
Asia Pacific, Europe & America | 681 | 554 | 459 | 23 | % | 48 | % | |||||||||||||
New Zealand | 809 | 623 | 556 | 30 | % | 46 | % | |||||||||||||
|
|
|
|
|
|
|
|
|
| |||||||||||
| 3,515 | 3,313 | 3,179 | 6 | % | 11 | % | ||||||||||||||
|
|
|
|
|
|
|
|
|
| |||||||||||
| As at ($M) | Movement | |||||||||||||||||||
| Net loans & advances | Mar 14 | Sep 13 | Mar 13 | Mar 14 v. Sep 13 | Mar 14 v. Mar 13 | |||||||||||||||
Australia | 336,466 | 324,278 | 314,620 | 4 | % | 7 | % | |||||||||||||
Asia Pacific, Europe & America | 76,634 | 69,893 | 61,223 | 10 | % | 25 | % | |||||||||||||
New Zealand | 96,150 | 89,093 | 78,473 | 8 | % | 23 | % | |||||||||||||
|
|
|
|
|
|
|
|
|
| |||||||||||
Net loans & advances | 509,250 | 483,264 | 454,316 | 5 | % | 12 | % | |||||||||||||
|
|
|
|
|
|
|
|
|
| |||||||||||
| As at ($M) | Movement | |||||||||||||||||||
| Customer deposits | Mar 14 | Sep 13 | Mar 13 | Mar 14 v. Sep 13 | Mar 14 v. Mar 13 | |||||||||||||||
Australia | 216,127 | 207,902 | 195,849 | 4 | % | 10 | % | |||||||||||||
Asia Pacific, Europe & America | 102,463 | 98,127 | 92,736 | 4 | % | 10 | % | |||||||||||||
New Zealand | 69,432 | 62,800 | 55,550 | 11 | % | 25 | % | |||||||||||||
|
|
|
|
|
|
|
|
|
| |||||||||||
Customer deposits | 388,022 | 368,829 | 344,135 | 5 | % | 13 | % | |||||||||||||
|
|
|
|
|
|
|
|
|
| |||||||||||
76
GEOGRAPHIC REVIEW
Australia geography
| Half Year | Movement | |||||||||||||||||||
| Mar 14 $M | Sep 13 $M | Mar 13 $M | Mar 14 v. Sep 13 | Mar 14 v. Mar 13 | ||||||||||||||||
Net interest income | 4,659 | 4,631 | 4,514 | 1 | % | 3 | % | |||||||||||||
Other operating income | 1,381 | 1,533 | 1,677 | -10 | % | -18 | % | |||||||||||||
|
|
|
|
|
|
|
|
|
| |||||||||||
Operating income | 6,040 | 6,164 | 6,191 | -2 | % | -2 | % | |||||||||||||
Operating expenses | (2,648 | ) | (2,679 | ) | (2,603 | ) | -1 | % | 2 | % | ||||||||||
|
|
|
|
|
|
|
|
|
| |||||||||||
Profit before credit impairment and income tax | 3,392 | 3,485 | 3,588 | -3 | % | -5 | % | |||||||||||||
Credit impairment charge | (479 | ) | (488 | ) | (466 | ) | -2 | % | 3 | % | ||||||||||
|
|
|
|
|
|
|
|
|
| |||||||||||
Profit before tax | 2,913 | 2,997 | 3,122 | -3 | % | -7 | % | |||||||||||||
Income tax expense and non-controlling interests | (888 | ) | (861 | ) | (958 | ) | 3 | % | -7 | % | ||||||||||
|
|
|
|
|
|
|
|
|
| |||||||||||
Cash profit | 2,025 | 2,136 | 2,164 | -5 | % | -6 | % | |||||||||||||
Adjustments between statutory profit and cash profit | (105 | ) | 4 | (206 | ) | large | -49 | % | ||||||||||||
|
|
|
|
|
|
|
|
|
| |||||||||||
Statutory profit | 1,920 | 2,140 | 1,958 | -10 | % | -2 | % | |||||||||||||
|
|
|
|
|
|
|
|
|
| |||||||||||
Balance Sheet | ||||||||||||||||||||
Net loans & advances | 336,466 | 324,278 | 314,620 | 4 | % | 7 | % | |||||||||||||
Other external assets | 136,579 | 128,905 | 124,142 | 6 | % | 10 | % | |||||||||||||
|
|
|
|
|
|
|
|
|
| |||||||||||
External assets | 473,045 | 453,183 | 438,762 | 4 | % | 8 | % | |||||||||||||
|
|
|
|
|
|
|
|
|
| |||||||||||
Customer deposits | 216,127 | 207,902 | 195,849 | 4 | % | 10 | % | |||||||||||||
Other deposits and borrowings | 73,908 | 66,277 | 71,264 | 12 | % | 4 | % | |||||||||||||
|
|
|
|
|
|
|
|
|
| |||||||||||
Deposits and other borrowings | 290,035 | 274,179 | 267,113 | 6 | % | 9 | % | |||||||||||||
Other external liabilities | 147,174 | 149,505 | 140,112 | -2 | % | 5 | % | |||||||||||||
|
|
|
|
|
|
|
|
|
| |||||||||||
External liabilities | 437,209 | 423,684 | 407,225 | 3 | % | 7 | % | |||||||||||||
|
|
|
|
|
|
|
|
|
| |||||||||||
Risk weighted assets | 201,720 | 196,416 | 192,118 | 3 | % | 5 | % | |||||||||||||
Average net loans and advances | 330,036 | 319,212 | 310,578 | 3 | % | 6 | % | |||||||||||||
Average deposits and other borrowings | 290,912 | 276,136 | 262,013 | 5 | % | 11 | % | |||||||||||||
Ratios | ||||||||||||||||||||
Net interest margin - cash | 2.37 | % | 2.45 | % | 2.52 | % | ||||||||||||||
Operating expenses to operating income - cash | 43.8 | % | 43.5 | % | 42.0 | % | ||||||||||||||
Operating expenses to average assets - cash | 1.14 | % | 1.18 | % | 1.20 | % | ||||||||||||||
|
|
|
|
|
|
|
|
|
| |||||||||||
Individual credit impairment charge/(release) - cash | 455 | 433 | 447 | 5 | % | 2 | % | |||||||||||||
Individual credit impairment charge/(release) as a % of average net advances - cash | 0.28 | % | 0.27 | % | 0.29 | % | ||||||||||||||
Collective credit impairment charge/(release) - cash | 24 | 55 | 19 | -56 | % | 26 | % | |||||||||||||
Collective credit impairment charge/(release) as a % of average net advances - cash | 0.01 | % | 0.03 | % | 0.01 | % | ||||||||||||||
Net impaired assets | 1,267 | 1,819 | 2,097 | -30 | % | -40 | % | |||||||||||||
Net impaired assets as a % of net advances | 0.38 | % | 0.56 | % | 0.67 | % | ||||||||||||||
|
|
|
|
|
|
|
|
|
| |||||||||||
Total full time equivalent staff (FTE)1 | 21,353 | 21,757 | 22,096 | -2 | % | -3 | % | |||||||||||||
|
|
|
|
|
|
|
|
|
| |||||||||||
| 1. | Comparative information has been restated to include technology costs, consistent with how FTE are reported and managed internally. |
77
GEOGRAPHIC REVIEW
Asia Pacific, Europe & America geography
Table reflects AUD for the APEA region
| Half Year | Movement | |||||||||||||||||||
| Mar 14 $M | Sep 13 $M | Mar 13 $M | Mar 14 v. Sep 13 | Mar 14 v. Mar 13 | ||||||||||||||||
Net interest income | 855 | 768 | 682 | 11 | % | 25 | % | |||||||||||||
Other operating income | 1,036 | 879 | 815 | 18 | % | 27 | % | |||||||||||||
|
|
|
|
|
|
|
|
|
| |||||||||||
Operating income | 1,891 | 1,647 | 1,497 | 15 | % | 26 | % | |||||||||||||
Operating expenses | (977 | ) | (911 | ) | (829 | ) | 7 | % | 18 | % | ||||||||||
|
|
|
|
|
|
|
|
|
| |||||||||||
Profit before credit impairment and income tax | 914 | 736 | 668 | 24 | % | 37 | % | |||||||||||||
Credit impairment charge | (85 | ) | (91 | ) | (99 | ) | -7 | % | -14 | % | ||||||||||
|
|
|
|
|
|
|
|
|
| |||||||||||
Profit before income tax | 829 | 645 | 569 | 29 | % | 46 | % | |||||||||||||
Income tax expense and non-controlling interests | (148 | ) | (91 | ) | (110 | ) | 63 | % | 35 | % | ||||||||||
|
|
|
|
|
|
|
|
|
| |||||||||||
Cash profit | 681 | 554 | 459 | 23 | % | 48 | % | |||||||||||||
Adjustments between statutory profit and cash profit | 2 | 29 | — | -93 | % | n/a | ||||||||||||||
|
|
|
|
|
|
|
|
|
| |||||||||||
Statutory profit | 683 | 583 | 459 | 17 | % | 49 | % | |||||||||||||
|
|
|
|
|
|
|
|
|
| |||||||||||
Balance Sheet | ||||||||||||||||||||
Net loans & advances | 76,634 | 69,893 | 61,223 | 10 | % | 25 | % | |||||||||||||
Other external assets | 66,475 | 66,728 | 71,260 | 0 | % | -7 | % | |||||||||||||
|
|
|
|
|
|
|
|
|
| |||||||||||
External assets | 143,109 | 136,621 | 132,483 | 5 | % | 8 | % | |||||||||||||
|
|
|
|
|
|
|
|
|
| |||||||||||
Customer deposits | 102,463 | 98,127 | 92,736 | 4 | % | 10 | % | |||||||||||||
Other deposits and borrowings | 29,791 | 25,306 | 30,533 | 18 | % | -2 | % | |||||||||||||
| �� |
|
|
|
|
|
|
|
|
|
| ||||||||||
Deposits and other borrowings | 132,254 | 123,433 | 123,269 | 7 | % | 7 | % | |||||||||||||
Other external liabilities | 21,296 | 17,944 | 16,747 | 19 | % | 27 | % | |||||||||||||
|
|
|
|
|
|
|
|
|
| |||||||||||
External liabilities | 153,550 | 141,377 | 140,016 | 9 | % | 10 | % | |||||||||||||
|
|
|
|
|
|
|
|
|
| |||||||||||
Risk weighted assets | 94,353 | 85,586 | 78,416 | 10 | % | 20 | % | |||||||||||||
Average net loans and advances | 75,621 | 67,834 | 56,896 | 11 | % | 33 | % | |||||||||||||
Average deposits and other borrowings | 133,781 | 124,105 | 110,748 | 8 | % | 21 | % | |||||||||||||
Ratios | ||||||||||||||||||||
Net interest margin | 1.20 | % | 1.16 | % | 1.20 | % | ||||||||||||||
Operating expenses to operating income - cash | 51.7 | % | 55.3 | % | 55.4 | % | ||||||||||||||
Operating expenses to average assets - cash | 1.22 | % | 1.25 | % | 1.29 | % | ||||||||||||||
|
|
|
|
|
|
|
|
|
| |||||||||||
Individual credit impairment charge/(release) - cash | 127 | 94 | 87 | 35 | % | 46 | % | |||||||||||||
Individual credit impairment charge/(release) as a % of average net advances - cash | 0.34 | % | 0.28 | % | 0.31 | % | ||||||||||||||
Collective credit impairment charge/(release) - cash | (42 | ) | (3 | ) | 12 | large | large | |||||||||||||
Collective credit impairment charge/(release) as a % of average net advances - cash | (0.11 | %) | (0.01 | %) | 0.05 | % | ||||||||||||||
Net impaired assets | 326 | 389 | 337 | -16 | % | -3 | % | |||||||||||||
Net impaired assets as a % of net advances | 0.43 | % | 0.56 | % | 0.55 | % | ||||||||||||||
|
|
|
|
|
|
|
|
|
| |||||||||||
Total full time equivalent staff (FTE)1 | 19,247 | 18,824 | 18,119 | 2 | % | 6 | % | |||||||||||||
|
|
|
|
|
|
|
|
|
| |||||||||||
| 1. | Comparative information has been restated to include technology contractors, consistent with how FTE are reported and managed internally. |
78
GEOGRAPHIC REVIEW
Asia Pacific, Europe & America geography
Table reflects USD for the APEA region
| Half Year | Movement | |||||||||||||||||||
| Mar 14 USD M | Sep 13 USD M | Mar 13 USD M | Mar 14 v. Sep 13 | Mar 14 v. Mar 13 | ||||||||||||||||
Net interest income | 778 | 731 | 709 | 6 | % | 10 | % | |||||||||||||
Other operating income | 945 | 837 | 847 | 13 | % | 12 | % | |||||||||||||
|
|
|
|
|
|
|
|
|
| |||||||||||
Operating income | 1,723 | 1,568 | 1,556 | 10 | % | 11 | % | |||||||||||||
Operating expenses | (891 | ) | (867 | ) | (862 | ) | 3 | % | 3 | % | ||||||||||
|
|
|
|
|
|
|
|
|
| |||||||||||
Profit before credit impairment and income tax | 832 | 701 | 694 | 19 | % | 20 | % | |||||||||||||
Credit impairment charge | (77 | ) | (86 | ) | (103 | ) | -10 | % | -25 | % | ||||||||||
|
|
|
|
|
|
|
|
|
| |||||||||||
Profit before income tax | 755 | 615 | 591 | 23 | % | 28 | % | |||||||||||||
Income tax expense and non-controlling interests | (134 | ) | (86 | ) | (114 | ) | 56 | % | 18 | % | ||||||||||
|
|
|
|
|
|
|
|
|
| |||||||||||
Cash profit | 621 | 529 | 477 | 17 | % | 30 | % | |||||||||||||
Adjustments between statutory profit and cash profit | 1 | 29 | — | -97 | % | n/a | ||||||||||||||
|
|
|
|
|
|
|
|
|
| |||||||||||
Statutory profit | 622 | 558 | 477 | 11 | % | 30 | % | |||||||||||||
|
|
|
|
|
|
|
|
|
| |||||||||||
Balance Sheet | ||||||||||||||||||||
Net loans & advances | 70,756 | 65,084 | 63,819 | 9 | % | 11 | % | |||||||||||||
Other external assets | 61,377 | 62,138 | 74,281 | -1 | % | -17 | % | |||||||||||||
|
|
|
|
|
|
|
|
|
| |||||||||||
External assets | 132,133 | 127,222 | 138,100 | 4 | % | -4 | % | |||||||||||||
|
|
|
|
|
|
|
|
|
| |||||||||||
Customer deposits | 94,603 | 91,376 | 96,669 | 4 | % | -2 | % | |||||||||||||
Other deposits and borrowings | 27,507 | 23,565 | 31,827 | 17 | % | -14 | % | |||||||||||||
|
|
|
|
|
|
|
|
|
| |||||||||||
Deposits and other borrowings | 122,110 | 114,941 | 128,496 | 6 | % | -5 | % | |||||||||||||
Other external liabilities | 19,663 | 16,710 | 17,456 | 18 | % | 13 | % | |||||||||||||
|
|
|
|
|
|
|
|
|
| |||||||||||
External liabilities | 141,773 | 131,651 | 145,952 | 8 | % | -3 | % | |||||||||||||
|
|
|
|
|
|
|
|
|
| |||||||||||
Risk weighted assets | 87,116 | 79,698 | 81,741 | 9 | % | 7 | % | |||||||||||||
Average net loans and advances | 68,911 | 64,762 | 59,099 | 6 | % | 17 | % | |||||||||||||
Average deposits and other borrowings | 121,910 | 118,180 | 115,035 | 3 | % | 6 | % | |||||||||||||
Ratios | ||||||||||||||||||||
Net interest margin | 1.20 | % | 1.16 | % | 1.20 | % | ||||||||||||||
Operating expenses to operating income - cash | 51.7 | % | 55.3 | % | 55.4 | % | ||||||||||||||
Operating expenses to average assets - cash | 1.22 | % | 1.25 | % | 1.29 | % | ||||||||||||||
|
|
|
|
|
|
|
|
|
| |||||||||||
Individual credit impairment charge/(release) - cash | 115 | 90 | 90 | 28 | % | 28 | % | |||||||||||||
Individual credit impairment charge/(release) as a % of average net advances - cash | 0.34 | % | 0.28 | % | 0.31 | % | ||||||||||||||
Collective credit impairment charge/(release) - cash | (38 | ) | (4 | ) | 13 | large | large | |||||||||||||
Collective credit impairment charge/(release) as a % of average net advances - cash | (0.11 | %) | (0.01 | %) | 0.05 | % | ||||||||||||||
Net impaired assets | 302 | 362 | 352 | -17 | % | -14 | % | |||||||||||||
Net impaired assets as a % of net advances | 0.43 | % | 0.56 | % | 0.55 | % | ||||||||||||||
|
|
|
|
|
|
|
|
|
| |||||||||||
Total full time equivalent staff (FTE)1 | 19,247 | 18,824 | 18,119 | 2 | % | 6 | % | |||||||||||||
|
|
|
|
|
|
|
|
|
| |||||||||||
| 1. | Comparative information has been restated to include technology contractors, consistent with how FTE are reported and managed internally. |
79
GEOGRAPHIC REVIEW
Asia Pacific, Europe & America geography
Table reflects AUD results for the APEA regions
| Half Year | Movement | |||||||||||||||||||
| Statutory Profit | Mar 14 $M | Sep 13 $M | Mar 13 $M | Mar 14 v. Sep 13 | Mar 14 v. Mar 13 | |||||||||||||||
Asia | 498 | 355 | 302 | 40 | % | 65 | % | |||||||||||||
Europe & America | 60 | 126 | 66 | -52 | % | -9 | % | |||||||||||||
Pacific | 125 | 102 | 91 | 23 | % | 37 | % | |||||||||||||
|
|
|
|
|
|
|
|
|
| |||||||||||
| 683 | 583 | 459 | 17 | % | 49 | % | ||||||||||||||
|
|
|
|
|
|
|
|
|
| |||||||||||
| Half Year | Movement | |||||||||||||||||||
| Cash Profit | Mar 14 $M | Sep 13 $M | Mar 13 $M | Mar 14 v. Sep 13 | Mar 14 v. Mar 13 | |||||||||||||||
Asia | 497 | 355 | 301 | 40 | % | 65 | % | |||||||||||||
Europe & America | 59 | 97 | 67 | -39 | % | -12 | % | |||||||||||||
Pacific | 125 | 102 | 91 | 23 | % | 37 | % | |||||||||||||
|
|
|
|
|
|
|
|
|
| |||||||||||
| 681 | 554 | 459 | 23 | % | 48 | % | ||||||||||||||
|
|
|
|
|
|
|
|
|
| |||||||||||
| Half Year | Movement | |||||||||||||||||||
| Net loans and advances | Mar 14 $M | Sep 13 $M | Mar 13 $M | Mar 14 v. Sep 13 | Mar 14 v. Mar 13 | |||||||||||||||
Asia | 67,261 | 61,306 | 53,545 | 10 | % | 26 | % | |||||||||||||
Europe & America | 5,991 | 5,459 | 5,045 | 10 | % | 19 | % | |||||||||||||
Pacific | 3,382 | 3,128 | 2,633 | 8 | % | 28 | % | |||||||||||||
|
|
|
|
|
|
|
|
|
| |||||||||||
| 76,634 | 69,893 | 61,223 | 10 | % | 25 | % | ||||||||||||||
|
|
|
|
|
|
|
|
|
| |||||||||||
| Half Year | Movement | |||||||||||||||||||
| Customer deposits | Mar 14 $M | Sep 13 $M | Mar 13 $M | Mar 14 v. Sep 13 | Mar 14 v. Mar 13 | |||||||||||||||
Asia | 61,894 | 59,644 | 47,972 | 4 | % | 29 | % | |||||||||||||
Europe & America | 36,013 | 34,115 | 40,702 | 6 | % | -12 | % | |||||||||||||
Pacific | 4,556 | 4,368 | 4,062 | 4 | % | 12 | % | |||||||||||||
|
|
|
|
|
|
|
|
|
| |||||||||||
| 102,463 | 98,127 | 92,736 | 4 | % | 10 | % | ||||||||||||||
|
|
|
|
|
|
|
|
|
| |||||||||||
| Half Year | Movement | |||||||||||||||||||
| Risk weighted assets | Mar 14 $M | Sep 13 $M | Mar 13 $M | Mar 14 v. Sep 13 | Mar 14 v. Mar 13 | |||||||||||||||
Asia | 70,222 | 61,533 | 57,613 | 14 | % | 22 | % | |||||||||||||
Europe & America | 17,362 | 17,834 | 15,263 | -3 | % | 14 | % | |||||||||||||
Pacific | 6,769 | 6,219 | 5,540 | 9 | % | 22 | % | |||||||||||||
|
|
|
|
|
|
|
|
|
| |||||||||||
| 94,353 | 85,586 | 78,416 | 10 | % | 20 | % | ||||||||||||||
|
|
|
|
|
|
|
|
|
| |||||||||||
80
GEOGRAPHIC REVIEW
New Zealand geography
Table reflects AUD results for the New Zealand geography
| Half Year | Movement | |||||||||||||||||||
| Mar 14 $M | Sep 13 $M | Mar 13 $M | Mar 14 v. Sep 13 | Mar 14 v. Mar 13 | ||||||||||||||||
Net interest income | 1,250 | 1,137 | 1,040 | 10 | % | 20 | % | |||||||||||||
Other operating income | 487 | 351 | 364 | 39 | % | 34 | % | |||||||||||||
|
|
|
|
|
|
|
|
|
| |||||||||||
Operating income | 1,737 | 1,488 | 1,404 | 17 | % | 24 | % | |||||||||||||
Operating expenses | (661 | ) | (623 | ) | (612 | ) | 6 | % | 8 | % | ||||||||||
|
|
|
|
|
|
|
|
|
| |||||||||||
Profit before credit impairment and income tax | 1,076 | 865 | 792 | 24 | % | 36 | % | |||||||||||||
Credit impairment (charge)/release | 36 | (19 | ) | (34 | ) | large | large | |||||||||||||
|
|
|
|
|
|
|
|
|
| |||||||||||
Profit before income tax | 1,112 | 846 | 758 | 31 | % | 47 | % | |||||||||||||
Income tax expense and non-controlling interests | (303 | ) | (223 | ) | (202 | ) | 36 | % | 50 | % | ||||||||||
|
|
|
|
|
|
|
|
|
| |||||||||||
Cash profit | 809 | 623 | 556 | 30 | % | 46 | % | |||||||||||||
Adjustments between statutory profit and cash profit | (31 | ) | (17 | ) | (36 | ) | 82 | % | -14 | % | ||||||||||
|
|
|
|
|
|
|
|
|
| |||||||||||
Statutory profit | 778 | 606 | 520 | 28 | % | 50 | % | |||||||||||||
|
|
|
|
|
|
|
|
|
| |||||||||||
Balance Sheet | ||||||||||||||||||||
Net loans & advances | 96,150 | 89,093 | 78,473 | 8 | % | 23 | % | |||||||||||||
Other external assets | 25,511 | 24,098 | 22,913 | 6 | % | 11 | % | |||||||||||||
|
|
|
|
|
|
|
|
|
| |||||||||||
External assets | 121,661 | 113,191 | 101,386 | 7 | % | 20 | % | |||||||||||||
|
|
|
|
|
|
|
|
|
| |||||||||||
Customer deposits | 69,432 | 62,800 | 55,550 | 11 | % | 25 | % | |||||||||||||
Other deposits and borrowings | 6,597 | 6,503 | 5,173 | 1 | % | 28 | % | |||||||||||||
|
|
|
|
|
|
|
|
|
| |||||||||||
Deposits and other borrowings | 76,029 | 69,303 | 60,723 | 10 | % | 25 | % | |||||||||||||
Other external liabilities | 23,989 | 23,028 | 22,164 | 4 | % | 8 | % | |||||||||||||
|
|
|
|
|
|
|
|
|
| |||||||||||
External liabilities | 100,018 | 92,331 | 82,887 | 8 | % | 21 | % | |||||||||||||
|
|
|
|
|
|
|
|
|
| |||||||||||
Risk weighted assets | 64,667 | 57,263 | 52,048 | 13 | % | 24 | % | |||||||||||||
Average net loans and advances | 92,606 | 84,046 | 77,571 | 10 | % | 19 | % | |||||||||||||
Average deposits and other borrowings | 73,791 | 66,020 | 61,019 | 12 | % | 21 | % | |||||||||||||
Ratios | ||||||||||||||||||||
Net interest margin | 2.32 | % | 2.31 | % | 2.27 | % | ||||||||||||||
Operating expenses to operating income - cash | 38.1 | % | 41.7 | % | 43.6 | % | ||||||||||||||
Operating expenses to average assets - cash | 1.10 | % | 1.12 | % | 1.18 | % | ||||||||||||||
|
|
|
|
|
|
|
|
|
| |||||||||||
Individual credit impairment charge/(release) - cash | 20 | 45 | 61 | -56 | % | -67 | % | |||||||||||||
Individual credit impairment charge/(release) as a % of average net advances - cash | 0.04 | % | 0.11 | % | 0.16 | % | ||||||||||||||
Collective credit impairment charge/(release) - cash | (56 | ) | (26 | ) | (27 | ) | large | large | ||||||||||||
Collective credit impairment charge/(release) as a % of average net advances - cash | (0.12 | %) | (0.06 | %) | (0.07 | %) | ||||||||||||||
Net impaired assets | 557 | 589 | 708 | -5 | % | -21 | % | |||||||||||||
Net impaired assets as a % of net advances | 0.58 | % | 0.66 | % | 0.90 | % | ||||||||||||||
|
|
|
|
|
|
|
|
|
| |||||||||||
Total full time equivalent staff (FTE) | 8,257 | 8,284 | 8,656 | 0 | % | -5 | % | |||||||||||||
|
|
|
|
|
|
|
|
|
| |||||||||||
81
GEOGRAPHIC REVIEW
New Zealand geography
Table reflects NZD results for the New Zealand geography
| Half Year | Movement | |||||||||||||||||||
| Mar 14 NZD M | Sep 13 NZD M | Mar 13 NZD M | Mar 14 v. Sep 13 | Mar 14 v. Mar 13 | ||||||||||||||||
Net interest income | 1,370 | 1,338 | 1,303 | 2 | % | 5 | % | |||||||||||||
Other operating income | 534 | 411 | 457 | 30 | % | 17 | % | |||||||||||||
|
|
|
|
|
|
|
|
|
| |||||||||||
Operating income | 1,904 | 1,749 | 1,760 | 9 | % | 8 | % | |||||||||||||
Operating expenses | (725 | ) | (730 | ) | (767 | ) | -1 | % | -5 | % | ||||||||||
|
|
|
|
|
|
|
|
|
| |||||||||||
Profit before credit impairment and income tax | 1,179 | 1,019 | 993 | 16 | % | 19 | % | |||||||||||||
Credit impairment (charge)/release | 39 | (22 | ) | (43 | ) | large | large | |||||||||||||
|
|
|
|
|
|
|
|
|
| |||||||||||
Profit before income tax | 1,218 | 997 | 950 | 22 | % | 28 | % | |||||||||||||
Income tax expense and non-controlling interests | (331 | ) | (262 | ) | (253 | ) | 26 | % | 31 | % | ||||||||||
|
|
|
|
|
|
|
|
|
| |||||||||||
Cash profit | 887 | 735 | 697 | 21 | % | 27 | % | |||||||||||||
Adjustments between statutory profit and cash profit | (34 | ) | (20 | ) | (44 | ) | 70 | % | -23 | % | ||||||||||
|
|
|
|
|
|
|
|
|
| |||||||||||
Statutory profit | 853 | 715 | 653 | 19 | % | 31 | % | |||||||||||||
|
|
|
|
|
|
|
|
|
| |||||||||||
Balance Sheet | ||||||||||||||||||||
Net loans & advances | 102,571 | 100,113 | 97,847 | 2 | % | 5 | % | |||||||||||||
Other external assets | 27,215 | 27,079 | 28,570 | 1 | % | -5 | % | |||||||||||||
|
|
|
|
|
|
|
|
|
| |||||||||||
External assets | 129,786 | 127,192 | 126,417 | 2 | % | 3 | % | |||||||||||||
|
|
|
|
|
|
|
|
|
| |||||||||||
Customer deposits | 74,069 | 70,566 | 69,264 | 5 | % | 7 | % | |||||||||||||
Other deposits and borrowings | 7,038 | 7,309 | 6,450 | -4 | % | 9 | % | |||||||||||||
|
|
|
|
|
|
|
|
|
| |||||||||||
Deposits and other borrowings | 81,107 | 77,875 | 75,714 | 4 | % | 7 | % | |||||||||||||
Other external liabilities | 25,590 | 25,876 | 27,636 | -1 | % | -7 | % | |||||||||||||
|
|
|
|
|
|
|
|
|
| |||||||||||
External liabilities | 106,697 | 103,751 | 103,350 | 3 | % | 3 | % | |||||||||||||
|
|
|
|
|
|
|
|
|
| |||||||||||
Risk weighted assets | 68,985 | 64,346 | 64,898 | 7 | % | 6 | % | |||||||||||||
Average net loans and advances | 101,484 | 98,873 | 97,223 | 3 | % | 4 | % | |||||||||||||
Average deposits and other borrowings | 80,865 | 77,663 | 76,477 | 4 | % | 6 | % | |||||||||||||
Ratios | ||||||||||||||||||||
Net interest margin | 2.32 | % | 2.31 | % | 2.27 | % | ||||||||||||||
Operating expenses to operating income - cash | 38.1 | % | 41.7 | % | 43.6 | % | ||||||||||||||
Operating expenses to average assets - cash | 1.10 | % | 1.12 | % | 1.18 | % | ||||||||||||||
|
|
|
|
|
|
|
|
|
| |||||||||||
Individual credit impairment charge/(release) - cash | 22 | 52 | 76 | -58 | % | -71 | % | |||||||||||||
Individual credit impairment charge/(release) as a % of average net advances - cash | 0.04 | % | 0.11 | % | 0.16 | % | ||||||||||||||
Collective credit impairment charge/(release) - cash | (61 | ) | (30 | ) | (33 | ) | large | 85 | % | |||||||||||
Collective credit impairment charge/(release) as a % of average net advances - cash | (0.12 | %) | (0.06 | %) | (0.07 | %) | ||||||||||||||
Net impaired assets | 594 | 662 | 884 | -10 | % | -33 | % | |||||||||||||
Net impaired assets as a % of net advances | 0.58 | % | 0.66 | % | 0.90 | % | ||||||||||||||
|
|
|
|
|
|
|
|
|
| |||||||||||
Total full time equivalent staff (FTE) | 8,257 | 8,284 | 8,656 | 0 | % | -5 | % | |||||||||||||
|
|
|
|
|
|
|
|
|
| |||||||||||
82
PROFIT RECONCILIATION
CONTENTS
Section 7 – Profit Reconciliation
| Adjustments between statutory profit and cash profit | 84 | |||
| Explanation of adjustments between statutory profit and cash profit | 84 | |||
| Reconciliation of statutory profit to cash profit | 88 |
83
PROFIT RECONCILIATION
Non-IFRS information
The Group provides two additional measures of performance in the Results Announcement which are prepared on a basis other than in accordance with accounting standards - cash profit and economic profit. The guidance provided in Australian Securities and Investments Commission Regulatory Guide 230 has been followed when presenting this information.
Adjustments between statutory profit and cash profit
Statutory profit has been adjusted to exclude non-core items to arrive at cash profit, and has been provided to assist readers to understand the results for the ongoing business activities of the Group. The adjustments made in arriving at cash profit are included in statutory profit which is subject to review within the context of the external auditor’s review of the Condensed Consolidated Financial Statements. Cash profit is not subject to review by the external auditor, however, the external auditor has informed the Audit Committee that the adjustments have been determined on a consistent basis across each period presented.
| Half Year | Movement | |||||||||||||||||||
| Mar 14 $M | Sep 13 $M | Mar 13 $M | Mar 14 v. Sep 13 | Mar 14 v. Mar 13 | ||||||||||||||||
Statutory profit attributable to shareholders of the Company | 3,381 | 3,329 | 2,937 | 2 | % | 15 | % | |||||||||||||
Adjustments between statutory profit and cash profit | 134 | (16 | ) | 242 | large | -45 | % | |||||||||||||
|
|
|
|
|
|
|
|
|
| |||||||||||
Cash profit | 3,515 | 3,313 | 3,179 | 6 | % | 11 | % | |||||||||||||
|
|
|
|
|
|
|
|
|
| |||||||||||
| Half Year | Movement | |||||||||||||||||||
| Mar 14 $M | Sep 13 $M | Mar 13 $M | Mar 14 v. Sep 13 | Mar 14 v. Mar 13 | ||||||||||||||||
Adjustments between statutory profit and cash profit | ||||||||||||||||||||
Treasury shares adjustment | 37 | 31 | 53 | 19 | % | -30 | % | |||||||||||||
Revaluation of policy liabilities | (3 | ) | 27 | 19 | large | large | ||||||||||||||
Economic hedging | 89 | (205 | ) | 192 | large | -54 | % | |||||||||||||
Revenue and net investment hedges | 18 | 143 | 16 | -87 | % | 13 | % | |||||||||||||
Structured credit intermediation trades | (7 | ) | (12 | ) | (38 | ) | -42 | % | -82 | % | ||||||||||
|
|
|
|
|
|
|
|
|
| |||||||||||
Total adjustments between statutory profit and cash profit | 134 | (16 | ) | 242 | large | -45 | % | |||||||||||||
|
|
|
|
|
|
|
|
|
| |||||||||||
Explanation of adjustments between statutory profit and cash profit
| • | Treasury shares adjustment |
ANZ shares held by the Group in the consolidated managed funds and life business are deemed to be Treasury shares for accounting purposes. Dividends and realised and unrealised gains and losses from these shares are reversed as these are not permitted to be recognised in income for statutory reporting purposes. In deriving cash profit, these earnings are included to ensure there is no asymmetrical impact on the Group’s profits because the Treasury shares support policy liabilities which are revalued in deriving income. Accordingly the gain of $37 million after tax ($40 million pre tax) eliminated for statutory accounting purposes has been added back to cash profit.
| • | Revaluation of policy liabilities |
When calculating policy liabilities, the projected future cash flows on insurance contracts are discounted to reflect the present value of the obligation, with the impact of changes in the market discount rate each period being reflected in the income statement. ANZ includes the impact on the remeasurement of the insurance contract attributable to changes in market discount rates as an adjustment to cash profit to remove the volatility attributable to changes in market interest rates which reverts to zero over the life of the insurance contract.
| • | Economic hedging and Revenue and net investment hedges |
The Group enters into economic hedges to manage its interest rate and foreign exchange risk. The application of AASB 139: Financial Instruments – Recognition and Measurement results in fair value gains and losses being recognised within the income statement. ANZ includes the mark-to-market adjustments as an adjustment to cash profit as the profit or loss resulting from the transactions will reverse over time to match with the profit or loss from the economically hedged item as part of cash profit. This includes gains and losses arising from:
| • | approved classes of derivatives not designated in accounting hedge relationships but which are considered to be economic hedges, including hedges of NZD and USD revenue; |
| • | the use of the fair value option (principally arising from the valuation of the ‘own name’ credit spread on debt issues designated at fair value); and |
| • | ineffectiveness from designated accounting cash flow, fair value and net investment hedges. |
In the table below, funding and lending related swaps are primarily cross currency interest rate swaps which are being used to convert the proceeds of foreign currency debt issuances into floating rate Australian dollar and New Zealand dollar debt. As these swaps do not qualify for hedge accounting, movements in the fair values are recorded in the Income Statement. The main drivers of these fair values are currency basis spreads and the Australian dollar and New Zealand dollar fluctuation against other major funding currencies. This category also includes economic hedges of select structured finance and specialised leasing transactions that do not qualify for hedge accounting. The main drivers of these fair value adjustments are Australian and New Zealand yield curves.
Mark-to-market losses in March 2014 half year were driven by a narrowing of basis spreads principally from movements in AUD/USD and USD/EUR currency pairs. These were partially offset by gains from the continuing weakening of AUD across some major currencies principally USD and EUR. The AUD has weakened significantly against EUR and USD since March 2013 and this drove much of the gains in the September 2013 half year.
84
PROFIT RECONCILIATION
Losses arising from the use of the fair value option on own name debt hedged by derivatives are attributable to a narrowing of ANZ credit spreads driven from a continuing period of relative stability in the global markets. In September 2013 half year, some negative sentiment on the Australian economy saw a marginal reversal of falling spreads which generated a gain in the period.
Losses within revenue and net investment hedges were principally as a result of the weakening in AUD against the NZD exchange rate during the March 2014 half year.
| Half Year | ||||||||||||
| Adjustments to the income statement | Mar 14 $M | Sep 13 $M | Mar 13 $M | |||||||||
Timing differences where IFRS results in asymmetry between the hedge and hedged items | ||||||||||||
Funding and lending related swaps | 101 | (281 | ) | 203 | ||||||||
Use of the fair value option on own debt hedged by derivatives | 15 | (11 | ) | 74 | ||||||||
Revenue and net investment hedges | 26 | 201 | 23 | |||||||||
Ineffective portion of cash flow and fair value hedges | 10 | (2 | ) | (6 | ) | |||||||
|
|
|
|
|
| |||||||
Increase/(decrease) to cash profit before tax | 152 | (93 | ) | 294 | ||||||||
|
|
|
|
|
| |||||||
Increase/(decrease) to cash profit after tax | 107 | (62 | ) | 208 | ||||||||
|
|
|
|
|
| |||||||
| Cumulative increase/(decrease) to cash profit pre-tax relating to economic hedging | As at ($M) | |||||||||||
| Mar 14 $M | Sep 13 $M | Mar 13 $M | ||||||||||
Timing differences where IFRS results in asymmetry between the hedge and hedged items (before tax) | ||||||||||||
Funding and lending related swaps | 779 | 678 | 959 | |||||||||
Use of the fair value option on own debt hedged by derivatives | 14 | (1 | ) | 10 | ||||||||
Revenue and net investment hedges | 205 | 179 | (22 | ) | ||||||||
Ineffective portion of cash flow and fair value hedges | (15 | ) | (25 | ) | (23 | ) | ||||||
|
|
|
|
|
| |||||||
| 983 | 831 | 924 | ||||||||||
|
|
|
|
|
| |||||||
85
PROFIT RECONCILIATION
| • | Structured credit intermediation trades |
ANZ entered into a series of structured credit intermediation trades from 2004 to 2007. The underlying structures involve credit default swaps (CDS) over synthetic collateralised debt obligations (CDOs), portfolios of external collateralised loan obligations (CLOs) or specific bonds/floating rate notes (FRNs). ANZ sold protection using credit default swaps over these structures and then to mitigate risk, purchased protection via credit default swaps over the same structures from eight US financial guarantors.
Being derivatives, both the sold protection and purchased protection are marked-to-market. Prior to the commencement of the global credit crisis, movements in valuations of these positions were not significant and largely offset each other in income. Following the onset of the credit crisis, the purchased protection has provided only a partial offset against movements in valuation of the sold protection because:
| • | one of the counterparties to the purchased protection defaulted and many of the remaining were downgraded; and |
| • | a credit valuation adjustment is applied to the remaining counterparties to the purchased protection reflective of changes to their credit worthiness. |
ANZ is actively monitoring this portfolio with a view to reducing the exposure via termination and restructuring of both the bought and sold protection if and when ANZ deems it cost effective relative to the perceived risk associated with a specific trade or counterparty. The bought and sold protection trades are by nature largely offsetting, with the notional amount on the outstanding bought CDSs and outstanding sold CDSs at 31 March 2014 each amounting to US$4.4 billion (30 September 2013: US$4.5 billion; 31 March 2013: US$4.7 billion).
The profit and loss impact of credit risk on structured credit derivatives remains volatile reflecting the impact of market movements in credit spreads and AUD/USD rates.
The (gain)/loss on structured credit intermediation trades is included as an adjustment to cash profit as it relates to a legacy non-core business where the cumulative mark-to-market movements are expected to reverse to zero in future periods.
| Half Year | Movement | |||||||||||||||||||
| Credit risk on intermediation trades | Mar 14 $M | Sep 13 $M | Mar 13 $M | Mar 14 v. Sep 13 | Mar 14 v. Mar 13 | |||||||||||||||
Profit before income tax | (9 | ) | (15 | ) | (48 | ) | -40 | % | -81 | % | ||||||||||
Income tax expense | 2 | 3 | 10 | -33 | % | -80 | % | |||||||||||||
Profit after income tax | (7 | ) | (12 | ) | (38 | ) | -42 | % | -82 | % | ||||||||||
| As at ($M) | Movement | |||||||||||||||||||
| Financial impacts of credit intermediation trades | Mar 14 | Sep 13 | Mar 13 | Mar 14 v. Sep 13 | Mar 14 v. Mar 13 | |||||||||||||||
Mark-to-market exposure to financial guarantors | 136 | 179 | 257 | -24 | % | -47 | % | |||||||||||||
|
|
|
|
|
|
|
|
|
| |||||||||||
Cumulative costs relating to financial guarantors1 | ||||||||||||||||||||
CVA for outstanding transactions | 33 | 42 | 54 | -21 | % | -39 | % | |||||||||||||
Realised close out and hedge costs | 333 | 333 | 336 | 0 | % | -1 | % | |||||||||||||
|
|
|
|
|
|
|
|
|
| |||||||||||
Cumulative life to date charges | 366 | 375 | 390 | -2 | % | -6 | % | |||||||||||||
|
|
|
|
|
|
|
|
|
| |||||||||||
| 1. | The cumulative costs in managing the positions include realised losses relating to restructuring of trades in order to reduce risks and realised losses on termination of sold protection trades. It also includes foreign exchange hedging losses |
| • | Credit risk on impaired derivatives (nil profit after tax impact) |
Reclassification of a charge to income for credit valuation adjustments on defaulted and impaired derivative exposures to credit impairment charges of $1 million for the half year (Sep 13 half: $2 million release; Mar 13 half: $11 million charge). The reclassification has been made to reflect the manner in which the defaulted and impaired derivatives are managed.
| • | Policyholders tax gross up (nil profit after tax impact) |
For statutory reporting purposes policyholder income tax and other related taxes paid on behalf of policyholders are included in both net income from wealth management and the Group’s income tax expense. The gross up of $29 million (Sep 13 half: $184 million; Mar 13 half: $187 million) has been excluded from the cash results as it does not reflect the underlying performance of the business which is assessed on a net of policyholder tax basis.
86
PROFIT RECONCILIATION
This page has been left blank intentionally
87
PROFIT RECONCILIATION
Reconciliation of statutory profit to cash profit
March 2014 Half Year | ||||||||||||||||
| Statutory | Adjustments to statutory profit | |||||||||||||||
| profit | ||||||||||||||||
| $M | Treasury shares adjustment $M | Policyholders tax gross up $M | Revaluation of policy liabilities $M | |||||||||||||
Net interest income | 6,778 | — | — | — | ||||||||||||
|
|
|
|
|
|
|
| |||||||||
Fee income | 1,255 | — | — | — | ||||||||||||
Foreign exchange earnings | 593 | — | — | — | ||||||||||||
Profit on trading instruments | 15 | — | — | — | ||||||||||||
Net income from wealth management | 611 | 40 | (29 | ) | (5 | ) | ||||||||||
Other | 266 | — | — | — | ||||||||||||
|
|
|
|
|
|
|
| |||||||||
Other operating income | 2,740 | 40 | (29 | ) | (5 | ) | ||||||||||
Operating income | 9,518 | 40 | (29 | ) | (5 | ) | ||||||||||
|
|
|
|
|
|
|
| |||||||||
Personnel expenses | (2,493 | ) | — | — | — | |||||||||||
Premises expenses | (391 | ) | — | — | — | |||||||||||
Computer expenses | (640 | ) | — | — | — | |||||||||||
Restructuring expenses | (35 | ) | — | — | — | |||||||||||
Other expenses | (727 | ) | — | — | — | |||||||||||
|
|
|
|
|
|
|
| |||||||||
Operating expenses | (4,286 | ) | — | — | — | |||||||||||
|
|
|
|
|
|
|
| |||||||||
Profit before credit impairment and tax | 5,232 | 40 | (29 | ) | (5 | ) | ||||||||||
Credit impairment charge | (527 | ) | — | — | — | |||||||||||
|
|
|
|
|
|
|
| |||||||||
Profit before income tax | 4,705 | 40 | (29 | ) | (5 | ) | ||||||||||
Income tax expense | (1,318 | ) | (3 | ) | 29 | 2 | ||||||||||
Non-controlling interests | (6 | ) | — | — | — | |||||||||||
|
|
|
|
|
|
|
| |||||||||
Profit | 3,381 | 37 | — | (3 | ) | |||||||||||
|
|
|
|
|
|
|
| |||||||||
September 2013 Half Year | ||||||||||||||||
| Statutory | Adjustments to statutory profit | |||||||||||||||
| profit | ||||||||||||||||
| $M | Treasury shares adjustment $M | Policyholders tax gross up $M | Revaluation of policy liabilities $M | |||||||||||||
Net interest income | 6,558 | — | — | — | ||||||||||||
|
|
|
|
|
|
|
| |||||||||
Fee income | 1,228 | — | — | — | ||||||||||||
Foreign exchange earnings | 377 | — | — | — | ||||||||||||
Profit on trading instruments | 48 | — | — | — | ||||||||||||
Net income from wealth management | 735 | 33 | (184 | ) | 38 | |||||||||||
Other | 577 | — | — | — | ||||||||||||
|
|
|
|
|
|
|
| |||||||||
Other operating income | 2,965 | 33 | (184 | ) | 38 | |||||||||||
Operating income | 9,523 | 33 | (184 | ) | 38 | |||||||||||
|
|
|
|
|
|
|
| |||||||||
Personnel expenses | (2,417 | ) | — | — | — | |||||||||||
Premises expenses | (377 | ) | — | — | — | |||||||||||
Computer expenses | (625 | ) | — | — | — | |||||||||||
Restructuring expenses | (28 | ) | — | — | — | |||||||||||
Other expenses | (766 | ) | — | — | — | |||||||||||
|
|
|
|
|
|
|
| |||||||||
Operating expenses | (4,213 | ) | — | — | — | |||||||||||
|
|
|
|
|
|
|
| |||||||||
Profit before credit impairment and tax | 5,310 | 33 | (184 | ) | 38 | |||||||||||
Credit impairment charge | (600 | ) | — | — | — | |||||||||||
|
|
|
|
|
|
|
| |||||||||
Profit before income tax | 4,710 | 33 | (184 | ) | 38 | |||||||||||
Income tax expense | (1,376 | ) | (2 | ) | 184 | (11 | ) | |||||||||
Non-controlling interests | (5 | ) | — | — | — | |||||||||||
|
|
|
|
|
|
|
| |||||||||
Profit | 3,329 | 31 | — | 27 | ||||||||||||
|
|
|
|
|
|
|
| |||||||||
88
PROFIT RECONCILIATION
March 2014 Half Year | ||||||||||||||||||||||
| Adjustments to statutory profit | Cash | |||||||||||||||||||||
| profit | ||||||||||||||||||||||
| Economic hedging $M | Revenue and $M | Structured credit $M | Credit risk $M | Total $M | $M | |||||||||||||||||
| (14 | ) | — | — | — | (14 | ) | 6,764 | |||||||||||||||
|
|
|
|
|
|
|
|
|
|
|
| |||||||||||
| — | — | — | — | — | 1,255 | |||||||||||||||||
| — | 26 | — | — | 26 | 619 | |||||||||||||||||
| — | — | (9 | ) | 1 | (8 | ) | 7 | |||||||||||||||
| — | — | — | — | 6 | 617 | |||||||||||||||||
| 140 | — | — | — | 140 | 406 | |||||||||||||||||
|
|
|
|
|
|
|
|
|
|
|
| |||||||||||
| 140 | 26 | (9 | ) | 1 | 164 | 2,904 | ||||||||||||||||
| 126 | 26 | (9 | ) | 1 | 150 | 9,668 | ||||||||||||||||
|
|
|
|
|
|
|
|
|
|
|
| |||||||||||
| — | — | — | — | — | (2,493 | ) | ||||||||||||||||
| — | — | — | — | — | (391 | ) | ||||||||||||||||
| — | — | — | — | — | (640 | ) | ||||||||||||||||
| — | — | — | — | — | (35 | ) | ||||||||||||||||
| — | — | — | — | — | (727 | ) | ||||||||||||||||
|
|
|
|
|
|
|
|
|
|
|
| |||||||||||
| — | — | — | — | — | (4,286 | ) | ||||||||||||||||
|
|
|
|
|
|
|
|
|
|
|
| |||||||||||
| 126 | 26 | (9 | ) | 1 | 150 | 5,382 | ||||||||||||||||
| — | — | — | (1 | ) | (1 | ) | (528 | ) | ||||||||||||||
|
|
|
|
|
|
|
|
|
|
|
| |||||||||||
| 126 | 26 | (9 | ) | — | 149 | 4,854 | ||||||||||||||||
| (37 | ) | (8 | ) | 2 | — | (15 | ) | (1,333 | ) | |||||||||||||
| — | — | — | — | — | (6 | ) | ||||||||||||||||
|
|
|
|
|
|
|
|
|
|
|
| |||||||||||
| 89 | 18 | (7 | ) | — | 134 | 3,515 | ||||||||||||||||
|
|
|
|
|
|
|
|
|
|
|
| |||||||||||
September 2013 Half Year | ||||||||||||||||||||||
| Adjustments to statutory profit | Cash | |||||||||||||||||||||
| profit | ||||||||||||||||||||||
| Economic hedging $M | Revenue and $M | Structured credit intermediation trades | Credit risk on impaired derivatives $M | Total adjustments to statutory profit $M | $M | |||||||||||||||||
| (22 | ) | — | — | — | (22 | ) | 6,536 | |||||||||||||||
|
|
|
|
|
|
|
|
|
|
|
| |||||||||||
| — | — | — | — | — | 1,228 | |||||||||||||||||
| 7 | 201 | — | — | 208 | 585 | |||||||||||||||||
| (43 | ) | — | (15 | ) | (2 | ) | (60 | ) | (12 | ) | ||||||||||||
| — | — | — | — | (113 | ) | 622 | ||||||||||||||||
| (237 | ) | — | — | — | (237 | ) | 340 | |||||||||||||||
|
|
|
|
|
|
|
|
|
|
|
| |||||||||||
| (273 | ) | 201 | (15 | ) | (2 | ) | (202 | ) | 2,763 | |||||||||||||
| (295 | ) | 201 | (15 | ) | (2 | ) | (224 | ) | 9,299 | |||||||||||||
|
|
|
|
|
|
|
|
|
|
|
| |||||||||||
| — | — | — | — | — | (2,417 | ) | ||||||||||||||||
| — | — | — | — | — | (377 | ) | ||||||||||||||||
| — | — | — | — | — | (625 | ) | ||||||||||||||||
| — | — | — | — | — | (28 | ) | ||||||||||||||||
| — | — | — | — | — | (766 | ) | ||||||||||||||||
|
|
|
|
|
|
|
|
|
|
|
| |||||||||||
| — | — | — | — | — | (4,213 | ) | ||||||||||||||||
|
|
|
|
|
|
|
|
|
|
|
| |||||||||||
| (295 | ) | 201 | (15 | ) | (2 | ) | (224 | ) | 5,086 | |||||||||||||
| — | — | — | 2 | 2 | (598 | ) | ||||||||||||||||
|
|
|
|
|
|
|
|
|
|
|
| |||||||||||
| (295 | ) | 201 | (15 | ) | — | (222 | ) | 4,488 | ||||||||||||||
| 90 | (58 | ) | 3 | — | 206 | (1,170 | ) | |||||||||||||||
| — | — | — | — | — | (5 | ) | ||||||||||||||||
|
|
|
|
|
|
|
|
|
|
|
| |||||||||||
| (205 | ) | 143 | (12 | ) | — | (16 | ) | 3,313 | ||||||||||||||
|
|
|
|
|
|
|
|
|
|
|
| |||||||||||
89
PROFIT RECONCILIATION
March 2013 Half Year | ||||||||||||||||
| Statutory | Adjustments to statutory profit | |||||||||||||||
| profit | ||||||||||||||||
| $M | Treasury shares adjustment $M | Policyholders tax gross up $M | Revaluation of policy liabilities $M | |||||||||||||
Net interest income | 6,200 | — | — | — | ||||||||||||
|
|
|
|
|
|
|
| |||||||||
Fee income | 1,231 | — | — | — | ||||||||||||
Foreign exchange earnings | 467 | — | — | — | ||||||||||||
Profit on trading instruments | 315 | — | — | — | ||||||||||||
Net income from wealth management | 696 | 57 | (187 | ) | 28 | |||||||||||
Other | 27 | — | — | — | ||||||||||||
|
|
|
|
|
|
|
| |||||||||
Other operating income | 2,736 | 57 | (187 | ) | 28 | |||||||||||
Operating income | 8,936 | 57 | (187 | ) | 28 | |||||||||||
|
|
|
|
|
|
|
| |||||||||
Personnel expenses | (2,347 | ) | — | — | — | |||||||||||
Premises expenses | (356 | ) | — | — | — | |||||||||||
Computer expenses | (618 | ) | — | — | — | |||||||||||
Restructuring expenses | (57 | ) | — | — | — | |||||||||||
Other expenses | (666 | ) | — | — | — | |||||||||||
|
|
|
|
|
|
|
| |||||||||
Operating expenses | (4,044 | ) | — | — | — | |||||||||||
|
|
|
|
|
|
|
| |||||||||
Profit before credit impairment and tax | 4,892 | 57 | (187 | ) | 28 | |||||||||||
Credit impairment charge | (588 | ) | — | — | — | |||||||||||
|
|
|
|
|
|
|
| |||||||||
Profit before income tax | 4,304 | 57 | (187 | ) | 28 | |||||||||||
Income tax expense | (1,362 | ) | (4 | ) | 187 | (9 | ) | |||||||||
Non-controlling interests | (5 | ) | — | — | — | |||||||||||
|
|
|
|
|
|
|
| |||||||||
Profit | 2,937 | 53 | — | 19 | ||||||||||||
|
|
|
|
|
|
|
| |||||||||
90
PROFIT RECONCILIATION
March 2013 Half Year | ||||||||||||||||||||||
| Adjustments to statutory profit | Cash | |||||||||||||||||||||
| profit | ||||||||||||||||||||||
| Economic hedging $M | Revenue and $M | Structured credit intermediation trades | Credit risk $M | Total adjustments to $M | $M | |||||||||||||||||
| 36 | — | — | — | 36 | 6,236 | |||||||||||||||||
|
|
|
|
|
|
|
|
|
|
|
| |||||||||||
| — | — | — | — | — | 1,231 | |||||||||||||||||
| (12 | ) | 23 | — | — | 11 | 478 | ||||||||||||||||
| 7 | — | (48 | ) | 11 | (30 | ) | 285 | |||||||||||||||
| — | — | — | — | (102 | ) | 594 | ||||||||||||||||
| 241 | — | — | — | 241 | 268 | |||||||||||||||||
|
|
|
|
|
|
|
|
|
|
|
| |||||||||||
| 236 | 23 | (48 | ) | 11 | 120 | 2,856 | ||||||||||||||||
| 272 | 23 | (48 | ) | 11 | 156 | 9,092 | ||||||||||||||||
|
|
|
|
|
|
|
|
|
|
|
| |||||||||||
| — | — | — | — | — | (2,347 | ) | ||||||||||||||||
| — | — | — | — | — | (356 | ) | ||||||||||||||||
| — | — | — | — | — | (618 | ) | ||||||||||||||||
| — | — | — | — | — | (57 | ) | ||||||||||||||||
| — | — | — | — | — | (666 | ) | ||||||||||||||||
|
|
|
|
|
|
|
|
|
|
|
| |||||||||||
| — | — | — | — | — | (4,044 | ) | ||||||||||||||||
|
|
|
|
|
|
|
|
|
|
|
| |||||||||||
| 272 | 23 | (48 | ) | 11 | 156 | 5,048 | ||||||||||||||||
| — | — | — | (11 | ) | (11 | ) | (599 | ) | ||||||||||||||
|
|
|
|
|
|
|
|
|
|
|
| |||||||||||
| 272 | 23 | (48 | ) | — | 145 | 4,449 | ||||||||||||||||
| (80 | ) | (7 | ) | 10 | — | 97 | (1,265 | ) | ||||||||||||||
| — | — | — | — | — | (5 | ) | ||||||||||||||||
|
|
|
|
|
|
|
|
|
|
|
| |||||||||||
| 192 | 16 | (38 | ) | — | 242 | 3,179 | ||||||||||||||||
|
|
|
|
|
|
|
|
|
|
|
| |||||||||||
91
PROFIT RECONCILIATION
This page has been left blank intentionally
92
CONDENSED CONSOLIDATED FINANCIAL STATEMENTS – TABLE OF CONTENTS
| CONTENTS | PAGE | |||
Directors’ Report | 94 | |||
Condensed Consolidated Income Statement | 95 | |||
Condensed Consolidated Statement of Comprehensive Income | 96 | |||
Condensed Consolidated Balance Sheet | 97 | |||
Condensed Consolidated Cash Flow Statement | 98 | |||
Condensed Consolidated Statement of Changes in Equity | 99 | |||
Notes to Condensed Consolidated Financial Statements | 100 | |||
93
DIRECTORS’ REPORT
The Directors present their report on the Condensed Consolidated Financial Statements for the half year ended 31 March 2014.
Directors
The names of the Directors of the Company who held office during and since the end of the half year are:
| Mr JP Morschel | Chairman | |
| Mr MRP Smith, OBE | Director and Chief Executive Officer | |
| Dr GJ Clark | Director, retired on 18 December 2013 | |
| Ms PJ Dwyer | Director | |
| Mr DM Gonski, AC | Director since 27 February 2014 | |
| Mr PAF Hay | Director | |
| Mr Lee Hsien Yang | Director | |
| Mr GR Liebelt | Director | |
| Mr IJ Macfarlane, AC | Director | |
| Mr DE Meiklejohn, AM | Director, retired on 18 December 2013 | |
| Ms AM Watkins | Director |
Result
The consolidated profit attributable to shareholders of the Company was $3,381 million. Further details are contained in the CFO’s Overview on pages 15 to 40 which forms part of this report, and in the Condensed Consolidated Financial Statements.
Review of operations
A review of the operations of the Group during the half year and the results of those operations are contained in the CFO’s Overview on pages 15 to 40 which forms part of this report.
Lead auditor’s independence declaration
The lead auditor’s independence declaration given under section 307C of the Corporations Act 2001 (as amended) is set out on page 129 which forms part of this report.
Rounding of amounts
The amounts contained in these Condensed Consolidated Financial Statements have been rounded to the nearest million dollars, except where otherwise indicated, as permitted by ASIC Class Order 98/100.
Significant events since balance date
On 10 April 2014, the Company announced the sale of ANZ Trustees to Equity Trustees Limited for $150 million. The transaction is expected to be completed in July 2014 subject to regulatory approval. The gain on sale will be recognised in the second half of the 2014 financial year.
There have been no other significant events from 31 March 2014 to the date of this report.
| Signed in accordance with a resolution of the Directors. | ||||
 |  | |||
| John P Morschel | Michael R P Smith, OBE | |||
| Chairman | Director | |||
| 30 April 2014 | ||||
94
CONDENSED CONSOLIDATED INCOME STATEMENT
Australia and New Zealand Banking Group Limited
| Note | Half Year | Movement | ||||||||||||||||||||
| Mar-14 $M | Sep-131 $M | Mar-131 $M | Mar-14 v. Sep-13 | Mar-14 v. Mar-13 | ||||||||||||||||||
Interest income | 14,430 | 14,301 | 14,326 | 1 | % | 1 | % | |||||||||||||||
Interest expense | (7,652 | ) | (7,743 | ) | (8,126 | ) | -1 | % | -6 | % | ||||||||||||
|
|
|
|
|
|
|
|
|
| |||||||||||||
Net interest income | 2 | 6,778 | 6,558 | 6,200 | 3 | % | 9 | % | ||||||||||||||
Other operating income | 2 | 1,882 | 1,959 | 1,829 | -4 | % | 3 | % | ||||||||||||||
Net funds management and insurance income | 2 | 611 | 735 | 696 | -17 | % | -12 | % | ||||||||||||||
Share of associates’ profit | 2,18 | 247 | 271 | 211 | -9 | % | 17 | % | ||||||||||||||
|
|
|
|
|
|
|
|
|
| |||||||||||||
Operating income | 9,518 | 9,523 | 8,936 | 0 | % | 7 | % | |||||||||||||||
Operating expenses | 3 | (4,286 | ) | (4,213 | ) | (4,044 | ) | 2 | % | 6 | % | |||||||||||
|
|
|
|
|
|
|
|
|
| |||||||||||||
Profit before credit impairment and income tax | 5,232 | 5,310 | 4,892 | -1 | % | 7 | % | |||||||||||||||
Credit impairment charge | 8 | (527 | ) | (600 | ) | (588 | ) | -12 | % | -10 | % | |||||||||||
|
|
|
|
|
|
|
|
|
| |||||||||||||
Profit before income tax | 4,705 | 4,710 | 4,304 | 0 | % | 9 | % | |||||||||||||||
Income tax expense | 4 | (1,318 | ) | (1,376 | ) | (1,362 | ) | -4 | % | -3 | % | |||||||||||
|
|
|
|
|
|
|
|
|
| |||||||||||||
Profit for the period | 3,387 | 3,334 | 2,942 | 2 | % | 15 | % | |||||||||||||||
|
|
|
|
|
|
|
|
|
| |||||||||||||
Comprising: | ||||||||||||||||||||||
Profit attributable to non-controlling interests | 6 | 5 | 5 | 20 | % | 20 | % | |||||||||||||||
Profit attributable to shareholders of the Company | 3,381 | 3,329 | 2,937 | 2 | % | 15 | % | |||||||||||||||
|
|
|
|
|
|
|
|
|
| |||||||||||||
Earnings per ordinary share (cents) | ||||||||||||||||||||||
Basic | 6 | 124.4 | 122.5 | 108.5 | 2 | % | 15 | % | ||||||||||||||
Diluted | 6 | 120.2 | 118.5 | 105.3 | 1 | % | 14 | % | ||||||||||||||
Dividend per ordinary share (cents) | 5 | 83 | 91 | 73 | -9 | % | 14 | % | ||||||||||||||
|
|
|
|
|
|
|
|
|
| |||||||||||||
The notes appearing on pages 100 to 127 form an integral part of the Condensed Consolidated Financial Statements.
| 1. | Comparative amounts have changed. Refer to Note 21 for details. |
95
CONDENSED CONSOLIDATED STATEMENT OF COMPREHENSIVE INCOME
Australia and New Zealand Banking Group Limited
| Half Year | Movement | |||||||||||||||||||
| Mar 14 $M | Sep 131 $M | Mar 131 $M | Mar 14 v. Sep 13 | Mar 14 v. Mar 13 | ||||||||||||||||
Profit for the period | 3,387 | 3,334 | 2,942 | 2 | % | 15 | % | |||||||||||||
Other comprehensive income | ||||||||||||||||||||
Items that will not be reclassified subsequently to profit or loss | ||||||||||||||||||||
Remeasurement gain/(loss) on defined benefit plans | 36 | 65 | (22 | ) | -45 | % | large | |||||||||||||
Income tax on items that will not be reclassified subsequently to profit or loss | ||||||||||||||||||||
Remeasurement gain/(loss) on defined benefit plans | (10 | ) | (17 | ) | (1 | ) | -41 | % | large | |||||||||||
Items that may be reclassified subsequently to profit or loss | ||||||||||||||||||||
Foreign currency translation reserve | ||||||||||||||||||||
Exchange differences taken to equity | 570 | 1,706 | 6 | -67 | % | Large | ||||||||||||||
Exchange differences transferred to income statement | (11 | ) | — | — | n/a | n/a | ||||||||||||||
Available-for-sale assets | ||||||||||||||||||||
Valuation gain/(loss) taken to equity | 133 | (22 | ) | 35 | large | Large | ||||||||||||||
Transferred to income statement | (45 | ) | 5 | (2 | ) | large | Large | |||||||||||||
Cash flow hedges | ||||||||||||||||||||
Valuation gain/(loss) taken to equity | — | (71 | ) | (115 | ) | -100 | % | -100 | % | |||||||||||
Transferred to income statement | (16 | ) | (5 | ) | 5 | large | Large | |||||||||||||
Share of associates’ other comprehensive income2 | (32 | ) | (2 | ) | 20 | large | large | |||||||||||||
Income tax on items that may be reclassified subsequently to profit or loss | ||||||||||||||||||||
Available-for-sale assets revaluation reserve | (26 | ) | 2 | (9 | ) | large | large | |||||||||||||
Cash flow hedge reserve | 3 | 21 | 31 | -86 | % | -90 | % | |||||||||||||
|
|
|
|
|
|
|
|
|
| |||||||||||
Other comprehensive income net of tax | 602 | 1,682 | (52 | ) | -64 | % | large | |||||||||||||
|
|
|
|
|
|
|
|
|
| |||||||||||
Total comprehensive income for the period | 3,989 | 5,016 | 2,890 | -20 | % | 38 | % | |||||||||||||
|
|
|
|
|
|
|
|
|
| |||||||||||
Comprising total comprehensive income attributable to: | ||||||||||||||||||||
Non-controlling interests | 6 | 10 | 5 | -40 | % | 20 | % | |||||||||||||
Shareholders of the Company | 3,983 | 5,006 | 2,885 | -20 | % | 38 | % | |||||||||||||
|
|
|
|
|
|
|
|
|
| |||||||||||
| 1. | Comparative amounts have changed. Refer to Note 21 for details. |
| 2. | Share of associates other comprehensive income is comprised of Available-for-sale assets reserve loss of $32 million (Sep 13 half: loss of $2 million, Mar 13 half: gain of $20 million); Foreign currency translation reserve of nil (Sep 13 half: nil, Mar 13 half: loss of $1 million) and Cash flow hedge reserve of nil (Sep 13 half: nil, Mar 13 half: gain of $1 million). |
The notes appearing on pages 100 to 127 form an integral part of the Condensed Consolidated Financial Statements.
96
CONDENSED CONSOLIDATED BALANCE SHEET
Australia and New Zealand Banking Group Limited
| As at ($M) | Movement | |||||||||||||||||||||
| Note | Mar 14 | Sep 131 | Mar 131 | Mar 14 v. Sep 13 | Mar 14 v. Mar 13 | |||||||||||||||||
Assets | ||||||||||||||||||||||
Cash | 33,651 | 25,270 | 39,779 | 33 | % | -15 | % | |||||||||||||||
Settlement balances owed to ANZ | 16,209 | 19,225 | 15,804 | -16 | % | 3 | % | |||||||||||||||
Collateral paid | 6,219 | 6,530 | 6,699 | -5 | % | -7 | % | |||||||||||||||
Trading securities | 46,170 | 41,288 | 39,569 | 12 | % | 17 | % | |||||||||||||||
Derivative financial instruments | 43,829 | 45,878 | 41,700 | -4 | % | 5 | % | |||||||||||||||
Available-for-sale assets | 27,330 | 28,277 | 23,410 | -3 | % | 17 | % | |||||||||||||||
Net loans and advances | 7 | 509,250 | 483,264 | 454,316 | 5 | % | 12 | % | ||||||||||||||
Regulatory deposits | 2,205 | 2,106 | 1,679 | 5 | % | 31 | % | |||||||||||||||
Investment in associates | 4,323 | 4,123 | 3,719 | 5 | % | 16 | % | |||||||||||||||
Current tax assets | 64 | 20 | 55 | large | 16 | % | ||||||||||||||||
Deferred tax assets | 446 | 725 | 659 | -38 | % | -32 | % | |||||||||||||||
Goodwill and other intangible assets | 7,969 | 7,690 | 7,142 | 4 | % | 12 | % | |||||||||||||||
Investments backing policy liabilities | 33,197 | 32,083 | 31,199 | 3 | % | 6 | % | |||||||||||||||
Other assets | 4,803 | 4,352 | 4,821 | 10 | % | 0 | % | |||||||||||||||
Premises and equipment | 2,150 | 2,164 | 2,079 | -1 | % | 3 | % | |||||||||||||||
|
|
|
|
|
|
|
|
|
| |||||||||||||
Total assets | 737,815 | 702,995 | 672,630 | 5 | % | 10 | % | |||||||||||||||
|
|
|
|
|
|
|
|
|
| |||||||||||||
Liabilities | ||||||||||||||||||||||
Settlement balances owed by ANZ | 8,133 | 8,695 | 13,373 | -6 | % | -39 | % | |||||||||||||||
Collateral received | 3,880 | 3,921 | 2,877 | -1 | % | 35 | % | |||||||||||||||
Deposits and other borrowings | 10 | 498,318 | 466,915 | 451,105 | 7 | % | 10 | % | ||||||||||||||
Derivative financial instruments | 45,876 | 47,509 | 45,070 | -3 | % | 2 | % | |||||||||||||||
Current tax liabilities | 285 | 972 | 735 | -71 | % | -61 | % | |||||||||||||||
Deferred tax liabilities | 41 | 14 | 12 | large | large | |||||||||||||||||
Policy liabilities | 33,402 | 32,388 | 31,087 | 3 | % | 7 | % | |||||||||||||||
External unit holder liabilities (life insurance funds) | 3,334 | 3,511 | 3,730 | -5 | % | -11 | % | |||||||||||||||
Payables and other liabilities | 9,615 | 9,059 | 9,074 | 6 | % | 6 | % | |||||||||||||||
Provisions | 1,115 | 1,228 | 1,172 | -9 | % | -5 | % | |||||||||||||||
Bonds and notes | 73,552 | 70,376 | 60,226 | 5 | % | 22 | % | |||||||||||||||
Loan capital | 11 | 13,226 | 12,804 | 11,666 | 3 | % | 13 | % | ||||||||||||||
|
|
|
|
|
|
|
|
|
| |||||||||||||
Total liabilities | 690,777 | 657,392 | 630,127 | 5 | % | 10 | % | |||||||||||||||
|
|
|
|
|
|
|
|
|
| |||||||||||||
Net assets | 47,038 | 45,603 | 42,503 | 3 | % | 11 | % | |||||||||||||||
|
|
|
|
|
|
|
|
|
| |||||||||||||
Shareholders’ equity | ||||||||||||||||||||||
Ordinary share capital | 23,529 | 23,641 | 23,589 | 0 | % | 0 | % | |||||||||||||||
Preference share capital | 871 | 871 | 871 | 0 | % | 0 | % | |||||||||||||||
Reserves | 13 | (334 | ) | (907 | ) | (2,528 | ) | -63 | % | -87 | % | |||||||||||
Retained earnings | 13 | 22,905 | 21,936 | 20,518 | 4 | % | 12 | % | ||||||||||||||
|
|
|
|
|
|
|
|
|
| |||||||||||||
Share capital and reserves attributable to shareholders of the Company | 13 | 46,971 | 45,541 | 42,450 | 3 | % | 11 | % | ||||||||||||||
Non-controlling interests | 13 | 67 | 62 | 53 | 8 | % | 26 | % | ||||||||||||||
|
|
|
|
|
|
|
|
|
| |||||||||||||
Total shareholders’ equity | 13 | 47,038 | 45,603 | 42,503 | 3 | % | 11 | % | ||||||||||||||
|
|
|
|
|
|
|
|
|
| |||||||||||||
The notes appearing on pages 100 to 127 form an integral part of the Condensed Consolidated Financial Statements.
| 1. | Comparative amounts have changed. Refer to Note 21 for details. |
97
CONDENSED CONSOLIDATED CASH FLOW STATEMENT
Australia and New Zealand Banking Group Limited
| Half Year | ||||||||||||
| Mar 14 Inflows (Outflows) $M | Sep 131 Inflows (Outflows) $M | Mar 131 Inflows (Outflows) $M | ||||||||||
Cash flows from operating activities | ||||||||||||
Interest received | 14,309 | 14,450 | 14,302 | |||||||||
Interest paid | (7,389 | ) | (8,083 | ) | (8,250 | ) | ||||||
Dividends received | 19 | 92 | 22 | |||||||||
Other operating income received | 2,024 | 7,146 | 2,470 | |||||||||
Other operating expenses paid | (4,216 | ) | (3,598 | ) | (3,753 | ) | ||||||
Income taxes (paid)/refunds received | (1,867 | ) | (1,203 | ) | (1,291 | ) | ||||||
Net cash flows from funds management and insurance business | ||||||||||||
Premiums, other income and life investment deposits received | 3,552 | 3,360 | 2,733 | |||||||||
Investment income and policy deposits received/(paid) | 48 | 139 | 59 | |||||||||
Claims and policy liability payments | (2,642 | ) | (2,595 | ) | (2,388 | ) | ||||||
Commission expense paid | (230 | ) | (239 | ) | (207 | ) | ||||||
|
|
|
|
|
| |||||||
Cash flows from operating activities before changes in operating assets and liabilities | 3,608 | 9,469 | 3,697 | |||||||||
|
|
|
|
|
| |||||||
Changes in operating assets and liabilities arising from cash flow movements | ||||||||||||
(Increase)/decrease in operating assets | ||||||||||||
Collateral paid | 396 | 169 | 179 | |||||||||
Trading securities | (4,990 | ) | (1,624 | ) | 2,392 | |||||||
Loans and advances | (16,357 | ) | (13,088 | ) | (15,610 | ) | ||||||
Net cash flows from investments backing policy liabilities | ||||||||||||
Purchase of insurance assets | (2,474 | ) | (2,166 | ) | (1,339 | ) | ||||||
Proceeds from sale/maturity of insurance assets | 2,217 | 2,413 | 1,928 | |||||||||
Increase/(decrease) in operating liabilities | ||||||||||||
Deposits and other borrowings | 27,397 | (3,816 | ) | 31,357 | ||||||||
Settlement balances owed by ANZ | (624 | ) | (4,678 | ) | 7,957 | |||||||
Collateral received | (70 | ) | 1,045 | 346 | ||||||||
Payables and other liabilities | 347 | (2 | ) | (1,023 | ) | |||||||
|
|
|
|
|
| |||||||
Change in operating assets and liabilities arising from cash flow movements | 5,842 | (21,747 | ) | 26,187 | ||||||||
|
|
|
|
|
| |||||||
Net cash provided by/(used in) operating activities | 9,450 | (12,278 | ) | 29,884 | ||||||||
|
|
|
|
|
| |||||||
Cash flows from investing activities | ||||||||||||
Available-for-sale assets | ||||||||||||
Purchases | (6,713 | ) | (6,091 | ) | (10,229 | ) | ||||||
Proceeds from sale or maturity | 7,947 | 2,683 | 7,541 | |||||||||
Controlled entities and associates | ||||||||||||
Purchased (net of cash acquired) | — | (1 | ) | (1 | ) | |||||||
Proceeds from sale (net of cash disposed) | 9 | 56 | 25 | |||||||||
Premises and equipment | ||||||||||||
Purchases | (135 | ) | (207 | ) | (149 | ) | ||||||
Other assets | (856 | ) | (684 | ) | (550 | ) | ||||||
|
|
|
|
|
| |||||||
Net cash provided by/(used in) investing activities | 252 | (4,244 | ) | (3,363 | ) | |||||||
|
|
|
|
|
| |||||||
Cash flows from financing activities | ||||||||||||
Bonds and notes | ||||||||||||
Issue proceeds | 10,814 | 11,915 | 6,980 | |||||||||
Redemptions | (8,860 | ) | (9,090 | ) | (10,683 | ) | ||||||
Loan capital | ||||||||||||
Issue proceeds | 1,874 | 1,118 | 750 | |||||||||
Redemptions | (1,505 | ) | (500 | ) | (965 | ) | ||||||
Dividends paid | (1,970 | ) | (1,569 | ) | (1,657 | ) | ||||||
Share capital issues | 2 | 9 | 21 | |||||||||
Share buyback | (500 | ) | (425 | ) | — | |||||||
|
|
|
|
|
| |||||||
Net cash provided by/(used in) financing activities | (145 | ) | 1,458 | (5,554 | ) | |||||||
|
|
|
|
|
| |||||||
Net increase/(decrease) in cash and cash equivalents | 9,557 | (15,064 | ) | 20,967 | ||||||||
Cash and cash equivalents at beginning of period | 49,023 | 60,777 | 41,450 | |||||||||
Effects of exchange rate changes on cash and cash equivalents | (88 | ) | 3,310 | (1,640 | ) | |||||||
|
|
|
|
|
| |||||||
Cash and cash equivalents at end of period | 58,492 | 49,023 | 60,777 | |||||||||
|
|
|
|
|
| |||||||
| 1. | Comparative amounts have changed as a result of the changes referred to in Note 21. |
The notes appearing on pages 100 to 127 form an integral part of the Condensed Consolidated Financial Statements.
98
CONDENSED CONSOLIDATED STATEMENT OF CHANGES IN EQUITY
Australia and New Zealand Banking Group Limited
| Ordinary share capital $M | Preference shares $M | Reserves1 $M | Retained earnings $M | Shareholders’ equity attributable to Equity holders of the Bank $M | Non- controlling interests $M | Total Shareholders’ equity $M | ||||||||||||||||||||||
As at 1 October 2012 | 23,070 | 871 | (2,498 | ) | 19,728 | 41,171 | 49 | 41,220 | ||||||||||||||||||||
Restatement (refer Note 1) | — | — | — | (17 | ) | (17 | ) | — | (17 | ) | ||||||||||||||||||
|
|
|
|
|
|
|
|
|
|
|
|
|
| |||||||||||||||
As at 1 October 2012 (restated) | 23,070 | 871 | (2,498 | ) | 19,711 | 41,154 | 49 | 41,203 | ||||||||||||||||||||
|
|
|
|
|
|
|
|
|
|
|
|
|
| |||||||||||||||
Profit or loss | — | — | — | 2,937 | 2,937 | 5 | 2,942 | |||||||||||||||||||||
Other comprehensive income for the period | — | — | (29 | ) | (23 | ) | (52 | ) | — | (52 | ) | |||||||||||||||||
|
|
|
|
|
|
|
|
|
|
|
|
|
| |||||||||||||||
Total comprehensive income for the period | — | — | (29 | ) | 2,914 | 2,885 | 5 | 2,890 | ||||||||||||||||||||
Transactions with equity holders in their capacity as equity holders: | ||||||||||||||||||||||||||||
Dividends paid | — | — | — | (2,118 | ) | (2,118 | ) | — | (2,118 | ) | ||||||||||||||||||
Dividend income on treasury shares held within the Group’s life insurance statutory funds | — | — | — | 10 | 10 | — | 10 | |||||||||||||||||||||
Dividend reinvestment plan | 451 | — | — | — | 451 | — | 451 | |||||||||||||||||||||
Transactions with non-controlling interests | — | — | — | — | — | (1 | ) | (1 | ) | |||||||||||||||||||
Other equity movements: | ||||||||||||||||||||||||||||
Group share option scheme | 21 | — | — | — | 21 | — | 21 | |||||||||||||||||||||
Treasury shares Global Wealth adjustment | 27 | — | — | — | 27 | — | 27 | |||||||||||||||||||||
Group employee share acquisition Scheme | 20 | — | — | — | 20 | — | 20 | |||||||||||||||||||||
Transfer of options/rights lapsed | — | — | (1 | ) | 1 | — | — | — | ||||||||||||||||||||
|
|
|
|
|
|
|
|
|
|
|
|
|
| |||||||||||||||
As at 31 March 2013 | 23,589 | 871 | (2,528 | ) | 20,518 | 42,450 | 53 | 42,503 | ||||||||||||||||||||
|
|
|
|
|
|
|
|
|
|
|
|
|
| |||||||||||||||
Profit or loss | — | — | — | 3,329 | 3,329 | 5 | 3,334 | |||||||||||||||||||||
Other comprehensive income for the period | — | — | 1,629 | 48 | 1,677 | 5 | 1,682 | |||||||||||||||||||||
|
|
|
|
|
|
|
|
|
|
|
|
|
| |||||||||||||||
Total comprehensive income for the period | — | — | 1,629 | 3,377 | 5,006 | 10 | 5,016 | |||||||||||||||||||||
Transactions with equity holders in their capacity as equity holders: | ||||||||||||||||||||||||||||
Dividends paid | — | — | — | (1,970 | ) | (1,970 | ) | (1 | ) | (1,971 | ) | |||||||||||||||||
Dividend income on treasury shares held within the Group’s life insurance statutory funds | — | — | — | 10 | 10 | — | 10 | |||||||||||||||||||||
Dividend reinvestment plan | 392 | — | — | — | 392 | — | 392 | |||||||||||||||||||||
Transactions with non-controlling interests | — | — | (10 | ) | — | (10 | ) | — | (10 | ) | ||||||||||||||||||
Other equity movements: | ||||||||||||||||||||||||||||
Share based payments/(exercises) | — | — | 3 | — | 3 | — | 3 | |||||||||||||||||||||
Group share option scheme | 9 | — | — | — | 9 | — | 9 | |||||||||||||||||||||
Treasury shares Global Wealth adjustment | (20 | ) | — | — | — | (20 | ) | — | (20 | ) | ||||||||||||||||||
Group employee share acquisition scheme | 96 | — | — | — | 96 | — | 96 | |||||||||||||||||||||
Group share buyback | (425 | ) | — | — | — | (425 | ) | — | (425 | ) | ||||||||||||||||||
Transfer of options/rights lapsed | — | — | (1 | ) | 1 | — | — | — | ||||||||||||||||||||
|
|
|
|
|
|
|
|
|
|
|
|
|
| |||||||||||||||
As at 30 September 2013 | 23,641 | 871 | (907 | ) | 21,936 | 45,541 | 62 | 45,603 | ||||||||||||||||||||
|
|
|
|
|
|
|
|
|
|
|
|
|
| |||||||||||||||
Profit or loss | — | — | — | 3,381 | 3,381 | 6 | 3,387 | |||||||||||||||||||||
Other comprehensive income for the period | — | — | 576 | 26 | 602 | — | 602 | |||||||||||||||||||||
|
|
|
|
|
|
|
|
|
|
|
|
|
| |||||||||||||||
Total comprehensive income for the period | — | — | 576 | 3,407 | 3,983 | 6 | 3,989 | |||||||||||||||||||||
Transactions with equity holders in their capacity as equity holders: | ||||||||||||||||||||||||||||
Dividends paid | — | — | — | (2,458 | ) | (2,458 | ) | (1 | ) | (2,459 | ) | |||||||||||||||||
Dividend income on treasury shares held within the Group’s life insurance statutory funds | — | — | — | 12 | 12 | — | 12 | |||||||||||||||||||||
Dividend reinvestment plan | 476 | — | — | — | 476 | — | 476 | |||||||||||||||||||||
Transactions with non-controlling interests | — | — | — | — | — | — | ||||||||||||||||||||||
Other equity movements: | ||||||||||||||||||||||||||||
Share based payments/(exercises) | — | — | 5 | — | 5 | — | 5 | |||||||||||||||||||||
Group share option scheme | 2 | — | — | — | 2 | — | 2 | |||||||||||||||||||||
Treasury shares Global Wealth adjustment | (2 | ) | — | — | — | (2 | ) | — | (2 | ) | ||||||||||||||||||
Group employee share acquisition scheme | (88 | ) | — | — | — | (88 | ) | — | (88 | ) | ||||||||||||||||||
Group share buyback | (500 | ) | — | — | — | (500 | ) | — | (500 | ) | ||||||||||||||||||
Transfer of options/rights lapsed | — | — | (8 | ) | 8 | — | — | — | ||||||||||||||||||||
|
|
|
|
|
|
|
|
|
|
|
|
|
| |||||||||||||||
As at 31 March 2014 | 23,529 | 871 | (334 | ) | 22,905 | 46,971 | 67 | 47,038 | ||||||||||||||||||||
|
|
|
|
|
|
|
|
|
|
|
|
|
| |||||||||||||||
| 1. | Further information on reserves is disclosed in Note 13. |
The notes appearing on pages 100 to 127 form an integral part of the Condensed Consolidated Financial Statements.
99
NOTES TO CONDENSED CONSOLIDATED FINANCIAL STATEMENTS
| 1. | Basis of preparation |
These Condensed Consolidated Financial Statements:
| • | have been prepared in accordance with the recognition and measurement requirements of Australian Accounting Standards (“AASs”); |
| • | should be read in conjunction with ANZ’s Annual Financial Statements for the year ended 30 September 2013 and any public announcements made by the Parent Entity and its controlled entities (the Group) for the half year ended 31 March 2014 in accordance with the continuous disclosure obligations under the Corporations Act 2001 and the ASX Listing Rules; |
| • | are Condensed Consolidated Financial Statements as defined in the AASB 134 Interim Financial Reporting (“AASB 134”). This report does not include all notes of the type normally included in ANZ’s Annual Financial Statements; |
| • | are presented in Australian dollars unless otherwise stated; and |
| • | were approved by the Board of Directors on 30 April 2014. |
| i) | Statement of compliance |
These Condensed Consolidated Financial Statements have been prepared in accordance with the Corporations Act 2001 and AASB 134 which ensures compliance with IAS 34 Interim Financial Reporting.
| ii) | Accounting policies |
These Condensed Consolidated Financial Statements have been prepared on the basis of accounting policies and using methods of computation consistent with those applied in the 2013 Annual Financial Statements with the exception of changes in policies arising from the adoption of a number of new and revised AAS’s that are effective from 1 October 2013 as described below:
| • | AASB 10 Consolidated Financial Statements (“AASB 10”) |
This standard replaces AASB 127 Consolidated and Separate Financial Statements and Interpretation 112 Consolidation – Special Purpose Entities and establishes the principles for when the Group controls another entity and is required to consolidate the other entity in the Group’s Financial Statements. The standard provides a single definition of control based on whether the investor is exposed to, or has rights to variable returns from its involvement with an investee and has the ability to affect those returns through its power over the investee. Implementation of AASB 10 did not materially impact the Group.
| • | AASB 13 Fair Value Measurement (“AASB 13”) |
This standard provides a single source of guidance on fair value measurement for financial and non-financial assets and liabilities. Consequential amendments to AASB 134 require additional fair value disclosures for financial assets and liabilities for Interim Financial Reports which have been included in Note 14. Comparative information is not required in the first year of application. Initial application of the standard did not materially impact the Group.
| • | AASB 119 Employee Benefits (amended 2011) |
These amendments impact the accounting for and disclosure of employee benefits by employers. The amendment to this standard has resulted in a change to the measurement of interest costs from defined benefit obligations.
In accordance with transitional provisions the changes have been applied retrospectively, with the net impact of initial application recognised in retained earnings as at 1 October 2012 and shown in the statement of changes in equity. The comparative balances of payables and other liabilities and the associated deferred tax asset have been restated. Refer to Note 21 for further details.
| iii) | Basis of measurement |
The financial information has been prepared in accordance with the historical cost basis except that the following assets and liabilities are stated at their fair value:
| • | derivative financial instruments, including in the case of fair value hedging, the fair value adjustment on the underlying hedged exposure; |
| • | available-for-sale financial assets; |
| • | financial instruments held for trading; and |
| • | assets and liabilities designated at fair value through profit and loss. |
In accordance with AASB 1038 Life Insurance Contracts, life insurance liabilities are measured using the Margin on Services model.
In accordance with AASB 119 Employee Benefits, defined benefit obligations are measured using the Projected Unit Credit method.
| iv) | Use of estimates, assumptions and judgments |
The preparation of these Condensed Consolidated Financial Statements requires the use of management judgement, estimates and assumptions that affect reported amounts and the application of accounting policies. Discussion of the critical accounting treatments, which include complex or subjective decisions or assessments, are covered in Note 2 of the 2013 Annual Financial Statements. Such estimates and judgements are reviewed on an ongoing basis.
| v) | Rounding of amounts |
The amounts contained in these Condensed Consolidated Financial Statements have been rounded to the nearest million dollars, except where otherwise indicated, as permitted by Australian Securities and Investments Commission Class Order 98/100.
| vi) | Comparatives |
Certain amounts in the comparative information have been reclassified to conform with current period financial statement presentations. Refer to Note 21 for further details.
100
NOTES TO CONDENSED CONSOLIDATED FINANCIAL STATEMENTS
| 2. | Income |
| Mar 14 $M | Sep 13 $M | Mar 13 $M | Mar 14 v. Sep 13 | Mar 14 v. Mar 13 | ||||||||||||||||
Interest income | 14,430 | 14,301 | 14,326 | 1 | % | 1 | % | |||||||||||||
Interest expense | (7,652 | ) | (7,743 | ) | (8,126 | ) | -1 | % | -6 | % | ||||||||||
|
|
|
|
|
|
|
|
|
| |||||||||||
Net interest income | 6,778 | 6,558 | 6,200 | 3 | % | 9 | % | |||||||||||||
|
|
|
|
|
|
|
|
|
| |||||||||||
i) Fee and commission income | ||||||||||||||||||||
Lending fees1 | 396 | 373 | 371 | 6 | % | 7 | % | |||||||||||||
Non-lending fees and commissions | 1,069 | 1,042 | 1,043 | 3 | % | 2 | % | |||||||||||||
|
|
|
|
|
|
|
|
|
| |||||||||||
Total fee and commission income | 1,465 | 1,415 | 1,414 | 4 | % | 4 | % | |||||||||||||
Fee and commission expense | (210 | ) | (187 | ) | (183 | ) | 12 | % | 15 | % | ||||||||||
|
|
|
|
|
|
|
|
|
| |||||||||||
Net fee and commission income2 | 1,255 | 1,228 | 1,231 | 2 | % | 2 | % | |||||||||||||
|
|
|
|
|
|
|
|
|
| |||||||||||
ii) Net funds management and insurance income | ||||||||||||||||||||
Funds management income | 458 | 444 | 418 | 3 | % | 10 | % | |||||||||||||
Investment income | 1,232 | 1,832 | 2,303 | -33 | % | -47 | % | |||||||||||||
Insurance premium income | 534 | 829 | 519 | -36 | % | 3 | % | |||||||||||||
Commission income/(expense) | (230 | ) | (239 | ) | (207 | ) | -4 | % | 11 | % | ||||||||||
Claims | (345 | ) | (364 | ) | (345 | ) | -5 | % | 0 | % | ||||||||||
Changes in policy liabilities3 | (998 | ) | (1,734 | ) | (1,935 | ) | -42 | % | -48 | % | ||||||||||
Elimination of treasury share (gain)/loss | (40 | ) | (33 | ) | (57 | ) | 21 | % | -30 | % | ||||||||||
|
|
|
|
|
|
|
|
|
| |||||||||||
Total net funds management and insurance income | 611 | 735 | 696 | -17 | % | -12 | % | |||||||||||||
|
|
|
|
|
|
|
|
|
| |||||||||||
iii) Share of associates’ profit | 247 | 271 | 211 | -9 | % | 17 | % | |||||||||||||
|
|
|
|
|
|
|
|
|
| |||||||||||
iv) Other income | ||||||||||||||||||||
Net foreign exchange earnings | 593 | 377 | 467 | 57 | % | 27 | % | |||||||||||||
Net gains from trading securities and derivatives | 15 | 33 | 267 | -55 | % | -94 | % | |||||||||||||
Credit risk on credit intermediation trades | 9 | 15 | 48 | -40 | % | -81 | % | |||||||||||||
Movement on financial instruments measured at fair value through profit & loss4 | (140 | ) | 236 | (241 | ) | large | -42 | % | ||||||||||||
Brokerage income | 28 | 28 | 25 | 0 | % | 12 | % | |||||||||||||
Write-down of investment in SSI | — | (26 | ) | — | -100 | % | n/a | |||||||||||||
Dilution gain on investment in Bank of Tianjin | 12 | — | — | n/a | n/a | |||||||||||||||
Insurance settlement | 26 | — | — | n/a | n/a | |||||||||||||||
Other | 84 | 68 | 32 | 24 | % | Large | ||||||||||||||
|
|
|
|
|
|
|
|
|
| |||||||||||
Total other income | 627 | 731 | 598 | -14 | % | 5 | % | |||||||||||||
|
|
|
|
|
|
|
|
|
| |||||||||||
Total other operating income5 | 2,740 | 2,965 | 2,736 | -8 | % | 0 | % | |||||||||||||
|
|
|
|
|
|
|
|
|
| |||||||||||
Total income | 17,170 | 17,266 | 17,062 | -1 | % | 1 | % | |||||||||||||
|
|
|
|
|
|
|
|
|
| |||||||||||
| 1. | Lending fees exclude fees treated as part of the effective yield calculation in interest income. |
| 2. | Includes interchange fees paid. |
| 3. | Includes policyholder tax gross up, which represents contribution tax (recovered at 15% on the super contributions made by members) debited to the policyholder account once a year in July when the statement is issued to the members at the end of the 30 June financial year. |
| 4. | Includes fair value movements (excluding realised and accrued interest) on derivatives not designated as accounting hedges entered into to manage interest rate and foreign exchange risk on funding instruments, ineffective portions of cashflow hedges, and fair value movements in financial assets and liabilities designated at fair value through profit and loss. |
| 5. | Total income includes external dividend income of $0.2 million (Sep 13 half: $1.8 million; Mar 13 half: $2.5 million). |
101
NOTES TO CONDENSED CONSOLIDATED FINANCIAL STATEMENTS
| 3. | Operating expenses |
| Half Year | Movement | |||||||||||||||||||
| Mar 14 $M | Sep 13 $M | Mar 13 $M | Mar 14 v. Sep 13 | Mar 14 v. Mar 13 | ||||||||||||||||
Personnel | ||||||||||||||||||||
Employee entitlements and taxes | 131 | 149 | 115 | -12 | % | 14 | % | |||||||||||||
Salaries and wages | 1,627 | 1,556 | 1,547 | 5 | % | 5 | % | |||||||||||||
Superannuation costs - defined benefit plans | 4 | 9 | 6 | -56 | % | -33 | % | |||||||||||||
Superannuation costs - defined contribution plans | 148 | 140 | 143 | 6 | % | 3 | % | |||||||||||||
Equity-settled share-based payments | 110 | 99 | 101 | 11 | % | 9 | % | |||||||||||||
Temporary staff | 82 | 84 | 64 | -2 | % | 28 | % | |||||||||||||
Other | 391 | 380 | 371 | 3 | % | 5 | % | |||||||||||||
|
|
|
|
|
|
|
|
|
| |||||||||||
Total personnel expenses | 2,493 | 2,417 | 2,347 | 3 | % | 6 | % | |||||||||||||
|
|
|
|
|
|
|
|
|
| |||||||||||
Premises | ||||||||||||||||||||
Depreciation and amortisation | 50 | 41 | 47 | 22 | % | 6 | % | |||||||||||||
Rent | 226 | 227 | 208 | 0 | % | 9 | % | |||||||||||||
Utilities and other outgoings | 89 | 89 | 81 | 0 | % | 10 | % | |||||||||||||
Other | 26 | 20 | 20 | 30 | % | 30 | % | |||||||||||||
|
|
|
|
|
|
|
|
|
| |||||||||||
Total premises expenses | 391 | 377 | 356 | 4 | % | 10 | % | |||||||||||||
|
|
|
|
|
|
|
|
|
| |||||||||||
Computer | ||||||||||||||||||||
Computer contractors | 124 | 72 | 109 | 72 | % | 14 | % | |||||||||||||
Data communications | 61 | 60 | 55 | 2 | % | 11 | % | |||||||||||||
Depreciation and amortisation | 265 | 258 | 238 | 3 | % | 11 | % | |||||||||||||
Rentals and repairs | 69 | 71 | 71 | -3 | % | -3 | % | |||||||||||||
Software purchased | 105 | 155 | 120 | -32 | % | -13 | % | |||||||||||||
Software impairment | 1 | — | 8 | n/a | -88 | % | ||||||||||||||
Other | 15 | 9 | 17 | 67 | % | -12 | % | |||||||||||||
|
|
|
|
|
|
|
|
|
| |||||||||||
Total computer expenses | 640 | 625 | 618 | 2 | % | 4 | % | |||||||||||||
|
|
|
|
|
|
|
|
|
| |||||||||||
Other | ||||||||||||||||||||
Advertising and public relations | 125 | 129 | 112 | -3 | % | 12 | % | |||||||||||||
Amortisation and impairment of intangible assets | 45 | 50 | 50 | -10 | % | -10 | % | |||||||||||||
Audit and other fees | 11 | 8 | 10 | 38 | % | 10 | % | |||||||||||||
Depreciation of furniture and equipment | 50 | 48 | 49 | 4 | % | 2 | % | |||||||||||||
Freight and cartage | 34 | 33 | 32 | 3 | % | 6 | % | |||||||||||||
Loss on sale and write-off of equipment | 2 | 8 | 7 | -75 | % | -71 | % | |||||||||||||
Non-lending losses | 27 | 26 | 28 | 4 | % | -4 | % | |||||||||||||
Postage and stationery | 65 | 67 | 61 | -3 | % | 7 | % | |||||||||||||
Professional fees | 106 | 150 | 118 | -29 | % | -10 | % | |||||||||||||
Telephone | 36 | 36 | 34 | 0 | % | 6 | % | |||||||||||||
Travel | 93 | 102 | 85 | -9 | % | 9 | % | |||||||||||||
Other | 133 | 109 | 80 | 22 | % | 66 | % | |||||||||||||
|
|
|
|
|
|
|
|
|
| |||||||||||
Total other expenses | 727 | 766 | 666 | -5 | % | 9 | % | |||||||||||||
|
|
|
|
|
|
|
|
|
| |||||||||||
Restructuring | ||||||||||||||||||||
New Zealand simplification programme | — | 4 | 14 | -100 | % | -100 | % | |||||||||||||
Other | 35 | 24 | 43 | 46 | % | -19 | % | |||||||||||||
|
|
|
|
|
|
|
|
|
| |||||||||||
Total restructuring expenses | 35 | 28 | 57 | 25 | % | -39 | % | |||||||||||||
|
|
|
|
|
|
|
|
|
| |||||||||||
Operating expenses | 4,286 | 4,213 | 4,044 | 2 | % | 6 | % | |||||||||||||
|
|
|
|
|
|
|
|
|
| |||||||||||
102
NOTES TO CONDENSED CONSOLIDATED FINANCIAL STATEMENTS
| 4. | Income tax expense |
| Reconciliation of the prima facie income tax expense on pre-tax profit with the income tax expense charged in the Income Statement | Half Year | Movement | ||||||||||||||||||
| Mar 14 $M | Sep 13 $M | Mar 13 $M | Mar 14 v. Sep 13 | Mar 14 v. Mar 13 | ||||||||||||||||
Profit before income tax | 4,705 | 4,710 | 4,304 | 0 | % | 9 | % | |||||||||||||
Prima facie income tax expense at 30% | 1,412 | 1,413 | 1,291 | 0 | % | 9 | % | |||||||||||||
Tax effect of permanent differences: | ||||||||||||||||||||
Overseas tax rate differential | (59 | ) | (25 | ) | (16 | ) | large | large | ||||||||||||
Rebateable and non-assessable dividends | (1 | ) | (1 | ) | (3 | ) | 0 | % | -67 | % | ||||||||||
Profit from associates | (74 | ) | (81 | ) | (63 | ) | -9 | % | 17 | % | ||||||||||
Write-down of investment in SSI | — | 8 | — | -100 | % | n/a | ||||||||||||||
Offshore Banking Unit | (1 | ) | (2 | ) | (4 | ) | -50 | % | -75 | % | ||||||||||
Global Wealth - Policyholder income and contributions tax | 21 | 130 | 131 | -84 | % | -84 | % | |||||||||||||
Global Wealth - Tax consolidation adjustment | — | (50 | ) | — | -100 | % | n/a | |||||||||||||
Tax provisions no longer required | (25 | ) | — | (4 | ) | n/a | large | |||||||||||||
Interest on Convertible Instruments | 32 | 29 | 29 | 10 | % | 10 | % | |||||||||||||
Other | 13 | (48 | ) | 2 | large | large | ||||||||||||||
|
|
|
|
|
|
|
|
|
| |||||||||||
| 1,318 | 1,373 | 1,363 | -4 | % | -3 | % | ||||||||||||||
Income tax under/(over) provided in previous years | — | 3 | (1 | ) | -100 | % | -100 | % | ||||||||||||
|
|
|
|
|
|
|
|
|
| |||||||||||
Total income tax expense charged in the income statement | 1,318 | 1,376 | 1,362 | -4 | % | -3 | % | |||||||||||||
|
|
|
|
|
|
|
|
|
| |||||||||||
Australia | 879 | 1,013 | 1,054 | -13 | % | -17 | % | |||||||||||||
Overseas | 439 | 363 | 308 | 21 | % | 43 | % | |||||||||||||
|
|
|
|
|
|
|
|
|
| |||||||||||
| 1,318 | 1,376 | 1,362 | -4 | % | -3 | % | ||||||||||||||
|
|
|
|
|
|
|
|
|
| |||||||||||
Effective Tax Rate - Group | 28.0 | % | 29.2 | % | 31.6 | % | ||||||||||||||
|
|
|
|
|
|
|
|
|
| |||||||||||
103
NOTES TO CONDENSED CONSOLIDATED FINANCIAL STATEMENTS
| 5. | Dividends |
| Half Year | Movement | |||||||||||||||||||
| Dividend per ordinary share (cents) | Mar 14 | Sep 13 | Mar 13 | Mar 14 v. Sep 13 | Mar 14 v. Mar 13 | |||||||||||||||
Interim (fully franked) | 83 | n/a | 73 | n/a | 14 | % | ||||||||||||||
Final (fully franked) | n/a | 91 | n/a | n/a | n/a | |||||||||||||||
| Ordinary share dividend1 | $M | $M | $M | % | % | |||||||||||||||
Interim dividend | — | 2,003 | — | n/a | n/a | |||||||||||||||
Final dividend | 2,497 | — | 2,150 | n/a | 16 | % | ||||||||||||||
Bonus option plan adjustment | (42 | ) | (36 | ) | (35 | ) | 17 | % | 20 | % | ||||||||||
|
|
|
|
|
|
|
|
|
| |||||||||||
Total2 | 2,455 | 1,967 | 2,115 | 25 | % | 16 | % | |||||||||||||
|
|
|
|
|
|
|
|
|
| |||||||||||
Ordinary share dividend payout ratio (%)3 | 67.4 | % | 75.1 | % | 68.3 | % | ||||||||||||||
|
|
|
|
|
|
|
|
|
| |||||||||||
| 1. | Dividends paid to ordinary equity holders of the Company. Excludes dividends payable by subsidiaries of the Group to non-controlling equity holders of approximately $1 million (Sep 13 half: $1 million; Mar 13 half: nil). |
| 2. | Dividends payable are not accrued and are recorded when paid. |
| 3. | Dividend payout ratio is calculated using proposed 2014 interim dividend of $2,278 million (not shown in the above table). The proposed 2014 interim dividend of $2,278 million is based on the forecast number of ordinary shares on issue at the dividend record date. Dividend payout ratios for the September 2013 half year and March 2013 half year are calculated using actual dividend paid of $2,497 million and $2,003 million respectively. Dividend payout ratio is calculated by adjusting profit attributable to shareholders of the company by the amount of preference share dividends paid. |
Ordinary Shares
The Directors propose that an interim dividend of 83 cents be paid on each eligible fully paid ANZ ordinary share on 1 July 2014. The proposed 2014 interim dividend will be fully franked for Australian tax purposes and New Zealand imputation credits of NZD 10 cents per ordinary share will also be attached.
ANZ has a Dividend Reinvestment Plan (DRP) and a Bonus Option Plan (BOP) that will operate in respect of the proposed 2014 interim dividend. For the 2014 interim dividend, ANZ intends to provide shares under the DRP and BOP through the issue of new shares. The “Acquisition Price” to be used in determining the number of shares to be provided under the DRP and BOP will be calculated by reference to the arithmetic average of the daily volume weighted average sale price of all fully paid ANZ ordinary shares sold in the ordinary course of trading on the ASX during the ten trading days commencing on 16 May 2014, and then rounded to the nearest whole cent. Shares provided under the DRP and BOP will rank equally in all respects with existing fully paid ANZ ordinary shares. Election notices from shareholders wanting to commence, cease or vary their participation in the DRP or BOP for the 2014 interim dividend must be received by ANZ’s Share Registrar by 5.00pm (Australian Eastern Standard Time) on 14 May 2014.
Subject to receiving effective contrary instructions from the shareholder, dividends payable to shareholders with a registered address in the United Kingdom (including the Channel Islands and the Isle of Man) or New Zealand will be converted to Pounds Sterling and New Zealand Dollars respectively at an exchange rate calculated on 16 May 2014.
Preference Shares
| Half Year | Movement | |||||||||||||||||||
| Mar 14 $M | Sep 13 $M | Mar 13 $M | Mar 14 v. Sep 13 | Mar 14 v. Mar 13 | ||||||||||||||||
Preference share dividend | ||||||||||||||||||||
Euro Trust Securities | 3 | 3 | 3 | 0 | % | 0 | % | |||||||||||||
Dividend per preference share | ||||||||||||||||||||
Euro Trust Securities | € | 4.60 | € | 4.45 | € | 4.37 | 3 | % | 5 | % | ||||||||||
104
NOTES TO CONDENSED CONSOLIDATED FINANCIAL STATEMENTS
| 6. | Earnings per share |
| Half Year | Movement | |||||||||||||||||||
| Mar 14 | Sep 13 | Mar 13 | Mar 14 v. Sep 13 | Mar 14 v. Mar 13 | ||||||||||||||||
Number of fully paid ordinary shares on issue (M)1 | 2,744.1 | 2,743.7 | 2,743.7 | 0 | % | 0 | % | |||||||||||||
|
|
|
|
|
|
|
|
|
| |||||||||||
Basic | ||||||||||||||||||||
Profit attributable to shareholders of the Company ($M) | 3,381 | 3,329 | 2,937 | 2 | % | 15 | % | |||||||||||||
Less Preference share dividends ($M) | (3 | ) | (3 | ) | (3 | ) | 0 | % | 0 | % | ||||||||||
|
|
|
|
|
|
|
|
|
| |||||||||||
Profit less preference share dividends ($M) | 3,378 | 3,326 | 2,934 | 2 | % | 15 | % | |||||||||||||
Weighted average number of ordinary shares (M)2 | 2,715.2 | 2,714.8 | 2,704.1 | 0 | % | 0 | % | |||||||||||||
Basic earnings per share (cents) | 124.4 | 122.5 | 108.5 | 2 | % | 15 | % | |||||||||||||
|
|
|
|
|
|
|
|
|
| |||||||||||
Diluted | ||||||||||||||||||||
Profit less preference share dividends ($M) | 3,378 | 3,326 | 2,934 | 2 | % | 15 | % | |||||||||||||
Interest on US Trust Securities ($M)3 | 7 | 17 | 14 | -59 | % | -50 | % | |||||||||||||
Interest on ANZ Convertible Preference Shares ($M)4 | 85 | 90 | 96 | -6 | % | -11 | % | |||||||||||||
Interest on ANZ Capital Notes ($M)5 | 24 | 7 | — | large | n/a | |||||||||||||||
|
|
|
|
|
|
|
|
|
| |||||||||||
Profit attributable to shareholders of the Company excluding interest on US Trust Securities, ANZ Convertible Preference Shares and ANZ Capital Notes ($M) | 3,494 | 3,440 | 3,044 | 2 | % | 15 | % | |||||||||||||
Weighted average number of shares on issue (M)2 | 2,715.2 | 2,714.8 | 2,704.1 | 0 | % | 0 | % | |||||||||||||
Weighted average number of convertible options (M) | 5.0 | 4.8 | 5.3 | 4 | % | -6 | % | |||||||||||||
Weighted average number of convertible US Trust Securities (M)3 | 16.8 | 27.5 | 26.5 | -39 | % | -37 | % | |||||||||||||
Weighted average number of ANZ Convertible Preference Shares (M)4 | 134.5 | 144.6 | 156.0 | -7 | % | -14 | % | |||||||||||||
Weighted average number of convertible ANZ Capital Notes (M)5 | 34.5 | 11.0 | — | large | n/a | |||||||||||||||
|
|
|
|
|
|
|
|
|
| |||||||||||
Adjusted weighted average number of shares - diluted (M)6 | 2,906.0 | 2,902.7 | 2,891.9 | 0 | % | 0 | % | |||||||||||||
|
|
|
|
|
|
|
|
|
| |||||||||||
Diluted earnings per share (cents) | 120.2 | 118.5 | 105.3 | 1 | % | 14 | % | |||||||||||||
|
|
|
|
|
|
|
|
|
| |||||||||||
| 1. | Number of fully paid ordinary shares on issue includes Treasury shares of 26.9 million at 31 March 2014 (Sep 13: 28.4 million; Mar 13: 28.7 million), comprised of 12.6 million Treasury shares held in Global Wealth (Sep 13: 12.6 million; Mar 13: 12.1 million) and 14.3 million in ANZEST Pty Ltd (Sep 13: 15.8 million; Mar 13: 16.6 million). |
| 2. | Weighted average number of ordinary shares excludes 12.8 million weighted average number of ordinary Treasury shares held in Global Wealth (Sep 13: 12.7 million; Mar 13: 12.5 million) and 15.0 million weighted average number of ordinary Treasury shares held in ANZEST Pty Ltd (Sep 13: 16.4 million; Mar 13: 16.6 million) for the group employee share acquisition scheme. |
| 3. | The US Trust Securities (issued on 27 November 2003) were due to convert to ANZ ordinary shares in 2053 at the market price of ANZ ordinary shares less 5% unless redeemed or bought back prior to that date. The US Trust Securities were redeemed by ANZ for cash at face value on 16 December 2013. |
| 4. | There are three “tranches” of convertible preference shares. The first are convertible preference shares (CPS1) issued on 30 September 2008 which convert to ordinary shares on 16 June 2014 at the market price of ANZ ordinary shares less 2.5% (subject to certain conversion conditions). On 31 March 2014, 6.3 million CPS1 were cancelled and re-invested in ANZ Capital Notes 2 (CN2) issued on that date. The second are convertible preference shares (CPS2) issued on 17 December 2009 and convert to ordinary shares on 15 December 2016 at the market price of ANZ ordinary shares less 1.0% (subject to certain conversion conditions). The third are convertible preference shares (CPS3) issued on 28 September 2011 that convert to ordinary shares on 1 September 2019 at the market price of ANZ ordinary shares less 1% (subject to certain conversion conditions). |
| 5. | There are two “tranches” of ANZ Capital Notes. The first are ANZ Capital Notes (CN1) issued on 7 August 2013 which convert to ANZ ordinary shares on 1 September 2023 at the market price of ANZ ordinary shares less 1.0% (subject to certain market conditions). The second are ANZ Capital Notes 2 (CN2) issued on 31 March 2014 which convert to ANZ ordinary shares on 24 March 2024 at the market price of ANZ ordinary shares less 1.0% (subject to certain market conditions). |
| 6. | The earnings per share calculation excludes the Euro Trust Securities (Preference Shares). |
105
NOTES TO CONDENSED CONSOLIDATED FINANCIAL STATEMENTS
| 7. | Net loans and advances |
| As at ($M) | Movement | |||||||||||||||||||
| Mar 14 | Sep 13 | Mar 13 | Mar 14 v. Sep 13 | Mar 14 v. Mar 13 | ||||||||||||||||
Australia | ||||||||||||||||||||
Overdrafts | 5,756 | 6,400 | 5,779 | -10 | % | 0 | % | |||||||||||||
Credit card outstandings | 8,852 | 8,847 | 8,761 | 0 | % | 1 | % | |||||||||||||
Commercial bills outstanding | 12,224 | 13,855 | 16,388 | -12 | % | -25 | % | |||||||||||||
Term loans - housing | 201,396 | 194,755 | 187,708 | 3 | % | 7 | % | |||||||||||||
Term loans - non-housing | 106,967 | 99,162 | 93,948 | 8 | % | 14 | % | |||||||||||||
Lease receivables | 1,563 | 1,597 | 1,560 | -2 | % | 0 | % | |||||||||||||
Hire purchase | 1,764 | 2,118 | 2,388 | -17 | % | -26 | % | |||||||||||||
Other | 490 | 79 | 704 | large | -30 | % | ||||||||||||||
|
|
|
|
|
|
|
|
|
| |||||||||||
| 339,012 | 326,813 | 317,236 | 4 | % | 7 | % | ||||||||||||||
|
|
|
|
|
|
|
|
|
| |||||||||||
Asia Pacific, Europe & America | ||||||||||||||||||||
Overdrafts | 1,456 | 1,239 | 1,077 | 18 | % | 35 | % | |||||||||||||
Credit card outstandings | 1,135 | 1,103 | 994 | 3 | % | 14 | % | |||||||||||||
Commercial bills outstanding | 2,431 | 2,681 | 1,539 | -9 | % | 58 | % | |||||||||||||
Term loans - housing | 6,063 | 5,737 | 4,494 | 6 | % | 35 | % | |||||||||||||
Term loans - non-housing | 65,115 | 58,927 | 52,385 | 11 | % | 24 | % | |||||||||||||
Lease receivables | 140 | 147 | 132 | -5 | % | 6 | % | |||||||||||||
Other | 121 | 303 | 334 | -60 | % | -64 | % | |||||||||||||
|
|
|
|
|
|
|
|
|
| |||||||||||
| 76,461 | 70,137 | 60,955 | 9 | % | 25 | % | ||||||||||||||
|
|
|
|
|
|
|
|
|
| |||||||||||
New Zealand | ||||||||||||||||||||
Overdrafts | 1,221 | 1,194 | 987 | 2 | % | 24 | % | |||||||||||||
Credit card outstandings | 1,430 | 1,297 | 1,135 | 10 | % | 26 | % | |||||||||||||
Term loans - housing | 57,254 | 52,785 | 46,080 | 8 | % | 24 | % | |||||||||||||
Term loans - non-housing | 36,110 | 33,838 | 30,422 | 7 | % | 19 | % | |||||||||||||
Lease receivables | 105 | 114 | 119 | -8 | % | -12 | % | |||||||||||||
Hire purchase | 720 | 642 | 535 | 12 | % | 35 | % | |||||||||||||
Other | 117 | 111 | 108 | 5 | % | 8 | % | |||||||||||||
|
|
|
|
|
|
|
|
|
| |||||||||||
| 96,957 | 89,981 | 79,386 | 8 | % | 22 | % | ||||||||||||||
|
|
|
|
|
|
|
|
|
| |||||||||||
Total gross loans and advances | 512,430 | 486,931 | 457,577 | 5 | % | 12 | % | |||||||||||||
|
|
|
|
|
|
|
|
|
| |||||||||||
Less: Provision for credit impairment (refer note 8) | (4,313 | ) | (4,354 | ) | (4,312 | ) | -1 | % | 0 | % | ||||||||||
Less: Unearned income1 | (1,052 | ) | (1,067 | ) | (1,087 | ) | -1 | % | -3 | % | ||||||||||
Add: Capitalised brokerage/mortgage origination fees2 | 1,000 | 942 | 869 | 6 | % | 15 | % | |||||||||||||
Add: Customers’ liabilities for acceptances | 1,185 | 812 | 1,269 | 46 | % | -7 | % | |||||||||||||
|
|
|
|
|
|
|
|
|
| |||||||||||
| (3,180 | ) | (3,667 | ) | (3,261 | ) | -13 | % | -2 | % | |||||||||||
|
|
|
|
|
|
|
|
|
| |||||||||||
Total net loans and advances | 509,250 | 483,264 | 454,316 | 5 | % | 12 | % | |||||||||||||
|
|
|
|
|
|
|
|
|
| |||||||||||
| 1. | Includes fees deferred and amortised using the effective interest method of $391 million (Sep 13: $381 million; Mar 13: $362 million). |
| 2. | Capitalised brokerage/mortgage origination fees are amortised over the term of the loan. |
106
NOTES TO CONDENSED CONSOLIDATED FINANCIAL STATEMENTS
| 8. | Provision for credit impairment |
| Half Year | Movement | |||||||||||||||||||
| Collective provision | Mar 14 $M | Sep 13 $M | Mar 13 $M | Mar 14 v. Sep 13 | Mar 14 v. Mar 13 | |||||||||||||||
Balance at start of period | 2,887 | 2,769 | 2,765 | 4 | % | 4 | % | |||||||||||||
Charge/(credit) to income statement | (74 | ) | 26 | 4 | large | large | ||||||||||||||
Adjustment for exchange rate fluctuations | 30 | 92 | — | -67 | % | n/a | ||||||||||||||
|
|
|
|
|
|
|
|
|
| |||||||||||
Total collective provision1 | 2,843 | 2,887 | 2,769 | -2 | % | 3 | % | |||||||||||||
|
|
|
|
|
|
|
|
|
| |||||||||||
Individual provision | ||||||||||||||||||||
Balance at start of period | 1,467 | 1,543 | 1,773 | -5 | % | -17 | % | |||||||||||||
New and increased provisions | 966 | 957 | 932 | 1 | % | 4 | % | |||||||||||||
Write-backs | (257 | ) | (247 | ) | (240 | ) | 4 | % | 7 | % | ||||||||||
Adjustment for exchange rate fluctuations | 12 | 54 | (3 | ) | -78 | % | large | |||||||||||||
Discount unwind | (30 | ) | (47 | ) | (55 | ) | -36 | % | -45 | % | ||||||||||
Bad debts written-off | (688 | ) | (793 | ) | (864 | ) | -13 | % | -20 | % | ||||||||||
|
|
|
|
|
|
|
|
|
| |||||||||||
Total individual provision | 1,470 | 1,467 | 1,543 | 0 | % | -5 | % | |||||||||||||
|
|
|
|
|
|
|
|
|
| |||||||||||
Total provision for credit impairment | 4,313 | 4,354 | 4,312 | -1 | % | 0 | % | |||||||||||||
|
|
|
|
|
|
|
|
|
| |||||||||||
| 1. | The collective provision includes amounts for off-balance sheet credit exposures: $597 million at Mar 14 (Sep 13: $595 million; Mar 13: $531 million). The impact on the income statement for the half year ended 31 March 2014 was an $8 million release (Sep 13 half: $35 million charge; Mar 13 half: $2 million charge). |
| Half Year | Movement | |||||||||||||||||||
| Provision movement analysis | Mar 14 $M | Sep 13 $M | Mar 13 $M | Mar 14 v. Sep 13 | Mar 14 v. Mar 13 | |||||||||||||||
New and increased provisions | ||||||||||||||||||||
Australia | 688 | 658 | 646 | 5 | % | 7 | % | |||||||||||||
Asia Pacific, Europe & America | 152 | 143 | 132 | 6 | % | 15 | % | |||||||||||||
New Zealand | 126 | 156 | 154 | -19 | % | -18 | % | |||||||||||||
|
|
|
|
|
|
|
|
|
| |||||||||||
| 966 | 957 | 932 | 1 | % | 4 | % | ||||||||||||||
Write-backs | (257 | ) | (247 | ) | (240 | ) | 4 | % | 7 | % | ||||||||||
|
|
|
|
|
|
|
|
|
| |||||||||||
| 709 | 710 | 692 | 0 | % | 2 | % | ||||||||||||||
Recoveries of amounts previously written-off | (108 | ) | (136 | ) | (111 | ) | -21 | % | -3 | % | ||||||||||
|
|
|
|
|
|
|
|
|
| |||||||||||
Individual credit impairment charge for loans and advances | 601 | 574 | 581 | 5 | % | 3 | % | |||||||||||||
Impairment on available-for-sale assets | — | — | 3 | n/a | -100 | % | ||||||||||||||
Collective credit impairment charge/(credit) to income statement | (74 | ) | 26 | 4 | large | large | ||||||||||||||
|
|
|
|
|
|
|
|
|
| |||||||||||
Credit impairment charge | 527 | 600 | 588 | -12 | % | -10 | % | |||||||||||||
|
|
|
|
|
|
|
|
|
| |||||||||||
| Half Year | Movement | |||||||||||||||||||
| Individual provision balance | Mar 14 $M | Sep 13 $M | Mar 13 $M | Mar 14 v. Sep 13 | Mar 14 v. Mar 13 | |||||||||||||||
Australia | 941 | 944 | 955 | 0 | % | -1 | % | |||||||||||||
Asia Pacific, Europe & America | 296 | 262 | 275 | 13 | % | 8 | % | |||||||||||||
New Zealand | 233 | 261 | 313 | -11 | % | -26 | % | |||||||||||||
|
|
|
|
|
|
|
|
|
| |||||||||||
Total individual provision | 1,470 | 1,467 | 1,543 | 0 | % | -5 | % | |||||||||||||
|
|
|
|
|
|
|
|
|
| |||||||||||
107
NOTES TO CONDENSED CONSOLIDATED FINANCIAL STATEMENTS
| 9. | Credit quality |
Financial Assets maximum exposure to credit risk
For financial assets recognised on the balance sheet, the maximum exposure to credit risk is the carrying amount. In certain circumstances, there may be differences between the carrying amounts reported on the balance sheet and the amounts reported in the table below. Principally, these differences arise in respect of financial assets that are subject to risks other than credit risk, such as equity investments which are primarily subject to market risk. For contingent exposures, the maximum exposure to credit risk is the maximum amount the Group would have to pay if the instrument is called upon. For undrawn facilities, the maximum exposure to credit risk is the full amount of the committed facilities.
The following table presents the maximum exposure to credit risk of on-balance sheet and off-balance sheet financial instruments before taking account of any collateral held or other credit enhancements.
As at March 2014 $M | Reported | Excluded1 | Maximum exposure to credit risk | |||||||||
Cash | 33,651 | 1,511 | 32,140 | |||||||||
Settlement balances owed to ANZ | 16,209 | — | 16,209 | |||||||||
Collateral Paid | 6,219 | — | 6,219 | |||||||||
Trading securities | 46,170 | — | 46,170 | |||||||||
Derivative financial instruments2 | 43,829 | — | 43,829 | |||||||||
Available-for-sale assets | 27,330 | 37 | 27,293 | |||||||||
Net loans and advances3 | 509,250 | — | 509,250 | |||||||||
Regulatory deposits | 2,205 | — | 2,205 | |||||||||
Investments relating to insurance business | 33,197 | 33,197 | — | |||||||||
Other financial assets4 | 8,076 | — | 8,076 | |||||||||
|
|
|
|
|
| |||||||
On-balance sheet sub total | 726,136 | 34,745 | 691,391 | |||||||||
|
|
|
|
|
| |||||||
Undrawn facilities | 177,386 | — | 177,386 | |||||||||
Contingent facilities | 39,268 | — | 39,268 | |||||||||
|
|
|
|
|
| |||||||
Off-balance sheet sub total | 216,654 | — | 216,654 | |||||||||
|
|
|
|
|
| |||||||
Total | 942,790 | 34,745 | 908,045 | |||||||||
|
|
|
|
|
| |||||||
As at September 2013 $M | ||||||||||||
Cash | 25,270 | 1,318 | 23,952 | |||||||||
Settlement balances owed to ANZ | 19,225 | — | 19,225 | |||||||||
Collateral Paid | 6,530 | — | 6,530 | |||||||||
Trading securities | 41,288 | — | 41,288 | |||||||||
Derivative financial instruments2 | 45,878 | — | 45,878 | |||||||||
Available-for-sale assets | 28,277 | 59 | 28,218 | |||||||||
Net loans and advances3 | 483,264 | — | 483,264 | |||||||||
Regulatory deposits | 2,106 | — | 2,106 | |||||||||
Investments relating to insurance business | 32,083 | 32,083 | — | |||||||||
Other financial assets4 | 7,038 | — | 7,038 | |||||||||
|
|
|
|
|
| |||||||
On-balance sheet sub total | 690,959 | 33,460 | 657,499 | |||||||||
|
|
|
|
|
| |||||||
Undrawn facilities | 170,670 | — | 170,670 | |||||||||
Contingent facilities | 36,532 | — | 36,532 | |||||||||
|
|
|
|
|
| |||||||
Off-balance sheet sub total | 207,202 | — | 207,202 | |||||||||
|
|
|
|
|
| |||||||
Total | 898,161 | 33,460 | 864,701 | |||||||||
|
|
|
|
|
| |||||||
| 1. | Includes bank notes and coins within cash, equity instruments within available-for-sale financial assets and investments relating to the insurance business where the credit risk is passed onto the policy holder. |
| 2. | Derivative financial instruments are net of credit valuation adjustments. |
| 3. | Includes individual and collective provisions for credit impairment held in respect of credit related commitments. |
| 4. | Mainly comprises trade dated assets and accrued interest. |
108
NOTES TO CONDENSED CONSOLIDATED FINANCIAL STATEMENTS
As at March 2013 $M | Reported | Excluded1 | Maximum exposure to credit risk | |||||||||
Cash | 39,779 | 1,629 | 38,150 | |||||||||
Settlement balances owed to ANZ | 15,804 | — | 15,804 | |||||||||
Collateral Paid | 6,699 | — | 6,699 | |||||||||
Trading securities | 39,569 | — | 39,569 | |||||||||
Derivative financial instruments2 | 41,700 | — | 41,700 | |||||||||
Available-for-sale assets | 23,410 | 65 | 23,345 | |||||||||
Net loans and advances3 | 454,316 | — | 454,316 | |||||||||
Regulatory deposits | 1,679 | — | 1,679 | |||||||||
Investments relating to insurance business | 31,199 | 31,087 | 112 | |||||||||
Other financial assets4 | 5,662 | — | 5,662 | |||||||||
|
|
|
|
|
| |||||||
On-balance sheet sub total | 659,817 | 32,781 | 627,036 | |||||||||
|
|
|
|
|
| |||||||
Undrawn facilities | 152,467 | — | 152,467 | |||||||||
Contingent facilities | 34,008 | — | 34,008 | |||||||||
|
|
|
|
|
| |||||||
Off-balance sheet sub total | 186,475 | — | 186,475 | |||||||||
|
|
|
|
|
| |||||||
Total | 846,292 | 32,781 | 813,511 | |||||||||
|
|
|
|
|
| |||||||
| 1. | Includes bank notes and coins within cash, equity instruments within available-for-sale financial assets and investments relating to the insurance business where the credit risk is passed onto the policy holder. |
| 2. | Derivative financial instruments are net of credit valuation adjustments. |
| 3. | Includes individual and collective provisions for credit impairment held in respect of credit related commitments. |
| 4. | Mainly comprises trade dated assets and accrued interest. |
109
NOTES TO CONDENSED CONSOLIDATED FINANCIAL STATEMENTS
| 9. | Credit quality, cont’d |
Distribution of financial assets by credit quality
As at March 2014 $M | Neither past due nor impaired | Past due but not impaired | Restructured | Net Impaired | Total | |||||||||||||||
Cash | 32,140 | — | — | — | 32,140 | |||||||||||||||
Settlement balances owed to ANZ | 16,209 | — | — | — | 16,209 | |||||||||||||||
Collateral Paid | 6,219 | — | — | — | 6,219 | |||||||||||||||
Trading securities | 46,170 | — | — | — | 46,170 | |||||||||||||||
Derivative financial instruments1 | 43,771 | — | — | 58 | 43,829 | |||||||||||||||
Available-for-sale assets | 27,293 | — | — | — | 27,293 | |||||||||||||||
Net loans and advances2 | 494,860 | 13,083 | 60 | 1,918 | 509,921 | |||||||||||||||
Regulatory deposits | 2,205 | — | — | — | 2,205 | |||||||||||||||
Investments backing policy liabilities | — | — | — | — | — | |||||||||||||||
Other financial assets3 | 8,076 | — | — | — | 8,076 | |||||||||||||||
Credit related commitments4 | 215,869 | — | — | 114 | 215,983 | |||||||||||||||
|
|
|
|
|
|
|
|
|
| |||||||||||
Total | 892,812 | 13,083 | 60 | 2,090 | 908,045 | |||||||||||||||
|
|
|
|
|
|
|
|
|
| |||||||||||
As at September 2013 $M | ||||||||||||||||||||
Cash | 23,952 | — | — | — | 23,952 | |||||||||||||||
Settlement balances owed to ANZ | 19,225 | — | — | — | 19,225 | |||||||||||||||
Collateral Paid | 6,530 | — | — | — | 6,530 | |||||||||||||||
Trading securities | 41,288 | — | — | — | 41,288 | |||||||||||||||
Derivative financial instruments1 | 45,786 | — | 25 | 67 | 45,878 | |||||||||||||||
Available-for-sale assets | 28,218 | — | — | — | 28,218 | |||||||||||||||
Net loans and advances2 | 469,496 | 11,763 | 316 | 2,311 | 483,886 | |||||||||||||||
Regulatory deposits | 2,106 | — | — | — | 2,106 | |||||||||||||||
Investments backing policy liabilities | — | — | — | — | — | |||||||||||||||
Other financial assets3 | 7,038 | — | — | — | 7,038 | |||||||||||||||
Credit related commitments4 | 206,502 | — | — | 78 | 206,580 | |||||||||||||||
|
|
|
|
|
|
|
|
|
| |||||||||||
Total | 850,141 | 11,763 | 341 | 2,456 | 864,701 | |||||||||||||||
|
|
|
|
|
|
|
|
|
| |||||||||||
As at March 2013 $M | ||||||||||||||||||||
Cash | 38,150 | — | — | — | 38,150 | |||||||||||||||
Settlement balances owed to ANZ | 15,804 | — | — | — | 15,804 | |||||||||||||||
Collateral Paid | 6,699 | — | — | — | 6,699 | |||||||||||||||
Trading securities | 39,569 | — | — | — | 39,569 | |||||||||||||||
Derivative financial instruments1 | 41,592 | — | 25 | 83 | 41,700 | |||||||||||||||
Available-for-sale assets | 23,345 | — | — | — | 23,345 | |||||||||||||||
Net loans and advances2 | 440,076 | 11,837 | 499 | 2,460 | 454,872 | |||||||||||||||
Regulatory deposits | 1,679 | — | — | — | 1,679 | |||||||||||||||
Investments backing policy liabilities | 112 | — | — | — | 112 | |||||||||||||||
Other financial assets3 | 5,662 | — | — | — | 5,662 | |||||||||||||||
Credit related commitments4 | 185,844 | — | — | 75 | 185,919 | |||||||||||||||
|
|
|
|
|
|
|
|
|
| |||||||||||
Total | 798,532 | 11,837 | 524 | 2,618 | 813,511 | |||||||||||||||
|
|
|
|
|
|
|
|
|
| |||||||||||
| 1. | Derivative assets, considered impaired, are net of credit valuation adjustments. |
| 2. | Individual and collective provisions for credit impairment held in respect of credit related commitments have been reallocated to credit related commitments in this table. |
| 3. | Mainly comprises trade dated assets and accrued interest. |
| 4. | Comprises undrawn commitments and customer contingent liabilities net of collective and individual provisions. |
110
NOTES TO CONDENSED CONSOLIDATED FINANCIAL STATEMENTS
| 9. | Credit quality, cont’d |
Credit quality of financial assets neither past due nor impaired
The credit quality of financial assets is managed by the Group using internal ratings based on their current probability of default. The Group’s masterscales are mapped to external rating agency scales, to enable wider comparisons.
As at March 2014 $M | Strong credit profile1 | Satisfactory risk2 | Sub-standard but not past due or impaired3 | Total | ||||||||||||
Cash | 31,929 | 211 | — | 32,140 | ||||||||||||
Settlement balances owed to ANZ | 15,345 | 732 | 132 | 16,209 | ||||||||||||
Collateral Paid | 6,217 | 2 | — | 6,219 | ||||||||||||
Trading securities | 46,170 | — | — | 46,170 | ||||||||||||
Derivative financial instruments | 42,841 | 851 | 79 | 43,771 | ||||||||||||
Available-for-sale assets | 25,980 | 1,297 | 16 | 27,293 | ||||||||||||
Net loans and advances | 377,153 | 101,346 | 16,361 | 494,860 | ||||||||||||
Regulatory deposits | 1,611 | 538 | 56 | 2,205 | ||||||||||||
Investments backing policy liabilities | — | — | — | — | ||||||||||||
Other financial assets4 | 7,724 | 304 | 48 | 8,076 | ||||||||||||
Credit related commitments5 | 183,807 | 29,851 | 2,211 | 215,869 | ||||||||||||
|
|
|
|
|
|
|
| |||||||||
| 738,777 | 135,132 | 18,903 | 892,812 | |||||||||||||
|
|
|
|
|
|
|
| |||||||||
As at September 2013 $M | ||||||||||||||||
Cash | 23,951 | 1 | — | 23,952 | ||||||||||||
Settlement balances owed to ANZ | 19,137 | 77 | 11 | 19,225 | ||||||||||||
Collateral Paid | 6,528 | 2 | — | 6,530 | ||||||||||||
Trading securities | 41,288 | — | — | 41,288 | ||||||||||||
Derivative financial instruments | 44,465 | 1,170 | 151 | 45,786 | ||||||||||||
Available-for-sale assets | 26,923 | 1,280 | 15 | 28,218 | ||||||||||||
Net loans and advances | 350,119 | 101,783 | 17,594 | 469,496 | ||||||||||||
Regulatory deposits | 1,132 | 445 | 529 | 2,106 | ||||||||||||
Other financial assets4 | 6,698 | 289 | 51 | 7,038 | ||||||||||||
Credit related commitments5 | 174,565 | 29,661 | 2,276 | 206,502 | ||||||||||||
|
|
|
|
|
|
|
| |||||||||
| 694,806 | 134,708 | 20,627 | 850,141 | |||||||||||||
|
|
|
|
|
|
|
| |||||||||
As at March 2013 $M | ||||||||||||||||
Cash | 38,054 | 95 | 1 | 38,150 | ||||||||||||
Settlement balances owed to ANZ | 15,536 | 267 | 1 | 15,804 | ||||||||||||
Collateral Paid | 6,698 | 1 | — | 6,699 | ||||||||||||
Trading securities | 39,328 | 240 | 1 | 39,569 | ||||||||||||
Derivative financial instruments | 40,582 | 802 | 208 | 41,592 | ||||||||||||
Available-for-sale assets | 21,819 | 1,520 | 6 | 23,345 | ||||||||||||
Net loans and advances | 325,853 | 96,751 | 17,472 | 440,076 | ||||||||||||
Regulatory deposits | 810 | 405 | 464 | 1,679 | ||||||||||||
Investments backing policy liabilities | 112 | — | — | 112 | ||||||||||||
Other financial assets4 | 5,276 | 327 | 59 | 5,662 | ||||||||||||
Credit related commitments5 | 154,240 | 29,379 | 2,225 | 185,844 | ||||||||||||
|
|
|
|
|
|
|
| |||||||||
| 648,308 | 129,787 | 20,437 | 798,532 | |||||||||||||
|
|
|
|
|
|
|
| |||||||||
| 1. | Customers that have demonstrated superior stability in their operating and financial performance over the long-term, and whose debt servicing capacity is not significantly vulnerable to foreseeable events. This rating broadly corresponds to ratings “Aaa” to “Baa3” and “AAA” to “BBB-” of Moody’s and Standard & Poor’s respectively. |
| 2. | Customers that have consistently demonstrated sound operational and financial stability over the medium to long term, even though some may be susceptible to cyclical trends or variability in earnings. This rating broadly corresponds to ratings “Ba2” to “Ba3” and “BB” to “BB-” of Moody’s and Standard & Poor’s respectively. |
| 3. | Customers that have demonstrated some operational and financial instability, with variability and uncertainty in profitability and liquidity projected to continue over the short and possibly medium term. This rating broadly corresponds to ratings “B1” to “Caa” and “B+” to “CCC” of Moody’s and Standard & Poor’s respectively. |
| 4. | Mainly comprises trade dated assets and accrued interest. |
| 5. | Comprises undrawn commitments and customer contingent liabilities net of collective provisions. |
111
NOTES TO CONDENSED CONSOLIDATED FINANCIAL STATEMENTS
| 9. | Credit quality, cont’d |
Ageing analysis of financial assets that are past due but not impaired
Ageing analysis of past due loans is used by the Group to measure and manage emerging credit risks. Financial assets that are past due but not impaired include those which are assessed, approved and managed on a portfolio basis within a centralised environment (for example credit cards and personal loans), that can be held on a productive basis until they are 180 days past due, as well as those which are managed on an individual basis.
A large portion of retail credit exposures, such as residential mortgages, are generally well secured. That is, the value of associated security is sufficient to cover amounts outstanding.
March 2014 Half Year $M | 1-5 days | 6-29 days | 30-59 days | 60-89 days | > 90 days | Total | ||||||||||||||||||
Net loans and advances | 3,345 | 4,660 | 2,037 | 980 | 2,061 | 13,083 | ||||||||||||||||||
|
|
|
|
|
|
|
|
|
|
|
| |||||||||||||
Total | 3,345 | 4,660 | 2,037 | 980 | 2,061 | 13,083 | ||||||||||||||||||
|
|
|
|
|
|
|
|
|
|
|
| |||||||||||||
September 2013 Half Year $M | 1-5 days | 6-29 days | 30-59 days | 60-89 days | > 90 days | Total | ||||||||||||||||||
Net loans and advances | 3,096 | 4,416 | 1,506 | 927 | 1,818 | 11,763 | ||||||||||||||||||
|
|
|
|
|
|
|
|
|
|
|
| |||||||||||||
Total | 3,096 | 4,416 | 1,506 | 927 | 1,818 | 11,763 | ||||||||||||||||||
|
|
|
|
|
|
|
|
|
|
|
| |||||||||||||
March 2013 Half Year $M | 1-5 days | 6-29 days | 30-59 days | 60-89 days | > 90 days | Total | ||||||||||||||||||
Net loans and advances | 2,088 | 5,294 | 1,870 | 889 | 1,696 | 11,837 | ||||||||||||||||||
|
|
|
|
|
|
|
|
|
|
|
| |||||||||||||
Total | 2,088 | 5,294 | 1,870 | 889 | 1,696 | 11,837 | ||||||||||||||||||
|
|
|
|
|
|
|
|
|
|
|
| |||||||||||||
Financial assets that are individually impaired
ANZ regularly reviews its portfolio and monitors adherence to contractual terms. When doubt arises as to the collectability of a credit facility, the financial instrument (or ‘the facility’) is classified and reported as individually impaired and an individual provision is allocated against it.
As described in the summary of significant accounting policies in the 2013 Annual Financial Statements, provisions are created for financial instruments that are reported on the balance sheet at amortised cost. For instruments reported at fair value, impairment provisions are treated as part of overall change in fair value and directly reduce the reported carrying amounts.
| Impaired instruments | Individual provision balances | |||||||||||||||||||||||
| As at ($M) | As at ($M) | |||||||||||||||||||||||
| Mar 14 | Sep 13 | Mar 13 | Mar 14 | Sep 13 | Mar 13 | |||||||||||||||||||
| $M | $M | $M | $M | $M | $M | |||||||||||||||||||
Derivative financial instruments1 | 58 | 67 | 83 | — | — | — | ||||||||||||||||||
Net loans and advances | 3,314 | 3,751 | 3,978 | 1,396 | 1,440 | 1,518 | ||||||||||||||||||
Credit related commitments2 | 188 | 105 | 100 | 74 | 27 | 25 | ||||||||||||||||||
|
|
|
|
|
|
|
|
|
|
|
| |||||||||||||
Total | 3,560 | 3,923 | 4,161 | 1,470 | 1,467 | 1,543 | ||||||||||||||||||
|
|
|
|
|
|
|
|
|
|
|
| |||||||||||||
| 1. | Derivative assets, considered impaired, are net of credit valuation adjustments. |
| 2. | Comprises undrawn commitments and customer contingent liabilities. |
| As at ($M) | Movement | |||||||||||||||||||
| Mar 14 | Sep 13 | Mar 13 | Mar 14 v. Sep 13 | Mar 14 v. Mar 13 | ||||||||||||||||
Less than $10 million | 2,204 | 2,235 | 2,246 | -1 | % | -2 | % | |||||||||||||
$10 million to $100 million | 897 | 1,491 | 1,659 | -40 | % | -46 | % | |||||||||||||
Greater than $100 million | 519 | 538 | 780 | -4 | % | -33 | % | |||||||||||||
|
|
|
|
|
|
|
|
|
| |||||||||||
Gross impaired assets1 | 3,620 | 4,264 | 4,685 | -15 | % | -23 | % | |||||||||||||
Less: Individually assessed provisions for impairment | (1,470 | ) | (1,467 | ) | (1,543 | ) | 0 | % | -5 | % | ||||||||||
|
|
|
|
|
|
|
|
|
| |||||||||||
Net impaired assets | 2,150 | 2,797 | 3,142 | -23 | % | -32 | % | |||||||||||||
|
|
|
|
|
|
|
|
|
| |||||||||||
| 1. | Includes $60 million restructured items (Sep 13: $341 million; Mar 13: $524 million). |
112
NOTES TO CONDENSED CONSOLIDATED FINANCIAL STATEMENTS
| 10. | Deposits and other borrowings |
| As at ($M) | Movement | |||||||||||||||||||
| Mar 14 | Sep 13 | Mar 13 | Mar 14 | Mar 14 | ||||||||||||||||
| Australia | $M | $M | $M | v. Sep 13 | v. Mar 13 | |||||||||||||||
Certificates of deposit | 51,217 | 51,448 | 52,231 | 0 | % | -2 | % | |||||||||||||
Term deposits | 77,900 | 80,297 | 78,515 | -3 | % | -1 | % | |||||||||||||
Other deposits bearing interest and other borrowings | 132,331 | 121,932 | 111,895 | 9 | % | 18 | % | |||||||||||||
Deposits not bearing interest | 6,157 | 5,701 | 5,373 | 8 | % | 15 | % | |||||||||||||
Deposits from banks | 13,617 | 6,767 | 8,024 | large | 70 | % | ||||||||||||||
Commercial paper | 8,812 | 8,015 | 11,008 | 10 | % | -20 | % | |||||||||||||
Borrowing corporations’ debt | 1 | 19 | 67 | -95 | % | -99 | % | |||||||||||||
|
|
|
|
|
|
|
|
|
| |||||||||||
| 290,035 | 274,179 | 267,113 | 6 | % | 9 | % | ||||||||||||||
|
|
|
|
|
|
|
|
|
| |||||||||||
Asia Pacific, Europe & America | ||||||||||||||||||||
Certificates of deposit | 4,986 | 4,725 | 8,030 | 6 | % | -38 | % | |||||||||||||
Term deposits | 79,586 | 76,259 | 74,601 | 4 | % | 7 | % | |||||||||||||
Other deposits bearing interest and other borrowings | 19,077 | 18,308 | 15,412 | 4 | % | 24 | % | |||||||||||||
Deposits not bearing interest | 3,990 | 3,827 | 3,012 | 4 | % | 32 | % | |||||||||||||
Deposits from banks | 22,449 | 20,314 | 22,214 | 11 | % | 1 | % | |||||||||||||
Commercial paper | 2,166 | — | — | n/a | n/a | |||||||||||||||
|
|
|
|
|
|
|
|
|
| |||||||||||
| 132,254 | 123,433 | 123,269 | 7 | % | 7 | % | ||||||||||||||
|
|
|
|
|
|
|
|
|
| |||||||||||
New Zealand | ||||||||||||||||||||
Certificates of deposit | 1,504 | 2,103 | 1,303 | -28 | % | 15 | % | |||||||||||||
Term deposits | 32,686 | 30,135 | 27,053 | 8 | % | 21 | % | |||||||||||||
Other deposits bearing interest and other borrowings | 29,841 | 26,419 | 22,735 | 13 | % | 31 | % | |||||||||||||
Deposits not bearing interest | 5,468 | 4,918 | 4,585 | 11 | % | 19 | % | |||||||||||||
Deposits from banks | 30 | 160 | 393 | -81 | % | -92 | % | |||||||||||||
Commercial paper | 5,063 | 4,240 | 3,478 | 19 | % | 46 | % | |||||||||||||
Borrowing corporations’ debt | 1,437 | 1,328 | 1,176 | 8 | % | 22 | % | |||||||||||||
|
|
|
|
|
|
|
|
|
| |||||||||||
| 76,029 | 69,303 | 60,723 | 10 | % | 25 | % | ||||||||||||||
|
|
|
|
|
|
|
|
|
| |||||||||||
Total deposits and other borrowings | 498,318 | 466,915 | 451,105 | 7 | % | 10 | % | |||||||||||||
|
|
|
|
|
|
|
|
|
| |||||||||||
113
NOTES TO CONDENSED CONSOLIDATED FINANCIAL STATEMENTS
| 11. | Loan capital |
APRA has granted ANZ transitional capital treatment for the ANZ Convertible Preference Shares (CPS) and all outstanding subordinated notes issued prior to 1 January 2013. Transition will apply up until the security’s first call date, except in the case of the outstanding USD and NZD Perpetual Subordinated Notes and ANZ CPS3 where the transitional treatment will apply up until the earlier of the end of the transitional period (January 2021) and the first call date when either a step up event (i.e. an increase in credit margin) or a conversion to ordinary shares is to occur.
| Half Year | Movement | |||||||||||||||||||
| Mar 14 | Sep 13 | Mar 13 | Mar 14 | Mar 14 | ||||||||||||||||
| $M | $M | $M | v. Sep 13 | v. Mar 13 | ||||||||||||||||
Tier 1 | ||||||||||||||||||||
US Trust Securities1 | — | 812 | 740 | -100 | % | -100 | % | |||||||||||||
Convertible Preference Shares (ANZ CPS) | ||||||||||||||||||||
ANZ CPS12 | 454 | 1,081 | 1,080 | -58 | % | -58 | % | |||||||||||||
ANZ CPS23 | 1,965 | 1,963 | 1,961 | 0 | % | 0 | % | |||||||||||||
ANZ CPS34 | 1,331 | 1,329 | 1,327 | 0 | % | 0 | % | |||||||||||||
ANZ Capital Notes 15 | 1,107 | 1,106 | — | 0 | % | n/a | ||||||||||||||
ANZ Capital Notes 26 | 1,593 | — | — | n/a | n/a | |||||||||||||||
Tier 2 | ||||||||||||||||||||
Perpetual subordinated notes | 1,108 | 1,065 | 957 | 4 | % | 16 | % | |||||||||||||
Subordinated notes | 5,668 | 5,448 | 5,601 | 4 | % | 1 | % | |||||||||||||
|
|
|
|
|
|
|
|
|
| |||||||||||
Total Loan Capital | 13,226 | 12,804 | 11,666 | 3 | % | 13 | % | |||||||||||||
|
|
|
|
|
|
|
|
|
| |||||||||||
| 1. | On 27 November 2003, ANZ issued USD 750 million Trust Securities each comprising an interest paying unsecured note and a preference share which were stapled together. ANZ redeemed the Trust Securities on 16 December 2013. The securities constituted Additional Tier 1 capital as defined by APRA for capital adequacy purposes. |
| 2. | On 30 September 2008, ANZ issued convertible preference shares (CPS1) which will convert into ANZ ordinary shares on 16 June 2014 at a 2.5% discount (subject to certain conditions being satisfied). $627 million CPS1 were reinvested in ANZ Capital Notes 2 (CN2) on 31 March 2014 leaving $454 million outstanding. The securities constitute Additional Tier 1 capital as defined by APRA for capital adequacy purposes. |
| 3. | On 17 December 2009, ANZ issued convertible preference shares (CPS2) which will convert into ANZ ordinary shares on 15 December 2016 at a 1% discount (subject to certain conditions being satisfied). The securities constitute Additional Tier 1 capital as defined by APRA for capital adequacy purposes. |
| 4. | On 28 September 2011, ANZ issued convertible preference shares (CPS3) which will convert into ANZ ordinary shares on 1 September 2019 at a 1% discount (subject to certain conditions being satisfied). If ANZ’s Common Equity Tier 1 capital ratio is equal to or less than 5.125% then the convertible preference shares will immediately convert into ANZ ordinary shares at a 1% discount subject to a maximum conversion number. Subject to certain conditions, on and from 1 September 2017 the convertible preference shares are redeemable or convertible into ANZ ordinary shares (on similar terms to the mandatory conversion) by ANZ. The securities constitute Additional Tier 1 capital as defined by APRA for capital adequacy purposes. |
| 5. | On 7 August 2013, ANZ issued convertible notes (ANZ Capital Notes or CN1) which will convert into ANZ ordinary shares on 1 September 2023 at a 1% discount (subject to certain conditions being satisfied). If ANZ’s Common Equity Tier 1 capital ratio is equal to or less than 5.125%, or ANZ receives a notice of non-viability from APRA, then the notes will immediately convert into ANZ ordinary shares at a 1% discount subject to a maximum conversion number. Subject to certain conditions, on and from 1 September 2021 the notes are redeemable or convertible into ANZ ordinary shares (on similar terms to the mandatory conversion) by ANZ. The securities constitute Additional Tier 1 capital as defined by APRA for capital adequacy purposes. |
| 6. | On 31 March 2014, ANZ issued convertible notes (ANZ Capital Notes 2 or CN2) which will convert into ANZ ordinary shares on 24 March 2024 at a 1% discount (subject to certain conditions being satisfied). If ANZ’s Common Equity Tier 1 capital ratio is equal to or less than 5.125%, or ANZ receives a notice of non-viability from APRA, then the notes will immediately convert into ANZ ordinary shares at a 1% discount subject to a maximum conversion number. Subject to certain conditions, on and from 24 March 2022 the notes are redeemable or convertible into ANZ ordinary shares (on similar terms to the mandatory conversion) by ANZ. The securities constitute Additional Tier 1 capital as defined by APRA for capital adequacy purposes. |
114
NOTES TO CONDENSED CONSOLIDATED FINANCIAL STATEMENTS
| 12. | Share capital |
Issued and quoted securities
| Number quoted | Issue price per share | Amount paid up per share | ||||||||||
Ordinary shares | ||||||||||||
As at 31 March 2014 | 2,744,118,670 | |||||||||||
Issued during the half year | 16,352,516 | |||||||||||
Bought back during half year1 | 15,889,156 | |||||||||||
Preference shares | ||||||||||||
As at 31 March 2014 | ||||||||||||
Euro Trust Securities2,3 | 500,000 | € | 1,000 | € | 1,000 | |||||||
| 1. | Following the issue of 16.2 million ordinary shares under the Dividend Reinvestment Plan and Bonus Option Plan for the 2013 final dividend, the Company repurchased $500 million of ordinary shares via an on-market share buy-back resulting in 15.9 million ordinary shares being cancelled. |
| 2. | On 13 December 2004, ANZ issued €500 million Trust Securities each comprising subordinated floating rate notes due 2053 stapled to a preference share. Subject to certain conditions, the securities are redeemable by the issuer on 16 December 2014. The securities constitute Additional Tier 1 capital as defined by APRA for capital adequacy purposes. |
| 3. | APRA has granted ANZ transitional capital treatment for the Euro Trust Securities (preference shares) until their first call date on 16 December 2014. |
| 13. | Shareholders’ equity |
| Half Year | Movement | |||||||||||||||||||
| Mar 14 | Sep 13 | Mar 13 | Mar 14 | Mar 14 | ||||||||||||||||
| $M | $M | $M | v. Sep 13 | v. Mar 13 | ||||||||||||||||
Share capital | ||||||||||||||||||||
Balance at start of period | 24,512 | 24,460 | 23,941 | 0 | % | 2 | % | |||||||||||||
Ordinary share capital | ||||||||||||||||||||
Dividend reinvestment plan | 476 | 392 | 451 | 21 | % | 6 | % | |||||||||||||
Group employee share acquisition scheme1 | (88 | ) | 96 | 20 | large | large | ||||||||||||||
Treasury shares in Global Wealth2 | (2 | ) | (20 | ) | 27 | -90 | % | large | ||||||||||||
Group share option scheme | 2 | 9 | 21 | -78 | % | -90 | % | |||||||||||||
Group share buyback3 | (500 | ) | (425 | ) | — | 18 | % | n/a | ||||||||||||
|
|
|
|
|
|
|
|
|
| |||||||||||
Total share capital | 24,400 | 24,512 | 24,460 | 0 | % | 0 | % | |||||||||||||
|
|
|
|
|
|
|
|
|
| |||||||||||
Foreign currency translation reserve | ||||||||||||||||||||
Balance at start of period | (1,125 | ) | (2,826 | ) | (2,831 | ) | -60 | % | -60 | % | ||||||||||
Transfer to the income statement | (11 | ) | — | — | n/a | n/a | ||||||||||||||
Currency translation adjustments net of hedges after tax | 570 | 1,701 | 5 | -66 | % | large | ||||||||||||||
|
|
|
|
|
|
|
|
|
| |||||||||||
Total foreign currency translation reserve | (566 | ) | (1,125 | ) | (2,826 | ) | -50 | % | -80 | % | ||||||||||
|
|
|
|
|
|
|
|
|
| |||||||||||
Share option reserve4 | ||||||||||||||||||||
Balance at start of period | 55 | 53 | 54 | 4 | % | 2 | % | |||||||||||||
Share based payments/(exercises) | 5 | 3 | — | 67 | % | n/a | ||||||||||||||
Transfer of options/rights lapsed to retained earnings | (8 | ) | (1 | ) | (1 | ) | large | large | ||||||||||||
|
|
|
|
|
|
|
|
|
| |||||||||||
Total share option reserve | 52 | 55 | 53 | -5 | % | -2 | % | |||||||||||||
|
|
|
|
|
|
|
|
|
| |||||||||||
| 1. | As at 31 March 2014, there were 14.3 million ANZEST Treasury shares outstanding (Sep 13: 15.8 million, Mar 13: 16.6 million). Shares in the Company which are purchased on-market by ANZEST Pty Ltd (trustee of ANZ employee share and option plans) or issued by the Company to ANZEST Pty Ltd are classified as Treasury shares (to the extent that they relate to unvested employee share-based awards). |
| 2. | As at 31 March 2014, there were 12.6 million Global Wealth Treasury shares outstanding (Sep 13: 12.6 million, Mar 13: 12.1 million). Global Wealth purchases and holds shares in the Company to back policy liabilities in the life insurance statutory funds. These shares are classified as Treasury shares. |
| 3. | Following the issue of 16.2 million ordinary shares under the Dividend Reinvestment Plan and Bonus Option Plan for the 2013 final dividend, the Company repurchased $500 million of ordinary shares via an on-market share buy-back resulting in 15.9 million ordinary shares being cancelled. |
| 4. | The share option reserve arises on the grant of share options/deferred share rights/performance rights (“options and rights”) to selected employees under the ANZ Share Option Plan. Amounts are transferred from the share option reserve to other equity accounts when the options and rights are exercised and to retained earnings when lapsed or forfeited after vesting. Forfeited options and rights due to termination prior to vesting are credited to the income statement. |
115
NOTES TO CONDENSED CONSOLIDATED FINANCIAL STATEMENTS
| 13. | Shareholders’ equity, cont’d |
| Half Year | Movement | |||||||||||||||||||
| Mar 14 | Sep 13 | Mar 13 | Mar 14 | Mar 14 | ||||||||||||||||
| $M | $M | $M | v. Sep 13 | v. Mar 13 | ||||||||||||||||
Available-for-sale revaluation reserve5 | ||||||||||||||||||||
Balance at start of period | 121 | 138 | 94 | -12 | % | 29 | % | |||||||||||||
Gain/(loss) recognised after tax | 62 | (21 | ) | 15 | large | large | ||||||||||||||
Transferred to income statement | (32 | ) | 4 | 29 | large | large | ||||||||||||||
|
|
|
|
|
|
|
|
|
| |||||||||||
Total available-for-sale revaluation reserve | 151 | 121 | 138 | 25 | % | 9 | % | |||||||||||||
|
|
|
|
|
|
|
|
|
| |||||||||||
Hedging reserve6 | ||||||||||||||||||||
Balance at start of period | 75 | 130 | 208 | -42 | % | -64 | % | |||||||||||||
Gain/(loss) recognised after tax | — | (52 | ) | (81 | ) | -100 | % | -100 | % | |||||||||||
Transferred to income statement | (13 | ) | (3 | ) | 3 | large | large | |||||||||||||
|
|
|
|
|
|
|
|
|
| |||||||||||
Total hedging reserve | 62 | 75 | 130 | -17 | % | -52 | % | |||||||||||||
|
|
|
|
|
|
|
|
|
| |||||||||||
Transactions with non-controlling interests reserve | ||||||||||||||||||||
Balance at start of period | (33 | ) | (23 | ) | (23 | ) | 43 | % | 43 | % | ||||||||||
Transactions with non-controlling interests | — | (10 | ) | — | -100 | % | n/a | |||||||||||||
|
|
|
|
|
|
|
|
|
| |||||||||||
Total transactions with non-controlling interests reserve | (33 | ) | (33 | ) | (23 | ) | 0 | % | 43 | % | ||||||||||
|
|
|
|
|
|
|
|
|
| |||||||||||
Total reserves | (334 | ) | (907 | ) | (2,528 | ) | -63 | % | -87 | % | ||||||||||
|
|
|
|
|
|
|
|
|
| |||||||||||
Retained earnings | ||||||||||||||||||||
Balance at start of period | 21,936 | 20,518 | 19,728 | 7 | % | 11 | % | |||||||||||||
Restatement (refer Note 1) | — | — | (17 | ) | n/a | -100 | % | |||||||||||||
|
|
|
|
|
|
|
|
|
| |||||||||||
Restated balance at beginning of period | 21,936 | 20,518 | 19,711 | 7 | % | 11 | % | |||||||||||||
Profit attributable to shareholders of the Company | 3,381 | 3,329 | 2,937 | 2 | % | 15 | % | |||||||||||||
Transfer of options/rights lapsed from share option reserve | 8 | 1 | 1 | large | large | |||||||||||||||
|
|
|
|
|
|
|
|
|
| |||||||||||
Total available for appropriation | 25,325 | 23,848 | 22,649 | 6 | % | 12 | % | |||||||||||||
Remeasurement gain/(loss) on defined benefit plans after tax | 26 | 48 | (23 | ) | -46 | % | large | |||||||||||||
Ordinary share dividends paid | (2,455 | ) | (1,967 | ) | (2,115 | ) | 25 | % | 16 | % | ||||||||||
Dividend income on Treasury shares held within the Group’s life insurance statutory funds | 12 | 10 | 10 | 20 | % | 20 | % | |||||||||||||
Preference share dividends paid | (3 | ) | (3 | ) | (3 | ) | 0 | % | 0 | % | ||||||||||
|
|
|
|
|
|
|
|
|
| |||||||||||
Retained earnings at end of period | 22,905 | 21,936 | 20,518 | 4 | % | 12 | % | |||||||||||||
|
|
|
|
|
|
|
|
|
| |||||||||||
Share capital and reserves attributable to shareholders of the Company | 46,971 | 45,541 | 42,450 | 3 | % | 11 | % | |||||||||||||
Non-controlling interests | 67 | 62 | 53 | 8 | % | 26 | % | |||||||||||||
|
|
|
|
|
|
|
|
|
| |||||||||||
Total shareholders’ equity | 47,038 | 45,603 | 42,503 | 3 | % | 11 | % | |||||||||||||
|
|
|
|
|
|
|
|
|
| |||||||||||
| 5. | The available-for-sale revaluation reserve arises on the revaluation of available-for-sale financial assets. Where a revalued financial asset is sold or impaired, that portion of the reserve which relates to that financial asset is recognised in the income statement. |
| 6. | The hedging reserve represents hedging gains and losses recognised on the effective portion of cash flow hedges. The cumulative deferred gain or loss on the hedge is recognised in the income statement when the hedged transaction impacts profit or loss. |
116
NOTES TO CONDENSED CONSOLIDATED FINANCIAL STATEMENTS
| 14. | Fair Value Measurement |
A significant number of financial instruments are carried on balance sheet at fair value. The following disclosures set out the Group’s fair value measurements, various levels within which the fair value measurements are categorised, valuation methodologies and, techniques and inputs used.
| (i) | Financial assets and financial liabilities not measured at fair value |
Below is a comparison of the carrying amounts as reported on the balance sheet and fair value of financial asset and liability categories other than those categories where the carrying amount is at fair value or considered a reasonable approximation of fair value:
| Carrying amount in the balance sheet | Fair Value | |||||||||||||||
At amortised Mar 14 | At fair value Mar 14 | Total Mar 14 | Mar 14 | |||||||||||||
| $M | $M | $M | $M | |||||||||||||
Financial assets | ||||||||||||||||
Net loans and advances1 | 509,012 | 238 | 509,250 | 509,536 | ||||||||||||
|
|
|
|
|
|
|
| |||||||||
| 509,012 | 238 | 509,250 | 509,536 | |||||||||||||
|
|
|
|
|
|
|
| |||||||||
Financial liabilities | ||||||||||||||||
Deposits and other borrowings | 493,255 | 5,063 | 498,318 | 498,423 | ||||||||||||
Bonds and notes1 | 70,871 | 2,681 | 73,552 | 74,506 | ||||||||||||
Loan capital1 | 13,226 | — | 13,226 | 13,424 | ||||||||||||
|
|
|
|
|
|
|
| |||||||||
| 577,352 | 7,744 | 585,096 | 586,353 | |||||||||||||
|
|
|
|
|
|
|
| |||||||||
| 1. | Fair value hedging is applied to certain financial instruments within these categories. The resulting fair value adjustments mean that the carrying value differs from the amortised cost. |
| (ii) | Financial assets and financial liabilities measured at fair value in the balance sheet |
| (a) | Valuation methodologies |
ANZ has an established control framework that ensures fair value is either determined or validated by a function independent of the party that undertakes the transaction. The control framework ensures that all models are calibrated periodically to test that outputs reflect prices from observable current market transactions in the same instrument or other available observable market data.
Where quoted market prices are used, prices are independently verified from other sources. For fair values determined using a valuation model, the control framework may include, as applicable, independent development or validation of valuation models, any inputs to those models, any adjustments required outside of the valuation model and, where possible, independent validation of model outputs. In this way, continued appropriateness of the valuations is ensured.
In instances where the Group holds offsetting risk positions, the Group uses the portfolio exemption in AASB 13 to measure the fair value of such groups of financial assets and financial liabilities on the basis of the price that would be received to sell a net long position (that is, an asset) for a particular risk exposure or to transfer a net short position (that is, a liability) for a particular risk exposure.
The Group categorises its fair value measurements on the basis of inputs used in measuring fair value using the fair value hierarchy below:
| • | Level 1 – Financial instruments that have been valued by reference to unadjusted quoted prices in active markets for identical financial instruments. This category includes financial instruments valued using quoted yields where available for specific debt securities. |
| • | Level 2 – Financial instruments that have been valued through valuation techniques incorporating inputs other than quoted prices within Level 1 that are observable for a similar financial asset or liability, either directly or indirectly. |
| • | Level 3 – Financial instruments that have been valued using valuation techniques which incorporate significant inputs that are not based on observable market data (unobservable inputs). |
| (b) | Valuation techniques and inputs used |
In the event that there is no quoted market price for the instrument, fair value is based on valuation techniques. The valuation models incorporate the impact of bid/ask spreads, counterparty credit spreads, funding costs and other factors that would influence the fair value determined by market participants.
The majority of valuation techniques employ only observable market data. However, for certain financial instruments the valuation technique may employ some data (valuation inputs or components) which is not readily observable in the current market. In these cases valuation inputs (or components of the overall value) are derived and extrapolated from other relevant market data and tested against historic transactions and observed market trends. To the extent that valuation is based on models or inputs that are not observable in the market, the determination of fair value can be more subjective, dependent on the significance of the unobservable input to the overall valuation.
The following valuation techniques have been applied to determine the fair values of financial instruments where there is no market price for the instrument:
| • | For instruments classified as Trading security assets and Trading liabilities, Derivative financial assets and liabilities, Available-for-sale financial assets, and Investments backing policy liabilities, fair value measurements are derived by using modelled valuations techniques (including discounted cash flow models) that incorporate market prices/yields for securities with similar credit risk, maturity and yield characteristics; and/or current market yields for similar instruments. |
| • | For Net loans and advances, Deposits and other borrowings and Bonds and notes, discounted cash flow techniques are used where contractual future cash flows of the instrument are discounted using discount rates incorporating changes in wholesale market rates or market borrowing rates of debt with similar maturities or a yield curve appropriate for the remaining term to maturity. |
| • | The fair value of External unit holder liabilities (life insurance funds) represents the unitholder’s share of net assets within the fund, which are carried at fair value in the fund. The fair value of Policy liabilities being liabilities of the insurance business is directly linked to the performance and value of the assets backing the liabilities. These assets are carried at fair value using modelled valuations. |
Further details of valuation techniques and significant unobservable inputs used in measuring fair values are described in (iii)(a) below.
117
NOTES TO CONDENSED CONSOLIDATED FINANCIAL STATEMENTS
There have been no substantial changes in the valuation techniques applied to different classes of financial instruments during the current half-year period.
| (c) | Fair value measurements |
The table below provides an analysis of financial instruments carried at fair value at reporting date categorised according to the lowest level input into a valuation model or a valuation component that is significant to the reported fair value. The fair value has been allocated in full to the category in the fair value hierarchy which most appropriately reflects the determination of the fair value.
| Fair value measurements | ||||||||||||||||
| Level 1 | Level 2 | Level 3 | Total | |||||||||||||
| Mar 14 | Mar 14 | Mar 14 | Mar 14 | |||||||||||||
| $M | $M | $M | $M | |||||||||||||
Financial assets | ||||||||||||||||
Trading securities | 42,467 | 3,703 | — | 46,170 | ||||||||||||
Derivative financial instruments | 611 | 43,083 | 135 | 43,829 | ||||||||||||
Available for sale financial assets | 23,099 | 4,195 | 36 | 27,330 | ||||||||||||
Investments backing policy liabilities | 19,390 | 13,721 | 86 | 33,197 | ||||||||||||
Loans and advances (designated at fair value) | — | 238 | — | 238 | ||||||||||||
|
|
|
|
|
|
|
| |||||||||
Total | 85,567 | 64,940 | 257 | 150,764 | ||||||||||||
|
|
|
|
|
|
|
| |||||||||
Financial liabilities | ||||||||||||||||
Payables and other liabilities1 | 3,212 | 76 | — | 3,288 | ||||||||||||
Derivative financial instruments | 636 | 45,098 | 142 | 45,876 | ||||||||||||
Deposits and other borrowings (designated at fair value) | — | 5,063 | — | 5,063 | ||||||||||||
Bonds and notes | — | 2,681 | — | 2,681 | ||||||||||||
Policy liabilities2 | — | 32,888 | — | 32,888 | ||||||||||||
External unit holder liabilities (life insurance funds) | — | 3,334 | — | 3,334 | ||||||||||||
|
|
|
|
|
|
|
| |||||||||
Total | 3,848 | 89,140 | 142 | 93,130 | ||||||||||||
|
|
|
|
|
|
|
| |||||||||
| 1. | Represents trading liabilities. |
| 2. | Policy liabilities relate to life investment contract liabilities only as these are designated at fair value through profit and loss. |
There are no assets or liabilities measured at fair value on a non-recurring basis.
The Group recognises transfers between Level 1 and Level 2 as of the beginning of the reporting period during which the transfer has occurred. There have been no significant transfers between Level 1 and Level 2 during the period.
118
NOTES TO CONDENSED CONSOLIDATED FINANCIAL STATEMENTS
| (iii) | Details of fair value measurements that incorporate unobservable market data |
| (a) | Composition of Level 3 fair value measurements |
The following table presents the composition of financial instruments measured at fair value with significant unobservable inputs (Level 3 fair value measurements).
| Financial assets | Financial liabilities | |||||||||||||||
| Derivatives | Available-for- sale | Investments backing policy liabilities | Derivatives | |||||||||||||
| Mar 14 | Mar 14 | Mar 14 | Mar 14 | |||||||||||||
| $M | $M | $M | $M | |||||||||||||
Asset backed securities | — | 2 | 2 | — | ||||||||||||
Illiquid corporate bonds | — | 8 | — | — | ||||||||||||
Structured credit products | 102 | — | — | (127 | ) | |||||||||||
Managed funds (suspended) | — | — | 23 | — | ||||||||||||
Alternative assets | — | 26 | 61 | — | ||||||||||||
Other derivatives | 33 | — | — | (15 | ) | |||||||||||
|
|
|
|
|
|
|
| |||||||||
Total | 135 | 36 | 86 | (142 | ) | |||||||||||
|
|
|
|
|
|
|
| |||||||||
Structured credit products comprise the structured credit intermediation trades that the Group entered into from 2004 to 2007 whereby it sold protection using credit default swaps over certain structures, and mitigated risk by purchasing protection via credit default swaps from US financial guarantors over the same structures. These trades are valued using complex models with certain inputs relating to the reference assets and derivative counterparties not being observable in the market. Such unobservable inputs include credit spreads and default probabilities contributing from 12% to 57% of the valuation. The assets underlying the structured credit products are diverse instruments with a wide range of credit spreads and default probabilities relevant to the valuation.
The remaining Level 3 balances include Asset backed securities and Illiquid corporate bonds where the effect on fair value of issuer credit cannot be directly or indirectly observed in the market; Managed funds (suspended) comprising of fixed income and mortgage investments in managed funds that are illiquid and are not currently redeemable; Alternative assets that largely comprise various investments in unlisted equity securities for which no active market exists; and Other derivatives which include reverse mortgage swaps where the mortality rate cannot be observed and long dated oil swaps where market data for the full tenor is unobservable. These Level 3 balances are not considered material.
| (b) | Movements in Level 3 fair value measurements |
The following table sets out movements in Level 3 fair value measurements. Derivatives are categorised on a portfolio basis and classified as either financial assets or financial liabilities based on whether the closing balance is an unrealised gain or loss. This could be different to the opening balance.
| Financial assets | Financial liabilities | |||||||||||||||
| Derivatives | Available-for- sale | Investments backing policy liabilities | Derivatives | |||||||||||||
| Mar 14 | Mar 14 | Mar 14 | Mar 14 | |||||||||||||
| $M | $M | $M | $M | |||||||||||||
Opening balance | 200 | 36 | 105 | (437 | ) | |||||||||||
New purchases | — | 4 | — | n/a | ||||||||||||
Disposals (sales) | — | (4 | ) | (15 | ) | n/a | ||||||||||
Cash settlements | n/a | n/a | n/a | 1 | ||||||||||||
Transfers: | ||||||||||||||||
Transfers into Level 3 category | — | 1 | — | — | ||||||||||||
Transfers out of Level 3 category | (31 | ) | — | — | 254 | |||||||||||
Fair value gain/(loss) recorded in other operating income in the income statement1 | (34 | ) | — | (4 | ) | 40 | ||||||||||
Fair value gain/(loss) recognised in reserves in equity | — | (1 | ) | — | — | |||||||||||
|
|
|
|
|
|
|
| |||||||||
Closing balance | 135 | 36 | 86 | (142 | ) | |||||||||||
|
|
|
|
|
|
|
| |||||||||
| 1. | Relating to assets and liabilities that are held at the end of the period. |
Transfers out of Level 3 relate principally to interest rate swaptions containing multi-callable features. The trade characteristics of the portfolio are such that inputs significant to the valuation are now observable.
Transfers into and out of Level 3 are deemed to have occurred as of the beginning of the reporting period in which the transfer occurred.
119
NOTES TO CONDENSED CONSOLIDATED FINANCIAL STATEMENTS
| (c) | Sensitivity to Level 3 data inputs |
Where valuation techniques use assumptions due to significant data inputs not being directly observed in the market place (Level 3 inputs), changing these assumptions changes the resultant estimate of fair value. The majority of transactions in this category are ‘back-to-back’ in nature where ANZ either acts as a financial intermediary or hedges the market risks. Similarly, the performance of Investments backing policy liabilities directly impacts the associated life investment contracts they relate to. In these circumstances, changes in the assumptions generally have minimal impact on the income statement and net assets of ANZ. An exception to this is the ‘back-to-back’ structured credit intermediation trades which create significant exposure to market risk and/or credit risk.
Principal inputs used in the determination of fair value of financial instruments included in the structured credit portfolio include counterparty credit spreads, market-quoted CDS prices, recovery rates, default probabilities, correlation curves and other inputs, some of which may not be directly observable in the market. The potential effect of changing prevailing unobservable inputs to reasonably possible alternative assumptions for valuing those financial instruments could result in less than a (+ / -) $10 million impact on profit. The ranges of reasonably possible alternative assumptions are established by application of professional judgement and analysis of the data available to support each assumption.
| (d) | Deferred fair value gains and losses |
Where the fair value of a financial instrument is determined using unobservable data that is significant to the valuation of the instrument, any difference between the transaction price and the amount determined based on the valuation technique on initial recognition of the financial instrument (day-one gain or loss) is deferred on the balance sheet. Subsequently, the day-one gain or loss is recognised in the income statement only to the extent that it arises from a change in factors (including time) that a market participant would consider in setting the price for the instrument.
The table below summarises the movement of the aggregate amount of day-one gains not recognised in the income statement on the initial recognition of the financial instrument where not all inputs to the valuation technique are observable in the market.
| Mar 14 | ||||
| $M | ||||
Opening balance | 4 | |||
Deferral on new transactions | 1 | |||
Amounts recognised in income statement during the period | (2 | ) | ||
|
| |||
Closing balance | 3 | |||
|
| |||
The closing balance of unrecognised gains is predominantly related to derivative financial instruments.
120
NOTES TO CONDENSED CONSOLIDATED FINANCIAL STATEMENTS
| 15. | Segment analysis |
(i) Description of segments
The Group operates on a divisional structure with Australia, International and Institutional Banking (IIB), New Zealand, and Global Wealth being the major operating divisions. The IIB and Global Wealth divisions are coordinated globally. GTSO and Group Centre provide support to the operating divisions, including technology, operations, risk management, financial management, strategy and marketing, human resources and corporate affairs. Additionally, Group Centre includes Group Treasury, Shareholder Functions and Discontinued Businesses.
There have been no major structural changes to Divisional segments since 30 September 2013; however certain amounts in the comparatives have been reclassified to conform with current period financial statement presentations.
(ii) Operating segments
Transactions between business units across segments within ANZ are conducted on an arms length basis.
| Half Year | Movement | |||||||||||||||||||
| Mar 14 | Sep 13 | Mar 13 | Mar 14 | Mar 14 | ||||||||||||||||
| Segment Revenue | $M | $M | $M | v. Sep 13 | v. Mar 13 | |||||||||||||||
Australia | 4,017 | 3,991 | 3,869 | 1 | % | 4 | % | |||||||||||||
International and Institutional Banking | 3,592 | 3,315 | 3,287 | 8 | % | 9 | % | |||||||||||||
New Zealand | 1,239 | 1,159 | 1,053 | 7 | % | 18 | % | |||||||||||||
Global Wealth | 806 | 780 | 744 | 3 | % | 8 | % | |||||||||||||
GTSO and Group Centre | 14 | 54 | 139 | -74 | % | -90 | % | |||||||||||||
|
|
|
|
|
|
|
|
|
| |||||||||||
Subtotal | 9,668 | 9,299 | 9,092 | 4 | % | 6 | % | |||||||||||||
Other1 | (150 | ) | 224 | (156 | ) | large | -4 | % | ||||||||||||
|
|
|
|
|
|
|
|
|
| |||||||||||
Group total | 9,518 | 9,523 | 8,936 | 0 | % | 7 | % | |||||||||||||
|
|
|
|
|
|
|
|
|
| |||||||||||
| Half Year | Movement | |||||||||||||||||||
| Mar 14 | Sep 13 | Mar 13 | Mar 14 | Mar 14 | ||||||||||||||||
| Segment Profit | $M | $M | $M | v. Sep 13 | v. Mar 13 | |||||||||||||||
Australia | 1,479 | 1,449 | 1,409 | 2 | % | 5 | % | |||||||||||||
International and Institutional Banking | 1,372 | 1,244 | 1,208 | 10 | % | 14 | % | |||||||||||||
New Zealand | 546 | 482 | 396 | 13 | % | 38 | % | |||||||||||||
Global Wealth | 226 | 268 | 204 | -16 | % | 11 | % | |||||||||||||
GTSO and Group Centre | (108 | ) | (130 | ) | (38 | ) | -17 | % | large | |||||||||||
|
|
|
|
|
|
|
|
|
| |||||||||||
Subtotal | 3,515 | 3,313 | 3,179 | 6 | % | 11 | % | |||||||||||||
Other1 | (134 | ) | 16 | (242 | ) | large | -45 | % | ||||||||||||
|
|
|
|
|
|
|
|
|
| |||||||||||
Group total | 3,381 | 3,329 | 2,937 | 2 | % | 15 | % | |||||||||||||
|
|
|
|
|
|
|
|
|
| |||||||||||
| Half Year | Movement | |||||||||||||||||||
| Mar 14 | Sep 13 | Mar 13 | Mar 14 | Mar 14 | ||||||||||||||||
| Segment Assets | $M | $M | $M | v. Sep 13 | v. Mar 13 | |||||||||||||||
Australia | 281,191 | 274,325 | 264,951 | 3 | % | 6 | % | |||||||||||||
International and Institutional Banking | 315,013 | 296,522 | 285,443 | 6 | % | 10 | % | |||||||||||||
New Zealand | 92,066 | 85,015 | 74,763 | 8 | % | 23 | % | |||||||||||||
Global Wealth | 49,800 | 49,010 | 47,342 | 2 | % | 5 | % | |||||||||||||
GTSO and Group Centre | 21 | (1,685 | ) | 325 | large | -94 | % | |||||||||||||
|
|
|
|
|
|
|
|
|
| |||||||||||
Subtotal | 738,091 | 703,187 | 672,824 | 5 | % | 10 | % | |||||||||||||
Other1 | (276 | ) | (192 | ) | (194 | ) | 44 | % | 42 | % | ||||||||||
|
|
|
|
|
|
|
|
|
| |||||||||||
Group total | 737,815 | 702,995 | 672,630 | 5 | % | 10 | % | |||||||||||||
|
|
|
|
|
|
|
|
|
| |||||||||||
| 1. | In evaluating the performance of the operating segments, certain items are removed from the operating segment results where they are not considered integral to the ongoing performance of the segment and are evaluated separately. These items are set out in part (iii) of this note (refer pages 83 to 92 for further analysis). |
121
NOTES TO CONDENSED CONSOLIDATED FINANCIAL STATEMENTS
| 15. | Segment analysis, cont’d |
(iii) Other items
The table below sets out the profit after tax impact of other items.
| Half Year | ||||||||||||||
| Mar 14 | Sep 13 | Mar 13 | ||||||||||||
| $M | $M | $M | ||||||||||||
Item gains/(losses) | Related segment | |||||||||||||
Treasury shares adjustment | Global Wealth | 37 | 31 | 53 | ||||||||||
Revaluation of policy liabilities | Global Wealth | (3 | ) | 27 | 19 | |||||||||
Economic hedging | IIB | 89 | (205 | ) | 192 | |||||||||
Revenue and net investment hedges | GTSO and Group Centre | 18 | 143 | 16 | ||||||||||
Structured credit intermediation trades | IIB | (7 | ) | (12 | ) | (38 | ) | |||||||
|
|
|
|
|
| |||||||||
Total profit after tax | 134 | (16 | ) | 242 | ||||||||||
|
|
|
|
|
| |||||||||
| 16. | Note to the Cash Flow Statement |
Reconciliation of cash and cash equivalents
| Half Year | ||||||||||||
| Mar 14 | Sep 131 | Mar 131 | ||||||||||
| Inflows | Inflows | Inflows | ||||||||||
| (Outflows) | (Outflows) | (Outflows) | ||||||||||
| $M | $M | $M | ||||||||||
Profit after income tax | 3,381 | 3,329 | 2,937 | |||||||||
Adjustments to reconcile to net cash provided by/(used in) operating activities | ||||||||||||
Provision for credit impairment | 527 | 600 | 588 | |||||||||
Impairment on available for sale assets transferred to profit and loss | — | — | 3 | |||||||||
Depreciation and amortisation | 410 | 397 | 384 | |||||||||
(Profit)/loss on sale of businesses | — | (14 | ) | (6 | ) | |||||||
(Profit)/loss on sale of premises and equipment | 9 | (31 | ) | 33 | ||||||||
Equity settled share-based payments expense | (78 | ) | 99 | 20 | ||||||||
Net derivatives/foreign exchange adjustment | 250 | 5,030 | 784 | |||||||||
Other non cash movements | (299 | ) | (105 | ) | (192 | ) | ||||||
Net (increase)/decrease in operating assets: | ||||||||||||
Trading securities | (4,990 | ) | (1,624 | ) | 2,392 | |||||||
Collateral paid | 396 | 169 | 179 | |||||||||
Loans and advances | (16,357 | ) | (13,088 | ) | (15,610 | ) | ||||||
Investments backing policy liabilities | (1,238 | ) | (1,509 | ) | (1,893 | ) | ||||||
Interest receivable | (121 | ) | 151 | (18 | ) | |||||||
Accrued income | (36 | ) | 60 | (85 | ) | |||||||
Net tax assets | (474 | ) | 174 | 72 | ||||||||
Net increase/(decrease) in operating liabilities: | ||||||||||||
Deposits and other borrowings | 27,397 | (3,816 | ) | 31,357 | ||||||||
Settlement balances owed by ANZ | (624 | ) | (4,678 | ) | 7,957 | |||||||
Collateral received | (70 | ) | 1,045 | 346 | ||||||||
Payables and other liabilities | 347 | (2 | ) | (1,023 | ) | |||||||
Life insurance contract policy liabilities | 1,020 | 1,677 | 1,992 | |||||||||
Interest payable | 263 | (340 | ) | (124 | ) | |||||||
Accrued expenses | (136 | ) | 86 | (103 | ) | |||||||
Other | (127 | ) | 112 | (106 | ) | |||||||
|
|
|
|
|
| |||||||
Net cash provided by/(used in) operating activities | 9,450 | (12,278 | ) | 29,884 | ||||||||
|
|
|
|
|
| |||||||
| 1. | Comparative amounts have changed as a result of the changes referred to in Note 21. |
122
NOTES TO CONDENSED CONSOLIDATED FINANCIAL STATEMENTS
| 16. | Note to the cash flow statement, cont’d |
| Half Year | ||||||||||||
| Mar 14 | Sep 13 | Mar 13 | ||||||||||
| Inflows | Inflows | Inflows | ||||||||||
| Reconciliation of cash and cash equivalents | (Outflows) | (Outflows) | (Outflows) | |||||||||
| $M | $M | $M | ||||||||||
Cash and cash equivalents at the end of the period as shown in the cash flow statement are reflected in the related items in the balance sheet as follows | ||||||||||||
Cash | 33,651 | 25,270 | 39,779 | |||||||||
Cash equivalents1 | 24,841 | 23,753 | 20,998 | |||||||||
|
|
|
|
|
| |||||||
| 58,492 | 49,023 | 60,777 | ||||||||||
|
|
|
|
|
| |||||||
Non-cash financing activities | ||||||||||||
Dividends satisfied by share issue | 476 | 392 | 451 | |||||||||
Dividends satisfied by bonus share issue | 42 | 36 | 35 | |||||||||
|
|
|
|
|
| |||||||
| 518 | 428 | 486 | ||||||||||
|
|
|
|
|
| |||||||
| 1. | Cash equivalents include settlement balances and loans and advances with financial institution counterparties that have original maturities of less than 90 days. |
| 17. | Changes in composition of the Group |
There were no material entities acquired or disposed during the half year ended 31 March 2014.
| 18. | Investments in Associates |
| Half Year | ||||||||||||
| Mar 14 | Sep 13 | Mar 13 | ||||||||||
| $M | $M | $M | ||||||||||
Profit after income tax | 247 | 271 | 211 | |||||||||
Contributions to profit1
| Contribution to Group post-tax profit | Ownership interest held by Group | |||||||||||||||||||||||
| Associates | Half Year | As at | ||||||||||||||||||||||
| Mar 14 | Sep 13 | Mar 13 | Mar 14 | Sep 13 | Mar 13 | |||||||||||||||||||
| $M | $M | $M | % | % | % | |||||||||||||||||||
P.T. Bank Pan Indonesia | 40 | 46 | 38 | 39 | 39 | 39 | ||||||||||||||||||
Metrobank Card Corporation Inc | 10 | 10 | 9 | 40 | 40 | 40 | ||||||||||||||||||
Bank of Tianjin2,3 | 56 | 49 | 44 | 14 | 18 | 18 | ||||||||||||||||||
AMMB Holdings Berhad | 67 | 79 | 54 | 24 | 24 | 24 | ||||||||||||||||||
Shanghai Rural Commercial Bank | 68 | 80 | 63 | 20 | 20 | 20 | ||||||||||||||||||
Saigon Securities Inc.2 | — | — | — | 18 | 18 | 18 | ||||||||||||||||||
Other associates | 6 | 7 | 3 | n/a | n/a | n/a | ||||||||||||||||||
|
|
|
|
|
|
|
|
|
|
|
| |||||||||||||
Profit after income tax | 247 | 271 | 211 | |||||||||||||||||||||
|
|
|
|
|
|
|
|
|
|
|
| |||||||||||||
| 1. | The results differ from the published results of these entities due to the application of IFRS, Group Accounting Policies and acquisition adjustments. This amounted to a nil increase for the March 2014 half (Sep 13 half: $5 million increase; Mar 13 half: $1 million increase). Excludes gains or losses on disposal or valuation adjustments. |
| 2. | Significant influence was established via representation on the Board of Directors. |
| 3. | During the period the Group did not participate in a rights issue and as a result the Group’s interest was reduced to 14%. |
123
NOTES TO CONDENSED CONSOLIDATED FINANCIAL STATEMENTS
| 19. | Contingent liabilities and contingent assets |
There are outstanding court proceedings, claims and possible claims for and against the Group, the aggregate amount of which cannot reasonably be quantified. Expert legal advice has been obtained and, in the light of such advice, provisions and/or disclosures as deemed appropriate have been made. In some instances we have not disclosed the estimated financial impact of the individual items as this may prejudice the interests of the Group.
Refer to Note 43 of the 2013 ANZ Annual Financial Statements for a description of contingent liabilities and contingent assets.
| • | Bank fees litigation |
Litigation Funder Bentham IMF Limited commenced a class action against ANZ in 2010, followed by a second similar class action in March 2013. Together the class actions are claimed to be on behalf of more than 40,000 ANZ customers.
On 5 February 2014, the Federal Court delivered reasons for judgment in the second class action. The first class action is in abeyance. The customers currently involved in these class actions are only part of ANZ’s customer base for credit cards and transaction accounts.
The applicants contended that the relevant exception fees were unenforceable penalties (at law and in equity) and that various of the fees were also unenforceable under statutory provisions governing unconscionable conduct, unfair contract terms and unjust transactions. On the penalties claims, the Court found in ANZ’s favour in relation to all but one of the fee types that were in issue in the case, namely honour fees (retail and business), dishonour fees (business), overlimit and non-payment fees. The Court found against ANZ in respect of late payment fees on the basis that they were unenforceable penalties. All of the applicants’ statutory claims were dismissed. Both ANZ and the applicants have appealed the Court’s decision. The appeal hearing is likely to take place in the second half of 2014 calendar year. Given the complexity of the issues involved, and the appeal by each side, the implications of the Court’s decision of 5 February 2014 are uncertain and may not be known for some time.
In June 2013, litigation funder Litigation Lending Services (NZ) commenced a representative action against ANZ for certain fees charged to New Zealand customers since 2007. There is a risk that further claims could emerge in Australia, New Zealand or elsewhere.
| • | Security recovery actions |
Various claims have been made or are anticipated, arising from security recovery actions taken to resolve impaired assets over recent years. ANZ will defend these claims and any future claims.
| 20. | Related party disclosure |
There have been no significant changes to the arrangements with related parties. Refer to Notes 46 and 47 of the 2013 Annual Financial Statements.
| 21. | Changes to comparatives |
Certain amounts reported as comparative information have changed either as a result of the adoption of AASB 119 Employee Benefits (“AASB 119”) or being reclassified to conform with current period financial statement presentations.
The following changes have been made to either the Income Statement and/or Balance Sheet:
Balance sheet reclassification
During the period, the classification of the balance sheet has changed to more consistently reflect the nature of the financial assets and liabilities. Prior to this reclassification, the balance sheet was classified according to both nature and counterparty. The key changes include:
Assets
| • | Securities purchased under agreements to resell in less than three months previously reported in Liquid assets are now classified as Cash. |
| • | Money at call, bills receivable and remittances in transit previously reported in Liquid assets are now classified as either Cash, Settlement balances owed to ANZ or Net loans and advances depending on the nature of the asset. |
| • | Loans to other banks previously reported in Due from other financial institutions are now classified as Net Loans and Advances. |
| • | Collateral paid previously reported in Due from other financial institutions is now classified separately. |
| • | Issued security settlements previously reported in Other assets are now classified as Settlement balances owed to ANZ. |
Liabilities
| • | Loans from other banks previously reported in Due to other financial institutions are now classified as Deposits and other borrowings. |
| • | Collateral received previously reported in Due to other financial institutions is now classified separately. |
| • | Issued security settlements previously reported in Other liabilities is now classified as Settlement balances owed by ANZ. |
Employee benefits
The adoption of AASB 119 has resulted in changes to the measurement of the Group’s defined benefit obligations. This has resulted in a restatement to comparatives in the Income Statement and Balance Sheet.
Business taxes reported in Asia
During the period business taxes which were previously reported as a contra to revenue were classified as expenses to better reflect the nature of the transaction. Comparative information has been reclassified accordingly.
124
NOTES TO CONDENSED CONSOLIDATED FINANCIAL STATEMENTS
| As at $M | ||||||||||||||||
| September 2013 | ||||||||||||||||
| Previously reported | Balance sheet | Employee benefits | Currently reported | |||||||||||||
Assets | ||||||||||||||||
Liquid assets | 39,737 | (39,737 | ) | — | — | |||||||||||
Due from other financial institutions | 22,177 | (22,177 | ) | — | — | |||||||||||
Cash | — | 25,270 | — | 25,270 | ||||||||||||
Settlement balances owed to ANZ | — | 19,225 | — | 19,225 | ||||||||||||
Collateral paid | — | 6,530 | — | 6,530 | ||||||||||||
Available-for-sale assets | 28,135 | 142 | — | 28,277 | ||||||||||||
Net loans and advances | 469,295 | 13,969 | — | 483,264 | ||||||||||||
Deferred tax assets | 721 | — | 4 | 725 | ||||||||||||
Other assets | 7,574 | (3,222 | ) | — | 4,352 | |||||||||||
All other assets | 135,352 | — | — | 135,352 | ||||||||||||
|
|
|
|
|
|
|
| |||||||||
Total assets | 702,991 | — | 4 | 702,995 | ||||||||||||
|
|
|
|
|
|
|
| |||||||||
Liabilities | ||||||||||||||||
Due to other financial institutions | 36,306 | (36,306 | ) | — | — | |||||||||||
Settlement balances owed by ANZ | — | 8,695 | — | 8,695 | ||||||||||||
Collateral received | — | 3,921 | — | 3,921 | ||||||||||||
Deposits and other borrowings | 439,674 | 27,241 | — | 466,915 | ||||||||||||
Payables and other liabilities | 12,594 | (3,551 | ) | 16 | 9,059 | |||||||||||
All other liabilities | 168,802 | — | — | 168,802 | ||||||||||||
|
|
|
|
|
|
|
| |||||||||
Total liabilities | 657,376 | — | 16 | 657,392 | ||||||||||||
|
|
|
|
|
|
|
| |||||||||
Net Assets | 45,615 | — | (12 | ) | 45,603 | |||||||||||
|
|
|
|
|
|
|
| |||||||||
Retained earnings | 21,948 | — | (12 | ) | 21,936 | |||||||||||
All other equity | 23,667 | — | — | 23,667 | ||||||||||||
|
|
|
|
|
|
|
| |||||||||
Total shareholders’ equity | 45,615 | — | (12 | ) | 45,603 | |||||||||||
|
|
|
|
|
|
|
| |||||||||
| Half Year ($M) | ||||||||||||||||
| September 2013 | ||||||||||||||||
| Previously | Business tax | Employee | Currently | |||||||||||||
| reported | restatement | benefits | reported | |||||||||||||
Net interest income | 6,558 | — | — | 6,558 | ||||||||||||
Other operating income | 2,958 | 7 | — | 2,965 | ||||||||||||
|
|
|
|
|
|
|
| |||||||||
Operating income | 9,516 | 7 | — | 9,523 | ||||||||||||
Operating expenses | (4,202 | ) | (7 | ) | (4 | ) | (4,213 | ) | ||||||||
|
|
|
|
|
|
|
| |||||||||
Profit before credit impairment and income tax | 5,314 | — | (4 | ) | 5,310 | |||||||||||
Provision for credit impairment | (600 | ) | — | — | (600 | ) | ||||||||||
|
|
|
|
|
|
|
| |||||||||
Profit before income tax | 4,714 | — | (4 | ) | 4,710 | |||||||||||
Income tax expense and non-controlling interests | (1,382 | ) | — | 1 | (1,381 | ) | ||||||||||
|
|
|
|
|
|
|
| |||||||||
Profit attributable to shareholders of the Company | 3,332 | — | (3 | ) | 3,329 | |||||||||||
|
|
|
|
|
|
|
| |||||||||
Other comprehensive income net of tax | 1,670 | — | 7 | 1,677 | ||||||||||||
|
|
|
|
|
|
|
| |||||||||
Total comprehensive income attributable to shareholders of the Company | 5,002 | — | 4 | 5,006 | ||||||||||||
|
|
|
|
|
|
|
| |||||||||
125
NOTES TO CONDENSED CONSOLIDATED FINANCIAL STATEMENTS
| As at $M | ||||||||||||||||
| March 2013 | ||||||||||||||||
| Previously reported | Balance sheet | Employee benefits | Currently reported | |||||||||||||
Assets | ||||||||||||||||
Liquid assets | 53,077 | (53,077 | ) | — | — | |||||||||||
Due from other financial institutions | 20,781 | (20,781 | ) | — | — | |||||||||||
Cash | — | 39,779 | — | 39,779 | ||||||||||||
Settlement balances owed to ANZ | — | 15,804 | — | 15,804 | ||||||||||||
Collateral paid | — | 6,699 | — | 6,699 | ||||||||||||
Available-for-sale assets | 23,282 | 128 | — | 23,410 | ||||||||||||
Net loans and advances | 441,980 | 12,336 | — | 454,316 | ||||||||||||
Deferred tax assets | 654 | — | 5 | 659 | ||||||||||||
Other assets | 5,709 | (888 | ) | — | 4,821 | |||||||||||
All other assets | 127,142 | — | — | 127,142 | ||||||||||||
|
|
|
|
|
|
|
| |||||||||
Total assets | 672,625 | — | 5 | 672,630 | ||||||||||||
|
|
|
|
|
|
|
| |||||||||
Liabilities | ||||||||||||||||
Due to other financial institutions | 43,345 | (43,345 | ) | — | — | |||||||||||
Settlement balances owed by ANZ | — | 13,373 | — | 13,373 | ||||||||||||
Collateral received | — | 2,877 | — | 2,877 | ||||||||||||
Deposits and other borrowings | 420,474 | 30,631 | — | 451,105 | ||||||||||||
Payables and other liabilities | 12,589 | (3,536 | ) | 21 | 9,074 | |||||||||||
All other liabilities | 153,698 | — | — | 153,698 | ||||||||||||
|
|
|
|
|
|
|
| |||||||||
Total liabilities | 630,106 | — | 21 | 630,127 | ||||||||||||
|
|
|
|
|
|
|
| |||||||||
Net Assets | 42,519 | — | (16 | ) | 42,503 | |||||||||||
|
|
|
|
|
|
|
| |||||||||
Retained earnings | 20,534 | — | (16 | ) | 20,518 | |||||||||||
All other equity | 21,985 | — | — | 21,985 | ||||||||||||
|
|
|
|
|
|
|
| |||||||||
Total shareholders’ equity | 42,519 | — | (16 | ) | 42,503 | |||||||||||
|
|
|
|
|
|
|
| |||||||||
| Half Year ($M) | ||||||||||||||||
| March 2013 | ||||||||||||||||
| Previously | Business tax | Employee | Currently | |||||||||||||
| reported | restatement | benefits | reported | |||||||||||||
Net interest income | 6,200 | — | — | 6,200 | ||||||||||||
Other operating income | 2,730 | 6 | — | 2,736 | ||||||||||||
|
|
|
|
|
|
|
| |||||||||
Operating income | 8,930 | 6 | — | 8,936 | ||||||||||||
Operating expenses | (4,034 | ) | (6 | ) | (4 | ) | (4,044 | ) | ||||||||
|
|
|
|
|
|
|
| |||||||||
Profit before credit impairment and income tax | 4,896 | — | (4 | ) | 4,892 | |||||||||||
Provision for credit impairment | (588 | ) | — | — | (588 | ) | ||||||||||
|
|
|
|
|
|
|
| |||||||||
Profit before income tax | 4,308 | — | (4 | ) | 4,304 | |||||||||||
Income tax expense and non-controlling interests | (1,368 | ) | — | 1 | (1,367 | ) | ||||||||||
|
|
|
|
|
|
|
| |||||||||
Profit attributable to shareholders of the Company | 2,940 | — | (3 | ) | 2,937 | |||||||||||
|
|
|
|
|
|
|
| |||||||||
Other comprehensive income net of tax | (56 | ) | — | 4 | (52 | ) | ||||||||||
|
|
|
|
|
|
|
| |||||||||
Total comprehensive income attributable to shareholders of the Company | 2,884 | — | 1 | 2,885 | ||||||||||||
|
|
|
|
|
|
|
| |||||||||
126
NOTES TO CONDENSED CONSOLIDATED FINANCIAL STATEMENTS
| As at $M | ||||||||||||||||
| 1 October 2012 | ||||||||||||||||
| Previously reported | Balance sheet | Employee benefits | Currently reported | |||||||||||||
Assets | ||||||||||||||||
Liquid assets | 36,578 | (36,578 | ) | — | — | |||||||||||
Due from other financial institutions | 17,103 | (17,103 | ) | — | — | |||||||||||
Cash | — | 25,143 | — | 25,143 | ||||||||||||
Settlement balances owed to ANZ | — | 14,016 | — | 14,016 | ||||||||||||
Collateral paid | — | 6,878 | — | 6,878 | ||||||||||||
Available-for-sale assets | 20,562 | 79 | — | 20,641 | ||||||||||||
Net loans and advances | 427,823 | 8,804 | — | 436,627 | ||||||||||||
Deferred tax assets | 785 | — | 7 | 792 | ||||||||||||
Other assets | 5,623 | (1,239 | ) | — | 4,384 | |||||||||||
All other assets | 133,653 | — | — | 133,653 | ||||||||||||
|
|
|
|
|
|
|
| |||||||||
Total assets | 642,127 | — | 7 | 642,134 | ||||||||||||
|
|
|
|
|
|
|
| |||||||||
Liabilities | ||||||||||||||||
Due to other financial institutions | 30,538 | (30,538 | ) | — | — | |||||||||||
Settlement balances owed by ANZ | — | 5,416 | — | 5,416 | ||||||||||||
Collateral received | — | 2,531 | — | 2,531 | ||||||||||||
Deposits and other borrowings | 397,123 | 23,690 | — | 420,813 | ||||||||||||
Payables and other liabilities | 10,109 | (1,099 | ) | 24 | 9,034 | |||||||||||
All other liabilities | 163,137 | — | — | 163,137 | ||||||||||||
|
|
|
|
|
|
|
| |||||||||
Total liabilities | 600,907 | — | 24 | 600,931 | ||||||||||||
|
|
|
|
|
|
|
| |||||||||
Net Assets | 41,220 | — | (17 | ) | 41,203 | |||||||||||
|
|
|
|
|
|
|
| |||||||||
Retained earnings | 19,728 | — | (17 | ) | 19,711 | |||||||||||
All other equity | 21,492 | — | — | 21,492 | ||||||||||||
|
|
|
|
|
|
|
| |||||||||
Total shareholders’ equity | 41,220 | — | (17 | ) | 41,203 | |||||||||||
|
|
|
|
|
|
|
| |||||||||
| 22. | Significant events since balance date |
On 10 April 2014, ANZ announced the sale of ANZ Trustees to Equity Trustees Limited for $150 million. The transaction is expected to be completed in July 2014 subject to regulatory approval. The gain on sale will be recognised in the second half of the 2014 financial year.
Other than the matter described above, there have no significant events from 31 March 2014 to the date of signing of this report.
127
DIRECTORS’ DECLARATION AND RESPONSIBILITY STATEMENT
Directors’ Declaration
The Directors of Australia and New Zealand Banking Group Limited declare that:
| 1. | in the Directors’ opinion the Condensed Consolidated Financial Statements and Notes to the Condensed Consolidated Financial Statements are in accordance with the Corporations Act 2001, including: |
| • | section 304, that they comply with the Australian Accounting Standards and any further requirements of the Corporations Regulations 2001; and |
| • | section 305, that they give a true and fair view of the financial position of the Group as at 31 March 2014 and of its performance for the half year ended on that date; and |
| 2. | in the Directors’ opinion as at the date of this declaration there are reasonable grounds to believe that the Company will be able to pay its debts as and when they become due and payable. |
Signed in accordance with a resolution of the Directors.
 |  | |||
| John Morschel | Michael R P Smith, OBE | |||
| Chairman | Director | |||
30 April 2014
Responsibility statement of the Directors in accordance with the Disclosure and Transparency Rule 4.2.10(3)(b) of the United Kingdom Financial Conduct Authority
The Directors of Australia and New Zealand Banking Group Limited confirm to the best of their knowledge that:
the Condensed Consolidated Financial Statements and Notes to the Condensed Consolidated Financial Statements for the half year ended 31 March 2014 and Directors’ Report (including matters included by reference) and Directors’ Declaration as set out on pages 94 to 128 as well as the additional information on page 144 includes a fair review of:
| (i) | the important events that have occurred during the first six months of the financial year, and their impact on the Condensed Consolidated Financial Statements; and |
| (ii) | a description of the principal risks and uncertainties for the remaining six months of the financial year. |
Signed in accordance with a resolution of the Directors.
 |  | |||
| John Morschel | Michael R P Smith, OBE | |||
| Chairman | Director | |||
| 30 April 2014 | ||||
128
AUDITOR’S REVIEW REPORT AND INDEPENDENCE DECLARATION
Independent auditor’s review report to the members of Australia and New Zealand Banking Group Limited

Report on the condensed consolidated financial statements
We have reviewed the accompanying half year condensed consolidated financial statements of Australia and New Zealand Banking Group Limited (the “Company”) which comprises the condensed consolidated balance sheet as at 31 March 2014, condensed consolidated income statement and condensed consolidated statement of comprehensive income, condensed consolidated statement of changes in equity and condensed consolidated cash flow statement for the half year ended on that date, notes 1 to 22 comprising a basis of preparation and other explanatory notes, and the directors’ declaration of the Group comprising the Company and the entities it controlled at the half year’s end or from time to time during the half year.
Directors’ responsibility for the half year condensed consolidated financial statements
The directors of the Company are responsible for the preparation of the half year condensed consolidated financial statements that give a true and fair view in accordance with Australian Accounting Standards and theCorporations Act 2001and for such internal controls as the directors determine is necessary to enable the preparation of the half year condensed consolidated financial statements that are free from material misstatement, whether due to fraud or error.
Auditors’ responsibility
Our responsibility is to express a conclusion on the half year condensed consolidated financial statements based on our review. We conducted our review in accordance with Auditing Standard on Review Engagements ASRE 2410Review of a Financial Report Performed by the Independent Auditor of the Entity, in order to state whether, on the basis of the procedures described, we have become aware of any matter that makes us believe that the half year condensed consolidated financial statements are not in accordance with theCorporations Act 2001 including: giving a true and fair view of the Group’s financial position as at 31 March 2014 and its performance for the half year ended on that date; and complying with Australian Accounting Standard AASB 134Interim Financial Reporting and theCorporations Regulations 2001. As auditor of Australia and New Zealand Banking Group Limited, ASRE 2410 requires that we comply with the ethical requirements relevant to the audit of the annual report.
A review of a half year condensed consolidated financial statements consists of making enquiries, primarily of persons responsible for financial and accounting matters, and applying analytical and other review procedures. A review is substantially less in scope than an audit conducted in accordance with Australian Auditing Standards and consequently does not enable us to obtain assurance that we would become aware of all significant matters that might be identified in an audit. Accordingly, we do not express an audit opinion.
Independence
In conducting our review, we have complied with the independence requirements of theCorporations Act 2001.
Conclusion
Based on our review, which is not an audit, we have not become aware of any matter that makes us believe that the half year condensed consolidated financial statements of Australia and New Zealand Banking Group Limited is not in accordance with theCorporations Act 2001, including:
| (a) | giving a true and fair view of the Group’s financial position as at 31 March 2014 and of its performance for the half year ended on that date; and |
| (b) | complying with Australian Accounting Standard AASB 134Interim Financial Reportingand theCorporations Regulations 2001. |
 |  | |||
| Melbourne | Andrew Yates | |||
| Partner | ||||
30 April 2014
Lead Auditor’s Independence Declaration under section 307C of the Corporations Act 2001
To: the directors of Australia and New Zealand Banking Group Limited
I declare that, to the best of my knowledge and belief, in relation to the review for the half year ended 31 March 2014, there have been:
| (i) | no contraventions of the auditor independence requirements as set out in theCorporations Act 2001 in relation to the review; and |
| (ii) | no contraventions of any applicable code of professional conduct in relation to the review. |
 |  | |||
| Melbourne | Andrew Yates | |||
| Partner | ||||
30 April 2014
KPMG, an Australian partnership and a member firm of the KPMG network of independent member firms affiliated with KPMG International Cooperative (“KPMG International”), a Swiss entity. Liability limited by a scheme approved under Professional Standards Legislation.
129
AUDITOR’S REVIEW REPORT AND INDEPENDENCE DECLARATION
This page has been left blank intentionally
130
SUPPLEMENTARY INFORMATION
CONTENTS
Section 9 – Supplementary information
Four year summary by half year | 132 | |||
Capital management | 133 | |||
Average balance sheet and related interest | 138 | |||
Full time equivalent staff | 142 | |||
Exchange rates | 142 | |||
Derivative financial instruments | 143 | |||
Summary of principal risks and uncertainties | 144 | |||
131
SUPPLEMENTARY INFORMATION
Four year summary by half year
| Mar 14 | Sep 13 | Mar 13 | Sep 12 | Mar 12 | Sep 11 | Mar 11 | Sep 10 | |||||||||||||||||||||||||
| $M | $M | $M | $M | $M | $M | $M | $M | |||||||||||||||||||||||||
Financial Performance | ||||||||||||||||||||||||||||||||
Net interest income | 6,764 | 6,536 | 6,236 | 6,126 | 5,984 | 5,848 | 5,652 | 5,623 | ||||||||||||||||||||||||
Other operating income | 2,904 | 2,763 | 2,856 | 3,002 | 2,736 | 2,529 | 2,856 | 2,592 | ||||||||||||||||||||||||
Operating expense | (4,286 | ) | (4,213 | ) | (4,044 | ) | (4,386 | ) | (4,133 | ) | (3,997 | ) | (4,026 | ) | (3,722 | ) | ||||||||||||||||
Credit impairment charge | (528 | ) | (598 | ) | (599 | ) | (688 | ) | (570 | ) | (560 | ) | (660 | ) | (722 | ) | ||||||||||||||||
|
|
|
|
|
|
|
|
|
|
|
|
|
|
|
| |||||||||||||||||
Profit before income tax | 4,854 | 4,488 | 4,449 | 4,054 | 4,017 | 3,820 | 3,822 | 3,771 | ||||||||||||||||||||||||
Income tax expense | (1,333 | ) | (1,170 | ) | (1,265 | ) | (1,118 | ) | (1,117 | ) | (1,073 | ) | (1,094 | ) | (1,040 | ) | ||||||||||||||||
Non-controlling interests | (6 | ) | (5 | ) | (5 | ) | (2 | ) | (4 | ) | (3 | ) | (5 | ) | (4 | ) | ||||||||||||||||
|
|
|
|
|
|
|
|
|
|
|
|
|
|
|
| |||||||||||||||||
Cash/underlying profit1 | 3,515 | 3,313 | 3,179 | 2,934 | 2,896 | 2,744 | 2,723 | 2,727 | ||||||||||||||||||||||||
Adjustments to arrive at statutory profit1 | (134 | ) | 16 | (242 | ) | (192 | ) | 23 | (53 | ) | (59 | ) | (151 | ) | ||||||||||||||||||
|
|
|
|
|
|
|
|
|
|
|
|
|
|
|
| |||||||||||||||||
Profit attributable to shareholders of the Company | 3,381 | 3,329 | 2,937 | 2,742 | 2,919 | 2,691 | 2,664 | 2,576 | ||||||||||||||||||||||||
|
|
|
|
|
|
|
|
|
|
|
|
|
|
|
| |||||||||||||||||
Financial Position | ||||||||||||||||||||||||||||||||
Assets | 737,815 | 702,995 | 672,630 | 642,127 | 612,212 | 594,488 | 537,447 | 531,739 | ||||||||||||||||||||||||
Net assets | 47,038 | 45,603 | 42,503 | 41,220 | 39,443 | 37,954 | 35,129 | 34,155 | ||||||||||||||||||||||||
Common Equity Tier 1 - APRA Basel 3 | 8.3 | % | 8.5 | % | 8.2 | % | 8.0 | % | 7.8 | % | 7.5 | % | 7.3 | % | n/a | |||||||||||||||||
Common Equity Tier 1 - Internationally Harmonised Basel 3 | 10.5 | % | 10.8 | % | 10.3 | % | 10.0 | % | 9.8 | % | 9.5 | % | 9.3 | % | n/a | |||||||||||||||||
Return on average ordinary shareholders’ equity (statutory) | 15.0 | % | 15.3 | % | 14.4 | % | 13.7 | % | 15.6 | % | 14.9 | % | 15.8 | % | 15.5 | % | ||||||||||||||||
Return on average assets (statutory) | 0.92 | % | 0.95 | % | 0.90 | % | 0.85 | % | 0.95 | % | 0.93 | % | 0.97 | % | 0.94 | % | ||||||||||||||||
Operating expenses to operating income (statutory) | 45.0 | % | 44.2 | % | 45.3 | % | 49.3 | % | 46.9 | % | 48.0 | % | 46.8 | % | 46.3 | % | ||||||||||||||||
Operating expenses to operating income (cash/underlying) | 44.3 | % | 45.3 | % | 44.5 | % | 48.0 | % | 47.4 | % | 47.7 | % | 47.3 | % | 45.3 | % | ||||||||||||||||
|
|
|
|
|
|
|
|
|
|
|
|
|
|
|
| |||||||||||||||||
Shareholder value - ordinary shares | ||||||||||||||||||||||||||||||||
Total return to shareholders | ||||||||||||||||||||||||||||||||
(share price movement plus dividends) | 10.4 | % | 10.5 | % | 19.0 | % | 9.6 | % | 23.6 | % | (15.7 | %) | 3.6 | % | (4.5 | %) | ||||||||||||||||
Market capitalisation | 90,720 | 84,450 | 78,278 | 67,255 | 62,325 | 51,319 | 61,820 | 60,614 | ||||||||||||||||||||||||
Dividend | 83 cents | 91 cents | 73 cents | 79 cents | 66 cents | 76 cents | 64 cents | 74 cents | ||||||||||||||||||||||||
Franked portion | 100 | % | 100 | % | 100 | % | 100 | % | 100 | % | 100 | % | 100 | % | 100 | % | ||||||||||||||||
Share price | ||||||||||||||||||||||||||||||||
- high | $ | 34.06 | $ | 32.09 | $ | 29.46 | $ | 25.12 | $ | 23.68 | $ | 24.49 | $ | 25.96 | $ | 26.23 | ||||||||||||||||
- low | $ | 28.84 | $ | 26.30 | $ | 23.42 | $ | 20.26 | $ | 18.60 | $ | 17.63 | $ | 22.05 | $ | 19.95 | ||||||||||||||||
- closing | $ | 33.06 | $ | 30.78 | $ | 28.53 | $ | 24.75 | $ | 23.26 | $ | 19.52 | $ | 23.81 | $ | 23.68 | ||||||||||||||||
|
|
|
|
|
|
|
|
|
|
|
|
|
|
|
| |||||||||||||||||
Share information | ||||||||||||||||||||||||||||||||
Earnings per share - basic (statutory) | 124.4c | 122.5c | 108.5c | 102.6c | 110.8c | 104.0c | 104.2c | 102.1c | ||||||||||||||||||||||||
Dividend payout ratio (statutory) | 67.4 | % | 75.1 | % | 68.3 | % | 78.5 | % | 60.8 | % | 74.6 | % | 62.5 | % | 73.7 | % | ||||||||||||||||
Net tangible assets per ordinary share | $ | 13.90 | $ | 13.48 | $ | 12.55 | $ | 12.22 | $ | 11.74 | $ | 11.44 | $ | 10.61 | $ | 10.38 | ||||||||||||||||
Number of fully paid ordinary shares (million) | 2,744.1 | 2,743.7 | 2,743.7 | 2,717.4 | 2,679.5 | 2,629.0 | 2,596.4 | 2,559.7 | ||||||||||||||||||||||||
|
|
|
|
|
|
|
|
|
|
|
|
|
|
|
| |||||||||||||||||
Other information | ||||||||||||||||||||||||||||||||
Total full time equivalent staff (FTE)2 | 48,857 | 48,865 | 48,871 | 50,357 | 51,744 | 52,378 | 51,650 | 50,552 | ||||||||||||||||||||||||
Number of shareholders | 486,596 | 468,343 | 451,621 | 438,958 | 439,811 | 442,943 | 424,787 | 411,692 | ||||||||||||||||||||||||
|
|
|
|
|
|
|
|
|
|
|
|
|
|
|
| |||||||||||||||||
| 1. | From 1 October 2012, the Group changed to reporting profit on a cash basis from reporting profit on an underlying profit basis. Consequently, certain comparative information was restated on a consistent basis. March 2011 to March 2014 balances reflect adjustments between cash profit and statutory profit. September 2010 balances reflect adjustments between underlying profit and statutory profit. |
| 2. | Comparative information has been restated to include technology contractors, consistent with the how FTE are reported and managed internally. |
132
SUPPLEMENTARY INFORMATION
Capital management
| Half Year | Movement | |||||||||||||||||||||||
| Mar 14 | Sep 13 | Mar 13 | Mar 14 | Mar 14 | ||||||||||||||||||||
| Qualifying Capital | $M | $M | $M | v. Sep 13 | v. Mar 13 | |||||||||||||||||||
Tier 1 | ||||||||||||||||||||||||
Shareholders’ equity and non-controlling interests | 47,038 | 45,603 | 42,503 | 3 | % | 11 | % | |||||||||||||||||
Prudential adjustments to shareholders’ equity | Table 1 | (1,071 | ) | (932 | ) | (958 | ) | 15 | % | 12 | % | |||||||||||||
|
|
|
|
|
|
|
|
|
| |||||||||||||||
Gross Common Equity Tier 1 capital | 45,967 | 44,671 | 41,545 | 3 | % | 11 | % | |||||||||||||||||
Deductions | Table 2 | (15,931 | ) | (15,892 | ) | (15,170 | ) | 0 | % | 5 | % | |||||||||||||
|
|
|
|
|
|
|
|
|
| |||||||||||||||
Common Equity Tier 1 capital | 30,036 | 28,779 | 26,375 | 4 | % | 14 | % | |||||||||||||||||
Additional Tier 1 capital | Table 3 | 7,279 | 6,401 | 5,365 | 14 | % | 36 | % | ||||||||||||||||
|
|
|
|
|
|
|
|
|
| |||||||||||||||
Tier 1 capital | 37,315 | 35,180 | 31,740 | 6 | % | 18 | % | |||||||||||||||||
|
|
|
|
|
|
|
|
|
| |||||||||||||||
Tier 2 capital | Table 4 | 6,335 | 6,190 | 6,062 | 2 | % | 5 | % | ||||||||||||||||
|
|
|
|
|
|
|
|
|
| |||||||||||||||
Total qualifying capital | 43,650 | 41,370 | 37,802 | 6 | % | 15 | % | |||||||||||||||||
|
|
|
|
|
|
|
|
|
| |||||||||||||||
Capital adequacy ratios | ||||||||||||||||||||||||
Common Equity Tier 1 | 8.3 | % | 8.5 | % | 8.2 | % | — | — | ||||||||||||||||
Tier 1 | 10.3 | % | 10.4 | % | 9.8 | % | — | — | ||||||||||||||||
Tier 2 | 1.8 | % | 1.8 | % | 1.9 | % | — | — | ||||||||||||||||
|
|
|
|
|
|
|
|
|
| |||||||||||||||
Total | 12.1 | % | 12.2 | % | 11.7 | % | — | — | ||||||||||||||||
|
|
|
|
|
|
|
|
|
| |||||||||||||||
Risk weighted assets | Table 5 | 360,740 | 339,265 | 322,582 | 6 | % | 12 | % | ||||||||||||||||
|
|
|
|
|
|
|
|
|
| |||||||||||||||
133
SUPPLEMENTARY INFORMATION
Capital management, cont’d
| Half Year | Movement | |||||||||||||||||||
| Mar 14 | Sep 13 | Mar 13 | Mar 14 | Mar 14 | ||||||||||||||||
| $M | $M | $M | v. Sep 13 | v. Mar 13 | ||||||||||||||||
Table 1: Prudential adjustments to shareholders’ equity | ||||||||||||||||||||
Treasury shares attributable to OnePath policy holders | 275 | 273 | 253 | 1 | % | 9 | % | |||||||||||||
Reclassification of preference share capital | (871 | ) | (871 | ) | (871 | ) | 0 | % | 0 | % | ||||||||||
Accumulated retained profits and reserves of insurance, funds management and securitisation entities | (727 | ) | (583 | ) | (573 | ) | 25 | % | 27 | % | ||||||||||
Deferred fee revenue including fees deferred as part of loan yields | 391 | 381 | 362 | 3 | % | 8 | % | |||||||||||||
Available-for-sale reserve attributable to deconsolidated subsidiaries | (81 | ) | (90 | ) | (105 | ) | -10 | % | -23 | % | ||||||||||
Other | (58 | ) | (42 | ) | (24 | ) | 38 | % | large | |||||||||||
|
|
|
|
|
|
|
|
|
| |||||||||||
Total | (1,071 | ) | (932 | ) | (958 | ) | 15 | % | 12 | % | ||||||||||
|
|
|
|
|
|
|
|
|
| |||||||||||
Table 2: Deductions from Common Equity Tier 1 capital | ||||||||||||||||||||
Unamortised goodwill & other intangibles (excluding OnePath Australia and New Zealand) | (4,126 | ) | (3,970 | ) | (3,717 | ) | 4 | % | 11 | % | ||||||||||
Intangible component of investments in OnePath Australia and New Zealand | (2,107 | ) | (2,096 | ) | (2,075 | ) | 1 | % | 2 | % | ||||||||||
Capitalised software | (2,252 | ) | (2,102 | ) | (1,800 | ) | 7 | % | 25 | % | ||||||||||
Capitalised expenses including loan and lease origination fees | (1,058 | ) | (979 | ) | (884 | ) | 8 | % | 20 | % | ||||||||||
Applicable deferred net tax assets | (934 | ) | (1,102 | ) | (990 | ) | -15 | % | -6 | % | ||||||||||
Expected losses in excess of eligible provisions | (129 | ) | (376 | ) | (526 | ) | -66 | % | -75 | % | ||||||||||
Investment in ANZ insurance and funds management subsidiaries | (428 | ) | (453 | ) | (684 | ) | -6 | % | -37 | % | ||||||||||
Investment in OnePath Australia and New Zealand | (984 | ) | (1,059 | ) | (1,042 | ) | -7 | % | -6 | % | ||||||||||
Investment in banking associates | (3,565 | ) | (3,361 | ) | (2,956 | ) | 6 | % | 21 | % | ||||||||||
Other deductions | (348 | ) | (394 | ) | (496 | ) | -12 | % | -30 | % | ||||||||||
|
|
|
|
|
|
|
|
|
| |||||||||||
Total | (15,931 | ) | (15,892 | ) | (15,170 | ) | 0 | % | 5 | % | ||||||||||
|
|
|
|
|
|
|
|
|
| |||||||||||
Table 3: Additional Tier 1 capital | ||||||||||||||||||||
Convertible Preference Shares | ||||||||||||||||||||
ANZ CPS1 | 454 | 1,081 | 1,080 | -58 | % | -58 | % | |||||||||||||
ANZ CPS2 | 1,965 | 1,963 | 1,961 | 0 | % | 0 | % | |||||||||||||
ANZ CPS3 | 1,331 | 1,329 | 1,327 | 0 | % | 0 | % | |||||||||||||
ANZ Capital Notes 1 | 1,107 | 1,106 | — | 0 | % | n/a | ||||||||||||||
ANZ Capital Notes 2 | 1,593 | — | — | n/a | n/a | |||||||||||||||
Preference Shares | 871 | 871 | 871 | 0 | % | 0 | % | |||||||||||||
Hybrid Securities | — | 812 | 740 | -100 | % | -100 | % | |||||||||||||
Regulatory adjustments and deductions | (42 | ) | (78 | ) | (17 | ) | -46 | % | large | |||||||||||
Transitional adjustments | — | (683 | ) | (597 | ) | -100 | % | -100 | % | |||||||||||
|
|
|
|
|
|
|
|
|
| |||||||||||
Total | 7,279 | 6,401 | 5,365 | 14 | % | 36 | % | |||||||||||||
|
|
|
|
|
|
|
|
|
| |||||||||||
Table 4: Tier 2 capital | ||||||||||||||||||||
General reserve for impairment of financial assets | 212 | 245 | 244 | -13 | % | -13 | % | |||||||||||||
Perpetual subordinated notes | 1,108 | 1,065 | 957 | 4 | % | 16 | % | |||||||||||||
Subordinated debt | 5,668 | 5,448 | 5,601 | 4 | % | 1 | % | |||||||||||||
Regulatory adjustments and deductions | (354 | ) | (340 | ) | (740 | ) | 4 | % | -52 | % | ||||||||||
Transitional adjustments | (299 | ) | (228 | ) | — | 31 | % | n/a | ||||||||||||
|
|
|
|
|
|
|
|
|
| |||||||||||
Total | 6,335 | 6,190 | 6,062 | 2 | % | 5 | % | |||||||||||||
|
|
|
|
|
|
|
|
|
| |||||||||||
134
SUPPLEMENTARY INFORMATION
| Half Year | Movement | |||||||||||||||||||
| Mar 14 | Sep 13 | Mar 13 | Mar 14 | Mar 14 | ||||||||||||||||
| $M | $M | $M | v. Sep 13 | v. Mar 13 | ||||||||||||||||
Table 5: Risk weighted assets | ||||||||||||||||||||
On balance sheet | 217,606 | 208,326 | 199,121 | 4 | % | 9 | % | |||||||||||||
Commitments | 53,777 | 47,809 | 45,250 | 12 | % | 19 | % | |||||||||||||
Contingents | 12,903 | 11,184 | 10,174 | 15 | % | 27 | % | |||||||||||||
Derivatives | 21,042 | 20,332 | 20,433 | 3 | % | 3 | % | |||||||||||||
|
|
|
|
|
|
|
|
|
| |||||||||||
Total credit risk | 305,328 | 287,651 | 274,978 | 6 | % | 11 | % | |||||||||||||
Market risk - Traded | 7,104 | 4,303 | 6,850 | 65 | % | 4 | % | |||||||||||||
Market risk - IRRBB | 16,359 | 18,287 | 12,629 | -11 | % | 30 | % | |||||||||||||
Operational risk | 31,949 | 29,024 | 28,125 | 10 | % | 14 | % | |||||||||||||
|
|
|
|
|
|
|
|
|
| |||||||||||
Total risk weighted assets | 360,740 | 339,265 | 322,582 | 6 | % | 12 | % | |||||||||||||
|
|
|
|
|
|
|
|
|
| |||||||||||
| Half Year | Movement | |||||||||||||||||||
| Mar 14 | Sep 13 | Mar 13 | Mar 14 | Mar 14 | ||||||||||||||||
| $M | $M | $M | v. Sep 13 | v. Mar 13 | ||||||||||||||||
Table 6: Credit risk weighted assets by Basel asset class | ||||||||||||||||||||
Subject to Advanced IRB approach | ||||||||||||||||||||
Corporate | 123,743 | 121,586 | 114,700 | 2 | % | 8 | % | |||||||||||||
Sovereign | 4,545 | 4,360 | 4,382 | 4 | % | 4 | % | |||||||||||||
Bank | 20,269 | 16,270 | 15,838 | 25 | % | 28 | % | |||||||||||||
Residential mortgage | 50,426 | 47,559 | 44,597 | 6 | % | 13 | % | |||||||||||||
Qualifying revolving retail (credit cards) | 7,260 | 7,219 | 7,234 | 1 | % | 0 | % | |||||||||||||
Other retail | 26,416 | 24,328 | 23,200 | 9 | % | 14 | % | |||||||||||||
|
|
|
|
|
|
|
|
|
| |||||||||||
Credit risk weighted assets subject to Advanced IRB approach | 232,659 | 221,322 | 209,951 | 5 | % | 11 | % | |||||||||||||
|
|
|
|
|
|
|
|
|
| |||||||||||
Credit risk specialised lending exposures subject to slotting criteria | 28,522 | 27,640 | 27,842 | 3 | % | 2 | % | |||||||||||||
|
|
|
|
|
|
|
|
|
| |||||||||||
Subject to Standardised approach | ||||||||||||||||||||
Corporate | 26,255 | 19,285 | 17,157 | 36 | % | 53 | % | |||||||||||||
Residential mortgage | 1,966 | 1,922 | 1,827 | 2 | % | 8 | % | |||||||||||||
Qualifying revolving retail (credit cards) | 1,796 | 1,728 | 2,068 | 4 | % | -13 | % | |||||||||||||
Other retail | 1,073 | 985 | 1,248 | 9 | % | -14 | % | |||||||||||||
|
|
|
|
|
|
|
|
|
| |||||||||||
Credit risk weighted assets subject to Standardised approach | 31,090 | 23,920 | 22,300 | 30 | % | 39 | % | |||||||||||||
|
|
|
|
|
|
|
|
|
| |||||||||||
Credit Valuation Adjustment and Qualifying Central Counterparties | 8,065 | 8,501 | 8,949 | -5 | % | -10 | % | |||||||||||||
|
|
|
|
|
|
|
|
|
| |||||||||||
Credit risk weighted assets relating to securitisation exposures | 1,253 | 2,724 | 2,549 | -54 | % | -51 | % | |||||||||||||
Other assets | 3,739 | 3,544 | 3,387 | 6 | % | 10 | % | |||||||||||||
|
|
|
|
|
|
|
|
|
| |||||||||||
Total credit risk weighted assets | 305,328 | 287,651 | 274,978 | 6 | % | 11 | % | |||||||||||||
|
|
|
|
|
|
|
|
|
| |||||||||||
135
SUPPLEMENTARY INFORMATION
Capital management, cont’d
| Collective Provision | Regulatory Expected Loss | |||||||||||||||
| As at ($M) | As at ($M) | |||||||||||||||
| Mar 14 | Sep 13 | Mar 14 | Sep 13 | |||||||||||||
Table 7: Collective provision and regulatory expected loss by division | ||||||||||||||||
Australia | 1,152 | 1,123 | 2,481 | 2,393 | ||||||||||||
International and Institutional Banking | 1,265 | 1,310 | 1,570 | 1,046 | ||||||||||||
New Zealand | 372 | 399 | 784 | 763 | ||||||||||||
Global Wealth | 11 | 12 | 14 | 21 | ||||||||||||
Other | 43 | 43 | — | 19 | ||||||||||||
|
|
|
|
|
|
|
| |||||||||
Collective provision and regulatory expected loss | 2,843 | 2,887 | 4,849 | 4,242 | ||||||||||||
|
|
|
|
|
|
|
| |||||||||
| As at ($M) | Movement | |||||||||||||||||||
| Mar 14 | Sep 13 | Mar 13 | Mar 14 | Mar 14 | ||||||||||||||||
| $M | $M | $M | v. Sep 13 | v. Mar 13 | ||||||||||||||||
Table 8: Expected loss in excess of eligible provisions | ||||||||||||||||||||
Basel expected loss | ||||||||||||||||||||
Defaulted | 2,373 | 1,854 | 1,976 | 28 | % | 20 | % | |||||||||||||
Non-defaulted | 2,476 | 2,388 | 2,349 | 4 | % | 5 | % | |||||||||||||
|
|
|
|
|
|
|
|
|
| |||||||||||
| 4,849 | 4,242 | 4,325 | 14 | % | 12 | % | ||||||||||||||
Less: Qualifying collective provision | ||||||||||||||||||||
Collective provision | (2,843 | ) | (2,887 | ) | (2,769 | ) | -2 | % | 3 | % | ||||||||||
Non-qualifying collective provision | 300 | 346 | 341 | -13 | % | -12 | % | |||||||||||||
Standardised collective provision | 212 | 245 | 245 | -13 | % | -13 | % | |||||||||||||
|
|
|
|
|
|
|
|
|
| |||||||||||
| (2,331 | ) | (2,296 | ) | (2,183 | ) | 2 | % | 7 | % | |||||||||||
Less: Qualifying individual provision | ||||||||||||||||||||
Individual provision | (1,470 | ) | (1,467 | ) | (1,543 | ) | 0 | % | -5 | % | ||||||||||
Additional individual provision for partial write offs1 | (797 | ) | ||||||||||||||||||
Standardised individual provision | 153 | 219 | 249 | -30 | % | -39 | % | |||||||||||||
Collective provision on advanced defaulted | (275 | ) | (322 | ) | (322 | ) | -15 | % | -15 | % | ||||||||||
|
|
|
|
|
|
|
|
|
| |||||||||||
| (2,389 | ) | (1,570 | ) | (1,616 | ) | 52 | % | 48 | % | |||||||||||
|
|
|
|
|
|
|
|
|
| |||||||||||
Gross deduction | 129 | 376 | 526 | -66 | % | -75 | % | |||||||||||||
|
|
|
|
|
|
|
|
|
| |||||||||||
| 1. | Included in eligible provisions post September 2013 due to a change in RWA calculation methodology. |
136
SUPPLEMENTARY INFORMATION
Capital management, cont’d
Table 9: APRA Basel 3 Common Equity Tier 1
| Half Year | ||||
| Mar 14 vs Sep 13 | ||||
APRA Basel 3 Common Equity Tier 1 | ||||
Cash profit after preference share dividends | +104bps($3.5B | ) | ||
Risk weighted assets | ||||
Portfolio growth and mix | -29bps | |||
Risk migration and Expected Losses in excess of Eligible Provisions | +4bps | |||
Non-credit risk | -2bps | |||
Capital retention in insurance businesses and associates | -9bps | |||
Capitalised software and intangibles | -7bps | |||
Other items | -2bps | |||
|
| |||
Organic Capital Generation | +59bps | |||
|
| |||
Ordinary share dividends | -74bps | |||
|
| |||
Other | 0bps | |||
|
| |||
Total Common Equity Tier 1 movement | -15bps | |||
|
| |||
March 2014 APRA Basel 3 Common Equity Tier 1 ratio | 8.3 | % | ||
|
| |||
137
SUPPLEMENTARY INFORMATION
Average balance sheet and related interest
Averages used in the following tables are predominantly daily averages. Interest income figures are presented on a tax-equivalent basis. Impaired loans are included under the interest earning asset category, ��loans and advances’. Intra-group interest earning assets and interest bearing liabilities are treated as external assets and liabilities for the geographic segments. During the period the classification of the balance sheet has been amended to more consistently reflect the nature of the financial assets and liabilities. As a result, average balance and related interest comparative information has changed accordingly. Refer to Note 21 of the Condensed Consolidated Financial Statements for further information.
| Half year Mar 14 | Half year Sep 13 | Half year Mar 13 | ||||||||||||||||||||||||||||||||||
| Ave bal | Int | Rate | Ave bal | Int | Rate | Ave bal | Int | Rate | ||||||||||||||||||||||||||||
| $M | $M | % | $M | $M | % | $M | $M | % | ||||||||||||||||||||||||||||
Interest earning assets | ||||||||||||||||||||||||||||||||||||
Settlement Balances owed to ANZ | ||||||||||||||||||||||||||||||||||||
Australia | 990 | 14 | 2.8 | % | 948 | 12 | 2.5 | % | 632 | 12 | 3.8 | % | ||||||||||||||||||||||||
Asia Pacific, Europe & America | 12,186 | 7 | 0.1 | % | 11,096 | 6 | 0.1 | % | 10,688 | 5 | 0.1 | % | ||||||||||||||||||||||||
New Zealand | 53 | 1 | 3.8 | % | 55 | 1 | 3.6 | % | 88 | 1 | 2.3 | % | ||||||||||||||||||||||||
Collateral Paid | ||||||||||||||||||||||||||||||||||||
Australia | 1,296 | 19 | 2.9 | % | 1,495 | 23 | 3.1 | % | 769 | 16 | 4.2 | % | ||||||||||||||||||||||||
Asia Pacific, Europe & America | 1,291 | 1 | 0.2 | % | 1,835 | 2 | 0.2 | % | 4,731 | 2 | 0.1 | % | ||||||||||||||||||||||||
New Zealand | 723 | 1 | 0.2 | % | 676 | 1 | 0.3 | % | 978 | 1 | 0.2 | % | ||||||||||||||||||||||||
Regulatory Deposits | ||||||||||||||||||||||||||||||||||||
Asia Pacific, Europe & America | 1,225 | 5 | 0.8 | % | 1,089 | 4 | 0.7 | % | 939 | 3 | 0.7 | % | ||||||||||||||||||||||||
Trading and available-for-sale assets | ||||||||||||||||||||||||||||||||||||
Australia | 42,539 | 650 | 3.1 | % | 38,938 | 629 | 3.2 | % | 36,511 | 605 | 3.3 | % | ||||||||||||||||||||||||
Asia Pacific, Europe & America | 20,443 | 156 | 1.5 | % | 18,661 | 132 | 1.4 | % | 15,270 | 124 | 1.6 | % | ||||||||||||||||||||||||
New Zealand | 11,633 | 223 | 3.8 | % | 10,127 | 177 | 3.5 | % | 9,971 | 183 | 3.7 | % | ||||||||||||||||||||||||
Loans and advances | ||||||||||||||||||||||||||||||||||||
Australia | 332,847 | 9,249 | 5.6 | % | 321,973 | 9,490 | 5.9 | % | 313,425 | 9,856 | 6.3 | % | ||||||||||||||||||||||||
Asia Pacific, Europe & America | 76,408 | 1,126 | 3.0 | % | 68,669 | 1,058 | 3.1 | % | 57,664 | 965 | 3.4 | % | ||||||||||||||||||||||||
New Zealand | 93,349 | 2,674 | 5.7 | % | 84,834 | 2,496 | 5.9 | % | 78,413 | 2,338 | 6.0 | % | ||||||||||||||||||||||||
Cash | ||||||||||||||||||||||||||||||||||||
Australia | 14,392 | 165 | 2.3 | % | 10,389 | 141 | 2.7 | % | 7,491 | 107 | 2.9 | % | ||||||||||||||||||||||||
Asia Pacific, Europe & America | 20,512 | 41 | 0.4 | % | 22,569 | 33 | 0.3 | % | 16,496 | 24 | 0.3 | % | ||||||||||||||||||||||||
New Zealand | 2,438 | 31 | 2.6 | % | 2,597 | 30 | 2.3 | % | 2,224 | 27 | 2.4 | % | ||||||||||||||||||||||||
Other assets | ||||||||||||||||||||||||||||||||||||
Australia | 67 | 9 | n/a | 41 | 14 | n/a | (28 | ) | 1 | n/a | ||||||||||||||||||||||||||
Asia Pacific, Europe & America | 8 | 20 | n/a | 6 | 28 | n/a | 2 | 32 | n/a | |||||||||||||||||||||||||||
New Zealand | — | 38 | n/a | — | 24 | n/a | — | 24 | n/a | |||||||||||||||||||||||||||
Intragroup assets | ||||||||||||||||||||||||||||||||||||
Australia | 3,067 | 200 | n/a | 3,199 | 216 | n/a | 1,907 | 217 | n/a | |||||||||||||||||||||||||||
Asia Pacific, Europe & America | 8,520 | 1 | n/a | 7,527 | (11 | ) | n/a | 8,718 | 1 | n/a | ||||||||||||||||||||||||||
|
|
|
|
|
|
|
|
|
|
|
|
|
|
|
|
|
| |||||||||||||||||||
| 643,987 | 14,631 | 606,724 | 14,506 | 566,889 | 14,544 | |||||||||||||||||||||||||||||||
Intragroup elimination | (11,587 | ) | (201 | ) | (10,726 | ) | (205 | ) | (10,625 | ) | (218 | ) | ||||||||||||||||||||||||
|
|
|
|
|
|
|
|
|
|
|
|
|
|
|
|
|
| |||||||||||||||||||
| 632,400 | 14,430 | 4.6 | % | 595,998 | 14,301 | 4.8 | % | 556,264 | 14,326 | 5.2 | % | |||||||||||||||||||||||||
Non-interest earning assets | ||||||||||||||||||||||||||||||||||||
Derivatives | ||||||||||||||||||||||||||||||||||||
Australia | 29,916 | 33,718 | 32,979 | |||||||||||||||||||||||||||||||||
Asia Pacific, Europe & America | 6,972 | 4,488 | 5,193 | |||||||||||||||||||||||||||||||||
New Zealand | 6,063 | 6,809 | 6,758 | |||||||||||||||||||||||||||||||||
Premises and equipment | 2,143 | 2,102 | 2,082 | |||||||||||||||||||||||||||||||||
Insurance assets | 32,765 | 31,460 | 30,216 | |||||||||||||||||||||||||||||||||
Other assets | 28,626 | 25,803 | 25,463 | |||||||||||||||||||||||||||||||||
Provisions for credit impairment | ||||||||||||||||||||||||||||||||||||
Australia | (2,812 | ) | (2,762 | ) | (2,846 | ) | ||||||||||||||||||||||||||||||
Asia Pacific, Europe & America | (743 | ) | (834 | ) | (767 | ) | ||||||||||||||||||||||||||||||
New Zealand | (787 | ) | (789 | ) | (843 | ) | ||||||||||||||||||||||||||||||
|
|
|
|
|
|
|
|
|
|
|
|
|
|
|
|
|
| |||||||||||||||||||
| 102,143 | 99,995 | 98,235 | ||||||||||||||||||||||||||||||||||
|
|
|
|
|
|
|
|
|
|
|
|
|
|
|
|
|
| |||||||||||||||||||
Total average assets | 734,543 | 695,993 | 654,499 | |||||||||||||||||||||||||||||||||
|
|
|
|
|
|
|
|
|
|
|
|
|
|
|
|
|
| |||||||||||||||||||
| 1. | Gross loans and advances including unearned income, capitalised brokerage/mortgage origination fees and customers’ liabilities for acceptances. |
138
SUPPLEMENTARY INFORMATION
| Half year Mar 14 | Half year Sep 13 | Half year Mar 13 | ||||||||||||||||||||||||||||||||||
| Ave bal | Int | Rate | Ave bal | Int | Rate | Ave bal | Int | Rate | ||||||||||||||||||||||||||||
| $M | $M | % | $M | $M | % | $M | $M | % | ||||||||||||||||||||||||||||
Interest bearing liabilities | ||||||||||||||||||||||||||||||||||||
Time deposits | ||||||||||||||||||||||||||||||||||||
Australia | 136,155 | 2,255 | 3.3 | % | 136,595 | 2,509 | 3.7 | % | 134,894 | 2,803 | 4.2 | % | ||||||||||||||||||||||||
Asia Pacific, Europe & America | 82,570 | 348 | 0.8 | % | 79,280 | 333 | 0.8 | % | 70,817 | 333 | 0.9 | % | ||||||||||||||||||||||||
New Zealand | 32,929 | 623 | 3.8 | % | 30,606 | 590 | 3.8 | % | 28,654 | 569 | 4.0 | % | ||||||||||||||||||||||||
Savings deposits | ||||||||||||||||||||||||||||||||||||
Australia | 26,782 | 423 | 3.2 | % | 24,765 | 414 | 3.3 | % | 23,564 | 424 | 3.6 | % | ||||||||||||||||||||||||
Asia Pacific, Europe & America | 4,996 | 11 | 0.4 | % | 5,582 | 13 | 0.5 | % | 4,968 | 12 | 0.5 | % | ||||||||||||||||||||||||
New Zealand | 9,184 | 143 | 3.1 | % | 7,840 | 127 | 3.2 | % | 6,225 | 106 | 3.4 | % | ||||||||||||||||||||||||
Other demand deposits | ||||||||||||||||||||||||||||||||||||
Australia | 97,221 | 1,198 | 2.5 | % | 87,438 | 1,180 | 2.7 | % | 83,134 | 1,217 | 2.9 | % | ||||||||||||||||||||||||
Asia Pacific, Europe & America | 13,152 | 21 | 0.3 | % | 11,397 | 17 | 0.3 | % | 10,432 | 16 | 0.3 | % | ||||||||||||||||||||||||
New Zealand | 19,023 | 220 | 2.3 | % | 17,113 | 203 | 2.4 | % | 15,683 | 195 | 2.5 | % | ||||||||||||||||||||||||
Deposits from banks | ||||||||||||||||||||||||||||||||||||
Australia | 15,578 | 199 | 2.6 | % | 9,160 | 132 | 2.9 | % | 6,473 | 102 | 3.2 | % | ||||||||||||||||||||||||
Asia Pacific, Europe & America | 28,228 | 62 | 0.4 | % | 24,075 | 75 | 0.6 | % | 21,593 | 78 | 0.7 | % | ||||||||||||||||||||||||
New Zealand | 516 | 6 | 2.3 | % | 535 | 6 | 2.2 | % | 668 | 8 | 2.4 | % | ||||||||||||||||||||||||
Settlement Balances owed by ANZ | ||||||||||||||||||||||||||||||||||||
Australia | 1,660 | 10 | 1.2 | % | 1,397 | 10 | 1.4 | % | 1,705 | 12 | 1.4 | % | ||||||||||||||||||||||||
Asia Pacific, Europe & America | 355 | — | 0.0 | % | 1,084 | — | 0.0 | % | 875 | — | 0.0 | % | ||||||||||||||||||||||||
New Zealand | 306 | 2 | 1.3 | % | 375 | 3 | 1.6 | % | 341 | 3 | 1.8 | % | ||||||||||||||||||||||||
Collateral Received (IEB) | ||||||||||||||||||||||||||||||||||||
Australia | 616 | 6 | 2.0 | % | 798 | 11 | 2.7 | % | 815 | 12 | 3.0 | % | ||||||||||||||||||||||||
Asia Pacific, Europe & America | 1,357 | 3 | 0.4 | % | 1,091 | 3 | 0.5 | % | 1,755 | 3 | 0.3 | % | ||||||||||||||||||||||||
New Zealand | 532 | 1 | 0.4 | % | 571 | 1 | 0.3 | % | 271 | 1 | 0.7 | % | ||||||||||||||||||||||||
Commercial paper | ||||||||||||||||||||||||||||||||||||
Australia | 8,914 | 115 | 2.6 | % | 12,200 | 172 | 2.8 | % | 8,400 | 139 | 3.3 | % | ||||||||||||||||||||||||
Asia Pacific, Europe & America | 805 | 2 | 0.5 | % | — | — | 0.0 | % | — | — | 0.0 | % | ||||||||||||||||||||||||
New Zealand | 5,553 | 80 | 2.9 | % | 4,030 | 61 | 3.0 | % | 4,395 | 67 | 3.1 | % | ||||||||||||||||||||||||
Borrowing corporations’ debt | ||||||||||||||||||||||||||||||||||||
Australia | 6 | — | 4.3 | % | 46 | 2 | 8.7 | % | 81 | 3 | 7.4 | % | ||||||||||||||||||||||||
New Zealand | 1,399 | 30 | 4.3 | % | 1,264 | 28 | 4.4 | % | 1,165 | 27 | 4.6 | % | ||||||||||||||||||||||||
Loan capital, bonds and notes | ||||||||||||||||||||||||||||||||||||
Australia | 65,426 | 1,350 | 4.1 | % | 64,618 | 1,375 | 4.2 | % | 64,881 | 1,497 | 4.6 | % | ||||||||||||||||||||||||
Asia Pacific, Europe & America | 4,742 | 29 | 1.2 | % | 3,331 | 20 | 1.2 | % | 1,142 | 11 | 1.9 | % | ||||||||||||||||||||||||
New Zealand | 14,298 | 323 | 4.5 | % | 13,985 | 322 | 4.6 | % | 13,692 | 332 | 4.9 | % | ||||||||||||||||||||||||
Other liabilities | ||||||||||||||||||||||||||||||||||||
Australia | 2,737 | 81 | n/a | 3,593 | 69 | n/a | 2,383 | 125 | n/a | |||||||||||||||||||||||||||
Asia Pacific, Europe & America | 2,195 | 25 | n/a | 2,099 | 21 | n/a | 1,832 | 21 | n/a | |||||||||||||||||||||||||||
New Zealand | 398 | 86 | n/a | 424 | 46 | n/a | 530 | 10 | n/a | |||||||||||||||||||||||||||
Intragroup liabilities | ||||||||||||||||||||||||||||||||||||
New Zealand | 11,587 | 201 | n/a | 10,726 | 205 | n/a | 10,625 | 218 | n/a | |||||||||||||||||||||||||||
|
|
|
|
|
|
|
|
|
|
|
|
|
|
|
|
|
| |||||||||||||||||||
| 589,220 | 7,853 | 556,018 | 7,948 | 521,993 | 8,344 | |||||||||||||||||||||||||||||||
Intragroup elimination | (11,587 | ) | (201 | ) | (10,726 | ) | (205 | ) | (10,625 | ) | (218 | ) | ||||||||||||||||||||||||
|
|
|
|
|
|
|
|
|
|
|
|
|
|
|
|
|
| |||||||||||||||||||
| 577,633 | 7,652 | 2.7 | % | 545,292 | 7,743 | 2.8 | % | 511,368 | 8,126 | 3.2 | % | |||||||||||||||||||||||||
Non-interest bearing liabilities | ||||||||||||||||||||||||||||||||||||
Deposits | ||||||||||||||||||||||||||||||||||||
Australia | 6,134 | 5,605 | 5,416 | |||||||||||||||||||||||||||||||||
Asia Pacific, Europe & America | 3,893 | 3,630 | 2,771 | |||||||||||||||||||||||||||||||||
New Zealand | 5,186 | 4,615 | 4,143 | |||||||||||||||||||||||||||||||||
Derivatives | ||||||||||||||||||||||||||||||||||||
Australia | 31,811 | 31,469 | 29,418 | |||||||||||||||||||||||||||||||||
Asia Pacific, Europe & America | 6,676 | 4,904 | 5,550 | |||||||||||||||||||||||||||||||||
New Zealand | 6,235 | 6,968 | 6,723 | |||||||||||||||||||||||||||||||||
Insurance Liabilities | 32,894 | 31,355 | 29,891 | |||||||||||||||||||||||||||||||||
External unit holder liabilities | 3,510 | 3,729 | 3,949 | |||||||||||||||||||||||||||||||||
Other liabilities | 14,392 | 14,004 | 13,521 | |||||||||||||||||||||||||||||||||
|
|
|
|
|
|
|
|
|
|
|
|
|
|
|
|
|
| |||||||||||||||||||
| 110,731 | 106,279 | 101,382 | ||||||||||||||||||||||||||||||||||
|
|
|
|
|
|
|
|
|
|
|
|
|
|
|
|
|
| |||||||||||||||||||
Total average liabilities | 688,364 | 651,571 | 612,750 | |||||||||||||||||||||||||||||||||
|
|
|
|
|
|
|
|
|
|
|
|
|
|
|
|
|
| |||||||||||||||||||
139
SUPPLEMENTARY INFORMATION
| Half Year | ||||||||||||
| Mar 14 | Sep 13 | Mar 13 | ||||||||||
| $M | $M | $M | ||||||||||
Total average assets | ||||||||||||
Australia | 469,557 | 453,442 | 434,621 | |||||||||
Asia Pacific, Europe & America | 157,899 | 144,489 | 128,340 | |||||||||
New Zealand | 118,674 | 108,788 | 102,163 | |||||||||
less intragroup elimination | (11,587 | ) | (10,726 | ) | (10,625 | ) | ||||||
|
|
|
|
|
| |||||||
| 734,543 | 695,993 | 654,499 | ||||||||||
|
|
|
|
|
| |||||||
% of total average assets attributable to overseas activities | 36.5 | % | 35.3 | % | 33.9 | % | ||||||
|
|
|
|
|
| |||||||
Average interest earning assets | ||||||||||||
Australia | 395,198 | 376,983 | 360,707 | |||||||||
Asia Pacific, Europe & America | 140,593 | 131,452 | 114,508 | |||||||||
New Zealand | 108,196 | 98,289 | 91,674 | |||||||||
less intragroup elimination | (11,587 | ) | (10,726 | ) | (10,625 | ) | ||||||
|
|
|
|
|
| |||||||
| 632,400 | 595,998 | 556,264 | ||||||||||
|
|
|
|
|
| |||||||
Total average liabilities | ||||||||||||
Australia | 439,399 | 423,165 | 404,874 | |||||||||
Asia Pacific, Europe & America | 151,984 | 138,553 | 123,914 | |||||||||
New Zealand | 108,568 | 100,579 | 94,587 | |||||||||
less intragroup elimination | (11,587 | ) | (10,726 | ) | (10,625 | ) | ||||||
|
|
|
|
|
| |||||||
| 688,364 | 651,571 | 612,750 | ||||||||||
|
|
|
|
|
| |||||||
% of total average liabilities attributable to overseas activities | 36.2 | % | 35.1 | % | 33.9 | % | ||||||
|
|
|
|
|
| |||||||
Average interest bearing liabilities | ||||||||||||
Australia | 355,095 | 340,610 | 326,330 | |||||||||
Asia Pacific, Europe & America | 138,400 | 127,939 | 113,414 | |||||||||
New Zealand | 95,725 | 87,469 | 82,249 | |||||||||
less intragroup elimination | (11,587 | ) | (10,726 | ) | (10,625 | ) | ||||||
|
|
|
|
|
| |||||||
| 577,633 | 545,292 | 511,368 | ||||||||||
|
|
|
|
|
| |||||||
Total average shareholders’ equity | ||||||||||||
Ordinary share capital, reserves and retained earnings1 | 45,308 | 43,551 | 40,878 | |||||||||
Preference share capital | 871 | 871 | 871 | |||||||||
|
|
|
|
|
| |||||||
| 46,179 | 44,422 | 41,749 | ||||||||||
|
|
|
|
|
| |||||||
Total average liabilities and shareholders’ equity | 734,543 | 695,993 | 654,499 | |||||||||
|
|
|
|
|
| |||||||
| 1. | Average shareholders’ equity includes Global Wealth shares that are eliminated from the closing shareholders’ equity balance of $275 million for Mar 14 (Sep 13: $273 million; Mar 13: $253 million). |
140
SUPPLEMENTARY INFORMATION
| Half Year | ||||||||||||
| Mar 14 | Sep 13 | Mar 13 | ||||||||||
| % | % | % | ||||||||||
Gross earnings rate1 | ||||||||||||
Australia | 5.23 | 5.57 | 6.01 | |||||||||
Asia Pacific, Europe & America | 1.91 | 1.90 | 2.03 | |||||||||
New Zealand | 5.50 | 5.54 | 5.63 | |||||||||
Group | 4.58 | 4.79 | 5.17 | |||||||||
|
|
|
|
|
| |||||||
| Interest spread and net interest average margin may be analysed as follows: | ||||||||||||
Australia | ||||||||||||
Net interest spread | 2.05 | 2.13 | 2.12 | |||||||||
Interest attributable to net non-interest bearing items | 0.32 | 0.33 | 0.37 | |||||||||
|
|
|
|
|
| |||||||
Net interest margin - Australia2 | 2.37 | 2.46 | 2.49 | |||||||||
|
|
|
|
|
| |||||||
Asia Pacific, Europe & America | ||||||||||||
Net interest spread | 1.18 | 1.14 | 1.19 | |||||||||
Interest attributable to net non-interest bearing items | 0.02 | 0.02 | 0.01 | |||||||||
|
|
|
|
|
| |||||||
Net interest margin - Asia Pacific, Europe & America2 | 1.20 | 1.16 | 1.20 | |||||||||
|
|
|
|
|
| |||||||
New Zealand | ||||||||||||
Net interest spread | 1.90 | 1.91 | 1.89 | |||||||||
Interest attributable to net non-interest bearing items | 0.42 | 0.40 | 0.38 | |||||||||
|
|
|
|
|
| |||||||
Net interest margin - New Zealand2 | 2.32 | 2.31 | 2.27 | |||||||||
|
|
|
|
|
| |||||||
Group | ||||||||||||
Net interest spread | 1.92 | 1.95 | 1.98 | |||||||||
Interest attributable to net non-interest bearing items | 0.23 | 0.25 | 0.26 | |||||||||
|
|
|
|
|
| |||||||
Net interest margin2 | 2.15 | 2.20 | 2.24 | |||||||||
|
|
|
|
|
| |||||||
Net interest margin (excluding global markets) | 2.54 | 2.61 | 2.65 | |||||||||
|
|
|
|
|
| |||||||
| 1. | Average interest rate received on average interest earning assets. |
| 2. | Statutory basis. |
141
SUPPLEMENTARY INFORMATION
Full Time Equivalent Staff1
At 31 March 2014, ANZ employed 48,857 people worldwide (30 September 2013: 48,865) on a full-time equivalent basis (“FTEs”).
| Division | As at | Movement | ||||||||||||||||||
| Mar 14 | Sep 13 | Mar 13 | Mar 14 v. Sep 13 | Mar 14 v. Mar 13 | ||||||||||||||||
Australia | 14,735 | 14,623 | 14,551 | 1 | % | 1 | % | |||||||||||||
International and Institutional Banking | 13,040 | 13,196 | 13,312 | -1 | % | -2 | % | |||||||||||||
New Zealand | 7,323 | 7,400 | 7,755 | -1 | % | -6 | % | |||||||||||||
Global Wealth | 4,090 | 4,271 | 4,176 | -4 | % | -2 | % | |||||||||||||
GTSO and Group Centre | 9,669 | 9,375 | 9,077 | 3 | % | 7 | % | |||||||||||||
|
|
|
|
|
|
|
|
|
| |||||||||||
Totals | 48,857 | 48,865 | 48,871 | 0 | % | 0 | % | |||||||||||||
|
|
|
|
|
|
|
|
|
| |||||||||||
| Geography | As at | Movement | ||||||||||||||||||
| Mar 14 | Sep 13 | Mar 13 | Mar 14 v. Sep 13 | Mar 14 v. Mar 13 | ||||||||||||||||
Australia | 21,353 | 21,757 | 22,096 | -2 | % | -3 | % | |||||||||||||
Asia Pacific, Europe & America | 19,247 | 18,824 | 18,119 | 2 | % | 6 | % | |||||||||||||
New Zealand | 8,257 | 8,284 | 8,656 | 0 | % | -5 | % | |||||||||||||
|
|
|
|
|
|
|
|
|
| |||||||||||
Totals | 48,857 | 48,865 | 48,871 | 0 | % | 0 | % | |||||||||||||
|
|
|
|
|
|
|
|
|
| |||||||||||
| 1. | Comparative information has been restated to include technology contractors, consistent with how FTE are reported and managed internally. |
Exchange rates
Major exchange rates used in translation of results of offshore controlled entities and branches and investments in associates were as follows:
| Balance sheet | Profit & Loss Average | |||||||||||||||||||||||
| As at | Half Year | |||||||||||||||||||||||
| Mar 14 | Sep 13 | Mar 13 | Mar 14 | Sep 13 | Mar 13 | |||||||||||||||||||
Chinese Yuan | 5.7480 | 5.6976 | 6.4793 | 5.5544 | 5.8062 | 6.4746 | ||||||||||||||||||
Euro | 0.6716 | 0.6896 | 0.8152 | 0.6672 | 0.7193 | 0.7938 | ||||||||||||||||||
Great British Pound | 0.5552 | 0.5760 | 0.6886 | 0.5565 | 0.6148 | 0.6574 | ||||||||||||||||||
Indian Rupee | 55.296 | 58.531 | 56.738 | 56.400 | 56.056 | 56.240 | ||||||||||||||||||
Indonesian Rupiah | 10,488.7 | 10,860.1 | 10,127.4 | 10,719.3 | 9,689.6 | 10,034.1 | ||||||||||||||||||
Malaysian Ringgit | 3.0169 | 3.0334 | 3.2351 | 2.9644 | 2.9978 | 3.1876 | ||||||||||||||||||
New Zealand Dollar | 1.0668 | 1.1237 | 1.2469 | 1.0959 | 1.1733 | 1.2533 | ||||||||||||||||||
Papua New Guinea Kina | 2.2356 | 2.2385 | 2.2297 | 2.2054 | 2.1095 | 2.1850 | ||||||||||||||||||
United States Dollar | 0.9233 | 0.9312 | 1.0424 | 0.9113 | 0.9474 | 1.0387 | ||||||||||||||||||
142
SUPPLEMENTARY INFORMATION
Derivative financial instruments
Derivatives
Derivative instruments are contracts whose value is derived from one or more underlying financial instruments or indices. They include swaps, forward rate contracts, futures, options and combinations of these instruments. The use of derivatives and their sale to customers as risk management products is an integral part of the Group’s trading activities. Derivatives are also used to manage the Group’s own exposure to fluctuations in foreign exchange and interest rates as part of its asset and liability management activities. Derivatives are subject to the same types of credit and market risk as other financial instruments and the Group manages these risks in a consistent manner.
The following table provides an overview of the Group’s exchange rate, interest rate, commodity and credit derivatives. It includes all contracts, both trading and hedging.
Notional principal amount is the face value of the contract and represents the volume of outstanding transactions. Fair value is the net position of contracts with positive market values and negative market values.
| As at 31 March 2014 | As at 30 September 2013 | |||||||||||||||||||||||
| Notional | Total fair value | Notional | Total fair value | |||||||||||||||||||||
| Principal | Principal | |||||||||||||||||||||||
| amount | Assets | Liabilities | amount | Assets | Liabilities | |||||||||||||||||||
| $M | $M | $M | $M | $M | $M | |||||||||||||||||||
Foreign exchange contracts | ||||||||||||||||||||||||
Spot and forward contracts | 542,709 | 7,001 | (7,408 | ) | 463,606 | 7,593 | (7,539 | ) | ||||||||||||||||
Swap agreements | 393,063 | 11,159 | (14,100 | ) | 377,385 | 10,352 | (12,692 | ) | ||||||||||||||||
Futures contracts | 1,401 | 105 | (67 | ) | 546 | 22 | (23 | ) | ||||||||||||||||
Options purchased | 92,030 | 2,017 | — | 65,991 | 1,376 | — | ||||||||||||||||||
Options sold | 129,306 | — | (1,812 | ) | 78,352 | — | (1,449 | ) | ||||||||||||||||
|
|
|
|
|
|
|
|
|
|
|
| |||||||||||||
| 1,158,509 | 20,282 | (23,387 | ) | 985,880 | 19,343 | (21,703 | ) | |||||||||||||||||
|
|
|
|
|
|
|
|
|
|
|
| |||||||||||||
Commodity contracts | ||||||||||||||||||||||||
Derivative contracts | 27,269 | 1,172 | (1,127 | ) | 23,169 | 1,346 | (1,232 | ) | ||||||||||||||||
Interest rate contracts | ||||||||||||||||||||||||
Forward rate agreements | 75,950 | 2 | (4 | ) | 84,547 | 3 | (5 | ) | ||||||||||||||||
Swap agreements | 2,249,000 | 20,303 | (19,032 | ) | 2,076,377 | 23,359 | (22,476 | ) | ||||||||||||||||
Futures contracts | 151,466 | 330 | (333 | ) | 100,849 | 456 | (498 | ) | ||||||||||||||||
Options purchased | 43,803 | 1,373 | — | 26,909 | 1,049 | — | ||||||||||||||||||
Options sold | 48,735 | — | (1,590 | ) | 35,282 | — | (1,233 | ) | ||||||||||||||||
|
|
|
|
|
|
|
|
|
|
|
| |||||||||||||
| 2,568,954 | 22,008 | (20,959 | ) | 2,323,964 | 24,867 | (24,212 | ) | |||||||||||||||||
|
|
|
|
|
|
|
|
|
|
|
| |||||||||||||
Credit default swaps | ||||||||||||||||||||||||
Structured credit derivatives purchased1 | 4,777 | 103 | — | 4,811 | 137 | — | ||||||||||||||||||
Other credit derivatives purchased2 | 15,452 | 189 | (227 | ) | 14,332 | 121 | (143 | ) | ||||||||||||||||
|
|
|
|
|
|
|
|
|
|
|
| |||||||||||||
Total credit derivatives purchased | 20,229 | 292 | (227 | ) | 19,143 | 258 | (143 | ) | ||||||||||||||||
|
|
|
|
|
|
|
|
|
|
|
| |||||||||||||
Structured credit derivatives sold1 | 4,777 | — | (127 | ) | 4,811 | — | (169 | ) | ||||||||||||||||
Other credit derivatives sold2 | 14,081 | 75 | (49 | ) | 13,045 | 64 | (50 | ) | ||||||||||||||||
|
|
|
|
|
|
|
|
|
|
|
| |||||||||||||
Total credit derivatives sold | 18,858 | 75 | (176 | ) | 17,856 | 64 | (219 | ) | ||||||||||||||||
|
|
|
|
|
|
|
|
|
|
|
| |||||||||||||
| 39,087 | 367 | (403 | ) | 36,999 | 322 | (362 | ) | |||||||||||||||||
|
|
|
|
|
|
|
|
|
|
|
| |||||||||||||
Total | 3,793,819 | 43,829 | (45,876 | ) | 3,370,012 | 45,878 | (47,509 | ) | ||||||||||||||||
|
|
|
|
|
|
|
|
|
|
|
| |||||||||||||
| 1. | Refer page 86. |
| 2. | The notional amounts comprise vanilla credit default swap transactions including credit indices such as Itraxx (Europe and Australia) and CDX. In the case of back-to-back deals, where a risk position from one counterparty is “closed out” with another counterparty, the notional amounts are not netted down in the above table. For example, ANZ may sell credit protection over a particular corporate bond (or reference asset) to a counterparty and simultaneously offset that credit exposure by buying credit protection over the same corporate bond (or reference asset) from another counterparty. Netting may only occur when there is an offsetting deal with the same counterparty. These credit default swap trades are transacted in conjunction with other financial instruments by reference to the traded market risk limit framework which includes VaR, name and rating specific concentration limits, sensitivity limits and stress testing limits. VaR disclosures are set out on page 58. |
143
SUPPLEMENTARY INFORMATION
Summary of principal risks and uncertainties
The principal risks and uncertainties facing the Group are unchanged from those disclosed in ANZ’s 2013 Annual Report. However, the operational, legal and regulatory landscape in which ANZ operates has continued to evolve since the prior financial period.
Set out below is a summary of the principal risks and uncertainties which could adversely impact the financial condition of the Group. These should not be regarded as a complete and comprehensive statement of all potential risks and uncertainties. The summary should be read in conjunction with the “Principal Risks and Uncertainties” section of ANZ’s 2013 Annual Report listed on pages 191 to 199.
All of the Group’s activities involve, to varying degrees, the analysis, evaluation, acceptance and management of risks or combinations of risks. The material risks facing the Group and its approach to management of those risks are described below:
Credit Risk – is defined as the risk of financial loss resulting from the failure of ANZ’s customers and counterparties to honour or perform fully the terms of a loan or contract. ANZ has a comprehensive framework to manage credit risk and support sound growth for appropriate returns. The framework is top down, being defined by credit principles and policies. The effectiveness of the credit risk management framework is assessed through various compliance and monitoring processes. These, together with portfolio selection, define and guide the credit process, organisation and staff.
Market Risk – is defined as the risk to earnings arising from changes in market risk factors, which ANZ may have an exposure to in the Banking Book and/or Trading Book. The key market risk factors can be summarised as follows:
| • | Interest rate risk: exposure to changes in the level and volatility of interest rates, slope of the yield curve and changes in credit spreads. |
| • | Currency rate risk: exposure to changes in foreign exchange spot and forward prices and the volatility of foreign exchange rates. |
| • | Commodity price risk: exposure to changes in commodity prices and the volatility of commodity prices. |
| • | Equity price risk: exposure to changes in equity prices and the volatility of equity prices. |
The Market Risk function is a specialist risk management unit independent of the business that is responsible for measuring and monitoring market risk. Market Risk have implemented policies and procedures to ensure that ANZ’s market risk exposures are managed within the appetite and limit framework set by the Board.
Liquidity Risk – is defined as the risk that the Group is unable to meet its payment obligations as they fall due, including repaying depositors or maturing wholesale debt, or that the Group has insufficient capacity to fund increases in assets. The timing mismatch of cash flows and the related liquidity risk is inherent in all banking operations and is closely monitored by the Group. The Group maintains a portfolio of liquid assets to manage potential stresses in funding sources. The minimum level of liquid assets held is based on a range of ANZ specific and general market liquidity stress scenarios such that potential cash flow obligations can be met over the short to medium term.
Operational Risk – is defined as the risk of loss resulting from inadequate or failed internal processes, people and systems, or from external events. This definition includes legal risk, and the risk of reputational loss but excludes strategic risk. The Group Operational Risk function is responsible for exercising governance over operational risk by ensuring business management usage of the operational risk measurement and management framework. They are also responsible for ensuring that key operational risks and their management are reported to executive risk committees. Key operational risk themes include business disruption, rogue trader and mis-selling. Business units are responsible for the day to day management of operational risks through the implementation of the Operational Risk Measurement and Management framework. This includes the identification, analysis, assessment, monitoring, treatment and escalation of operational risks.
Compliance Risk – is defined as the probability and impact of an event that results in a failure to act in accordance with laws, regulations, industry standards and codes, internal policies and procedures and principles of good governance as applicable to ANZ’s businesses. Group Compliance is accountable for designing a compliance program that allows ANZ to meet its regulatory obligations. It also provides assurance to the Board that material risks are identified, assessed and managed by the business.
Reputational Risk – is defined as the risk of loss caused by adverse perceptions of ANZ held by the public, shareholders, investors, regulators, or rating agencies that directly or indirectly impact earnings, capital adequacy or value. We have established decision-making frameworks and policies to ensure our business decisions are guided by sound social and environmental standards and take into account reputation risk.
Insurance Risk – is defined as the risk of loss due to unexpected changes in current and future insurance claim rates. In life insurance business, insurance risk arises primarily through mortality (death), morbidity (illness and injury) and longevity risks. For general insurance business, insurance risk arises mainly through weather-related incidents and similar calamities, as well as adverse variability in home, contents, motor, travel and other insurance claim amounts. Insurance risk is managed primarily by: product design to price all applicable risks into contracts; reinsurance to reduce liability for large individual risks; underwriting to price/reserve for the level of risk associated with an individual contract; claims management to admit and pay only genuine claims; insurance experience reviews to update assumptions and portfolio management to maintain a diversity of individual risks.
Reinsurance Risk – Reinsurance is an agreement in which one insurer (‘the reinsurer’) indemnifies another insurer for all or part of the risk of a policy originally issued and assumed by that other insurer. Reinsurance is a risk transfer tool between the insurer and reinsurer. The main risk that arises with reinsurance is counterparty credit risk. This is the risk that a reinsurer fails to meet their contractual obligations, i.e. to pay reinsurance claims when due. This risk is measured by assigning a counterparty credit rating or probability of default. Reinsurance counterparty credit risk is mitigated by restricting counterparty exposures on the basis of financial strength and concentration.
144
DEFINITIONS
AAS- Australian Accounting Standards.
AASB- Australian Accounting Standards Board.
Cash represents short-term highly liquid instruments that are readily convertible to known amounts of cash and are subject to insignificant risk of change in value. Cash includes coins, notes, money at call, balances held with central banks, securities purchased under agreements to resell (“reverse repos”).
Cash profit is a measure of profit which is prepared on a basis other than in accordance with accounting standards. Cash profit represents a measure of the result of the ongoing business activities of the Group, enabling shareholders to assess Group and Divisional performance against prior periods and against peer institutions. To calculate cash profit, the Group excludes items from statutory net profit as noted below. These items are calculated consistently period on period so as not to discriminate between positive and negative adjustments.
Gains and losses are adjusted where they are significant, or have the potential to be significant in any one period, and fall into one of three categories:
| 1. | non-core gains or losses included in earnings arising from changes in tax, legal, accounting legislation or other non-core items not associated with the ongoing operations of the Group; |
| 2. | treasury shares, revaluation of policy liabilities, economic hedging impacts and similar accounting items that represent timing differences that will reverse through earnings in the future; and |
| 3. | accounting reclassifications between individual line items that do not impact reported results, such as policyholder tax gross up. |
The adjustments made in arriving at cash profit are included in statutory profit which is subject to review within the context of the Group Condensed Consolidated Financial Statements review. Cash profit is not subject to review by the external auditor, however, the external auditor has informed the Audit Committee that the adjustments have been determined on a consistent basis across each period presented.
Collective provision is the provision for credit losses that are inherent in the portfolio but not able to be individually identified. A collective provision may only be recognised when a loss event has already occurred. Losses expected as a result of future events, no matter how likely, are not recognised.
Customer deposits represent term deposits, other deposits bearing interest, deposits not bearing interest and borrowing corporations debt excluding securitisation deposits.
Economic Profit is a risk adjusted profit measure. Economic Profit is determined by adjusting cash profit with economic credit costs, the benefit of imputation credits and the cost of capital. This measure is used to evaluate business unit performance and is included in determining the variable component of remuneration packages.
Expected loss is determined based on the expected average annual loss of principal over the economic cycle for the current risk profile of the lending portfolio.
IFRS – International Financial Reporting Standards.
Impairedcommitments and contingencies comprises undrawn facilities and contingent facilities where the customer’s status is defined as impaired.
Impaired loans comprises drawn facilities where the customer’s status is defined as impaired.
Individual provision is the amount of expected credit losses on financial instruments assessed for impairment on an individual basis (as opposed to on a collective basis). It takes into account expected cash flows over the lives of those financial instruments.
Net interest averagemargin is net interest income as a percentage of average interest earning assets.
Net loans and advancesincludes gross loans and advances and acceptances and capitalised brokerage/mortgage origination fees, less unearned income and provisions for credit impairment.
Net tangible assets equals share capital and reserves attributable to shareholders of the Group less preference share capital and unamortised intangible assets (including goodwill and software).
Operating expenses excludes the provision for impairment of loans and advances charge.
Operating income includes net funds management and insurance income, share of associates profit and other operating income.
Repo discount is a discount applicable on the repurchase by a central bank of an eligible security pursuant to a repurchase agreement.
145
DEFINITIONS
Restructured items comprise facilities in which the original contractual terms have been modified for reasons related to the financial difficulties of the customer. Restructuring may consist of reduction of interest, principal or other payments legally due, or an extension in maturity materially beyond those typically offered to new facilities with similar risk.
Revenue includes net interest income, net funds management and insurance income, share of associates profit and other operating income.
Segment review description
The Group operates on a divisional structure with Australia, International and Institutional Banking (IIB), New Zealand, and Global Wealth being the major operating divisions. The IIB and Global Wealth divisions are coordinated globally. Global Technology, Services & Operations and Group Centre provide support to the operating divisions, including risk management, financial management, strategy and marketing, human resources and corporate affairs.
Australia
The Australia division comprises the Retail and Corporate and Commercial Banking business units.
| • | Retail |
Retail is responsible for delivering a range of product solutions including home loans, credit cards, personal loans, merchant services, transaction banking, savings accounts and deposits to our consumer customers, using capabilities in product, analytics, customer research, segmentation, strategy and marketing. It also provides a range of solutions for businesses including physical payment instruments (cash and cheques) as well as online and electronic payments.
| • | Home Loansprovides housing finance to consumers in Australia for both owner occupied and investment purposes, as well as providing housing finance for overseas investors. |
| • | Cards and Paymentsprovides consumer and commercial credit cards, personal loans and merchant services. |
| • | Depositsprovides transaction banking, savings and investment products, such as term deposits and cash management accounts. |
Retail delivers banking solutions to customers across multiple distribution channels including the Australian branch network, ANZ Direct, specialist sales channels and digital channels (including goMoney, Internet Banking, anz.com). The retail distribution network provides retail and wealth solutions to consumers, as well as providing small business solutions and meeting the various cash and cheque handling needs of corporate, commercial and institutional customers.
| • | Corporate and Commercial Banking (C&CB) |
| • | Corporate Bankingprovides a full range of banking services including traditional relationship banking and sophisticated financial solutions, primarily to large private companies, smaller listed companies and multi-national corporation subsidiaries. |
| • | Regional Business Bankingprovides a full range of banking services to non-metropolitan commercial and Agri (including corporate) customers. |
| • | Business Bankingprovides a full range of banking services, to metropolitan based small to medium sized business clients with a turnover of A$5 million up to A$125 million. |
| • | Small Business Bankingprovides a full range of banking services to metropolitan and regional based small businesses in Australia with a turnover of up to A$5m and lending up to A$1 million. |
| • | Esanda provides motor vehicle and equipment finance. |
International and Institutional Banking (IIB)
The International and Institutional Banking division comprises Global Institutional, Retail Asia Pacific and Asia Partnerships business units, along with Relationship & Infrastructure.
| • | Global Institutionalprovides global financial services to government, corporate and institutional clients with a focus on solutions for clients with complex financial needs, based on a deep understanding of their businesses and industries, with particular expertise in natural resources, agriculture and infrastructure. Institutional delivers transaction banking, specialised and relationship lending and markets solutions in Australia, New Zealand, Asia, Pacific, Europe and America. |
| • | Transaction Bankingprovides working capital and liquidity solutions including regional cash management solutions, deposit products, international payments and clearing, documentary trade, supply chain finance and structured trade finance principally to institutional, corporate and commercial customers. |
| • | Global Marketsprovides risk management services to corporate and institutional clients globally in relation to foreign exchange, interest rates, credit, commodities, debt capital markets, wealth solutions and equity derivatives. Markets provides origination, underwriting, structuring and risk management services, advice and sale of credit and derivative products globally. Markets also manages the Group’s interest rate risk position and liquidity portfolio. |
| • | Global Loansprovides term loans and specialist loan structuring and execution. It provides specialist credit analysis, structuring, execution and ongoing monitoring of strategically significant customer transactions including project and structured finance, debt structuring and acquisition finance, structured asset finance and export finance. |
| • | Retailwhich provides retail and small business banking services to customers in the Asia Pacific region and also includes investment and insurance products and services for Asia Pacific customers. |
| • | Asia Partnershipswhich is a portfolio of strategic partnerships in Asia. This includes investments in Indonesia with PT Bank Pan Indonesia, in the Philippines with Metrobank Cards Corporation, in China with Bank of Tianjin and Shanghai Rural Commercial Bank, in Malaysia with AMMB Holdings Berhad and in Vietnam with Saigon Securities Incorporation. |
| • | Relationship & Infrastructureincludes client relationship management teams for global institutional and financial institution and corporate customers in Australia, New Zealand, Asia Pacific, Europe and America and central support functions. Relationship and infrastructure also includes businesses within IIB which are discontinued. |
146
DEFINITIONS
Segment review description, cont’d
New Zealand
The New Zealand division comprises Retail and Commercial business units.
| • | Retail |
| • | Retail provides mortgages, credit cards, unsecured lending, transaction banking services, and savings and deposit products to personal customers in New Zealand. |
| • | Commercial |
| • | Commercial & Agri (CommAgri)provides financial solutions through a relationship management model for medium-sized businesses, including agri-business, with a turnover of up to NZ$150 million. Asset Finance (including motor vehicle and equipment finance), operating leases and investment products are provided under the UDC brand. |
| • | Small Business Bankingprovides a full range of banking services to small enterprises, typically with turnover of less than NZ$5 million. |
Global Wealth
The Global Wealth division comprises Funds Management, Insurance and Private Wealth which provides investment, superannuation, insurance products and services as well as Private Banking for customers across Australia, New Zealand and Asia.
| • | Private Wealthspecialises in assisting individuals and families to manage, grow and preserve their wealth. The businesses within Private Wealth include Private Bank and ANZ Trustees. |
| • | Funds Managementincludes the Pensions and Investment business, E*Trade and Investment Lending. |
| • | Insuranceincludes Life Insurance, General Insurance and ANZ Lender’s Mortgage Insurance. |
| • | Corporate and otherincludes income from invested capital, cash profits from advice and distribution business and unallocated corporate tax credits. |
Global Technology, Services and Operations (GTSO) and Group Centre
GTSO and Group Centre provide support to the operating divisions, including technology, operations, risk management, financial management, strategy and marketing, human resources and corporate affairs. Additionally, Group Centre includes Group Treasury, Shareholder Functions and Discontinued Businesses.
Settlement balances owed to / from ANZ represents financial assets and/or liabilities which are in the course of being settled. These may include trade dated assets and liabilities, nostro / vostro accounts and settlement accounts.
147
ASX APPENDIX 4D – CROSS REFERENCE INDEX
| PAGE | ||||
Details of the reporting period (4D Item 1) | Table of Contents | |||
Results for Announcement to the Market (4D Item 2) | After front cover | |||
Net Tangible Assets per security (4D Item 3) | 10 | |||
Details of entities over which control has been gained or lost (4D Item 4) | 123 | |||
Dividends and dividend dates (4D Item 5) | After front cover | |||
Dividend Reinvestment Plan (4D Item 6) | After front cover | |||
Details of associates and joint venture entities (4D Item 7) | 123 | |||
148
ASX APPENDIX 4D - ALPHABETICAL INDEX
| PAGE | ||||
Appendix 4D Statement | After front cover | |||
Appendix 4D Cross Reference Index | 148 | |||
Basis of preparation | 100 | |||
CEO Overview | 13 | |||
CFO Overview | 15 | |||
Changes in comparatives | 124 | |||
Changes in composition of the Group | 123 | |||
Condensed Consolidated Balance Sheet | 97 | |||
Condensed Consolidated Cash Flow Statement | 98 | |||
Condensed Consolidated Income Statement | 95 | |||
Condensed Consolidated Statement of Comprehensive Income | 96 | |||
Condensed Statement of Changes in Equity | 99 | |||
Contingent liabilities and contingent assets | 124 | |||
Credit quality | 108 | |||
Definitions | 145 | |||
Deposits and other borrowings | 113 | |||
Dividends | 104 | |||
Earnings per share | 105 | |||
Fair value measurement | 117 | |||
Geographic review | 75 | |||
Income | 101 | |||
Income tax expense | 103 | |||
Investments in associates | 123 | |||
Loan capital | 114 | |||
Media Release | 3 | |||
Net loans and advances | 106 | |||
Note to the Cash Flow Statement | 122 | |||
Operating expenses | 102 | |||
Profit reconciliation | 83 | |||
Provision for credit impairment | 107 | |||
Related party disclosure | 124 | |||
Segment analysis | 121 | |||
Segment review | 41 | |||
Shareholders’ equity | 115 | |||
Share capital | 115 | |||
Significant events since balance date | 127 | |||
Snapshot | 7 | |||
Supplementary Information – Average balance sheet and related interest | 138 | |||
Supplementary Information – Capital management | 133 | |||
Supplementary Information – Derivative financial instruments | 143 | |||
Supplementary Information – Exchange rates | 142 | |||
Supplementary Information – Four year summary by half year | 132 | |||
Supplementary Information – Full Time Equivalent staff | 142 | |||
Supplementary Information – Summary of principal risks and uncertainties | 144 | |||
149