1ST QUARTER 2014 EARNINGS RELEASE MAY 2014
Forward Looking Statements Some of the information included herein may contain forward-looking statements within the meaning of the federal securities laws. Forward-looking statements give our current expectations and may contain projections of results of operations or of financial condition, or forecasts of future events. Words such as “may,” “assume,” “forecast,” “position,” “predict,” “strategy,” “expect,” “intend,” “plan,” “estimate,” “anticipate,” “could,” “believe,” “project,” “budget,” “potential,” or “continue,” and similar expressions are used to identify forward-looking statements. They can be affected by assumptions used or by known or unknown risks or uncertainties. Consequently, no expected results of operations or financial condition or other forward-looking statements can be guaranteed. When considering these forward-looking statements, you should keep in mind the risk factors and other cautionary statements in Hi-Crush Partners LP’s (“Hi-Crush”) reports filed with the Securities and Exchange Commission (“SEC”), including those described under Item 1A, “Risk Factors” of Hi-Crush’s Annual Report on Form 10-K for the fiscal year ended December 31, 2013 and any subsequently filed Quarterly Report on Form 10-Q. Actual results may vary materially. You are cautioned not to place undue reliance on any forward-looking statements. You should also understand that it is not possible to predict or identify all such factors and should not consider the risk factors in our reports filed with the SEC or the following list to be a complete statement of all potential risks and uncertainties. Factors that could cause our actual results to differ materially from the results contemplated by such forward-looking statements include: the volume of frac sand we are able to sell; the price at which we are able to sell frac sand; the outcome of any pending litigation; changes in the price and availability of natural gas or electricity; changes in prevailing economic conditions; and difficulty collecting receivables. All forward-looking statements are expressly qualified in their entirety by the foregoing cautionary statements. Hi-Crush’s forward-looking statements speak only as of the date made and Hi-Crush undertakes no obligation to update or revise its forward-looking statements, whether as a result of new information, future events or otherwise. 2
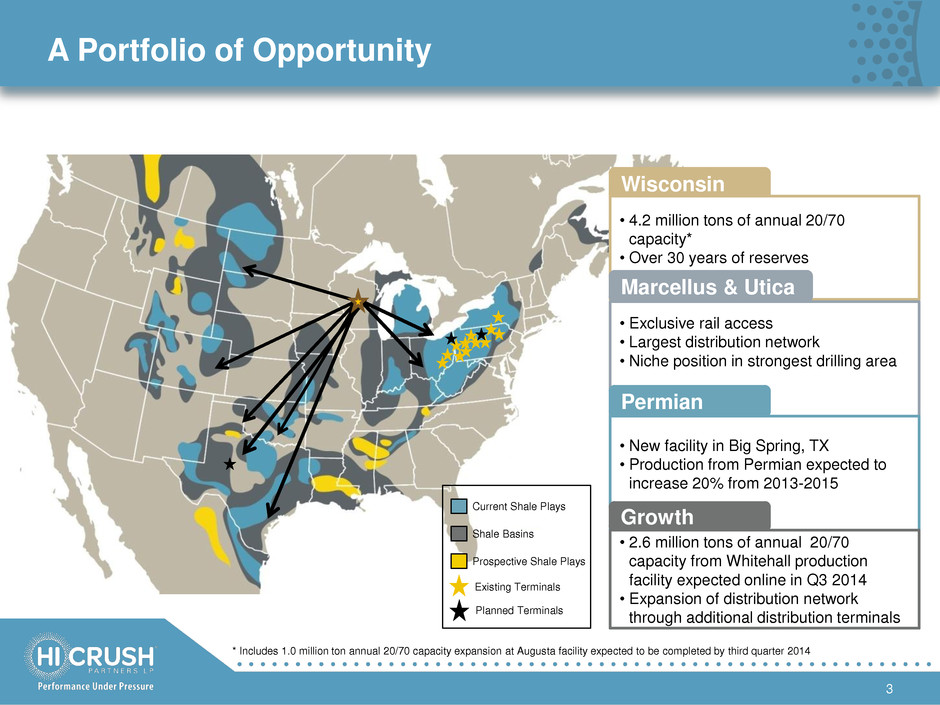
A Portfolio of Opportunity 3 Wisconsin • 4.2 million tons of annual 20/70 capacity* • Over 30 years of reserves Marcellus & Utica • Exclusive rail access • Largest distribution network • Niche position in strongest drilling area Permian • New facility in Big Spring, TX • Production from Permian expected to increase 20% from 2013-2015 Growth • 2.6 million tons of annual 20/70 capacity from Whitehall production facility expected online in Q3 2014 • Expansion of distribution network through additional distribution terminals Current Shale Plays Shale Basins Prospective Shale Plays Existing Terminals Planned Terminals * Includes 1.0 million ton annual 20/70 capacity expansion at Augusta facility expected to be completed by third quarter 2014
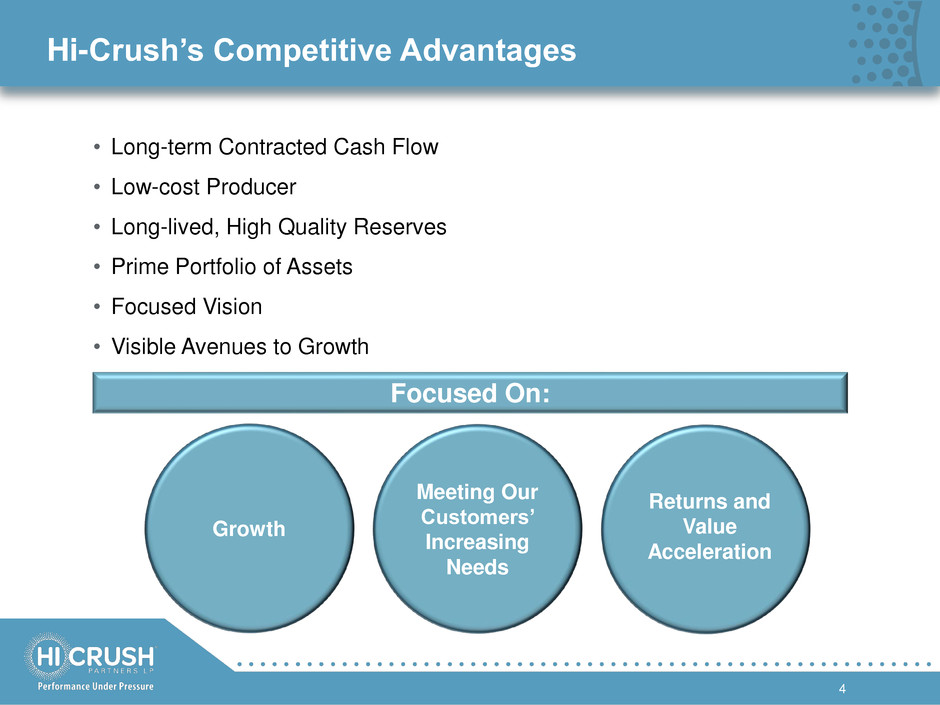
Hi-Crush’s Competitive Advantages 4 • Long-term Contracted Cash Flow • Low-cost Producer • Long-lived, High Quality Reserves • Prime Portfolio of Assets • Focused Vision • Visible Avenues to Growth Focused On: Growth Meeting Our Customers’ Increasing Needs Returns and Value Acceleration

Delivering Outstanding Results 5 Predictable Income Visible Organic Growth Best in Class Assets • Expansion of distribution network • Construction of Whitehall facility by our sponsor • Lowest industry production cost per ton • 1,838 contiguous acres of premium sand • 3.2 million tons of frac sand contracted in 2014 • Double digit annual distribution growth
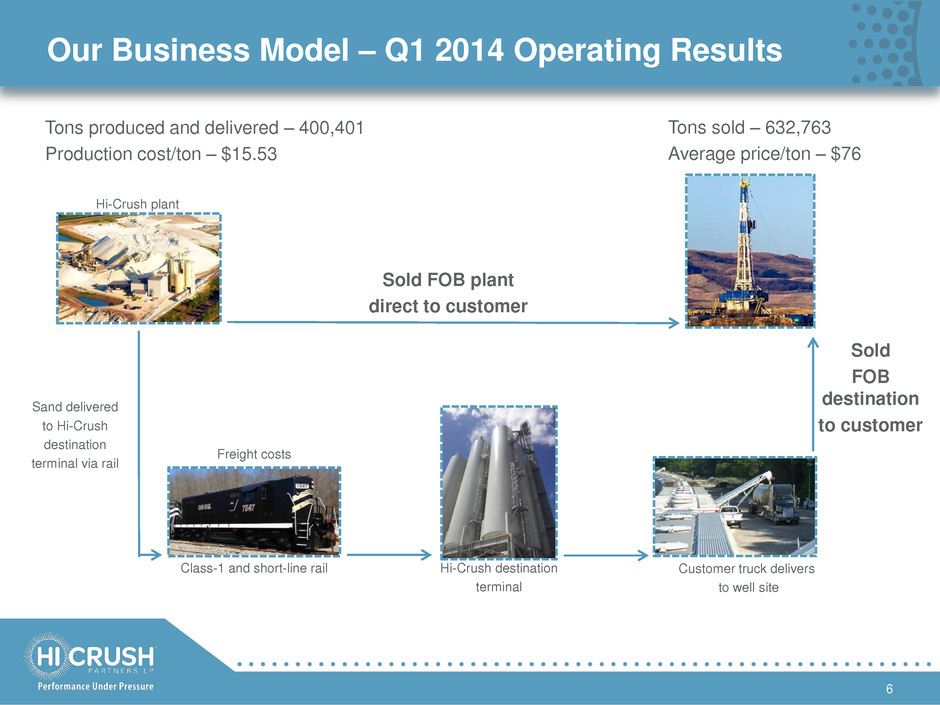
Our Business Model – Q1 2014 Operating Results 6 Sold FOB plant direct to customer Hi-Crush destination terminal Freight costs Hi-Crush plant Tons produced and delivered – 400,401 Production cost/ton – $15.53 Sold FOB destination to customer Sand delivered to Hi-Crush destination terminal via rail Tons sold – 632,763 Average price/ton – $76 Class-1 and short-line rail Customer truck delivers to well site
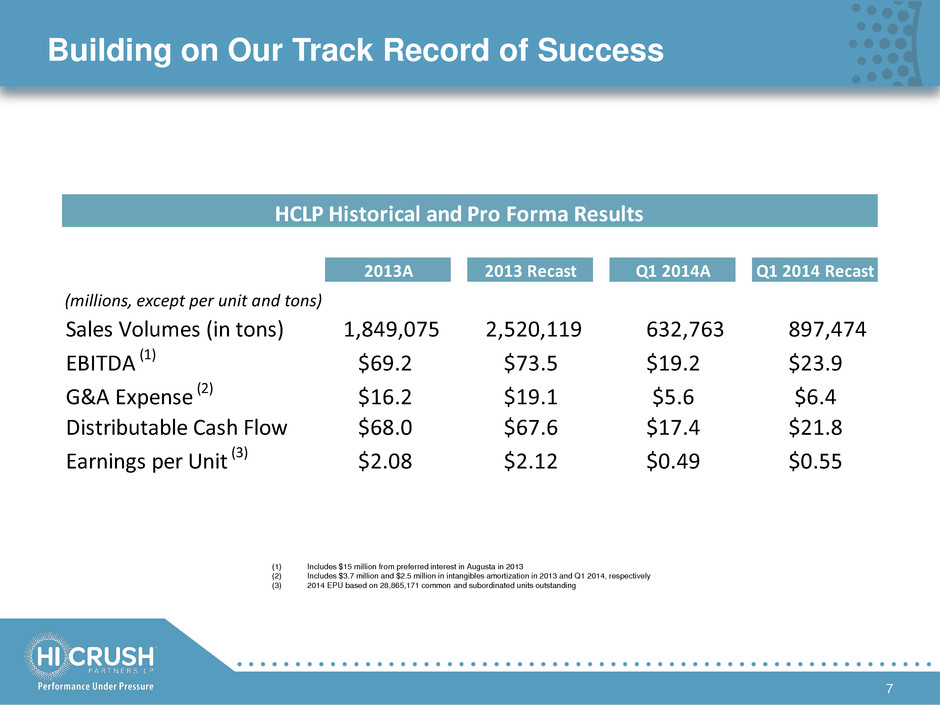
Building on Our Track Record of Success 7 (1) Includes $15 million from preferred interest in Augusta in 2013 (2) Includes $3.7 million and $2.5 million in intangibles amortization in 2013 and Q1 2014, respectively (3) 2014 EPU based on 28,865,171 common and subordinated units outstanding HCLP Historical and Pro Forma Results 2013A 2013 Recast Q1 2014A Q1 2014 Recast (millions, except per unit and tons) Sales Volumes (in tons) 1,849,075 2,520,119 632,763 897,474 EBITDA (1) $69.2 $73.5 $19.2 $23.9 G&A Expense (2) $16.2 $19.1 $5.6 $6.4 Distributable Cash Flow $68.0 $67.6 $17.4 $21.8 Earnings per Unit (3) $2.08 $2.12 $0.49 $0.55

Revised HCLP Financial Outlook 8 (1) Assumes no dropdowns or M&A activity (2) Includes $3.4 million, $3.4 million and $1.7 million in intangibles amortization in Previous 2014, Updated 2014 and 2015, respectively (3) Assumes conversion of Class B units Note: The table above references estimated EBITDA, which is a non-GAAP measure that represents net income (loss) before net interest expense, income tax expense and depreciation, depletion and amortization expense, and Distributable Cash Flow, which is a non-GAAP measure that represents EBITDA less cash paid for interest expense and maintenance and replacement capital expenditures, including accrual for reserve replacement, plus accretion of asset retirement obligations and the distribution from the preferred interest in Augusta to the extent not included in net income. We have not included a reconciliation of these forward-looking non-GAAP measures to estimated net income because the GAAP financial measure on a forward-looking basis is not accessible, and the reconciling information is not available without unreasonable efforts. HCLP Financial Outlook (1) Previous 2014 Updated 2014 2015 (millions, except per unit and tons) Sales Volumes (in tons) 2.3 - 2.7 mm 3.6 - 4.3 mm 5.0 - 6.4 mm EBITDA $80 - 90 $115 - 135 $140 - 185 G&A Expense (2) $18 - 21 $18 - 22 $19 - 23 Distributable Cash Flow $75 - 85 $100 - 130 $125 - 170 Distributions per Unit (3) $2.30 - 2.50
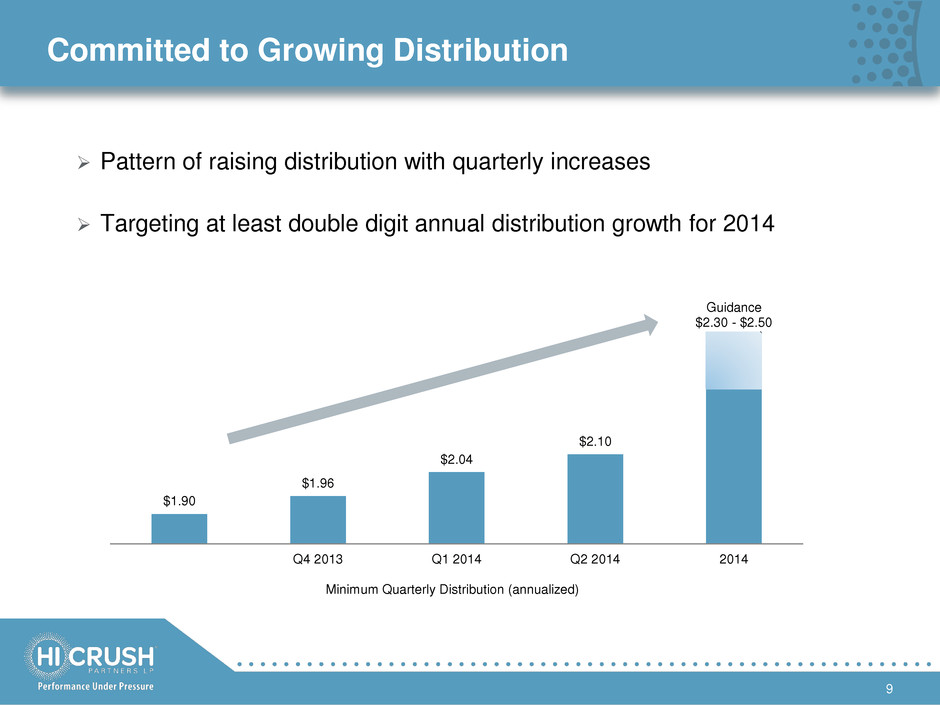
$1.90 $1.96 $2.04 $2.10 Guidance $2.30 - $2.50 Q4 2013 Q1 2014 Q2 2014 2014 Committed to Growing Distribution 9 Pattern of raising distribution with quarterly increases Targeting at least double digit annual distribution growth for 2014 Minimum Quarterly Distribution (annualized)
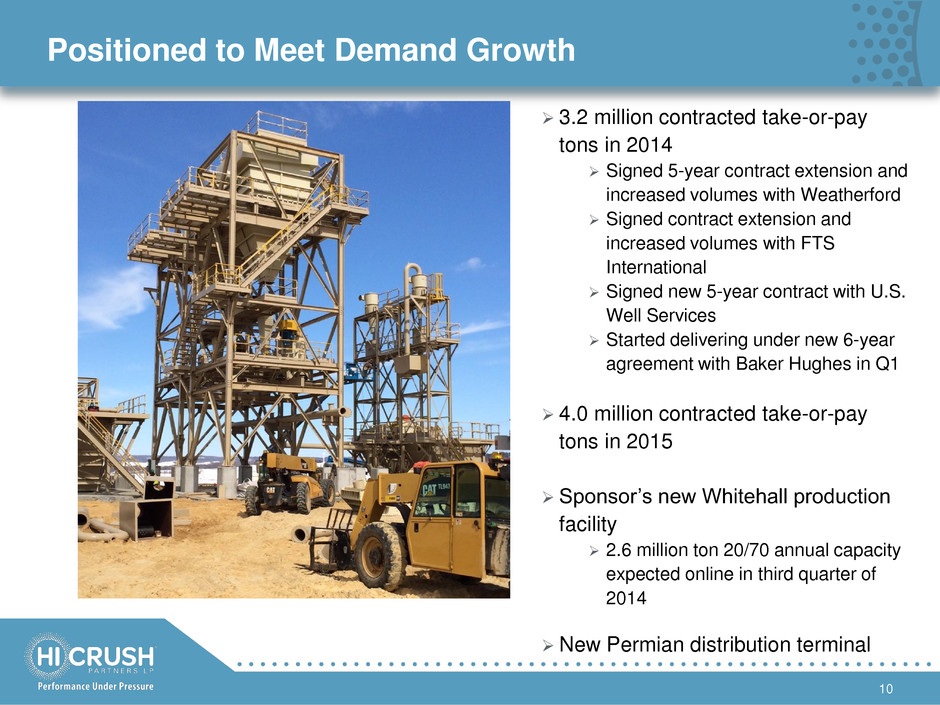
Positioned to Meet Demand Growth 10 3.2 million contracted take-or-pay tons in 2014 Signed 5-year contract extension and increased volumes with Weatherford Signed contract extension and increased volumes with FTS International Signed new 5-year contract with U.S. Well Services Started delivering under new 6-year agreement with Baker Hughes in Q1 4.0 million contracted take-or-pay tons in 2015 Sponsor’s new Whitehall production facility 2.6 million ton 20/70 annual capacity expected online in third quarter of 2014 New Permian distribution terminal
Industry Backdrop
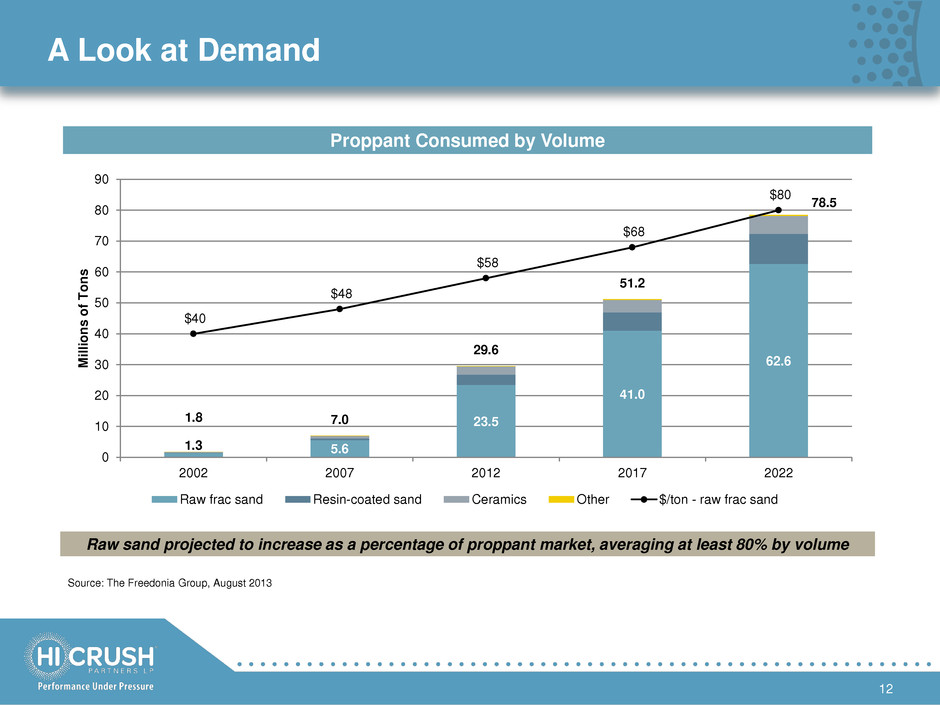
A Look at Demand Proppant Consumed by Volume Source: The Freedonia Group, August 2013 Raw sand projected to increase as a percentage of proppant market, averaging at least 80% by volume 1.3 5.6 23.5 41.0 62.6 $40 $48 $58 $68 $80 1.8 7.0 29.6 51.2 78.5 0 10 20 30 40 50 60 70 80 90 2002 2007 2012 2017 2022 M ill io n s o f T o n s Raw frac sand Resin-coated sand Ceramics Other $/ton - raw frac sand 12
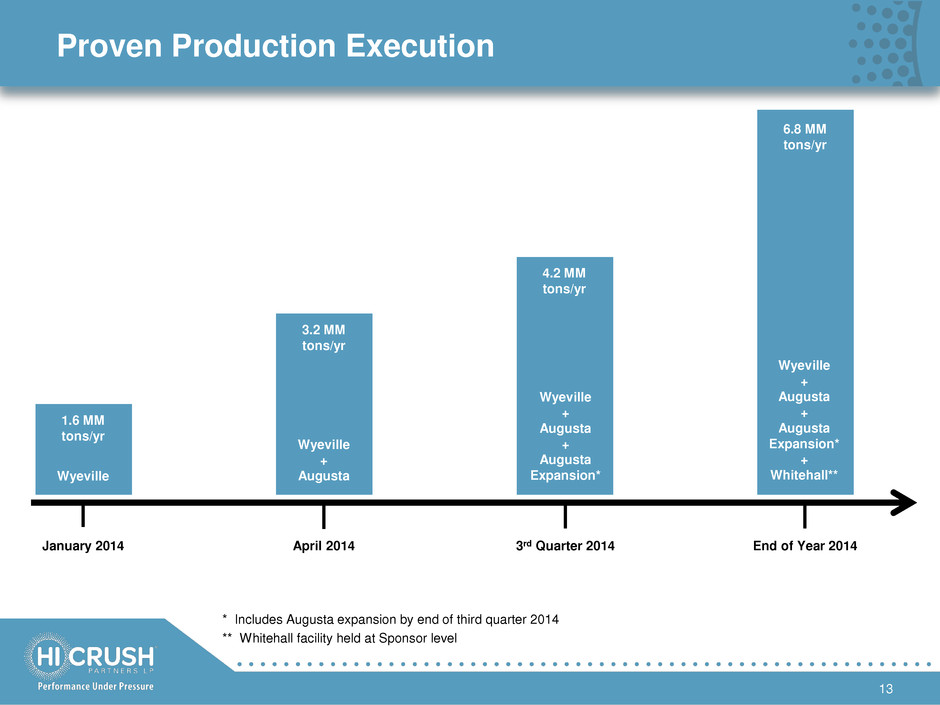
Proven Production Execution * Includes Augusta expansion by end of third quarter 2014 ** Whitehall facility held at Sponsor level January 2014 April 2014 3rd Quarter 2014 End of Year 2014 13 1.6 MM tons/yr Wyeville Wyeville + Augusta Wyeville + Augusta + Augusta Expansion* Wyeville + Augusta + Augusta Expansion* + Whitehall** 3.2 MM tons/yr 4.2 MM tons/yr 6.8 MM tons/yr
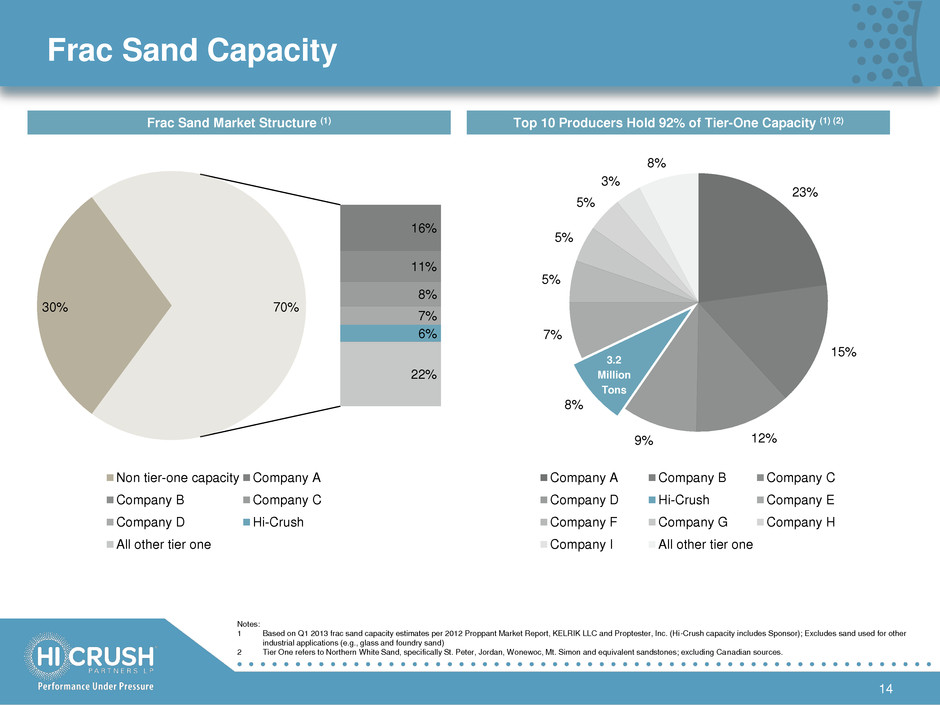
Frac Sand Capacity 14 23% 15% 12% 9% 8% 7% 5% 5% 5% 3% 8% Company A Company B Company C Company D Hi-Crush Company E Company F Company G Company H Company I All other tier one 30% 16% 11% 8% 7% 6% 22% 70% Non tier-one capacity Company A Company B Company C Company D Hi-Crush All other tier one Frac Sand Market Structure (1) Top 10 Producers Hold 92% of Tier-One Capacity (1) (2) Notes: 1 Based on Q1 2013 frac sand capacity estimates per 2012 Proppant Market Report, KELRIK LLC and Proptester, Inc. (Hi-Crush capacity includes Sponsor); Excludes sand used for other industrial applications (e.g., glass and foundry sand) 2 Tier One refers to Northern White Sand, specifically St. Peter, Jordan, Wonewoc, Mt. Simon and equivalent sandstones; excluding Canadian sources. 3.2 Million Tons
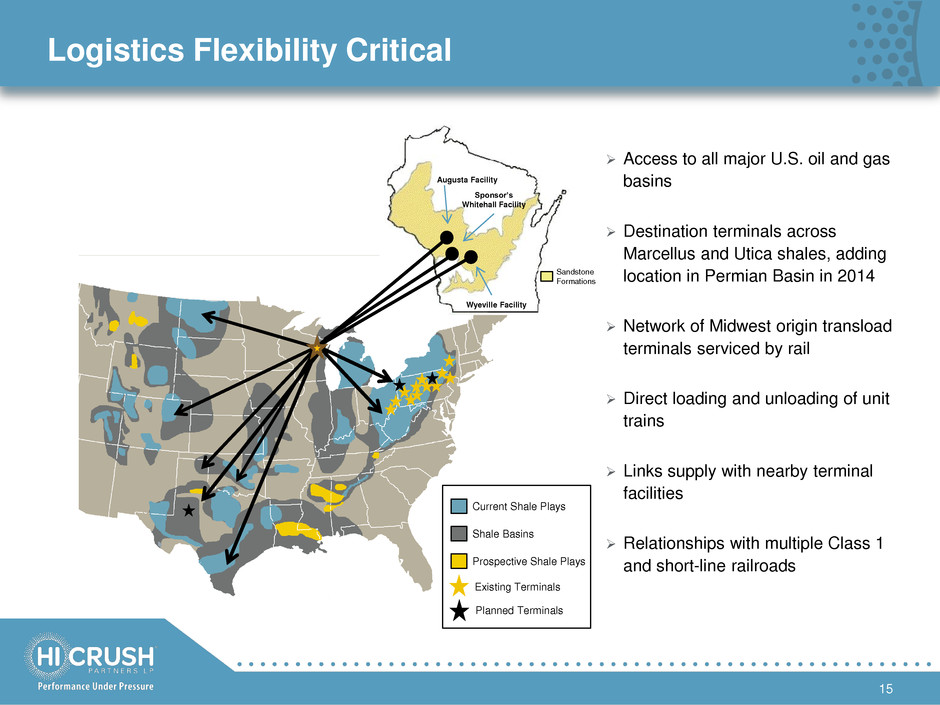
Logistics Flexibility Critical Augusta Facility Wyeville Facility Sandstone Formations Access to all major U.S. oil and gas basins Destination terminals across Marcellus and Utica shales, adding location in Permian Basin in 2014 Network of Midwest origin transload terminals serviced by rail Direct loading and unloading of unit trains Links supply with nearby terminal facilities Relationships with multiple Class 1 and short-line railroads Current Shale Plays Shale Basins Prospective Shale Plays Existing Terminals Sponsor’s Whitehall Facility 15 Planned Terminals
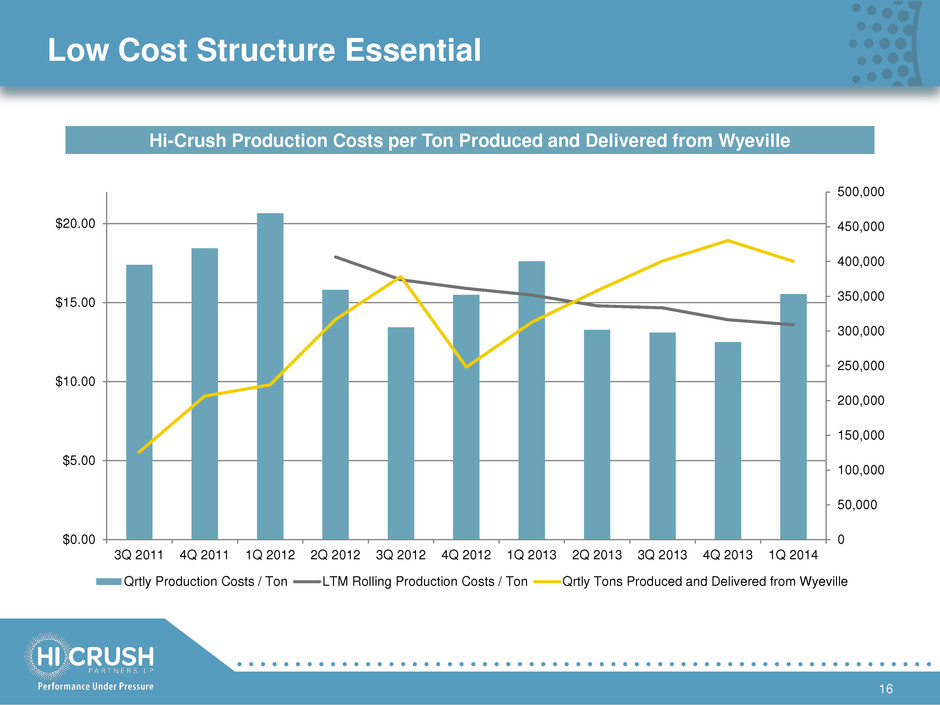
Low Cost Structure Essential 16 Hi-Crush Production Costs per Ton Produced and Delivered from Wyeville 0 50,000 100,000 150,000 200,000 250,000 300,000 350,000 400,000 450,000 500,000 $0.00 $5.00 $10.00 $15.00 $20.00 3Q 2011 4Q 2011 1Q 2012 2Q 2012 3Q 2012 4Q 2012 1Q 2013 2Q 2013 3Q 2013 4Q 2013 1Q 2014 Qrtly Production Costs / Ton LTM Rolling Production Costs / Ton Qrtly Tons Produced and Delivered from Wyeville
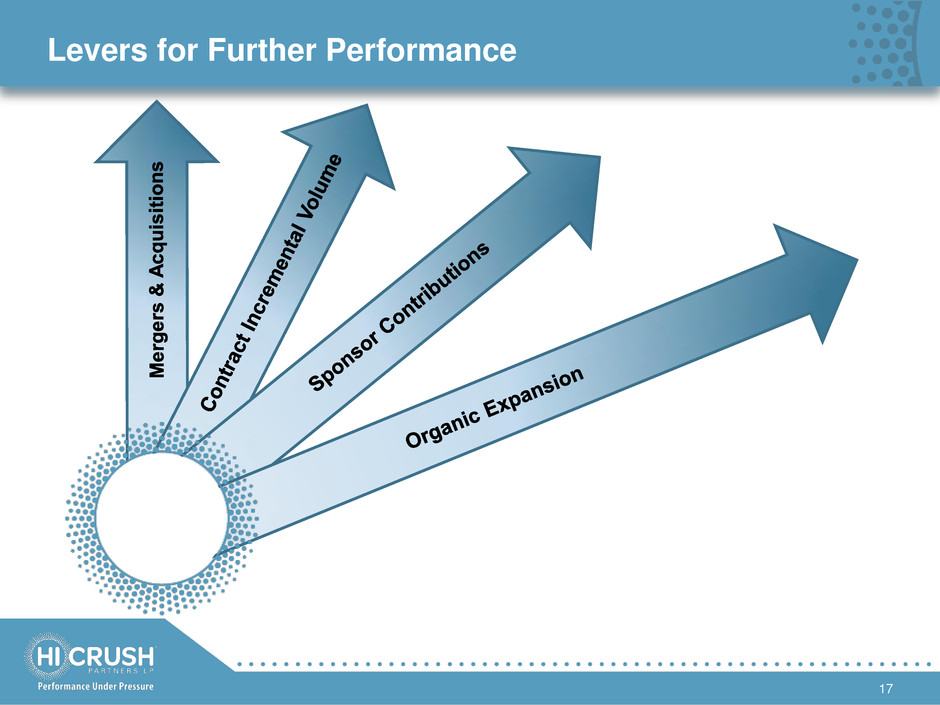
Levers for Further Performance 17
Appendix
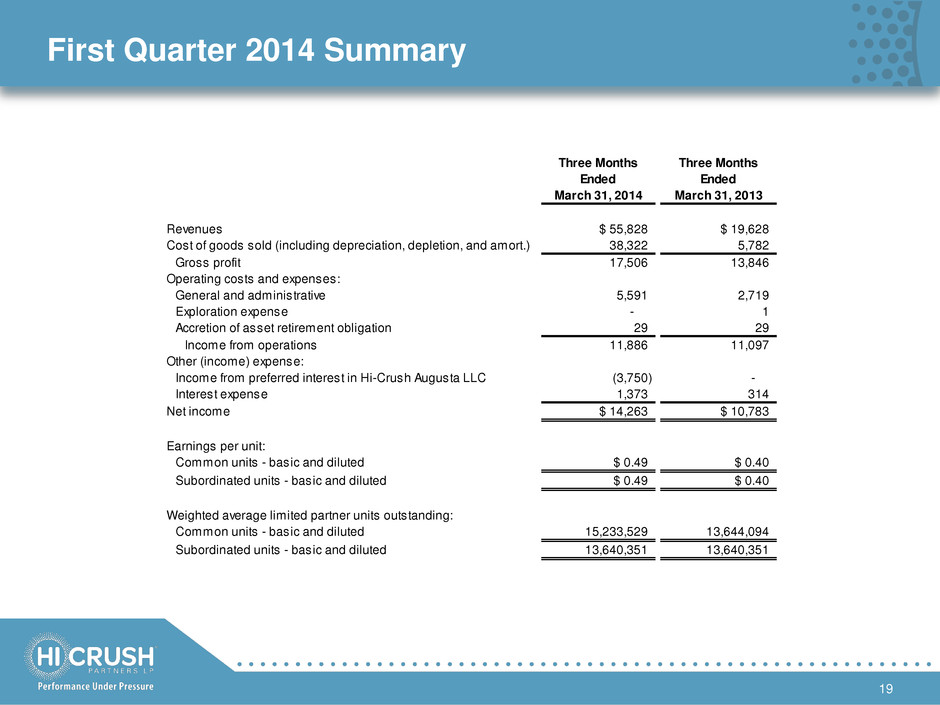
First Quarter 2014 Summary 19 Three Months Three Months Ended Ended March 31, 2014 March 31, 2013 Revenues $ 55,828 $ 19,628 Cost of goods sold (including depreciation, depletion, and amort.) 38,322 5,782 Gross profit 17,506 13,846 Operating costs and expenses: General and administrative 5,591 2,719 Exploration expense - 1 Accretion of asset retirement obligation 29 29 Income from operations 11,886 11,097 Other (income) expense: Income from preferred interest in Hi-Crush Augusta LLC (3,750) - Interest expense 1,373 314 Net income $ 14,263 $ 10,783 Earnings per unit: Common units - basic and diluted $ 0.49 $ 0.40 Subordinated units - basic and diluted $ 0.49 $ 0.40 Weighted average limited partner units outstanding: Common units - basic and diluted 15,233,529 13,644,094 Subordinated units - basic and diluted 13,640,351 13,640,351
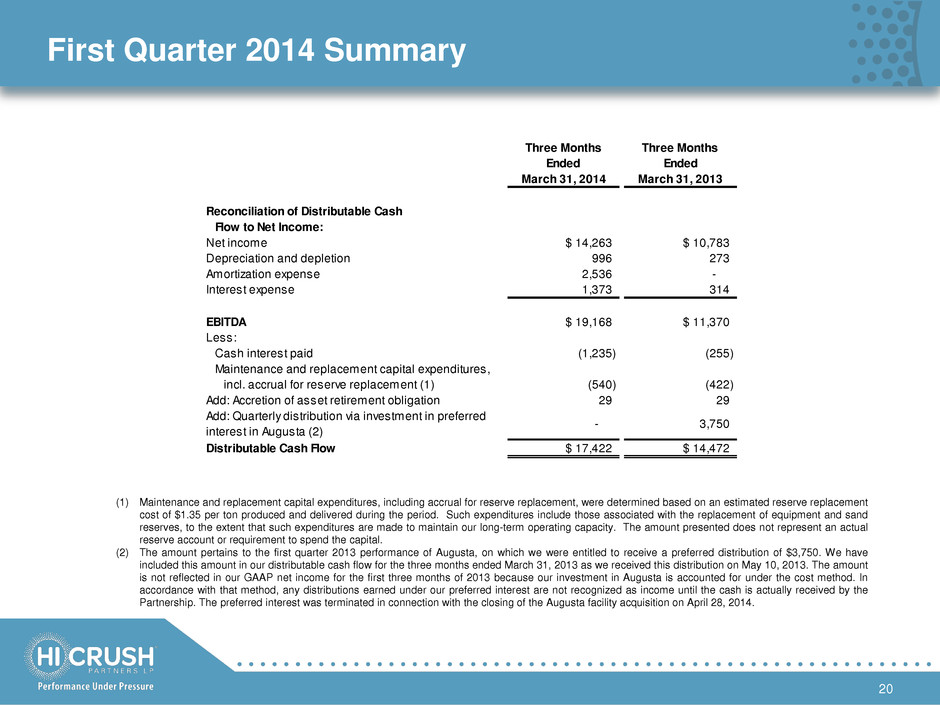
First Quarter 2014 Summary (1) Maintenance and replacement capital expenditures, including accrual for reserve replacement, were determined based on an estimated reserve replacement cost of $1.35 per ton produced and delivered during the period. Such expenditures include those associated with the replacement of equipment and sand reserves, to the extent that such expenditures are made to maintain our long-term operating capacity. The amount presented does not represent an actual reserve account or requirement to spend the capital. (2) The amount pertains to the first quarter 2013 performance of Augusta, on which we were entitled to receive a preferred distribution of $3,750. We have included this amount in our distributable cash flow for the three months ended March 31, 2013 as we received this distribution on May 10, 2013. The amount is not reflected in our GAAP net income for the first three months of 2013 because our investment in Augusta is accounted for under the cost method. In accordance with that method, any distributions earned under our preferred interest are not recognized as income until the cash is actually received by the Partnership. The preferred interest was terminated in connection with the closing of the Augusta facility acquisition on April 28, 2014. 20 Three Months Three Months Ended Ended March 31, 2014 March 31, 2013 Reconciliation of Distributable Cash Flow to Net Income: Net income $ 14,263 $ 10,783 Depreciation and depletion 996 273 Amortization expense 2,536 - Interest expense 1,373 314 EBITDA $ 19,168 $ 11,370 Less: Cash interest paid (1,235) (255) Maintenance and replacement capital expenditures, incl. accrual for reserve replacement (1) (540) (422) Add: Accretion of asset retirement obligation 29 29 Add: Quarterly distribution via investment in preferred interest in Augusta (2) - 3,750 Distributable Cash Flow $ 17,422 $ 14,472
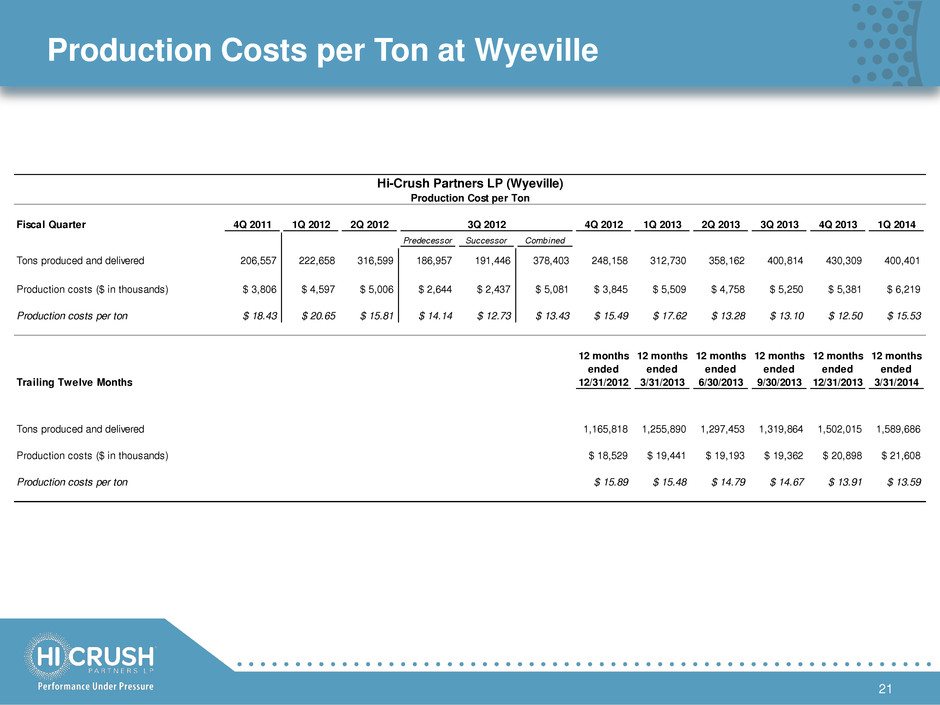
Production Costs per Ton at Wyeville 21 Hi-Crush Partners LP (Wyeville) Production Cost per Ton Fiscal Quarter 4Q 2011 1Q 2012 2Q 2012 3Q 2012 4Q 2012 1Q 2013 2Q 2013 3Q 2013 4Q 2013 1Q 2014 Predecessor Successor Combined Tons produced and delivered 206,557 222,658 316,599 186,957 191,446 378,403 248,158 312,730 358,162 400,814 430,309 400,401 Production costs ($ in thousands) $ 3,806 $ 4,597 $ 5,006 $ 2,644 $ 2,437 $ 5,081 $ 3,845 $ 5,509 $ 4,758 $ 5,250 $ 5,381 $ 6,219 Production costs per ton $ 18.43 $ 20.65 $ 15.81 $ 14.14 $ 12.73 $ 13.43 $ 15.49 $ 17.62 $ 13.28 $ 13.10 $ 12.50 $ 15.53 12 months ended 3 months ended 6 months ended 9 months ended 12 months ended 12 months ended 12 months ended 12 months ended 12 months ended 12 months ended 12 months ended Trailing Twelve Months 12/31/2011 3/31/2012 6/30/2012 9/30/2012 9/30/2012 12/31/2012 3/31/2013 6/30/2013 9/30/2013 12/31/2013 3/31/2014 Predecessor Successor Combined Tons produced and delivered 332,593 222,658 539,257 726,214 191,446 1,124,217 1,165,818 1,255,890 1,297,453 1,319,864 1,502,015 1,589,686 Production costs ($ in thousands) $ 5,998 $ 4,597 $ 9,603 $ 12,247 $ 2,437 $ 18,490 $ 18,529 $ 19,441 $ 19,193 $ 19,362 $ 20,898 $ 21,608 Production costs per ton $ 18.03 $ 20.65 $ 17.81 $ 16.86 $ 12.73 $ 16.45 $ 15.89 $ 15.48 $ 14.79 $ 14.67 $ 13.91 $ 13.59
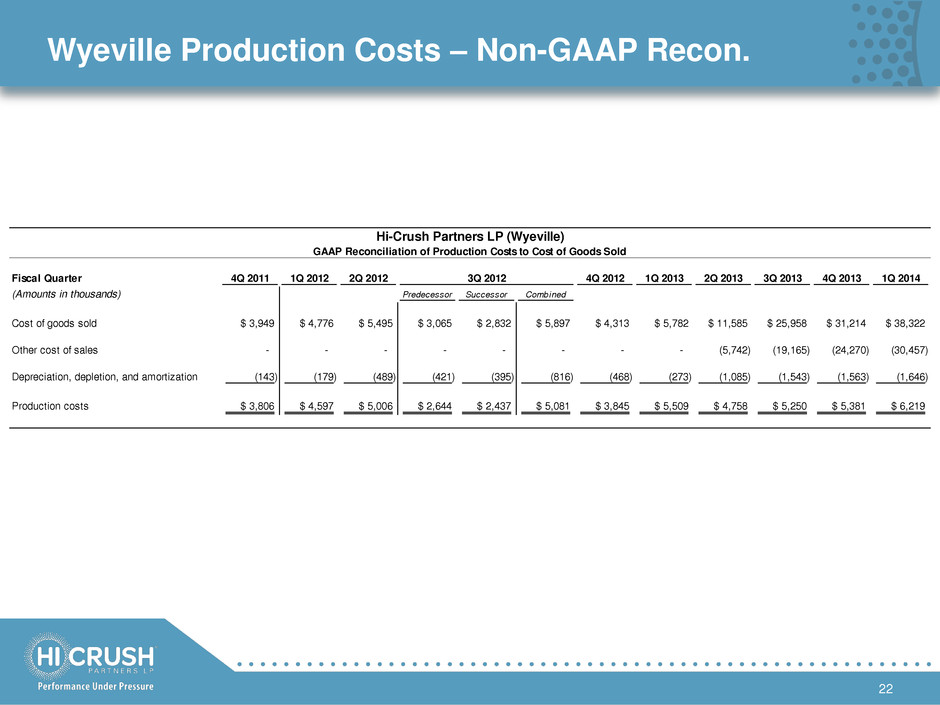
Wyeville Production Costs – Non-GAAP Recon. 22 Hi-Crush Partners LP (Wyeville) GAAP Reconciliation of Production Costs to Cost of Goods Sold Fiscal Quarter 4Q 2011 1Q 2012 2Q 2012 4Q 2012 1Q 2013 2Q 2013 3Q 2013 4Q 2013 1Q 2014 (Amounts in thousands) Predecessor Successor Combined Cost of goods sold $ 3,949 $ 4,776 $ 5,495 $ 3,065 $ 2,832 $ 5,897 $ 4,313 $ 5,782 $ 11,585 $ 25,958 $ 31,214 $ 38,322 Other cost of sales - - - - - - - - (5,742) (19,165) (24,270) (30,457) Depreciation, depletion, and amortization (143) (179) (489) (421) (395) (816) (468) (273) (1,085) (1,543) (1,563) (1,646) Production costs $ 3,806 $ 4,597 $ 5,006 $ 2,644 $ 2,437 $ 5,081 $ 3,845 $ 5,509 $ 4,758 $ 5,250 $ 5,381 $ 6,219 3Q 2012

Preliminary Recast EBITDA and DCF – Non-GAAP Recon. 23 Three Months Three Months Three Months Ended Ended Recast Ended March 31, 2014 March 31, 2014 Adjustments March 31, 2014 HCLP Hi-Crush Augusta HCLP Recasted Reconciliation of EBITDA and Distributable Cash Flow to Net Income: Net income $ 14,263 $ 7,394 $ (3,137) $ 18,520 Depreciation and depletion 996 480 - 1,476 Amortization expense 2,536 - - 2,536 Interest expense 1,373 37 - 1,410 EBITD $ 19,168 $ 7,911 $ (3,137) $ 23,942 Less: Cash interest paid (1,235) (37) - (1,272) Maintenance and replacement capital expenditures, incl. accrual for reserve replacement (540) (434) 5 (969) Add: Accretion of asset retirement obligation 29 28 - 57 Distributable Cash Flow $ 17,422 $ 7,468 $ (3,132) $ 21,758


