INVESTOR PRESENTATION NOVEMBER 2017

Forward Looking Statements Some of the information included herein may contain forward-looking statements within the meaning of the federal securities laws. Forward-looking statements give our current expectations and may contain projections of results of operations or of financial condition, or forecasts of future events. Words such as ―may,‖ ―assume,‖ ―forecast,‖ ―position,‖ ―predict,‖ ―strategy,‖ ―expect,‖ ―intend,‖ ―plan,‖ ―estimate,‖ ―anticipate,‖ ―could,‖ ―believe,‖ ―project,‖ ―budget,‖ ―potential,‖ or ―continue,‖ and similar expressions are used to identify forward-looking statements. They can be affected by assumptions used or by known or unknown risks or uncertainties. Consequently, no expected results of operations or financial condition or other forward-looking statements can be guaranteed. When considering these forward-looking statements, you should keep in mind the risk factors and other cautionary statements in Hi-Crush Partners LP’s (―Hi-Crush‖) reports filed with the Securities and Exchange Commission (―SEC‖), including those described under Item 1A, ―Risk Factors‖ of Hi-Crush’s Annual Report on Form 10-K for the fiscal year ended December 31, 2016. Actual results may vary materially. You are cautioned not to place undue reliance on any forward-looking statements. You should also understand that it is not possible to predict or identify all such factors and should not consider the risk factors in our reports filed with the SEC or the following list to be a complete statement of all potential risks and uncertainties. Factors that could cause our actual results to differ materially from the results contemplated by such forward- looking statements include: whether we are able to complete the Blair acquisition, the volume of frac sand we are able to sell; the price at which we are able to sell frac sand; the outcome of any litigation, claims or assessments, including unasserted claims; changes in the price and availability of natural gas or electricity; changes in prevailing economic conditions; and difficulty collecting receivables. All forward-looking statements are expressly qualified in their entirety by the foregoing cautionary statements. Hi-Crush’s forward-looking statements speak only as of the date made and Hi-Crush undertakes no obligation to update or revise its forward-looking statements, whether as a result of new information, future events or otherwise. 2
Business Update
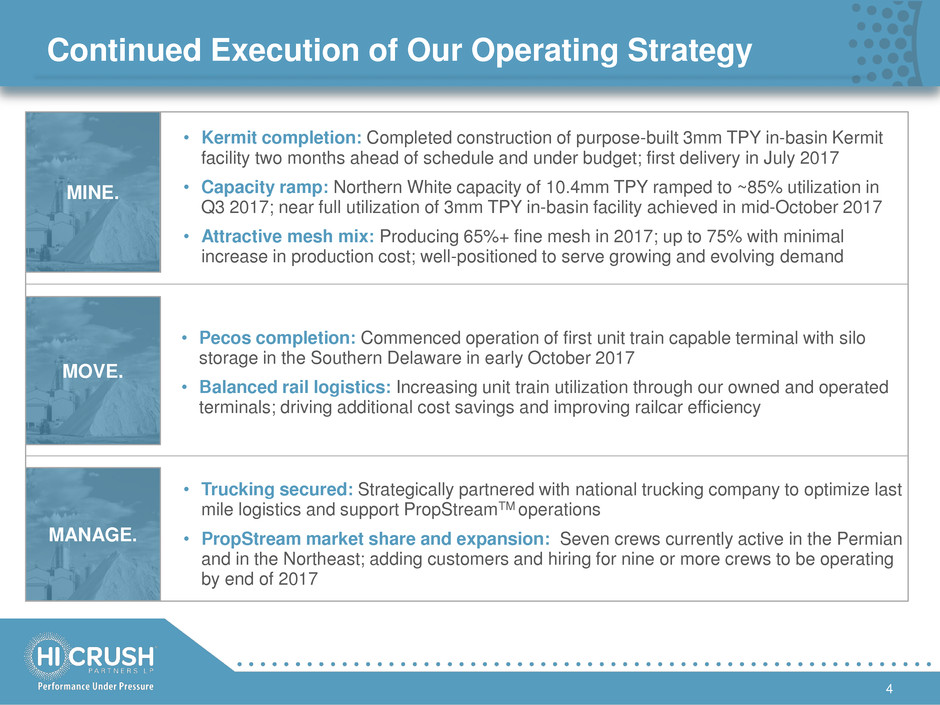
Continued Execution of Our Operating Strategy 4 MOVE. • Kermit completion: Completed construction of purpose-built 3mm TPY in-basin Kermit facility two months ahead of schedule and under budget; first delivery in July 2017 • Capacity ramp: Northern White capacity of 10.4mm TPY ramped to ~85% utilization in Q3 2017; near full utilization of 3mm TPY in-basin facility achieved in mid-October 2017 • Attractive mesh mix: Producing 65%+ fine mesh in 2017; up to 75% with minimal increase in production cost; well-positioned to serve growing and evolving demand MINE. • Pecos completion: Commenced operation of first unit train capable terminal with silo storage in the Southern Delaware in early October 2017 • Balanced rail logistics: Increasing unit train utilization through our owned and operated terminals; driving additional cost savings and improving railcar efficiency MANAGE. • Trucking secured: Strategically partnered with national trucking company to optimize last mile logistics and support PropStreamTM operations • PropStream market share and expansion: Seven crews currently active in the Permian and in the Northeast; adding customers and hiring for nine or more crews to be operating by end of 2017
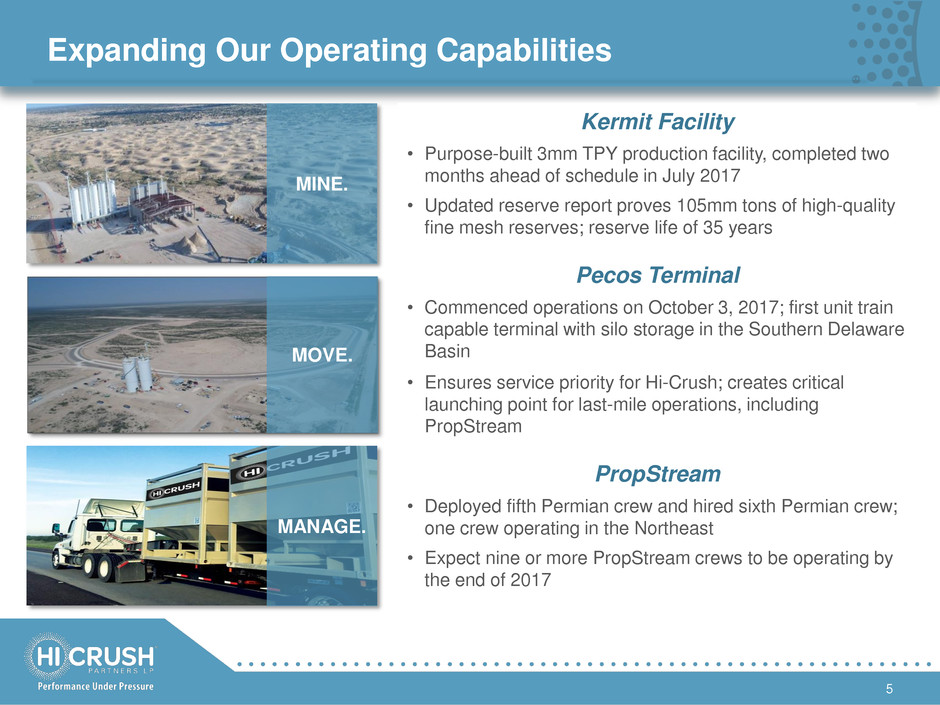
Kermit Facility • Purpose-built 3mm TPY production facility, completed two months ahead of schedule in July 2017 • Updated reserve report proves 105mm tons of high-quality fine mesh reserves; reserve life of 35 years Pecos Terminal • Commenced operations on October 3, 2017; first unit train capable terminal with silo storage in the Southern Delaware Basin • Ensures service priority for Hi-Crush; creates critical launching point for last-mile operations, including PropStream PropStream • Deployed fifth Permian crew and hired sixth Permian crew; one crew operating in the Northeast • Expect nine or more PropStream crews to be operating by the end of 2017 Expanding Our Operating Capabilities 5 MINE. MOVE. MANAGE.

Resuming Capital Return to Unitholders • Reinstituting our quarterly cash distribution at $0.15/unit effective for Q3 2017 ($0.60/unit on an annualized basis) • Plans to continue distribution growth in a meaningful and sustainable manner over the near and long-term • Board approval for a buyback program of up to $100mm • Unit repurchases will take place opportunistically • Credit agreements currently allow for repurchases of up to $20mm; will seek consent for repurchases of up to $100mm 6 Capital return program represents thoughtful balance of return methods; maximizes value to unitholders Distributions Buyback Program Laying the foundation for sustainable and meaningful growth in total unitholder return over the near and long-term

Our Unrivaled In-Basin Logistics Platform Advantage: Hi-Crush owned and operated network reduces trucking distance and costs 1) Estimate based on NavPort 2017 YTD reported proppant volumes as of 10/26/17 Northeast Service Footprint Permian Service Footprint 7
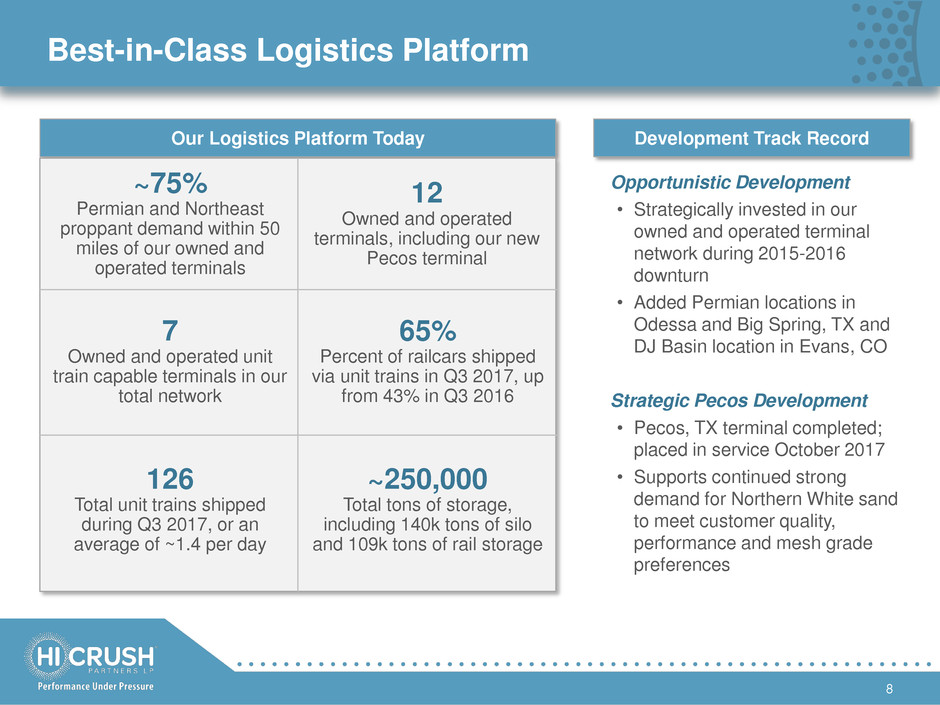
Development Track Record Our Logistics Platform Today ~250,000 Total tons of storage, including 140k tons of silo and 109k tons of rail storage ~75% Permian and Northeast proppant demand within 50 miles of our owned and operated terminals 12 Owned and operated terminals, including our new Pecos terminal 7 Owned and operated unit train capable terminals in our total network 65% Percent of railcars shipped via unit trains in Q3 2017, up from 43% in Q3 2016 126 Total unit trains shipped during Q3 2017, or an average of ~1.4 per day Best-in-Class Logistics Platform 8 Opportunistic Development • Strategically invested in our owned and operated terminal network during 2015-2016 downturn • Added Permian locations in Odessa and Big Spring, TX and DJ Basin location in Evans, CO Strategic Pecos Development • Pecos, TX terminal completed; placed in service October 2017 • Supports continued strong demand for Northern White sand to meet customer quality, performance and mesh grade preferences

Network Ownership Enhances Logistics Advantage 9 Note: Map does not reflect all third party terminals utilized by Hi-Crush to deliver sand to customers • Reduces potential for logistics bottlenecks • Priority at owned and operated terminals ensures quality customer service and fast turn times • Unit train capabilities at majority of 100+ origination / destination pairings • 61% of volumes delivered in-basin in Q3 2017 • 63% of Q3 2017 in-basin volumes delivered through Hi-Crush owned and operated terminals • Access to multiple third party terminals Bakken DJ Basin Permian SCOOP / STACK Eagle Ford Marcellus / Utica Logistics Network Kermit facility Rail-served Sand Facility Existing Terminal (HCLP owned) Pecos Terminal (HCLP owned) Mine-to-Well Sand Facility Existing Terminal (Third party) Wisconsin Augusta Wyeville Whitehall Blair Haynesville

Pecos Terminal Operating in the Delaware 10 Terminal Details • Operational as of October 3, 2017 • Complements Kermit facility as additional source point to mitigate logistical bottlenecks and meet customer needs for various mesh sizes • First-mover advantage with unit train capable terminal facility located directly on class-1 rail with 20,000 tons of vertical storage in the Southern Delaware; manifest capable with rail-to-truck operations • Furthers Hi-Crush strategy of owning and operating key logistics infrastructure to provide frac sand from the mine to the well site Dedicated rail park terminal for proppant, strategically located in the Delaware Basin
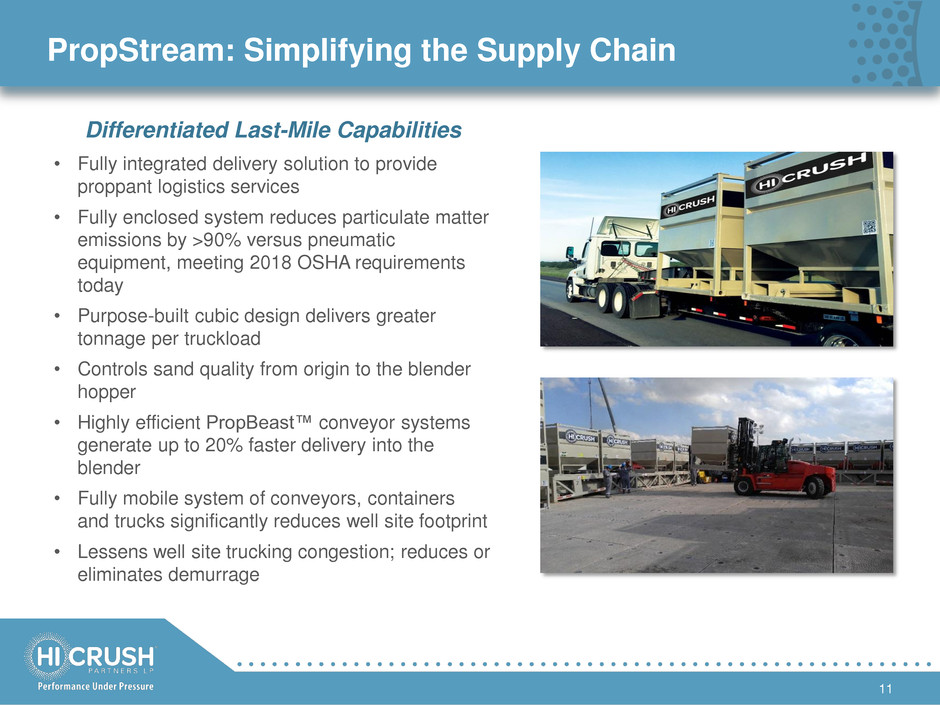
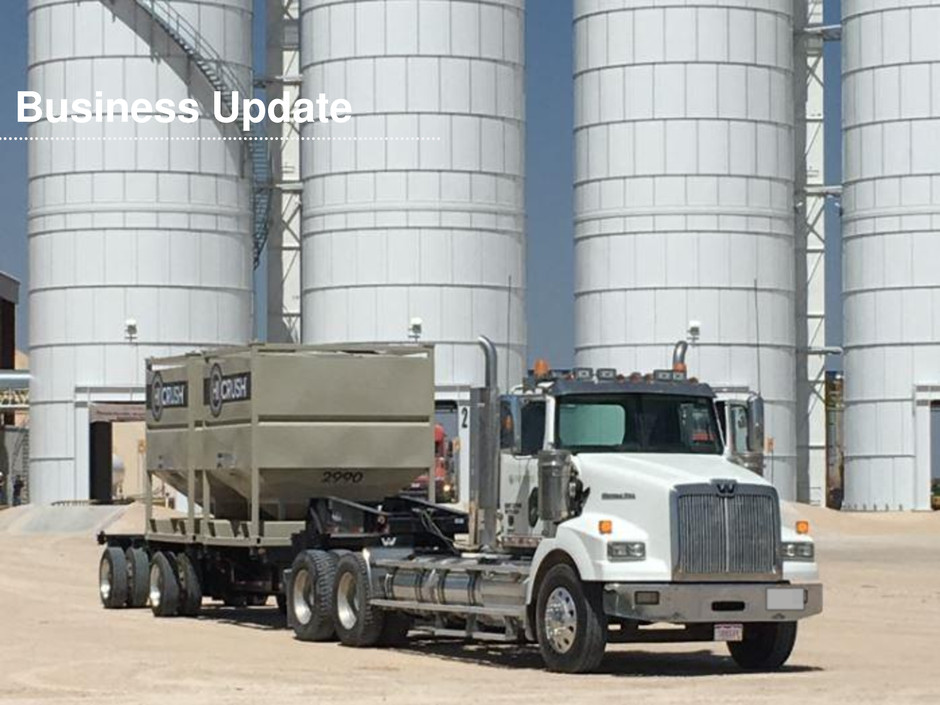
PropStream: Simplifying the Supply Chain 11 Differentiated Last-Mile Capabilities • Fully integrated delivery solution to provide proppant logistics services • Fully enclosed system reduces particulate matter emissions by >90% versus pneumatic equipment, meeting 2018 OSHA requirements today • Purpose-built cubic design delivers greater tonnage per truckload • Controls sand quality from origin to the blender hopper • Highly efficient PropBeast™ conveyor systems generate up to 20% faster delivery into the blender • Fully mobile system of conveyors, containers and trucks significantly reduces well site footprint • Lessens well site trucking congestion; reduces or eliminates demurrage

Outlook and Strategy

Volumes and Utilization Increasing to Meet Demand 13 898 1,024 1,181 1,482 1,195 1,190 1,409 1,209 963 849 1,083 1,359 1,385 2,113 2,456 0 500 1,000 1,500 2,000 2,500 3,000 3,500 Q1 '14 Q2 '14 Q3 '14 Q4 '14 Q1 '15 Q2 '15 Q3 '15 Q4 '15 Q1 '16 Q2 '16 Q3 '16 Q4 '16 Q1 '17 Q2 '17 Q3 '17Q4 '17E 000s tons Quarterly Volumes Sold Quarterly Nameplate Capacity Q4 2017 volumes expected to increase to 2.7mm – 2.9mm tons; sequential growth of 8-16% Q3 2017 volumes of 2.5mm tons represents 16% sequential growth HCLP Quarterly Volumes Sold Proactively investing to meet growing demand
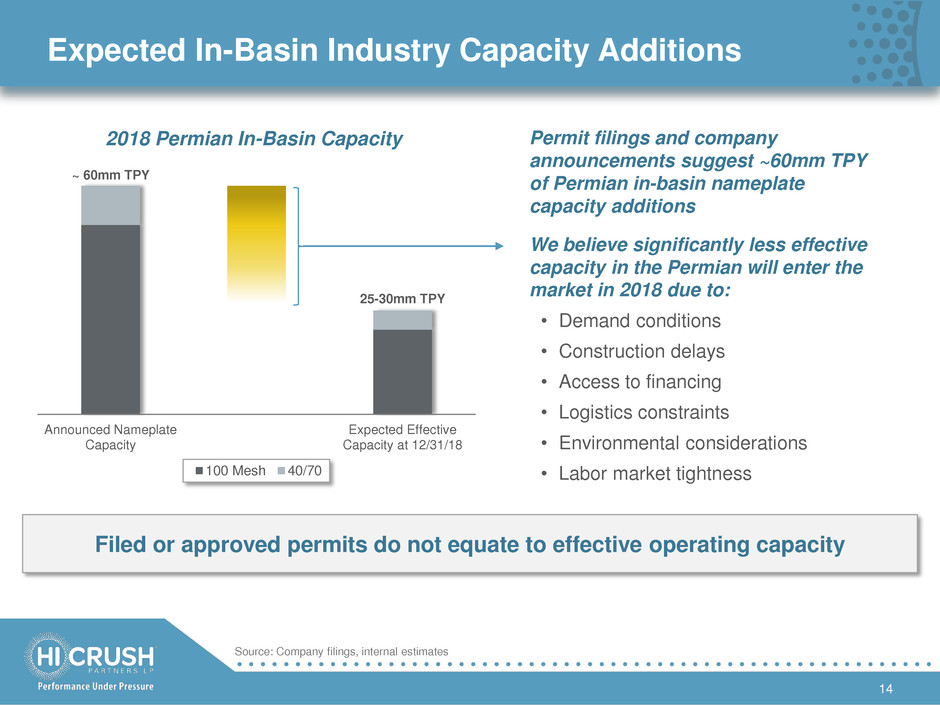
Expected In-Basin Industry Capacity Additions 14 Announced Nameplate Capacity Expected Effective Capacity at 12/31/18 100 Mesh 40/70 ~ 60mm TPY 25-30mm TPY Permit filings and company announcements suggest ~60mm TPY of Permian in-basin nameplate capacity additions We believe significantly less effective capacity in the Permian will enter the market in 2018 due to: • Demand conditions • Construction delays • Access to financing • Logistics constraints • Environmental considerations • Labor market tightness 2018 Permian In-Basin Capacity Filed or approved permits do not equate to effective operating capacity Source: Company filings, internal estimates
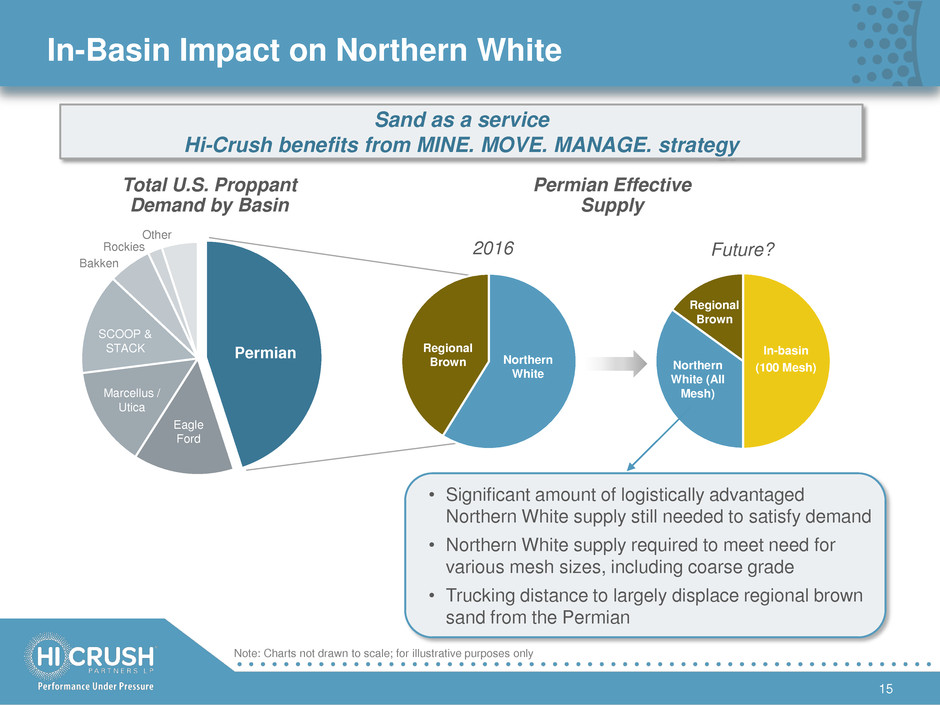
In-Basin Impact on Northern White 15 In-basin (100 Mesh) Northern White (All Mesh) Total U.S. Proppant Demand by Basin Permian Effective Supply Regional Brown 2016 Future? Sand as a service Hi-Crush benefits from MINE. MOVE. MANAGE. strategy • Significant amount of logistically advantaged Northern White supply still needed to satisfy demand • Northern White supply required to meet need for various mesh sizes, including coarse grade • Trucking distance to largely displace regional brown sand from the Permian Permian Regional Brown Northern White Eagle Ford Marcellus / Utica SCOOP & STACK Bakken Rockies Other Note: Charts not drawn to scale; for illustrative purposes only

PropStream Kermit Strong Financial Outlook Using Modest Assumptions 16 $mm $5.0 $10.0 $15.0 $20.0 $25.0 75% 39 78 117 156 195 80% 42 83 125 166 208 85% 44 88 133 177 221 90% 47 94 140 187 234 95% 49 99 148 198 247 3.0mm TPY ~$35/ton Kermit: ~$105mm 9 crews ~$1.5mm/crew PropStream: ~$13.5mm Northern White Contribution Margin Matrix $mm $5.0 $10.0 $15.0 $20.0 $25.0 75% 158 197 236 275 314 80% 160 202 243 285 327 85% 163 207 251 295 340 90% 165 212 259 306 353 95% 168 217 267 316 366 -- - N W Ut ili zat ion - -- ------------- Northern White Contribution Margin per Ton ---------- -- - N W Ut ili zat ion - -- Pre-G&A Margin Potential Northern White Contribution Margin Note: Northern White contribution margin based on total capacity of 10.4mm TPY ------------- Northern White Contribution Margin per Ton ---------- Historical Average Contribution Margin • 3Q14 - $44.00/ton • 4Q16 - $3.51/ton • 3Q17 - $19.39/ton

Leveraging Our Competitive Advantages 17 Factor Our Position The Hi-Crush Advantage Size and Scale Five facilities, 13.4mm tons of annual capacity Premier supplier with operational flexibility and ability to meet dynamic customer needs Supply Diversity Leading supplier of Northern White and in-basin frac sand 13.4mm TPY of low-cost, high-quality frac sand production with diversity of grades, geography and sand types Best-in-Class Assets Market-leading cost structure Best-in-class cost structure provides competitive, financial and operational advantages from mine to well site Distribution Network Class-1 rail origins; strategic owned terminal network; in- basin production Direct access to UP and CN railroads combined with Kermit facility and PropStream last-mile solution extends competitive advantages to the well site Customer Relationships Strong, long-term relationships Increasing profitable market share through close partnerships with key customers who are consolidating their supply sources Balance Sheet Ample liquidity and significant capital flexibility Maintain conservative position; strong ability to pursue potential attractive growth opportunities; focused on long-term capital returns Focused Strategy Clear strategy to win long- term Positioned to profitably capture long-term market share and meet industry’s evolving demands
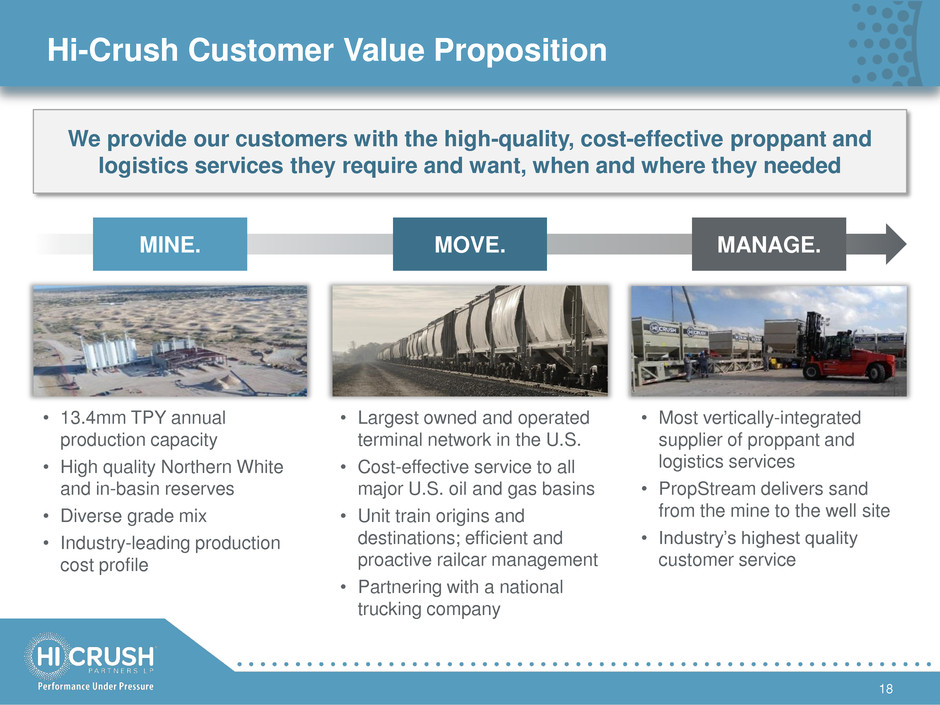
18 Hi-Crush Customer Value Proposition We provide our customers with the high-quality, cost-effective proppant and logistics services they require and want, when and where they needed • 13.4mm TPY annual production capacity • High quality Northern White and in-basin reserves • Diverse grade mix • Industry-leading production cost profile • Largest owned and operated terminal network in the U.S. • Cost-effective service to all major U.S. oil and gas basins • Unit train origins and destinations; efficient and proactive railcar management • Partnering with a national trucking company • Most vertically-integrated supplier of proppant and logistics services • PropStream delivers sand from the mine to the well site • Industry’s highest quality customer service MOVE. MINE. MANAGE.
Financial Results
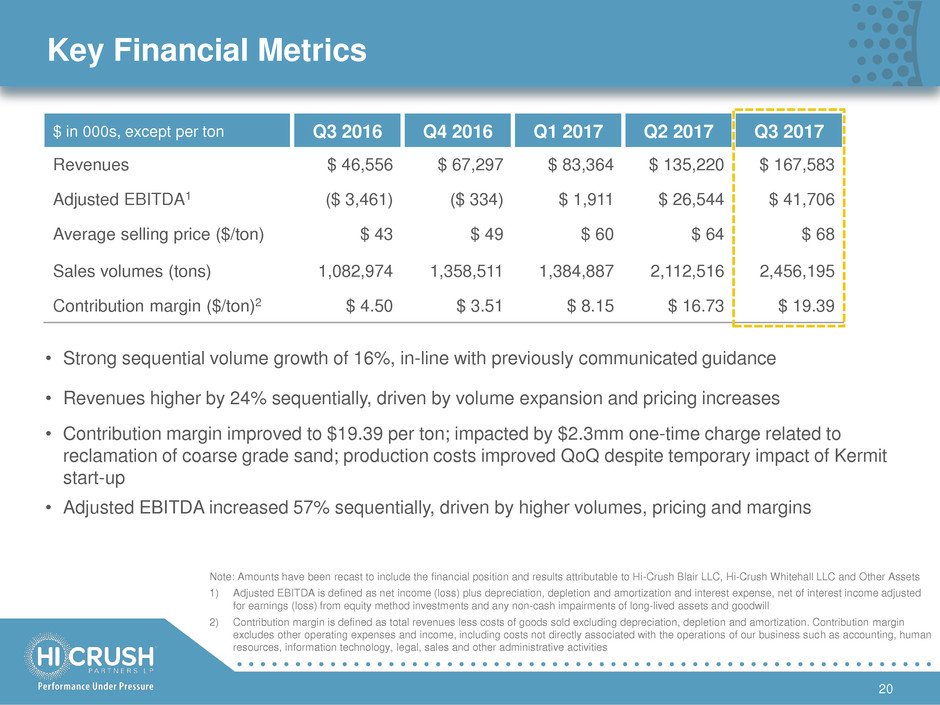
Key Financial Metrics 20 $ in 000s, except per ton Q3 2016 Q4 2016 Q1 2017 Q2 2017 Q3 2017 Revenues $ 46,556 $ 67,297 $ 83,364 $ 135,220 $ 167,583 Adjusted EBITDA1 ($ 3,461) ($ 334) $ 1,911 $ 26,544 $ 41,706 Average selling price ($/ton) $ 43 $ 49 $ 60 $ 64 $ 68 Sales volumes (tons) 1,082,974 1,358,511 1,384,887 2,112,516 2,456,195 Contribution margin ($/ton)2 $ 4.50 $ 3.51 $ 8.15 $ 16.73 $ 19.39 Note: Amounts have been recast to include the financial position and results attributable to Hi-Crush Blair LLC, Hi-Crush Whitehall LLC and Other Assets 1) Adjusted EBITDA is defined as net income (loss) plus depreciation, depletion and amortization and interest expense, net of interest income adjusted for earnings (loss) from equity method investments and any non-cash impairments of long-lived assets and goodwill 2) Contribution margin is defined as total revenues less costs of goods sold excluding depreciation, depletion and amortization. Contribution margin excludes other operating expenses and income, including costs not directly associated with the operations of our business such as accounting, human resources, information technology, legal, sales and other administrative activities • Strong sequential volume growth of 16%, in-line with previously communicated guidance • Revenues higher by 24% sequentially, driven by volume expansion and pricing increases • Contribution margin improved to $19.39 per ton; impacted by $2.3mm one-time charge related to reclamation of coarse grade sand; production costs improved QoQ despite temporary impact of Kermit start-up • Adjusted EBITDA increased 57% sequentially, driven by higher volumes, pricing and margins
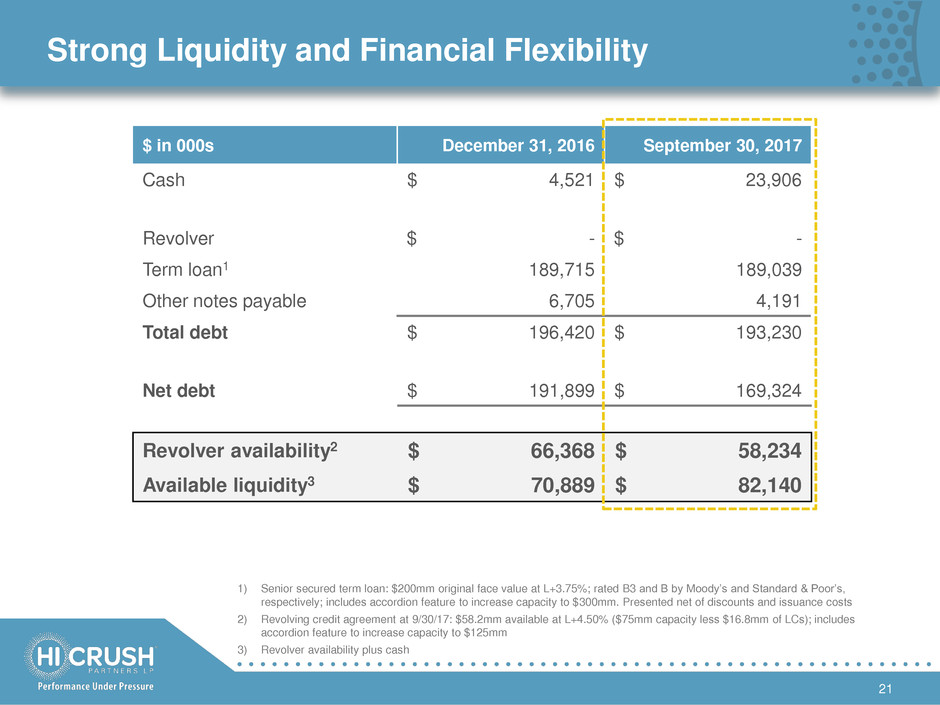
Strong Liquidity and Financial Flexibility 21 $ in 000s December 31, 2016 September 30, 2017 Cash $ 4,521 $ 23,906 Revolver $ - $ - Term loan1 189,715 189,039 Other notes payable 6,705 4,191 Total debt $ 196,420 $ 193,230 Net debt $ 191,899 $ 169,324 Revolver availability2 $ 66,368 $ 58,234 Available liquidity3 $ 70,889 $ 82,140 1) Senior secured term loan: $200mm original face value at L+3.75%; rated B3 and B by Moody’s and Standard & Poor’s, respectively; includes accordion feature to increase capacity to $300mm. Presented net of discounts and issuance costs 2) Revolving credit agreement at 9/30/17: $58.2mm available at L+4.50% ($75mm capacity less $16.8mm of LCs); includes accordion feature to increase capacity to $125mm 3) Revolver availability plus cash

Credit Facility Provides Liquidity and Flexibility 22 1) Leverage and interest coverage ratios for Q2 2017 – Q4 2017 based on annualized figures beginning April 1, 2017; equity cure provision available to address any potential EBITDA covenant shortfalls • Capacity: Total revolver capacity of $75mm provides flexibility • 2017 Covenants: Conservative balance sheet; in compliance with leverage ratio maximum and interest coverage minimum1 • Capital Return: No minimum asset coverage ratio or limitation on distribution payments; executed 6th amendment allowing for up to $20mm in unit buybacks 4.5x 4.0x 3.5x 1.5x 0x 1x 2x 3x 4x 5x Q3 2017 Q4 2017 Q1 2018 Leverage Ratio Maximum1 and thereafter Credit Facility Terms Covenant Overview Maximum Actual
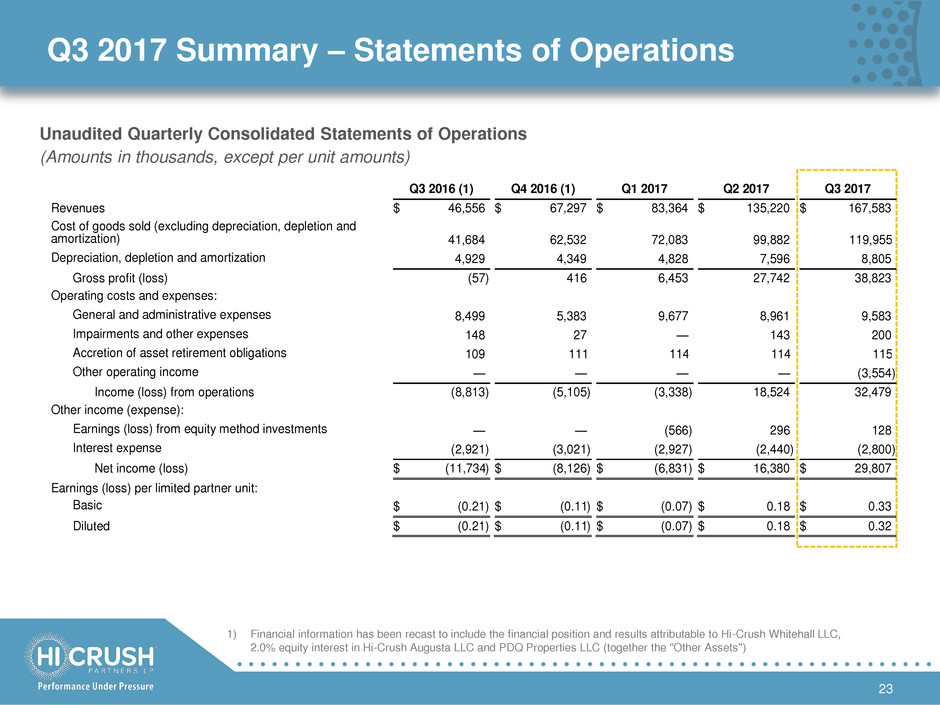
Q3 2017 Summary – Statements of Operations 23 1) Financial information has been recast to include the financial position and results attributable to Hi-Crush Whitehall LLC, 2.0% equity interest in Hi-Crush Augusta LLC and PDQ Properties LLC (together the "Other Assets") Unaudited Quarterly Consolidated Statements of Operations (Amounts in thousands, except per unit amounts) Q3 2016 (1) Q4 2016 (1) Q1 2017 Q2 2017 Q3 2017 Revenues $ 46,556 $ 67,297 $ 83,364 $ 135,220 $ 167,583 Cost of goods sold (excluding depreciation, depletion and amortization) 41,684 62,532 72,083 99,882 119,955 Depreciation, depletion and amortization 4,929 4,349 4,828 7,596 8,805 Gross profit (loss) (57 ) 416 6,453 27,742 38,823 Operating costs and expenses: General and administrative expenses 8,499 5,383 9,677 8,961 9,583 Impairments and other expenses 148 27 — 143 200 Accretion of asset retirement obligations 109 111 114 114 115 Other operating income — — — — (3,554 ) Income (loss) from operations (8,813 ) (5,105 ) (3,338 ) 18,524 32,479 Other income (expense): Earnings (loss) from equity method investments — — (566 ) 296 128 Interest expense (2,921 ) (3,021 ) (2,927 ) (2,440 ) (2,800 ) Net income (loss) $ (11,734 ) $ (8,126 ) $ (6,831 ) $ 16,380 $ 29,807 Earnings (loss) per limited partner unit: Basic $ (0.21 ) $ (0.11 ) $ (0.07 ) $ 0.18 $ 0.33 Diluted $ (0.21 ) $ (0.11 ) $ (0.07 ) $ 0.18 $ 0.32
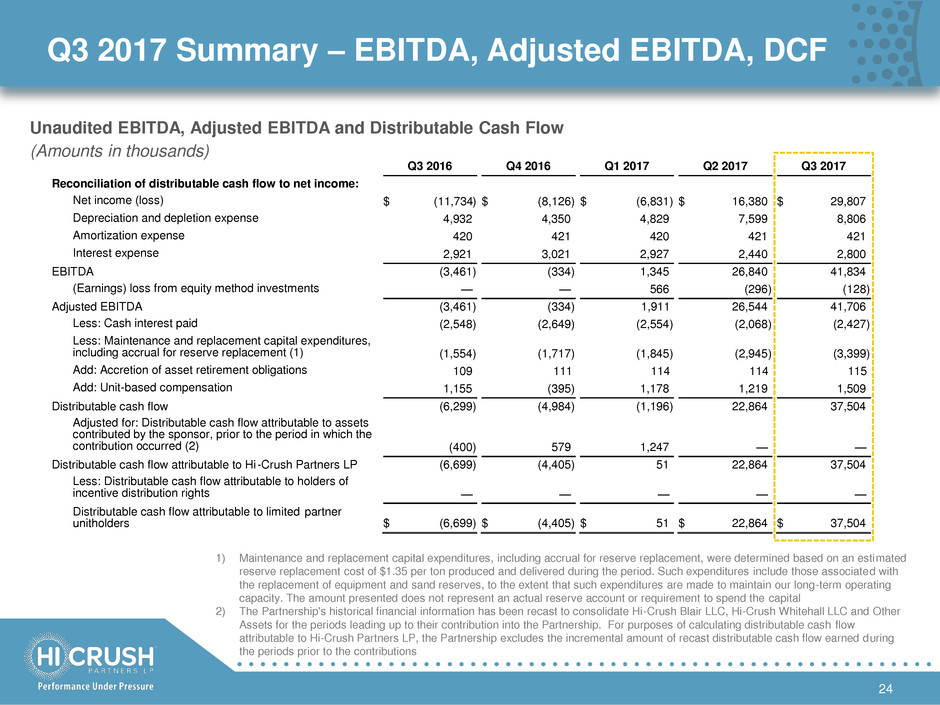
24 Q3 2017 Summary – EBITDA, Adjusted EBITDA, DCF Unaudited EBITDA, Adjusted EBITDA and Distributable Cash Flow (Amounts in thousands) 1) Maintenance and replacement capital expenditures, including accrual for reserve replacement, were determined based on an estimated reserve replacement cost of $1.35 per ton produced and delivered during the period. Such expenditures include those associated with the replacement of equipment and sand reserves, to the extent that such expenditures are made to maintain our long-term operating capacity. The amount presented does not represent an actual reserve account or requirement to spend the capital 2) The Partnership's historical financial information has been recast to consolidate Hi-Crush Blair LLC, Hi-Crush Whitehall LLC and Other Assets for the periods leading up to their contribution into the Partnership. For purposes of calculating distributable cash flow attributable to Hi-Crush Partners LP, the Partnership excludes the incremental amount of recast distributable cash flow earned during the periods prior to the contributions Q3 2016 Q4 2016 Q1 2017 Q2 2017 Q3 2017 Reconciliation of distributable cash flow to net income: Net income (loss) $ (11,734 ) $ (8,126 ) $ (6,831 ) $ 16,380 $ 29,807 Depreciation and depletion expense 4,932 4,350 4,829 7,599 8,806 Amortization expense 420 421 420 421 421 Interest expense 2,921 3,021 2,927 2,440 2,800 EBITDA (3,461 ) (334 ) 1,345 26,840 41,834 (Earnings) loss from equity method investments — — 566 (296 ) (128 ) Adjusted EBITDA (3,461 ) (334 ) 1,911 26,544 41,706 Less: Cash interest paid (2,548 ) (2,649 ) (2,554 ) (2,068 ) (2,427 ) Less: Maintenance and replacement capital expenditures, including accrual for reserve replacement (1) (1,554 ) (1,717 ) (1,845 ) (2,945 ) (3,399 ) Add: Accretion of asset retirement obligations 109 111 114 114 115 Add: Unit-based compensation 1,155 (395 ) 1,178 1,219 1,509 Distributable cash flow (6,299 ) (4,984 ) (1,196 ) 22,864 37,504 Adjusted for: Distributable cash flow attributable to assets contributed by the sponsor, prior to the period in which the contribution occurred (2) (400 ) 579 1,247 — — stributable cash flow attributable to Hi -Crush Partners LP (6,699 ) (4,405 ) 51 22,864 37,504 Less: Distributable cash flow attributable to holders of incentive distribution rights — — — — — Distributable cash flow attributable to limited partner unitholders $ (6,699 ) $ (4,405 ) $ 51 $ 22,864 $ 37,504
Appendix Investor Presentation | September, 2013 25

Hi-Crush’s Production Portfolio 26 Wyeville Blair Augusta Whitehall Kermit Capacity 1.85mm TPY 2.86mm TPY 2.86mm TPY 2.86mm TPY 3.00mm TPY Type Northern White Northern White Northern White Northern White In-basin Reserve Life1 41 years 41 years 14 years 28 years 35 years2 Takeaway Union Pacific Canadian National Union Pacific Canadian National Direct to Truck Location Wisconsin Wisconsin Wisconsin Wisconsin West Texas Status Active Active Active Active Active Site 1) Reserve life estimates based on reserve reports prepared by JT Boyd 2) Kermit reserve estimate revised to 104.7mm tons from 55.5mm tons based on reserve report prepared by JT Boyd as of 9/1/2017
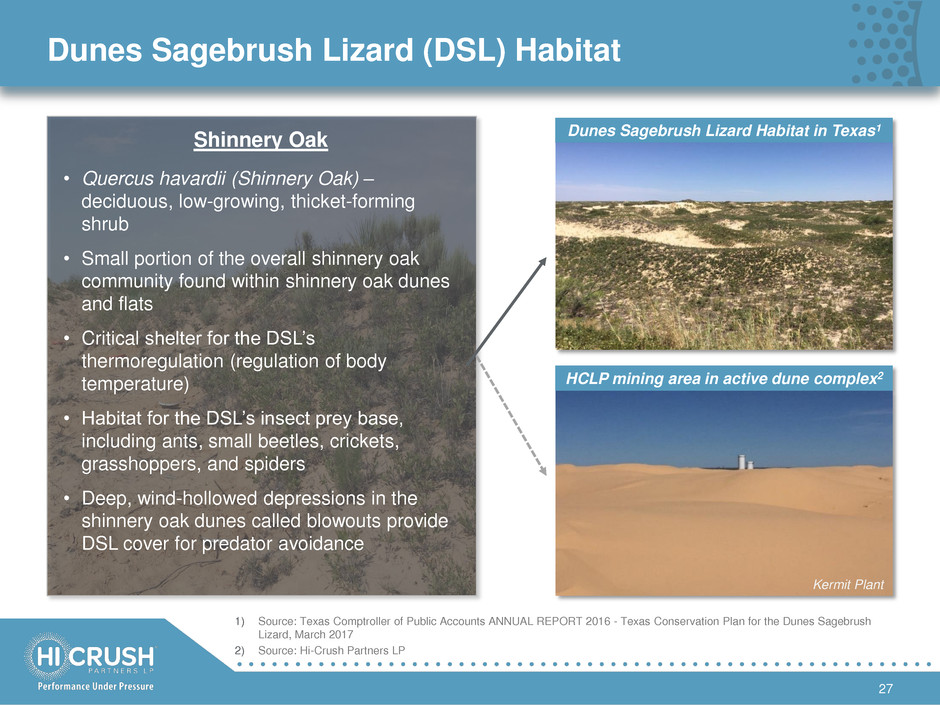
Dunes Sagebrush Lizard (DSL) Habitat 27 HCLP mining area in active dune complex2 Dunes Sagebrush Lizard Habitat in Texas1 1) Source: Texas Comptroller of Public Accounts ANNUAL REPORT 2016 - Texas Conservation Plan for the Dunes Sagebrush Lizard, March 2017 2) Source: Hi-Crush Partners LP Kermit Plant • Quercus havardii (Shinnery Oak) – deciduous, low-growing, thicket-forming shrub • Small portion of the overall shinnery oak community found within shinnery oak dunes and flats • Critical shelter for the DSL’s thermoregulation (regulation of body temperature) • Habitat for the DSL’s insect prey base, including ants, small beetles, crickets, grasshoppers, and spiders • Deep, wind-hollowed depressions in the shinnery oak dunes called blowouts provide DSL cover for predator avoidance Shinnery Oak
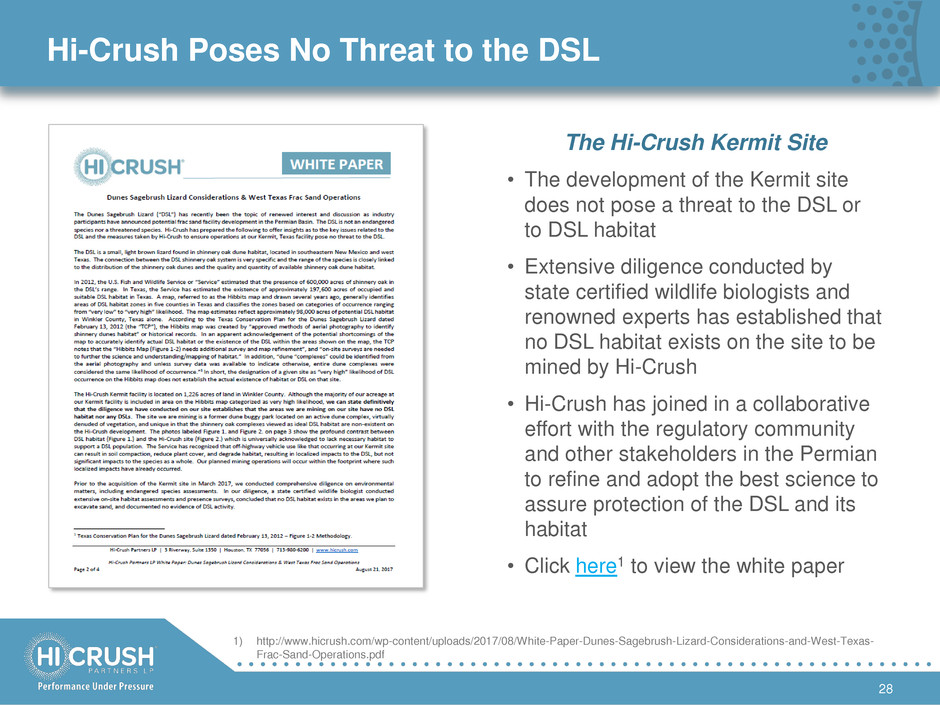
Hi-Crush Poses No Threat to the DSL 28 • The development of the Kermit site does not pose a threat to the DSL or to DSL habitat • Extensive diligence conducted by state certified wildlife biologists and renowned experts has established that no DSL habitat exists on the site to be mined by Hi-Crush • Hi-Crush has joined in a collaborative effort with the regulatory community and other stakeholders in the Permian to refine and adopt the best science to assure protection of the DSL and its habitat • Click here1 to view the white paper The Hi-Crush Kermit Site 1) http://www.hicrush.com/wp-content/uploads/2017/08/White-Paper-Dunes-Sagebrush-Lizard-Considerations-and-West-Texas- Frac-Sand-Operations.pdf
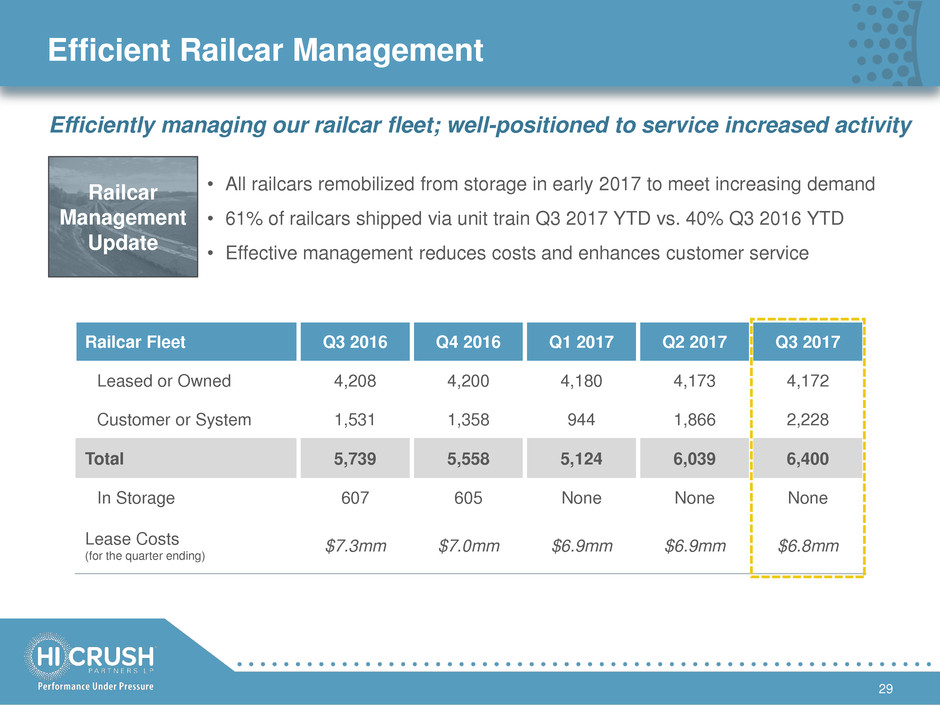
Efficient Railcar Management 29 Railcar Fleet Q3 2016 Q4 2016 Q1 2017 Q2 2017 Q3 2017 Leased or Owned 4,208 4,200 4,180 4,173 4,172 Customer or System 1,531 1,358 944 1,866 2,228 Total 5,739 5,558 5,124 6,039 6,400 In Storage 607 605 None None None Lease Costs (for the quarter ending) $7.3mm $7.0mm $6.9mm $6.9mm $6.8mm • All railcars remobilized from storage in early 2017 to meet increasing demand • 61% of railcars shipped via unit train Q3 2017 YTD vs. 40% Q3 2016 YTD • Effective management reduces costs and enhances customer service Railcar Management Update Efficiently managing our railcar fleet; well-positioned to service increased activity
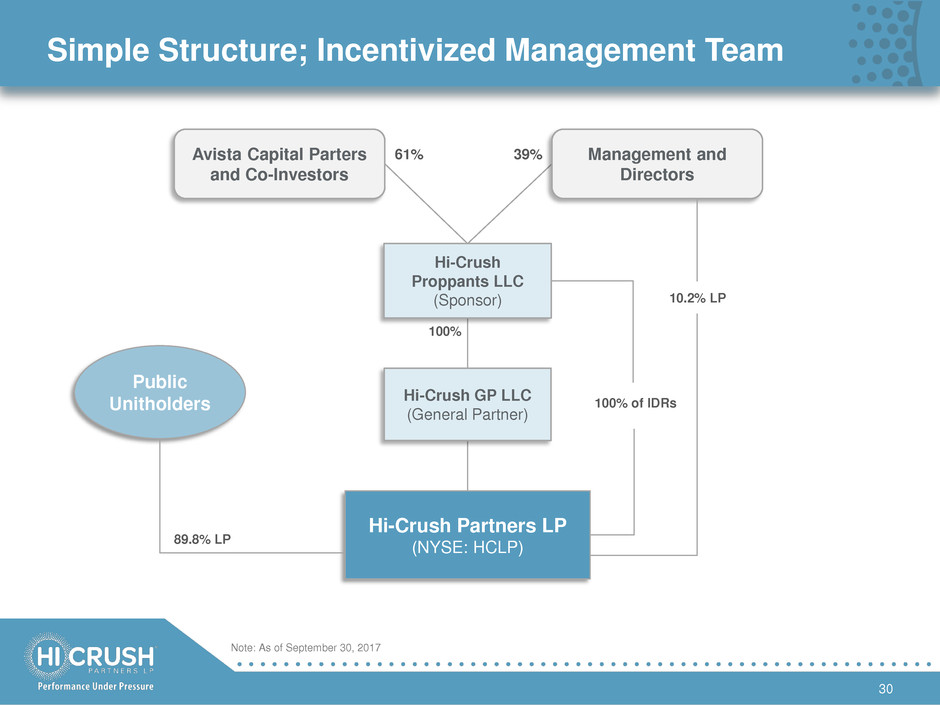
Simple Structure; Incentivized Management Team 30 39% 61% 100% 89.8% LP 100% of IDRs Hi-Crush Proppants LLC (Sponsor) Avista Capital Parters and Co-Investors Management and Directors Hi-Crush Partners LP (NYSE: HCLP) Public Unitholders Hi-Crush GP LLC (General Partner) 10.2% LP Note: As of September 30, 2017


