Investor Presentation February 2019 NYSE: HCLP hicrush.com
Forward Looking Statements and Non-GAAP Measures No Solicitation This communication relates to the proposed conversion of Hi-Crush Partners LP (the “Partnership”) from a Delaware limited partnership to a Delaware corporation (the”Conversion”). This communication is for informational purposes only and does not constitute a solicitation of any vote or approval, in any jurisdiction, pursuant to the Conversion or otherwise. Important Additional Information In connection with the Conversion, the Partnership has filed with the U.S. Securities and Exchange Commission (“SEC”) a proxy statement. The Conversion will be submitted to the Partnership’s unitholders for their consideration. The Partnership may also file other documents with the SEC regarding the Conversion. The definitive proxy statement will be sent to the unitholders of the Partnership. This document is not a substitute for the proxy statement that will be filed with the SEC or any other documents that the Partnership may file with the SEC or send to unitholders of the Partnership in connection with the Conversion. INVESTORS AND SECURITY HOLDERS OF THE PARTNERSHIP ARE URGED TO READ THE PROXY STATEMENT THAT HAS BEEN FILED REGARDING THE CONVERSION AND ALL OTHER RELEVANT DOCUMENTS THAT ARE FILED OR WILL BE FILED WITH THE SEC, AS WELL AS ANY AMENDMENTS OR SUPPLEMENTS TO THESE DOCUMENTS, CAREFULLY AND IN THEIR ENTIRETY BECAUSE THEY WILL CONTAIN IMPORTANT INFORMATION ABOUT THE CONVERSION AND RELATED MATTERS. Investors and security holders ARE able to obtain free copies of THE proxy statement and all other documents filed or that will be filed with the SEC by the Partnership through the website maintained by the SEC at http://www.sec.gov. Copies of documents filed with the SEC by the Partnership will be made available free of charge on the Partnership’s website at www.hicrush.com, under the heading “Investors,” or by directing a request to Investor Relations, Hi- Crush Partners LP, 1330 Post Oak Blvd., Suite 600, Houston, TX 77056, Tel. No. (713) 980-6270. Participants in the Solicitation The Partnership is managed and operated by the board of directors and executive officers of its general partner, Hi-Crush GP LLC (our “General Partner”). The Partnership, our General Partner and our General Partner’s directors and executive officers may be deemed to be participants in the solicitation of proxies in respect to the Conversion. Information regarding our General Partner’s directors and executive officers is contained in the Partnership’s Annual Report on Form 10-K for the 2017 fiscal year filed with the SEC on February 20, 2018, and certain of its Current Reports on Form 8-K. You can obtain a free copy of these documents at the SEC’s website at http://www.sec.gov or by accessing the Partnership’s website at www.hicrush.com. Investors may obtain additional information regarding the interests of those persons and other persons who may be deemed participants in the Conversion by reading the proxy statement regarding the Conversion. You may obtain free copies of this document as described above. Forward-Looking Statements and Cautionary Statements The foregoing contains “forward-looking statements” within the meaning of Section 27A of the Securities Act and Section 21E of the Exchange Act. All statements, other than statements of historical fact, included in this communication that address activities, events or developments that the Partnership expects, believes or anticipates will or may occur in the future are forward-looking statements. Words such as “estimate,” “project,” “predict,” “believe,” “expect,” “anticipate,” “potential,” “create,” “intend,” “could,” “may,” “foresee,” “plan,” “will,” “guidance,” “look,” “outlook,” “goal,” “future,” “assume,” “forecast,” “build,” “focus,” “work,” “continue” or the negative of such terms or other variations thereof and words and terms of similar substance used in connection with any discussion of future plans, actions, or events identify forward-looking statements. However, the absence of these words does not mean that the statements are not forward-looking. These forward-looking statements include, but are not limited to, statements regarding the Conversion, descriptions of the post-Conversion company and its operations, transition plans, opportunities and anticipated future performance. There are a number of risks and uncertainties that could cause actual results to differ materially from the forward-looking statements included in this communication. These include the expected timing and likelihood of completion of the Conversion, the occurrence of any event, change or other circumstances that could give rise to the abandonment of the proposed Conversion, the possibility that unitholders of the Partnership may not approve the Conversion, risks related to disruption of management time from ongoing business operations due to the Conversion, the risk that any announcements relating to the Conversion could have adverse effects on the market price of the Partnership’s common units, the risk that the Conversion and its announcement could have an adverse effect on the ability of the Partnership to retain customers and retain and hire key personnel and maintain relationships with their suppliers and customers and on their operating results and businesses generally, the risk the pending Conversion could distract management of the Partnership and that the Partnership will incur substantial costs, the risk that problems arise that may result in the post-Conversion company not operating as effectively and efficiently as expected, the risk that the post-Conversion company may be unable to achieve expected benefits of the Conversion or it may take longer than expected to achieve those benefits and other important factors that could cause actual results to differ materially from those projected. All such factors are difficult to predict and are beyond the Partnership’s control, including those detailed in the Partnership’s annual reports on Form 10-K, quarterly reports on Form 10-Q and current reports on Form 8-K that are available on its website at www.hicrush.com and on the SEC’s website at http://www.sec.gov. All forward-looking statements are based on assumptions that the Partnership believes to be reasonable but that may not prove to be accurate. Any forward-looking statement speaks only as of the date on which such statement is made, and the Partnership undertakes no obligation to correct or update any forward-looking statement, whether as a result of new information, future events or otherwise, except as required by applicable law. Readers are cautioned not to place undue reliance on these forward-looking statements that speak only as of the date hereof. Use of Non-GAAP Information This presentation may include non-GAAP financial measures. Such non-GAAP measures are not alternatives to GAAP measures, and you should not consider these non-GAAP measures in isolation or as a substitute for analysis of our results as reported under GAAP. For additional disclosure regarding such non-GAAP measures, including reconciliations to their most directly comparable GAAP measure, please refer to Hi-Crush’s most recent earnings release at www.hicrush.com. 2
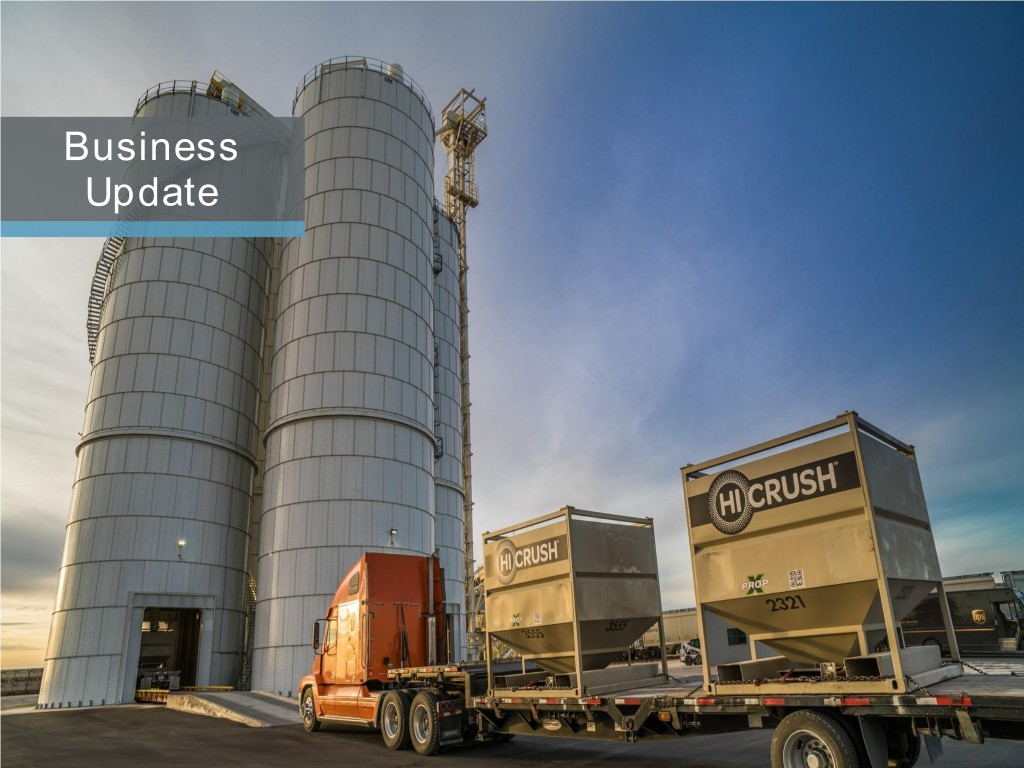
Business Update 3
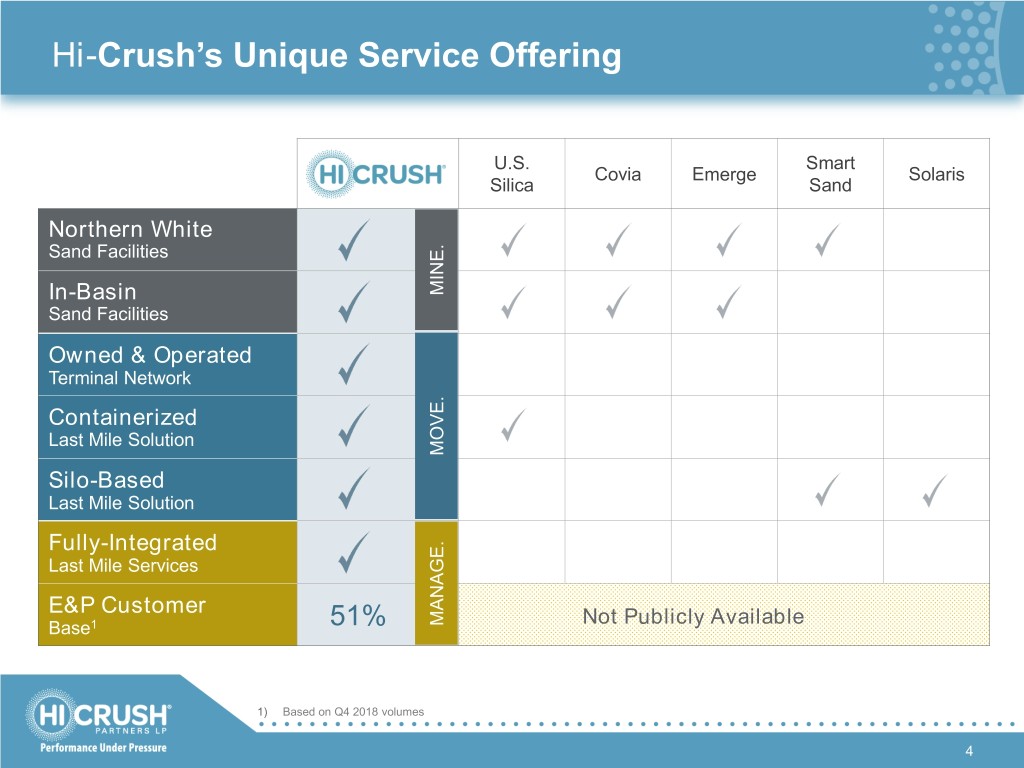
Hi-Crush’s Unique Service Offering U.S. Smart Covia Emerge Solaris Silica Sand Northern White Sand Facilities In-Basin MINE. Sand Facilities Owned & Operated Terminal Network Containerized Last Mile Solution MOVE. Silo-Based Last Mile Solution Fully-Integrated Last Mile Services E&P Customer MANAGE. Not Publicly Available Base1 51% 1) Based on Q4 2018 volumes 4
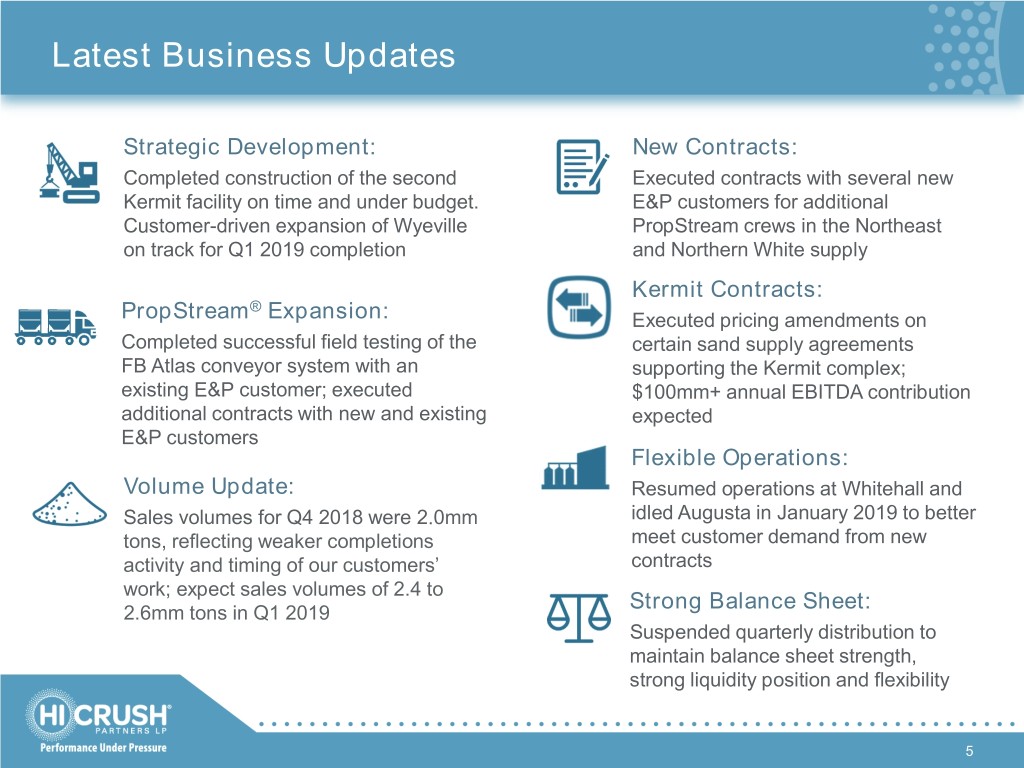
Latest Business Updates Strategic Development: New Contracts: Completed construction of the second Executed contracts with several new Kermit facility on time and under budget. E&P customers for additional Customer-driven expansion of Wyeville PropStream crews in the Northeast on track for Q1 2019 completion and Northern White supply Kermit Contracts: ® PropStream Expansion: Executed pricing amendments on Completed successful field testing of the certain sand supply agreements FB Atlas conveyor system with an supporting the Kermit complex; existing E&P customer; executed $100mm+ annual EBITDA contribution additional contracts with new and existing expected E&P customers Flexible Operations: Volume Update: Resumed operations at Whitehall and Sales volumes for Q4 2018 were 2.0mm idled Augusta in January 2019 to better tons, reflecting weaker completions meet customer demand from new activity and timing of our customers’ contracts work; expect sales volumes of 2.4 to Strong Balance Sheet: 2.6mm tons in Q1 2019 Suspended quarterly distribution to maintain balance sheet strength, strong liquidity position and flexibility 5
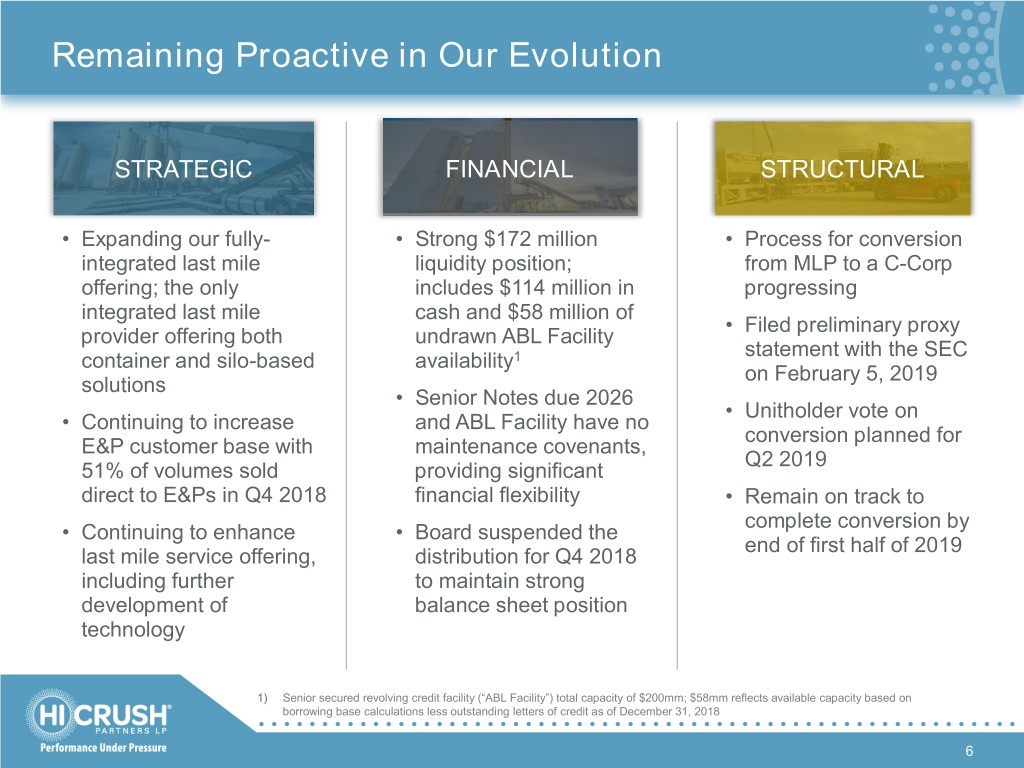
Remaining Proactive in Our Evolution STRATEGIC FINANCIAL STRUCTURAL • Expanding our fully- • Strong $172 million • Process for conversion integrated last mile liquidity position; from MLP to a C-Corp offering; the only includes $114 million in progressing integrated last mile cash and $58 million of • Filed preliminary proxy provider offering both undrawn ABL Facility statement with the SEC container and silo-based availability1 on February 5, 2019 solutions • Senior Notes due 2026 • Unitholder vote on • Continuing to increase and ABL Facility have no conversion planned for E&P customer base with maintenance covenants, Q2 2019 51% of volumes sold providing significant direct to E&Ps in Q4 2018 financial flexibility • Remain on track to complete conversion by • Continuing to enhance • Board suspended the end of first half of 2019 last mile service offering, distribution for Q4 2018 including further to maintain strong development of balance sheet position technology 1) Senior secured revolving credit facility (“ABL Facility”) total capacity of $200mm; $58mm reflects available capacity based on borrowing base calculations less outstanding letters of credit as of December 31, 2018 6
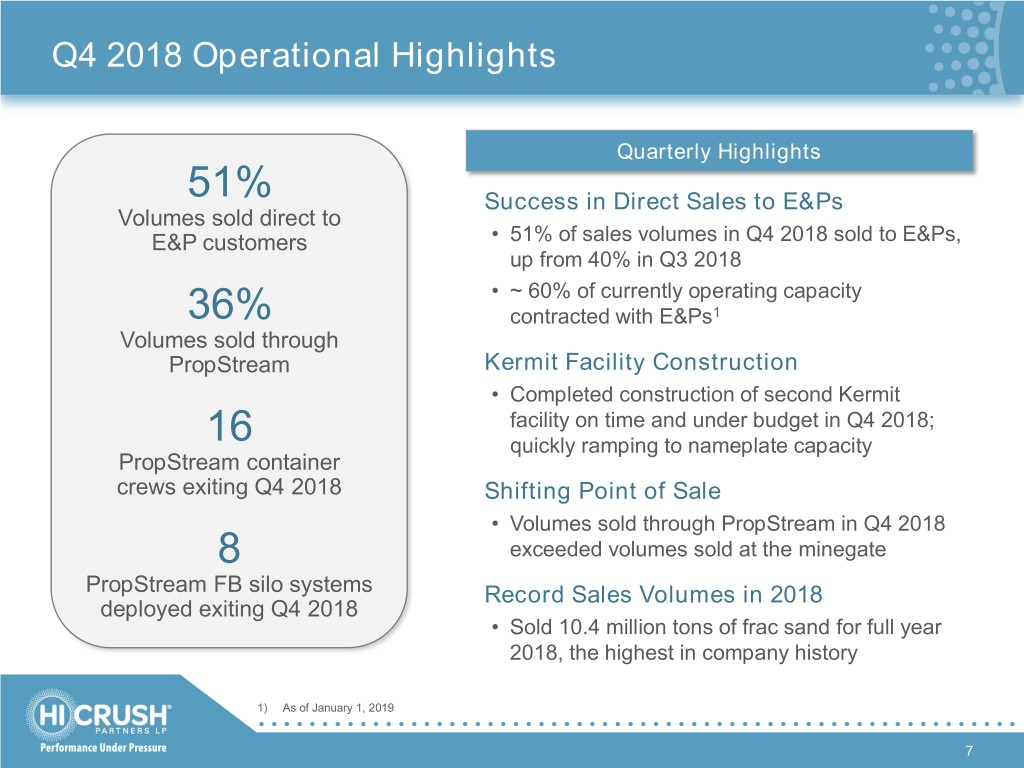
Q4 2018 Operational Highlights Quarterly Highlights 51% Success in Direct Sales to E&Ps Volumes sold direct to E&P customers • 51% of sales volumes in Q4 2018 sold to E&Ps, up from 40% in Q3 2018 • ~ 60% of currently operating capacity 36% contracted with E&Ps1 Volumes sold through PropStream Kermit Facility Construction • Completed construction of second Kermit facility on time and under budget in Q4 2018; 16 quickly ramping to nameplate capacity PropStream container crews exiting Q4 2018 Shifting Point of Sale • Volumes sold through PropStream in Q4 2018 8 exceeded volumes sold at the minegate PropStream FB silo systems Record Sales Volumes in 2018 deployed exiting Q4 2018 • Sold 10.4 million tons of frac sand for full year 2018, the highest in company history 1) As of January 1, 2019 7

Continued Focus on Logistics Expansion Hi-Crush continues to execute on its Mine. Move. Manage. operating strategy through the expansion of its industry-leading proppant logistics platform Platform Evolution • FB Atlas top-fill conveyor system successfully field tested • Positive customer feedback received on diversified last mile silo system offering, resulting in further deployment Operational Improvements • Enhanced operations at Pecos terminal by utilizing land to forward stage sand • Facilitates customer access and minimizes logistics bottlenecks Continued Investment • Investing in systems and technology to enhance customer information flow, product tracking and operational efficiencies • Adding talent to enhance our last mile expertise 8
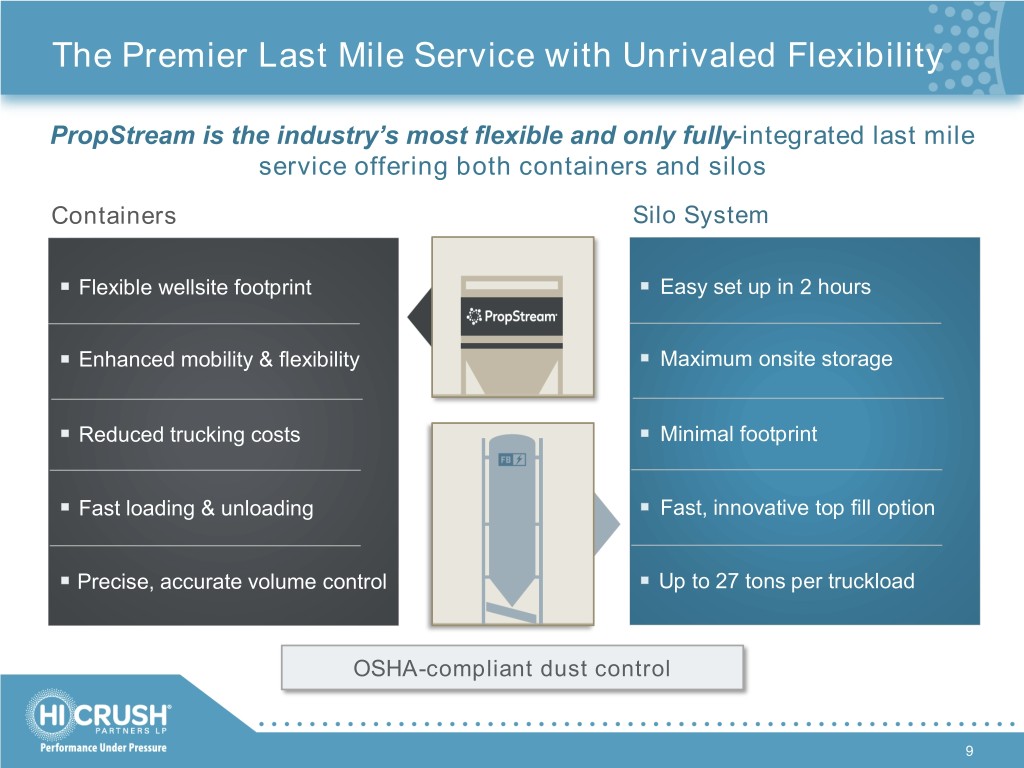
The Premier Last Mile Service with Unrivaled Flexibility PropStream is the industry’s most flexible and only fully-integrated last mile service offering both containers and silos Containers Silo System Flexible wellsite footprint Easy set up in 2 hours Enhanced mobility & flexibility Maximum onsite storage Reduced trucking costs Minimal footprint Fast loading & unloading Fast, innovative top fill option Precise, accurate volume control Up to 27 tons per truckload OSHA-compliant dust control 9

Growing Relationships with E&Ps PropStream’s integrated proppant logistics service complements Hi-Crush’s focus on serving E&P customers 1 Container Crews • 51% of Q4 2018 volumes sold direct Silo Systems1 51% to E&Ps % E&P Sales Volumes • Signed agreement with Chesapeake 40% Energy for supply of Northern White 8 sand in the Northeast and Powder 33% River Basin, and deployment of an 31% incremental PropStream container 25% 16 16 crew to the Northeast 14 12 • Signed agreement with CNX 14% 10 Resources for supply of Northern 7% White sand and deployment of 1% 6 incremental FB silo system for their 0% 2 1 4 operations in the Northeast beginning in Q1 2019 • Signed contracts with additional E&P customers for sand and/or services beginning in Q1 2019 1) Reflects crews and deployed systems at the end of each respective quarter 10

Hi-Crush Benefits of Aligning with E&P Customers Relationship Driven: Better Visibility: Long project lead times and Closer relationships provide significant capital greater visibility into requirements drive E&Ps to constantly-evolving activity, value strategic relationships demand trends and market with suppliers who offer fundamentals differentiated solutions Growth Opportunity: Less Volatility: Addressing E&Ps’ currently Partnering with the right E&P underserved need for a customers reduces volatility as direct-sourced, preferred drilling and completion provider of flexible, full- programs are more consistent scope proppant and through commodity cycles logistics solutions 11
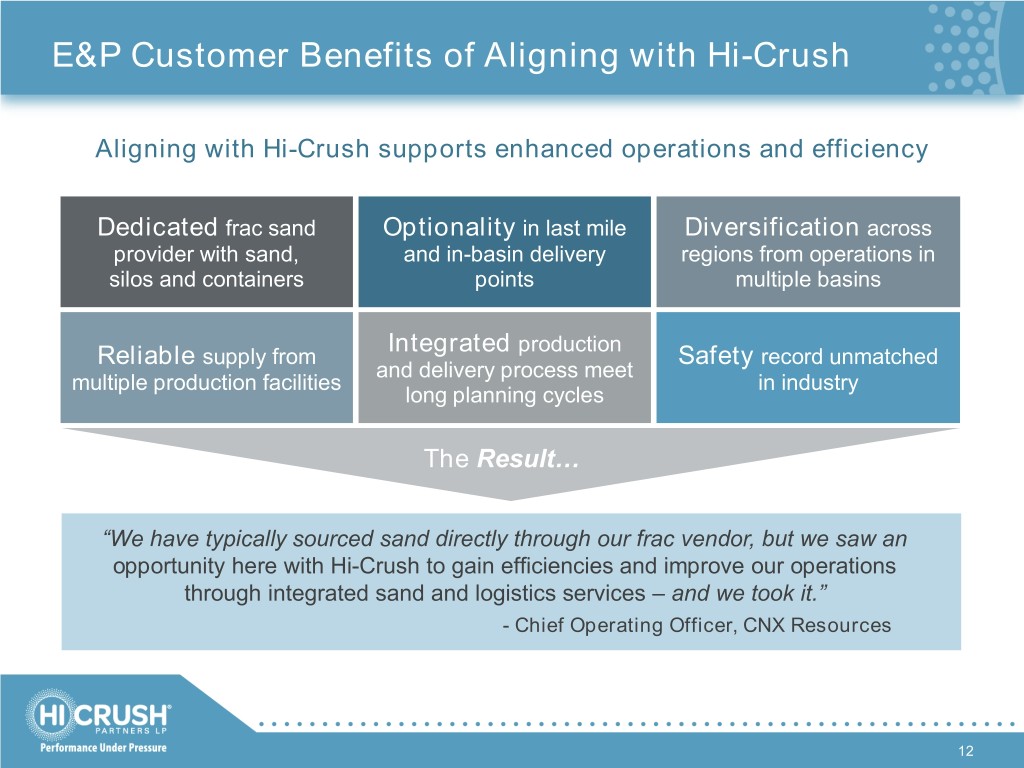
E&P Customer Benefits of Aligning with Hi-Crush Aligning with Hi-Crush supports enhanced operations and efficiency Dedicated frac sand Optionality in last mile Diversification across provider with sand, and in-basin delivery regions from operations in silos and containers points multiple basins Integrated production Reliable supply from Safety record unmatched and delivery process meet multiple production facilities in industry long planning cycles The Result… “We have typically sourced sand directly through our frac vendor, but we saw an opportunity here with Hi-Crush to gain efficiencies and improve our operations through integrated sand and logistics services – and we took it.” - Chief Operating Officer, CNX Resources 12
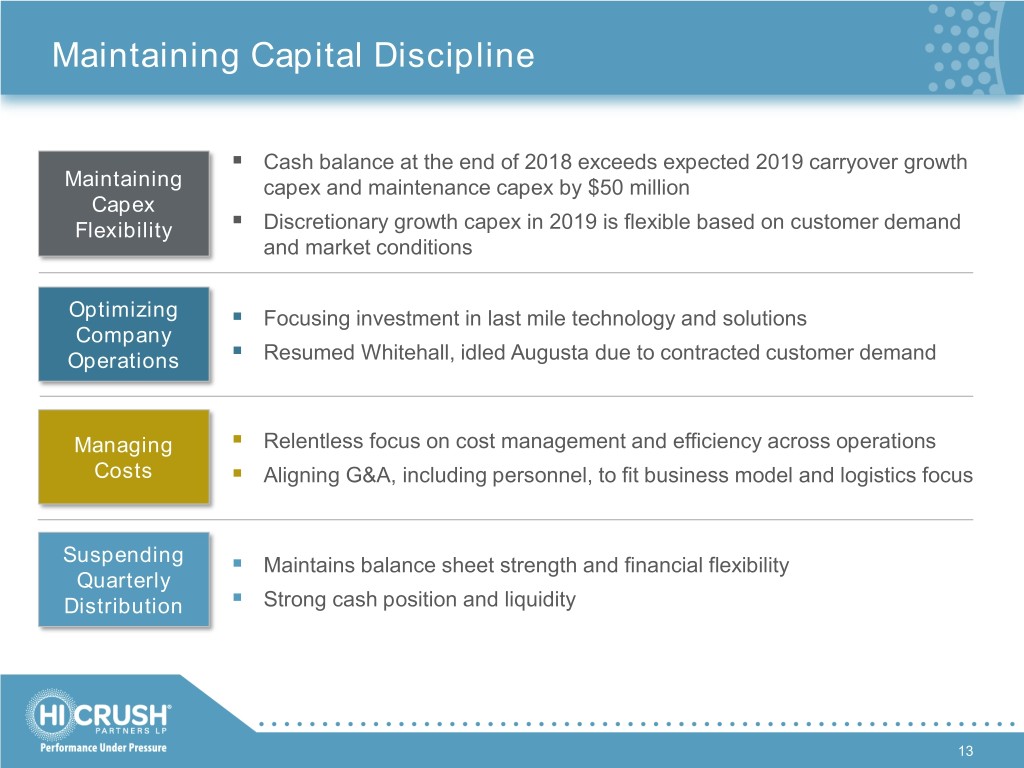
Maintaining Capital Discipline . Cash balance at the end of 2018 exceeds expected 2019 carryover growth Maintaining capex and maintenance capex by $50 million Capex . Flexibility Discretionary growth capex in 2019 is flexible based on customer demand and market conditions Optimizing . Focusing investment in last mile technology and solutions Company . Operations Resumed Whitehall, idled Augusta due to contracted customer demand . Managing Relentless focus on cost management and efficiency across operations Costs . Aligning G&A, including personnel, to fit business model and logistics focus Suspending . Maintains balance sheet strength and financial flexibility Quarterly . Distribution Strong cash position and liquidity 13
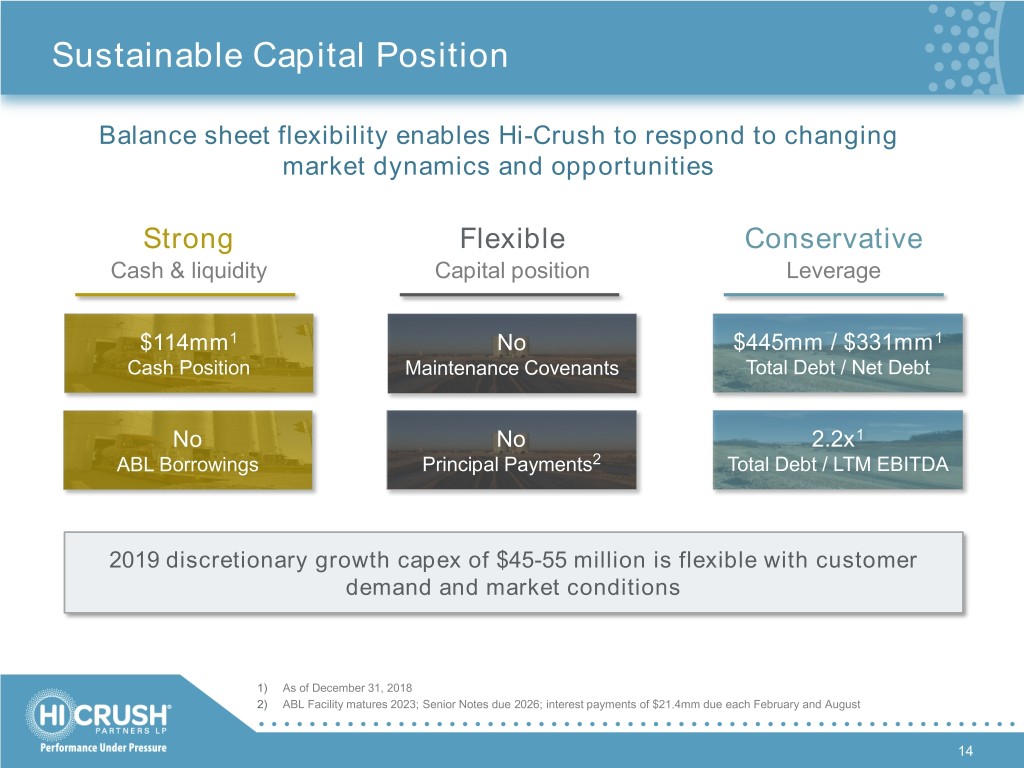
Sustainable Capital Position Balance sheet flexibility enables Hi-Crush to respond to changing market dynamics and opportunities Strong Flexible Conservative Cash & liquidity Capital position Leverage $114mm1 No $445mm / $331mm1 Cash Position Maintenance Covenants Total Debt / Net Debt No No 2.2x1 ABL Borrowings Principal Payments2 Total Debt / LTM EBITDA 2019 discretionary growth capex of $45-55 million is flexible with customer demand and market conditions 1) As of December 31, 2018 2) ABL Facility matures 2023; Senior Notes due 2026; interest payments of $21.4mm due each February and August 14
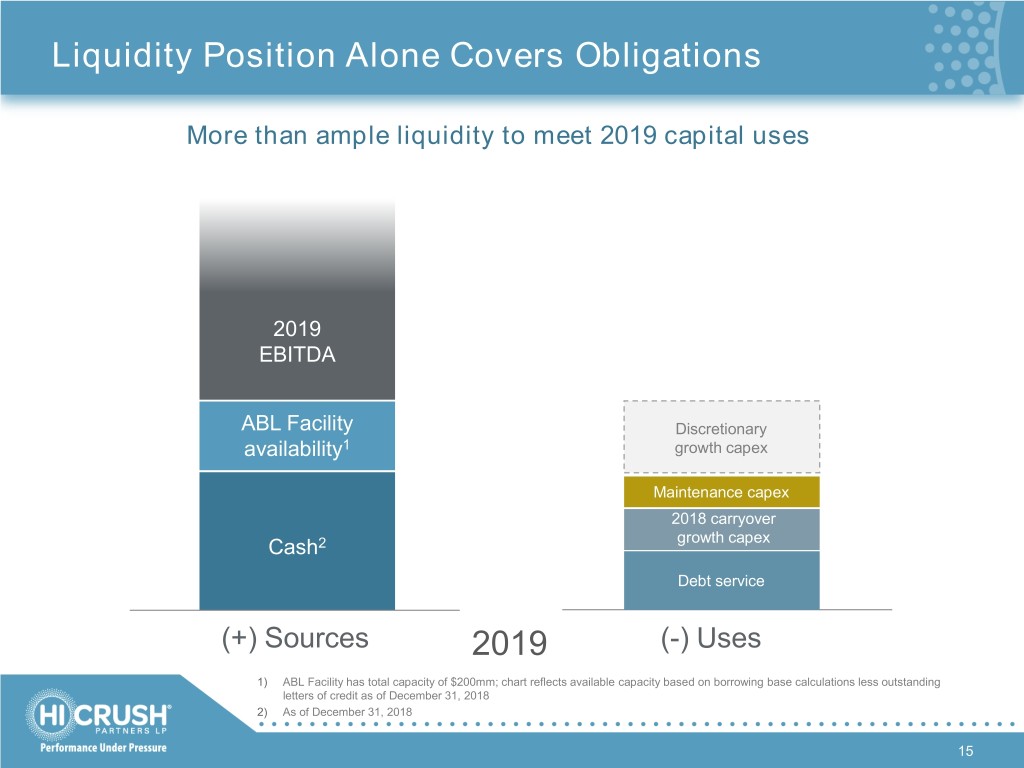
Liquidity Position Alone Covers Obligations More than ample liquidity to meet 2019 capital uses 2019 EBITDA ABL Facility Discretionary availability1 growth capex Maintenance capex 2018 carryover Cash2 growth capex Debt service (+) Sources 2019 (-) Uses 1) ABL Facility has total capacity of $200mm; chart reflects available capacity based on borrowing base calculations less outstanding letters of credit as of December 31, 2018 2) As of December 31, 2018 15
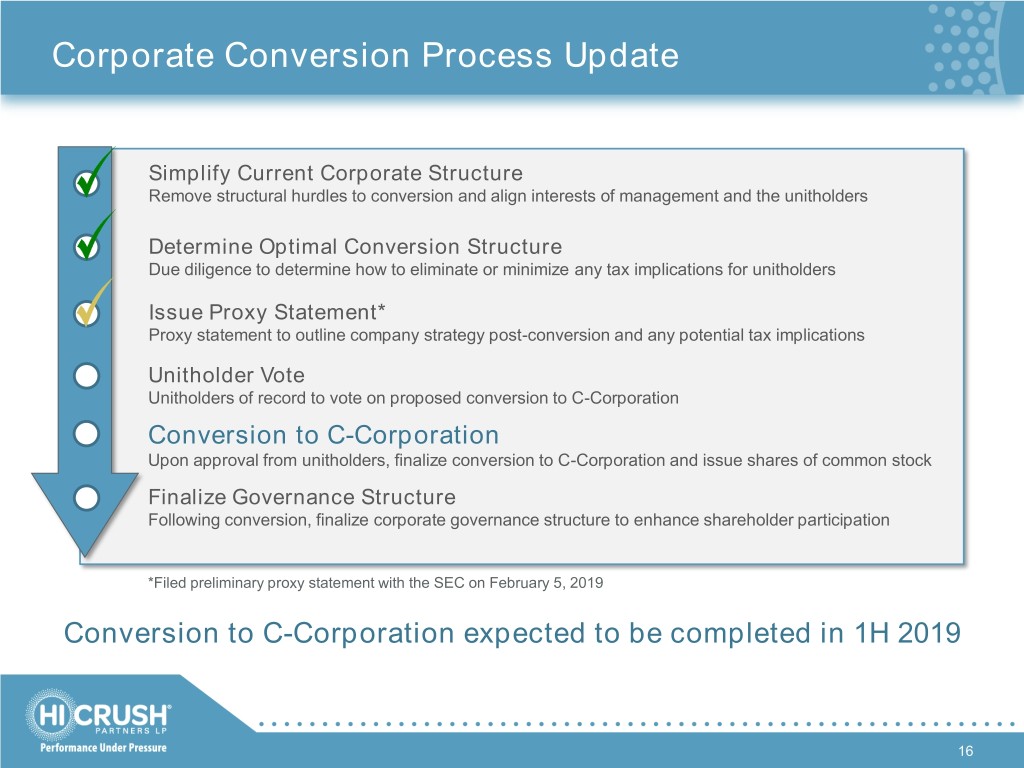
Corporate Conversion Process Update Simplify Current Corporate Structure Remove structural hurdles to conversion and align interests of management and the unitholders Determine Optimal Conversion Structure Due diligence to determine how to eliminate or minimize any tax implications for unitholders Issue Proxy Statement* Proxy statement to outline company strategy post-conversion and any potential tax implications Unitholder Vote Unitholders of record to vote on proposed conversion to C-Corporation Conversion to C-Corporation Upon approval from unitholders, finalize conversion to C-Corporation and issue shares of common stock Finalize Governance Structure Following conversion, finalize corporate governance structure to enhance shareholder participation *Filed preliminary proxy statement with the SEC on February 5, 2019 Conversion to C-Corporation expected to be completed in 1H 2019 16
Business Overview
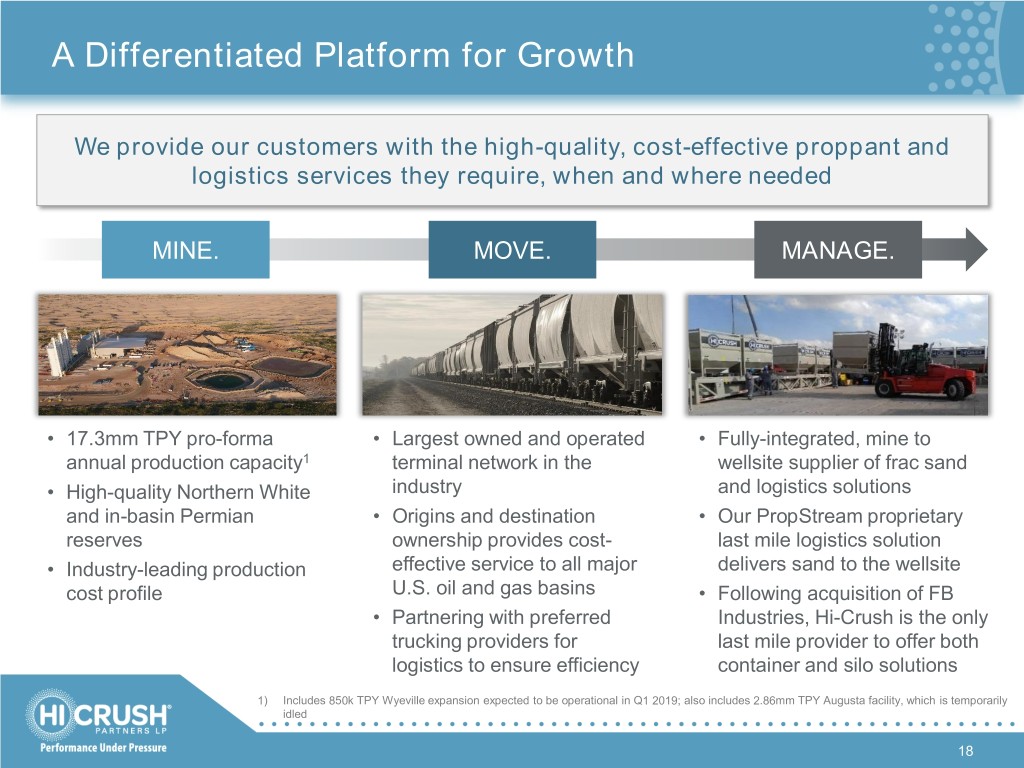
A Differentiated Platform for Growth We provide our customers with the high-quality, cost-effective proppant and logistics services they require, when and where needed MINE. MOVE. MANAGE. • 17.3mm TPY pro-forma • Largest owned and operated • Fully-integrated, mine to annual production capacity1 terminal network in the wellsite supplier of frac sand • High-quality Northern White industry and logistics solutions and in-basin Permian • Origins and destination • Our PropStream proprietary reserves ownership provides cost- last mile logistics solution • Industry-leading production effective service to all major delivers sand to the wellsite cost profile U.S. oil and gas basins • Following acquisition of FB • Partnering with preferred Industries, Hi-Crush is the only trucking providers for last mile provider to offer both logistics to ensure efficiency container and silo solutions 1) Includes 850k TPY Wyeville expansion expected to be operational in Q1 2019; also includes 2.86mm TPY Augusta facility, which is temporarily idled 18
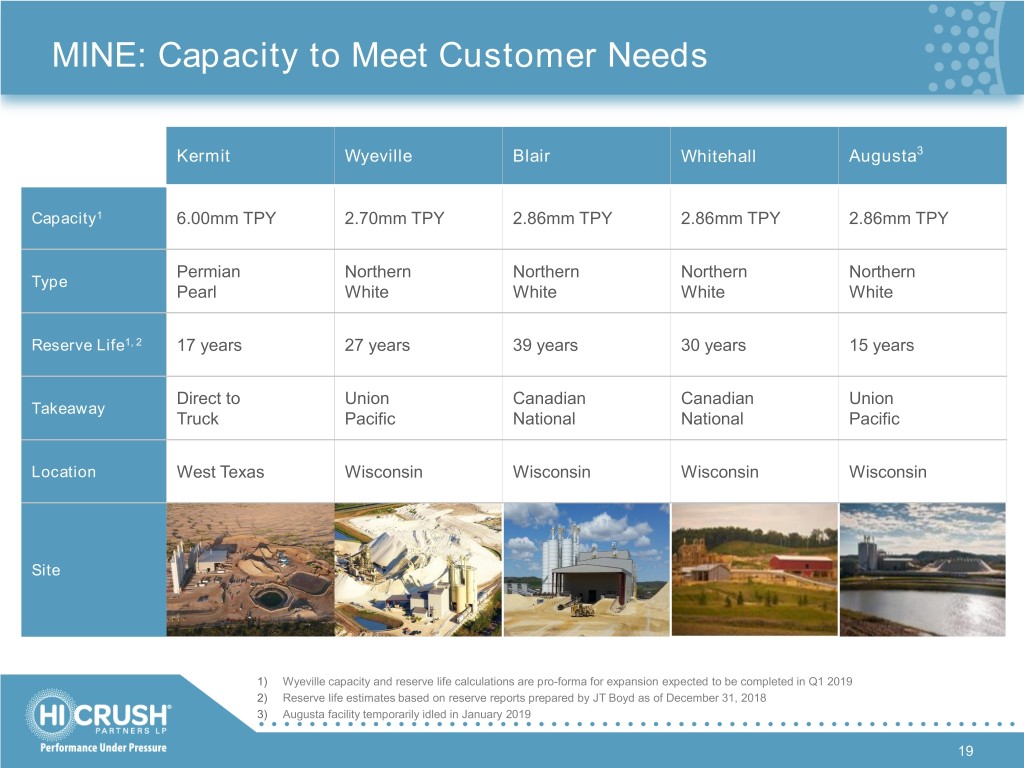
MINE: Capacity to Meet Customer Needs Kermit Wyeville Blair Whitehall Augusta3 Capacity1 6.00mm TPY 2.70mm TPY 2.86mm TPY 2.86mm TPY 2.86mm TPY Permian Northern Northern Northern Northern Type Pearl White White White White Reserve Life1, 2 17 years 27 years 39 years 30 years 15 years Direct to Union Canadian Canadian Union Takeaway Truck Pacific National National Pacific Location West Texas Wisconsin Wisconsin Wisconsin Wisconsin Site 1) Wyeville capacity and reserve life calculations are pro-forma for expansion expected to be completed in Q1 2019 2) Reserve life estimates based on reserve reports prepared by JT Boyd as of December 31, 2018 3) Augusta facility temporarily idled in January 2019 19

MOVE: Owned and Operated Logistics Network Wisconsin Logistics Network Bakken Augusta • Ensures customer service priority and quality, and Blair lowers cost to deliver Whitehall volumes in basin by Marcellus / avoiding transload fees Wyeville Utica paid to third-party service providers • Provides flexibility to address changing demand DJ Basin dynamics, allows for increased profitability from third-party sand transactions, and Kermit Complex proactively mitigates Northern White Sand Facility Permian SCOOP / impacts of potential STACK In-Basin Sand Facility bottlenecks Existing Terminal (HCLP owned) Haynesville Existing Terminal (Third party) Eagle Ford Note: Map does not reflect all third party terminals utilized by Hi-Crush to deliver sand to customers 20

MANAGE: Flexible Solutions for Our Customers E&P MINE. MOVE. MANAGE. Customer Priorities • Our ability to offer customers the option of container- and silo-based last mile Surety of solution enables optimization of logistics for each wellsite Supply • FB Industries’ silo solution offers increased capacity for onsite storage, while PropStream containers allow for more flexible delivery and wellsite management • Our integrated container and silo offering completely eliminates need for Asset pneumatic trucks, improving asset turns and driving cost savings Utilization • Flexible offering allows customers to structurally reduce their costs by & ROI choosing the last mile solution best suited for individual wellsite environments • Completely enclosed containerized delivery system and top-fill conveyor Health & solution for silo system meet all OSHA regulations, eliminate use of pneumatic Safety trailers and reduce overall wellsite traffic • Facilitates improved wellsite environment through noise reduction 21

Financial Results & Outlook 22
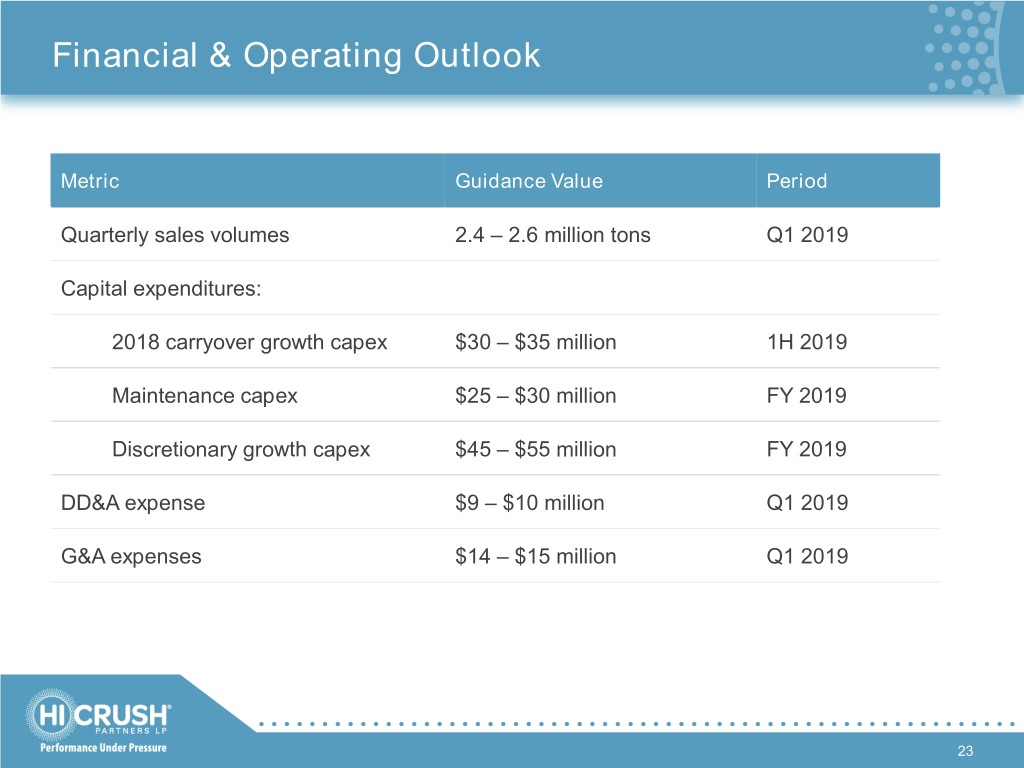
Financial & Operating Outlook Metric Guidance Value Period Quarterly sales volumes 2.4 – 2.6 million tons Q1 2019 Capital expenditures: 2018 carryover growth capex $30 – $35 million 1H 2019 Maintenance capex $25 – $30 million FY 2019 Discretionary growth capex $45 – $55 million FY 2019 DD&A expense $9 – $10 million Q1 2019 G&A expenses $14 – $15 million Q1 2019 23
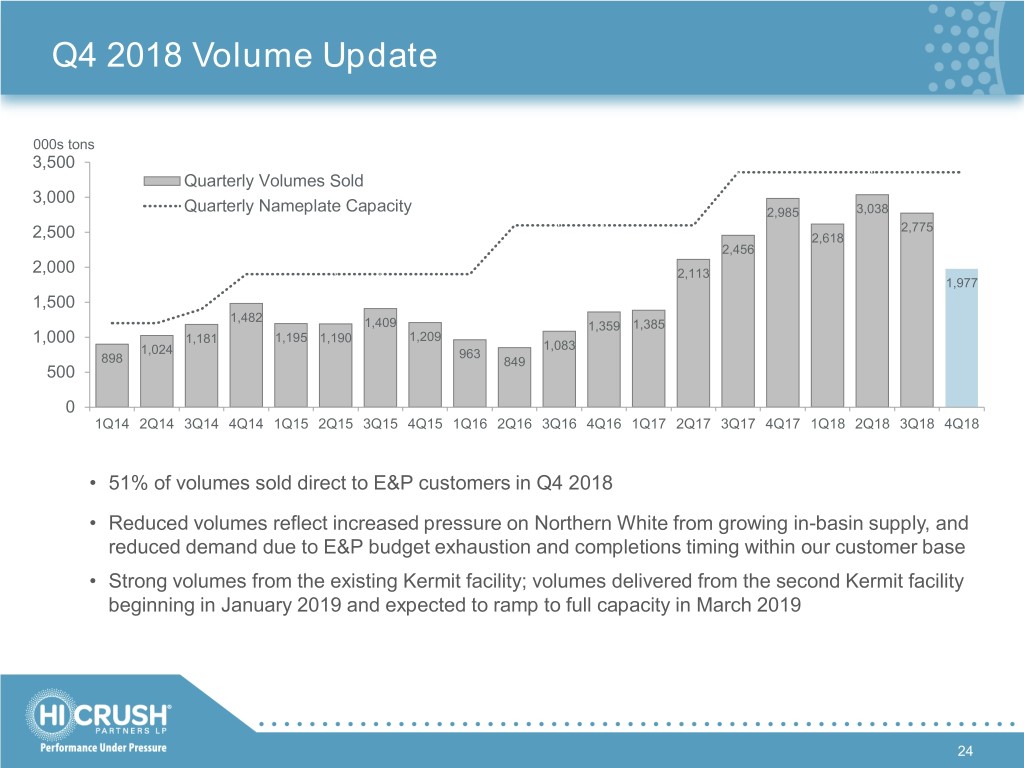
Q4 2018 Volume Update 000s tons 3,500 Quarterly Volumes Sold 3,000 Quarterly Nameplate Capacity 2,985 3,038 2,775 2,500 2,618 2,456 2,000 2,113 1,977 1,500 1,482 1,409 1,359 1,385 1,181 1,195 1,190 1,209 1,000 1,083 1,024 963 898 849 500 0 1Q14 2Q14 3Q14 4Q14 1Q15 2Q15 3Q15 4Q15 1Q16 2Q16 3Q16 4Q16 1Q17 2Q17 3Q17 4Q17 1Q18 2Q18 3Q18 4Q18 • 51% of volumes sold direct to E&P customers in Q4 2018 • Reduced volumes reflect increased pressure on Northern White from growing in-basin supply, and reduced demand due to E&P budget exhaustion and completions timing within our customer base • Strong volumes from the existing Kermit facility; volumes delivered from the second Kermit facility beginning in January 2019 and expected to ramp to full capacity in March 2019 24
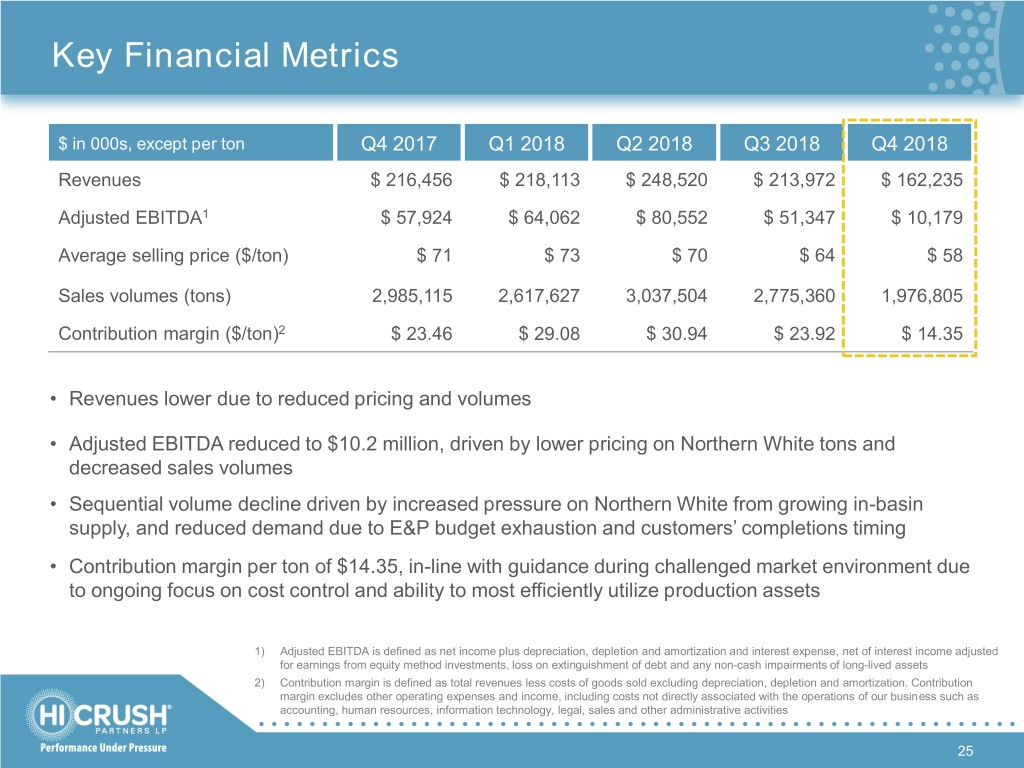
Key Financial Metrics $ in 000s, except per ton Q4 2017 Q1 2018 Q2 2018 Q3 2018 Q4 2018 Revenues $ 216,456 $ 218,113 $ 248,520 $ 213,972 $ 162,235 Adjusted EBITDA1 $ 57,924 $ 64,062 $ 80,552 $ 51,347 $ 10,179 Average selling price ($/ton) $ 71 $ 73 $ 70 $ 64 $ 58 Sales volumes (tons) 2,985,115 2,617,627 3,037,504 2,775,360 1,976,805 Contribution margin ($/ton)2 $ 23.46 $ 29.08 $ 30.94 $ 23.92 $ 14.35 • Revenues lower due to reduced pricing and volumes • Adjusted EBITDA reduced to $10.2 million, driven by lower pricing on Northern White tons and decreased sales volumes • Sequential volume decline driven by increased pressure on Northern White from growing in-basin supply, and reduced demand due to E&P budget exhaustion and customers’ completions timing • Contribution margin per ton of $14.35, in-line with guidance during challenged market environment due to ongoing focus on cost control and ability to most efficiently utilize production assets 1) Adjusted EBITDA is defined as net income plus depreciation, depletion and amortization and interest expense, net of interest income adjusted for earnings from equity method investments, loss on extinguishment of debt and any non-cash impairments of long-lived assets 2) Contribution margin is defined as total revenues less costs of goods sold excluding depreciation, depletion and amortization. Contribution margin excludes other operating expenses and income, including costs not directly associated with the operations of our business such as accounting, human resources, information technology, legal, sales and other administrative activities 25
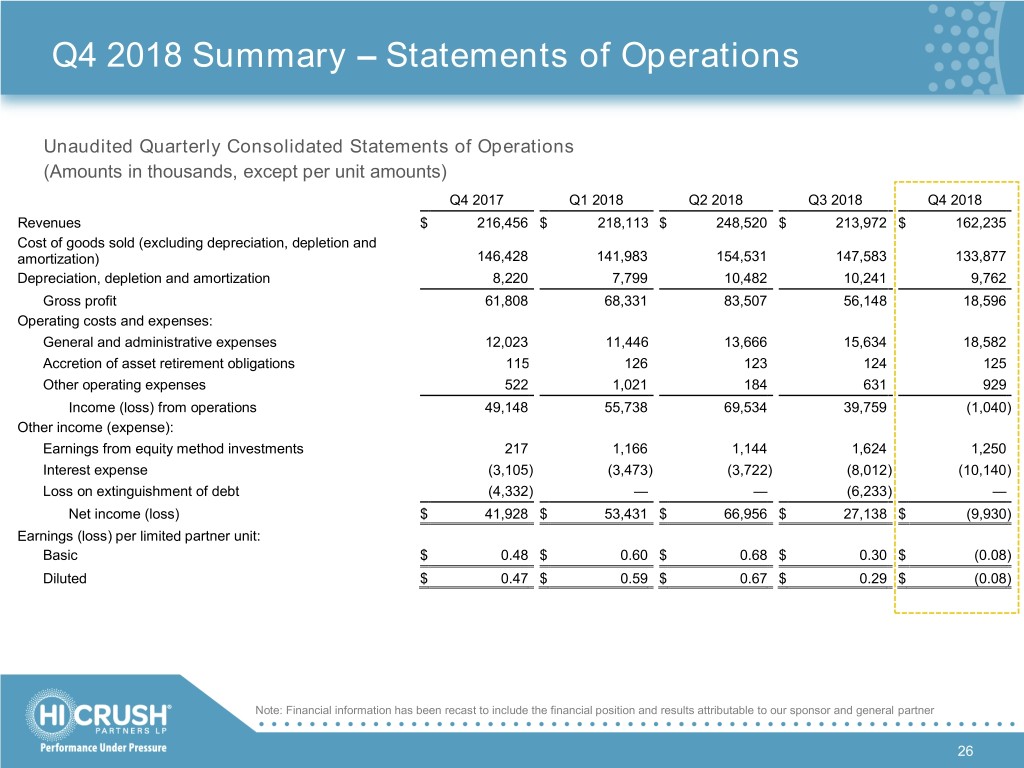
Q4 2018 Summary – Statements of Operations Unaudited Quarterly Consolidated Statements of Operations (Amounts in thousands, except per unit amounts) Q4 2017 Q1 2018 Q2 2018 Q3 2018 Q4 2018 Revenues $ 216,456 $ 218,113 $ 248,520 $ 213,972 $ 162,235 Cost of goods sold (excluding depreciation, depletion and amortization) 146,428 141,983 154,531 147,583 133,877 Depreciation, depletion and amortization 8,220 7,799 10,482 10,241 9,762 Gross profit 61,808 68,331 83,507 56,148 18,596 Operating costs and expenses: General and administrative expenses 12,023 11,446 13,666 15,634 18,582 Accretion of asset retirement obligations 115 126 123 124 125 Other operating expenses 522 1,021 184 631 929 Income (loss) from operations 49,148 55,738 69,534 39,759 (1,040 ) Other income (expense): Earnings from equity method investments 217 1,166 1,144 1,624 1,250 Interest expense (3,105 ) (3,473 ) (3,722 ) (8,012 ) (10,140 ) Loss on extinguishment of debt (4,332 ) — — (6,233 ) — Net income (loss) $ 41,928 $ 53,431 $ 66,956 $ 27,138 $ (9,930 ) Earnings (loss) per limited partner unit: Basic $ 0.48 $ 0.60 $ 0.68 $ 0.30 $ (0.08 ) Diluted $ 0.47 $ 0.59 $ 0.67 $ 0.29 $ (0.08 ) Note: Financial information has been recast to include the financial position and results attributable to our sponsor and general partner 26
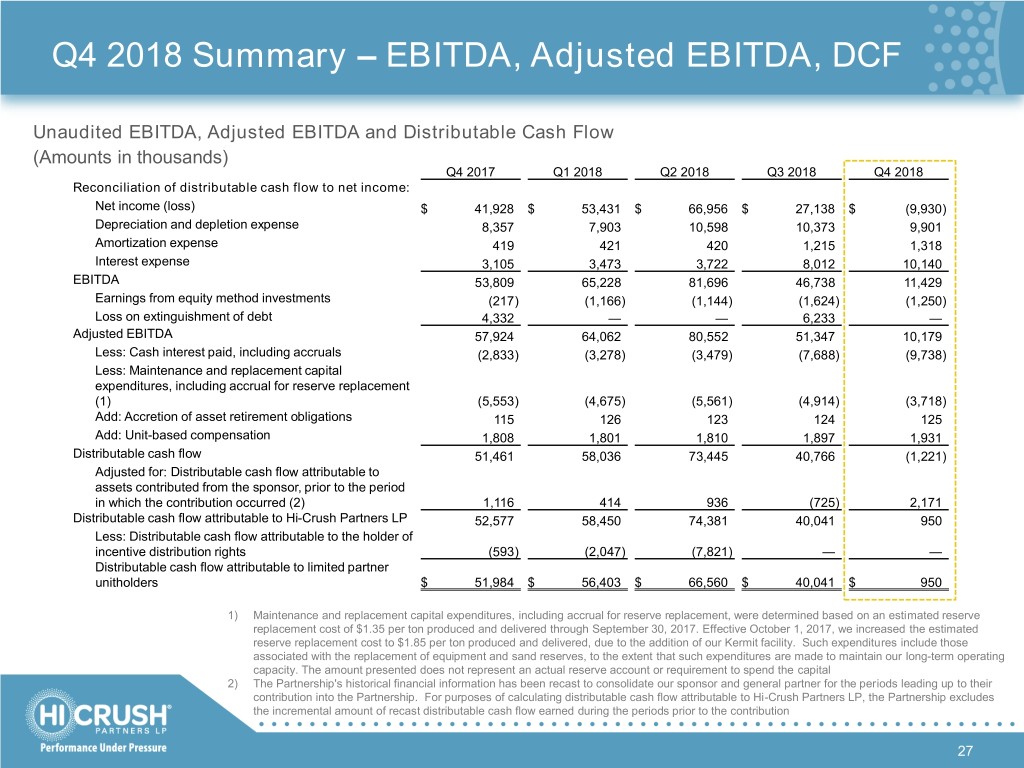
Q4 2018 Summary – EBITDA, Adjusted EBITDA, DCF Unaudited EBITDA, Adjusted EBITDA and Distributable Cash Flow (Amounts in thousands) Q4 2017 Q1 2018 Q2 2018 Q3 2018 Q4 2018 Reconciliation of distributable cash flow to net income: Net income (loss) $ 41,928 $ 53,431 $ 66,956 $ 27,138 $ (9,930) Depreciation and depletion expense 8,357 7,903 10,598 10,373 9,901 Amortization expense 419 421 420 1,215 1,318 Interest expense 3,105 3,473 3,722 8,012 10,140 EBITDA 53,809 65,228 81,696 46,738 11,429 Earnings from equity method investments (217) (1,166) (1,144) (1,624) (1,250) Loss on extinguishment of debt 4,332 — — 6,233 — Adjusted EBITDA 57,924 64,062 80,552 51,347 10,179 Less: Cash interest paid, including accruals (2,833) (3,278) (3,479) (7,688) (9,738) Less: Maintenance and replacement capital expenditures, including accrual for reserve replacement (1) (5,553) (4,675) (5,561) (4,914) (3,718) Add: Accretion of asset retirement obligations 115 126 123 124 125 Add: Unit-based compensation 1,808 1,801 1,810 1,897 1,931 Distributable cash flow 51,461 58,036 73,445 40,766 (1,221) Adjusted for: Distributable cash flow attributable to assets contributed from the sponsor, prior to the period in which the contribution occurred (2) 1,116 414 936 (725) 2,171 Distributable cash flow attributable to Hi-Crush Partners LP 52,577 58,450 74,381 40,041 950 Less: Distributable cash flow attributable to the holder of incentive distribution rights (593) (2,047) (7,821) — — Distributable cash flow attributable to limited partner unitholders $ 51,984 $ 56,403 $ 66,560 $ 40,041 $ 950 1) Maintenance and replacement capital expenditures, including accrual for reserve replacement, were determined based on an estimated reserve replacement cost of $1.35 per ton produced and delivered through September 30, 2017. Effective October 1, 2017, we increased the estimated reserve replacement cost to $1.85 per ton produced and delivered, due to the addition of our Kermit facility. Such expenditures include those associated with the replacement of equipment and sand reserves, to the extent that such expenditures are made to maintain our long-term operating capacity. The amount presented does not represent an actual reserve account or requirement to spend the capital 2) The Partnership's historical financial information has been recast to consolidate our sponsor and general partner for the periods leading up to their contribution into the Partnership. For purposes of calculating distributable cash flow attributable to Hi-Crush Partners LP, the Partnership excludes the incremental amount of recast distributable cash flow earned during the periods prior to the contribution 27
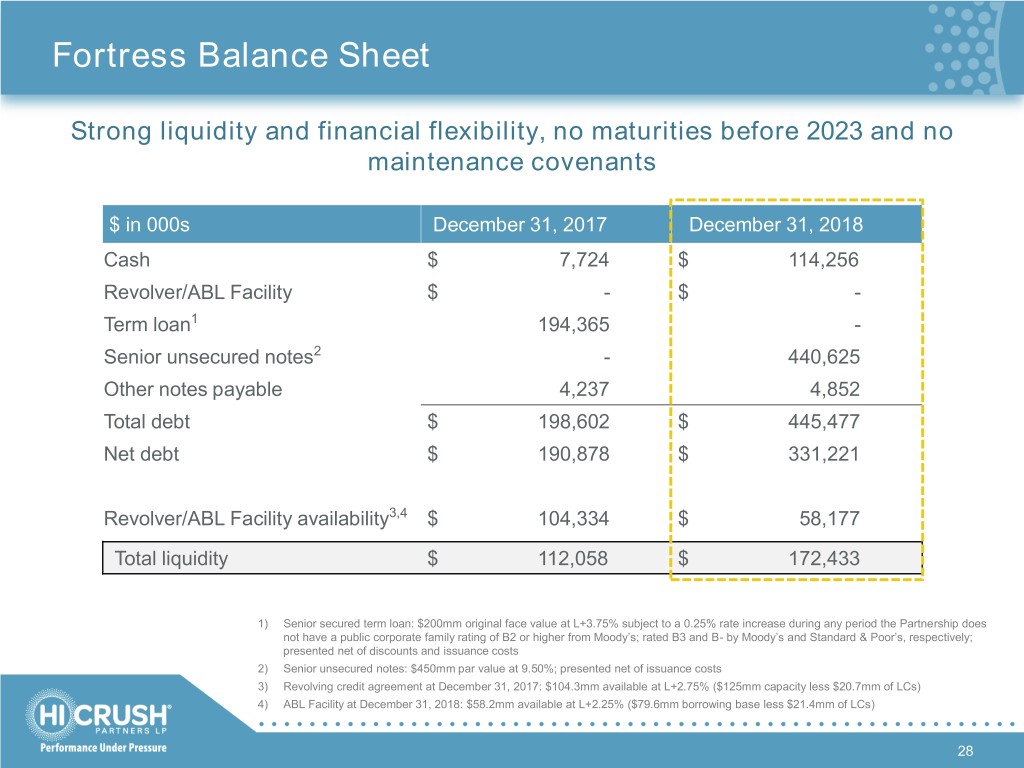
Fortress Balance Sheet Strong liquidity and financial flexibility, no maturities before 2023 and no maintenance covenants $ in 000s December 31, 2017 December 31, 2018 Cash $ 7,724 $ 114,256 Revolver/ABL Facility $ - $ - Term loan1 194,365 - Senior unsecured notes2 - 440,625 Other notes payable 4,237 4,852 Total debt $ 198,602 $ 445,477 Net debt $ 190,878 $ 331,221 Revolver/ABL Facility availability3,4 $ 104,334 $ 58,177 Total liquidity $ 112,058 $ 172,433 1) Senior secured term loan: $200mm original face value at L+3.75% subject to a 0.25% rate increase during any period the Partnership does not have a public corporate family rating of B2 or higher from Moody’s; rated B3 and B- by Moody’s and Standard & Poor’s, respectively; presented net of discounts and issuance costs 2) Senior unsecured notes: $450mm par value at 9.50%; presented net of issuance costs 3) Revolving credit agreement at December 31, 2017: $104.3mm available at L+2.75% ($125mm capacity less $20.7mm of LCs) 4) ABL Facility at December 31, 2018: $58.2mm available at L+2.25% ($79.6mm borrowing base less $21.4mm of LCs) 28

Investor Contacts Caldwell Bailey Lead Analyst, Investor Relations Marc Silverberg Managing Director (ICR, Inc.) Phone: (713) 980-6270 E-mail: ir@hicrush.com 29


