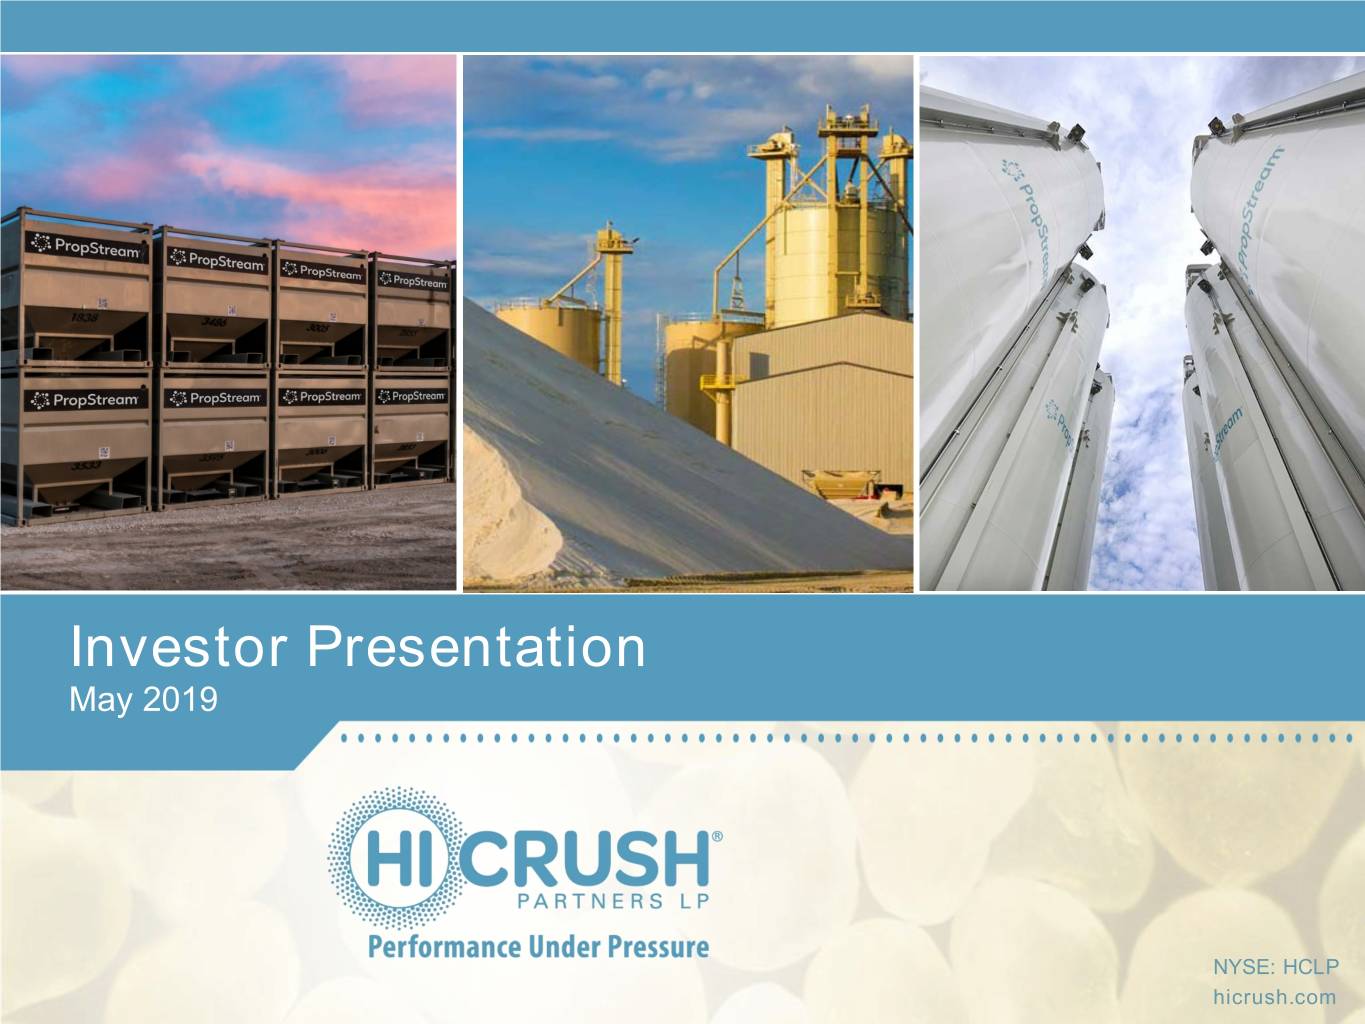
Investor Presentation May 2019 NYSE: HCLP hicrush.com
Forward Looking Statements and Non-GAAP Measures Forward-Looking Statements and Cautionary Statements The foregoing contains “forward-looking statements” within the meaning of Section 27A of the Securities Act and Section 21E of the Exchange Act. All statements, other than statements of historical fact, included in this communication that address activities, events or developments that the Partnership expects, believes or anticipates will or may occur in the future are forward-looking statements. Words such as “estimate,” “project,” “predict,” “believe,” “expect,” “anticipate,” “potential,” “create,” “intend,” “could,” “may,” “foresee,” “plan,” “will,” “guidance,” “look,” “outlook,” “goal,” “future,” “assume,” “forecast,” “build,” “focus,” “work,” “continue” or the negative of such terms or other variations thereof and words and terms of similar substance used in connection with any discussion of future plans, actions, or events identify forward-looking statements. However, the absence of these words does not mean that the statements are not forward-looking. These forward-looking statements include, but are not limited to, statements regarding the Conversion, descriptions of the post-Conversion company and its operations, transition plans, opportunities and anticipated future performance. There are a number of risks and uncertainties that could cause actual results to differ materially from the forward- looking statements included in this communication. These include the expected timing and likelihood of completion of the Conversion, the occurrence of any event, change or other circumstances that could give rise to the abandonment of the proposed Conversion, the possibility that unitholders of the Partnership may not approve the Conversion, risks related to disruption of management time from ongoing business operations due to the Conversion, the risk that any announcements relating to the Conversion could have adverse effects on the market price of the Partnership’s common units, the risk that the Conversion and its announcement could have an adverse effect on the ability of the Partnership to retain customers and retain and hire key personnel and maintain relationships with their suppliers and customers and on their operating results and businesses generally, the risk the pending Conversion could distract management of the Partnership and that the Partnership will incur substantial costs, the risk that problems arise that may result in the post-Conversion company not operating as effectively and efficiently as expected, the risk that the post-Conversion company may be unable to achieve expected benefits of the Conversion or it may take longer than expected to achieve those benefits and other important factors that could cause actual results to differ materially from those projected. All such factors are difficult to predict and are beyond the Partnership’s control, including those detailed in the Partnership’s annual reports on Form 10-K, quarterly reports on Form 10-Q and current reports on Form 8-K that are available on its website at www.hicrush.com and on the SEC’s website at http://www.sec.gov. All forward-looking statements are based on assumptions that the Partnership believes to be reasonable but that may not prove to be accurate. Any forward-looking statement speaks only as of the date on which such statement is made, and the Partnership undertakes no obligation to correct or update any forward-looking statement, whether as a result of new information, future events or otherwise, except as required by applicable law. Readers are cautioned not to place undue reliance on these forward-looking statements that speak only as of the date hereof. Use of Non-GAAP Information This presentation may include non-GAAP financial measures. Such non-GAAP measures are not alternatives to GAAP measures, and you should not consider these non-GAAP measures in isolation or as a substitute for analysis of our results as reported under GAAP. For additional disclosure regarding such non-GAAP measures, including reconciliations to their most directly comparable GAAP measure, please refer to Hi-Crush’s most recent earnings release at www.hicrush.com. 2
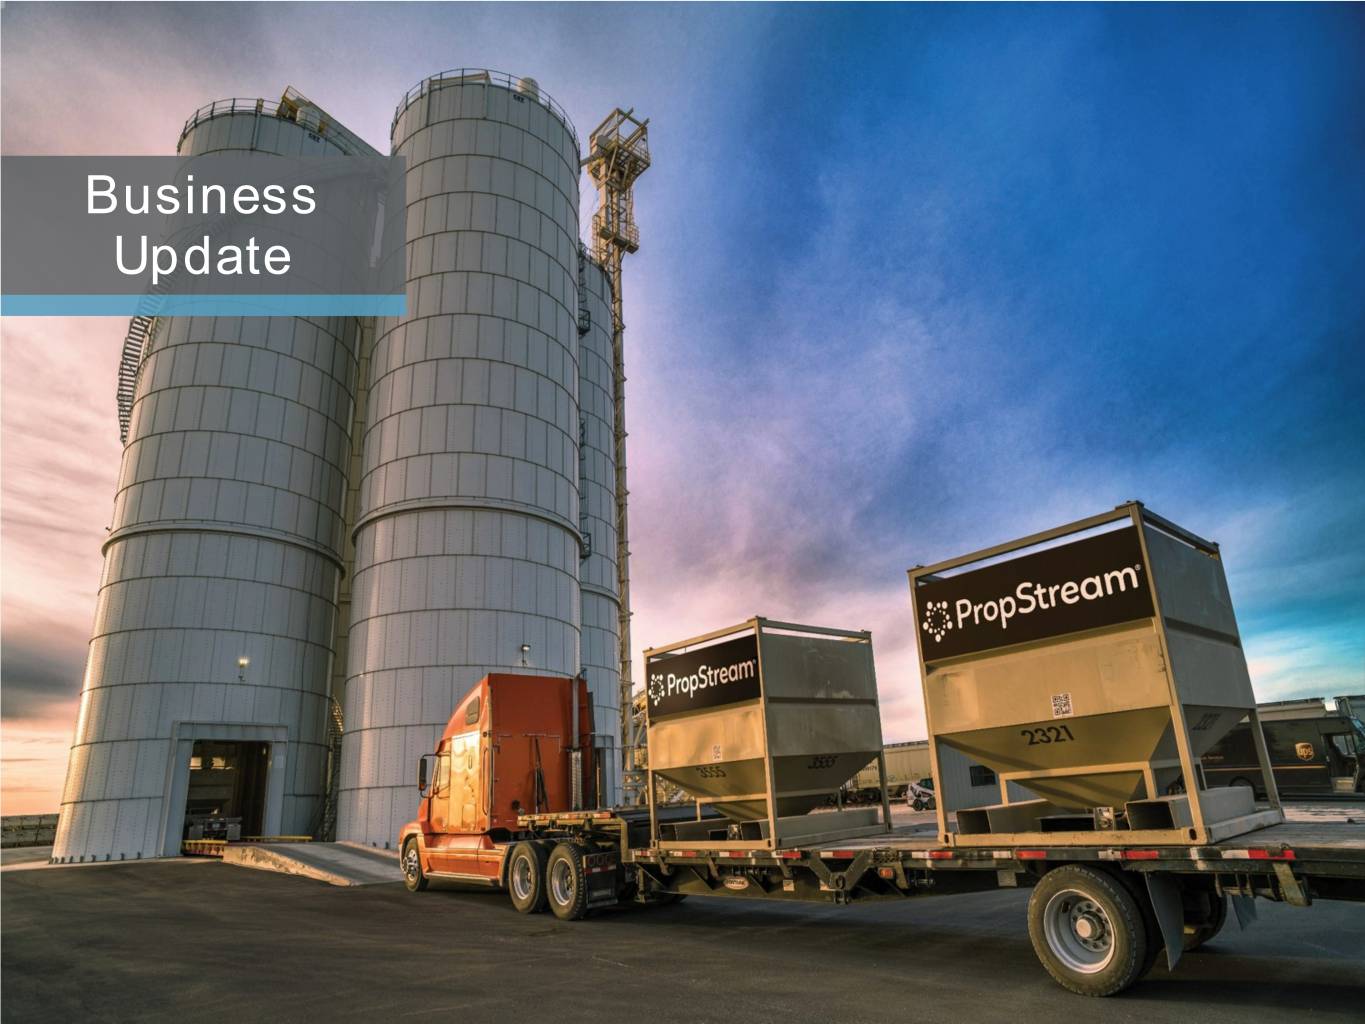
Business Update 3
Latest Business Updates Last Mile Technology: Logistics Expansion: Acquired BulkTracer, owner of the Acquired remaining ownership interest PropDispatch software that enables real- in Pronghorn Logistics, expanding last time logistics management for the last mile customer relationships and reach mile; enhanced functionality to be rolled to additional basins out over the remainder of 2019 Volume Update: E&P Relationships: Sales volumes for Q1 2019 increased to Continue to advance strategy of selling 2.4mm tons, up from 2.0mm tons in Q4 directly to E&Ps; 63% of Q1 2019 sales 2018, reflecting ramp of second Kermit volumes sold to E&Ps, up from 51% in facility; expect sales volumes of 2.5 to Q4 2018 2.7mm tons in Q2 2019 Silo Systems: Strategic Development: Completing upgrades to further improve Completed ramp to nameplate capacity at efficiency; deployment underway in Q2 second Kermit facility, following completion 2019 in late-December 2018; completed construction of customer-driven Wyeville Strong Balance Sheet: expansion, production ramping in Q2 2019 Maintain strong liquidity position and flexibility; $115.6mm in liquidity exiting Q1 2019 4

PropDispatch: Real-Time Logistics Management Advancing our last mile platform with differentiated technology Overview • In January 2019, acquired BulkTracer Holdings, the owner and developer of PropDispatch software • PropDispatch software enables real-time tracking and monitoring of truck movements, container location, silo inventory, etc. • Enhancing software to further improve functionality and ease of use • Updates will be rolled out over the remainder of 2019 Fully automated Real-time visibility Central dispatch Automates ordering, dispatching, Enables real-time decision making Efficiently dispatch drivers based hauling, tracking, reconciling and by leveraging constant on location and proximity to supply invoicing of trucks and sand data flow points 5

Pronghorn Logistics: Extending Last Mile Innovation Combination with Pronghorn expands PropStream as a leader in logistics services across all major shale basins Acquisition Highlights • In Q2 2019, Hi-Crush acquired remaining • Complementary Footprint – Creates a network ownership interests in Pronghorn of last mile solutions serving the Permian, Eagle Logistics, LLC (“Pronghorn”) Ford, Marcellus, Utica, Powder River, Mid-Con and Bakken regions • Pronghorn provides frac sand sourcing, last mile logistics, and wellsite • E&P Focused – Expands customer base with management services to E&P customers 100% blue-chip, multi-basin E&Ps, consistent with in the Eagle Ford, Powder River, Mid-Con Hi-Crush’s focus on directly serving operators and Bakken • Ease of Integration – Combined companies’ • Experienced rapid growth as a result of crews using same silo and container solutions with reputation for excellent service quality PropDispatch software • Pronghorn’s management team has • Experienced Management – Brings a track joined Hi-Crush in leadership roles record of innovation in last mile logistics optimization and customer cost reduction 6
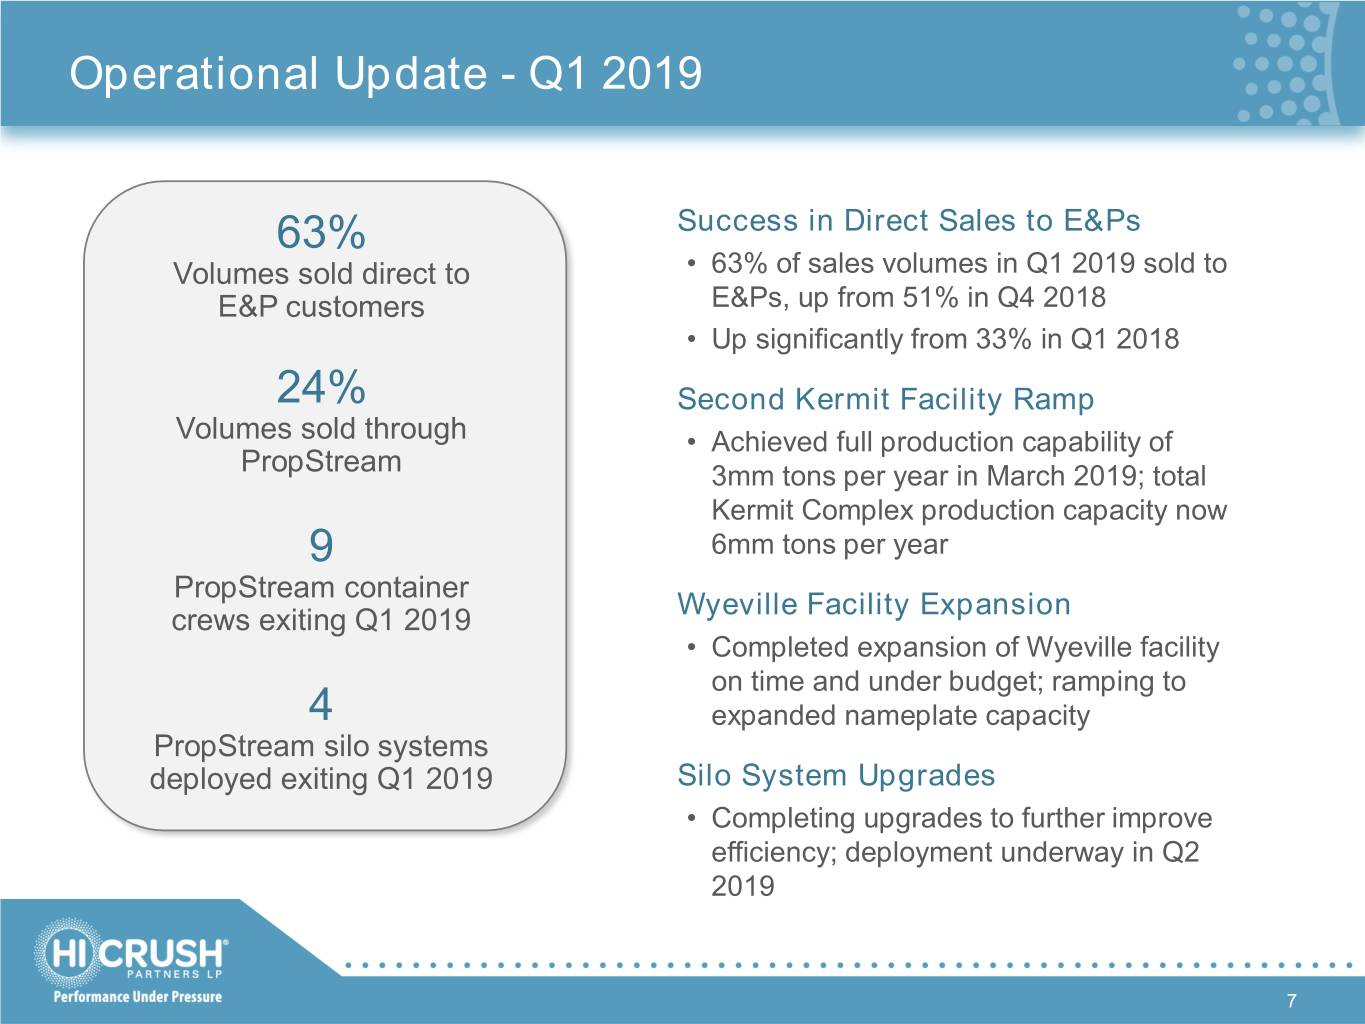
Operational Update - Q1 2019 63% Success in Direct Sales to E&Ps Volumes sold direct to • 63% of sales volumes in Q1 2019 sold to E&P customers E&Ps, up from 51% in Q4 2018 • Up significantly from 33% in Q1 2018 24% Second Kermit Facility Ramp Volumes sold through • Achieved full production capability of PropStream 3mm tons per year in March 2019; total Kermit Complex production capacity now 9 6mm tons per year PropStream container crews exiting Q1 2019 Wyeville Facility Expansion • Completed expansion of Wyeville facility on time and under budget; ramping to 4 expanded nameplate capacity PropStream silo systems deployed exiting Q1 2019 Silo System Upgrades • Completing upgrades to further improve efficiency; deployment underway in Q2 2019 7
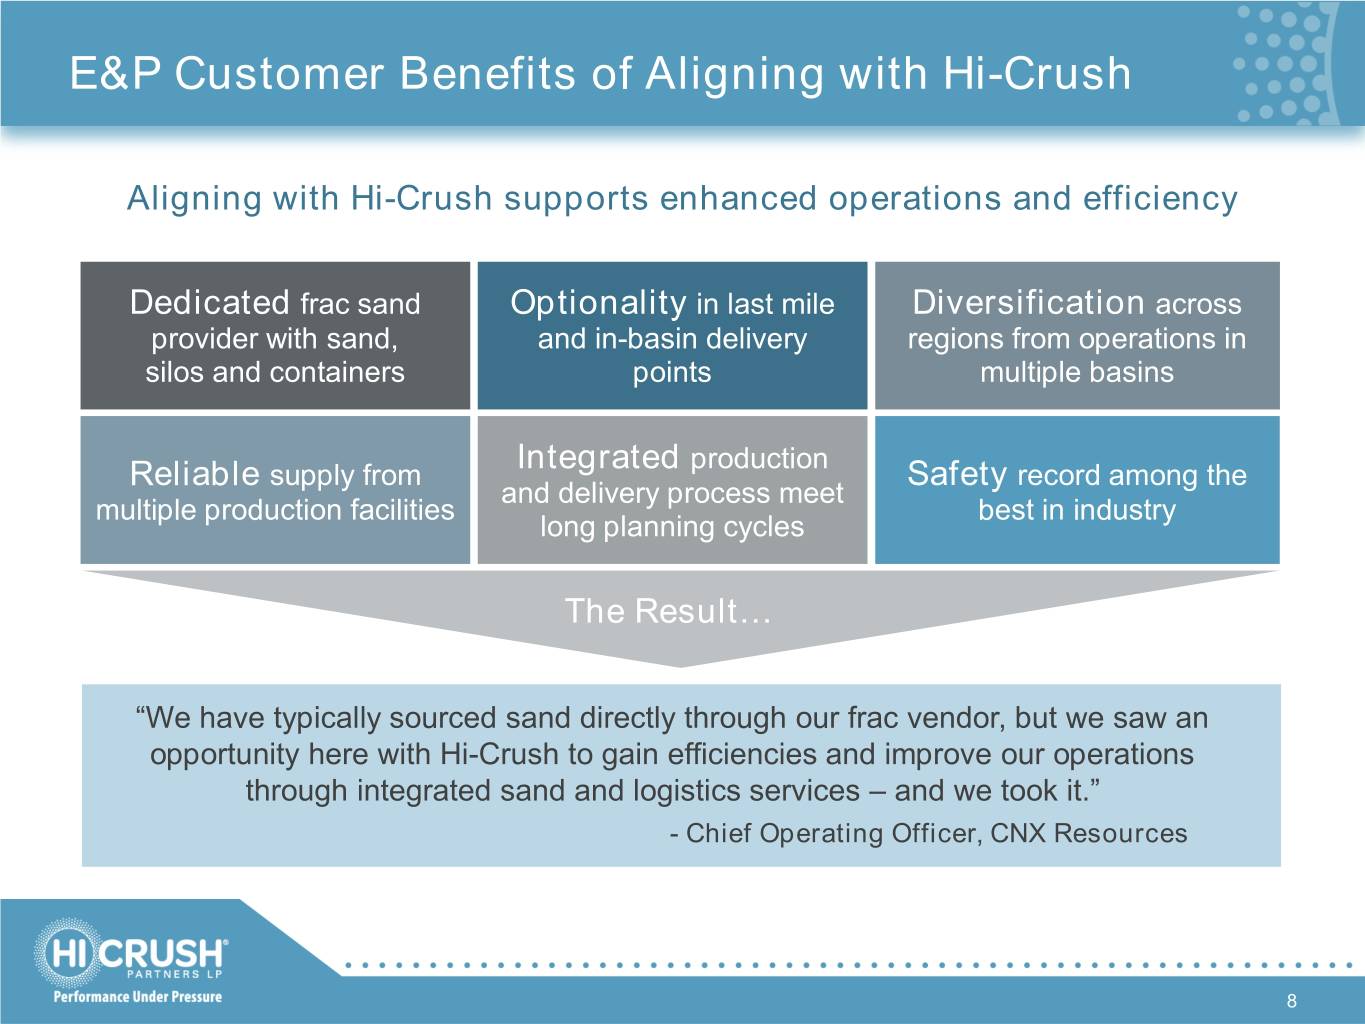
E&P Customer Benefits of Aligning with Hi-Crush Aligning with Hi-Crush supports enhanced operations and efficiency Dedicated frac sand Optionality in last mile Diversification across provider with sand, and in-basin delivery regions from operations in silos and containers points multiple basins production supply from Integrated record among the Reliable and delivery process meet Safety multiple production facilities best in industry long planning cycles The Result… “We have typically sourced sand directly through our frac vendor, but we saw an opportunity here with Hi-Crush to gain efficiencies and improve our operations through integrated sand and logistics services – and we took it.” - Chief Operating Officer, CNX Resources 8

Hi-Crush Benefits of Aligning with E&P Customers Relationship Driven Long project lead times and significant capital requirements drive E&Ps to value strategic 63% of quarterly sales volumes in Q1 2019 relationships with suppliers who offer sold to E&P customers differentiated solutions 63% Better Visibility Closer relationships provide greater visibility into 51% constantly-evolving activity, demand trends and market fundamentals 40% 33% 31% Growth Opportunity 25% Addressing E&Ps’ currently underserved need for a direct-sourced, preferred provider of flexible, 14% full-scope proppant and logistics solutions 7% 0% 1% Less Volatility Partnering with the right E&P customers reduces volatility as drilling and completion programs are more consistent through commodity cycles % of total quarterly sales volumes 9

Sustainable Capital Position Balance sheet flexibility enables Hi-Crush to address changing market dynamics and opportunities Strong Flexible Conservative Cash & liquidity Capital position Leverage $60mm60mm11 No $444mm / $384mm1 Cash Position Maintenance Covenants Total Debt / Net Debt No No 2.4x1 ABL Borrowings Principal Payments2 Net Debt / LTM EBITDA 1) As of March 31, 2019. 2) ABL Facility matures 2023; Senior Notes due 2026; interest payments of $21.4mm due each February and August. 10
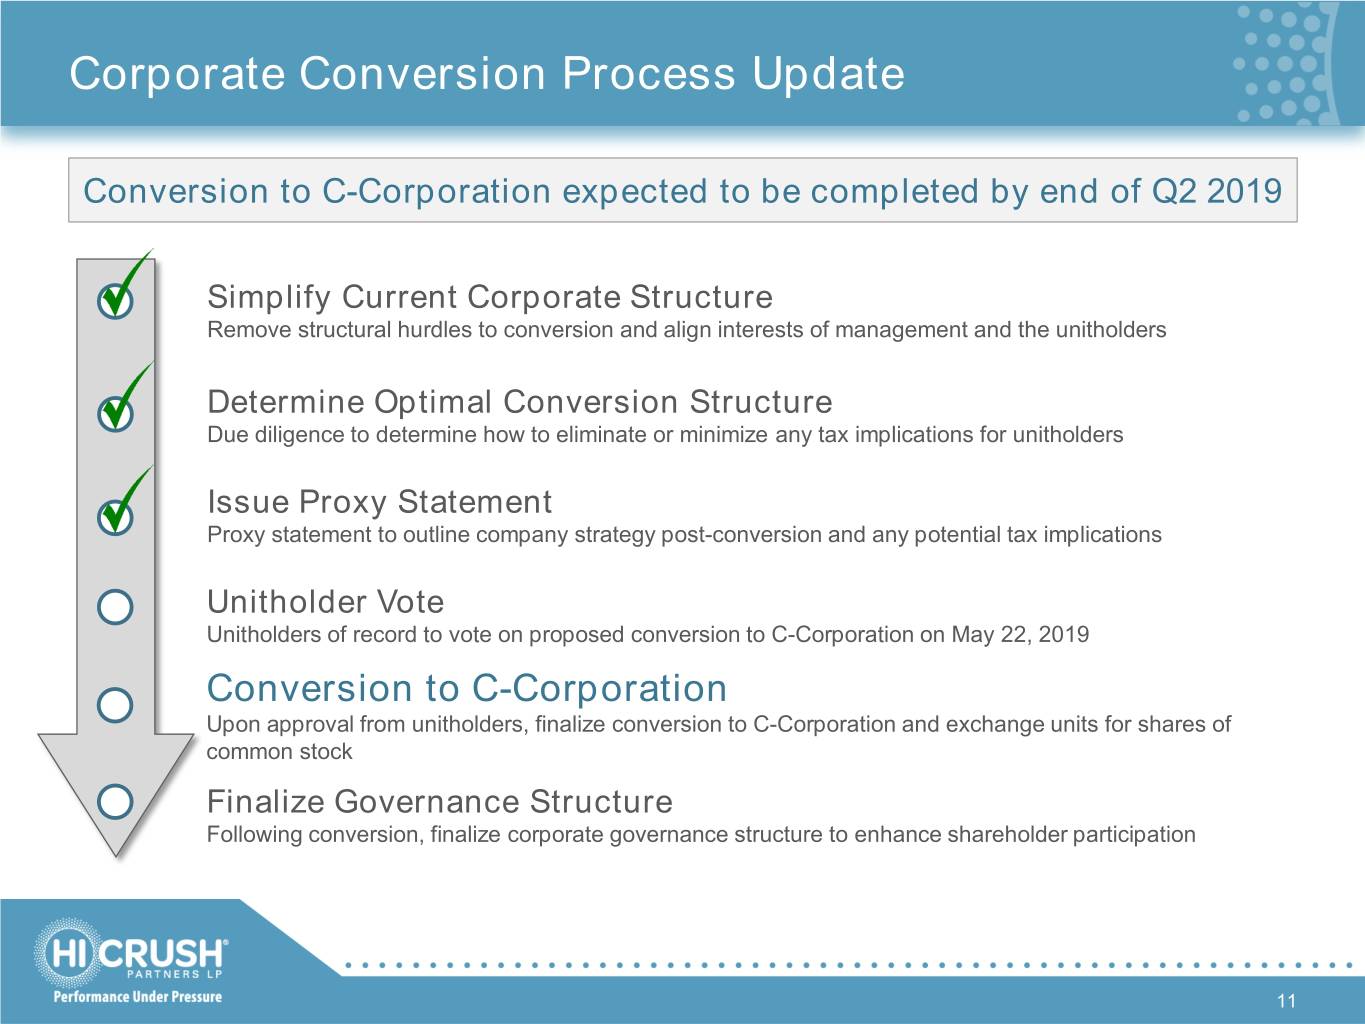
Corporate Conversion Process Update Conversion to C-Corporation expected to be completed by end of Q2 2019 Simplify Current Corporate Structure Remove structural hurdles to conversion and align interests of management and the unitholders Determine Optimal Conversion Structure Due diligence to determine how to eliminate or minimize any tax implications for unitholders Issue Proxy Statement Proxy statement to outline company strategy post-conversion and any potential tax implications Unitholder Vote Unitholders of record to vote on proposed conversion to C-Corporation on May 22, 2019 Conversion to C-Corporation Upon approval from unitholders, finalize conversion to C-Corporation and exchange units for shares of common stock Finalize Governance Structure Following conversion, finalize corporate governance structure to enhance shareholder participation 11

Fulfilling Our Corporate Responsibilities From our CEO Evidence of Our Commitment “The most important asset at Hi-Crush Behavior-based safety program is our people. Ensuring the health and ingrained in all aspects of our safety of our workers is a core culture across mine and logistics element of our culture.” operations; aimed at accident – Bob Rasmus prevention and rewards positive behavior Our CRUSH Principles Support SAFETY First Our Wisconsin mine and production facilities participate in Compliance the Wisconsin Department of Natural Resources Green Tier Reduction Program as a Tier 1 participant nderstanding Responsibilities U >90% reduction of particulate >90% matter emissions from wellsite Sustainable Practices sand operations from PropStream, meeting OSHA PEL Habitual Improvement regulations 12
Financial Results and Outlook 13
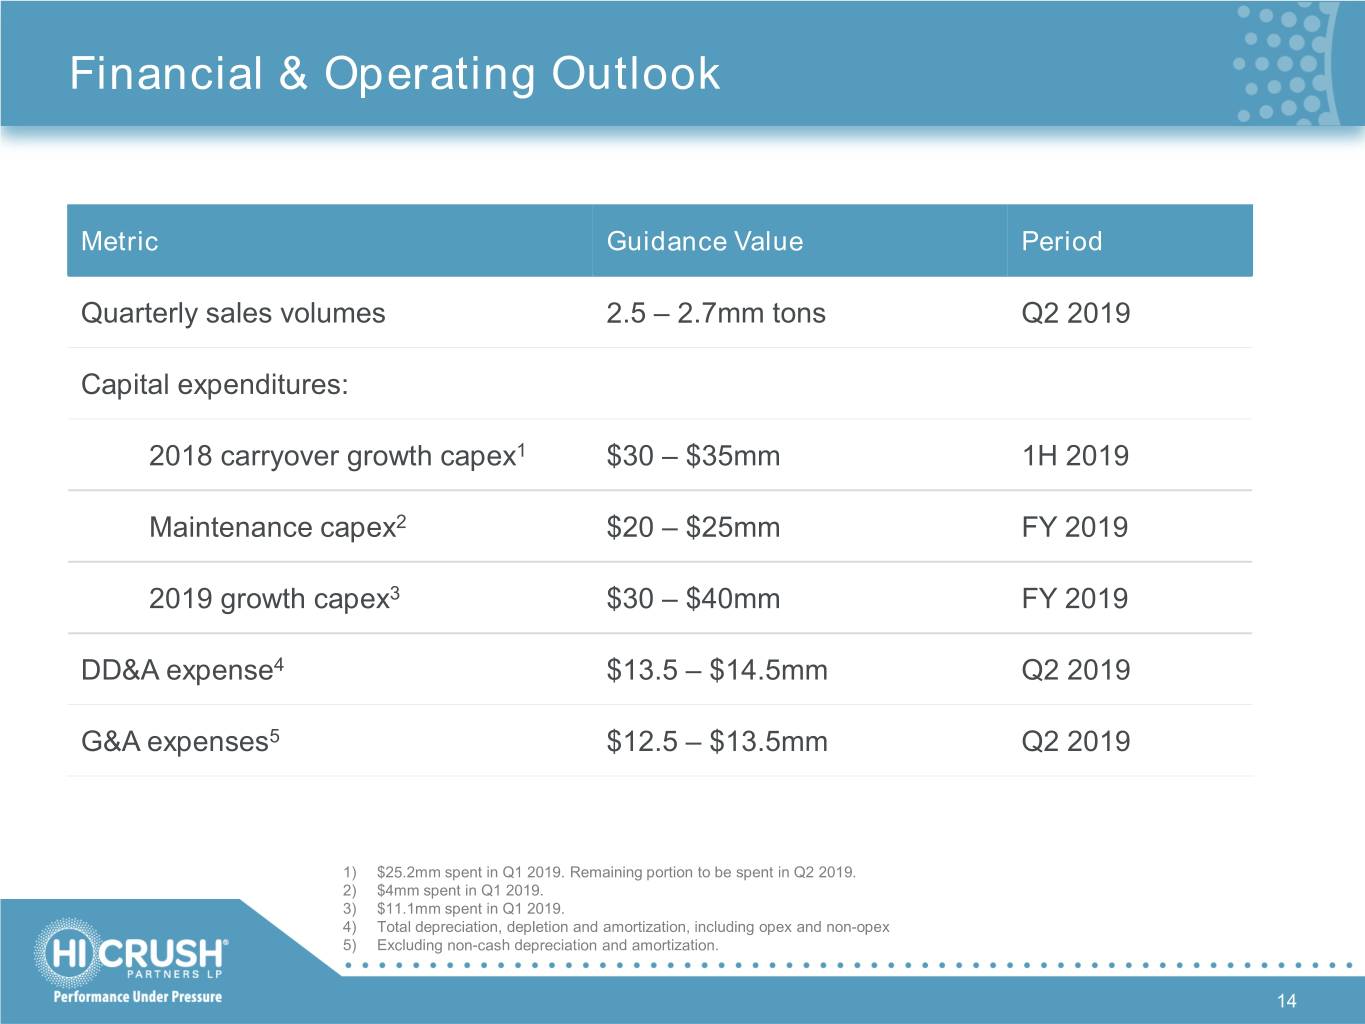
Financial & Operating Outlook Metric Guidance Value Period Quarterly sales volumes 2.5 – 2.7mm tons Q2 2019 Capital expenditures: 2018 carryover growth capex1 $30 – $35mm 1H 2019 Maintenance capex2 $20 – $25mm FY 2019 2019 growth capex3 $30 – $40mm FY 2019 DD&A expense4 $13.5 – $14.5mm Q2 2019 G&A expenses5 $12.5 – $13.5mm Q2 2019 1) $25.2mm spent in Q1 2019. Remaining portion to be spent in Q2 2019. 2) $4mm spent in Q1 2019. 3) $11.1mm spent in Q1 2019. 4) Total depreciation, depletion and amortization, including opex and non-opex 5) Excluding non-cash depreciation and amortization. 14

Maintaining Capital Discipline More than ample liquidity to meet 2019 capital uses Capital Sources Capital Uses Interest payments EBITDA Maintenance capex Cash 2019 growth capex ABL availability 2018 carryover growth capex . In-Basin and Northern White Sand . PropStream logistics and services . Second Kermit facility . Optimization and efficiencies . Wyeville expansion . Relentless cost management . Atlas conveyors . Silo upgrades . Technology and innovation 15
��
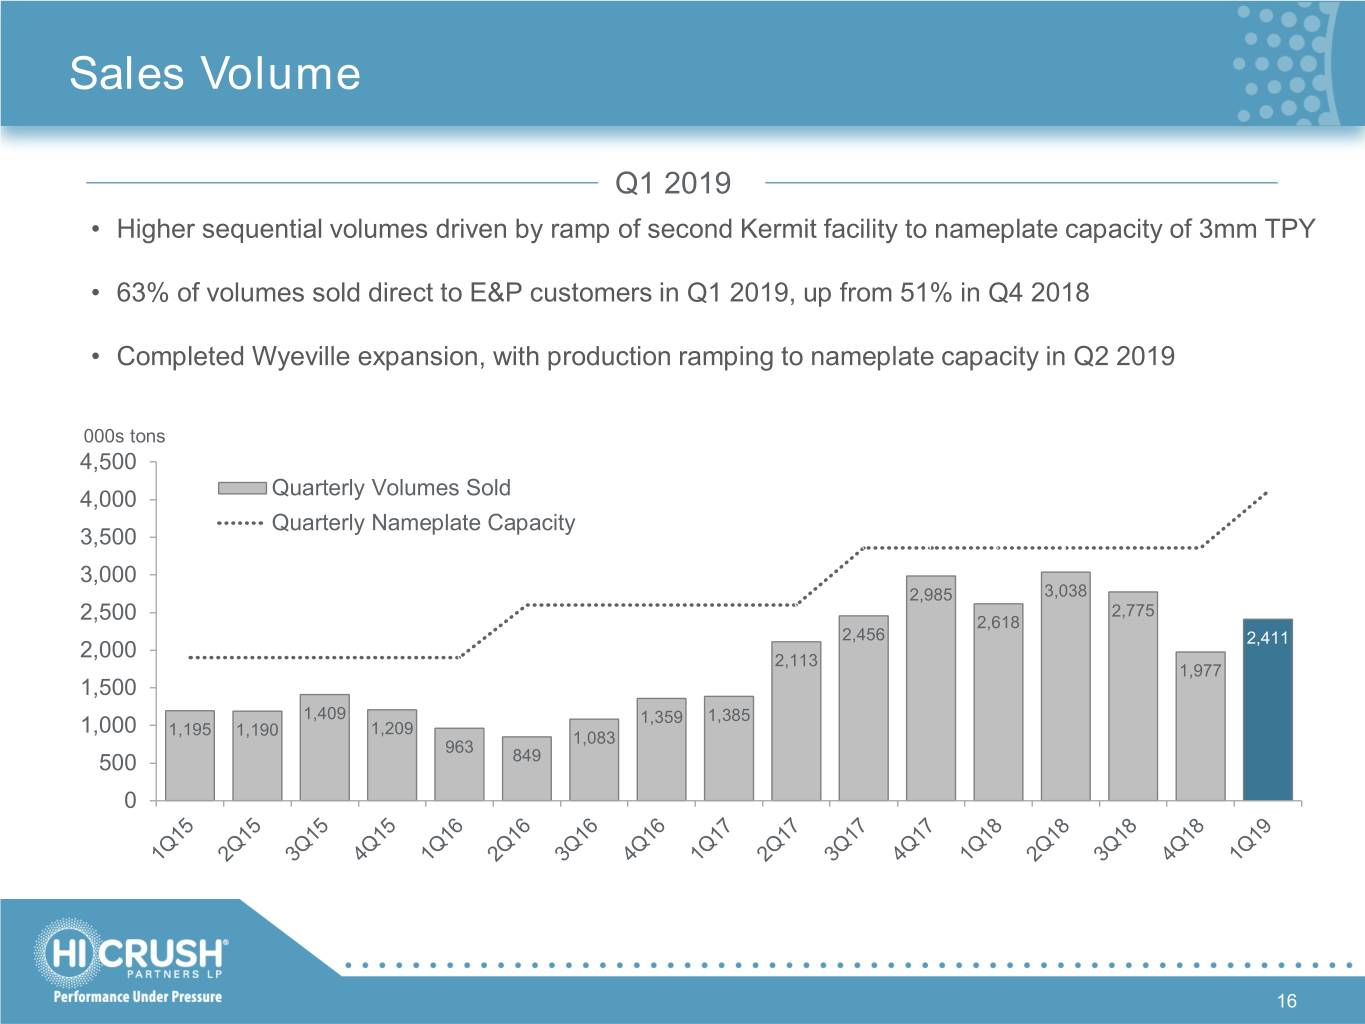
Sales Volume Q1 2019 • Higher sequential volumes driven by ramp of second Kermit facility to nameplate capacity of 3mm TPY • 63% of volumes sold direct to E&P customers in Q1 2019, up from 51% in Q4 2018 • Completed Wyeville expansion, with production ramping to nameplate capacity in Q2 2019 000s tons 4,500 Quarterly Volumes Sold 4,000 Quarterly Nameplate Capacity 3,500 3,000 2,985 3,038 2,775 2,500 2,618 2,456 2,411 2,000 2,113 1,977 1,500 1,409 1,359 1,385 1,000 1,209 1,195 1,190 1,083 963 500 849 0 16
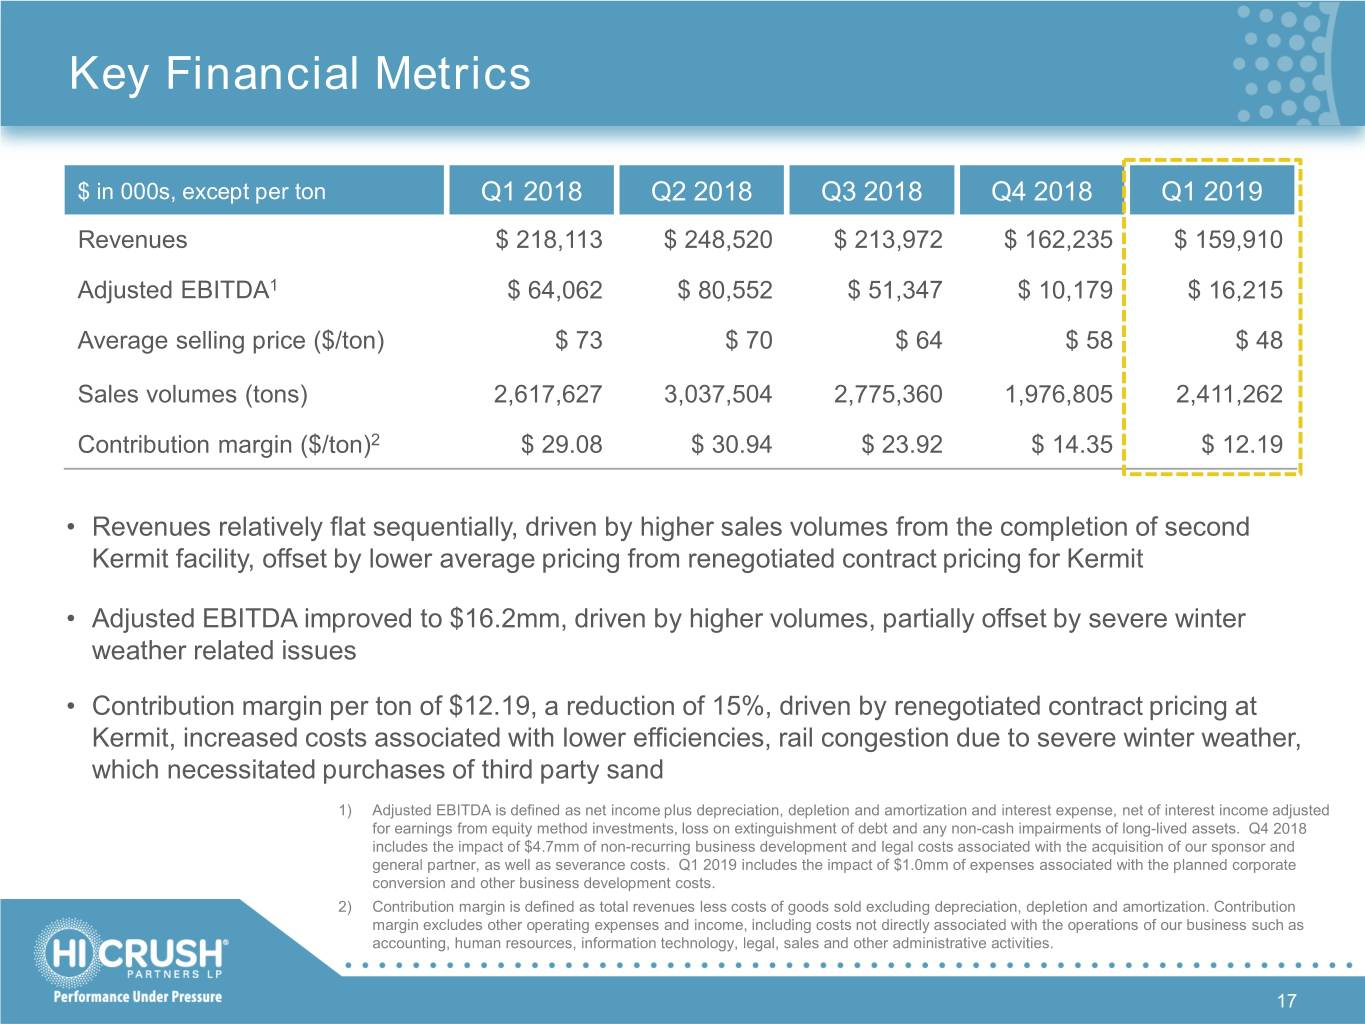
Key Financial Metrics $ in 000s, except per ton Q1 2018 Q2 2018 Q3 2018 Q4 2018 Q1 2019 Revenues $ 218,113 $ 248,520 $ 213,972 $ 162,235 $ 159,910 Adjusted EBITDA1 $ 64,062 $ 80,552 $ 51,347 $ 10,179 $ 16,215 Average selling price ($/ton) $ 73 $ 70 $ 64 $ 58 $ 48 Sales volumes (tons) 2,617,627 3,037,504 2,775,360 1,976,805 2,411,262 Contribution margin ($/ton)2 $ 29.08 $ 30.94 $ 23.92 $ 14.35 $ 12.19 • Revenues relatively flat sequentially, driven by higher sales volumes from the completion of second Kermit facility, offset by lower average pricing from renegotiated contract pricing for Kermit • Adjusted EBITDA improved to $16.2mm, driven by higher volumes, partially offset by severe winter weather related issues • Contribution margin per ton of $12.19, a reduction of 15%, driven by renegotiated contract pricing at Kermit, increased costs associated with lower efficiencies, rail congestion due to severe winter weather, which necessitated purchases of third party sand 1) Adjusted EBITDA is defined as net income plus depreciation, depletion and amortization and interest expense, net of interest income adjusted for earnings from equity method investments, loss on extinguishment of debt and any non-cash impairments of long-lived assets. Q4 2018 includes the impact of $4.7mm of non-recurring business development and legal costs associated with the acquisition of our sponsor and general partner, as well as severance costs. Q1 2019 includes the impact of $1.0mm of expenses associated with the planned corporate conversion and other business development costs. 2) Contribution margin is defined as total revenues less costs of goods sold excluding depreciation, depletion and amortization. Contribution margin excludes other operating expenses and income, including costs not directly associated with the operations of our business such as accounting, human resources, information technology, legal, sales and other administrative activities. 17
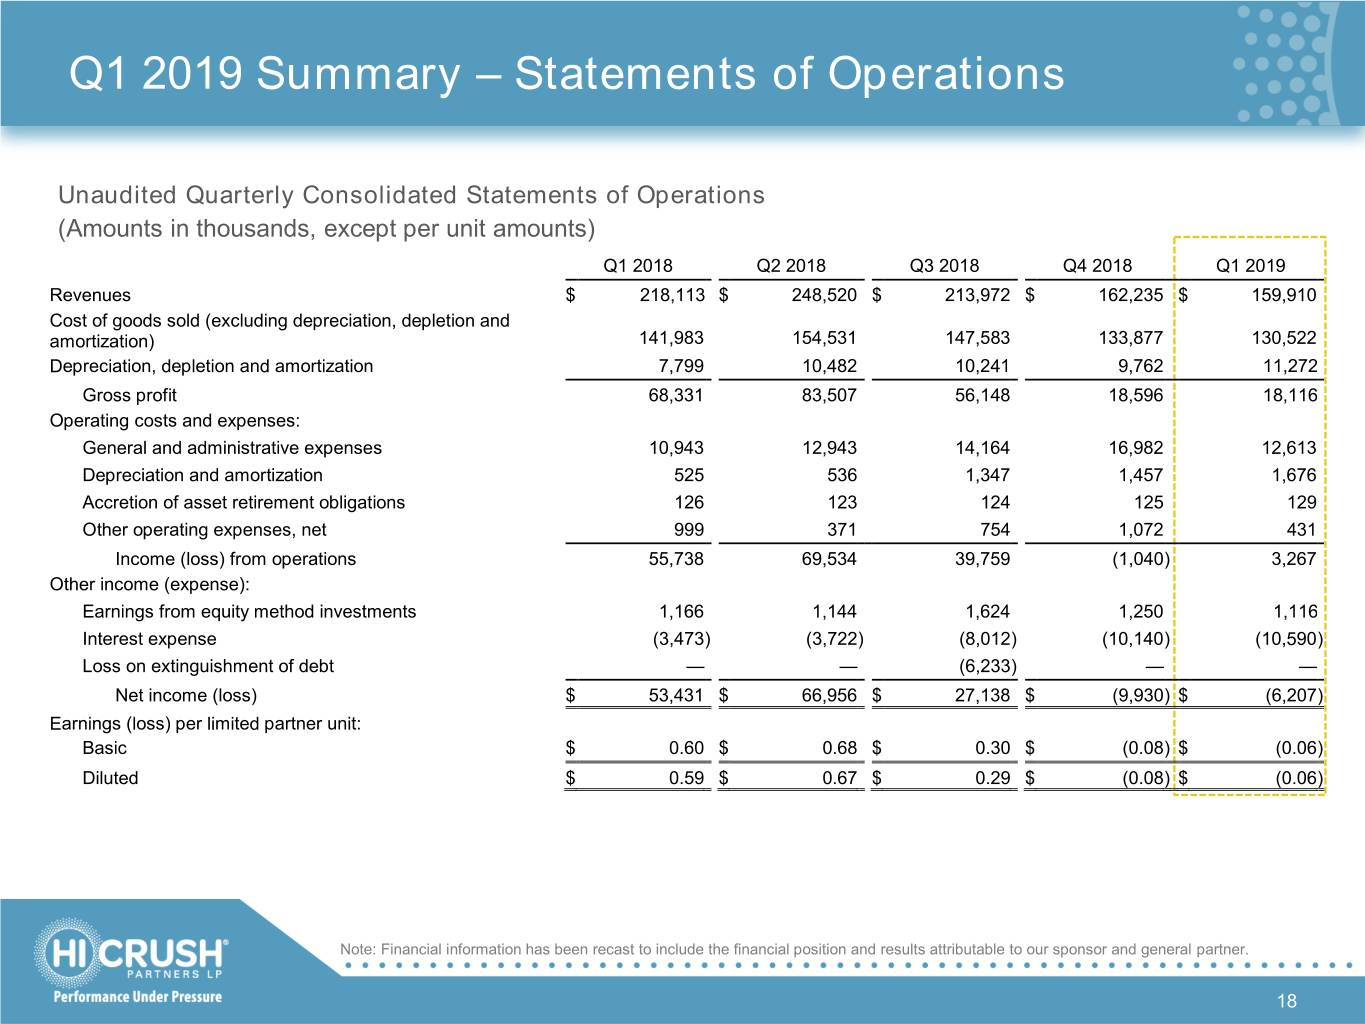
Q1 2019 Summary – Statements of Operations Unaudited Quarterly Consolidated Statements of Operations (Amounts in thousands, except per unit amounts) Q1 2018 Q2 2018 Q3 2018 Q4 2018 Q1 2019 Revenues $ 218,113 $ 248,520 $ 213,972 $ 162,235 $ 159,910 Cost of goods sold (excluding depreciation, depletion and amortization) 141,983 154,531 147,583 133,877 130,522 Depreciation, depletion and amortization 7,799 10,482 10,241 9,762 11,272 Gross profit 68,331 83,507 56,148 18,596 18,116 Operating costs and expenses: General and administrative expenses 10,943 12,943 14,164 16,982 12,613 Depreciation and amortization 525 536 1,347 1,457 1,676 Accretion of asset retirement obligations 126 123 124 125 129 Other operating expenses, net 999 371 754 1,072 431 Income (loss) from operations 55,738 69,534 39,759 (1,040 ) 3,267 Other income (expense): Earnings from equity method investments 1,166 1,144 1,624 1,250 1,116 Interest expense (3,473 ) (3,722 ) (8,012 ) (10,140 ) (10,590 ) Loss on extinguishment of debt — — (6,233 ) — — Net income (loss) $ 53,431 $ 66,956 $ 27,138 $ (9,930 ) $ (6,207 ) Earnings (loss) per limited partner unit: Basic $ 0.60 $ 0.68 $ 0.30 $ (0.08 ) $ (0.06 ) Diluted $ 0.59 $ 0.67 $ 0.29 $ (0.08 ) $ (0.06 ) Note: Financial information has been recast to include the financial position and results attributable to our sponsor and general partner. 18
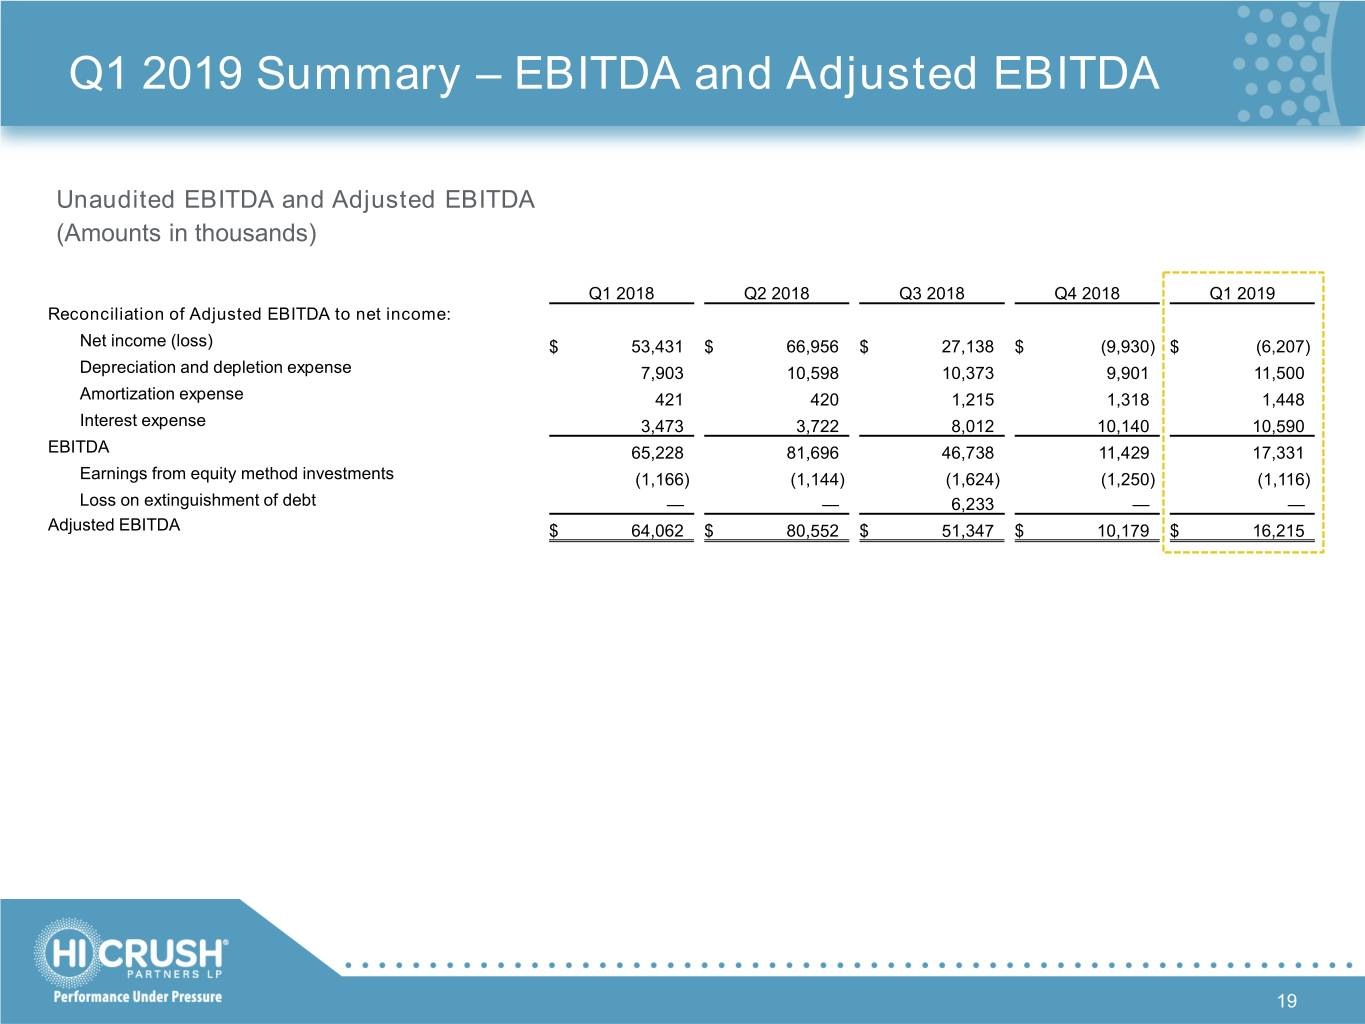
Q1 2019 Summary – EBITDA and Adjusted EBITDA Unaudited EBITDA and Adjusted EBITDA (Amounts in thousands) Q1 2018 Q2 2018 Q3 2018 Q4 2018 Q1 2019 Reconciliation of Adjusted EBITDA to net income: Net income (loss) $ 53,431 $ 66,956 $ 27,138 $ (9,930) $ (6,207) Depreciation and depletion expense 7,903 10,598 10,373 9,901 11,500 Amortization expense 421 420 1,215 1,318 1,448 Interest expense 3,473 3,722 8,012 10,140 10,590 EBITDA 65,228 81,696 46,738 11,429 17,331 Earnings from equity method investments (1,166) (1,144) (1,624) (1,250) (1,116) Loss on extinguishment of debt — — 6,233 — — Adjusted EBITDA $ 64,062 $ 80,552 $ 51,347 $ 10,179 $ 16,215 19
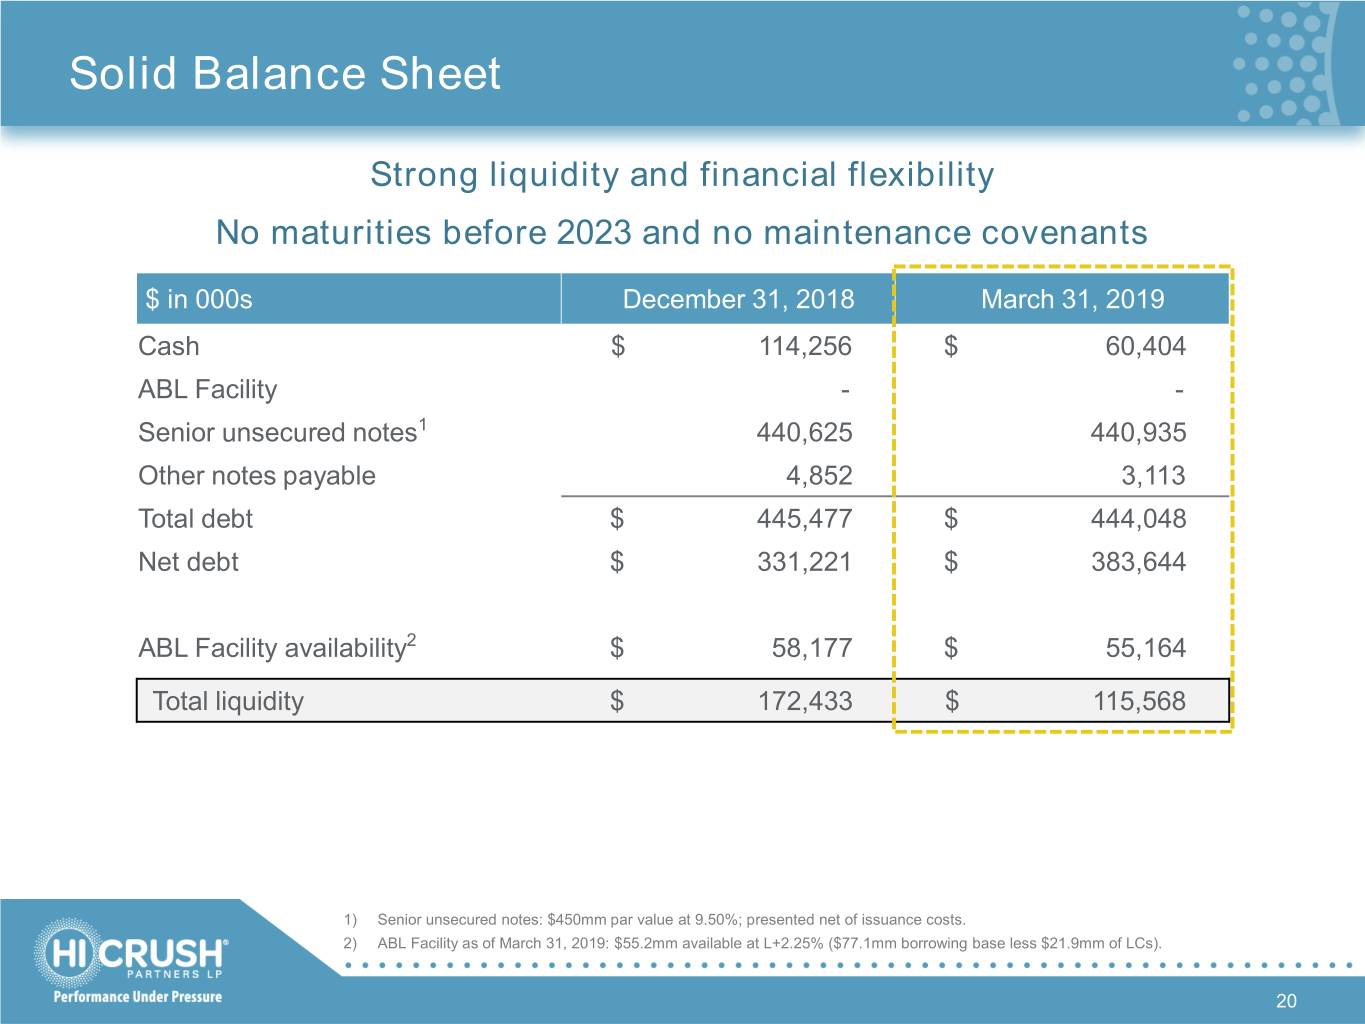
Solid Balance Sheet Strong liquidity and financial flexibility No maturities before 2023 and no maintenance covenants $ in 000s December 31, 2018 March 31, 2019 Cash $ 114,256 $ 60,404 ABL Facility - - Senior unsecured notes1 440,625 440,935 Other notes payable 4,852 3,113 Total debt $ 445,477 $ 444,048 Net debt $ 331,221 $ 383,644 ABL Facility availability2 $ 58,177 $ 55,164 Total liquidity $ 172,433 $ 115,568 1) Senior unsecured notes: $450mm par value at 9.50%; presented net of issuance costs. 2) ABL Facility as of March 31, 2019: $55.2mm available at L+2.25% ($77.1mm borrowing base less $21.9mm of LCs). 20

Investor Contacts Caldwell Bailey Lead Analyst, Investor Relations Marc Silverberg Managing Director (ICR, Inc.) Phone: (713) 980-6270 E-mail: ir@hicrush.com 21


