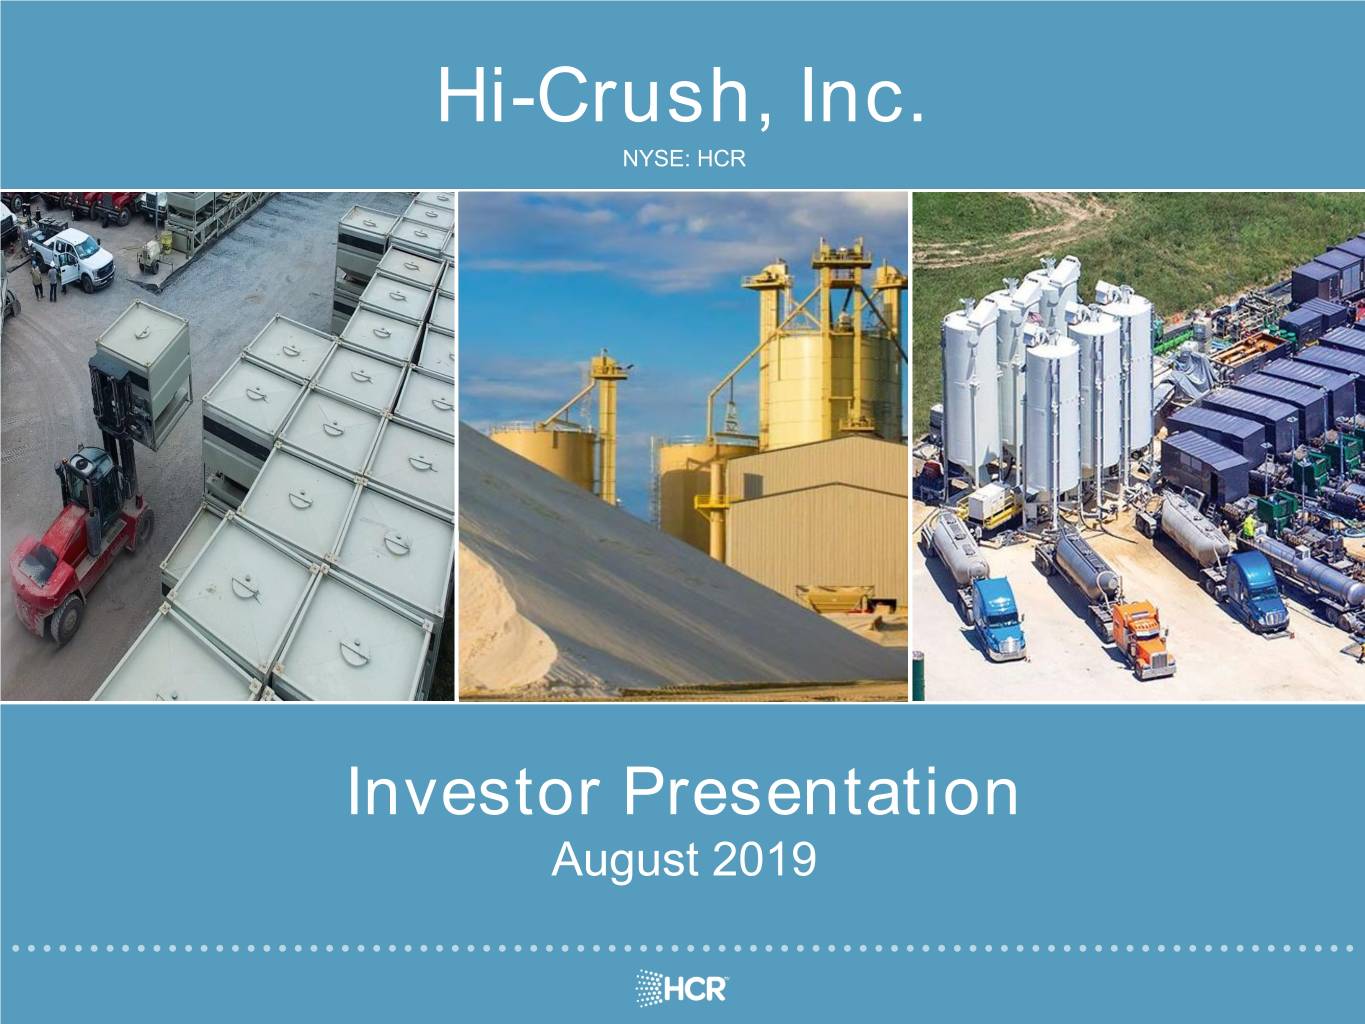
Hi-Crush, Inc. NYSE: HCR Investor Presentation August 2019
Forward Looking Statements and Non-GAAP Measures Forward-Looking Statements and Cautionary Statements Some of the information in this presentation may contain forward-looking statements within the meaning of Section 27A of the Securities Act of 1933, as amended, and Section 21E of the Securities Exchange Act of 1934, as amended (the "Exchange Act"). Forward-looking statements give our current expectations, and contain projections of results of operations or of financial condition, or forecasts of future events. Words such as "may," "should," "assume," "forecast," "position," "predict," "strategy," "expect," "intend," "hope," "plan," "estimate," "anticipate," "could," "believe," "project," "budget," "potential," "likely," or "continue," and similar expressions are used to identify forward-looking statements. They can be affected by assumptions used or by known or unknown risks or uncertainties. Consequently, no forward-looking statements can be guaranteed. When considering these forward-looking statements, you should keep in mind the risk factors and other cautionary statements in Hi-Crush’s reports filed with the SEC, including those described under Item 1A of Hi-Crush’s Form 10-K for the year ended December 31, 2018 and any subsequently filed 10-Q. Actual results may vary materially. You are cautioned not to place undue reliance on any forward-looking statements. You should also understand that it is not possible to predict or identify all such factors and should not consider the risk factors in our reports filed with the SEC or the following list to be a complete statement of all potential risks and uncertainties. Factors that could cause our actual results to differ materially from the results contemplated by such forward looking statements include: the volume of frac sand we are able to sell; the price at which we are able to sell frac sand; the outcome of any pending litigation, claims or assessments, including unasserted claims; changes in the price and availability of natural gas or electricity; changes in prevailing economic conditions; and difficulty collecting receivables. All forward-looking statements are expressly qualified in their entirety by the foregoing cautionary statements. Hi-Crush’s forward-looking statements speak only as of the date made and Hi-Crush undertakes no obligation to update or revise its forward-looking statements, whether as a result of new information, future events or otherwise. Use of Non-GAAP Information This presentation may include non-GAAP financial measures. Such non-GAAP measures are not alternatives to GAAP measures, and you should not consider these non-GAAP measures in isolation or as a substitute for analysis of our results as reported under GAAP. For additional disclosure regarding such non-GAAP measures, including reconciliations to their most directly comparable GAAP measure, please refer to Hi-Crush’s most recent earnings release at www.hicrush.com. 2
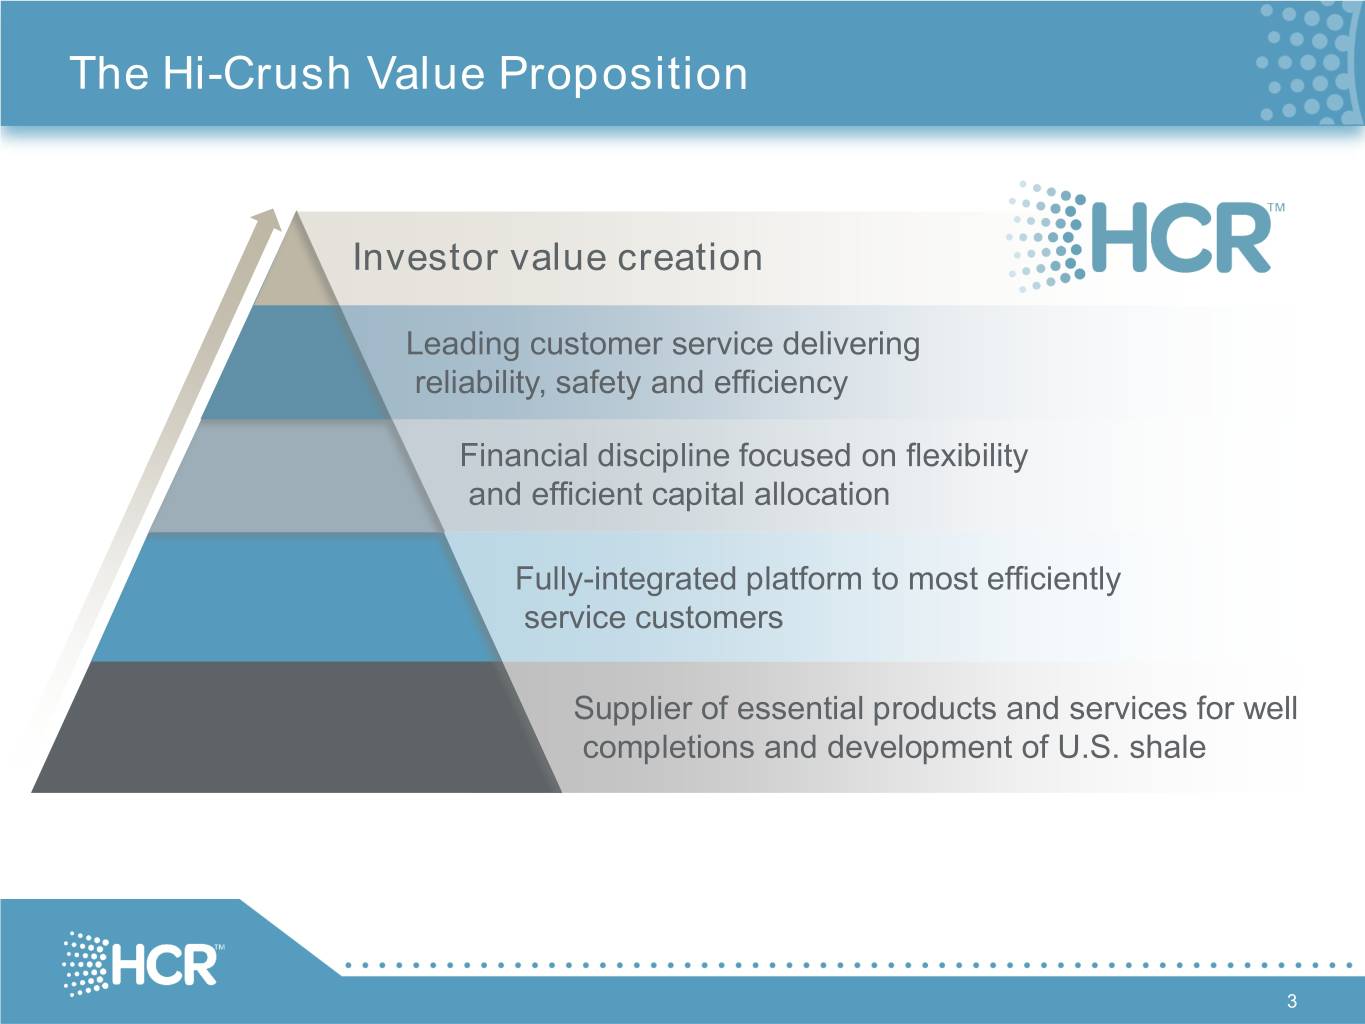
The Hi-Crush Value Proposition Investor value creation Leading customer service delivering reliability, safety and efficiency Financial discipline focused on flexibility and efficient capital allocation Fully-integrated platform to most efficiently service customers Supplier of essential products and services for well completions and development of U.S. shale 3
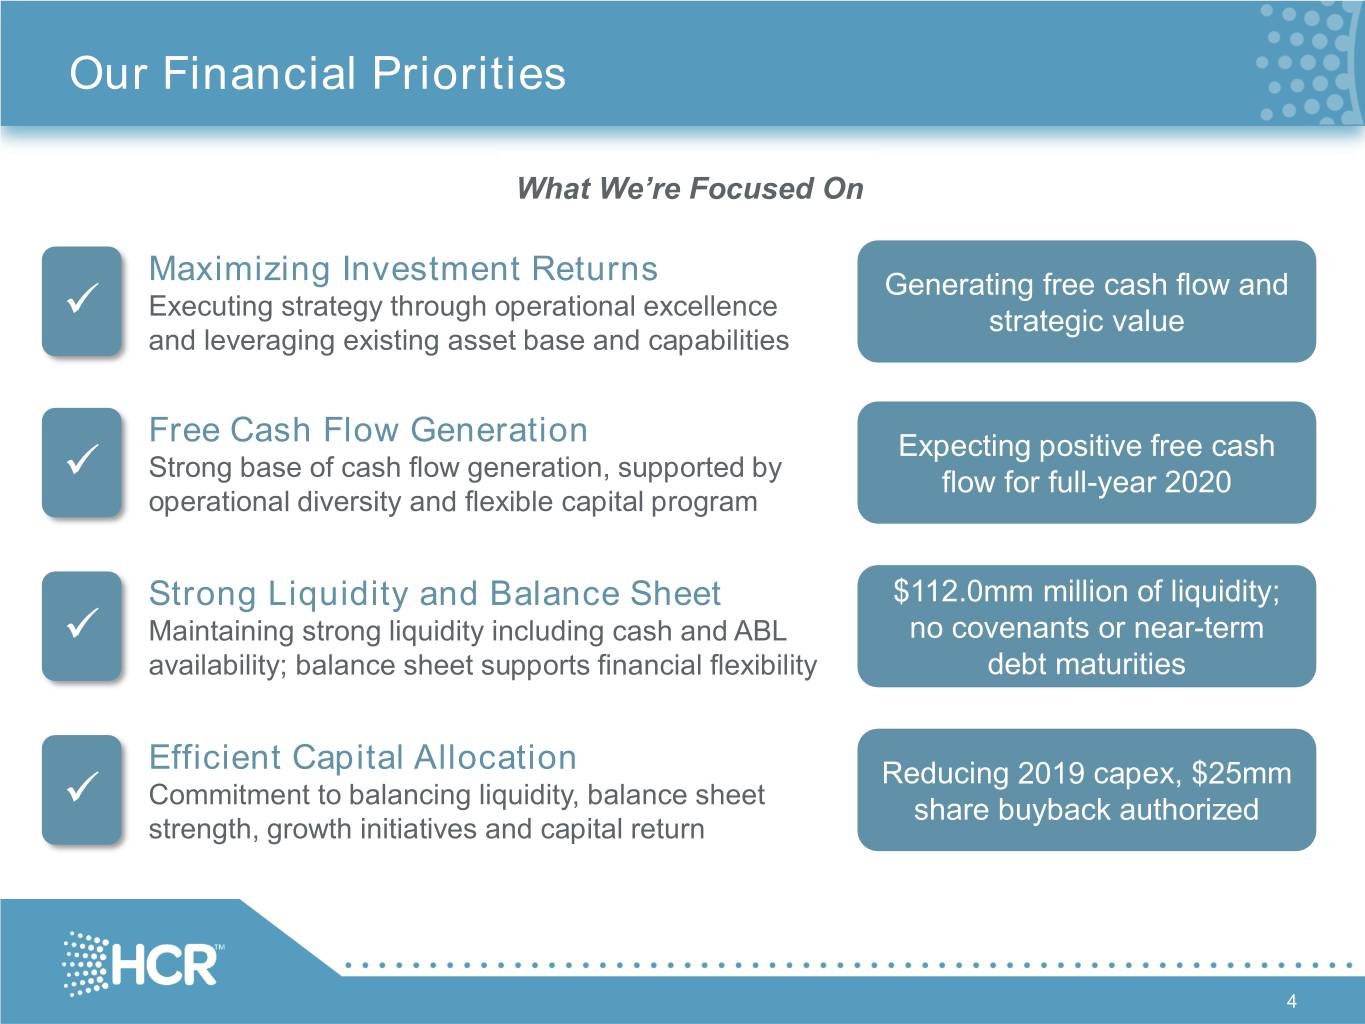
Our Financial Priorities What We’re Focused On Maximizing Investment Returns Generating free cash flow and Executing strategy through operational excellence strategic value and leveraging existing asset base and capabilities Free Cash Flow Generation Expecting positive free cash Strong base of cash flow generation, supported by flow for full-year 2020 operational diversity and flexible capital program Strong Liquidity and Balance Sheet $112.0mm million of liquidity; Maintaining strong liquidity including cash and ABL no covenants or near-term availability; balance sheet supports financial flexibility debt maturities Efficient Capital Allocation Reducing 2019 capex, $25mm Commitment to balancing liquidity, balance sheet share buyback authorized strength, growth initiatives and capital return 4
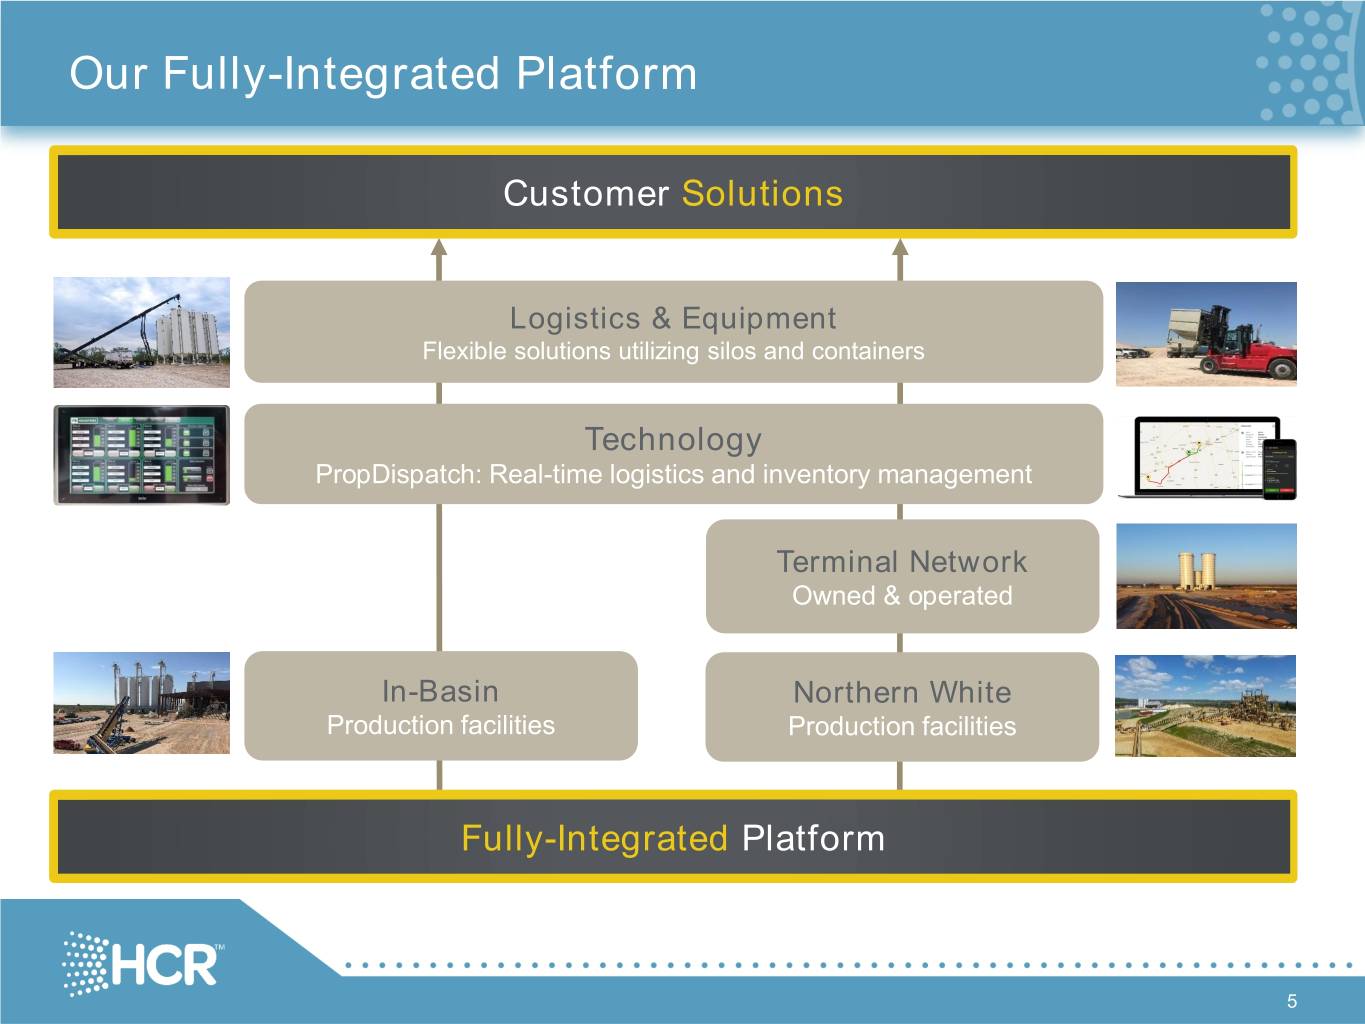
Our Fully-Integrated Platform Customer Solutions Logistics & Equipment Flexible solutions utilizing silos and containers Technology PropDispatch: Real-time logistics and inventory management Terminal Network Owned & operated In-Basin Northern White Production facilities Production facilities Fully-Integrated Platform 5
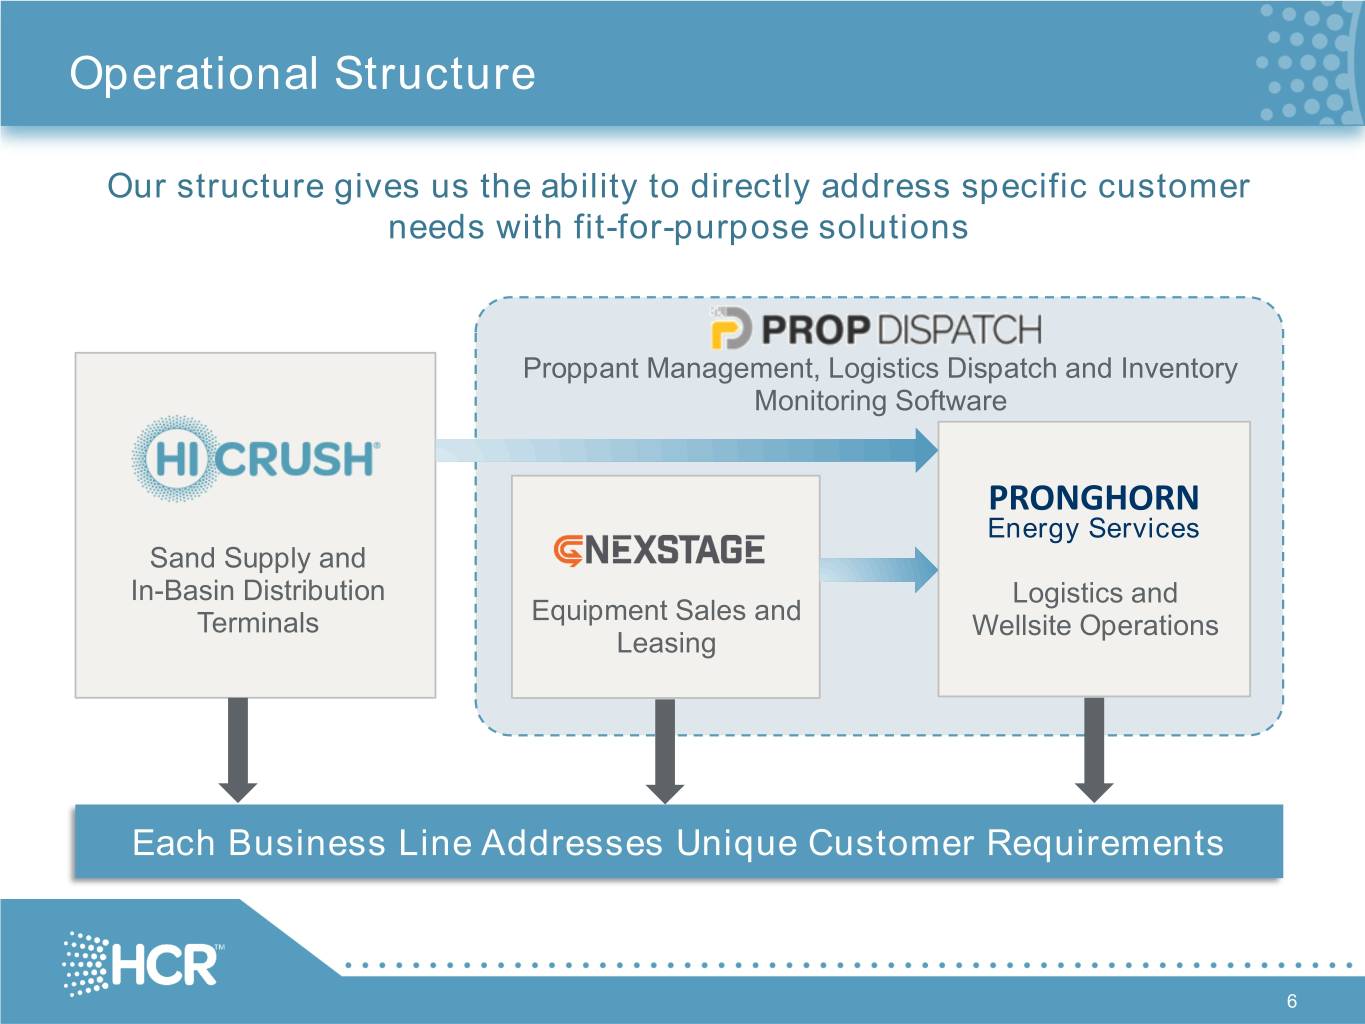
Operational Structure Our structure gives us the ability to directly address specific customer needs with fit-for-purpose solutions Proppant Management, Logistics Dispatch and Inventory Monitoring Software PRONGHORN Energy Services Sand Supply and In-Basin Distribution Logistics and Equipment Sales and Terminals Wellsite Operations Leasing Each Business Line Addresses Unique Customer Requirements 6
Business Update 7
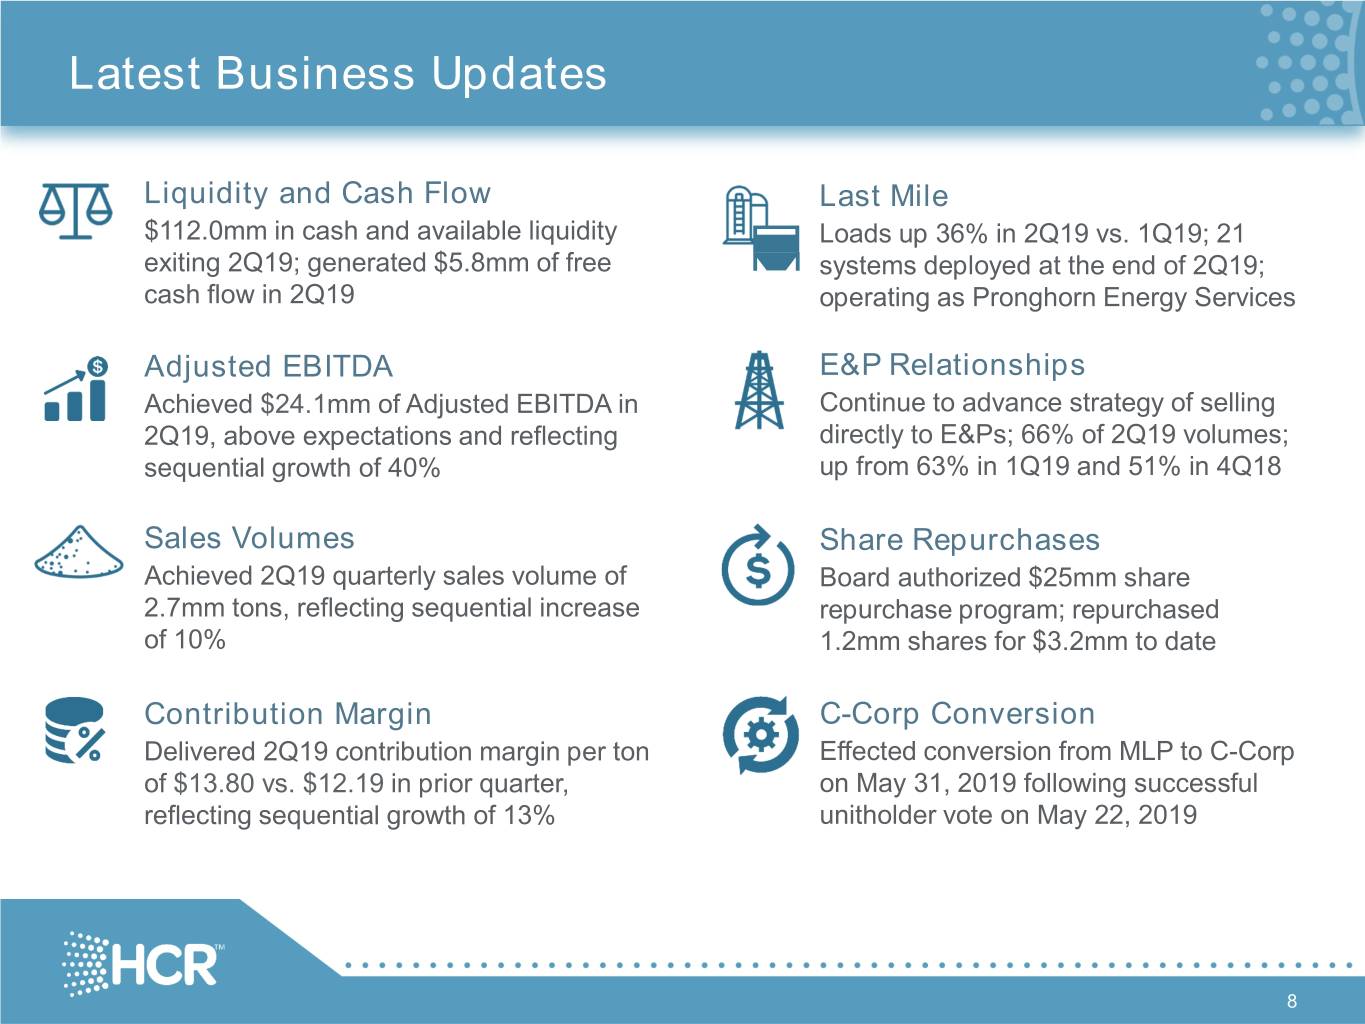
Latest Business Updates Liquidity and Cash Flow Last Mile $112.0mm in cash and available liquidity Loads up 36% in 2Q19 vs. 1Q19; 21 exiting 2Q19; generated $5.8mm of free systems deployed at the end of 2Q19; cash flow in 2Q19 operating as Pronghorn Energy Services Adjusted EBITDA E&P Relationships Achieved $24.1mm of Adjusted EBITDA in Continue to advance strategy of selling 2Q19, above expectations and reflecting directly to E&Ps; 66% of 2Q19 volumes; sequential growth of 40% up from 63% in 1Q19 and 51% in 4Q18 Sales Volumes Share Repurchases Achieved 2Q19 quarterly sales volume of Board authorized $25mm share 2.7mm tons, reflecting sequential increase repurchase program; repurchased of 10% 1.2mm shares for $3.2mm to date Contribution Margin C-Corp Conversion Delivered 2Q19 contribution margin per ton Effected conversion from MLP to C-Corp of $13.80 vs. $12.19 in prior quarter, on May 31, 2019 following successful reflecting sequential growth of 13% unitholder vote on May 22, 2019 8
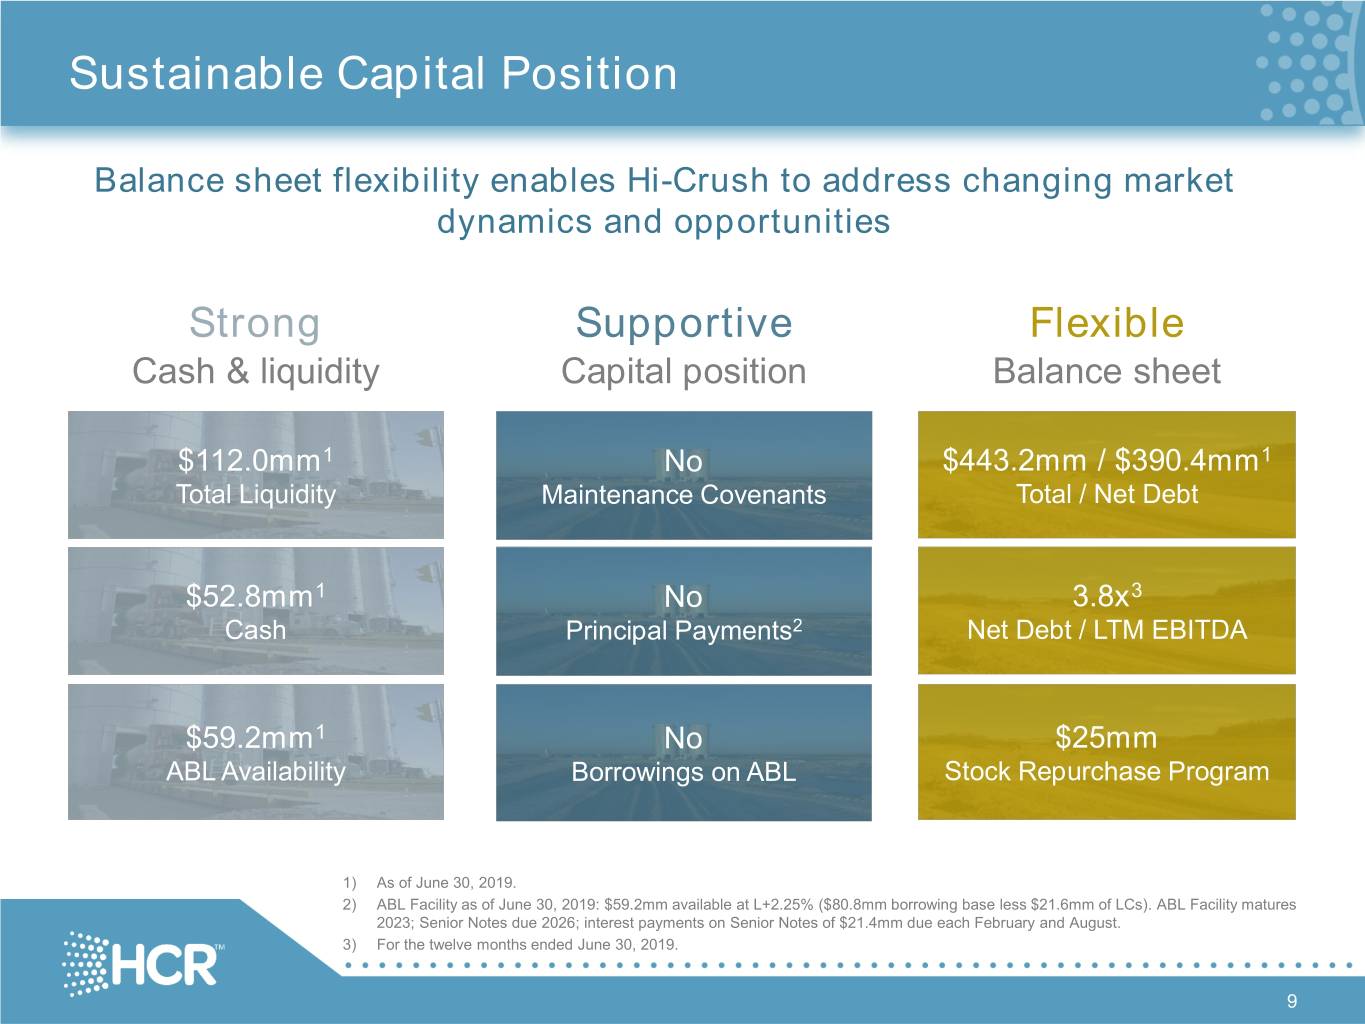
Sustainable Capital Position Balance sheet flexibility enables Hi-Crush to address changing market dynamics and opportunities Strong Supportive Flexible Cash & liquidity Capital position Balance sheet $112.0mm1 No $443.2mm / $390.4mm1 Total Liquidity Maintenance Covenants Total / Net Debt $52.8mm1 No 3.8x3 Cash Principal Payments2 Net Debt / LTM EBITDA $59.2mm1 No $25mm ABL Availability Borrowings on ABL Stock Repurchase Program 1) As of June 30, 2019. 2) ABL Facility as of June 30, 2019: $59.2mm available at L+2.25% ($80.8mm borrowing base less $21.6mm of LCs). ABL Facility matures 2023; Senior Notes due 2026; interest payments on Senior Notes of $21.4mm due each February and August. 3) For the twelve months ended June 30, 2019. 9

Current Debt Structure Senior Notes ABL Facility $450mm $200mm $397.2mm net of cash1 $59.2mm of availability2 No maturities until August 2026 No borrowings No near-term maturities Highly flexible balance Supports efficient or covenant restrictions sheet position capital allocation 1) Cash balance of $52.8mm as of June 30, 2019. 2) ABL Facility as of June 30, 2019: $59.2mm available at L+2.25% ($80.8mm borrowing base less $21.6mm of LCs). 10

Capital Return via Stock Repurchases • Stock repurchase program approved for up to $25 million $3.2mm • Effective through June 30, 2020 completed to date1 Supported by… Balance Sheet Strength Ongoing Confidence in Strategy $112.0mm total liquidity2 Leading proppant logistics solutions No borrowings on ABL facility Focused on serving E&P customers No maintenance covenants Deployment of technology No maturities until 2026 Low-cost production Funded with… Existing cash Capex reductions Future free cash flow 1) Purchases made through June 20, 2019 under 10b-18 program, which places limitations on purchase amounts based on 30-day average volume and dates purchases can be made prior to the end of quarterly reporting period and for two days subsequent to earnings release date. 2) As of June 30, 2019. 11
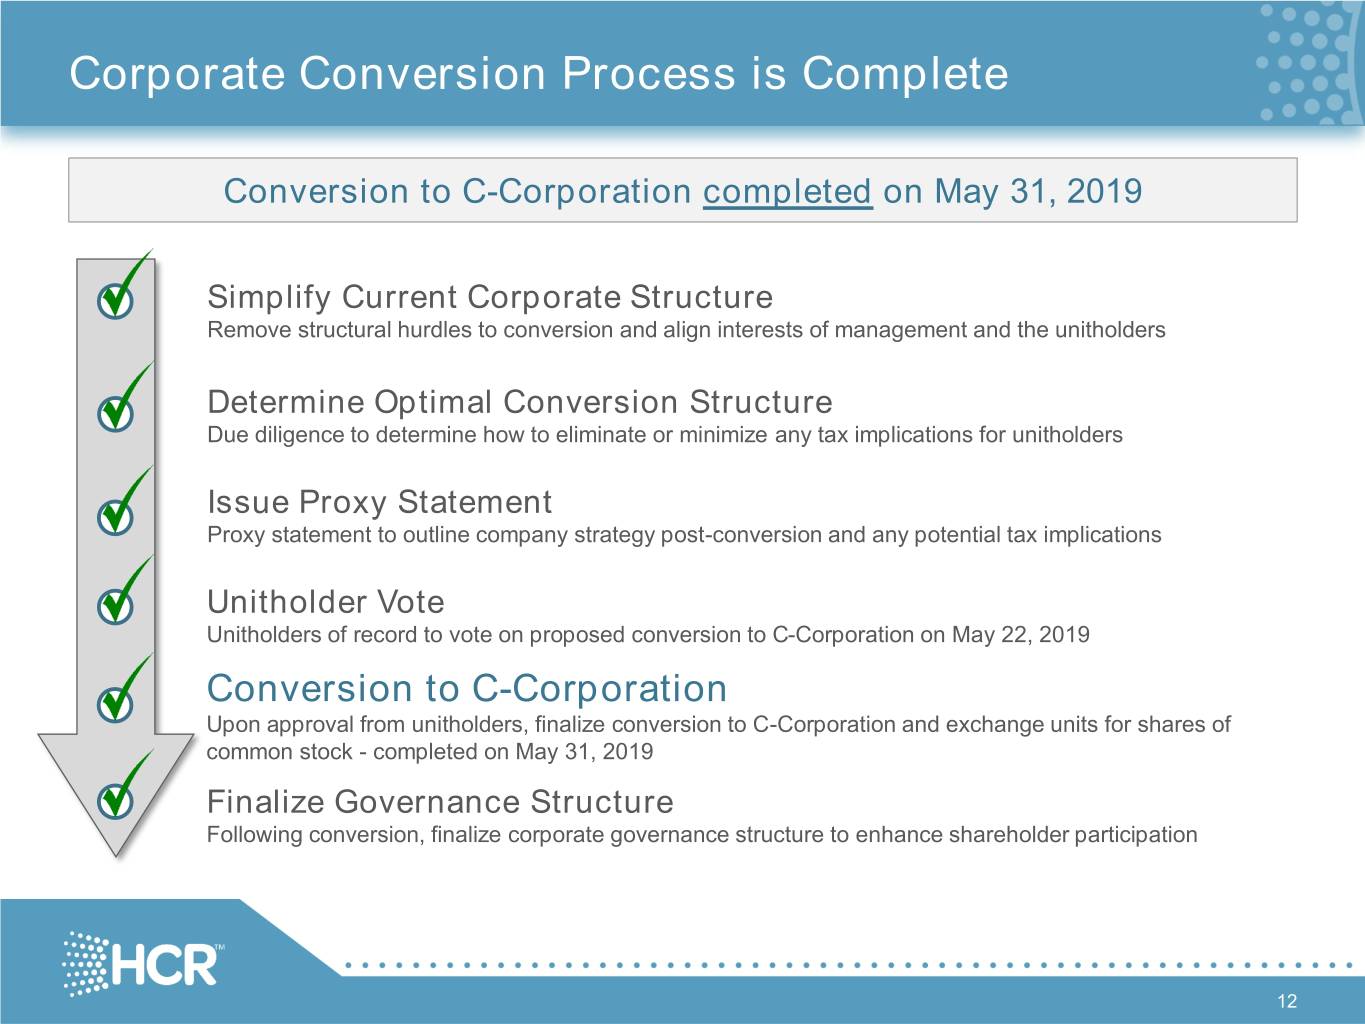
Corporate Conversion Process is Complete Conversion to C-Corporation completed on May 31, 2019 Simplify Current Corporate Structure Remove structural hurdles to conversion and align interests of management and the unitholders Determine Optimal Conversion Structure Due diligence to determine how to eliminate or minimize any tax implications for unitholders Issue Proxy Statement Proxy statement to outline company strategy post-conversion and any potential tax implications Unitholder Vote Unitholders of record to vote on proposed conversion to C-Corporation on May 22, 2019 Conversion to C-Corporation Upon approval from unitholders, finalize conversion to C-Corporation and exchange units for shares of common stock - completed on May 31, 2019 Finalize Governance Structure Following conversion, finalize corporate governance structure to enhance shareholder participation 12
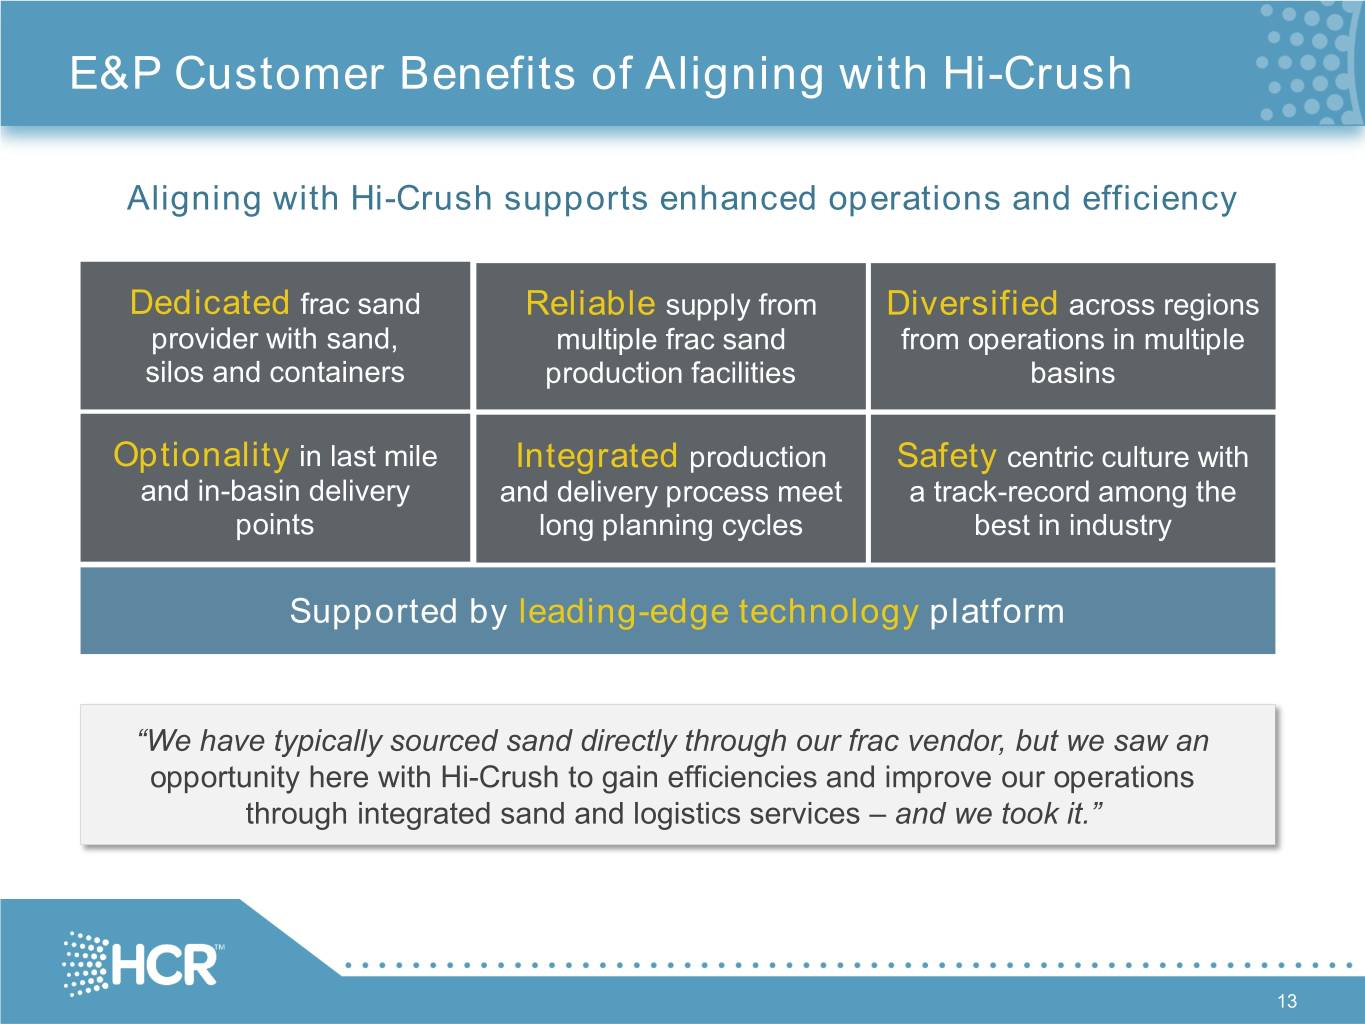
E&P Customer Benefits of Aligning with Hi-Crush Aligning with Hi-Crush supports enhanced operations and efficiency Dedicated frac sand Reliable supply from Diversified across regions provider with sand, multiple frac sand from operations in multiple silos and containers production facilities basins Optionality in last mile Integrated production Safety centric culture with and in-basin delivery and delivery process meet a track-record among the points long planning cycles best in industry Supported by leadingThe Result…-edge technology platform “We have typically sourced sand directly through our frac vendor, but we saw an opportunity here with Hi-Crush to gain efficiencies and improve our operations through integrated sand and logistics services – and we took it.” 13

Hi-Crush Benefits of Aligning with E&P Customers Relationship Driven Long project lead times and significant capital 66% requirements drive E&Ps to value strategic of quarterly sales volumes in 2Q19 relationships with suppliers who offer sold to E&P customers differentiated solutions 66% 63% Better Visibility Closer relationships provide greater visibility into 51% constantly-evolving activity, demand trends and market fundamentals 40% 33% 31% Growth Opportunity 25% Addressing E&Ps’ need for a direct-sourced, preferred provider of flexible, full-scope proppant 14% and logistics solutions 7% 0% 1% Reduces Volatility Partnering with the right E&Ps enhances stability as drilling and completion “manufacturing” programs are more consistent through commodity cycles % of total quarterly sales volumes 14
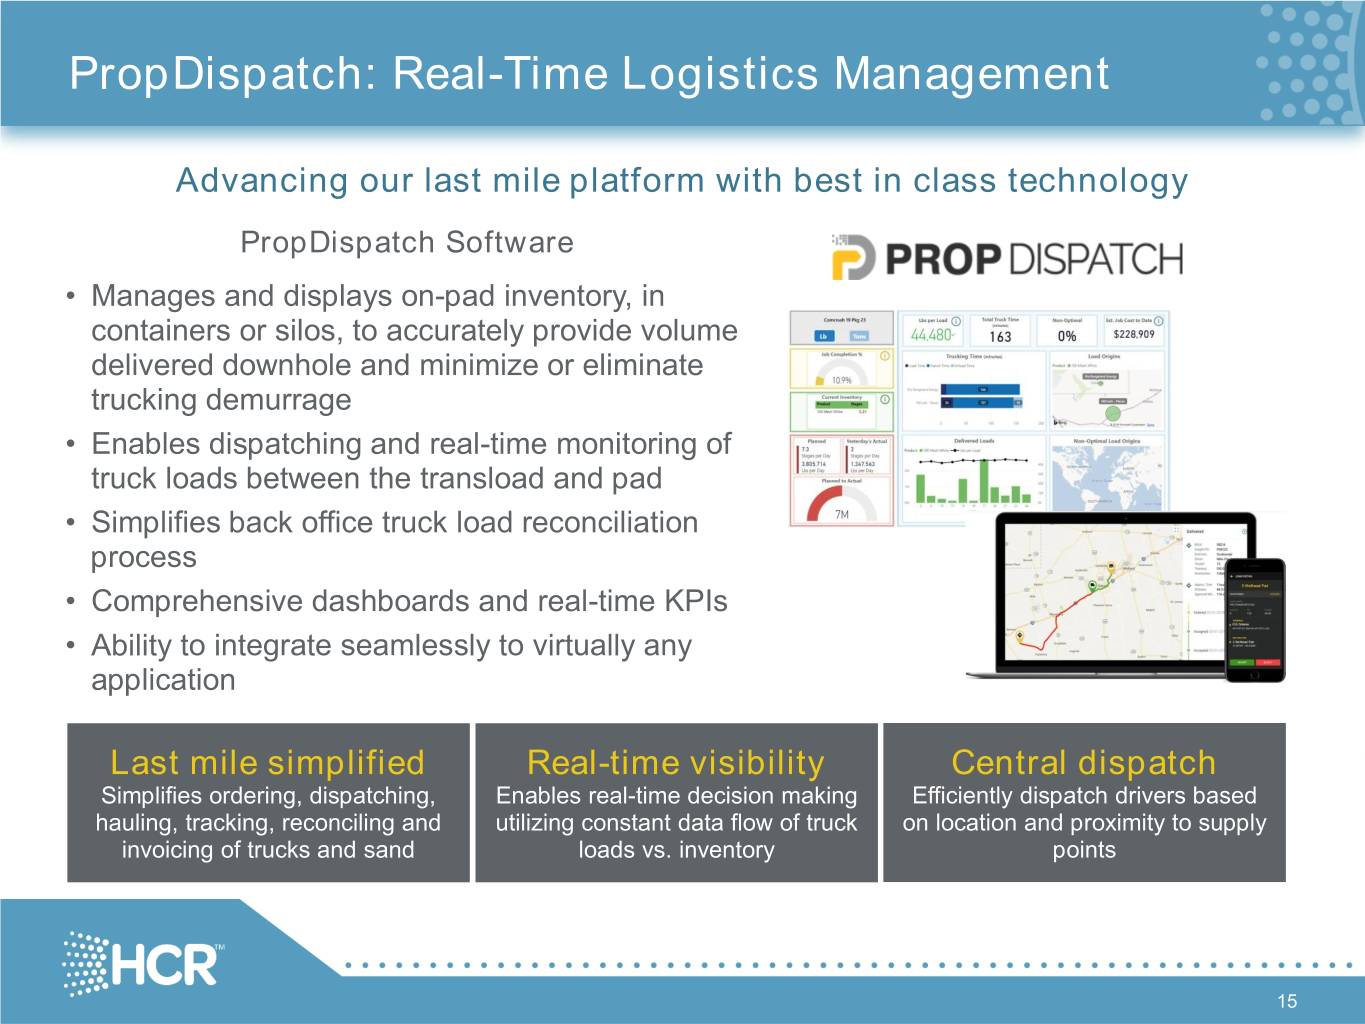
PropDispatch: Real-Time Logistics Management Advancing our last mile platform with best in class technology PropDispatch Software • Manages and displays on-pad inventory, in containers or silos, to accurately provide volume delivered downhole and minimize or eliminate trucking demurrage • Enables dispatching and real-time monitoring of truck loads between the transload and pad • Simplifies back office truck load reconciliation process • Comprehensive dashboards and real-time KPIs • Ability to integrate seamlessly to virtually any application Last mile simplified Real-time visibility Central dispatch Simplifies ordering, dispatching, Enables real-time decision making Efficiently dispatch drivers based hauling, tracking, reconciling and utilizing constant data flow of truck on location and proximity to supply invoicing of trucks and sand loads vs. inventory points 15
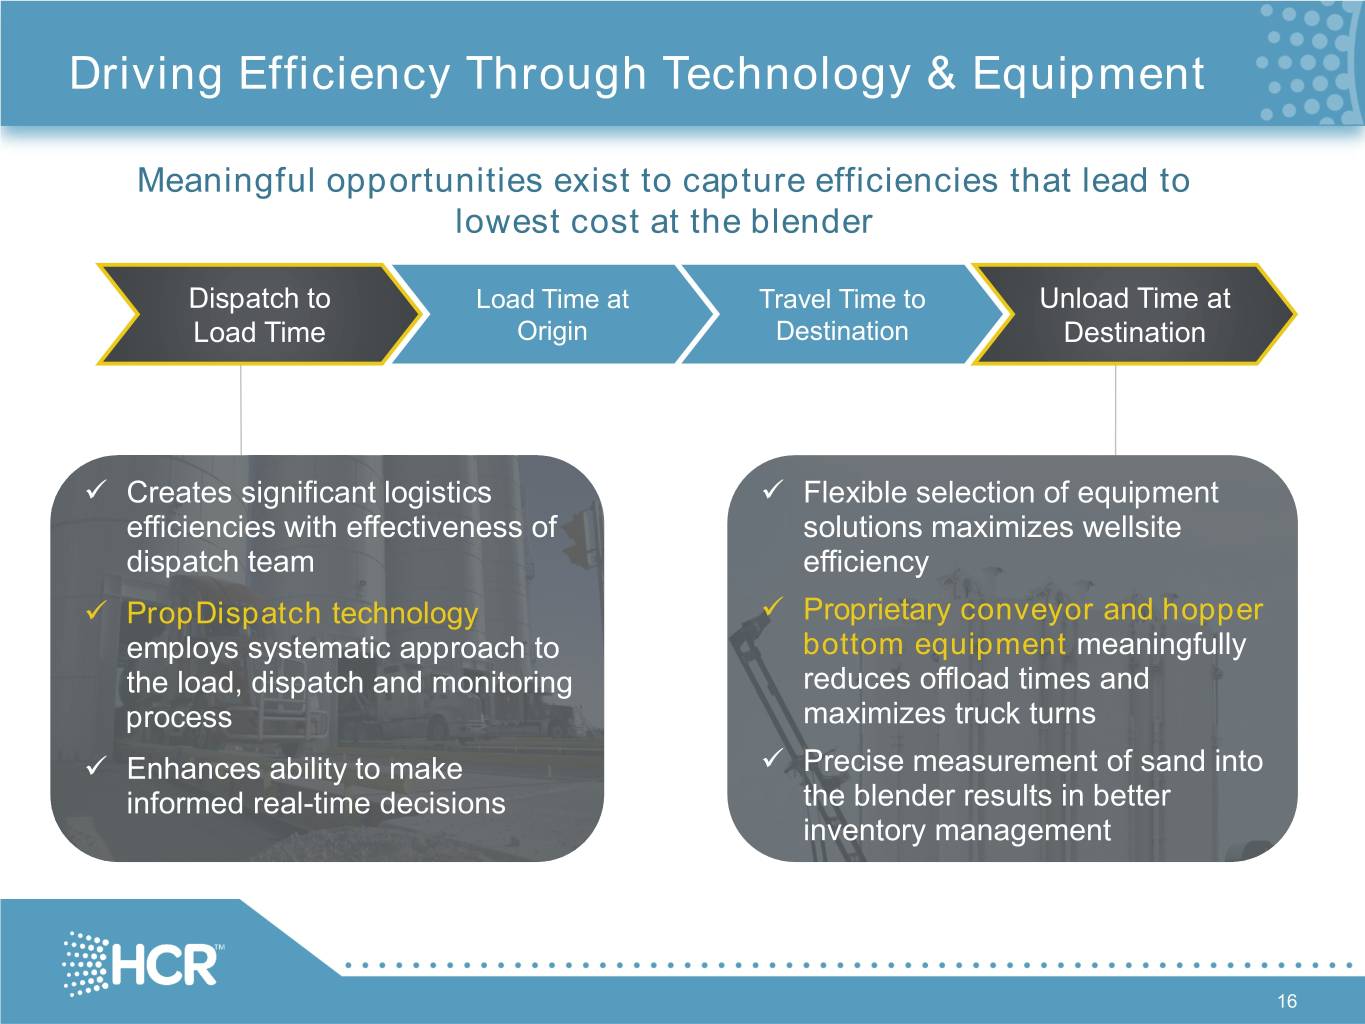
Driving Efficiency Through Technology & Equipment Meaningful opportunities exist to capture efficiencies that lead to lowest cost at the blender Dispatch to Load Time at Travel Time to Unload Time at Load Time Origin Destination Destination Creates significant logistics Flexible selection of equipment efficiencies with effectiveness of solutions maximizes wellsite dispatch team efficiency PropDispatch technology Proprietary conveyor and hopper employs systematic approach to bottom equipment meaningfully the load, dispatch and monitoring reduces offload times and process maximizes truck turns Enhances ability to make Precise measurement of sand into informed real-time decisions the blender results in better inventory management 16
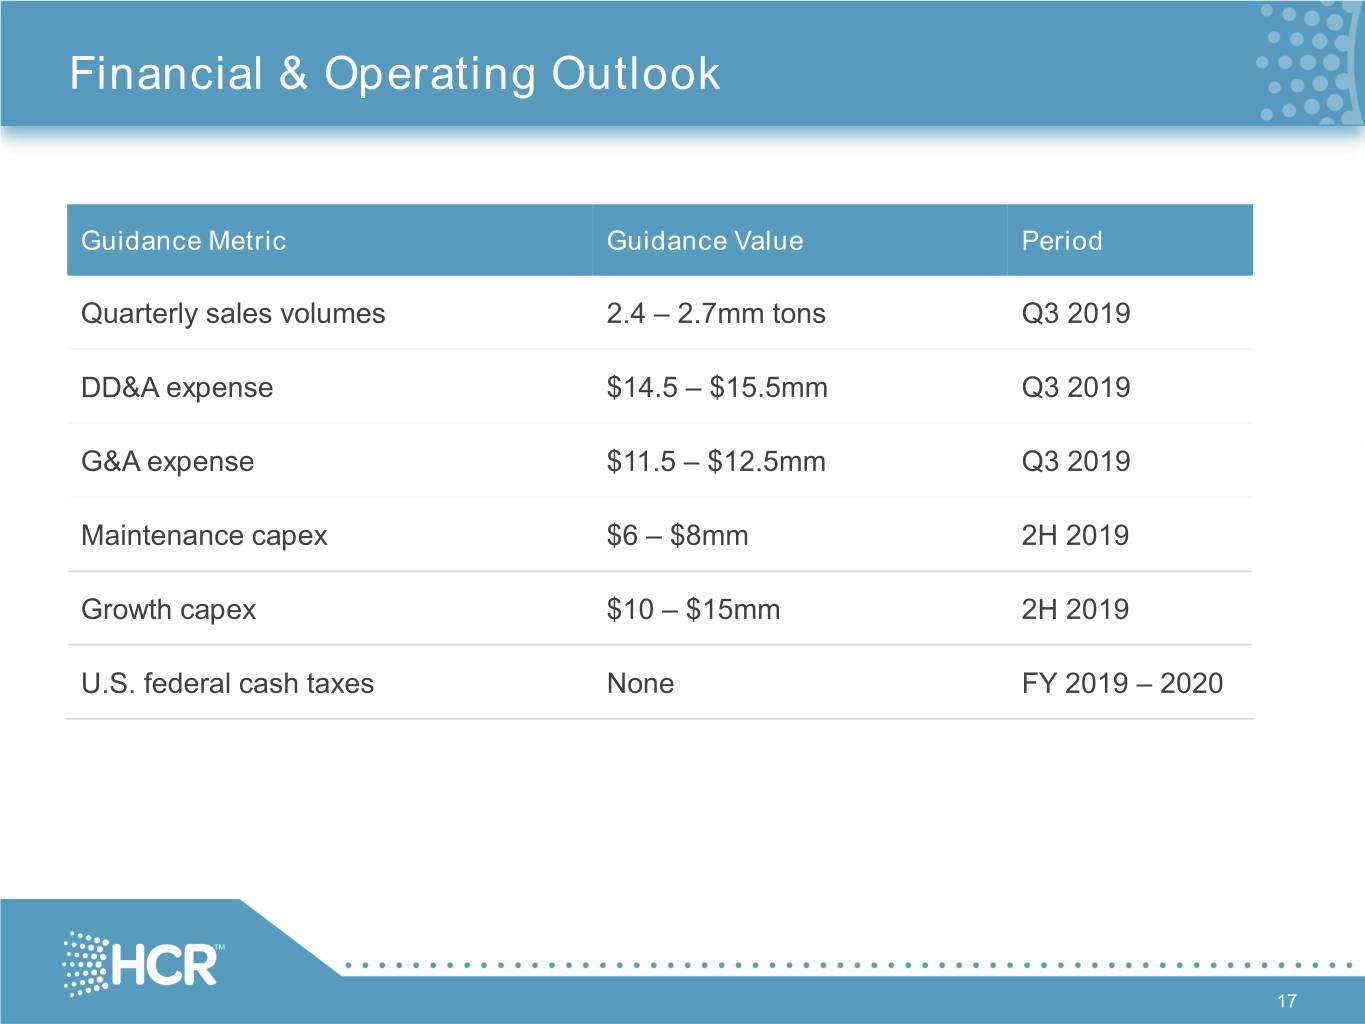
Financial & Operating Outlook Guidance Metric Guidance Value Period Quarterly sales volumes 2.4 – 2.7mm tons Q3 2019 DD&A expense $14.5 – $15.5mm Q3 2019 G&A expense $11.5 – $12.5mm Q3 2019 Maintenance capex $6 – $8mm 2H 2019 Growth capex $10 – $15mm 2H 2019 U.S. federal cash taxes None FY 2019 – 2020 17
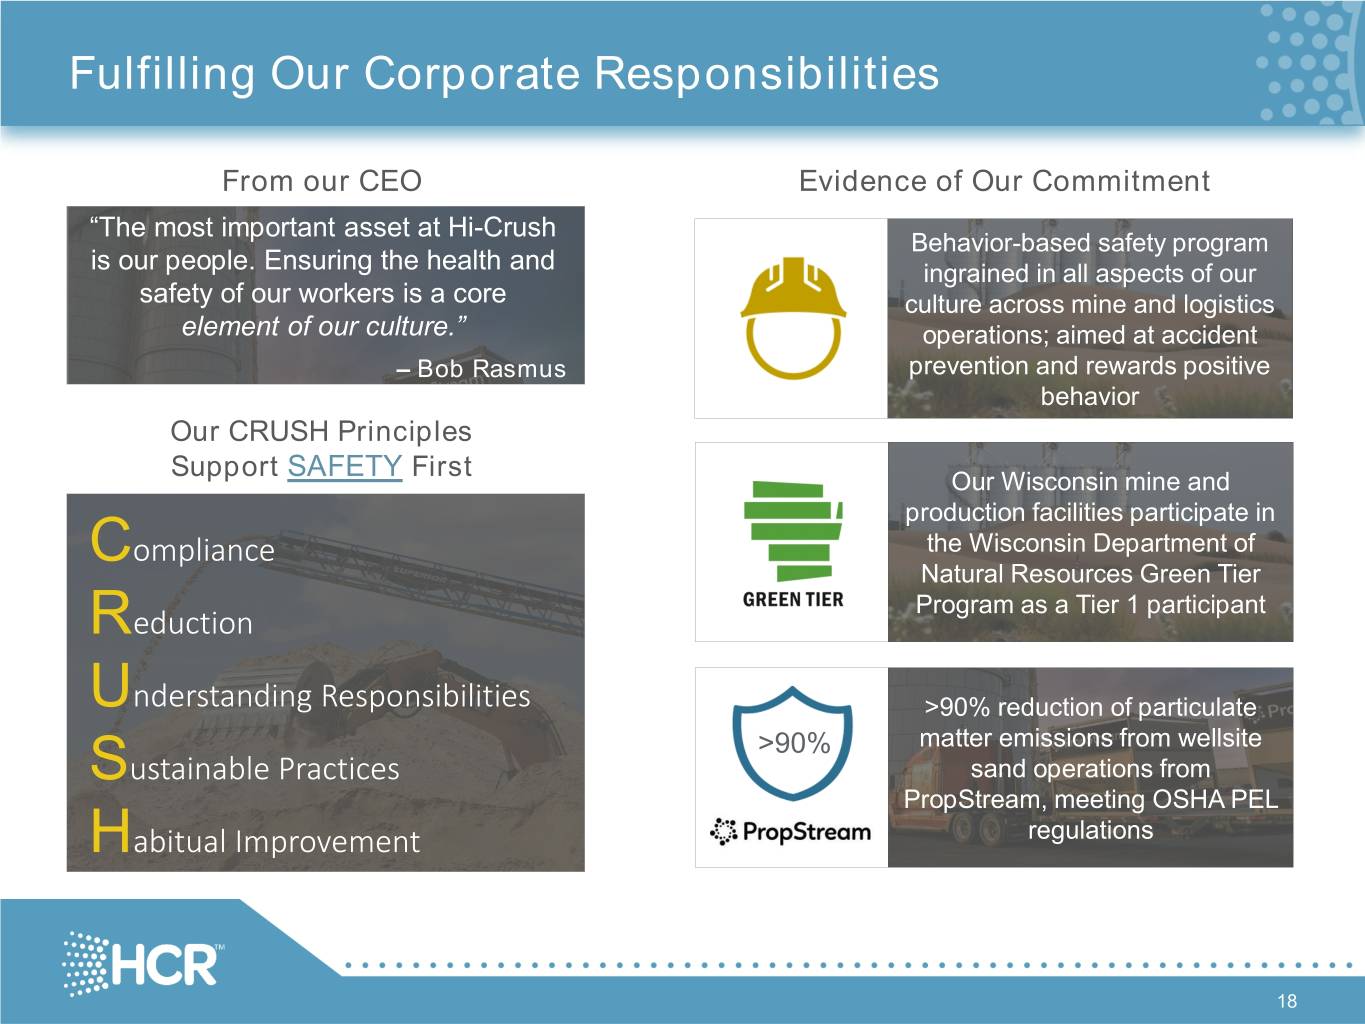
Fulfilling Our Corporate Responsibilities From our CEO Evidence of Our Commitment “The most important asset at Hi-Crush Behavior-based safety program is our people. Ensuring the health and ingrained in all aspects of our safety of our workers is a core culture across mine and logistics element of our culture.” operations; aimed at accident – Bob Rasmus prevention and rewards positive behavior Our CRUSH Principles Support SAFETY First Our Wisconsin mine and production facilities participate in Compliance the Wisconsin Department of Natural Resources Green Tier Program as a Tier 1 participant Reduction Understanding Responsibilities >90% reduction of particulate >90% matter emissions from wellsite Sustainable Practices sand operations from PropStream, meeting OSHA PEL Habitual Improvement regulations 18
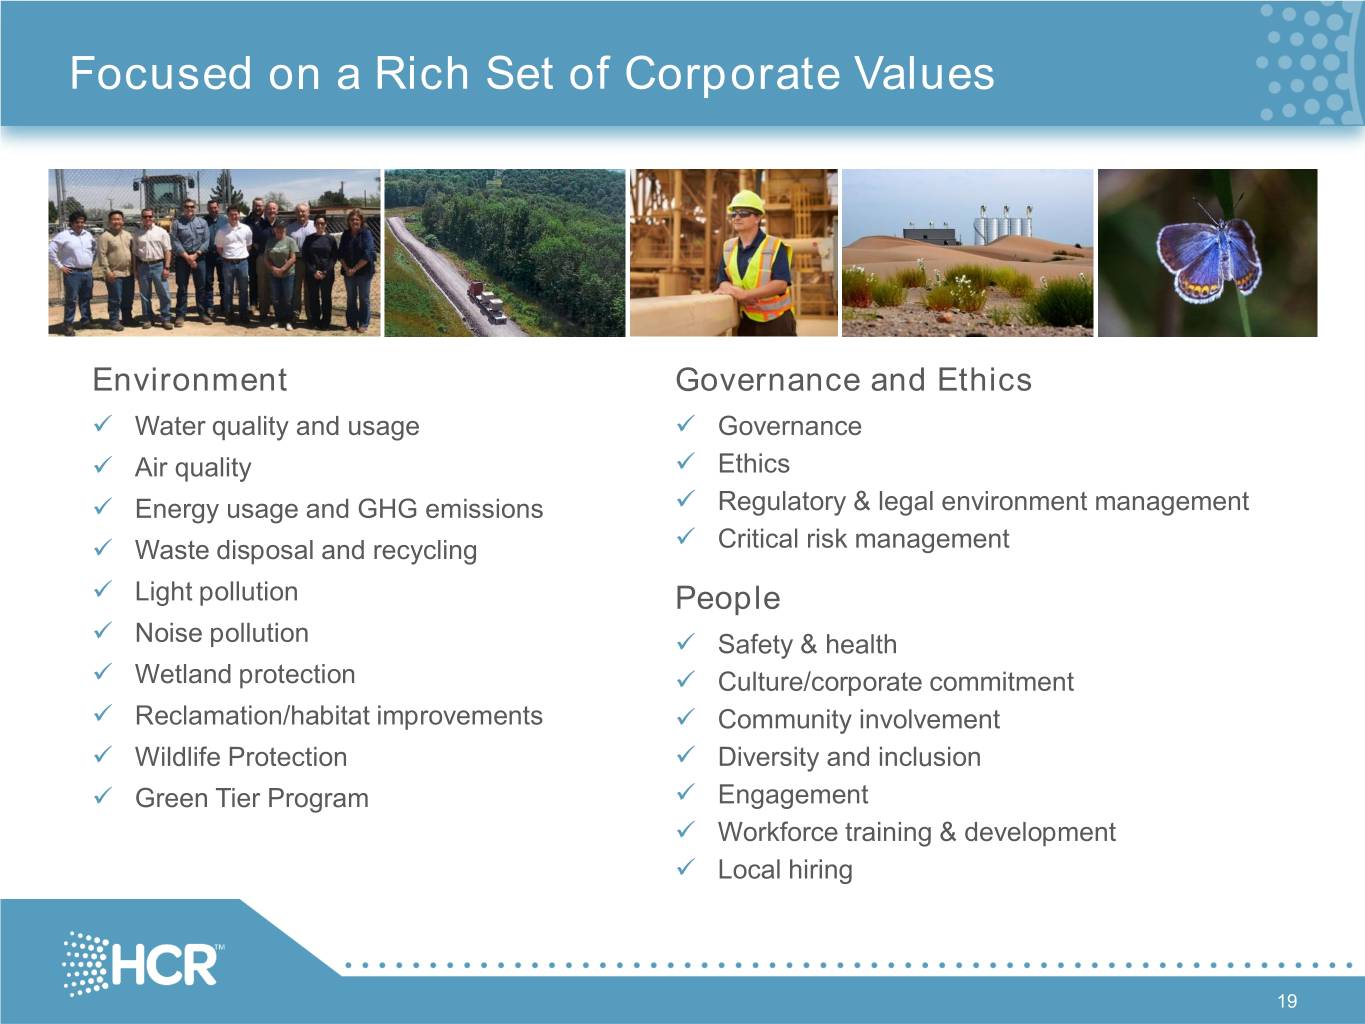
Focused on a Rich Set of Corporate Values Environment Governance and Ethics Water quality and usage Governance Air quality Ethics Energy usage and GHG emissions Regulatory & legal environment management Waste disposal and recycling Critical risk management Light pollution People Noise pollution Safety & health Wetland protection Culture/corporate commitment Reclamation/habitat improvements Community involvement Wildlife Protection Diversity and inclusion Green Tier Program Engagement Workforce training & development Local hiring 19

Appendix 20

Key Financial Metrics $ in 000s, except per ton Q2 2018 Q3 2018 Q4 2018 Q1 2019 Q2 2019 Revenues $ 248,520 $ 213,972 $ 162,235 $ 159,910 $178,001 Adjusted EBITDA1 $ 81,636 $ 52,048 $ 14,889 $ 17,224 $24,055 Average selling price ($/ton) $ 70 $ 64 $ 58 $ 48 $47 Sales volumes (tons) 3,037,504 2,775,360 1,976,805 2,411,262 2,662,086 Contribution margin ($/ton)2 $ 30.94 $ 23.92 $ 14.35 $ 12.19 $13.80 • Revenues increased 11% sequentially, driven by higher Northern White sales volumes and volumes sold through our logistics and wellsite operations • Adjusted EBITDA increased to $24.1mm, driven by higher volumes and improved contribution margin per ton • Contribution margin per ton of $13.80, an increase of 13%, driven by increased sales volumes and positive impact on production costs, particularly at the Wisconsin facilities 1) EBITDA is defined as net income, plus; (i) depreciation, depletion and amortization; (ii) interest expense, net of interest income; and (iii) income tax expense. We define Adjusted EBITDA as EBITDA, plus; (i) non-cash impairments of long-lived assets and goodwill; (ii) change in estimated fair value of contingent consideration; (iii) earnings (loss) from equity method investments; (iv) gain on remeasurement of equity method investments; (v) loss on extinguishment of debt; and (vi) non- recurring business development costs and other items. 2) Contribution margin is defined as total revenues less costs of goods sold excluding depreciation, depletion and amortization. Contribution margin excludes other operating expenses and income, including costs not directly associated with the operations of our business such as accounting, human resources, information technology, legal, sales and other administrative activities. 21
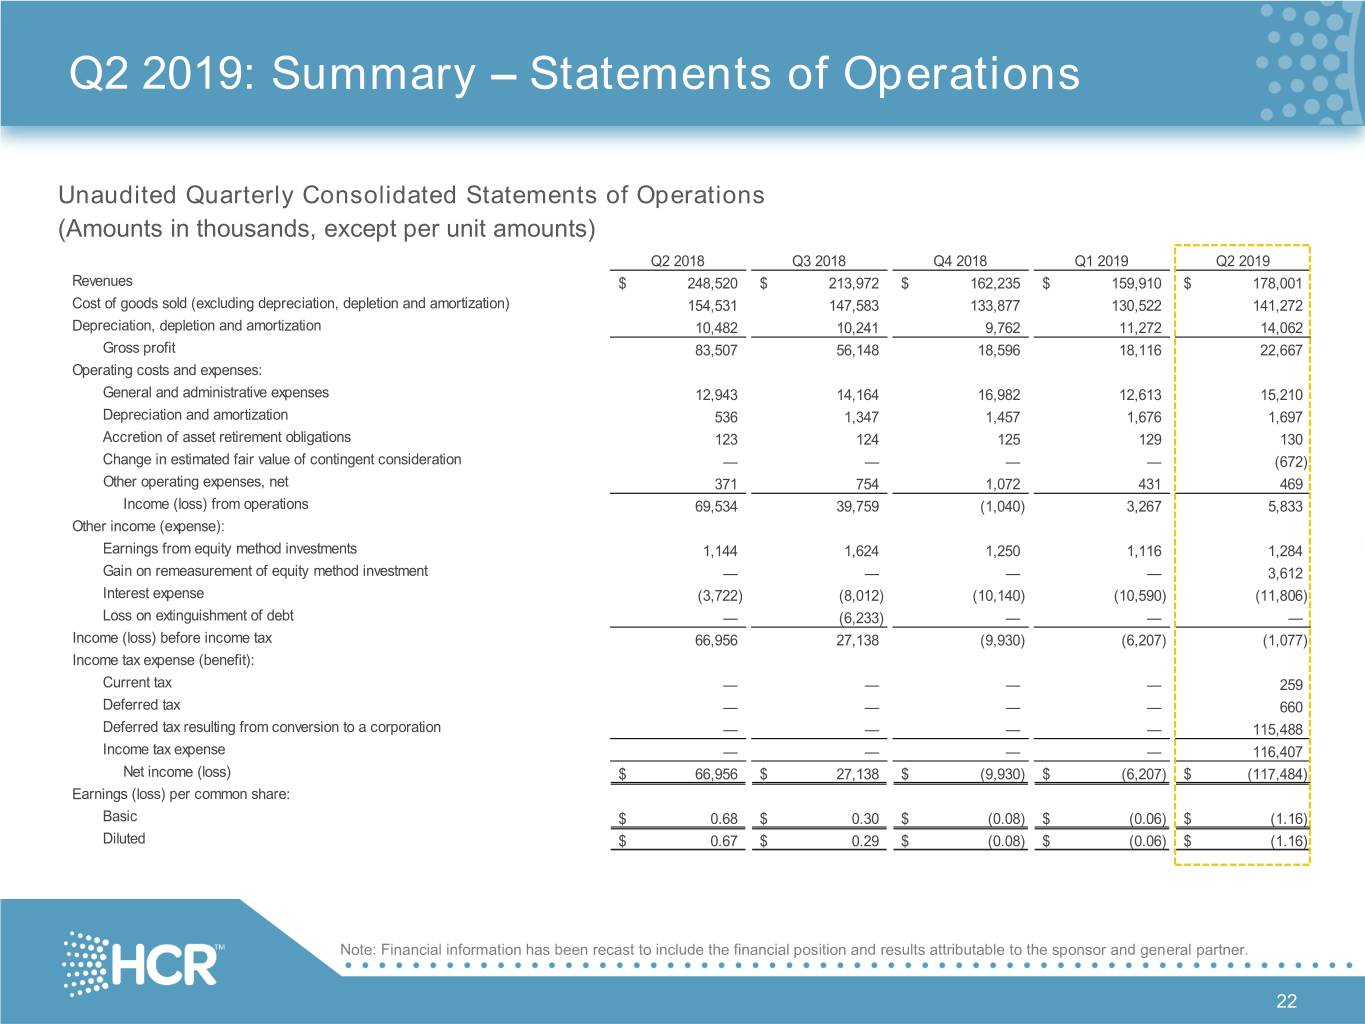
Q2 2019: Summary – Statements of Operations Unaudited Quarterly Consolidated Statements of Operations (Amounts in thousands, except per unit amounts) Q2 2018 Q3 2018 Q4 2018 Q1 2019 Q2 2019 Revenues $ 248,520 $ 213,972 $ 162,235 $ 159,910 $ 178,001 Cost of goods sold (excluding depreciation, depletion and amortization) 154,531 147,583 133,877 130,522 141,272 Depreciation, depletion and amortization 10,482 10,241 9,762 11,272 14,062 Gross profit 83,507 56,148 18,596 18,116 22,667 Operating costs and expenses: General and administrative expenses 12,943 14,164 16,982 12,613 15,210 Depreciation and amortization 536 1,347 1,457 1,676 1,697 Accretion of asset retirement obligations 123 124 125 129 130 Change in estimated fair value of contingent consideration — — — — (672) Other operating expenses, net 371 754 1,072 431 469 Income (loss) from operations Marc - can you69,534 please 39,759 (1,040) 3,267 5,833 Other income (expense): Earnings from equity method investments add the table on1,144 this 1,624 1,250 1,116 1,284 Gain on remeasurement of equity method investment — — — — 3,612 Interest expense slide (3,722) (8,012) (10,140) (10,590) (11,806) Loss on extinguishment of debt — (6,233) — — — Income (loss) before income tax 66,956 27,138 (9,930) (6,207) (1,077) Income tax expense (benefit): Current tax — — — — 259 Deferred tax — — — — 660 Deferred tax resulting from conversion to a corporation — — — — 115,488 Income tax expense — — — — 116,407 Net income (loss) $ 66,956 $ 27,138 $ (9,930) $ (6,207) $ (117,484) Earnings (loss) per common share: Basic $ 0.68 $ 0.30 $ (0.08) $ (0.06) $ (1.16) Diluted $ 0.67 $ 0.29 $ (0.08) $ (0.06) $ (1.16) Note: Financial information has been recast to include the financial position and results attributable to the sponsor and general partner. 22
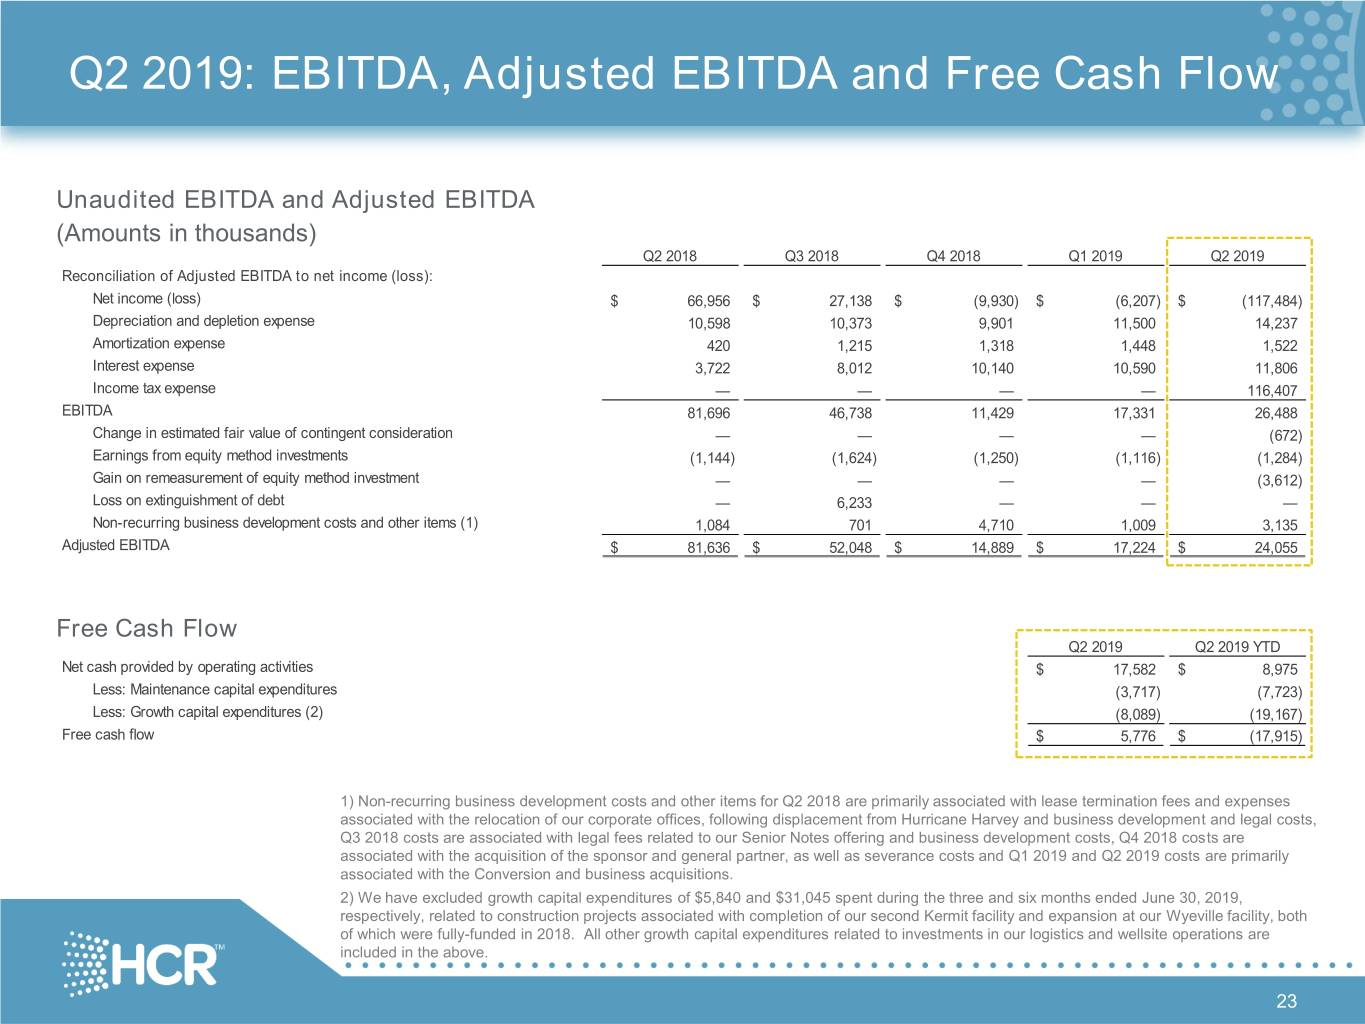
Q2 2019: EBITDA, Adjusted EBITDA and Free Cash Flow Unaudited EBITDA and Adjusted EBITDA (Amounts in thousands) Q2 2018 Q3 2018 Q4 2018 Q1 2019 Q2 2019 Reconciliation of Adjusted EBITDA to net income (loss): Net income (loss) $ 66,956 $ 27,138 $ (9,930) $ (6,207) $ (117,484) Depreciation and depletion expense 10,598 10,373 9,901 11,500 14,237 Amortization expense 420 1,215 1,318 1,448 1,522 Interest expense 3,722 8,012 10,140 10,590 11,806 Income tax expense — — — — 116,407 EBITDA 81,696 46,738 11,429 17,331 26,488 Change in estimated fair value of contingent consideration — — — — (672) Earnings from equity method investments (1,144) (1,624) (1,250) (1,116) (1,284) Gain on remeasurement of equity method investment — — — — (3,612) Loss on extinguishment of debt — 6,233 — — — Non-recurring business development costs and other items (1) 1,084 701 4,710 1,009 3,135 Adjusted EBITDA $ 81,636 $ 52,048 $ 14,889 $ 17,224 $ 24,055 Free Cash Flow Q2 2019 Q2 2019 YTD Net cash provided by operating activities $ 17,582 $ 8,975 Less: Maintenance capital expenditures (3,717) (7,723) Less: Growth capital expenditures (2) (8,089) (19,167) Free cash flow $ 5,776 $ (17,915) 1) Non-recurring business development costs and other items for Q2 2018 are primarily associated with lease termination fees and expenses associated with the relocation of our corporate offices, following displacement from Hurricane Harvey and business development and legal costs, Q3 2018 costs are associated with legal fees related to our Senior Notes offering and business development costs, Q4 2018 costs are associated with the acquisition of the sponsor and general partner, as well as severance costs and Q1 2019 and Q2 2019 costs are primarily associated with the Conversion and business acquisitions. 2) We have excluded growth capital expenditures of $5,840 and $31,045 spent during the three and six months ended June 30, 2019, respectively, related to construction projects associated with completion of our second Kermit facility and expansion at our Wyeville facility, both of which were fully-funded in 2018. All other growth capital expenditures related to investments in our logistics and wellsite operations are included in the above. 23

Solid Balance Sheet Strong liquidity and financial flexibility No debt payments before 2026 and no maintenance covenants $ in 000s March 31, 2019 June 30, 2019 Cash $ 60,404 $ 52,853 ABL Facility - - Senior unsecured notes1 440,935 441,244 Other notes payable 3,113 1,997 Total debt $ 444,048 $ 443,241 Net debt $ 383,644 $ 390,388 ABL Facility availability2 $ 55,164 $ 59,182 Total liquidity $ 115,568 $ 112,035 1) Senior unsecured notes due 2026: $450mm par value at 9.50%; presented net of issuance costs. 2) ABL Facility as of June 30, 2019: $59.2mm available at L+2.25% ($80.8mm borrowing base less $21.6mm of LCs). 24
Investor Contacts Caldwell Bailey Lead Analyst, Investor Relations Marc Silverberg Managing Director (ICR, Inc.) Phone: (713) 980-6270 E-mail: ir@hicrush.com 25


