Filed Pursuant to Rule 424(b)(3)
Registration No. 333-185676
TRILINC GLOBAL IMPACT FUND, LLC
SUPPLEMENT NO. 15 DATED FEBRUARY 5, 2015
TO THE PROSPECTUS DATED APRIL 15, 2014
This prospectus supplement (“Supplement”) is part of and should be read in conjunction with the prospectus of TriLinc Global Impact Fund, LLC (the “Company”), dated April 15, 2014, as supplemented by Prospectus Supplement No. 11, dated November 17, 2014, Prospectus Supplement No. 12, dated December 5, 2014, Prospectus Supplement No. 13, dated December 10, 2014, and Prospectus Supplement No. 14, dated January 7, 2015 (the “Prospectus”). Unless otherwise defined herein, capitalized terms used in this Supplement shall have the same meanings as in the Prospectus.
The purposes of this Supplement are as follows:
| A. | To provide information regarding our public offering; |
| B. | To provide information regarding distributions declared; and |
| C. | To update the section of the Prospectus titled “Business.” |
| A. | Status of Our Public Offering |
As of February 4, 2015, we had raised gross proceeds of approximately $72.7 million from the sale of approximately 7.7 million units of our limited liability company interest, including units issued pursuant to our distribution reinvestment plan.
| B. | Declaration of Distributions |
On January 20, 2015, with the authorization of our board of managers, the Company declared distributions for all classes of units for the period from January 1 through January 31, 2015. These distributions were calculated based on unitholders of record for each day in an amount equal to $0.00197808 per unit per day (less the distribution fee with respect to Class C units). On February 2, 2015, $309,644 of these distributions were paid in cash and on January 31, 2015, $142,892 were reinvested in the Company’s units for those investors participating in the Company’s unit Distribution Reinvestment Plan. Some or all of the Company’s distributions have been and may continue to be paid from sources other than cash flow from operations, such as capital contributions from the Sponsor, cash resulting from a waiver or deferral of fees, and/or proceeds from this offering.
| C. | Update to the Section Titled “Business” |
| 1. | The following information updates and supplements the “Business—Investments—Overview” section of the Prospectus to provide certain information regarding the Company’s investment portfolio as of January 31, 2015: |
Investments
Since the Company commenced operations and through January 31, 2015, the Company has funded in excess of $77.2 million in term loans and trade finance facilities. Given the Company’s weighted average portfolio duration of less than a year, a significant portion of the secured borrower debt has paid off and been reinvested in new transactions.
| Description | Sector | Country | Investment Type | Maturity1 | Interest Rate2 | Total Loan Commitment3 | Total Amount Outstanding4 | Primary Impact Objective | ||||||||||||||||
Agricultural Supplies Producer | Agricultural Chemicals | South Africa | Trade Finance | 3/12/2015 | 13.00 | % | $ | 10,000,000 | $ | 6,770,294 | Job Creation | |||||||||||||
Agriculture Distributor | Farm-Product Raw Materials | Argentina | Trade Finance | 7/28/2015 | 9.00 | % | $ | 7,000,000 | $ | 6,000,000 | Job Creation | |||||||||||||
Beef Exporter | Meat Products | Argentina | Trade Finance | 6/4/2015 | 11.98 | % | $ | 7,000,000 | $ | 6,000,000 | Job Creation | |||||||||||||
Candle Distributor | Miscellaneous Manufacturing Industries | South Africa | Trade Finance | 3/3/2015 | 12.75 | % | $ | 1,400,000 | $ | 1,400,000 | Job Creation | |||||||||||||
Cement Distributor | Cement, Hydraulic | Kenya | Trade Finance | 3/17/2015 | 14.75 | % | $ | 5,000,000 | $ | 5,000,000 | Job Creation | |||||||||||||
Construction Materials Distributor5 | Hardware, Plumbing, and Heating Equipment | South Africa | Trade Finance | 5/29/2015 | 12.75 | % | $ | 750,000 | $ | 656,175 | Job Creation | |||||||||||||
Consumer Goods Distributor | Groceries and Related Products | Namibia | Trade Finance | 2/13/2015 | 12.00 | % | $ | 2,000,000 | $ | 2,000,000 | Job Creation | |||||||||||||
Dairy Co-Operative6 | Dairy Products | Argentina | Trade Finance | 11/3/2015 | 10.33 | % | $ | 6,000,000 | $ | 6,000,000 | Job Creation | |||||||||||||
Diaper Manufacturer7 | Converted Paper and Paperboard Products | Peru | Term Loan | 06/15/2017 | 15.60 | % | $ | 2,750,000 | $ | 2,750,000 | Job Creation | |||||||||||||
Farm Supplies Distributor | Miscellaneous Non-Durable Goods | Zambia | Trade Finance | 3/1/2015 | 12.50 | % | $ | 5,000,000 | $ | 4,330,398 | Job Creation | |||||||||||||
Fruit & Nut Distributor8 | Groceries and Related Products | South Africa | Trade Finance | 5/22/2015 | 17.50 | % | $ | 1,250,000 | $ | 1,154,848 | Job Creation | |||||||||||||
Meat Processor | Meat Products | South Africa | Trade Finance | 2/28/2015 | 12.50 | % | $ | 1,000,000 | $ | 626,110 | Job Creation | |||||||||||||
Mine Remediation Company | Metal Mining Services | South Africa | Trade Finance | 10/1/2015 | 17.50 | % | $ | 2,500,000 | $ | 2,415,367 | Job Creation | |||||||||||||
Rice & Bean Importer | Groceries and Related Products | South Africa | Trade Finance | 4/28/2015 | 12.50 | % | $ | 1,000,000 | $ | 1,000,000 | Job Creation | |||||||||||||
Soybean Distributor | Fats and Oils | Argentina | Trade Finance | 12/12/2014 | 9.02 | % | $ | 3,500,000 | $ | 0 | Job Creation | |||||||||||||
Sugar Producer | Field Crops, Except Cash Grains | Brazil | Term Loan | 4/30/2017 | 12.43 | % | $ | 3,000,000 | $ | 3,000,000 | Capacity- Building | |||||||||||||
Textile Distributor | Apparel, Piece Goods, and Notions | South Africa | Trade Finance | 3/12/2015 | 15.00 | % | $ | 2,500,000 | $ | 1,746,257 | Job Creation | |||||||||||||
Portfolio Totals | $ | 61,650,000 | $ | 50,849,449 | ||||||||||||||||||||
| 1 | Given the nature of trade finance contracts, trade finance borrowers typically have a 30 day grace period relative to the maturity date. |
| 2 | Interest rates are as of January 31, 2015. Interest rates include contractual rates and accrued fees where applicable. |
| 3 | The total loan commitment represents the maximum amount that can be borrowed under the agreement. The actual amount drawn on the loan by the borrower may change over time. Loan commitments are subject to availability of funds and do not represent a contractual obligation to provide funds to a borrower. |
| 4 | The total amount outstanding represents the actual amount borrowed under the loan as of January 31, 2015. In some instances where there is a $0 balance, the borrower may have paid back the original amount borrowed under a trade finance facility and under an agreement, may borrow again. |
| 5 | On January 28, 2015, TriLinc funded $182,109 as part of an existing $750,000 trade finance facility at a fixed interest rate of 12.75% to the Construction Materials Supplier. The transaction, set to mature on May 29, 2015, is supported by specific piping and fitting inventory. |
| 6 | On January 16, 2015, TriLinc funded $500,000 as part of an existing $6,000,000 trade finance facility at a fixed interest rate of 10.33% to the Dairy Co-Operative. The transaction, set to mature on November 3, 2015, is supported by a purchase contract with a large developed market company. |
| 7 | The interest rate includes 2.50% of deferred interest. |
| 8 | On January 22, 2015, TriLinc funded $1,250,000 as part of an existing $1,250,000 trade finance facility at a fixed interest rate of 17.5% to the Fruit and Nut Distributor. The transaction, set to mature on May 22, 2015, is supported by a purchase and repurchase agreement that is secured by specific fruit and nut inventory, as well as receivables. |
As of January 31, 2015 the Company had exited the following investments:
| Description | Sector | Country | Investment Type | Transaction Date | Transaction Amount | Payoff Date | Internal Rate of Return (“IRR”)1 | Primary Impact Objective | ||||||||||||||||
Electronics Retailer | Radio, Television, Consumer Electronics, and Music Stores | Indonesia | Term Loan | 7/26/2013 | $ | 5,000,000 | 6/17/2014 | 19.59 | % | Access to Finance | ||||||||||||||
Fertilizer Distributor | Agricultural Chemicals | Zambia | Trade Finance | 7/17/2014 | $ | 3,000,000 | 11/4/2014 | 12.65 | % | Job Creation | ||||||||||||||
Food Processor | Groceries and Related Products | Peru | Term Loan | 3/25/2014 | $ | 576,000 | 11/28/2014 | 14.01 | % | Job Creation | ||||||||||||||
Frozen Seafood Exporter | Groceries and Related Products | Ecuador | Trade Finance | 6/17/2013 | $ | 240,484 | 5/14/2014 | 13.49 | % | Job Creation | ||||||||||||||
Insulated Wire Manufacturer | Rolling, Drawing, and Extruding of Nonferrous Metals | Peru | Trade Finance | 5/2/2014 | $ | 1,991,000 | 12/2/2014 | 8.43 | % | Job Creation | ||||||||||||||
International Tuna Exporter | Groceries and Related Products | Ecuador | Trade Finance | 7/17/2013 | $ | 1,000,000 | 10/9/2013 | 13.58 | % | Job Creation | ||||||||||||||
Seafood Processing Company | Miscellaneous Food Preparations and Kindred Products | Ecuador | Trade Finance | 6/19/2013 | $ | 496,841 | 7/1/2013 | 13.44 | % | Job Creation | ||||||||||||||
Timber Exporter | Sawmills and Planing Mills | Chile | Trade Finance | 7/3/2013 | $ | 915,000 | 6/12/2014 | 10.25 | % | Job Creation | ||||||||||||||
Portfolio Totals | $ | 13,219,325 | ||||||||||||||||||||||
| 1 | Given that the loan has been paid off, this investment is no longer part of the Company’s portfolio. The internal rate of return is defined as the gross average annual return earned through the life of an investment. The internal rate of return was calculated by our Advisor (unaudited) as the investment (loan advance) was made and cash was received (principal, interest and fees). |
Certain Portfolio Characteristics
Total Assets (est.) | $ | 65,479,906 | ||
Current Loan Commitments | $ | 61,650,000 | ||
Leverage | 0 | % | ||
Weighted Average Portfolio Loan Size | $ | 3,635,950 | ||
Weighted Average Portfolio Duration | 0.42 years | |||
Weighted Average Position Yield | 12.7 | % | ||
USD Denominated | 100 | % | ||
Countries | 7 |
Top Five Investments by Percentage
| Company Description | Country | % of Total Assets | ||||
Agricultural Supplies Producer | South Africa | 10.3 | % | |||
Agriculture Distributor | Argentina | 9.2 | % | |||
Beef Exporter | Argentina | 9.2 | % | |||
Dairy Co-Operative | Argentina | 9.2 | % | |||
Cement Distributor | Kenya | 7.6 | % | |||
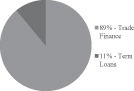
Investment Type | Developing Economies | Sector Diversification | ||
| 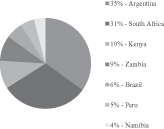 | 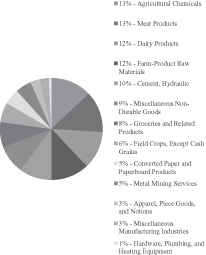 |
| 2. | The following disclosure supplements the “Business—Investments—Overview—Impact Overview” section of the Prospectus to provide an impact overview of the Company’s investment portfolio as of January 31, 2015: |
Impact Overview as of January 31, 2015
The Company’s borrower companies currently employ a total of 10,216 employees.
Percentage of the Borrowers that: | ||||
Comply with local environmental, labor, health, safety and business laws, standards and regulations | 100 | % | ||
Demonstrate their positive impact on the community through community service and/or community donations | 53 | % | ||
Commit to working towards implementing international environmental and health and safety best practices | 100 | % | ||
Implement environmentally sustainable practices including energy savings, waste reduction and/or water conservation | 82 | % | ||
Top Borrower Impact Objectives(total over 100% as borrowers can choose multiple) | ||||
Job Creation | 94 | % | ||
Agricultural Productivity & Food Security | 18 | % | ||
Capacity-Building | 6 | % | ||
Health Improvement | 6 | % | ||
Wage Increase | 6 | % | ||
Additional Borrower Impact Highlights | ||||
Percentage of employees receiving training or technical assistance | 27 | % | ||
Percentage of female employees | 13 | % | ||