Exhibit 99.3
PRO FORMA VALUATION REPORT
MALVERN BANCORP, INC.
Paoli, Pennsylvania
PROPOSED HOLDING COMPANY FOR:
MALVERN FEDERAL SAVINGS BANK
Paoli, Pennsylvania
Dated As Of:
May 4, 2012
Prepared By:
RP® Financial, LC.
1100 North Glebe Road
Suite 600
Arlington, Virginia 22201

| May 4, 2012 |
Boards of Directors
Malvern Federal Mutual Holding Company
Malvern Federal Bancorp, Inc.
Malvern Federal Savings Bank
42 East Lancaster Avenue
Paoli, Pennsylvania 19301
Members of the Boards of Directors:
At your request, we have completed and hereby provide an independent appraisal (“Appraisal”) of the estimated pro forma market value of the common stock which is to be issued in connection with the mutual-to-stock conversion transaction described below.
This Appraisal is furnished pursuant to the requirements of the Code of Federal Regulations 563b.7 and has been prepared in accordance with the “Guidelines for Appraisal Reports for the Valuation of Savings and Loan Associations Converting from Mutual to Stock Form of Organization” of the Office of Thrift Supervision (“OTS”) and reissued by the Office of the Comptroller of the Currency (“OCC”), and applicable regulatory interpretations thereof. Such Valuation Guidelines are relied upon by the Federal Reserve Board (“FRB”) in the absence of separate written valuation guidelines.
Description of Plan of Conversion and Reorganization
On January 17 2012, the respective Boards of Directors of Malvern Federal Mutual Holding Company (the “MHC”), Malvern Federal Bancorp, Inc. (“MLVF”) and Malvern Federal Savings Bank, Paoli, Pennsylvania (the “Bank”) adopted a Plan of Conversion and Reorganization (the “Plan of Conversion”) whereby the MHC will convert to stock form. As a result of the conversion, MLVF, which currently owns all of the issued and outstanding common stock of the Bank, will be succeed by a Pennsylvania corporation with the name of Malvern Bancorp, Inc. (“Malvern Bancorp” or the “Company”). Following the conversion, the MHC and MLVF will no longer exist. For purposes of this document, the existing consolidated entity will hereinafter be referred to as Malvern Bancorp or the Company. As of March 31, 2012, the MHC had a majority ownership interest in, and its principal asset consisted of, approximately 55.45% of the common stock (the “MHC Shares”) of MLVF. The remaining 44.55% of MLVF’s common stock is owned by public stockholders.
It is our understanding that Malvern Bancorp will offer its stock, representing the majority ownership interest held by the MHC, in a subscription offering to Eligible Account Holders, Supplemental Eligible Account Holders and Other Members, as such terms are defined for purposes of applicable federal regulatory requirements governing mutual-to-stock conversions. To the extent that shares remain available for purchase after satisfaction of all subscriptions
| Washington Headquarters | |
| Three Ballston Plaza | Telephone: (703) 528-1700 |
| 1100 North Glebe Road, Suite 600 | Fax No.: (703) 528-1788 |
| Arlington, VA 22201 | Toll-Free No.: (866) 723-0594 |
| www.rpfinancial.com | E-Mail: mail@rpfinancial.com |
Boards of Directors
May 4, 2012
Page 2
received in the subscription offering, the shares may be offered for sale to the public at large in a community offering and/or a syndicated community offering. Upon completing the mutual-to-stock conversion and stock offering (the “second-step conversion”), the Company will be 100% owned by public shareholders, the publicly-held shares of MLVF will be exchanged for shares in the Company at a ratio that retains their ownership interest at the time the conversion is completed and the MHC assets will be consolidated with the Company.
RP® Financial, LC.
RP® Financial, LC. (“RP Financial”) is a financial consulting firm serving the financial services industry nationwide that, among other things, specializes in financial valuations and analyses of business enterprises and securities, including the pro forma valuation for savings institutions converting from mutual-to-stock form. The background and experience of RP Financial is detailed in Exhibit V-1. For its appraisal services, RP Financial is being compensated on a fixed fee basis for the original appraisal and for any subsequent updates, and such fees are payable regardless of the valuation conclusion or the completion of the conversion offering transaction. We believe that we are independent of the Company, the Bank, the MHC and the other parties engaged by the Bank or the Company to assist in the stock conversion process.
Valuation Methodology
In preparing our Appraisal, we have reviewed the regulatory applications of the Company, the Bank and the MHC, including the prospectus as filed with the FRB, the OCC and the Securities and Exchange Commission (“SEC”). We have conducted a financial analysis of the Company, the Bank and the MHC that has included a review of audited financial information for the fiscal years ended September 30, 2007 through September 30, 2011 and a review of various unaudited information and internal financial reports through March 31, 2012, and due diligence related discussions with the Company’s management; ParenteBeard LLC, the Company’s independent auditor; Elias, Matz, Tiernan & Herrick L.L.P., the Company’s conversion counsel; and Stifel Nicolaus Weisel, the Company’s marketing advisor in connection with the stock offering. All assumptions and conclusions set forth in the Appraisal were reached independently from such discussions. In addition, where appropriate, we have considered information based on other available published sources that we believe are reliable. While we believe the information and data gathered from all these sources are reliable, we cannot guarantee the accuracy and completeness of such information.
We have investigated the competitive environment within which Malvern Bancorp operates and have assessed Malvern Bancorp’s relative strengths and weaknesses. We have kept abreast of the changing regulatory and legislative environment for financial institutions and analyzed the potential impact on Malvern Bancorp and the industry as a whole. We have analyzed the potential effects of the stock conversion on Malvern Bancorp’s operating characteristics and financial performance as they relate to the pro forma market value of Malvern Bancorp. We have analyzed the assets held by the MHC, which will be consolidated with Malvern Bancorp’s assets and equity pursuant to the completion of the second-step conversion. We have reviewed the economic and demographic characteristics of the Company’s primary market area. We have compared Malvern Bancorp’s financial performance
Boards of Directors
May 4, 2012
Page 3
and condition with selected publicly-traded thrifts in accordance with the Valuation Guidelines, as well as all publicly-traded thrifts and thrift holding companies. We have reviewed the current conditions in the securities markets in general and the market for thrift stocks in particular, including the market for existing thrift issues, initial public offerings by thrifts and thrift holding companies, and second-step conversion offerings. We have excluded from such analyses thrifts subject to announced or rumored acquisition, and/or institutions that exhibit other unusual characteristics.
The Appraisal is based on Malvern Bancorp’s representation that the information contained in the regulatory applications and additional information furnished to us by Malvern Bancorp and its independent auditor, legal counsel and other authorized agents are truthful, accurate and complete. We did not independently verify the financial statements and other information provided by Malvern Bancorp, or its independent auditor, legal counsel and other authorized agents nor did we independently value the assets or liabilities of Malvern Bancorp. The valuation considers Malvern Bancorp only as a going concern and should not be considered as an indication of Malvern Bancorp’s liquidation value.
Our appraised value is predicated on a continuation of the current operating environment for Malvern Bancorp and for all thrifts and their holding companies. Changes in the local, state and national economy, the legislative and regulatory environment for financial institutions and mutual holding companies, the stock market, interest rates, and other external forces (such as natural disasters or significant world events) may occur from time to time, often with great unpredictability and may materially impact the value of thrift stocks as a whole or the value of Malvern Bancorp’s stock alone. It is our understanding that there are no current plans for selling control of Malvern Bancorp following completion of the second-step conversion. To the extent that such factors can be foreseen, they have been factored into our analysis.
The estimated pro forma market value is defined as the price at which Malvern Bancorp’s common stock, immediately upon completion of the second-step stock offering, would change hands between a willing buyer and a willing seller, neither being under any compulsion to buy or sell and both having reasonable knowledge of relevant facts.
Valuation Conclusion
It is our opinion that, as of May 4, 2012, the estimated aggregate pro forma valuation of the shares of the Company to be issued and outstanding at the end of the conversion offering – including (1) newly-issued shares representing the MHC’s current ownership interest in the Company and (2) exchange shares issued to existing public shareholders of MLVF – was $49,593,660 at the midpoint, equal to 4,959,366 shares at $10.00 per share. The resulting range of value and pro forma shares, all based on $10.00 per share, are as follows: $42,154,610 or 4,215,461 shares at the minimum; $57,032,710 or 5,703,271 shares at the maximum; and $65,587,620 or 6,558,762 shares at the super maximum (also known as “maximum, as adjusted”).
Based on this valuation and taking into account the ownership interest represented by the shares owned by the MHC, the midpoint of the offering range is $27,500,000, equal to 2,750,000 shares at $10.00 per share. The resulting offering range and offering shares, all based on $10.00 per share, are as follows: $23,375,000 or 2,337,500 shares at the minimum;
Boards of Directors
May 4, 2012
Page 4
$31,625,000 or 3,162,500 shares at the maximum; and $36,368,750 or 3,636,875 shares at the super maximum.
Establishment of the Exchange Ratio
OCC regulations provide that in a conversion of a mutual holding company, the minority stockholders are entitled to exchange the public shares for newly issued shares in the fully converted company. The Boards of Directors of the MHC, MLVF and the Bank have independently determined the exchange ratio, which has been designed to preserve the current aggregate percentage ownership in the Company held by the public shareholders. The exchange ratio to be received by the existing minority shareholders of the Company will be determined at the end of the offering, based on the total number of shares sold in the offering and the final appraisal. Based on the valuation conclusion herein, the resulting offering value and the $10.00 per share offering price, the indicated exchange ratio at the midpoint is 0.8127 shares of the Company for every one share held by public shareholders. Furthermore, based on the offering range of value, the indicated exchange ratio is 0.6908 at the minimum, 0.9346 at the maximum and 1.0748 at the super maximum. RP Financial expresses no opinion on the proposed exchange of newly issued Company shares for the shares held by the public stockholders or on the proposed exchange ratio.
Limiting Factors and Considerations
The valuation is not intended, and must not be construed, as a recommendation of any kind as to the advisability of purchasing shares of the common stock. Moreover, because such valuation is determined in accordance with applicable OCC regulatory guidelines and is necessarily based upon estimates and projections of a number of matters, all of which are subject to change from time to time, no assurance can be given that persons who purchase shares of common stock in the conversion offering, or prior to that time, will thereafter be able to buy or sell such shares at prices related to the foregoing valuation of the estimated pro forma market value thereof. The appraisal reflects only a valuation range as of this date for the pro forma market value of Malvern Bancorp immediately upon issuance of the stock and does not take into account any trading activity with respect to the purchase and sale of common stock in the secondary market on the date of issuance of such securities or at anytime thereafter following the completion of the second-step conversion.
RP Financial’s valuation was based on the financial condition, operations and shares outstanding of Malvern Bancorp as of March 31, 2012, the date of the financial data included in the prospectus. The proposed exchange ratio to be received by the current public stockholders of MLVF and the exchange of the public shares for newly issued shares of Malvern Bancorp’s common stock as a full public company was determined independently by the Boards of Directors of the MHC, MLVF and the Bank. RP Financial expresses no opinion on the proposed exchange ratio to public stockholders or the exchange of public shares for newly issued shares.
RP Financial is not a seller of securities within the meaning of any federal and state securities laws and any report prepared by RP Financial shall not be used as an offer or solicitation with respect to the purchase or sale of any securities. RP Financial maintains a policy which prohibits RP Financial, its principals or employees from purchasing stock of its client institutions.
Boards of Directors
May 4, 2012
Page 5
This valuation will be updated as provided for in the conversion regulations and guidelines. These updates will consider, among other things, any developments or changes in the financial performance and condition of Malvern Bancorp, management policies, and current conditions in the equity markets for thrift shares, both existing issues and new issues. These updates may also consider changes in other external factors which impact value including, but not limited to: various changes in the legislative and regulatory environment for financial institutions, the stock market and the market for thrift stocks, and interest rates. Should any such new developments or changes be material, in our opinion, to the valuation of the shares, appropriate adjustments to the estimated pro forma market value will be made. The reasons for any such adjustments will be explained in the update at the date of the release of the update. The valuation will also be updated at the completion of Malvern Bancorp’s stock offering.
| Respectfully submitted, | |
| RP® FINANCIAL, LC. | |
 | |
| Ronald S. Riggins | |
| President and Managing Director | |
 | |
| Gregory E. Dunn | |
| Director |
| RP® Financial, LC. | TABLE OF CONTENTS |
| i |
TABLE OF CONTENTS
MALVERN BANCORP, INC.
MALVERN FEDERAL SAVINGS BANK
Paoli, Pennsylvania
| DESCRIPTION | PAGE NUMBER | |||
| CHAPTER ONE | OVERVIEW AND FINANCIAL ANALYSIS | |||
| Introduction | I.1 | |||
| Plan of Conversion and Reorganization | I.1 | |||
| Strategic Overview | I.2 | |||
| Balance Sheet Trends | I.5 | |||
| Income and Expense Trends | I.9 | |||
| Interest Rate Risk Management | I.13 | |||
| Lending Activities and Strategy | I.13 | |||
| Asset Quality | I.17 | |||
| Funding Composition and Strategy | I.18 | |||
| Subsidiaries | I.18 | |||
| Legal Proceedings | I.19 | |||
| CHAPTER TWO | MARKET AREA | |||
| Introduction | II.1 | |||
| National Economic Factors | II.1 | |||
| Market Area Demographics | II.5 | |||
| Local Economy | II.7 | |||
| Unemployment Trends | II.10 | |||
| Market Area Deposit Characteristics and Competition | II.10 | |||
| CHAPTER THREE | PEER GROUP ANALYSIS | |||
| Peer Group Selection | III.1 | |||
| Financial Condition | III.5 | |||
| Income and Expense Components | III.8 | |||
| Loan Composition | III.11 | |||
| Interest Rate Risk | III.13 | |||
| Credit Risk | III.13 | |||
| Summary | III.16 | |||
| RP® Financial, LC. | TABLE OF CONTENTS |
| ii |
TABLE OF CONTENTS
MALVERN BANCORP, INC.
MALVERN FEDERAL SAVINGS BANK
Paoli, Pennsylvania
(continued)
| DESCRIPTION | PAGE NUMBER | |||||
| CHAPTER FOUR | VALUATION ANALYSIS | |||||
| Introduction | IV.1 | |||||
| Appraisal Guidelines | IV.1 | |||||
| RP Financial Approach to the Valuation | IV.1 | |||||
| Valuation Analysis | IV.2 | |||||
| 1. | Financial Condition | IV.2 | ||||
| 2. | Profitability, Growth and Viability of Earnings | IV.4 | ||||
| 3. | Asset Growth | IV.6 | ||||
| 4. | Primary Market Area | IV.6 | ||||
| 5. | Dividends | IV.7 | ||||
| 6. | Liquidity of the Shares | IV.8 | ||||
| 7. | Marketing of the Issue | IV.8 | ||||
| A. | The Public Market | IV.9 | ||||
| B. | The New Issue Market | IV.12 | ||||
| C. | The Acquisition Market | IV.13 | ||||
| D. | Trading in Malvern Bancorp’s Stock | IV.13 | ||||
| 8. | Management | IV.15 | ||||
| 9. | Effect of Government Regulation and Regulatory Reform | IV.16 | ||||
| Summary of Adjustments | IV.16 | |||||
| Valuation Approaches: | IV.16 | |||||
| 1. | Price-to-Earnings (“P/E”) | IV.18 | ||||
| 2. | Price-to-Book (“P/B”) | IV.19 | ||||
| 3. | Price-to-Assets (“P/A”) | IV.19 | ||||
| Comparison to Recent Offerings | IV.21 | |||||
| Valuation Conclusion | IV.21 | |||||
| Establishment of the Exchange Ratio | IV.22 | |||||
| RP® Financial, LC. | LIST OF TABLES |
| iii |
LIST OF TABLES
MALVERN BANCORP, INC.
MALVERN FEDERAL SAVINGS BANK
Paoli, Pennsylvania
| TABLE NUMBER | DESCRIPTION | PAGE | ||
| 1.1 | Historical Balance Sheet Data | I.6 | ||
| 1.2 | Historical Income Statements | I.10 | ||
| 2.1 | Summary Demographic Data | II.6 | ||
| 2.2 | Employment by Sector | II.7 | ||
| 2.3 | Market Area Largest Employers | II.9 | ||
| 2.4 | Unemployment Trends | II.10 | ||
| 2.5 | Deposit Summary | II.11 | ||
| 2.6 | Market Area Deposit Competitors | II.12 | ||
| 3.1 | Peer Group of Publicly-Traded Thrifts | III.3 | ||
| 3.2 | Balance Sheet Composition and Growth Rates | III.6 | ||
| 3.3 | Income as a Percent of Average Assets and Yields, Costs, Spreads | III.9 | ||
| 3.4 | Loan Portfolio Composition and Related Information | III.12 | ||
| 3.5 | Interest Rate Risk Measures and Net Interest Income Volatility | III.14 | ||
| 3.6 | Credit Risk Measures and Related Information | III.15 | ||
| 4.1 | Market Area Unemployment Rates | IV.7 | ||
| 4.2 | Pricing Characteristics and After-Market Trends | IV.14 | ||
| 4.3 | Public Market Pricing | IV.20 |
| RP® Financial, LC. | OVERVIEW AND FINANCIAL ANALYSIS |
| I.1 |
I. Overview and Financial Analysis
Introduction
Malvern Federal Savings Bank (the “Bank”), chartered in 1887, is a federally chartered stock savings bank headquartered in Paoli, Pennsylvania. The Bank serves the Philadelphia metropolitan area through the headquarters office and eight branch offices. The headquarters and seven branches are located in Chester County and one branch is located in Delaware County. A map of the Bank’s branch office locations is provided in Exhibit I-1. The Bank is a member of the Federal Home Loan Bank (“FHLB”) system and its deposits are insured up to the maximum allowable amount by the Federal Deposit Insurance Corporation (“FDIC”).
Malvern Federal Bancorp, Inc. (“MLVF”) is the federally-chartered mid-tier holding company of the Bank. MLVF owns 100% of the outstanding common stock of the Bank. Since being formed in 2008, MLVF has engaged primarily in the business of holding the common stock of the Bank. MLVF completed its initial public offering in May 2008, pursuant to which it sold 2,645,575 shares or 43% of its outstanding common stock to the public at a purchase price of $10.00 per share, issued 3,383,875 shares or 55% of its common stock outstanding to Malvern Federal Mutual Holding Company (the “MHC”), the mutual holding company parent of MLVF and contributed 123,050 shares or 2% of the common stock outstanding to the Malvern Federal Charitable Foundation. The Bank is supervised and examined by the Office of the Comptroller of the Currency (“OCC”). The MHC and MLVF are subject to supervision and regulation by the Board of Governors of the Federal Reserve System (the “Federal Reserve Board” or the “FRB”). At March 31, 2012, MLVF had total assets of $651.6 million, deposits of $537.0 million and equity of $61.9 million or 9.5% of total assets. MLVF’s audited financial statements for the most recent period are included by reference as Exhibit I-2.
Plan of Conversion and Reorganization
On January 17, 2012, the respective Boards of Directors of the MHC, MLVF and the Bank adopted a Plan of Conversion and Reorganization (the “Plan of Conversion”) whereby the MHC will convert to stock form. As a result of the conversion, MLVF, which currently owns all of the issued and outstanding common stock of the Bank, will be succeed by a Pennsylvania corporation with the name of Malvern Bancorp, Inc. (“Malvern Bancorp” or the “Company”). Following the conversion, the MHC will no longer exist. For purposes of this document, the
| RP® Financial, LC. | OVERVIEW AND FINANCIAL ANALYSIS |
| I.2 |
existing consolidated entity will hereinafter be referred to as Malvern Bancorp or the Company. As of March 31, 2012, the MHC’s ownership interest in MLVF approximated 55.45% and the public stockholders’ ownership interest in MLVF approximated 44.55%.
It is our understanding that Malvern Bancorp will offer its stock, representing the majority ownership interest held by the MHC, in a subscription offering to Eligible Account Holders, Supplemental Eligible Account Holders and Other Members, as such terms are defined for purposes of applicable federal regulatory requirements governing mutual-to-stock conversions. To the extent that shares remain available for purchase after satisfaction of all subscriptions received in the subscription offering, the shares may be offered for sale to members of the general public in a community offering and/or a syndicated community offering. Upon completing the mutual-to-stock conversion and stock offering (the “second-step conversion”), the Company will be 100% owned by public shareholders, the publicly-held shares of MLVF will be exchanged for shares in the Company at a ratio that retains their ownership interest at the time the conversion is completed and the MHC assets will be consolidated with the Company.
Strategic Overview
Malvern Bancorp maintains a local community banking emphasis, with a primary strategic objective of meeting the borrowing and savings needs of its local customer base. Historically, Malvern Bancorp’s operating strategy has been fairly reflective of a traditional thrift operating strategy in which 1-4 family residential mortgage loans and retail deposits have constituted the principal components of the Company’s assets and liabilities, respectively. Beyond 1-4 family permanent mortgage loans, the Company’s lending activities include diversification into commercial real estate loans, construction and land loans, commercial business, and consumer loans. Pursuant to the Company’s diversification into higher risk types of lending followed by a downturn in real estate market conditions, the Company experienced deterioration in credit quality. Non-performing assets increased from $2.5 million or 0.45% of assets at September 30, 2007 to $25.2 million or 3.49% of assets at September 30, 2010. Residential mortgage loans (both first and second mortgages) and commercial real estate/multi-family loans comprised the largest concentrations of the Company’s non-performing assets balance at September 30, 2010. Since fiscal year end 2010, the non-performing assets balance has trended lower and equaled $16.5 million or 2.53% of assets at March 31, 2012. In light of the Company’s deterioration in credit quality, less favorable real estate market conditions for higher risk commercial real estate loans and construction and development loans and due to
| RP® Financial, LC. | OVERVIEW AND FINANCIAL ANALYSIS |
| I.3 |
regulatory constraints imposed by the Office of Thrift Supervision (“OTS”) during fiscal 2010, the Company has generally stopped originating new commercial real estate loans and construction and development loans. Accordingly, the Company’s current lending activities emphasize the origination of 1-4 family permanent mortgage loans and consumer loans.
In October 2010, the Company, the Bank and the MHC entered into Supervisory Agreements with the OTS, which have been transferred to the OCC in the case of the Bank and to the FRB in the case of the Company and the MHC. Exhibit I-3 provides a summary of the requirements and restrictions set forth in the Supervisory Agreements. As of March 31, 2012, the Bank, the Company and the MHC were in compliance with the terms of their respective Supervisory Agreements.
Investments serve as a supplement to the Company’s lending activities, with recent trends showing an increase in investment securities. The Company has experienced an increase in liquidity in connection with the loan portfolio shrinkage that has occurred over the past two and one-half fiscal years, which in part has been deployed into investment securities. The Company’s investment activities have emphasized investment in mortgage-backed securities and U.S. Government and agency securities. Other investments maintained by the Company include trust preferred securities, municipal bonds, corporate debt securities and FHLB stock.
Retail deposits have consistently served as the primary interest-bearing funding source for the Company. The deposit base is concentrated in time deposits, which are locally generated deposits. Malvern Federal does not maintain any brokered certificates of deposit (“CDs”) and under the terms of the Bank’s Supervisory Agreement, the Bank may not engage in the use of brokered deposits without the prior written non-objection of the OCC. In recent years, the concentration of CDs has declined as a percent of total deposits, as the result of a decline in CD balances and growth of transaction and saving account deposits. The Company utilizes borrowings as a supplemental funding source to facilitate management of funding costs and interest rate risk. FHLB advances currently account for all of the Company’s borrowings and consist substantially of long-term advances with initial terms of more than five years.
Malvern Bancorp’s earnings base is largely dependent upon net interest income and operating expense levels. The Company’s net interest margin has increased since fiscal 2009, as the decline in short-term interest rates and resulting steeper yield curve has facilitated higher interest rate spreads for the Company. In particular, the Company’s balance sheet is liability-sensitive in the short-term and, therefore, funding costs have decreased more rapidly relative to
| RP® Financial, LC. | OVERVIEW AND FINANCIAL ANALYSIS |
| I.4 |
yields earned on less rate sensitive interest-earning assets. Operating expenses have increased in recent years as well, which combined with asset shrinkage has inflated the Company’s operating expense ratio as a percent of average assets. The increase in operating expenses has been mostly related to professional fees incurred to facilitate the work out of problem assets and expenses related to holding higher balances of Other Real Estate Owned (“OREO”). Revenues derived from sources of non-interest operating income have been a relatively limited contributor to the Company’s earnings.
The post-offering business plan of the Company is expected to remain consistent with current strategic objectives. Malvern Bancorp will continue to be an independent community-oriented financial institution with a commitment to local real estate financing with operations funded primarily by retail deposits. Growth strategies will continue to be implemented within the context of managing the Company’s exposure to credit risk and interest rate risk and adhering to the requirements of the Supervisory Agreements. ..Accordingly, the Company’s business strategies will continue to focus on reducing the level of non-performing assets, managing the existing loan portfolio and emphasizing retail lending growth going forward, increasing market share in Chester and Delaware Counties and growing core deposits. Pursuant to the modification of the lending restrictions set forth in the Supervisory Agreements, the Company will seek to implement a more diversified lending strategy that will emphasize growth of commercial real estate loans and construction loans.
The Company’s Board of Directors has elected to complete a second-step conversion to improve the competitive position of Malvern Bancorp. The capital realized from the stock offering will increase the operating flexibility and overall financial strength of Malvern Bancorp. The additional capital realized from stock proceeds will increase liquidity to support funding of future loan growth and other interest-earning assets. The Company’s strengthened capital position will also provide more of a cushion against potential credit quality related losses, as the Company continues to implement workout strategies to reduce the balance of non-performing assets. Malvern Bancorp’s higher capital position resulting from the infusion of stock proceeds will also serve to reduce interest rate risk, particularly through enhancing the Company’s interest-earning-assets-to-interest-bearing-liabilities (“IEA/IBL”) ratio. The additional funds realized from the stock offering will provide an alternative funding source to deposits and borrowings in meeting the Company’s future funding needs, which may facilitate a reduction in Malvern Bancorp’s funding costs. The projected uses of proceeds are highlighted below.
| RP® Financial, LC. | OVERVIEW AND FINANCIAL ANALYSIS |
| I.5 |
| o | Malvern Bancorp. The Company is expected to retain up to 30% of the net offering proceeds. At present, funds at the Company level are expected to be primarily invested initially into short-term investments. Over time, the funds may be utilized for various corporate purposes, possibly including infusing additional equity into the Bank, repurchases of common stock, and the payment of cash dividends pursuant to regulatory limitations and guidelines and the requirements of the Supervisory Agreements. | |
| o | Malvern Federal Savings Bank. Approximately 70% of the net stock proceeds will be infused into the Bank in exchange for all of the Bank’s newly issued stock. Cash proceeds (i.e., net proceeds less deposits withdrawn to fund stock purchases) infused into the Bank are anticipated to become part of general operating funds, and are expected to be primarily utilized to fund retail loan growth over time. |
Overall, it is the Company’s objective to pursue growth that will serve to increase returns, while, at the same time, growth will not be pursued that could potentially compromise the overall risk associated with Malvern Bancorp’s operations.
Balance Sheet Trends
Table 1.1 shows the Company’s historical balance sheet data for the past five and one-half years. From fiscal year end 2007 through March 31, 2012, Malvern Bancorp’s assets increased at a 3.8% annual rate. Asset growth was sustained through fiscal year end 2010 and then declined through March 31, 2012, as the Company curtailed its lending activities and focused on resolution of problem of assets. Asset growth was primarily funded by deposit growth, which paralleled asset growth trends for the period covered in Table 1.1. A summary of Malvern Bancorp’s key operating ratios for the past five and one-half fiscal years is presented in Exhibit I-4.
Malvern Bancorp’s loans receivable balance at March 31, 2012 was only nominally higher compared to the balance at fiscal year end 2007, as loan growth sustained from year fiscal end 2007 through fiscal year end 2009 was substantially offset by a steady downward trend in the loans receivable balance from fiscal year end 2009 through March 31, 2012. The Company’s lower loan growth rate compared to its asset growth rate provided for a decrease in the loans-to-assets ratio from 84.5% at fiscal year end 2007 to 71.7% at March 31, 2012. Trends in the Company’s loan portfolio composition over the past five and one-half fiscal years show that the concentration of 1-4 family permanent mortgage loans comprising total loans increased from 40.4% at fiscal year end 2007 to 46.6% at March 31, 2012. Over the past five and one-half years lending diversification by the Company has emphasized commercial real estate/multi-family loans, with the concentration of commercial real estate/multi-family loans
| RP® Financial, LC. | OVERVIEW AND FINANCIAL ANALYSIS |
| I.6 |
Table 1.1
Malvern Bancorp, Inc.
Historical Balance Sheet Data
| 09/30/07- 03/31/12 | ||||||||||||||||||||||||||||||||||
| At Fiscal Year Ended September 30, | At March 31, | Annual. | ||||||||||||||||||||||||||||||||
| 2007 | 2008 | 2009 | 2010 | 2011 | 2012 | Growth Rate | ||||||||||||||||||||||||||||
| Amount | Pct(1) | Amount | Pct(1) | Amount | Pct(1) | Amount | Pct(1) | Amount | Pct(1) | Amount | Pct(1) | Pct | ||||||||||||||||||||||
| ($000) | (%) | ($000) | (%) | ($000) | (%) | ($000) | (%) | ($000) | (%) | ($000) | (%) | (%) | ||||||||||||||||||||||
| Total Amount of: | ||||||||||||||||||||||||||||||||||
| Assets | $ | 551,932 | 100.00 | % | $ | 639,509 | 100.00 | % | $ | 691,639 | 100.00 | % | $ | 720,506 | 100.00 | % | $ | 666,568 | 100.00 | % | $ | 651,604 | 100.00 | % | 3.76 | % | ||||||||
| Cash and cash equivalents | 18,967 | 3.44 | % | 12,922 | 2.02 | % | 25,325 | 3.66 | % | 81,395 | 11.30 | % | 33,496 | 5.03 | % | 58,625 | 9.00 | % | 28.50 | % | ||||||||||||||
| Investment securities | 30,577 | 5.54 | % | 24,839 | 3.88 | % | 31,940 | 4.62 | % | 45,435 | 6.31 | % | 78,186 | 11.73 | % | 82,397 | 12.65 | % | 24.64 | % | ||||||||||||||
| Loans receivable, net | 466,192 | 84.47 | % | 571,536 | 89.37 | % | 593,565 | 85.82 | % | 547,323 | 75.96 | % | 506,019 | 75.91 | % | 467,028 | 71.67 | % | 0.04 | % | ||||||||||||||
| Loans held for sale | 9,258 | 1.68 | % | — | 0.00 | % | — | 0.00 | % | — | 0.00 | % | — | 0.00 | % | — | 0.00 | % | -100.00 | % | ||||||||||||||
| FHLB stock | 4,560 | 0.83 | % | 6,896 | 1.08 | % | 6,567 | 0.95 | % | 6,567 | 0.91 | % | 5,349 | 0.80 | % | 4,827 | 0.74 | % | 1.27 | % | ||||||||||||||
| Bank-owned life insurance | 7,787 | 1.41 | % | 8,136 | 1.27 | % | 13,650 | 1.97 | % | 14,213 | 1.97 | % | 14,760 | 2.21 | % | 15,026 | 2.31 | % | 15.73 | % | ||||||||||||||
| Other real estate owned | 227 | 0.04 | % | 230 | 0.04 | % | 5,875 | 0.85 | % | 5,315 | 0.74 | % | 8,321 | 1.25 | % | 4,743 | 0.73 | % | 96.49 | % | ||||||||||||||
| Deposits | $ | 433,488 | 78.54 | % | $ | 453,493 | 70.91 | % | $ | 516,511 | 74.68 | % | $ | 596,858 | 82.84 | % | $ | 554,455 | 83.18 | % | $ | 537,029 | 82.42 | % | 4.87 | % | ||||||||
| Borrowings | 71,387 | 12.93 | % | 113,798 | 17.79 | % | 99,621 | 14.40 | % | 55,334 | 7.68 | % | 49,098 | 7.37 | % | 48,593 | 7.46 | % | -8.19 | % | ||||||||||||||
| Equity | $ | 44,039 | 7.98 | % | $ | 68,836 | 10.76 | % | $ | 69,842 | 10.10 | % | $ | 66,207 | 9.19 | % | $ | 60,284 | 9.04 | % | $ | 61,903 | 9.50 | % | 7.86 | % | ||||||||
| Loans/Deposits | 105.19 | % | 152.06 | % | 127.14 | % | 110.03 | % | 96.47 | % | 89.88 | % | ||||||||||||||||||||||
| Full Service Offices | 7 | 7 | 7 | 8 | 8 | 8 | ||||||||||||||||||||||||||||
(1) Ratios are as a percent of ending assets.
Sources: Malvern Bancorp’s prospectus, audited and unaudited financial statements and RP Financial calculations.
| RP® Financial, LC. | OVERVIEW AND FINANCIAL ANALYSIS |
| I.7 |
comprising total loans increasing from 23.2% at fiscal year end 2007 to 27.0% at March 31, 2012. Consumer loans constitute the second largest area of lending diversification for the Company and increased from 19.3% of total loans at fiscal year end 2007 to 19.9% of total loans at March 31, 2012. Other areas of lending diversification for the Company include construction and land loans, which declined from 13.8% of total loans at fiscal year end 2007 to 4.7% of total loans at March 31, 2012, and commercial business loans, which declined from 3.3% of total loans at fiscal year end 2007 to 1.8% of total loans at March 31, 2012. Loan balances for 1-4 family permanent mortgage loans, commercial real estate/multi-family loans and consumer loans have been declining since fiscal year end 2009, while the balance of construction and land loans has been declining since fiscal year end 2007 and the balance of commercial business loans has been declining since fiscal year end 2008.
The intent of the Company’s investment policy is to provide adequate liquidity and to generate a favorable return within the context of supporting Malvern Bancorp’s overall credit and interest rate risk objectives. It is anticipated that proceeds retained at the holding company level will primarily be invested into short-term funds. The Company has maintained a higher level of cash and investments in recent years for purposes of managing credit risk and interest rate exposure, during a period when the Company has experienced credit quality deterioration in its loans portfolio and interest rates are at historical lows. Over the past five and one half fiscal years, the Company’s level of cash and investment securities (inclusive of FHLB stock) ranged from a low of 7.2% of assets at fiscal year end 2008 to a high of 22.4% of assets at March 31, 2012. The Company maintained total cash and investments of $145.8 million at March 31, 2012.
Mortgage-backed securities have generally comprised the largest portion of the Company’s investment holdings over the past five and one-half years and are generally purchased as a means to deploy excess liquidity at more favorable yields than other investment alternatives that are consistent with Malvern Bancorp’s investment philosophy. Mortgage-backed securities held by Malvern Bancorp consist of securities that are guaranteed or insured by GSEs. As of March 31, 2012, the mortgage-backed securities portfolio totaled $47.8 million. Mortgage-backed securities maintained as available for sale totaled $47.1 million at March 31, 2012, with the remaining $696,000 of the portfolio maintained as held to maturity. As of March 31, 2012, the net unrealized gain on the available for sale mortgage-backed securities portfolio equaled $803,000. Beyond the mortgage-backed securities portfolio, investment securities held by the Company at March 31, 2012 consisted of $28.0 million of U.S. Government and agency
| RP® Financial, LC. | OVERVIEW AND FINANCIAL ANALYSIS |
| I.8 |
debt securities, $1.5 million of corporate debt securities, $2.6 million of municipal bonds and $758,000 of trust preferred securities and were all maintained as available for sale. As of March 31, 2012, the net unrealized loss on the available for sale portfolio of investment securities equaled $114.000. Exhibit I-5 provides historical detail of the Company’s investment portfolio. As of March 31, 2012, the Company also held FHLB stock of $4.8 million or 0.7% of assets and cash and cash equivalents amounting to $58.6 million or 9.0% of assets.
The Company also maintains an investment in bank-owned life insurance (“BOLI”) policies, which cover the lives of some of the Company’s employees and directors. The purpose of the investment is to provide funding for the benefit plans of the covered individuals. The life insurance policies earn tax-exempt income through cash value accumulation and death proceeds. As of March 31, 2012, the cash surrender value of the Company’s BOLI equaled $15.0 million or 2.3% of assets.
Over the past five and one-half fiscal years, Malvern Bancorp’s funding needs have been addressed through a combination of deposits, borrowings and internal cash flows. From fiscal year end 2007 through March 31, 2012, the Company’s deposits increased at a 4.9% annual rate. Deposit growth was sustained from fiscal year end 2007 through fiscal year end 2010, which was followed by a decline in deposits during the past one and one-half fiscal years. Most of decline in deposits consisted of CDs, as the Company elected not to match higher rates offered in the marketplace to facilitate deposit run-off that could be funded by asset shrinkage. Overall, total deposits increased from $433.5 million or 78.5% of assets at fiscal year end 2007 to $537.0 million or 82.4% of assets at March 31, 2012. CDs accounted for 54.8% of total deposits at March 31, 2012, versus 62.3% of total deposits at fiscal year end 2010.
Borrowings serve as an alternative funding source for the Company to address funding needs for growth and to support management of deposit costs and interest rate risk. From year end 2007 through March 31, 2012, borrowings decreased at an annual rate of 8.2%. Borrowings increased from $71.4 million or 12.9% of assets at fiscal year end 2007 to a peak balance of $113.8 million or 17.8% of assets at fiscal year end 2008 and then declined to a low of $48.6 million or 7.5% of assets at March 31, 2012. The Company’s utilization of borrowings has generally been limited to FHLB advances and borrowings held by the Company at March 31, 2012 consisted entirely of FHLB advances.
The Company’s equity increased at a 7.9% annual rate from year fiscal year end 2007 through March 31, 2012, which was mostly attributable to the minority stock offering completed during fiscal 2008. Retention of earnings during fiscal years 2008 and 2009 and the first six
| RP® Financial, LC. | OVERVIEW AND FINANCIAL ANALYSIS |
| I.9 |
months of fiscal 2012 also contributed to the Company’s capital growth, but was more than offset by net losses recorded during fiscal years 2010 and 2011. Capital growth outpaced the Company’s asset growth rate, which provided for an increase in the Company’s equity-to-assets ratio from 8.0% at fiscal year end 2007 to 9.5% at March 31, 2012. All of the Company’s capital is tangible capital. Malvern Bancorp maintained capital surpluses relative to all of its regulatory capital requirements at March 31, 2012. The addition of stock proceeds will serve to strengthen the Company’s capital position, as well as support growth opportunities. At the same time, Malvern Bancorp’s ROE will initially be depressed following its stock conversion as the result of the significant increase that will be realized in the Company’s pro forma capital position.
Income and Expense Trends
Table 1.2 shows the Company’s historical income statements for the past five and one-half fiscal years. The Company’s reported earnings over the past five and one-half fiscal years ranged from a net loss of $6.1 million or 0.90% of average assets in fiscal 2011 to net income of $2.4 million or 0.45% of average assets during fiscal 2007. For the twelve months ended March 31, 2012, the Company reported net income of $801,000 or 0.12% of average assets. The net losses recorded during fiscal years 2010 and 2011 were largely related to significantly higher loan loss provisions established to address deterioration in the credit quality of the Company’s loan portfolio. Net interest income and operating expenses represent the primary components of the Company’s recurring earnings. Revenues derived from sources of non-interest operating income have been a relatively limited contributor to the Company’s earnings. Non-operating gains and losses have been a relatively minor factor in the Company’s earnings over the past five and one-half fiscal years.
Over the past five and one-half fiscal years, the Company’s net interest income to average assets ratio ranged from a low of 2.36% during fiscal 2009 to a high of 2.86% during fiscal 2011. For the twelve months ended March 31, 2012, the Company’s net interest income to average assets ratio equaled 2.82%. The comparatively higher net interest income ratios reported since fiscal 2009 have been facilitated by wider yield-cost spreads, as the decline in short-term interest rates and resulting steeper yield curve has provided for a more significant decline in the Company’s funding costs relative to less rate sensitive interest-earning asset yields. Deposit run-off, consisting primarily of relatively higher costing CDs, and the pay down of borrowings also contributed to lowering the Company’s funding costs. A reduction in the concentration of non-interest earning comprising assets further contributed to the increase in the
| RP® Financial, LC. | OVERVIEW AND FINANCIAL ANALYSIS I.10 |
Table 1.2
Malvern Bancorp, Inc.
Historical Income Statements
| For the Fiscal Year Ended September 30, | For the 12 months | ||||||||||||||||||||||||||||||||||||
| 2007 | 2008 | 2009 | 2010 | 2011 | Ended 03/31/12 | ||||||||||||||||||||||||||||||||
| Amount | Pct(1) | Amount | Pct(1) | Amount | Pct(1) | Amount | Pct(1) | Amount | Pct(1) | Amount | Pct(1) | ||||||||||||||||||||||||||
| ($000) | (%) | ($000) | (%) | ($000) | (%) | ($000) | (%) | ($000) | (%) | ($000) | (%) | ||||||||||||||||||||||||||
| Interest income | $ | 32,769 | 6.18 | % | $ | 33,592 | 5.85 | % | $ | 34,701 | 5.10 | % | $ | 33,148 | 4.80 | % | $ | 29,726 | 4.36 | % | $ | 27,954 | 4.20 | % | |||||||||||||
| Interest expense | (19,235 | ) | -3.63 | % | (19,105 | ) | -3.33 | % | (18,681 | ) | -2.75 | % | (13,641 | ) | -1.97 | % | (10,198 | ) | -1.50 | % | (9,191 | ) | -1.38 | % | |||||||||||||
| Net interest income | $ | 13,534 | 2.55 | % | $ | 14,487 | 2.52 | % | $ | 16,020 | 2.36 | % | $ | 19,507 | 2.82 | % | $ | 19,528 | 2.86 | % | $ | 18,763 | 2.82 | % | |||||||||||||
| Provision for loan losses | (1,298 | ) | -0.24 | % | (1,609 | ) | -0.28 | % | (2,280 | ) | -0.34 | % | (9,367 | ) | -1.36 | % | (12,392 | ) | -1.82 | % | (2,375 | ) | -0.36 | % | |||||||||||||
| Net interest income after provisions | $ | 12,236 | 2.31 | % | $ | 12,878 | 2.24 | % | $ | 13,740 | 2.02 | % | $ | 10,140 | 1.47 | % | $ | 7,136 | 1.05 | % | $ | 16,388 | 2.46 | % | |||||||||||||
| Other operating income | $ | 1,461 | 0.28 | % | $ | 1,846 | 0.32 | % | $ | 2,201 | 0.32 | % | $ | 2,096 | 0.30 | % | $ | 1,706 | 0.25 | % | $ | 2,094 | 0.31 | % | |||||||||||||
| Operating expense | (10,154 | ) | -1.91 | % | (12,642 | ) | -2.20 | % | (14,501 | ) | -2.13 | % | (17,105 | ) | -2.48 | % | (18,556 | ) | -2.72 | % | (18,325 | ) | -2.75 | % | |||||||||||||
| Net operating income | $ | 3,543 | 0.67 | % | $ | 2,082 | 0.36 | % | $ | 1,440 | 0.21 | % | ($ | 4,869 | ) | -0.70 | % | ($ | 9,714 | ) | -1.43 | % | $ | 157 | 0.02 | % | |||||||||||
| Non-Operating Income(Loss) | |||||||||||||||||||||||||||||||||||||
| Investment securities gains (losses), net | ($ | 8 | ) | 0.00 | % | — | 0.00 | % | 29 | 0.00 | % | $ | (13 | ) | 0.00 | % | — | 0.00 | % | $ | 623 | 0.09 | % | ||||||||||||||
| Gain (Loss)on sale of OREO | — | 0.00 | % | — | 0.00 | % | (225 | ) | -0.03 | % | (142 | ) | -0.02 | % | 23 | 0.00 | % | 9 | 0.00 | % | |||||||||||||||||
| Gain on disposal of fixed assets | — | 0.00 | % | — | 0.00 | % | 8 | 0.00 | % | — | 0.00 | % | — | 0.00 | % | — | 0.00 | % | |||||||||||||||||||
| Net non-operating income | ($ | 8 | ) | 0.00 | % | $ | 0 | 0.00 | % | ($ | 188 | ) | -0.03 | % | ($ | 155 | ) | -0.02 | % | $ | 23 | 0.00 | % | $ | 632 | 0.09 | % | ||||||||||
| Net income before tax | $ | 3,535 | 0.67 | % | $ | 2,082 | 0.36 | % | $ | 1,252 | 0.18 | % | ($ | 5,024 | ) | -0.73 | % | ($ | 9,691 | ) | -1.42 | % | $ | 789 | 0.12 | % | |||||||||||
| Income tax (expense) benefit | (1,123 | ) | -0.21 | % | (630 | ) | -0.11 | % | (242 | ) | -0.04 | % | 1,895 | 0.27 | % | 3,579 | 0.53 | % | 12 | 0.00 | % | ||||||||||||||||
| Net income (loss) | $ | 2,412 | 0.45 | % | $ | 1,452 | 0.25 | % | $ | 1,010 | 0.15 | % | ($ | 3,129 | ) | -0.45 | % | ($ | 6,112 | ) | -0.90 | % | $ | 801 | 0.12 | % | |||||||||||
| Adjusted Earnings | |||||||||||||||||||||||||||||||||||||
| Net income | $ | 2,412 | 0.45 | % | $ | 1,452 | 0.25 | % | $ | 1,010 | 0.15 | % | ($ | 3,129 | ) | -0.45 | % | ($ | 6,112 | ) | -0.90 | % | $ | 801 | 0.12 | % | |||||||||||
| Add(Deduct): Net gain/(loss) on sale | 8 | 0.00 | % | 0 | 0.00 | % | 188 | 0.03 | % | 155 | 0.02 | % | (23 | ) | 0.00 | % | (632 | ) | -0.09 | % | |||||||||||||||||
| Tax effect (2) | (3 | ) | 0.00 | % | — | 0.00 | % | (75 | ) | -0.01 | % | (62 | ) | -0.01 | % | 9 | 0.00 | % | 253 | 0.04 | % | ||||||||||||||||
| Adjusted earnings | $ | 2,417 | 0.46 | % | $ | 1,452 | 0.25 | % | $ | 1,123 | 0.17 | % | ($ | 3,036 | ) | -0.44 | % | ($ | 6,126 | ) | -0.90 | % | $ | 422 | 0.06 | % | |||||||||||
| Expense Coverage Ratio (3) | 1.34 | 1.15 | 1.10 | 1.14 | 1.05 | 1.03 | |||||||||||||||||||||||||||||||
| Efficiency Ratio (4) | 67.5 | % | 77.4 | % | 79.6 | % | 79.2 | % | 87.5 | % | 87.9 | % | |||||||||||||||||||||||||
| (1) | Ratios are as a percent of average assets. |
| (2) | Assumes a 40.0% effective tax rate. |
| (3) | Expense coverage ratio calculated as net interest income before provisions for loan losses divided by operating expenses. |
| (4) | Efficiency ratio calculated as operating expenses divided by the sum of net interest income before provisions for loan losses plus other income (excluding net gains). |
Sources: Malvern Bancorp’s prospectus, audited & unaudited financial statements and RP Financial calculations.
| RP® Financial, LC. | OVERVIEW AND FINANCIAL ANALYSIS I.11 |
net interest income ratio during the most recent twelve month period. The slight decline in the net interest income ratio during the most twelve month period reflects some compression in the interest rate spread since fiscal 2011, as yields declined more significantly relative to funding costs. The more significant decrease in interest-earning assets yields was related to a shift in the Company’s interest-earning asset composition towards a higher concentration of relatively lower yielding cash and investments, as well as the lag in less interest-rate sensitive interest-earning assets repricing lower relatively to interest-bearing deposits and borrowings. The Company’s interest rate spread equaled 2.78% during the six months ended March 31, 2012, versus interest rate spreads of 2.17% and 2.93% during fiscal years 2009 and 2011, respectively. The Company’s net interest rate spreads and yields and costs for the period covered in Table 1.1 are set forth in Exhibits I-3 and I-6.
Non-interest operating income has been a fairly stable and somewhat of a limited contributor to the Company’s earnings, reflecting the Company’s limited diversification into products and services that generate sources of non-interest operating income. Throughout the period shown in Table 1.2, sources of non-interest operating income ranged from a low of 0.25% of average assets during fiscal 2011 to a high of 0.32% of average assets during fiscal 2009. For the twelve month ended March 31, 2012, the Company reported non-interest operating income of $2.1 million or 0.31% of average assets. Service charges and fees, rental income and earnings on BOLI constitute the largest sources of non-interest operating income for the Company.
Operating expenses represent the other major component of the Company’s earnings, ranging from a low of 1.91% of average assets during fiscal 2007 to a high of 2.75% of average assets during the twelve months ended March 31, 2012. The comparatively higher operating expense ratios reflected for the past two fiscal years and the most recent twelve month period were largely attributable to higher operating expenses resulting from increases in professional fees incurred to facilitate the work out of problem assets and OREO expenses incurred to maintain and dispose of OREO. Asset shrinkage has also placed upward pressure on the Company’s operating expense ratio over the past one and one-half fiscal years. The increase in capital realized from the stock offering will increase the Company’s capacity to leverage operating expenses through growth of the balance sheet.
Overall, the general trends in the Company’s net interest margin and operating expense ratio since fiscal 2007 reflect a decrease in core earnings, as indicated by the Company’s expense coverage ratio (net interest income divided by operating expenses). Malvern
| RP® Financial, LC. | OVERVIEW AND FINANCIAL ANALYSIS I.12 |
Bancorp’s expense coverage ratio equaled 1.34 times during fiscal 2007 versus a ratio of 1.03 times during the twelve months ended March 31, 2012. The decrease in the expense coverage ratio resulted from a comparatively larger increase in the operating expense ratio relative to the net interest income ratio. Similarly, Malvern Bancorp’s efficiency ratio (operating expenses, net of amortization of intangibles, as a percent of the sum of net interest income and other operating income) of 67.5% for fiscal 2007 was more favorable than its efficiency ratio of 87.9% for the twelve months ended March 31, 2012.
During the period covered in Table 1.2, loan loss provisions had a varied impact on the Company earnings which was largely related to credit quality trends. Over the past five and one-half fiscal years, loan loss provisions established by the Company ranged from 0.24% of average assets during fiscal 2007 to 1.82% of average asset during fiscal 2011. For the twelve months ended March 31, 2012, provisions for loan losses were $2.4 million or 0.36% of average assets. The lower loan loss provisions established during the most recent twelve month period was supported by a downward trend in non-performing loans since peaking at fiscal year end 2010, as well as the decline in loans outstanding that has been occurring since fiscal year end 2009. As of March 31, 2012, the Company maintained valuation allowances of $8.1 million, equal to 1.73% of net loans receivable and 68.84% of total non-accruing loans. Exhibit I-7 sets forth the Company’s loan loss allowance activity during the past five and one-half fiscal years.
Non-operating income over the past five and one-half years has primarily consisted of gains and losses on the sale of investment securities and OREO. Overall, non-operating income ranged from a net loss of 0.03% of average assets during fiscal 2009 to net gains equal to 0.09% of average assets during the twelve months ended March 31, 2012. Net gains recorded for the most recent twelve month period included gains on the sale of investment securities of $623,000 and gains on the sale of OREO of $9,000. The gain on sale of investment securities was realized from the securitization and sale of $10.7 million of long-term, fixed rate residential loans and $7.6 million of investment securities. The gains and losses realized from the sale of investment securities and OREO are viewed as non-recurring income items and, therefore, are not considered to be part of the Company’s core earnings.
The Company’s effective tax rate ranged from a low of 1.52% during the twelve months ended March 31, 2012 to a high of 37.72% during fiscal 210. As set forth in the prospectus, the Company’s marginal effective statutory tax rate is 40.0%.
| RP® Financial, LC. | OVERVIEW AND FINANCIAL ANALYSIS I.13 |
Interest Rate Risk Management
The Company’s balance sheet is liability-sensitive in the short-term (less than one year) and, thus, the net interest margin will typically be adversely affected during periods of rising and higher interest rates, as well as in the interest rate environment that generally prevailed during 2007, in which the yield curve was flat or inverted. Comparatively, the Company’s interest rate spreads will tend to benefit when short-term interest rates decline and the yield curve steepens. As of March 31, 2012 the Company’s Net Portfolio Value (“NPV”) analysis indicated that a 2.0% instantaneous and sustained increase in interest rates would result in a 2% decline in the Company’s NPV (see Exhibit I-8).
The Company pursues a number of strategies to manage interest rate risk, particularly with respect to seeking to limit the repricing mismatch between interest rate sensitive assets and liabilities. The Company manages interest rate risk from the asset side of the balance sheet through underwriting residential mortgages that will allow for their sale to the secondary market when such a strategy is appropriate, originating 1-4 family ARM loans, diversifying into other types of lending beyond 1-4 family permanent mortgage loans which consist primarily of shorter term and adjustable rate loans, emphasizing investing in securities with maturities of less five than years or with floating rates, maintaining most investments as available for sale and building up liquidity in the prevailing low interest rate environment. As of March 31, 2012, ARM loans comprised 31.5% of total loans (see Exhibit I-9). On the liability side of the balance sheet, management of interest rate risk has been pursued through emphasizing growth of lower cost and less interest rate sensitive transaction and savings account deposits, extending CD maturities through offering attractive rates on certain CDs with maturities of more than one year and utilizing fixed rate FHLB advances with terms out to ten years.
The infusion of stock proceeds will serve to further limit the Company’s interest rate risk exposure, as most of the net proceeds will be redeployed into interest-earning assets and the increase in the Company’s capital position will lessen the proportion of interest rate sensitive liabilities funding assets.
Lending Activities and Strategy
Malvern Bancorp’s lending activities have traditionally emphasized 1-4 family permanent mortgage loans and such loans continue to comprise the major portion of the Company’s loan portfolio. Beyond 1-4 family loans, lending diversification by the Company has emphasized
| RP® Financial, LC. | OVERVIEW AND FINANCIAL ANALYSIS I.14 |
commercial real estate/multi-family loans followed by consumer loans. Other areas of lending diversification for the Company included construction and land development loans and commercial business loans. During fiscal 2010, the Company discontinued, with certain exceptions, the origination of any new commercial real estate loans, construction loans and land development loans. Pursuant to the terms of the Supervisory Agreements, the Company may not make, invest in or purchase any new commercial real estate loans and/or commercial business loans without the prior written non-objection of the OCC, other than with respect to any refinancing, extension or modification of an existing commercial real estate loan or commercial business loan where no new funds are advanced. Accordingly, the Company’s current lending strategy is to remain primarily a 1-4 family lender, with lending diversification emphasizing consumer loan products. Exhibit I-10 provides historical detail of Malvern Bancorp’s loan portfolio composition over the past five and one-half fiscal years and Exhibit I-11 provides the contractual maturity of the Company’s loan portfolio by loan type as of March 31, 2012.
Malvern Bancorp offers fixed rate and adjustable rate loans for 1-4 family permanent mortgage loans, with terms of up to 30 years. Loans are generally underwritten to secondary market guidelines and the Company’s current philosophy is to retain most originations for investment. In the prevailing interest rate environment, the substantial portion of 1-4 family loans originated by the Company consists of fixed rate loans. ARM loans offered by the Company include loans with repricing terms of one, three or five years and are indexed to U.S. Treasury notes of comparable maturities as the repricing term. After the initial repricing period, ARM loans convert to a one-year ARM loan for the balance of the mortgage term. Fixed rate loans are offered for terms of 10 to 30 years. The Company also offers balloon loans, which are amortized over thirty years and have a five or seven year balloon provision and bi-weekly mortgage loans. As of March 31, 2012, the Company’s outstanding balance of 1-4 family loans equaled $220.2 million or 46.6% of total loans outstanding.
During 2010, the Company generally stopped originating any new construction and land development loans. Previously, construction loans originated by the Company consisted of loans to finance the construction of 1-4 family residences, as well as multi-family and commercial real estate properties. The Company’s 1-4 family construction lending activities consisted of construction financing for construction/permanent loans, as well as financing for speculative loans that are extended to builders. Generally, the Company limited a builder on the number of homes built on speculative basis to two unsold homes (one model home and one speculative home) per development project. Construction loans for the construction of
| RP® Financial, LC. | OVERVIEW AND FINANCIAL ANALYSIS I.15 |
commercial properties were originated as construction/permanent loans. Construction loans were generally originated as prime rate based loans and required payment of interest only during the construction period. Construction loans were extended up to a loan-to-value (“LTV”) ratio of 80.0%.
The Company also made construction loans for the acquisition and development of land for sale (i.e. roads, sewer and water lines). Acquisition and development construction loans were generally only made in conjunction with a commitment for a construction loan for the units to be built on the site. Acquisition and development construction loans were generally originated as prime rate based loans and required payment of interest only during the construction period. Acquisition and development construction loans were extended up to a LTV ratio of 80.0%. At March 31, 2012, the Company’s largest commercial construction or development loan had an outstanding balance of $3.4 million and was performing in accordance with its terms at March 31, 2012. Malvern Bancorp’s outstanding balance of construction and development loans equaled $21.8 million or 4.6% of total loans outstanding.
Land loans consist substantially of properties that will be used for residential and commercial development. Land loans are typically prime rate based loans that require payment of interest only for terms of up to three years and are extended up to a LTV ratio of 80.0%. As of March 31, 2012, Malvern Bancorp’s outstanding balance of land loans equaled $632,000 or 0.1% of total loans outstanding.
The balance of the mortgage loan portfolio consists of commercial real estate and multi-family loans, which are substantially collateralized by properties in the Philadelphia MSA. During 2010, the Company generally stopped originating any new commercial real estate/multi-family loans. Previously, Malvern Bancorp originated commercial real estate and multi-family loans up to a LTV ratio of 75.0% and required a minimum debt-coverage ratio of 1.2 times. Commercial real estate and multi-family loans were generally extended as ten year notes, with a five year repricing term indexed to the prime rate as published inThe Wall Street Journal. Commercial real estate and multi-family loans generally have amortization terms of up to 25 years. Properties securing the commercial real estate and multi-family loan portfolio include office buildings, retail and industrial use buildings, strip shopping centers, mixed-use properties, medical and professional buildings, churches and apartment buildings. As of March 31, 2012, the Company’s largest commercial real estate/multi-family loan on one property had an outstanding balance of $7.6 million and was performing in accordance with its terms at March
| RP® Financial, LC. | OVERVIEW AND FINANCIAL ANALYSIS I.16 |
31, 2012. As of March 31, 2012, the Company’s outstanding balance of commercial real estate and multi-family loans totaled $127.5 million or 27.0% of total loans outstanding.
Malvern Bancorp’s diversification into non-mortgage loans consists primarily of consumer loans, with second mortgage loans and home equity lines of credit constituting the major portion of the consumer loan portfolio. Most of the Company’s second mortgage loans are generated through loan brokers operating in southeastern Pennsylvania. Second mortgage loans are offered as fixed or adjustable rate amortizing loans for terms of up to 20 years, while home equity lines of credit have a floating rate tied to the prime rate for terms of up to 20 years. The Bank will originate second mortgage loans and home equity lines of credit up to a LTV ratio of 85.0% when combined with a first mortgage held by the Company and up to an 80.0% LTV ratio when combined with a first mortgage held by any other financial institution. Other than second mortgage loans and home equity lines of credit, consumer lending has been a relatively minor area of lending diversification for the Company, with the balance of the portfolio consisting of various types of installment loans, unsecured personal loans and loans secured by deposits. As of March 31, 2012, the Company’s outstanding balance of consumer loans equaled $93.7 million or 19.9% of total loans outstanding. Second mortgage loans and home equity lines of credit accounted for $72.2 million and $20.7 million of the consumer loan balance, respectively, at March 31, 2012.
During 2010, the Company generally stopped originating any new commercial business loans. Previously, the Company offered commercial business loans and lines of credit to small- and medium-sized companies in its market area. Commercial business loans offered by the Company consisted of fixed rate term loans for terms of up to ten years and floating rate lines of credit indexed to the prime rate as published inThe Wall Street Journal. As of March 31, 2012, the Company’s outstanding balance of commercial business loans equaled $8.7 million or 1.8% of total loans outstanding.
Exhibit I-12 provides a summary of the Company’s lending activities over the past three and one-half fiscal years. Over the past three and one-half fiscal years, total loans originated declined significantly, which was mostly related to decreases in originations of commercial/real estate/multi-family loans and construction and development loans. Total originations declined from $128.5 million during fiscal 2009 to $65.0 million during fiscal 2011 and for the six months ended March 31, 2012 totaled $29.3 million. Originations of 1-4 family permanent mortgage loans accounted for the largest source of originations during the past three and one-half fiscal years ($117.5 million or 38.1% of total loans originated), followed by commercial real
| RP® Financial, LC. | OVERVIEW AND FINANCIAL ANALYSIS I.17 |
estate/multi-family loans ($75.8 million or 24.6% of total loans originated) and consumer loans ($70.3 million or 22.8% of total loans originated). Loan originations were supplemented with loan purchases totaling $127.4 million during the past three and one-half fiscal years, which consisted substantially of purchases of 1-4 family permanent mortgage loans (total purchases of $77.3 million) and second mortgage loans (total purchases of $49.7 million). Loan purchases reflect loans obtained from the Company’s network of loan brokers, which are classified as “purchased” loans when the broker provides the loan funds at closing and closes the loan in its name. The Company did not sell any loans during the past three and one-half fiscal years. After recording loan growth during fiscal 2009, the Company’s loan portfolio trended lower during the past two and one-half fiscal years as loan originations and purchases were more than offset by loan repayments, transfers of loans to OREO and net loan charge-offs.
Asset Quality
The Company’s historical 1-4 family lending emphasis and lending emphasis on lending in local and familiar markets generally supported maintenance of relatively favorable credit quality measures. However, with the onset of the recession in the Company’s lending markets, the Company experienced credit quality deterioration in its loan portfolio. Over the past five and one-half fiscal years, Malvern Bancorp’s balance of non-performing assets ranged from a low of 0.45% of assets at fiscal year end 2007 to a high of 3.49% of assets at fiscal year end 2010. The Company held $16.5 million of non-performing assets at March 31, 2012, equal to 2.53% of assets. As shown in Exhibit I-13, non-performing assets at March 31, 2012 consisted of $11.7 million of non-accruing loans and $4.7 million of OREO and other foreclosed assets. As of March 31, 2012, non-accruing 1-4 family loans totaling $4.4 million accounted for the largest concentration of the non-accruing loan balance and commercial real estate properties totaling $3.2 million accounted for the largest portion of the OREO and other foreclosed assets balance. The decrease in non-performing assets since fiscal year end 2010 was the result of an $8.1 million reduction in the non-accruing loan balance and a $572,000 reduction in OREO and other foreclosed assets.
To track the Company’s asset quality and the adequacy of valuation allowances, Malvern Bancorp has established detailed asset classification policies and procedures which are consistent with regulatory guidelines. Classified assets are reviewed monthly by senior management and the Board. Pursuant to these procedures, when needed, the Company establishes additional valuation allowances to cover anticipated losses in classified or non-
| RP® Financial, LC. | OVERVIEW AND FINANCIAL ANALYSIS I.18 |
classified assets. As of March 31, 2012, the Company maintained allowance for loan losses of $8.1 million, equal to 1.73% of net loans receivable and 68.85% of non-accruing loans.
Funding Composition and Strategy
Deposits have consistently served as the Company’s primary funding source and at March 31, 2012 deposits accounted for 91.7% of Malvern Bancorp’s interest-bearing funding composition. Exhibit I-14 sets forth the Company’s deposit composition for the past three and one-half fiscal years. CDs constitute the largest concentration of the Company’s deposit composition, with the concentration of CDs comprising total deposits trending lower since fiscal year end 2010. As of March 31, 2012, the CD portfolio totaled $294.3 million or 54.8% of total deposits, versus comparable measures of $371.6 million and 62.3% of total deposits at year fiscal end 2010. CDs with scheduled maturities of one year or less comprised 38.4% of the Company’s CDs at March 31, 2012. Exhibit I-15 sets forth the maturity schedule of the Company’s CDs as of March 31, 2012. As of March 31, 2012, jumbo CDs (CD accounts with balances of $100,000 or more) amounted to $135.2 million or 46.0% of total CDs. Historically, the Company has not utilized brokered CDs as a funding source.
The Company maintained $242.7 million of savings and transaction account deposits at March 31, 2012, which equaled 45.2% of total deposits. Comparatively, core deposits equaled $225.2 million or 37.7% of total deposits at fiscal year end 2010. Since fiscal year end 2010, interest-bearing demand deposits have been the primary source of the Company’s core deposit growth and comprised the largest concentration of the Company’s core deposits at March 31, 2012, amounting to $95.1 million or 39.2% of core deposits.
Borrowings serve as an alternative funding source for the Company to facilitate management of funding costs and interest rate risk. The Company maintained $48.6 million of borrowings at March 31, 2012 with a weighted average rate of 1.76%. Borrowings held by the Company at March 31, 2012 consisted entirely of FHLB advances, most of which had remaining terms of more than five years.
Subsidiaries
In addition to the Bank, Malvern Bancorp has one subsidiary, Malvern Federal Holdings, Inc., a Delaware corporation organized to hold and manage certain investment securities. The Bank has two subsidiaries, Malvern Federal Investments, Inc., a Delaware corporation
| RP® Financial, LC. | OVERVIEW AND FINANCIAL ANALYSIS I.19 |
organized as an operating subsidiary of the Bank to hold and manage certain investment securities, and Strategic Asset Management Group, Inc. (“SAMG”), a Pennsylvania corporation and insurance brokerage engaged in sales of property and casualty insurance, commercial insurance and life and health insurance. SAMG currently is inactive.
Legal Proceedings
On January 12, 2012, Stilwell Value Partners VI, L.P., withdrew the lawsuit it had previously filed against MLVF, the MHC and each of their directors pursuant to a Praecipe to Discontinue filed in the Court of Common Pleas of Chester County, Pennsylvania.Stilwell Value Partners VI, L.P. v. Hughes, et al. The Company is not presently involved in any legal proceedings of a material nature. From time to time, the Company is a party to legal proceedings incidental to its business, such as suits to enforce its security interest in collateral pledged to secure loans made by the Bank.
| RP® Financial, LC. | MARKET AREA II.1 |
II. MARKET AREA
Introduction
Malvern Bancorp conducts operations out of the headquarters office and eight branch offices in the Pennsylvania counties of Chester and Delaware Counties, which are in located southeastern Pennsylvania, approximately 25 miles west of downtown Philadelphia. The headquarters office and seven branch locations are in Chester County and during 2010 the Company opened its first branch location in Delaware County. Exhibit II-1 provides information on the Company’s office properties.
The Philadelphia MSA is the nation’s sixth largest metropolitan area in terms of total population, with a 2011 population of approximately 6.0 million. The two counties served by the Company’s branches had a total population of approximately 1.1 million in 2011. The Greater Philadelphia area economy is typical of the cities in the northeast corridor, where the traditional manufacturing-based economy has diminished and the service sector has been the primary source of growth. Overall, the Philadelphia MSA maintains a fairly diversified economic base, as traditional employers in the manufacturing and financial services industry have been bolstered by growth in the life sciences and healthcare industries as well as the information technology and communication sectors.
Future growth opportunities for Malvern Bancorp depend on the future growth and stability of the local and regional economy, demographic growth trends, and the nature and intensity of the competitive environment. These factors have been briefly examined to help determine the growth potential that exists for the Company, the relative economic health of the Company’s market area, and the resultant impact on value.
National Economic Factors
The future success of the Company’s operations is partially dependent upon various national and local economic trends. In assessing national economic trends over the past few quarters, manufacturing and non-manufacturing activity continued to expand in October 2011, but at a slower pace compared to September. Jobs data for October continued to imply a slow recovery, with 80,000 jobs added and the unemployment rate ticking down to 9.0%. Economists’ had forecasted a gain of 95,000 jobs for October. Retail sales and the index of leading economic indicators both increased in October. Sales of existing homes were also
| RP® Financial, LC. | MARKET AREA II.2 |
higher in October, but prices continued to decline as a glut of foreclosures kept pressure on home prices. An increase in manufacturing activity during November and a brighter jobs report for November provided further evidence that the recovery was gaining momentum. November employment data showed 120,000 jobs were added and the unemployment rate declined to 8.6%. However, the pace of growth in the service sector was slower in November and November retail sales showed only a modest increase from October. Housing starts surged 9.3% in November, which was fueled by construction of apartments, townhouses and other multi-family properties. Increases in November durable-goods orders and single-family home sales also suggested that the economy was improving. Manufacturing activity expanded at a slightly higher rate in December, as the index which measures manufacturing activity reached a six month high. The pace of non-manufacturing activity picked up as well in December. Employers added 200,000 jobs in December, which pushed the December unemployment rate down to 8.5%. December was the third consecutive month of retail sales showing slower growth and new home construction declined in December. Declining home prices and attractive mortgage rates supported a gain in existing home sales for December. Comparatively, sales of new homes declined in December and for all of 2011 new home sales were the lowest since the Census Bureau began tracking such sales in 1963. A more positive economic outlook was indicated by the 3% increase in December durable-goods orders and fourth quarter GDP increased at a 2.8% annual rate (subsequently revised up to 3.0%), the fastest pace since the second quarter of 2010.
Economy data for the first month of 2012 generally reflected an improving economy. Manufacturing activity increased in January, marking the 30th straight month of increased factory activity. January non-manufacturing activity showed a healthy increase as well. Employers added 243,000 jobs in January, which was more than expected, and the unemployment rate for January declined to 8.3%. The January unemployment rate was the lowest since February 2009. Retail sales were up slightly in January and industrial production was unchanged in January, with both readings falling short of expectations. Residential construction was up 1.5% in January, but remained low by historical standards. Sales of existing homes also rose in January, while new home sales were down slightly in January but higher than a year ago. February data generally pointed towards an improving economy, as employment showed solid growth for the third straight month and the February unemployment rate held steady at 8.3%. The service industry grew at its fastest pace in a year in February, while manufacturing activity continued to expand in February as well but at a slower rate compared to January. February
| RP® Financial, LC. | MARKET AREA II.3 |
retail sales were up 1.1% from January, the biggest jump in five months. New and existing home sales declined in February and residential construction was down as well in February, but permits for new residential construction in February climbed to their highest level since October 2008. The pace of manufacturing activity picked up steam in March, while service activity expanded at a slower rate in March. Employers added 120,000 jobs in March, which was far less than expected, and the March unemployment rate dropped to 8.2%. Retail sales showed a healthy increase in March, which was believed to be supported by recent job growth and unseasonably mild weather throughout most regions of the U.S. Housing data for March was somewhat mixed, but, in general, the recovery for housing market remained slow and uneven. New home construction was down in March, while permits for future building reached their highest level since September 2008. Similarly, sales of existing homes declined in March, but pending home sales of existing homes were up in March. First quarter GDP increased at a 2.2% annual rate, versus 3.0% in the fourth quarter and below expected growth of 2.5%.
Manufacturing activity accelerated in April 2012, while April service sector activity expanded at a slightly lower rate in April. Employment data for April showed a decrease in hiring for a second straight month, although the April unemployment rate fell to 8.1%.
In terms of interest rates trends over the past few quarters, the yield on the 10-year Treasury remained below 2.0% at the start of the fourth quarter of 2011 and then edged above 2.0% heading into mid-October, as signs of stronger growth eased concerns that the economy was slipping back into a recession. Long-term Treasury yields stabilized for the balance of October and then edged lower at the beginning of November, as investors continued to be attracted to the safety of U.S. Treasury bonds. The Federal Reserve concluded its early-November meeting by keeping its target rate near zero, but lowered its jobs forecast for 2012. Wholesale and consumer prices edged down in October, which served to ease inflation concerns and helped to keep Treasury yields at historic lows with the 10-year Treasury yield hovering around 2.0% into late-November. A rise in consumer confidence in November and investors moving back into stocks pushed the yield on the 10-year Treasury back above 2.0% at the end of November. Treasury yields continued to edge higher at the start of December, following the better-than-expected jobs report for November. Disappointing November retail sales and the Federal Reserve’s guarded assessment of the economy helped to push the 10-year Treasury yield under 2.0% in mid-December. The Federal Reserve concluded its mid-December meeting by keeping its target rate the same and reiterated that short-term rates are likely to stay near zero until mid-2013. Little change in November wholesale and consumer
| RP® Financial, LC. | MARKET AREA II.4 |
prices indicated that inflation was slowing down. Data showing a healthier economy and consumer confidence increasing to a six month high pushed the 10-year Treasury yield back up to 2.0% in late-December.
Long-term Treasury yields remained fairly stable during the first half of January 2012 and then declined on more signs of weaker than expected economic growth and Standard & Poor’s downgrade of France’s debt along with eight other euro-zone countries. Low inflation reflected in the December wholesale and retail prices, along with the Federal Reserve’s announcement to keep rates low at least through 2014, helped to keep long-term Treasury yields near historic lows through the end of January. Data that generally showed an improving economy in January, including a better-than-expected jobs report for January, pushed Treasury yields slightly higher in early-February with the yield on the 10-year Treasury edging above 2.0%. However, investors moved backed into the safety of U.S. Treasury bonds heading into mid-February, reflecting renewed fears of a Greek default and a drop in consumer confidence during February. Long-term Treasury yields edged higher in mid-February, as investors reacted to news of higher consumer prices in January including an increase in “core” consumer prices. The interest rate environment remained fairly stable through the end of February and into early-March. Investors moved out of Treasury bonds in mid-March, pushing yields to their highest level since October, as signs of an improving economy reduced prospects for another round of bond buying by the Federal Reserve.
Treasury yields edged lower at the start of the second quarter of 2012, as the 10-year Treasury yield declined to 2.0% in mid-April. A weaker than expected employment report for March and mounting concerns about Europe’s debt problems were noted factors that pushed investors back into U.S. bonds. Interest rates stabilized through the second half of April, with the yield on the 10-year Treasury remaining slightly below 2.0% for the balance of April. The late-April meeting of the Federal Reserve concluded with a reaffirmation of their plan to keep short-term interest rates near zero until late 2014 to support economic growth. Disappointing job growth reflected in the April employment data pushed Treasury yields lower in early-May. As of May 4, 2012, the bond equivalent yields for U.S. Treasury bonds with terms of one and ten years equaled 0.18% and 1.91%, respectively, versus comparable year ago yields of 0.19% and 3.25%. Exhibit II-2 provides historical interest rate trends.
Based on the consensus outlook of economists surveyed by The Wall Street Journal in April 2012, economic growth is expected to increase slightly in 2012 compared to 2011. The economists forecasted GDP growth of 2.5% for 2012 compared to 1.6% for 2011. Most of the
| RP® Financial, LC. | MARKET AREA II.5 |
economists expect that the unemployment rate will be at 7.9% by the end of 2012 and, on average, 191,000 jobs will be added per month over the next year. On average, the economists did not expect the Federal Reserve to begin raising its target rate until late 2013 and the 10-year Treasury yield would increase to 2.55% by the end of 2012. The surveyed economists also forecasted home prices would be substantially unchanged in 2012 and housing starts would increase slightly in 2012.
Market Area Demographics
Key demographic indicators for the Company’s market area include population, number of households and household/per capita income levels. Trends in these key measures are summarized by the data presented in Table 2.1 from 2010 to 2011 and projected through 2016. Data for the nation as well as for Pennsylvania and the Philadelphia MSA are included for comparative purposes. Chester County and Delaware County had 2011 populations of 503,000 and 560,000, respectively. Chester County’s population increased at a 0.8% rate over the past year, which exceeded Delaware County’s 0.3% population growth rate for 2011. The population growth rate in Chester County was also higher than the comparable growth rates for the Philadelphia MSA (0.3%), Pennsylvania (0.3%), as well as the nation (0.6%). The stronger population growth experienced in Chester County translated into stronger household growth as well. Growth in households for Delaware County and the Philadelphia MSA also paralleled population growth trends. These trends reflect a shift in population towards more outlying suburban markets. Population and household growth trends are projected to continue over the next five years through 2016, with population and household growth rates for Chester County projected to increase slightly over the next five years and remain well above the comparable projected growth rates for Delaware County and the Philadelphia MSA.
Income measures show that Chester County is a relatively affluent market, while Delaware County income measures also exceeded the comparable state and national measures for median household income and per capita income. The greater wealth of the suburban markets is consistent with national trends, in which the white collar professionals who work in the cities generally reside in the surrounding suburbs. Additionally, much of the growth in white collar jobs in the Philadelphia MSA has been occurring in suburban markets. After declining in 2011, household and per capita income for Chester and Delaware Counties are projected to increase over the next five years, which is consistent with the historical and
| RP® Financial, LC. | MARKET AREA II.6 |
Table 2.1
Malvern Bancorp, Inc.
Summary Demographic Data
| Year | Annual Growth Rate | |||||||||||||||
| 2010 | 2011 | 2016 | 2010-2011 | 2011-2016 | ||||||||||||
| Population (000) | ||||||||||||||||
| United States | 308,746 | 310,704 | 321,315 | 0.6 | % | 0.7 | % | |||||||||
| Pennsylvania | 12,702 | 12,736 | 12,916 | 0.3 | % | 0.3 | % | |||||||||
| Philadelphia-Camden-Wilmington MSA | 5,965 | 5,985 | 6,100 | 0.3 | % | 0.4 | % | |||||||||
| Chester County | 499 | 503 | 530 | 0.8 | % | 1.0 | % | |||||||||
| Delaware County | 559 | 560 | 565 | 0.3 | % | 0.2 | % | |||||||||
| Households (000) | ||||||||||||||||
| United States | 116,716 | 117,458 | 121,713 | 0.6 | % | 0.7 | % | |||||||||
| Pennsylvania | 5,019 | 5,032 | 5,121 | 0.3 | % | 0.4 | % | |||||||||
| Philadelphia-Camden-Wilmington MSA | 2,260 | 2,268 | 2,317 | 0.3 | % | 0.4 | % | |||||||||
| Chester County | 183 | 184 | 194 | 0.8 | % | 1.1 | % | |||||||||
| Delaware County | 209 | 209 | 211 | 0.3 | % | 0.2 | % | |||||||||
| Median Household Income ($) | ||||||||||||||||
| United States | $ | 51,914 | 50,227 | 57,536 | -3.2 | % | 2.8 | % | ||||||||
| Pennsylvania | 50,398 | 49,405 | 58,149 | -2.0 | % | 3.3 | % | |||||||||
| Philadelphia-Camden-Wilmington MSA (1) | 66,841 | 58,051 | 71,471 | -13.2 | % | 4.2 | % | |||||||||
| Chester County | 84,741 | 81,161 | 91,930 | -4.2 | % | 2.5 | % | |||||||||
| Delaware County | 61,876 | 60,442 | 75,310 | -2.3 | % | 4.5 | % | |||||||||
| Per Capita Income ($) | ||||||||||||||||
| United States | $ | 27,334 | 26,391 | 30,027 | -3.4 | % | 2.6 | % | ||||||||
| Pennsylvania | 27,049 | 26,788 | 31,059 | -1.0 | % | 3.0 | % | |||||||||
| Philadelphia-Camden-Wilmington MSA (1) | 32,744 | 30,422 | 35,362 | -7.1 | % | 3.1 | % | |||||||||
| Chester County | 41,251 | 38,451 | 44,972 | -6.8 | % | 3.2 | % | |||||||||
| Delaware County | 32,067 | 31,399 | 36,586 | -2.1 | % | 3.1 | % | |||||||||
| 2011 HH Net Income Dist. (%) | $0 to $25,000 | $25,000- $50,000 | $50,000- $100,000 | $100,000+ | ||||||||||||
| United States | 24.65 | % | 25.09 | % | 30.40 | % | 19.86 | % | ||||||||
| Pennsylvania | 17.78 | % | 25.91 | % | 27.79 | % | 28.52 | % | ||||||||
| Philadelphia-Camden-Wilmington MSA | 21.16 | % | 21.56 | % | 31.26 | % | 26.02 | % | ||||||||
| Chester County | 12.10 | % | 16.92 | % | 31.24 | % | 39.74 | % | ||||||||
| Delaware County | 18.66 | % | 21.88 | % | 32.45 | % | 27.01 | % | ||||||||
| (1) | Due to unavailable data, the 2010 MSA income figures are based on an average of the counties included in the MSA. |
| Sources: SNL Financial, LC. and U.S. Census Bureau. | |
| RP® Financial, LC. | MARKET AREA II.7 |
projected income measures for the U.S., Pennsylvania and the Philadelphia MSA. The affluence of the Chester County market is further evidenced by a comparison of household income distribution measures, as Chester County maintains a lower percentage of households with incomes of less than $25,000 and a much higher percentage of households with incomes over $100,000 relative to Delaware County as well as the U.S. and Pennsylvania. Household income distribution measures for Delaware County were fairly consistent with the Pennsylvania measures and implied a more affluent market area relative to the U.S. measures.
Local Economy
The economy of the Company’s market area is relatively diverse and has several significant components. Employment data, shown in Table 2.2, indicates that education and health services constitute the most prominent sector of the economy of the Greater Philadelphia region. The next largest component of the economy of the market is transportation, trade and utilities, followed by professional & business services and government.
Table 2.2
Malvern Bancorp, Inc.
Employment by Sector
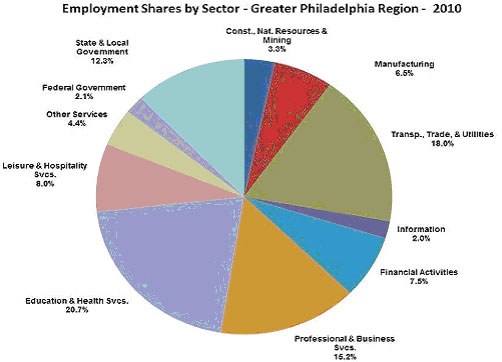
Source: Global Insight, December, 2010.
| RP® Financial, LC. | MARKET AREA II.8 |
Growth sectors of the local economy included the life science and healthcare industries, whose expansion has been fostered by the presence of major research universities and a highly educated technically proficient workforce. Similarly, those same factors have contributed to growth in the information technology and communications industries. The market area’s core industries, with emphasis on those which are perceived to be supporting future growth, have been described below.
Financial Services. The financial services sector has historically been and remains an important element of the Philadelphia metropolitan area economy. The Vanguard Company is one of the largest employers in Chester County, with over 9,000 employees. Moreover, there are numerous other major financial services employers based outside of the Company’s immediate market area, which also provide substantial employment and income to the local economy.
Bio-technology and Pharmaceutical Industries. The Philadelphia metropolitan area is one of the leading regions of the world for biotech and pharmaceutical research and development. Among these are some of the world’s largest pharmaceutical companies including market leaders such as GlaxoSmithKline, Merck, Pfizer, Aventis, and AstraZeneca. Such companies have established operations in the Philadelphia area owing to the presence of critical infrastructure including the presence or world class universities and research centers, the availability of venture capital, and a supportive business environment.
Health Care. Many of the same factors leading to the growth of the bio-tech and pharmaceuticals industries have also made the market area a center for health care. In this regard, there are a variety of primary and secondary health care facilities in the market area with Crozer Keystone Health System and Mercy Health Corp. being among the largest.
Science and Technology. The chemicals industry in greater Philadelphia is the fourth largest in employment among the major metro areas. The greater Philadelphia chamber of commerce notes that more than 36,000 greater Philadelphia residents are employed in science and technology related jobs and the region ranks in the top 10 U.S. metro areas in the number of engineering degrees earned. Furthermore, the area’s high concentration of major science, technology and large businesses that utilize technology (e.g., Lockheed Martin, Boeing, SAP, SCT, GlaxoSmith Kline, Merck, the U.S. Navy and others) has created numerous spin-off business opportunities, supports cluster development and act as magnets for other companies to locate to the market area.
| RP® Financial, LC. | MARKET AREA II.9 |
Table 2.3 lists the largest employers in the Greater Philadelphia region by number of employees.
Table 2.3
Malvern Bancorp, Inc.
Market Area Largest Employers
| Chester County | ||||
| Company | Industry | Employees | ||
| The Vanguard Group | Investment management firm | 9,000 | ||
| SunGard Data Systems | Computer and software services | 4,000 | ||
| Tyco Electronics | Software & Hardware | 4,000 | ||
| QVC | Electronic retail merchandising | 2,800 | ||
| Siemens Medical Solutions | Medical technologies; healthcare information systems | 2,000 | ||
| Devereux | Mental Health Services | 1,500 | ||
| Unisys | Technical solutions and software services | 1,500 | ||
| Telespectrum | Telemarketing Services | 1,300 | ||
| Paoli Hospital | General medical & surgical hospital | 1,100 | ||
| Brandywine Hospital | General medical & surgical hospital | 975 | ||
| Chester County Hospital | General medical & surgical hospital | 975 | ||
| Delaware County | ||||
| Company | Industry | Employees | ||
| Crozer Keystone Health Systems | Healthcare | 5,000 | + | |
| Jefferson Health Systems | Healthcare | 5,000 | + | |
| Boeing Co | Military Rotorcraft | 4,800 | ||
| Riddle Memorial Hospital | Nonprofit Hospital & Substance Abuse Center | 1,938 | ||
| SAP America Inc | Prepackaged Software | 1,800 | ||
| Elwyn | Job Training and Related Services | 1,500 | ||
| Delaware County Memorial Hospital | General Medical & Surgical Hospitals | 1,300 | ||
| Crozer-Keystone Health System | General Medical & Surgical Hospitals | 1,200 | ||
| Fair Acres Geriatric Center | Skilled Nursing Facility | 1,150 | ||
| Atlantic Petroleum LLC | Convenience Stores/ Gasoline Stations | 1,100 | ||
| Mercy Health System | General Medical & Surgical Hospitals | 1,000 | ||
| Taylor Hospital | Acute-Care Hospital & Rehabilitation | 1,000 | ||
Source: Greater Philadelphia Chamber of Commerce
| RP® Financial, LC. | MARKET AREA II.10 |
Unemployment Trends
Comparative unemployment rates for the primary market area counties, as well as for the U.S. and Pennsylvania, are shown in Table 2.4, with Chester County’s favorable demographic characteristics also translating into a relatively low unemployment rate. March 2012 unemployment rates for the counties of Chester and Delaware were 5.9% and 7.8%, respectively, which were below the comparable Philadelphia MSA unemployment rate of 8.4%. Comparatively, the March 2012 unemployment rates for the U.S. and Pennsylvania were 8.9% and 7.7%, respectively. Both of the primary market area counties recorded lower unemployment rates for March 2012 compared to the year ago period, which paralleled the trends for the Philadelphia MSA, Pennsylvania and the U.S.
Table 2.4
Malvern Bancorp, Inc.
Unemployment Trends (1)
| Region | March 2011 Unemployment | March 2012 Unemployment | ||||||
| United States | 10.2 | % | 8.9 | % | ||||
| Pennsylvania | 8.2 | 7.7 | ||||||
| Philadelphia MSA | 8.6 | 8.4 | ||||||
| Chester County | 6.3 | 5.9 | ||||||
| Delaware County | 7.9 | 7.8 | ||||||
(1) Unemployment rates have not been seasonally adjusted.
Source: U.S. Bureau of Labor Statistics.
Market Area Deposit Characteristics and Competition
The Company’s retail deposit base is closely tied to the economic fortunes of the market area counties and, in particular, the areas that are nearby to one of Malvern Bancorp’s branches. Table 2.5 displays deposit market trends from June 30, 2007 through June 30, 2011 for Chester and Delaware Counties, as well for Pennsylvania. In Chester County, the Company’s $516.5 million of deposits at June 30, 2011 represented a 4.7% market share of bank and thrift deposits. In Delaware County, the Company’s $45.3 million of deposits at June 30, 2011 represented a 0.6% market share of bank and thrift deposits. The market area is dominated by commercial banks, which hold a 78% deposit market share in Chester County and a 68% deposit market share in Delaware County. Annual deposit growth rates for all banks and thrifts in Chester and Delaware Counties over the last four years equaled 4.6% and 6.2%,
| RP® Financial, LC. | MARKET AREA II.11 |
respectively. The Company’s annual deposit growth rate in Chester County equaled 4.7% during the period covered in Table 2.5, which served to preserve its deposit market share.
Table 2.5
Malvern Bancorp, Inc.
Deposit Summary
| As of June 30, | ||||||||||||||||||||||
| 2007 | 2011 | Deposit Growth Rate 2007-2011 | ||||||||||||||||||||
| Deposits | Market Share | Number of Branches | Deposits | Market Share | No. of Branches | |||||||||||||||||
| (Dollars in Millions) | (%) | |||||||||||||||||||||
| Pennsylvania | $ | 259,411,000 | 100.0 | % | 4,758 | $ | 300,267,000 | 100.0 | % | 4,711 | 3.7 | % | ||||||||||
| Commercial Banks | 189,718,000 | 73.1 | % | 3,432 | 231,733,000 | 77.2 | % | 3,467 | 5.1 | % | ||||||||||||
| Savings Institutions | 69,693,000 | 26.9 | % | 1,326 | 68,534,000 | 22.8 | % | 1,244 | -0.4 | % | ||||||||||||
| Chester County | $ | 9,097,034 | 100.0 | % | 208 | $ | 10,887,846 | 100.0 | % | 207 | 4.6 | % | ||||||||||
| Commercial Banks | 6,502,890 | 71.5 | % | 142 | 8,467,382 | 77.8 | % | 157 | 6.8 | % | ||||||||||||
| Savings Institutions | 2,594,144 | 28.5 | % | 66 | 2,420,464 | 22.2 | % | 50 | -1.7 | % | ||||||||||||
| Malvern Bancorp | 429,555 | 4.7 | % | 7 | 516,499 | 4.7 | % | 7 | 4.7 | % | ||||||||||||
| Delaware County | $ | 9,028,045 | 100.0 | % | 178 | $ | 11,486,219 | 100.0 | % | 184 | 6.2 | % | ||||||||||
| Commercial Banks | 5,390,136 | 59.7 | % | 98 | 7,781,260 | 67.7 | % | 110 | 9.6 | % | ||||||||||||
| Savings Institutions | 3,637,909 | 40.3 | % | 80 | 3,704,959 | 32.3 | % | 74 | 0.5 | % | ||||||||||||
| Malvern Bancorp | — | — | — | 45,298 | 0.6 | % | 1 | — | ||||||||||||||
Source: FDIC.
The Philadelphia MSA today is a major center for financial services, and Malvern Bancorp competes with a number of very large financial institutions that are either headquartered or maintain a significant presence in southeastern Pennsylvania. Some of the larger commercial banks operating in the Company’s market include Wells Fargo, PNC Financial, Commerce, and Bank of America. Malvern Bancorp also competes with a number of large savings institutions that maintain branches in or are headquartered in southeastern Pennsylvania, including Citizens, Sovereign Bank and Beneficial Mutual. Overall, the magnitude of the competition that Malvern Bancorp faces is apparent with more than 350 financial institution branches operating in Chester and Delaware Counties (excluding credit unions). Securities firms, credit unions and mutual funds also represent major sources of competition for deposits. In many cases, these competitors are also seeking to provide some or all of the community-oriented services as Malvern Bancorp. With regard to lending competition, the Company encounters the most significant competition from the same institutions providing deposit services. In addition, the Company competes with mortgage companies and independent mortgage brokers for mortgage loan market share. Table 2.6 lists the Company’s
| RP® Financial, LC. | MARKET AREA II.12 |
largest competitors in Chester and Delaware Counties, based on deposit market share as noted parenthetically.
Table 2.6
Malvern Bancorp, Inc.
Market Area Deposit Competitors
| Location | Name | |
| Chester County | Wells Fargo & Co. (13.8%) | |
| PNC Financial (9.3%) | ||
| Citizens Bank of PA (8.7%) | ||
| Toronto-Dominion Bank (8.3%) | ||
| Malvern Bancorp (4.7%) | ||
| Delaware County | Wells Fargo & Co. (19.2%) | |
| Toronto-Dominion Bank (15.0%) | ||
| Citizens Bank of PA (12.0%) | ||
| PNC Financial (9.0%) | ||
| Malvern Bancorp (0.6%) | ||
| Source: FDIC |
| RP® Financial, LC. | PEER GROUP ANALYSIS |
| III.1 |
III. PEER GROUP ANALYSIS
This chapter presents an analysis of Malvern Bancorp’s operations versus a group of comparable savings institutions (the “Peer Group”) selected from the universe of all publicly-traded savings institutions in a manner consistent with the regulatory valuation guidelines. The basis of the pro forma market valuation of Malvern Bancorp is derived from the pricing ratios of the Peer Group institutions, incorporating valuation adjustments for key differences in relation to the Peer Group. Since no Peer Group can be exactly comparable to Malvern Bancorp, key areas examined for differences are: financial condition; profitability, growth and viability of earnings; asset growth; primary market area; dividends; liquidity of the shares; marketing of the issue; management; and effect of government regulations and regulatory reform.
Peer Group Selection
The Peer Group selection process is governed by the general parameters set forth in the regulatory valuation guidelines. Accordingly, the Peer Group is comprised of only those publicly-traded savings institutions whose common stock is either listed on a national exchange (NYSE or AMEX), or is NASDAQ listed, since their stock trading activity is regularly reported and generally more frequent than non-publicly traded and closely-held institutions. Institutions that are not listed on a national exchange or NASDAQ are inappropriate, since the trading activity for thinly-traded or closely-held stocks is typically highly irregular in terms of frequency and price and thus may not be a reliable indicator of market value. We have also excluded from the Peer Group those companies under acquisition or subject to rumored acquisition, mutual holding companies and recent conversions, since their pricing ratios are subject to unusual distortion and/or have limited trading history. A recent listing of the universe of all publicly-traded savings institutions is included as Exhibit III-1.
Ideally, the Peer Group, which must have at least 10 members to comply with the regulatory valuation guidelines, should be comprised of locally- or regionally-based institutions with comparable resources, strategies and financial characteristics. There are approximately 132 publicly-traded institutions nationally and, thus, it is typically the case that the Peer Group will be comprised of institutions with relatively comparable characteristics. To the extent that differences exist between the converting institution and the Peer Group, valuation adjustments will be applied to account for the differences. Since Malvern Bancorp will be a fully-converted
| RP® Financial, LC. | PEER GROUP ANALYSIS |
| III.2 |
public company upon completion of the second-step offering, we considered only fully-converted public companies to be viable candidates for inclusion in the Peer Group. From the universe of publicly-traded thrifts, we selected ten institutions with characteristics similar to those of Malvern Bancorp. In the selection process, we applied one “screen” to the universe of all public companies that were eligible for consideration:
| o | Screen #1 Mid-Atlantic institutions with assets between $400 million and $1.250 billion, tangible equity-to-assets ratios of greater than 8.0% and positive core earnings. Ten companies met the criteria for Screen #1 and all ten were included in the Peer Group: Alliance Bancorp, Inc. of Pennsylvania, Beacon Federal Bancorp of New York, Cape Bancorp, Inc. of New Jersey, Colonial Financial Services of New Jersey, ESSA Bancorp, Inc. of Pennsylvania, Fox Chase Bancorp, Inc. of Pennsylvania, Ocean Shore Holding Company of New Jersey, Oneida Financial Corp. of New York, Standard Financial Corp. of Pennsylvania and TF Financial Corp. of Newton, Pennsylvania. Exhibit III-2 provides financial and public market pricing characteristics of all publicly-traded Mid-Atlantic thrifts. |
Table 3.1 shows the general characteristics of each of the 10 Peer Group companies and Exhibit III-3 provides summary demographic and deposit market share data for the primary market areas served by each of the Peer Group companies. While there are expectedly some differences between the Peer Group companies and Malvern Bancorp, we believe that the Peer Group companies, on average, provide a good basis for valuation subject to valuation adjustments. The following sections present a comparison of Malvern Bancorp’s financial condition, income and expense trends, loan composition, interest rate risk and credit risk versus the Peer Group as of the most recent publicly available date.
In addition to the selection criteria used to identify the Peer Group companies, a summary description of the key comparable characteristics of each of the Peer Group companies relative to Malvern Bancorp’s characteristics is detailed below.
| o | Alliance Bancorp, Inc. of Pennsylvania. Selected due to Philadelphia market area, similar size of branch network, second-step conversion completed in January 2011, relatively high equity-to-assets ratio, similar level of deposits funding assets, limited earnings contribution from sources of non-interest operating income and lending diversification emphasis on commercial real estate loans. |
| o | Beacon Federal Bancorp of New York. Selected due to same size of branch network, similar interest-earning asset composition, similar net interest income ratio as a percent of average assets and similar concentrations of 1-4 family loans, commercial real estate loans and consumer loans as a percent of assets. |
| RP® Financial, LC. | PEER GROUP ANALYSIS |
| III.3 |
Table 3.1
Peer Group of Publicly-Traded Thrifts
May 4, 2012
| Ticker | Financial Institution | Exchange | Primary Market | Operating Strategy(1) | Total Assets(2) | Offices | Fiscal Year | Conv. Date | Stock Price | Market Value | ||||||||||||||
| ($) | ($Mil) | |||||||||||||||||||||||
| ESSA | ESSA Bancorp, Inc. of PA | NASDAQ | Stroudsburg, PA | Thrift | $ | 1,097 | 18 | 09-30 | 04/07 | $ | 9.84 | $ | 117 | |||||||||||
| CBNJ | Cape Bancorp, Inc. of NJ | NASDAQ | Cape May Ct Hs, NJ | Thrift | $ | 1,071 | 17 | 12-31 | 02/08 | $ | 7.68 | $ | 102 | |||||||||||
| BFED | Beacon Federal Bancorp of NY | NASDAQ | East Syracuse NY | Thrift | $ | 1,027 | 8 | 12-31 | 10/07 | $ | 13.15 | $ | 81 | |||||||||||
| OSHC | Ocean Shore Holding Co. of NJ | NASDAQ | Ocean City, NJ | Thrift | $ | 995 | 10 | 12-31 | 12/09 | $ | 11.90 | $ | 86 | |||||||||||
| FXCB | Fox Chase Bancorp, Inc. of PA | NASDAQ | Hatboro, PA | Thrift | $ | 994 | 11 | 12-31 | 06/10 | $ | 13.06 | $ | 167 | |||||||||||
| THRD | TF Financial Corp. of Newtown PA | NASDAQ | Newtown, PA | Thrift | $ | 682 | 14 | 12-31 | 07/94 | $ | 24.88 | $ | 71 | |||||||||||
| ONFC | Oneida Financial Corp. of NY | NASDAQ | Oneida, NY | Thrift | $ | 656 | 13 | 12-31 | 07/10 | $ | 10.69 | $ | 73 | |||||||||||
| COBK | Colonial Financial Services of NJ | NASDAQ | Bridgeton, NJ | Thrift | $ | 604 | 9 | 12-31 | 07/10 | $ | 12.88 | $ | 51 | |||||||||||
| ALLB | Alliance Bancorp, Inc. of PA | NASDAQ | Broomall, PA | Thrift | $ | 470 | 9 | 12-31 | 01/11 | $ | 11.65 | $ | 64 | |||||||||||
| STND | Standard Financial Corp. of PA | NASDAQ | Monroeville, PA | Thrift | $ | 437 | 12 | 09-30 | 10/10 | $ | 16.75 | $ | 57 | |||||||||||
| NOTES: | (1) | Operating strategies are: Thrift=Traditional Thrift, M.B.=Mortgage Banker, R.E.=Real Estate Developer, Div.=Diversified and Ret.=Retail Banking. |
| (2) | Most recent quarter end available (E=Estimated and P=Pro Forma). | |
| Source: | SNL Financial, LC. | |
| RP® Financial, LC. | PEER GROUP ANALYSIS |
| III.4 |
| o | Cape Bancorp, Inc. of New Jersey. Selected due to similar interest-earning asset composition, similar concentration of mortgage-backed securities and 1-4 family loans comprising assets and lending diversification emphasis on commercial real estate loans. |
| o | Colonial Financial Services of New Jersey. Selected due to similar asset size, similar size of branch network, second-step conversion completed in July 2010, similar level of deposits funding assets, similar net interest income ratio as a percent of average assets, similar impact of loan loss provisions on earnings, limited earnings contribution from sources of non-interest operating income and lending diversification emphasis on commercial real estate loans. |
| o | ESSA Bancorp, Inc. of Pennsylvania. Selected due to relatively high equity-to-assets ratio, similar interest-earning asset composition, lending diversification emphasis on commercial real estate loans and similar ratio of non-performing assets as a percent of assets. |
| o | Fox Chase Bancorp, Inc. of Pennsylvania. Selected due to Philadelphia market area, completed second-step conversion in June 2010, relatively high equity-to-assets ratio, limited earnings contribution from sources of non-interest operating income, lending diversification emphasis on commercial real estate loans and similar ratio of non-performing assets as a percent of assets. |
| o | Ocean Shore Holding Co. of New Jersey. Selected due to completed second-step conversion in December 2009, similar interest-earning asset composition, similar interest-bearing liability composition, similar net interest income ratio as a percent of average assets and lending diversification emphasis on commercial real estate loans. |
| o | Oneida Financial Corp. of New York. Selected due to second-step conversion completed in July 2010, comparable asset size, similar level of deposits funding assets, similar net interest income ratio as a percent of average assets and lending diversification emphasis on commercial real estate loans. |
| o | Standard Financial Corp. of Pennsylvania. Selected due to relatively high equity-to-assets ratio, similar interest-earning asset composition, similar impact of loan loss provisions on earnings and lending diversification emphasis on commercial real estate loans. |
| o | TF Financial Corporation of Pennsylvania. Selected due to Philadelphia market area, similar asset size, similar interest-earning asset composition, similar interest-bearing liability composition, similar level of operating expenses as a percent of average assets, and lending diversification emphasis on commercial real estate loans. |
In aggregate, the Peer Group companies maintained a higher level of tangible equity than the industry average (13.1% of assets versus 12.1% for all public companies), generated higher core earnings as a percent of average assets (0.60% core ROAA versus 0.08% for all public companies), and earned a higher core ROE (4.53% core ROE versus 0.01% for all public companies). Overall, the Peer Group’s average P/TB ratio and average core P/E multiple were slightly below the respective averages for all publicly-traded thrifts.
| RP® Financial, LC. | PEER GROUP ANALYSIS |
| III.5 |
| All Publicly-Traded | Peer Group | ||||||
| Financial Characteristics (Averages) | |||||||
| Assets ($Mil) | $ | 2,753 | $ | 803 | |||
| Market capitalization ($Mil) | $ | 303 | $ | 87 | |||
| Tangible equity/assets (%) | 12.10 | % | 13.10 | % | |||
| Core return on average assets (%) | 0.08 | 0.60 | |||||
| Core return on average equity (%) | 0.01 | 4.53 | |||||
| Pricing Ratios (Averages)(1) | |||||||
| Core price/earnings (x) | 20.22x | 18.91x | |||||
| Price/tangible book (%) | 89.39 | % | 85.17 | % | |||
| Price/assets (%) | 10.09 | 11.02 | |||||
| (1) Based on market prices as of May 4, 2012. | |||||||
Ideally, the Peer Group companies would be comparable to Malvern Bancorp in terms of all of the selection criteria, but the universe of publicly-traded thrifts does not provide for an appropriate number of such companies. However, in general, the companies selected for the Peer Group were fairly comparable to Malvern Bancorp, as will be highlighted in the following comparative analysis.
Financial Condition
Table 3.2 shows comparative balance sheet measures for Malvern Bancorp and the Peer Group, reflecting the expected similarities and some differences given the selection procedures outlined above. The Company’s and the Peer Group’s ratios reflect balances as of March 31, 2012 and December 31, 2011, respectively, unless indicated otherwise for the Peer Group companies. Malvern Bancorp’s equity-to-assets ratio of 9.5% was less than the Peer Group’s average net worth ratio of 14.0%. However, the Company’s pro forma capital position will increase with the addition of stock proceeds, providing the Company with an equity-to-assets ratio that will be more comparable to the Peer Group’s ratio. Tangible equity-to-assets ratios for the Company and the Peer Group equaled 9.5% and 13.1%, respectively. The increase in Malvern Bancorp’s pro forma capital position will be favorable from a risk perspective and in terms of future earnings potential that could be realized through leverage and lower funding costs. At the same time, the Company’s higher pro forma capitalization will initially depress return on equity. Both Malvern Bancorp’s and the Peer Group’s capital ratios reflected capital surpluses with respect to the regulatory capital requirements. On a pro forma basis, the Company’s regulatory surpluses will become more significant.
| RP® Financial, LC. | PEER GROUP ANALYSIS |
| III.6 |
Table 3.2
Balance Sheet Composition and Growth Rates
Comparable Institution Analysis
As of December 31, 2011
| Balance Sheet as a Percent of Assets | ||||||||||||||||||||||
| Cash & Equivalents | MBS & Invest | BOLI | Loans | Deposits | Borrowed Funds | Subd. Debt | Net Worth | Goodwill & Intang | Tng Net Worth | |||||||||||||
| Malvern Bancorp, Inc. | ||||||||||||||||||||||
| March 31, 2012 | 9.0 | % | 13.4 | % | 2.3 | % | 71.7 | % | 82.4 | % | 7.5 | % | 0.0 | % | 9.5 | % | 0.0 | % | 9.5 | % | ||
| All Public Companies | ||||||||||||||||||||||
| Averages | 6.1 | % | 21.9 | % | 1.5 | % | 65.8 | % | 73.3 | % | 12.3 | % | 0.4 | % | 12.9 | % | 0.7 | % | 12.1 | % | ||
| Medians | 4.7 | % | 19.2 | % | 1.7 | % | 68.4 | % | 74.0 | % | 10.4 | % | 0.0 | % | 11.8 | % | 0.0 | % | 11.1 | % | ||
| State of PA | ||||||||||||||||||||||
| Averages | 6.0 | % | 30.3 | % | 1.5 | % | 58.3 | % | 71.0 | % | 14.5 | % | 0.4 | % | 13.0 | % | 0.8 | % | 12.2 | % | ||
| Medians | 4.1 | % | 27.0 | % | 1.6 | % | 63.8 | % | 70.8 | % | 12.4 | % | 0.0 | % | 12.6 | % | 0.3 | % | 11.6 | % | ||
| Comparable Group | ||||||||||||||||||||||
| Averages | 5.9 | % | 23.2 | % | 1.8 | % | 64.2 | % | 74.4 | % | 10.5 | % | 0.2 | % | 14.0 | % | 0.9 | % | 13.1 | % | ||
| Medians | 3.1 | % | 21.3 | % | 2.0 | % | 67.0 | % | 74.9 | % | 9.1 | % | 0.0 | % | 13.4 | % | 0.4 | % | 11.7 | % | ||
| Comparable Group | ||||||||||||||||||||||
| ALLB | Alliance Bancorp, Inc. of PA | 20.4 | % | 12.4 | % | 2.5 | % | 60.8 | % | 80.1 | % | 0.8 | % | 0.0 | % | 17.7 | % | 0.0 | % | 17.7 | % | |
| BFED | Beacon Federal Bancorp of NY | 4.3 | % | 16.0 | % | 1.1 | % | 75.4 | % | 66.3 | % | 22.3 | % | 0.0 | % | 10.9 | % | 0.0 | % | 10.9 | % | |
| CBNJ | Cape Bancorp, Inc. of NJ | 3.3 | % | 18.5 | % | 2.7 | % | 67.6 | % | 72.3 | % | 13.4 | % | 0.0 | % | 13.6 | % | 2.1 | % | 11.5 | % | |
| COBK | Colonial Financial Services of NJ | 1.3 | % | 44.4 | % | 1.8 | % | 49.3 | % | 86.2 | % | 1.7 | % | 0.0 | % | 11.9 | % | 0.0 | % | 11.9 | % | |
| ESSA | ESSA Bancorp, Inc. of PA | 2.6 | % | 24.7 | % | 2.1 | % | 67.6 | % | 58.4 | % | 25.8 | % | 0.0 | % | 14.7 | % | 0.2 | % | 14.6 | % | |
| FXCB | Fox Chase Bancorp, Inc. of PA | 0.7 | % | 29.3 | % | 1.3 | % | 66.0 | % | 66.6 | % | 14.4 | % | 0.0 | % | 18.5 | % | 0.0 | % | 18.5 | % | |
| OSHC | Ocean Shore Holding Co. of NJ | 15.6 | % | 5.9 | % | 1.9 | % | 73.1 | % | 75.6 | % | 11.1 | % | 1.6 | % | 10.5 | % | 0.6 | % | 9.9 | % | |
| ONFC | Oneida Financial Corp. of NY | 6.1 | % | 38.2 | % | 2.6 | % | 43.0 | % | 83.0 | % | 1.7 | % | 0.0 | % | 13.3 | % | 3.8 | % | 9.5 | % | |
| STND | Standard Financial Corp. of PA | 2.8 | % | 24.2 | % | 2.3 | % | 66.5 | % | 74.2 | % | 7.1 | % | 0.0 | % | 17.9 | % | 2.2 | % | 15.8 | % | |
| THRD | TF Financial Corp. of Newtown PA | 2.2 | % | 18.3 | % | 0.0 | % | 72.5 | % | 80.8 | % | 6.9 | % | 0.0 | % | 11.4 | % | 0.6 | % | 10.7 | % | |
| Balance Sheet Annual Growth Rates | Regulatory Capital | |||||||||||||||||||||
| Assets | MBS, Cash & Investments | Loans | Deposits | Borrows. &Subdebt | Net Worth | Tng Net Worth | Tangible | Core | Reg.Cap. | |||||||||||||
| Malvern Bancorp, Inc. | ||||||||||||||||||||||
| March 31, 2012 | -3.15 | % | 29.84 | % | -10.02 | % | -4.07 | % | -2.03 | % | 3.35 | % | 3.35 | % | 8.27 | % | 8.27 | % | 13.71 | % | ||
| All Public Companies | ||||||||||||||||||||||
| Averages | 3.41 | % | 10.75 | % | 1.77 | % | 3.53 | % | -8.96 | % | 3.11 | % | 2.70 | % | 11.75 | % | 11.75 | % | 20.48 | % | ||
| Medians | 1.37 | % | 6.01 | % | -0.33 | % | 2.02 | % | -8.33 | % | 2.49 | % | 2.45 | % | 11.46 | % | 11.46 | % | 18.37 | % | ||
| State of PA | ||||||||||||||||||||||
| Averages | -2.43 | % | -3.41 | % | -2.20 | % | -0.50 | % | -14.62 | % | 1.05 | % | 1.31 | % | 11.86 | % | 11.86 | % | 20.33 | % | ||
| Medians | -2.57 | % | -3.54 | % | -0.52 | % | -0.02 | % | -13.59 | % | 3.68 | % | 3.68 | % | 11.80 | % | 11.80 | % | 21.41 | % | ||
| Comparable Group | ||||||||||||||||||||||
| Averages | 1.89 | % | 8.46 | % | -0.31 | % | 3.65 | % | -11.02 | % | 2.37 | % | 2.05 | % | 11.27 | % | 11.27 | % | 18.31 | % | ||
| Medians | 1.15 | % | 5.87 | % | -0.52 | % | 1.02 | % | -13.59 | % | 3.28 | % | 2.63 | % | 10.32 | % | 10.32 | % | 18.23 | % | ||
| Comparable Group | ||||||||||||||||||||||
| ALLB | Alliance Bancorp, Inc. of PA | 3.30 | % | 8.82 | % | -0.27 | % | -2.22 | % | -47.48 | % | NM | NM | NA | NA | NA | ||||||
| BFED | Beacon Federal Bancorp of NY | -0.55 | % | 6.70 | % | -2.58 | % | 0.51 | % | -4.97 | % | 2.15 | % | 2.15 | % | 10.32 | % | 10.32 | % | 14.53 | % | |
| CBNJ | Cape Bancorp, Inc. of NJ | 0.95 | % | 22.61 | % | -6.40 | % | 2.83 | % | -15.10 | % | 10.26 | % | 12.53 | % | 9.48 | % | 9.48 | % | 14.11 | % | |
| COBK | Colonial Financial Services of NJ | 2.28 | % | 14.10 | % | -7.20 | % | 1.53 | % | 43.50 | % | 3.27 | % | 3.27 | % | 10.82 | % | 10.82 | % | 19.99 | % | |
| ESSA | ESSA Bancorp, Inc. of PA | 1.48 | % | 4.14 | % | -0.77 | % | 10.16 | % | -12.12 | % | -2.79 | % | -3.87 | % | NA | NA | NA | ||||
| FXCB | Fox Chase Bancorp, Inc. of PA | -7.27 | % | -25.73 | % | 4.34 | % | -4.94 | % | -15.06 | % | -8.51 | % | -8.51 | % | 15.57 | % | 15.57 | % | 24.71 | % | |
| OSHC | Ocean Shore Holding Co. of NJ | 18.44 | % | 52.51 | % | 10.19 | % | 24.72 | % | 0.00 | % | 4.10 | % | -1.82 | % | NA | NA | NA | ||||
| ONFC | Oneida Financial Corp. of NY | 0.32 | % | -0.33 | % | 0.77 | % | -0.28 | % | -8.33 | % | 2.38 | % | 2.63 | % | NA | NA | NA | ||||
| STND | Standard Financial Corp. of PA | 1.34 | % | 5.03 | % | 0.19 | % | 3.93 | % | -26.28 | % | 5.00 | % | 5.99 | % | NA | NA | NA | ||||
| THRD | TF Financial Corp. of Newtown PA | -1.42 | % | -3.22 | % | -1.40 | % | 0.21 | % | -24.33 | % | 5.44 | % | 6.11 | % | 10.14 | % | 10.14 | % | 18.23 | % | |
| Source: | SNL Financial, LC. and RP® Financial, LC. calculations. The information provided in this table has been obtained from sources we believe are reliable, but we cannot guarantee the accuracy or completeness of such information. |
| Copyright (c) 2012 by RP® Financial, LC. | |
| RP® Financial, LC. | PEER GROUP ANALYSIS |
| III.7 |
The interest-earning asset compositions for the Company and the Peer Group were somewhat similar, with loans constituting the bulk of interest-earning assets for both Malvern Bancorp and the Peer Group. The Company’s loans-to-assets ratio of 71.7% was higher than the comparable Peer Group ratio of 64.2%. Comparatively, the Company’s cash and investments-to-assets ratio of 22.4% was lower than the comparable Peer Group ratio of 29.1%. Overall, Malvern Bancorp’s interest-earning assets amounted to 94.1% of assets, which was slightly above the comparable Peer Group ratio of 93.3%. The Peer Group’s non-interest earning assets included bank-owned life insurance (“BOLI”) equal to 1.8% of assets and goodwill/intangibles equal to 0.9% of assets, while the Company maintained BOLI equal to 2.3% of assets and a zero balance of goodwill/intangibles.
Malvern Bancorp’s funding liabilities reflected a funding strategy that was somewhat similar to that of the Peer Group’s funding composition. The Company’s deposits equaled 82.4% of assets, which was above the Peer Group’s ratio of 74.4%. Comparatively, the Company maintained a slightly lower level of borrowings than the Peer Group, as indicated by borrowings-to-assets ratios of 7.5% and 10.7% for Malvern Bancorp and the Peer Group, respectively. Total interest-bearing liabilities maintained by the Company and the Peer Group, as a percent of assets, equaled 89.9% and 85.1%, respectively, with the Peer Group’s lower ratio supported by maintenance of a higher capital position.
A key measure of balance sheet strength for a thrift institution is its IEA/IBL ratio. Presently, the Company’s IEA/IBL ratio is lower than the Peer Group’s ratio, based on IEA/IBL ratios of 104.7% and 109.6%, respectively. The additional capital realized from stock proceeds should serve to provide Malvern Bancorp with an IEA/IBL ratio that is more comparable to the Peer Group’s ratio, as the increase in capital provided by the infusion of stock proceeds will serve to lower the level of interest-bearing liabilities funding assets and will be primarily deployed into interest-earning assets.
The growth rate section of Table 3.2 shows annual growth rates for key balance sheet items. Malvern Bancorp’s growth rates are based on annual growth for the twelve months ended March 31, 2012, while the Peer Group’s growth rates are based on annual growth for the twelve months December 31, 2011 or the most recent twelve month period available. Malvern Bancorp recorded a 3.2% decrease in assets, versus asset growth of 1.9% recorded by the Peer Group. Asset shrinkage for the Company was driven by a 10.0% decline in loans, which was partially offset by a 29.8% increase in cash and investments. Asset growth for the Peer
| RP® Financial, LC. | PEER GROUP ANALYSIS |
| III.8 |
Group was sustained by an 8.5% increase in cash and investments, which was partially offset by a 0.3% decline in loans.
Asset shrinkage funded reductions in the Company’s deposits and borrowings of 4.1% and 2.0%, respectively. Asset growth for the Peer Group was funded by a 3.7% increase in borrowings, which funded an 11.0% reduction in borrowings as well. The Company’s capital increased by 3.4% during the twelve month period, versus a 2.4% capital growth rate posted by the Peer Group. The Peer Group’s slightly lower capital growth rate was in part related to the higher level of capital maintained by the Peer Group, as well as retention of earnings being somewhat offset by capital management strategies such as dividend payments and the retention of earnings. The Company’s post-conversion capital growth rate will initially be constrained by maintenance of a higher pro forma capital position.
Income and Expense Components
Table 3.3 displays statements of operations for the Company and the Peer Group. The Company’s and the Peer Group’s ratios are based on earnings for the twelve months ended March 31, 2012 and December 31, 2011, respectively, unless otherwise indicated for the Peer Group companies. Malvern Bancorp and the Peer Group reported net income to average assets of 0.12% and 0.58%, respectively. The Company’s lower return was attributable to earnings advantages maintained by the Peer Group with respect to higher ratios for net interest income and non-interest operating income and a lower ratio of operating expenses, which were partially offset by the Company’s lower ratio of loan loss provisions, higher ratio for net gains and lower effective tax rate.
The Peer Group’s slightly higher net interest income ratio was primarily realized through a lower interest expense ratio and, to a lesser extent, a slightly higher interest income ratio. The Peer Group’s lower interest expense ratio was supported by maintaining a lower cost of funds (1.41% versus 1.67% for the Company) and by maintenance of a lower level of interest-bearing liabilities funding assets. Comparatively, similar yields earned on interest-earning assets (4.55% for the Company versus for 4.50% for the Peer Group) and similar concentrations of assets maintained in interest-earning assets translated into comparable interest income ratios for the Company and the Peer Group. Overall, Malvern Bancorp and the Peer Group reported net interest income to average assets ratios of 2.82% and 3.02%, respectively.
| RP® Financial, LC. | PEER GROUP ANALYSIS |
| III.9 |
Table 3.3
Income as Percent of Average Assets and Yields, Costs, Spreads
Comparable Institution Analysis
For the 12 Months Ended December 31, 2011
| Net Interest Income | Other Income | |||||||||||||||||||||
| Net Income | Income | Expense | NII | Loss Provis. on IEA | NII After Provis. | Loan Fees | R.E. Oper. | Other Income | Total Other Income | |||||||||||||
| Malvern Bancorp, Inc. | ||||||||||||||||||||||
| March 31, 2012 | 0.12 | % | 4.20 | % | 1.38 | % | 2.82 | % | 0.36 | % | 2.46 | % | 0.00 | % | 0.00 | % | 0.31 | % | 0.31 | % | ||
| All Public Companies | ||||||||||||||||||||||
| Averages | 0.16 | % | 4.40 | % | 1.24 | % | 3.16 | % | 0.59 | % | 2.57 | % | 0.02 | % | -0.11 | % | 0.80 | % | 0.71 | % | ||
| Medians | 0.41 | % | 4.31 | % | 1.14 | % | 3.11 | % | 0.31 | % | 2.64 | % | 0.00 | % | -0.02 | % | 0.60 | % | 0.55 | % | ||
| State of PA | ||||||||||||||||||||||
| Averages | 0.41 | % | 4.16 | % | 1.34 | % | 2.82 | % | 0.47 | % | 2.36 | % | 0.01 | % | -0.05 | % | 0.50 | % | 0.47 | % | ||
| Medians | 0.47 | % | 4.21 | % | 1.35 | % | 2.93 | % | 0.39 | % | 2.37 | % | 0.00 | % | -0.01 | % | 0.46 | % | 0.46 | % | ||
| Comparable Group | ||||||||||||||||||||||
| Averages | 0.58 | % | 4.23 | % | 1.21 | % | 3.02 | % | 0.57 | % | 2.46 | % | 0.01 | % | -0.04 | % | 0.85 | % | 0.82 | % | ||
| Medians | 0.55 | % | 4.21 | % | 1.14 | % | 3.01 | % | 0.45 | % | 2.50 | % | 0.00 | % | 0.00 | % | 0.48 | % | 0.49 | % | ||
| Comparable Group | ||||||||||||||||||||||
| ALLB | Alliance Bancorp, Inc. of PA | 0.25 | % | 4.02 | % | 0.88 | % | 3.14 | % | 0.70 | % | 2.44 | % | 0.00 | % | 0.00 | % | 0.16 | % | 0.16 | % | |
| BFED | Beacon Federal Bancorp of NY | 0.55 | % | 4.78 | % | 1.79 | % | 2.99 | % | 0.97 | % | 2.02 | % | 0.00 | % | 0.00 | % | 0.96 | % | 0.96 | % | |
| CBNJ | Cape Bancorp, Inc. of NJ | 0.75 | % | 4.35 | % | 1.09 | % | 3.26 | % | 1.84 | % | 1.43 | % | 0.00 | % | -0.25 | % | 1.16 | % | 0.90 | % | |
| COBK | Colonial Financial Services of NJ | 0.55 | % | 4.03 | % | 1.20 | % | 2.83 | % | 0.31 | % | 2.52 | % | 0.00 | % | 0.00 | % | 0.26 | % | 0.26 | % | |
| ESSA | ESSA Bancorp, Inc. of PA | 0.47 | % | 4.24 | % | 1.63 | % | 2.60 | % | 0.19 | % | 2.41 | % | 0.06 | % | 0.00 | % | 0.48 | % | 0.54 | % | |
| FXCB | Fox Chase Bancorp, Inc. of PA | 0.46 | % | 4.43 | % | 1.40 | % | 3.03 | % | 0.55 | % | 2.48 | % | 0.00 | % | -0.05 | % | 0.33 | % | 0.29 | % | |
| OSHC | Ocean Shore Holding Co. of NJ | 0.55 | % | 4.16 | % | 1.33 | % | 2.83 | % | 0.05 | % | 2.78 | % | 0.00 | % | 0.00 | % | 0.48 | % | 0.48 | % | |
| ONFC | Oneida Financial Corp. of NY | 0.90 | % | 3.60 | % | 0.61 | % | 2.99 | % | 0.16 | % | 2.83 | % | 0.06 | % | -0.02 | % | 3.67 | % | 3.70 | % | |
| STND | Standard Financial Corp. of PA | 0.74 | % | 4.18 | % | 1.08 | % | 3.10 | % | 0.36 | % | 2.74 | % | 0.02 | % | 0.00 | % | 0.48 | % | 0.50 | % | |
| THRD | TF Financial Corp. of Newtown PA | 0.57 | % | 4.54 | % | 1.08 | % | 3.46 | % | 0.54 | % | 2.92 | % | 0.00 | % | -0.08 | % | 0.50 | % | 0.42 | % | |
| G&A/Other Exp. | Non-Op. Items | Yields, Costs, and Spreads | |||||||||||||||||||
| G&A Expense | Goodwill Amort. | Net Gains | Extrao. Items | Yield On Assets | Cost Of Funds | Yld-Cost Spread | MEMO: Assets/ FTE Emp. | MEMO: Effective Tax Rate | |||||||||||||
| Malvern Bancorp, Inc. | |||||||||||||||||||||
| March 31, 2012 | 2.75 | % | 0.00 | % | 0.09 | % | 0.00 | % | 4.55 | % | 1.67 | % | 2.88 | % | $ | 6,859 | 1.52 | % | |||
| All Public Companies | |||||||||||||||||||||
| Averages | 3.00 | % | 0.04 | % | 0.13 | % | 0.00 | % | 4.58 | % | 1.39 | % | 3.20 | % | $ | 5,929 | 30.77 | % | |||
| Medians | 2.86 | % | 0.00 | % | 0.05 | % | 0.00 | % | 4.56 | % | 1.36 | % | 3.20 | % | $ | 5,103 | 30.95 | % | |||
| State of PA | |||||||||||||||||||||
| Averages | 2.31 | % | 0.01 | % | 0.02 | % | 0.00 | % | 4.39 | % | 1.54 | % | 2.85 | % | $ | 5,795 | 28.07 | % | |||
| Medians | 2.28 | % | 0.00 | % | 0.03 | % | 0.00 | % | 4.46 | % | 1.53 | % | 2.91 | % | $ | 5,732 | 30.63 | % | |||
| Comparable Group | |||||||||||||||||||||
| Averages | 2.67 | % | 0.01 | % | -0.03 | % | 0.00 | % | 4.50 | % | 1.41 | % | 3.09 | % | $ | 5,315 | 31.46 | % | |||
| Medians | 2.26 | % | 0.00 | % | 0.03 | % | 0.00 | % | 4.46 | % | 1.34 | % | 3.06 | % | $ | 5,488 | 28.45 | % | |||
| Comparable Group | |||||||||||||||||||||
| ALLB | Alliance Bancorp, Inc. of PA | 2.36 | % | 0.00 | % | -0.01 | % | 0.00 | % | 4.29 | % | 1.08 | % | 3.21 | % | $ | 5,103 | NM | |||
| BFED | Beacon Federal Bancorp of NY | 2.14 | % | 0.00 | % | -0.34 | % | 0.00 | % | 4.98 | % | 2.02 | % | 2.96 | % | $ | 7,495 | 55.78 | % | ||
| CBNJ | Cape Bancorp, Inc. of NJ | 3.16 | % | 0.01 | % | -0.30 | % | 0.00 | % | 4.82 | % | 1.26 | % | 3.56 | % | $ | 5,608 | NM | |||
| COBK | Colonial Financial Services of NJ | 2.07 | % | 0.00 | % | 0.04 | % | 0.00 | % | 4.23 | % | 1.36 | % | 2.87 | % | $ | 5,920 | 26.28 | % | ||
| ESSA | ESSA Bancorp, Inc. of PA | 2.35 | % | 0.02 | % | 0.06 | % | 0.00 | % | 4.45 | % | 1.95 | % | 2.50 | % | $ | 5,569 | 24.48 | % | ||
| FXCB | Fox Chase Bancorp, Inc. of PA | 2.16 | % | 0.00 | % | 0.07 | % | 0.00 | % | 4.51 | % | 1.70 | % | 2.81 | % | $ | 7,470 | 31.64 | % | ||
| OSHC | Ocean Shore Holding Co. of NJ | 2.14 | % | 0.00 | % | -0.09 | % | 0.00 | % | 4.36 | % | 1.52 | % | 2.84 | % | $ | 5,406 | 37.51 | % | ||
| ONFC | Oneida Financial Corp. of NY | 5.38 | % | 0.05 | % | 0.08 | % | 0.00 | % | 4.06 | % | 0.71 | % | 3.35 | % | $ | 2,011 | 24.80 | % | ||
| STND | Standard Financial Corp. of PA | 2.16 | % | 0.04 | % | 0.03 | % | 0.00 | % | 4.47 | % | 1.33 | % | 3.15 | % | $ | 4,555 | 30.63 | % | ||
| THRD | TF Financial Corp. of Newtown PA | 2.81 | % | 0.00 | % | 0.19 | % | 0.00 | % | 4.87 | % | 1.22 | % | 3.65 | % | $ | 4,011 | 20.59 | % | ||
| Source: | SNL Financial, LC. and RP® Financial, LC. calculations. The information provided in this table has been obtained from sources we believe are reliable, but we cannot guarantee the accuracy or completeness of such information. |
| Copyright (c) 2012 by RP® Financial, LC. | |
| RP® Financial, LC. | PEER GROUP ANALYSIS III.10 |
In another key area of core earnings strength, the Company maintained similar operating expense ratios. For the periods covered in Table 3.3, the Company and the Peer Group reported operating expense to average assets ratios of 2.75% and 2.68%, respectively. Assets per full time equivalent employee were higher for the Company ($6.9 million versus $5.3 million for the Peer Group), which would tend to facilitate a lower operating expense for the Company. However, in recent years, the Company has incurred additional operating expenses related to holding and working out of problem assets and addressing regulatory issues.
When viewed together, net interest income and operating expenses provide considerable insight into a thrift’s earnings strength, since those sources of income and expenses are typically the most prominent components of earnings and are generally more predictable than losses and gains realized from the sale of assets or other non-recurring activities. In this regard, as measured by their expense coverage ratios (net interest income divided by operating expenses), the Peer Group’s earnings were more favorable than the Company’s. Expense coverage ratios for Malvern Bancorp and the Peer Group equaled 1.03x and 1.13x, respectively.
Sources of non-interest operating income provided a larger contribution to the Peer Group’s earnings, with such income amounting to 0.31% and 0.82% of Malvern Bancorp’s and the Peer Group’s average assets, respectively. The Company’s relatively low earnings contribution realized from non-interest operating income is indicative of its limited diversification into areas that generate revenues from non-interest sources. Taking non-interest operating income into account in comparing the Company’s and the Peer Group’s earnings, Malvern Bancorp’s efficiency ratio (operating expenses, net of amortization of intangibles, as a percent of the sum of non-interest operating income and net interest income) of 87.9% was less favorable than the Peer Group’s efficiency ratio of 69.5%.
Loan loss provisions had a less significant impact on the Company’s earnings, with loan loss provisions established by the Company and the Peer Group equaling 0.36% and 0.57% of average assets, respectively.
Net gains realized from the sale of assets had a slightly larger impact on the Company’s earnings, as the Company reported net gains equal to 0.09% of average assets compared to a net loss equal to 0.03% of average assets for the Peer Group. Typically, gains and losses generated are viewed as earnings with a relatively high degree of volatility, particularly to the extent that such gains and losses result from the sale of investments or other assets that are not considered to be part of an institution’s core operations. Comparatively, to the extent that gains
| RP® Financial, LC. | PEER GROUP ANALYSIS III.11 |
have been derived through selling fixed rate loans into the secondary market, such gains may be considered to be an ongoing activity for an institution and, therefore, warrant some consideration as a core earnings factor. However, loan sale gains are still viewed as a more volatile source of income than income generated through the net interest margin and non-interest operating income. Gains on the sale of investment securities accounted for most of the gains reported by the Company. Extraordinary items were not a factor in either the Company’s or the Peer Group’s earnings.
Taxes had a less significant impact on the Company’s earnings, as Malvern Bancorp and the Peer Group posted effective tax rates of 1.52% and 31.46%, respectively. As indicated in the prospectus, the Company’s effective marginal tax rate is equal to 40.0%.
Loan Composition
Table 3.4 presents data related to the Company’s and the Peer Group’s loan portfolio compositions (including the investment in mortgage-backed securities). The Company’s loan portfolio composition reflected a lower concentration of 1-4 family permanent mortgage loans and mortgage-backed securities than maintained by the Peer Group (41.1% of assets versus 51.3% for the Peer Group). The Company’s lower ratio was attributable to maintaining lower concentrations of both 1-4 family permanent mortgage loans and mortgage-backed securities. Loans serviced for others equaled 4.4% and 5.6% of the Company’s and the Peer Group’s assets, respectively, thereby indicating a slightly greater influence of loan servicing income on the Peer Group’s earnings. Both the Company and the Peer Group maintained relatively modest balances of loan servicing intangibles.
Diversification into higher risk and higher yielding types of lending was more significant for the Company compared to the Peer Group’s lending diversification, which was largely related to the higher concentration of consumer loans that was maintained by the Company. Commercial real estate/multi-family loans represented the most significant area of lending diversification for the Company (19.6% of assets), followed by consumer loans (14.4% of assets). Likewise, the Peer Group’s lending diversification consisted primarily of commercial real estate/multi-family loans (18.1% of assets), while commercial business loans constituted the second largest area of lending diversification for the Peer Group (3.8% of assets). Other areas of lending diversification for the Peer Group included construction/land loans (1.7% of assets) and consumer loans (2.5% of assets). Lending diversification for the Company also
| RP® Financial, LC. | PEER GROUP ANALYSIS III.12 |
Table 3.4
Loan Portfolio Composition and Related Information
Comparable Institution Analysis
As of December 31, 2011
| Portfolio Composition as a Percent of Assets | ||||||||||||||||||||||||||||||||
| Institution | MBS | 1-4 Family | Constr. & Land | 5+Unit Comm RE | Commerc. Business | Consumer | RWA/ Assets | Serviced For Others | Servicing Assets | |||||||||||||||||||||||
| (%) | (%) | (%) | (%) | (%) | (%) | (%) | ($000) | ($000) | ||||||||||||||||||||||||
| Malvern Bancorp, Inc. | 7.34 | % | 33.80 | % | 3.45 | % | 19.56 | % | 1.34 | % | 14.38 | % | 66.03 | % | $ | 31,000 | $ | 143 | ||||||||||||||
| All Public Companies | ||||||||||||||||||||||||||||||||
| Averages | 14.29 | % | 34.00 | % | 3.32 | % | 24.18 | % | 4.36 | % | 1.75 | % | 62.40 | % | $ | 862,371 | $ | 7,172 | ||||||||||||||
| Medians | 11.90 | % | 34.06 | % | 2.43 | % | 23.21 | % | 3.09 | % | 0.43 | % | 61.45 | % | $ | 9,085 | $ | 99 | ||||||||||||||
| State of PA | ||||||||||||||||||||||||||||||||
| Averages | 17.86 | % | 37.11 | % | 2.48 | % | 14.56 | % | 2.39 | % | 1.48 | % | 57.96 | % | $ | 99,975 | $ | 428 | ||||||||||||||
| Medians | 18.57 | % | 42.48 | % | 2.45 | % | 15.33 | % | 1.48 | % | 0.45 | % | 59.70 | % | $ | 625 | $ | 34 | ||||||||||||||
| Comparable Group | ||||||||||||||||||||||||||||||||
| Averages | 13.20 | % | 38.09 | % | 1.66 | % | 18.05 | % | 3.77 | % | 2.45 | % | 60.27 | % | $ | 44,785 | $ | 288 | ||||||||||||||
| Medians | 12.90 | % | 30.87 | % | 1.72 | % | 16.98 | % | 3.00 | % | 0.42 | % | 59.99 | % | $ | 9,215 | $ | 121 | ||||||||||||||
| Comparable Group | ||||||||||||||||||||||||||||||||
| ALLB | Alliance Bancorp, Inc. of PA | 2.19 | % | 25.41 | % | 2.43 | % | 28.80 | % | 1.96 | % | 1.34 | % | 60.56 | % | $ | 0 | $ | 0 | |||||||||||||
| BFED | Beacon Federal Bancorp of NY | 16.75 | % | 31.44 | % | 2.20 | % | 18.57 | % | 6.16 | % | 15.86 | % | 76.48 | % | $ | 136,430 | $ | 938 | |||||||||||||
| CBNJ | Cape Bancorp, Inc. of NJ | 9.36 | % | 30.30 | % | 1.42 | % | 31.75 | % | 4.80 | % | 0.11 | % | 70.13 | % | $ | 2,670 | $ | 5 | |||||||||||||
| COBK | Colonial Financial Services of NJ | 17.31 | % | 27.95 | % | 2.20 | % | 15.39 | % | 3.47 | % | 0.20 | % | 55.53 | % | $ | 0 | $ | 0 | |||||||||||||
| ESSA | ESSA Bancorp, Inc. of PA | 19.18 | % | 58.13 | % | 0.59 | % | 6.02 | % | 0.78 | % | 0.15 | % | 51.88 | % | $ | 0 | $ | 186 | |||||||||||||
| FXCB | Fox Chase Bancorp, Inc. of PA | 28.88 | % | 25.79 | % | 1.32 | % | 27.12 | % | 11.04 | % | 0.83 | % | 64.87 | % | $ | 46,720 | $ | 287 | |||||||||||||
| OSHC | Ocean Shore Holding Co. of NJ | 3.16 | % | 61.41 | % | 1.99 | % | 7.99 | % | 0.75 | % | 0.08 | % | 43.93 | % | $ | 0 | $ | 12 | |||||||||||||
| ONFC | Oneida Financial Corp. of NY | 15.66 | % | 20.77 | % | 0.64 | % | 11.89 | % | 5.54 | % | 5.11 | % | 59.70 | % | $ | 131,460 | $ | 531 | |||||||||||||
| STND | Standard Financial Corp. of PA | 10.15 | % | 48.91 | % | 1.45 | % | 14.07 | % | 2.53 | % | 0.52 | % | 59.32 | % | $ | 15,760 | $ | 55 | |||||||||||||
| THRD | TF Financial Corp. of Newtown PA | 9.38 | % | 50.83 | % | 2.34 | % | 18.87 | % | 0.68 | % | 0.31 | % | 60.28 | % | $ | 114,810 | $ | 870 | |||||||||||||
| Source: | SNL Financial LC. and RP® Financial, LC. calculations. The information provided in this table has been obtained from sources we believe are reliable, but we cannot guarantee the accuracy or completeness of such information. |
| Copyright (c) 2012 by RP® Financial, LC. | |
| RP® Financial, LC. | PEER GROUP ANALYSIS III.13 |
included construction/land loans (3.5% of assets) and commercial business loans (1.3% of assets). Overall, the composition of the Company’s assets provided for a slightly higher risk weighted assets-to-assets ratio compared to the Peer Group’s ratio (66.03% versus 60.27% for the Peer Group).
Interest Rate Risk
Table 3.5 reflects various key ratios highlighting the relative interest rate risk exposure of the Company versus the Peer Group. In terms of balance sheet composition, Malvern Bancorp’s interest rate risk characteristics were considered to be less favorable relative to the comparable measures for the Peer Group. Most notably, the Company’s tangible equity-to-assets ratio and IEA/IBL ratio were below the comparable Peer Group ratios. Comparatively, on the positive side for the Company, the Company’s level of non-interest earning assets was slightly lower than the comparable Peer Group ratio. On a pro forma basis, the infusion of stock proceeds should serve to provide the Company with more comparable balance sheet measures for interest rate risk as currently maintained by the Peer Group, given the increases that will be realized in Company’s equity-to-assets and IEA/IBL ratios.
To analyze interest rate risk associated with the net interest margin, we reviewed quarterly changes in net interest income as a percent of average assets for Malvern Bancorp and the Peer Group. In general, the comparative fluctuations in the Company’s and the Peer Group’s ratios implied that the interest rate risk associated with the Company’s net interest income was greater compared to the Peer Group’s, based on the interest rate environment that prevailed during the period covered in Table 3.5. The stability of the Company’s net interest margin should be enhanced by the infusion of stock proceeds, as interest rate sensitive liabilities will be funding a lower portion of Malvern Bancorp’s assets and the proceeds will be substantially deployed into interest-earning assets.
Credit Risk
Overall, based on a comparison of credit quality measures, the Company’s credit risk exposure was considered to be slightly less than Peer Group’s. As shown in Table 3.6, the Company’s non-performing assets/assets and non-performing loans/loans ratios equaled 2.53% and 2.51%, respectively, versus comparable measures of 2.86% and 3.52% for the Peer Group. The Company’s and Peer Group’s loss reserves as a percent of non-performing loans equaled
| RP® Financial, LC. | PEER GROUP ANALYSIS III.14 |
Table 3.5
Interest Rate Risk Measures and Net Interest Income Volatility
Comparable Institution Analysis
As of December 31, 2011 or Most Recent Date Available
| Balance Sheet Measures | Quarterly Change in Net Interest Income | |||||||||||||||||||||||||||||
| Equity/ Assets | IEA/ IBL | Non-Earn. Assets/ Assets | ||||||||||||||||||||||||||||
| Institution | 12/31/2011 | 9/30/2011 | 6/30/2011 | 3/31/2011 | 12/31/2010 | 9/30/2010 | ||||||||||||||||||||||||
| (%) | (%) | (%) | (change in net interest income is annualized in basis points) | |||||||||||||||||||||||||||
| Malvern Bancorp, Inc. | 9.5 | % | 104.7 | % | 5.9 | % | -12 | -10 | 9 | 16 | -7 | -9 | ||||||||||||||||||
| All Public Companies | 12.0 | % | 108.5 | % | 6.1 | % | -1 | -1 | 4 | 0 | 1 | 1 | ||||||||||||||||||
| State of PA | 12.2 | % | 110.2 | % | 5.5 | % | -5 | -1 | 8 | 8 | 6 | 4 | ||||||||||||||||||
| Comparable Group | ||||||||||||||||||||||||||||||
| Averages | 13.1 | % | 109.9 | % | 6.7 | % | -9 | 2 | 2 | 3 | 2 | 5 | ||||||||||||||||||
| Medians | 11.7 | % | 108.0 | % | 5.9 | % | -11 | 2 | 3 | 3 | -1 | 3 | ||||||||||||||||||
| Comparable Group | ||||||||||||||||||||||||||||||
| ALLB | Alliance Bancorp, Inc. of PA | 17.7 | % | 115.7 | % | 6.4 | % | -11 | 7 | -1 | 1 | -9 | 29 | |||||||||||||||||
| BFED | Beacon Federal Bancorp of NY | 10.9 | % | 108.0 | % | 4.3 | % | -22 | -8 | 8 | -2 | 6 | 9 | |||||||||||||||||
| CBNJ | Cape Bancorp, Inc. of NJ | 11.5 | % | 104.3 | % | 10.6 | % | -7 | 2 | -20 | 4 | -4 | 3 | |||||||||||||||||
| COBK | Colonial Financial Services of NJ | 11.9 | % | 108.0 | % | 5.1 | % | -26 | 27 | -5 | -4 | -7 | -8 | |||||||||||||||||
| ESSA | ESSA Bancorp, Inc. of PA | 14.6 | % | 112.8 | % | 5.0 | % | -12 | -11 | -2 | 5 | 11 | 4 | |||||||||||||||||
| FXCB | Fox Chase Bancorp, Inc. of PA | 18.5 | % | 118.5 | % | 3.9 | % | 8 | 16 | 7 | 15 | 30 | 21 | |||||||||||||||||
| OSHC | Ocean Shore Holding Co. of NJ | 9.9 | % | 107.3 | % | 5.3 | % | -11 | 2 | 5 | -1 | -8 | -13 | |||||||||||||||||
| ONFC | Oneida Financial Corp. of NY | 9.5 | % | 103.2 | % | 12.6 | % | -11 | 3 | 11 | -2 | -4 | 3 | |||||||||||||||||
| STND | Standard Financial Corp. of PA | 15.8 | % | 115.1 | % | 6.5 | % | 0 | -12 | 1 | 9 | 4 | -6 | |||||||||||||||||
| THRD | TF Financial Corp. of Newtown PA | 10.7 | % | 106.0 | % | 7.0 | % | 6 | -2 | 10 | 7 | 2 | 3 | |||||||||||||||||
| NA=Change is greater than 100 basis points during the quarter. | |
| Source: | SNL Financial LC. and RP® Financial, LC. calculations. The information provided in this table has been obtained from sources we believe are reliable, but we cannot guarantee the accuracy or completeness of such information. |
| Copyright (c) 2012 by RP® Financial, LC. | |
| RP® Financial, LC. | PEER GROUP ANALYSIS III.15 |
Table 3.6
Credit Risk Measures and Related Information
Comparable Institution Analysis
As of December 31, 2011 or Most Recent Date Available
| Institution | REO/ Assets | NPAs & 90+Del/ Assets | NPLs/ Loans | Rsrves/ Loans | Rsrves/ NPLs | Rsrves/ NPAs & 90+Del | Net Loan Chargoffs | NLCs/ Loans | |||||||||||||||||||
| (%) | (%) | (%) | (%) | (%) | (%) | ($000) | (%) | ||||||||||||||||||||
| Malvern Bancorp, Inc. | 0.73 | % | 2.53 | % | 2.51 | % | 1.73 | % | 68.85 | % | 49.03 | % | $ | 4,665 | 1.00 | % | |||||||||||
| All Public Companies | |||||||||||||||||||||||||||
| Averages | 0.50 | % | 3.57 | % | 4.39 | % | 1.58 | % | 53.56 | % | 47.44 | % | $ | 1,553 | 0.76 | % | |||||||||||
| Medians | 0.18 | % | 2.45 | % | 3.31 | % | 1.39 | % | 40.77 | % | 35.66 | % | $ | 572 | 0.26 | % | |||||||||||
| State of PA | |||||||||||||||||||||||||||
| Averages | 0.41 | % | 2.26 | % | 3.09 | % | 1.41 | % | 54.17 | % | 45.09 | % | $ | 1,396 | 0.46 | % | |||||||||||
| Medians | 0.27 | % | 2.63 | % | 2.90 | % | 1.38 | % | 44.23 | % | 34.68 | % | $ | 721 | 0.29 | % | |||||||||||
| Comparable Group | |||||||||||||||||||||||||||
| Averages | 0.52 | % | 2.86 | % | 3.52 | % | 1.43 | % | 63.69 | % | 43.12 | % | $ | 955 | 0.58 | % | |||||||||||
| Medians | 0.35 | % | 3.47 | % | 3.52 | % | 1.40 | % | 42.46 | % | 34.03 | % | $ | 721 | 0.52 | % | |||||||||||
| Comparable Group | |||||||||||||||||||||||||||
| ALLB | Alliance Bancorp, Inc. of PA | 1.43 | % | 3.71 | % | 4.20 | % | 1.35 | % | 33.33 | % | 23.76 | % | $ | 425 | 0.60 | % | ||||||||||
| BFED | Beacon Federal Bancorp of NY | 0.19 | % | 4.44 | % | 5.50 | % | 2.41 | % | 43.88 | % | 42.01 | % | $ | 2,896 | 1.42 | % | ||||||||||
| CBNJ | Cape Bancorp, Inc. of NJ | 0.75 | % | 3.99 | % | 4.45 | % | 1.69 | % | 37.89 | % | 29.27 | % | $ | 965 | 0.53 | % | ||||||||||
| COBK | Colonial Financial Services of NJ | 0.51 | % | 4.81 | % | 8.57 | % | 1.66 | % | 19.39 | % | 17.32 | % | $ | 73 | 0.10 | % | ||||||||||
| ESSA | ESSA Bancorp, Inc. of PA | 0.17 | % | 2.15 | % | 2.84 | % | 1.08 | % | 38.54 | % | 34.68 | % | $ | 945 | 0.50 | % | ||||||||||
| FXCB | Fox Chase Bancorp, Inc. of PA | 0.64 | % | 3.37 | % | 4.19 | % | 1.72 | % | 41.03 | % | 33.22 | % | $ | 2,052 | 1.22 | % | ||||||||||
| OSHC | Ocean Shore Holding Co. of NJ | 0.02 | % | 0.54 | % | 0.70 | % | 0.54 | % | 79.21 | % | 74.71 | % | $ | 40 | 0.02 | % | ||||||||||
| ONFC | Oneida Financial Corp. of NY | 0.00 | % | 0.78 | % | 0.59 | % | 1.04 | % | 181.35 | % | 58.69 | % | $ | 43 | 0.06 | % | ||||||||||
| STND | Standard Financial Corp. of PA | 0.00 | % | 1.24 | % | 1.60 | % | NA | 97.73 | % | 84.21 | % | $ | 496 | 0.00 | % | |||||||||||
| THRD | TF Financial Corp. of Newtown PA | 1.48 | % | 3.56 | % | 2.54 | % | 1.40 | % | 64.59 | % | 33.37 | % | $ | 1,619 | 1.31 | % | ||||||||||
| Source: | Audited and unaudited financial statements, corporate reports and offering circulars, and RP® Financial, LC. calculations. The information provided in this table has been obtained from sources we believe are reliable, but we cannot guarantee the accuracy or completeness of such information. |
| Copyright (c) 2012 by RP® Financial, LC. | |
| RP® Financial, LC. | PEER GROUP ANALYSIS III.16 |
68.85% and 63.69%, respectively. Loss reserves maintained as percent of net loans equaled 1.73% and 1.43% for the Company and the Peer Group, respectively. Net loan charge-offs were slightly higher for the Company, as net loan charge-offs for the Company equaled 1.00% of loans versus 0.58% of loans for the Peer Group.
Summary
Based on the above analysis, RP Financial concluded that the Peer Group forms a reasonable basis for determining the pro forma market value of the Company. Such general characteristics as asset size, capital position, interest-earning asset composition, funding composition, core earnings measures, loan composition, credit quality and exposure to interest rate risk all tend to support the reasonability of the Peer Group from a financial standpoint. Those areas where differences exist will be addressed in the form of valuation adjustments to the extent necessary.
| RP® Financial, LC. | VALUATION ANALYSIS IV.1 |
IV. VALUATION ANALYSIS
Introduction
This chapter presents the valuation analysis and methodology, prepared pursuant to the regulatory valuation guidelines, and valuation adjustments and assumptions used to determine the estimated pro forma market value of the common stock to be issued in conjunction with the Company’s conversion transaction.
Appraisal Guidelines
The regulatory written appraisal guidelines reissued by the OCC specify the market value methodology for estimating the pro forma market value of an institution pursuant to a mutual-to-stock conversion. Pursuant to this methodology: (1) a peer group of comparable publicly-traded institutions is selected; (2) a financial and operational comparison of the subject company to the peer group is conducted to discern key differences; and (3) a valuation analysis in which the pro forma market value of the subject company is determined based on the market pricing of the peer group as of the date of valuation, incorporating valuation adjustments for key differences. In addition, the pricing characteristics of recent conversions, both at conversion and in the aftermarket, must be considered.
RP Financial Approach to the Valuation
The valuation analysis herein complies with such regulatory approval guidelines. Accordingly, the valuation incorporates a detailed analysis based on the Peer Group, discussed in Chapter III, which constitutes “fundamental analysis” techniques. Additionally, the valuation incorporates a “technical analysis” of recently completed stock conversions, including closing pricing and aftermarket trading of such offerings. It should be noted that these valuation analyses cannot possibly fully account for all the market forces which impact trading activity and pricing characteristics of a particular stock on a given day.
The pro forma market value determined herein is a preliminary value for the Company’s to-be-issued stock. Throughout the conversion process, RP Financial will: (1) review changes in Malvern Bancorp’s operations and financial condition; (2) monitor Malvern Bancorp’s
| RP® Financial, LC. | VALUATION ANALYSIS IV.2 |
operations and financial condition relative to the Peer Group to identify any fundamental changes; (3) monitor the external factors affecting value including, but not limited to, local and national economic conditions, interest rates, and the stock market environment, including the market for thrift stocks and Malvern Bancorp’s stock specifically; and (4) monitor pending conversion offerings (including those in the offering phase), both regionally and nationally. If material changes should occur during the conversion process, RP Financial will evaluate if updated valuation reports should be prepared reflecting such changes and their related impact on value, if any. RP Financial will also prepare a final valuation update at the closing of the offering to determine if the prepared valuation analysis and resulting range of value continues to be appropriate.
The appraised value determined herein is based on the current market and operating environment for the Company and for all thrifts. Subsequent changes in the local and national economy, the legislative and regulatory environment, the stock market, interest rates, and other external forces (such as natural disasters or major world events), which may occur from time to time (often with great unpredictability) may materially impact the market value of all thrift stocks, including Malvern Bancorp’s value, or Malvern Bancorp’s value alone. To the extent a change in factors impacting the Company’s value can be reasonably anticipated and/or quantified, RP Financial has incorporated the estimated impact into the analysis.
Valuation Analysis
A fundamental analysis discussing similarities and differences relative to the Peer Group was presented in Chapter III. The following sections summarize the key differences between the Company and the Peer Group and how those differences affect the pro forma valuation. Emphasis is placed on the specific strengths and weaknesses of the Company relative to the Peer Group in such key areas as financial condition, profitability, growth and viability of earnings, asset growth, primary market area, dividends, liquidity of the shares, marketing of the issue, management, and the effect of government regulations and/or regulatory reform. We have also considered the market for thrift stocks, in particular new issues, to assess the impact on value of the Company coming to market at this time.
1. Financial Condition
The financial condition of an institution is an important determinant in pro forma market value because investors typically look to such factors as liquidity, capital, asset composition and
| RP® Financial, LC. | VALUATION ANALYSIS IV.3 |
quality, and funding sources in assessing investment attractiveness. The similarities and differences in the Company’s and the Peer Group’s financial strengths are noted as follows:
| ▪ | Overall A/L Composition. In comparison to the Peer Group, the Company’s interest-earning asset composition showed a higher concentrations of loans and lower concentration of cash and investments. Lending diversification into higher risk and higher yielding types of loans was more significant for the Company, which resulted in a slightly higher risk weighted assets-to-assets ratio for the Company. Overall, in comparison to the Peer Group, the Company’s interest-earning asset composition provided for a similar yield earned on interest-earning assets. Malvern Bancorp’s funding composition reflected a higher concentration of deposits and a slightly lower concentration of borrowings relative to the comparable Peer Group ratios, while Malvern Bancorp’s cost of funds was slightly higher than the Peer Group’s cost of funds. Overall, as a percent of assets, the Company maintained a slightly higher level of interest-earning assets and a lower level of interest-bearing liabilities compared to the Peer Group’s ratios, which resulted in a lower IEA/IBL ratio for the Company. After factoring in the impact of the net stock proceeds, the Company’s IEA/IBL ratio should be more comparable to the Peer Group’s ratio. On balance, RP Financial concluded that asset/liability composition was a neutral factor in our adjustment for financial condition. | |
| ▪ | Credit Quality. The Company’s ratios for non-performing assets and non-performing loans were more slightly more favorable than the comparable Peer Group ratios. Loss reserves as a percent of loans and non-performing loans were slightly higher for the Company, while net loan charge-offs were a larger factor for the Company. As noted above, the Company’s risk weighted assets-to-assets ratio was slightly higher than the Peer Group’s ratio. Overall, RP Financial concluded that credit quality was a slightly positive factor in our adjustment for financial condition. | |
| ▪ | Balance Sheet Liquidity. The Company maintained a lower level of cash and investment securities relative to the Peer Group (22.4% of assets versus 29.1% for the Peer Group). Following the infusion of stock proceeds, the Company’s cash and investments ratio is expected to increase as the proceeds retained at the holding company level will be initially deployed into investments. The Company’s future borrowing capacity was considered to be comparable to the Peer Group’s borrowing capacity, given the fairly similar levels of borrowings currently funding the Company’s and the Peer Group’s assets. Overall, RP Financial concluded that balance sheet liquidity was a neutral factor in our adjustment for financial condition. | |
| ▪ | Funding Liabilities. The Company’s interest-bearing funding composition reflected a higher concentration of deposits and a slightly lower concentration of borrowings relative to the comparable Peer Group ratios, which translated into a higher cost of funds for the Company. Total interest-bearing liabilities as a percent of assets were higher for the Company compared to the Peer Group’s ratio, which was attributable to the Company’s lower capital position. Following the stock offering, the increase in the Company’s capital position will reduce the level of interest-bearing liabilities funding the Company’s assets. Overall, RP Financial concluded that funding liabilities were a neutral factor in our adjustment for financial condition. | |
| ▪ | Capital. The Company currently operates with a lower equity-to-assets ratio than the Peer Group. However, following the stock offering, Malvern Bancorp’s pro forma capital position should be fairly comparable to the Peer Group’s equity-to-assets |
| RP® Financial, LC. | VALUATION ANALYSIS IV.4 |
| ratio. The increase in the Company’s pro forma capital position implies greater leverage capacity, lower dependence on interest-bearing liabilities to fund assets and a greater capacity to absorb unanticipated losses. At the same time, the Company’s more significant capital surplus will make it difficult to achieve a competitive ROE. On balance, RP Financial concluded that capital strength was a neutral factor in our adjustment for financial condition. |
On balance, Malvern Bancorp’s balance sheet strength was considered to be fairly consistent with the Peer Group’s balance sheet strength and, thus, no adjustment was applied for the Company’s financial condition.
2. Profitability, Growth and Viability of Earnings
Earnings are a key factor in determining pro forma market value, as the level and risk characteristics of an institution’s earnings stream and the prospects and ability to generate future earnings heavily influence the multiple that the investment community will pay for earnings. The major factors considered in the valuation are described below.
| ▪ | Reported Earnings. The Company reported a net income equal to 0.12% of average assets, versus net income equal to 0.58% of average assets for the Peer Group. The Peer Group’s higher reported earnings was supported by maintaining earnings advantages with respect to net interest income, non-interest operating income and operating expenses, while the Company showed relative earnings advantages with respect to loan loss provisions and net gains. Reinvestment and leveraging of stock proceeds into interest-earning assets will serve to increase the Company’s earnings over time. On balance, given that the Company’s lower reported earnings were representative of the Company’s less favorable core earnings, RP Financial concluded that the Company’s reported earnings were a moderately negative factor in our adjustment for profitability, growth and viability of earnings. | |
| ▪ | Core Earnings. Net interest income, operating expenses, non-interest operating income and loan loss provisions were reviewed in assessing the relative strengths and weaknesses of the Company’s and the Peer Group’s core earnings. The Company operated with a slightly lower net interest income ratio, a slightly higher operating expense ratio and a lower level of non-interest operating income. The Company’s ratios for net interest income and operating expenses translated into a lower expense coverage ratio in comparison to the Peer Group’s ratio (equal to 1.03x versus 1.13X for the Peer Group). Similarly, the Company’s efficiency ratio of 87.9% was less favorable than the Peer Group’s efficiency ratio of 69.5%. Loan loss provisions had a more significant impact on the Peer Group’s earnings. Overall, these measures, as well as the expected earnings benefits the Company should realize from the redeployment of stock proceeds into interest-earning assets and leveraging of post-conversion capital, indicate that the Company’s pro forma core earnings will be less favorable than the Peer Group’s. Therefore, RP Financial concluded that this was a moderately negative factor in our adjustment for profitability, growth and viability of earnings. |
| RP® Financial, LC. | VALUATION ANALYSIS IV.5 |
| ▪ | Interest Rate Risk. Quarterly changes in the Company’s and the Peer Group’s net interest income to average assets ratios indicated that a slightly greater degree of volatility was associated with the Company’s net interest margin. Other measures of interest rate risk, such as capital and IEA/IBL ratios were more favorable for the Peer Group, while the Company maintained a slightly lower level of non-interest earning assets. On a pro forma basis, the infusion of stock proceeds can be expected to provide the Company with equity-to-assets and IEA/ILB ratios that should be fairly similar to the comparable Peer Group ratios, as well as enhance the stability of the Company’s net interest margin through the reinvestment of stock proceeds into interest-earning assets. On balance, RP Financial concluded that interest rate risk was a neutral factor in our adjustment for profitability, growth and viability of earnings. | |
| ▪ | Credit Risk. Loan loss provisions were a more significant factor in the Peer Group’s earnings (0.36% of average assets versus 0.57% of average assets for the Company). In terms of future exposure to credit quality related losses, the Company maintained a higher concentrations of assets in loans and showed a greater degree, of lending diversification into higher risk types of loans. Credit quality measures for non-performing assets and loss reserves as a percent of loans and non-performing loans were slightly more favorable for the Company. Overall, RP Financial concluded that credit risk was a slightly positive factor in our adjustment for profitability, growth and viability of earnings. | |
| ▪ | Earnings Growth Potential. Several factors were considered in assessing earnings growth potential. First, the Peer Group maintained a higher interest rate spread than the Company, which would tend to support a higher net interest margin for the Peer Group going forward based on the current prevailing interest rate environment. Second, the infusion of stock proceeds will provide the Company with similar growth potential through leverage as currently maintained by the Peer Group. Third, the Company’s lower ratio of non-interest operating income and fairly similar operating expense ratio were viewed as a respective disadvantage and a neutral impact to sustain earnings growth during periods when net interest margins come under pressure as the result of adverse changes in interest rates. Overall, earnings growth potential was considered to be a slightly negative factor in our adjustment for profitability, growth and viability of earnings. | |
| ▪ | Return on Equity. Currently, the Company’s core ROE is less favorable than the Peer Group’s core ROE. Accordingly, as the result of the Company’s lower core earnings and the increase in capital that will be realized from the infusion of net stock proceeds into the Company’s equity, the Company’s pro forma return equity on a core earnings basis can be expected to initially remain lower than the Peer Group’s core ROE. Accordingly, this was a moderately negative factor in the adjustment for profitability, growth and viability of earnings. |
On balance, Malvern Bancorp’s pro forma earnings strength was considered to be less favorable than the Peer Group’s and, thus, a moderate downward adjustment was applied for profitability, growth and viability of earnings.
| RP® Financial, LC. | VALUATION ANALYSIS IV.6 |
3. Asset Growth
Comparative twelve-month asset growth rates for the Company and the Peer Group showed a 3.2% decrease in the Company’s assets, versus a 1.9% increase in the Peer Group’s assets. Asset shrinkage for the Company consisted of loans, which was partially offset by an increase cash and investments. Similarly, asset growth for the Peer Group consisted of cash and investments, which was partially offset by a nominal decrease in loans. The Company’s asset growth trends would tend to be viewed less favorably than the Peer Group’s growth trends, particularly given the Company’s growth trends showed a comparatively larger decline in loans (10.0% decline versus 0.3% decline for the Peer Group). On a pro forma basis, the Company’s tangible equity-to-assets ratio will be more comparable to the Peer Group’s ratio, indicating similar leverage capacity for the Company and the Peer Group. On balance, a slight downward adjustment was applied for asset growth.
4. Primary Market Area
The general condition of an institution’s market area has an impact on value, as future success is in part dependent upon opportunities for profitable activities in the local market served. The Company’s primary market area is the Philadelphia metropolitan area, where it maintains its headquarters and eight branch offices in Chester and Delaware Counties. Seven of the Company’s eight branches, as well as the headquarters office, are maintained in Chester County. Chester County is an affluent suburb of Philadelphia, which exhibited relatively favorable demographic growth trends during 2011. The favorable demographic characteristics of the Company market area has also fostered a highly competitive banking environment, in which the Company competes against other community banks as well as institutions with a regional or national presence.
The Peer Group companies generally operate in slower growing, less densely populated markets with lower per capita income than Chester County. The respective average and median deposit market shares maintained by the Peer Group companies were above and below the Company’s market share of deposits in Chester County. Overall, the degree of competition faced by the Peer Group companies was viewed to be relatively similar to the Company’s competitive environment and the growth potential in the markets served by the Peer Group companies was viewed to be less favorable compared to the Company’s primary market area. Summary demographic and deposit market share data for the Company and the Peer Group companies primary market area counties is provided in Exhibit III-3. As shown in Table 4.1,
| RP® Financial, LC. | VALUATION ANALYSIS IV.7 |
March 2012 unemployment rates for the primary market area counties served by the Peer Group companies were all higher than Chester County’s unemployment rate. On balance, we concluded that a slight upward adjustment was appropriate for the Company’s market area.
Table 4.1
Market Area Unemployment Rates
Malvern Bancorp and the Peer Group Companies(1)
| County | March 2012 Unemployment | ||||
| Malvern Bancorp - PA | Chester | 5.9 | % | ||
| Peer Group Average | 10.0 | % | |||
| Alliance Bancorp, Inc. – PA | Delaware | 7.8 | |||
| Beacon Federal Bancorp – NY | Onondaga | 8.0 | |||
| Cape Bancorp, Inc. – NJ | Cape May | 15.8 | |||
| Colonial Financial Services – NJ | Cumberland | 13.6 | |||
| ESSA Bancorp, Inc. – PA | Monroe | 9.4 | |||
| Fox Chase Bancorp, Inc. - PA | Montgomery | 6.8 | |||
| Ocean Shore Holding Co. – NJ | Cape May | 15.8 | |||
| Oneida Financial Corp. - NY | Oneida | 8.5 | |||
| Standard Financial Corp. – PA | Allegheny | 6.7 | |||
| TF Financial Corp. – PA | Bucks | 7.2 |
| (1) | Unemployment rates are not seasonally adjusted. | |
| Source: U.S. Bureau of Labor Statistics. | ||
| 5. | Dividends | |
The Company currently does not pay a dividend. After the second-step conversion, future declarations of dividends by the Board of Directors will depend upon a number of factors, including investment opportunities, growth objectives, financial condition, profitability, tax considerations, minimum capital requirements, regulatory limitations, stock market characteristics and general economic conditions.
Eight out of the ten Peer Group companies pay regular cash dividends, with implied dividend yields ranging from 1.07% to 4.49%. The average dividend yield on the stocks of the Peer Group institutions was 1.55% as of May 4, 2012. As of May 4, 2012, approximately 62% of all fully-converted publicly-traded thrifts had adopted cash dividend policies (see Exhibit IV-1), exhibiting an average yield of 1.63%. The dividend paying thrifts generally maintain higher than average profitability ratios, facilitating their ability to pay cash dividends.
| RP® Financial, LC. | VALUATION ANALYSIS IV.8 |
While the Company currently does not pay a dividend, it will have the capacity to pay a dividend comparable to the Peer Group’s average dividend yield based on pro forma capitalization. However, the Company’s lower earnings and the restrictions set forth in the Supervisory Agreements, which prohibit the Company from declaring or paying dividends without receiving the prior written approval of the FRB, represent negatives in terms of capacity to pay a dividend similar to the Peer Group companies on average. On balance, we concluded that a slight downward adjustment was warranted for this factor.
| 6. | Liquidity of the Shares |
The Peer Group is by definition composed of companies that are traded in the public markets. All ten of the Peer Group members trade on the NASDAQ. Typically, the number of shares outstanding and market capitalization provides an indication of how much liquidity there will be in a particular stock. The market capitalization of the Peer Group companies ranged from $51.4 million to $166.6 million as of May 4, 2012, with average and median market values of $86.9 million and $77.3 million, respectively. The shares issued and outstanding for the Peer Group companies ranged from 2.8 million to 13.3 million, with average and median shares outstanding of 7.4 million and 6.5 million, respectively. The Company’s second-step stock offering is expected to provide for a pro forma market value that will be at lower end of the range or below the range of the Peer Group’s market capitalizations and in the lower half of the range of shares outstanding reflected for the Peer Group companies. Consistent with all of the Peer Group companies, the Company’s stock will continue to be quoted on the NASDAQ following the stock offering. Overall, we anticipate that the Company’s stock will have a fairly comparable trading market as the Peer Group companies and, therefore, concluded no adjustment was necessary for this factor.
| 7. | Marketing of the Issue |
We believe that four separate markets exist for thrift stocks, including those coming to market such as Malvern Bancorp’s: (A) the after-market for public companies, in which trading activity is regular and investment decisions are made based upon financial condition, earnings, capital, ROE, dividends and future prospects; (B) the new issue market in which converting thrifts are evaluated on the basis of the same factors, but on a pro forma basis without the benefit of prior operations as a fully-converted publicly-held company and stock trading history; (C) the acquisition market for thrift franchises in Pennsylvania; and (D) the market for the public
| RP® Financial, LC. | VALUATION ANALYSIS IV.9 |
stock of Malvern Bancorp. All of these markets were considered in the valuation of the Company’s to-be-issued stock.
| A. | The Public Market |
The value of publicly-traded thrift stocks is easily measurable, and is tracked by most investment houses and related organizations. Exhibit IV-1 provides pricing and financial data on all publicly-traded thrifts. In general, thrift stock values react to market stimuli such as interest rates, inflation, perceived industry health, projected rates of economic growth, regulatory issues and stock market conditions in general. Exhibit IV-2 displays historical stock market trends for various indices and includes historical stock price index values for thrifts and commercial banks. Exhibit IV-3 displays historical stock price indices for thrifts only.
In terms of assessing general stock market conditions, the performance of the overall stock market has been mixed in recent quarters. At the start of the fourth quarter of 2011, day-to-day fluctuations in the broader stock market continued to be dominated by news regarding Europe’s sovereign-debt problems. The S&P 500-stock index briefly moved into bear-market territory on fears of a European debt default, which was followed by a strong rebound after the leaders of France and Germany promised to strengthen European banks. A positive report on September U.S retail sales and more signs of progress in Europe’s sovereign-debt crisis helped to push the DJIA into positive territory in mid-October. Mixed third quarter earnings reports and ongoing euro-zone concerns provided for more volatility in the broader stock market through the end of October. Overall, the DJIA was up 9.5% for October, which was its best one-month performance in nine years. The broader stock market continued to perform unevenly throughout November, as investors reacted to ongoing developments concerning Europe’s sovereign debt and mixed economic data. Notably, the DJIA turned in its worst Thanksgiving week performance since the market began observing the holiday, as Europe’s debt problems and lackluster economic data weighed on the broader stock market. Comparatively, stocks rallied strongly to close out November and into early-December, which was supported by news that major central banks agreed to act together to make it less costly for European banks to borrow U.S. dollars and a better-than-expected U.S. employment report for November. Stocks traded unevenly heading into mid-December, as investors reacted to the latest developments concerning Europe’s ability to tackle its debt crisis. Encouraging news coming out of Europe and some reports showing a pick-up in U.S. economic activity supported a positive trend in the broader stock market to close out 2011. For all of 2011, the DJIA ended
| RP® Financial, LC. | VALUATION ANALYSIS IV.10 |
2011 with a gain of 5.5% and the NASDAQ Composite was down 1.8% for the year. Over the course of 2011, the S&P 500 had been up as much as 8.4% in late-April and down nearly 13% in early-October. For all of 2011, the S&P 500 was essentially unchanged.
More signs of an improving U.S. economy sustained a generally positive trend in the broader stock market at the start of 2012. Major stock indexes moved to six-month highs in mid-January, as investors responded to encouraging jobs data and solid fourth quarter earnings posted by some large banks. Disappointing economic data, including weaker than expected new home sales in December and fourth quarter GDP growth falling short of expectations, contributed to the DJIA posting its first weekly loss of 2012 in late-January. Notwithstanding the downward trend in late-January, gains in the major stock indexes for January were the largest in fifteen years. A strong jobs report for January helped stocks regain some traction in early-February, with the DJIA moving to its highest close since May 2008. The DJIA posted its sharpest one day decline for 2012 heading into mid-February, which was attributable to renewed fears of a Greek default and disappointing readings on the U.S. economy. Signs of an accelerating U.S. economic recovery and indications of progress toward an agreement on a bailout for Greece propelled the DJIA to a 52-week high in mid-February. In late-February, the DJIA closed above 13000 for the first time since the financial crisis and February marked the fifth straight month that the DJIA closed higher. Stocks faltered in early-March on worries about Greece and slower global economic growth, which was followed by a rebound going into mid-March. Some favorable economic reports, including solid job growth reflected in the February employment data, Greece moving closer to completing its debt restructuring and most of the largest U.S. banks passing the latest round of “stress tests” contributed to the rally that pushed the broader stock market to multi-year highs in mid-March. Concerns about slower growth in China pulled stocks lower heading into the close of the first quarter, while the broader stock market closed out the first quarter with a gain. Overall, the DJIA was up 8.1% for the first quarter, which was the best first quarter performance for the DJIA since 1998.
Following the strong first quarter of 2012, stocks moved lower at the beginning of the second quarter. Among the factors contributing to the decline included minutes from the latest Federal Reserve meeting that suggested further monetary stimulus was unlikely and a disappoint employment report for March, in which job growth was less than expected. The DJIA had its worst week for 2012 in mid-April, as worries over rising borrowings costs for European countries fueled the downturn. Stocks rebounded at the end of April and the DJIA moved to a four year high at the start of May, with some favorable first quarter earnings posted by some
| RP® Financial, LC. | VALUATION ANALYSIS IV.11 |
blue chip stocks and a stronger than expected reading for manufacturing activity in April supporting the gains. A disappointing jobs report for April fueled a selloff in the broader stock market to close out the first week of May, with the DJIA recording its worst week of 2012 on heightened concerns that the economic recovery was heading for a slowdown. On May 4, 2012, the DJIA closed at 13038.27, an increase of 3.2% from one year ago and an increase of 6.7% year-to-date, and the NASDAQ closed at 2956.34, an increase of 4.6% from one year ago and an increase of 13.5% year-to-date. The Standard & Poor’s 500 Index closed at 1369.10 on May 4, 2012, an increase of 2.2% from one year ago and an increase of 8.9% year-to-date.
The market for thrift stocks has been somewhat volatile as well in recent quarters, but in general underperformed the broader stock market. Bank and thrift stocks led a sharp market downturn to start out the fourth quarter of 2011, as investors were unsettled when Greece’s government indicated that it would miss its deficit target in 2011. Indications that European policymakers were moving forward with plans to stabilize Europe’s banks and resolve Europe’s debt crisis pushed bank and thrift stocks along with the broader market higher heading into mid-October. Thrift stocks underperformed the broader stock market in mid-October, as third quarter earnings reports for some of the nation’s largest banks showed decreases in revenues. Shares of financial stocks rallied in late-October, as European leaders hashed out an eleventh hour agreement to address the fallout from Greece’s debt woes. Volatility prevailed in bank and thrift stocks through most of November, which was largely tied to changes in sentiment over resolution of Europe’s sovereign debt problems. Thrift stocks traded lower along with the broader stock market Thanksgiving week and more than recovered those losses the following week, as financial shares were the strongest gainers on news about a coordinated plan by major central banks to cut short-term borrowings rates and U.S. employment growth picked up speed in November. Thrift stocks were largely trendless heading into mid-December, as investors reacted to generally positive economic data and the conclusion of the European summit. A strong report on housing starts in November and Spain’s second successful debt auction boosted financials along with the broader stock market in late-December. Thrift stocks closed out 2011 generally trending higher, as financials benefitted from economic reports showing a brightening picture for the U.S. economy. For 2011 overall, the SNL Index for all publicly-traded thrifts showed a decline of 18.7%.
Some more encouraging news on the economy helped to sustain the advance in thrift stocks at the beginning of 2012. Bank and thrift stocks did not keep pace with the broader stock market heading into the second half of January, as financials traded in a narrow range on
| RP® Financial, LC. | VALUATION ANALYSIS IV.12 |
mixed fourth quarter earnings reports coming out of the sector. Financial stocks led the broader market lower in late-January, as investors focused on the standoff between Greece and its creditors and the cut in Bank of America’s rating by Goldman Sachs. The better-than-expected employment report for January boosted thrift stocks in early-February, which was followed by a slight pullback on some profit taking and renewed concerns about the Greek bailout. Bank and thrift stocks advanced in mid-February on increased optimism that Greece was close to getting approval of its bailout package. Financials traded in a fairly narrow range into late-February and then retreated along with the broader stock market in late-February and early-March, based on concerns related to the global economy. Generally favorable results from the Federal Reserve’s latest round of “stress test” triggered a broad based rally for bank and thrift stocks in mid-March. Thrift stocks traded in a narrow range to close out the first quarter.
Thrift stocks tumbled along with stocks in general at the start of the second quarter 2012, as investors reacted to the weaker than expected job growth reflected in the March employment report and renewed concerns about Europe’s debt problems. The March consumer price index, which showed that core inflation was still above the Federal Reserve’s target range also pressured thrift stocks lower in mid-April. Thrift stocks rebounded in late-April, as the Federal Reserve meeting concluded with no change in its target rate and reaffirmed their plan to keep short-term rates near zero until late-2014. The disappointing employment report for April led thrift stocks lower to close out the first week of May. On May 4, 2012, the SNL Index for all publicly-traded thrifts closed at 513.7, a decrease of 8.6% from one year ago and an increase of 6.7% year-to-date.
| B. | The New Issue Market |
In addition to thrift stock market conditions in general, the new issue market for converting thrifts is also an important consideration in determining the Company’s pro forma market value. The new issue market is separate and distinct from the market for seasoned thrift stocks in that the pricing ratios for converting issues are computed on a pro forma basis, specifically: (1) the numerator and denominator are both impacted by the conversion offering amount, unlike existing stock issues in which price change affects only the numerator; and (2) the pro forma pricing ratio incorporates assumptions regarding source and use of proceeds, effective tax rates, stock plan purchases, etc. which impact pro forma financials, whereas pricing for existing issues are based on reported financials. The distinction between pricing of converting and existing issues is perhaps no clearer than in the case of the price/book (“P/B”) ratio in that the P/B ratio of a converting thrift will typically result in a discount to book value
| RP® Financial, LC. | VALUATION ANALYSIS IV.13 |
whereas in the current market for existing thrifts the P/B ratio may reflect a premium to book value. Therefore, it is appropriate to also consider the market for new issues, both at the time of the conversion and in the aftermarket.
Over the past three months, there were no conversion offerings completed. As shown in Table 4.2, two standard conversions and one second-step conversion have been completed during 2012. The second-step conversion offering is considered to be more relevant for our analysis, which was completed on January 18, 2012. Cheviot Financial’s second-step offering was completed at the minimum of the offering range, with a 62% offering raising gross proceeds of $37.4 million. Cheviot Financial’s pro forma price/tangible book ratio at the closing value equaled 65.6%. Cheviot Financial’s stock price closed 2.6% above its offering price after one week of trading and was up 9.7% from its offering price through May 4, 2012.
| C. | The Acquisition Market |
Also considered in the valuation was the potential impact on Malvern Bancorp’s stock price of recently completed and pending acquisitions of other thrift institutions operating in Pennsylvania. As shown in Exhibit IV-4, there were nine Pennsylvania thrift acquisitions completed from the beginning of 2008 through May 4, 2012 and there are currently three acquisitions pending of Pennsylvania savings institutions. The recent acquisition activity involving Pennsylvania savings institutions may imply a certain degree of acquisition speculation for the Company’s stock. To the extent that acquisition speculation may impact the Company’s offering, we have largely taken this into account in selecting companies for the Peer Group which operate in markets that have experienced a comparable level of acquisition activity as the Company’s market and, thus, are subject to the same type of acquisition speculation that may influence Malvern Bancorp’s stock. However, since converting thrifts are subject to a three-year regulatory moratorium from being acquired, acquisition speculation in Malvern Bancorp’s stock would tend to be less compared to the stocks of the Peer Group companies.
| D. | Trading in Malvern Bancorp’s Stock |
Since Malvern Bancorp’s minority stock currently trades under the symbol “MLVF” on the NASDAQ, RP Financial also considered the recent trading activity in the valuation analysis. Malvern Bancorp had a total of 6,102,500 shares issued and outstanding at March 31, 2012, of which 2,718,625 shares were held by public shareholders and traded as
| RP® Financial, LC. | VALUATION ANALYSIS IV.14 |
Table 4.2
Pricing Characteristics and After-Market Trends
Conversions Completed in 2012
| Institutional Information | Pre-Conversion Data | Offering Information | Contribution to | Insider Purchases | ||||||||||||||||||||||||||||||||||
| Financial Info. | Asset Quality | Char. Found. | % Off Incl. Fdn.+Merger Shares | |||||||||||||||||||||||||||||||||||
| Excluding Foundation | Benefit Plans | |||||||||||||||||||||||||||||||||||||
| Institution | Conversion Date | Ticker | Assets | Equity/ Assets | NPAs/ Assets | Res. Cov. | Gross Proc. | % Offer | % of Mid. | Exp./ Proc. | Form | % of Public Off. Excl. Fdn. | ESOP | Recog Plans | Stk Option | Mgmt.& Dirs. | Initial Div. Yield | |||||||||||||||||||||
| ($Mil) | (%) | (%) | (%) | ($Mil.) | (%) | (%) | (%) | (%) | (%) | (%) | (%) | (%)(2) | (%) | |||||||||||||||||||||||||
| Standard Conversions | ||||||||||||||||||||||||||||||||||||||
| Wellesley Bancorp, Inc. - MA*(1) | 1/26/12 | WEBK-NASDAQ | $ | 274 | 8.07 | % | 1.00 | % | 118 | % | $ | 22.5 | 100 | % | 94 | % | 5.5 | % | C/S | $ | 225K/6.5 | % | 8.0 | % | 4.0 | % | 10.0 | % | 11.1 | % | 0.00 | % | ||||||
| West Indiana Bancshares, Inc. - IN*(1) | 1/11/12 | WEIN-OTC-BB | $ | 225 | 7.94 | % | 1.46 | % | 76 | % | $ | 13.6 | 100 | % | 85 | % | 9.2 | % | C/S | $ | 125K/2.7 | % | 8.0 | % | 4.0 | % | 10.0 | % | 5.2 | % | 0.00 | % | ||||||
| Averages - Standard Conversions: | $ | 250 | 8.01 | % | 1.23 | % | 97 | % | $ | 18.1 | 100 | % | 89 | % | 7.3 | % | N.A. | N.A. | 8.0 | % | 4.0 | % | 10.0 | % | 8.2 | % | 0.00 | % | ||||||||||
| Medians - Standard Conversions: | $ | 250 | 8.01 | % | 1.23 | % | 97 | % | $ | 18.1 | 100 | % | 89 | % | 7.3 | % | N.A. | N.A. | 8.0 | % | 4.0 | % | 10.0 | % | 8.2 | % | 0.00 | % | ||||||||||
| Second Step Conversions | ||||||||||||||||||||||||||||||||||||||
| Cheviot Financial Corp., - OH* | 1/18/12 | CHEV-NASDAQ | $ | 601 | 12.02 | % | 2.74 | % | 0 | % | $ | 37.4 | 62 | % | 85 | % | 6.7 | % | N.A. | N.A. | 4.0 | % | 4.0 | % | 10.0 | % | 1.9 | % | 0.00 | % | ||||||||
| Averages - Second Step Conversions: | $ | 601 | 12.02 | % | 2.74 | % | 0 | % | $ | 37.4 | 62 | % | 85 | % | 6.7 | % | N.A. | N.A. | 4.0 | % | 4.0 | % | 10.0 | % | 1.9 | % | 0.00 | % | ||||||||||
| Medians - Second Step Conversions: | $ | 601 | 12.02 | % | 2.74 | % | 0 | % | $ | 37.4 | 62 | % | 85 | % | 6.7 | % | N.A. | N.A. | 4.0 | % | 4.0 | % | 10.0 | % | 1.9 | % | 0.00 | % | ||||||||||
| Mutual Holding Companies(6) | ||||||||||||||||||||||||||||||||||||||
| Averages - All Conversions: | $ | 425 | 10.01 | % | 1.99 | % | 49 | % | $ | 27.7 | 81 | % | 87 | % | 7.0 | % | N.A. | N.A. | 6.0 | % | 4.0 | % | 10.0 | % | 5.0 | % | 0.00 | % | ||||||||||
| Medians - All Conversions: | $ | 425 | 10.01 | % | 1.99 | % | 49 | % | $ | 27.7 | 81 | % | 87 | % | 7.0 | % | N.A. | N.A. | 6.0 | % | 4.0 | % | 10.0 | % | 5.0 | % | 0.00 | % | ||||||||||
| Institutional Information | Pro Forma Data | Post-IPO Pricing Trends | ||||||||||||||||||||||||||||||||||||||
| Pricing Ratios(3)(6) | Financial Charac. | Closing Price: | ||||||||||||||||||||||||||||||||||||||
| Institution | Conversion Date | Ticker | P/TB | Core P/E | P/A | Core ROA | TE/A | Core ROE | IPO Price | First Trading Day | % Chge | After First Week(4) | % Chge | After First Month(5) | % Chge | Thru 5/4/12 | % Chge | |||||||||||||||||||||||
| (%) | (x) | (%) | (%) | (%) | (%) | ($) | ($) | (%) | ($) | (%) | ($) | (%) | ($) | (%) | ||||||||||||||||||||||||||
| Standard Conversions | ||||||||||||||||||||||||||||||||||||||||
| Wellesley Bancorp, Inc. - MA*(1) | 1/26/12 | WEBK-NASDAQ | 58.7 | % | 12.8 | x | 8.2 | % | 0.6 | % | 14.0 | % | 4.6 | % | $ | 10.00 | $ | 12.00 | 20.0 | % | $ | 12.10 | 21.0 | % | $ | 12.29 | 22.9 | % | $ | 13.58 | 35.8 | % | ||||||||
| West Indiana Bancshares, Inc. - IN*(1) | 1/11/12 | WEIN-OTC-BB | 48.9 | % | 105.3 | x | 5.9 | % | 0.1 | % | 12.1 | % | 0.5 | % | $ | 10.00 | $ | 11.26 | 12.6 | % | $ | 11.15 | 11.5 | % | $ | 12.00 | 20.0 | % | $ | 12.76 | 27.6 | % | ||||||||
| Averages - Standard Conversions: | 53.8 | % | 59.0 | x | 7.1 | % | 0.4 | % | 13.1 | % | 2.5 | % | $ | 10.00 | $ | 11.63 | 16.3 | % | $ | 11.63 | 16.3 | % | $ | 12.15 | 21.5 | % | $ | 13.17 | 31.7 | % | ||||||||||
| Medians - Standard Conversions: | 53.8 | % | 59.0 | x | 7.1 | % | 0.4 | % | 13.1 | % | 2.5 | % | $ | 10.00 | $ | 11.63 | 16.3 | % | $ | 11.63 | 16.3 | % | $ | 12.15 | 21.5 | % | $ | 13.17 | 31.7 | % | ||||||||||
| Second Step Conversions | ||||||||||||||||||||||||||||||||||||||||
| Cheviot Financial Corp., - OH* | 1/18/12 | CHEV-NASDAQ | 65.6 | % | 23.74 | 9.6 | % | 0.4 | % | 14.9 | % | 2.5 | % | $ | 8.00 | $ | 8.25 | 3.1 | % | $ | 8.21 | 2.6 | % | $ | 8.28 | 3.5 | % | $ | 8.78 | 9.7 | % | |||||||||
| Averages - Second Step Conversions: | 65.6 | % | 23.7 | x | 9.6 | % | 0.4 | % | 14.9 | % | 2.5 | % | $ | 8.00 | $ | 8.25 | 3.1 | % | $ | 8.21 | 2.6 | % | $ | 8.28 | 3.5 | % | $ | 8.78 | 9.7 | % | ||||||||||
| Medians - Second Step Conversions: | 65.6 | % | 23.7 | x | 9.6 | % | 0.4 | % | 14.9 | % | 2.5 | % | $ | 8.00 | $ | 8.25 | 3.1 | % | $ | 8.21 | 2.6 | % | $ | 8.28 | 3.5 | % | $ | 8.78 | 9.7 | % | ||||||||||
| Mutual Holding Companies(6) | ||||||||||||||||||||||||||||||||||||||||
| Averages - All Conversions: | 59.7 | % | 41.4 | x | 8.3 | % | 0.4 | % | 14.0 | % | 2.5 | % | $ | 9.00 | $ | 9.94 | 9.7 | % | $ | 9.92 | 9.4 | % | $ | 10.21 | 12.5 | % | $ | 10.98 | 20.7 | % | ||||||||||
| Medians - All Conversions: | 59.7 | % | 41.4 | x | 8.3 | % | 0.4 | % | 14.0 | % | 2.5 | % | $ | 9.00 | $ | 9.94 | 9.7 | % | $ | 9.92 | 9.4 | % | $ | 10.21 | 12.5 | % | $ | 10.98 | 20.7 | % | ||||||||||
Note: * - Appraisal performed by RP Financial; BOLD = RP Fin. Did the business plan, “NT” - Not Traded; “NA” - Not Applicable, Not Available; C/S-Cash/Stock.
| (1) | Non-OTS regulated thrift. |
| (2) | As a percent of MHC offering for MHC transactions. |
| (3) | Does not take into account the adoption of SOP 93-6. |
| (4) | Latest price if offering is less than one week old. |
| (5) | Latest price if offering is more than one week but less than one month old. |
| (6) | Mutual holding company pro forma data on full conversion basis. |
| (7) | Simultaneously completed acquisition of another financial institution. |
| (8) | Simultaneously converted to a commercial bank charter. |
| (9) | Former credit union. |
May 4, 2012
| RP® Financial, LC. | VALUATION ANALYSIS IV.15 |
public securities. The Company’s stock showed a 52 week trading range of $5.51 to $9.00 per share through May 4, 2012. The Company’s stock closed at $8.46 per share on May 4, 2012.
There are significant differences between the Company’s minority stock currently being traded and the conversion stock that will be issued by the Company. Such differences include different liquidity characteristics, a different return on equity for the conversion stock, the stock is currently traded based on speculation of a range of exchange ratios and dividend payments, if any, will be made on all shares outstanding. Since the pro forma impact has not been publicly disseminated to date, it is appropriate to discount the current trading level. As the pro forma impact is made known publicly, the trading level will become more informative.
* * * * * * * * * * *
In determining our valuation adjustment for marketing of the issue, we considered trends in both the overall thrift market, the new issue market including the new issue market for second-step conversions, the acquisition market and recent trading activity in the Company’s minority stock. Taking these factors and trends into account, RP Financial concluded that a slight downward adjustment was appropriate in the valuation analysis for purposes of marketing of the issue.
| 8. | Management |
The Company’s management team appears to have experience and expertise in all of the key areas of the Company’s operations. Exhibit IV-5 provides summary resumes of the Company’s Board of Directors and senior management. The Company’s Board and senior management have addressed the requirements set forth in the Supervisory Agreements, as well as implemented strategies that have facilitated improving credit quality trends and a return to profitability. The Company currently does not have any senior management positions that are vacant.
The returns, equity positions and other operating measures of the Peer Group companies are indicative of well-managed financial institutions, which have Boards and management teams that have been effective in implementing competitive operating strategies. Therefore, on balance, we concluded no valuation adjustment relative to the Peer Group was appropriate for this factor.
| RP® Financial, LC. | VALUATION ANALYSIS IV.16 |
| 9. | Effect of Government Regulation and Regulatory Reform |
In summary, as a fully-converted, FDIC insured institution, Malvern Bancorp will operate in substantially the same regulatory environment as the Peer Group members — all of whom are adequately capitalized institutions and are operating with no apparent restrictions. Comparatively, the MHC, the Company and the Bank are currently operating under a Supervisory Agreements originally entered into with the OTS and subsequently transferred to the OCC in the case of the Bank and the FRB in the case of the MHC and the Company. Exhibit IV-6 reflects the Bank’s pro forma regulatory capital ratios. On balance, a slight downward adjustment has been applied for the effect of government regulation and regulatory reform.
Summary of Adjustments
Overall, based on the factors discussed above, we concluded that the Company’s pro forma market value should reflect the following valuation adjustments relative to the Peer Group:
| Key Valuation Parameters: | Valuation Adjustment |
| Financial Condition | No Adjustment |
| Profitability, Growth and Viability of Earnings | Moderate Downward |
| Asset Growth | Slight Downward |
| Primary Market Area | Slight Upward |
| Dividends | Slight Downward |
| Liquidity of the Shares | No Adjustment |
| Marketing of the Issue | Slight Downward |
| Management | No Adjustment |
| Effect of Govt. Regulations and Regulatory Reform | Slight Downward |
Valuation Approaches
In applying the accepted valuation methodology promulgated by the OCC and adopted by the FRB, i.e., the pro forma market value approach, we considered the three key pricing ratios in valuing the Company’s to-be-issued stock — price/earnings (“P/E”), price/book (“P/B”), and price/assets (“P/A”) approaches — all performed on a pro forma basis including the effects of the stock proceeds. In computing the pro forma impact of the conversion and the related pricing ratios, we have incorporated the valuation parameters disclosed in the Company’s
| RP® Financial, LC. | VALUATION ANALYSIS IV.17 |
prospectus for reinvestment rate, effective tax rate, stock benefit plan assumptions and expenses (summarized in Exhibits IV-7 and IV-8).
In our estimate of value, we assessed the relationship of the pro forma pricing ratios relative to the Peer Group and recent conversion offerings.
RP Financial’s valuation placed an emphasis on the following:
| • | P/E Approach. The P/E approach is generally the best indicator of long-term value for a stock and we have given it significant weight among the valuation approaches. Given certain similarities between the Company’s and the Peer Group’s earnings composition and overall financial condition, the P/E approach was carefully considered in this valuation. At the same time, recognizing that (1) the earnings multiples will be evaluated on a pro forma basis for the Company; and (2) the Peer Group companies have had the opportunity to realize the benefit of reinvesting and leveraging the offering proceeds, we also gave weight to the other valuation approaches. | |
| • | P/B Approach. P/B ratios have generally served as a useful benchmark in the valuation of thrift stocks, particularly in the context of a conversion offering, as the earnings approach involves assumptions regarding the use of proceeds. RP Financial considered the P/B approach to be a valuable indicator of pro forma value taking into account the pricing ratios under the P/E and P/A approaches. We have also modified the P/B approach to exclude the impact of intangible assets (i.e., price/tangible book value or “P/TB”), in that the investment community frequently makes this adjustment in its evaluation of this pricing approach. | |
| • | P/A Approach. P/A ratios are generally a less reliable indicator of market value, as investors typically assign less weight to assets and attribute greater weight to book value and earnings. Furthermore, this approach as set forth in the regulatory valuation guidelines does not take into account the amount of stock purchases funded by deposit withdrawals, thus understating the pro forma P/A ratio. At the same time, the P/A ratio is an indicator of franchise value, and, in the case of highly capitalized institutions, high P/A ratios may limit the investment community’s willingness to pay market multiples for earnings or book value when ROE is expected to be low. | |
| • | Trading of MLVF stock. Converting institutions generally do not have stock outstanding. Malvern Bancorp, however, has public shares outstanding due to the mutual holding company form of ownership. Since Malvern Bancorp’s stock is currently quoted on the NASDAQ, it is an indicator of investor interest in the Company’s conversion stock and therefore received some weight in our valuation. Based on the May 4, 2012 closing stock price of $8.46 per share and the 6,102,500 shares of Malvern Bancorp stock outstanding, the Company’s implied market value of $51.6 million was considered in the valuation process. However, since the conversion stock will have different characteristics than the minority shares, and since pro forma information has not been publicly disseminated to date, the current trading price of Malvern Bancorp’s stock was somewhat discounted herein but will become more important towards the closing of the offering. |
| RP® Financial, LC. | VALUATION ANALYSIS IV.18 |
In preparing the pro forma pricing analysis, we have taken into account the pro forma impact of the MHC net assets that will be consolidated with the Company and thus will increase equity. At March 31, 2012, the MHC had unconsolidated net assets of $100,000.
Based on the application of the three valuation approaches, taking into consideration the valuation adjustments discussed above, RP Financial concluded that as of May 4, 2012, the aggregate pro forma market value of Malvern Bancorp’s conversion stock equaled $49,593,660 at the midpoint, equal to 4,959,366 shares at $10.00 per share. The $10.00 per share price was determined by the Malvern Bancorp Board. The midpoint and resulting valuation range is based on the sale of a 55.45% ownership interest to the public, which provides for a $27,500,000 public offering at the midpoint value.
1.Price-to-Earnings (“P/E”). The application of the P/E valuation method requires calculating the Company’s pro forma market value by applying a valuation P/E multiple to the pro forma earnings base. In applying this technique, we considered both reported earnings and a recurring earnings base, that is, earnings adjusted to exclude any one-time non-operating items, plus the estimated after-tax earnings benefit of the reinvestment of the net proceeds. The Company’s reported earnings equaled $801,000 for the twelve months ended March 31, 2012. In deriving Malvern Bancorp’s core earnings, the adjustments made to reported earnings were to eliminate gains on the sale of investment securities and OREO, which equaled $623,000 and $9,000, respectively, for the twelve months ended March 31, 2012. As shown below, on a tax effected basis, assuming an effective marginal tax rate of 40.0% for the earnings adjustments, the Company’s core earnings were determined to equal $422,000 for the twelve months ended March 31, 2012. (Note: see Exhibit IV-9 for the adjustments applied to the Peer Group’s earnings in the calculation of core earnings).
| Amount | ||||
| ($000) | ||||
| Net income(loss) | $ | 801 | ||
| Deduct: Investment securities gains(1) | (374 | ) | ||
| Deduct: Gain on sale of OREO(1) | (5 | ) | ||
| Core earnings estimate | $ | 422 | ||
(1) Tax effected at 40.0%.
Based on the Company’s reported and estimated core earnings and incorporating the impact of the pro forma assumptions discussed previously, the Company’s pro forma reported and core P/E multiples at the $49.6 million midpoint value equaled 51.68 times and 85.42 times,
| RP® Financial, LC. | VALUATION ANALYSIS |
| IV.19 |
respectively, which provided for premiums of 180.87% and 351.72% relative to the Peer Group’s average reported and core P/E multiples of 18.40 times and 18.91 times, respectively (see Table 4.3). In comparison to the Peer Group’s median reported and core earnings multiples which equaled 17.00 times and 16.30 times, respectively, the Company’s pro forma reported and core P/E multiples at the midpoint value indicated premiums of 204.00% and 424.05%, respectively. At the top of the super range, the Company’s reported and core P/E multiples equaled 64.77 times and 103.50 times, respectively. In comparison to the Peer Group’s average reported and core P/E multiples, the Company’s P/E multiples at the top of the super range reflected premiums of 252.01% and 447.33%, respectively. In comparison to the Peer Group’s median reported and core P/E multiples, the Company’s P/E multiples at the top of the super range reflected premiums of 281.00% and 534.97%, respectively.
2.Price-to-Book (“P/B”). The application of the P/B valuation method requires calculating the Company’s pro forma market value by applying a valuation P/B ratio, as derived from the Peer Group’s P/B ratio, to the Company’s pro forma book value. Based on the $49.6 million midpoint valuation, the Company’s pro forma P/B and P/TB ratios both equaled 56.85%. In comparison to the average P/B and P/TB ratios for the Peer Group of 78.42% and 85.17%, the Company’s ratios reflected a discount of 27.51% on a P/B basis and a discount of 33.25% on a P/TB basis. In comparison to the Peer Group’s median P/B and P/TB ratios of 74.90% and 83.11%, respectively, the Company’s pro forma P/B and P/TB ratios at the midpoint value reflected discounts of 24.10% and 31.60%, respectively. At the top of the super range, the Company’s P/B and P/TB ratios both equaled 68.49%. In comparison to the Peer Group’s average P/B and P/TB ratios, the Company’s P/B and P/TB ratios at the top of the super range reflected discounts of 12.66% and 19.58%, respectively. In comparison to the Peer Group’s median P/B and P/TB ratios, the Company’s P/B and P/TB ratios at the top of the super range reflected discounts of 8.56% and 17.59%, respectively. RP Financial considered the discounts under the P/B approach to be reasonable, particularly in light of the significant premiums reflected in the Company’s pro forma P/E multiples.
3.Price-to-Assets (“P/A”). The P/A valuation methodology determines market value by applying a valuation P/A ratio to the Company’s pro forma asset base, conservatively assuming no deposit withdrawals are made to fund stock purchases. In all likelihood there will
| RP® Financial, LC. | VALUATION ANALYSIS IV.20 |
Table 4.3
Public Market Pricing
Malvern Bancorp, Inc. and the Comparables
As of May 4, 2012
| Market | Per Share Data | ||||||||||||||||||||||||||||||
| Capitalization | Core | Book | Dividends(4) | ||||||||||||||||||||||||||||
| Price/ | Market | 12 Month | Value/ | Pricing Ratios(3) | Amount/ | Payout | |||||||||||||||||||||||||
| Share(1) | Value | EPS(2) | Share | P/E | P/B | P/A | P/TB | P/Core | Share | Yield | Ratio(5) | ||||||||||||||||||||
| ($) | ($Mil) | ($) | ($) | (x) | (%) | (%) | (%) | (x) | ($) | (%) | (%) | ||||||||||||||||||||
| Malvern Bancorp, Inc. | |||||||||||||||||||||||||||||||
| Superrange | $ | 10.00 | $ | 65.59 | $ | 0.10 | $ | 14.60 | 64.77 | x | 68.49 | % | 9.57 | % | 68.49 | % | 103.50 | x | $ | 0.00 | 0.00 | % | 0.00 | % | |||||||
| Maximum | $ | 10.00 | $ | 57.03 | $ | 0.11 | $ | 15.99 | 57.94 | x | 62.54 | % | 8.38 | % | 62.54 | % | 94.27 | x | $ | 0.00 | 0.00 | % | 0.00 | % | |||||||
| Midpoint | $ | 10.00 | $ | 49.59 | $ | 0.12 | $ | 17.59 | 51.68 | x | 56.85 | % | 7.33 | % | 56.85 | % | 85.42 | x | $ | 0.00 | 0.00 | % | 0.00 | % | |||||||
| Minimum | $ | 10.00 | $ | 42.15 | $ | 0.13 | $ | 19.76 | 45.09 | x | 50.61 | % | 6.26 | % | 50.61 | % | 75.84 | x | $ | 0.00 | 0.00 | % | 0.00 | % | |||||||
| All Non-MHC Public Companies (7) | |||||||||||||||||||||||||||||||
| Averages | $ | 12.24 | $ | 302.81 | $ | 0.12 | $ | 14.71 | 19.00 | x | 82.90 | % | 10.09 | % | 89.39 | % | 20.22 | x | $ | 0.21 | 1.63 | % | 24.47 | % | |||||||
| Medians | $ | 11.95 | $ | 74.63 | $ | 0.30 | $ | 14.09 | 17.22 | x | 80.55 | % | 9.76 | % | 83.85 | % | 18.01 | x | $ | 0.16 | 1.23 | % | 0.00 | % | |||||||
| All Non-MHC State of PA(7) | |||||||||||||||||||||||||||||||
| Averages | $ | 13.84 | $ | 181.71 | $ | 0.71 | $ | 16.52 | 18.38 | x | 84.49 | % | 10.99 | % | 91.12 | % | 20.19 | x | $ | 0.27 | 2.01 | % | 36.33 | % | |||||||
| Medians | $ | 13.06 | $ | 66.37 | $ | 0.66 | $ | 14.52 | 17.90 | x | 78.99 | % | 10.65 | % | 83.97 | % | 18.23 | x | $ | 0.20 | 1.72 | % | 19.11 | % | |||||||
| Comparable Group Averages | |||||||||||||||||||||||||||||||
| Averages | $ | 13.25 | $ | 86.89 | $ | 0.74 | $ | 16.77 | 18.40 | x | 78.42 | % | 11.02 | % | 85.17 | % | 18.91 | x | $ | 0.19 | 1.55 | % | 27.03 | % | |||||||
| Medians | $ | 12.39 | $ | 77.25 | $ | 0.79 | $ | 14.84 | 17.00 | x | 74.90 | % | 10.49 | % | 83.11 | % | 16.30 | x | $ | 0.20 | 1.47 | % | 30.11 | % | |||||||
| Comparable Group | |||||||||||||||||||||||||||||||
| ALLB | Alliance Bancorp, Inc. of PA | $ | 11.65 | $ | 63.77 | $ | 0.22 | $ | 15.16 | NM | 76.85 | % | 13.58 | % | 76.85 | % | NM | $ | 0.20 | 1.72 | % | NM | |||||||||
| BFED | Beacon Federal Bancorp of NY | $ | 13.15 | $ | 81.44 | $ | 1.30 | $ | 18.10 | 14.14 | x | 72.65 | % | 7.93 | % | 72.65 | % | 10.12 | x | $ | 0.28 | 2.13 | % | 30.11 | % | ||||||
| CBNJ | Cape Bancorp, Inc. of NJ | $ | 7.68 | $ | 102.25 | $ | 0.76 | $ | 10.94 | 12.80 | x | 70.20 | % | 9.55 | % | 83.30 | % | 10.11 | x | $ | 0.00 | 0.00 | % | 0.00 | % | ||||||
| COBK | Colonial Financial Services of NJ | $ | 12.88 | $ | 51.44 | $ | 0.79 | $ | 17.95 | 15.52 | x | 71.75 | % | 8.52 | % | 71.75 | % | 16.30 | x | $ | 0.00 | 0.00 | % | 0.00 | % | ||||||
| ESSA | ESSA Bancorp, Inc. of PA | $ | 9.84 | $ | 116.85 | $ | 0.40 | $ | 13.60 | 22.88 | x | 72.35 | % | 10.65 | % | 73.16 | % | 24.60 | x | $ | 0.20 | 2.03 | % | 46.51 | % | ||||||
| FXCB | Fox Chase Bancorp, Inc. of PA | $ | 13.06 | $ | 166.57 | $ | 0.33 | $ | 14.44 | 35.30 | x | 90.44 | % | 16.76 | % | 90.44 | % | 39.58 | x | $ | 0.16 | 1.23 | % | 43.24 | % | ||||||
| OSHC | Ocean Shore Holding Co. of NJ | $ | 11.90 | $ | 85.81 | $ | 0.78 | $ | 14.52 | 17.00 | x | 81.96 | % | 8.63 | % | 86.92 | % | 15.26 | x | $ | 0.24 | 2.02 | % | 34.29 | % | ||||||
| ONFC | Oneida Financial Corp. of NY | $ | 10.69 | $ | 73.07 | $ | 0.80 | $ | 12.72 | 12.43 | x | 84.04 | % | 11.13 | % | 117.34 | % | 13.36 | x | $ | 0.48 | 4.49 | % | 55.81 | % | ||||||
| STND | Standard Financial Corp. of PA | $ | 16.75 | $ | 57.18 | $ | 0.93 | $ | 22.96 | 17.63 | x | 72.95 | % | 13.08 | % | 82.92 | % | 18.01 | x | $ | 0.18 | 1.07 | % | 18.95 | % | ||||||
| THRD | TF Financial Corp. of Newtown PA | $ | 24.88 | $ | 70.51 | $ | 1.09 | $ | 27.33 | 17.90 | x | 91.04 | % | 10.33 | % | 96.40 | % | 22.83 | x | $ | 0.20 | 0.80 | % | 14.39 | % | ||||||
| Financial Characteristics(6) | 2nd Step Offering Amount | |||||||||||||||||||||||
| Total Assets | Equity/ Assets | Tang Eq/ Assets | NPAs/ Assets | Reported | Core | Exchange Ratio | ||||||||||||||||||
| ROA | ROE | ROA | ROE | |||||||||||||||||||||
| ($Mil) | (%) | (%) | (%) | (%) | (%) | (%) | (%) | ($Mil) | ||||||||||||||||
| Malvern Bancorp, Inc. | ||||||||||||||||||||||||
| Superrange | $ | 685 | 13.97 | % | 13.97 | % | 2.40 | % | 0.15 | % | 1.06 | % | 0.09 | % | 0.66 | % | 1.0748 | $ | 36.369 | |||||
| Maximum | $ | 681 | 13.40 | % | 13.40 | % | 2.42 | % | 0.14 | % | 1.08 | % | 0.09 | % | 0.66 | % | 0.9346 | $ | 31.625 | |||||
| Midpoint | $ | 677 | 12.89 | % | 12.89 | % | 2.43 | % | 0.14 | % | 1.10 | % | 0.09 | % | 0.67 | % | 0.8127 | $ | 27.500 | |||||
| Minimum | $ | 673 | 12.38 | % | 12.38 | % | 2.45 | % | 0.14 | % | 1.12 | % | 0.08 | % | 0.67 | % | 0.6908 | $ | 23.375 | |||||
| All Non-MHC Public Companies (7) | ||||||||||||||||||||||||
| Averages | $ | 2,753 | 12.56 | % | 11.94 | % | 3.57 | % | 0.16 | % | 0.91 | % | 0.08 | % | 0.01 | % | ||||||||
| Medians | $ | 901 | 11.68 | % | 10.92 | % | 2.45 | % | 0.39 | % | 2.95 | % | 0.27 | % | 2.50 | % | ||||||||
| All Non-MHC State of PA(7) | ||||||||||||||||||||||||
| Averages | $ | 1,426 | 13.43 | % | 12.78 | % | 1.98 | % | 0.54 | % | 4.64 | % | 0.52 | % | 4.50 | % | ||||||||
| Medians | $ | 682 | 14.52 | % | 12.60 | % | 1.70 | % | 0.57 | % | 4.21 | % | 0.45 | % | 4.08 | % | ||||||||
| Comparable Group Averages | ||||||||||||||||||||||||
| Averages | $ | 803 | 14.04 | % | 13.20 | % | 2.86 | % | 0.58 | % | 4.35 | % | 0.60 | % | 4.53 | % | ||||||||
| Medians | $ | 838 | 13.42 | % | 11.79 | % | 3.47 | % | 0.55 | % | 4.79 | % | 0.57 | % | 4.28 | % | ||||||||
| Comparable Group | ||||||||||||||||||||||||
| ALLB | Alliance Bancorp, Inc. of PA | $ | 470 | 17.68 | % | 17.68 | % | 3.71 | % | 0.25 | % | 1.48 | % | 0.26 | % | 1.55 | % | |||||||
| BFED | Beacon Federal Bancorp of NY | $ | 1,027 | 10.92 | % | 10.92 | % | 4.44 | % | 0.55 | % | 5.14 | % | 0.77 | % | 7.19 | % | |||||||
| CBNJ | Cape Bancorp, Inc. of NJ | $ | 1,071 | 13.60 | % | 11.71 | % | 3.99 | % | 0.75 | % | 5.63 | % | 0.95 | % | 7.13 | % | |||||||
| COBK | Colonial Financial Services of NJ | $ | 604 | 11.87 | % | 11.87 | % | 4.81 | % | 0.55 | % | 4.66 | % | 0.53 | % | 4.44 | % | |||||||
| ESSA | ESSA Bancorp, Inc. of PA | $ | 1,097 | 14.72 | % | 14.58 | % | 2.15 | % | 0.47 | % | 3.13 | % | 0.43 | % | 2.91 | % | |||||||
| FXCB | Fox Chase Bancorp, Inc. of PA | $ | 994 | 18.53 | % | 18.53 | % | 3.37 | % | 0.45 | % | 2.39 | % | 0.41 | % | 2.13 | % | |||||||
| OSHC | Ocean Shore Holding Co. of NJ | $ | 995 | 10.53 | % | 9.98 | % | 0.54 | % | 0.55 | % | 4.92 | % | 0.61 | % | 5.48 | % | |||||||
| ONFC | Oneida Financial Corp. of NY | $ | 656 | 13.25 | % | 9.87 | % | 0.78 | % | 0.89 | % | 6.75 | % | 0.83 | % | 6.27 | % | |||||||
| STND | Standard Financial Corp. of PA | $ | 437 | 17.92 | % | 16.12 | % | 1.24 | % | 0.74 | % | 4.21 | % | 0.73 | % | 4.13 | % | |||||||
| THRD | TF Financial Corp. of Newtown PA | $ | 682 | 11.35 | % | 10.79 | % | 3.56 | % | 0.57 | % | 5.21 | % | 0.45 | % | 4.08 | % | |||||||
| (1) | Average of High/Low or Bid/Ask price per share. |
| (2) | EPS (estimate core basis) is based on actual trailing 12 month data, adjusted to omit non-operating items on a tax-effected basis, and is shown on a pro forma basis where appropriate. |
| (3) | P/E = Price to earnings; P/B = Price to book; P/A = Price to assets; P/TB = Price to tangible book value; and P/Core = Price to core earnings. |
| (4) | Indicated 12 month dividend, based on last quarterly dividend declared. |
| (5) | Indicated 12 month dividend as a percent of trailing 12 month estimated core earnings. |
| (6) | ROA (return on assets) and ROE (return on equity) are indicated ratios based on trailing 12 month common earnings and average common equity and total assets balances. |
| (7) | Excludes from averages and medians those companies the subject of actual or rumored acquisition activities or unusual operating characteristics. |
| Source: | SNL Financial, LC. and RP® Financial, LC. calculations. The information provided in this table has been obtained from sources we believe are reliable, but we cannot guarantee the accuracy or completeness of such information. |
| RP® Financial, LC. | VALUATION ANALYSIS |
| IV.21 |
be deposit withdrawals, which results in understating the pro forma P/A ratio which is computed herein. At the $49.6 million midpoint of the valuation range, the Company’s value equaled 7.33% of pro forma assets. Comparatively, the Peer Group companies exhibited an average P/A ratio of 11.02%, which implies a discount of 33.48% has been applied to the Company’s pro forma P/A ratio. In comparison to the Peer Group’s median P/A ratio of 10.49%, the Company’s pro forma P/A ratio at the midpoint value reflects a discount of 30.12%.
Comparison to Recent Offerings
As indicated at the beginning of this chapter, RP Financial’s analysis of recent conversion offering pricing characteristics at closing and in the aftermarket has been limited to a “technical” analysis and, thus, the pricing characteristics of recent conversion offerings can not be a primary determinate of value. Particular focus was placed on the P/TB approach in this analysis, since the P/E multiples do not reflect the actual impact of reinvestment and the source of the stock proceeds (i.e., external funds vs. deposit withdrawals). As discussed previously, one second-step conversions has been completed in 2012 and closed at a pro forma price/tangible book ratio of 65.6% (see Table 4.2). Cheviot Financial’s stock price closed 2.6% above its offering price after one week of trading and was up 9.7% from its offering price through May 4, 2012. In comparison, the Company’s pro forma price/tangible book ratio at the appraised midpoint value reflects a discount of 13.34% and at the top of the super range reflects a premium of 4.41%.
Valuation Conclusion
Based on the foregoing, it is our opinion that, as of May 4, 2012, the estimated aggregate pro forma valuation of the shares of the Company to be issued and outstanding at the end of the conversion offering – including (1) newly-issued shares representing the MHC’s current ownership interest in the Company and (2) exchange shares issued to existing public shareholders of the Company - was $49,593,660 at the midpoint, equal to 4,959,366 shares at a per share value of $10.00. The resulting range of value and pro forma shares, all based on $10.00 per share, are as follows: $42,154,610 or 4,215,461 shares at the minimum; $57,032,710 or 5,703,271 shares at the maximum; and $65,587,620 or 6,558,762 shares, at the super maximum (also known as “maximum, as adjusted”).
| RP® Financial, LC. | VALUATION ANALYSIS |
| IV.22 |
Based on this valuation and taking into account the ownership interest represented by the shares owned by the MHC, the midpoint of the offering range is $27,500,000, equal to 2,750,000 shares at $10.00 per share. The resulting offering range and offering shares, all based on $10.00 per share, are as follows: $23,375,000 or 2,337,500 shares, at the minimum; $31,625,000 or 3,162,500 shares at the maximum; and $36,368,750 or 3,636,875 shares at the super maximum. The pro forma valuation calculations relative to the Peer Group are shown in Table 4.3 and are detailed in Exhibit IV-7 and Exhibit IV-8.
Establishment of the Exchange Ratio
The conversion regulations provide that in a conversion of a mutual holding company, the minority stockholders are entitled to exchange the public shares for newly issued shares in the fully-converted company. The Board of Directors of Malvern Bancorp has independently determined the exchange ratio, which has been designed to preserve the current aggregate percentage ownership in the Company held by the public shareholders. The exchange ratio to be received by the existing minority shareholders of the Company will be determined at the end of the offering, based on the total number of shares sold in the offering and the final appraisal. Based on the valuation conclusion herein, the resulting offering value and the $10.00 per share offering price, the indicated exchange ratio at the midpoint is 0.8127 shares of the Company for every share held by public shareholders. Furthermore, based on the offering range of value, the indicated exchange ratio is 0.6908 at the minimum, 0.9346 at the maximum and 1.0748 at the super maximum. RP Financial expresses no opinion on the proposed exchange of newly issued Company shares for the shares held by the public stockholders or on the proposed exchange ratio.
| RP® Financial, LC. | LIST OF EXHIBITS |
EXHIBITS
| RP® Financial, LC. | LIST OF EXHIBITS |
LIST OF EXHIBITS
| Exhibit Number | Description | ||
| I-1 | Map of Office Locations | ||
| I-2 | Audited Financial Statements | ||
| I-3 | The Supervisory Agreements | ||
| I-4 | Key Operating Ratios | ||
| I-5 | Investment Portfolio Composition | ||
| I-6 | Yields and Costs | ||
| I-7 | Loan Loss Allowance Activity | ||
| I-8 | Interest Rate Risk Analysis | ||
| I-9 | Fixed and Adjustable Rate Loans | ||
| I-10 | Loan Portfolio Composition | ||
| I-11 | Contractual Maturity by Loan Type | ||
| I-12 | Loan Originations, Purchases, Sales and Repayments | ||
| I-13 | Non-Performing Assets | ||
| I-14 | Deposit Composition | ||
| I-15 | Maturity of Time Deposits | ||
| II-1 | Description of Office Properties | ||
| II-2 | Historical Interest Rates | ||
| RP® Financial, LC. | LIST OF EXHIBITS |
LIST OF EXHIBITS (continued)
| Exhibit Number | Description | ||
| III-1 | General Characteristics of Publicly-Traded Institutions | ||
| III-2 | Public Market Pricing of Mid-Atlantic Thrift Institutions | ||
| III-3 | Peer Group Market Area Comparative Analysis | ||
| IV-1 | Stock Prices: As of May 4, 2012 | ||
| IV-2 | Historical Stock Price Indices | ||
| IV-3 | Historical Thrift Stock Indices | ||
| IV-4 | Market Area Acquisition Activity | ||
| IV-5 | Director and Senior Management Summary Resumes | ||
| IV-6 | Pro Forma Regulatory Capital Ratios | ||
| IV-7 | Pro Forma Analysis Sheet | ||
| IV-8 | Pro Forma Effect of Conversion Proceeds | ||
| IV-9 | Peer Group Core Earnings Analysis | ||
| V-1 | Firm Qualifications Statement | ||
EXHIBIT I-1
Malvern Bancorp, Inc.
Map of Office Locations
Exhibit I-1
Malvern Bancorp, Inc.
Map of Office Locations

EXHIBIT I-2
Malvern Bancorp, Inc.
Audited Financial Statements
[Incorporated by Reference]
EXHIBIT I-3
Malvern Bancorp, Inc.
The Supervisory Agreements
Exhibit I-3
Malvern Bancorp, Inc.
The Supervisory Agreements
In October 2010, Malvern Federal Bancorp, Malvern Federal Savings Bank and Malvern Federal Mutual Holding Company entered into Supervisory Agreements (the “Supervisory Agreement(s)”) with the OTS. The agreements provide, among other things, that within specified time frames:
| • | we were required to submit an updated, comprehensive business plan to the OTS that, among other things, addressed Malvern Federal Savings Bank’s strategy to improve core earnings, maintain appropriate levels of liquidity and achieve profitability on a consistent basis. We must submit quarterly reports to the OCC (and, previously, the OTS) regarding Malvern Federal Savings Bank’s compliance with the plan; | |
| • | Malvern Federal Savings Bank must ensure that its financial reports to the OCC (and, previously, the OTS) are accurately prepared and timely filed in accordance with applicable law, regulations and regulatory guidance; | |
| • | we were required to submit a written internal asset review and classification program to the OTS that, among other things, ensures the accurate and timely identification and classification of Malvern Federal Savings Bank’s classified and criticized assets, and requires asset reviews for commercial real estate, construction and land development, multi-family and commercial loans by an independent third-party loan review consultant not less than every six months; | |
| • | we were required to submit to the OTS a detailed, written plan with targeted levels of Malvern Federal Savings Bank’s problem assets (as defined), describing our strategies to reduce the levels of our problem assets to the targeted levels and the development of specific workout plans for problem assets in the amount of $500,000 or more and we must submit quarterly asset reports to the OCC (and, previously, the OTS) regarding, among other things, Malvern Federal Savings Bank’s compliance with such plans; | |
| • | we were required to revise Malvern Federal Savings Bank’s policies, procedures and methodologies relating to the allowance for loan and lease losses (“ALLL”) to be in compliance with all applicable laws, regulations and regulatory guidance, and we must provide for a quarterly independent third-party review and validation of Malvern Federal Savings Bank’s ALLL; | |
| • | we were required to submit to the OTS a written program of its policies and procedures for identifying, monitoring and controlling risks associated with concentrations of commercial real estate credit which, among other things, establishes comprehensive concentration limits, provides for specific review procedures and reporting requirements to identify, monitor and control risks associated with concentrations of credit and contain a written action plan, with specific time frames, for bringing Malvern Federal Savings Bank into compliance with its concentration of credit limits; | |
| • | Malvern Federal Savings Bank may not make, invest in, or purchase any new commercial real estate loans and/or commercial and industrial loans without the prior written non-objection of the OCC (and, previously, the OTS), other than with respect to any refinancing, extension or modification of an existing commercial real estate or commercial and industrial loan where no new funds are advanced; | |
| • | Malvern Federal Savings Bank was required to develop and implement an information technology policy; |
Exhibit I-3 (continued)
Malvern Bancorp, Inc.
The Supervisory Agreements
| • | Malvern Federal Bancorp and Malvern Federal Mutual Holding Company are prohibited from declaring or paying dividends or making any other capital distributions (as defined) without receiving the prior written approval of the FRB (and, previously, the OTS); and | |
| • | Malvern Federal Bancorp and Malvern Federal Mutual Holding Company are required to ensure Malvern Federal Savings Bank’s compliance with its Supervisory Agreement. |
Malvern Federal Savings Bank, Malvern Federal Bancorp and Malvern Federal Mutual Holding Company have complied in all material respects with all applicable terms of the Supervisory Agreements.
As a result of the Supervisory Agreement with Malvern Federal Savings Bank, it is subject to certain additional restrictions pursuant to Federal banking regulations, including the following:
| • | Malvern Federal Savings Bank must limit its asset growth in any quarter to an amount which does not exceed the net interest credited on deposit liabilities during the quarter, unless otherwise permitted by the OCC (and, previously, the OTS); | |
| • | Malvern Federal Savings Bank is required to provide the OCC (and, previously, the OTS) with prior notice of any new director or senior executive officer; | |
| • | Malvern Federal Savings Bank is restricted from making any “golden parachute payments,” as defined; | |
| • | Malvern Federal Savings Bank may not enter into, renew, extend or revise any contractual arrangements related to compensation or benefits with any director or officer without receiving prior written non-objection from the OCC (and, previously, the OTS); | |
| • | Malvern Federal Savings Bank may not declare or pay any dividends or make other capital distributions without the prior written approval of the OCC (and, previously, the OTS); | |
| • | Malvern Federal Savings Bank’s ability to engage in transactions with affiliates, as defined, is restricted; and | |
| • | Malvern Federal Savings Bank may not engage in the use of brokered deposits without the prior written non-objection of the OCC (and, previously, the OTS). | |
| Source: Malvern Bancorp’s prospectus. | ||
EXHIBIT I-4
Malvern Bancorp, Inc.
Key Operating Ratios
Exhibit I-4
Malvern Bancorp, Inc.
Key Operating Ratios
| Six Months Ended March 31, | Year Ended September 30, | ||||||||||||||
| 2012 | 2011 | 2011 | 2010 | 2009 | 2008 | 2007 | |||||||||
| Selected Financial Ratios and Other Data: | |||||||||||||||
| Performance Ratios: | |||||||||||||||
| Return on assets (ratio of net income to average total assets) | 0.44 | % | (1.57 | )% | (0.90 | )% | (0.45 | )% | 0.15 | % | 0.25 | % | 0.45 | % | |
| Return on average equity (ratio of net income to average equity) | 4.77 | (16.57 | ) | (9.64 | ) | (4.53 | ) | 1.46 | 2.78 | 5.76 | |||||
| Interest rate spread(2) | 2.78 | 2.89 | 2.93 | 2.83 | 2.17 | 2.18 | 2.25 | ||||||||
| Net interest margin(3) | 2.90 | 3.00 | 3.06 | 3.01 | 2.47 | 2.61 | 2.65 | ||||||||
| Non-interest expenses to average total assets | 2.64 | 2.59 | 2.72 | 2.48 | 2.13 | 2.19 | 1.92 | ||||||||
| Efficiency ratio(4) | 80.73 | 84.69 | 87.29 | 79.75 | 80.42 | 77.40 | 67.75 | ||||||||
| Asset Quality Ratios: | |||||||||||||||
| Non-accrual loans as a percent of gross loans | 2.48 | 3.05 | 2.52 | 3.60 | 2.38 | 1.52 | 0.51 | ||||||||
| Non-performing assets as a percent of total assets | 2.53 | 3.20 | 3.19 | 3.49 | 2.90 | 1.38 | 0.45 | ||||||||
| Non-performing assets and performing troubled debt restructurings as a percent of total assets | 3.80 | 4.89 | 4.74 | 5.16 | 2.91 | 1.39 | 0.47 | ||||||||
| Allowance for loan losses as a percent of gross loans | 1.71 | 1.97 | 1.97 | 1.48 | 0.96 | 0.96 | 0.97 | ||||||||
| Allowance for loan losses as a percent of non-accrual loans | 68.85 | 64.50 | 78.21 | 41.07 | 40.28 | 64.12 | 200.31 | ||||||||
| Net charge-offs to average loans outstanding | 0.84 | 2.91 | 1.97 | 1.19 | 0.35 | 0.12 | 0.03 | ||||||||
| Capital Ratios(5): | |||||||||||||||
| Total risk-based capital to risk weighted assets | 13.71 | 12.51 | 12.01 | 12.85 | 12.67 | 13.33 | 11.24 | ||||||||
| Tier 1 risk-based capital to risk weighted assets | 12.45 | 11.25 | 10.76 | 11.83 | 11.96 | 12.40 | 10.36 | ||||||||
| Tangible capital to tangible assets | 8.27 | 8.01 | 7.54 | 8.24 | 9.07 | 9.64 | 8.03 | ||||||||
| Tier 1 leverage (core) capital to adjusted tangible assets | 8.27 | 8.01 | 7.54 | 8.24 | 9.07 | 9.64 | 8.03 | ||||||||
| Shareholders’ equity to total assets | 9.50 | 8.90 | 9.04 | 9.19 | 10.10 | 10.76 | 7.98 | ||||||||
| Tangible shareholders’ equity to total assets | 9.50 | 8.90 | 9.04 | 9.19 | 10.10 | 10.76 | 7.98 | ||||||||
| Other Data: | |||||||||||||||
| Number of full service financial center offices | 8 | 8 | 8 | 8 | 7 | 7 | 7 | ||||||||
| (1) | Earnings per share for the fiscal year ended September 30, 2008, is for period from May 20, 2008, the date of Malvern Federal Bancorp’s initial stock issuance, through September 30, 2008. | |
| (2) | Represents the difference between the weighted average yield on interest earning assets and the weighted average cost of interest bearing liabilities. | |
| (3) | Net interest income divided by average interest earning assets. | |
| (4) | Represents the ratio obtained from dividing non-interest expense by the sum of net interest income and total other income. | |
| (5) | Other than shareholders’ equity to total assets and tangible shareholders’ equity to total assets, all capital ratios are for Malvern Federal Savings Bank only. | |
Source: Malvern Bancorp’s prospectus.
EXHIBIT I-5
Malvern Bancorp, Inc.
Investment Portfolio Composition
Exhibit I-5
Malvern Bancorp, Inc.
Investment Portfolio Composition
| At March 31, | At September 30, | ||||||||||||||||||||||||
| 2012 | 2011 | 2010 | 2009 | ||||||||||||||||||||||
| Amortized Cost | Fair Value | Amortized Cost | Fair Value | Amortized Cost | Fair Value | Amortized Cost | Fair Value | ||||||||||||||||||
| (In thousands) | |||||||||||||||||||||||||
| Securities available for sale: | |||||||||||||||||||||||||
| U.S. government obligations | $ | 4,999 | $ | 5,005 | $ | 4,998 | $ | 5,010 | $ | 4,997 | $ | 4,997 | $ | 999 | $ | 1,011 | |||||||||
| U.S. government agencies(1) | 24,566 | 24,675 | 28,372 | 28,442 | 15,705 | 15,754 | 8,946 | 9,042 | |||||||||||||||||
| State and municipal obligations | 2,624 | 2,606 | 952 | 963 | 1,199 | 1,207 | 1,768 | 1,759 | |||||||||||||||||
| Corporate debt securities | 1,000 | 758 | 2,185 | 2,214 | 1,451 | 1,475 | 1,288 | 1,326 | |||||||||||||||||
| Single issuer trust preferred security | 1,502 | 1,532 | 1,000 | 790 | 1,000 | 759 | 1,000 | 638 | |||||||||||||||||
| Mortgage-backed securities: | |||||||||||||||||||||||||
| Federal Home Loan Mortgage Association | 2,103 | 2,226 | 3,397 | 3,589 | 4,808 | 5,027 | 7,072 | 7,268 | |||||||||||||||||
| Federal Home Loan Mortgage Corporation | 556 | 579 | 968 | 1,016 | 1,324 | 1,385 | 1,774 | 1,830 | |||||||||||||||||
| Government National Mortgage Association | 140 | 143 | 147 | 151 | 165 | 169 | 203 | 206 | |||||||||||||||||
| Collateralized mortgage obligations | 43,522 | 44,177 | 31,838 | 32,214 | 9,798 | 9,946 | 4,015 | 4,018 | |||||||||||||||||
| Total available for sale | 81,012 | 81,701 | 73,857 | 74,389 | 40,447 | 40,719 | 27,065 | 27,098 | |||||||||||||||||
| Securities held to maturity: | |||||||||||||||||||||||||
| Mortgage-backed securities: | |||||||||||||||||||||||||
| Government National Mortgage Association | 215 | 222 | 232 | 241 | 266 | 275 | 300 | 307 | |||||||||||||||||
| Federal Home Loan Mortgage Association | 481 | 524 | 3,565 | 3,783 | 4,450 | 4,650 | 4,542 | 4,635 | |||||||||||||||||
| Total held to maturity | 696 | 746 | 3,797 | 4,024 | 4,716 | 4,925 | 4,842 | 4,942 | |||||||||||||||||
| Total investment securities | $ | 81,708 | $ | 82,447 | $ | 77,654 | $ | 78,413 | $ | 45,163 | $ | 45,644 | $ | 31,907 | $ | 32,040 | |||||||||
| (1) Includes FHLB notes. | |
Source: Malvern Bancorp’s prospectus.
EXHIBIT I-6
Malvern Bancorp, Inc.
Yields and Costs
Exhibit I-6
Malvern Bancorp, Inc.
Yields and Costs
| Six Months Ended March 31, | |||||||||||||||||||
| 2012 | 2011 | ||||||||||||||||||
| Average Outstanding Balance | Interest Earned/Paid | Average Yield/ Rate | Average Outstanding Balance | Interest Earned/Paid | Average Yield/ Rate | ||||||||||||||
| (Dollars in Thousands) | |||||||||||||||||||
| Interest Earning Assets: | |||||||||||||||||||
| Loans receivable(1) | $ | 488,462 | $ | 12,458 | 5.10 | % | $ | 538,897 | $ | 14,364 | 5.33 | % | |||||||
| Investment securities | 84,846 | 869 | 2.04 | 75,420 | 735 | 1.95 | |||||||||||||
| Deposits in other banks | 38,607 | 18 | 0.10 | 25,526 | 19 | 0.15 | |||||||||||||
| FHLB stock | 5,069 | 1 | 0.04 | 6,232 | — | 0.00 | |||||||||||||
| Total interest earning assets(1) | 616,984 | 13,346 | 4.32 | 646,075 | 15,118 | 4.68 | |||||||||||||
| Non-interest earning assets | 44,336 | 46,729 | |||||||||||||||||
| Total assets | $ | 661,320 | $ | 692,804 | |||||||||||||||
| Interest Bearing Liabilities: | |||||||||||||||||||
| Demand and NOW accounts | $ | 90,122 | 149 | 0.34 | $ | 89,649 | 298 | 0.66 | |||||||||||
| Money Market accounts | 85,403 | 285 | 0.66 | 86,527 | 480 | 1.11 | |||||||||||||
| Savings accounts | 45,132 | 23 | 0.10 | 41,048 | 38 | 0.19 | |||||||||||||
| Certificate accounts | 304,564 | 3,085 | 2.02 | 336,412 | 3,716 | 2.21 | |||||||||||||
| Total deposits | 525,221 | 3,542 | 1.34 | 553,636 | 4,532 | 1.64 | |||||||||||||
| Borrowed funds | 48,847 | 862 | 3.52 | 50,402 | 879 | 3.49 | |||||||||||||
| Total interest-bearing liabilities | 574,068 | 4,404 | 1.54 | 604,038 | 5,411 | 1.79 | |||||||||||||
| Non-interest bearing liabilities | 25,597 | 23,064 | |||||||||||||||||
| Total liabilities | 599,665 | 627,102 | |||||||||||||||||
| Shareholders’ equity | 61,655 | 65,702 | |||||||||||||||||
| Total liabilities and shareholders’ equity | $ | 661,320 | $ | 692,804 | |||||||||||||||
| Net Interest-earning assets | $ | 42,916 | $ | 42,037 | |||||||||||||||
| Net interest income | |||||||||||||||||||
| Net interest spread | $ | 8,942 | 2.78 | % | $ | 9,707 | 2.89 | % | |||||||||||
| Net interest margin(2) | 2.90 | % | 3.00 | % | |||||||||||||||
| Average interest- earning assets to average interest- bearing liabilities | 107.48 | % | 106.96 | % | |||||||||||||||
| (1) | Includes non-accrual loans during the respective periods. Calculated net of deferred fees and discounts and allowance for loan losses. | |
| (2) | Equals net interest income divided by average interest-earning assets. | |
Exhibit I-6 (continued)
Malvern Bancorp, Inc.
Yields and Costs
| Year Ended September 30, | ||||||||||||||||||||||||||||
| 2011 | 2010 | 2009 | ||||||||||||||||||||||||||
| Average Outstanding Balance | Interest Earned/ Paid | Average Yield/ Rate | Average Outstanding Balance | Interest Earned/ Paid | Average Yield/ Rate | Average Outstanding Balance | Interest Earned/Paid | Average Yield/ Rate | ||||||||||||||||||||
| (Dollars in thousands) | ||||||||||||||||||||||||||||
| Interest Earning Assets: | ||||||||||||||||||||||||||||
| Loans receivable(1) | $ | 530,497 | $ | 28,185 | 5.31 | % | $ | 583,995 | $ | 32,085 | 5.49 | % | $ | 597,744 | $ | 33,711 | 5.64 | % | ||||||||||
| Investment securities | 78,147 | 1,510 | 1.93 | 33,812 | 1,025 | 3.03 | 27,993 | 925 | 3.30 | |||||||||||||||||||
| Deposits in other banks | 24,100 | 31 | 0.13 | 24,497 | 38 | 0.16 | 15,158 | 65 | 0.43 | |||||||||||||||||||
| FHLB stock | 5,905 | — | 0.00 | 6,567 | — | 0.00 | 6,513 | — | 0.00 | |||||||||||||||||||
| Total interest earning assets(1) | 638,649 | 29,726 | 4.65 | 648,871 | 33,148 | 5.11 | 647,408 | 34,701 | 5.36 | |||||||||||||||||||
| Non-interest earning assets | 42,578 | 42,100 | 32,550 | |||||||||||||||||||||||||
| Total assets | $ | 681,227 | $ | 690,971 | $ | 679,958 | ||||||||||||||||||||||
| Interest Bearing Liabilities: | ||||||||||||||||||||||||||||
| Demand and NOW accounts | $ | 90,674 | 519 | 0.57 | $ | 87,240 | 845 | 0.97 | $ | 76,407 | 1,321 | 1.73 | ||||||||||||||||
| Money Market accounts | 87,329 | 915 | 1.05 | 63,788 | 648 | 1.02 | 58,167 | 960 | 1.65 | |||||||||||||||||||
| Savings accounts | 44,237 | 78 | 0.18 | 41,002 | 110 | 0.27 | 38,661 | 136 | 0.35 | |||||||||||||||||||
| Certificate accounts | 321,918 | 6,941 | 2.16 | 324,973 | 8,511 | 2.62 | 306,213 | 11,061 | 3.61 | |||||||||||||||||||
| Total deposits | 544,158 | 8,453 | 1.55 | 517,003 | 10,114 | 1.96 | 479,448 | 13,478 | 2.81 | |||||||||||||||||||
| Borrowed funds | 49,874 | 1,745 | 3.50 | 80,714 | 3,527 | 4.37 | 105,873 | 5,203 | 4.92 | |||||||||||||||||||
| Total interest-bearing liabilities | 594,032 | 10,198 | 1.72 | 597,717 | 13,641 | 2.28 | 585,321 | 18,681 | 3.19 | |||||||||||||||||||
| Non-interest bearing liabilities | 23,764 | 24,126 | 25,443 | |||||||||||||||||||||||||
| Total liabilities | 617,796 | 621,843 | 610,764 | |||||||||||||||||||||||||
| Shareholders’ equity | 63,431 | �� | 69,128 | 69,194 | ||||||||||||||||||||||||
| Total liabilities and shareholders’ equity | $ | 681,227 | $ | 690,971 | $ | 679,958 | ||||||||||||||||||||||
| Net Interest-earning assets | $ | 44,617 | $ | 51,154 | $ | 62,087 | ||||||||||||||||||||||
| Net interest income | $ | 19,528 | $ | 19,507 | $ | 16,020 | ||||||||||||||||||||||
| Net interest spread | 2.93 | % | 2.83 | % | 2.17 | % | ||||||||||||||||||||||
| Net interest margin | 3.06 | % | 3.01 | % | 2.47 | % | ||||||||||||||||||||||
| Average interest earning assets to average interest- bearing liabilities | 107.51 | % | 108.56 | % | 110.61 | % | ||||||||||||||||||||||
| (1) | Calculated net of deferred loan fees, loan discounts, loans in process and loss reserves. | |
Source: Malvern Bancorp’s prospectus.
EXHIBIT I-7
Malvern Bancorp, Inc.
Loan Loss Allowance Activity
Exhibit I-7
Malvern Bancorp, Inc.
Loan Loss Allowance Activity
| Six Months Ended March 31, | Year Ended September 30, | |||||||||||||||||||||
| 2012 | 2011 | 2011 | 2010 | 2009 | 2008 | 2007 | ||||||||||||||||
| (Dollars in thousands) | ||||||||||||||||||||||
| Balance at beginning of period | $ | 10,101 | $ | 8,157 | $ | 8,157 | $ | 5,718 | $ | 5,505 | $ | 4,541 | $ | 3,393 | ||||||||
| Provision for loan losses | 25 | 10,042 | 12,392 | 9,367 | 2,280 | 1,609 | 1,298 | |||||||||||||||
| Charge-offs: | ||||||||||||||||||||||
| Residential mortgage | 975 | 2,271 | 2,478 | 824 | 124 | 144 | — | |||||||||||||||
| Construction and Development: | ||||||||||||||||||||||
| Residential and commercial | 412 | 107 | 1,307 | 4,133 | — | — | — | |||||||||||||||
| Commercial: | ||||||||||||||||||||||
| Commercial real estate | 855 | 2,214 | 2,460 | 927 | 1,760 | 90 | — | |||||||||||||||
| Multi-family | — | 164 | 164 | 525 | — | — | — | |||||||||||||||
| Other | 88 | — | 278 | — | — | 4 | — | |||||||||||||||
| Consumer: | ||||||||||||||||||||||
| Home equity lines of credit | 51 | 126 | 166 | 168 | — | — | — | |||||||||||||||
| Second mortgages | 865 | 2,980 | 3,691 | 334 | 153 | 393 | 135 | |||||||||||||||
| Other | 22 | 2 | 6 | 22 | 60 | 19 | 25 | |||||||||||||||
| Total charge-offs | 3,268 | 7,864 | 10,550 | 6,933 | 2,097 | 650 | 160 | |||||||||||||||
| Recoveries: | ||||||||||||||||||||||
| Residential mortgage | — | — | 1 | — | — | — | — | |||||||||||||||
| Construction and Development: | — | |||||||||||||||||||||
| Residential and commercial | 1,139 | — | — | — | 25 | — | — | |||||||||||||||
| Commercial: | ||||||||||||||||||||||
| Commercial real estate | — | 1 | 1 | — | — | — | — | |||||||||||||||
| Multi-family | — | 1 | 1 | 1 | — | — | — | |||||||||||||||
| Other | 2 | 1 | 5 | — | — | — | — | |||||||||||||||
| Consumer: | ||||||||||||||||||||||
| Home equity lines of credit | — | 3 | 3 | — | — | — | — | |||||||||||||||
| Second mortgages | 75 | 20 | 82 | — | — | 2 | 3 | |||||||||||||||
| Other | 2 | 5 | 9 | 4 | 5 | 3 | 7 | |||||||||||||||
| Total recoveries | 1,218 | 31 | 102 | 5 | 30 | 5 | 10 | |||||||||||||||
| Net charge-offs | 2,050 | 7,833 | 10,448 | 6,928 | 2,067 | 645 | 150 | |||||||||||||||
| Balance at end of period | $ | 8,076 | $ | 10,366 | $ | 10,101 | $ | 8,157 | $ | 5,718 | $ | 5,505 | $ | 4,541 | ||||||||
| Ratios: | ||||||||||||||||||||||
| Ratio of allowance for loan losses to non-accrual loans | 68.85 | % | 64.50 | % | 78.21 | % | 41.07 | % | 40.28 | % | 64.12 | % | 200.31 | % | ||||||||
| Ratio of net charge-offs to average loans outstanding(1) | 0.84 | % | 2.91 | % | 1.97 | % | 1.19 | % | 0.35 | % | 0.12 | % | 0.03 | % | ||||||||
| Ratio of net charge-offs to total allowance for loan losses(1) | 50.78 | % | 151.12 | % | 103.43 | % | 84.93 | % | 36.15 | % | 11.72 | % | 3.30 | % | ||||||||
| (1) | Annualized. |
Source: Malvern Bancorp’s prospectus.
EXHIBIT I-8
Malvern Bancorp, Inc.
Interest Rate Risk Analysis
Exhibit I-8
Malvern Bancorp, Inc.
Interest Rate Risk Analysis
| As of March 31, 2012 | As of September 30, 2011 | ||||||||||||||||||
| Changes in Interest Rates (basis points)(1) | Amount | Dollar Change from Base | Percentage Change from Base | Amount | Dollar Change from Base | Percentage Change from Base | |||||||||||||
| (Dollars in thousands) | |||||||||||||||||||
| +300 | $ | 60,027 | $ | (8,704 | ) | (13 | )% | $ | 63,164 | $ | (5,236 | ) | (8 | )% | |||||
| +200 | 67,077 | (1,654 | ) | (2 | ) | 67,755 | (645 | ) | (1 | ) | |||||||||
| +100 | 70,830 | 2,099 | 3 | 69,752 | 1,352 | 2 | |||||||||||||
| 0 | 68,731 | — | — | 68,400 | — | — | |||||||||||||
| -100 | 58,582 | (10,149 | ) | (15 | ) | 65,900 | (2,500 | ) | (4 | ) | |||||||||
| (1) | Assumes an instantaneous uniform change in interest rates. A basis point equals 0.01%. |
Source: Malvern Bancorp’s prospectus.
EXHIBIT I-9
Malvern Bancorp, Inc.
Fixed and Adjustable Rate Loans
Exhibit I-9
Malvern Bancorp, Inc.
Fixed and Adjustable Rate Loans
| March 31, 2012 | September 30, | ||||||||||||||||||||||||||||||||||||
| 2011 | 2010 | 2009 | 2008 | 2007 | |||||||||||||||||||||||||||||||||
| Amount | Percent | Amount | Percent | Amount | Percent | Amount | Percent | Amount | Percent | Amount | Percent | ||||||||||||||||||||||||||
| (Dollars in thousands) | |||||||||||||||||||||||||||||||||||||
| Fixed-Rate Loans: | |||||||||||||||||||||||||||||||||||||
| Residential mortgage(1) | $ | 202,441 | 42.8 | % | $ | 211,405 | 41.2 | % | $ | 201,285 | 36.4 | % | $ | 227,712 | 38.2 | % | $ | 218,214 | 38.1 | % | $ | 163,463 | 34.2 | % | |||||||||||||
| Construction and Development: | |||||||||||||||||||||||||||||||||||||
| Residential and commercial | 3,292 | 0.7 | 4,250 | 0.8 | 968 | 0.2 | 5,382 | 0.9 | 4,505 | 0.8 | 8,626 | 1.8 | |||||||||||||||||||||||||
| Land loans | — | — | 1,376 | 0.3 | 1,312 | 0.3 | 1,558 | 0.3 | 1,575 | 0.2 | 1,591 | 0.3 | |||||||||||||||||||||||||
| Total fixed-rate construction and development loans | 3,292 | 0.7 | 5,626 | 1.1 | 2,280 | 0.5 | 6,940 | 1.2 | 6,080 | 1.0 | 10,217 | 2.1 | |||||||||||||||||||||||||
| Commercial: | |||||||||||||||||||||||||||||||||||||
| Commercial real estate | 43,089 | 9.1 | 40,231 | 7.8 | 40,833 | 7.4 | 56,126 | 9.4 | 52,406 | 9.1 | 35,053 | 7.4 | |||||||||||||||||||||||||
| Multi-family | 1,688 | 0.4 | 932 | 0.2 | 950 | 0.2 | 3,519 | 0.6 | — | — | — | — | |||||||||||||||||||||||||
| Other | 483 | 0.1 | 1,643 | 0.3 | 1,733 | 0.3 | 3,798 | 0.6 | 4,441 | 0.8 | 3,847 | 0.8 | |||||||||||||||||||||||||
| Total fixed-rate commercial loans | 45,260 | 9.6 | 42,806 | 8.3 | 43,516 | 7.9 | 63,443 | 10.6 | 56,847 | 9.9 | 38,900 | 8.2 | |||||||||||||||||||||||||
| Consumer: | |||||||||||||||||||||||||||||||||||||
| Home equity lines of credit | — | — | — | — | — | — | — | — | — | — | — | — | |||||||||||||||||||||||||
| Second mortgages | 72,188 | 15.3 | 85,881 | 16.8 | 105,825 | 19.1 | 113,943 | 19.1 | 103,741 | 18.1 | 78,706 | 16.5 | |||||||||||||||||||||||||
| Other | 531 | 0.1 | 552 | 0.1 | 822 | 0.1 | 867 | 0.2 | 960 | 0.2 | 1,097 | 0.2 | |||||||||||||||||||||||||
| Total fixed-rate consumer loans | 72,719 | 15.4 | 86,433 | 16.9 | 106,647 | 19.2 | 114,810 | 19.3 | 104,701 | 18.3 | 79,803 | 16.7 | |||||||||||||||||||||||||
| Total fixed-rate loans | $ | 323,712 | 68.5 | $ | 346,270 | 67.5 | $ | 353,728 | 64.0 | $ | 412,905 | 69.3 | $ | 385,842 | 67.3 | $ | 292,383 | 61.2 | |||||||||||||||||||
| Adjustable-Rate Loans: | |||||||||||||||||||||||||||||||||||||
| Residential mortgage | $ | 17,770 | 3.8 | % | $ | 17,925 | 3.5 | % | $ | 29,681 | 5.4 | % | $ | 24,596 | 4.1 | % | $ | 29,904 | 5.2 | % | $ | 29,998 | 6.3 | % | |||||||||||||
| Construction and Development: | |||||||||||||||||||||||||||||||||||||
| Residential and commercial | 18,554 | 3.9 | 21,755 | 4.2 | 29,461 | 5.3 | 32,126 | 5.4 | 40,946 | 7.1 | 50,244 | 10.5 | |||||||||||||||||||||||||
| Land loans | 632 | 0.1 | 1,346 | 0.3 | 1,677 | 0.3 | 1,679 | 0.3 | 2,955 | 0.5 | 5,074 | 1.1 | |||||||||||||||||||||||||
| Total adjustable-rate construction and development loans | 19,186 | 4.0 | 23,101 | 4.5 | 31,138 | 5.6 | 33,805 | 5.7 | 43,901 | 7.6 | 55,318 | 11.6 | |||||||||||||||||||||||||
| Commercial: | |||||||||||||||||||||||||||||||||||||
| Commercial real estate | 79,007 | 16.7 | 90,994 | 17.7 | 102,262 | 18.5 | 86,737 | 14.6 | 86,116 | 15.0 | 73,448 | 15.4 | |||||||||||||||||||||||||
| Multi-family | 3,682 | 0.8 | 4,575 | 0.9 | 5,543 | 1.0 | 6,094 | 1.0 | 1,906 | 0.4 | 2,257 | 0.5 | |||||||||||||||||||||||||
| Other | 8,252 | 1.7 | 9,349 | 1.8 | 9,665 | 1.8 | 11,849 | 2.0 | 12,819 | 2.2 | 11,920 | 2.5 | |||||||||||||||||||||||||
| Total adjustable-rate commercial loans | 90,941 | 19.2 | 104,918 | 20.4 | 117,470 | 21.3 | 104,680 | 17.6 | 100,841 | 17.6 | 87,625 | 18.4 | |||||||||||||||||||||||||
| Consumer: | |||||||||||||||||||||||||||||||||||||
| Home equity lines of credit | 20,667 | 4.4 | 20,735 | 4.0 | 19,927 | 3.6 | 19,149 | 3.2 | 12,393 | 2.2 | 11,811 | 2.4 | |||||||||||||||||||||||||
| Second mortgages | — | — | — | — | — | — | — | — | — | — | 26 | — | |||||||||||||||||||||||||
| Other | 290 | 0.1 | 236 | 0.1 | 264 | 0.1 | 276 | 0.1 | 344 | 0.1 | 427 | 0.1 | |||||||||||||||||||||||||
| Total adjustable-rate consumer loans | 20,957 | 4.5 | 20,971 | 4.1 | 20,191 | 3.7 | 19,425 | 3.3 | 12,737 | 2.3 | 12,264 | 2.5 | |||||||||||||||||||||||||
| Total adjustable-rate loans | $ | 148,854 | 31.5 | % | $ | 166,915 | 32.5 | % | $ | 198,480 | 36.0 | % | $ | 182,506 | 30.7 | % | $ | 187,383 | 32.7 | % | $ | 185,205 | 38.8 | % | |||||||||||||
| Total loans(1) | $ | 472,566 | 100.0 | % | $ | 513,185 | 100.0 | % | $ | 552,208 | 100.0 | % | $ | 595,411 | 100.0 | % | $ | 573,225 | 100.0 | % | $ | 477,588 | 100.0 | % | |||||||||||||
| (1) | Includes $9.3 million of fixed-rate, single-family residential loans held for sale at September 30, 2007. | |
Source: Malvern Bancorp’s prospectus.
EXHIBIT I-10
Malvern Bancorp, Inc.
Loan Portfolio Composition
Exhibit I-10
Malvern Bancorp, Inc.
Loan Portfolio Composition
| March 31, 2012 | September 30, | ||||||||||||||||||||||||||||||
| 2011 | 2010 | 2009 | 2008 | 2007 | |||||||||||||||||||||||||||
| Amount | Percent | Amount | Percent | Amount | Percent | Amount | Percent | Amount | Percent | Amount | Percent | ||||||||||||||||||||
| (Dollars in thousands) | |||||||||||||||||||||||||||||||
| Residential mortgage(1) | $ | 220,211 | 46.6 | % | $ | 229,330 | 44.7 | % | $ | 230,966 | 41.8 | % | $ | 252,308 | 42.4 | % | $ | 248,118 | 43.3 | % | $ | 193,460 | 40.4 | % | |||||||
| Construction and Development: | |||||||||||||||||||||||||||||||
| Residential and commercial | 21,846 | 4.6 | 26,005 | 5.0 | 30,429 | 5.5 | 37,508 | 6.3 | 45,451 | 7.9 | 58,870 | 12.4 | |||||||||||||||||||
| Land loans | 632 | 0.1 | 2,722 | 0.6 | 2,989 | 0.6 | 3,237 | 0.6 | 4,530 | 0.8 | 6,665 | 1.4 | |||||||||||||||||||
| Total construction and development loans | 22,478 | 4.7 | 28,727 | 5.6 | 33,418 | 6.1 | 40,745 | 6.9 | 49,981 | 8.7 | 65,535 | 13.8 | |||||||||||||||||||
| Commercial: | |||||||||||||||||||||||||||||||
| Commercial real estate | 122,096 | 25.8 | 131,225 | 25.5 | 143,095 | 25.9 | 142,863 | 24.0 | 138,522 | 24.2 | 108,500 | 22.7 | |||||||||||||||||||
| Multi-family | 5,370 | 1.2 | 5,507 | 1.1 | 6,493 | 1.2 | 9,613 | 1.6 | 1,906 | 0.3 | 2,257 | 0.5 | |||||||||||||||||||
| Other | 8,735 | 1.8 | 10,992 | 2.1 | 11,398 | 2.1 | 15,647 | 2.6 | 17,260 | 3.0 | 15,767 | 3.3 | |||||||||||||||||||
| Total commercial loans | 136,201 | 28.8 | 147,724 | 28.7 | 160,986 | 29.2 | 168,123 | 28.2 | 157,688 | 27.5 | 126,524 | 26.5 | |||||||||||||||||||
| Consumer: | |||||||||||||||||||||||||||||||
| Home equity lines of credit | 20,667 | 4.4 | 20,735 | 4.0 | 19,927 | 3.6 | 19,149 | 3.2 | 12,393 | 2.2 | 11,811 | 2.5 | |||||||||||||||||||
| Second mortgages | 72,188 | 15.3 | 85,881 | 16.8 | 105,825 | 19.1 | 113,943 | 19.1 | 103,741 | 18.1 | 78,733 | 16.5 | |||||||||||||||||||
| Other | 821 | 0.2 | 788 | 0.2 | 1,086 | 0.2 | 1,143 | 0.2 | 1,304 | 0.2 | 1,525 | 0.3 | |||||||||||||||||||
| Total consumer loans | 93,676 | 19.9 | 107,404 | 21.0 | 126,838 | 22.9 | 134,235 | 22.5 | 117,438 | 20.5 | 92,069 | 19.3 | |||||||||||||||||||
| Total loans | 472,566 | 100.0 | % | 513,185 | 100.0 | % | 552,208 | 100.0 | % | 595,411 | 100.0 | % | 573,225 | 100.0 | % | 477,588 | 100.0 | % | |||||||||||||
| Deferred loan costs, net | 2,538 | 2,935 | 3,272 | 3,872 | 3,816 | 2,404 | |||||||||||||||||||||||||
| Allowance for loan losses | (8,076 | ) | (10,101 | ) | (8,157 | ) | (5,718 | ) | (5,505 | ) | (4,541 | ) | |||||||||||||||||||
| Loans receivable, net | $ | 467,028 | $ | 506,019 | $ | 547,323 | $ | 593,565 | $ | 571,536 | $ | 475,451 | |||||||||||||||||||
| (1) | Includes $9.3 million of loans held for sale at September 30, 2007. |
Source: Malvern Bancorp’s prospectus.
EXHIBIT I-11
Malvern Bancorp, Inc.
Contractual Maturity by Loan Type
Exhibit I-11
Malvern Bancorp, Inc.
Contractual Maturity by Loan Type
| Construction and Development | Commercial | Consumer | |||||||||||||||||||||||||||||
| Residential Mortgage | Residential and Commercial | Land Loans | Commercial Real Estate | Multi-family | Other | Home Equity Lines of Credit | Second Mortgages | Other | Total | ||||||||||||||||||||||
| (Dollars in thousands) | |||||||||||||||||||||||||||||||
| Amounts due in: | |||||||||||||||||||||||||||||||
| One year or less | $ | 684 | $ | 12,403 | $ | 632 | $ | 7,668 | $ | 131 | $ | 468 | $ | 300 | $ | 117 | $ | 26 | $ | 22,429 | |||||||||||
| After one year through two years | 682 | — | — | 3,276 | — | 970 | — | 250 | 123 | 5,301 | |||||||||||||||||||||
| After two years through three years | 523 | — | — | 9,424 | — | 657 | — | 482 | 171 | 11,257 | |||||||||||||||||||||
| After three years through five years | 4,713 | 3,618 | — | 23,177 | 1,005 | 960 | 60 | 1,539 | 127 | 35,199 | |||||||||||||||||||||
| After five years through ten years | 31,444 | 4,964 | — | 64,128 | 3,672 | 2,499 | — | 13,389 | — | 120,096 | |||||||||||||||||||||
| After ten years through fifteen years | 34,205 | — | — | 7,487 | — | 1,344 | 5,186 | 23,297 | 5 | 71,524 | |||||||||||||||||||||
| Beyond fifteen years | 147,960 | 861 | — | 6,936 | 562 | 1,837 | 15,121 | 33,114 | 369 | 206,760 | |||||||||||||||||||||
| Total | $ | 220,211 | $ | 21,846 | $ | 632 | $ | 122,096 | $ | 5,370 | $ | 8,735 | $ | 20,667 | $ | 72,188 | $ | 821 | $ | 472,566 | |||||||||||
| Interest rate terms on amounts due after one year: | |||||||||||||||||||||||||||||||
| Fixed rate | $ | 202,302 | $ | 3,292 | $ | — | $ | 40,861 | $ | 1,688 | $ | — | $ | — | $ | 72,071 | $ | 509 | $ | 320,723 | |||||||||||
| Adjustable rate | 17,225 | 6,151 | — | 73,567 | 3,551 | 8,267 | 20,367 | — | 286 | 129,414 | |||||||||||||||||||||
| Total | $ | 219,527 | $ | 9,443 | $ | — | $ | 114,428 | $ | 5,239 | $ | 8,267 | $ | 20,367 | $ | 72,071 | $ | 795 | $ | 450,137 | |||||||||||
Source: Malvern Bancorp’s prospectus.
EXHIBIT I-12
Malvern Bancorp, Inc.
Loan Originations, Purchases, Sales and Repayments
Exhibit I-12
Malvern Bancorp, Inc.
Loan Originations, Purchases, Sales and Repayments
| Six Months Ended March 31, | Year Ended September 30, | |||||||||||||||
| 2012 | 2011 | 2011 | 2010 | 2009 | ||||||||||||
| (Dollars in thousands) | ||||||||||||||||
| Total gross loans at beginning of period | $ | 513,185 | $ | 552,208 | $ | 552,208 | $ | 595,411 | $ | 573,225 | ||||||
| Originations by type: | ||||||||||||||||
| Residential mortgage | 17,870 | 24,804 | 35,378 | 26,422 | 37,842 | |||||||||||
| Construction and Development(1): | ||||||||||||||||
| Residential and commercial | 3,363 | 1,899 | 3,890 | 7,250 | 16,015 | |||||||||||
| Land loans | — | 23 | 36 | 40 | 318 | |||||||||||
| Commercial: | ||||||||||||||||
| Commercial real estate | 645 | 2,560 | 3,146 | 28,354 | 32,494 | |||||||||||
| Multi-family | 161 | 270 | 494 | 45 | 10,431 | |||||||||||
| Other | 912 | 2,562 | 3,426 | 3,836 | 5,105 | |||||||||||
| Consumer: | ||||||||||||||||
| Home equity lines of credit(1) | 5,319 | 5,656 | 11,289 | 10,965 | 19,309 | |||||||||||
| Second mortgages | 573 | 4,924 | 6,719 | 6,952 | 6,103 | |||||||||||
| Other | 431 | 355 | 608 | 1,139 | 884 | |||||||||||
| Total originations | 29,274 | 43,053 | 64,986 | 85,003 | 128,501 | |||||||||||
| Principal Repayments: | ||||||||||||||||
| Residential mortgage | 26,194 | 35,682 | 54,691 | 53,338 | 59,838 | |||||||||||
| Construction and Development: | ||||||||||||||||
| Residential and commercial | 7,521 | 4,281 | 7,750 | 13,244 | 23,763 | |||||||||||
| Land loans | 1,927 | 16 | 235 | 287 | 1,612 | |||||||||||
| Commercial: | ||||||||||||||||
| Commercial real estate | 9,535 | 1,723 | 7,387 | 25,519 | 24,167 | |||||||||||
| Multi-family | 297 | 296 | 1,335 | 3,095 | 2,727 | |||||||||||
| Other | 3,169 | 1,932 | 3,542 | 8,063 | 6,696 | |||||||||||
| Consumer: | ||||||||||||||||
| Home equity lines of credit | 5,452 | 5,157 | 10,034 | 10,313 | 12,595 | |||||||||||
| Second mortgages | 16,289 | 17,041 | 28,848 | 25,935 | 27,250 | |||||||||||
| Other | 398 | 571 | 882 | 1,196 | 1,044 | |||||||||||
| Total principal repayments | 70,782 | 66,699 | 114,704 | 140,990 | 159,692 | |||||||||||
| Net loan originations and principal repayments | (41,508 | ) | (23,646 | ) | (49,718 | ) | (55,987 | ) | (31,191 | ) | ||||||
| Purchases: | ||||||||||||||||
| Residential mortgage(2) | 11,238 | 6,533 | 27,683 | 10,130 | 28,293 | |||||||||||
| Construction and Development: | ||||||||||||||||
| Residential and commercial | — | 125 | 125 | — | — | |||||||||||
| Consumer: | ||||||||||||||||
| Home equity lines of credit | 66 | — | — | 131 | 58 | |||||||||||
| Second mortgages | 2,028 | 3,138 | 4,560 | 11,098 | 31,964 | |||||||||||
| Total purchases | 13,332 | 9,796 | 32,368 | 21,359 | 60,315 | |||||||||||
| Sales: | ||||||||||||||||
| Residential mortgage | 10,671 | — | — | — | — | |||||||||||
| Construction and Development: | ||||||||||||||||
| Residential and commercial | — | — | — | — | — | |||||||||||
| Other adjustments, net(3) | (1,772 | ) | (11,947 | ) | (21,673 | ) | (8,575 | ) | (6,938 | ) | ||||||
| Net increase (decrease) | (40,619 | ) | (25,797 | ) | (39,023 | ) | (43,203 | ) | 22,186 | |||||||
| Total gross loans at end of period | $ | 472,566 | $ | 526,411 | $ | 513,185 | $ | 552,208 | $ | 595,411 | ||||||
| (1) | Origination amounts for construction and development loans and line of credit loans reflect disbursements of loan proceeds during the period although loans may have been originated in a prior period. | |
| (2) | Includes purchases of loans from our network of loan brokers. | |
| (3) | Reflects non-cash items related to transfers of loans to other real estate owned, recoveries and charge-offs. | |
Source: Malvern Bancorp’s prospectus.
EXHIBIT I-13
Malvern Bancorp, Inc.
Non-Performing Assets
Exhibit I-13
Malvern Bancorp, Inc.
Non-Performing Assets
| March 31, 2012 | Year Ended September 30, | ||||||||||||||||||
| 2011 | 2010 | 2009 | 2008 | 2007 | |||||||||||||||
| (Dollars in thousands) | |||||||||||||||||||
| Non-accruing loans: | |||||||||||||||||||
| Residential mortgage | $ | 4,425 | $ | 2,866 | $ | 8,354 | $ | 3,809 | $ | 1,402 | $ | 461 | |||||||
| Construction and Development: | |||||||||||||||||||
| Residential and commercial | 3,210 | 6,617 | 1,393 | 7,086 | 1,695 | — | |||||||||||||
| Commercial: | |||||||||||||||||||
| Commercial real estate | 2,822 | 1,765 | 4,476 | 785 | 4,050 | 661 | |||||||||||||
| Multi-family | — | — | 1,093 | — | — | — | |||||||||||||
| Other | 201 | 229 | — | 35 | 561 | 780 | |||||||||||||
| Consumer: | |||||||||||||||||||
| Home equity lines of credit | 43 | 61 | 457 | 407 | 205 | 14 | |||||||||||||
| Second mortgages | 1,029 | 1,377 | 4,085 | 2,072 | 672 | 351 | |||||||||||||
| Other | — | — | 3 | 1 | — | — | |||||||||||||
| Total non-accruing loans | 11,730 | 12,915 | 19,861 | 14,195 | 8,585 | 2,267 | |||||||||||||
| Accruing loans delinquent more than 90 days past due | — | — | — | — | — | — | |||||||||||||
| Real estate owned and other foreclosed assets: | |||||||||||||||||||
| Residential mortgage | 1,374 | 3,872 | 1,538 | 1,568 | 230 | 227 | |||||||||||||
| Construction and Development: | |||||||||||||||||||
| Residential and commercial | — | — | 1,085 | 196 | — | — | |||||||||||||
| Land | 164 | ||||||||||||||||||
| Commercial: | |||||||||||||||||||
| Commercial real estate | 3,171 | 4,415 | 2,602 | 4,006 | — | — | |||||||||||||
| Multi-family | — | — | 70 | — | — | — | |||||||||||||
| Other | 34 | 34 | 20 | 20 | — | — | |||||||||||||
| Consumer: | |||||||||||||||||||
| Second mortgages | — | — | — | 85 | — | — | |||||||||||||
| Total | 4,743 | 8,321 | 5,315 | 5,875 | 230 | 227 | |||||||||||||
| Total non-performing assets | $ | 16,473 | $ | 21,236 | $ | 25,176 | $ | 20,070 | $ | 8,815 | $ | 2,494 | |||||||
| Performing troubled debt-restructurings: | |||||||||||||||||||
| Residential mortgage | 876 | 1,049 | 2,277 | — | — | — | |||||||||||||
| Construction and Development: | |||||||||||||||||||
| Land loans | 1,154 | 1,160 | 1,170 | — | — | — | |||||||||||||
| Commercial: | |||||||||||||||||||
| Commercial real estate | 6,100 | 7,919 | 7,742 | 25 | 103 | 121 | |||||||||||||
| Multi-family | — | — | 612 | — | — | — | |||||||||||||
| Other | 175 | 175 | 175 | — | — | — | |||||||||||||
| Consumer: | |||||||||||||||||||
| Home equity lines of credit | — | 37 | — | — | — | — | |||||||||||||
| Total performing troubled debt restructurings | 8,305 | 10,340 | 11,976 | 25 | 103 | 121 | |||||||||||||
| Total non-performing assets and performing troubled debt restructurings | $ | 24,778 | $ | 31,576 | $ | 37,152 | $ | 20,095 | $ | 8,918 | $ | 2,615 | |||||||
| Ratios: | |||||||||||||||||||
| Total non-accrual loans as a percent of gross loans | 2.48 | % | 2.52 | % | 3.60 | % | 2.38 | % | 1.52 | % | 0.51 | % | |||||||
| Total non-performing assets as a percent of total asset | 2.53 | % | 3.19 | % | 3.49 | % | 2.90 | % | 1.38 | % | 0.45 | % | |||||||
| Total non-performing assets and performing troubled debt restructurings as a percent of total assets | 3.80 | % | 4.74 | % | 5.16 | % | 2.91 | % | 1.39 | % | 0.47 | % | |||||||
Source: Malvern Bancorp’s prospectus.
EXHIBIT I-14
Malvern Bancorp, Inc.
Deposit Composition
Exhibit I-14
Malvern Bancorp, Inc.
Deposit Composition
| At March 31, | At September 30, | ||||||||||||||||||||||||
| 2012 | 2011 | 2010 | 2009 | ||||||||||||||||||||||
| Amount | Percent of Total Deposits | Amount | Percent of Total Deposits | Amount | Percent of Total Deposits | Amount | Percent of Total Deposits | ||||||||||||||||||
| (Dollars in thousands) | |||||||||||||||||||||||||
| Deposit Types: | |||||||||||||||||||||||||
| Savings | $ | 46,996 | 8.7 | % | $ | 45,067 | 8.1 | % | $ | 42,385 | 7.1 | % | $ | 39,554 | 7.7 | % | |||||||||
| Money market | 79,248 | 14.8 | 86,315 | 15.6 | 80,980 | 13.5 | 58,401 | 11.3 | |||||||||||||||||
| Interest bearing demand | 95,088 | 17.7 | 88,722 | 16.0 | 83,365 | 14.0 | 95,720 | 18.5 | |||||||||||||||||
| Non-interest bearing demand | 21,413 | 4.0 | 19,833 | 3.6 | 18,503 | 3.1 | 19,314 | 3.7 | |||||||||||||||||
| Total core deposits | 242,745 | 45.2 | 239,937 | 43.3 | 225,233 | 37.7 | 212,989 | 41.2 | |||||||||||||||||
| Time deposits with original maturities of: | |||||||||||||||||||||||||
| Three months or less | 837 | 0.2 | 834 | 0.1 | 884 | 0.2 | 893 | 0.2 | |||||||||||||||||
| Over three months to six months | 6,953 | 1.3 | 7,513 | 1.4 | 10,585 | 1.8 | 16,294 | 3.2 | |||||||||||||||||
| Over six months to twelve months | 5,472 | 1.0 | 8,688 | 1.6 | 29,917 | 5.0 | 45,607 | 8.8 | |||||||||||||||||
| Over twelve months | 281,022 | 52.3 | 297,483 | 53.6 | 330,239 | 55.3 | 240,728 | 46.6 | |||||||||||||||||
| Total time deposits | 294,284 | 54.8 | 314,518 | 56.7 | 371,625 | 62.3 | 303,522 | 58.8 | |||||||||||||||||
| Total deposits | $ | 537,029 | 100.0 | % | $ | 554,455 | 100.0 | % | $ | 596,858 | 100.0 | % | $ | 516,511 | 100.0 | % | |||||||||
Source: Malvern Bancorp’s prospectus.
EXHIBIT I-15
Malvern Bancorp, Inc.
Maturity of Time Deposits
Exhibit I-15
Malvern Bancorp, Inc.
Maturity of Time Deposits
| Period to Maturity from March 31, 2012 | ||||||||||||||||||||||
| One Year | More than | More than | At September 30, | |||||||||||||||||||
| or Less | One Year to Two Years | Two Years to Three Years | More than Three Years | At March 31, 2012 | 2011 | 2010 | ||||||||||||||||
| (Dollars in thousands) | ||||||||||||||||||||||
| Interest Rate Range: | ||||||||||||||||||||||
| 0.99% and below | $ | 25,199 | $ | 25,271 | $ | 2,048 | $ | — | $ | 52,518 | $ | 39,591 | $ | 24,241 | ||||||||
| 1.00% to 1.99% | 46,642 | 18,968 | 6,754 | 12,424 | 84,788 | 93,216 | 129,999 | |||||||||||||||
| 2.00% to 2.99% | 36,484 | 16,380 | 19,271 | 39,155 | 111,290 | 130,983 | 119,666 | |||||||||||||||
| 3.00% to 3.99% | 353 | 2,492 | 9,461 | 24,875 | 37,181 | 41,656 | 52,865 | |||||||||||||||
| 4.00% to 4.99% | 3,237 | 1,001 | 3,120 | 3 | 7,361 | 7,934 | 43,187 | |||||||||||||||
| 5.00% to 5.99% | 1,146 | — | — | — | 1,146 | 1,138 | 1,667 | |||||||||||||||
| Total | $ | 113,061 | $ | 64,112 | $ | 40,654 | $ | 76,457 | $ | 294,284 | $ | 314,518 | $ | 371,625 | ||||||||
Source: Malvern Bancorp’s prospectus.
EXHIBIT II-1
Malvern Bancorp, Inc.
Description of Office Properties
Exhibit II-1
Malvern Bancorp, Inc.
Description of Office Properties
We currently conduct business from our headquarters and eight full-service financial center offices. The following table sets forth the net book value of the land, building and leasehold improvements and certain other information with respect to the our offices at March 31, 2012. We maintain automated teller machines (“ATMs”) at each of our financial center offices.
| Description/Address | Leased/Owned | Date of Lease Expiration | Net Book Value of Property | Amount of Deposits | |||||||||
| (Dollars in thousands) | |||||||||||||
| Paoli Headquarters | Owned | N/A | $ | 2,902 | $ | N/A | |||||||
| 42 East Lancaster Avenue | |||||||||||||
| Paoli, PA 19301 | |||||||||||||
| Paoli Financial Center | Owned | N/A | 647 | $ | 197,799 | ||||||||
| 34 East Lancaster Avenue | |||||||||||||
| Paoli, PA 19301 | |||||||||||||
| Malvern Financial Center | Owned | N/A | 29 | 57,305 | |||||||||
| 100 West King Street | |||||||||||||
| Malvern, PA 19355 | |||||||||||||
| Exton Financial Center | Owned | N/A | 269 | 58,742 | |||||||||
| 109 North Pottstown Pike | |||||||||||||
| Exton, PA 19341 | |||||||||||||
| Coventry Financial Center | Owned | N/A | 318 | 65,443 | |||||||||
| 1000 Ridge Road | |||||||||||||
| Pottstown, PA 19465 | |||||||||||||
| Berwyn Financial Center | Owned | N/A | 658 | 47,240 | |||||||||
| 650 Lancaster Avenue | |||||||||||||
| Berwyn, PA 19313 | |||||||||||||
| Lionville Financial Center | Owned | N/A | 907 | 33,680 | |||||||||
| 537 West Uwchlan Avenue | |||||||||||||
| Downingtown, PA 19335 | |||||||||||||
| Westtown Financial Center | Leased | 2015 | 130 | 36,205 | |||||||||
| 100 Skiles Boulevard | |||||||||||||
| West Chester, PA 19382 | |||||||||||||
| Concordville Financial Center | Leased | 2030 | 462 | 40,615 | |||||||||
| 940 Baltimore Pike | |||||||||||||
| Glen Mills, PA 19342 | |||||||||||||
Source: Malvern Bancorp’s prospectus.
EXHIBIT II-2
Historical Interest Rates
EXHIBIT II-2
Historical Interest Rates
Exhibit II-2
Historical Interest Rates(1)
| Year/Qtr. Ended | Prime Rate | 90 Day T-Bill | One Year T-Bill | 10 Year T-Bond | ||||||||||
| 2000: | Quarter 1 | 9.00 | % | 5.88 | % | 6.28 | % | 6.03 | % | |||||
| Quarter 2 | 9.50 | % | 5.88 | % | 6.08 | % | 6.03 | % | ||||||
| Quarter 3 | 9.50 | % | 6.23 | % | 6.07 | % | 5.80 | % | ||||||
| Quarter 4 | 9.50 | % | 5.89 | % | 5.32 | % | 5.12 | % | ||||||
| 2001: | Quarter 1 | 8.00 | % | 4.30 | % | 4.09 | % | 4.93 | % | |||||
| Quarter 2 | 6.75 | % | 3.65 | % | 3.72 | % | 5.42 | % | ||||||
| Quarter 3 | 6.00 | % | 2.40 | % | 2.49 | % | 4.60 | % | ||||||
| Quarter 4 | 4.75 | % | 1.74 | % | 2.17 | % | 5.07 | % | ||||||
| 2002: | Quarter 1 | 4.75 | % | 1.79 | % | 2.70 | % | 5.42 | % | |||||
| Quarter 2 | 4.75 | % | 1.70 | % | 2.06 | % | 4.86 | % | ||||||
| Quarter 3 | 4.75 | % | 1.57 | % | 1.53 | % | 3.63 | % | ||||||
| Quarter 4 | 4.25 | % | 1.22 | % | 1.32 | % | 3.83 | % | ||||||
| 2003: | Quarter 1 | 4.25 | % | 1.14 | % | 1.19 | % | 3.83 | % | |||||
| Quarter 2 | 4.00 | % | 0.90 | % | 1.09 | % | 3.54 | % | ||||||
| Quarter 3 | 4.00 | % | 0.95 | % | 1.15 | % | 3.96 | % | ||||||
| Quarter 4 | 4.00 | % | 0.95 | % | 1.26 | % | 4.27 | % | ||||||
| 2004: | Quarter 1 | 4.00 | % | 0.95 | % | 1.20 | % | 3.86 | % | |||||
| Quarter 2 | 4.00 | % | 1.33 | % | 2.09 | % | 4.62 | % | ||||||
| Quarter 3 | 4.75 | % | 1.70 | % | 2.16 | % | 4.12 | % | ||||||
| Quarter 4 | 5.25 | % | 2.22 | % | 2.75 | % | 4.24 | % | ||||||
| 2005: | Quarter 1 | 5.75 | % | 2.80 | % | 3.43 | % | 4.51 | % | |||||
| Quarter 2 | 6.00 | % | 3.12 | % | 3.51 | % | 3.98 | % | ||||||
| Quarter 3 | 6.75 | % | 3.55 | % | 4.01 | % | 4.34 | % | ||||||
| Quarter 4 | 7.25 | % | 4.08 | % | 4.38 | % | 4.39 | % | ||||||
| 2006: | Quarter 1 | 7.75 | % | 4.63 | % | 4.82 | % | 4.86 | % | |||||
| Quarter 2 | 8.25 | % | 5.01 | % | 5.21 | % | 5.15 | % | ||||||
| Quarter 3 | 8.25 | % | 4.88 | % | 4.91 | % | 4.64 | % | ||||||
| Quarter 4 | 8.25 | % | 5.02 | % | 5.00 | % | 4.71 | % | ||||||
| 2007: | Quarter 1 | 8.25 | % | 5.04 | % | 4.90 | % | 4.65 | % | |||||
| Quarter 2 | 8.25 | % | 4.82 | % | 4.91 | % | 5.03 | % | ||||||
| Quarter 3 | 7.75 | % | 3.82 | % | 4.05 | % | 4.59 | % | ||||||
| Quarter 4 | 7.25 | % | 3.36 | % | 3.34 | % | 3.91 | % | ||||||
| 2008: | Quarter 1 | 5.25 | % | 1.38 | % | 1.55 | % | 3.45 | % | |||||
| Quarter 2 | 5.00 | % | 1.90 | % | 2.36 | % | 3.99 | % | ||||||
| Quarter 3 | 5.00 | % | 0.92 | % | 1.78 | % | 3.85 | % | ||||||
| Quarter 4 | 3.25 | % | 0.11 | % | 0.37 | % | 2.25 | % | ||||||
| 2009: | Quarter 1 | 3.25 | % | 0.21 | % | 0.57 | % | 2.71 | % | |||||
| Quarter 2 | 3.25 | % | 0.19 | % | 0.56 | % | 3.53 | % | ||||||
| Quarter 3 | 3.25 | % | 0.14 | % | 0.40 | % | 3.31 | % | ||||||
| Quarter 4 | 3.25 | % | 0.06 | % | 0.47 | % | 3.85 | % | ||||||
| 2010: | Quarter 1 | 3.25 | % | 0.16 | % | 0.41 | % | 3.84 | % | |||||
| Quarter 2 | 3.25 | % | 0.18 | % | 0.32 | % | 2.97 | % | ||||||
| Quarter 3 | 3.25 | % | 0.18 | % | 0.32 | % | 2.97 | % | ||||||
| Quarter 4 | 3.25 | % | 0.12 | % | 0.29 | % | 3.30 | % | ||||||
| 2011: | Quarter 1 | 3.25 | % | 0.09 | % | 0.30 | % | 3.47 | % | |||||
| Quarter 2 | 3.25 | % | 0.03 | % | 0.19 | % | 3.18 | % | ||||||
| Quarter 3 | 3.25 | % | 0.02 | % | 0.13 | % | 1.92 | % | ||||||
| Quarter 4 | 3.25 | % | 0.02 | % | 0.12 | % | 1.89 | % | ||||||
| 2012: | Quarter 1 | 3.25 | % | 0.07 | % | 0.19 | % | 2.23 | % | |||||
| As of May 4, 2012 | 3.25 | % | 0.07 | % | 0.18 | % | 1.91 | % | ||||||
| (1) | End of period data. |
| Sources: Federal Reserve and The Wall Street Journal. | |
EXHIBIT III-1
General Characteristics of Publicly-Traded Institutions
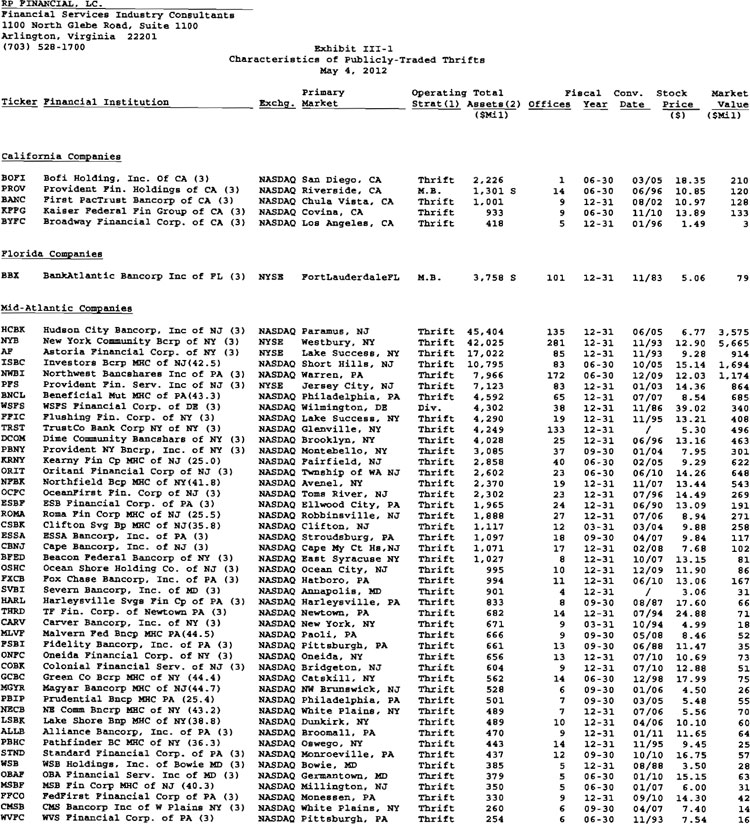
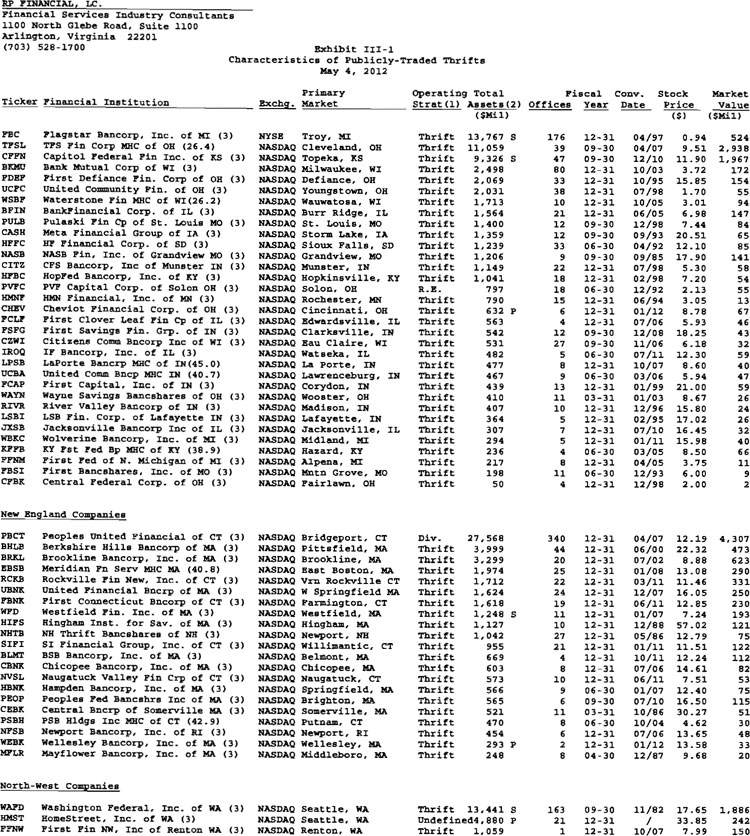
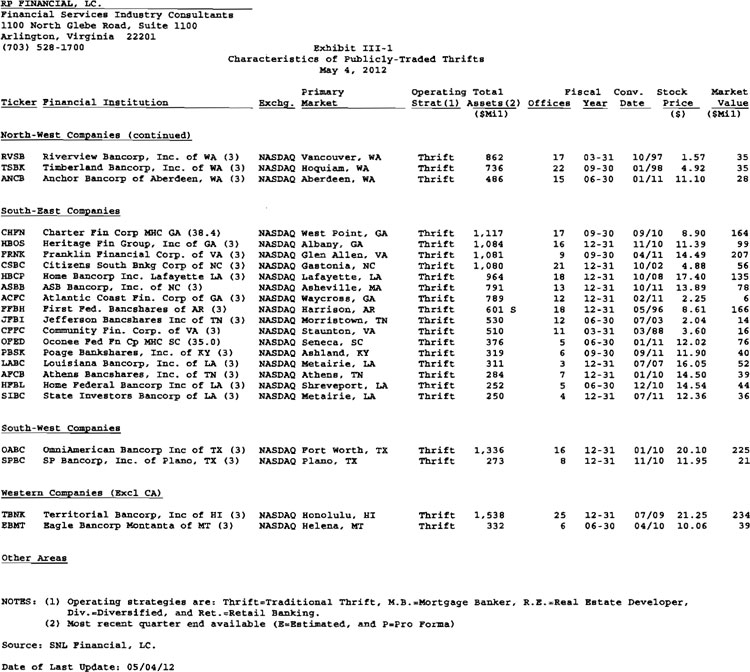
EXHIBIT III-2
Public Market Pricing of Mid-Atlantic Thrift Institutions
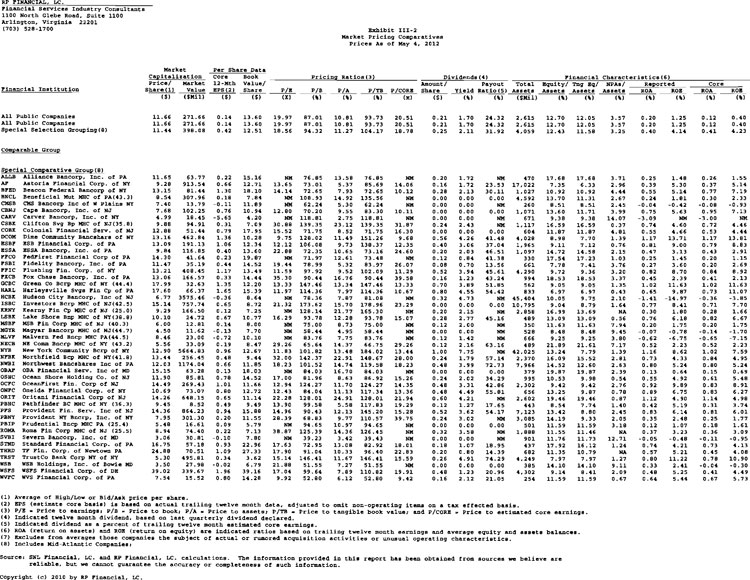
EXHIBIT III-3
Peer Group Market Area Comparative Analysis
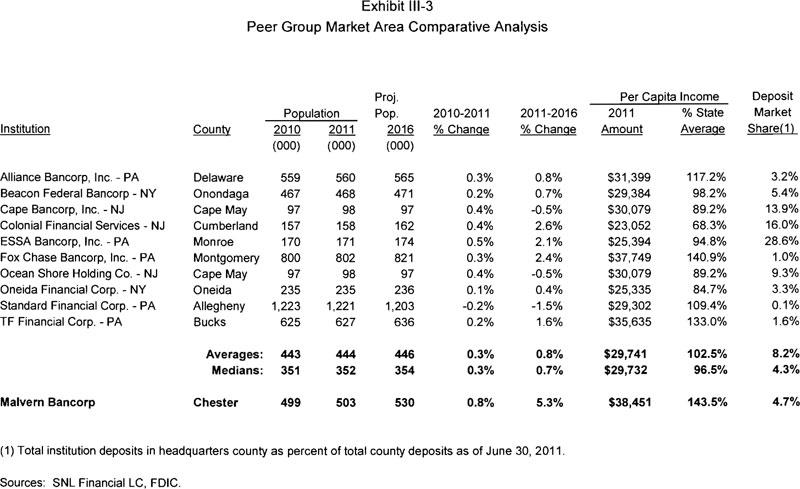
EXHIBIT IV-1
Stock Prices:
As of May 4, 2012
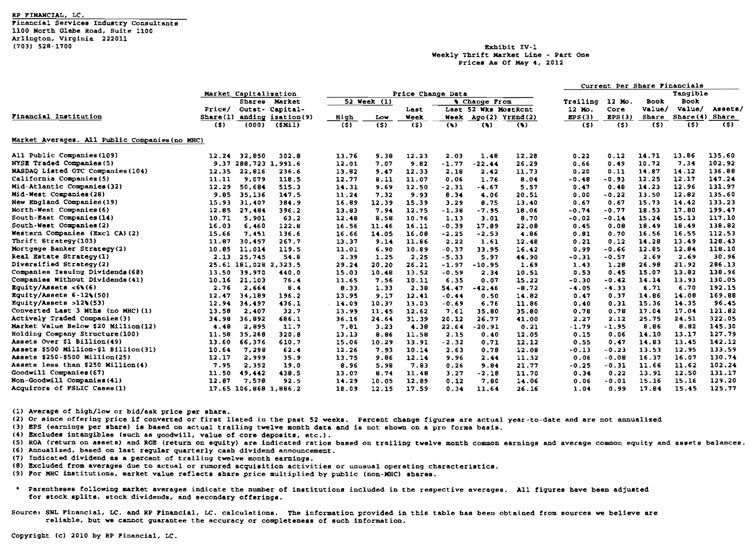
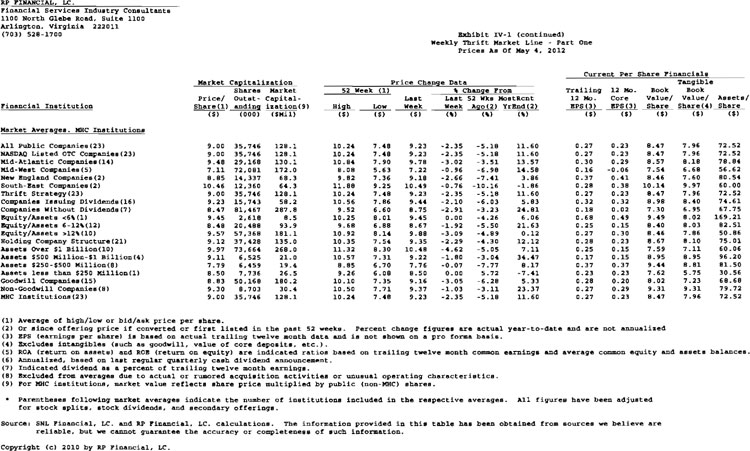
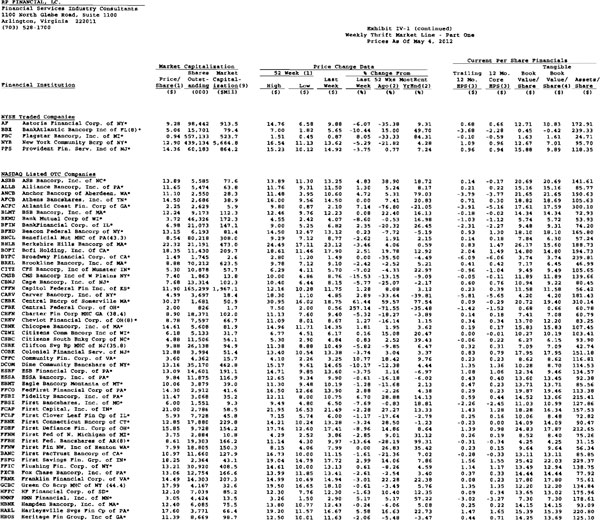
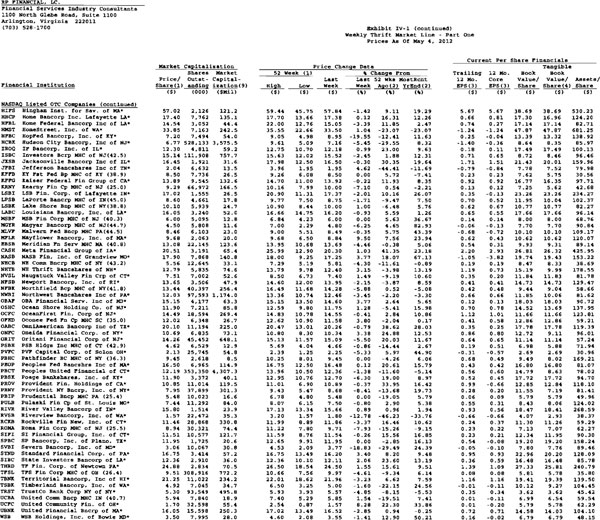
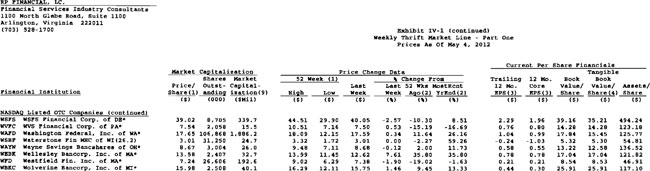
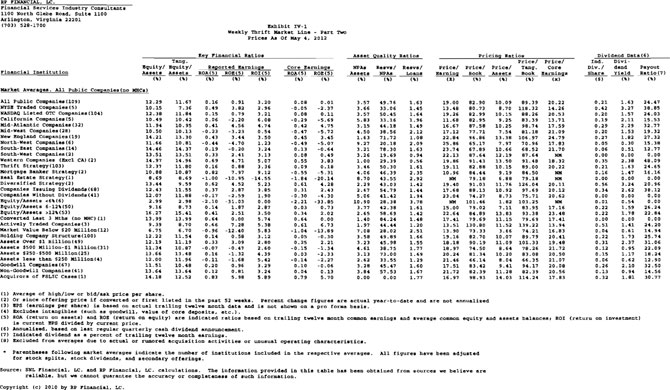
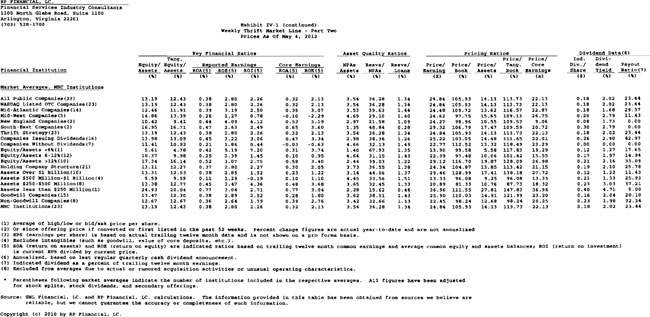
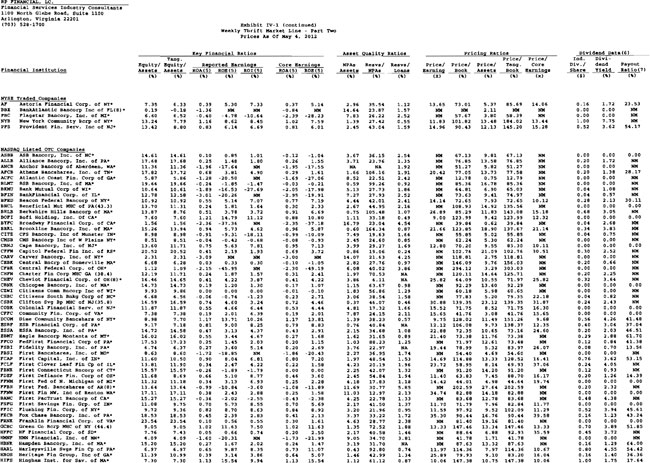
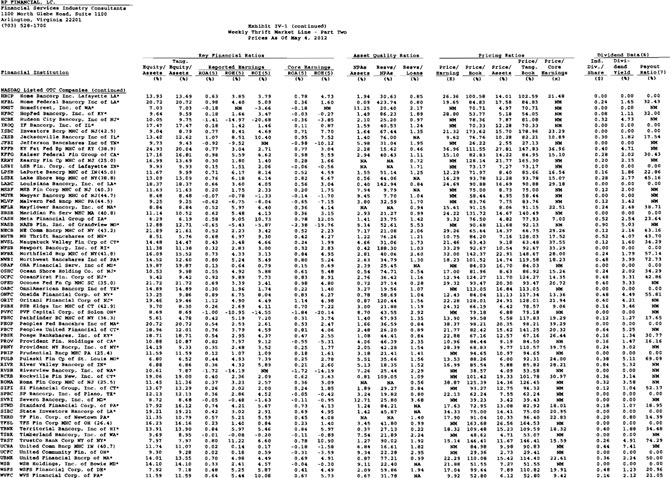
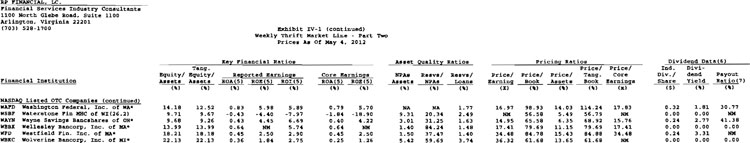
EXHIBIT IV-2
Historical Stock Price Indices
Exhibit IV-2
Historical Stock Price Indices(1)
| Year/Qtr. Ended | DJIA | S&P 500 | NASDAQ Composite | SNL Thrift Index | SNL Bank Index | ||||||||||||
| 2000: | Quarter 1 | 10921.9 | 1498.6 | 4572.8 | 545.6 | 421.24 | |||||||||||
| Quarter 2 | 10447.9 | 1454.6 | 3966.1 | 567.8 | 387.37 | ||||||||||||
| Quarter 3 | 10650.9 | 1436.5 | 3672.8 | 718.3 | 464.64 | ||||||||||||
| Quarter 4 | 10786.9 | 1320.3 | 2470.5 | 874.3 | 479.44 | ||||||||||||
| 2001: | Quarter 1 | 9878.8 | 1160.3 | 1840.3 | 885.2 | 459.24 | |||||||||||
| Quarter 2 | 10502.4 | 1224.4 | 2160.5 | 964.5 | 493.70 | ||||||||||||
| Quarter 3 | 8847.6 | 1040.9 | 1498.8 | 953.9 | 436.60 | ||||||||||||
| Quarter 4 | 10021.5 | 1148.1 | 1950.4 | 918.2 | 473.67 | ||||||||||||
| 2002: | Quarter 1 | 10403.9 | 1147.4 | 1845.4 | 1006.7 | 498.30 | |||||||||||
| Quarter 2 | 9243.3 | 989.8 | 1463.2 | 1121.4 | 468.91 | ||||||||||||
| Quarter 3 | 7591.9 | 815.3 | 1172.1 | 984.3 | 396.80 | ||||||||||||
| Quarter 4 | 8341.6 | 879.8 | 1335.5 | 1073.2 | 419.10 | ||||||||||||
| 2003: | Quarter 1 | 7992.1 | 848.2 | 1341.2 | 1096.2 | 401.00 | |||||||||||
| Quarter 2 | 8985.4 | 974.5 | 1622.8 | 1266.6 | 476.07 | ||||||||||||
| Quarter 3 | 9275.1 | 996.0 | 1786.9 | 1330.9 | 490.90 | ||||||||||||
| Quarter 4 | 10453.9 | 1112.0 | 2003.4 | 1482.3 | 548.60 | ||||||||||||
| 2004: | Quarter 1 | 10357.7 | 1126.2 | 1994.2 | 1585.3 | 562.20 | |||||||||||
| Quarter 2 | 10435.5 | 1140.8 | 2047.8 | 1437.8 | 546.62 | ||||||||||||
| Quarter 3 | 10080.3 | 1114.6 | 1896.8 | 1495.1 | 556.00 | ||||||||||||
| Quarter 4 | 10783.0 | 1211.9 | 2175.4 | 1605.6 | 595.10 | ||||||||||||
| 2005: | Quarter 1 | 10503.8 | 1180.6 | 1999.2 | 1516.6 | 551.00 | |||||||||||
| Quarter 2 | 10275.0 | 1191.3 | 2057.0 | 1577.1 | 563.27 | ||||||||||||
| Quarter 3 | 10568.7 | 1228.8 | 2151.7 | 1527.2 | 546.30 | ||||||||||||
| Quarter 4 | 10717.5 | 1248.3 | 2205.3 | 1616.4 | 582.80 | ||||||||||||
| 2006: | Quarter 1 | 11109.3 | 1294.8 | 2339.8 | 1661.1 | 595.50 | |||||||||||
| Quarter 2 | 11150.2 | 1270.2 | 2172.1 | 1717.9 | 601.14 | ||||||||||||
| Quarter 3 | 11679.1 | 1335.9 | 2258.4 | 1727.1 | 634.00 | ||||||||||||
| Quarter 4 | 12463.2 | 1418.3 | 2415.3 | 1829.3 | 658.60 | ||||||||||||
| 2007: | Quarter 1 | 12354.4 | 1420.9 | 2421.6 | 1703.6 | 634.40 | |||||||||||
| Quarter 2 | 13408.6 | 1503.4 | 2603.2 | 1645.9 | 622.63 | ||||||||||||
| Quarter 3 | 13895.6 | 1526.8 | 2701.5 | 1523.3 | 595.80 | ||||||||||||
| Quarter 4 | 13264.8 | 1468.4 | 2652.3 | 1058.0 | 492.85 | ||||||||||||
| 2008: | Quarter 1 | 12262.9 | 1322.7 | 2279.1 | 1001.5 | 442.5 | |||||||||||
| Quarter 2 | 11350.0 | 1280.0 | 2293.0 | 822.6 | 332.2 | ||||||||||||
| Quarter 3 | 10850.7 | 1166.4 | 2082.3 | 760.1 | 414.8 | ||||||||||||
| Quarter 4 | 8776.4 | 903.3 | 1577.0 | 653.9 | 268.3 | ||||||||||||
| 2009: | Quarter 1 | 7608.9 | 797.9 | 1528.6 | 542.8 | 170.1 | |||||||||||
| Quarter 2 | 8447.0 | 919.3 | 1835.0 | 538.8 | 227.6 | ||||||||||||
| Quarter 3 | 9712.3 | 1057.1 | 2122.4 | 561.4 | 282.9 | ||||||||||||
| Quarter 4 | 10428.1 | 1115.1 | 2269.2 | 587.0 | 260.8 | ||||||||||||
| 2010: | Quarter 1 | 10856.6 | 1169.4 | 2398.0 | 626.3 | 301.1 | |||||||||||
| Quarter 2 | 9744.0 | 1030.7 | 2109.2 | 564.5 | 257.2 | ||||||||||||
| Quarter 3 | 9744.0 | 1030.7 | 2109.2 | 564.5 | 257.2 | ||||||||||||
| Quarter 4 | 11577.5 | 1257.6 | 2652.9 | 592.2 | 290.1 | ||||||||||||
| 2011: | Quarter 1 | 12319.7 | 1325.8 | 2781.1 | 578.1 | 293.1 | |||||||||||
| Quarter 2 | 12414.3 | 1320.6 | 2773.5 | 540.8 | 266.8 | ||||||||||||
| Quarter 3 | 10913.4 | 1131.4 | 2415.4 | 443.2 | 198.9 | ||||||||||||
| Quarter 4 | 12217.6 | 1257.6 | 2605.2 | 481.4 | 221.3 | ||||||||||||
| 2012: | Quarter 1 | 13212.0 | 1408.5 | 3091.6 | 529.3 | 284.9 | |||||||||||
| As of May 4, 2012 | 13038.3 | 1369.1 | 2956.3 | 513.7 | 266.4 | ||||||||||||
| (1) | End of period data. |
Sources: SNL Financial and The Wall Street Journal.
EXHIBIT IV-3
Historical Thrift Stock Indices
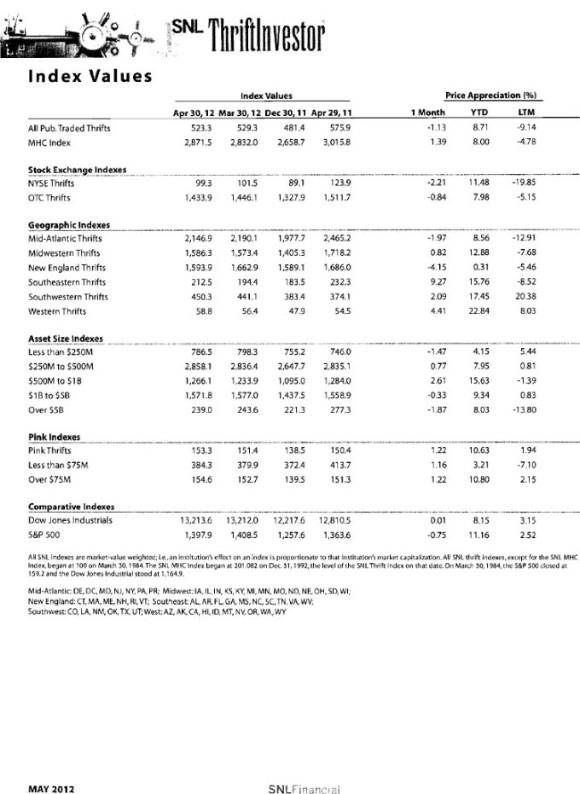
EXHIBIT IV-4
Market Area Acquisition Activity
Exhibit IV-4
Pennsylvania Thrift Acquisitions 2008-Present
| Target Financials at Announcement | |||||||||||||||||||||||||||
| Announce Date | Complete Date | Buyer Short Name | Target Name | Total Assets ($000) | E/A (%) | TE/A (%) | ROAA (%) | ROAE (%) | NPAs/ Assets (%) | Rsrvs/ NPLs (%) | |||||||||||||||||
| 06/15/2011 | Def Agrmt | F.N.B. Corp. | PA | Parkvale Financial Corporation | PA | 1,801,292 | 6.88 | 5.42 | -0.83 | -12.20 | 2.04 | 69.38 | |||||||||||||||
| 01/26/2011 | Def Agrmt | Susquehanna Bancshares Inc. | PA | Abington Bancorp, Inc. | PA | 1,247,098 | 16.99 | 16.99 | 0.61 | 3.60 | 3.18 | 26.68 | |||||||||||||||
| 12/14/2010 | 05/31/2011 | Norwood Financial Corp. | PA | North Penn Bancorp, Inc. | PA | 164,505 | 12.10 | 12.10 | 0.79 | 6.41 | 1.36 | 90.30 | |||||||||||||||
| 10/01/2010 | Def Agrmt | e3holding inc. | PA | American Eagle Savings Bank | PA | 22,298 | 3.92 | 3.92 | -3.85 | -80.12 | 0.00 | NA | |||||||||||||||
| 11/03/2009 | 07/01/2010 | Bryn Mawr Bank Corp. | PA | First Keystone Financial, Inc. | PA | 525,376 | 6.22 | 6.22 | -0.58 | -8.87 | 0.58 | 115.44 | |||||||||||||||
| 06/16/2009 | 07/01/2010 | Fidelity S&L Assn. | PA | Croydon Savings Bank | PA | 12,917 | 7.60 | 7.60 | -1.57 | -17.00 | 11.63 | 24.50 | |||||||||||||||
| 01/29/2009 | 10/23/2009 | Northwest Bancorp Inc. (MHC) | PA | Keystone State Savings Bank | PA | 25,650 | 14.71 | 14.71 | -0.27 | -1.83 | 0.00 | NA | |||||||||||||||
| 10/13/2008 | 01/30/2009 | Banco Santander S.A. | Sovereign Bancorp, Inc. | PA | 77,321,406 | 9.49 | 4.92 | -2.94 | -30.08 | 0.91 | 150.03 | ||||||||||||||||
| 05/22/2008 | 10/17/2008 | Emclaire Financial Corp. | PA | Elk County S&L Association | PA | 10,404 | 22.90 | 22.90 | 0.24 | 1.05 | 0.54 | NA | |||||||||||||||
| 05/20/2008 | 12/05/2008 | Harleysville National Corp. | PA | Willow Financial Bancorp, Inc. | PA | 1,568,858 | 12.74 | 6.19 | 0.38 | 2.88 | 0.30 | 270.17 | |||||||||||||||
| 02/25/2008 | 10/17/2008 | Sharon MHC | PA | Morton Savings Bank | PA | 19,484 | 5.74 | 5.74 | -0.66 | -10.79 | 0.00 | NA | |||||||||||||||
| 09/06/2007 | 02/01/2008 | National Penn Bancshares Inc. | PA | KNBT Bancorp, Inc. | PA | 2,888,789 | 12.19 | 7.90 | 0.68 | 5.56 | 0.15 | 407.84 | |||||||||||||||
| Average: | 7,134,006 | 10.96 | 9.55 | -0.67 | -11.78 | 1.72 | 144.29 | ||||||||||||||||||||
| Median: | 344,941 | 10.80 | 6.91 | -0.43 | -5.35 | 0.56 | 102.87 | ||||||||||||||||||||
| Deal Terms and Pricing at Announcement | |||||||||||||||||||||||||||
| Announce Date | Complete Date | Buyer Short Name | Target Name | Deal Value ($M) | Value/ Share ($) | P/B (%) | P/TB (%) | P/E (x) | P/A (%) | Prem/ Cdeps (%) | |||||||||||||||||
| 06/15/2011 | Def Agrmt | F.N.B. Corp. | PA | Parkvale Financial Corporation | PA | 130.7 | 22.738 | 137.81 | 197.55 | NM | 7.26 | NA | |||||||||||||||
| 01/26/2011 | Def Agrmt | Susquehanna Bancshares Inc. | PA | Abington Bancorp, Inc. | PA | 273.8 | 13.042 | 124.09 | 124.09 | 33.44 | 21.96 | NA | |||||||||||||||
| 12/14/2010 | 05/31/2011 | Norwood Financial Corp. | PA | North Penn Bancorp, Inc. | PA | 27.4 | 19.395 | 125.21 | 125.21 | 20.63 | 16.68 | 6.39 | |||||||||||||||
| 10/01/2010 | Def Agrmt | e3holding inc. | PA | American Eagle Savings Bank | PA | 12.0 | NA | NA | NA | NA | NA | NA | |||||||||||||||
| 11/03/2009 | 07/01/2010 | Bryn Mawr Bank Corp. | PA | First Keystone Financial, Inc. | PA | 32.8 | 13.426 | 99.90 | 99.90 | NM | 6.24 | NA | |||||||||||||||
| 06/16/2009 | 07/01/2010 | Fidelity S&L Assn. | PA | Croydon Savings Bank | PA | NA | NA | NA | NA | NA | NA | NA | |||||||||||||||
| 01/29/2009 | 10/23/2009 | Northwest Bancorp Inc. (MHC) | PA | Keystone State Savings Bank | PA | NA | NA | NA | NA | NA | NA | NA | |||||||||||||||
| 10/13/2008 | 01/30/2009 | Banco Santander S.A. | Sovereign Bancorp, Inc. | PA | 1,909.9 | 3.810 | 35.41 | 68.40 | NM | 3.27 | NA | ||||||||||||||||
| 05/22/2008 | 10/17/2008 | Emclaire Financial Corp. | PA | Elk County S&L Association | PA | 3.5 | NA | NA | NA | NA | NA | NA | |||||||||||||||
| 05/20/2008 | 12/05/2008 | Harleysville National Corp. | PA | Willow Financial Bancorp, Inc. | PA | 161.5 | 10.235 | 79.65 | 175.85 | 26.24 | 10.29 | 7.34 | |||||||||||||||
| 02/25/2008 | 10/17/2008 | Sharon MHC | PA | Morton Savings Bank | PA | NA | NA | NA | NA | NA | NA | NA | |||||||||||||||
| 09/06/2007 | 02/01/2008 | National Penn Bancshares Inc. | PA | KNBT Bancorp, Inc. | PA | 460.1 | 17.119 | 126.34 | 204.67 | 22.82 | 15.93 | 13.14 | |||||||||||||||
| Average: | 104.06 | 142.24 | 25.78 | 11.66 | 8.96 | ||||||||||||||||||||||
| Median: | 124.09 | 125.21 | 24.53 | 10.29 | 7.34 | ||||||||||||||||||||||
Source: SNL Financial, LC.
EXHIBIT IV-5
Malvern Bancorp, Inc.
Director and Senior Management Summary Resumes
Exhibit IV-5
Malvern Bancorp, Inc.
Director and Senior Management Summary Resumes
| Name | Age | Position with Malvern Federal Bancorp and Principal Occupation During the Past Five Years | Year Term Expires | Director Since | ||||
| Ronald Anderson | 55 | President and Chief Executive Officer of Malvern Federal Bancorp since its organization in 2008 and President and Chief Executive Officer of Malvern Federal Savings Bank since September 2002. Previously, Executive Vice President and Chief Executive Officer of Malvern Federal Savings Bank from September 2001 to September 2002. | 2014 | 2006 | ||||
| Kristin S. Camp | 42 | Director. Partner at the law firm Buckley, Brion, McGuire & Morris LLP, West Chester, Pennsylvania since 1996. | 2013 | 2007 | ||||
| F. Claire Hughes, Jr. | 68 | Chairman of the Board. Retired since January 2007. Previously Vice President, General Manager and Treasurer of Matthews Ford and President of Matthews Leasing Company, Paoli, Pennsylvania. | 2014 | 2001 | ||||
| Joseph E. Palmer, Jr. | 71 | Director. Co-owner and manager of Palmer Group Properties, a real estate investment and management company located in Paoli, Pennsylvania since 1994. | 2015 | 1986 | ||||
| Stephen P. Scartozzi | 61 | Director. President of The Hardware Center, Inc., Paoli, Pennsylvania since January 2007 and, previously, Vice President of The Hardware Center, Inc. | 2013 | 2010 | ||||
| George E. Steinmetz | 51 | Director. Owner, Matthews Paoli Ford, an automobile dealership, Paoli, Pennsylvania since 2002. | 2013 | 2007 | ||||
| Therese Woodman | 59 | Director. Township Manager of East Whiteland Township since February 2001. | 2012 | 2009 | ||||
| John B. Yerkes, Jr. | 73 | Vice Chairman of the Board. Principal and Chief Executive Officer of Yerkes Associates, Inc., consulting civil engineers, West Chester, Pennsylvania, since 1961. | 2015 | 1975 |
Exhibit IV-5 (continued)
Malvern Bancorp, Inc.
Director and Senior Management Summary Resumes
Executive Officers Who are Not Also Directors. The following individuals will be the executive officers of Malvern Bancorp–New. Ages are as of March 31, 2012.
Dennis Boyle, who is 60 years old, currently is Senior Vice President and Chief Financial Officer of Malvern Federal Bancorp and Senior Vice President, Treasurer and Chief Financial Officer of Malvern Federal Savings Bank. Previously, Mr. Boyle served as Vice President and Treasurer of Malvern Federal Savings Bank and in various other capacities since joining the Bank in 1974.
Richard J. Fuchs,who is 62 years old, joined Malvern Federal Savings Bank as Senior Vice President – Operations on September 1, 2009. Previously, Mr. Fuchs served as the Executive Vice President – Retail Banking and Chief Deposit Office of Fox Chase Bank, Hatboro, Pennsylvania, from April 2006 until September 2009, and prior thereto, he was Senior Vice President – Community Banking Division at The Bryn Mawr Trust Company, Bryn Mawr, Pennsylvania, and he also served as President and Chief Executive Officer of its subsidiary, the Bryn Mawr Brokerage Company from 2000 to 2005.
William E. Hughes, Jr., who is 54 years old, has served as Senior Vice President and Chief Lending Officer of Malvern Federal Savings Bank since 1997 and in various other capacities since joining the Bank in 1977.
Charles H. Neiner, who is 66 years old, has served as Chief Credit Officer of Malvern Federal Savings Bank since July 2011. Previously, Mr. Neiner served as Loan Servicing Manager since joining Malvern Federal Savings Bank in 2002. Mr. Neiner, who is a certified public accountant, has more than 35 years experience in the financial services industry, both as an independent consultant and as an employee with several banks and mortgage banking institutions.
EXHIBIT IV-6
Malvern Bancorp, Inc.
Pro Forma Regulatory Capital Ratios
Exhibit IV-6
Malvern Bancorp, Inc.
Pro Forma Regulatory Capital Ratios
| Pro Forma at March 31, 2012 | ||||||||||||||||||||||||||
| Minimum of Offering Range | Midpoint of Offering Range | Maximum of Offering Range | 15% Above Maximum of Offering Range | |||||||||||||||||||||||
| Malvern Federal Savings Bank Historical at March 31, 2012 | 2,337,500 Shares At $10.00 per Share | 2,750,000 Shares At $10.00 Per Share | 3,162,500 Shares at $10.00 Per Share | 3,636,875 Shares at $10.00 Per Share | ||||||||||||||||||||||
| (Unaudited) | ||||||||||||||||||||||||||
| Amount | Percent of Assets (1) | Amount | Percent of Assets | Amount | Percent of Assets | Amount | Percent of Assets | Amount | Percent of Assets | |||||||||||||||||
| (Dollars in Thousands) | ||||||||||||||||||||||||||
| GAAP capital | $ | 58,131 | 8.94 | % | $ | 73,135 | 11.00 | % | $ | 75,907 | 11.37 | % | $ | 78,679 | 11.73 | % | $ | 81,867 | 12.15 | % | ||||||
| Tier 1 capital: | ||||||||||||||||||||||||||
| Actual | $ | 53,442 | 8.27 | % | $ | 68,446 | 10.36 | % | $ | 71,218 | 10.73 | % | $ | 73,990 | 11.10 | % | $ | 77,178 | 11.53 | % | ||||||
| Requirement | 25,838 | 4.00 | 26,434 | 4.00 | 26,545 | 4.00 | 26,656 | 4.00 | 26,783 | 4.00 | ||||||||||||||||
| Excess | $ | 27,604 | 4.27 | % | $ | 42,012 | 6.36 | % | $ | 44,673 | 6.73 | % | $ | 47,334 | 7.10 | % | $ | 50,395 | 7.53 | % | ||||||
| Tier 1 risk-based capital: | ||||||||||||||||||||||||||
| Actual | $ | 53,442 | 12.45 | % | $ | 68,446 | 15.83 | % | $ | 71,218 | 16.47 | % | $ | 73,990 | 17.07 | % | $ | 77,178 | 17.78 | % | ||||||
| Requirement | 17,174 | 4.00 | 17,293 | 4.00 | 17,315 | 4.00 | 17,337 | 4.00 | 17,363 | 4.00 | ||||||||||||||||
| Excess | $ | 36,268 | 8.45 | % | $ | 51,153 | 11.83 | % | $ | 53,903 | 12.47 | % | $ | 56,653 | 13.07 | % | $ | 59,815 | 13.78 | % | ||||||
| Total capital: | ||||||||||||||||||||||||||
| Actual | $ | 58,842 | 13.71 | % | $ | 73,846 | 17.08 | % | $ | 76,618 | 17.70 | % | $ | 79,390 | 18.32 | % | $ | 82,578 | 19.02 | % | ||||||
| Requirement | 34,348 | 8.00 | 34,586 | 8.00 | 34,630 | 8.00 | 34,675 | 8.00 | 34,726 | 8.00 | ||||||||||||||||
| Excess | $ | 24,494 | 5.71 | % | $ | 39,260 | 9.08 | % | $ | 41,988 | 9.70 | % | $ | 44,715 | 10.32 | % | $ | 47,852 | 11.02 | % | ||||||
| Reconciliation of capital infused into Malvern Federal Savings Bank: | ||||||||||||||||||||||||||
| Net proceeds infused Plus: | $ | 14,904 | $ | 17,676 | $ | 20,448 | $ | 23,636 | ||||||||||||||||||
| Net assets received from mutual holding company | 100 | 100 | 100 | 100 | ||||||||||||||||||||||
| Pro forma increase in GAAP and regulatory capital | $ | 15,004 | $ | 17,776 | $ | 20,548 | $ | 23,736 | ||||||||||||||||||
| (1) | Adjusted total or adjusted risk-weighted assets, as appropriate. | |
Source: Malvern Bancorp’s prospectus.
EXHIBIT IV-7
Malvern Bancorp, Inc.
Pro Forma Analysis Sheet
EXHIBIT IV-7
PRO FORMA ANALYSIS SHEET
Malvern Bancorp, Inc.
Prices as of May 4, 2012
| Subject | Peer Group | Pennsylvania Companies | All Public | |||||||||||||||
| Valuation Midpoint Pricing Multiples | Symbol | at Midpoint | Average | Median | Average | Median | Average | Median | ||||||||||
| Price-earnings multiple | = | P/E | 51.68 | x | 18.40 | x | 17.00 | x | 18.38 | x | 17.90 | x | 19.00 | x | 17.22 | x | ||
| Price-core earnings multiple | = | P/CE | 85.42 | 18.91 | x | 16.30 | x | 20.19 | x | 18.23 | x | 20.22 | x | 18.01 | x | |||
| Price-book ratio | = | P/B | 56.87 | % | 78.42 | % | 74.90 | % | 84.49 | % | 78.99 | % | 82.90 | % | 80.55 | % | ||
| Price-tangible book ratio | = | P/TB | 56.87 | % | 85.17 | % | 83.11 | % | 91.12 | % | 83.97 | % | 89.39 | % | 83.85 | % | ||
| Price-assets ratio | = | P/A | 7.33 | % | 11.02 | % | 10.49 | % | 10.99 | % | 10.65 | % | 10.09 | % | 9.76 | % | ||
| Valuation Parameters | ||||||||||||
| Pre-Conversion Earnings (1)(Y) | $ | 802,000 | (12 Mths 03/12) | ESOP Stock (% of Offering) (E) | 0.00 | % | ||||||
| Pre-Conversion Core Earnings (1)(YC) | $ | 423,000 | (12 Mths 03/12) | Cost of ESOP Borrowings (S) | 0.00 | % | ||||||
| Pre-Conversion Book Value (2)(B) | $ | 62,003,000 | ESOP Amortization (T) | 15.00 | Years | |||||||
| Pre-Conv. Tang. Book Value (2)(B) | $ | 62,003,000 | Stock Program (% of Offering) (M) | 0.00 | % | |||||||
| Pre-Conversion Assets (2)(A) | $ | 651,704,000 | Stock Programs Vesting (N) | 5.00 | Years | |||||||
| Reinvestment Rate (R) | 1.04 | % | Fixed Expenses | $ | 1,150,000 | |||||||
| Tax rate (TAX) | 40.00 | % | Variable Expenses | 1.00 | % | |||||||
| After Tax Reinvest. Rate (R) | 0.62 | % | Percentage Sold (PCT) | 55.4506 | % | |||||||
| Est. Conversion Expenses (3)(X) | 8.17 | % | MHC Assets | $ | 100,000 | |||||||
| Insider Purchases | $ | 200,000 | Options as % of Offering (O1) | 0.00 | % | |||||||
| Price/Share | $ | 10.00 | Estimated Option Value (O2) | 0.00 | % | |||||||
| Foundation Cash Contribution (FC) | 0.00 | % | Option Vesting Period (O3) | 5.00 | Years | |||||||
| Foundation Stock Contribution (FS) | 0.00 | % | Shares | % of Options taxable (O4) | 25.00 | % | ||||||
| Foundation Tax Benefit (FT) | $ | 0 |
| Calculation of Pro Forma Value After Conversion | ||||||
| 1. V= | P/E * (Y) | V= | $49,593,660 | |||
| 1 - P/E * PCT * ((1-X-E-M-FS)*R - (1-TAX)*(E/T) - (1-TAX)*(M/N)-(1-TAX*O4)*(O1*O2/O3))) | ||||||
| 2. V= | P/Core E * (YC) | V= | $49,593,660 | |||
| 1 - P/Core E * PCT * ((1-X-E-M-FS)*R - (1-TAX)*(E/T) - (1-TAX)*(M/N)-(1-TAX*O4)*(O1*O2/O3))) | ||||||
| 3. V= | P/B * (B+FT) | V= | $49,593,660 | |||
| 1 - P/B * PCT * (1-X-E-M-FC-FS) | ||||||
| 4. V= | P/TB * (B+FT) | V= | $49,593,660 | |||
| 1 - P/TB * PCT * (1-X-E-M-FC-FS) | ||||||
| 5. V= | P/A * (A+FT) | V= | $49,593,660 | |||
| 1 - P/A * PCT * (1-X-E-M-FC-FS) | ||||||
| Shares | |||||||||||||||||||
| Conclusion | 2nd Step Offering Shares | 2nd Step Exchange Shares | Full Conversion Shares | Plus: Foundation Shares | Total Market Capitalization Shares | Exchange Ratio | |||||||||||||
| Supermaximum | 3,636,875 | 2,921,887 | 6,558,762 | 0 | 6,558,762 | 1.0748 | |||||||||||||
| Maximum | 3,162,500 | 2,540,771 | 5,703,271 | 0 | 5,703,271 | 0.9346 | |||||||||||||
| Midpoint | 2,750,000 | 2,209,366 | 4,959,366 | 0 | 4,959,366 | 0.8127 | |||||||||||||
| Minimum | 2,337,500 | 1,877,961 | 4,215,461 | 0 | 4,215,461 | 0.6908 | |||||||||||||
| Market Value | ||||||||||||||||
| Conclusion | 2nd Step Offering Value | 2nd Step Exchange Shares Value | Full Conversion $ Value | Foundation Value | Total Market Capitalization $ Value | |||||||||||
| Supermaximum | $ | 36,368,750 | $ | 29,218,870 | $ | 65,587,620 | $ | 0 | $ | 65,587,620 | ||||||
| Maximum | $ | 31,625,000 | $ | 25,407,710 | $ | 57,032,710 | 0 | $ | 57,032,710 | |||||||
| Midpoint | $ | 27,500,000 | $ | 22,093,660 | $ | 49,593,660 | 0 | $ | 49,593,660 | |||||||
| Minimum | $ | 23,375,000 | $ | 18,779,610 | $ | 42,154,610 | 0 | $ | 42,154,610 | |||||||
| (1) | Includes $1,000 of net income earned on net MHC assets of $100,000. |
| (2) | Includes $100,000 of net MHC assets. |
| (3) | Estimated offering expenses at midpoint of the offering. |
EXHIBIT IV-8
Malvern Bancorp, Inc.
Pro Forma Effect of Conversion Proceeds
Exhibit IV-8
PRO FORMA EFFECT OF CONVERSION PROCEEDS
Malvern Bancorp, Inc.
At the Minimum of the Range
| 1. | Fully Converted Value and Exchange Ratio | ||||
| Fully Converted Value | $ | 42,154,610 | |||
| Exchange Ratio | 0.6908 | ||||
| 2nd Step Offering Proceeds | $ | 23,375,000 | |||
| Less: Estimated Offering Expenses | 2,083,000 | ||||
| 2nd Step Net Conversion Proceeds (Including Foundation) | $ | 21,292,000 | |||
| 2. | Estimated Additional Income from Conversion Proceeds | ||||
| Net Conversion Proceeds | $ | 21,292,000 | |||
| Less: Cash Contribution to Foundation | (0 | ) | |||
| Less: Stock Contribution to Foundation | 0 | ||||
| Less: ESOP Stock Purchases | 0 | ||||
| Less: RRP Stock Purchases | 0 | ||||
| Net Proceeds to be Reinvested | $ | 21,292,000 | |||
| Estimated after-tax net incremental rate of return | 0.62 | % | |||
| Earnings Increase | $ | 132,862 | |||
| Less: Estimated cost of ESOP borrowings | 0 | ||||
| Less: Amortization of ESOP borrowings | 0 | ||||
| Less: Stock Programs Vesting | 0 | ||||
| Less: Option Plan Vesting | 0 | ||||
| Net Earnings Increase | $ | 132,862 |
| 3. | Pro Forma Earnings | Before Conversion | Net Earnings Increase | After Conversion | ||||||||||
| 12 Months ended March 31, 2012 (reported) | $ | 802,000 | $ | 132,862 | $ | 934,862 | ||||||||
| 12 Months ended March 31, 2012 (core) | $ | 423,000 | $ | 132,862 | $ | 555,862 | ||||||||
| 4. | Pro Forma Net Worth | Before Conversion | Net Addition to Equity | Tax Benefit of Foundation | After Conversion | |||||||||
| March 31, 2012 | $ | 62,003,000 | $ | 21,292,000 | $ | 0 | $ | 83,295,000 | ||||||
| March 31, 2012 (Tangible) | $ | 62,003,000 | $ | 21,292,000 | $ | 0 | $ | 83,295,000 | ||||||
| 5. | Pro Forma Assets | Before Conversion | Net Cash Proceeds | Tax Benefit of Foundation | After Conversion | |||||||||
| March 31, 2012 | $ | 651,704,000 | $ | 21,292,000 | $ | 0 | $ | 672,996,000 | ||||||
Exhibit IV-8
PRO FORMA EFFECT OF CONVERSION PROCEEDS
Malvern Bancorp, Inc.
At the Midpoint of the Range
| 1. | Fully Converted Value and Exchange Ratio | ||||
| Fully Converted Value | $ | 49,593,660 | |||
| Exchange Ratio | 0.8127 | ||||
| 2nd Step Offering Proceeds | $ | 27,500,000 | |||
| Less: Estimated Offering Expenses | 2,248,000 | ||||
| 2nd Step Net Conversion Proceeds (Including Foundation) | $ | 25,252,000 | |||
| 2. | Estimated Additional Income from Conversion Proceeds | ||||
| Net Conversion Proceeds | $ | 25,252,000 | |||
| Less: Cash Contribution to Foundation | (0 | ) | |||
| Less: Stock Contribution to Foundation | 0 | ||||
| Less: ESOP Stock Purchases | 0 | ||||
| Less: RRP Stock Purchases | 0 | ||||
| Net Proceeds to be Reinvested | $ | 25,252,000 | |||
| Estimated after-tax net incremental rate of return | 0.62 | % | |||
| Earnings Increase | $ | 157,572 | |||
| Less: Estimated cost of ESOP borrowings | 0 | ||||
| Less: Amortization of ESOP borrowings | 0 | ||||
| Less: Stock Programs Vesting | 0 | ||||
| Less: Option Plan Vesting | 0 | ||||
| Net Earnings Increase | $ | 157,572 |
| 3. | Pro Forma Earnings | Before Conversion | Net Earnings Increase | After Conversion | ||||||||||
| 12 Months ended March 31, 2012 (reported) | $ | 802,000 | $ | 157,572 | $ | 959,572 | ||||||||
| 12 Months ended March 31, 2012 (core) | $ | 423,000 | $ | 157,572 | $ | 580,572 | ||||||||
| 4. | Pro Forma Net Worth | Before Conversion | Net Cash Proceeds | Tax Benefit of Foundation | After Conversion | |||||||||
| March 31, 2012 | $ | 62,003,000 | $ | 25,252,000 | $ | 0 | $ | 87,255,000 | ||||||
| March 31, 2012 (Tangible) | $ | 62,003,000 | $ | 25,252,000 | $ | 0 | $ | 87,255,000 | ||||||
| 5. | Pro Forma Assets | Before Conversion | Net Cash Proceeds | Tax Benefit of Foundation | After Conversion | |||||||||
| March 31, 2012 | $ | 651,704,000 | $ | 25,252,000 | $ | 0 | $ | 676,956,000 | ||||||
Exhibit IV-8
PRO FORMA EFFECT OF CONVERSION PROCEEDS
Malvern Bancorp, Inc.
At the Maximum of the Range
| 1. | Fully Converted Value and Exchange Ratio | ||||
| Fully Converted Value | $ | 57,032,710 | |||
| Exchange Ratio | 0.9346 | ||||
| 2nd Step Offering Proceeds | $ | 31,625,000 | |||
| Less: Estimated Offering Expenses | 2,413,000 | ||||
| 2nd Step Net Conversion Proceeds (Including Foundation) | $ | 29,212,000 | |||
| 2. | Estimated Additional Income from Conversion Proceeds | ||||
| Net Conversion Proceeds | $ | 29,212,000 | |||
| Less: Cash Contribution to Foundation | (0 | ) | |||
| Less: Stock Contribution to Foundation | 0 | ||||
| Less: ESOP Stock Purchases | 0 | ||||
| Less: RRP Stock Purchases | 1 | ||||
| Net Proceeds to be Reinvested | $ | 29,212,001 | |||
| Estimated after-tax net incremental rate of return | 0.62 | % | |||
| Earnings Increase | $ | 182,283 | |||
| Less: Estimated cost of ESOP borrowings | 0 | ||||
| Less: Amortization of ESOP borrowings | 0 | ||||
| Less: Stock Programs Vesting | 0 | ||||
| Less: Option Plan Vesting | 0 | ||||
| Net Earnings Increase | $ | 182,283 |
| 3. | Pro Forma Earnings | Before Conversion | Net Earnings Increase | After Conversion | ||||||||||
| 12 Months ended March 31, 2012 (reported) | $ | 802,000 | $ | 182,283 | $ | 984,283 | ||||||||
| 12 Months ended March 31, 2012 (core) | $ | 423,000 | $ | 182,283 | $ | 605,283 | ||||||||
| 4. | Pro Forma Net Worth | Before Conversion | Net Cash Proceeds | Tax Benefit of Foundation | After Conversion | |||||||||
| March 31, 2012 | $ | 62,003,000 | $ | 29,212,001 | $ | 0 | $ | 91,215,001 | ||||||
| March 31, 2012 (Tangible) | $ | 62,003,000 | $ | 29,212,001 | $ | 0 | $ | 91,215,001 | ||||||
| 5. | Pro Forma Assets | Before Conversion | Net Cash Proceeds | Tax Benefit of Foundation | After Conversion | |||||||||
| March 31, 2012 | $ | 651,704,000 | $ | 29,212,001 | $ | 0 | $ | 680,916,001 | ||||||
Exhibit IV-8
PRO FORMA EFFECT OF CONVERSION PROCEEDS
Malvern Bancorp, Inc.
At the Super Maximum Value
| 1. | Fully Converted Value and Exchange Ratio | ||||
| Fully Converted Value | $ | 65,587,620 | |||
| Exchange Ratio | 1.0748 | ||||
| 2nd Step Offering Proceeds | $ | 36,368,750 | |||
| Less: Estimated Offering Expenses | 2,602,750 | ||||
| 2nd Step Net Conversion Proceeds (Including Foundation) | $ | 33,766,000 | |||
| 2. | Estimated Additional Income from Conversion Proceeds | ||||
| Net Conversion Proceeds | $ | 33,766,000 | |||
| Less: Cash Contribution to Foundation | (0 | ) | |||
| Less: Stock Contribution to Foundation | 0 | ||||
| Less: ESOP Stock Purchases | 0 | ||||
| Less: RRP Stock Purchases | (2 | ) | |||
| Net Proceeds to be Reinvested | $ | 33,765,998 | |||
| Estimated after-tax net incremental rate of return | 0.62 | % | |||
| Earnings Increase | $ | 210,700 | |||
| Less: Estimated cost of ESOP borrowings | 0 | ||||
| Less: Amortization of ESOP borrowings | 0 | ||||
| Less: Stock Programs Vesting | 0 | ||||
| Less: Option Plan Vesting | 0 | ||||
| Net Earnings Increase | $ | 210,700 |
| 3. | Pro Forma Earnings | Before Conversion | Net Earnings Increase | After Conversion | ||||||||||
| 12 Months ended March 31, 2012 (reported) | $ | 802,000 | $ | 210,700 | $ | 1,012,700 | ||||||||
| 12 Months ended March 31, 2012 (core) | $ | 423,000 | $ | 210,700 | $ | 633,700 | ||||||||
| 4. | Pro Forma Net Worth | Before Conversion | Net Cash Proceeds | Tax Benefit of Foundation | After Conversion | |||||||||
| March 31, 2012 | $ | 62,003,000 | $ | 33,765,998 | $ | 0 | $ | 95,768,998 | ||||||
| March 31, 2012 (Tangible) | $ | 62,003,000 | $ | 33,765,998 | $ | 0 | $ | 95,768,998 | ||||||
| 5. | Pro Forma Assets | Before Conversion | Net Cash Proceeds | Tax Benefit of Foundation | After Conversion | |||||||||
| March 31, 2012 | $ | 651,704,000 | $ | 33,765,998 | $ | 0 | $ | 685,469,998 | ||||||
EXHIBIT IV-9
Peer Group Core Earnings Analysis
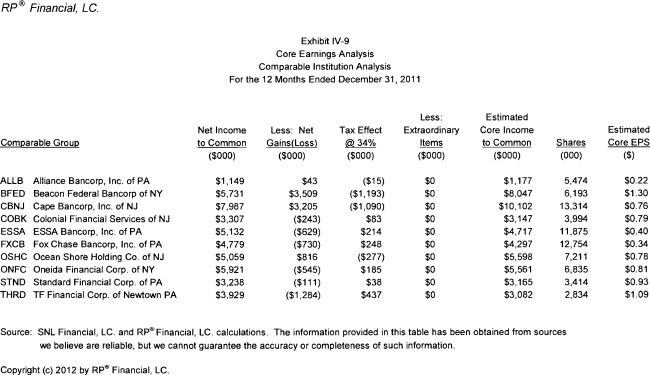
EXHIBIT V-1
RP® Financial, LC.
Firm Qualifications Statement
RPfinancial, lc.
Advisory | Planning | Valuation
| FIRM QUALIFICATION STATEMENT |
| RP® Financial, LC. (“RP Financial”) provides financial and management consulting, merger advisory and valuation services to the financial services companies, including banks, thrifts, credit unions, insurance companies, mortgage companies and others. We offer a broad array of services, high quality and prompt service, hands-on involvement by our senior staff, careful structuring of strategic initiatives and sophisticated valuation and other analyses consistent with industry practices and regulatory requirements. Our staff has extensive consulting, valuation, financial advisory and industry backgrounds. |
| STRATEGIC PLANNING SERVICES |
| RP Financial’s strategic planning services, for established or de novo banking companies, provide effective feasible plans with quantifiable results to enhance shareholder value, achieve regulatory approval or realize other objectives. We conduct situation analyses; establish mission/vision statements, develope strategic goals and objectives; and identify strategies to enhance value, address capital, increase earnings, manage risk and tackle operational or organizational matters. Our proprietary financial simulation models facilitate the evaluation of the feasibility, impact and merit of alternative financial strategies. |
| MERGER ADVISORY SERVICES |
| RP Financial’s merger advisory services include targeting buyers and sellers, assessing acquisition merit, conducting due diligence, negotiating and structuring deal terms, preparing merger business plans and financial simulations, rendering fairness opinions, preparing fair valuation analyses and supporting post-merger strategies. RP Financial is also expert in de novo charters, shelf charters and failed bank deals with loss sharing or other assistance. Through financial simulations, valuation proficiency and regulatory familiarity, RP Financial’s merger advisory services center on enhancing shareholder returns. |
| VALUATION SERVICES |
| RP Financial’s extensive valuation practice includes mergers, thrift stock conversions, insurance company demutualizations, merger valuation and goodwill impairment, ESOPs, going private, secondary offerings and other purposes. We are highly experienced in performing appraisals conforming with regulatory guidelines and appraisal standards. RP Financial is the nation’s leading valuation firm for thrift stock conversions, with offerings ranging up to $4 billion. |
| MANAGEMENT STUDIES |
| RP Financial provides effective organizational planning, and we are often engaged to prepare independent management studies required for regulatory enforcement actions. We evaluate Board, management and staffing needs, assess existing talent and capabilities and make strategic recommendations for new positions, replacement, succession and other organizational matters. |
| ENTERPRISE RISK ASSESSMENT SERVICES |
| RP Financial provides effective enterprise risk assessment consulting services to assist our clients in evaluating the degree to which they have properly identified, understood, measured, monitored and controlled enterprise risk as part of a deliberate risk/reward strategy and to help them implement strategies to mitigate risk, enhance performance, ensure effective reporting and compliance with laws and regulations and avoid potential future damage to their reputation and associated consequences and to mitigate residual risk and unanticipated losses. |
| OTHER CONSULTING SERVICES |
| RP Financial provides other consulting services including evaluating regulatory changes, development diversification and branching strategies, conducting feasibility studies and other research, and preparing management studies in response to regulatory enforcement actions. We assist clients with CRA plans and revising policies and procedures. Our other consulting services are aided by proprietary valuation and financial simulation models. |
| KEY PERSONNEL (Years of Relevant Experience & Contact Information) | ||
| Ronald S. Riggins, Managing Director (31) | (703) 647-6543 | rriggins@rpfinancial.com |
| William E. Pommerening, Managing Director (27) | (703) 647-6546 | wpommerening@rpfinancial.com |
| Marcus Faust, Director (23) | (703) 647-6553 | mfaust@rpfinancial.com |
| Gregory E. Dunn, Director (28) | (703) 647-6548 | gdunn@rpfinancial.com |
| James P. Hennessey, Director (25) | (703) 647-6544 | jhennessey@rpfinancial.com |
| James J. Oren, Director (24) | (703) 647-6549 | joren@rpfinancial.com |
| Timothy M. Biddle, Senior Vice President (21) | (703) 647-6552 | tbiddle@rpfinancial.com |
| Janice Hollar, Senior Vice President (29) | (703) 647-6554 | jhollar@rpfinancial.com |
| Carla H. Pollard, Senior Vice President (22) | (703) 647-6556 | cpollard@rpfinancial.com |
| RP Financial, LC. | Phone: (703) 528-1700 | |
| 1100 North Glebe Road, Suite 600 | Fax: (703) 528-1788 | |
| Arlington, VA 22201 | www.rpfinancial.com |
1