Exhibit 99.1

Investor Presentation November 4, 2013
Certain comments in this presentation contain certain forward looking statements (as defined in the Securities Exchange Act of 1934 and the regulations hereunder). Forward looking statements are not historical facts but instead represent only the beliefs, expectations or opinions of Malvern Bancorp, Inc. and its management regarding future events, many of which, by their nature, are inherently uncertain. Forward looking statements may be identified by the use of such words as: “believe”, “expect”, “anticipate”, “intend”, “plan”, “estimate”, or words of similar meaning, or future or conditional terms such as “will”, “would”, “should”, “could”, “may”, “likely”, “probably”, or “possibly.” Forward looking statements include, but are not limited to, financial projections and estimates and their underlying assumptions; statements regarding plans, objectives and expectations with respect to future operations, products and services; and statements regarding future performance. Such statements are subject to certain risks, uncertainties and assumption, many of which are difficult to predict and generally a re beyond the control of Malvern Bancorp, Inc. and its management, that could cause actual results to differ materially from those expressed in, or implied or projected by, forward looking statements. The following factors, among others, could cause actual results to differ materially from the anticipated results or other expectations expressed in the forward looking statements: (1) economic and competitive conditions which could affect the volume of loan originations, deposit flows and real estate values; (2) the levels of non - interest income and expense and the amount of loan losses; (3) competitive pressure among depository institutions increasing significantly; (4) changes in the interest rate environment causing reduced interest margins; (5) general economic conditions, either nationally or in the markets in which Malvern Bancorp, Inc. is or will be doing business, being less favorable than expected ; ( 6) political and social unrest, including acts of war or terrorism; or (7) legislation or changes in regulatory requirements adversely affecting the business in which Malvern Bancorp, Inc. is engaged. Malvern Bancorp, Inc. undertakes no obligation to update these forward looking statements to reflect events or circumstances that occur after the date on which such statements were made. As used in this report, unless the context otherwise requires, the terms “we,” “our,” “us,” or the “Company” refer to Malvern Bancorp, Inc. and the term the “Bank” refers to Malvern Federal Savings Bank, a federally chartered savings bank and wholly owned subsidiary of the Company. In addition, unless the context otherwise requires, references to the operations of the Company include the operations of the Bank. For a more detailed description of the factors that may affect Malvern Bancorp’s operating results or the outcomes described in these forward - looking statements, we refer you to our filings with the Securities and Exchange Commission, including our annual report on Form 10 - K for the year ended September 30, 2012. Malvern Bancorp assumes no obligation to update the forward - looking statements made during this presentation. For more information, please visit our Web site www.malvernfederal.com. Forward - Looking Statements 1
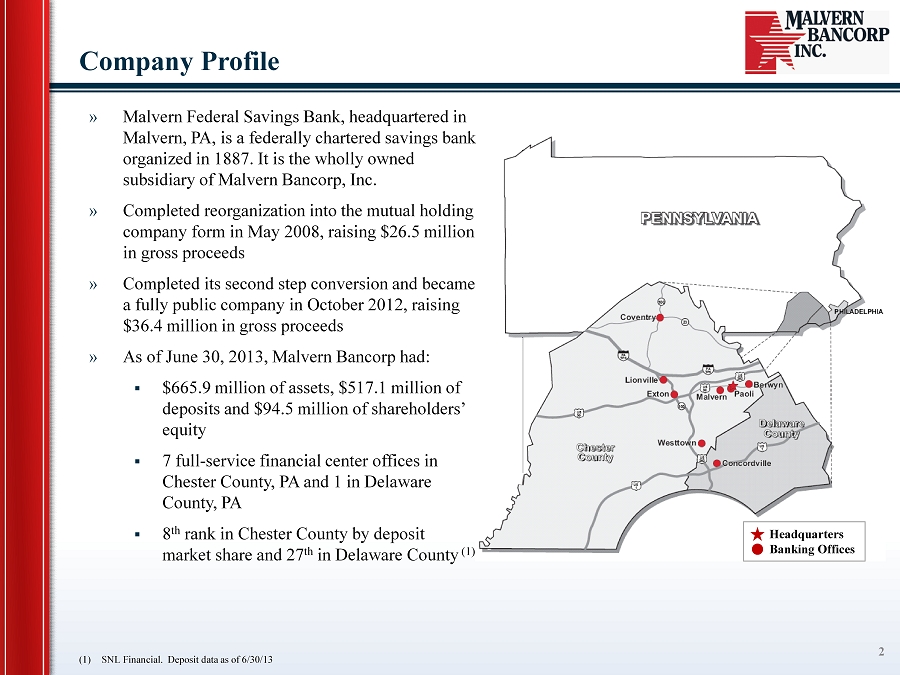
Company Profile 2 » Malvern Federal Savings Bank, headquartered in Malvern, PA, is a federally chartered savings bank organized in 1887. It is the wholly owned subsidiary of Malvern Bancorp, Inc. » Completed reorganization into the mutual holding company form in May 2008, raising $26.5 million in gross proceeds » C ompleted its second step conversion and became a fully public company in October 2012, raising $36.4 million in gross proceeds » As of June 30, 2013, Malvern Bancorp had: ▪ $665.9 million of assets, $517.1 million of deposits and $94.5 million of shareholders’ equity ▪ 7 full - service financial center offices in Chester County, PA and 1 in Delaware County, PA ▪ 8 th rank in Chester County by deposit market share and 27 th in Delaware County (1) Headquarters Banking Offices (1) SNL Financial. Deposit data as of 6/30/13
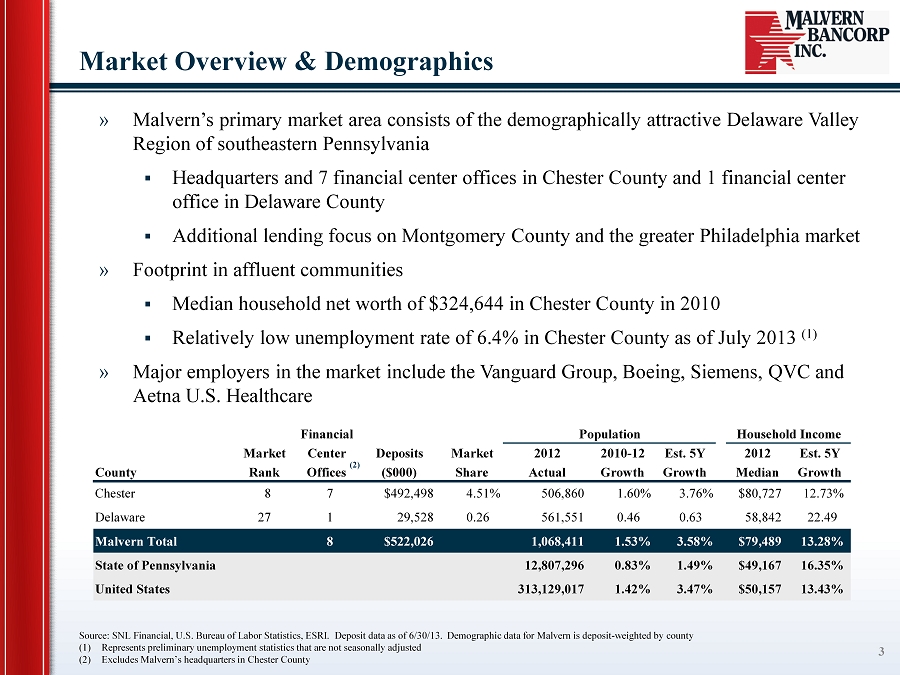
» Malvern’s primary market area consists of the demographically attractive Delaware Valley Region of southeastern Pennsylvania ▪ Headquarters and 7 financial center offices in Chester County and 1 financial center office in Delaware County ▪ Additional lending focus on Montgomery County and the greater Philadelphia market » Footprint in affluent communities ▪ Median household net worth of $324,644 in Chester County in 2010 ▪ Relatively low unemployment rate of 6.4% in Chester County as of July 2013 (1) » Major employers in the market include the Vanguard Group, Boeing, Siemens, QVC and Aetna U.S. Healthcare Market Overview & Demographics 3 Source: SNL Financial, U.S. Bureau of Labor Statistics, ESRI. Deposit data as of 6/30/13. Demographic data for Malvern is d epo sit - weighted by county (1) Represents preliminary unemployment statistics that are not seasonally adjusted (2) Excludes Malvern’s headquarters in Chester County (2) Financial Population Household Income Market Center Deposits Market 2012 2010-12 Est. 5Y 2012 Est. 5Y County Rank Offices ($000) Share Actual Growth Growth Median Growth Chester 8 7 $492,498 4.51% 506,860 1.60% 3.76% $80,727 12.73% Delaware 27 1 29,528 0.26 561,551 0.46 0.63 58,842 22.49 Malvern Total 8 $522,026 1,068,411 1.53% 3.58% $79,489 13.28% State of Pennsylvania 12,807,296 0.83% 1.49% $49,167 16.35% United States 313,129,017 1.42% 3.47% $50,157 13.43%
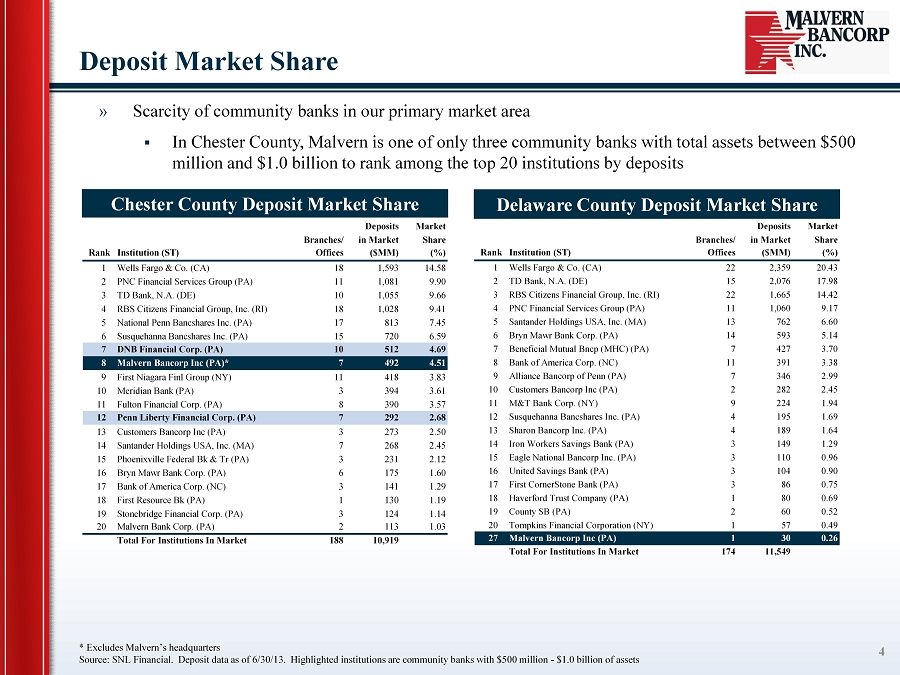
Deposits Market Branches/ in Market Share Rank Institution (ST) Offices ($MM) (%) 1 Wells Fargo & Co. (CA) 22 2,359 20.43 2 TD Bank, N.A. (DE) 15 2,076 17.98 3 RBS Citizens Financial Group, Inc. (RI) 22 1,665 14.42 4 PNC Financial Services Group (PA) 11 1,060 9.17 5 Santander Holdings USA, Inc. (MA) 13 762 6.60 6 Bryn Mawr Bank Corp. (PA) 14 593 5.14 7 Beneficial Mutual Bncp (MHC) (PA) 7 427 3.70 8 Bank of America Corp. (NC) 11 391 3.38 9 Alliance Bancorp of Penn (PA) 7 346 2.99 10 Customers Bancorp Inc (PA) 2 282 2.45 11 M&T Bank Corp. (NY) 9 224 1.94 12 Susquehanna Bancshares Inc. (PA) 4 195 1.69 13 Sharon Bancorp Inc. (PA) 4 189 1.64 14 Iron Workers Savings Bank (PA) 3 149 1.29 15 Eagle National Bancorp Inc. (PA) 3 110 0.96 16 United Savings Bank (PA) 3 104 0.90 17 First CornerStone Bank (PA) 3 86 0.75 18 Haverford Trust Company (PA) 1 80 0.69 19 County SB (PA) 2 60 0.52 20 Tompkins Financial Corporation (NY) 1 57 0.49 27 Malvern Bancorp Inc (PA) 1 30 0.26 Total For Institutions In Market 174 11,549 Deposits Market Branches/ in Market Share Rank Institution (ST) Offices ($MM) (%) 1 Wells Fargo & Co. (CA) 18 1,593 14.58 2 PNC Financial Services Group (PA) 11 1,081 9.90 3 TD Bank, N.A. (DE) 10 1,055 9.66 4 RBS Citizens Financial Group, Inc. (RI) 18 1,028 9.41 5 National Penn Bancshares Inc. (PA) 17 813 7.45 6 Susquehanna Bancshares Inc. (PA) 15 720 6.59 7 DNB Financial Corp. (PA) 10 512 4.69 8 Malvern Bancorp Inc (PA)* 7 492 4.51 9 First Niagara Finl Group (NY) 11 418 3.83 10 Meridian Bank (PA) 3 394 3.61 11 Fulton Financial Corp. (PA) 8 390 3.57 12 Penn Liberty Financial Corp. (PA) 7 292 2.68 13 Customers Bancorp Inc (PA) 3 273 2.50 14 Santander Holdings USA, Inc. (MA) 7 268 2.45 15 Phoenixville Federal Bk & Tr (PA) 3 231 2.12 16 Bryn Mawr Bank Corp. (PA) 6 175 1.60 17 Bank of America Corp. (NC) 3 141 1.29 18 First Resource Bk (PA) 1 130 1.19 19 Stonebridge Financial Corp. (PA) 3 124 1.14 20 Malvern Bank Corp. (PA) 2 113 1.03 Total For Institutions In Market 188 10,919 » Scarcity of community banks in our primary market area ▪ In Chester County, Malvern is one of only three community banks with total assets between $500 million and $1.0 billion to rank among the top 20 institutions by deposits Deposit Market Share 4 * Excludes Malvern’s headquarters Source: SNL Financial. Deposit data as of 6/30/13. Highlighted institutions are community banks with $500 million - $1.0 billi on of assets Chester County Deposit Market Share Delaware County Deposit Market Share *
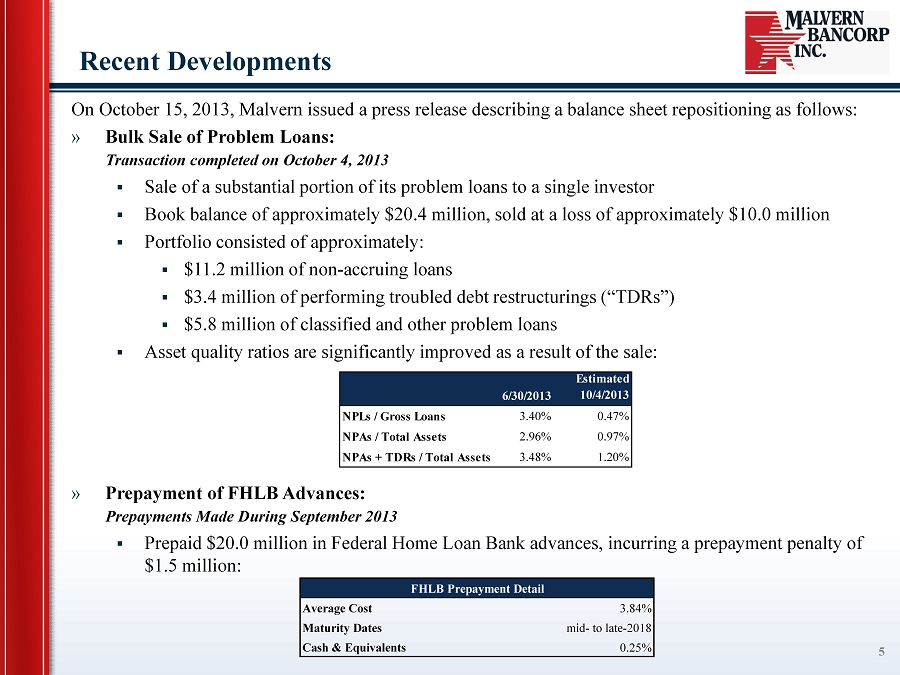
Recent Developments 5 On October 15, 2013, Malvern issued a press release describing a balance sheet repositioning as follows: » Bulk Sale of Problem Loans: Transaction completed on October 4, 2013 ▪ Sale of a substantial portion of its problem loans to a single investor ▪ Book balance of approximately $20.4 million, sold at a loss of approximately $10.0 million ▪ Portfolio consisted of approximately: ▪ $11.2 million of non - accruing loans ▪ $ 3.4 million of performing troubled debt restructurings (“TDRs ”) ▪ $ 5.8 million of classified and other problem loans ▪ Asset quality ratios are significantly improved as a result of the sale: » Prepayment of FHLB Advances: Prepayments M ade During September 2013 ▪ Prepaid $20.0 million in Federal Home Loan Bank advances, incurring a prepayment penalty of $1.5 million: 6/30/2013 Estimated 10/4/2013 NPLs / Gross Loans 3.40% 0.47% NPAs / Total Assets 2.96% 0.97% NPAs + TDRs / Total Assets 3.48% 1.20% FHLB Prepayment Detail Average Cost 3.84% Maturity Dates mid- to late-2018 Cash & Equivalents 0.25%
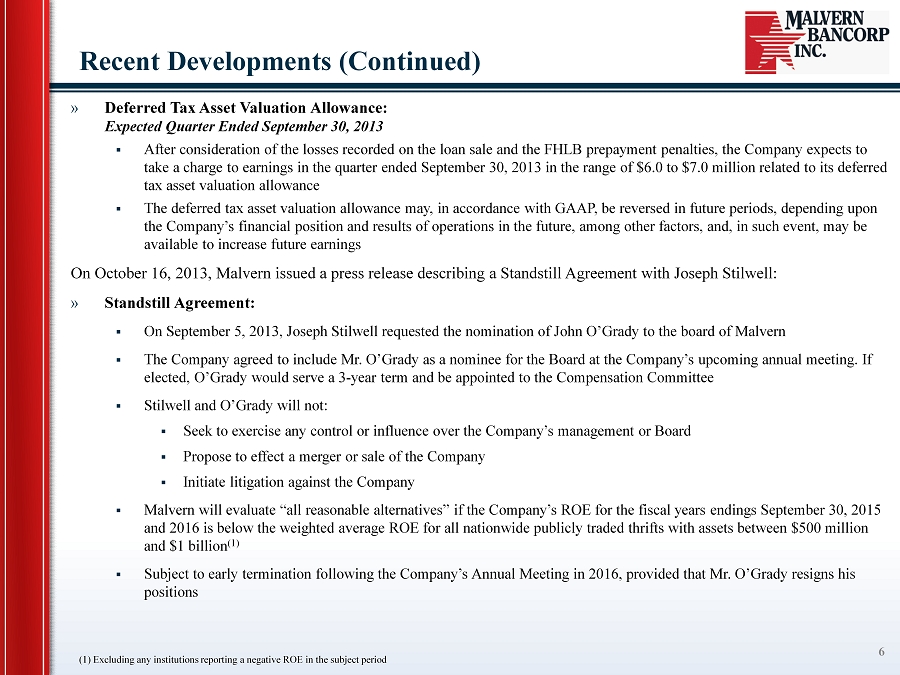
Recent Developments (Continued) 6 » Deferred Tax Asset Valuation Allowance: Expected Quarter Ended September 30, 2013 ▪ After consideration of the losses recorded on the loan sale and the FHLB prepayment penalties, the Company expects to take a charge to earnings in the quarter ended September 30, 2013 in the range of $6.0 to $7.0 million related to its deferre d tax asset valuation allowance ▪ The deferred tax asset valuation allowance may, in accordance with GAAP, be reversed in future periods, depending upon the Company’s financial position and results of operations in the future, among other factors, and, in such event, may be available to increase future earnings On October 16, 2013, Malvern issued a press release describing a Standstill Agreement with Joseph Stilwell: » Standstill Agreement: ▪ O n September 5 , 2013, Joseph Stilwell requested the nomination of John O’Grady to the board of Malvern ▪ The Company agreed to include Mr. O’Grady as a nominee for the Board at the Company’s upcoming annual meeting. If elected, O’Grady would serve a 3 - year term and be appointed to the Compensation Committee ▪ Stilwell and O’Grady will not: ▪ Seek to exercise any control or influence over the Company’s management or Board ▪ Propose to effect a merger or sale of the Company ▪ Initiate litigation against the Company ▪ Malvern will evaluate “all reasonable alternatives” if the Company’s ROE for the fiscal years endings September 30, 2015 and 2016 is below the weighted average ROE for all nationwide publicly traded thrifts with assets between $500 million and $1 billion (1) ▪ Subject to early termination following the Company’s Annual Meeting in 2016, provided that Mr. O’Grady resigns his positions (1) Excluding any institutions reporting a negative ROE in the subject period
» Our business strategy is focused on returning core profitability to sustainable levels, further reducing the level of our non - performing assets, limiting the number of additional non - performing assets in future periods and seeking additional relief from the provisions of the Supervisory Agreement. » Below are the highlights of our business strategy : » Improving Earnings » Managing Loan Portfolio » Managing Credit Risk » Increasing Market Share Penetration » Increasing Our Core Deposits » Continuing to Provide Exceptional Customer Service Business Strategy 7
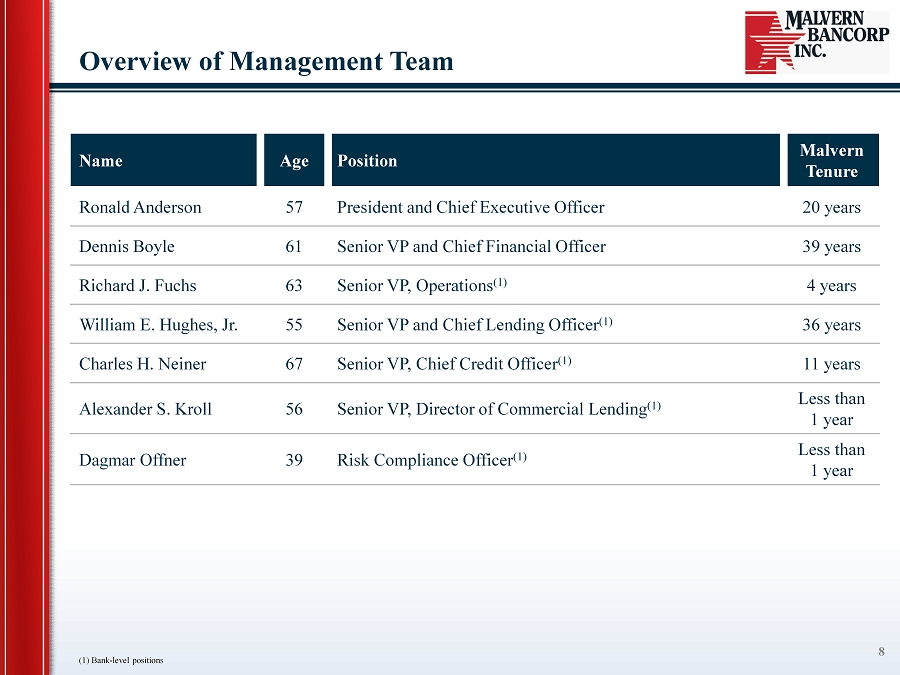
Overview of Management Team 8 Name Age Position Malvern Tenure Ronald Anderson 57 President and Chief Executive Officer 20 years Dennis Boyle 61 Senior VP and Chief Financial Officer 39 years Richard J. Fuchs 63 Senior VP, Operations (1) 4 years William E. Hughes, Jr. 55 Senior V P and Chief Lending Officer (1) 36 years Charles H. Neiner 67 Senior VP, Chief Credit Officer (1) 11 years Alexander S. Kroll 56 Senior VP, Director of Commercial Lending (1) Less than 1 year Dagmar Offner 39 Risk Compliance Officer (1) Less than 1 year (1) Bank - level positions
Financial Highlights 9
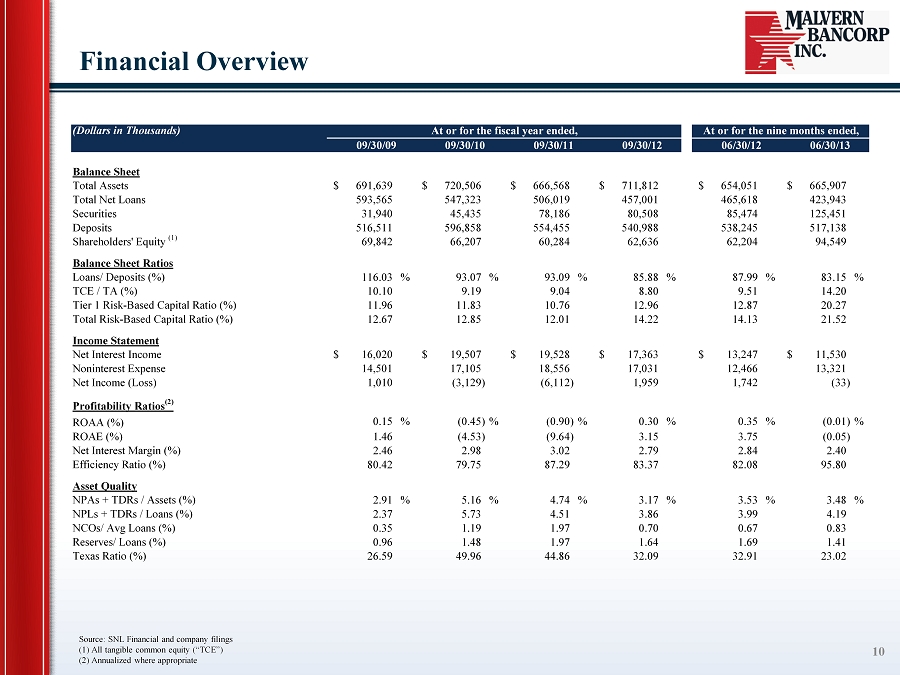
Financial Overview 10 (Dollars in Thousands) At or for the fiscal year ended, At or for the nine months ended, 09/30/09 09/30/10 09/30/11 09/30/12 06/30/12 06/30/13 Balance Sheet Total Assets 691,639$ 720,506$ 666,568$ 711,812$ 654,051$ 665,907$ Total Net Loans 593,565 547,323 506,019 457,001 465,618 423,943 Securities 31,940 45,435 78,186 80,508 85,474 125,451 Deposits 516,511 596,858 554,455 540,988 538,245 517,138 Shareholders' Equity (1) 69,842 66,207 60,284 62,636 62,204 94,549 Balance Sheet Ratios Loans/ Deposits (%) 116.03 % 93.07 % 93.09 % 85.88 % 87.99 % 83.15 % TCE / TA (%) 10.10 9.19 9.04 8.80 9.51 14.20 Tier 1 Risk-Based Capital Ratio (%) 11.96 11.83 10.76 12.96 12.87 20.27 Total Risk-Based Capital Ratio (%) 12.67 12.85 12.01 14.22 14.13 21.52 Income Statement Net Interest Income 16,020$ 19,507$ 19,528$ 17,363$ 13,247$ 11,530$ Noninterest Expense 14,501 17,105 18,556 17,031 12,466 13,321 Net Income (Loss) 1,010 (3,129) (6,112) 1,959 1,742 (33) Profitability Ratios (2) ROAA (%) 0.15 % (0.45)% (0.90)% 0.30 % 0.35 % (0.01)% ROAE (%) 1.46 (4.53) (9.64) 3.15 3.75 (0.05) Net Interest Margin (%) 2.46 2.98 3.02 2.79 2.84 2.40 Efficiency Ratio (%) 80.42 79.75 87.29 83.37 82.08 95.80 Asset Quality NPAs + TDRs / Assets (%) 2.91 % 5.16 % 4.74 % 3.17 % 3.53 % 3.48 % NPLs + TDRs / Loans (%) 2.37 5.73 4.51 3.86 3.99 4.19 NCOs/ Avg Loans (%) 0.35 1.19 1.97 0.70 0.67 0.83 Reserves/ Loans (%) 0.96 1.48 1.97 1.64 1.69 1.41 Texas Ratio (%) 26.59 49.96 44.86 32.09 32.91 23.02 Source: SNL Financial and company filings (1) All tangible common equity (“TCE”) (2) Annualized where appropriate
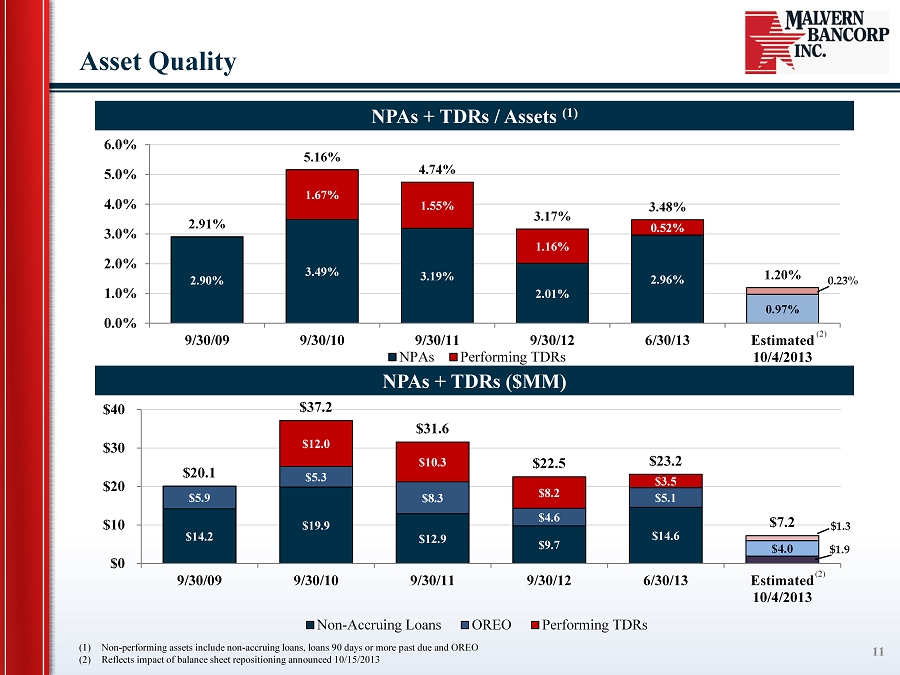
2.90% 3.49% 3.19% 2.01% 2.96% 0.97% 1.67% 1.55% 1.16% 0.52% 2.91% 5.16% 4.74% 3.17% 3.48% 1.20% 0.0% 1.0% 2.0% 3.0% 4.0% 5.0% 6.0% 9/30/09 9/30/10 9/30/11 9/30/12 6/30/13 Estimated 10/4/2013 NPAs Performing TDRs NPAs + TDRs ($MM) Asset Quality 11 NPAs + TDRs / Assets (1) (1) Non - performing assets include non - accruing loans, loans 90 days or more past due and OREO (2) Reflects impact of balance sheet repositioning announced 10/15/2013 (2) $14.2 $19.9 $12.9 $9.7 $14.6 $5.9 $5.3 $8.3 $4.6 $5.1 $4.0 $12.0 $10.3 $8.2 $3.5 $20.1 $37.2 $31.6 $22.5 $23.2 $7.2 $0 $10 $20 $30 $40 9/30/09 9/30/10 9/30/11 9/30/12 6/30/13 Estimated 10/4/2013 Non-Accruing Loans OREO Performing TDRs (2) 0.23% $1.3 $1.9
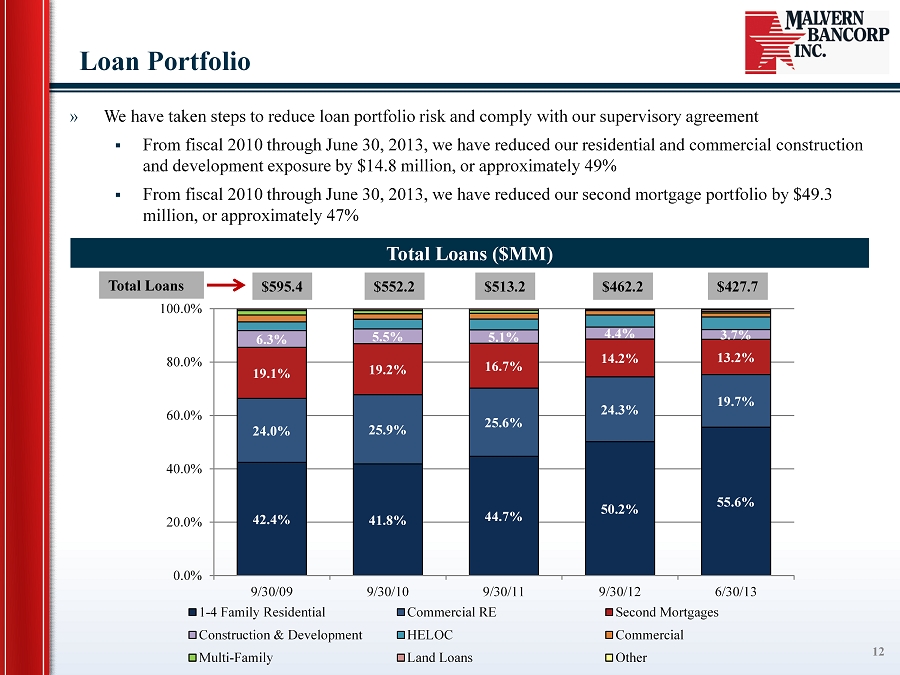
42.4% 41.8% 44.7% 50.2% 55.6% 24.0% 25.9% 25.6% 24.3% 19.7% 19.1% 19.2% 16.7% 14.2% 13.2% 6.3% 5.5% 5.1% 4.4% 3.7% 0.0% 20.0% 40.0% 60.0% 80.0% 100.0% 9/30/09 9/30/10 9/30/11 9/30/12 6/30/13 1-4 Family Residential Commercial RE Second Mortgages Construction & Development HELOC Commercial Multi-Family Land Loans Other Loan Portfolio 12 » We have taken steps to reduce loan portfolio risk and comply with our supervisory agreement ▪ From fiscal 2010 through June 30, 2013, we have reduced our residential and commercial construction and development exposure by $14.8 million, or approximately 49% ▪ From fiscal 2010 through June 30, 2013, we have reduced our second mortgage portfolio by $49.3 million, or approximately 47% Total Loans ($MM) $595.4 $552.2 $513.2 $462.2 $427.7 Total Loans
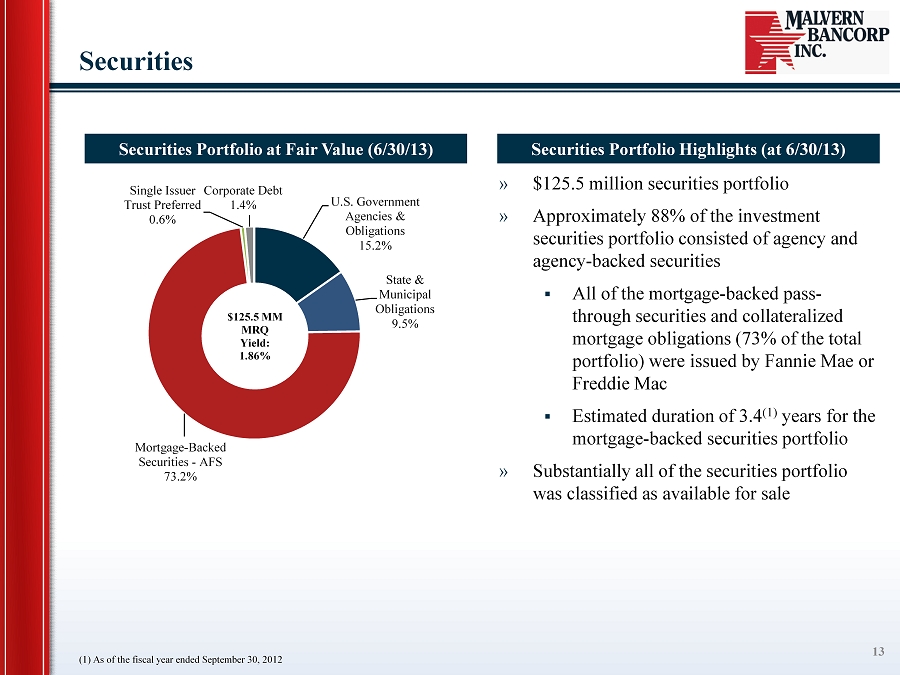
Securities 13 » $125.5 million securities portfolio » Approximately 88% of the investment securities portfolio consisted of agency and agency - backed securities ▪ All of the mortgage - backed pass - through securities and collateralized mortgage obligations (73% of the total portfolio) were issued by Fannie Mae or Freddie Mac ▪ Estimated duration of 3.4 (1) years for the mortgage - backed securities portfolio » Substantially all of the securities portfolio was classified as available for sale Securities Portfolio at Fair Value (6/30/13) Securities Portfolio Highlights (at 6/30/13) U.S. Government Agencies & Obligations 15.2% State & Municipal Obligations 9.5% Mortgage - Backed Securities - AFS 73.2% Single Issuer Trust Preferred 0.6% Corporate Debt 1.4% $125.5 MM MRQ Yield: 1.86% (1) As of the fiscal year ended September 30, 2012
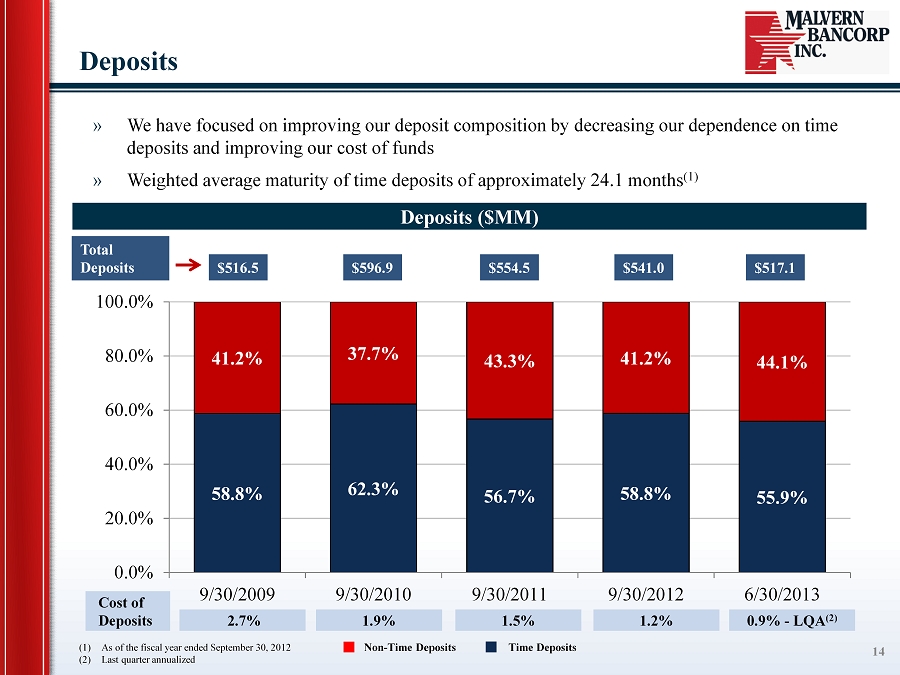
58.8% 62.3% 56.7% 58.8% 55.9% 41.2% 37.7% 43.3% 41.2% 44.1% 0.0% 20.0% 40.0% 60.0% 80.0% 100.0% 9/30/2009 9/30/2010 9/30/2011 9/30/2012 6/30/2013 Deposits » W e have focused on improving our deposit composition by decreasing our dependence on time deposits and improving our cost of funds » Weighted average maturity of time deposits of approximately 24.1 months (1) Deposits ($MM) $516.5 $596.9 $554.5 $541.0 1.5% 0.9% - LQA (2) 2.7% 1.9% Cost of Deposits 1.2% 14 $517.1 (1) As of the fiscal year ended September 30, 2012 (2) Last quarter annualized Total Deposits Non - Time Deposits Time Deposits
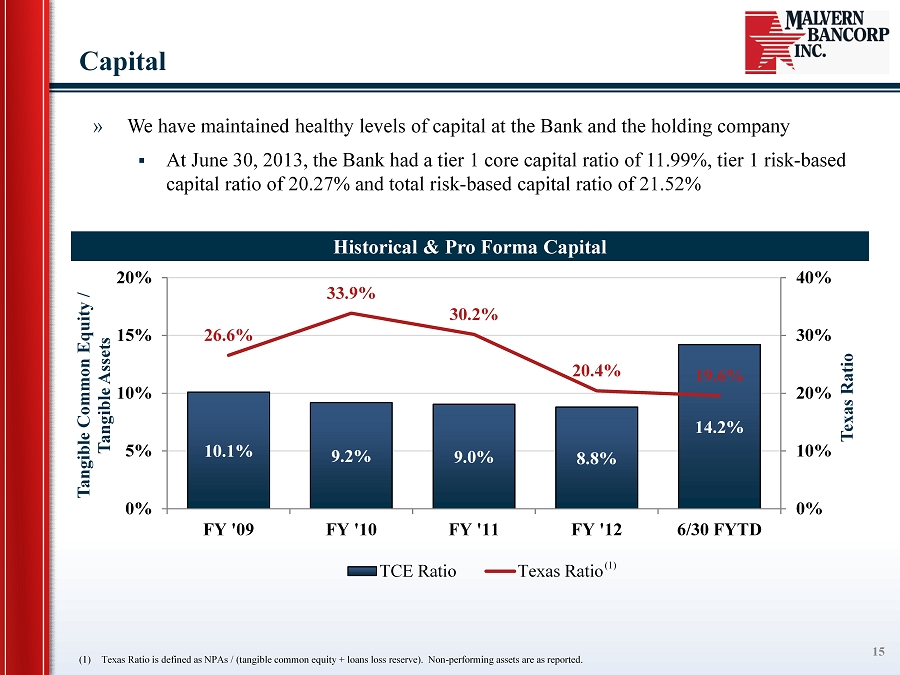
10.1% 9.2% 9.0% 8.8% 14.2% 26.6% 33.9% 30.2% 20.4% 19.6% 0% 10% 20% 30% 40% 0% 5% 10% 15% 20% FY '09 FY '10 FY '11 FY '12 6/30 FYTD Texas Ratio Tangible Common Equity / Tangible Assets TCE Ratio Texas Ratio Capital » We have maintained healthy levels of capital at the Bank and the holding company ▪ At June 30, 2013, the Bank had a tier 1 core capital ratio of 11.99%, tier 1 risk - based capital ratio of 20.27% and total risk - based capital ratio of 21.52% 15 Historical & Pro Forma Capital (1) Texas Ratio is defined as NPAs / (tangible common equity + loans loss reserve). Non - performing assets are as reported. (1)
Market Statistics 16
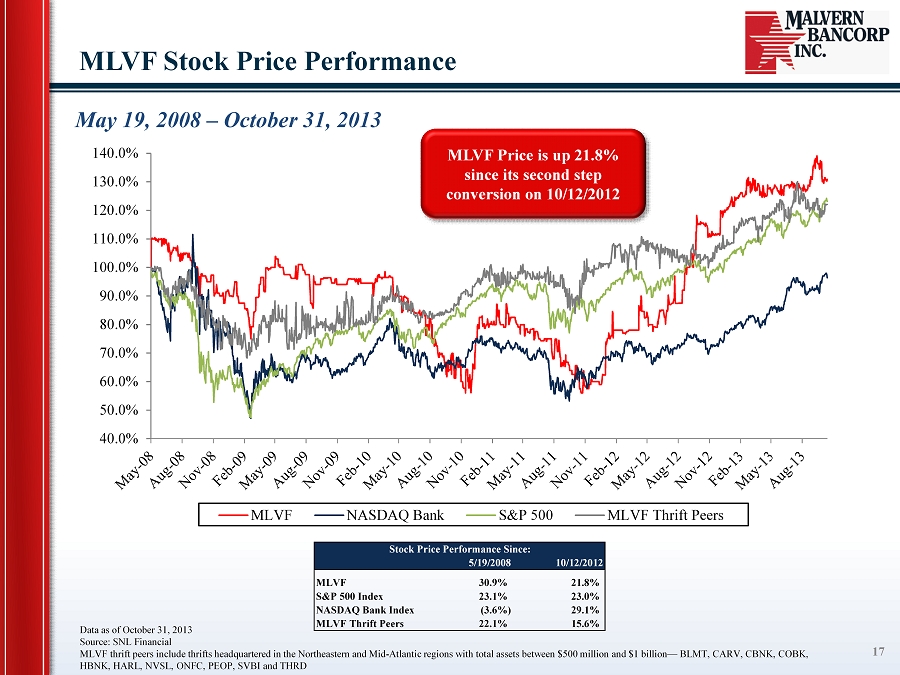
40.0% 50.0% 60.0% 70.0% 80.0% 90.0% 100.0% 110.0% 120.0% 130.0% 140.0% MLVF NASDAQ Bank S&P 500 MLVF Thrift Peers May 19, 2008 – October 31, 2013 MLVF Stock Price Performance 17 Data as of October 31, 2013 Source: SNL Financial MLVF thrift peers include thrifts headquartered in the Northeastern and Mid - Atlantic regions with total assets between $500 million a nd $1 billion — BLMT, CARV, CBNK, COBK, HBNK, HARL, NVSL, ONFC, PEOP, SVBI and THRD MLVF Price is up 21.8% since its second step conversion on 10/12/2012 Stock Price Performance Since: 5/19/2008 10/12/2012 MLVF 30.9% 21.8% S&P 500 Index 23.1% 23.0% NASDAQ Bank Index (3.6%) 29.1% MLVF Thrift Peers 22.1% 15.6%
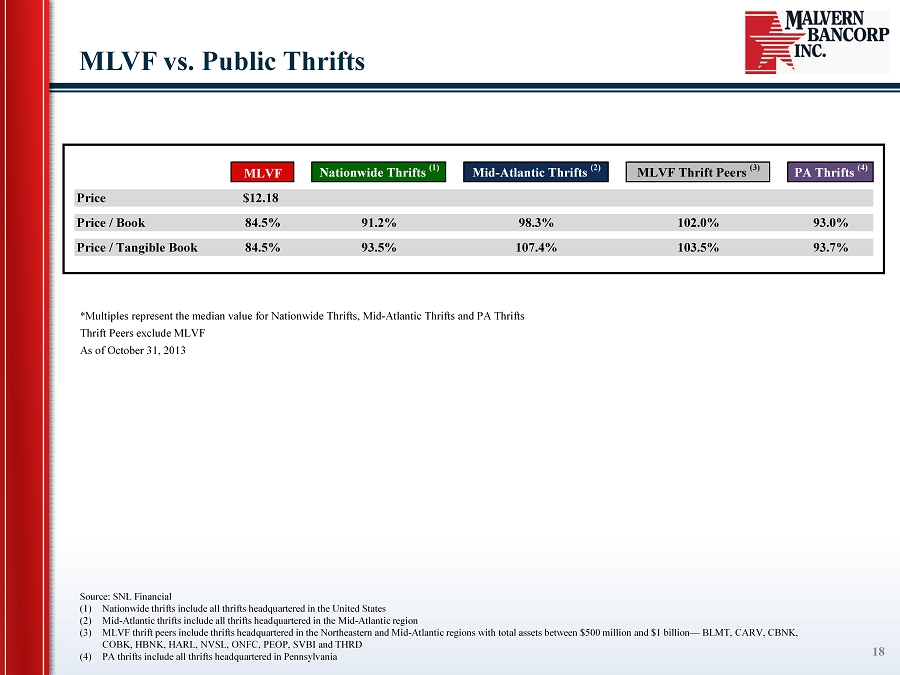
Source : SNL Financial (1) Nationwide thrifts include all thrifts headquartered in the United States (2) Mid - Atlantic thrifts include all thrifts headquartered in the Mid - Atlantic region (3) MLVF thrift peers include thrifts headquartered in the Northeastern and Mid - Atlantic regions with total assets between $500 mill ion and $1 billion — BLMT, CARV, CBNK, COBK, HBNK, HARL, NVSL, ONFC, PEOP, SVBI and THRD (4) PA thrifts include all thrifts headquartered in Pennsylvania MLVF vs. Public Thrifts 18 *Multiples represent the median value for Nationwide Thrifts, Mid - Atlantic Thrifts and PA Thrifts Thrift Peers exclude MLVF As of October 31, 2013 MLVF Nationwide Thrifts (1) Mid-Atlantic Thrifts (2) MLVF Thrift Peers (3) PA Thrifts (4) Price $12.18 Price / Book 84.5% 91.2% 98.3% 102.0% 93.0% Price / Tangible Book 84.5% 93.5% 107.4% 103.5% 93.7%
Appendix 19
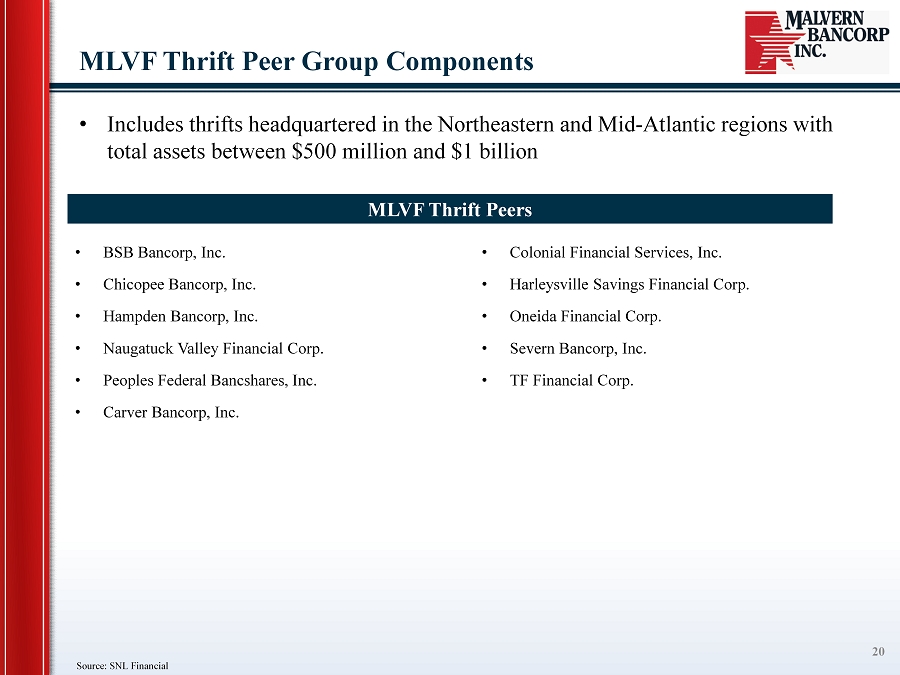
Source : SNL Financial MLVF Thrift Peer Group Components 20 • Includes thrifts headquartered in the Northeastern and Mid - Atlantic regions with total assets between $500 million and $1 billion MLVF Thrift Peers • BSB Bancorp, Inc. • Chicopee Bancorp, Inc. • Hampden Bancorp, Inc. • Naugatuck Valley Financial Corp. • Peoples Federal Bancshares, Inc. • Carver Bancorp, Inc . • Colonial Financial Services, Inc. • Harleysville Savings Financial Corp. • Oneida Financial Corp. • Severn Bancorp, Inc. • TF Financial Corp.
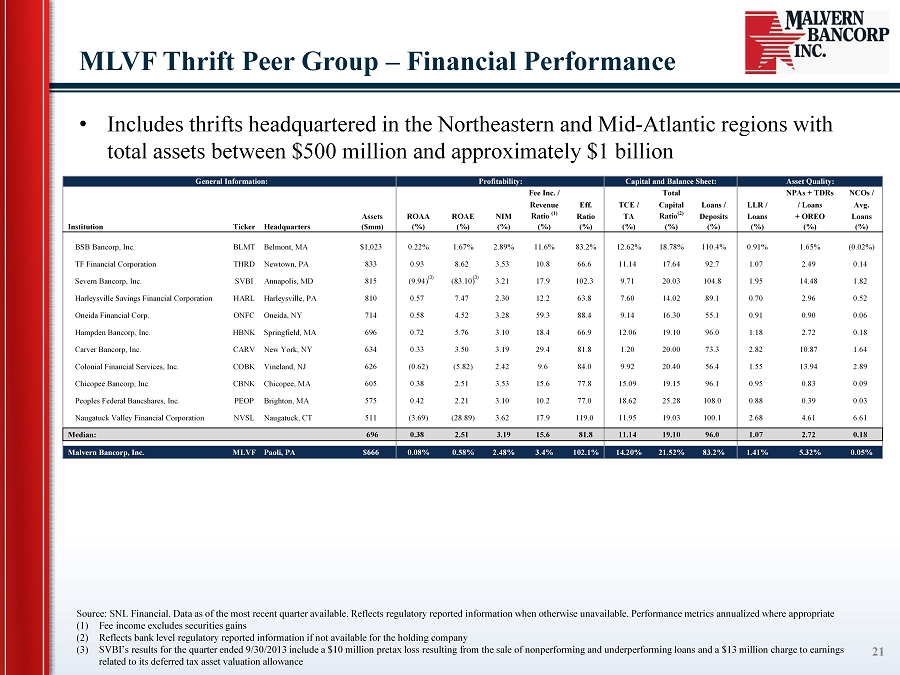
MLVF Thrift Peer Group – Financial Performance 21 • Includes thrifts headquartered in the Northeastern and Mid - Atlantic regions with total assets between $500 million and approximately $1 billion Source : SNL Financial. Data as of the most recent quarter available. Reflects regulatory reported information when otherwise unavailable. Pe rformance metrics annualized where appropriate (1) Fee income excludes securities gains (2) Reflects bank level regulatory reported information if not available for the holding company (3) SVBI’s results for the quarter ended 9/30/2013 include a $10 million pretax loss resulting from the sale of nonperforming and un derperforming loans and a $13 million charge to earnings related to its deferred tax asset valuation allowance General Information: Profitability: Capital and Balance Sheet: Asset Quality: Fee Inc. / Total NPAs + TDRs NCOs / Revenue Eff. TCE / Capital Loans / LLR / / Loans Avg. Assets ROAA ROAE NIM Ratio (1) Ratio TA Ratio (2) Deposits Loans + OREO Loans Institution Ticker Headquarters ($mm) (%) (%) (%) (%) (%) (%) (%) (%) (%) (%) (%) BSB Bancorp, Inc. BLMT Belmont, MA $1,023 0.22% 1.67% 2.89% 11.6% 83.2% 12.62% 18.78% 110.4% 0.91% 1.65% (0.02%) TF Financial Corporation THRD Newtown, PA 833 0.93 8.62 3.53 10.8 66.6 11.14 17.64 92.7 1.07 2.49 0.14 Severn Bancorp, Inc. SVBI Annapolis, MD 815 (9.94) (83.10) 3.21 17.9 102.3 9.71 20.03 104.8 1.95 14.48 1.82 Harleysville Savings Financial Corporation HARL Harleysville, PA 810 0.57 7.47 2.30 12.2 63.8 7.60 14.02 89.1 0.70 2.96 0.52 Oneida Financial Corp. ONFC Oneida, NY 714 0.58 4.52 3.28 59.3 88.4 9.14 16.30 55.1 0.91 0.90 0.06 Hampden Bancorp, Inc. HBNK Springfield, MA 696 0.72 5.76 3.10 18.4 66.9 12.06 19.10 96.0 1.18 2.72 0.18 Carver Bancorp, Inc. CARV New York, NY 634 0.33 3.50 3.19 29.4 81.8 1.20 20.00 73.3 2.82 10.87 1.64 Colonial Financial Services, Inc. COBK Vineland, NJ 626 (0.62) (5.82) 2.42 9.6 84.0 9.92 20.40 56.4 1.55 13.94 2.89 Chicopee Bancorp, Inc. CBNK Chicopee, MA 605 0.38 2.51 3.53 15.6 77.8 15.09 19.15 96.1 0.95 0.83 0.09 Peoples Federal Bancshares, Inc. PEOP Brighton, MA 575 0.42 2.21 3.10 10.2 77.0 18.62 25.28 108.0 0.88 0.39 0.03 Naugatuck Valley Financial Corporation NVSL Naugatuck, CT 511 (3.69) (28.89) 3.62 17.9 119.0 11.95 19.03 100.1 2.68 4.61 6.61 Median: 696 0.38 2.51 3.19 15.6 81.8 11.14 19.10 96.0 1.07 2.72 0.18 Malvern Bancorp, Inc. MLVF Paoli, PA $666 0.08% 0.58% 2.48% 3.4% 102.1% 14.20% 21.52% 83.2% 1.41% 5.32% 0.05% (3) (3)
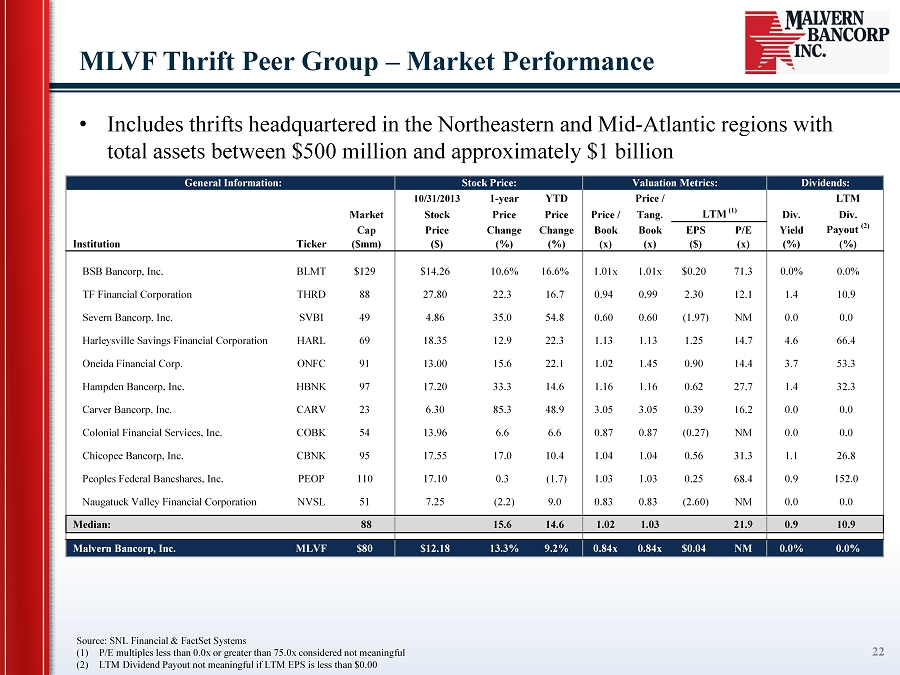
Source : SNL Financial & FactSet Systems (1) P/E multiples less than 0.0x or greater than 75.0x considered not meaningful (2) LTM Dividend Payout not meaningful if LTM EPS is less than $0.00 MLVF Thrift Peer Group – Market Performance 22 • Includes thrifts headquartered in the Northeastern and Mid - Atlantic regions with total assets between $500 million and approximately $1 billion General Information: Stock Price: Valuation Metrics: Dividends: 10/31/2013 1-year YTD Price / LTM Market Stock Price Price Price / Tang. LTM (1) Div. Div. Cap Price Change Change Book Book EPS P/E Yield Payout (2) Institution Ticker ($mm) ($) (%) (%) (x) (x) ($) (x) (%) (%) BSB Bancorp, Inc. BLMT $129 $14.26 10.6% 16.6% 1.01x 1.01x $0.20 71.3 0.0% 0.0% TF Financial Corporation THRD 88 27.80 22.3 16.7 0.94 0.99 2.30 12.1 1.4 10.9 Severn Bancorp, Inc. SVBI 49 4.86 35.0 54.8 0.60 0.60 (1.97) NM 0.0 0.0 Harleysville Savings Financial Corporation HARL 69 18.35 12.9 22.3 1.13 1.13 1.25 14.7 4.6 66.4 Oneida Financial Corp. ONFC 91 13.00 15.6 22.1 1.02 1.45 0.90 14.4 3.7 53.3 Hampden Bancorp, Inc. HBNK 97 17.20 33.3 14.6 1.16 1.16 0.62 27.7 1.4 32.3 Carver Bancorp, Inc. CARV 23 6.30 85.3 48.9 3.05 3.05 0.39 16.2 0.0 0.0 Colonial Financial Services, Inc. COBK 54 13.96 6.6 6.6 0.87 0.87 (0.27) NM 0.0 0.0 Chicopee Bancorp, Inc. CBNK 95 17.55 17.0 10.4 1.04 1.04 0.56 31.3 1.1 26.8 Peoples Federal Bancshares, Inc. PEOP 110 17.10 0.3 (1.7) 1.03 1.03 0.25 68.4 0.9 152.0 Naugatuck Valley Financial Corporation NVSL 51 7.25 (2.2) 9.0 0.83 0.83 (2.60) NM 0.0 0.0 Median: 88 15.6 14.6 1.02 1.03 21.9 0.9 10.9 Malvern Bancorp, Inc. MLVF $80 $12.18 13.3% 9.2% 0.84x 0.84x $0.04 NM 0.0% 0.0%