UNITED STATES
SECURITIES AND EXCHANGE COMMISSION
WASHINGTON, D.C. 20549
FORM 20-F/A
(Amendment No. 1)
| x | REGISTRATION STATEMENT PURSUANT TO SECTION 12(b) or (g) OF THE SECURITIES EXCHANGE ACT OF 1934 |
OR
| ¨ | ANNUAL REPORT PURSUANT TO SECTION 13 OR 15(d) OF THE SECURITIES EXCHANGE ACT OF 1934 |
OR
| ¨ | TRANSITION REPORT PURSUANT TO SECTION 13 OR 15(d) OF THE SECURITIES EXCHANGE ACT OF 1934 |
OR
| ¨ | SHELL COMPANY REPORT PURSUANT TO SECTION 13 OR 15(d) OF THE SECURITIES EXCHANGE ACT OF 1934 |
Commission file number: 000-54726
Sears Canada Inc.
(Exact name of Registrant as specified in its charter)
N/A
(Translation of Registrant’s name into English)
Canada
(Jurisdiction of incorporation or organization)
290 Yonge Street, Suite 700, Toronto, Ontario, Canada, M5B 2C3
(Address of principal executive office)
Klaudio Leshnjani
Senior Vice-President and General Counsel
290 Yonge Street
Suite 700
Toronto, Ontario, Canada M5B 2C3
Tel: 416 941-4421
Fax: 416 941-2321
(Name, Telephone, Email and/or Facsimile number and Address of Company Contact Person)
Copies to:
| | | | |
Andrew J. Beck
Torys LLP
1114 Ave of the Americas, 23rd Floor New York, New York 10036
(212) 880-6010 | | | | Patricia A. Koval Torys LLP Suite 3000, TD Centre
79 Wellington Street West
Toronto, Ontario, Canada
M5K 1N2 (416) 865-7356 |
Dane A. Drobny Senior Vice President, General Counsel and Corporate Secretary Sears Holdings Corporation 3333 Beverly Road Hoffman Estates, Illinois 60179 (847) 286-2500 | | Kevin D. Cramer Osler, Hoskin & Harcourt LLP 620 8th Avenue, 36th Floor New York, New York 10018 (212) 867-5800 | | William H. Hinman, Jr. Simpson Thacher & Bartlett LLP 2550 Hanover Street Palo Alto, California 94304 (650) 251–5000 |
Securities registered or to be registered pursuant to Section 12(b) of the Act. None
| | |
Title of each class | | Name of each exchange on which registered |
| N/A | | N/A |
Securities registered or to be registered pursuant to Section 12(g) of the Act.
Common Shares
Securities for which there is a reporting obligation pursuant to Section 15(d) of the Act.
None
Indicate the number of outstanding shares of each of the issuer’s classes of capital or common stock as of the close of the period covered by the annual report.
Not applicable
Indicate by check mark if the registrant is a well-known seasoned issuer, as defined in Rule 405 of the Securities Act. Yes ¨ No x
If this report is an annual or transition report, indicate by check mark if the registrant is not required to file reports pursuant to Section 13 or 15(d) of the Securities Exchange Act of 1934. Yes ¨ No ¨
Indicate by check mark whether the registrant (1) has filed all reports required to be filed by Section 13 or 15(d) of the Securities Exchange Act of 1934 during the preceding 12 months (or for such shorter period that the registrant was required to file such reports), and (2) has been subject to such filing requirements for the past 90 days. Yes ¨ No x
Indicate by check mark whether the registrant has submitted electronically and posted on its corporate Web site, if any, every Interactive Data File required to be submitted and posted pursuant to Rule 405 of Regulation S-T (§232.405 of this chapter) during the preceding 12 months (or for such shorter period that the registrant was required to submit and post such files). Yes ¨ No ¨
Indicate by check mark whether the registrant is a large accelerated filer, an accelerated filer, or a non-accelerated filer. See definition of “accelerated filer and large accelerated filer” in Rule 12b-2 of the Exchange Act. (Check one):
| | | | |
| Large accelerated filer ¨ | | Accelerated filer ¨ | | Non-accelerated filer x |
Indicate by check mark which basis of accounting the registrant has used to prepare the financial statements included in this filing:
| | | | |
| U.S. GAAP ¨ | | International Financial Reporting Standards as issued by the International Accounting Standards Board x | | Other ¨ |
If “Other” has been checked in response to the previous question, indicate by check mark which financial statement item the registrant has elected to follow. Item 17 ¨ Item 18 ¨
If this is an annual report, indicate by check mark whether the registrant is a shell company (as defined in Rule 12b-2 of the Exchange Act). Yes ¨ No ¨
TABLE OF CONTENTS
ii
iii
INTRODUCTION AND USE OF CERTAIN TERMS
We have prepared this Registration Statement on Form 20-F, or this Form 20-F, using a number of conventions, which you should consider when reading the information contained herein. Unless otherwise indicated or the context otherwise requires, in this Form 20-F the disclosure assumes that the spin-off has been completed and references to:
| | • | | “we”, “us” and “our”, “Sears Canada” or “the Company” are to Sears Canada Inc. and its subsidiaries, together with its investments in joint venture interests; |
| | • | | an “affiliate” of any person are to any other person that, directly or indirectly through one or more intermediaries, controls, is controlled by or is under common control with such person; |
| | • | | “common shares” are to the common shares, no par value, of Sears Canada Inc.; |
| | • | | “ESL” are to ESL Investments, Inc. and its investment affiliates, including Edward S. Lampert; |
| | • | | “Fiscal 2009”, “Fiscal 2010”, “Fiscal 2011” and “Fiscal 2012” are to the 52-week periods ended January 30, 2010, January 29, 2011, January 28, 2012 and the 53-week period ending February 2, 2013, respectively; |
| | • | | “fiscal year” are to the 52 or 53-week period ending on the Saturday closest to January 31; |
| | • | | “Q1 2011” and “Q1 2012” are to the 13-week periods ended April 30, 2011 and April 28, 2012, respectively; |
| | • | | “Sears Holdings” are, collectively, to Sears Holdings Corporation, our controlling shareholder and a Delaware corporation, and its subsidiaries, excluding Sears Canada; |
| | • | | “Sears Roebuck” are to Sears, Roebuck and Co., a New York corporation and wholly-owned subsidiary of Sears Holdings Corporation; |
| | • | | “spin-off” are to the special dividend of a portion of our common shares held by Sears Holdings to its stockholders, as described under Item 4.A. “Information on the Company – History and Development of the Company – The Spin-Off”; |
| | • | | “Spin-Off Date” are to 11:59 p.m., New York City time on , 2012, when the spin-off will become effective; and |
| | • | | “TSX” are to the Toronto Stock Exchange. |
Historical Performance and Market Data
This Form 20-F contains information relating to our business as well as historical performance and market data. When considering this data, you should bear in mind that historical results and market data may not be indicative of the future results that you should expect from us. Certain statistical and market data have been obtained from third party sources. We have not independently verified this data and cannot guarantee its accuracy or completeness.
Financial Information
All financial information is presented in accordance with International Financial Reporting Standards, or IFRS, as issued by the International Accounting Standards Board, or IASB, other than certain non-IFRS financial measures and measures of operating performance which are defined under “Use of Non-IFRS Measures, Measures of Operating Performance and Reconciliation of Net Earnings (Loss) to Adjusted EBITDA,” below. All figures are unaudited unless otherwise indicated.
We maintain our financial statements in Canadian dollars, and, in this Form 20-F, all references to “CAD” or “$” are to Canadian dollars unless expressly otherwise stated.
1
Exchange Rate Table
The following table sets forth the average exchange rate for one Canadian dollar expressed in terms of U.S. dollars for each of the last five fiscal years. The average rate is calculated using the average of the exchange rates on the last day of each month during the period.
| | | | |
| | | Average | |
2012 (through July 6) | | | 0.9927 | |
2011 | | | 1.0151 | |
2010 | | | 0.9671 | |
2009 | | | 0.8833 | |
2008 | | | 0.9397 | |
2007 | | | 0.9418 | |
The following table sets forth the high and low exchange rates for each month during the previous six months.
| | | | | | | | |
| | | Low | | | High | |
July 2012 (through July 6) | | | 0.9805 | | | | 0.9878 | |
June 2012 | | | 0.9599 | | | | 0.9825 | |
May 2012 | | | 0.9663 | | | | 1.0164 | |
April 2012 | | | 0.9961 | | | | 1.0197 | |
March 2012 | | | 0.9985 | | | | 1.0153 | |
February 2012 | | | 0.9984 | | | | 1.0136 | |
January 2012 | | | 0.9735 | | | | 1.0014 | |
The exchange rates are based upon the noon buying rate as quoted by the Bank of Canada. At July 6, 2012, the exchange rate for one Canadian dollar expressed in terms of one U.S. dollar, as quoted by The Bank of Canada at 4 p.m. Eastern Time, equaled $0.9817.
USE OF NON-IFRS MEASURES, MEASURES OF OPERATING PERFORMANCE AND RECONCILIATION OF NET EARNINGS (LOSS) TO ADJUSTED EBITDA
Our financial statements are prepared in accordance with IFRS. Management uses IFRS, non-IFRS and operating performance measures as key performance indicators to better assess our underlying performance and provides this additional information in this Form 20-F so that readers may do the same. See Item 5.A. “Operating and Financial Review and Prospects – Operating Results – Use of Non-IFRS Measures, Measures of Operating Performance and Reconciliation of Net Earnings (Loss) to Adjusted EBITDA” for additional information.
SPECIAL NOTE REGARDING FORWARD-LOOKING STATEMENTS
This Form 20-F contains certain forward-looking statements. Forward-looking statements relate to expectations, beliefs, projections, future plans and strategies, anticipated events or trends and similar expressions concerning matters that are not historical facts. Forward-looking statements in this Form 20-F include statements regarding the anticipated benefits of the spin-off, our future results of operations, our future growth prospects, and our business strategy, plans, expectations, goals and objectives. Often, but not always, forward-looking statements can be identified by the use of words such as “plans”, “expects” or “does not expect”, “is expected”, “budget”, “scheduled”, “estimates”, “forecasts”, “intends”, “anticipates” or “does not anticipate”, or “believes”, or variations of such words and phrases, or statements that certain “endeavored” actions, events or results “may”, “could”, “would”, “might” or “will” be taken, occur or be achieved. The forward-looking statements are based on our beliefs, assumptions and expectations of our future performance, taking into account all information currently available to us. These beliefs, assumptions and expectations can change as a result of many possible events or
2
factors, not all of which are known to us or within our control. If a change occurs, our business, financial condition, liquidity and results of operations may vary materially from those expressed in our forward-looking statements. The following factors, among others, could cause our actual results to vary from our forward-looking statements:
| | • | | our ability to successfully implement our strategic initiatives, productivity improvement and cost reduction initiatives and whether such initiatives will yield the expected benefits; |
| | • | | the results achieved pursuant to our long-term credit card marketing and servicing alliance with JPMorgan Chase Bank, N.A. (Toronto Branch), or JPMorgan Chase; |
| | • | | general economic conditions; |
| | • | | competitive conditions in the businesses in which we participate; |
| | • | | changes in consumer spending; |
| | • | | seasonal weather patterns; |
| | • | | weaker business performance in the fourth quarter; |
| | • | | customer preference toward product offerings; |
| | • | | ability to retain senior management and key personnel; |
| | • | | ability to successfully manage our inventory levels; |
| | • | | disruptions to our computer systems; |
| | • | | economic, social and political instability in jurisdictions where suppliers are located; increased shipping costs, potential transportation delays and interruptions; |
| | • | | damage to the reputations of the brands we sell; |
| | • | | changes in our relationship with our suppliers; |
| | • | | the outcome of product liability claims; |
| | • | | any significant security compromise or breach of our customer, associate or Company information; |
| | • | | the credit worthiness and financial stability of tenants, partners and co-venturers, with respect to our real estate joint venture interests; |
| | • | | possible changes in our ownership by Sears Holdings and other significant shareholders following the spin-off; |
| | • | | interest rate fluctuations and other changes in funding costs and investment income; |
| | • | | fluctuations in foreign currency exchange rates; |
| | • | | the possibility of negative investment returns in our pension plan or an unexpected increase to the defined benefit obligation; |
| | • | | the impairment of goodwill and other assets; |
| | • | | new accounting pronouncements, or changes to existing pronouncements, that impact the methods we use to report our financial condition and results from operations; |
| | • | | uncertainties associated with critical accounting assumptions and estimates; |
| | • | | the outcome of pending legal proceedings; |
| | • | | changes in laws, rules and regulations that apply to us; |
| | • | | compliance costs associated with environmental laws and regulations; |
3
| | • | | the possible future termination of certain intellectual property rights associated with the “Sears” name and brand names if Sears Holdings reduces its interest in the Company to less than 25%; and |
| | • | | other factors described in this Form 20-F, including those set forth under Item 3.D. “Key Information – Risk Factors”, Item 5 “Operating and Financial Review and Prospects” and Item 4.B. “Information on the Company – Business Overview”. |
Except as required by applicable law, we undertake no obligation to update or revise publicly any forward-looking statements, whether as a result of new information, future events or otherwise. We qualify any and all of our forward-looking statements by these cautionary factors. Please keep this cautionary note in mind as you read this Form 20-F.
4
PART I
ITEM 1. IDENTITY OF DIRECTORS, SENIOR MANAGEMENT AND ADVISERS
1.A. DIRECTORS AND SENIOR MANAGEMENT
For information regarding our directors and senior management, see Item 6.A. “Directors, Senior Management and Employees – Directors and Senior Management”.
1.B. ADVISERS
Our Canadian legal counsel is Torys LLP, Suite 3000, TD Centre, 79 Wellington Street West, Toronto, Ontario, Canada, M5K 1N2. Our U.S. legal counsel is Torys LLP, 23rd Floor – 1114 Ave of the Americas, New York, New York, 10036-7703.
1.C. AUDITORS
We have retained Deloitte & Touche LLP to act as our independent registered chartered accountants. The address for Deloitte & Touche LLP is Brookfield Place, 181 Bay Street, Suite 1400, Toronto, Ontario, M5J 2V1.
ITEM 2. OFFER STATISTICS AND EXPECTED TIMETABLE
Not applicable.
ITEM 3. KEY INFORMATION
3.A. SELECTED FINANCIAL DATA
The following table presents selected financial data which is derived from, and should be read in conjunction with, the recast Q1 2012 Interim Condensed Consolidated Financial Statements and the recast 2011 Annual Consolidated Financial Statements, each of which are included in this Form 20-F.
| | | | | | | | | | | | | | | | |
($ in millions, except per share amounts) | | Q1 2012 | | | Fiscal 2011
(recast**) | | | Q1 2011
(recast**) | | | Fiscal 2010
(recast**) | |
Total revenue | | $ | 915.1 | | | $ | 4,619.3 | | | $ | 992.5 | | | $ | 4,938.5 | |
Same store sales (%) | | | (6.3 | %) | | | (7.5 | %) | | | (9.2 | %) | | | (4.4 | %) |
Adjusted EBITDA* | | | (30.1 | ) | | | 124.0 | | | | (22.3 | ) | | | 306.5 | |
Operating (loss) earnings | | | (53.8 | ) | | | (50.9 | ) | | | (50.9 | ) | | | 196.3 | |
Net earnings (loss) | | | 93.1 | | | | (50.3 | ) | | | (47.0 | ) | | | 125.0 | |
| | | | | | | | | | | | | | | | |
| | | As at
April 28, 2012 | | | As at
January 28, 2012 | | | As at
April 30, 2011 | | | As at
January 29, 2011 | |
Cash and cash equivalents and short-term investments | | $ | 361.6 | | | $ | 397.4 | | | $ | 198.4 | | | $ | 432.3 | |
Working capital | | | 486.7 | | | | 471.0 | | | | 360.3 | | | | 536.9 | |
Inventories | | | 883.7 | | | | 823.9 | | | | 981.7 | | | | 953.2 | |
Total assets | | | 2,744.6 | | | | 2,730.7 | | | | 2,727.5 | | | | 2,907.5 | |
Total long-term obligations, including principal payments on long-term obligations due within one year | | | 28.2 | | | | 122.7 | | | | 33.4 | | | | 129.1 | |
Shareholders’ equity | | | 1,182.3 | | | | 1,092.0 | | | | 1,201.3 | | | | 1,260.4 | |
| | | | |
Per share of capital stock | | | | | | | | | | | | | | | | |
Operating (loss) earnings | | $ | (0.57 | ) | | $ | (0.49 | ) | | $ | (0.48 | ) | | $ | 1.83 | |
Basic net earnings (loss) | | $ | 0.91 | | | $ | (0.48 | ) | | $ | (0.45 | ) | | $ | 1.16 | |
Diluted net earnings (loss) | | $ | 0.91 | | | $ | (0.48 | ) | | $ | (0.45 | ) | | $ | 1.16 | |
Shareholders’ equity | | | 11.53 | | | | 10.63 | | | | 11.40 | | | | 11.96 | |
5
| * | Adjusted EBITDA is a non-IFRS measure. See Item 5. “Operating and Financial Review and Prospects – Operating Results – Use of Non-IFRS Measures, Measures of Operating Performance and Reconciliation of Net Earnings (Loss) to Adjusted EBITDA”. |
| ** | Recast to reflect changes resulting from the retrospective application of the change in accounting policy related to the early adoption of the amendments to accounting standard “IAS 19 (Revised), Employee Benefits”. |
3.B. CAPITALIZATION AND INDEBTEDNESS
The following table presents our capitalization as of April 28, 2012 on an actual unaudited historical basis.
| | | | |
| | | As of April 28, 2012
(recast**) | |
| | | ($ in millions) | |
Debt Outstanding:* | | | | |
Finance lease obligations – Current | | $ | 4.9 | |
Secured revolving credit facility | | | — | |
Finance lease obligations – Non-current | | | 23.3 | |
| | | | |
| | $ | 28.2 | |
| |
Shareholders’ Equity: | | | | |
Capital Stock | | | 15.0 | |
Retained earnings | | | 1,308.8 | |
Accumulated other comprehensive loss | | | (141.5 | ) |
| | | | |
Total Capitalization (debt plus shareholders’ equity) | | $ | 1,210.5 | |
| | | | |
| * | Finance lease obligations are unsecured and not guaranteed by any third parties. |
| ** | Recast to reflect changes resulting from the retrospective application of the change in accounting policy related to the early adoption of the amendments to accounting standard “IAS 19 (Revised), Employee Benefits”. |
This table should be read in conjunction with Item 5.A. “Operating and Financial Review and Prospects – Operating Results” and Item 5.B. “Operating and Financial Review and Prospects – Liquidity and Capital Resources”, collectively referred to herein as the Management’s Discussion and Analysis of Financial Condition and Results of Operations, or MD&A, as well as the consolidated financial statements and accompanying notes.
3.C. REASONS FOR THE OFFER AND USE OF PROCEEDS
Not applicable.
3.D. RISK FACTORS
You should carefully consider the risks described below, together with all of the other information included in this Form 20-F, in evaluating the Company and our common shares. The following risk factors could adversely affect our business, results of operations, financial condition and the price of our common shares.
Risks Relating to Our Business
If we are unable to compete effectively in the highly competitive retail industry, our business and results of operations could be materially adversely affected.
The Canadian retail market remains highly competitive as key players and new entrants compete for market share. International retailers continue to expand into Canada while existing competitors enhance their product offerings and become direct competitors. Our competitors include traditional full-line department stores, discount
6
department stores, wholesale clubs, ‘‘big-box’’ retailers, internet retailers and specialty stores offering alternative retail formats. Failure to develop and implement appropriate competitive strategies and the performance of our competitors could have a material adverse effect on our business, results of operations and financial condition.
To stay competitive and relevant to our customers, significant initiatives in support of our strategic plan are underway for Fiscal 2012. These initiatives include improvements in business processes, advancements in information technology and other organizational changes. The achievement of strategic goals may be adversely affected by a wide range of factors, many of which are beyond our control. The inability to execute and integrate strategic plans could have a negative impact on our current operations, market reputation, customer satisfaction and financial position. Our potential to implement and achieve our long-term strategic objectives is dependent on the achievement of these strategic plans and initiatives. There can be no assurance that such plans and initiatives will yield the expected results, either of which could cause us to fall short in achieving financial objectives and long-range goals.
Additional risk may arise when foreign retailers carrying on business in Canada in competition with us engage in marketing activities which are not in full compliance with Canadian legal requirements regarding advertising and labeling rules and product quality standards. Such retailers may gain an unfair advantage and their activities may negatively affect our business and results of operations.
The majority of the performance payments earned pursuant to the credit card marketing and servicing alliance with JPMorgan Chase are related to customers’ purchases using the Sears Card and Sears MasterCard. The credit card industry is highly competitive as credit card issuers continue to expand their product offerings to distinguish their cards. As competition increases, there is a risk that a reduction in the percentage of purchases charged to the Sears Card and Sears MasterCard may negatively impact our results of operations and financial condition.
Due to the seasonality of our business, our results of operations would be adversely affected if our business performed poorly in the fourth quarter or as a result of unseasonable weather patterns.
Our operations are seasonal in nature with respect to results of operations and in products and services offered. Merchandise and service revenues, as well as performance payments received from JPMorgan Chase, vary by quarter based upon consumer spending behavior. Historically, our revenues and earnings have been higher in the fourth quarter due to the holiday season and we have reported a disproportionate level of earnings in that quarter. As a result, our fourth quarter results of operations significantly impacts our annual results of operations. Our fourth quarter results of operations may fluctuate significantly, based on many factors, including holiday spending patterns and weather conditions. In addition, we offer many seasonal goods and services. We set budgeted inventory levels and promotional activity to be in accordance with our strategic initiatives and expected consumer demand. Businesses such as the Company that generate revenue from the sale of seasonal merchandise and services are subject to the risk of changes in consumer spending behavior as a result of unseasonable weather patterns.
If we fail to offer merchandise and services that our customers want, our sales may be limited, which would reduce our revenues and profits and adversely impact our results of operations.
To be successful, we must identify, obtain supplies and offer to customers attractive, relevant and high-quality merchandise and services on a continuous basis. Customers’ preferences may change over time. If we misjudge either the demand for products and services we sell or our customers’ purchasing habits and tastes, we may be faced with excess inventories of some products and missed opportunities for products and services we chose not to offer. This could have a negative effect on our revenues and profits and adversely impact our results of operations.
7
Our failure to retain our senior management team and to continue to attract qualified new personnel could adversely affect our business and results of operations.
Our success is dependent on our ability to attract, motivate and retain senior leaders and other key personnel. The loss of one or more of the members of our senior management may disrupt our business and adversely affect our results of operations. We do not maintain key-man life insurance on any of our executives. Furthermore, we may not be successful in attracting, assimilating and retaining new personnel to grow our business profitably. The inability to attract and retain key personnel could have an adverse effect on our business.
If we do not successfully manage our inventory levels, our results of operations will be adversely affected.
We must maintain sufficient in-stock inventory levels to operate the business successfully while minimizing out-of-stock levels. A significant portion of inventory is sourced from vendors requiring advance notice periods in order to supply the quantities that we require. These lead times may adversely impact our ability to respond to changing consumer preferences, resulting in inventory levels that are insufficient to meet demand or in merchandise that may have to be sold at lower prices. Inappropriate inventory levels or a failure to accurately anticipate the future demand for a particular product or the time it will take to obtain new inventory may negatively impact our results of operations.
We rely extensively on computer systems to process transactions, summarize results and manage our business. Disruptions in these systems could harm our ability to run our business.
Given the number of individual transactions that we process each year, it is critical that we maintain uninterrupted operation of our computer and communications hardware and software systems. These systems are subject to obsolescence, damage or interruption from power outages, computer and telecommunications failures, computer viruses, security breaches, catastrophic events such as fires, natural disasters and adverse weather occurrences and usage errors by our employees. If the systems are damaged or cease to function properly, we may have to make a significant investment to fix or replace them, may suffer interruptions in operations in the interim and our reputation with our customers may be harmed. Our ability to maintain sufficient inventory levels in our stores is critical to our success and largely depends upon the efficient and uninterrupted operation of our computer and communications hardware and software systems. Any material interruption in our computer operations may have a material adverse effect on our business and results of operations.
We rely on foreign sources for significant amounts of our merchandise, and our business may therefore be negatively affected by the risks associated with international trade.
We are dependent upon a significant amount of products that originate from non-Canadian markets. In particular, we source a significant amount of products from China. We are subject to the risks that are associated with the sourcing and delivery of this merchandise, including: potential economic, social and political instability in jurisdictions where suppliers are located; increased shipping costs, potential transportation delays and interruptions; adverse foreign currency fluctuations, changes in international laws, rules and regulations pertaining to the importation of products, quotas; and the imposition and collection of taxes and duties. Any increase in cost to us of merchandise purchased from foreign vendors or restriction on the merchandise made available to us by such vendors could have an adverse effect on our business and results of operations.
Damage to the reputations of the brands we sell could reduce our revenues and profits and adversely impact our results of operations.
As a diverse and multi-channel retailer, we promote many brands as part of our normal course of business. These brands include the Sears brand, Sears private label brands for product lines such as Jessica, and non-proprietary brands exclusive to Sears. Damage to the reputation of these brands or the reputation of the suppliers of these brands could negatively impact consumer opinions of Sears or our related products and reduce our revenues and profits and adversely impact our results of operations. In those circumstances, it may be difficult and costly for us to regain customer confidence.
8
If our relationships with our significant suppliers were to be impaired, it could have a negative impact on our competitive position and our results of operations and financial condition.
Although our business is not substantially dependent on any one supplier, our relationship with certain suppliers is of significance to our merchandising strategy, including attracting customers to our locations, cross-segment sales and image. The loss of a significant supplier relationship could result in lower revenues and decreased customer interest in our stores, which, in turn, would adversely affect our results of operations and financial condition. In addition, we may not be able to develop relationships with new suppliers, and products from alternative sources, if any, may be of a lesser quality and more expensive than those we currently purchase.
The lack of willingness of our vendors to provide acceptable payment terms could negatively impact our liquidity and/or reduce the availability of products or services we seek to procure.
We depend on our vendors to provide us with financing for our purchases of inventory and services. Our vendors could seek to limit the availability of vendor credit to us or other terms under which they sell to us, or both, which could negatively impact our liquidity. In addition, the inability of our vendors to access liquidity, or the insolvency of our vendors, could lead to their failure to deliver inventory or other services to us. Certain of our vendors may finance their operations and/or reduce the risk associated with collecting accounts receivable from us by selling or “factoring” the receivables or by purchasing credit insurance or other forms of protection from loss associated with our credit risks. The ability of our vendors to do so is subject to our perceived credit quality. Our vendors could be limited in their ability to factor receivables or obtain credit protection in the future because of our perceived financial position and credit worthiness, which could reduce the availability of products or services we seek to procure.
We may be subject to product liability claims if people or properties are harmed by the products we sell or the services we offer.
We sell products produced by third party manufacturers. Some of these products may expose us to product liability claims relating to personal injury, death or property damage caused by such products and may require us to take actions, such as product recalls. In addition, we also provide various services which could give rise to such claims. Although we maintain liability insurance to mitigate these potential claims, we cannot be certain that its coverage will be adequate for liabilities actually incurred or that insurance will continue to be available on economically reasonable terms or at all. Product liability claims can be expensive to defend and can divert the attention of management and other personnel for significant periods, regardless of the ultimate outcome. Claims of this nature, as well product recalls, could also have a negative impact on customer confidence in the products and services we offer and on our reputation, and adversely affect our business and our results of operations.
If we do not maintain the security of our customer, associate or Company information, we could damage our reputation, incur substantial additional costs and become subject to litigation.
Any significant security compromise or breach of customer, associate or Company data, either held or maintained by the Company or our third party providers, could significantly damage our reputation and brands and result in additional costs, lost sales, fines and/or lawsuits. The regulatory environment in Canada related to information security and privacy is very rigorous. There is no guarantee that the procedures that we have implemented to protect against unauthorized access to secured data are adequate to safeguard against all data security breaches. A data security breach could negatively impact our business and our results of operations.
The performance of our real estate joint ventures may be affected by events outside of our control.
The primary objective of our real estate joint venture operations is to maximize the returns on our investments in shopping center real estate. We review the performance of these joint ventures on a regular basis. Shopping center investments are non-core assets that we sell when we believe it is financially advantageous to do
9
so. Similarly, we may also develop excess land within these real estate holdings and shopping center joint venture investments when it is advantageous to do so. The return on such transactions is contingent on the state of the economic environment and other factors. In addition, the credit worthiness and financial stability of tenants and partners could negatively impact our results of operations.
We are subject to a number of long-term real estate leases which could restrict our ability to respond to changes in demographics or the retail environment and adversely affect our results of operations.
As of April 28, 2012, we operated a total of 122 Full-line Department stores, 371 specialty stores (including 48 Sears Home stores, 11 Outlet stores, four Appliances and Mattresses stores, 278 Hometown Dealer stores operated under independent local ownership and 30 Corbeil stores), 16 Floor Covering Centres, 1,597 catalogue merchandise pick-up locations and 105 Sears Travel offices. Company owned stores consist of 14 Full-line Department stores and two Sears Home stores, with the majority of the remainder held under long-term leases. While we are able to change our merchandise mix and relocate stores in order to maintain competitiveness, we are restricted from vacating a current site without breaching our contractual obligations and incurring lease-related expenses for the remaining portion of the lease-term. The long-term nature of the leases may limit our ability to respond in a timely manner to changes in the demographic or retail environment at any location, which could adversely affect our results of operations. In addition, when leases for the stores in our ongoing operations expire, we may be unable to negotiate renewals, either on commercially acceptable terms, or at all, which could cause us to close stores. Accordingly, we are subject to the risks associated with leasing real estate, which could have an adverse effect on our results of operations.
We may be subject to legal proceedings if we violate the operating covenants in our real estate leases that could adversely affect our business and results of operations.
As of April 28, 2012, we had operating covenants with landlords for approximately 100 of our Sears brand corporate stores. An operating covenant generally requires us, during normal operating hours, to operate a store continuously as per the identified format in the lease agreement. As of April 28, 2012, the remaining term of the various Sears operating covenants ranged from less than one year to 25 years, with an average remaining term of approximately seven years. Failure to observe our operating covenants may result in legal proceedings against us and adversely affect our business and results of operations.
We are subject to laws and regulations that impact our business and a failure to comply with such laws and regulations could lead to lawsuits or regulatory actions against us that could adversely affect our business and results of operations.
Laws and regulations are in place to protect the interests and well-being of our customers and communities, business partners, suppliers, employees, shareholders and creditors. Changes to statutes, laws, regulations or regulatory policies, including changes in the interpretation, implementation or enforcement of statutes, laws, regulations and regulatory policies, could adversely affect our business and results of operations. In addition, we may incur significant costs in the course of complying with any changes to applicable statutes, laws, regulations and regulatory policies. Our failure to comply with applicable statutes, laws, regulations or regulatory policies could result in a judicial or regulatory judgment or sanctions and financial penalties that could adversely impact our reputation, business and results of operations. Although we believe that we have taken reasonable measures designed to ensure compliance with governing statutes, laws, regulations and regulatory policies in the jurisdictions in which we conduct business, there is no assurance that we will always be in compliance or deemed to be in compliance.
We are required to comply with federal and provincial environmental laws and regulations, the cost of which may adversely affect our results of operations and financial condition.
We are exposed to environmental risk as an owner, lessor and lessee of property. Under federal and provincial laws, the owner, lessor or lessee could be liable for the costs of removal and remediation of certain
10
hazardous substances on its properties or disposed of at other locations. The failure to remove or remediate such substances, if any, could lead to claims against us.
We are currently remediating various locations across Canada where we operated auto centers, gas bars and a logistics facility. The extent of the remediation and the costs thereof have not yet been determined. We continue to monitor the costs of remediation and appropriately provide for these costs in our reserves. If we commit to renovating a leased or owned building that contains or may contain asbestos, or if asbestos is inadvertently disturbed, we will be legally obligated to comply with asbestos removal standards. The extent of this liability has not yet been determined because the costs to remove asbestos depend upon factors including, among others, the location and extent of any renovations undertaken. Inadvertent disturbance of asbestos cannot be foreseen. The costs incurred by us could be significant and may negatively impact our results of operations and financial condition.
We are exposed to a variety of legal proceedings, including class action lawsuits, and tax audits which, if adversely decided, could materially adversely affect us.
We currently are involved in various legal proceedings incidental to the normal course of business. Although we are of the view that the final disposition of any such litigation is not expected to have a material adverse effect on our liquidity, consolidated financial position or results of operations, the outcome of such litigation cannot be predicted with certainty.
In the ordinary course of business, we are subject to ongoing audits by tax authorities. While we believe that our tax filing positions are appropriate and supportable, periodically, certain matters are reviewed and from time to time are challenged by the tax authorities. As we routinely evaluate and provide for potentially unfavorable outcomes with respect to any tax audits, we believe that the final disposition of tax audits will not have a material adverse effect on our liquidity, consolidated financial position or results of operations. If the result of a tax audit materially differs from the existing provisions, our effective tax rate and our net earnings could be affected positively or negatively in the period in which the tax audits are completed.
Three class actions in the provinces of Québec, Saskatchewan and Ontario were commenced against us in 2005 arising out of our pricing of tires. The plaintiffs allege that we inflated the regular retail price of certain brands of tires sold by us in order to later claim that the same brands were on sale for up to 45% off the regular retail price so as to induce potential customers into believing that substantial savings were being offered. The plaintiffs seek general damages, special damages, and punitive damages, as well as costs and pre- and post-judgment interest. No dollar amounts are currently specified. The plaintiffs intend to proceed with the Québec action and seek certification as a class action on a national basis. We believe these claims are without merit, and intend to defend against them vigorously. In view of the uncertainty regarding the amount of damages, if any, that could be established, and in light of the plaintiffs not having stated an amount of damages they may seek in this matter, we do not believe a material outflow of resources embodying economic benefit is likely to result.
Events outside our control such as social or political unrest, natural disasters, extreme or unseasonable weather, acts of war or terrorism, systems breakdowns or power outages could have a material adverse effect on our business and results of operations.
Our business is sensitive to customers’ spending patterns, which may be affected by domestic and international social or political unrest, natural disasters, extreme or unseasonable weather, acts of war or terrorism, or other significant events outside of our control, any of which could lead to a decrease in spending by consumers. In addition, such events as well as systems breakdowns and power outages could cause store closures, disrupt our supply chain or other operations, delay shipments of our merchandise to consumers, reduce our revenue and result in expenses to repair or replace our facilities. Disruptions during a peak season such as the month of December, which may account for up to 40% of a year’s earnings, could have a particularly adverse effect on our business and results of operations.
11
Our business could suffer if we are unsuccessful in making, integrating, and maintaining acquisitions and investments.
From time to time we pursue strategic acquisitions of, joint ventures with, or investments in, other companies or businesses, although we have no present commitments with respect to any material acquisitions or investments. Any such acquisition, joint venture or investment that we make may require us to spend our cash, or incur debt, contingent liabilities, or amortization expenses related to intangible assets, any of which could reduce our profitability and harm our business. Acquisitions, joint ventures and investments also increase the complexity of our business and place strain on our management, personnel, operations, supply chain, financial resources, and internal financial controls and reporting functions. We may not be able to manage acquisitions, joint ventures or investments effectively, which could damage our reputation, limit our growth and adversely affect our business and results of operations.
Financial Risks
Our business has been and will continue to be affected by Canadian and worldwide economic conditions; a persistence or worsening of current economic conditions could lead to reduced revenues and gross margins, and negatively impact our liquidity.
We plan our operations giving regard to economic and financial variables that are beyond our control. Changes to these variables may adversely impact our performance. Should the current economic conditions persist or worsen, heightened competition, a further decline in consumer confidence, lower disposable income, higher unemployment and personal debt levels may result, which could lead to reduced demand for our products and services. Any of these events could cause us to increase inventory markdowns and promotional expenses, thereby reducing our gross margins and results of operations. Our results of operations have been negatively impacted as a result of the current economic conditions and the volatility in the Canadian and global economies and it is difficult to accurately assess the potential impact on our business. If the Canadian or global economies continue to worsen, however, we could experience a decline in same store sales, erosion of gross profit and profitability.
Increasing fuel and energy costs may have a significant negative impact on our operations. We require significant quantities of fuel for the vehicles used to distribute and deliver inventory and we are exposed to the risk associated with variations in the market price for petroleum products. We could experience a disruption in energy supplies, including our supply of gasoline, as a result of factors that are beyond our control, which could have an adverse effect on our business. Certain of our vendors also are experiencing increases in the cost of various raw materials, such as cotton, oil-related materials, steel and rubber, which could result in increases in the prices that we pay for merchandise, particularly apparel, appliances and tires and adversely affect our results of operations.
Liquidity Risk
We could face liquidity risk due to various factors, including but not limited to, the unpredictability of the current economic climate, failure to secure appropriate funding vehicles and cash flow issues relating to the operation and management of the business. Failure to fulfill financial obligations due and owing from us as a result of this liquidity risk could have undesirable consequences on us.
Fluctuations in U.S. and Canadian dollar exchange rates may affect our results of operations.
Our foreign exchange risk is currently limited to currency fluctuations between the Canadian and U.S. dollar. We are vulnerable to increases in the value of the U.S. dollar relative to the Canadian dollar because the majority of our revenues are denominated in Canadian dollars and a substantial amount of the merchandise we purchase is priced in U.S. dollars. The costs of these goods in Canadian dollars rise when the U.S. dollar increases in value relative to the Canadian dollar and, as a result, we may be forced to increase our prices or reduce our gross margins. We may use foreign currency forward and option contracts to hedge the exchange rate
12
risk on a portion of our expected requirement for U.S. dollars. There can be no assurance that our hedging efforts will achieve their intended results or that our estimate of our requirement for U.S. dollars will be accurate, with the result that currency fluctuations may have an adverse impact on our results of operations.
In addition, the appreciation of the Canadian dollar over the past few years relative to the U.S. dollar presents an additional challenge to us as our customers are motivated to cross-border shop, which may have an adverse impact on our results of operations. See “Exchange Rate Table” elsewhere in this Form 20-F.
We are exposed to counterparty credit risk which could adversely affect our results of operations.
Credit risk refers to the possibility that we can suffer financial losses due to the failure of counterparties to meet their payment obligations to us. Exposure to credit risk exists for derivative instruments, cash and cash equivalents, short-term investments, accounts receivable and investments included in other long-term assets. Cash and cash equivalents, short-term investments, accounts receivable, derivative financial assets, and other long-term assets of $489.9 million as at April 28, 2012 (January 28, 2012: $514.9 million, January 29, 2011: $577.6 million, January 31, 2010: $1,536.5 million) expose us to credit risk should the borrower default on maturity of the investment. Although we seek to manage this exposure through policies that require borrowers to have a minimum credit rating of A, and limiting investments with individual borrowers at maximum levels based on credit rating, there can be no assurance that we will be able to successfully manage our credit risk.
We invest our surplus cash in investment grade, short-term money market instruments, the return on which depends upon interest rates and the credit worthiness of the issuer. We attempt to mitigate credit risk resulting from the possibility that an issuer may default on repayment by requiring that issuers have a minimum credit rating and limiting exposures to individual borrowers.
We are exposed to interest rate risk which could adversely affect our results of operations.
Interest rate risk reflects the sensitivity of our financial condition to movements in interest rates. Financial assets and liabilities which do not bear interest or bear interest at fixed rates are classified as non-interest rate sensitive. Cash and cash equivalents and borrowings under our $800.0 million senior secured revolving credit facility, or the Credit Facility, are subject to interest rate risk. The total outstanding balance subject to interest rate risk as at April 28, 2012 was a net asset of $362.9 million (January 28, 2012: net asset of $297.7 million, January 29, 2011: net asset of $322.9 million). An increase or decrease in interest rate of 0.25% would cause an immaterial after-tax impact on net (loss) earnings.
Expenses associated with our retirement benefit plans may fluctuate significantly depending on changes in actuarial assumptions, future market performance of plan assets, and other events outside of our control and adversely affect our results of operations.
We currently maintain a defined benefit registered pension plan, a non-registered supplemental savings arrangement and a defined benefit non-pension post-retirement plan, which provides life insurance, medical and dental benefits to eligible retired associates through a health and welfare trust. The defined benefit plan continues to accrue benefits related to future compensation increases although no further service credit is earned. In addition, we no longer provide medical, dental and life insurance benefits at retirement for associates who had not achieved the eligibility criteria for these non-pension post-retirement benefits as at December 31, 2008.
There is no assurance that our retirement benefit plans will be able to earn the assumed rate of return. New regulations and market driven changes may result in changes in the discount rates and other variables which would result in the Company being required to make contributions in the future that differ significantly from the estimates. Management is required to use assumptions to account for the plans in conformity with IFRS. However, actual future experience will differ from these assumptions giving rise to actuarial gains or losses. In any year, actual experience differing from the assumptions may be material. Plan assets consist primarily of cash,
13
alternative investments, marketable equity and fixed income securities. The value of the marketable equity and fixed income investments will fluctuate due to changes in market prices. Plan obligations and annual pension expense are determined by independent actuaries and through the use of a number of assumptions.
Although we believe that the assumptions used in the actuarial valuation process are reasonable, there remains a degree of risk and uncertainty which may cause results to differ materially from expectations. Significant assumptions in measuring the benefit obligations and pension plan costs include the discount rate and the rate of compensation increase. See Note 20.4 “Pension assumptions” of the Notes to the 2011 Annual Consolidated Financial Statements for more information on the weighted-average actuarial assumptions for the plans.
We face risks associated with impairment of goodwill and other assets.
Our goodwill, intangible assets and long-lived assets, primarily consisting of stores and joint ventures, are subject to periodic testing for impairment. A significant amount of judgment is involved in the periodic testing. Failure to achieve sufficient levels of cash flow within each of our cash generating units or specific operating units could result in impairment charges for goodwill and intangible assets or fixed asset impairment for long-lived assets, which could have a material adverse effect on our reported results of operations.
Risks Relating to our Relationship with Sears Holdings
We may lose rights to some intellectual property if Sears Holdings’ equity ownership in us falls below specified thresholds.
We rely on our right to use the “Sears” name, including as part of our corporate and commercial name, which we consider a significant and valuable aspect of our business. Our right to use the “Sears” name and certain other brand names was granted pursuant to a license agreement with Sears Holdings. Our license to use the “Sears” name and certain brand names may be terminated if Sears Holdings’ indirect ownership interest in us is reduced to less than 25%. In addition, our license to use the “Sears” name may also terminate upon the occurrence of certain bankruptcy events. Losing our right to use these intellectual properties could significantly diminish our competitiveness and could materially harm our business. If the license agreement is terminated, we would attempt to renegotiate the license agreement although the terms of any renegotiated license agreement would likely be less favorable to us.
Some of our directors and executive officers may have conflicts of interest because of their ownership of Sears Holdings common stock and positions with Sears Holdings.
Some of our directors and executive officers own Sears Holdings common stock. In addition, one of our directors, William R. Harker, is an executive officer of Sears Holdings. Ownership of Sears Holdings common stock by our directors and officers after the spin-off and the presence of executive officers or directors of Sears Holdings on our board of directors could create, or appear to create, conflicts of interest with respect to matters involving both us and Sears Holdings.
Risks Relating to Our Common Shares and the Spin-off
As long as Sears Holdings or ESL controls us, your ability to influence matters requiring shareholder approval will be limited.
Immediately following the spin-off, Sears Holdings will control approximately 51% of our voting power and ESL is expected to directly control approximately 27% of our voting power based on ESL’s ownership of Sears Holdings common stock as disclosed in ESL’s Schedule 13D/A filed July 5, 2012. As of the date of this Form 20-F, ESL controlled Sears Holdings and, therefore, ESL will directly or indirectly control approximately 78% of our voting power immediately following the spin-off. So long as ESL directly or indirectly controls a
14
majority of our outstanding common shares, ESL will have the ability to control the election of our board of directors and the outcome of certain shareholder votes.
Accordingly, Sears Holdings and ESL will continue to have the ability to exercise control over certain actions to be taken or approved by our directors and shareholders, including with respect to certain mergers or business combinations or dispositions of all or substantially all of our assets.
Sears Holdings and ESL’s voting control may discourage transactions involving a change of control of us, including transactions in which you, as a holder of our common shares, might otherwise receive a premium for your shares over the then-current market price. Subject to certain limits, Sears Holdings is also not prohibited from selling a controlling interest in us to a third party and may do so without your approval and, subject to applicable laws, without providing for a purchase of your common shares. Accordingly, your common shares may be worth less than they would be if Sears Holdings and ESL did not maintain voting control over us.
Sears Holdings and ESL’s interests may be different than your interests and Sears Holdings and ESL may have investments in other companies that may compete with us, and may have interests from time to time that diverge from the interests of our other shareholders, particularly with regard to new investment opportunities.
In addition, conflicts of interest may arise between Sears Holdings and/or ESL and us, including corporate opportunities, potential acquisitions or transactions, as well as other matters. We may be adversely affected by any conflicts of interest between Sears Holdings and/or ESL and us.
Furthermore, neither Sears Holdings nor ESL owes us or our shareholders any fiduciary duties under Canadian law. See Item 7.B. “Related Party Transactions – Conflicts of Interest and Fiduciary Duties”.
Becoming a reporting company in the United States will increase our expenses and administrative burden, in particular to bring us into compliance with certain provisions of the Sarbanes-Oxley Act of 2002 to which we are not currently subject.
As a U.S. reporting company, we will incur additional legal, accounting and other expenses that we did not incur prior to being a U.S. reporting company. These increased costs and expenses may arise from various factors, including costs associated with complying with U.S. federal securities laws (including compliance with the Sarbanes-Oxley Act of 2002) and tax administration.
In addition, changing laws, regulations and standards relating to corporate governance and public disclosure, including those related to foreign private issuers and the Sarbanes-Oxley Act of 2002, and related regulations implemented by the United States Securities and Exchange Commission, or the SEC, are creating uncertainty for foreign private issuers and other U.S. public companies, increasing legal and financial compliance costs, and making some activities more time consuming. We are currently evaluating and monitoring developments with respect to new and proposed rules and cannot predict or estimate the amount of the additional costs we may incur or the timing of such costs. These laws, regulations and standards are subject to varying interpretations, in many cases due to their lack of specificity, and, as a result, their application in practice may evolve over time as new guidance is provided by regulatory and governing bodies. This could result in continuing uncertainty regarding compliance matters and higher costs necessitated by ongoing revisions to disclosure and governance practices. We intend to invest resources to comply with evolving laws, regulations and standards, and this investment may result in increased general and administrative expenses and a diversion of management’s time and attention from revenue-generating activities to compliance activities. If our efforts to comply with new laws, regulations and standards differ from the activities intended by regulatory or governing bodies due to ambiguities related to practice, regulatory authorities may initiate legal proceedings against us and our business may be harmed. The costs of compliance or our failure to comply with these laws, rules and regulations could adversely affect our reputation, business, results of operations, financial condition and the price of our common shares.
15
The price of our common shares may decline if Sears Holdings or ESL alter their strategy with respect to their ownership of our shares.
Sears Holdings and ESL have advised us that they have not reached any decision regarding whether or for how long they will retain their share ownership in us and what form, if any, the disposition or distribution of their shares in us will take. Sears Holdings and ESL will, in their respective sole discretions, determine the timing and terms of any transactions with respect to their shares in us, taking into account business and market conditions and other factors that they deem relevant. Neither Sears Holdings nor ESL is subject to any contractual obligation to maintain its ownership position in us, nor is ESL subject to any contractual obligation to us to maintain its ownership in Sears Holdings. Consequently, we cannot assure you that either Sears Holdings or ESL will maintain their current direct or indirect ownership of our common shares. Any announcement by Sears Holdings or ESL that they have reached a determination regarding what to do with their direct or indirect ownership of our common shares, or the perception by the investment community that Sears Holdings or ESL has reached such a determination, could have an adverse impact on the price of our common shares.
If our share price fluctuates after the spin-off, you could lose all or a significant part of your investment.
Although there is a current public market for our common shares, the number of holders of our common shares is likely to substantially increase following the spin-off and the spin-off will potentially enhance liquidity. We cannot predict the prices at which our common shares may trade after the spin-off. The market price of our common shares may fluctuate widely, depending on many factors, some of which may be beyond our control, including:
| | • | | our business profile and market capitalization may not fit the investment objectives of some Sears Holdings stockholders and, as a result, these Sears Holdings stockholders may sell our shares after the spin-off; |
| | • | | actual or anticipated fluctuations in our results of operations due to factors related to our business; |
| | • | | success or failure of our business strategy; |
| | • | | actual or anticipated changes in the Canadian economy or the retailing environment, our quarterly or annual earnings, or those of other companies in our industry; |
| | • | | announcements by us or our competitors of significant acquisitions or dispositions; |
| | • | | changes in earnings estimates by securities analysts or our ability to meet those estimates; |
| | • | | the operating and stock price performance of other comparable companies, including Sears Holdings; |
| | • | | overall market fluctuations; |
| | • | | changes in laws and regulations affecting our business; |
| | • | | actual or anticipated sales or distributions of our common shares by Sears Holdings, ESL, our officers, directors or certain other significant shareholders; |
| | • | | terrorist acts or wars; and |
| | • | | general economic conditions and other external factors. |
In addition, the stock market in general has experienced extreme price and volume fluctuations that have often been unrelated or disproportionate to the operating performance of companies like us. These broad market and industry factors may materially reduce the market price of our common shares, regardless of our operating performance.
Substantial sales of our common shares may occur in connection with the spin-off, which could cause the price of our common shares to decline.
Although we have no actual knowledge of any plan or intention on the part of any significant shareholder to sell our shares following the spin-off, it is likely that some shareholders, possibly including our significant
16
shareholders, will sell their common shares for a number of reasons, including if, for reasons such as our business profile or market capitalization, we do not fit their investment objectives. In particular, Sears Holdings is a member of the S&P 500 Index, while we will not be and, accordingly, certain Sears Holdings stockholders may elect or be required to sell our shares following the spin-off due to such shareholders’ own investment guidelines or other reasons.
The common shares held by Sears Holdings, ESL and our other affiliates may be sold in the U.S. public market only if registered or if the holders thereof qualify for an exemption from registration under the Securities Act of 1933, as amended, or the Securities Act, or to the extent sold to investors in Canada in compliance with applicable Canadian securities laws. Individuals who may be considered our affiliates after the spin-off include individuals who control, are controlled by or are under common control with us, as those terms generally are interpreted for U.S. federal securities law purposes. These individuals include our directors, executive officers and certain significant shareholders. Individuals who are our affiliates will be permitted to sell their common shares only pursuant to an effective registration statement under the Securities Act, or an exemption from the registration requirements of the Securities Act, such as the exemptions afforded by Section 4(1) of the Securities Act, or Rule 144, or Regulation S thereunder.
In addition, non-affiliates will have be able to offer their Sears Canada common shares for sale over the TSX immediately after the spin-off. The sale of a substantial number of our common shares could adversely affect the market price of our common shares and could impair our future ability to raise capital through an offering of our equity securities.
Your percentage ownership in us may be diluted in the future.
Your percentage ownership in us may be diluted in the future if additional equity awards are granted to our directors, officers and employees in the future. We may establish equity incentive plans that provide for the grant of common share-based equity awards to our directors, officers and other employees. In addition, we may issue equity in order to raise capital or in connection with future acquisitions, strategic investments or partnerships, which would dilute your percentage ownership.
The combined post-spin-off value of our common shares and Sears Holdings common stock may not equal or exceed the aggregate pre-spin-off value of Sears Holdings common stock and our common shares.
After the spin-off, Sears Holdings common stock will continue to be listed and traded on the NASDAQ Global Select Market. Our common shares will continue to be traded under the symbol “SCC” on the TSX. We have no current plans to apply for listing on any additional stock exchanges. We cannot assure you that the combined trading prices of Sears Holdings common stock and our common shares after the spin-off will be equal to or greater than the aggregate trading prices of Sears Holdings common stock and our outstanding common shares prior to the spin-off. Until the market has fully evaluated the impact of the spin-off on Sears Holdings and on our business, the price at which Sears Holdings common stock and our common shares trade may fluctuate.
Because we are a Canadian corporation, half of our directors and most of our officers, and the experts named in this Form 20-F, are resident in Canada. It may be difficult for investors in the United States to enforce civil liabilities against such persons, based solely upon the federal securities laws of the United States.
We are a Canadian corporation with our principal place of business in Canada. Half of our directors and most of our officers and the auditors named herein are residents of Canada and all or a substantial portion of our assets and those of such persons are located outside the United States. Consequently, it may be difficult for U.S. investors to effect service of process within the United States upon us, our directors or officers, or such auditors who are not residents of the United States, or to realize in the United States upon judgments of courts of the United States predicated upon civil liabilities under the U.S. securities laws. Investors should not assume that Canadian courts: (1) would enforce judgments of U.S. courts obtained in actions against us or such persons predicated upon the civil liability provisions of the U.S. federal securities laws or the securities or “blue sky” laws of any state within the
17
United States or (2) would enforce, in original actions, liabilities against us or such persons predicated upon the U.S. federal securities laws or any such state securities or blue sky laws. We believe that a judgment of a U.S. court predicated solely upon civil liability under such laws would likely be enforceable in Canada if the U.S. court in which the judgment was obtained had a basis for jurisdiction in the matter that was recognized by a Canadian court for such purposes. We cannot be certain that Canadian courts will allow shareholders to originate actions in Canada predicated solely upon U.S. federal or state securities laws.
As a foreign private issuer, we are not subject to certain U.S. securities law disclosure requirements that apply to a domestic U.S. issuer, which may limit the information publicly available to our shareholders.
As a foreign private issuer, we are not required to comply with all the periodic disclosure requirements of the Securities Exchange Act of 1934, as amended, or the Exchange Act, and therefore, there may be less publicly available information about us than if we were a U.S. domestic issuer. For example, we are not subject to the proxy rules in the United States and disclosure with respect to our annual meetings will be governed by Canadian requirements. Our governing corporate law statute, the Canada Business Corporations Act, generally requires that we must call an annual meeting of shareholders not later than 15 months after holding our last preceding annual meeting but no later than six months after the end of our preceding financial year. Our most recent annual meeting was held on April 17, 2012. Therefore, our first annual meeting of shareholders after completion of the spin-off will not be required to occur until July 2013. Although our directors and principal shareholders are required to report trades in our securities and are subject to early warning obligations under Canadian securities laws, they are exempt from the reporting and “short-swing” profit recovery provisions of Section 16 of the Exchange Act.
We may lose our foreign private issuer status in the future, which could result in significant additional costs and expenses to us.
In order to maintain our current status as a foreign private issuer under U.S. federal securities laws, a majority of our common shares must be either directly or indirectly owned by non-residents of the United States unless we also satisfy each of the three additional requirements in accordance with the definition of “foreign private issuer” under the Exchange Act. In addition to the majority of our common shares being owned by residents of the United States, if any of (i) the majority of our executive officers or directors are United States citizens or residents, (ii) more than fifty percent of our assets are located in the United States or (iii) our business is administered principally in the United States, then we would lose our foreign private issuer status. We currently satisfy the test and qualify as a foreign private issuer, but we cannot be certain that we will meet these requirements in the future. The regulatory and compliance costs to us under U.S. federal securities laws as a U.S. domestic issuer may be significantly more than the costs we incur as a Canadian foreign private issuer. If we cease to be a foreign private issuer, we would not be eligible to use the multijurisdictional disclosure system or other foreign issuer forms and would be required to file periodic and current reports and registration statements on U.S. domestic issuer forms with the SEC, which are more detailed and extensive than the forms available to a foreign private issuer. We may also be required to prepare our financial statements in accordance with U.S. generally accepted accounting principles, or GAAP. These additional reporting obligations could be costly and have a negative impact on our financial condition.
If you receive our common shares in the spin-off, you may need to fund your United States federal income tax liability with cash from other sources or by selling our common shares.
If you receive our common shares pursuant to the spin-off, you generally will be considered to have received a taxable distribution in an amount equal to the fair market value of our common shares received by you plus the amount of cash received in lieu of fractional common shares on the date of the distribution. As a result, you may need to fund any United States federal income tax and/or Canadian federal income tax resulting from the receipt of our common shares with cash from your own funds or by selling all or a portion of such common shares received by you. You should discuss with your tax advisor the United States federal income tax
18
consequences and Canadian federal income tax consequences of receiving our common shares pursuant to the spin-off. For a detailed discussion, see Item 10.E. “Taxation – Material United States Federal Income Tax Consequences” and “Taxation – Material Canadian Federal Income Tax Consequences”.
Because we are a foreign corporation for United States federal income tax purposes, the ownership and disposition of our shares may result in different tax consequences to you than would the ownership and disposition of the shares of a United States corporation such as Sears Holdings.
We are a foreign corporation for United States federal income tax purposes, which may result in different tax consequences to you than would the ownership and disposition of the shares of a United States corporation such as Sears Holdings. Such differences include the imposition of any Canadian withholding taxes, your ability to claim foreign tax credits in respect of Canadian taxes and, as a result of the spin-off, your ability potentially to exclude distributions of “previously taxed income” (and any related Canadian dollar exchange gain or loss that you may be required to recognize in respect of such excluded distributions). You should discuss the United States federal income tax consequences to you of the ownership and disposition of our common shares with your own tax advisor. For additional discussion, see Item 10.E. “Taxation – Material United States Federal Income Tax Consequences – Ownership of Our Common Shares”.
ITEM 4. INFORMATION ON THE COMPANY
4.A. HISTORY AND DEVELOPMENT OF THE COMPANY
We were incorporated under the laws of Canada by letters patent dated September 17, 1952 and were continued under the Canada Business Corporations Act, or CBCA, by articles of continuance effective May 15, 1980. By articles of amendment effective May 31, 1984, we changed our name from Simpsons-Sears Limited to Sears Canada Inc. By articles of amalgamation dated January 1, 1994, December 29, 1996 and December 30, 1999, we were amalgamated with various wholly-owned subsidiaries. The address of our registered office and principal place of business is 290 Yonge Street, Suite 700, Toronto, Ontario, Canada, M5B 2C3.
Development of the Business Over the Last Three Years
In Fiscal 2009, we focused on our gift registry business, which was expanded to a total of 107 stores, and launched Oasis in two Full-line Department stores. Oasis is a beauty department concept offering a ‘one-stop’, ‘head-to-toe’ shopping destination featuring a wide assortment of beauty brands and personal care tools.
In addition, during Fiscal 2009, we expanded the products and services offered throughout our various channels, including: (i) launched “Sears Certified Real Estate Services”, designed to help make real estate transactions professional, easy and rewarding for customers who are buying or selling a home in the Greater Toronto Area; (ii) secured commercial agreements with a provincial electric utility company to supply energy efficient appliances for its major appliance replacement program as well as with reputable home builders to supply major appliances to new home buyers; (iii) expanded our diverse product and services offerings to include a new residential painting service in select markets; and (iv) launched the Sears Water Appliance Program (SWAP), a national program that encourages homeowners to upgrade their inefficient or non-functional water softeners to an ENERGY STAR®-compliant unit, providing Canadians with more energy efficient solutions and another way to reduce emissions of greenhouse gases into the environment.
In Fiscal 2009, we completed the relocation of head office operations to the vacant space above the Toronto Eaton Centre Full-line Department store to reduce costs and improve efficiencies. We also reduced inventory levels by $116.0 million through promotional events and improved inventory management practices through initiatives such as integrating return-to-vendor provisions into agreements as well as selling products on consignment. Furthermore, we improved our replenishment and direct importing practices to increase margins, enhance our competitive pricing capabilities and ensure customers have a broad and relevant selection of quality products to choose from in order to grow sales.
19
During Fiscal 2009, Sears Canada opened 15 new Hometown Dealer stores and one new Outlet store. The Company also closed nine Floor Covering Centres, one Appliances and Mattresses store and one Lands’ End store.
In Fiscal 2010, we undertook several initiatives to introduce new businesses and products targeted to specific customer segments and local markets. These included the expansion of the gift registry across 15 Full-line Department stores, 41 Home stores, and all Hometown Dealer locations, as well as the roll out of the Modern Shop in 43 stores to offer a shopping experience intended to appeal to the younger-minded customer. The Modern Shop is a contemporary shop set up in high-traffic areas of the store, focusing on modern brands.
During Fiscal 2010, we sold land in Lachenaie, Québec, which was held by one of our real estate joint ventures. Our proportionate share of net proceeds on the sale of land was $4.0 million. A pre-tax gain of $2.8 million, net of closing and other costs, was recognized on the sale. We also opened 83 new Hometown Dealer stores and four Floor Covering Centres. We closed 1 Hometown Dealer store, 1 Outlet store and 2 Floor Covering Centres. In addition, we finalized an agreement to sell real estate property in Burnaby, British Columbia, for net proceeds of $13.9 million. A pre-tax gain of $13.4 million, net of closing costs, was recognized on the sale of the property in the fourth quarter of Fiscal 2010.
Throughout Fiscal 2011, we continued to enhance our national presence by growing our Hometown Dealer network through the conversion of catalogue agents into full Hometown Dealer stores with an expanded assortment of products and services, including gift registry, home improvement services, and an expanded selection of big ticket appliances and electronics.
In order to position the Company to continue operating efficiently during the challenging economic environment, we wrote down $38.4 million of excess inventory in Fiscal 2011. We also implemented internal restructuring to position us for the transformation. In Fiscal 2011, we embarked on a transformation strategy to be implemented over a three-year timeframe. See Item 4.B. “Business Overview – Transformation Strategy”.
During Fiscal 2011, we sold our interest in the Chatham Centre for net proceeds of $1.6 million. We also opened 20 Hometown Dealer stores and three Catalogue merchandise pick-up locations. We closed three Hometown Dealer stores, three Floor Covering centers and 91 Catalogue merchandise pick-up locations.
For Fiscal 2011, the Company purchased $84.3 million of capital assets and intangible assets (2010: $60.0 million), while divesting of $0.7 million of capital assets and intangible assets (2010: $14.6 million).
In Fiscal 2012, we intend to invest $10.0 million to refresh the Barrie, Limeridge- Hamilton, Newmarket and Belleville Full-line Department stores.
For the upcoming year, we will continue our mission of building customer relationships, increasing profitability and improving every day and we remain confident in our strategy geared toward productivity improvement and growing profitable sales by better meeting the needs of our target customers. Some of the priorities for Fiscal 2012 include: (i) focusing on lean inventory management and implementing further reductions in inventory shrinkage and product returns; and (ii) continuing to focus on expense management and recovering costs while improving customer service.
On March 2, 2012, we entered into an agreement to surrender and terminate early the operating leases on three properties. On the closing date, April 20, 2012, we received cash proceeds of $170.0 million for the surrender of the three leases, resulting in a pre-tax gain of $164.3 million for the 13-week period ended April 28, 2012, net of transaction costs of $5.7 million, including the derecognition of leasehold improvements. We plan to exit all three properties by October 31, 2012.
On April 29, 2012, we sold the operations of our subsidiary, Cantrex Group Inc., or Cantrex, to Nationwide Marketing Group, LLC for $3.5 million, equal to the net carrying amount of specified Cantrex assets and liabilities to be sold. As the net carrying amount of assets and liabilities sold equaled the proceeds received, no gain or loss was recognized on the transaction.
20
THE SPIN-OFF
General
Sears Holdings has announced its plan for a partial spin-off of a minority share of our common shares by means of a pro rata dividend to Sears Holdings’ shareholders. After giving effect to the spin-off, Sears Holdings will own approximately 51% of our outstanding common shares. Immediately following the spin-off, our common shares will remain listed for trading on the TSX.
Sears Holdings has advised us that it currently intends to distribute the Sears Canada common shares as soon as practicable after this Form 20-F becomes effective and we have satisfactorily responded to all SEC comments, or the Spin-Off Date. On the Spin-Off Date, each Sears Holdings stockholder will receive of our common shares for every shares of Sears Holdings common stock held as of the close of business on , 2012, or the record date. You will not be required to make any payment, surrender or exchange your common stock of Sears Holdings or take any other action to receive your common shares of Sears Canada.
We anticipate that immediately following the spin-off, ESL, which currently owns approximately 62% of Sears Holdings common stock, will directly own approximately 27% of our outstanding common shares, and therefore will directly and indirectly (through Sears Holdings) own approximately 78% of our outstanding common shares.
The distribution of Sears Canada common shares as described in this Form 20-F is subject to the satisfaction of certain conditions. For a more detailed description of these conditions, see “Spin-Off Conditions” below.
Reasons for the Spin-Off
Sears Holdings announced that its board of directors has determined that pursuing a disposition of a portion of the Sears Canada common shares held by Sears Holdings through a partial spin-off, following which Sears Holdings would hold approximately 51% of Sears Canada, is in the best interest of Sears Holdings and its stockholders, and that a greater degree of separation between Sears Canada and Sears Holdings would provide, among other things, financial, operational and managerial benefits to both Sears Canada and Sears Holdings, including but not limited to the following expected benefits:
| | • | | Strategic Focus and Flexibility. Sears Holdings’ board of directors believes that following the spin-off, Sears Canada and Sears Holdings should be better able to dedicate resources to pursue appropriate growth opportunities and best optimize returns on assets employed and execute strategic plans best suited to their respective businesses in a more efficient manner. The Sears Holdings’ board of directors also believes that structuring the spin-off as a partial spin-off preserves flexibility as to how it may realize the value of its remaining holdings in Sears Canada over time. |
| | • | | Investor Choice. Sears Holdings’ board of directors believes that (i) the spin-off should increase investor understanding of Sears Canada and its market position within its industry, while also allowing for a more natural and interested investor base; (ii) the spin-off should allow current and prospective investors to make independent decisions with respect to each of Sears Holdings and Sears Canada based on, among other factors, each company’s different business models, strategies and geographic focus; and (iii) the spin-off should provide investors with a more targeted investment opportunity by allowing investors to participate in a direct investment in Sears Canada, and providing investors with increased flexibility of choice in what assets and securities they hold. |
| | • | | Liquidity. Sears Holdings’ board of directors believes that the spin-off potentially enhances the liquidity of holders of Sears Canada common shares. |
In light of the foregoing, and a review of the impact of the proposed spin-off, the Sears Holdings board of directors has concluded that a spin-off, in the form contemplated, is a reasonable way to enhance long-term stockholder value and preserve flexibility for holders of Sears Holdings’ common stock.
21
Manner of Effecting the Spin-Off
For every shares of Sears Holdings common stock that you own as of the close of business on the record date, you will receive common shares of Sears Canada on the Spin-Off Date. Fractional shares of Sears Canada common shares will not be distributed to Sears Holdings’ stockholders. Instead, the distribution agent engaged by Sears Holdings will aggregate fractional shares into whole shares, sell the whole shares in the open market at prevailing market prices and distribute the aggregate net cash proceeds of the sales pro rata, based on the fractional share such holder would otherwise be entitled to receive, to each holder who otherwise would have been entitled to receive a fractional share in the spin-off. Accordingly, if you hold fewer than shares of Sears Holdings common stock as of the record date, you will not receive any Sears Canada common shares; however, you will receive a cash distribution from Sears Holdings’ distribution agent representing the proceeds from the sale of the fractional share to which you are otherwise entitled, net of brokerage fees and other costs. The distribution agent, in its sole discretion, without any influence by Sears Holdings, or us, will determine when, how, through which broker-dealer and at what price to sell the whole shares. Any broker-dealer used by the distribution agent will not be an affiliate of either Sears Holdings or us.
The aggregate net cash proceeds of these fractional share sales (as well as the fair market value of the common shares you receive) generally will be taxable for United States federal income tax purposes. See “–Item 10.E. “Taxation – Material United States Federal Income Tax Consequences” for an explanation of the United States federal income tax consequences of the spin-off.
We estimate that it will take approximately business days from the Spin-Off Date for the distribution agent to complete the distributions of the aggregate net cash proceeds. If you hold your Sears Holdings common stock through a bank or brokerage firm, your bank or brokerage firm will receive, on your behalf, your pro rata share of the aggregate net cash proceeds of the sales and will electronically credit your account for your share of such proceeds. Shareholders should consult their bank or broker for further details.
It is anticipated that, as early as two trading days prior to the record date and continuing up to and including the Spin-Off Date, there will be two markets in Sears Holdings common stock: a “regular-way” market and an “ex-distribution” market. Sears Holdings common stock that trades on the regular-way market will trade with an entitlement to Sears Canada common shares distributed pursuant to the spin-off. Shares that trade on the ex-distribution market will trade without an entitlement to Sears Canada common shares distributed pursuant to the spin-off. If you sell Sears Holdings common stock in the “regular-way” market up to and including the Spin-Off Date, you will be selling your right to receive Sears Canada common shares in the spin-off. If you own Sears Holdings common stock at the close of business on the record date and sell those shares on the “ex-distribution” market up to and including the Spin-Off Date, you will still receive Sears Canada common shares that you would be entitled to receive in respect of the Sears Holdings common stock you owned at the close of business on the record date.
If you own Sears Holdings common stock as of the close of business on the record date, the Sears Canada common shares that you are otherwise entitled to receive in the spin-off will be issued electronically, as of the Spin-Off Date, to you or to your bank or brokerage firm on your behalf by way of direct registration in book-entry form. Registration in book-entry form refers to a method of recording share ownership where no physical share certificates are issued to shareholders, as is the case in this spin-off.
Most Sears Holdings stockholders hold their common stock of Sears Holdings through a bank or brokerage firm. In such cases, the bank or brokerage firm would be said to hold the shares in “street name” and ownership would be recorded on the bank or brokerage firm’s books. If you hold your Sears Holdings common stock through a bank or brokerage firm, on the Spin-Off Date your bank or brokerage firm will credit your account for the Sears Canada common shares that you are entitled to receive in the spin-off. If you have any questions concerning the mechanics of having shares held in “street name,” we encourage you to contact your bank or brokerage firm.
Prior to the Spin-Off Date, an information statement containing a copy of this Form 20-F will be furnished to holders of record of Sears Holdings common stock and made publicly available online at
22
www.searsholdings.com/invest. Sears Holdings will, in its sole discretion, elect to either mail full printed copies of the information statement to all holders of record of Sears Holdings common stock as of the record date or mail a Notice of Internet Availability of Spin-Off Materials, or the Notice, to such stockholders describing how stockholders can access the information statement on the Internet. In the event Sears Holdings elects to provide Notices to stockholders, such Notices will be mailed shortly following the record date and will instruct holders of Sears Holdings common stock how to receive a paper copy of the information statement at no charge. Sears Holdings will mail a full printed copy of the information statement prior to the Spin-Off Date to all holders of Sears Holdings common stock who have elected to receive printed copies of proxy materials from Sears Holdings.
Results of the Spin-Off
Immediately after the spin-off, Sears Holdings will hold approximately 51% of the outstanding Sears Canada common shares and ESL is expected to directly hold approximately 27% of the outstanding Sears Canada common shares. Sears Holdings has advised us that immediately following the spin-off, we expect to have approximately shareholders of record, based on the number of registered holders of Sears Canada and Sears Holdings common stock on , 2012. Our outstanding share capital immediately following the spin-off will consist of approximately Sears Canada common shares. The actual number of shares to be distributed to each Sears Holdings stockholder will be determined on the record date and will reflect any issuance of new shares pursuant to Sears Holdings’ equity plans, and any shares repurchased by Sears Holdings under its common stock repurchase program, in each case on or prior to the record date. The spin-off will not affect the number of outstanding shares of Sears Holdings common stock or any rights of Sears Holdings’ stockholders.
Material United States Federal Income Tax Consequences of the Spin-Off
If you receive our common shares pursuant to the spin-off you generally will be considered to have received a taxable distribution for U.S federal income tax purposes in an amount equal to the fair market value of our common shares received by you plus the amount of cash received in lieu of fractional common shares on the date of the distribution. This distribution will be treated as a dividend to the extent of your share of the current and accumulated earnings and profits of Sears Holdings, as determined for United States federal income tax purposes. To the extent that the amount of the distribution exceeds Sears Holdings’ current and accumulated earnings and profits for the taxable year of the distribution, the distribution will first be treated as a tax-free return of capital, causing a reduction in the adjusted basis of your Sears Holdings common stock, and to the extent the amount of the distribution exceeds your adjusted tax basis, the excess will be treated as capital gain. We anticipate that the current and accumulated earnings and profits of Sears Holdings will exceed the aggregate fair market value of our common shares plus the amount of cash received in lieu of fractional common shares on the date of the distribution. The foregoing discussion is qualified in its entirety by the discussion set forth in Item 10.E. “Taxation – Material United States Federal Income Tax Consequences”.
You should consult your own tax advisors concerning the United States federal income tax consequences to you of the receipt, ownership and disposition of our common shares in light of your particular situation as well as any consequences arising under the laws of any other taxing jurisdiction.
Spin-Off Conditions
Sears Holdings has advised us that the spin-off is subject to the satisfaction or waiver by Sears Holdings, in its sole discretion, of the following conditions:
| | • | | the Sears Holdings board of directors shall have authorized and approved the spin-off and related transactions and not withdrawn such authorization and approval, and shall have declared the dividend of Sears Canada common shares to Sears Holdings stockholders; |
| | • | | this Form 20-F will have gone effective under the Exchange Act and no stop order suspending the effectiveness of this Form 20-F shall be in effect, and no proceedings for such purpose shall be pending before or threatened by the SEC; |
23
| | • | | no order, injunction or decree issued by any governmental authority of competent jurisdiction or other legal restraint or prohibition preventing consummation of the spin-off shall be in effect, and no other event outside the control of Sears Holdings shall have occurred or failed to occur that prevents the consummation of the spin-off; |
| | • | | no other events or developments shall have occurred prior to the spin-off that, in the sole judgment of the board of directors of Sears Holdings, would result in the spin-off having a material adverse effect on Sears Holdings or the shareholders of Sears Holdings; and |
| | • | | prior to the Spin-Off Date, an information statement shall have been mailed to the holders of Sears Holdings common stock as of the record date or access to such information statement shall have been provided through electronic means. |
Sears Holdings has advised us that the fulfillment of the foregoing conditions will not create any obligation on the part of Sears Holdings to effect the spin-off, and that Sears Holdings has the right not to complete the spin-off if, at any time, the board of directors of Sears Holdings determines, in its sole discretion, that the spin-off is not in the best interests of Sears Holdings or its stockholders, or that market conditions are such that it is not advisable to effect the spin-off. In addition, Sears Holdings may at any time decide to abandon the spin-off or modify or change the terms of the spin-off, including by, among other things, accelerating or delaying the timing of the consummation of all or part of the spin-off.
4.B. BUSINESS OVERVIEW
We are a multi-channel retailer and as of April 28, 2012, we operated a total of 122 Full-line Department stores, 371 specialty stores (including 48 Sears Home stores, 11 Outlet stores, four Appliances and Mattresses stores, 278 Hometown Dealer stores operated under independent local ownership and 30 Corbeil stores), 16 Floor Covering Centres, 1,597 catalogue merchandise pick-up locations, 105 Sears Travel offices and a nationwide home maintenance, repair, and installation network. We also publish an extensive general merchandise catalogue and offer shopping online at Sears.ca.
Our operations are centered around merchandising and include the sale of goods and services through our Retail Channel, which includes our Full-line, Sears Home, Hometown Dealer, Outlet, Appliances and Mattresses, and Corbeil Electrique Inc., or Corbeil, stores, and our Direct (catalogue/internet) Channel. Our operations also include service revenue related to product repair, home improvement and logistics. We also have commission revenues, which include insurance, and performance payments received from JPMorgan Chase under our long-term credit card marketing and servicing alliance with JPMorgan Chase. We have partnered with Thomas Cook Canada Inc., or Thomas Cook, in a multi-year licensing arrangement, under which Thomas Cook manages the day-to-day operations of all Sears Travel offices. Licensee fee revenues are comprised of payments received from licensees that operate within the Company’s stores. We are a party to a number of joint ventures which have been classified as jointly controlled entities for financial reporting purposes. These joint ventures are jointly controlled by the venturers who are entitled to a share of the joint ventures’ income or loss. See Item 4.C. “Information on the Company – Organizational Structure – Significant Subsidiaries” for additional information.
Retail Channel
Full-line Department stores – Our Full-line Department stores are located primarily in suburban enclosed shopping centers. The major merchandise categories include the following:
| | • | | Home & Hardlines – Major appliances, home furnishings and mattresses, home décor, lawn and garden, hardware, electronics and leisure, and seasonal products; and |
| | • | | Apparel & Accessories – Women’s, men’s and children’s apparel, nursery products, cosmetics, jewelry, footwear and accessories. |
Although merchandise varies by store, the merchandise sales mix between the two major categories is approximately 60% Home and Hardlines and 40% Apparel and Accessories.
24
Full-line Department stores also offer Sears Home Services and include a Sears catalogue merchandise pick-up location. Sears Travel offices and licensed businesses, such as optical centers and portrait studios, are also located in most of our Full-line Department stores.
Sears Home stores – Sears Home stores are typically located in power shopping centers (open mall shopping centers) and present an extensive selection of furniture, mattresses and box-springs, electronics and major appliances. The majority of these stores range in size from 35,000 to 60,000 square feet. Home Improvement Products and Services operations are located within 10 Sears Home stores. The showrooms provide a range of products and services sold under the Sears Home Services banner that are complementary to home furnishings and major appliances.
Hometown Dealer stores – Sears Hometown Dealer locations are independently operated and offer major appliances, furniture, home electronics, outdoor power equipment as well as catalogue merchandise pick-up. Most Hometown Dealer stores are located in markets that had previously been served by a catalogue agent and continue to lack the population to support a Full-line Department store.
Outlet stores – Sears Outlet stores offer clearance merchandise, particularly from the Company’s Direct channel, as well as surplus big-ticket items from all channels.
Appliances and Mattresses stores – The Sears Appliances and Mattresses stores are part of our strategy to bring our product categories to a growing number of customers who shop in conveniently located power centers. These stores are smaller in size (approximately 10,000 to 15,000 square feet) and feature a wide selection of major appliances, mattresses and box-springs, and include Sears private labels and a variety of national brands.
Sears Home Services – Sears Home Services was formed as a result of combining Home Improvement Products and Services and Product Repair Services. Sears Home Services is marketed through 90 Full-line Department stores, 21 Parts and Services stores and 13 Sears Home Services Showrooms located within Sears Home and Outlet stores, by telephone at 1-800-4-MY-HOME (English) or 1-800-LE-FOYER (French) and online at Sears.ca. Sears Home Services provides a broad range of home services, including the sale, installation, maintenance and repair of heating and cooling equipment, roofing, doors and windows, flooring, window coverings, energy audits, kitchen and bathroom renovations, carpet and upholstery cleaning and duct cleaning.
Corbeil – Corbeil is a chain of major appliance specialty stores located throughout Québec and Eastern Ontario. There are 30 stores in the chain, 19 of which are franchised. The chain also includes one liquidation center and one distribution center in Montreal. Stores average approximately 6,500 square feet in size.
Sears Floor Covering Centres – Sears Floor Covering Centres is a network of independently owned and operated retail outlets offering an assortment of broadloom and hard floor coverings.
Sears Travel – Sears Travel service operates within 108 Sears locations across Canada, an online travel service at www.searstravel.ca and 1-866-FLY-SEARS, which connects customers to the nearest geographical branch. Beginning on January 30, 2011, Thomas Cook managed the day-to-day operations of all Sears Travel offices and the Sears Travel website.
Cantrex – On April 29, 2012, we sold the operations of Cantrex, comprised of specified assets and liabilities totaling $3.5 million. Cantrex is one of the largest buying groups in Canada, representing 799 independent retailers with over 1,200 locations across Canada.
Direct Channel
Our Direct channel is comprised of our catalogue business, which is one of Canada’s largest general merchandise catalogue business, and Sears.ca, one of Canada’s leading online shopping destinations with over 79.2 million visits in Fiscal 2011, according to comScore’s December 2011 report and Omniture’s web report dated January 30, 2011 – January 28, 2012. With two distribution centers exclusively dedicated to servicing the Direct channel and 1,597 catalogue merchandise pick-up locations nationwide, Sears can deliver orders in most
25
areas of the country within 72 hours. Orders can be placed by telephone at 1-800-26-SEARS, by mail, fax, online at Sears.ca or in person through Sears stores and catalogue agents. As at April 28, 2012, 1,409 of the total 1,597 catalogue merchandise pick-up locations were independently operated under independent local ownership, with the remaining 188 units located within Sears Canada corporate stores.
Catalogue – In Fiscal 2011, 20 different catalogues were distributed throughout Canada reaching up to approximately 3.2 million households. In addition, during Fiscal 2011, Sears distributed 17 Specialogues designed to offer more seasonally relevant merchandise to specific customers.
Sears.ca – In Fiscal 2009, in an effort to further improve the online shopping experience, we launched the first phase of the new Sears.ca website with an increased selection of products and categories. Our website enables us to provide new and exciting merchandise offers direct to web and highlights our extensive general merchandise selection. In Fiscal 2011, we continued to invest in our online capabilities to improve the user experience and engage new customers and demographics.
Logistics
National Logistics Centres – We operate 6 logistics centers strategically located across the country. The total floor area of these logistics centers was 6.5 million square feet at the end of Fiscal 2011, of which 5.6 million square feet is devoted to warehouse and logistics operations. The remainder of the space is utilized for other Sears Canada operations, including call center services.
S.L.H. Transport Inc., or SLH – Our wholly-owned subsidiary, SLH, transports merchandise to stores, catalogue merchandise pick-up locations and directly to customers. SLH is responsible for providing logistics services for our merchandising operations by operating a fleet of tractors and trailers to provide carrier services for Sears and contract carrier services to commercial customers who are unrelated to Sears.
Loyalty Rewards Program
During Fiscal 2009, we, in conjunction with JPMorgan Chase, introduced modifications to the Sears Club Loyalty program, by simplifying the earn rates and redemption values to allow for more effective communication and promotion of the program. The redemption options for Sears Club Points were expanded to allow customers to instantly redeem for travel purchases through Sears Travel, allowing Canadians to earn travel rewards with a no fee credit card through the Sears MasterCard. Further enhancements and simplifications were introduced to allow customers to redeem more frequently and in smaller increments.
Pricing Strategy
Our pricing strategy is anchored to our Value Strategy, which offers everyday value with an active promotional program. Our Value Strategy focuses on solutions for the customer, from coordinating a particular look to providing easy-to-understand product benefits and features. This strategy is intended to increase the average transaction value and improve profitability.
We recently enhanced our value proposition by lowering the price on over 5,000 items including items in every store and in every department. This was announced on February 16, 2012 and was the first significant change customers saw as a result of the transformation being undertaken by the Company. We also introduced weekly specially-priced must-have “WOW” items concurrent with the price reductions.
In Fiscal 2010, the appreciation of the Canadian dollar versus the U.S. dollar encouraged cross-border shopping by Canadians in the U.S. We responded by increasing promotional and clearance activity and undertook various initiatives to mitigate the impacts of this challenging environment, including merchandise, customer financing and internet initiatives. One of these initiatives included expanding our price match guarantee and matching prices on most products in our retail stores with those available in U.S. retail stores. In addition, we improved our financing options by introducing no interest, no back-dated interest deferred or equal billing financing with respect to merchandise purchased with the Sears Card or Sears MasterCard.
26
Seasonality of Business
Our operations are seasonal in nature with respect to operating results and in products and services offered. Merchandise and service revenues, as well as performance payments received from JPMorgan Chase, will vary by quarter based upon consumer spending behavior. Historically, our revenues and earnings are higher in the fourth quarter than in any of the other three quarters due to the holiday season. We are able to adjust certain variable costs in response to seasonal revenue patterns; however, costs such as occupancy are fixed, causing us to report a disproportionate level of earnings in the fourth quarter. This business seasonality results in quarterly performance that is not necessarily indicative of annual performance.
In addition, we offer many seasonal goods and services. We set budgeted inventory levels and promotional activity to be in accord with our strategic initiatives and expected consumer demand. Businesses such as the Company that generate revenue from the sale of seasonal merchandise and services are subject to the risk of changes in consumer spending behavior as a result of unseasonable weather patterns.
Dependence on Intangible Property
We have a license from Sears Holdings to use the name “Sears” as part of our corporate name, as well as a license to use other brand names, such as Kenmore®, Craftsman®, and DieHard®. We rely on our right to use the “Sears” name, which we consider a significant and valuable aspect of our business. Our right to use the “Sears” name and certain other brand names was granted pursuant to a license agreement with Sears Holdings. Our license to use the “Sears” name and certain brand names may be terminated if Sears Holdings’ indirect ownership interest in us is reduced to less than 25%. In addition, our license to use the “Sears” name may also terminate upon the occurrence of certain bankruptcy events. Losing our right to use these intellectual properties could significantly diminish our competitiveness and could materially harm our business. If the license agreement is terminated, we would attempt to renegotiate the license agreement although the terms of any renegotiated license agreement would likely be less favorable to us.
We believe that one of our strengths is the recognition and reputation of our private brands and exclusive relationships with many non-proprietary national brands. Our private brands, which are available in Canada, include Jessica®, Nevada®, Whole Home®, Boulevard Club®, Tradition®, Protocol®, Retreat®, Alpinetek®, Pure NRG Athletics®, Trendzone®, Baby Boots®, Attitude®, and Distinction®. We also own a number of domain names which are used in our online business. We have established procedures to register and otherwise vigorously protect our intellectual property, including the protection of the Sears Holdings trademarks used by us in Canada. See Item 3.D. “Risk Factors – Risks Relating to our Relationship with Sears Holdings – We may lose rights to some intellectual property if Sears Holdings’ equity ownership in us falls below specified thresholds.”
Purchase of Merchandise
The sourcing and purchase of goods sold by us is conducted at our head office in Toronto, Ontario by the merchandise buying and corporate procurement teams. We purchase our merchandise from approximately 2,300 domestic and international suppliers, many of which have long-standing relationships with us. In particular, we purchase a significant amount of products that originate from China and other non-Canadian markets. We work closely with our suppliers in marketing, research, design and development, production standards and production planning. Although our business is not substantially dependent on any one supplier, our relationship with certain suppliers is of significance to our merchandising strategy, including attracting customers to our locations, cross segment sales and image.
For the majority of our merchandise purchased on a direct import basis, we utilize the international merchandise purchasing services of Sears Holdings. Sears Holdings may provide assistance to us with respect to monitoring and facilitating the production and inspection of imported goods, as well as the co-ordination of shipments and the payment to suppliers. See Item 7.B. “Related Party Transactions – Relationship with Sears Holdings”.
27
The majority of our merchandise bought on a direct import basis is purchased in U.S. dollars. As a result, exchange rate fluctuations between the Canadian and U.S. dollars may pose a risk to the our expected Canadian equivalent cost of U.S. dollars. In order to minimize the cost of our U.S. dollar requirements, we may use foreign currency forward or option contracts to hedge the exchange rate risk. See Item 3.D. “Risk Factors – Liquidity Risk – Fluctuations in U.S. and Canadian dollar exchange rates may affect our results of operation”.
Transformation Strategy
In Fiscal 2011, the Company embarked on a transformation strategy to be implemented over a three-year timeframe. There are five components of the strategy.
| | • | | Build the Core: Implementing fundamental merchandise category plans to seek to ensure that the right products and services are being offered in categories where the Company has a strong competitive position with Canadians, such as major appliances and mattresses. |
| | • | | Be Customer Driven: More fully and effectively utilizing our customer database to develop our merchandising and marketing strategies. |
| | • | | Get Value Right: Demonstrating a competitive value equation where our everyday price is more competitive, our promotions are well understood and balanced, our quality is superior and our service is dependable. |
| | • | | Operate Effective Formats: We are a multi-format retailer, operating in many different markets. We are working to align our category strengths with the market and to create more value from our trading strategies with retail concepts aligned to customer needs, including developing separate tactical approaches for our Full-line Department stores, Sears Home stores, Hometown Dealer stores, and Corbeil stores. |
| | • | | Organize the Right Talent and Create a Winning Attitude: Maintaining a strong leadership team supported by loyal and dedicated associates who are committed to the implementation of our transformation strategy. |
Many of the changes implemented during the early phases of the transformation in Fiscal 2011 were internal and addressed structure and personnel. The quarter ended April 28, 2012 was notable as it saw the first set of changes visible to the customer, including:
| | • | | execution of integrated marketing programs to support the key categories of major appliances and mattresses; |
| | • | | lowering of prices on over 5,000 products, offering competitive value every day on key items in addition to our promotional discount program; |
| | • | | introduction to our first “LOOK! report”, a high quality printed publication featuring the new apparel looks for the Spring Season; and |
| | • | | completion of a transaction for the early surrender and termination of the leases on three store locations in Vancouver, Calgary and Ottawa, and announcing plans to open the first Corbeil appliance store in the Greater Toronto Area. |
Legal Proceedings
We currently are involved in various legal proceedings incidental to the normal course of business. Although we are of the view that the final disposition of any such litigation is not expected to have a material adverse effect on our liquidity, consolidated financial position or results of operations, the outcome of such litigation cannot be predicted with certainty.
28
In the ordinary course of business, we are subject to ongoing audits by tax authorities. While we believe that our tax filing positions are appropriate and supportable, periodically, certain matters are reviewed and from time to time challenged by the tax authorities. As we routinely evaluate and provide for potentially unfavorable outcomes with respect to any tax audits, we believe that the final disposition of tax audits will not have a material adverse effect on our liquidity, consolidated financial position or results of operations. If the result of a tax audit materially differs from the existing provisions, our effective tax rate and our net earnings could be affected positively or negatively in the period in which the tax audits are completed.
Three class actions in the provinces of Québec, Saskatchewan and Ontario were commenced against us in 2005 arising out of our pricing of tires. The plaintiffs allege that we inflated the regular retail price of certain brands of tires sold by us in order to later claim that the same brands were on sale for up to 45% off the regular retail price so as to induce potential customers into believing that substantial savings were being offered. The plaintiffs seek general damages, special damages, and punitive damages, as well as costs and pre- and post-judgment interest. No dollar amounts are currently specified. The plaintiffs intend to proceed with the Québec action and seek certification as a class action on a national basis. We believe these claims are without merit, and intend to defend against them vigorously. In view of the uncertainty regarding the amount of damages, if any, that could be established, and in light of the plaintiffs not having stated an amount of damages they may seek in this matter, we do not believe a reasonable estimate of the possible range of loss related to this matter is currently possible. Therefore, we have not made a provision for any potential liability.
4.C. ORGANIZATIONAL STRUCTURE
Organizational Chart
The chart below represents a simplified summary of the key companies within our organizational structure immediately following the spin-off.
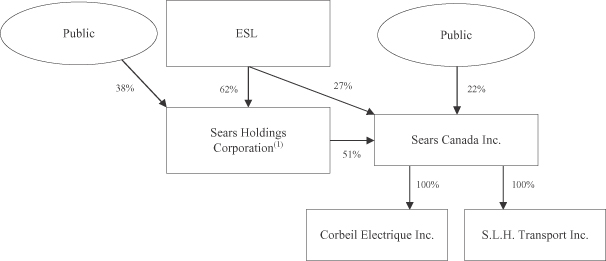
| (1) | Sears Holdings holds common shares of Sears Canada through its indirect, wholly owned subsidiaries, Sears Canada Holdings Corp. and SHLD Acquisition Corp. |
29
See Item 4.B. “Information on the Company – Business Overview” for additional information.
Sears Holdings and ESL
We are currently a majority owned indirect subsidiary of Sears Holdings. Sears Holdings is the beneficial holder of 97,341,670 or 95.5% of Sears Canada common shares as at July 6, 2012. The ultimate controlling party of the Company is ESL. ESL is the beneficial owner of 65,744,084 shares or approximately 62% of Sears Holdings common stock as disclosed in ESL’s Schedule 13D/A filed July 5, 2012. Immediately following completion of the spin-off, Sears Holdings will hold approximately 51% of Sears Canada’s common shares and ESL is expected to directly hold approximately 27% of Sears Canada’s common shares, and therefore ESL is expected to directly or indirectly control approximately 78% of our outstanding common shares and will have the ability to control the election of our board of directors and the outcome of certain other shareholder votes.
Significant Subsidiaries
None of our subsidiaries has total assets exceeding 10% of our consolidated assets, or sales and operating revenues in excess of 10% of our consolidated sales and operating revenues. In addition, our subsidiaries, when taken together, do not have assets exceeding 20% of our consolidated assets, or sales and operating revenues exceeding 20% of our consolidated sales and operating revenues.
We have a number of joint ventures, in partnership with Westcliff Group, Ivanhoe Cambridge Properties and T&T Properties. Our investments in our joint ventures include our share of income or losses from our joint venture interests in 12 shopping centers across Canada, most of which contain a Sears store. Joint venture investments range from 15% to 50% and are co-owned with major shopping center owners.
The table below sets out our joint venture entities and our ownership interest in each as at April 28, 2012.
| | | | | | | | |
Entity Name | | Properties | | Joint Venture Partner | | Ownership
Interest | |
Carrefour Richelieu Realties (St-Jérôme) | | Carrefour Richelieu | | Westcliff Group | | | 50 | % |
Carrefour Richelieu Realties (St-Jean) | | Carrefour de Nord | | Westcliff Group | | | 50 | % |
Carrefour Richelieu Realties (Carrefour Angrignon) | | Carrefour Angrignon | | Westcliff Group | | | 50 | % |
Carrefour Richelieu Realties (Place Angrignon) | | Place Angrignon | | Westcliff Group | | | 50 | % |
Carrefour Richelieu Realties (Pierre Caisse) | | Place Pierre Caisse | | Westcliff Group | | | 50 | % |
Carrefour Richelieu Realties (Drummondville) | | Promenades de Drummondville | | Westcliff Group | | | 50 | % |
Méga-Centre Drummondville | | Mega Centre Drummondville | | Westcliff Group | | | 50 | % |
Societe de Gestion des Nieges Ville Marie | | Various land holdings in Québec, Canada | | Westcliff Group | | | 50 | % |
133562 Canada Inc. | | Various land holdings in Québec, Canada | | Westcliff Group | | | 50 | % |
172098 Canada Inc. | | Drummondville Stripmall | | Westcliff Group | | | 50 | % |
Kildonan Place | | Kildonan Place | | Ivanhoe Cambridge | | | 20 | % |
Regionaux (Les Rivières Shopping Centre) | | Les Rivieres Shopping Centre | | Ivanhoe Cambridge | | | 15 | % |
Regionaux (Les Galeries de Hull) | | Les Galeries de Hull | | Ivanhoe Cambridge | | | 15 | % |
Medicine Hat Mall | | Medicine Hat Mall | | T&T Properties | | | 40 | % |
30
4.D. PROPERTY, PLANTS AND EQUIPMENT
Geographic Distribution and Square Footage of Store Locations
The following table shows the geographic distribution of our store locations as at the end of Q1 2012, and the total number of store locations as at the end of Q1 2012, Fiscal 2011 and Fiscal 2010.
| | | | | | | | | | | | | | | | | | | | | | | | | | | | | | | | |
Atlantic | | | Québec | | | Ontario | | | Prairies | | | Pacific | | | As at
April 28, 2012
Total | | | As at
January 28, 2012
Total | | | As at
January 29, 2011
Total | |
Full-line Department stores | | | 12 | | | | 27 | | | | 46 | | | | 22 | | | | 15 | | | | 122 | | | | 122 | | | | 122 | |
Sears Home stores | | | 2 | | | | 12 | | | | 19 | | | | 10 | | | | 5 | | | | 48 | | | | 48 | | | | 48 | |
Outlet stores | | | 1 | | | | 1 | | | | 6 | | | | 1 | | | | 2 | | | | 11 | | | | 11 | | | | 11 | |
Specialty type: Appliances and | | | | | | | | | | | | | | | | | | | | | | | | | | | | | | | | |
Mattresses stores | | | — | | | | — | | | | 3 | | | | 1 | | | | — | | | | 4 | | | | 4 | | | | 4 | |
Corporate stores | | | 15 | | | | 40 | | | | 74 | | | | 34 | | | | 22 | | | | 185 | | | | 185 | | | | 185 | |
Hometown Dealer stores | | | 53 | | | | 32 | | | | 67 | | | | 77 | | | | 49 | | | | 278 | | | | 285 | | | | 268 | |
Sears Home Services Showrooms | | | 1 | | | | 3 | | | | 6 | | | | 1 | | | | 2 | | | | 13 | | | | 13 | | | | 13 | |
Corbeil Franchise stores | | | — | | | | 17 | | | | 2 | | | | — | | | | — | | | | 19 | | | | 19 | | | | 19 | |
Corbeil Corporate stores | | | — | | | | 11 | | | | — | | | | — | | | | — | | | | 11 | | | | 11 | | | | 11 | |
Corbeil | | | — | | | | 28 | | | | 2 | | | | — | | | | — | | | | 30 | | | | 30 | | | | 30 | |
Sears Floor Covering Centres | | | — | | | | 3 | | | | 4 | | | | 5 | | | | 4 | | | | 16 | | | | 17 | | | | 20 | |
Cantrex | | | 72 | | | | 282 | | | | 183 | | | | 122 | | | | 132 | | | | 791 | | | | 799 | | | | 768 | |
Sears Travel offices | | | 7 | | | | 21 | | | | 45 | | | | 18 | | | | 14 | | | | 105 | | | | 108 | | | | 108 | |
Catalogue merchandise pick-up locations | | | 231 | | | | 370 | | | | 451 | | | | 391 | | | | 154 | | | | 1,597 | | | | 1,734 | | | | 1,822 | |
As at the end of Fiscal 2011 and Fiscal 2010, the gross square footage for corporate store locations was as follows:
| | | | | | | | |
| (square feet, millions) | | As at
January 28, 2012 | | | As at
January 29, 2011 | |
Full-line Department stores | | | 16.5 | | | | 16.5 | |
Sears Home stores | | | 2.1 | | | | 2.1 | |
Outlet stores | | | 0.8 | | | | 0.8 | |
Appliances and Mattresses stores | | | 0.1 | | | | 0.1 | |
Corbeil | | | 0.1 | | | | 0.1 | |
| | | | | | | | |
Total | | | 19.6 | | | | 19.6 | |
| | | | | | | | |
Investment Property
Investment property owned by the Company represents vacant land with no operating activity. As at January 28, 2012, the carrying value and fair value of investment property were $21.7 million and $23.2 million, respectively (January 29, 2011: $21.7 million and $21.7 million, January 31, 2010: $21.7 million and $21.7 million).
Distribution Facilities
We operate five distribution centers and one cross dock facility strategically located across the country. The total area of these facilities is approximately 6.3 million square feet.
All merchandise sold through the Corporate Store (Full-line, Sears Home, Hometown Dealer, Outlet, Appliances and Mattresses stores) and Direct Channels (Catalogue and Internet) are distributed from our five
31
distribution centers and one cross dock facility. Our distribution centers are located in Montreal, Québec, Vaughan and Belleville, Ontario, Regina, Saskatchewan and Calgary, Alberta and our cross dock facility is located in Port Coquitlam, British Columbia.
Our wholly-owned subsidiary, SLH, transports merchandise to stores, catalogue merchandise pick-up locations and direct to customers. SLH is responsible for providing logistics services for our merchandising operations by operating a fleet of tractors and trailers to provide carrier services for us and contract carrier services to commercial customers who are unrelated to us.
Leasing arrangements
As of April 28, 2012, we operated a total of 122 Full-line Department stores, 371 specialty stores (including 48 Sears Home stores, 11 Outlet stores, four Appliances and Mattresses stores, 278 Hometown Dealer stores operated under independent local ownership and 30 Corbeil stores), 16 Floor Covering Centres, 1,597 catalogue merchandise pick-up locations and 105 Sears Travel offices. Company-owned stores consist of 14 Full-line Department stores and two Sears Home stores, with the majority of the remainder held under long-term leases. While we are able to change our merchandise mix and relocate stores in order to maintain our competitiveness, we are restricted from vacating a current site without breaching our contractual obligations and incurring lease-related expenses for the remaining portion of the lease-term. The long-term nature of the leases limits our ability to respond in a timely manner to changes in the demographic or retail environment at any location.
Finance lease arrangements
As at January 28, 2012, we had finance lease arrangements related to the building and equipment components of certain leased properties, which include retail, office and warehouse locations. The related land components of these properties have been separately classified as operating leases. The buildings and equipment held under finance leases are used in the normal course of operations and do not contain significant unusual or contingent lease terms or restrictions. Building leases typically run for a period of one to 10 years, with some leases providing an option to renew after that date. Equipment leases typically run for a period of one to five years, with some leases providing an option to renew after that date. The net carrying value of these assets at January 28, 2012 was $28.0 million (January 29, 2011: $31.0 million, January 31, 2010: $31.5 million).
As at January 28, 2012, the corresponding finance lease obligations, current and non-current, were $5.1 million (January 29, 2011: $4.7 million, January 31, 2010: $5.4 million) and $24.5 million (January 29, 2011: $27.0 million, January 31, 2010: $26.1 million), included in the Consolidated Statements of Financial Position under “Principal payments on long-term obligations due within one year” and “Long-term obligations,” respectively (see Note 17).
The table below presents the future minimum lease payments of our finance lease obligations:
| | | | | | | | | | | | | | | | | | | | | | | | | | | | | | | | | | | | |
| | | As at
January 28, 2012 | | | As at
January 29, 2011 | | | As at
January 31, 2010 | |
(in CAD millions) | | Finance
lease
payments | | | Future
finance
costs | | | Present value of
minimum lease
payments | | | Finance
lease
payments | | | Future
finance
costs | | | Present value of
minimum lease
payments | | | Finance
lease
payments | | | Future
finance
costs | | | Present value of
minimum lease
payments | |
Within 1 year | | $ | 7.0 | | | $ | 1.9 | | | $ | 5.1 | | | $ | 6.7 | | | $ | 2.0 | | | $ | 4.7 | | | $ | 7.7 | | | $ | 2.3 | | | $ | 5.4 | |
2 years | | | 6.0 | | | | 1.5 | | | | 4.5 | | | | 5.9 | | | | 1.7 | | | | 4.2 | | | | 6.0 | | | | 1.7 | | | | 4.3 | |
3 years | | | 4.8 | | | | 1.2 | | | | 3.6 | | | | 4.9 | | | | 1.5 | | | | 3.4 | | | | 5.2 | | | | 1.4 | | | | 3.8 | |
4 years | | | 3.3 | | | | 1.1 | | | | 2.2 | | | | 4.2 | | | | 1.3 | | | | 2.9 | | | | 4.2 | | | | 1.2 | | | | 3.0 | |
5 years | | | 3.1 | | | | 0.9 | | | | 2.2 | | | | 4.2 | | | | 1.0 | | | | 3.2 | | | | 4.2 | | | | 1.0 | | | | 3.2 | |
Thereafter | | | 14.2 | | | | 2.2 | | | | 12.0 | | | | 16.5 | | | | 3.2 | | | | 13.3 | | | | 15.2 | | | | 3.4 | | | | 11.8 | |
| | | | | | | | | | | | | | | | | | | | | | | | | | | | | | | | | | | | |
Total minimum payments | | $ | 38.4 | | | $ | 8.8 | | | $ | 29.6 | | | $ | 42.4 | | | $ | 10.7 | | | $ | 31.7 | | | $ | 42.5 | | | $ | 11.0 | | | $ | 31.5 | |
| | | | | | | | | | | | | | | | | | | | | | | | | | | | | | | | | | | | |
32
Interest on finance lease obligations is recognized immediately in “Finance costs” in the Consolidated Statements of Net (Loss) Earnings and Comprehensive (Loss) Income (see Note 17 of the Notes to the Audited Consolidated Financial Statements). Included in total “Finance Costs” in Fiscal 2011, was $2.2 million (2010: $2.3 million) of interest related to finance lease obligations.
Operating lease arrangements
As at January 28, 2012, the Company had operating lease arrangements related to leased retail and office properties as well as equipment assets. The leases typically run for a period of one to 10 years, with some leases providing an option to renew after that date. Some leases include additional or contingent rent payments that are based on sales and step rent payments which are recognized on a straight-line basis over the term of the lease. During Fiscal 2011, contingent rent recognized as an expense in respect of operating leases totaled $0.9 million (2010: $1.0 million). Rental expense for all operating leases totaled $103.4 million in Fiscal 2011 (2010: $106.1 million). These expenses are included in “Selling, administrative and other expenses” in the Consolidated Statements of Net (Loss) Earnings and Comprehensive (Loss) Income.
The table below presents the contractual maturities of future minimum lease payments for the Company’s operating leases:
| | | | | | | | | | | | |
(in CAD millions) | | As at
January 28, 2012 | | | As at
January 29, 2011 | | | As at
January 31, 2010 | |
Within 1 year | | $ | 102.7 | | | $ | 100.7 | | | $ | 100.1 | |
2 years | | | 86.2 | | | | 93.9 | | | | 91.4 | |
3 years | | | 66.8 | | | | 76.0 | | | | 82.4 | |
4 years | | | 55.9 | | | | 62.4 | | | | 67.9 | |
5 years | | | 42.1 | | | | 50.8 | | | | 54.8 | |
Thereafter | | | 156.4 | | | | 187.6 | | | | 214.9 | |
| | | | | | | | | | | | |
Total operating lease obligations 1 | | $ | 510.1 | | | $ | 571.4 | | | $ | 611.5 | |
| | | | | | | | | | | | |
| 1 | Operating lease obligations are not reported in the Consolidated Statements of Financial Position |
Environmental Concerns
We are exposed to environmental risk as an owner, lessor and lessee of property. Under Canadian federal and provincial laws, the owner, lessor or lessee could be liable for the costs of removal and remediation of certain hazardous substances on its properties or disposed of at other locations. The failure to remove or remediate such substances, if any, could lead to claims against us.
We are currently remediating various locations across Canada where we operated auto centers, gas bars and a logistics facility. The extent of the remediation and the costs thereof have not yet been determined. We continue to monitor the costs of remediation and appropriately provide for these costs in our reserves.
If we commit to renovating a leased or owned building that contains or may contain asbestos, or if asbestos is inadvertently disturbed, we are legally obligated to comply with asbestos removal standards. The extent of this liability has not yet been determined because the costs to remove asbestos depend upon factors including the location and extent of any renovations undertaken. Inadvertent disturbance of asbestos cannot be foreseen. The costs incurred by us could be significant and may negatively impact our results of operations and financial condition.
See Item 4.B. “Information on the Company – Business Overview” and Item 4.C. “Information on the Company – Organizational Structure – Significant Subsidiaries”.
33
ITEM 4A. UNRESOLVED STAFF COMMENTS
Not applicable.
ITEM 5. OPERATING AND FINANCIAL REVIEW AND PROSPECTS
5.A. OPERATING RESULTS
Introduction
The discussion herein, or MD&A, contains commentary from the Company’s management regarding strategy, operating results and financial position. Management is responsible for its accuracy, integrity and objectivity, and develops, maintains and supports the necessary systems and controls to provide reasonable assurance as to the accuracy of the comments contained herein. In addition to historical information, this MD&A contains forward-looking statements. Readers are cautioned that these forward-looking statements are subject to risks and uncertainties that could cause actual results to differ materially from those reflected in the forward-looking statements. See the section entitled “Special Note Regarding Forward-Looking Statements” at the beginning of this Form 20-F and Item 3.D. “Key Information – Risk Factors”. All dollar references, unless otherwise stated, are in millions of Canadian dollars. See “Introduction and Use of Certain Terms – Exchange Rate Table”.
The Company’s operations are focused on merchandising and include the sale of goods and services through the Company’s Retail channel, which includes its Full-line, Sears Home, Hometown Dealer, Outlet, Appliances and Mattresses, Corbeil stores, and its Direct (catalogue/internet) channel. It also includes service revenue related to product repair and home improvement. Commission revenues include travel, insurance, and performance payments received from JPMorgan Chase under the Company’s long-term credit card marketing and servicing alliance with JPMorgan Chase. The Company has partnered with Thomas Cook in a multi-year licensing arrangement, under which Thomas Cook manages the day-to-day operations of all Sears Travel offices. Licensee fee revenues are comprised of payments received from licensees that operate within the Company’s stores. The Company is a party to a number of joint ventures co-owning shopping centers with Westcliff Group, Ivanhoe Cambridge Properties and T&T Properties and various other shopping center owners, which have been classified as jointly controlled entities for financial reporting purposes. These joint ventures are jointly controlled by the venturers who are entitled to a share of the joint ventures’ income or loss.
Basis of Presentation
The principal accounting policies of the Company have been applied consistently in the preparation of its consolidated financial statements for all periods presented, including the fiscal 2010 opening Consolidated Statement of Financial Position as at January 31, 2010, except for certain exemptions and exceptions as allowed under IFRS 1, First-time Adoption of International Financial Reporting Standards, of IFRS 1. A detailed explanation of how the transition to IFRS has affected the reported financial position, results of operations and cash flow of the Company is provided in Note 32 “IFRS 1 – First time adoption of IFRS” of the Notes to the 2011 Annual Consolidated Financial Statements. This note includes reconciliations of the Consolidated Statements of Financial Position, equity and comprehensive income for comparative periods under Canadian GAAP to those reported under IFRS.
The Company’s significant accounting policies are detailed in Note 2 “Significant accounting policies” of the Notes to the 2011 Annual Consolidated Financial Statements. The impact of transition to IFRS on the Company’s opening Fiscal 2010 and opening Fiscal 2011 statements of financial position, and the impact on the Company’s results of operations and cash flow for the 52-weeks ended January 29, 2011, are described and reconciled in Note 32 “IFRS 1 – First time adoption of IFRS”. The optional exemptions and mandatory exceptions of IFRS 1 applied by the Company at transition are also described in Note 32 “IFRS 1 – First time adoption of IFRS”. The fiscal year of the Company consists of a 52- or 53-week period ending on the Saturday closest to January 31. The fiscal years for the 2011 and 2010 consolidated financial statements presented in this MD&A represent the 52-week periods ended January 28, 2012, or Fiscal 2011, and January 29, 2011, or
34
Fiscal 2010, respectively. Figures relating to the opening Consolidated Statement of Financial Position in this Form 20-F represent balances as at January 31, 2010. The Company’s consolidated financial statements are presented in Canadian dollars, which is the Company’s functional currency. The conversion to IFRS excluding the effects of the early adoption of International Accounting Standards, or IAS, 19(R) has resulted in an increase to equity of $558.9 million on the opening Statement of Financial Position for Fiscal 2011, as well as a $34.6 million decrease to net earnings for Fiscal 2010. This change is offset with the impact of the early adoption of IAS 19(R), which has resulted in a decrease to equity of $246.2 million on the opening Statement of Financial Position as at January 31, 2010, and an increase to Fiscal 2010 net earnings of $9.8 million, due to the reduction in the retirement benefit plans expense. The Company operates as one business segment, with operations focused on the merchandising of products and services.
IFRS 1 optional exemptions and mandatory exceptions
IFRS 1 optional exemptions allow companies to elect non-retrospective or other treatments at transition where retrospective application is deemed to be overly burdensome or impracticable. The voluntary exemptions which were elected by the Company at transition are as follows:
Fair value or revaluation as deemed cost:
An entity may elect to revalue its property, plant and equipment at fair value at the transition date and use this fair value as the deemed transition cost. On transition, the Company elected to measure certain of its land and buildings, investment property and finance lease buildings at fair value and set the fair value as the deemed cost. The election resulted in a material increase in the net carrying value of property, plant and equipment and retained earnings on the transition date of January 31, 2010, with a corresponding increase in depreciation expense for the 52-week periods ended January 29, 2011 and January 28, 2012. Had this election not been taken, the net carrying value of property plant and equipment and retained earnings would be materially lower on the transition date of January 31, 2010, with a significantly lower depreciation expense for the 52-week periods ended January 29, 2011 and January 28, 2012.
Business combinations:
An exemption is available within IFRS 1 that allows an entity to carry forward its previous GAAP accounting for business combinations prior to the transition date. The Company has elected to not apply IFRS 3 – Business Combinations retrospectively to business combinations that occurred before the transition date. No change has been made to the recognition and measurement of business combinations that occurred prior to this date.
Borrowing costs:
IAS 23 – Borrowing Costs, or IAS 23 requires capitalization of borrowing costs that are directly attributable to, and an allocation of borrowing costs on general debt that relate to, the acquisition, construction or redevelopment of an asset that takes a substantial period of time to prepare for its intended use. IAS 23 requires retrospective application.
IFRS 1 allows an entity to adopt IAS 23 prospectively to projects for which the capitalization commencement date is after January 30, 2010, or it may elect any date earlier than January 31, 2010 for transition. The Company has elected to apply IAS 23 prospectively to the acquisition, construction or redevelopment of assets that occurred on or after the transition date.
Share-based payment transactions:
IFRS 2 – Share-based payment, or IFRS 2, is applied to all grants of shares, options or other equity instruments made after November 7, 2002. Similarly, IFRS 2 applies to all liabilities arising from share-based (unit-based) payment transactions that exist at the later of the date of transition to IFRS and January 1, 2005.
35
IFRS 1 allows first-time adopters to exclude application of IFRS 2 to equity instruments that were granted prior to November 7, 2002. It also allows the first-time adopter to not apply IFRS 2 to equity instruments granted after November 7, 2002 that had vested before transition to IFRS. Finally, it allows first-time adopters to exclude the application of IFRS 2 to liabilities settled before the transition date. The Company has elected these exemptions on the transition date.
Arrangements containing leases:
IFRS 1 allows entities to determine whether an arrangement contains a lease in accordance with International Financial Reporting Interpretations Committee 4 – Determining whether an Arrangement contains a Lease based on the facts and circumstances at the transition date rather than at the lease inception date. On transition, the Company has elected not to reapply the criteria for determining whether an arrangement contains a lease on the date of transition, given the same determination was made in accordance with Canadian GAAP in 2004.
IFRS 1 also provides certain mandatory exceptions to the retrospective application requirement. The general premise of IFRS 1 mandatory exceptions is to prevent companies from using hindsight in adopting IFRS’s retrospectively. The mandatory exceptions applicable to the Company are as follows:
Estimates:
Estimates made in accordance with IFRS at the transition date remained consistent with those determined under Canadian GAAP, except where they were impacted by a difference in accounting policy.
Hedge accounting:
Hedging relationships recognized under Canadian GAAP must be discontinued unless the entity had documented IFRS compliant hedging documentation prior to February 1, 2010 in which case hedge accounting may continue in accordance with IAS 39. The Company’s hedge transactions continue to be effective hedges under IFRS.
Derecognition of financial assets and liabilities:
Financial assets and liabilities derecognized before January 31, 2010 are not re-recognized under IFRS. Management did not choose to apply the International Accounting Standards, or IAS, 39 derecognition criteria to an earlier date. The application of this exemption has no impact to the Company.
Recast Due to Adoption of IAS 19(R)
The Company has elected to early adopt the amendments to IAS 19 beginning January 29, 2012, with retrospective application to prior reporting periods. See Note 2.26 “IAS 19 (Revised), Employee Benefits”, in the Notes to the 2011 Annual Consolidated Financial Statements for further detail on the accounting policy.
Use of Non-IFRS Measures, Measures of Operating Performance and Reconciliation of Net Earnings (Loss) to Adjusted EBITDA
The Company’s consolidated financial statements are prepared in accordance with IFRS. Management uses IFRS, non-IFRS and operating performance measures as key performance indicators to better assess the Company’s underlying performance and provides this additional information in this Form 20-F so that readers may do the same. Non-IFRS measures used in this Form 20-F are reconciled to or calculated from such financial information.
36
Same store sales is a measure of operating performance used by management, the retail industry and investors to compare retail operations, excluding the impact of store openings and closures. Same store sales represents merchandise sales generated through operations in the Company’s Full-line, Sears Home, Hometown Dealer and Corbeil stores, as well as Catalogue desks in Full-line, Sears Home and Outlet stores, that were continuously open during both of the periods being compared. More specifically, the same store sales metric compares the same calendar weeks for each period and represents the 13 and 52-week periods ended April 28, 2012, January 28, 2012 and January 29, 2011. The calculation of same store sales is a performance metric and may be impacted by store space expansion and contraction.
Operating net earnings before interest, taxes, depreciation and amortization, or Adjusted EBITDA, is a non-IFRS measure and excludes finance costs, interest income, share of income or loss from joint ventures, income tax expense or recovery, depreciation and amortization and income or expenses of a non-recurring, unusual or one-time nature. Adjusted EBITDA is a measure used by management, the retail industry and investors as an indicator of the Company’s operating performance, ability to incur and service debt, and as a valuation metric. Our management uses Adjusted EBITDA to evaluate the operating performance of our business as well as executive compensation metrics. While Adjusted EBITDA is a non-IFRS measurement, management believes that it is an important indicator of operating performance because it excludes the effect of financing and investing activities by eliminating the effects of interest and depreciation and removes the impact of certain non-recurring items that are not indicative of our ongoing operating performance. Therefore management believes Adjusted EBITDA gives investors greater transparency in assessing our results of operations.
These measures do not have any standardized meaning prescribed by IFRS and therefore may not be comparable to similar measures presented by other reporting issuers. Adjusted EBITDA should not be considered in isolation or as an alternative to measures prepared in accordance with IFRS.
A reconciliation of the Company’s net earnings (loss) to Adjusted EBITDA is outlined in the following table:
| | | | | | | | | | | | | | | | |
| | | First Quarter | | | Fiscal | |
(in $ millions, except per share amounts) | | 2012 | | | 2011
(recast **) | | | 2011
(recast **) | | | 2010
(recast **) | |
Net earnings (loss) | | $ | 93.1 | | | $ | (47.0 | ) | | $ | (50.3 | ) | | $ | 125.0 | |
| | | | | | | | | | | | | | | | |
Gain on lease terminations | | | (164.3 | ) | | | — | | | | — | | | | — | |
Transformation expense * | | | — | | | | — | | | | 60.0 | | | | — | |
Depreciation and amortization expense | | | 28.7 | | | | 28.6 | | | | 114.9 | | | | 123.6 | |
Finance costs | | | 4.0 | | | | 6.8 | | | | 16.0 | | | | 16.6 | |
Interest income | | | (0.5 | ) | | | (0.6 | ) | | | (1.7 | ) | | | (4.2 | ) |
Share of income from joint ventures | | | (3.5 | ) | | | (1.9 | ) | | | (8.3 | ) | | | (3.2 | ) |
Income tax expense (recovery) | | | 12.4 | | | | (8.2 | ) | | | (6.6 | ) | | | 62.1 | |
Unusual gains *** | | | — | | | | — | | | | — | | | | (13.4 | ) |
| | | | | | | | | | | | | | | | |
Adjusted EBITDA | | $ | (30.1 | ) | | | (22.3 | ) | | | 124.0 | | | | 306.5 | |
| | | | | | | | | | | | | | | | |
Basic net earnings (loss) per share | | $ | 0.91 | | | $ | (0.45 | ) | | $ | (0.48 | ) | | $ | 1.16 | |
| | | | | | | | | | | | | | | | |
| * | Transformation expense includes costs related to internal reorganization and the disposition of excess inventory. |
| ** | Recast to reflect changes resulting from the retrospective application of the change in accounting policy related to the early adoption of the amendments to accounting standard “IAS 19 (Revised), Employee Benefits”. |
| *** | Unusual gains in Fiscal 2010 represents the gain on sale of real estate property. |
37
Business Overview
The Company’s key resources and capabilities include its associates, brand equity, specialized services, national presence and logistics. The Company’s ability to raise funds and working capital to support its operations is also a key capability. See “Item 5.B.– Liquidity and Capital Resources”.
There is seasonal variability in the Company’s financial performance and in the products and services we offer. Accordingly, merchandise and service revenue, as well as performance payments received from JPMorgan Chase, referred to as commission revenue, will vary by quarter based upon consumer spending behavior. Historically, the Company’s revenue and earnings are higher in the fourth quarter than in any of the other three quarters due to the holiday season. The Company is able to adjust certain variable costs in response to seasonal revenue patterns; however, costs such as occupancy are fixed, causing the Company to report a disproportionate level of earnings in the fourth quarter. This business seasonality results in quarterly performance that is not necessarily indicative of annual performance.
In addition, the Company offers many seasonal goods and services. The Company sets budgeted inventory levels and promotional activity to be in accord with its strategic initiatives and expected consumer demand. Businesses that generate revenue from the sale of seasonal merchandise and services are subject to the risk of changes in consumer spending behavior as a result of unseasonable weather patterns.
Other factors that affect the Company’s sales and results of operations include actions by its competitors, timing of its promotional events, and changes in population and other demographics. Accordingly, the Company’s results for any one fiscal quarter are not necessarily indicative of the results to be expected for any other quarter, or the full year, and comparable store sales for any particular period may increase or decrease.
The table below outlines select financial data for Q1 2012, and our 2011 and 2010 fiscal quarters. The quarterly results are unaudited.
| | | | | | | | | | | | | | | | | | | | | | | | | | | | | | | | |
| | | First Quarter (recast *) | | | Second Quarter (recast *) | | | Third Quarter (recast *) | | | Fourth Quarter (recast *) | |
(in CAD millions, except per share amounts) | | 2012 | | | 2011) | | | 2011 | | | 2010 | | | 2011 | | | 2010 | | | 2011 | | | 2010 | |
Total revenue | | $ | 915.1 | | | $ | 992.5 | | | $ | 1,147.7 | | | $ | 1,212.3 | | | $ | 1,113.2 | | | $ | 1,198.6 | | | $ | 1,365.9 | | | $ | 1,459.4 | |
Net earnings (loss) | | $ | 93.1 | | | $ | (47.0 | ) | | $ | (0.3 | ) | | $ | 23.0 | | | $ | (44.1 | ) | | $ | 23.3 | | | $ | 41.1 | | | $ | 85.2 | |
Basic net earnings (loss) per share | | $ | 0.91 | | | $ | (0.45 | ) | | $ | — | | | $ | 0.21 | | | $ | (0.42 | ) | | $ | 0.21 | | | $ | 0.39 | | | $ | 0.79 | |
Diluted net earnings (loss) per share | | $ | 0.91 | | | $ | (0.45 | ) | | $ | — | | | $ | 0.21 | | | $ | (0.42 | ) | | $ | 0.21 | | | $ | 0.39 | | | $ | 0.79 | |
| * | Recast to reflect changes resulting from the retrospective application of the change in accounting policy related to the early adoption of the amendments to accounting standard “IAS 19 (Revised), Employee Benefits”. |
38
Financial Highlights and Overall Performance
Operating Results for Fiscal 2011
| | | | | | | | | | | | |
| | | Fiscal | |
(in CAD millions) | | 2011
(recast *) | | | % Chg 2011
vs 2010 | | | 2010
(recast *) | |
Revenue | | $ | 4,619.3 | | | | (6.5 | %) | | $ | 4,938.5 | |
Cost of goods and services sold | | | 2,932.3 | | | | (2.2 | %) | | | 2,997.7 | |
Selling, administrative and other expenses | | | 1,737.9 | | | | (0.4 | %) | | | 1,744.5 | |
| | | | | | | | | | | | |
Operating (loss) earnings | | | (50.9 | ) | | | (125.9 | %) | | | 196.3 | |
| | | | | | | | | | | | |
Finance costs | | | 16.0 | | | | (3.6 | %) | | | 16.6 | |
Interest income | | | 1.7 | | | | (59.5 | %) | | | 4.2 | |
Share of income from joint ventures | | | 8.3 | | | | 159.4 | % | | | 3.2 | |
| | | | | | | | | | | | |
(Loss) earnings before income taxes | | | (56.9 | ) | | | (130.4 | %) | | | 187.1 | |
| | | | | | | | | | | | |
Income tax (recovery) expense | | | (6.6 | ) | | | (110.6 | %) | | | 62.1 | |
| | | | | | | | | | | | |
Net (loss) earnings | | $ | (50.3 | ) | | | (140.2 | %) | | $ | 125.0 | |
| | | | | | | | | | | | |
| * | Recast to reflect changes resulting from the retrospective application of the change in accounting policy related to the early adoption of the amendments to accounting standard “IAS 19 (Revised), Employee Benefits”. |
Total revenue in Fiscal 2011 declined 6.5% or $319.2 million to $4,619.3 million compared to $4,938.5 million during the same period in Fiscal 2010. Same store sales decreased by 7.5% in Fiscal 2011 compared to Fiscal 2010. The decrease is primarily attributable to sales declines in the Home & Hardlines group, with industry-wide price compression, which is primarily due to the effect of both lower retail prices paid by the customer as a result of competitive pressure from other retailers lowering their prices, as well as the compression of prices within categories between the high-end and the lower-end of product quality, and aggressive competition affecting sales in major appliances, which experienced lower average selling prices. Electronics experienced lower average selling prices, primarily in televisions, and home décor products declined as well, partially attributable to lower active inventory. Revenue in the Apparel and Accessories group also experienced declines, primarily in women’s and men’s wear, with sales declines primarily attributable to weak performance of private brands.
The Company has achieved improved results in the annual sales of Craftsman® private brand products, which were partially offset by the declines in the Home & Hardlines group, due to the offering of innovative tractors utilizing Turn Tight™ technology and EZ Steer™ power steering snowblowers, the re-setting of the pricing strategy and a strong integrated marketing campaign across various mass media.
Cost of goods and services sold was $2,932.3 million in Fiscal 2011 compared to $2,997.7 million in Fiscal 2010, a 2.2% decrease year-over-year. This decrease is primarily attributable to lower sales volumes.
The Company’s gross profit rate was 36.5% for Fiscal 2011 compared to 39.3% in Fiscal 2010. The 280 basis point decline is due mainly to price compression in major appliances, home décor, electronics, and increased promotional activity in women’s and men’s wear. The Company continues to undertake various initiatives to mitigate margin compression, including the five components of the transformation strategy described in Item 4.B. “Business Overview” as well as a reduction in the level of promotional discounting and the reduction of unprofitable merchandise categories. As at the end of Fiscal 2011, there had not been a material dollar impact from these initiatives.
39
Selling, administrative and other expenses, including depreciation and amortization expense was $1,737.9 million in Fiscal 2011 and $1,744.5 million in Fiscal 2010. The decrease of $6.6 million or 0.4% in expense is primarily driven by cost containment measures with reduced spending in advertising and marketing initiatives due primarily to a reduction in catalogue pages and outsourcing costs, due in part to reduced retail support center costs, higher costs in the prior period due to the labor disruption at one of our distribution facilities, and savings from sales volume reductions. Merchant commissions in our catalogue business were down due to reductions in sales volume, and rent and equipment rental costs were lower due to cost savings initiatives. These cost containment measures were offset by a one-time transformation expense of $60.0 million, related primarily to the planned disposition of excess inventory and internal restructuring costs.
Depreciation and amortization expense was $114.9 million in Fiscal 2011 and $123.6 million in Fiscal 2010. The decrease in expense is predominantly due to an increase in the estimated useful lives of property, plant and equipment.
Finance costs in Fiscal 2011 decreased by $0.6 million to $16.0 million compared to $16.6 million during Fiscal 2010 due to lower interest expense related to long-term debt as a result of the Company’s repayment of its unsecured medium-term notes in Fiscal 2010 ($200.0 million in the second quarter of 2010 and $100.0 million in the third quarter of 2010), offset by interest on accruals for uncertain tax positions of $5.2 million and interest of $1.5 million on a sales tax assessment in Fiscal 2011.
Interest income decreased by $2.5 million or 59.5% to $1.7 million in Fiscal 2011 compared to $4.2 million in Fiscal 2010 primarily due to $1.2 million in interest income received in Fiscal 2010 on a $400.0 million promissory note issued by Sears Holdings in the third quarter of Fiscal 2010 and lower levels of cash and cash equivalents in Fiscal 2011.
Share of income from joint ventures in Fiscal 2011 increased by $5.1 million to $8.3 million compared to $3.2 million for Fiscal 2010. The increase is predominantly due to lower depreciation expense arising from an increase in the estimated useful lives of property, plant and equipment, and lower interest expense due to lower outstanding debt balance, offset by a gain of $2.8 million on the sale of the joint venture in the third quarter of Fiscal 2010.
Income tax recovery was $6.6 million for Fiscal 2011 compared to an income tax expense of $62.1 million in Fiscal 2010. The year-over-year change was primarily attributable to the loss before income taxes of $56.9 million in Fiscal 2011 compared to earnings before income taxes of $187.1 million in Fiscal 2010.
Adjusted EBITDA for Fiscal 2011 was $124.0 million compared to $306.5 million in Fiscal 2010, a decrease of $182.5 million. See “Use of Non-IFRS Measures, Measures of Operating Performance and Reconciliation of Net Earnings (Loss) to Adjusted EBITDA” above for a discussion of non-IFRS measures.
40
Operating Results for Q1 2012
| | | | | | | | | | | | |
| | | First Quarter | |
(in CAD millions) | | 2012 | | | % Chg 2012
vs 2011 | | | 2011
(recast) * | |
Revenue | | $ | 915.1 | | | | (7.8 | %) | | $ | 992.5 | |
Cost of goods and services sold | | | 580.4 | | | | (7.2 | %) | | | 625.4 | |
Selling, administrative and other expenses | | | 393.5 | | | | (5.9 | %) | | | 418.0 | |
| | | | | | | | | | | | |
Operating loss | | | (58.8 | ) | | | (15.5 | %) | | | (50.9 | ) |
| | | | | | | | | | | | |
Gain on lease terminations | | | 164.3 | | | | — | | | | — | |
Finance costs | | | 4.0 | | | | (41.2 | %) | | | 6.8 | |
Interest income | | | 0.5 | | | | (16.7 | %) | | | 0.6 | |
Share of income from joint ventures | | | 3.5 | | | | 84.2 | % | | | 1.9 | |
| | | | | | | | | | | | |
Earnings (loss) before income taxes | | | 105.5 | | | | 291.1 | % | | | (55.2 | ) |
| | | | | | | | | | | | |
Income tax (expense) recovery | | | (12.4 | ) | | | (251.2 | %) | | | 8.2 | |
| | | | | | | | | | | | |
Net earnings (loss) | | $ | 93.1 | | | | (298.1 | %) | | $ | (47.0 | ) |
| | | | | | | | | | | | |
| * | Recast to reflect changes resulting from the retrospective application of the change in accounting policy related to the early adoption of the amendments to accounting standard “IAS 19 (Revised), Employee Benefits”. |
Total revenue in Q1 2012 decreased by 7.8% to $915.1 million compared to $992.5 million in Q1 2011, with same store sales declines of 6.3% in Q1 2012, a 2.9% improvement compared to same store declines of 9.2% in Q1 2011. Revenue in the Apparel & Accessories group experienced declines in several categories. Women’s wear and Men’s wear revenue decreased, due primarily to lower sales of promotional and clearance items and lower performance of private brands. Revenue was also negatively impacted by the reductions in catalogue pages. Children’s wear sales were lower due to a decrease in juvenile and infant products as the Company was in the process of transitioning to new product assortments in those categories.
The revenue decline in the Home & Hardlines group was primarily driven by reduced sales in several categories, with declines in home décor, electronics, fitness & recreation and hardware. The major appliances and mattresses categories, which were aggressively marketed, experienced improved revenues in the quarter, growing due to successful new promotional activities focused on those areas.
The Company experienced increased weekday sales and total regular-priced sales compared to Q1 2011 due to the lowering of over 5,000 prices in the quarter. These improvements did not sufficiently offset the total revenue decline which was impacted by the following factors:
| | • | | The reduction of merchandise offerings in non-strategic categories; |
| | • | | Lower sales of clearance merchandise, the result of less inventory and reduced promotional activity on clearance merchandise; and |
| | • | | The reduction in catalogues distributed. |
Cost of goods and services sold was $580.4 million in Q1 2012 compared to $625.4 million in Q1 2011, a 7.2% decrease quarter-over-quarter. This decrease is primarily attributable to lower sales volumes.
The Company’s gross profit rate was 36.6% in Q1 2012 compared to 37.0% in Q1 2011. The 40 basis point decline is due mainly to margin declines in Apparel & Accessories.
Selling, administrative and other expenses including depreciation and amortization expense was $393.5 million in Q1 2012 and $418.0 million in Q1 2011. The decrease in expense was primarily driven by cost
41
containment measures with reduced spending in advertising and marketing related primarily to the reduction of catalogue pages, outsourcing costs and payroll and benefits expenses. Depreciation and amortization expense in Q1 2012 was comparable to Q1 2011.
On March 2, 2012, the Company entered into an agreement to surrender and terminate early the leases on three properties. On the closing date, April 20, 2012, the Company received cash proceeds of $170.0 million for surrender of the three leases, resulting in a pre-tax gain of $164.3 million for the 13-week period ended April 28, 2012, net of transaction costs of $5.7 million including the derecognition of leasehold improvements. The Company plans to exit all three properties by October 31, 2012.
Finance costs in Q1 2012 decreased by $2.8 million or 41.2% to $4.0 million compared to $6.8 million in Q1 2011, due to lower long-term debt levels in Q1 2012 and less interest on accruals for uncertain tax positions which totaled $1.6 million in Q1 2012.
Interest income decreased by $0.1 million to $0.5 million in Q1 2012 compared to $0.6 million in Q1 2011. The decrease in the period is due to lower average levels of cash and cash equivalents.
Share of income from joint ventures increased by $1.6 million to $3.5 million in Q1 2012 compared to $1.9 million in Q1 2011 primarily due to increases in revenues resulting from new tenants and lower interest expense from loan repayments.
Income tax expense increased by $20.6 million to $12.4 million in Q1 2012 compared to an $8.2 million income tax recovery in Q1 2011 due to higher taxable earnings.
Adjusted EBITDA for Q1 2012 was ($30.1) million compared to ($22.3) million in Q1 2011, a decrease of $7.8 million. Adjusted EBITDA excludes the pre-tax gain of $164.3 million for the early surrender and termination of leases on three properties. Adjusted EBITDA is a non-IFRS measure. See “Use of Non-IFRS Measures, Measures of Operating Performance and Reconciliation of Net Earnings (Loss) to Adjusted EBITDA” above for a discussion of non-IFRS measures.
For a discussion on the impact of foreign currency fluctuations on the Company, and the extent to which foreign currency net investments are hedged by currency borrowings and other hedging instruments, see Item 11 “Quantitative and Qualitative Disclosures About Market Risk – Foreign Exchange Risk”.
Subsequent Events
On April 29, 2012, the Company received proceeds of $3.5 million for the sale of specified Cantrex assets and liabilities. As the net carrying amount of assets and liabilities sold equaled the proceeds received, no gain or loss was recognized on the transaction. See Note 13 “Assets and liabilities held for sale” in the Notes to the Q1 2012 Interim Condensed Consolidated Financial Statements.
5.B. LIQUIDITY AND CAPITAL RESOURCES
Fiscal 2011
Current assets as at January 28, 2012 were $196.3 million lower than at January 29, 2011, due primarily to the reduction of $129.3 million in inventory, $34.9 million in cash and cash equivalents, and $27.8 million in accounts receivable.
Inventories were $823.9 million as at January 28, 2012 compared to $953.2 million at January 29, 2011. The $129.3 million decrease in the inventory balance was due to a planned reduction in inventory receipts and inventory write-downs related to a planned disposition of excess inventory.
42
Total cash and cash equivalents was $397.4 million as at January 28, 2012 compared to $432.3 million as at January 29, 2011. The decrease of $34.9 million or 8.1% was primarily due to the purchase of $84.3 million in property, plant and equipment and intangible assets, the repurchase of $42.0 million of common shares, net repayment of $12.1 million in long-term obligations, offset by $85.0 million in cash flow generated from operating activities in Fiscal 2011.
Total assets and liabilities as at the end of Fiscal 2011, Fiscal 2010, and Fiscal 2010 opening Consolidated Statement of Financial Position (as at January 31, 2010) were as follows:
| | | | | | | | | | | | |
(in CAD millions, at period end) | | As at
January 28, 2012
(recast)* | | | As at
January 29, 2011
(recast)* | | | As at
January 31, 2010
(recast)* | |
Total assets | | $ | 2,730.7 | | | $ | 2,907.5 | | | $ | 3,808.3 | |
| | | | | | | | | | | | |
Total liabilities | | $ | 1,638.7 | | | $ | 1,647.1 | | | $ | 1,803.9 | |
| | | | | | | | | | | | |
| * | Recast to reflect changes resulting from the retrospective application of the change in accounting policy related to the early adoption of the amendments to accounting standard “IAS 19 (Revised), Employee Benefits”. |
Total assets as at January 28, 2012 decreased by $176.8 million to $2,730.7 million compared to Fiscal 2010, due primarily to lower inventory, cash and cash equivalents, property, plant and equipment, and accounts receivable.
Total liabilities as at January 28, 2012 decreased by $8.4 million to $1,638.7 million compared to Fiscal 2010, due primarily to lower accounts payable and accrued liabilities, deferred tax liabilities, income and other taxes payable, offset by a higher retirement benefit liability.
Cash Flow Generated from Operating Activities – Cash flow generated from operating activities increased by $13.7 million in Fiscal 2011 to $85.0 million compared to cash flow generated from operating activities of $71.3 million during Fiscal 2010. Our primary source of operating cash flow is the sale of goods and services to customers, while the primary use of cash in operations is the purchase of merchandise inventories. The increase is primarily attributable to more favorable changes in non-cash working capital, including inventory and accounts receivable and to lower income tax payments, offset by an unfavorable change to accounts payable and accrued liabilities and the net loss in Fiscal 2011.
Inventories decreased by $129.3 million in Fiscal 2011 to $823.9 million due to a planned reduction in inventory receipts, inventory write-downs and a one-time $38.4 million charge to inventory related to a planned disposition of excess inventory. Inventory write-downs in Fiscal 2011 were $115.4 million, an increase of $41.3 million compared to Fiscal 2010.
Accounts receivable decreased by $27.8 million in Fiscal 2011 to $116.2 million primarily due to timing of cash receipts from JPMorgan Chase and lower outstanding receivables from Cantrex vendors.
Accounts payable and accrued liabilities decreased $95.8 million in Fiscal 2011 to $576.8 million, primarily due to lower inventory purchasing activity and timing of payments to vendors.
Income and other taxes payable decreased $19.2 million in Fiscal 2011 to $43.8 million, while income tax payments decreased by $58.2 million in Fiscal 2011 to $21.6 million. The decrease is primarily due to the loss before income taxes of $56.9 million generated in the year, compared to the earnings before income taxes of $187.1 million generated in Fiscal 2010.
Cash Flow (Used for) Generated from Investing Activities – Cash flow from investing activities decreased by $1,201.4 million in Fiscal 2011 due to a use of cash of $63.5 million compared to cash flow generated from
43
investing activities of $1,137.9 million in Fiscal 2010. The decrease is primarily attributable to the maturity of $1,165.5 million in short-term investments in Fiscal 2010 used to support our dividend payments and the repayment of unsecured medium-term notes.
In addition, we incurred an increase of $24.3 million in capital expenditures in Fiscal 2011, primarily to support the on-going retail merchandise business through leasehold improvements and equipment purchases. We currently anticipate 2012 capital expenditure levels to be similar to 2011 levels.
Cash Flow Used for Financing Activities – Cash flow used for financing activities in Fiscal 2011 decreased by $946.5 million to $56.3 million compared to a use of cash of $1,002.8 million during Fiscal 2010. The decrease is primarily due to the payment of extraordinary dividends of $753.4 million in Fiscal 2010. In addition, in Fiscal 2011, we made a net repayment of long-term obligations of $12.1 million (Fiscal 2010 - $204.2 million) and repurchased $42.0 million (Fiscal 2010 - $43.0 million) of common shares.
During Fiscal 2010, the Company repaid in full, upon maturity, $300.0 million of its unsecured medium-term notes. In September 2010, the Company entered into an $800.0 million senior secured revolving credit facility, or the Credit Facility, with a syndicate of lenders with a maturity date of September 10, 2015. The Credit Facility is secured with a first lien on inventory and credit card receivables.
As at January 28, 2012, the Company had drawn $101.1 million (January 29, 2011: $107.5 million) of borrowings and had $6.3 million (January 29, 2011: $6.7 million) of standby letters of credit outstanding under the Credit Facility. Availability under the Credit Facility was $415.1 million as at the end of Fiscal 2011 (January 29, 2011: $510.6 million). This availability may be reduced by reserves which may be applied by the lenders pursuant to the agreement.
Q1 2012
Total cash and cash equivalents were $361.6 million as at April 28, 2012 compared to $397.4 million as at January 28, 2012. The decrease of $35.8 million or 9.0% was primarily due to the net repayment of $102.5 million in long-term obligations, $93.3 million in cash flow used for operating activities in Q1 2012, the purchase of $13.2 million in property, plant and equipment and intangible assets, offset by cash proceeds of $170.0 million from lease terminations.
Inventories were $883.7 million as at April 28, 2012 compared to $823.9 million at January 28, 2012. The $59.8 million increase in the inventory balance was driven by the seasonal buildup of inventory.
Total assets and liabilities as at the dates noted below were as follows:
| | | | | | | | | | | | |
(in CAD millions) | | As at
April 28, 2012 | | | As at
January 28, 2012
(recast)* | | | As at
January 29, 2011
(recast)* | |
Total assets | | $ | 2,744.6 | | | $ | 2,730.7 | | | $ | 2,907.5 | |
| | | | | | | | | | | | |
Total liabilities | | $ | 1,562.3 | | | $ | 1,638.7 | | | $ | 1,647.1 | |
| | | | | | | | | | | | |
| * | Recast to reflect changes resulting from the retrospective application of the change in accounting policy related to the early adoption of the amendments to accounting standard “IAS 19 (Revised), Employee Benefits”. |
Total assets as at April 28, 2012 increased by $13.9 million to $2,744.6 million compared to January 28, 2012 due primarily to higher levels of inventories, offset by decreases in cash and cash equivalents and property, plant and equipment.
44
Total liabilities as at April 28, 2012 decreased by $76.4 million to $1,562.3 million compared to January 28, 2012, due primarily to lower long-term obligations, offset by an increase in accounts payable and accrued liabilities.
Cash Flow Used for Operating Activities – Cash flow used for operating activities decreased by $19.6 million in Q1 2012 to $93.3 million compared to $112.9 million during Q1 2011. Our primary source of operating cash flow is the sale of goods and services to customers, while the primary use of cash in operations is the purchase of merchandise inventories. We used less cash in operations in the first quarter of 2012 compared to the first quarter of 2011, primarily due to income tax refunds of $7.8 million in Q1 2012 (Q1 2011 – income tax payment of $19.7 million), partially offset by higher retirement benefit plan contributions of $12.4 million (Q1 2011 - $2.7 million).
Non-cash working capital decreased $5.5 million to $65.6 million in Q1 2012 (Q1 2011 - $71.1 million decrease). The decrease is primarily due to an increase in inventories of $59.8 million and a decrease in income and other taxes payable of $10.4 million, offset by a decrease in accounts receivable of $20.0 million.
Cash Flow Generated from (Used for) Investing Activities – Cash flow generated from investing activities increased by $172.9 million in Q1 2012 to $163.6 million compared to a use of cash of $9.3 million in Q1 2011. The increase is primarily attributable to the $170.0 million in cash proceeds received from the early surrender and termination of leases on three properties, slightly offset by lower capital expenditures in Q1 2012 of $3.1 million.
In the normal course of business, we consider offers to sell owned or leased properties. These transactions may, individually or in the aggregate, result in material proceeds or outlays of cash and cause our capital expenditures levels to vary from period to period. Currently, we do not have any plans to enter into any such transactions.
Cash Flow Used for Financing Activities – Cash flow used for financing activities decreased by $4.5 million in Q1 2012 to $105.9 million compared to a use of cash of $110.4 million in Q1 2011. Q1 2012 cash was primarily used to make net repayments on long-term obligations of $102.5 million (Q1 2011 - $108.9 million) and repurchases of common shares of $2.9 million (Q1 2011 - $0.9 million).
Retirement Benefit Plans
The expense for the defined benefit, defined contribution and other benefit plans for the 13-week period ended April 28, 2012 was $2.5 million (2011: $2.0 million), $2.3 million (2011: $2.6 million) and $3.0 million (2011: $3.1 million), respectively. Not included in total retirement benefit plans expense for the 13-week period are short-term disability payments of $2.5 million (2011: $2.4 million) that were paid from the other benefit plan. These expenses are included in “Selling, administrative and other expenses” in the Condensed Consolidated Statements of Net Earnings (Loss) and Comprehensive Income (Loss).
Total payments relating to cash contributed by the Company to its defined benefit, defined contribution and other benefit plans for the 13-week period ended April 28, 2012 were $12.4 million (2011: $2.7 million).
Recast Due to Adoption of IAS 19 (R)
The Company has elected to early adopt the amendments to IAS 19 beginning January 29, 2012, with retrospective application to prior reporting periods. See Note 2.26 “IAS 19 (Revised), Employee Benefits” in the Notes to the 2011 Annual Consolidated Financial Statements for further detail on the accounting policy.
Capital Resources
The Company’s capital expenditures, working capital needs, debt repayment and other financing needs are funded primarily through cash generated from operations. In selecting appropriate funding choices, the
45
Company’s objective is to manage its capital structure in such a way as to diversify its funding sources, while minimizing its funding costs and risks. The Company expects to be able to satisfy all of its financing requirements through cash on hand, cash generated by operations and available credit facilities. The Company’s cost of funding is affected by a variety of general economic conditions, including the overall interest rate environment, as well as the Company’s results of operations, credit ratings and fluctuations of its credit spread over applicable reference rates.
In September 2010, the Company entered into its $800.0 million senior secured revolving Credit Facility with a syndicate of lenders with a maturity date of September 10, 2015. As at April 28, 2012, the Company had no drawings on the Credit Facility and had $6.7 million of standby letters of credit outstanding. Availability under the Credit Facility was $580.9 million as at April 28, 2012 and is determined pursuant to a borrowing base formula. This availability may be reduced by reserves which may be applied by the lenders pursuant to the agreement. The Credit Facility is secured with a first lien on inventory and credit card receivables. The Credit Facility contains covenants which are customary for facilities of this nature and the Company was in compliance with all covenants as at April 28, 2012.
In December 2011, the Company renewed its letter of credit facility to support its offshore merchandise purchasing program at a reduced level of U.S. $15.0 million. As at April 28, 2012, outstanding letters of credit of U.S. $6.2 million were issued under the Company’s offshore merchandise purchasing program.
The Company regularly monitors its sources and uses of cash and its level of cash on hand, and considers the most effective use of cash on hand including certain voluntary repayment of obligations, potential acquisitions, stock purchases and dividends.
We believe that the Company’s working capital provides sufficient liquidity to support our business operations for the next 12 months. However, while we currently do not have any plans to seek additional funding, we may elect to do so prior to that time. Additional equity or debt financing may not be available to us on acceptable terms or at all. In addition, covenants under our existing indebtedness may limit our ability to incur additional indebtedness and any proceeds from the issuance of equity or debt may be required to be used, in whole or in part, to make mandatory payments under our credit agreements. See Item 10.C. “Material Contracts – (b) Credit Facility”.
Funding Costs
The funding costs for the Company in the first quarter of Fiscal 2012 and Fiscal 2011, and for the full 2011 and 2010 fiscal years are outlined in the table below:
| | | | | | | | | | | | | | | | |
| | | First Quarter | | | Fiscal | |
(in CAD millions) | | 2012 | | | 2011 | | | 2011 | | | 2010 | |
Interest costs | | | | | | | | | | | | | | | | |
Total long-term obligations at end of period * | | $ | 28.2 | | | $ | 33.4 | | | $ | 122.7 | | | $ | 129.1 | |
Average long-term obligations for period | | | 84.1 | | | | 124.7 | | | | 69.7 | | | | 289.9 | |
Long-term funding costs ** | | | 1.0 | | | | 1.4 | | | | 3.3 | | | | 14.9 | |
Average rate of long-term funding | | | 4.8 | % | | | 4.5 | % | | | 4.7 | % | | | 5.1 | % |
| * | Includes principal payments due within one year. |
| ** | Excludes standby fee on the unused portion of the Credit Facility, amortization of debt issuance costs and interest accrued related to uncertain tax positions and sales tax assessments. |
There was no floating debt as at April 28, 2012. The fixed-to-floating funding ratio as at January 28, 2012 was 20/80 (January 29, 2011: 21/79). Fixed rate debt maturing in the next 12 months is considered floating rate funding for the purpose of this calculation.
46
On April 29, 2012, the Company received proceeds of $3.5 million for the sale of specified Cantrex assets and liabilities. As the net carrying amount of assets and liabilities sold equaled the proceeds received, no gain or loss was recognized on the transaction. See Note 13 “Assets and liabilities held for sale” in the Notes to the Q1 2012 Interim Condensed Consolidated Financial Statements.
5.C. RESEARCH AND DEVELOPMENT, PATENTS AND LICENSES, ETC.
Not applicable.
5.D. TREND INFORMATION
For a discussion of trends in sales and inventory of the Company, please see Item 5.A. “Operating and Financial Review and Prospects – Operating Results”.
5.E. OFF-BALANCE SHEET ARRANGEMENTS
Commitments
As at April 28, 2012, cash and cash equivalents that are restricted represent cash and investments pledged as collateral for letter of credit obligations issued under the Company’s offshore merchandise purchasing program of $6.4 million (January 28, 2012: $7.2 million, April 30, 2011: $6.1 million, January 29, 2011: $7.1 million), which is the Canadian equivalent of U.S. $6.5 million (January 28, 2012: U.S. $7.2 million, April 30, 2011: U.S. $6.4 million, January 29, 2011: U.S. $7.0 million). As at April 30, 2011, restricted cash and cash equivalents also included cash deposits pledged as collateral with counterparties relating to outstanding derivative contracts of $17.4 million (January 29, 2011: $5.1 million) and funds held in trust in accordance with regulatory requirements governing advance ticket sales related to Sears Travel of $2.5 million (January 29, 2011: $3.1 million).
Guarantees
The Company has provided the following significant guarantees to third parties:
Royalty License Agreements
The Company pays royalties under various merchandise license agreements, which are generally based on the sale of products. Certain license agreements require a minimum guaranteed payment of royalties over the term of the contract, regardless of sales. Total future minimum royalty payments under such agreements as at April 28, 2012 are $2.8 million (January 28, 2012: $3.1 million, April 30, 2011: $4.5 million, January 29, 2011: $2.4 million).
Other Indemnification Agreements
In the ordinary course of business, the Company has provided indemnification commitments to counterparties in transactions such as leasing transactions, royalty agreements, service arrangements, investment banking agreements and director and officer indemnification agreements. The Company has also provided certain indemnification agreements in connection with the sale of the credit and financial services operations in November 2005. The foregoing indemnification agreements require the Company to compensate the counterparties for costs incurred as a result of changes in laws and regulations, or as a result of litigation or statutory claims, or statutory sanctions that may be suffered by a counterparty as a consequence of the transaction. The terms of these indemnification agreements will vary based on the contract and typically do not provide for any limit on the maximum potential liability. Historically, the Company has not made any significant payments under such indemnifications and no amount has been accrued in our historical audited and unaudited consolidated financial statements with respect to these indemnification commitments.
47
5.F. TABULAR DISCLOSURE OF CONTRACTUAL OBLIGATIONS
Contractual obligations, including payments due over the next five fiscal years and thereafter as at January 28, 2012, are shown in the following table:
| | | | | | | | | | | | | | | | | | | | | | | | |
| | | | | | Contractual Cash Flow Maturities | |
(in CAD millions) | | Carrying
Amount | | | Total | | | Within
1 year | | | 1 year to
3 years | | | 3 years to
5 years | | | Beyond
5 years | |
Accounts payable and accrued liabilities | | $ | 576.8 | | | $ | 576.8 | | | $ | 576.8 | | | $ | — | | | $ | — | | | | — | |
Long-term obligations including payments due within one year 1 | | | 122.7 | | | | 153.2 | | | | 10.7 | | | | 18.3 | | | | 110.0 | | | | 14.2 | |
Operating lease obligations 2 | | | n/a | | | | 510.1 | | | | 102.7 | | | | 153.0 | | | | 98.0 | | | | 156.4 | |
Royalties 2 | | | n/a | | | | 3.1 | | | | 1.6 | | | | 1.5 | | | | — | | | | — | |
Retirement benefit plan obligations 2,3 | | | n/a | | | | 75.7 | | | | 29.3 | | | | 46.4 | | | | — | | | | — | |
| | | | | | | | | | | | | | | | | | | | | | | | |
| | $ | 699.5 | | | $ | 1,318.9 | | | $ | 721.1 | | | $ | 219.2 | | | $ | 208.0 | | | $ | 170.6 | |
| 1 | Cash flow maturities related to long-term obligations, including payments due within one year, include annual interest on finance lease obligations at an average rate of 6.7% and on secured credit facility borrowings at a rate of 3.7%. |
| 2 | Operating lease obligations, royalties and retirement benefit plan funding obligations are not reported on the Consolidated Statements of Financial Position. |
| 3 | Payments beyond 2013 are subject to a funding valuation to be completed as at December 31, 2013. Until then, the Company is obligated to fund in accordance with the most recent valuation completed as at December 31, 2010. |
ACCOUNTING POLICIES AND ESTIMATES
Changes in Accounting Policies
Early adoption of IAS 19 (Revised) – Employee Benefits
The Company has elected to early adopt IAS 19. On June 16, 2011, the IASB issued amendments to IAS 19 which included the elimination of the “corridor approach,” which is the option to defer and amortize the recognition of actuarial gains and losses. The significant amendments to IAS 19 are as follows:
| | • | | The “corridor approach” is to be replaced with full and immediate recognition of actuarial gain and loss remeasurements in “Other comprehensive (loss) income”, or OCI; |
| | • | | Retirement benefit costs are to consist of service costs, net interest and remeasurements, with remeasurements being recorded in OCI; |
| | • | | Past service costs are to be recognized immediately in the Consolidated Statements of Net Earnings (Loss); |
| | • | | Expected returns on plan assets will no longer be recognized in profit or loss. Instead, interest income on plan assets, calculated using the discount rate used to measure the pension obligation, will be recognized in the Consolidated Statements of Net Earnings (Loss), |
| | • | | Plan administration costs are to be expensed as incurred; and |
| | • | | Disclosures relating to retirement benefit plans will be enhanced and will include discussions on risk associated with each plan, an explanation of items recognized in the consolidated financial statements and descriptions of the amount, timing and uncertainty on the Company’s future cash flow. |
The amendments to IAS 19 are effective for annual periods beginning on or after January 1, 2013 with early adoption permitted.
48
The amendments are required to be applied retrospectively in accordance with IAS 8, Accounting Policies, Changes in Accounting Estimates and Errors. As the Company adopted the amendments to IAS 19 in Q1 2012, the Company was required to retrospectively recast the adoption to its annual Consolidated Financial Statements in this Form 20-F with the effect of recasting extended to the transition date of January 31, 2010. The Company has recast the assets and liabilities as at January 28, 2012, January 29, 2011 and January 31, 2010 and income, expenses and cash flows for the 52-week periods ended January 28, 2012 and January 29, 2011.
Recast of prior period comparatives
A summary of the impact arising from the application of the change in accounting policy is as follows:
Consolidated Statements of Financial Position
| | | | | | | | | | | | | | | | |
(Increase (decrease) in CAD millions) | | As at
January 28, 2012 | | | As at
April 30, 2011 | | | As at
January 29, 2011 | | | As at
January 31, 2010 | |
Retirement benefit asset | | $ | (187.7 | ) | | $ | (193.1 | ) | | $ | (197.4 | ) | | $ | (207.4 | ) |
Retirement benefit liability | | | 308.2 | | | | 206.2 | | | | 205.3 | | | | 124.1 | |
Net change to retirement benefit asset and liability | | | (495.9 | ) | | | (399.3 | ) | | | (402.7 | ) | | | (331.5 | ) |
Deferred tax assets | | | 84.0 | | | | 66.1 | | | | 32.7 | | | | — | |
Deferred tax liabilities | | | (43.6 | ) | | | (36.7 | ) | | | (71.0 | ) | | | (85.3 | ) |
Net change to deferred tax assets and liabilities | | | 127.6 | | | | 102.8 | | | | 103.7 | | | | 85.3 | |
Accumulated other comprehensive loss | | | (141.7 | ) | | | (62.6 | ) | | | (62.6 | ) | | | — | |
Retained earnings | | | (226.6 | ) | | | (233.9 | ) | | | (236.4 | ) | | | (246.2 | ) |
Consolidated Statements of Net Earnings (Loss) and Comprehensive Income (Loss)
| | | | | | | | | | | | | | | | |
(Increase (decrease) in CAD millions, except
per share amounts) | | 13-Week
Period Ended
April 28, 2012 | | | 13-Week
Period Ended
April 30, 2011 | | | 52-Week
Period Ended
January 28, 2012 | | | 52-Week
Period Ended
January 29, 2011 | |
Selling, administrative and other expenses | | $ | (6.1 | ) | | $ | (3.3 | ) | | $ | (13.2 | ) | | $ | (13.2 | ) |
Earnings before income taxes | | | 6.1 | | | | 3.3 | | | | 13.2 | | | | 13.2 | |
Deferred income tax expense | | | 1.6 | | | | 0.8 | | | | 3.4 | | | | 3.4 | |
Net earnings | | | 4.5 | | | | 2.5 | | | | 9.8 | | | | 9.8 | |
Basic net earnings per share | | $ | 0.04 | | | $ | 0.02 | | | $ | 0.09 | | | $ | 0.09 | |
Diluted net earnings per share | | $ | 0.04 | | | $ | 0.02 | | | $ | 0.09 | | | $ | 0.09 | |
Other comprehensive loss | | | — | | | | — | | | | (79.1 | ) | | | (62.6 | ) |
Comprehensive income (loss) | | | 4.5 | | | | 2.5 | | | | (69.3 | ) | | | (52.8 | ) |
Consolidated Statements of Cash Flows
| | | | | | | | | | | | | | | | |
(Increase (decrease) in CAD millions) | | 13-Week
Period Ended
April 28, 2012 | | | 13-Week
Period Ended
April 30, 2011 | | | 52-Week
Period Ended
January 28, 2012 | | | 52-Week
Period Ended
January 29, 2011 | |
Net earnings | | $ | 4.5 | | | $ | 2.5 | | | $ | 9.8 | | | $ | 9.8 | |
Retirement benefit plans expense | | | (6.1 | ) | | | (3.3 | ) | | | (13.2 | ) | | | (13.2 | ) |
Income tax expense | | | 1.6 | | | | 0.8 | | | | 3.4 | | | | 3.4 | |
Please refer to Note 10 “Retirement benefit plans” in the Notes to the Q1 2012 Interim Condensed Consolidated Financial Statements for a full recast of prior period comparative figures.
49
IFRS 7, Financial Instruments: Disclosures, or IFRS 7
The IASB first amended IFRS 7 on October 7, 2010, to require additional disclosures regarding transfers of financial assets. These amendments are effective for annual periods beginning on or after July 1, 2011. The Company has adopted these amendments beginning January 29, 2012. These amendments do not impact the Company’s disclosures for the 13-week period ended April 28, 2012.
Issued Standards Not Yet Adopted
The Company monitors the standard setting process for new standards issued by the IASB that the Company may be required to adopt in the future. Since the impact of a proposed standard may change during the review period, the Company does not comment publicly until the standard has been finalized and the effects have been determined.
On December 16, 2011, the IASB issued amendments to three previously released standards. They are as follows:
IAS 32, Financial Instruments: Presentation, or IAS 32
The IASB amended IAS 32 to address inconsistencies in current practice in the application of offsetting criteria. The amendments provide clarification with respect to the meaning of ‘currently has a legally enforceable right of set-off’ and that some gross settlement systems may be considered equivalent to net settlement. These amendments are effective for annual periods beginning on or after January 1, 2014. The Company is currently assessing the impact of these amendments on the Company’s consolidated financial statements and related note disclosures.
IFRS 7, Financial Instruments: Disclosures, or IFRS 7
On December 16, 2011, the IASB approved additional amendments to IFRS 7, which establishes disclosure requirements to help users better assess the effect or potential effect of offsetting arrangements on a company’s financial position. These amendments are effective for annual periods beginning on or after January 1, 2013. The Company will apply these amendments beginning the first quarter of its 2013 fiscal year and is currently assessing the impact on the Company’s disclosures.
IFRS 9, Financial Instruments, or IFRS 9
The IASB issued IFRS 9 on November 12, 2009, which will ultimately replace IAS 39, Financial Instruments: Recognition and Measurement, or IAS 39. The replacement of IAS 39 is a three-phase project with the objective of improving and simplifying the reporting for financial instruments.
The first phase of the project provides guidance on the classification and measurement of financial assets. IFRS 9 was subsequently reissued on October 28, 2010, incorporating new requirements on accounting for financial liabilities. On December 16, 2011, the IASB amended the mandatory effective date of IFRS 9 to fiscal years beginning on or after January 1, 2015. The amendment also provides relief from the requirement to recast comparative financial statements for the effect of applying IFRS 9. The Company is monitoring the impact of amendments to this standard and initial application of IFRS 9 is expected to impact the classification of a number of financial assets which will require disclosure in the financial statement notes.
On June 16, 2011, the IASB amended IAS 1 to require additional disclosures for items presented in OCI on a before-tax basis and requires items to be grouped and presented in OCI based on whether they are potentially reclassifiable to earnings or loss subsequently (i.e. items that may be reclassified and those that will not be reclassified to earnings or loss). These amendments are effective for annual periods beginning on or after July 1, 2012 and require full retrospective application. The Company will apply these amendments beginning the first quarter of its 2013 fiscal year and is currently assessing the impact to its consolidated financial statements.
50
On May 12, 2011, the IASB issued four new standards, all of which are applicable to Annual Reporting periods beginning on or after January 1, 2013. The Company is currently assessing the impact of these standards on its consolidated financial statements and related note disclosures. The following is a list and description of these standards:
IFRS 10, Consolidated Financial Statements, or IFRS 10
IFRS 10 establishes the standards for the presentation and preparation of consolidated financial statements when an entity controls one or more entities;
IFRS 11, Joint Arrangements, or IFRS 11
IFRS 11 replaces IAS 31, Interests in Joint Ventures, or IAS 31, and requires that a party in a joint arrangement assess its rights and obligations to determine the type of joint arrangement and account for those rights and obligations accordingly. As a consequence of this new IFRS, the IASB also issued amended and retitled IAS 28, Investments in Associates and Joint Ventures;
IFRS 12, Disclosure of Involvement with Other Entities, or IFRS 12
IFRS 12, along with IFRS 11 described above, replaces IAS 31. IFRS 12 requires the disclosure of information that enables users of financial statements to evaluate the nature of and the risks associated with, the entity’s interests in joint ventures and the impact of those interests on its financial position, results of operations and cash flow; and
IFRS 13, Fair Value Measurement, or IFRS 13
IFRS 13 provides guidance to improve consistency and comparability in fair value measurements and related disclosures through a ‘fair value hierarchy’. This standard applies when another IFRS requires or permits fair value measurements or disclosures. IFRS 13 does not apply for share-based payment transactions, leasing transactions and measurements that are similar to, but are not fair value.
Critical Accounting Estimates
Critical judgments that management has made in the process of applying the Company’s accounting policies, key assumptions concerning the future and other key sources of estimation uncertainty that have the potential to materially impact the carrying amounts of assets and liabilities within the next financial year are described in Note 4 “Critical accounting judgments and key sources of estimation uncertainty” of the Notes to the Q1 2012 Interim Condensed Consolidated Financial Statements.
51
ITEM 6. DIRECTORS, SENIOR MANAGEMENT AND EMPLOYEES
6.A. DIRECTORS AND SENIOR MANAGEMENT
Board of Directors
Our Articles of Amalgamation provide for the board of directors, or the Board, to consist of a minimum of seven and a maximum of 20 directors, with the number of directors within such limits to be determined by the Board. The current size of the Board has been fixed at eight directors. Each of the members of our board will hold office until our next annual meeting of shareholders or until their successors are duly elected or appointed. The following table presents certain background information regarding the members of our Board:
| | | | | | | | |
Name, Business Address and Independence | | Age | | | Position | | Principal Occupation |
E.J. Bird 1, 3 159 Old Ballenger Mill Road Landrum, SC 29356 United States (Independent) | | | 49 | | | Lead Director | | Private Investor |
| | | |
William C. Crowley 2, 3 146 Central Park West New York, NY 10023 United States (Non-Independent) | | | 54 | | | Chairman | | Managing Member, CRK Capital Partners, LLC |
| | | |
William R. Harker 2, 3 Sears Canada Inc. 290 Yonge Street, Suite 700 Toronto, ON M5B 2C3 Canada (Non-Independent) | | | 39 | | | Director | | Senior Vice President of Sears Holdings (retail business) |
| | | |
R. Raja Khanna 1, 4 GlassBOX Television Inc. 130 Merton St., 4th Floor, Toronto, ON M4S 1A4 Canada (Independent) | | | 39 | | | Director | | Chief Executive Officer of GlassBOX Television (media-related company) |
| | | |
James McBurney 1, 4 HCF International Advisers Limited 9th Floor, Portland House, Bressender Place London, SW1E 5BH United Kingdom (Independent) | | | 53 | | | Director | | Chief Executive Officer of HCF International Advisers Limited (investment banking firm) |
| | | |
Calvin McDonald Sears Canada Inc. 290 Yonge Street, Suite 700 Toronto, ON M5B 2C3 Canada (Non-Independent) | | | 40 | | | President, CEO and Director | | President and Chief Executive Officer of Sears Canada |
52
| | | | | | | | |
Name, Business Address and Independence | | Age | | | Position | | Principal Occupation |
| | | |
Deborah E. Rosati 1, 2, 4 11821 Lakeshore Rd. Wainfleet, ON L0S 1V0 Canada (Independent) | | | 50 | | | Director | | President of RosatiNet, Inc. (management consulting firm) |
| | | |
Donald C. Ross Osler, Hoskin & Harcourt LLP 100 King Street West 1 First Canadian Place Suite 6100, P.O. Box 50 Toronto, ON M5X 1B8 Canada (Non-Independent) | | | 65 | | | Director | | Partner of Osler, Hoskin & Harcourt LLP (law firm) |
| (1) | Member of the Audit Committee |
| (2) | Member of the Human Resources and Compensation Committee |
| (3) | Member of the Investment Committee |
| (4) | Member of the Nominating and Corporate Governance Committee |
Four of the current eight directors, namely William C. Crowley, William R. Harker, Calvin McDonald and Donald C. Ross, are “Non-Independent Directors” (as such term is defined below) and the other four current directors, namely E. J. Bird, R. Raja Khanna, James McBurney and Deborah E. Rosati, are “Independent Directors” (as such term is defined below). The Nominating and Corporate Governance Committee of the Board, or the Governance Committee, is responsible for considering and recommending for approval by the Board qualified candidates to be nominated for election or appointment as directors. The Governance Committee bases its review of Board candidates on skill sets as outlined in the Governance Committee charter.
The definition of “Independent Director” is derived from Canadian National Instrument 52-110 – Audit Committees, as amended, of the Canadian Securities Administrators. For the purpose of determining independence, a director is an “Independent Director” if he or she has no direct or indirect material relationship with the Company or any of its affiliates, including Sears Holdings and ESL. A “material relationship” is a relationship which could, in the view of the Board, be reasonably expected to interfere with the exercise of a member’s independent judgment. A “Non-Independent Director” is a director who is not an Independent Director.
Set forth below is additional biographical information regarding our current directors.
E.J. Bird. E. J. Bird is a private investor. Mr. Bird is also the President of Overflow Ministries, a not-for-profit organization, and has held this position since 2003. Mr. Bird served as an analyst for Levine Investments from 2002 to 2010 and as Chief Financial Officer of ESL from 1991 to 2002. Mr. Bird is a director of GWR Global Water Resources Corp. Mr. Bird brings a wealth of financial knowledge to the Board and has extensive expertise with respect to financial matters. Mr. Bird holds a Bachelor’s degree in Business Administration (Accounting), summa cum laude, from Baylor University and a Master in Business Administration degree from Stanford Graduate School of Business. Mr. Bird is licensed as a Certified Public Accountant. Mr. Bird has been a director of the Company since May, 2006.
William C. Crowley. William C. Crowley is the Managing Member of CRK Capital Partners, LLC. Until June 1, 2012, he was the President and Chief Operating Officer of ESL and served in this capacity from January 1999. From March 2005 to January 2011, Mr. Crowley held the position of Executive Vice President and Chief Administrative Officer at Sears Holdings. Mr. Crowley is a member of the board of directors of AutoNation, Inc.
53
and AutoZone Inc. and the Chairman of the Board of Orchard Supply Hardware Stores Corporation. Mr. Crowley is the Chairman of the Board and has considerable experience with the management of retail organizations, having held senior positions with both Sears Holdings and Kmart Holding Corporation. Mr. Crowley completed his undergraduate and law degree at Yale University and holds a Master’s Degree from the University of Oxford. Mr. Crowley has been a director since March, 2005.
William R. Harker. William R. Harker is a Senior Vice President at Sears Holdings and has held this position since April 2006. Until June 1, 2012, Mr. Harker was the Executive Vice President and General Counsel of ESL and was appointed to this position in February 2011. From September 2005 until August 2009, Mr. Harker held various positions within Sears Holdings, including Senior Vice President, Human Resources, General Counsel and Corporate Secretary, Vice President, Acting General Counsel and Corporate Secretary and Vice President, Chief Counsel. Prior to Sears Holdings, Mr. Harker served as an Associate with the law firm of Wachtell, Lipton, Rosen and Katz from September 2000 to August 2005. Mr. Harker sits on the board of directors of the Sears Roebuck Foundation and is a Trustee on the national Board of Trustees of the March of Dimes Foundation. Mr. Harker brings a wealth of legal knowledge to the Board having held numerous senior legal roles at Sears Holdings. Mr. Harker holds a law degree from the University of Pennsylvania Law School and a business administration degree from West Virginia University. Mr. Harker has been a director since November, 2008.
R. Raja Khanna. Raja Khanna is currently the Chief Executive Officer of GlassBOX Television and assumed this position in February 2008. Mr. Khanna co-founded QuickPlay Media Inc., a mobile video company, and served as its Chief Marketing Officer from 2004 until 2007. Previous to that position, Mr. Khanna founded Snap Media Corp., a dot com start-up company, and held the office of Chief Executive Officer from 1995 to 2004. Mr. Khanna is a member of the board of directors of QuickPlay Media Inc., GlassBOX Television Inc., the National Screen Institute and Blue Ant Media Inc. Mr. Khanna’s experience with digital media technologies and his entrepreneurial expertise make him an asset to the Board. Mr. Khanna holds a Bachelor of Laws degree from Osgoode Hall Law School and a Bachelor of Science degree in Philosophy and Genetics from the University of Toronto. Mr. Khanna has been a director since October, 2007.
James McBurney. James McBurney is the Chief Executive Officer of HCF International Advisers Limited and assumed this position in September 2010. Prior to holding this position, Mr. McBurney was a private investor who was focused on the metals and mining sector. From 2005 to 2008, Mr. McBurney was the Chief Executive Officer of JNR (UK) Limited. Mr. McBurney also held the role of Managing Director and Head of the Natural Resources Group for Europe, Middle East, and Africa (EMEA) at Bank of America Securities from 2002 to 2005. Mr. McBurney is currently a director of Ruspetro PLC and Atlantic Sea Island Group LLC. Mr. McBurney’s vast knowledge of the business, finance and investment sectors makes him an asset to the Board. Mr. McBurney holds a Master in Business Administration degree from Harvard Business School and a Bachelor of Arts degree cum laude from Yale College. Mr. McBurney has been a director since April, 2010.
Calvin McDonald. Calvin McDonald was appointed as the President and Chief Executive Officer of the Company in June, 2011. Prior to this appointment, Mr. McDonald held the position of Executive Vice-President, Conventional Division of Loblaw Companies Limited since January 2011 and was the Executive Vice-President, Marketing, CRM – Brands and Corporate Strategy of Loblaw Companies Limited, from January 2010 to December 2010. From April 2007 to January 2010, Mr. McDonald held the position of Senior Vice-President, Grocery Business Unit of Loblaw Companies Limited. Mr. McDonald also held the position of Vice-President, Merchandising & Marketing, No Frills Division of Loblaw Companies Limited from February 2005 to April 2007. Mr. McDonald has been in the retail business for over 18 years. In his previous roles with Loblaw Companies Limited, Mr. McDonald oversaw $10 billion in revenue and achieved a number of operational successes. Mr. McDonald’s extensive knowledge of the retail industry makes him an asset to the Board and the Company. Mr. McDonald holds a Bachelor of Science degree from the University of Western Ontario and a Master of Business Administration degree from the University of Toronto. Mr. McDonald has been a director since June, 2011.
54
Deborah E. Rosati. Deborah E. Rosati, FCA, ICD.D is currently the President of RosatiNet, Inc., a management consulting firm which she founded in 2001, and is a corporate director focused on corporate governance and corporate strategy for emerging technology companies. Ms. Rosati has over twenty years experience in financial, operational and strategic management in the technology sector with senior finance roles in both public and private corporations, as well as a general partner with a national venture capital firm. Ms. Rosati is currently a member of the Board of Directors of the CICA Risk Oversight Governance Board and the National Ballet School of Canada. Ms. Rosati’s experience in financial, operational and strategic management roles in the Canadian market makes her a valuable member of the Board. Ms. Rosati holds an Honours Bachelor’s degree in Business Administration from Brock University and is a Fellow Chartered Accountant and certified Director, ICD.D (2008). Ms. Rosati has been a director since April, 2007.
Donald C. Ross. Donald C. Ross is currently a Partner at Osler, Hoskin & Harcourt LLP where he has practiced law since 1988. In that capacity he has advised various clients on corporate and corporate governance matters, mergers and acquisitions and corporate finance, in both a domestic and cross-border context. In providing legal advice in a business context he has interacted with management in a number of types of businesses and helped them develop plans to address issues having both legal and business elements. From January 2006 until December 2009 Mr. Ross served as the Managing Partner of Osler, Hoskin & Harcourt LLP’s legal practice in New York City and was a member of the Firm’s Executive Committee. Mr. Ross holds a Bachelors of Arts degree in political science and economics from the University of Toronto, a Master of Science degree in economics from the London School of Economics and a Bachelor of Laws degree from Osgoode Hall Law School at York University. He is a member of the Ontario Bar and the New York Bar. Mr. Ross has been a director since May, 2012.
On May 21, 2012, Deidra C. Merriwether resigned from the Board. Ms. Merriwether had previously been a member of the Board since April 2007, and is currently Sears Holdings’ Senior Vice President and Chief Operating Officer – Sears Full Line Stores and Kmart.
Senior Management
The table below presents certain background information regarding our senior management. The individuals identified with an asterix are officers of the Company. The business address for each of the individuals below is Sears Canada Inc., 290 Yonge Street, Suite 700, Toronto, ON, M5B 2C3.
| | |
Name, Province and Country of Residence | | Title |
Calvin McDonald * Ontario, Canada | | President and Chief Executive Officer |
| |
Sharon R. Driscoll * Ontario, Canada | | Senior Vice-President and Chief Financial Officer |
| |
Christopher Brockbank Ontario, Canada | | Senior Vice-President, Marketing |
| |
Doug Campbell Ontario, Canada | | Executive Vice-President, Home & Hardlines, Major Appliances and Electronics |
| |
Thomas Fitzgerald * Ontario, Canada | | Executive Vice-President and Chief Administrative Officer |
| |
Steven Goldsmith* Ontario, Canada | | Executive Vice-President, Merchandising, Apparel and Accessories |
| |
Peter Kalen * Ontario, Canada | | Senior Vice-President, Financial and Home Services |
| |
Klaudio Leshnjani * Ontario, Canada | | Senior Vice-President and General Counsel |
55
Set forth below is a summary of the principal occupations, for at least the last five years, of our senior management.
Sharon R. Driscoll. Sharon R. Driscoll was appointed Senior Vice-President and Chief Financial Officer of the Company in December 2010. Previously, Ms. Driscoll held the position of Senior Vice-President, Finance from November 2008 to November 2010. Before joining the Company, Ms. Driscoll was employed with Loblaw Companies Limited, most recently holding the positions of Senior Vice-President, Corporate Development from April 2008 to October 2008, Senior Vice-President, Finance National Merchandising from January 2007 to April 2008 and Senior Vice-President, Finance Retail Ontario Region from August 2003 to January 2007 for Loblaws Supermarkets Limited. Ms. Driscoll began her employment with Loblaw Companies Limited in 1987.
Christopher Brockbank. Christopher Brockbank was appointed Senior Vice-President, Marketing of the Company in December 2011. Previously, Mr. Brockbank was a Marketing Consultant from April 2011 to November 2011. From August 2010 to March 2011, Mr. Brockbank was the Chief Marketing Officer of Just Energy Group Inc. and from 2008 to 2010, Mr. Brockbank was the Executive Vice-President, Marketing at Sun Media Corporation. From December 2005 to April 2008, Mr. Brockbank held the position of Vice-President, Marketing at Sirius Canada Inc.
Douglas Campbell. Douglas Campbell was appointed Executive Vice-President, Home & Hardlines, Major Appliances and Electronics effective June 2012. Prior to this role he served as Senior Vice-President, Major Appliances of the Company from December 2011 to May 2012. From May 2011 to December 2011, Mr. Campbell served as the Vice-President, Major Appliances and Electronics of the Company. Before joining the Company, Mr. Campbell was a Principal at Boston Consulting Group from 2005 to May 2011.
Thomas Fitzgerald. Thomas Fitzgerald was appointed to the position of Executive Vice-President and Chief Administrative Officer of the Company in May 2011. Prior to this position, Mr. Fitzgerald was the Chief Executive Officer of Lucky Brand Jeans from June 2009 to December 2009. From October 2008 to June 2009, Mr. Fitzgerald was the Interim Chief Executive Officer of Mexx, Amsterdam. Mr. Fitzgerald also held the positions of Senior Vice-President, Direct Brand Services for Liz Claiborne Inc. from March 2008 to October 2008 and Chief Operating Officer, Direct Brands for Liz Claiborne Inc. from September 2007 to March 2008. From September 2006 to September 2007, Mr. Fitzgerald was the Executive Vice-President and Chief Financial Officer for Burlington Coat Factory.
Stephen Goldsmith. Stephen Goldsmith was appointed as the Executive Vice-President, Merchandising, Apparel and Accessories of the Company in July 2011. Before this position, Mr. Goldsmith was the Executive Vice-President, Limited Brands Direct of Limited Brands, Inc. from July 2007 to June 2011 and from May 2005 to July 2007 Mr. Goldsmith held the position of Vice-President, Merchandising of Amazon.com, Inc.
Peter Kalen. Peter Kalen is the Senior Vice-President, Financial and Home Services of the Company and assumed this position in May 2010. Prior to this role, Mr. Kalen served as the Vice-President, Financial Services from May 2009 to April 2010. Before joining the Company, Mr. Kalen was the Senior Vice-President for President’s Choice Financial and held this position from December 2006 to June 2008. From December 2004 to December 2006, Mr. Kalen was employed with Citi Cards Canada as Senior Vice-President.
Klaudio Leshnjani. Klaudio Leshnjani is the Senior Vice-President and General Counsel of the Company and assumed this position in March 2011. Mr. Leshnjani was the Vice-President and General Counsel of the Company from February 2008 to February 2011. Prior to this role, Mr. Leshnjani held the position of Interim General Counsel from August 2007 to January 2008 and Senior Corporate Counsel from June 2005 to August 2007. Mr. Leshnjani joined the Company in June 2002 as Legal Counsel.
See Item 6.A. “Directors, Senior Management and Employees – Directors and Senior Management – Board of Directors” for information regarding Calvin McDonald.
56
6.B. COMPENSATION
Compensation Discussion and Analysis
Our commitment to improving the lives of our customers by providing quality services, products and solutions that earn their trust and build lifetime relationships is contingent upon our ability to successfully attract, motivate and retain highly talented executive officers who are committed to our vision, mission and values. We firmly believe that our executive compensation strategy is in-line with attracting and retaining executive officers who successfully contribute to our accomplishments. During the 52-week period ended January 28, 2012, or Fiscal 2011, we sought out top talent, including the appointment of a new President and Chief Executive Officer and the appointment of several senior executives.
This Compensation Discussion and Analysis, or CD&A, describes and explains the significant elements of compensation awarded to, earned by, paid to or made payable to our named executive officers, as defined under Canadian National Instrument 51-102 – Continuous Disclosure Obligations, or the Canadian Executive Compensation Rules, for Fiscal 2011. The Canadian Executive Compensation Rules require us to provide specific disclosure regarding the Chief Executive Officer, the Chief Financial Officer and the three other most highly compensated executive officers of the Company who served as executive officers during Fiscal 2011 and whose total compensation, individually, was more than $150,000 and any individual satisfying any of the foregoing criteria but for the fact that the individual was neither an executive officer of the Company or its subsidiaries, nor acting in a similar capacity, at the end of that financial year, the “Named Executive Officer” or “NEO”.
This CD&A discusses our compensation philosophy, program design, objectives, and the Human Resources and Compensation Committee’s, or the HRCC, decisions for the following Named Executive Officers:
| | • | | Calvin McDonald, President and Chief Executive Officer (since June 2011) |
| | • | | Dene L. Rogers, former President and Chief Executive Officer (until June 2011) |
| | • | | Sharon R. Driscoll, Senior Vice-President and Chief Financial Officer |
| | • | | Douglas Campbell, Senior Vice-President, Major Appliances |
| | • | | Thomas Fitzgerald, Executive Vice-President and Chief Administrative Officer (since May 2011) |
| | • | | Steven Goldsmith, Executive Vice-President, Merchandising, Apparel and Accessories (since July 2011) |
| | • | | Scott Silver, former Executive Vice-President, Merchandising, Home and Hardlines (until November 2011) |
Compensation Philosophy
The HRCC’s compensation philosophy is principled on our executive compensation being:
| | • | | Aligned with our goals; |
| | • | | Aligned with the goals and interests of the shareholders; and |
| | • | | Able to attract, motivate and retain qualified, experienced executives. |
Our executive compensation programs are established and designed to:
| | • | | Provide a competitive total rewards package; |
| | • | | Reward executives for corporate performance; and |
| | • | | Support business objectives. |
57
The compensation programs for the executive officers are pay-for-performance based, with direct-line-of-sight to corporate and individual performance.
Executive Peer Group
Our target level of total compensation is a median position in the market of twenty Canadian companies of comparable size, revenue, and business. This group of comparator companies in retail and general industry, as listed immediately below, was reviewed to ensure that employment positions within both industries are comparable to the positions available at the Company. The comparable compensation components are base salary, target annual incentives, target long-term incentives, and target total compensation. In Fiscal 2009, a review was conducted by Aon Hewitt with the comparator companies, as well as other companies with which the Company competes for talent. No reviews were conducted during Fiscal 2011 for the NEOs.
| | | | | | |
Executive Peer Group |
Retail Organizations | | General Industry Organizations |
Alimentation Couche-Tard Inc. | | RONA Inc. | | AbitibiBowater- Inc. | | McDonald’s Restaurants
of Canada Limited |
| | | |
Canadian Tire Corporation, Limited | | Shoppers Drug Mart Corporation | | Canada Post Corporation | | Rogers Communications
Inc. |
| | | |
The Home Depot Canada Inc. | | Sobeys Inc. | | Canadian National
Railway Company | | TELUS Corporation |
| | | |
The Hudson’s Bay Company | | Staples Canada Inc./The Business Depot Limited | | Finning International
Inc. | | Tim Hortons Inc. |
| | | |
Metro Inc. | | Wal-Mart Canada | | Maple Leaf Foods Inc. | | Transcontinental Inc. |
Compensation Consulting Firm
We retain an independent executive compensation consulting firm, Meridian Compensation Partners, or Meridian, formerly Aon Hewitt. Meridian was originally retained in Fiscal 2011. Meridian was created to be a truly independent executive compensation consulting firm from Aon Hewitt, to ensure no conflict of interests with Aon Hewitt’s other consulting businesses. The mandate of Meridian is to serve us and, at the request of the HRCC, to provide assistance and guidance to the HRCC in its review of executive compensation, including the competitiveness of pay levels, executive compensation design issues, market trends, and technical considerations as required. Meridian does not perform any non-executive compensation or other related services for the HRCC or the Company. Meridian may perform services for the HRCC, provided that such services are not in conflict with its mandate to serve the Company.
For Fiscal 2011, Meridian reviewed and commented on the Fiscal 2010 management proxy circular. No other executive compensation related services were performed for the HRCC or the Company in Fiscal 2011. The fees paid to Meridian for services performed during Fiscal 2011 and Fiscal 2010 totaled approximately $5,156 and $nil, respectively.
All Other Fees
Meridian does not perform any other services for us.
Human Resources and Compensation Committee
The HRCC is responsible for overseeing the development of our overall human resources strategy, policies and practices, which includes a strategy for fair and competitive compensation of executive officers in support of the achievement of our business strategy, as well as the development of other compensation programs for the
58
benefit of all associates. The HRCC partakes in an annual review of all compensation programs and practices, as presented by our management, to consider the implications of risks including reviewing program design and financial liability of existing plans. The HRCC also approves the introduction of all new annual plans and proposed design changes, as recommended by our management, after assessing the risk and financial liability of each program to us and the competitive position in the market. Decisions are approved on the basis of pay-for-performance without exposing us to inappropriate risk. Where such potential exists to influence the behavior of an NEO, appropriate action is taken to discourage such behavior. At the end of Fiscal 2011, no such risks were identified that would likely cause a material adverse effect on us. The HRCC oversees:
| | • | | The development of the Chief Executive Officer’s goals and objectives and evaluates the Chief Executive Officer’s performance based on the achievement of these goals; |
| | • | | The compensation and performance of our executive officers and receives periodic performance reports and compensation recommendations from the Chief Executive Officer, as necessary, with respect to the executive officers; and |
| | • | | The development of an appropriate succession plan for the executive officers. |
The Chief Executive Officer’s performance is evaluated by the HRCC on a regular basis and is directly tied to the achievement of corporate goals and positive corporate results. The HRCC is kept apprised of our performance through frequent communication with the Chief Executive Officer.
Composition of HRCC
During Fiscal 2011, the HRCC was comprised of three Non-Independent Directors, William C. Crowley, William R. Harker, Deidra C. Merriwether and one Independent Director, Deborah E. Rosati.
Ms. Merriwether is an officer of Sears Holdings. Mr. Harker is an executive officer of Sears Holdings and a former executive officer of ESL and Mr. Crowley is a former executive officer of ESL. Each member of the HRCC brings their own individual expertise to the committee, including financial, human resources, investment and retail knowledge which is utilized in assessing and approving implementation of our compensation policies and practices. One member, Mr. Harker, has held a senior position with Sears Holdings with responsibility for the human resources department. None of the members of the HRCC are eligible to participate in our executive compensation programs.
The accomplishments of the HRCC in Fiscal 2011 are highlighted below:
| | • | | Reviewed and approved changes to the Annual Incentive Program design; |
| | • | | Reviewed and approved the Long-Term Incentive Plan for our executive officers and designated salaried associates for the 2011-2013 Long-Term Incentive Plan period; |
| | • | | Reviewed and recommended disclosure of our executive compensation; |
| | • | | Reviewed the executive organization structure and succession plans; |
| | • | | Reviewed and identified high potential associates and assessed the capability of current talent; and |
| | • | | Reviewed investment of and contributions to our pension plan. |
Compensation Structure and Mix
Our executive compensation program focuses on a total rewards structure, which is comprised of two components of compensation provided to the executive officers: (i) fixed compensation comprised of base salary, benefits and perquisites, and pension; and (ii) at-risk performance based compensation comprised of an annual incentive program and long-term incentive plan. The fixed elements provide a competitive base of secure compensation necessary to attract and retain executive talent. The performance based elements are at-risk, reward performance, and are designed to balance decisions regarding short-term gains with our longer term interests.
59
The main components of the total rewards structure are:
| | • | | Benefits and perquisite |
| | • | | At-Risk Incentive Compensation |
| | • | | Annual Incentive Program, or AIP |
| | • | | Long-Term Incentive Plan, or LTIP |
The following table provides a summary of how each element of compensation is intended to reward certain executive officers and salaried associates.
| | | | |
Compensation Element | | Objective | | Intended Rewards and Why It is Used |
FIXED COMPENSATION | | | | |
| | |
Base Salary | | To provide a portion of compensation as a fixed cash amount. | | • To pay for competence in the
role and for scope of
responsibilities.• Market practice. |
| | |
Benefits and Perquisites | | To provide an added incentive to certain executive officers other than cash compensation, such as health coverage, vehicle allowance, and perquisite allowance for club memberships, and financial planning. | | • To ensure that associates
have access to health services
to manage personal wellness.• Reinforces individual
accountability for personal
financial planning. • Market practice. |
| | |
Pension | | To provide a retirement savings vehicle for our associates. | | • To provide associates with a
pension at retirement. The
retirement plans manage
associate and employer
contributions to ensure
ownership of each
associate’s retirement
income.• Market practice. |
| | |
AT-RISK COMPENSATION | | | | |
| | |
AIP | | To provide an opportunity for an annual incentive award based on the achievement of near-term corporate and business objectives. | | • Focuses attention on the
achievement of annual
profitability with lesser
emphasis on revenue.• To provide a competitive
total compensation package. • Market practice. |
| | |
LTIP | | A performance and employment retention based compensation component designed to encourage long-term sustainable performance results. | | • Focuses attention on the
achievement of profitability
over a three-year period.• To provide a competitive
total compensation package. • Market practice. |
We provide a significant proportion of compensation to our executive officers through AIP and LTIP. The actual compensation mix varies by executive level, reflecting the impact executive officers have on our results.
60
Aggregate Weighting of Compensation Components for Active Named Executive Officers
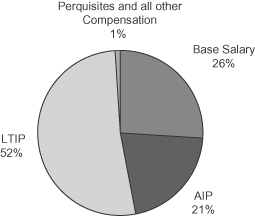
The chart above shows the weighting of the various components that executives may receive as compensation based on actual base salary, target levels of incentive compensation and perquisites, and other compensation for Fiscal 2011 for all active NEOs. The chart does not include any one-time payments made to any NEO during Fiscal 2011.
Fixed Compensation
Fixed compensation is inclusive of base salary, benefits and perquisites (for certain NEOs), and pension to provide executive talent with earnings that are competitive in the market and consistent with our compensation philosophy. Our fixed compensation programs are designed to provide a competitive base of secure compensation necessary to attract and retain executive talent while ensuring a level of secure earnings that are sufficient to meet living standards and discourage undue, high-risk decision making.
Base Salaries
Base salary reflects annual compensation received by an associate for the position they hold and the role they perform. Base salaries are normally set at median market values and balanced with relative roles and responsibilities and equity. The relative base salary of executive officers reflects experience and accountabilities of the role and the incumbent’s performance in that role. Base salaries are normally benchmarked externally against comparable roles in peer companies and internally against similar roles. Salaries are then adjusted depending on the NEOs’ past performance, experience, individual qualifications, promotion or other change in responsibilities, expected future contributions to us and current market competitiveness. During Fiscal 2011, one NEO received a base salary increase, which was approved by the HRCC, reflective of a promotion with increased responsibility and recognition of contributions to us.
Benefits and Perquisites
We provide select executive officers and designated salaried associates with competitive perquisites and benefits that allow them to focus on their daily responsibilities and the achievement of our objectives. Certain NEOs, other than the Chief Executive Officer and the Executive Vice-Presidents, are provided with a company vehicle or vehicle allowance, and an annual perquisite allowance to cover club memberships and financial planning, to reinforce individual accountability for personal financial planning. All NEOs are provided with an annual executive comprehensive medical. All of our officers are provided with reimbursement for premiums on optional life insurance, or Officer Life, and long-term disability, or LTD, insurance, or Officer LTD, along with higher life insurance and LTD plan maximums.
61
Retirement Benefits and Pension
We provide post-retirement benefits through the Sears Canada Inc. Health and Welfare Plan, or the Health and Welfare Plan, to all associates who satisfied the eligibility requirements on or before December 31, 2008.
The Sears Registered Retirement Plan, or the SRRP, has two components: (i) a defined benefit, or DB, component for service up to and including June 30, 2008, which also includes a Supplementary Retirement Plan, or the SRP; and (ii) a defined contribution, or DC, component effective July 1, 2008, which does not include a supplementary retirement plan.
At-Risk Incentive Compensation
Our at-risk incentive compensation programs are designed to reinforce our business strategy approved by the Board. The incentive programs provide executives with the opportunity to earn cash incentives based on the achievement of corporate and team performance objectives. Awards vary as a percentage of base salary, and incentive targets for all levels are reviewed periodically to ensure ongoing market competitiveness. Performance objectives are based on our business plan for the fiscal year and are intended to be challenging but achievable. We converted all financial measures from Canadian GAAP to IFRS during Fiscal 2011, and all corporate financial measures on all financial statements are currently stated in IFRS.
For Fiscal 2011, there were two at-risk incentive compensation programs for the NEOs: AIP and LTIP.
AIP
The AIP is an important component of the total compensation offer designed to provide an annual financial reward based on the achievement of specific targeted corporate performance measures and team goals approved by the HRCC. The AIP is designed to achieve three important objectives:
| | • | | Motivate and reward eligible associates who contribute to successfully achieving team goals that support our goals; |
| | • | | Provide associates with a competitive total compensation package; and |
| | • | | Attract and retain talented associates. |
Associates must be actively employed on the date of AIP payment to be eligible to receive the payout (associates who retire or terminate their employment, voluntarily or involuntarily, before the date of payout are not eligible for the payment). As well, associates must be in good performance standing and not undergoing disciplinary action or in a performance improvement program in order to receive their AIP payment. Associates who are on an approved leave of absence (other than LTD) will receive their AIP payment upon their return to active employment. In the event of a LTD or death during the year, then such participant, or his or her estate, as the case may be, is entitled to a pro-rata AIP award payment based on the date of LTD or death.
For the NEOs, the incentive award (target bonus amount as a percentage of base salary) is 100% based on the achievement of two corporate performance objectives established in each financial year. For Fiscal 2011, corporate performance was measured under IFRS by:
| | (i) | Corporate Revenue; and |
| | (ii) | Operating Profit (total revenue less total expenses, except for those expenses which are interest, income tax, depreciation, amortization and other non-recurring, unusual and one-time in nature expenses, or the Adjusted EBITDA). |
In Fiscal 2011, the weighting of the performance measures was 90% for Adjusted EBITDA and 10% for Corporate Revenue for the President and Chief Executive Officer and other NEOs. The Adjusted AIP EBITDA threshold must be achieved for payout.
62
For each corporate performance measure, the threshold goal is set at 90% of target, and the maximum goal is set at 125% of target. Compensation awards are determined according to the following criteria:
| | • | | If the threshold performance level of the corporate performance objective is achieved, then 60% of the target award is payable; |
| | • | | If the target performance level of the corporate performance objective is achieved, then 100% of the target award is payable; |
| | • | | If the maximum performance level of the corporate performance objective is achieved, then 200% of the target award is payable to recognize the achievement of superior corporate performance; and |
| | • | | If the actual result of the corporate performance objective is between these performance levels, the award payable is adjusted on a straight-line basis. |
For NEOs, the award levels and applicable payouts, as a percentage of base salary, are described below:
| | | | | | | | | | | | |
Position (1) | | Threshold
(60% payout of target) (2) | | | Target
(100% payout of target) (2) | | | Maximum
(200% payout of
target) (2) | |
President and Chief Executive Officer | | | 60 | % | | | 100 | % | | | 200 | % |
Executive Vice-Presidents | | | 45 | % | | | 75 | % | | | 150 | % |
Senior Vice-President and Chief Financial Officer | | | 36 | % | | | 60 | % | | | 120 | % |
Senior Vice-Presidents | | | 36 | % | | | 60 | % | | | 120 | % |
| (1) | Plan descriptions for current active NEOs. |
| (2) | Payouts are determined based on percentage of base salary. |
| | | | | | | | | | | | |
Performance Measure | | Weighting of the
Performance Measure | | | Target (1) | | Results | | AIP Performance
Score | |
Corporate Revenue | | | 10 | % | | Revenue of
$5,029.9 Million | | Revenue of
$4,619.0 Million | | | 0 | % |
Adjusted EBITDA | | | 90 | % | | Adjusted EBITDA of $402.0
Million | | Adjusted EBITDA of
$120.0 Million | | | 0 | % |
| (1) | Measures are in accordance with IFRS. |
LTIP
The LTIP provides a cash incentive for executive officers and designated salaried associates to promote superior return on investment for shareholders. The plan is a performance and employment retention based incentive program designed to measure and reward long-term corporate performance, as measured by total earnings determined before interest, income taxes, depreciation and amortization, and excluding certain items, or the LTIP EBITDA, over a three-year cycle. It is designed to align participants’ financial incentives with our financial goals and assist in attracting, retaining, engaging and rewarding executive officers and participating salaried associates. The award payout is paid to the LTIP participant in cash after the end of the three-year plan cycle.
Awards are designed to vary commensurately with achievement of corporate financial goals for the performance period. Under the LTIP, a cash award amount, as a percentage of base salary, is established by the HRCC for participants and correlates with the threshold, target and maximum levels of achievement of the corporate performance objective.
Upon the HRCC’s approval, a new LTIP will continue to be introduced on an annual basis, recognizing three-year corporate performance. This “rolling” design for awards will result in annual payouts which began in
63
2009. The “rolling” design (as demonstrated in the chart below) is intended to serve as a retention tool and maintain the executive officers’ or participating salaried associates’ focus on achieving long-term sustainable performance results.
| | | | | | | | | | | | | | | | | | |
Award Period | | Fiscal Years | |
| | 2009 | | 2010 | | 2011 | | 2012 | | | 2013 | | | 2014 | |
| | Feb 2009
to Jan 2010 | | Feb 2010
to Jan 2011 | | Feb 2011
to Jan 2012 | | Feb 2012
to Jan 2013 | | | Feb 2013
to Jan 2014 | | | Feb 2014
to Jan 2015 | |
2009-2011 | | 3-year Performance Period | | | Payout | | | | | | | | | |
| | | | |
2010-2012 | | | | 3-year Performance Period | | | | Payout | | | | | |
| | | |
2011-2013 | | | | 3-year Performance Period | | | | Payout | |
For Fiscal 2011, the three-year plan cycle which began on January 30, 2011 will mature on February 1, 2014, or the 2011-2013 LTIP, and will recognize performance results from the 2011 to 2013 fiscal years.
For the 2011-2013 LTIP, corporate performance is measured in its entirety by LTIP EBITDA. The threshold level for the performance measure is 80% of target corporate performance; and the maximum level is 125% of target corporate performance. These achievement levels are established to align with the corporate incentive strategy and to be challenging but achievable:
| | • | | Meeting the threshold corporate performance objective results in a payout of 60% of the target award amount; |
| | • | | Meeting the target corporate performance objective results in a payout of 100% of the target award amount; |
| | • | | Meeting the maximum corporate performance objective results in a payout of 250% of the target award amount; and |
| | • | | If the actual result of the corporate performance objective is between these performance levels, the award payable is adjusted on a straight-line basis between threshold and target or target and maximum. |
For NEOs, the award levels and applicable payouts, as a percentage of base salary, are described below:
| | | | | | | | | | | | |
Position (1) | | Threshold
(60% payout of target) (2) | | | Target
(100% payout of target) (2) | | | Maximum
(250% payout of target) (2) | |
President and Chief Executive Officer | | | 180 | % | | | 300 | % | | | 750 | % |
Executive Vice-Presidents | | | 120 | % | | | 200 | % | | | 500 | % |
Senior Vice-President and Chief Financial Officer | | | 54 | % | | | 90 | % | | | 225 | % |
Senior Vice-Presidents | | | 54 | % | | | 90 | % | | | 225 | % |
| (1) | Plan descriptions for current active NEOs. |
| (2) | Payouts are determined based on percentage of base salary. |
Participation in the LTIP, and eligibility for payment, is subject to the participant being actively employed in an eligible position at the beginning of or within the first two fiscal quarters of the three-year plan cycle and on the date the award payment is made, and having been employed, without interruption, from the grant date to the end of that three-year plan cycle. In the event the LTIP participant’s employment is terminated, voluntarily or involuntarily, or the participant retires before the end of the LTIP cycle, then such participant is not entitled to the award. In the event the LTIP participant dies or sustains a LTD before the end of the LTIP cycle, or is on an authorized leave of absence, then such participant, or his or her estate, as the case may be, is entitled to a pro-rata award payment based on the number of completed months the participant was in the LTIP until the date of such leave or death.
64
The LTIP for the three-year plan cycle which began on February 1, 2009 and matured on January 28, 2012, or the 2009-2011 LTIP, had a corporate LTIP EBITDA goal at 100% weighting for most eligible participants. Senior Vice-Presidents participating in the 2009-2011 LTIP had two independent goals: LTIP EBITDA at 75% weighting and Cash goal at 25% weighting. We did not achieve the threshold for LTIP EBITDA or Cash goal and as a result, will not result in a payout for any participant.
| | | | | | | | | | | | |
Performance Measure (1) | | Weighting of the
Performance Measure | | | Target (2) | | Results | | LTIP
Performance
Score | |
LTIP EBITDA | | | 75 | % | | 3-year cumulative Adjusted EBITDA of $1,647.2 Million | | 3-year Adjusted EBITDA of $ 946.5 Million | | | 0 | % |
Cash Goal | | | 25 | % | | 3-year cumulative Cash performance of $155.0 Million | | 3-year Cash performance of $15.1 Million | | | 0 | % |
| (1) | Describes 2009-2011 LTIP Corporate Target performance for Senior Vice-Presidents. All other participants were measured on 100% LTIP EBITDA weighting. |
| (2) | Measures are in accordance with IFRS. |
Equity Compensation Plan Information
Aggregated Securities Issuable upon Exercise of Outstanding Options, Warrants and Rights to Employees and Directors as at January 28, 2012
| | | | | | | | | | |
Plan Category | | Number of securities to be issued
upon exercise of outstanding
options, warrants and rights
(a) | | Weighted-average exercise
price of outstanding
options, warrants and
rights
(b) | | | Number of securities
remaining available for
future issuance under
equity compensation
plans (excluding securities
reflected in column (a))
(c) | |
| Equity compensation plans approved by securityholders | | 10,760 (Options)(1)
0 (Restricted Shares)
0 (Deferred Share Units) | | $
| 17.81
N/A
N/A |
| | | 3,670,001 | (2) |
| Equity compensation plans not approved by securityholders | | N/A | | | N/A | | | | N/A | |
| | | | | | | | | | |
Total | | 10,760 | | $ | 17.81 | (3) | | | 3,670,001 | |
| | | | | | | | | | |
Notes:
| | (1) | There are no outstanding options under the Stock Option Plan for Directors. |
| | (2) | A total of 3,455,251 shares are available for future issuance under the Employees Stock Plan and a total of 214,750 common shares are available for future issuance under the Stock Option Plan for Directors as at January 28, 2012. Following the last grant in 2004, we discontinued equity compensation grants under the Employees Stock Plan. We also discontinued the granting of stock options under the Stock Option Plan for Directors following the last grant in 2003. |
| | (3) | Applies to outstanding options only. |
Closed Plans
In the past, we provided for an Employees Stock Plan, which expired on April 19, 2008. Following the last grant in 2004, we discontinued equity compensation grants under the Employees Stock Plan. The Employees Stock Plan, originally established in 1984, provided for the award of stock options, special incentive awards of shares, and share appreciation rights, or SARs, to our executive officers and designated associates who demonstrated effective service and high levels of performance.
65
Unless specified otherwise, options granted under the Employees Stock Plan would vest in equal installments on each of the first three anniversaries of the date of the grant and expire ten years from the date of the grant. The exercise price for any options could not be less than the “Market Price” pursuant to the Employees Stock Plan, being the weighted average price at which the shares traded on the TSX on the five trading days preceding the date of the grant. The value of SARs payments was calculated by the amount by which the Market Price of the shares on the date of exercise of the SARs exceeded the price per share payable on the exercise price of the option granted. In the case of an award of shares by way of special incentive, all or part of the awarded shares which vested could be received on a current basis, or deferred and taken as Deferred Share Units, or DSUs. The maximum number of shares reserved for issuance to any one participant under the Employees Stock Plan was five percent (5%) of the shares outstanding at the time of the grant or award (on a non-diluted basis). No such number of shares was ever reserved for issuance to any one participant.
The entitlements of participants cease immediately upon termination of employment by the Company, with cause, or in the event that the participant terminated his/her employment with the Company. Upon termination of employment of the participant by the Company, without cause, all rights cease regarding shares. All rights to exercise stock options granted to participants cease six (6) months after the termination date.
Stock options, shares or rights in respect thereof cannot be transferred or assigned other than by will or pursuant to the laws of succession or descent and distribution. Notwithstanding the expiry of the Employees Stock Plan on April 19, 2008, all outstanding stock options may be exercised or allowed to expire in accordance with the terms of their grants. There are currently no outstanding share-based or option-based awards outstanding for any of the NEOs or directors. We do not permit the use of hedging strategies to monetize and/or reduce market risk associated with equity compensation granted by us held directly or indirectly.
| | | | | | | | |
Employees Stock Plan (as at January 28, 2012) | | # of Shares | | | % of Outstanding Capital | |
Shares issued under Plan (includes Deferred Shares) | | | 0 | | | | 0.00 | % |
Shares issuable under Plan | | | 0 | | | | 0.00 | % |
Shares issuable under grants made | | | 10,760 | | | | 0.00 | % |
Discretionary Compensation
The HRCC may exercise its discretion to award compensation payments to NEOs and certain other salaried associates if performance goals for at-risk compensation have not met thresholds required for payouts. The HRCC may also exercise its discretion to reduce or increase any awards or payouts to NEOs and certain other salaried associates based on achievement of performance goals and individual contributions to business results. The HRCC may also exercise its discretion to offer other one-time awards to NEOs and other salaried associates to attract, retain and recognize associates for their contributions. For Fiscal 2011, the HRCC did exercise its discretion to award compensation to certain NEOs and other salaried associates.
The HRCC will review the AIP at-risk compensation program during Fiscal 2012 for NEOs and certain salaried associates. While we may establish equity incentive plans that provide for the grant of common share-based equity awards to our directors, officers and other employees, we do not anticipate any other significant changes to our compensation policies or practices for the NEOs during Fiscal 2012.
President and Chief Executive Officer Compensation
Calvin McDonald was appointed President and Chief Executive Officer of the Company on June 22, 2011. Prior to this appointment, Mr. McDonald served as the Executive Vice-President, Conventional Division of Loblaw Companies Limited from January 2011 to June 2011.
Philosophy and Governance
The compensation of the President and Chief Executive Officer is generally designed by us to be aligned with our performance, consistent with the approach for other executive officers. In determining compensation for
66
the President and Chief Executive Officer, we take into account the responsibilities and accountability of the position. The relative weight assigned to the pay-at-risk components of the Chief Executive Officer’s compensation is greater than the weight assigned to the pay-at-risk components of other executive officers’ compensation.
Compensation
We entered into an employment agreement with Mr. McDonald in June 2011, or the McDonald Employment Agreement. The McDonald Employment Agreement specifies Mr. McDonald’s compensation with respect to his base salary, his AIP and LTIP, and includes information on his signing bonus and cash retention award. Under the McDonald Employment Agreement, Mr. McDonald is entitled to a base salary of $800,000 per year. Mr. McDonald was entitled to a one-time signing bonus of $200,000 paid within 30 days of employment beginning; this payment was made in June 2011 in accordance with the terms. With respect to the retention award, Mr. McDonald will receive a Cash Retention Award of $1,000,000, which is to be paid in four equal installments as soon as practicable after January 31, 2012, January 31, 2013, January 31, 2014 and January 15, 2015, or Cash Retention Award. The first Cash Retention Award payment to Mr. McDonald was made, in accordance with the recommendation of our management and with the approval of the HRCC, on January 28, 2012. To be eligible for the remaining Cash Retention Award payments Mr. McDonald must be actively employed on the date of payment of each installment payment.
Mr. McDonald’s target bonus amount under the AIP for Fiscal 2011 is 100% of his annual base salary. For the 2011 AIP, Mr. McDonald will not receive a payout as we did not achieve the threshold Adjusted EBITDA required for payout.
Mr. McDonald is also eligible to participate in the 2011-2013 LTIP cycle. Mr. McDonald’s target bonus amount under the LTIP is 300% of his annual base salary. If the specified performance targets are achieved during the performance period, Mr. McDonald will receive a payment equal to his target award if employed at the end of the three-year plan cycle and on the date the award payment is made (subject to certain termination-related exceptions).
Compensation of Named Executive Officers
Compensation of our executive officers is comprised of base salary, benefits and perquisites, pension, and at-risk compensation programs consisting of the AIP and LTIP. Since the last grant in 2004, we have discontinued equity compensation grants under the Employees Stock Plan. There are currently no outstanding stock awards for any of the NEOs.
67
The following table provides a summary of compensation information for the Named Executive Officers during Fiscal 2011.
Summary Compensation Table for Fiscal 2011
| | | | | | | | | | | | | | | | | | | | | | | | | | | | |
NEO Name and Principal Position (a) | | Year
(b) | | | Salary ($)
(1)
(c) | | | Non-Equity Incentive
Plan Compensation (f) | | | Pension
Benefit
Value ($)
(g) | | | All Other
Compensation
($) (4)
(h) | | | Total
Compensation
($)
(i) | |
| | | | Annual
Incentive
Plans 2011
($) (2)
(f1) | | | Long-
Term
Incentive
Plans
2009-2011
($) (3)
(f2) | | | | |
C. McDonald (6) | | | 2011 | | | | 487,879 | | | | 450,000 | | | | — | | | | — | | | | 5,037 | | | | 942,916 | |
| President and Chief Executive Officer | | | 2010 | | | | — | | | | — | | | | — | �� | | | — | | | | — | | | | — | |
| | | 2009 | | | | — | | | | — | | | | — | | | | — | | | | — | | | | — | |
| | | | | | | |
D. L. Rogers (4)(5)(6) | | | 2011 | | | | 276,084 | | | | — | | | | — | | | | (29,926 | ) | | | 873,363 | | | | 1,119,521 | |
| Former President and Chief Executive Officer | | | 2010 | | | | 715,388 | | | | — | | | | — | | | | (8,447 | ) | | | 9,375 | | | | 716,316 | |
| | | 2009 | | | | 710,217 | | | | 402,570 | | | | — | | | | 23,800 | | | | (5,280 | ) | | | 1,131,307 | |
| | | | | | | |
S. R. Driscoll (4)(6) | | | 2011 | | | | 375,000 | | | | — | | | | — | | | | 5,850 | | | | 46,877 | | | | 427,727 | |
Senior Vice-President and Chief Financial Officer | | | 2010 | | | | 305,776 | | | | 50,000 | | | | — | | | | 9,662 | | | | 36,671 | | | | 402,109 | |
| | | 2009 | | | | 249,792 | | | | 99,000 | | | | — | | | | 8,055 | | | | 37,299 | | | | 394,146 | |
| | | | | | | |
T. Fitzgerald (6) | | | 2011 | | | | 463,333 | | | | 776,227 | | | | — | | | | — | | | | 2,761 | | | | 1,242,321 | |
| Executive Vice-President and Chief Administrative Officer | | | 2010 | | | | — | | | | — | | | | — | | | | — | | | | — | | | | — | |
| | | 2009 | | | | — | | | | — | | | | — | | | | — | | | | — | | | | — | |
| | | | | | | |
S. Goldsmith (6) | | | 2011 | | | | 324,901 | | | | 549,576 | | | | — | | | | — | | | | 4,789 | | | | 879,266 | |
| Executive Vice-President, Merchandising, Apparel and Accessories | | | 2010 | | | | — | | | | — | | | | — | | | | — | | | | — | | | | — | |
| | | 2009 | | | | — | | | | — | | | | — | | | | — | | | | — | | | | — | |
| | | | | | | | | | | | | | | | | | | | | | | | | | | | |
| | | | | | | |
S. Silver (6) | | | 2011 | | | | 246,251 | | | | 479,901 | | | | — | | | | — | | | | 107,841 | | | | 833,993 | |
Former Executive Vice-President, Merchandising, Home and Hardlines | | | 2010 | | | | — | | | | — | | | | — | | | | — | | | | — | | | | — | |
| | | 2009 | | | | — | | | | — | | | | — | | | | — | | | | — | | | | — | |
| | | | | | | | | | | | | | | | | | | | | | | | | | | | |
| | | | | | | |
D. Campbell (6) | | | 2011 | | | | 288,853 | | | | 210,993 | | | | — | | | | — | | | | 28,222 | | | | 528,068 | |
| Executive Vice-President, Home & Hardlines Major Appliances and Electronics | | | 2010 | | | | — | | | | — | | | | — | | | | — | | | | — | | | | — | |
| | | 2009 | | | | — | | | | — | | | | — | | | | — | | | | — | | | | — | |
Notes:
| | (1) | Base salary represents actual salary earnings received in each fiscal year. |
| | (2) | Includes annual non-equity incentive plan compensation, such as discretionary cash awards, signing, relocation, and retention bonuses. For Fiscal 2011, we did not meet the threshold level of Adjusted AIP EBITDA; as a result, there will be no AIP payout for the NEOs. |
In Fiscal 2011, the Company made payments to the following officers in the following amounts:
Calvin McDonald received CAD 450,000, which was comprised of (i) a signing bonus of CAD 200,000 that was paid in June 2011 in accordance with his employment agreement; and (ii) a retention bonus of CAD 250,000 that was paid in January 2012 in accordance with his employment agreement;
Thomas Fitzgerald received CAD 776,227, which was comprised of (i) a signing bonus of CAD 220,000 that was paid in May 2011 and October 2011 in accordance with his employment agreement;
68
(ii) a relocation bonus of CAD 281,110 that was paid in May 2011 and January 2012 in accordance with his employment agreement; (iii) a commuting bonus of CAD 14,960 that was paid during Fiscal 2011 in accordance with his employment agreement; and (iv) a guaranteed annual bonus of CAD 260,157 that was paid in May 2012 in accordance with his employment agreement;
Steven Goldsmith received CAD 549,576, which was comprised of (i) a signing bonus of CAD 200,000 that was paid in August 2011 in accordance with his employment agreement; (ii) insurance payments of CAD 18,000 that were paid in August 2011 in accordance with his employment agreement; (iii) commuting payments of CAD 150,000 that were paid during Fiscal 2011 in accordance with his employment agreement; and (iv) a guaranteed annual bonus of CAD 181,576 that was paid in May 2012 in accordance with his employment agreement;
Scott Silver received CAD 479,901, which was comprised of (i) a signing bonus of CAD 150,000 that was paid in July 2011 in accordance with his employment agreement; (ii) a relocation bonus of CAD 279,901 that was paid in August 2011 in accordance with his employment agreement; and (iii) commuting payments of CAD 50,000 that were paid during Fiscal 2011 in accordance with his employment agreement; and
Doug Campbell received CAD 210,993, which was comprised of (i) a relocation bonus of CAD 192,208 that was paid in March 2011 in accordance with his employment agreement; and (ii) insurance payments of CAD 18,785 that were paid during Fiscal 2011.
| | (3) | For the 2009-2011 LTIP, the corporate performance measure of LTIP EBITDA did not meet the threshold level. As well, the independent Cash Goal for the SVPs did not meet the threshold. As a result there will be no 2009-2011 LTIP payout. |
| | (4) | For Fiscal 2011, the amounts in this column include perquisites and other compensation (inclusive of termination payments) for each NEO. The aggregate value of perquisites and benefits for each NEO with the exception of Mr. Rogers and Ms. Driscoll is less than the lesser of $50,000 or 10% of the NEO’s total annual salary and bonus for Fiscal 2011. The perquisites and other personal benefits which individually exceed 25% of the total perquisites and other personal benefits for Mr. Rogers and Ms. Driscoll are set out below: |
| | | | | | |
D. L. Rogers | | | 2011: | | | Tax Equalization ($427,700) |
S. R. Driscoll | | | 2011: | | | Vehicle allowance ($24,718), Perquisite allowance ($12,897) |
| | (5) | Dene L. Rogers’ annual compensation was based on U.S. currency, as per his employment agreement. Mr. Rogers’ employment agreement allowed for a conversion of Mr. Rogers’ salary and other elements of compensation from U.S. funds into Canadian funds. Each compensation element, including Mr. Rogers’ base salary, AIP, LTIP payments, benefits and perquisites were converted using the respective Bank of Canada rate during Fiscal 2011. |
| | (6) | Calvin McDonald was appointed as our President and Chief Executive Officer in June 2011. Prior to this appointment, Mr. McDonald held the position of Executive Vice-President, Conventional Division of Loblaw Companies Limited since January 2011 and was the Executive Vice-President, Marketing, CRM – Brands and Corporate Strategy, Loblaw Companies Limited, from January 2010 to December 2010. From April 2007 to January 2010, Mr. McDonald held the position of Senior Vice-President, Grocery Business Unit, Loblaw Companies Limited. Mr. McDonald also held the position of Vice-President, Merchandising & Marketing, No Frills Division, Loblaw Companies Limited from February 2005 to April 2007. |
Dene L. Rogers is the former President and Chief Executive Officer of the Company. Mr. Rogers’ employment ceased in June 2011. Mr. Rogers was appointed to this position in December 2006. Prior to this appointment, Mr. Rogers held the position of Acting President since May 2006. From October 2005 until December 2006, Mr. Rogers served as the Executive Vice-President, Restructuring and Business Development of Sears Holdings. Previous to this position, Mr. Rogers served as the Executive Vice-President and General Manager of Kmart Holding Corporation from October 2003 to October 2005.
69
Sharon R. Driscoll was appointed Senior Vice-President and Chief Financial Officer in December 2010. Previously, Ms. Driscoll held the position of Senior Vice-President, Finance from November 2008 to November 2010. Before joining Sears Canada, Ms. Driscoll was employed with Loblaw Companies Limited, most recently holding the positions of Senior Vice-President, Corporate Development from April 2008 to October 2008, Senior Vice-President, Finance National Merchandising from January 2007 to April 2008 and Senior Vice-President, Finance Retail Ontario Region from August 2003 to January 2007 for Loblaws Supermarkets Limited. Ms. Driscoll began her employment with Loblaw Companies Limited in 1987.
Thomas Fitzgerald was appointed as the Executive Vice-President and Chief Administrative Officer and assumed this position in May 2011. Prior to this appointment, Mr. Fitzgerald was the Chief Executive Officer of Lucky Brand Jeans from June 2009 to December 2009. From October 2008 to June 2009, Mr. Fitzgerald was the Interim Chief Executive Officer of Mexx, Amsterdam. Mr. Fitzgerald also held the positions of Senior Vice-President, Direct Brand Services for Liz Claiborne Inc. from March 2008 to October 2008 and Chief Operating Officer, Direct Brands for Liz Claiborne Inc. from September 2007 to March 2008. From September 2006 to September 2007, Mr. Fitzgerald was the Executive Vice-President and Chief Financial Officer for Burlington Coat Factory.
Steven Goldsmith was appointed as the Executive Vice-President, Merchandising, Apparel and Accessories and assumed this position in July 2011. Prior to this position, Mr. Goldsmith was the Executive Vice-President, Limited Brands Direct, Limited Brands, Inc. from July 2007 to June 2011 and from June 2005 to July 2007, Mr. Goldsmith held the position of Vice-President, Merchandising, Amazon.com, Inc.
Scott Silver was Executive Vice-President, Merchandising, Home and Hardlines from June 2011 until his employment ceased in November 2011. Mr. Silver’s previous positions include Chief Executive Officer, President, Silver Lining Holdings from 2009 to 2011. Mr. Silver also held positions with Linens ‘N Things including Executive Vice-President, Chief Merchandising Officer from March 2008 to December 2008, Executive Vice-President, Merchandising from 2007 to 2008, Senior Vice-President, General Merchandise Manager, Housewares, Bath Specialty Food and Electronics Divisions from 2006 to 2007 and Divisional Vice-President, General Merchandise Manager, Housewares, Bath, Food and Electronics Divisions from 2005 to 2006.
Douglas Campbell was appointed Executive Vice-President, Home & Hardlines, Major Appliances and Electronics in June 2012. Prior to this role he served as the Senior Vice-President, Major Appliances from December 2011 to May 2012. From May 2011 to December 2011, Mr. Campbell served as the Vice-President, Major Appliances and Electronics. Before joining the Company, Mr. Campbell was a Principal at Boston Consulting Group from 2005 to 2011.
Pension Plans
The SRRP has two components: (i) a DB component for service up to and including June 30, 2008, which also includes a SRP; and (ii) a DC component effective July 1, 2008, which does not include a SRP. None of the NEOs have a pension under the DB component or SRP.
Amendments to the Pension Plans
We amended the SRRP effective July 1, 2008 by introducing the DC component. Contributions by members towards defined benefits were discontinued and members will keep all pension benefits accrued up to and including June 30, 2008 in the existing DB component of the SRRP. After this date, compensation growth in future years will continue to be included in the calculation of the DB component of the pension although no further service credit will be earned.
Under the DC component of the SRRP, members are able to contribute a percentage of their eligible earnings subject to statutory limits. Employees who became eligible to join the SRRP on and after July 1, 2008 have the option to enroll in the DC portion of the SRRP, except where enrollment is mandatory due to provincial
70
legislation. Our contributions are determined based on member contributions using a matching formula. Currently, our contributions are equal to a maximum of 3.5% of an associate’s earnings, which was reduced effective April 1, 2009 from a maximum of 5.5% of an associate’s earnings.
The pension plan ensures that a competitive benefit exists for the member, which is consistent with the Canadian retail industry practice. The plan design allows members to have control over their retirement savings through variable contribution levels and a range of investment options.
Entitlements under the SRRP and the SRP
Certain NEOs participated in the DB component of the SRRP. Under the SRRP pension accrual formula, the annual pension payable at age 65 for the participating NEOs is calculated as follows:
For Credited Years of Service after January 1, 1987
Years of credited service multiplied by 1% of “Pensionable Earnings” between 20% and 100% of the Canada Pension Plan (CPP) covered earnings limit, plus 1.75% of “Pensionable Earnings” above this Canada Pension Plan/Québec Pension Plan (CPP/QPP) limit. “Pensionable Earnings” are the average annual remuneration in the best three consecutive years of the last ten years of employment.
Annual remuneration includes salary and actual AIP bonus amount paid.
Registered DB plans, such as the SRRP, are subject to a maximum annual benefit under the Income Tax Act (Canada). In 2011, the maximum was $2,552.22 for each pensionable year of service. Associates with final average earnings of approximately $172,100 per year may be eligible for a pension from the SRP.
NEOs and certain other members of the SRRP were entitled to receive, upon retirement, an additional pension from the unregistered SRP which provides a benefit based on the SRRP formula representing the difference between the pension determined in accordance with the SRRP and the maximum annual benefit under the Income Tax Act (Canada). In the past, pensions payable under the SRP were not funded or otherwise secured but simply paid through our general revenues. In October 2005, the Board authorized us to fund the actuarial liability corresponding with the SRP for all current retirees and other members of the SRP as they retire or otherwise become eligible for funding. Effective January 2010, the funding method for all eligible associates retiring on or after January 1, 2010 changed to be funded on a pay-as-you-go basis from our general revenues. Those who retire prior to January 1, 2010 will continue to receive SRP payments from the actuarial fund. The estimated SRP assets were $49 million as at December 31, 2011.
The form of pension is as follows:
| | (a) | for a member who has no spouse at the date of pension commencement, monthly installments for the member’s lifetime, but if the member dies before receiving 120 monthly payments, the commuted value of the balance of such 120 monthly payments is paid to the member’s beneficiary; and |
| | (b) | for a member who has a spouse at the date of pension commencement, monthly installments for the greater of the member’s lifetime and 120 months, and continuing thereafter, reduced by 331/3%, to the surviving spouse, if any, for the spouse’s lifetime. The monthly amount is reduced so that the actuarial value of this pension is equal to the actuarial value of the pension in (a) above. |
Under the DB component of the SRRP, normal retirement is the last day of the month in which a member turns age 65. Members may take early retirement at any time after reaching age 55. However, since the pension will be spread out over a longer period of time, depending on a member’s pensionable service, reductions may apply to the monthly pension. Service for this purpose includes any service that is not credited, as well as credited service.
Pensions to retirees are adjusted annually for inflation after age 65, if the Consumer Price Index, or CPI, increases by more than 2% within the year. The pension will be adjusted by three-quarters of the CPI increase, provided that the adjustment cannot exceed the lesser of 12% and the average base pay increase provided to active associates of the Company in the prior year.
71
Defined Benefit Component
The following table provides a summary of the DB component obligations for the NEOs during Fiscal 2011.
| | | | | | | | | | | | | | | | | | | | | | | | | | | | |
Name (a) | | Number of
years
credited
service
(b) | | | Annual Benefits Payable
($) | | | Accrued
obligation at
start of year
($)
(d) | | | Compensatory
change
($)
(e) | | | Non-
compensatory
change
($)
(f) | | | Accrued
obligation at
year end
($)
(g) | |
| | | At year end
(c1) | | | At age
65 (c2) | | | | | |
C. McDonald * | | | — | | | | — | | | | — | | | | — | | | | — | | | | — | | | | — | |
D. L. Rogers ** | | | 1.5 | | | | — | | | | 29,000 | | | | 276,000 | | | | (37,000 | ) | | | 70,000 | | | | — | |
S. Driscoll * | | | — | | | | — | | | | — | | | | — | | | | — | | | | — | | | | — | |
T. Fitzgerald * | | | — | | | | — | | | | — | | | | — | | | | — | | | | — | | | | — | |
S. Goldsmith * | | | — | | | | — | | | | — | | | | — | | | | — | | | | — | | | | — | |
S. Silver * | | | — | | | | — | | | | — | | | | — | | | | — | | | | — | | | | — | |
D. Campbell * | | | — | | | | — | | | | — | | | | — | | | | — | | | | — | | | | — | |
Notes:
| | * | There is no DB plan obligation for Mr. McDonald, Ms. Driscoll, Mr. Fitzgerald, Mr. Goldsmith, Mr. Silver and Mr. Campbell because they joined us after June 30, 2008. |
| | ** | Mr. Rogers’ employment ceased on June 22, 2011 and he was paid a total lump-sum of $309,000 on December 30, 2011 representing his commuted value from the DB Component of the SRRP. Mr. Rogers has no further benefit obligation remaining in the plan as of January 29, 2012. |
| | (c1) | The immediate retirement pension benefit payable at January 29, 2012, reduced for early retirement if applicable. If the member is not eligible to retire, it is nil. |
| | (c2) | This amount represents the pension benefit payable at age 65. |
| | (d) | The total SRP and SRRP obligations at January 29, 2012 using assumptions applicable for year-end disclosure at that date. |
| | (e) | Compensatory change refers to a change in the pension benefit obligation resulting from a change in the associate’s compensation. |
| | (f) | Non-compensatory change refers to a change in the pension benefit obligation that is not related to the associate’s compensation, including changes resulting from other factors such as changes in assumptions, changes to discount rate at year-end and interest cost. |
| | (g) | The total SRP and SRRP obligations at January 29, 2012 using assumptions expected to be applicable for year-end disclosure at that date. |
Defined Contribution Component
The following table provides a summary of the DC component value for the NEOs during Fiscal 2011.
| | | | | | | | | | | | |
Name | | Accumulated
value at start
of year
($) | | | Compensatory
($) (1) | | | Accumulated
value at
year end
($) | |
C. McDonald | | | — | | | | — | | | | — | |
D. L. Rogers | | | 68,677 | | | | 7,074 | | | | 77,670 | |
S. Driscoll | | | 61,672 | | | | 5,850 | | | | 76,219 | |
T. Fitzgerald | | | — | | | | — | | | | — | |
S. Goldsmith | | | — | | | | — | | | | — | |
S. Silver | | | — | | | | — | | | | — | |
D. Campbell | | | — | | | | — | | | | — | |
| (1) | Compensatory change refers to the component of the pension benefit value that is based on the associate’s compensation and includes employer contributions. |
72
Termination and Change of Control Benefits
The following NEOs have entered into employment contracts which provide for incremental payments in connection with a termination of employment from the Company. We do not have any supplementary contracts, agreements, plans or arrangements that would provide for incremental payments or benefits to the NEOs, including incremental payments or benefits to be provided upon retirement or with respect to change of control scenarios.
CALVIN MCDONALD
President and Chief Executive Officer (since June 2011)
The effective date of the McDonald Employment Agreement is June 22, 2011. The termination provisions of the McDonald Employment Agreement provide for the following incremental payments to be made in the event of Mr. McDonald’s termination on a without cause basis, or if Mr. McDonald leaves, with Good Reason (“Good Reason” means either: (i) a material reduction in Mr. McDonald’s base salary; or (ii) Mr. McDonald’s removal from the Board):
| | (1) | If Mr. McDonald’s employment is terminated within 12 months from the effective date of the McDonald Employment Agreement, then he is entitled to 12 months of salary continuation equal to his base salary, provided that, after the first anniversary of the effective date, the salary continuation period will be extended by one month for each complete month worked beyond the first anniversary, up to a maximum of 24 months; |
| | (2) | Provided that Mr. McDonald is actively employed for the first 12 months of the performance period relating to a LTIP, he would be entitled to a pro-rata share of any LTIP target incentive awards (based on his active months of employment during the related performance period), provided that Mr. McDonald’s achievement of the financial performance metrics relating to such LTIP at the end of the fiscal month immediately preceding termination is equal to or greater than the established fiscal performance targets as of the end of such fiscal month, and provided that at the end of the full performance period, the financial performance metrics relating to such LTIP have also been achieved; and |
| | (3) | The next installment of the Cash Retention Award. |
In addition, if Mr. McDonald is terminated without cause, he will be entitled to continue in our benefits plan and pension plan, if applicable, during the statutory notice period under the Employment Standards Act (Ontario).
The table below provides estimated incremental payments to be made to Mr. McDonald assuming that the trigger occurred on the last business day of Fiscal 2011, being January 28, 2012, and during the first 12 months of employment as well as estimated incremental payments to be made to Mr. McDonald assuming the trigger occurred after the first 12 months of employment:
| | | | | | | | |
Compensation Element | | Termination by the Company
Without Just Cause during
first 12 months | | | Termination by the Company
Without Just Cause after first
12 months | |
Cash Compensation Payments | | | | | | | | |
Base Salary | | $ | 800,000 | (1) | | $ | 1,600,000 | (2) |
AIP (100% at target award level) | | | — | | | | — | |
Cash Retention Award | | $ | 250,000 | (3) | | $ | 250,000 | (3) |
Total Cash Compensation | | $ | 1,050,000 | | | $ | 1,850,000 | |
Long-Term Incentive Plan Payments | | | | | | | | |
LTIP (300% at target award level) | | | — | (4) | | $ | 1,133,333 | (5) |
Total Long-Term Incentive Plan | | | — | | | $ | 1,133,333 | |
Pension Plan Payments and Benefits Accrual | | | | | | | | |
Pension Plan and Benefits Accrual | | $ | 459 | (6) | | $ | 917 | (7) |
Total Pension Plan and Benefit Accrual | | $ | 459 | | | $ | 917 | |
| | | | | | | | |
TOTAL | | $ | 1,050,459 | | | $ | 2,984,250 | |
| | | | | | | | |
73
Notes:
| | (1) | We cannot accurately determine the actual incremental payments that would be made to the NEO, however, we have, in order to comply with the Executive Compensation Rules, attempted to estimate this payment based on compensation information available for Fiscal 2011. We would like to stress that these estimates are not indicative of actual payments that will be made to the NEO at a future date. For the purposes of this table, we have assumed that the triggering event occurred on the last business day of Fiscal 2011, being January 28, 2012. |
| | (2) | This amount is based on Mr. McDonald’s base salary in effect as of the last day of Fiscal 2011 continued for a period of 12 months. Pursuant to the McDonald Employment Agreement, Mr. McDonald’s annual base salary is set at $800,000. |
| | (3) | This amount is based on Mr. McDonald’s base salary in effect as of the last day of Fiscal 2011 continued for a period of 24 months. This represents the maximum period of salary continuation, if termination occurs after the first 12 months and granting one additional month for each completed month of employment beyond the first 12 months up to the 24-month maximum, being on June 2013. Pursuant to the McDonald Employment Agreement, Mr. McDonald’s annual base salary is set at $800,000. |
| | (4) | This amount represents the next installment in the Cash Retention Award pursuant to the McDonald Employment Agreement. |
| | (5) | Mr. McDonald would not be entitled to a pro-rata payment for the 2011-2013 LTIP as the condition of being Actively Employed for the first 12 months of the performance period, relating to the 2011-2013 LTIP, would not be satisfied. |
| | (6) | This amount represents a pro-rata payment for 17 out of 36 months of the 2012-2014 LTIP that Mr. McDonald would be entitled to pursuant to the McDonald Employment Agreement assuming termination occurs in June 2013 coinciding with the achievement of the maximum salary continuation period (see (2) above). Mr. McDonald’s financial performance metrics as at the end of the fiscal quarter immediately preceding termination being the first quarter ending April 2013 cannot be accurately determined and is assumed to be equal to the established fiscal performance targets triggering payment. Mr. McDonald would not be entitled to a pro-rata payment for the 2011-2013 LTIP as the condition of being Actively Employed for the first 12 months of the performance period, relating to the 2011-2013 LTIP, would not be satisfied. |
| | (7) | This amount represents the cost to us for Mr. McDonald’s continued participation in our benefit and pension programs, based on his coverage in effect as of last day of Fiscal 2011, for a period of one week, representing the statutory notice period under the Employment Standards Act (Ontario). |
| | (8) | This amount represents the cost to us for Mr. McDonald’s continued participation in our benefit and pension programs, based on his coverage in effect as of last day of Fiscal 2011, for a period of two weeks, assuming termination occurs in June 2013 coinciding with the achievement of the maximum salary continuation period, (see (2) above), representing the statutory notice period under the Employment Standards Act (Ontario). |
DENE L. ROGERS
Former President and Chief Executive Officer (until June 2011)
Mr. Rogers’ employment ended on June 22, 2011. Under the relevant provisions of Mr. Rogers’ employment agreement, Mr. Rogers was entitled to the following payments upon termination:
Termination by the Corporation Without Just Cause
Salary
The salary he would have earned for the 12 month period following the termination date, using the salary in effect immediately prior to the termination date;
74
AIP
An amount equivalent to his annual target under the AIP for the entire plan year in which the termination occurred. Mr. Rogers will also receive a pro-rata amount equivalent to his annual target under the AIP for the plan year immediately following the year in which the termination occurs, based on the ratio of the number of days in the AIP performance period completed during the 12 month severance period, but excluding any part of the 12 month period already taken into account under the preceding AIP plan year;
Pension Plan
A lump sum payment comprised of the cost to us of the contributions to our pension plans on Mr. Rogers’ behalf over the shorter of the remainder of the Term or Notice Period using the normal contribution levels in effect immediately prior to the termination date;
Any rights, entitlements, benefits and payments arising or accruing to Mr. Rogers during his employment or after the termination of his employment, pursuant to the express applicable provisions of our pension plans; and
LTIP
A pro-rata share of Mr. Rogers’ 2009-2011 LTIP target incentive award (based on Mr. Rogers’ active whole months of employment during the performance period of the 2009-2011 LTIP), provided that Mr. Rogers’ achievement of financial performance metrics as of the end of the fiscal quarter immediately preceding resignation is equal to or greater than the established financial performance targets as of the end of the fiscal quarter.
The table below provides for the termination-related payments made to or to be made to Mr. Rogers as a result of the cessation of his employment with us on June 22, 2011:
| | | | |
Compensation Element | | Termination by
the Company
Without Just
Cause | |
Cash Compensation Payments | | | | |
Base Salary | | $ | 700,910 | (1) |
2011 AIP (90% at target award level) | | $ | 630,819 | (2) |
2012 AIP (90% at target award level) | | $ | 251,288 | (3) |
Total Cash Compensation | | $ | 1,583,017 | |
Long-Term Incentive Plan Payments | | | | |
2009-2011 LTIP (300% at target award level) | | $ | 507,842 | (4) |
Total Long-Term Incentive Plan | | $ | 507,842 | |
Pension Plan Payments and Benefits Accrual | | | | |
Benefits Accrual | | $ | 993 | (5) |
Pension Plan | | $ | 15,652 | (6) |
Total Pension Plans and Benefit Accrual | | $ | 16,645 | |
| | | | |
TOTAL | | $ | 2,107,504 | |
| | | | |
Notes:
We cannot accurately determine the actual incremental payments that will be made at time of payment for 2011 AIP and 2012 AIP, as amounts will be converted from U.S. dollars to Canadian dollars at time of payment however, we have, in order to comply with the Executive Compensation Rules, attempted to estimate these payments. All amounts have been converted from U.S. dollars to Canadian dollars at the Bank of Canada closing rate of $1.0013 on January 27, 2012 being the last day of trading during Fiscal 2011.
| | (1) | This amount is based on Mr. Rogers’ base salary in effect immediately prior to the termination date of June 22, 2011 continued for a period of 12 months from the date employment ceased. Pursuant to |
75
| | Mr. Rogers’ employment agreement, Mr. Rogers’ annual base salary was set at $700,000 U.S. For the purposes of this table, this amount was converted from U.S. dollars to Canadian dollars at the Bank of Canada rate of $1.0013 on January 27, 2012. |
| | (2) | This amount represents an equivalent payment for the entire 2011 AIP performance period derived from target Fiscal 2011 AIP figures. |
| | (3) | This amount represents an equivalent pro-rata payment for the 2012 AIP performance period derived from target Fiscal 2011 AIP figures, based on the ratio of number of completed days, being 145 days, during Mr. Rogers 12 month Notice Period not already accounted for under the 2011 AIP performance period. |
| | (4) | This amount represents a pro-rata payment for the 2009-2011 LTIP that Mr. Rogers would be entitled to pursuant to Mr. Rogers’ employment agreement, based on 28 months of Active Employment during 2009-2011 LTIP. Mr. Rogers financial performance metrics as at the end of the fiscal quarter immediately preceding termination, being first quarter 2011 ending April 2, 2011, for the AIP EBITDA goal was below the established targets however the Cash Goal was above the established financial performance targets and therefore Mr. Rogers will receive an LTIP payment for 2009-2011 LTIP for the Cash goal component. |
| | (5) | This amount represents a lump sum payment to Mr. Rogers and is comprised of the amount payable by us for our contributions to the DC component of the pension plan for a period of three months until October 1, 2011, representing the shorter period between the lapse of term or 12 months. The amount of DB pension accrued for the period of three months cannot be determined and is not represented in the value above. This payment was made to Mr. Rogers during Fiscal 2011. |
| | (6) | This amount represents the cost to us for Mr. Rogers’ continued participation in our benefit programs, based on his coverage in effect as of June 22, 2011, for a period of five weeks, representing the statutory notice period under the Employment Standards Act (Ontario). |
SHARON R. DRISCOLL
Senior Vice-President and Chief Financial Officer
The termination provisions of Ms. Driscoll’s employment agreement specify that in the event we terminate Ms. Driscoll’s employment on a without just cause basis, Ms. Driscoll will be entitled to the greater of:
| | (i) | 12 months of base salary; or |
| | (ii) | two weeks’ base pay for each completed year of service to a maximum of 78 weeks of base pay (which is inclusive of all termination and severance pay to which Ms. Driscoll may be entitled in accordance with the applicable employment standards legislation); or |
| | (iii) | such base pay in lieu of notice and severance pay, if applicable, as required under the applicable employment standards legislation, as may be amended. |
(each of (i), (ii) and (iii) above, a Severance Period).
In the absence of just cause, Ms. Driscoll’s employment agreement provides for the continuance of all benefits (including perquisites) during the Severance Period.
76
The table below provides for the estimated incremental payments to be made to Ms. Driscoll assuming that the triggering event occurred on the last business day of Fiscal 2011, being January 28, 2012.
| | | | |
Compensation Element | | Triggering Event:
Termination by
the Company
Without Just
Cause | |
Cash Compensation Payments | | | | |
Base Salary | | $ | 375,000 | (1) |
Total Cash Compensation | | $ | 375,000 | |
Pension Plan Payments, Benefits Accrual and Perquisites | | | | |
Pension Plan and Benefits Accrual | | $ | 25,033 | (2) |
Perquisites | | $ | 37,597 | (3) |
Total Pension, Benefits and Perquisite Plans | | $ | 62,630 | |
| | | | |
TOTAL | | $ | 437,630 | |
| | | | |
Notes:
We cannot accurately determine the actual incremental payments that would be made to the NEO, however we have, in order to comply with the Executive Compensation Rules, attempted to estimate these payments based on compensation information available for Fiscal 2011. We would like to stress that these estimates are not indicative of actual payments that will be made to the NEO at a future date. For the purposes of this table, we have assumed that the triggering event occurred on the last business day of Fiscal 2011, being January 28, 2012.
| | (1) | This amount represents payment to Ms. Driscoll based on her receiving 12 months’ base salary in lieu of notice. Ms. Driscoll’s salary as at January 28, 2012 was $375,000. |
| | (2) | This amount represents benefits accrual and pension plan payments that Ms. Driscoll would be entitled to as per her employment agreement. Ms. Driscoll would receive these payments, based on her coverage in effect as of last day of Fiscal 2011, for a period of 12 months. |
| | (3) | This amount represents perquisites program payments that Ms. Driscoll would be entitled to as per her employment agreement. Ms. Driscoll would receive these payments for a period of 12 months. |
THOMAS FITZGERALD
Executive Vice-President and Chief Administrative Officer
We entered into an employment agreement in May 2011 with Mr. Fitzgerald, or the Fitzgerald Employment Agreement. The Fitzgerald Employment Agreement provides for termination payments to Mr. Fitzgerald in the event Mr. Fitzgerald’s employment is terminated following his relocation to Toronto, Ontario, Canada. If we change Mr. Fitzgerald’s reporting relationship, Mr. Fitzgerald can make a claim for terminating his employment on a without cause basis. Any termination on a without cause basis would trigger the following incremental payment:
If Terminated Following Relocation to Toronto, Ontario, Canada
Mr. Fitzgerald will be provided with the greater of:
| | (i) | 12 months of base pay and 75% of his targeted AIP; or |
| | (ii) | two weeks’ notice (or base pay in lieu of notice or a combination thereof) for each completed year of service to a maximum of 78 weeks of base pay. |
If we terminate Mr. Fitzgerald’s employment without cause, Mr. Fitzgerald would be entitled to continue in our benefits plan and pension plan during the severance period in accordance with the applicable employment standards legislation.
77
The table below provides for the estimated incremental payments to be made to Mr. Fitzgerald assuming that the triggering event occurred on the last business day of Fiscal 2011, being January 28, 2012.
| | | | |
Compensation Element | | Triggering Event:
Termination by
the Company
Without Just
Cause | |
| | | Following
Relocation to
Toronto, Ontario,
Canada | |
Cash Compensation Payments | | | | |
Base Salary | | $ | 650,000 | (1) |
AIP (75% at target award level) | | $ | 487,500 | (2) |
Total Cash Compensation | | $ | 1,137,500 | |
Pension Plan Payments and Benefits Accrual | | | | |
Pension Plan and Benefits Accrual | | $ | 400 | (3) |
Total Pension and Benefits Plans | | $ | 400 | |
| | | | |
TOTAL | | $ | 1,137,900 | |
| | | | |
Notes:
We cannot accurately determine the actual incremental payments that would be made to the NEO, however we have, in order to comply with the Executive Compensation Rules, attempted to estimate these payments based on compensation information available for Fiscal 2011. We would like to stress that these estimates are not indicative of actual payments that will be made to the NEO at a future date. For the purposes of this table, we have assumed that the triggering event occurred on the last business day of Fiscal 2011, being January 28, 2012.
| | (1) | This amount represents payment to Mr. Fitzgerald based on his receiving 12 months’ base salary in lieu of notice. Mr. Fitzgerald’s salary as at January 28, 2012 was $650,000. |
| | (2) | This amount represents payment to Mr. Fitzgerald based on his receiving an equivalent payment for 75% of his AIP target award derived from target Fiscal 2011 AIP figures. |
| | (3) | This amount represents benefits accrual and pension plan payments that Mr. Fitzgerald would be entitled to as per his employment agreement. Mr. Fitzgerald would receive these payments, based on his coverage in effect as of last day of Fiscal 2011, for a period of one week, representing the statutory notice period under the Employment Standards Act (Ontario). |
STEVEN GOLDSMITH
Executive Vice-President, Merchandising, Apparel and Accessories
We entered into an employment agreement with Mr. Goldsmith in July 2011, or the Goldsmith Employment Agreement. The Goldsmith Employment Agreement provides for termination payments to Mr. Goldsmith in the event Mr. Goldsmith’s employment is terminated prior to or following his relocation to Toronto, Ontario, Canada. If we change Mr. Goldsmith’s reporting relationship, Mr. Goldsmith can make a claim for terminating his employment on a without cause basis. Any termination on a without cause basis would trigger the following incremental payments:
If Terminated 12 Months Following the Effective Date or Prior to Relocation to Toronto, Ontario, Canada
Mr. Goldsmith will receive six months of his base salary as severance, which will be subject to standard deductions.
If Terminated Following Relocation to Toronto, Ontario, Canada
Mr. Goldsmith will be provided with the greater of:
| | (i) | 12 months of base pay; or |
| | (ii) | two weeks’ notice (or base pay in lieu of notice or a combination thereof) for each completed year of services to a maximum of 78 weeks of base pay. |
78
If we terminate Mr. Goldsmith’s employment without cause, Mr. Goldsmith would be entitled to continue in our benefits plan and pension plan during the severance period in accordance with the applicable employment standards legislation.
The table below provides for the estimated incremental payments to be made to Mr. Goldsmith assuming that the triggering event occurred on the last business day of Fiscal 2011, being January 28, 2012.
| | | | | | | | |
Compensation Element | | Triggering Event:
Termination by the Company Without Just
Cause | |
| | | Terminated within
12 months of the
effective date of
employment or
prior to relocation
to Toronto,
Ontario, Canada | | | Termination following
relocation to Toronto,
Ontario, Canada. | |
Cash Compensation Payments | | | | | | | | |
Base Salary | | $ | 312,500 | (1) | | $ | 625,000 | (2) |
AIP (75% at target award level) | | | — | | | | — | |
Total Cash Compensation | | $ | 312,500 | | | $ | 625,000 | |
Pension Plan Payments and Benefits Accrual | | | | | | | | |
Pension Plan and Benefits Accrual | | $ | 445 | (3) | | $ | 445 | (3) |
Total Pension and Benefits Plans | | $ | 445 | | | $ | 445 | |
| | | | | | | | |
TOTAL | | $ | 312,945 | | | $ | 625,445 | |
| | | | | | | | |
Notes:
We cannot accurately determine the actual incremental payments that would be made to the NEO, however we have, in order to comply with the Executive Compensation Rules, attempted to estimate these payments based on compensation information available for Fiscal 2011. We would like to stress that these estimates are not indicative of actual payments that will be made to the NEO at a future date. For the purposes of this table, we have assumed that the triggering event occurred on the last business day of Fiscal 2011, being January 28, 2012.
| | (1) | This amount represents payment to Mr. Goldsmith based on his receiving six months’ base salary. Mr. Goldsmith’s salary as at January 28, 2012 was $625,000. |
| | (2) | This amount represents payment to Mr. Goldsmith based on his receiving 12 months’ base salary. Mr. Goldsmith’s salary as at January 28, 2012 was $625,000. |
| | (3) | This amount represents benefits accrual and pension plan payments that Mr. Goldsmith would be entitled to, based on his coverage in effect as of last day of Fiscal 2011, for a period of one week, representing the statutory notice period under the Employment Standards Act (Ontario). |
SCOTT SILVER
Former Executive Vice-President, Merchandising, Home and Hardlines (until November 2011)
Mr. Silver’s employment ended on November 29, 2011. Under the relevant provisions of Mr. Silver’s employment agreement, Mr. Silver was entitled to the following payments upon termination:
Termination by the Corporation Without Just Cause Following Relocation to Toronto, Ontario, Canada
Mr. Silver will be provided with the greater of:
| | (i) | 12 months of base pay; or |
| | (ii) | two weeks’ notice (or base pay in lieu of notice or a combination thereof) for each completed year of service to a maximum of 78 weeks of base pay. |
79
The table below provides for the termination-related payments made to or to be made to Mr. Silver as a result of the cessation of his employment on November 29, 2011:
| | | | |
Compensation Element | | Triggering Event:
Termination by the
Company Without
Just Cause | |
| | | Termination following
relocation to Toronto,
Ontario, Canada. | |
Cash Compensation Payments | | | | |
Base Salary | | $ | 575,000 | (1) |
Total Cash Compensation | | $ | 575,000 | |
Pension Plan Payments and Benefits Accrual | | | | |
Pension Plan and Benefits Accrual | | $ | 372 | (2) |
Total Pension and Benefits Plans | | $ | 372 | |
| | | | |
TOTAL | | $ | 575,372 | |
| | | | |
Notes:
We would like to stress that in order to comply with the Executive Compensation Rules, we have attempted to estimate these payments, the amounts stated above represent estimates that are not indicative of actual payments that will be made to the NEO at a future date.
| | (1) | This amount represents payment to Mr. Silver based on his receiving 12 months’ base salary from the effective date his employment ceased. Mr. Silver’s salary as at November 29, 2011 was $575,000. |
| | (2) | This amount represents the cost to us for the continuation of participation in our benefits and pension plan for Mr. Silver for a period of one week, representing the statutory notice period under the Employment Standards Act (Ontario). |
DOUGLAS CAMPBELL
Executive Vice-President, Home & Hardlines, Major Appliances and Electronics
The termination provisions of Mr. Campbell’s employment agreement specify that in the event that we terminate Mr. Campbell’s employment on a without cause basis following the move of his primary residence to Southern Ontario, Mr. Campbell will be entitled to the greater of:
(i) 12 months of base salary; or
(ii) two weeks’ notice (or base pay in lieu of notice or a combination thereof) for each completed year of service to a maximum of 78 weeks of base pay (which is inclusive of all termination and severance pay to which Mr. Campbell may be entitled in accordance with the applicable employment standards legislation).
If we terminate Mr. Campbell’s employment on a without cause basis prior to the move of his primary residence to Southern Ontario, he would receive payment equal to 22 weeks of his base pay. If we terminate Mr. Campbell’s employment without cause, Mr. Campbell would be entitled to continue in our benefits plan and pension plan during the severance period in accordance with the applicable employment standards legislation.
80
| | | | |
Compensation Element | | Triggering Event:
Termination by
the Company
Without Just
Cause | |
Cash Compensation Payments | | | | |
Base Salary | | $ | 139,057 | (1) |
Total Cash Compensation | | $ | 139,057 | |
Pension Plan Payments and Benefits Accrual | | | | |
Pension Plan and Benefits Accrual | | | — | (2) |
Perquisites | | $ | 13,699 | (3) |
Total Pension, Benefits and Perquisite Plans | | $ | 13,699 | |
| | | | |
TOTAL | | $ | 152,756 | |
| | | | |
Notes:
We cannot accurately determine the actual incremental payments that would be made to the NEO, however we have, in order to comply with the Executive Compensation Rules, attempted to estimate these payments based on compensation information available for Fiscal 2011. We would like to stress that these estimates are not indicative of actual payments that will be made to the NEO at a future date. For the purposes of this table, we have assumed that the triggering event occurred on the last business day of Fiscal 2011, being January 28, 2012.
| | (1) | This amount represents payment to Mr. Campbell based on his receiving 22 weeks base salary in lieu of notice. Mr. Campbell’s salary as at January 28, 2012 was $335,000. |
| | (2) | As of January 28, 2012, Mr. Campbell was not a participant in our benefits and pension programs. |
| | (3) | This amount represents perquisites program payments that Mr. Campbell would be entitled to. Mr. Campbell would receive these payments for a period of two weeks, representing the statutory notice under the Employment Standards Act (Ontario). |
81
Performance Graph
The following graph compares the cumulative total shareholder return on our shares over the last five fiscal years with the cumulative total shareholder return of the S&P/TSX Composite Index over the same period, based on an investment of $100.00. In each case, the total shareholder return shown in the graph includes the reinvestment of all dividends paid.
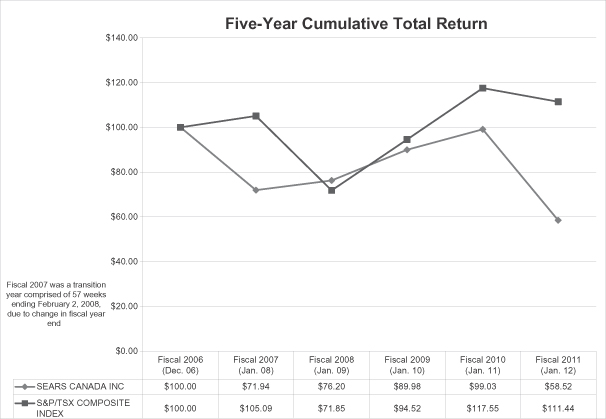
The indicator used to measure our performance was changed from Earnings Per Share (EPS) to EBITDA in the 2006 fiscal year. Our compensation philosophy is intended to establish a relationship between executive compensation and corporate results. The total NEO compensation increased during the 2006, 2008, 2009, and 2010 fiscal years corresponding to an improvement in our total shareholder return, or TSR, value. Similarly, the NEO compensation decreased during Fiscal 2007 (being the 52 week period ended February 2, 2008) and Fiscal 2011 corresponding with the downward trend of our TSR value. Our TSR value graphed above reflects two extraordinary cash dividends, each of $3.50 per share, paid to shareholders in Fiscal 2010.
Between May 25, 2011 and May 24, 2012, pursuant to our Normal Course Issuer Bid, through the facilities of the TSX, the Company was permitted to purchase for cancellation up to 5% of its outstanding common shares, representing approximately 5.2 million common shares.
Director Compensation
Our compensation philosophy surrounding Independent Director compensation is principled on taking a non-risk based approach in order to encourage suitable governance through unbiased decision-making. The Independent Directors’ compensation is reviewed by the Governance Committee generally every two to three years. The most recent review of Independent Director compensation was performed in Fiscal 2010 and resulted
82
in a change to the compensation of the Lead Director. Directors who are our employees, or employees of our affiliates, including Sears Holdings, do not receive compensation as directors. In February 2011, the Board made a decision to reimburse William C. Crowley for travel expenses associated with attending shareholder, Board and Board committee meetings.
The Governance Committee may, if appropriate and timely, engage an independent consulting firm to conduct a comprehensive survey of prevailing market trends and practices in director compensation and obtain a report on its findings and recommendations. The Governance Committee may then evaluate the report received and make appropriate recommendations to the Board with respect to the compensation of the Independent Directors based on the findings and recommendations of such report. Management of the Corporation may also assist the Governance Committee in determining market trends and practices with respect to director compensation.
Compensation Earned
For Fiscal 2011, the Independent Directors’ compensation was based on the following categories:
| | | | |
Director Compensation Category | | Compensation | |
Annual Retainer | | $ | 60,000 | |
Committee Retainer | | $ | 5,000 | |
Chair Retainer (HRCC, Governance Committee, Investment Committee) | | $ | 5,000 | |
Chair Retainer (Audit Committee) | | $ | 15,000 | |
Lead Director Retainer | | $ | 25,000 | |
Meeting Fee | | $ | 1,500 | |
Travel Fee | | $ | 2,000 | (1) |
Administration Expense Allowance | | $ | 500 | |
| (1) | Independent Directors receive a travel fee of $2,000 when attending an annual or special meeting of shareholders, board or committee meetings, which require air travel. |
Director Compensation Table
The following table provides a summary of compensation paid to the directors in Fiscal 2011.
| | | | | | | | | | | | |
Name (a) | | Fees earned (1)
($)
(b) | | | All other
compensation(2)
($)
(g) | | | Total
($)
(h) | |
William C. Crowley (3) | | | — | | | | — | | | | — | |
E. J. Bird | | | 142,500 | | | | 5,929.18 | | | | 148,429.18 | |
William R. Harker (4) | | | — | | | | — | | | | — | |
R. Raja Khanna | | | 97,000 | | | | 994.61 | | | | 97,994.61 | |
James McBurney | | | 96,000 | | | | 12,867.26 | | | | 108,867.26 | |
Calvin McDonald (5) | | | — | | | | — | | | | — | |
Deidra C. Merriwether (6) | | | — | | | | — | | | | — | |
Dene L. Rogers (7) | | | — | | | | — | | | | — | |
Deborah E. Rosati | | | 105,000 | | | | 2,722.32 | | | | 108,222.32 | |
Notes:
| (1) | Includes all fees earned and paid in cash to the directors, including the annual retainers for Board committee, and chair, meeting fees, travel fees, and annual administration allowance, as well as an additional fee paid to the Lead Director. |
83
| (2) | Includes payment for expenses, such as airfare, accommodation and transportation, incurred by the director in order to attend a shareholder, Board or board committee meeting. |
| (3) | Mr. Crowley is a Non-Independent Director and does not receive any compensation for his service on the Board. In February 2011, the Board made a decision to reimburse Mr. Crowley for all future travel expenses associated with attending shareholder, Board and board committee meetings. |
| (4) | Mr. Harker is a Non-Independent Director and does not receive any compensation for his service on the Board. |
| (5) | Mr. McDonald is the President and Chief Executive Officer of the Company and is a Non-Independent Director. Mr. McDonald does not receive compensation for his service on the Board. Mr. McDonald’s compensation as a Named Executive Officer is reflected in the Summary Compensation Table, above. |
| (6) | Ms. Merriwether was a Non-Independent Director and did not receive any compensation for her service on the Board. Ms. Merriwether resigned from the Board on May 21, 2012. |
| (7) | Mr. Rogers served as our President and Chief Executive Officer until June 22, 2011. Mr. Rogers did not receive compensation for his service on the Board. Mr. Rogers’ compensation as a Named Executive Officer is reflected in the Summary Compensation Table, above. |
Equity-Based Director Compensation Programs
Directors’ Share Purchase Plan
A Directors’ Share Purchase Plan, or the Share Purchase Plan, was established in 1995 to link a portion of the compensation paid to the Independent Directors with our performance and the return to shareholders. Since the last grant in 2005, we discontinued the granting of shares under the Share Purchase Plan.
Stock Option Plan for Directors
In 1998, we established the Stock Option Plan for Directors of the Company, or the Stock Option Plan for Directors, to provide for the grant of stock options and SARs to the Independent Directors. Following the last grant in 2003, we discontinued the granting of stock options to the Independent Directors. There are currently no vested or unvested stock options outstanding pursuant to the Stock Option Plan for Directors.
Aggregated Option/SARs Exercises of Independent Directors during Fiscal 2011
The following table sets out the number of shares issuable under the Stock Option Plan for Directors for Fiscal 2011.
| | | | | | | | |
Stock Option Plan for Directors
(for the year ended January 28, 2012) | | # of Shares | | | % of outstanding capital | |
Shares issued under Plan | | | 0 | | | | 0.00 | % |
Shares issuable under Plan | | | 250,000 | | | | 0.24 | % |
Shares issuable under grants made | | | 0 | | | | 0.00 | % |
The Independent Directors do not hold any stock options.
Director Share Ownership Policy
Since April 2004, each Independent Director was expected to acquire and own shares equal in value to five times his or her annual cash retainer within five years of being elected or appointed to the Board. Effective January 1, 2007, and reflective of the fact that Independent Directors must now purchase common shares in the open market rather than be granted shares by the Company, the Share Ownership Policy was amended such that Independent Directors are now suggested to acquire and hold shares equal in value to their annual cash retainer (currently $60,000 as of January 1, 2007) within three years of being elected or appointed to the Board.
84
Indebtedness of Directors, Executive Officers and Employees
As at March 15, 2012, the aggregate indebtedness of all employees and former employees of the Company to the Company and its subsidiaries was approximately $19,318.88 for loans made to employees under the Company’s housing relocation assistance program. None of this indebtedness is in respect of directors or executive officers of the Company. During Fiscal 2011, there was no indebtedness of directors, proposed director nominees or executive officers, or former directors or executive officers of the Company to the Company or any of its subsidiaries.
6.C. BOARD PRACTICES
Board of Directors
The Board believes that strong corporate governance practices are essential to our success, effective corporate performance and the best interests of shareholders. The Governance Committee oversees corporate governance, on behalf of the Board, including the methods and processes for evaluating Board effectiveness and performance. The Governance Committee is responsible for reviewing the corporate governance guidelines, policies and requirements adopted from time to time by applicable securities regulatory authorities, and guiding us in our approach and practices with respect to such matters.
Composition
The size of the Board has been fixed at eight. Four of the current eight directors, namely, E. J. Bird, R. Raja Khanna, James McBurney and Deborah E. Rosati, are Independent Directors while the other four, namely, William C. Crowley, William R. Harker, Calvin McDonald and Donald C. Ross, are Non-Independent Directors. Mr. Crowley and Mr. Harker are former executive officers of ESL and Mr. Harker is an executive officer of Sears Holdings. Mr. McDonald is an executive officer of the Company. Mr. Ross is a partner of Osler, Hoskin & Harcourt LLP, which serves as external counsel to Sears Holdings. The preceding directors are considered to be Non-Independent Directors as a result of their relationship with us, Sears Holdings and its affiliated entities. Mr. Crowley is also Chairman of the Board.
The Board takes various measures to facilitate the exercise of independent judgment by its directors in carrying out their responsibilities, including:
| | • | | The holding of an in camera session following each Board and committee meeting without management present; |
| | • | | The holding of separate meetings of Independent Directors after each regularly scheduled Board and Committee meeting; |
| | • | | The appointment of a Lead Director (see below under the heading “Chairman of the Board and Lead Director”); |
| | • | | Engaging in frequent discussions with our management; and |
| | • | | Retaining external advisors. |
Chairman of the Board and Lead Director
In view of the fact that Mr. Crowley, Chairman of the Board, is a Non-Independent Director, the Board has appointed E. J. Bird, an Independent Director, to serve as the Lead Director of the Board. The Lead Director serves to provide the Board with an independent perspective pertaining to its oversight activities and enhances our ability to identify and resolve conflicts of interest. In addition, the Lead Director acts as a liaison between the Chairman of the Board and the Independent Directors on sensitive issues and collaborates with the Chairman to provide guidance so as to ensure the Board successfully carries out its duties.
85
Meetings of the Independent Directors
Independent Directors meet separately at each regularly scheduled Board or committee meeting, following an in camera session in which the directors meet without the presence of management. The Independent Directors are also encouraged to meet from time to time as may be necessary. The Board encourages the Independent Directors to engage in open and candid discussion as they see fit.
Attendance at Board and Committee Meetings
The Board has five regularly scheduled meetings each year. Additional meetings of the Board are held as required. Four meetings of the Board were held in Fiscal 2011. We do not have an executive committee of the Board. The number of meetings held by the Committees of the Board in Fiscal 2011 is set out below:
| | | | |
Board Committee | | Meetings held in Fiscal 2011 | |
Audit Committee | | | 7 | |
Governance Committee | | | 2 | |
HRCC | | | 3 | |
Investment Committee | | | 5 | |
Directors are expected to maintain a 100% attendance record with respect to all Board and committee meetings. If a director’s attendance falls below 75% for either a Board or committee meeting, the director’s attendance record will be reviewed by the Governance Committee.
Board Mandate
The mandate of the Board is to oversee our business and affairs and provide guidance and direction to our management in order to attain corporate objectives and maximize shareholder value.
Position Descriptions
Written position descriptions for the chair of each Board Committee have been developed and are set out in the charters of each committee. In addition, position descriptions have been developed for the Chairman of the Board and the Chief Executive Officer and are set out in the mandate of the Chairman of the Board and the mandate of the Chief Executive Officer, respectively, which are available at www.sears.ca.
Orientation and Continuing Education
Management provides an orientation and ongoing education program for directors during which information regarding the role of the Board, its committees and directors is provided. The directors receive updates on emerging trends in business and corporate governance. We periodically review our orientation and education program to enhance its currency and effectiveness. On an annual basis, we host a special session with the directors to have an in-depth discussion regarding our strategic plan. The most recent strategic session was held in September 2011, which included a review of our key businesses and a presentation regarding our three-year transformation plan to build for tomorrow. Regular updates are provided to the directors regarding our operation and our strategic business plan in addition to industry-related information on business developments and the competitive landscape.
Ethical Business Conduct
Honesty and integrity are essential to good corporate governance and, to that end, we have adopted a Code of Business Conduct, or the Code of Conduct. The Code of Conduct applies to every executive officer and employee. It provides guidelines and sets out expectations regarding interactions with customers, investors,
86
governmental authorities and suppliers of merchandise and services, and among employees. The Code of Conduct also sets out the ethical values and standards of behavior that apply to all of our business activities, including such matters as fair dealing, conduct in the workplace, conflicts of interest, corporate property and records, and compliance with the laws of all jurisdictions in which we conduct business.
Management reports regularly to the Audit Committee on compliance with the Code of Conduct. Executive officers and employees are required to acknowledge annually, in writing, their understanding of, and compliance with, the Code of Conduct.
Although the Code of Conduct does not apply to the directors, a culture of ethical business conduct among directors is promoted by the mandate of the Board. The mandate of the Board requires that directors observe two standards of conduct: a fiduciary standard which requires directors to act honestly and in good faith with a view to the best interests of the Company, and a performance related standard which requires directors to exercise the care, diligence and skill that a reasonably prudent person would exercise in comparable circumstances. The mandate of the Board also requires that the Board satisfy itself that the Chief Executive Officer and other senior management personally exhibit and create a culture of integrity throughout the Company. The CBCA establishes similar standards of conduct for directors.
As required under the CBCA, a director and executive officer is also required to disclose to us any interest that he or she has in a material contract or a material transaction. A director in a conflict of interest may not, subject to certain exceptions under the CBCA, vote on a matter in respect of which a director has an interest. It is the Board’s practice that directors are required to abstain from any discussions or meetings regarding any matters in which they have a material interest. In addition, the mandate of the Lead Director requires the Lead Director to review conflict of interest issues with respect to the Board as they arise.
Our Disclosure, Confidentiality and Insider Trading Policy is also applicable to directors, executive officers and employees (see below under the heading “Disclosure, Confidentiality and Insider Trading Policy”).
We have established the Sears Canada Ethics Hotline which provides a confidential and anonymous communication channel for employees and other stakeholders to report suspected breaches of the Code of Conduct, concerns regarding business ethics related to the Company, and accounting, internal accounting controls, and auditing matters.
The Code of Conduct, mandate of the Board, mandate of the Lead Director and information pertaining to the Sears Canada Ethics Hotline can be found on our website at www.sears.ca or by contacting the Company’s Corporate Communications Department at (416) 941-4425.
See Item 7.B. “Major Shareholders and Related Party Transactions – Related Party Transactions – Conflicts of Interest and Fiduciary Duties”.
Disclosure, Confidentiality and Insider Trading Policy
We have adopted a Disclosure, Confidentiality and Insider Trading Policy, or the Disclosure Policy, which reflects our commitment to providing timely and accurate corporate information to the capital markets, including our shareholders, and to the general public. The Disclosure Policy provides direction and guidance to directors, executive officers and employees regarding confidentiality and disclosure of corporate information, insider trading obligations and sanctions for non-compliance. The Disclosure Policy requires prompt general disclosure of any material information. It also sets out the procedures to be followed in communicating with investors, analysts and the media. A Disclosure Policy committee, comprised of senior management representatives, which meets on an ad hoc basis, has been established to administer the Disclosure Policy.
87
Board Committees
The Board has four committees: the Audit Committee, the HRCC, the Governance Committee and the Investment Committee. Each committee has a written charter and has the authority to engage, independent from management and at our expense, external advisors, including legal counsel and other expert advisors, as it deems appropriate, to assist it in the performance of its duties.
Audit Committee
During Fiscal 2011, the Audit Committee was comprised of four Independent Directors. As of the date hereof, the Audit Committee members are as follows: E. J. Bird, R. Raja Khanna, James McBurney and Deborah E. Rosati, all of whom are Independent Directors and financially literate. The purpose of the Audit Committee is to assist the Board in its oversight of:
| | • | | The integrity of our financial reporting; |
| | • | | The independence, qualifications, appointment and performance of our external auditors; |
| | • | | The mandate and performance of our internal audit department according to the Internal Audit Department Charter, which was implemented in 2009; |
| | • | | The operation of the Sears Canada Ethics Hotline; |
| | • | | The functioning of our risk oversight subcommittee, or ROC, and its processes; and |
| | • | | Management’s responsibility for reporting on internal controls. |
The Audit Committee meets approximately five times a year and holds an in camera session after each regularly scheduled meeting without the presence of management. The Audit Committee also meets in camera with its external auditors and the Independent Directors also meet separately after each regularly scheduled meeting.
The ROC is responsible for identifying, assessing and monitoring our principal risks and ensuring that management has a structured process in place for managing, mitigating and controlling those risks as set out in its charter. The ROC reports directly to the Audit Committee on a quarterly basis. The ROC meets at least four times a year and the Senior Vice-President and Chief Financial Officer serves as chair for these meetings. The ROC has the authority to engage external experts, if necessary.
Human Resources and Compensation Committee
For Fiscal 2011, the membership of the HRCC was comprised of one Independent Director, being Deborah E. Rosati and three Non-Independent Directors, being William C. Crowley, William R. Harker and Deidra C. Merriwether. The current members of the HRCC are Deborah E. Rosati, William C. Crowley and William R. Harker.
The Board believes that the composition of the HRCC reflects a high level of “compensation” literacy. Each member brings their own individual expertise to the committee, including financial, human resources, investment and retail knowledge, and is able to utilize that knowledge to assess and implement our compensation policies and practices. Three of the committee members have held senior positions with Sears Holdings for several years, one of which was responsible for the Human Resources department of Sears Holdings. In addition, the Chair of the committee has held this position since 2007 and is well versed in our compensation policies.
The Board delegates the responsibility of determining the compensation of the officers to the HRCC. To ensure that an objective process is established and followed for determining executive compensation, the HRCC (i) engages independent external advisors, when necessary, and (ii) considers market-competitive and industry-specific compensation practices.
88
The purpose of the HRCC is to assist the Board in its oversight responsibilities relating to:
| | • | | The development of our overall human resources strategy for fair and competitive compensation of all of our officers, senior vice-presidents and vice-presidents, or the Senior Leadership Team, in support of the achievement of our business strategy, as well as the development of other significant compensation programs for the benefit of all employees; |
| | • | | The development of the Chief Executive Officer’s goals and objectives and the evaluation of his or her performance against these goals; and |
| | • | | The succession plan for, and the compensation of, the Senior Leadership Team. |
The responsibilities of the HRCC include the following:
| | • | | Approve our compensation and human resources strategy to ensure it is aligned with our goals and objectives and assess the competitiveness and appropriateness of our policies and internal equity relating to the Senior Leadership Team’s compensation; |
| | • | | Review and approve, at least annually, the design of our compensation policies and practices, senior management’s base salaries, based on market competitiveness and level of responsibility, and all employee-related short and long-term incentive plans together with performance targets in support of our business strategy, achievement of performance goals at the end of each plan cycle, and any payments pursuant to such incentive plans to the Senior Leadership Team and, in summary form, to other eligible plan participants; |
| | • | | Review and approve our pension and benefit plans and perquisite programs and any material changes thereto; |
| | • | | Establish performance targets and corporate goals and objectives relevant to the Chief Executive Officer’s compensation and evaluate the Chief Executive Officer’s performance in light of such targets; |
| | • | | Determine and recommend annually the Chief Executive Officer’s compensation based on the HRCC’s evaluation of the Chief Executive Officer’s performance; |
| | • | | Review and recommend for approval by the Board, any employment agreements relating to the Chief Executive Officer and approve any employment agreements relating to executive vice-presidents and senior vice-presidents who are officers, and report its conclusions to the Board; |
| | • | | Make recommendations on the proposed appointment or reassignment of executive vice-presidents and senior vice-presidents who are officers; |
| | • | | Review and approve, at least annually, all compensation, any changes to compensation and the compensation of newly appointed executive vice-presidents and senior vice-presidents; |
| | • | | Review and approve, the aggregate amounts allocated to management, other than senior management, pursuant to short and long-term incentive plans; |
| | • | | Review the annual performance assessments, the executive organizational structure and succession plans for senior management (only the Board may approve the succession plan for the CEO and appoint executive vice-presidents and senior vice-presidents); and |
| | • | | Review and approve the committee’s executive compensation report in the annual management proxy circular. |
The HRCC considers the implications of risks including reviewing program design and financial liability of all existing plans at least annually. The HRCC also approves the introduction of all new annual plans and proposed design changes, as recommended by the Company, after assessing the risk and financial liability of
89
each program and the competitive position in the market. Decisions are approved on the basis of pay-for-performance without exposing us to inappropriate risk. Where such potential exists to influence the behavior of an NEO, appropriate action is taken to discourage such behavior.
The HRCC meets at least two times per year and holds an in camera session after each regularly scheduled meeting without the presence of management. The Independent Directors also meet separately after each regularly scheduled meeting.
Governance Committee
During Fiscal 2011 and as of the date hereof, the Governance Committee was comprised of three Independent Directors, being R. Raja Khanna, James McBurney and Deborah E. Rosati.
The purpose of the Governance Committee is to assist the Board to:
| | • | | Develop, implement and oversee compliance with the Board’s corporate governance policies, practices and procedures; |
| | • | | Identify candidates to be nominated for election or appointment to the Board; |
| | • | | Determine the compensation of the Independent Directors for their service to the Board and its committees; and |
| | • | | Assess the performance and effectiveness of the Board and its committees. |
The responsibilities of the Governance Committee include the following:
| | • | | Review the size and composition of the Board; |
| | • | | Develop a policy setting out the appropriate criteria for the selection of directors; |
| | • | | Recommend qualified candidates to be nominated for election or appointment to the Board; |
| | • | | If appropriate, engage an independent consulting firm to assist in identifying qualified candidates; |
| | • | | Review Independent Directors’ compensation and recommend appropriate changes; |
| | • | | Conduct a board effectiveness survey, which also includes a director evaluation component and director peer review to evaluate the performance and effectiveness of the Board and the Chairman of the Board, the Board’s committees and their respective chairs; |
| | • | | Review the adequacy of the orientation and education program for new directors and the ongoing educational presentations to incumbent directors; |
| | • | | Review the corporate governance statements in our annual report and management proxy circular; and |
| | • | | Assess shareholder proposals and make appropriate recommendations to the Board with respect thereto. |
In connection with its responsibility for considering and recommending for approval by the Board qualified candidates to be nominated for election or appointment as directors, the Governance Committee has developed a policy which sets out the appropriate criteria for the selection of directors, or the Director Selection Policy. Pursuant to the Director Selection Policy, when there is a vacancy on the Board, the Chair of the Governance Committee, in consultation with other Governance Committee members, prepares a skills profile for that position consistent with the selection criteria contained in the Director Selection Policy. As well, the Governance Committee requires that prospective nominees fully understand the role of the Board and its committees, and the contribution that individual directors are expected to make including, in particular, the commitment of time and energy.
90
In pursuance of its responsibility regarding assessments of Board effectiveness, the Governance Committee conducts a board effectiveness survey and a director peer review survey, or the Surveys, every two years. The Surveys are prepared by us and administered by the legal department. We may obtain assistance from external advisors with respect to the preparation of the Surveys, as necessary. The results are reported and reviewed by the Chair of the Governance Committee who reports the results to the Board for discussion. The last Board effectiveness survey was conducted in Fiscal 2010.
The Governance Committee meets at least two times per year and holds an in camera session after each regularly scheduled meeting without the presence of management. The Independent Directors also meet separately after each regularly scheduled meeting.
Investment Committee
During Fiscal 2011, the membership of the Investment Committee of the Board was comprised of one Independent Director, being E. J. Bird, and three Non-Independent Directors, being William C. Crowley, William R. Harker and Deidra C. Merriwether. As of the date hereof, the Investment Committee members are William R. Harker, E.J. Bird, William C. Crowley, and Sharon Driscoll.
The purpose of the Investment Committee is to assist the Board in its oversight responsibilities relating to the investment of the funds established pursuant to our pension and benefit plans. The Investment Committee is responsible for the establishment of strategy and policies and for the selection and appointment of external investment managers.
The Investment Committee meets at least four times per year and holds an in camera session after each regularly scheduled meeting without the presence of management. The Independent Directors also meet separately after each regularly scheduled meeting.
Directors’ and Officers’ Liability Insurance
We have entered into an indemnification agreement with each of the Independent Directors and officers. Pursuant to an undertaking by Sears Holdings, which forms part of the indemnification agreement, Sears Holdings maintains a directors’ and officers’ liability insurance policy for our directors and officers to the same extent that directors and officers and former directors and officers of Sears Holdings have the benefit of such insurance. The coverage applies so long as Sears Holdings owns more than 50% of our common shares. The policy applies where we are not able to indemnify our directors and/or officers. Pursuant to the policy, we are required to indemnify our directors and officers to the fullest extent permitted by law. The coverage limit is U.S.$150 million. The premium for the policy is paid by Sears Holdings. Neither we nor any of our directors or officers are required to reimburse Sears Holdings for any portion of the premium expense incurred by Sears Holdings. There is no deductible for this coverage.
6.D. EMPLOYEES
As of January 31, 2012, we had approximately 29,777 employees. All of our employees are located in Canada. Less than 5% of our employees are covered by collective bargaining agreements. We believe we compensate our employees on a competitive basis, and we have incentive programs to motivate our employees and reduce employee turnover. Our management believes that our relations with our employees and their unions are good.
91
The following table sets forth the number of our employees as of January 31, 2010, 2011 and 2012:
| | | | | | | | | | | | |
| | | As of January 31 | |
Employees | | 2010 | | | 2011 | | | 2012 | |
Full-time | | | 11,520 | | | | 11,820 | | | | 11,739 | |
Part-time | | | 20,016 | | | | 19,752 | | | | 18,038 | |
| | | | | | | | | | | | |
Total | | | 31,536 | | | | 31,572 | | | | 29,777 | |
| | | | | | | | | | | | |
6.E. SHARE OWNERSHIP
See Item 7.A. “Major Shareholders and Related Party Transactions – Major Shareholders”.
ITEM 7. MAJOR SHAREHOLDERS AND RELATED PARTY TRANSACTIONS
7.A. MAJOR SHAREHOLDERS
The table below presents information regarding the beneficial ownership of our common shares prior to and immediately after completion of the spin-off by each person or entity that we know beneficially owns or immediately following the spin-off will (based on the assumptions described below), beneficially own 5% or more of our common shares.
We based the share amounts on such person’s beneficial ownership of Sears Holdings shares on July 9, 2012, giving effect to a distribution ratio of one Sears Canada common share for every shares of common stock of Sears Holdings held by such person on the record date. Immediately following the spin-off, we estimate that approximately Sears Canada common shares will be issued and outstanding.
To the extent our directors, officers and employees own Sears Holdings shares at the record date of the spin-off, they will participate in the spin-off on the same terms as other holders of Sears Holdings shares.
Except as otherwise noted in the footnotes below, each person or entity identified in the table has sole voting and investment or dispositive power with respect to the securities they hold. The Company’s major shareholders do not have different voting rights from other shareholders.
| | | | | | | | | | | | |
| | | Common Shares Outstanding
Prior to the Spin-Off | | | Common Shares Outstanding
Immediately After the Spin-Off |
| Name and Address | | Common Shares
Owned | | | Percentage(1) | | | Common Shares
Owned | | Percentage |
5% Shareholders: | | | | | | | | | | | | |
Sears Holdings Corporation (2) | | | 97,341,670 | | | | 95.5 | | | | | |
ESL Investments, Inc. and investment affiliates (3) (4) | | | — | | | | — | | | | | |
Fairholme Capital Management, L.L.C. and related persons, as a group (5) (6) | | | — | | | | — | | | | | |
| (1) | Based on 101,877,662 common shares issued and outstanding as of July 9, 2012. |
| (2) | Sears Holdings holds common shares of Sears Canada through its indirect, wholly-owned subsidiaries, Sears Canada Holdings Corp. and SHLD Acquisition Corp. |
| (3) | Consists of common shares of Sears Canada held by ESL Investments Inc., or Investments, common shares of Sears Canada held by ESL Partners, L.P., or Partners, common shares of Sears Canada held in an account established by the investment members of ESL Investors L.L.C., or Investors, common shares of Sears Canada held by ESL Institutional Partners, L.P., or Institutional, common shares of Sears Canada held by CRK Partners, LLC, or CRK LLC, common shares of Sears Canada held directly by Edward S. Lampert, common shares of Sears Canada held by SPE I Partners, LP, or SPE I, and common shares held by SPE Master I, LP, or SPE Master I. Mr. Lampert is the Chairman, Chief Executive Officer and Director of Investments. Investments is the general partner of RBS Partners, L.P., or RBS, the sole member of CRK LLC and the manager of RBS Investment Management, |
92
| | L.L.C., or RBSIM. RBS is the general partner of Partners, SPE I and SPE Master I and the managing member of Investors. RBSIM is the general partner of Institutional. The address of each ESL entity is 1170 Kane Concourse, Suite 200, Bay Harbor, FL 33154. |
| (4) | Based upon 65,744,084 shares of Sears Holdings common stock beneficially owned by ESL as disclosed in ESL’s Schedule 13D/A filed on July 5, 2012 and a distribution ratio of one common share of Sears Canada for every shares of Sears Holdings common stock held as of the record date for the spin-off. |
| (5) | Consists of common shares of Sears Canada held by Fairholme Capital Management, L.L.C., or FCM, The Fairholme Fund, a series of Fairholme Funds, Inc., or the Fairholme Funds, and Bruce R. Berkowitz. Mr. Berkowitz is the Managing Member of FCM and President of the Fairholme Funds. Mr. Berkowitz, FCM and the Fairholme Funds expressly disclaim beneficial ownership of the shares of the Company held by FCM and its related entities. The address of each FCM entity is 4400 Biscayne Boulevard, 9th Floor, Miami, FL 33137. |
| (6) | Based upon 16,108,492 shares of Sears Holdings common stock beneficially owned by FCM as of February 14, 2012, as disclosed in the Schedule 13G/A filed by FCM on February 14, 2012 and a distribution ratio of one common share of Sears Canada for every shares of Sears Holdings common stock held as of the record date for the spin-off. |
As of , 2012, approximately of our common shares, representing approximately % of our outstanding common shares, were held of record by residents of the United States.
7.B. RELATED PARTY TRANSACTIONS
Relationship with Sears Holdings
We are currently a majority owned indirect subsidiary of Sears Holdings. Sears Holdings is the beneficial holder of 97,341,670 or 95.5%, of common shares of Sears Canada as at July 9, 2012. The ultimate controlling party of the Company is ESL. As of July 5, 2012, ESL was the beneficial owner of approximately 62% of the issued and outstanding common stock of Sears Holdings. Immediately following completion of the spin-off, Sears Holdings will hold approximately 51% of the outstanding common shares of Sears Canada, and ESL is expected to directly hold approximately 27%, and is expected to directly and indirectly hold approximately 78% of the outstanding common shares of Sears Canada.
Immediately following the spin-off, we will continue to be a subsidiary of Sears Holdings. We have entered into a number of agreements and arrangements with Sears Holdings and these agreements will remain in place following the spin-off subject to the terms of the agreements described below. While we believe that this ongoing relationship with Sears Holdings provides us with access to opportunities that would otherwise not be available to us, this relationship causes us to operate differently from an independent, stand-alone entity. We describe below these relationships as well as potential conflicts of interest (and the methods for resolving them) and other material considerations arising from our relationship with Sears Holdings.
Licensing Agreement
We have a royalty-free license from Sears Roebuck to use the name “Sears” as part of our corporate name, as well as a royalty-free license to use other brand names, such as Kenmore®, Craftsman®, and DieHard®. We rely on our right to use the “Sears” name, including as part of our corporate name, and this right may be terminated by Sears Roebuck should Sears Holdings reduce its indirect ownership interest in the Company to less than 25% or in the case of a bankruptcy or insolvency of, or an assignment for the benefit of creditors by, Sears Canada. Our license to use the other brand names is subject to potential termination by Sears Roebuck following a transitional period, determined by us, of up to seven years after Sears Holdings reduces its indirect ownership interest in the Company to less than 25%. During the last four years of such transition period, the Company
93
would be required to pay Sears Roebuck a royalty with respect to the use of such brand names determined at the lesser of fair market value and the lowest rate which will provide Sears Canada an incentive to phase out the use of such brand names.
Cross Border Vendor Agreement
The Company is party to a cross border vendor agreement with Sears Roebuck establishing a collaboration and allowing the Company and Sears Roebuck to use each other’s websites to sell merchandise in the United States and Canada. Merchandise sold pursuant to the agreement will obligate the Company or Sears Roebuck, as applicable, to pay fees to the other party equal to (i) for some transactions, a percentage of merchandise selling prices, and (ii) for other transactions, a percentage of the revenue booked by the applicable seller. This agreement can be terminated by either party on 60 days’ written notice and will also terminate upon a transaction that results in the Company no longer being an affiliate of Sears Holdings.
Software Agreement
We and Sears Roebuck are also party to an information technology agreement for the sharing of information technology and software development, ownership and costs, which agreement (i) either party may terminate on 90 days’ written notice, or (ii) will automatically terminate if Sears Holdings ceases to control 50% of the voting power of Sears Canada.
Import Services Agreement
We are party to an agreement with Sears Roebuck pursuant to which it has agreed to perform certain import services when requested by us, including coordination of merchandise shipments and inspections of imported merchandise, for fees equal to a percentage of the value of the imported merchandise. The agreement may be terminated by either party upon 30 days’ written notice.
Other Services
Sears Holdings may provide us services which are outside the scope of our existing agreements under arrangements that are on market terms and conditions and pursuant to which Sears Holdings will receive fees. The services provided under these arrangements may include financial advisory, operations and maintenance, development, operations management and other services. Pursuant to our conflict of interest guidelines, those arrangements may require prior approval by a majority of the Audit Committee, which may be granted in the form of general guidelines, policies or procedures.
Conflicts of Interest and Fiduciary Duties
Our organizational and ownership structure and strategy involve a number of relationships that may give rise to conflicts of interest between us and Sears Holdings. In certain circumstances, material transactions between or among us, Sears Holdings, ESL and/or any of our or their respective affiliates may be related party transactions for the purposes of, and subject to certain requirements of, Canadian Multilateral Instrument 61-101-Protection of Minority Security Holders in Special Transactions, or MI 61-101. MI 61-101 provides a number of circumstances in which a transaction between an issuer and a related party may be subject to valuation and minority approval requirements. An exemption from such requirements is available when the fair market value of the transaction is not more than 25% of the market capitalization of the issuer. In any case, our Audit Committee is responsible for pre-approving all material related party transactions, including those with Sears Holdings, which have a value greater than $1.0 million.
In addition, neither Sears Holdings nor ESL owes us or our shareholders any fiduciary duties under Canadian law, which would limit our and our shareholders’ recourse against Sears Holdings and/or ESL. The
94
CBCA does provide, however, for an “oppression” remedy, which allows a court to make a wide range of orders to rectify conduct that the court finds to be oppressive or unfairly prejudicial to, or that unfairly disregards the interests of, shareholders.
To our knowledge, (i) no director or executive officer of the Company, (ii) neither Sears Holdings nor any other person or company that beneficially owns, or controls or directs, directly or indirectly, more than 10% of any class or series of the outstanding voting securities of the Company and, (iii) none of their respective associates or affiliates has or had any material interest, directly or indirectly, in any transaction completed within the three most recently completed fiscal years, or during the current fiscal year, or in any proposed transaction, that has materially affected or will or would materially affect the Company.
See “Risks Relating to our Relationship with Sears Holdings” and “Risks Relating to our Common Shares and the Spin-Off” under Item 3.D. “Risk Factors” and “Ethical Business Conduct” under Item 6.C. “Board Practices”.
7.C. INTERESTS OF EXPERTS AND COUNSEL
Not applicable.
ITEM 8. FINANCIAL INFORMATION
8.A. CONSOLIDATED STATEMENTS AND OTHER FINANCIAL INFORMATION
Financial Statements
See Item 18. “Financial Statements”.
Legal Proceedings
To our knowledge and other than the litigation described under Item 3.D. “Key Information – Risk Factors – We are exposed to a variety of legal proceedings, including class action lawsuits, and tax audits, which, if adversely decided could materially adversely affect us” and Item 4.B. “Information on the Company – Business Overview – Legal Proceedings”, there are no legal proceedings material to the Company to which the Company was a party to or of which any of their respective properties are the subject matter, nor are there any such proceedings known to us to be contemplated.
To our knowledge, there were no (i) penalties or sanctions imposed against the Company by a court relating to securities legislation or by a securities regulatory authority during Fiscal 2011; (ii) penalties or sanctions imposed by a court or regulatory body against the Company that would likely be considered important to a reasonable investor in making an investment decision; or (iii) settlement agreements the Company entered into with a court relating to securities legislation or with a securities regulatory authority during the last financial year.
Dividend Policy
Our objectives when managing capital are to:
| | • | | maintain financial flexibility thus allowing us to preserve our ability to meet financial objectives; |
| | • | | provide an appropriate return to shareholders; and |
| | • | | maintain a capital structure that allows us to obtain financing should the need arise. |
We manage and make adjustments to our capital structure, when necessary, in light of changes in economic conditions, the objectives of our shareholders, the cash requirements of the business and the condition of capital markets. In order to maintain or adjust the capital structure, we may pay a dividend or return capital to shareholders, modify debt levels or sell assets.
95
We define capital as follows:
| | • | | long-term obligations, including the current portion of long-term obligations; and |
See Item 10.F. “Additional Information – Dividends and Paying Agents – Dividends”.
8.B. SIGNIFICANT CHANGES
A discussion of significant changes in our business can be found under Item 4.A. “Information on the Company – History and Development of the Company”, Item 4.B. “Information on the Company – Business Overview” and Item 5.A. “Operating and Financial Review and Prospects – Operating Results – Subsequent Events”.
ITEM 9. THE OFFER AND LISTING
9.A. LISTING DETAILS
Our common shares are listed on the TSX under the symbol “SCC”. The following tables set forth, for the periods indicated, the high and low market prices of our common shares as reported on the TSX.
| | (a) | For the five most recent full fiscal years: |
| | | | | | | | |
Fiscal year ended | | High $ | | | Low $ | |
Jan. 28, 2012 | | | 20.69 | | | | 10.00 | |
Jan. 29, 2011 | | | 30.13 | | | | 18.37 | |
Jan. 20, 2010 | | | 26.28 | | | | 17.05 | |
Jan. 31, 2009 | | | 25.39 | | | | 15.00 | |
Jan. 26, 2008 | | | 33.00 | | | | 17.51 | |
| | (b) | For each full financial quarter of the two most recent full fiscal years and any subsequent period: |
| | | | | | | | |
Period | | High $ | | | Low $ | |
1st Quarter ended April 28, 2012 | | | 14.24 | | | | 11.60 | |
4th Quarter ended Jan. 28, 2012 | | | 15.50 | | | | 10.00 | |
3rd Quarter ended Oct. 29, 2011 | | | 15.60 | | | | 12.50 | |
2nd Quarter ended July 30, 2011 | | | 19.78 | | | | 15.17 | |
1st Quarter ended April 30, 2011 | | | 20.69 | | | | 18.74 | |
4th Quarter ended January 29, 2011 | | | 20.46 | | | | 18.37 | |
3rd Quarter ended October 30, 2010 | | | 26.19 | | | | 18.57 | |
2nd Quarter ended July 31, 2010 | | | 29.29 | | | | 24.12 | |
1st Quarter ended May 1, 2010 | | | 30.13 | | | | 23.90 | |
| | (c) | for the most recent six months: |
| | | | | | | | |
Period | | High ($) | | | Low ($) | |
July (up until July 6, 2012) | | | 10.30 | | | | 10.25 | |
June 2012 | | | 11.10 | | | | 9.76 | |
May 2012 | | | 13.70 | | | | 9.76 | |
April 2012 | | | 13.85 | | | | 13.06 | |
March 2012 | | | 14.24 | | | | 12.49 | |
February 2012 | | | 12.35 | | | | 11.60 | |
January 2012 | | | 12.63 | | | | 11.00 | |
96
See Item 10 “Additional Information” for additional information regarding our common shares.
9.B. PLAN OF DISTRIBUTION
Not applicable.
9.C. MARKETS
Our common shares have been listed on the TSX since April 5, 1965. Our ticker symbol is “SCC”.
9.D. SELLING SHAREHOLDERS
Not applicable.
9.E. DILUTION
Not applicable.
9.F. EXPENSES OF THE ISSUE
Not applicable.
ITEM 10. ADDITIONAL INFORMATION
10.A. SHARE CAPITAL
Authorized/Issued Capital
Our authorized share capital consists of an unlimited number of common shares without nominal or par value and an unlimited number of class 1 preferred shares, issuable in one or more series, or the Class 1 Preferred Shares. There are currently no Class 1 Preferred Shares outstanding.
Common Shares
The holders of common shares are entitled to vote at all meetings of our shareholders except meetings at which only holders of another specified class or series of shares are entitled to vote. The holders of common shares are entitled to receive dividends as and when declared by the Board, subject to the dividend entitlements of the holders of the Class 1 Preferred Shares, if any. After payment to the holders of the Class 1 Preferred Shares of the amount to which they may be entitled, and after payment of all outstanding debts, the holders of common shares are entitled to receive our remaining property upon the liquidation, dissolution or winding-up thereof.
No shares have been issued subject to call or assessment. There are no pre-emptive or conversion rights and no provisions for redemption or purchase for cancellation, surrender, or sinking or purchase funds. The common shares must be issued as fully-paid and non-assessable, and are not subject to further capital calls by the Company. All of the common shares rank equally as to voting rights, participation in a distribution of the assets of the Company on a liquidation, dissolution or winding-up of the Company and entitlement to dividends.
Common shares are transferable at the offices of the Company’s transfer agent and registrar, Canadian Stock Transfer Company Inc., in Toronto, Ontario, Canada and Montreal, Québec, Canada.
There are no restrictions in the Company’s constating documents on the free transferability of the common shares.
97
Class 1 Preferred Shares
The Company does not currently have any preferred shares outstanding. The Company is authorized to issue an unlimited number of Class 1 Preferred Shares, issuable in three series, Series A, Series B and Series C. For each series of Class 1 Preferred Shares the Board has the authority to fix the number of shares of such series and to determine the designation, rights, privileges, restrictions, and conditions attaching to such series, including: the rate or amount of or method of calculating preferential dividends, whether dividends will be cumulative or non-cumulative, the payment dates, whether the shares will be redeemable, and if so, the redemption price and terms and conditions of redemption, any voting rights, any conversion rights, any sinking fund, any purchase fund or other provisions and the amount payable on return of capital in the event of the liquidation, dissolution or winding-up of the Company.
The Class 1 Preferred Shares are entitled to preference over the common shares and over any other shares of the Company ranking junior to the Class 1 Preferred Shares. The approval of the holders of Class 1 Preferred Shares to add, change or remove any right, privilege, restriction or condition attaching to the Class 1 Preferred Shares as a class or any other matter requiring the consent of the holders of the Class 1 Preferred Shares may be given in such manner as may then be required by law, subject to a minimum requirement that such approval be given by resolution by the affirmative vote of at least two-thirds of the votes cast at a meeting of the holders of Class 1 Preferred Shares duly called for that purpose.
Shares Not Representing Capital
None.
Shares Held by Company
None.
History of Share Capital
As at July 9, 2012, there were 101,877,662 common shares issued and outstanding, which are listed for trading on the TSX, and 9,920 award options were outstanding under the Employees Stock Plan. See Item 6.B “Directors, Senior Management and Employees – Compensation – Compensation Discussion and Analysis – Equity Compensation Plan Information – Closed Plans” for additional information regarding the Employees Stock Plan.
The number of outstanding common shares at the end of Fiscal 2011 (January 28, 2012), Fiscal 2010 (January 29, 2011), and Fiscal 2009 (January 31, 2010) were as follows: 102,748,295 shares, 105,417,095 shares and 107,620,995 shares, respectively. There were 105,417,095 common shares outstanding at the beginning of Fiscal 2011 and 102,748,295 common shares outstanding at the end of Fiscal 2011. There were 107,620,995 common shares outstanding at the beginning of Fiscal 2010 and 105,417,095 common shares outstanding at the end of Fiscal 2010. There were 107,620,995 common shares outstanding at the beginning of Fiscal 2009 and 107,620,995 common shares outstanding at the end of Fiscal 2009.
As at the end of Fiscal 2011, 10,760 award options were outstanding under the Employees Stock Plan.
We have not issued any common shares or Class 1 Preferred Shares and we have not granted any stock options within the last three years.
Normal Course Issuer Bid
In each of Fiscal 2011 and 2010, we filed a Normal Course Issuer Bid, or NCIB, with the TSX that permitted us to purchase our common shares for cancellation. Purchases made pursuant to an NCIB are effected
98
through the facilities of the TSX on the open market. We may not purchase common shares under an NCIB if such shares cannot be purchased at prices that we consider attractive. Decisions regarding the timing of purchases under a NCIB are based on market conditions and other factors.
On May 18, 2010, we filed an NCIB with the TSX for the period of May 25, 2010 to May 24, 2011, which we refer to as the 2010 NCIB, that permitted us to purchase for cancellation up to 5% of our issued and outstanding common shares. On May 24, 2011, we renewed the 2010 NCIB with the TSX for the period of May 25, 2011 to May 24, 2012, which we refer to as the 2011 NCIB, that permitted us to purchase up to 5% of our issued and outstanding common shares. The 2011 NCIB expired on May 24, 2011 and has not been renewed for 2012.
In Fiscal 2010, we purchased 2,204,504 of our common shares for a total of $43.0 million. In Fiscal 2011, we purchased 2,668,800 of our common shares for a total of $42.0 million. In Q1 2012, we purchased 235,763 shares for a total of $2.9 million. All of the common shares we purchased under our NCIB have been cancelled.
Transfer Agent and Registrar
The transfer agent and registrar for the Company is Canadian Stock Transfer Company Inc., in Toronto, Ontario, Canada.
10.B. MEMORANDUM AND ARTICLES OF ASSOCIATION
The Company was incorporated under the laws of Canada by letters patent dated September 17, 1952 and was continued under the CBCA by articles of continuance effective May 15, 1980. By articles of amendment effective May 31, 1984, the Company changed its name from Simpsons-Sears Limited to Sears Canada Inc. By articles of amalgamation dated January 1, 1994, December 29, 1996 and December 30, 1999, the Company was amalgamated with various wholly-owned subsidiaries.
| 1. | Register, Entry Number and Purposes |
Our current Certificate and Articles of Amalgamation were registered on December 30, 1999. Our corporation number in Canada is 3706486. Neither the Certificate nor the Articles of Amalgamation contain a statement of the Company’s objects and purposes.
The CBCA provides that, subject to any unanimous shareholders agreement, the directors shall manage, or supervise the management of, the business and affairs of the Company. Pursuant to the CBCA, a director or officer who is a party to, or who is a director or officer of or has a material interest in any person who is a party to, a material contract or proposed material contract with the Company, shall disclose the nature and extent of his interest at the time and in the manner provided by the CBCA. Any such contract or proposed contract shall be referred to the Board or shareholders for approval even if such contract is one that in the ordinary course of the Company’s business would not require approval by the Board or shareholders, and a director interested in a contract so referred to the Board shall not vote on any resolution to approve the same unless the contract or transaction: (i) relates primarily to his or her remuneration as a director, officer, employee or agent of the Company or an affiliate; (ii) is for indemnity or insurance of or for the director or officer as permitted by the CBCA; or (iii) is with an affiliate. Sears Holdings and ESL are affiliates of the Company. It is the Board’s practice that directors are required to abstain from any discussions or meetings regarding any matters in which they have a material interest. In addition, the mandate of the Lead Director requires the Lead Director to review conflict of interest issues with respect to the Board as they arise.
The Company’s director retirement policy provides that a director may not stand for election or be appointed to fill a vacancy on the Board after his or her 70th birthday, unless the Board makes an exception to this policy by means of a special resolution.
99
The directors may, on behalf of the Company:
| | • | | Borrow money upon the credit of the Company; |
| | • | | Issue, reissue, sell or pledge bonds, debentures, notes or other evidences of indebtedness or guarantee of the Company, whether secured or unsecured; |
| | • | | To the extent permitted by the CBCA, give a guarantee on behalf of the Company to secure performance of any present or future indebtedness, liability or obligation of any person; and |
| | • | | Mortgage, hypothecate, pledge or otherwise create a security interest in all or any currently owned or subsequently acquired real or personal, movable or immovable, property of the Company including book debts, rights, powers, franchises and undertakings, to secure any such bonds, debentures, notes or other evidences of indebtedness or guarantee or any other present or future indebtedness, liability or obligation of the Company. |
The Company’s Financing Charter provides that the Board may grant the Company the mandate to arrange suitable financing for the ensuing year and may delegate to certain senior officers of the Company the power to negotiate and enter into certain funding arrangements. Such mandate does not permit the Company to obtain financing by way of equity issues, unhedged foreign currency issues, or debt issues convertible in whole or part into equity, without prior approval of the Board.
Nothing in the Company’s By-Laws limits or restricts the borrowing of money by the Company on bills of exchange or promissory notes made, drawn, accepted or endorsed by or on behalf of the Company. These borrowing powers may be varied by way of an amendment to our Articles of Amalgamation or By-Laws. Both types of amendments would require shareholder approval, however, in the case of a by-law amendment made by the directors, the amendment will be effective until confirmed or rejected by shareholders.
| 3. | Rights, Preferences and Restrictions Attaching to Each Class of Shares |
See Item 10.A. “Additional Information – Share Capital” for a description of the rights, preferences and restrictions attaching to each class of our shares.
| 4. | Procedures to Change the Rights of Shareholders |
In order to change the rights of our shareholders, the Company would need to amend our Articles of Amalgamation to effect the change. Such an amendment would require the approval of two-thirds of the votes cast by the Company’s common shareholders, and the holders of any other shares carrying the right to vote at any general meeting of the shareholders of the Company, at a duly called special meeting. For certain amendments, such as those creating a class of preferred shares, a shareholder is entitled under the CBCA to dissent in respect of such a resolution amending the Articles of Amalgamation and, if the resolution is adopted and the Company implements such changes, demand payment of the fair value of the shareholder’s shares. In addition, for certain amendments, the separate approval of two-thirds of the votes cast by the holders of one or more classes of shares, or in some cases, of one or more series of shares, is required.
| 5. | Ordinary and Extraordinary Shareholders’ Meetings |
An annual meeting of shareholders must be held not later than fifteen months after holding the last preceding annual meeting but no later than six months after the end of the Company’s preceding financial year. The Board has the power to call a special meeting of shareholders at any time. The Board must call a general meeting of shareholders if requisitioned to do so by not less than holders of five percent of the issued shares of the Company that carry the right to vote at a meeting, for the purpose stated in the shareholder requisition.
Notice of the date, time and location of each meeting of shareholders must be given not less than 21 days before the date of each meeting to each director, to the auditor and to each shareholder who at the close of
100
business on the record date for notice is entered in the securities register as the holder of one or more shares carrying the right to vote at the meeting. Notice of a meeting of shareholders called for any other purpose other than consideration of the minutes of an earlier meeting, financial statements, reports of the directors or auditor, setting or changing the number of directors, the election of directors or reappointment of the incumbent auditor, must state the general nature of the special business in sufficient detail to permit the shareholder to form a reasoned judgment on such business, must state the text of any special resolution to be submitted to the meeting, and must, if the special business includes considering, approving, ratifying, adopting or authorizing any document or the signing of or giving of effect to any document, have attached to it, a copy of the document or state that a copy of the document will be available for inspection by shareholders at the Company’s records office or another accessible location.
The only persons entitled to be present at a meeting of shareholders are those entitled to vote, the directors of the Company and the auditor of the Company. Any other person may be admitted only on the invitation of the chairman of the meeting or with the consent of the meeting. In circumstances where a court orders a meeting of shareholders, the court may direct how the meeting may be held, including who may attend the meeting.
| 6. | Limitations on Rights to Own Securities |
No share may be issued until it is fully paid.
Neither Canadian law nor our Articles of Amalgamation or By-Laws limit the right of a non-resident to hold or vote common shares of the Company, other than as provided in the Investment Canada Act, or the Investment Act, as amended by the World Trade Organization Agreement Implementation Act. The Investment Act generally prohibits implementation of a direct reviewable investment by an individual, government or agency thereof, corporation, partnership, trust or joint venture that is not a “Canadian,” as defined in the Investment Act, or a non-Canadian, unless, after review, the minister responsible for the Investment Act is satisfied that the investment is likely to be of net benefit to Canada. An investment in the common shares of the Company by a non-Canadian (other than a “WTO Investor,” as defined below) would be reviewable under the Investment Act if it were an investment to acquire direct control of the Company, and the value of the assets of the Company were $5.0 million or more (provided that immediately prior to the implementation of the investment the Company was not controlled by WTO Investors). An investment in common shares of the Company by a WTO Investor (or by a non-Canadian other than a WTO Investor if, immediately prior to the implementation of the investment the Company was controlled by WTO Investors) would be reviewable under the Investment Act if it were an investment to acquire direct control of the Company and the value of the assets of the Company equaled or exceeded an amount determined by the Minister on an annual basis ($330 million in asset value for 2012 and the Minister of Industry (Canada) recently announced that the regulations will be amended to progressively raise the review threshold to $1 billion in enterprise value over a four-year period). A non-Canadian, whether a WTO Investor or otherwise, would be deemed to acquire control of the Company for purposes of the Investment Act if he or she acquired a majority of the common shares of the Company. The acquisition of less than a majority, but at least one-third of the shares, would be presumed to be an acquisition of control of the Company, unless it could be established that the Company is not controlled in fact by the acquirer through the ownership of the shares. In general, an individual is a WTO Investor if he or she is a “national” of a country (other than Canada) that is a member of the World Trade Organization, or a WTO Member or has a right of permanent residence in a WTO Member. A corporation or other entity will be a “WTO Investor” if it is a “WTO Investor-controlled entity,” pursuant to detailed rules set out in the Investment Act. The United States is a WTO Member. Certain transactions involving our common shares would be exempt from the Investment Act, including:
| • | | an acquisition of the shares if the acquisition were made in the ordinary course of that person’s business as a trader or dealer in securities; |
| • | | an acquisition of control of the Company in connection with the realization of a security interest granted for a loan or other financial assistance and not for any purpose related to the provisions of the Investment Act; and |
101
| • | | an acquisition of control of the Company by reason of an amalgamation, merger, consolidation or corporate reorganization, following which the ultimate direct or indirect control in fact of the Company, through the ownership of voting interests, remains unchanged. |
| 7. | Impediments to Change of Control |
There are no provisions of our Articles of Amalgamation or By-Laws that would have an effect of delaying, deferring or preventing a change of control of the Company and that would operate only with respect to a merger, acquisition or corporate restructuring involving the Company.
| 8. | Stockholder Ownership Disclosure Threshold in By-Laws |
Neither our Articles of Amalgamation or By-Laws contain a provision governing the ownership threshold above which shareholder ownership must be disclosed.
| 9. | Significant Differences with Applicable U.S. Law |
With respect to items 2 through 8 above, the law applicable to the Company is not significantly different from that provided under the corporation law statutes in most U.S. jurisdictions. In addition:
| • | | none of the CBCA, applicable Canadian securities law, our Articles of Amalgamation or By-Laws, or the rules, regulations or policies of the TSX, or collectively, the Canadian rules, require a majority of the Company’s directors to be independent. However, National Policy 58-201 of the Canadian Securities Administrators recommends that a majority of the Company’s directors should be independent. The Canadian rules also require the Company to disclose, in any management information circular for the election of directors, whether a majority of the Company’s directors are independent; |
| • | | the Company’s Articles of Amalgamation do not permit cumulative voting; |
| • | | the TSX, on which the Company’s shares are listed, requires that “shareholder rights plans” (commonly referred to as “poison pills”) be ratified by shareholders within six months of their adoption by a listed company’s board of directors. Pursuant to National Policy 62-202 of the Canadian Securities Administrators, the Canadian securities regulatory authorities have advised participants in the capital markets that they are prepared to examine target company defensive tactics with respect to take-over bids in specific cases to determine whether they are abusive of shareholder rights; |
| • | | the CBCA provides that shareholders of a corporation or their personal representatives may examine the records of a corporation containing: |
| | • | | the articles and the By-Laws, and all amendments thereto, and a copy of any unanimous shareholder agreement; |
| | • | | minutes of meetings and resolutions of shareholders; |
| | • | | copies of all notices of directors and notices of change of directors and director’s address filed with Industry Canada; and |
| | • | | a securities register showing, with respect to each class or series of securities, the names and the latest known address of each person who is or has been a security holder; the number or securities held by each security holder; and the date and particulars of the issue and transfer of each security; provided however, that any shareholder or their personal representative that wishes to examine the securities register of a distributing corporation must first make a request to the corporation or its agent, accompanied by an affidavit, prepared in accordance with the provisions of the CBCA. On payment of a reasonable fee, the shareholder is entitled to an extract from the securities register. |
The CBCA further provides that a shareholder of a corporation is entitled, on request and without charge, to one copy of the articles and by-laws and of any unanimous shareholder agreement. Furthermore, shareholders or their personal representatives, upon payment of a reasonable fee and on sending to the corporation the affidavit
102
referred to above, may on application require the corporation to furnish within ten days after receipt of the affidavit, a list, or basic list setting out the names of the shareholders of the corporation, the number of shares owned by each shareholder and the address of each shareholder, and may also require any supplemental list setting out any changes to the basic list and any list setting out the name and address of any known holder of an option or right to acquire shares of the corporation.
The basic list and any supplemental lists or the information contained in the securities register obtained by a shareholder or their personal representative may not be used by any person except in connection with (i) an effort to influence the voting of shareholders of the corporation; (ii) an offer to acquire securities of the corporation; or (iii) any other matter relating to the affairs of the corporation.
| 10. | Special Conditions for Changes in Capital |
The conditions imposed by the Company’s Articles of Amalgamation are not more stringent than required under the CBCA.
A copy of the Company’s Certificate of Amalgamation, Articles of Amalgamation and By-Laws have been filed as an exhibit to this Form 20-F.
10.C. MATERIAL CONTRACTS
The contracts outlined below are considered to be material to us. Those contracts that were entered into in the ordinary course of business and which do not satisfy the requirements for disclosure have not been included below.
| | (a) | Program Agreement: The program agreement dated November 15, 2005, or the Program Agreement, between Sears Canada, Sears Canada Bank and JPMorgan Chase, governs the long-term marketing and servicing alliance relating to the Sears Card and Sears MasterCard credit cards for an initial term of ten years. Under the Program Agreement, JPMorgan Chase provides credit and customer service benefits to Sears Card and Sears MasterCard holders in Canada. The Company receives performance payments from JPMorgan Chase based on a percentage of sales charged to the Sears Card and Sears MasterCard, new account generation, processing of account payments, and a percentage of sales of additional financial products by JPMorgan Chase to Sears Card and Sears MasterCard holders. In addition, JPMorgan Chase provides deferred financing for Sears Canada customers. Pursuant to the Program Agreement, JPMorgan manages operating centers in four Canadian locations including Toronto, Scarborough, Ottawa and Vancouver, with approximately 1,000 employees. |
| | (b) | Credit Facility: In September 2010, the Company entered into an $800.0 million senior secured revolving credit facility, or the Credit Facility, with a syndicate of lenders with a maturity date of September 10, 2015. The Credit Facility is secured with a first lien on inventory and credit card receivables. Availability under the Credit Facility is determined pursuant to a borrowing base formula. Availability under the Credit Facility was $580.9 million as at April 28, 2012. This availability may be reduced by additional reserves in the borrowing base formula which may be applied by the lenders pursuant to the terms of the Credit Facility. Borrowings under the Credit Facility can be repaid prior to the termination date. The Credit Facility contains covenants which are customary for facilities of this nature and the Company was in compliance with all covenants as at April 28, 2012. In addition, the Company had $6.7 million of standby letters of credit outstanding against the Credit Facility as at April 28, 2012. Interest on drawings under the Credit Facility is determined based on bankers’ acceptance rates for one to three month terms or the prime rate plus a spread. Interest amounts on the Credit Facility are due monthly and are added to principal amounts outstanding. |
| | (c) | Licenses: We have a royalty-free license from Sears Holdings to use the name “Sears” as part of our corporate name, as well as a royalty-free license to use other brand names, such as Kenmore®, Craftsman®, and DieHard®. We rely on our right to use the “Sears” name, and this right may be |
103
| | terminated by Sears Holdings should Sears Holdings reduce its indirect ownership interest in the Company to less than 25% or in the case of a bankruptcy or insolvency of, or an assignment for the benefit of creditors by, Sears Canada. Our license to use other brand names may be terminated by Sears Holdings following a transitional period, determined by us, of up to seven years after Sears Holdings reduces its indirect ownership interest in the Company to less than 25%. During the last four years of such transition period, the Company would be required to pay Sears Holdings a royalty with respect to the use of such brand names determined at the lesser of fair market value and the lowest rate which will provide Sears Canada an incentive to phase out the use of such brand names. |
Copies of the agreements noted above are available, free of charge and are available electronically on the website of the SEC at www.sec.gov and on our SEDAR profile at www.sedar.com. Requests for such documents should be directed to our Corporate Communications Department in writing at 290 Yonge Street, Suite 700, Toronto, Ontario, Canada, M5B 2C3, or by phone at (416) 941-4428.
10.D. EXCHANGE CONTROLS
There are currently no governmental laws, decrees, regulations or other legislation of Canada or the United States which restrict the import or export of capital or the remittance of distributions, interest or other payments to non-residents of Canada or the United States holding our common shares.
10.E. TAXATION
The following summary discusses the material United States and Canadian federal income tax considerations related to the receipt, holding, and disposition of our common shares as of the date hereof to a holder who receives our common shares in the spin-off.
Material United States Federal Income Tax Consequences
The following discussion describes the material United States federal income tax consequences to U.S. and Non-U.S. Holders (each as defined below) of the receipt of our common shares in the spin-off, and, in the case of U.S. Holders, of the ownership and disposition of such common shares as of the date hereof. The discussion set forth below deals only with holders that hold Sears Holdings common stock and that will hold our common shares (upon receipt in the spin-off) as capital assets. As used herein, the term “U.S. Holder” means a beneficial owner of Sears Holdings common stock that receives our common shares in the spin-off by reason of holding Sears Holdings common stock and that is, for United States federal income tax purposes, one of the following:
| • | | an individual citizen or resident of the United States; |
| • | | a corporation (or other entity treated as a corporation for United States federal income tax purposes) created or organized in or under the laws of the United States, any state thereof or the District of Columbia; |
| • | | an estate the income of which is subject to United States federal income taxation regardless of its source; or |
| • | | a trust if it (1) is subject to the primary supervision of a court within the United States and one or more United States persons have the authority to control all substantial decisions of the trust or (2) has a valid election in effect under applicable United States Treasury regulations to be treated as a United States person. |
For purposes of this discussion, a Non-U.S. Holder means a beneficial owner of Sears Holdings common stock that receives our common shares in the spin-off by reason of holding Sears Holdings common stock and that is neither a U.S. Holder nor a partnership (or other entity treated as a partnership for United States federal income tax purposes).
104
The discussion below is based upon the provisions of the Internal Revenue Code of 1986, as amended, or the Code, and regulations, rulings and judicial decisions thereunder as of the date hereof, and such authorities may be replaced, revoked or modified, possibly with retroactive effect, so as to result in United States federal income tax consequences different from those discussed below.
This discussion does not address the United States federal income tax consequences applicable to you if you are subject to special treatment under the United States federal income tax laws, including if you are:
| | • | | a dealer in securities or currencies; |
| | • | | a financial institution; |
| | • | | a regulated investment company; |
| | • | | a real estate investment trust; |
| | • | | a tax-exempt organization; |
| | • | | a person holding Sears Holdings common stock or who will be holding our common shares as part of a hedging, integrated or conversion transaction, a constructive sale or a straddle; |
| | • | | a trader in securities that has elected the mark-to-market method of accounting for your securities; |
| | • | | a person liable for alternative minimum tax; |
| | • | | a person who owns or is deemed to own 10% or more of our common shares (as measured by voting power); |
| | • | | a partnership or other pass-through entity for United States federal income tax purposes; |
| | • | | a controlled foreign corporation or passive foreign investment company; |
| | • | | a United States expatriate; or |
| | • | | a person whose “functional currency” is not the United States dollar. |
Because Sears Holdings will continue to own more than 50% of our common shares immediately after the spin-off, we will be treated as a controlled foreign corporation for United States federal income tax purposes. U.S. holders that own, or are deemed to own, 10% or more of our common shares (as measured by voting power) should consult their own tax advisors concerning the application of the controlled foreign corporation rules to them in light of their particular circumstances.
If a partnership (or other entity treated as a partnership for United States federal income tax purposes) holds Sears Holdings common stock or will be holding our common shares as a result of the spin-off, the tax treatment of a partner will generally depend upon the status of the partner and the activities of the partnership. If you are a partner of a partnership holding Sears Holdings common stock or that will be holding our common shares as a result of the spin-off, you should consult your tax advisors.
This discussion does not address all the United States federal income tax consequences to you in light of your particular circumstances and does not address the effects of any state, local or non-United States tax laws. You should consult your own tax advisors concerning the United States federal income tax consequences to you of the receipt, ownership and disposition of our common shares in light of your particular situation as well as any consequences arising under the laws of any other taxing jurisdiction.
105
Tax Consequences of the Spin-Off
Consequences to U.S. Holders
A U.S. Holder who receives our common shares pursuant to the spin-off will be considered to have received a taxable distribution in an amount equal to the fair market value of our common shares received by such U.S. Holder plus the amount of cash received in lieu of fractional common shares on the date of the distribution. This distribution will be treated as a dividend, taxable as ordinary income, to the extent of such holder’s share of the current and accumulated earnings and profits of Sears Holdings, as determined for United States federal income tax purposes. To the extent that the amount of the distribution exceeds Sears Holdings’ current and accumulated earnings and profits for the taxable year of the distribution, the distribution will first be treated as a tax-free return of capital, causing a reduction in the adjusted basis of such holder’s Sears Holdings common stock, and to the extent the amount of the distribution exceeds such holder’s adjusted tax basis, the excess will be taxed as capital gain recognized on a sale or exchange of the U.S. Holder’s Sears Holdings common stock. We anticipate that the current and accumulated earnings and profits of Sears Holdings will exceed the aggregate fair market value of our common shares plus the amount of cash received in lieu of fractional shares of our common shares on the date of the distribution.
The amount of the dividend received by non-corporate U.S. Holders generally will be “qualified dividend income” subject to reduced rates of United States federal income taxation if received prior to January 1, 2013. The amount of the dividend received by corporate U.S. Holders generally will be eligible for the dividends received deduction allowed to corporations under the Code. In either case, however, U.S. Holders that have not met a minimum holding period requirement with respect to Sears Holdings common stock during which they are not protected from the risk of loss or that elect to treat the dividend income as “investment income” will not be eligible for the reduced rates of taxation available to non-corporate U.S. Holders or the dividends received deduction available to corporate U.S. Holders. In addition, neither the rate reduction nor the dividends received deduction will apply if the recipient is obligated to make related payments with respect to positions in substantially similar or related property. This disallowance applies even if the minimum holding period requirement has been met. U.S. Holders should consult their own tax advisors regarding the application of these rules to their particular circumstances.
A U.S. Holder will have a basis in our common shares received in the spin-off equal to the fair market value of such common shares on the date of the distribution, and the holding period for such common shares received in the spin-off will begin on the date of the distribution.
Information Reporting and Backup Withholding. In general, information reporting will apply to the distribution of our common shares to a U.S. Holder within the United States (and in certain cases, outside the United States), unless such holder is an exempt recipient.
Backup withholding may apply to the distribution of our common shares and the amount of cash distributed in lieu of fractional common shares to a U.S. Holder that fails to provide a taxpayer identification number or certification of other exempt status or fails to report in full dividend income. If backup withholding applies to the distribution of our common shares to a U.S. Holder, the U.S. Holder’s broker (or other applicable withholding agent) will be required to remit any such backup withholding in cash to the Internal Revenue Service. Depending on the circumstances, the broker (or other applicable withholding agent) may obtain the funds necessary to remit such backup withholding by asking the U.S. Holder to provide the funds, by using funds in the U.S. Holder’s account with the broker or by selling (on the U.S. Holder’s behalf) all or a portion of our common shares received by the U.S. Holder in the spin-off. Backup withholding is not an additional tax, and any amounts withheld under the backup withholding rules will be allowed as a refund or a credit against the U.S. Holder’s United States federal income tax liability provided the required information is timely furnished to the Internal Revenue Service.
106
Consequences to Non-U.S. Holders
A Non-U.S. Holder who receives our common shares pursuant to the spin-off will be considered to have received a taxable distribution in an amount equal to the fair market value of our common shares received by such Non-U.S. Holder plus the amount of cash received in lieu of fractional common shares on the date of the distribution. This distribution will be treated as a dividend to the extent of such holder’s share of the current and accumulated earnings and profits of Sears Holdings, as determined for United States federal income tax purposes. We anticipate that the current and accumulated earnings and profits of Sears Holdings will exceed the aggregate fair market value of our common shares plus the amount of cash received in lieu of fractional common shares on the date of the distribution.
Accordingly, it is anticipated that Non-U.S. Holders generally will be subject to withholding of United States federal income tax at a rate of 30% on the amount of the distribution that is treated as a dividend and received by them (or such lower rate as may be specified by an applicable income tax treaty). However, if the amount of such distribution treated as a dividend is effectively connected with the conduct of a trade or business by the Non-U.S. Holder within the United States, then such amount will be subject to United States federal income tax on a net income basis in the same manner as if the Non-U.S. Holder were a United States person as defined under the Code unless exempt under an applicable income tax treaty. Any such effectively connected dividends received by a corporate Non-U.S. Holder may be subject to an additional “branch profits tax” at a 30% rate, or such lower rate as may be specified by an applicable income tax treaty.
A Non-U.S. Holder who wishes to claim the benefit of an applicable treaty rate or any applicable exemption under the Code with respect to the amount of the distribution treated as a dividend subject to withholding tax will be required (i) to complete Internal Revenue Service Form W-8BEN (or other applicable Form W-8) and certify under penalty of perjury that such holder is not a United States person as defined under the Code and is eligible for treaty benefits or exemption under the Code or (ii) if Sears Holdings common shares are held through certain foreign intermediaries, to satisfy the relevant certification requirements of applicable United States Treasury regulations.
A Non-U.S. Holder eligible for a reduced rate of United States withholding tax pursuant to an income tax treaty may obtain a refund of any excess amounts withheld by timely filing an appropriate claim for refund with the Internal Revenue Service.
If withholding tax applies to the distribution of our common shares and the amount of cash distributed in lieu of fractional common shares to a Non-U.S. Holder, the Non-U.S. Holder’s broker (or other applicable withholding agent) will be required to remit any such withholding tax in cash to the Internal Revenue Service. Depending on the circumstances, the broker (or other applicable withholding agent) may obtain the funds necessary to remit any such withholding tax by asking the Non-U.S. Holder to provide the funds, by using funds in the Non-U.S. Holder’s account with the broker or by selling (on the Non-U.S. Holder’s behalf) all or a portion of our common shares received by the Non-U.S. Holder in the spin-off.
Special rules may apply in the case of a Non-U.S. Holder subject to special treatment under the United States federal income tax laws, including, without limitation, any Non-U.S. Holder (i) that has an office or fixed place of business in the United States; (ii) that is present in the United States for 183 days or more in a taxable year; or (iii) that is (a) a former citizen or long-term resident of the United States, (b) a foreign insurance company that is treated as holding a partnership interest in our company in connection with its U.S. business, (c) a passive foreign investment company, or (d) a corporation that accumulates earnings to avoid U.S. federal income tax. Non-U.S. Holders should consult their own tax advisors regarding the application of these special rules.
Information Reporting and Backup Withholding. In general, information reporting will apply to the distribution of our common shares to a Non-U.S. Holder and any tax withheld with respect to the distribution.
107
Copies of the information return reporting the distribution and any withholding may also be made available to the tax authorities in the country in which the Non-U.S. Holder resides under the provisions of an applicable income tax treaty.
A Non-U.S. Holder will be subject to backup withholding with respect to the distribution of our common shares and the amount of cash distributed in lieu of fractional common shares to such Non-U.S. Holder unless such holder certifies, under penalty of perjury, that it is a Non-U.S. Holder (and the payor does not have actual knowledge or reason to know that such holder is a United States person as defined under the Code), or such holder otherwise establishes an exemption. If backup withholding applies to the distribution of our common shares to a Non-U.S. Holder, the Non-U.S. Holder’s broker (or other applicable withholding agent) will be required to remit any such backup withholding in cash to the Internal Revenue Service. Depending on the circumstances, the broker (or other applicable withholding agent) may obtain the funds necessary to remit such backup withholding by asking the Non-U.S. Holder to provide the funds, by using funds in the Non-U.S. Holder’s account with the broker or by selling (on the Non-U.S. Holder’s behalf) all or a portion of our common shares received by the Non-U.S. Holder in the spin-off. Backup withholding is not an additional tax, and any amounts withheld under the backup withholding rules will be allowed as a refund or a credit against the Non-U.S. Holder’s United States federal income tax liability provided the required information is timely furnished to the Internal Revenue Service.
Tax Consequences to U.S. Holders of the Ownership and Disposition of Our Common Shares
Taxation of Distributions on Common Shares. Subject to the passive foreign investment company rules discussed below, the gross amount of any actual or deemed distribution (including any Canadian taxes withheld therefrom) on our common shares will be included in the gross income of a U.S. Holder as a dividend to the extent such distribution is paid out of our current or accumulated earnings and profits, as determined under United States federal income tax principles. A distribution in excess of our current and accumulated earnings and profits will first be treated as a tax-free return of capital to the extent of such holder’s adjusted tax basis in our common shares and will be applied against and reduce such basis on a dollar-for-dollar basis. Thereafter, to the extent that such distribution exceeds such holder’s adjusted tax basis in our common shares, the distribution will be treated as a gain from the sale or exchange of such common shares. Dividends will not be eligible for the dividends received deduction generally allowed to United States corporations in respect of dividends received from other United States corporations.
With respect to non-corporate U.S. Holders, certain dividends received in taxable years beginning before January 1, 2013 from a “qualified foreign corporation” (as defined in the Code) may be subject to reduced rates of United States federal income taxation. A qualified foreign corporation includes a foreign corporation that is eligible for the benefits of a comprehensive income tax treaty with the United States which the United States Treasury Department determines to be satisfactory for these purposes and which includes an exchange of information provision. The United States Treasury Department has determined that the current income tax treaty between the United States and Canada, or the Treaty, meets these requirements, and we believe we are eligible for the benefits of that Treaty. However, a qualified foreign corporation does not include a non-U.S. corporation that is a passive foreign investment company for the taxable year in which a dividend is paid or that was a passive foreign investment company for the preceding taxable year. Moreover, non-corporate U.S. Holders that do not meet a minimum holding period requirement with respect to our common shares during which they are not protected from a risk of loss or that elect to treat the dividend income as “investment income” will not be eligible for the reduced rates of taxation. In addition, the rate reduction will not apply to dividends if the recipient is obligated to make related payments with respect to positions in substantially similar or related property. This disallowance applies even if the minimum holding period requirement has been met. U.S. Holders should consult their own tax advisors regarding the application of this legislation to their particular circumstances.
The amount of any dividend paid in Canadian dollars will equal the United States dollar value of the Canadian dollars received calculated by reference to the exchange rate in effect on the date the dividend is
108
received by the U.S. Holder, regardless of whether the Canadian dollars are converted into United States dollars. If the Canadian dollars received as a dividend are converted into United States dollars on the date they are received, a U.S. Holder generally will not be required to recognize foreign currency gain or loss in respect of the dividend income. If the Canadian dollars received as a dividend are not converted into United States dollars on the date of receipt, a U.S. Holder will have a basis in the Canadian dollars equal to their United States dollar value on the date of receipt. Any gain or loss realized on a subsequent conversion or other disposition of the Canadian dollars will be treated as United States source ordinary income or loss.
Any tax withheld under Canadian law with respect to distributions on our common shares at a rate not exceeding the rate provided in the Treaty may, subject to a number of complex limitations, be claimed as a foreign tax credit against a U.S. Holder’s U.S. federal income tax liability or may be claimed as a deduction for U.S. federal income tax purposes. The limitation on foreign taxes eligible for credit is calculated separately with respect to specific classes of income. For this purpose, dividends paid with respect to our common shares will be foreign source income and generally will constitute “passive category income” or, in the case of certain U.S. Holders, “general category income.” The rules relating to United States foreign tax credits are complex and the availability of a foreign tax credit depends on numerous factors. U.S. Holders should consult their own tax advisors concerning the application of the United States foreign tax credit rules in light of their particular circumstances.
In connection with the spin-off, the Sears Holdings consolidated group will recognize gain for U.S. federal income tax purposes equal to the difference between its adjusted tax basis in the common shares distributed and their fair market value. Under certain rules related to the disposition of stock of controlled foreign corporations by U.S. shareholders that own more than 10% of such controlled foreign corporation, a portion of the gain recognized by the Sears Holdings consolidated group will be re-characterized, under Section 1248 of the Code, as a dividend to the Sears Holdings consolidated group to the extent of our earnings and profits attributable to such distributed common shares. The amount treated as a dividend by the Sears Holdings consolidated group under Section 1248 of the Code will then become “previously taxed income” under Section 959 of the Code. The “previously taxed income” balance will be maintained in units of Canadian dollars, the functional currency of our earnings and profits. As a result, U.S. Holders who receive our common shares in the spin-off may be able to exclude a portion of subsequent distributions of dividends that are made with respect to our common shares from gross income to the extent that such dividends, measured in units of Canadian dollars, are paid out of the “previously taxed income” under Section 959 of the Code as “successors in interest” to the Sears Holdings consolidated group with respect to the common shares. Although a portion of a subsequent dividend may be excluded to the extent attributable to “previously taxed income,” a U.S. Holder should note that the difference between the United States dollar equivalent of the excluded dividend amount in units of Canadian dollars as calculated by reference to the exchange rate in effect on the date the dividend is received by the U.S. Holder and the United States dollar equivalent of that excluded dividend amount in units of Canadian dollars as calculated by Sears Holdings (at the time of the relevant disposition for Section 1248 purposes) may be recognized by the U.S. Holder as foreign source ordinary income or loss upon receipt of the excluded dividend distribution. If a U.S. Holder excludes a portion of a subsequent dividend distribution from gross income because it was paid out of the “previously taxed income” balance, such holder will be required to reduce its tax basis in our common shares by a corresponding amount in accordance with the rules of Section 961(b) of the Code.
In order to claim the exclusion, a U.S. Holder will be required to comply with the requirements set forth in Treasury Regulation Section 1.959-1(d) for establishing the right to the exclusion. Sears Holdings has notified us that it intends to provide information after the end of our taxable year, to the extent reasonably practicable, for U.S. Holders who receive common shares in the spin-off to assist them in meeting these requirements with respect to any subsequent distribution by Sears Canada, including the amount of “previously taxed income” under Section 959 to be attributed to each distributed common share in units of Canadian dollars as well as the United States dollar equivalent of that amount (as calculated at the time of the relevant disposition for Section 1248 purposes). However, any U.S. Holder who acquires common shares other than in the spin-off will not be able to obtain the information required to meet such requirements (unless certain information is provided by the
109
transferor of those common shares), and, therefore, a subsequent U.S. Holder generally will not be able to claim any such exclusion. U.S. Holders should consult their own tax advisors regarding the United States federal income tax consequences to them of excluding a portion of subsequent distributions made with respect to our common shares pursuant to the special rules described above.
Taxation of Dispositions of Common Shares. Subject to the passive foreign investment company rules discussed below, upon a sale or other taxable disposition of our common shares, a U.S. Holder generally will recognize capital gain or loss for United States federal income tax purposes equal to the difference, if any, between the amount realized and such holder’s adjusted tax basis in our common shares. For taxable years beginning before January 1, 2013, capital gain realized by a non-corporate U.S. Holder, including an individual, generally is taxed at a maximum rate of 15% if the property has been held for more than one year. The deductibility of capital losses is subject to limitations. Any gain or loss recognized by a U.S. Holder generally will be treated as gain or loss from sources within the United States for United States foreign tax credit limitation purposes.
If a U.S. Holder receives any Canadian dollars on the sale or other taxable disposition of our common shares, such U.S. Holder may recognize ordinary income or loss as a result of currency fluctuations between the date of the sale or other taxable disposition of our common shares and the date the sale proceeds are converted into U.S. dollars.
Passive Foreign Investment Company Considerations. Special, generally adverse, United States federal income tax rules apply to United States persons who own shares of a passive foreign investment company, or a PFIC. A non-U.S. corporation will be classified as a PFIC for United States federal income tax purposes for any taxable year in which, after applying relevant look-through rules with respect to the income and assets of subsidiaries, either at least 75% of its gross income is “passive income,” or on average at least 50% of the gross value of its assets is attributable to assets that produce passive income or are held for the production of passive income. If we are classified as a PFIC for any taxable year in which a U.S. Holder held our common shares, we may continue to be classified as a PFIC for any subsequent taxable year in which such holder continues to own our common shares, even if our income or assets would not cause us to be a PFIC in such subsequent taxable year.
Based on our structure, and the composition of our income and assets, we do not expect to be a PFIC for the taxable year ending December 31, 2012, and we expect to operate in such a manner so as not to become a PFIC for succeeding taxable years. However, there can be no assurance the IRS will not successfully challenge our position or that we will not become a PFIC in a future taxable year, as PFIC status is retested each year and depends on our assets and income in such year. If we are classified as a PFIC at any time a U.S. Holder owns our common shares, such holder may be subject to an increased United States federal income tax liability and a special interest charge in respect of gain recognized on the sale or other disposition of common shares and upon the receipt of certain “excess distributions” (as defined in the Code). U.S. Holders should consult their own tax advisors regarding the implications of the PFIC tax regime for the ownership and disposition of our common shares.
Additional Tax Under Recently Enacted Legislation. Certain U.S. Holders who are individuals, estates, or trusts may be required to pay a 3.8% tax on the lesser of (i) such U.S. Holders’ “modified adjusted gross income” (or “adjusted gross income” in the case of estates and trusts) over certain thresholds and (ii) such U.S. Holders’ “net investment income” (or “undistributed net investment income” in the case of estates and trusts), which includes, among other things, dividend income and capital gain from the sale or other disposition of certain property, including our common shares, for taxable years beginning on or after January 1, 2013. U.S. Holders should consult their own tax advisors regarding the implications of this recently enacted legislation for the ownership and disposition of our common shares.
110
Information Reporting and Backup Withholding. In general, information reporting will apply to dividends in respect of our common shares and the proceeds from the sale, exchange or redemption of our common shares that are paid to a U.S. Holder within the United States (and in certain cases, outside the United States), unless such holder is an exempt recipient. Backup withholding may apply to such payments if a U.S. Holder fails to provide a taxpayer identification number or certification of other exempt status or fails to report in full dividend income. Backup withholding is not an additional tax, and any amounts withheld under the backup withholding rules will be allowed as a refund or a credit against a U.S. Holder’s United States federal income tax liability provided the required information is timely furnished to the Internal Revenue Service.
Under recently promulgated U.S. Treasury Regulations, U.S. individuals that own “specified foreign financial assets” with an aggregate fair market value exceeding either $50,000 on the last day of the taxable year or $75,000 at any time during the taxable year generally are required to file an information report with respect to such assets with their tax returns. Significant penalties may apply to persons who fail to comply with these new rules. Specified foreign financial assets include not only financial accounts maintained in foreign financial institutions, but also, unless held in accounts maintained by a financial institution, any stock or security issued by a non-U.S. person. The U.S. Treasury Department and the IRS anticipate that, for taxable years beginning on or after January 1, 2012, these information reporting requirements will apply to certain U.S. entities that own specified foreign financial assets. The failure to report information required under these regulations could result in substantial penalties and in the extension of the statute of limitations with respect to federal income tax returns filed by a U.S. Holder. U.S. Holders should consult their tax advisors regarding the possible implications of these recently promulgated regulations for an investment in our common shares.
Material Canadian Federal Income Tax Considerations
The following summary describes the material Canadian federal income tax considerations of the spin-off and of the holding and disposition of common shares of Sears Canada generally applicable to a Sears Holdings stockholder who receives, as beneficial owner, Sears Canada common shares on the spin-off and who, at all relevant times, for purposes of the Income Tax Act (Canada) and the Income Tax Regulations, or collectively, the Tax Act, (1) deals at arm’s length with us and Sears Holdings; (2) is not affiliated with us or with Sears Holdings; and (3) holds the Sears Canada common shares as capital property, or a Holder. Generally, the Sears Canada common shares will be capital property to a Holder provided the Holder does not acquire or hold those Sears Canada common shares in the course of carrying on a business or as part of an adventure or concern in the nature of trade.
This summary is based on the current provisions of the Tax Act, and an understanding of the current administrative policies and assessing practices and policies of the Canada Revenue Agency published in writing prior to the date hereof. This summary takes into account all specific proposals to amend the Tax Act publicly announced by or on behalf of the Minister of Finance (Canada) prior to the date hereof, or the Proposed Amendments, and assumes that all Proposed Amendments will be enacted in the form proposed. However, no assurances can be given that the Proposed Amendments will be enacted as proposed, or at all. This summary does not otherwise take into account or anticipate any changes in law or administrative policy or assessing practice whether by legislative, administrative or judicial action nor does it take into account tax legislation or considerations of any province, territory or foreign jurisdiction, which may differ from those discussed herein.
This summary is of a general nature only and is not, and is not intended to be, legal or tax advice to any particular shareholder. This summary is not exhaustive of all Canadian federal income tax considerations. Accordingly, Sears Holdings stockholders should consult their own tax advisors having regard to their own particular circumstances.
111
Currency Conversion
Generally, for purposes of the Tax Act, all amounts relating to the acquisition, holding or disposition of the Sears Canada common shares must be converted into Canadian dollars based on exchange rates as determined in accordance with the Tax Act.
Holders Not Resident in Canada
This portion of the summary is generally applicable to a Holder who, at all relevant times, for purposes of the Tax Act, is not, and is not deemed to be, resident in Canada, does not, and is not deemed to hold, Sears Holdings common stock in a business carried on in Canada, and will not use or hold, and will not be deemed to use or hold, the Sears Canada common shares in a business carried on in Canada, or a Non-Resident Holder. Special rules, which are not discussed in this summary, may apply to a non-Canadian Sears Holdings stockholder that is an insurer that carries on an insurance business in Canada and elsewhere.
The Spin-Off
A Non-Resident Holder will not be required to include any amount in computing its income for purposes of the Tax Act as a result of the receipt of Sears Canada common shares pursuant to the spin-off and will not be subject to any withholding tax under the Tax Act in respect of such receipt of Sears Canada common shares (or cash in lieu of a fractional share). A Non-Resident Holder will be considered to have acquired the Sears Canada common shares received by the Non-Resident Holder on the spin-off at a cost equal to the fair market value of the Sears Canada common shares at the time of the spin-off. The adjusted cost base to the Non-Resident Holder of such Sears Canada common shares will be determined by averaging the cost of such shares with the adjusted cost base of all other Sears Canada common shares owned by the Non-Resident Holder as capital property immediately prior to the spin-off and acquired after December 31, 1971.
Dividends on Sears Canada Common Shares
Dividends paid or credited on the Sears Canada common shares or deemed to be paid or credited on the Sears Canada common shares to a Non-Resident Holder will be subject to Canadian withholding tax at the rate of 25%, subject to any reduction in the rate of withholding to which the Non-Resident Holder is entitled under any applicable income tax convention. For example, under the Canada-U.S. Income Tax Convention (1980), the Convention, where dividends on the Sears Canada common shares are considered to be paid to or derived by a Non-Resident Holder that is the beneficial owner of the dividends and is a U.S. resident for the purposes of, and is entitled to benefits in accordance with, the provisions of the Convention, the applicable rate of Canadian withholding tax is generally reduced to (i) 5% if the beneficial owner of the dividends is a company that owns at least 10% of our voting stock and (ii) 15% in other cases.
Dispositions of Sears Canada Common Shares
A Non-Resident Holder will not be subject to tax under the Tax Act on any capital gain realized on a disposition or deemed disposition of Sears Canada common shares, unless the Sears Canada common shares are “taxable Canadian property” of the Non-Resident Holder for purposes of the Tax Act and the Non-Resident Holder is not entitled to relief under an applicable income tax convention between Canada and the country in which the Non-Resident Holder is resident.
Generally, the Sears Canada common shares will not constitute taxable Canadian property of a Non-Resident Holder at a particular time provided that the Sears Canada common shares are listed at that time on a designated stock exchange (which includes the TSX), unless at any particular time during the 60-month period that ends at that time (1) the Non-Resident Holder, persons with whom the Non-Resident Holder does not deal with at arm’s length, or the Non-Resident Holder together with all such persons, owned 25% or more of the issued shares of any class or series of our capital stock and (2) more than 50% of the fair market value of the
112
Sears Canada common shares was derived directly or indirectly from one or any combination of: (i) real or immovable properties situated in Canada, (ii) “Canadian resource properties” (as defined in the Tax Act), (iii) “timber resource properties” (as defined in the Tax Act), and (iv) options in respect of, or interests in, or for civil law rights in, property in any of the foregoing whether or not the property exists. Notwithstanding the foregoing, in certain circumstances set out in the Tax Act, Sears Canada common shares could be deemed to be taxable Canadian property of a Non-Resident Holder. Non-Resident Holders whose Sears Canada common shares may constitute taxable Canadian property should consult their own tax advisors.
Holders Resident in Canada
This portion of the summary is generally applicable to a Holder who, at all relevant times, for purposes of the Tax Act, is, or is deemed to be resident in Canada, or a Resident Holder. Certain Resident Holders may be entitled to make or may have already made the irrevocable election permitted by subsection 39(4) of the Tax Act the effect of which may be to deem to be capital property any Sears Canada common shares (and all other “Canadian securities”, as defined in the Tax Act) owned by such Resident Holder in the taxation year in which the election is made and in all subsequent taxation years. Resident Holders whose Sears Canada common shares might not otherwise be considered to be capital property should consult their own tax advisors concerning this election. This portion of the summary is not applicable to a Sears Holdings stockholder (i) that is a “specified financial institution”, (ii) an interest in which is a “tax shelter investment”, (iii) that is, for purposes of certain rules (referred to as the mark-to-market rules) applicable to securities held by financial institutions, a “financial institution”, (iv) that reports its “Canadian tax results” in a currency other than Canadian currency, or (v) in respect of whom Sears Holdings is a “foreign affiliate”, each as defined in the Tax Act. Such Sears Holdings stockholders should consult their own tax advisors.
The Spin-Off
A Resident Holder will be required to include in computing its income for the taxation year in which it receives the Sears Canada common shares pursuant to the spin-off an amount (which would include any United States taxes withheld in respect of the spin-off) equal to the sum of the fair market value of the Sears Canada common shares at the time of the spin-off and the amount of cash received in lieu of a fractional share. The gross-up and dividend tax credit rules applicable to individuals, and the deduction available to corporations, that generally apply in respect of dividends paid by a taxable Canada corporation will not apply to the dividend- in-kind of the Sears Canada common shares that is being paid by Sears Holdings pursuant to the spin-off or to the amount of any cash received in lieu of a fractional share.
A Resident Holder will be considered to have acquired the Sears Canada common shares received by the Non-Resident Holder on the spin-off at a cost equal to the fair market value of the Sears Canada common shares at the time of the spin-off. The adjusted cost base to the Resident Holder of such Sears Canada common shares will be determined by averaging the cost of such shares with the adjusted cost base of all other Sears Canada common shares owned by the Resident Holder as capital property immediately prior to the spin-off and acquired after December 31, 1971.
A Resident Holder may be entitled to a credit and/or deduction under the Tax Act in respect of U.S. withholding tax paid by the Resident Holder in respect of the dividend-in-kind of the Sears Canada common shares paid by Sears Holdings pursuant to the spin-off, subject to the detailed provisions of the Tax Act. Resident Holders are urged to consult their tax advisors with respect to the availability of any such credit or deduction.
Dividends on Sears Canada Common Shares
A Resident Holder will be required to include in computing its income for a taxation year any dividends received on the Sears Canada common shares. In the case of a Resident Holder that is an individual (other than certain trusts), such dividends will be subject to the gross-up and dividend tax credit rules applicable to taxable dividends received from taxable Canadian corporations, including the enhanced gross-up and dividend tax credit
113
applicable to any dividends designated by us as an eligible dividend in accordance with the provisions of the Tax Act. A dividend received by a Resident Holder that is a corporation will generally be deductible in computing the corporation’s taxable income.
A Resident Holder that is “private corporation”, as defined in the Tax Act, or any other corporation controlled, whether because of a beneficial interest in one or more trusts or otherwise, by or for the benefit of an individual (other than a trust) or a related group of individuals (other than trusts), will generally be liable to pay a refundable tax of 33 1/3 % under Part IV of the Tax Act on dividends received on the Sears Canada common shares to the extent such dividends are deductible in computing the Resident Holder’s taxable income for the taxation year. This tax will generally be refunded to the corporation at a rate of $1.00 for every $3.00 of taxable dividends paid while it is a private corporation.
Dividends received by an individual (including certain trusts) may give rise to a liability for alternative minimum tax as calculated under the detailed rules set out in the Tax Act.
Dispositions of Sears Canada Common Shares
Generally, on a disposition or deemed disposition of a Sears Canada common share, a Resident Holder will realize a capital gain (or capital loss) equal to the amount, if any, by which the proceeds of disposition, net of any reasonable costs of disposition, exceed (or are less than) the adjusted cost base to the Resident Holder of the Sears Canada common share immediately before the disposition or deemed disposition.
Generally, a Resident Holder is required to include in computing its income for a taxation year one-half of the amount of any capital gain, or a taxable capital gain, realized in the year. Subject to and in accordance with the provisions of the Tax Act, a Resident Holder is required to deduct one-half of the amount of any capital loss, or an allowable capital loss, realized in a taxation year from taxable capital gains realized by the Resident Holder in the year and allowable capital losses in excess of taxable capital gains for the year may be carried back and deducted in any of the three preceding taxation years or carried forward and deducted in any subsequent taxation year against net taxable capital gains realized in such years.
The amount of any capital loss realized by a Resident Holder that is a corporation on the disposition of a Sears Canada common share may be reduced by the amount of any dividends received by the Resident Holder on such Sears Canada common share to the extent and under the circumstances prescribed by the Tax Act. Similar rules may apply where a Sears Canada common share is owned by a partnership or trust of which a corporation, trust or partnership is a member or beneficiary. Such Resident Holders should consult their own advisors.
A Resident Holder that is, through the relevant taxation year, a “Canadian-controlled private corporation”, as defined in the Tax Act, may be liable for a refundable tax on “aggregate investment income”, which is defined in the Tax Act to include taxable capital gains.
Capital gains realized by an individual (including certain trusts) may give rise to a liability for alternative minimum tax as calculated under the detailed rules set out in the Tax Act.
Eligibility for Investment
On the date of the spin-off, the Sears Canada common shares will be qualified investments under the Tax Act for trusts governed by registered retirement savings plans, or a RRSP, registered retirement income funds, or a RRIF, registered education savings plans, deferred profit sharing plans, registered disability savings plans and tax-free savings accounts, or a TFSA, and, in the case of an RRSP, an RRIF or a TFSA, provided the annuitant of the RRSP or RRIF or the holder of the TFSA, as the case may be, does not have a “significant interest” (within the meaning of the Tax Act) in Sears Canada or in a corporation, partnership or trust that does not deal at arm’s length with Sears Canada, will not be a prohibited investment under the Tax Act for such RRSP, RRIF or TFSA.
114
10.F. DIVIDENDS AND PAYING AGENTS
Dividends
There were no dividends declared or paid to holders of common shares in Fiscal 2011. During Fiscal 2010, we distributed approximately $753.4 million to holders of common shares as extraordinary cash dividends. Payments in the amounts of $3.50 per common share were made to shareholders on: (i) June 4, 2010; and (ii) September 24, 2010. In 2006, we announced that we would discontinue the practice of paying quarterly dividends.
We regularly monitor our sources and uses of cash and our level of cash on hand, and consider the most effective use of cash on hand including, among other options, the payment of dividends.
Paying Agent
Our transfer agent, Canadian Stock Transfer Company Inc., has been appointed to act as paying agent for distributions by us in 2012.
10.G. STATEMENT BY EXPERTS
The consolidated financial statements of Sears Canada Inc. as of January 28, 2012, January 29, 2011 and January 31, 2010 and for each of the 52 week periods ended January 28, 2012 and January 29, 2011 included in this Form 20-F have been audited by Deloitte & Touche LLP, an independent registered public accounting firm, as stated in their report appearing herein and elsewhere in this Form 20-F. Such financial statements are included in reliance upon the reports of such firm given upon their authority as experts in accounting and auditing. The address of Deloitte & Touche LLP is Suite 1400, Brookfield Place, 181 Bay Street, Toronto, Ontario, M5J 2V1, Canada.
10.H. DOCUMENTS ON DISPLAY
Any statement in this Form 20-F about any of our contracts or other documents is not necessarily complete. If the contract or document is filed as an exhibit to the Form 20-F, the contract or document is deemed to modify the description contained in this Form 20-F. You must review the exhibits themselves for a complete description of the contract or document.
Our SEC filings are available at the SEC’s website at www.sec.gov. You may also read and copy any document we file with the SEC at the public reference facilities maintained by the SEC at SEC Headquarters, Public Reference Section, 100 F Street, N.E., Washington D.C. 20549. You may obtain information on the operation of the SEC’s public reference facilities by calling the SEC at 1-800-SEC-0330.
In addition, we are required by Canadian securities laws to file documents electronically with Canadian securities regulatory authorities and these filings are available on our SEDAR profile at www.sedar.com. Requests for such documents should be directed to our Corporate Communications Department in writing at 290 Yonge Street, Suite 700, Toronto, Ontario, Canada, M5B 2C3, or by phone at (416) 941-4428.
10.I. SUBSIDIARY INFORMATION
Not applicable.
ITEM 11. QUANTITATIVE AND QUALITATIVE DISCLOSURES ABOUT MARKET RISK
The Company is exposed to credit, liquidity and market risk as a result of holding financial instruments. Market risk consists of foreign exchange and interest rate risk. See Note 14 “Financial instruments” of the Notes to the Q1 2012 Interim Condensed Consolidated Financial Statements for additional information.
115
Credit Risk
Credit risk refers to the possibility that the Company can suffer financial losses due to the failure of the Company’s counterparties to meet their payment obligations. The Company is exposed to minimal credit risk from customers as a result of ongoing credit evaluations and review of accounts receivable collectability.
Cash and cash equivalents, accounts receivable, derivative financial assets and investments included in other long-term assets of $489.9 million as at April 28, 2012 (January 28, 2012: $514.9 million, April 30, 2011: $330.9 million) expose the Company to credit risk should the borrower default on maturity of the cash and cash equivalents, accounts receivable, derivative financial assets or investments. The Company manages its exposure to credit risk from cash and cash equivalents, derivative financial assets and investments included in other long-term assets through policies that require borrowers to have a minimum credit rating of A, and limiting investments with individual borrowers at maximum levels based on credit rating.
Liquidity Risk
Liquidity risk is the risk that the Company may not have cash available to satisfy financial liabilities as they come due. The Company actively maintains access to adequate funding sources to seek to ensure it has sufficient available funds to meet current and foreseeable financial requirements at a reasonable cost. See Item 5.F. “Operating and Financial Review and Prospects – Tabular Disclosure of Contractual Obligations”.
Market Risk
Market risk exists as a result of the potential for losses caused by changes in market factors such as foreign currency exchange rates, interest rates and commodity prices.
Foreign Exchange Risk
The Company may enter into foreign exchange contracts to reduce the foreign exchange risk with respect to U.S. dollar denominated assets and liabilities and purchases of goods or services.
| | • | | As at April 28, 2012, there were no option contracts outstanding (January 28, 2012: no option contracts outstanding, April 30, 2011: notional value of option contracts outstanding was U.S. $279.0 million, January 29, 2011: notional value of option contracts outstanding was U.S. $372.0 million) and therefore, no derivative financial assets nor derivative financial liabilities were recognized in the unaudited Condensed Consolidated Statements of Financial Position (January 28, 2012: Nil, April 30, 2011: $17.1 million included in “Derivative financial liabilities”, January 29, 2011: $3.0 million included in “Derivative financial liabilities”). The intrinsic value portion of derivatives is designated as a cash flow hedge for hedge accounting treatment under IAS 39. Option contracts are intended to reduce the foreign exchange risk with respect to anticipated purchases of U.S. dollar denominated goods and services, including goods purchased for resale, or hedged item. |
| | • | | As at April 28, 2012, there were also no swap contracts outstanding (January 28, 2012: no swap contracts outstanding, April 30, 2011: notional value of swap contracts outstanding was U.S. $6.2 million, January 29, 2011: notional value of swap contracts outstanding was U.S. $6.8 million) and therefore, no derivative financial assets nor derivative financial liabilities were recognized in the unaudited Condensed Consolidated Statements of Financial Position (January 28, 2012: Nil, April 30, 2011: less than $0.1 million included in “Derivative financial assets”, January 29, 2011: less than $0.1 million included in “Derivative financial liabilities”). Swap contracts are intended to reduce the foreign exchange risk on U.S. dollar denominated short-term investments pledged as collateral for letter of credit obligations issued under the Company’s offshore merchandise purchasing program. |
While the notional principal of outstanding financial instruments is not recorded on the unaudited Condensed Consolidated Statements of Financial Position, the fair value of any outstanding contracts is included
116
in “Derivative financial assets” or “Derivative financial liabilities”, depending on the fair value, and classified as current or long-term, depending on the maturities of the outstanding contracts. Changes in the fair value of the designated portion of contracts are included in OCI for cash flow hedges, to the extent the designated portion of the hedges continue to be effective, with the ineffective portion included in “Selling, administrative and other expenses” in the unaudited Condensed Consolidated Statements of Net Earnings (Loss) and Comprehensive Income (Loss). Amounts previously included in OCI are reclassified to “Cost of goods and services sold” in the same period in which the hedged item impacts net earnings (loss).
For the 13-week period ended April 28, 2012, the Company recorded a gain of $1.8 million (2011: gain of $2.6 million) relating to the translation or settlement of U.S. dollar denominated monetary items consisting of cash and cash equivalents, accounts receivable and accounts payable, excluding the reclassification from OCI of the gain (loss) on foreign exchange derivatives designated as cash flow hedges.
The period end exchange rate was 1.0194 U.S. dollar to Canadian dollar. A 10% appreciation or depreciation of the U.S. and/or the Canadian dollar exchange rate was determined to have an after-tax impact on net earnings (loss) of $7.3 million for U.S. dollar denominated balances included in cash and cash equivalents, accounts receivable and accounts payable.
Interest Rate Risk
From time to time, the Company may enter into interest rate swap contracts with approved financial institutions to manage exposure to interest rate risks. Interest rate risk reflects the sensitivity of the Company’s financial condition to movements in interest rates. Financial assets and liabilities which do not bear interest or bear interest at fixed rates are classified as non-interest rate sensitive. As at April 28, 2012, the Company had no interest rate swap contracts in place.
Cash and cash equivalents and borrowings under our Credit Facility are subject to interest rate risk. The total subject to interest rate risk as at April 28, 2012 was a net asset of $362.9 million (January 28, 2012: net asset of $297.7 million, April 30, 2011: net asset of $197.2 million). An increase or decrease in interest rates of 0.25% would cause an immaterial after-tax impact on quarterly net earnings (loss).
Investment Returns
The Company invests its surplus cash in investment grade, short-term money market instruments, the return on which depends upon interest rates and the credit worthiness of the issuer. The Company attempts to mitigate credit risk resulting from the possibility that an issuer may default on repayment by requiring that issuers have a minimum credit rating and limiting exposures to individual borrowers.
Retirement Benefit Plans
There is no assurance that the Company’s retirement benefit plans will be able to earn the assumed rate of return. New regulations and market driven changes may result in changes in the discount rates and other variables which would result in the Company being required to make contributions in the future that differ significantly from the estimates. Management is required to use assumptions to account for the plans in conformity with IFRS. However, actual future experience will differ from these assumptions giving rise to actuarial gains or losses. In any year, actual experience differing from the assumptions may be material. The relevant accounting standard contemplates such differences and allows these actuarial gains or losses to be recognized over the expected average remaining service life of the employee group covered.
Plan assets consist primarily of cash, alternative investments, marketable equity and fixed income securities. The value of the marketable equity and fixed income investments will fluctuate due to changes in market prices. Plan obligations and annual pension expense are determined by independent actuaries and through the use of a
117
number of assumptions. Although the Company believes that the assumptions used in the actuarial valuation process are reasonable, there remains a degree of risk and uncertainty which may cause results to differ materially from expectations. Key assumptions in measuring the benefit obligations and pension plan costs include the discount rate, the rate of compensation increase, and the expected return on plan assets. The discount rate is based on the yield of high-quality, fixed-income investments, at the year-end date, with maturities corresponding to the anticipated timing of future benefit payments. The compensation increase assumption is based upon historical experience and anticipated future management actions. Refer to Note 20.4 “Pension assumptions” of the Notes to the 2011 Annual Consolidated Financial Statements for more information on the weighted-average actuarial assumptions for the plans.
ITEM 12. DESCRIPTION OF SECURITIES OTHER THAN EQUITY SECURITIES
12.A. DEBT SECURITIES
Not applicable.
12.B. WARRANTS AND RIGHTS
Not applicable.
12.C. OTHER SECURITIES
Not applicable.
12.D. AMERICAN DEPOSITARY SHARES
Not applicable.
118
PART II
ITEM 13. DEFAULTS, DIVIDEND ARREARAGES AND DELINQUENCIES
None.
ITEM 14. MATERIAL MODIFICATIONS TO THE RIGHTS OF SECURITY HOLDERS AND USE OF PROCEEDS
None.
ITEM 15. CONTROLS AND PROCEDURES
Not applicable.
ITEM 16. [RESERVED]
16.A. AUDIT COMMITTEE FINANCIAL EXPERTS
Not applicable.
16.B. CODE OF ETHICS
Not applicable.
16.C. PRINCIPAL ACCOUNTANT FEES AND SERVICES
Not applicable.
16.D. EXEMPTIONS FROM THE LISTING STANDARDS FOR AUDIT COMMITTEES
Not applicable.
16.E. PURCHASES OF EQUITY SECURITIES BY THE ISSUER AND AFFILIATED PURCHASERS
We have in the past purchased, subject to applicable law, our common shares for cancellation in the open market. See Item 10.A “Additional Information – Share Capital – Normal Course Issuer Bid”.
16.F. CHANGE IN REGISTRANT’S CERTIFYING ACCOUNTANT
None.
16.G. CORPORATE GOVERNANCE
Not applicable.
16.H. MINING SAFETY DISCLOSURE
Not applicable.
119
PART III
ITEM 17. FINANCIAL STATEMENTS
Not applicable.
ITEM 18. FINANCIAL STATEMENTS
See the list of financial statements beginning on page F-1 which are filed as part of this Form 20-F.
ITEM 19. EXHIBITS
| | |
| Number | | Description |
| |
| 1.1 | | Certificate of Amalgamation dated December 30, 1999. |
| |
| 1.2 | | Articles of Amalgamation dated December 30, 1999. |
| |
| 1.3 | | By-Laws dated April 21, 2011. |
| |
| 4.1 | | Program Agreement, dated November 15, 2005, by and between Sears Canada Inc., Sears Canada Bank and JPMorgan Chase Bank, N.A. |
| |
| 4.2 | | Credit Agreement, dated September 10, 2010, among Sears Canada Inc. and the lenders named therein. |
| |
| 4.3 | | Agreement, dated January 26, 1987, between Sears Canada Inc. and Sears, Roebuck and Co. |
| |
| 4.4 | | Employment Agreement, dated June 22, 2011, between Sears Canada Inc. and Calvin McDonald. |
| |
| 4.5 | | Employment Agreement, dated December 21, 2010, between Sears Canada Inc. and Sharon Driscoll. |
| |
| 4.6 | | Employment Agreement, dated May 16, 2011, between Sears Canada Inc. and Thomas Fitzgerald. |
| |
| 4.7 | | Employment Agreement, dated July 25, 2011, between Sears Canada Inc. and Steven Goldsmith. |
| |
| 4.8 | | Employment Agreement, dated June 1, 2012, between Sears Canada Inc. and Douglas Campbell. |
| |
| 4.9 | | Form of Indemnification Agreement of Directors and Officers. |
| |
| 8.1 | | List of Significant Subsidiaries.* |
| |
| 23.1 | | Consent of Deloitte & Touche LLP. |
| * | To be filed by amendment. |
120
SIGNATURES
The registrant hereby certifies that it meets all of the requirements for filing on this Form 20-F and that it has duly caused and authorized the undersigned to sign this Form 20-F on its behalf.
| | |
| SEARS CANADA INC. |
| |
By: | | /s/ Klaudio Leshnjani |
| | Name: Klaudio Leshnjani |
| | Title: Senior Vice-President and General Counsel |
Date: July 9, 2012
121
SEARS CANADA INC.
INDEX TO FINANCIAL STATEMENTS
| | | | |
| | | Page | |
Report of Independent Registered Chartered Accountants | | | F-1 | |
Audited Consolidated Financial Statements and the notes thereto for the 52-week periods ended January 28, 2012 and January 29, 2011. | | | F-2 | |
122
Report of Independent Registered Chartered Accountants
To the Shareholders and Board of Directors of
Sears Canada Inc.
We have audited the accompanying consolidated financial statements of Sears Canada Inc. and subsidiaries, which comprise the consolidated statements of financial position as at January 28, 2012, January 29, 2011 and January 31, 2010 and the consolidated statements of net (loss) earnings and comprehensive (loss) income, consolidated statements of changes in shareholders’ equity and consolidated statements of cash flows for the 52 week periods ended January 28, 2012 and January 29, 2011, and a summary of significant accounting policies and other explanatory information.
Management’s Responsibility for the Consolidated Financial Statements
Management is responsible for the preparation and fair presentation of these consolidated financial statements in accordance with International Financial Reporting Standards as issued by the International Accounting Standards Board, and for such internal control as management determines is necessary to enable the preparation of consolidated financial statements that are free from material misstatement, whether due to fraud or error.
Auditor’s Responsibility
Our responsibility is to express an opinion on these consolidated financial statements based on our audits. We conducted our audits in accordance with Canadian generally accepted auditing standards and the standards of the Public Company Accounting Oversight Board (United States). Those standards require that we comply with ethical requirements and plan and perform the audit to obtain reasonable assurance about whether the consolidated financial statements are free from material misstatement.
An audit involves performing procedures to obtain audit evidence about the amounts and disclosures in the consolidated financial statements. The procedures selected depend on the auditor’s judgment, including the assessment of the risks of material misstatement of the consolidated financial statements, whether due to fraud or error. In making those risk assessments, the auditor considers internal control relevant to the entity’s preparation and fair presentation of the consolidated financial statements in order to design audit procedures that are appropriate in the circumstances, but not for the purpose of expressing an opinion on the effectiveness of the entity’s internal control. An audit also includes evaluating the appropriateness of accounting policies used and the reasonableness of accounting estimates made by management, as well as evaluating the overall presentation of the consolidated financial statements.
We believe that the audit evidence we have obtained in our audits is sufficient and appropriate to provide a basis for our audit opinion.
Opinion
In our opinion, the consolidated financial statements present fairly, in all material respects, the financial position of Sears Canada Inc. and subsidiaries as at January 28, 2012, January 29, 2011 and January 31, 2010 and their financial performance and cash flows for the 52 week periods ended January 28, 2012 and January 29, 2011 in accordance with International Financial Reporting Standards as issued by the International Accounting Standards Board.
/s/ Deloitte & Touche LLP
Independent Registered Chartered Accountants
Licensed Public Accountants
May 31, 2012
Toronto, Canada
F-1
TABLE OF CONTENTS
F-2
SEARS CANADA INC.
CONSOLIDATED STATEMENTS OF FINANCIAL POSITION
| | | | | | | | | | | | | | | | |
(in CAD millions) | | Notes | | | As at
January 28, 2012
(Recast - Note 2) | | | As at
January 29, 2011
(Recast - Note 2) | | | As at
January 31, 2010
(Recast - Note 2) | |
ASSETS | | | | | | | | | | | | | | | | |
Current assets | | | | | | | | | | | | | | | | |
Cash and cash equivalents | | | 5,14,21.2 | | | $ | 397.4 | | | $ | 432.3 | | | $ | 226.9 | |
Short-term investments | | | 14 | | | | — | | | | — | | | | 1,165.5 | |
Accounts receivable, net | | | 6,14 | | | | 116.2 | | | | 144.0 | | | | 132.9 | |
Income taxes recoverable | | | | | | | 4.1 | | | | 4.5 | | | | 5.7 | |
Inventories | | | | | | | 823.9 | | | | 953.2 | | | | 852.3 | |
Prepaid expenses | | | 8 | | | | 27.9 | | | | 31.8 | | | | 34.8 | |
Derivative financial assets | | | 14 | | | | — | | | | — | | | | 9.9 | |
| | | | | | | | | | | | | | | | |
Total current assets | | | | | | | 1,369.5 | | | | 1,565.8 | | | | 2,428.0 | |
Non-current assets | | | | | | | | | | | | | | | | |
Property, plant and equipment | | | 9,19 | | | | 872.0 | | | | 900.7 | | | | 961.0 | |
Investment property | | | 9 | | | | 21.7 | | | | 21.7 | | | | 21.7 | |
Intangible assets | | | 10.2 | | | | 23.6 | | | | 23.5 | | | | 22.6 | |
Goodwill | | | 10.1 | | | | 8.7 | | | | 11.2 | | | | 11.2 | |
Investment in joint ventures | | | 11 | | | | 301.4 | | | | 313.3 | | | | 321.0 | |
Deferred tax assets | | | 22 | | | | 84.6 | | | | 33.2 | | | | 0.6 | |
Other long-term assets | | | 12,14,16,22 | | | | 49.2 | | | | 38.1 | | | | 42.2 | |
| | | | | | | | | | | | | | | | |
Total assets | | | | | | $ | 2,730.7 | | | $ | 2,907.5 | | | $ | 3,808.3 | |
| | | | | | | | | | | | | | | | |
LIABILITIES | | | | | | | | | | | | | | | | |
Current liabilities | | | | | | | | | | | | | | | | |
Accounts payable and accrued liabilities | | | 15 | | | $ | 576.8 | | | $ | 665.6 | | | $ | 698.3 | |
Deferred revenue | | | 13 | | | | 208.0 | | | | 224.0 | | | | 235.9 | |
Provisions | | | 16 | | | | 64.8 | | | | 65.3 | | | | 69.4 | |
Income taxes payable | | | | | | | 1.0 | | | | 1.0 | | | | 8.0 | |
Other taxes payable | | | | | | | 42.8 | | | | 65.3 | | | | 64.6 | |
Derivative financial liabilities | | | 14 | | | | — | | | | 3.0 | | | | — | |
Principal payments on long-term obligations due within one year | | | 14,17,19,24 | | | | 5.1 | | | | 4.7 | | | | 305.4 | |
| | | | | | | | | | | | | | | | |
Total current liabilities | | | | | | | 898.5 | | | | 1,028.9 | | | | 1,381.6 | |
Non-current liabilities | | | | | | | | | | | | | | | | |
Long-term obligations | | | 14,17,19,24 | | | | 117.6 | | | | 124.4 | | | | 26.1 | |
Deferred revenue | | | 13 | | | | 89.2 | | | | 77.4 | | | | 67.5 | |
Retirement benefit liability | | | 20.1 | | | | 452.3 | | | | 326.2 | | | | 222.9 | |
Deferred tax liabilities | | | 22 | | | | 5.3 | | | | 5.5 | | | | 12.3 | |
Other long-term liabilities | | | 16,18 | | | | 75.8 | | | | 84.7 | | | | 93.5 | |
| | | | | | | | | | | | | | | | |
Total liabilities | | | | | | | 1,638.7 | | | | 1,647.1 | | | | 1,803.9 | |
| | | | | | | | | | | | | | | | |
SHAREHOLDERS’ EQUITY | | | | | | | | | | | | | | | | |
Capital stock | | | 23 | | | | 15.0 | | | | 15.4 | | | | 15.7 | |
Retained earnings | | | 23,24,32 | | | | 1,218.5 | | | | 1,310.4 | | | | 1,981.5 | |
Accumulated other comprehensive (loss) gain | | | | | | | (141.5 | ) | | | (65.4 | ) | | | 7.2 | |
| | | | | | | | | | | | | | | | |
Total shareholders’ equity | | | | | | | 1,092.0 | | | | 1,260.4 | | | | 2,004.4 | |
| | | | | | | | | | | | | | | | |
Total liabilities and shareholders’ equity | | | | | | $ | 2,730.7 | | | $ | 2,907.5 | | | $ | 3,808.3 | |
| | | | | | | | | | | | | | | | |
The accompanying notes are an integral part of these consolidated financial statements.
F-3
SEARS CANADA INC.
CONSOLIDATED STATEMENTS OF NET (LOSS) EARNINGS AND COMPREHENSIVE (LOSS) INCOME
For the 52-week periods ended January 28, 2012 and January 29, 2011
| | | | | | | | | | |
(in CAD millions, except per share amounts) | | Notes | | 2011
(Recast - Note 2) | | | 2010
(Recast - Note 2) | |
Revenue | | 25 | | $ | 4,619.3 | | | $ | 4,938.5 | |
Cost of goods and services sold | | 7,14 | | | 2,932.3 | | | | 2,997.7 | |
Selling, administrative and other expenses | | 9,10,20.4,26 | | | 1,737.9 | | | | 1,744.5 | |
| | | | | | | | | | |
Operating (loss) earnings | | | | | (50.9 | ) | | | 196.3 | |
| | | | | | | | | | |
Finance costs | | 17,22 | | | 16.0 | | | | 16.6 | |
Interest income | | 5 | | | (1.7 | ) | | | (4.2 | ) |
Share of income from joint ventures | | 11 | | | (8.3 | ) | | | (3.2 | ) |
| | | | | | | | | | |
(Loss) earnings before income taxes | | | | | (56.9 | ) | | | 187.1 | |
| | | | | | | | | | |
Income tax (recovery) expense | | | | | | | | | | |
Current | | 22 | | | 18.7 | | | | 75.4 | |
Deferred | | 22 | | | (25.3 | ) | | | (13.3 | ) |
| | | | | | | | | | |
| | 22 | | | (6.6 | ) | | | 62.1 | |
| | | | | | | | | | |
Net (loss) earnings | | | | $ | (50.3 | ) | | $ | 125.0 | |
| | | | | | | | | | |
Basic net (loss) earnings per share | | 29 | | $ | (0.48 | ) | | $ | 1.16 | |
Diluted net (loss) earnings per share | | 29 | | $ | (0.48 | ) | | $ | 1.16 | |
Net (loss) earnings | | | | $ | (50.3 | ) | | $ | 125.0 | |
Other comprehensive (loss) earnings, net of taxes: | | | | | | | | | | |
Mark-to-market adjustment on cash and cash equivalents | | | | | — | | | | (0.2 | ) |
Loss on foreign exchange derivatives, net of income tax recovery of $1.7 (2010: recovery of $3.4) | | | | | (4.1 | ) | | | (7.5 | ) |
Reclassification to net (loss) earnings of loss (gain) on foreign exchange derivatives, net of income tax recovery of $2.8 (2010: expense of $1.1) | | | | | 7.1 | | | | (2.3 | ) |
Remeasurement loss on net defined retirement benefit liability, net of income tax recovery of $27.4 (2010: recovery of $21.7) | | | | | (79.1 | ) | | | (62.6 | ) |
| | | | | | | | | | |
Other comprehensive loss | | | | | (76.1 | ) | | | (72.6 | ) |
| | | | | | | | | | |
Comprehensive (loss) income | | | | $ | (126.4 | ) | | $ | 52.4 | |
| | | | | | | | | | |
The accompanying notes are an integral part of these consolidated financial statements.
F-4
SEARS CANADA INC.
CONSOLIDATED STATEMENTS OF CHANGES IN SHAREHOLDERS’ EQUITY
For the 52-week periods ended January 28, 2012 and January 29, 2011
| | | | | | | | | | | | | | | | | | | | | | | | | | | | | | | | |
(in CAD millions) (Recast - Note 2) | | Notes | | | Capital
stock | | | Retained
earnings | | | Mark-to-market
on short-term
investments
within cash and
cash equivalents | | | Foreign exchange
derivatives
designated as cash
flow hedges | | | Remeasurement
losses | | | Accumulated
other
comprehensive
loss | | | Shareholders’
equity | |
Balance as at January 29, 2011 | | | | | | $ | 15.4 | | | $ | 1,310.4 | | | $ | — | | | $ | (2.8 | ) | | $ | (62.6 | ) | | $ | (65.4 | ) | | $ | 1,260.4 | |
Comprehensive (loss) income | | | | | | | | | | | | | | | | | | | | | | | | | | | | | | | | |
Net loss | | | | | | | | | | | (50.3 | ) | | | | | | | | | | | | | | | — | | | | (50.3 | ) |
Other comprehensive (loss) income | | | | | | | | | | | | | | | | | | | | | | | | | | | | | | | | |
Loss on foreign exchange derivatives, net of income tax recovery of $1.7 | | | | | | | | | | | | | | | | | | | (4.1 | ) | | | | | | | (4.1 | ) | | | (4.1 | ) |
Reclassification of loss on foreign exchange derivatives, net of income tax recovery of $2.8 | | | | | | | | | | | | | | | | | | | 7.1 | | | | | | | | 7.1 | | | | 7.1 | |
Remeasurement losses on retirement benefit liability, net of income tax recovery of $27.4 | | | | | | | | | | | | | | | | | | | | | | | (79.1 | ) | | | (79.1 | ) | | | (79.1 | ) |
| | | | | | | | | | | | | | | | | | | | | | | | | | | | | | | | |
Total other comprehensive income (loss) | | | | | | | — | | | | — | | | | — | | | | 3.0 | | | | (79.1 | ) | | | (76.1 | ) | | | (76.1 | ) |
| | | | | | | | | | | | | | | | | | | | | | | | | | | | | | | | |
Total comprehensive (loss) income | | | | | | | — | | | | (50.3 | ) | | | — | | | | 3.0 | | | | (79.1 | ) | | | (76.1 | ) | | | (126.4 | ) |
| | | | | | | | | | | | | | | | | | | | | | | | | | | | | | | | |
| | | | | | | | | | | | | | | | | | | | | | | | | | | | | | | | |
Repurchases of common shares | | | 23 | | | | (0.4 | ) | | | (41.6 | ) | | | | | | | | | | | | | | | | | | | (42.0 | ) |
| | | | | | | | | | | | | | | | | | | | | | | | | | | | | | | | |
Balance as at January 28, 2012 | | | | | | $ | 15.0 | | | $ | 1,218.5 | | | $ | — | | | $ | 0.2 | | | $ | (141.7 | ) | | $ | (141.5 | ) | | $ | 1,092.0 | |
| | | | | | | | | | | | | | | | | | | | | | | | | | | | | | | | |
The accompanying notes are an integral part of these consolidated financial statements.
F-5
| | | | | | | | | | | | | | | | | | | | | | | | | | | | | | | | |
(in CAD millions) (Recast - Note 2) | | Notes | | | Capital
stock | | | Retained
earnings | | | Mark-to-market
on short-term
investments
within cash
and cash
equivalents | | | Foreign exchange
derivatives
designated as cash
flow hedges | | | Remeasurement
gains (losses) | | | Accumulated
other
comprehensive
loss | | | Shareholders’
equity | |
Balance at January 31, 2010 | | | | | | $ | 15.7 | | | $ | 2,227.7 | | | $ | 0.2 | | | $ | 7.0 | | | $ | — | | | $ | 7.2 | | | $ | 2,250.6 | |
Adjustment to retained earnings | | | | | | | | | | | | | | | | | | | | | | | | | | | | | | | | |
Adjustment to opening retained earnings resulting from the early adoption of IAS 19, Revised, net of income tax recovery of $85.3 | | | | | | | | | | | (246.2 | ) | | | | | | | | | | | | | | | | | | | (246.2 | ) |
| | | | | | | | | | | | | | | | | | | | | | | | | | | | | | | | |
Adjusted balance at January 31, 2010 | | | | | | $ | 15.7 | | | $ | 1,981.5 | | | $ | 0.2 | | | $ | 7.0 | | | $ | — | | | $ | 7.2 | | | $ | 2,004.4 | |
Comprehensive (loss) income | | | | | | | | | | | | | | | | | | | | | | | | | | | | | | | | |
Net earnings | | | | | | | | | | | 125.0 | | | | | | | | | | | | | | | | — | | | | 125.0 | |
Other comprehensive loss | | | | | | | | | | | | | | | | | | | | | | | | | | | | | | | | |
Mark-to-market loss | | | | | | | | | | | | | | | (0.2 | ) | | | | | | | | | | | (0.2 | ) | | | (0.2 | ) |
Loss on foreign exchange derivatives, net of income tax recovery of $3.4 | | | | | | | | | | | | | | | | | | | (7.5 | ) | | | | | | | (7.5 | ) | | | (7.5 | ) |
Reclassification of gain on foreign exchange derivatives, net of income tax expense of $1.1 | | | | | | | | | | | | | | | | | | | (2.3 | ) | | | | | | | (2.3 | ) | | | (2.3 | ) |
Remeasurement losses on retirement benefit liability, net of income tax recovery of $21.7 | | | | | | | | | | | | | | | | | | | | | | | (62.6 | ) | | | (62.6 | ) | | | (62.6 | ) |
| | | | | | | | | | | | | | | | | | | | | | | | | | | | | | | | |
Total other comprehensive loss | | | | | | | — | | | | — | | | | (0.2 | ) | | | (9.8 | ) | | | (62.6 | ) | | | (72.6 | ) | | | (72.6 | ) |
| | | | | | | | | | | | | | | | | | | | | | | | | | | | | | | | |
Total comprehensive income (loss) | | | | | | | — | | | | 125.0 | | | | (0.2 | ) | | | (9.8 | ) | | | (62.6 | ) | | | (72.6 | ) | | | 52.4 | |
| | | | | | | | | | | | | | | | | | | | | | | | | | | | | | | | |
Repurchases of common shares | | | 23 | | | | (0.3 | ) | | | (42.7 | ) | | | | | | | | | | | | | | | — | | | | (43.0 | ) |
Dividends declared | | | | | | | | | | | (753.4 | ) | | | | | | | | | | | | | | | — | | | | (753.4 | ) |
| | | | | | | | | | | | | | | | | | | | | | | | | | | | | | | | |
Balance as at January 29, 2011 | | | | | | $ | 15.4 | | | $ | 1,310.4 | | | $ | — | | | $ | (2.8 | ) | | $ | (62.6 | ) | | $ | (65.4 | ) | | $ | 1,260.4 | |
| | | | | | | | | | | | | | | | | | | | | | | | | | | | | | | | |
The accompanying notes are an integral part of these consolidated financial statements.
F-6
SEARS CANADA INC.
CONSOLIDATED STATEMENTS OF CASH FLOWS
For the 52-week periods ended January 28, 2012 and January 29, 2011
| | | | | | | | | | | | |
(in CAD millions) | | Notes | | | 2011
(Recast - Note 2) | | | 2010
(Recast - Note 2) | |
Cash flow generated from operating activities | | | | | | | | | | | | |
Net (loss) earnings | | | | | | $ | (50.3 | ) | | $ | 125.0 | |
Adjustments for: | | | | | | | | | | | | |
Depreciation and amortization expense | | | 9,10.2 | | | | 114.9 | | | | 123.6 | |
Impairment losses | | | 9,10.1 | | | | 2.5 | | | | 3.3 | |
Gain (loss) on disposal of property, plant and equipment | | | | | | | 1.1 | | | | (13.7 | ) |
Finance costs | | | 17 | | | | 16.0 | | | | 16.6 | |
Interest income | | | 5 | | | | (1.7 | ) | | | (4.2 | ) |
Share of income from joint ventures | | | 11 | | | | (8.3 | ) | | | (3.2 | ) |
Retirement benefit plans expense | | | 20.4 | | | | 30.2 | | | | 26.6 | |
Short-term disability expense | | | 20.4 | | | | 8.4 | | | | 7.7 | |
Income tax (recovery) expense | | | 22 | | | | (6.6 | ) | | | 62.1 | |
Interest received | | | 5 | | | | 1.6 | | | | 3.0 | |
Interest paid | | | 17 | | | | (4.6 | ) | | | (14.5 | ) |
Retirement benefit plans contributions | | | 20.4 | | | | (17.9 | ) | | | (13.8 | ) |
Income tax refunds (payments), net | | | 22 | | | | (21.6 | ) | | | (79.8 | ) |
Changes in non-cash working capital | | | 30 | | | | 29.6 | | | | (156.6 | ) |
Changes in long-term assets and liabilities | | | | | | | (8.3 | ) | | | (10.8 | ) |
| | | | | | | | | | | | |
| | | | | | | 85.0 | | | | 71.3 | |
| | | | | | | | | | | | |
Cash flow (used for) generated from investing activities | | | | | | | | | | | | |
Purchases of property, plant and equipment and intangible assets | | | 9,10.2 | | | | (84.3 | ) | | | (60.0 | ) |
Changes in short-term investments | | | | | | | — | | | | 1,165.5 | |
Interest received from notes receivable from parent | | | 5 | | | | — | | | | 1.2 | �� |
Proceeds from sale of property, plant and equipment | | | | | | | 0.7 | | | | 14.6 | |
Dividends received from joint ventures | | | | | | | 20.1 | | | | 16.6 | |
| | | | | | | | | | | | |
| | | | | | | (63.5 | ) | | | 1,137.9 | |
| | | | | | | | | | | | |
Cash flow used for financing activities | | | | | | | | | | | | |
Interest paid on finance lease obligations | | | 17 | | | | (2.2 | ) | | | (2.2 | ) |
Repayment of long-term obligations | | | | | | | (117.1 | ) | | | (687.0 | ) |
Proceeds from long-term obligations | | | | | | | 105.0 | | | | 482.8 | |
Dividend payments | | | | | | | — | | | | (753.4 | ) |
Repurchases of common shares | | | 23 | | | | (42.0 | ) | | | (43.0 | ) |
| | | | | | | | | | | | |
| | | | | | | (56.3 | ) | | | (1,002.8 | ) |
| | | | | | | | | | | | |
(Decrease) Increase in cash and cash equivalents | | | | | | $ | (34.8 | ) | | $ | 206.4 | |
| | | | | | | | | | | | |
Effect of exchange rate on cash and cash equivalents at end of period | | | | | | | (0.1 | ) | | | (1.0 | ) |
| | | | | | | | | | | | |
Cash and cash equivalents at beginning of period | | | | | | $ | 432.3 | | | $ | 226.9 | |
Cash and cash equivalents at end of period | | | | | | $ | 397.4 | | | $ | 432.3 | |
| | | | | | | | | | | | |
The accompanying notes are an integral part of these consolidated financial statements.
F-7
NOTES TO THE CONSOLIDATED FINANCIAL STATEMENTS
Sears Canada Inc. is incorporated in Canada. The address of its registered office and principal place of business is 290 Yonge Street, Suite 700, Toronto, Ontario, Canada M5B 2C3. The principal activities of Sears Canada Inc. and its subsidiaries (the “Company”) include the sale of goods and services through the Company’s Retail channel, which includes its Full-line, Sears Home, Hometown Dealer, Outlet, Appliances and Mattresses, Corbeil Electrique Inc. (“Corbeil”) stores, and its Direct (catalogue/internet) channel. It also includes service revenue related to product repair, home improvement, Cantrex Group Inc. (“Cantrex”) and logistics. Commission revenues include travel, insurance, and performance payments received from JPMorgan Chase under the Company’s long-term credit card marketing and servicing alliance with JPMorgan Chase. The Company has partnered with Thomas Cook Canada Inc. (“Thomas Cook”) in a multi-year licensing arrangement, under which Thomas Cook manages the day-to-day operations of all Sears Travel offices. Licensee fee revenues are comprised of payments received from licensees that operate within the Company’s stores. The Company is a party to a number of joint ventures which have been classified as jointly controlled entities for financial reporting purposes. These joint ventures are jointly controlled by the venturers who are entitled to a share of the joint ventures’ income or loss.
The indirect parent of the Company is Sears Holdings Corporation (“Sears Holdings”), incorporated in the U.S. in the state of Delaware. The ultimate controlling party of the Company is ESL Investments, Inc. (incorporated in the U.S. in the state of Delaware) through Sears Holdings.
| 2. | Significant accounting policies |
2.1 Statement of compliance
The consolidated financial statements of the Company have been prepared in accordance with the standards and interpretations issued by the International Accounting Standards Board (“IASB”). These include International Financial Reporting Standards (“IFRS”), International Accounting Standards (“IAS”), the interpretations of the International Financial Reporting Interpretations Committee (“IFRIC”) and the Standing Interpretations Committee (“SIC”), which are effective and applicable to the Company as at the end of its current fiscal year.
2.2 Basis of preparation and presentation
The principal accounting policies of the Company have been applied consistently in the preparation of its consolidated financial statements for all periods presented, including the fiscal 2010 opening Consolidated Statement of Financial Position as at January 31, 2010, except for certain exemptions and exceptions as allowed under IFRS 1, First-time Adoption of International Financial Reporting Standards (“IFRS 1”). The Company’s significant accounting policies are detailed in Note 2.
The impact of transition to IFRS on the Company’s opening fiscal 2010 and opening fiscal 2011 statements of financial position, and the impact on the Company’s financial performance and cash flow for the 52-weeks ended January 29, 2011, are described and reconciled in Note 32. The optional exemptions and mandatory exceptions of IFRS 1 applied by the Company at transition are also described in Note 32.
The fiscal year of the Company consists of a 52 or 53-week period ending on the Saturday closest to January 31. The fiscal years for the 2011 and 2010 consolidated financial statements represent the 52-week periods ended January 28, 2012 (“Fiscal 2011” or “2011”) and January 29, 2011 (“Fiscal 2010” or “2010”), respectively. Figures relating to the opening Consolidated Statement of Financial Position in these Consolidated Financial Statements represent balances as at January 31, 2010 (“2009”).
The Company has made certain minor revisions to the presentation of the Consolidated Statements of Net (Loss) Earnings and Comprehensive (Loss) Income to provide a more informative presentation to users. The Company’s
F-8
consolidated financial statements are presented in Canadian dollars, which is the Company’s functional currency. The Company operates as one business segment, with operations focused on the merchandising of products and services.
2.3 Basis of measurement
The consolidated financial statements have been prepared on the historical cost basis, with the exception of certain financial instruments that are measured at fair value and the retirement benefit asset, which is the net total of plan assets, plus unamortized prior service cost and unamortized actuarial losses, less unamortized actuarial gains and the present value of the retirement benefit liability. On transition to IFRS, the Company elected to measure certain of its property, plant and equipment, including the property, plant and equipment of its real estate joint ventures, and its investment property, at fair value. The fair value was set as the deemed cost, in accordance with IFRS 1, as at that date, and represents the historical cost basis for measurement. Historical cost is generally based on the fair value of the consideration given in exchange for assets.
2.4 Basis of consolidation
The consolidated financial statements incorporate the financial statements of the Company as well as all of its subsidiaries. Real estate joint venture investments are accounted for using the equity method of accounting (described further in Note 2.13).
Subsidiaries include all entities where the Company has the power to govern the financial and operating policies of the entity so as to obtain benefits from its activities.
All intercompany balances and transactions, including any unrealized income and expenses arising from intercompany transactions, are eliminated in the preparation of the consolidated financial statements.
2.5 Cash and cash equivalents
Cash and cash equivalents include highly liquid investments with maturities of 90 days or less at the date of purchase. Cash and cash equivalents are considered to be restricted when they are subject to contingent rights of a third party customer, vendor or government agency.
2.6 Short-term investments
Short-term investments include investments with maturities between 91 to 364 days from the date of purchase.
2.7 Inventories
Inventories are measured at the lower of cost and net realizable value. Cost is determined using the weighted average cost method, based on individual items. The cost is comprised of the purchase price, plus the costs incurred in bringing the inventory to its present location and condition. Net realizable value is the estimated selling price in the ordinary course of business less the estimated costs to sell. Rebates and allowances received from vendors are recognized as a reduction to the cost of inventory, unless the rebates clearly relate to the reimbursement of specific expenses. A provision for shrinkage and obsolescence is calculated based on historical experience. All inventories consist of finished goods.
2.8 Property, plant and equipment
Property, plant and equipment are measured at cost or deemed cost less accumulated depreciation and accumulated impairment losses. Costs include expenditures that are directly attributable to the acquisition of the asset. The cost of self-constructed assets include site preparation costs, design and engineering fees, freight (only on initial freight costs incurred between the vendor and the Company), installation expenses and provincial sales tax (Saskatchewan, Manitoba and Prince Edward Island), and are net of any vendor subsidies or reimbursements.
F-9
An allocation of general and specific incremental interest charges for major construction projects is also included in the cost of related assets.
On transition to IFRS, certain selected property, plant and equipment were measured at their fair values to be used as the deemed cost in accordance with the IFRS 1 election option (see Note 32). The Company engaged independent qualified third parties to conduct appraisals of its land and buildings.
When the significant parts of an item of property, plant and equipment have varying useful lives, they are accounted for as separate components of property, plant and equipment. Depreciation is calculated based on the depreciable amount of the asset or significant component thereof, if applicable, which is the cost of the asset or significant component less its residual value. Depreciation is recognized using the straight-line method for each significant component of an item of property, plant and equipment and is recorded in “Selling, administrative and other expenses” in the Consolidated Statements of Net (Loss) Earnings and Comprehensive (Loss) Income. The estimated useful lives are 2 to 13 years for equipment and fixtures and 10 to 50 years for buildings and building improvements. The estimated useful lives, residual values and depreciation methods for property, plant and equipment are reviewed annually and adjusted, if appropriate, with the effect of any changes in estimates accounted for on a prospective basis.
Assets held under finance leases are depreciated over their expected useful lives on the same basis as owned assets or, where shorter, the term of the relevant lease, unless it is reasonably certain that the Company will obtain ownership by the end of the lease term.
The gain or loss arising on the disposal or retirement of an item of property, plant and equipment is determined as the difference between the proceeds from sale or the cost of retirement and the carrying amount of the asset, and is recognized in the Consolidated Statements of Net (Loss) Earnings and Comprehensive (Loss) Income. For a discussion on the impairment of tangible assets refer to Note 2.11.
Property, plant and equipment are reviewed at the end of each reporting period to determine whether there is an indicator of impairment.
2.9 Investment property
The Company’s investment property consists of vacant land which is not currently used in its operations. On transition to IFRS, the Company measured its investment property at their fair values to be used as the deemed cost in accordance with the IFRS 1 election option (see Note 32). Investment property is measured at its deemed cost less accumulated impairment losses.
The fair values of investment properties are estimated using observable data based on the current cost of acquiring comparable properties within the market area and the capitalization of the property’s anticipated revenue. The Company engages independent qualified third parties to conduct appraisals of its investment properties.
The gain or loss arising on the disposal or retirement of an item of investment property is determined as the difference between the proceeds from sale or the cost of retirement, and the carrying amount of the asset, and is recognized in the Consolidated Statements of Net (Loss) Earnings and Comprehensive (Loss) Income.
Investment properties are reviewed at the end of each reporting period to determine whether there is any indicator of impairment.
2.10 Intangible assets
2.10.1 Finite intangible assets other than goodwill
Finite intangible assets consist of purchased and internally developed software. Intangible assets are carried at cost less accumulated amortization and accumulated impairment losses and are amortized on a straight-line basis
F-10
over their estimated useful lives which range from 2 to 5 years. The useful lives of all intangible assets other than goodwill are finite. Amortization expense is included in “Selling, administrative and other expenses” in the Consolidated Statements of Net (Loss) Earnings and Comprehensive (Loss) Income. The estimated useful lives and amortization methods for intangible assets other than goodwill are reviewed annually, with the effect of any changes in estimates being accounted for on a prospective basis.
Internally developed software costs are capitalized when the following criteria are met:
| | • | | It is technically feasible to complete the software so that it will be available for use; |
| | • | | The Company intends to complete the software product; |
| | • | | The Company has an ability to use the software; |
| | • | | The Company can demonstrate how the software will generate probable future economic benefits; |
| | • | | Adequate technical, financial and other resources to complete the development and to use the software product are available; and |
| | • | | The expenditure attributable to the software product during its development can be reliably measured. |
Costs that qualify for capitalization are limited to those that are directly related to each software development project.
2.10.2 Goodwill
Goodwill arising in a business combination is recognized as an asset at the date that control is acquired (“the acquisition date”). Goodwill is measured as the excess of the sum of the consideration transferred, over the net fair value of identifiable assets acquired less liabilities assumed as of the acquisition date.
2.11 Impairment of tangible assets and intangible assets with finite useful lives
At the end of each reporting period, the Company reviews property, plant and equipment, investment property and intangible assets other than goodwill for indicators of impairment. If any such indication exists, the recoverable amount of the asset is estimated in order to determine the extent of the impairment loss, if any. Where it is not possible to estimate the recoverable amount of an individual asset, the assets are then grouped together into the smallest group of assets that generate independent cash flow from continuing use (the “cash generating unit” or “CGU”) and a recoverable amount is estimated for that CGU.
Where a reasonable and consistent basis of allocation can be identified, corporate assets are also allocated to individual CGUs. Otherwise, they are allocated to the smallest group of CGUs for which a reasonable and consistent allocation basis can be identified.
If the recoverable amount of an asset or a CGU is estimated to be less than its carrying amount, the asset or CGU will be reduced to its recoverable amount and an impairment loss is recognized immediately. If an impairment for a CGU has been identified, the impairment is first allocated to goodwill before other assets held by the CGU. Where goodwill is not part of a CGU, an impairment loss is recognized as a reduction in the carrying amount of the assets included in the CGU on a pro rata basis.
Where an impairment loss subsequently reverses (not applicable to goodwill), the carrying amount of the asset or CGU is revised to an estimate of its recoverable amount limited to the carrying amount that would have been determined had no impairment loss been recognized for the asset or CGU in prior years. A reversal of an impairment loss is recognized immediately.
2.12 Impairment of goodwill
Goodwill is not amortized but is reviewed for impairment at least annually. For the purposes of impairment testing, goodwill is allocated to each of the Company’s CGUs expected to benefit from the synergies of the combination.
F-11
CGUs to which goodwill has been allocated are tested for impairment annually, or more frequently when there is an indication that the unit may be impaired. If the recoverable amount of the CGU is less than its carrying amount, the impairment loss is allocated first to reduce the carrying amount of any goodwill allocated to the CGU, and then to the other assets of the unit on a pro-rata basis, based on the carrying amount of each asset in the unit. Impairment losses for goodwill are not reversed in subsequent periods.
2.13 Investment in joint ventures
Joint ventures are those entities over which the Company has joint control, established by contractual agreement. The Company is a party to a number of joint ventures which have been classified as jointly controlled entities for financial reporting purposes. These joint ventures are jointly controlled by the venturers who are entitled to a share of the joint ventures’ income or loss.
Investments in joint ventures are accounted for using the equity method as follows:
| | • | | Investments in joint ventures are initially measured at cost. |
| | • | | From the date that joint control commences, until the date that it ceases, the Company’s share of post-acquisition income or losses from joint ventures is recognized in the Consolidated Statements of Net (Loss) Earnings and Comprehensive (Loss) Income, with a corresponding increase or decrease to the carrying amount of the investments. |
| | • | | The joint venture reporting periods used in the application of the equity method differ from the Company’s reporting period end by 1 to 2 months. |
| | • | | The accounting policies of the joint ventures are aligned with those of the Company for the purposes of applying the equity method. |
| | • | | Gains on transactions between the Company and its joint ventures are eliminated to the extent of the Company’s interest in the joint ventures, and losses are eliminated unless the transaction provides evidence of an impairment of the assets transferred. |
The Company presents its joint venture investments in “Investment in joint ventures” on the Consolidated Statements of Financial Position. The Company presents its share of income or losses from joint ventures in “Share of income from joint ventures” in the Consolidated Statements of Net (Loss) Earnings and Comprehensive (Loss) Income.
2.14 Leasing arrangements
Leases are classified as finance leases when the terms of the lease transfer substantially all the risks and rewards of ownership to the lessee. All other leases are classified as operating leases.
2.14.1 The Company as lessor
The Company has entered into a number of agreements to sub-lease premises to third parties. All sub-leases to third parties are classified as operating leases. Rental income from operating leases is recognized on a straight-line basis over the term of the lease.
2.14.2 The Company as lessee
Assets held under finance leases are initially recognized by the Company at the lower of the fair value of the asset and the present value of the minimum lease payments. The corresponding current and non-current liabilities to the lessor are included in the Consolidated Statements of Financial Position as a finance lease obligation in “Principal payments on long-term obligations due within one year” and “Long-term obligations,” respectively. The assets are depreciated using the same accounting policy as applicable to property, plant and equipment (see Note 2.8).
F-12
Lease payments are apportioned between finance costs and the lease obligation in order to achieve a constant rate of interest on the remaining balance of the liability. The minimum lease payments are allocated between the land and building element in proportion to the relative fair values of the leasehold interests, in each of these elements of the lease.
Finance costs are recognized immediately. Assets under operating leases are not recognized by the Company. Operating lease payments are recognized in “Selling, administrative and other expenses” in the Consolidated Statements of Net (Loss) Earnings and Comprehensive (Loss) Income.
In the event that lease incentives are received to enter into leases, such incentives are recognized as a liability. The aggregate benefit of incentives is recognized as a reduction of rental expense on a straight-line basis over the lease term, except where another systematic basis is more representative of the time pattern in which economic benefits from the leased asset are consumed.
2.15 Retirement benefit plans
The Company currently maintains a defined contribution and a defined benefit registered pension plan, which covers eligible regular full-time and part-time associates, a non-registered supplemental savings arrangement and a defined benefit non-pension post retirement plan, which provides life insurance, medical and dental benefits to eligible retired associates through a health and welfare trust.
2.15.1 Defined contribution plan
A defined contribution plan is a post-employment benefit plan under which the Company pays fixed or matching contributions based on employee contributions into a separate legal entity and has no further legal or constructive obligation to pay additional amounts. Company contributions to the defined contribution retirement benefit plan are recognized as an expense when employees have rendered services entitling them to the contributions.
2.15.2 Defined benefit plans
For defined benefit retirement benefit plans, the cost of providing benefits is determined using the Projected Unit Credit Method, with actuarial valuations prepared by independent qualified actuaries at least every 3 years. Remeasurements comprising of actuarial gains and losses, the effect of the asset ceiling (if applicable) and the return on plan assets (excluding interest) are recognized immediately in the statement of financial position with a charge or credit to other comprehensive income in the period in which they occur. Remeasurements recorded in other comprehensive income are not recycled into profit or loss. However, the entity may transfer those amounts recognized in other comprehensive income within equity. Past service cost is recognized in profit or loss in the period of plan amendment. Net-interest is calculated by applying the discount rate to the net defined benefit liability or asset. Defined benefit costs are split into three categories:
| | • | | service cost, past-service cost, gains and losses on curtailments and settlements; |
| | • | | net interest expense or income; |
The Company presents the first two components of defined benefit costs in “Selling, administrative and other expenses” in the Consolidated Statements of Net (Loss) Earnings and Comprehensive (Loss) Income.
Remeasurements are recorded in other comprehensive income
The retirement benefit obligation recognized in the Consolidated Statements of Financial Position represents the actual deficit or surplus in the Company’s defined benefit plans. Any surplus resulting from this calculation is limited to the present value of any economic benefits available in the form of refunds from the plans or reductions in future contributions to the plans.
F-13
2.15.3 Termination benefits
A liability for a termination benefit is recognized at the earlier of when the entity can no longer withdraw the offer of the termination benefit and when the entity recognizes any related restructuring costs.
2.16 Revenue recognition
Revenue is measured at the fair value of the consideration received or receivable, excluding sales taxes. Revenue is reduced for estimated customer returns, discounts and other similar allowances.
2.16.1 Sale of goods
Revenue from the sale of goods is recognized upon delivery to the customer. Revenue relating to goods sold subject to installation, such as home improvement products, is recognized when the goods have been delivered and the installation is complete.
2.16.2 Rendering of services
Revenue from a contract to provide services is recognized by reference to the stage of completion of the contract.
Extended warranty service contracts
The Company sells extended warranty service contracts with terms of coverage generally between 12 and 60 months. Revenue from the sale of each contract is deferred and amortized on a straight-line basis over the term of the related contract.
Product repair, handling and installation services
Product repair, handling and installation services revenue is recognized once the services are complete. These services are performed within a short timeframe which is typically one day.
2.16.3 Commission and licensee fee revenue
Commission revenue
The Company earns commission revenues by selling various products and services that are provided by third parties, such as sales of travel services, home improvement products and insurance programs. As the Company is not the primary obligor in these transactions, these commissions are recognized upon sale of the related product or service.
Licensee fee revenue
Fee revenue is received from a variety of licensees that operate in the Company’s stores. Revenue earned is based on a percentage of licensee sales. Revenue is recorded upon sale of the related product or service.
Credit card revenue
Revenue is received from JP Morgan Chase relating to credit sales. Revenue is based on a percentage of sales charged on the Sears Card or Sears MasterCard and is included in revenue when the sale occurs.
2.16.4 Interest income
Interest income is recognized when it is probable that the economic benefits will flow to the Company and the amount of income can be reliably measured. Interest income is accrued on a periodic basis by reference to the principal outstanding and the applicable interest rate.
F-14
2.16.5 Customer loyalty program
The Sears Club Points Program (the “Program”) allows members to earn points from eligible purchases made on their Sears Card and/or Sears MasterCard. Members can then redeem points in accordance with the Program rewards schedule for merchandise. When points are earned, the Company defers revenue equal to the fair value of the awards adjusted for expected redemptions. When awards are redeemed, the redemption value of the awards is charged against deferred revenue and recognized as revenue. The redemption rates are reviewed on an ongoing basis and are adjusted based upon expected future activity.
2.16.6 Cost of goods and services sold
Cost of goods and services sold includes the purchase price of merchandise sold, freight and handling costs incurred in preparing the related inventory for sale, installation costs incurred relating to the sale of goods subject to installation, costs of services provided during the period relating to services sold, less rebates from suppliers relating to merchandise sold, write-downs taken on inventory during the period and physical inventory losses.
2.17 Foreign currency translation
Transactions in currencies other than the Company’s functional currency are recognized at the rates of exchange prevailing at the dates of the transactions. At the end of each reporting period, monetary assets and liabilities denominated in foreign currencies are retranslated to the functional currency at the exchange rates prevailing at that date.
Non-monetary assets and liabilities denominated in a foreign currency that are measured at historical cost are translated using the exchange rate at the date of the transaction and are not retranslated.
Exchange differences arising on retranslation are recognized in the Consolidated Statements of Net (Loss) Earnings and Comprehensive (Loss) Income in the period in which they arise, except for exchange differences on certain foreign currency hedging transactions (see Note 2.23.1 for hedge accounting policies).
2.18 Consideration from a vendor
The Company has arrangements with its vendors that provide for rebates subject to binding contractual agreements. Rebates on inventories subject to binding agreements are recognized as a reduction of the cost of sales or related inventories for the period, provided the rebates are probable and reasonably estimable. Rebates on advertising costs subject to binding agreements are recognized as a reduction of the advertising expense for the period, provided the rebates are probable and reasonably estimable.
2.19 Taxation
Income tax expense represents the sum of current tax expense and deferred tax expense.
2.19.1 Current tax
Tax currently payable or recoverable is based on taxable earnings or loss for the reporting period. Taxable income differs from earnings as reported in the Consolidated Statements of Net (Loss) Earnings and Comprehensive (Loss) Income, due to income or expenses that are taxable or deductible in other years and items that are not taxable or deductible for tax purposes. The Company’s liability for current tax is calculated using tax rates that have been enacted or substantively enacted as at the end of the reporting period and includes any adjustments to taxes payable and/or taxes recoverable in respect of prior years.
2.19.2 Deferred tax
Deferred tax is recognized on temporary differences between the carrying amounts of assets and liabilities and the corresponding tax bases used in the computation of taxable earnings or loss.
F-15
Deferred tax liabilities are generally recognized for taxable temporary differences. Deferred tax assets are generally recognized for deductible temporary differences to the extent that it is probable that taxable income will be available, against which deductible temporary differences can be utilized. Such deferred tax assets and liabilities are not recognized if the temporary differences arise from the initial recognition of goodwill or from the initial recognition (other than in a business combination) of other assets and liabilities in a transaction that affects neither the taxable net earnings or loss nor the accounting income or loss.
Deferred tax liabilities are recognized for taxable temporary differences associated with investments in subsidiaries and investments in joint ventures, except where the Company is able to control the reversal of the temporary difference and it is probable that the temporary difference will not reverse in the foreseeable future. Deferred tax assets arising from deductible temporary differences associated with such investments are only recognized to the extent that it is probable that there will be sufficient taxable earnings against which to utilize the benefits of the temporary differences and they are expected to reverse in the foreseeable future.
The carrying amount of deferred tax assets is reviewed at the end of each reporting period and reduced to the extent that it is no longer probable that sufficient taxable income will be available to allow all or part of the asset to be recovered.
Deferred tax assets and liabilities are measured at the tax rates that are expected to be applicable in the period in which the liability is settled or the asset realized, based on tax rates and tax laws that have been enacted or substantively enacted by the end of the reporting period. The measurement of deferred tax liabilities and assets reflects the tax consequences that would follow from the manner in which the Company expects, at the end of the reporting period, to recover or settle the carrying amount of its assets and liabilities.
Deferred tax assets and liabilities are offset when there is a legally enforceable right to offset current tax assets against current tax liabilities, when they relate to income taxes levied by the same taxation authority and when the Company intends to settle its current tax assets and liabilities on a net basis. Deferred tax assets and liabilities are not discounted.
2.19.3 Current and deferred tax for the period
Current and deferred tax are recognized as a tax expense or recovery in the Consolidated Statements of Net (Loss) Earnings and Comprehensive (Loss) Income, except when they relate to items that are recognized outside of earnings or loss (whether in other comprehensive income (loss), “OCI”, or directly in equity), in which case, the tax is also recognized outside of earnings or loss, or where they arise from the initial accounting for a business combination. In the case of a business combination, the tax effect is included in the accounting for the business combination. Interest on the Company’s tax position is recognized as a finance cost.
2.20 Provisions
Provisions are recognized when the Company has a present obligation, legal or constructive, as a result of a past event, it is probable that the Company will be required to settle the obligation and a reliable estimate can be made for the amount of the obligation.
The amount recognized as a provision is the best estimate of the consideration required to settle the present obligation at the end of the reporting period, taking into account the risks and uncertainties specific to the obligation. Where a provision is measured using the cash flow estimated to settle the present obligation, its carrying amount is the present value of those cash flow.
When some or all of the economic benefits required to settle a provision are expected to be recovered from a third party, a receivable is recognized as an asset if it is virtually certain that reimbursement will be received and the amount of the receivable can be measured reliably.
F-16
2.20.1 Onerous contract provisions
An onerous contract provision is recognized when the expected benefits to be derived by the Company from a contract are lower than the unavoidable cost of meeting its obligations. The provision is measured at the present value of the lower of the expected cost of terminating the contract or the expected cost of continuing with the contract. Before a provision is established, the Company recognizes any impairment loss on the assets associated with that contract.
2.20.2 General liability provisions
The Company purchases third party insurance for automobile, damage to a claimant’s property or bodily injury from use of a product, and general liability claims that exceed a certain dollar level. However, the Company is responsible for the payment of claims under these insured limits. In estimating the obligation associated with incurred losses, the Company utilizes actuarial methodologies which are based on historical data and validated by an independent third party. Loss estimates are adjusted based on actual claims settlements and reported claims.
2.20.3 Warranty provisions
An estimate for warranty provisions is made at the time the merchandise is sold based on historical warranty trends. Please also see Note 16.
2.20.4 Returns and allowances provisions
Provisions for returns and allowances are made based on historical rates which represent the expected future outflow of economic benefits on current sales.
2.20.5 Environmental provisions
The Company is exposed to environmental risks as an owner, lessor and lessee of property. Under federal and provincial laws, the owner, lessor or lessee could be liable for the costs of removal and remediation of certain hazardous substances on its properties or disposed of at other locations. The failure to remove or remediate such substances, if any, could lead to claims against the Company. The provision is based on assessments conducted by third parties, as well as historical data.
2.21 Financial assets
All financial assets are recognized and derecognized on the trade date where the purchase or sale of a financial asset is under a contract whose terms require delivery of the financial asset within the timeframe established by the market concerned. Financial assets are initially measured at fair value plus transaction costs, except for those financial assets for which the transaction costs are expensed as incurred.
Financial assets and liabilities are offset with the net amount presented in the Consolidated Statements of Financial Position when, and only when, the Company has a legal right to offset the amounts and intends either to settle on a net basis or to realize the asset and settle the liability simultaneously.
Financial assets are classified into the following categories: financial assets at ‘fair value through profit or loss’ (“FVTPL”), ‘held-to-maturity’ investments, ‘available-for-sale’ (“AFS”) financial assets and ‘loans and receivables’. The classification depends on the nature and purpose of the financial assets and is determined at the time of initial recognition. Currently the Company does not have any ‘held-to-maturity’ investments.
F-17
2.21.1 Effective interest method
The effective interest method calculates the amortized cost of a financial asset or financial liability and allocates interest income or expense over the relevant period. The effective interest rate is the rate that exactly discounts estimated future cash flow (including all fees on points paid or received that form an integral part of the effective interest rate, transaction costs and other premiums or discounts) through the expected life of the financial instrument, or (where appropriate) a shorter period, to the net carrying amount on initial recognition.
Interest income or expense is recognized on an effective interest basis for financial assets and financial liabilities other than those classified as at FVTPL.
2.21.2 Financial assets at FVTPL
Financial assets are classified as at FVTPL when the financial asset is either held-for-trading or it is designated as at FVTPL. Currently the Company does not have any FVTPL financial assets that have been designated as at FVTPL upon initial recognition.
A financial asset is classified as held-for-trading if:
| • | | It has been acquired principally for the purpose of selling it in the near term; or |
| • | | On initial recognition it is part of a portfolio of identified financial instruments that the Company manages together and has a recent actual pattern of short-term profit-taking; or |
| • | | It is a derivative that is not designated and effective as a hedging instrument. |
Financial assets at FVTPL are measured at fair value, with any gains or losses arising on remeasurement recognized in the Consolidated Statements of Net (Loss) Earnings and Comprehensive (Loss) Income, unless the financial asset is designated and effective as a hedging instrument. The net gain or loss recognized incorporates any interest earned on the financial asset and is included in “Selling, administrative and other expenses” in the Consolidated Statements of Net (Loss) Earnings and Comprehensive (Loss) Income, unless the financial asset is designated and effective as a hedging instrument. Fair value is determined in the manner described in Note 14.
2.21.3 AFS financial assets
The Company’s short-term investments and cash equivalents have been classified as AFS financial assets and are measured at fair value. Gains and losses arising from changes in fair value are recognized in OCI, with the exception of impairment losses, interest calculated using the effective interest method and foreign exchange gains and losses on monetary assets, which are recognized in “Selling, administrative and other expenses” or “Interest Income” in the Consolidated Statements of Net (Loss) Earnings and Comprehensive (Loss) Income. Where the investment is disposed of or is determined to be impaired, the cumulative gain or loss previously included in accumulated other comprehensive income (loss)” (“AOCI”) is reclassified to “Selling, administrative and other expenses” in the Consolidated Statements of Net (Loss) Earnings and Comprehensive (Loss) Income.
2.21.4 Loans and receivables
Cash held by the bank and restricted cash and cash equivalents are classified as ‘loans and receivables’ and are measured at amortized cost.
Trade receivables and other receivables that have fixed or determinable payments that are not quoted in an active market are also classified as ‘loans and receivables.’ Loans and receivables are measured at amortized cost using the effective interest method, less any impairment. Interest income is recognized by applying the effective interest rate, except for short-term receivables, where the recognition of interest would be immaterial.
F-18
2.21.5 Impairment of financial assets
Financial assets, other than those at FVTPL, are assessed for indicators of impairment at the end of each reporting period. Financial assets are considered to be impaired when there is objective evidence that the estimated future cash flow of the financial asset have been negatively affected as a result of events that have occurred after its initial recognition.
For all financial assets, objective evidence of impairment could include:
| • | | Significant financial difficulty of the issuer or counterparty; or |
| • | | Default or delinquency in interest or principal payments; or |
| • | | Probability that the borrower will enter bankruptcy or financial reorganization. |
For financial assets carried at amortized cost, the amount of any impairment loss recognized is the difference between the asset’s carrying amount and the present value of estimated future cash flow discounted at the financial asset’s initial effective interest rate. When a subsequent event causes the amount of any impairment loss to decrease, the decrease in impairment loss is reversed through the Consolidated Statements of Net (Loss) Earnings and Comprehensive (Loss) Income.
The carrying amount of the financial asset is reduced by any impairment loss directly for all financial assets with the exception of trade receivables, where the carrying amount is reduced through the use of an allowance account. When a trade receivable is considered uncollectible its carrying amount is written off including any amounts previously recorded in the allowance account. Subsequent recoveries of amounts previously written off are credited to “Selling, administrative and other expenses” in the Consolidated Statements of Net (Loss) Earnings and Comprehensive (Loss) Income. Changes in the carrying amount of the allowance account are also recognized in “Selling, administrative and other expenses.”
2.21.6 Derecognition of financial assets
The Company derecognizes a financial asset only when the contractual rights to the cash flow from the asset expire, or when substantially all the risks and rewards of ownership of the asset are transferred to another entity. If the Company retains substantially all the risks and rewards of ownership of a transferred financial asset, the Company continues to recognize the financial asset and also recognizes a collateralized borrowing for the proceeds received.
2.22 Financial liabilities and equity instruments
2.22.1 Classification as debt or equity
Debt and equity instruments are classified as either financial liabilities or as equity in accordance with the substance of the contractual arrangement.
2.22.2 Equity instruments
An equity instrument is any contract that evidences a residual interest in the assets of an entity after deducting all of its liabilities. Equity instruments issued by the Company are recognized at the proceeds received, net of direct issuance costs.
2.22.3 Financial liabilities
Financial liabilities are recognized on the trade date at which the Company becomes a party to the contractual provisions of the instrument. Financial liabilities are classified as either financial liabilities at ‘FVTPL’ or ‘other financial liabilities’.
F-19
2.22.4 Financial liabilities at FVTPL
Financial liabilities are classified as at FVTPL when they are either held-for-trading or designated as at FVTPL. Currently the Company does not have any financial liabilities that have been designated as at FVTPL upon initial recognition.
A financial liability is classified as held-for-trading if:
| • | | It has been incurred principally for the purpose of repurchase in the near term; or |
| • | | It is a derivative that has not been designated and is not effective as a hedging instrument. |
Financial liabilities at FVTPL are measured at fair value, with gains or losses arising on remeasurement recognized in “Selling, administrative and other expenses” in the Consolidated Statements of Net (Loss) Earnings and Comprehensive (Loss) Income, unless the financial liability is designated and effective as a hedging instrument (see Note 2.23). Fair value is determined in the manner described in Note 14.
2.22.5 Other financial liabilities
Other financial liabilities, including borrowings, are initially measured at fair value, net of transaction costs. Other financial liabilities are subsequently measured at amortized cost with interest expense recognized on an effective interest method.
The Company amortizes debt issuance transaction costs over the life of the debt using the effective interest method.
2.22.6 Derecognition of financial liabilities
The Company derecognizes financial liabilities when, and only when, the Company’s obligations are discharged, cancelled or expired.
2.23 Derivative financial instruments
The Company enters into a variety of derivative financial instruments to manage its exposure to interest rate and foreign exchange rate risk, including foreign exchange option contracts and interest rate swaps. Further details on derivative financial instruments are disclosed in Note 14.
Derivatives are initially recognized at fair value at the date the derivative contract is entered into and are subsequently remeasured to their fair value at the end of each reporting period. The resulting gain or loss is recognized immediately in “Selling, administrative and other expenses�� unless the derivative is designated and effective as a hedging instrument, in which case, the timing of the recognition depends on the nature of the hedge relationship. The Company designates certain derivatives as hedges of highly probable forecasted transactions or hedges of foreign currency risk of firm commitments (cash flow hedges).
A derivative with a positive fair value is recognized as a financial asset, whereas a derivative with a negative fair value is recognized as a financial liability. A derivative is presented as a non-current asset or a non-current liability if the remaining maturity of the instrument is more than 12 months and it is not expected to be realized or settled within 12 months. Other derivatives are presented as current assets or current liabilities.
2.23.1 Hedge accounting
The Company designates certain hedging instruments, which include derivatives, as cash flow hedges. Hedges of foreign exchange risk on firm commitments are accounted for as cash flow hedges.
F-20
At the inception of the hedging relationship, the Company documents the relationship between the hedging instrument and the hedged item, along with its risk management objectives and its strategy for undertaking various hedging transactions. At the inception of the hedge and on an ongoing basis, the Company documents whether the hedging instrument is highly effective in offsetting changes in fair values or cash flows of the hedged item.
Note 14 sets out details of the fair values of the derivative instruments used for hedging purposes.
2.23.2 Cash flow hedges
The effective portion of changes in the fair value of derivatives that are designated and qualify as cash flow hedges is recognized in OCI. The gain or loss relating to the ineffective portion is recognized immediately in “Selling, administrative and other expenses” in the Consolidated Statements of Net (Loss) Earnings and Comprehensive (Loss) Income. Amounts previously recognized in OCI and accumulated in AOCI within equity are reclassified in the periods when the hedged items are recognized (i.e. to “Cost of goods and services sold” in the Consolidated Statements of Net (Loss) Earnings and Comprehensive (Loss) Income).
Hedge accounting is discontinued when the Company revokes the hedging relationship, when the hedging instrument expires or is sold, terminated, or exercised, or when it no longer qualifies for hedge accounting. Any gains or losses accumulated in AOCI within equity at the time of discontinuation remain in equity and are transferred to “Cost of goods and services sold” in the Consolidated Statements of Net (Loss) Earnings and Comprehensive (Loss) Income when the forecasted transaction is ultimately recognized. When a forecasted transaction is no longer expected to occur, the gains or losses accumulated in equity are recognized immediately.
2.24 Borrowing costs
Borrowing costs directly attributable to the acquisition, construction or production of qualifying assets are added to the cost of the assets until they are substantially ready for their intended use or sale. Investment income earned on any temporary investment of these borrowings prior to expenditure is deducted from the borrowing costs eligible for capitalization.
All other borrowing costs are expensed in the period in which they are incurred.
2.25 Net (loss) earnings per share
Net (loss) earnings per share is calculated using the weighted average number of shares outstanding during the reporting period. Diluted net (loss) earnings per share is determined using the ‘treasury stock method,’ which considers the potential for the issuance of new shares created by unexercised in-the-money options.
2.26 Changes in Accounting Policy
IAS 19 (Revised), Employee Benefits (“IAS 19”)
The Company has elected to early adopt IAS 19 (Revised). On June 16, 2011, the IASB issued amendments to IAS 19 which included the elimination of the “corridor approach,” which is the option to defer and amortize the recognition of actuarial gains and losses. The significant amendments to IAS 19 are as follows:
| | • | | The “corridor approach” is to be replaced with full and immediate recognition of actuarial gain and loss remeasurements in “Other comprehensive (loss) income” (“OCI”); |
| | • | | Retirement benefit costs are to consist of service costs, net interest and remeasurements, with remeasurements being recorded in OCI; |
| | • | | Past service costs are to be recognized immediately in the Consolidated Statements of Net Earnings (Loss); |
F-21
| | • | | Expected returns on plan assets will no longer be recognized in profit or loss. Instead, interest income on plan assets, calculated using the discount rate used to measure the pension obligation, will be recognized in the Consolidated Statements of Net Earnings (Loss), |
| | • | | Plan administration costs are to be expensed as incurred; and |
| | • | | Disclosures relating to retirement benefit plans will be enhanced and will include discussions on risk associated with each plan, an explanation of items recognized in the consolidated financial statements and descriptions of the amount, timing and uncertainty on the Company’s future cash flows. |
The amendments to IAS 19 are effective for annual periods beginning on or after January 1, 2013 with early adoption permitted. The amendments are required to be applied retrospectively in accordance with IAS 8, Accounting Estimates and Errors. As the Company adopted the amendments to IAS 19 in Q1 2012, the Company was required to retrospectively recast the adoption to its annual Consolidated Financial Statements within the Form 20-F with the effect of recasting extended to the transition date of January 31, 2010. Refer to Note 32. The Company has recast the assets and liabilities as at January 28, 2012, January 29, 2011 and January 31, 2010 and income, expenses and cash flow for the 52-week periods ended January 28, 2012 and January 29, 2011.
Recast of financial statement captions
A summary of the impact arising from the application of the change in accounting policy is as follows:
| | | | | | | | | | | | |
| Consolidated Statements of Financial Position | |
(Increase (decrease) in CAD millions) | | As at
January 28, 2012 | | | As at
January 29, 2011 | | | As at
January 31, 2010 | |
Retirement benefit asset | | $ | (187.7 | ) | | $ | (197.4 | ) | | $ | (207.4 | ) |
Retirement benefit liability | | | 308.2 | | | | 205.3 | | | | 124.1 | |
Net change to retirement benefit asset and liability | | | (495.9 | ) | | | (402.7 | ) | | | (331.5 | ) |
| | | |
Deferred tax assets | | | 84.0 | | | | 32.7 | | | | — | |
Deferred tax liabilities | | | (43.6 | ) | | | (71.0 | ) | | | (85.3 | ) |
Net change to deferred tax assets and liabilities | | | 127.6 | | | | 103.7 | | | | 85.3 | |
| | | |
Accumulated other comprehensive loss | | | (141.7 | ) | | | (62.6 | ) | | | — | |
Retained earnings | | | (226.6 | ) | | | (236.4 | ) | | | (246.2 | ) |
| | | | | | | | |
| Consolidated Statements of Net Earnings (Loss) and Comprehensive Income (Loss) | |
(Increase (decrease) in CAD millions, except per share amounts) | | 52-Week
Period Ended
January 28, 2012 | | | 52-Week
Period Ended
January 29, 2011 | |
Selling, administrative and other expenses | | $ | (13.2 | ) | | $ | (13.2 | ) |
Earnings before income taxes | | | 13.2 | | | | 13.2 | |
Deferred income tax expense | | | 3.4 | | | | 3.4 | |
| | |
Net earnings | | $ | 9.8 | | | | 9.8 | |
| | |
Basic net earnings per share | | $ | 0.09 | | | $ | 0.09 | |
Diluted net earnings per share | | $ | 0.09 | | | $ | 0.09 | |
| | |
Other comprehensive loss | | | (79.1 | ) | | | (62.6 | ) |
Comprehensive loss | | | (69.3 | ) | | | (52.8 | ) |
| | | | | | | | |
| Consolidated Statemens of Cash Flows | | | | | | |
(Increase (decrease) in CAD millions) | | 52-Week
Period Ended
January 28, 2012 | | | 52-Week
Period Ended
January 29, 2011 | |
Net earnings | | $ | 9.8 | | | $ | 9.8 | |
Retirement benefit plans expense | | | (13.2 | ) | | | (13.2 | ) |
Income tax expense | | | 3.4 | | | | 3.4 | |
Please refer to Note 20 for fully recast prior year comparative figures.
F-22
| 3. | Issued standards not yet adopted |
The Company monitors the standard setting process for new standards and interpretations issued by the IASB that the Company may be required to adopt in the future. Since the impact of a proposed standard may change during the review period, the Company does not comment publicly until the standard has been finalized and the effects have been determined.
On December 16, 2011, the IASB issued amendments to three previously released standards. They are as follows:
IAS 32, Financial Instruments: Presentation (“IAS 32”)
The IASB amended IAS 32 to address inconsistencies in current practice in the application of offsetting criteria. The amendments provide clarification with respect to the meaning of ‘currently has a legally enforceable right of set-off’ and that some gross settlement systems may be considered equivalent to net settlement. These amendments are effective for annual periods beginning on or after January 1, 2014. The Company is currently assessing the impact of these amendments on the Company’s consolidated financial statements and related note disclosures.
IFRS 7, Financial Instruments: Disclosures (“IFRS 7”)
The IASB first amended IFRS 7 on October 7, 2010, to require additional disclosures regarding transfers of financial assets. These amendments are effective for annual periods beginning on or after July 1, 2011. The Company will apply these amendments beginning the first quarter of its 2012 fiscal year and is currently assessing the impact on the Company’s disclosures.
On December 16, 2011, the IASB approved amendments to IFRS 7, which establishes disclosure requirements to help users better assess the effect or potential effect of offsetting arrangements on a company’s financial position. These amendments are effective for annual periods beginning on or after January 1, 2013. The Company will apply these amendments beginning the first quarter of its 2013 fiscal year and is currently assessing the impact on the Company’s disclosures.
IFRS 9, Financial Instruments (“IFRS 9”)
The IASB issued IFRS 9 on November 12, 2009, which will ultimately replace IAS 39, Financial Instruments: Recognition and Measurement (“IAS 39”). The replacement of IAS 39 is a three-phase project with the objective of improving and simplifying the reporting for financial instruments.
The first phase of the project provides guidance on the classification and measurement of financial assets. IFRS 9 was subsequently reissued on October 28, 2010, incorporating new requirements on accounting for financial liabilities. On December 16, 2011, the IASB amended the mandatory effective date of IFRS 9 to fiscal years beginning on or after January 1, 2015. The amendment also provides relief from the requirement to recast comparative financial statements for the effect of applying IFRS 9. The Company is monitoring the impact of amendments to this standard and initial application of this IFRS is expected to impact the classification of a number of financial assets which will require disclosure in the financial statement notes.
On June 16, 2011, the IASB issued amendments to the following standard:
IAS 1, Presentation of Financial Statements (“IAS 1”)
The IASB has amended IAS 1 to require additional disclosures for items presented in OCI on a before-tax basis and requires items to be grouped and presented in OCI based on whether they are potentially reclassifiable to earnings or loss subsequently (i.e. items that may be reclassified and those that will not be reclassified to earnings or loss). These amendments are effective for annual periods beginning on or after July 1, 2012 and require full retrospective application. The Company will apply these amendments beginning the first quarter of its 2013 fiscal year and is currently assessing the impact to its consolidated financial statements.
F-23
On May 12, 2011, the IASB issued four new standards, all of which are applicable to Annual Reporting periods beginning on or after January 1, 2013. The Company is currently assessing the impact of these standards on its consolidated financial statements and related note disclosures. The following is a list and description of these standards:
IFRS 10, Consolidated Financial Statements (“IFRS 10”)
IFRS 10 establishes the standards for the presentation and preparation of consolidated financial statements when an entity controls one or more entities;
IFRS 11, Joint Arrangements (“IFRS 11”)
IFRS 11 replaces IAS 31, Interests in Joint Ventures (“IAS 31”) and requires that a party in a joint arrangement assess its rights and obligations to determine the type of joint arrangement and account for those rights and obligations accordingly;
IFRS 12, Disclosure of Involvement with Other Entities (“IFRS 12”)
IFRS 12, along with IFRS 11 described above, replaces IAS 31. IFRS 12 requires the disclosure of information that enables users of financial statements to evaluate the nature of and the risks associated with, the entity’s interests in joint ventures and the impact of those interests on its financial position, financial performance and cash flows; and
IFRS 13, Fair Value Measurement (“IFRS 13”)
IFRS 13 provides guidance to improve consistency and comparability in fair value measurements and related disclosures through a ‘fair value hierarchy’. This standard applies when another IFRS requires or permits fair value measurements or disclosures. IFRS 13 does not apply for share-based payment transactions, leasing transactions and measurements that are similar to, but are not fair value.
| 4. | Critical accounting judgments and key sources of estimation uncertainty |
In the application of the Company’s accounting policies, management is required to make judgments, estimates and assumptions with regards to the carrying amounts of assets and liabilities that are not readily apparent from other sources. The estimates and underlying assumptions are based on historical experience and other factors that are considered to be relevant. Actual results may differ from these estimates. The estimates and underlying assumptions are reviewed on an ongoing basis. Revisions to accounting estimates are recognized in the period in which the estimate is revised if the revision affects only that period, or in the period of the revision and future periods, if the revision affects both current and future periods.
The following are the critical judgments that management has made in the process of applying the Company’s accounting policies, key assumptions concerning the future and other key sources of estimation uncertainty that have the potential to materially impact the carrying amounts of assets and liabilities within the next fiscal year.
4.1 Legal liabilities
Assessing the financial outcome of uncertain legal positions requires judgment to be made regarding the relative merits of each claim and the extent to which a claim is likely to be successful. The assessments are based on reviews conducted by internal and external counsel, when appropriate.
Changes in estimates or assumptions could cause changes to “Provisions” on the Consolidated Statements of Financial Position and a charge or credit to “Selling, administrative and other expenses” in the Consolidated Statements of Net (Loss) Earnings and Comprehensive (Loss) Income. For additional information, see Note 16.
F-24
4.2 Inventory
4.2.1 Obsolescence, valuation and inventory stock losses
Inventory is written-down to reflect future losses on the disposition of obsolete merchandise. Future losses are estimated based on historical trends that vary depending on the type of inventory.
An adjustment is made each period to value inventory at the lower of cost and net realizable value. This adjustment is estimated based on historical trends that vary depending on the type of inventory.
Inventory is adjusted to reflect estimated inventory stock losses incurred in the year based on recent historical inventory count data.
4.2.2 Vendor rebates
Inventory is adjusted to reflect vendor rebates received or receivable based on vendor agreements. This adjustment is estimated based on historical data and current vendor agreements.
4.2.3 Freight
Inbound freight incurred to bring inventory to its present location is estimated each reporting period and is included in the cost of inventory. This estimate is based on historical freight costs incurred.
Changes in estimates may result in changes to “Inventories” on the Consolidated Statements of Financial Position and a charge or credit to “Cost of goods and services sold” in the Consolidated Statements of Net (Loss) Earnings and Comprehensive (Loss) Income. For additional information, see Note 7.
4.3 Impairment of property, plant and equipment and intangible assets
The Company’s property, plant and equipment and intangible assets have been allocated to CGUs. Determining whether the CGU is impaired requires an estimation of the recoverable amount of the CGU, which is the higher of the fair value less costs to sell and its value in use. To determine the recoverable amount of the CGU, management is required to estimate its fair value by evaluating the expected future cash flow using an appropriate growth rate, the estimated costs to sell and a suitable discount rate to calculate the value in use.
Changes in estimates may result in changes to “Property, plant and equipment” and “Intangible assets” on the Consolidated Statements of Financial Position and a charge or credit to “Selling, administrative and other expenses” in the Consolidated Statements of Net (Loss) Earnings and Comprehensive (Loss) Income. For additional information, see Note 9 and Note 10.2.
4.4 Impairment of goodwill
Determining whether goodwill is impaired requires the Company to determine the recoverable amount of the CGU to which the goodwill is allocated. To determine the recoverable amount of the CGU, management is required to estimate its fair value by evaluating expected future cash flow using an appropriate growth rate, the estimated costs to sell and a suitable discount rate to calculate the value in use.
Changes in estimates may result in changes to “Goodwill” on the Consolidated Statements of Financial Position and a charge to “Selling, administrative and other expenses” in the Consolidated Statements of Net (Loss) Earnings and Comprehensive (Loss) Income. For additional information, see Note 10.1.
F-25
4.5 Retirement benefit liability
The retirement benefit liability is estimated based on certain actuarial assumptions, including the discount rate, inflation rate, salary growth and mortality rates. New regulations and market driven changes may impact the assumptions made.
Changes in estimates may result in changes to the “Retirement benefit liability” on the Consolidated Statements of Financial Position and a charge or credit to “Selling, administrative and other expenses” in the Consolidated Statements of Net (Loss) Earnings and Comprehensive (Loss) Income. For additional information, see Note 20.
4.6 Loyalty program deferred revenue
The fair value of Sears Club points granted is deferred at the time of the related initial sale transaction and is recognized upon redemption of the points for merchandise. The redemption value of the points is estimated based on historical behaviour and trends in redemption rates and redemption values.
Changes in estimates may result in changes to “Deferred revenue” (current and non-current) on the Consolidated Statements of Financial Position and an increase or decrease to “Revenue” and/or “Cost of goods and services sold” in the Consolidated Statements of Net (Loss) Earnings and Comprehensive (Loss) Income. For additional information, see Note 13”.
4.7 Derivative assets and liabilities
All derivatives are measured at fair value. U.S. dollar option contracts are traded over-the-counter and give holders the right to buy, or sell, a specified amount of U.S. currency at an agreed upon price and date in the future. Fair values of the U.S. dollar option contracts are derived using a Black-Scholes valuation model. The Company is required to estimate various inputs which are used in this model that are a combination of quoted prices and observable market inputs. The fair values of derivatives include an adjustment for credit risk when appropriate.
Changes in estimates may result in changes to “Derivative financial assets” and “Derivative financial liabilities” on the Consolidated Statements of Financial Position and a charge or credit to “Cost of goods and services sold”, “Selling, administrative and other expenses” or “Other comprehensive income (loss)” in the Consolidated Statements of Net (Loss) Earnings and Comprehensive (Loss) Income. For additional information, see Note 14.
4.8 Provisions
Provisions are estimated based on historical data, cost estimates provided by specialists and future projections.
Changes in estimates or assumptions could cause changes to “Provisions” on the Consolidated Statements of Financial Position and a charge or credit to “Cost of goods and services sold” or “Selling, administrative and other expenses” in the Consolidated Statements of Net (Loss) Earnings and Comprehensive (Loss) Income. For additional information, see Note 16.
4.9 Leasing arrangements
The Company has applied judgment in the classification of its leasing arrangements, which is determined at the inception of the lease and is based on the substance of the transaction, rather than its legal form. The Company’s leases were evaluated based on certain significant assumptions including the discount rate, economic life of a building, lease term and existence of a bargain renewal option.
Changes in estimates or assumptions could cause changes to “Property, plant and equipment”, “Principal payments on long-term obligations due within one year” and “Long-term obligations” on the Consolidated
F-26
Statements of Financial Position and a charge or credit to “Selling, administrative and other expenses” and “Finance costs” in the Consolidated Statements of Net (Loss) Earnings and Comprehensive (Loss) Income. For additional information, see Note 19.
4.10 Taxes
In the ordinary course of business, the Company is subject to ongoing audits by tax authorities. While the Company believes that its tax filing positions are appropriate and supportable, certain matters are periodically challenged by tax authorities. The Company applies judgment and routinely evaluates and provides for potentially unfavourable outcomes with respect to any tax audits. If the result of a tax audit materially differs from the existing provisions, the Company’s effective tax rate and its net (loss) earnings will be affected positively or negatively.
Changes in estimates or assumptions could cause changes to “Income taxes recoverable”, “Deferred tax assets”, “Income and other taxes payable” and “Deferred tax liabilities” on the Consolidated Statements of Financial Position and a charge or credit to “Income tax (recovery) expense” in the Consolidated Statements of Net (Loss) Earnings and Comprehensive (Loss) Income. For additional information, see Note 22.
| 5. | Cash and cash equivalents and interest income |
Cash and cash equivalents
The components of cash and cash equivalents were as follows:
| | | | | | | | | | | | |
(in CAD millions) | | As at
January 28, 2012 | | | As at
January 29, 2011 | | | As at
January 31, 2010 | |
Cash | | $ | 49.0 | | | $ | 46.3 | | | $ | 51.3 | |
Cash equivalents | | | | | | | | | | | | |
Government treasury bills | | | 199.9 | | | | 323.8 | | | | 100.0 | |
Bank term deposits | | | 121.0 | | | | 26.9 | | | | 59.8 | |
Investment accounts | | | 20.3 | | | | 20.0 | | | | — | |
Restricted cash and cash equivalents | | | 7.2 | | | | 15.3 | | | | 15.8 | |
| | | | | | | | | | | | |
Total cash and cash equivalents | | $ | 397.4 | | | $ | 432.3 | | | $ | 226.9 | |
| | | | | | | | | | | | |
The components of restricted cash and cash equivalents are further discussed in Note 21.
Interest income
Interest income related primarily to cash and cash equivalents and short-term investments for the fiscal year ended January 28, 2012 totaled $1.7 million (2010: $4.2 million). During Fiscal 2011, the Company received $1.6 million (2010: $4.2 million) in cash related to interest income.
| 6. | Accounts receivable, net |
The components of accounts receivable, net were as follows:
| | | | | | | | | | | | |
(in CAD millions) | | As at
January 28, 2012 | | | As at
January 29, 2011 | | | As at
January 31, 2010 | |
Deferred receivables | | $ | 1.3 | | | $ | 2.3 | | | $ | 2.8 | |
Other receivables | | | 114.9 | | | | 141.7 | | | | 130.1 | |
| | | | | | | | | | | | |
Total accounts receivable, net | | $ | 116.2 | | | $ | 144.0 | | | $ | 132.9 | |
| | | | | | | | | | | | |
F-27
Included in the accounts receivable balances above are amounts that are past due but are not provided for, as the Company considers the balances to be collectible. These past due accounts receivable balances are listed below:
| | | | | | | | | | | | |
(in CAD millions) | | As at
January 28, 2012 | | | As at
January 29, 2011 | | | As at
January 31, 2010 | |
Greater than 30 days | | $ | 3.2 | | | $ | 2.7 | | | $ | 2.3 | |
Greater than 60 days | | | 3.5 | | | | 2.3 | | | | 2.4 | |
Greater than 90 days | | | 6.4 | | | | 6.8 | | | | 5.1 | |
| | | | | | | | | | | | |
Total | | $ | 13.1 | | | $ | 11.8 | | | $ | 9.8 | |
| | | | | | | | | | | | |
The amount of inventory recognized as an expense during Fiscal 2011 was $2,703.5 million (2010: $2,754.3 million), which includes $115.4 million (2010: $74.1 million) of inventory write-downs. These expenses are included in “Cost of goods and services sold” in the Consolidated Statements of Net (Loss) Earnings and Comprehensive (Loss) Income.
Inventory is pledged as collateral under the Company’s revolving credit facility.
The components of prepaid expenses were as follows:
| | | | | | | | | | | | |
(in CAD millions) | | As at
January 28, 2012 | | | As at
January 29, 2011 | | | As at
January 31, 2010 | |
Rent | | $ | 14.2 | | | $ | 13.8 | | | $ | 14.0 | |
Contracts | | | 5.2 | | | | 7.3 | | | | 11.7 | |
Advertising raw materials | | | 1.5 | | | | 3.7 | | | | 1.5 | |
Supplies | | | 3.6 | | | | 3.7 | | | | 3.5 | |
Insurance | | | 0.3 | | | | 0.3 | | | | 1.6 | |
Miscellaneous | | | 3.1 | | | | 3.0 | | | | 2.5 | |
| | | | | | | | | | | | |
Total prepaid expenses | | $ | 27.9 | | | $ | 31.8 | | | $ | 34.8 | |
| | | | | | | | | | | | |
F-28
| 9. | Property, plant and equipment and investment property |
The following is a continuity of property, plant and equipment:
| | | | | | | | | | | | | | | | | | | | | | | | |
(in CAD millions) | | Land | | | Buildings | | | Finance
Lease
Buildings | | | Finance
Lease
Equipment | | | Equipment
and
Fixtures | | | Total | |
Cost or deemed cost | | | | | | | | | | | | | | | | | | | | | | | | |
| | | | | | |
Balance at January 31, 2010 | | $ | 231.1 | | | $ | 1,106.4 | | | $ | 47.3 | | | $ | — | | | $ | 1,125.9 | | | $ | 2,510.7 | |
Additions | | | — | | | | 20.4 | | | | 5.8 | | | | — | | | | 33.2 | | | | 59.4 | |
Disposals | | | (0.1 | ) | | | (1.0 | ) | | | (15.6 | ) | | | — | | | | (7.6 | ) | | | (24.3 | ) |
| | | | | | | | | | | | | | | | | | | | | | | | |
Balance at January 29, 2011 | | $ | 231.0 | | | $ | 1,125.8 | | | $ | 37.5 | | | $ | — | | | $ | 1,151.5 | | | $ | 2,545.8 | |
| | | | | | | | | | | | | | | | | | | | | | | | |
Additions | | | — | | | | 31.1 | | | | — | | | | 3.5 | | | | 45.1 | | | | 79.7 | |
Disposals | | | — | | | | (4.8 | ) | | | — | | | | — | | | | (17.8 | ) | | | (22.6 | ) |
| | | | | | | | | | | | | | | | | | | | | | | | |
Balance at January 28, 2012 | | $ | 231.0 | | | $ | 1,152.1 | | | $ | 37.5 | | | $ | 3.5 | | | $ | 1,178.8 | | | $ | 2,602.9 | |
| | | | | | | | | | | | | | | | | | | | | | | | |
Accumulated depreciation and impairment | | | | | | | | | | | | | | | | | | | | | | | | |
| | | | | | |
Balance at January 31, 2010 | | $ | — | | | $ | 597.4 | | | $ | 15.8 | | | $ | — | | | $ | 936.5 | | | $ | 1,549.7 | |
Depreciation expense 1 | | | — | | | | 57.7 | | | | 6.3 | | | | — | | | | 51.4 | | | | 115.4 | |
Disposals | | | — | | | | (0.6 | ) | | | (15.6 | ) | | | — | | | | (7.1 | ) | | | (23.3 | ) |
Impairment losses (reversals) 1 | | | — | | | | 1.9 | | | | — | | | | | | | | 1.4 | | | | 3.3 | |
| | | | | | | | | | | | | | | | | | | | | | | | |
Balance at January 29, 2011 | | $ | — | | | $ | 656.4 | | | $ | 6.5 | | | $ | — | | | $ | 982.2 | | | $ | 1,645.1 | |
| | | | | | | | | | | | | | | | | | | | | | | | |
Depreciation expense 1 | | | — | | | | 51.0 | | | | 5.5 | | | | 1.0 | | | | 49.3 | | | | 106.8 | |
Disposals | | | — | | | | (3.8 | ) | | | — | | | | — | | | | (17.2 | ) | | | (21.0 | ) |
| | | | | | | | | | | | | | | | | | | | | | | | |
Balance at January 28, 2012 | | $ | — | | | $ | 703.6 | | | $ | 12.0 | | | $ | 1.0 | | | $ | 1,014.3 | | | $ | 1,730.9 | |
| | | | | | | | | | | | | | | | | | | | | | | | |
Total property, plant and equipment | | | | | | | | | | | | | | | | | | | | | | | | |
| | | | | | |
Balance at January 28, 2012 | | $ | 231.0 | | | $ | 448.5 | | | $ | 25.5 | | | $ | 2.5 | | | $ | 164.5 | | | $ | 872.0 | |
Balance at January 29, 2011 | | $ | 231.0 | | | $ | 469.4 | | | $ | 31.0 | | | $ | — | | | $ | 169.3 | | | $ | 900.7 | |
Balance at January 31, 2010 | | $ | 231.1 | | | $ | 509.0 | | | $ | 31.5 | | | $ | — | | | $ | 189.4 | | | $ | 961.0 | |
| 1 | Depreciation expense and impairment losses are included in “Selling, administrative and other expenses” in the Consolidated Statements of Net (Loss) Earnings and Comprehensive (Loss) Income. |
The Company engaged independent qualified third party appraisers to conduct appraisals of its land and building properties at transition to IFRS (see Note 32). The valuation methods used to determine fair value include the direct capitalization and discounted cash flow methods for buildings and the direct sales comparison for land.
Impairment loss
During Fiscal 2011, the Company reviewed its CGUs for impairment and did not identify an impairment loss. During Fiscal 2010, the Company recognized an impairment loss of $3.3 million on leased store assets relating to the Deerfoot Full-line store and the Calgary and Kitchener West Appliances and Mattresses stores. The recoverable amount of these assets was determined based on their estimated value in use and a pre-tax discount rate of 8.5%. The impairment loss was attributable to low revenue levels at these stores.
The Company did not record any reversals of previously recorded impairment losses during Fiscal 2011 (2010: Nil).
Investment property
Investment property owned by the Company represents vacant land with no operating activity. During Fiscal 2011, there were no investment property additions, disposals or impairment losses. As at January 28, 2012, the carrying value and fair value of investment property were $21.7 million and $23.2 million, respectively (January 29, 2011: $21.7 million and $21.7 million, January 31, 2010: $21.7 million and $21.7 million).
F-29
| 10. | Goodwill and intangible assets |
10.1 Allocation of goodwill to cash generating units
Goodwill has been allocated for impairment testing purposes to the following CGUs:
| | • | | Cantrex Group Inc. and Corbeil Electrique Inc. |
| | • | | Home Improvement Product Services |
The following is a continuity of goodwill, as allocated by CGU:
| | | | | | | | |
(in CAD millions) | | 2011 | | | 2010 | |
Cantrex Group Inc. and Corbeil Electrique Inc. | | | | | | | | |
Balance, beginning of fiscal year | | $ | 2.6 | | | $ | 2.6 | |
Impairment losses | | | — | | | | — | |
| | | | | | �� | | |
Balance, end of fiscal year | | $ | 2.6 | | | $ | 2.6 | |
| | | | | | | | |
Home Improvement Product Services | | | | | | | | |
Balance, beginning of fiscal year | | $ | 8.6 | | | $ | 8.6 | |
Impairment losses | | | (2.5 | ) | | | — | |
| | | | | | | | |
Balance, end of fiscal year | | $ | 6.1 | | | $ | 8.6 | |
| | | | | | | | |
Total goodwill | | $ | 8.7 | | | $ | 11.2 | |
| | | | | | | | |
In the assessment of impairment, management used historical data and past experience as the key assumptions used in the determination of the recoverable amount. The Company completed a test for goodwill impairment at the date of transition and on an annual basis in Fiscal 2011 and Fiscal 2010.
| | • | | Cantrex Group Inc. and Corbeil Electrique Inc. |
The recoverable amount of this CGU is determined based on its estimated fair value less costs to sell. The fair value was determined based on the present value of the estimated cash flow over a 10 year period and a terminal value equivalent to the present value of 5 times after-tax cash flow representing the value of the business beyond the 10 year cash flow projection. Cost to sell was estimated to be 2% of the fair value, which reflects management’s best estimate of the potential costs associated with divesting of the businesses considered. A discount rate of 8.4% was applied to the cash flow projections based on management’s best estimate of the CGU’s weighted average cost of capital considering the risks facing the CGU. Annual growth rates of 5% for the first 5 years and 2% for the subsequent 5 years were used for Corbeil Electrique Inc. and 0% for all 10 years was used for Cantrex Group Inc. given the businesses’ historical growth experience and anticipated growth. The recoverable amount was determined to be greater than the carrying value including the goodwill allocated to the Cantrex Group Inc. and Corbeil Electrique Inc. CGU, therefore, no impairment was identified in Fiscal 2011 (2010: Nil).
| | • | | Home Improvement Product Services |
The recoverable amount of this CGU is determined based on its estimated fair value less costs to sell. The fair value was determined based on the present value of the estimated cash flow over a 10 year period and a terminal value equivalent to the present value of 5 times after-tax cash flow, representing the value of the business beyond the 10 year cash flow projection. Cost to sell was estimated to be 2% of the fair value of the business. This reflects management’s best estimate of the potential costs associated with divesting of the business. A discount rate of 12.2% per annum was used, based on management’s best estimate of the CGU’s weighted average cost of capital considering the risks facing the CGU. The cash flow projection for the first 3 years was based on annual revenue growth rates of 10% for the first year and 5% for the second and third years. The cash flow projection subsequent to the third year assumed an annual revenue growth rate of 2%. The recoverable amount was determined to be less than the carrying value including the goodwill allocated
F-30
to the Home Improvement Product Services CGU in Fiscal 2011 resulting in an impairment loss to goodwill of $2.5 million (2010: Nil). This impairment loss is attributable to experienced revenue declines in the Home Improvement Products Services business.
10.2 Intangible assets
The following is a continuity of intangible assets:
| | | | | | | | | | | | |
(in CAD millions) | | Application
Software | | | Information
System Software | | | Total | |
Cost or deemed cost | | | | | | | | | | | | |
| | | |
Balance at January 31, 2010 | | $ | 14.2 | | | $ | 121.3 | | | $ | 135.5 | |
Additions | | | 5.8 | | | | 3.3 | | | | 9.1 | |
Disposals | | | — | | | | — | | | | — | |
| | | | | | | | | | | | |
Balance at January 29, 2011 | | $ | 20.0 | | | $ | 124.6 | | | $ | 144.6 | |
| | | | | | | | | | | | |
Additions | | | 6.8 | | | | 1.5 | | | | 8.3 | |
Disposals | | | — | | | | (0.1 | ) | | | (0.1 | ) |
| | | | | | | | | | | | |
Balance at January 28, 2012 | | $ | 26.8 | | | $ | 126.0 | | | $ | 152.8 | |
| | | | | | | | | | | | |
Accumulated amortization | | | | | | | | | | | | |
Balance at January 31, 2010 | | $ | 7.3 | | | $ | 105.6 | | | $ | 112.9 | |
Amortization expense 1 | | | 2.9 | | | | 5.3 | | | | 8.2 | |
Disposals | | | — | | | | — | | | | — | |
| | | | | | | | | | | | |
Balance at January 29, 2011 | | $ | 10.2 | | | $ | 110.9 | | | $ | 121.1 | |
| | | | | | | | | | | | |
Amortization expense 1 | | | 3.7 | | | | 4.4 | | | | 8.1 | |
Disposals | | | — | | | | — | | | | — | |
| | | | | | | | | | | | |
Balance at January 28, 2012 | | $ | 13.9 | | | $ | 115.3 | | | $ | 129.2 | |
| | | | | | | | | | | | |
Total intangible assets | | | | | | | | | | | | |
| | | |
Balance at January 28, 2012 | | $ | 12.9 | | | $ | 10.7 | | | $ | 23.6 | |
Balance at January 29, 2011 | | $ | 9.8 | | | $ | 13.7 | | | $ | 23.5 | |
Balance at January 31, 2010 | | $ | 6.9 | | | $ | 15.7 | | | $ | 22.6 | |
| 1 | Amortization expense and impairment losses are included in “Selling, administrative and other expenses” in the Consolidated Statements of Net (Loss) Earnings and Comprehensive (Loss) Income. No impairment losses were recognized on intangible assets for both Fiscal 2011 and Fiscal 2010. |
| 11. | Investment in joint ventures |
The Company’s investment in joint ventures includes its share of income or losses from its joint venture interests in 12 shopping centres across Canada, most of which contain a Sears store. Joint venture investments range from 15% to 50% and are co-owned with major shopping centre owners.
F-31
The Company’s joint ventures are in partnership with Westcliff Group, Ivanhoe Cambridge Properties and T&T Properties. The jointly controlled entities and Sears ownership interest in each as at January 28, 2012 are listed below:
| | | | | | |
Entity Name | | Properties | | Joint Venture Partner | | Ownership
Interest |
Carrefour Richelieu Realties (St-Jérôme) | | Carrefour Richelieu | | Westcliff Group | | 50% |
Carrefour Richelieu Realties (St-Jean) | | Carrefour de Nord | | Westcliff Group | | 50% |
Carrefour Richelieu Realties (Carrefour Angrignon) | | Carrefour Angrignon | | Westcliff Group | | 50% |
Carrefour Richelieu Realties (Place Angrignon) | | Place Angrignon | | Westcliff Group | | 50% |
Carrefour Richelieu Realties (Pierre Caisse) | | Place Pierre Caisse | | Westcliff Group | | 50% |
Carrefour Richelieu Realties (Drummondville) | | Promenades de Drummondville | | Westcliff Group | | 50% |
Méga-Centre Drummondville | | Mega Centre Drummondville | | Westcliff Group | | 50% |
Societe de Gestion des Nieges Ville Marie | | Various land holdings in Quebec, Canada | | Westcliff Group | | 50% |
133562 Canada Inc. | | Various land holdings in Quebec, Canada | | Westcliff Group | | 50% |
172098 Canada Inc. | | Drummondville Stripmall | | Westcliff Group | | 50% |
Kildonan Place | | Kildonan Place | | Ivanhoe Cambridge | | 20% |
Regionaux (Les Rivières Shopping Centre) | | Les Rivieres Shopping Centre | | Ivanhoe Cambridge | | 15% |
Regionaux (Les Galeries de Hull) | | Les Galeries de Hull | | Ivanhoe Cambridge | | 15% |
Medicine Hat Mall | | Medicine Hat Mall | | T&T Properties | | 40% |
During Q3 2011, the Company sold its share of assets in Chatham Centre for net proceeds of $1.6 million, recognizing a gain of $0.1 million on the sale. During Fiscal 2010, the Company sold its share of land in the Lachenaie joint venture for net proceeds of $4.0 million and realized a gain of $2.8 million.
The following represents the Company’s share of investments in the assets and liabilities, revenues and expenses of the joint ventures:
| | | | | | | | | | | | |
(in CAD millions) | | As at
January 28, 2012 | | | As at
January 29, 2011 | | | As at
January 31, 2010 | |
Current assets | | $ | 6.4 | | | $ | 10.4 | | | $ | 6.5 | |
Non-current assets | | | 333.5 | | | | 349.0 | | | | 366.8 | |
| | | | | | | | | | | | |
Total assets | | $ | 339.9 | | | $ | 359.4 | | | $ | 373.3 | |
| | | | | | | | | | | | |
Current liabilities | | $ | 7.9 | | | $ | 11.1 | | | $ | 15.7 | |
Non-current liabilities | | | 30.6 | | | | 35.0 | | | | 36.6 | |
| | | | | | | | | | | | |
Total liabilities | | $ | 38.5 | | | $ | 46.1 | | | $ | 52.3 | |
| | | | | | | | | | | | |
Investment in joint ventures | | $ | 301.4 | | | $ | 313.3 | | | $ | 321.0 | |
| | | | | | | | | | | | |
| | | | | | | | |
(in CAD millions) | | 2011 | | | 2010 | |
Revenue | | $ | 48.0 | | | $ | 47.7 | |
Expenses | | | | | | | | |
Administrative and other expenses | | | 23.4 | | | | 21.8 | |
Gain on sale of joint venture assets | | | (0.1 | ) | | | (2.8 | ) |
Finance costs | | | 2.0 | | | | 3.3 | |
Tax expense | | | 0.1 | | | | 0.2 | |
Depreciation expense | | | 14.3 | | | | 22.0 | |
| | | | | | | | |
Share of income from joint ventures | | $ | 8.3 | | | $ | 3.2 | |
| | | | | | | | |
F-32
| 12. | Other long-term assets |
The components of other long-term assets were as follows:
| | | | | | | | | | | | |
(in CAD millions) | | As at
January 28, 2012 | | | As at
January 29, 2011 | | | As at
January 31, 2010 | |
Income taxes recoverable | | $ | 30.3 | | | $ | 20.9 | | | $ | 20.9 | |
Prepaid rent | | | 11.0 | | | | 13.2 | | | | 15.6 | |
Receivables | | | 6.6 | | | | 2.7 | | | | 3.8 | |
Investments | | | 1.3 | | | | 1.3 | | | | 1.3 | |
Deferred charges | | | — | | | | — | | | | 0.6 | |
| | | | | | | | | | | | |
Other long-term assets | | $ | 49.2 | | | $ | 38.1 | | | $ | 42.2 | |
| | | | | | | | | | | | |
The components of deferred revenue were as follows:
| | | | | | | | | | | | |
(in CAD millions) | | As at
January 28, 2012 | | | As at
January 29, 2011 | | | As at
January 31, 2010 | |
Arising from extended warranty service contracts (i) | | $ | 144.6 | | | $ | 135.7 | | | $ | 123.6 | |
Arising from unshipped sales (ii) | | | 65.7 | | | | 70.1 | | | | 74.9 | |
Arising from customer loyalty program (iii) | | | 41.3 | | | | 53.6 | | | | 59.5 | |
Arising from gift card issuances (iv) | | | 29.1 | | | | 34.9 | | | | 37.5 | |
Arising from vendor partnership agreements (v) | | | 9.7 | | | | — | | �� | | — | |
Other (vi) | | | 6.8 | | | | 7.1 | | | | 7.9 | |
| | | | | | | | | | | | |
Total deferred revenue | | $ | 297.2 | | | $ | 301.4 | | | $ | 303.4 | |
| | | | | | | | | | | | |
Current | | $ | 208.0 | | | $ | 224.0 | | | $ | 235.9 | |
Non-current | | | 89.2 | | | | 77.4 | | | | 67.5 | |
| | | | | | | | | | | | |
Total deferred revenue | | $ | 297.2 | | | $ | 301.4 | | | $ | 303.4 | |
| | | | | | | | | | | | |
The following explanations describe the Company’s deferred revenue:
| (i) | Deferred revenue arising from the sale of extended warranty service contracts, which provide coverage for product repair services over the term of the contracts. |
| (ii) | Deferred revenue arising from the sale of merchandise which has not yet been delivered to or picked up by the customer. The revenue is recognized once the merchandise is delivered to the customer. |
| (iii) | Deferred revenue arising from the Company’s Sears Club points program as described in Note 2.16.5. |
| (iv) | Deferred revenue arising from the purchase of gift cards by customers that have not yet been redeemed for merchandise. At redemption of the gift card, the revenue is recognized. |
| (v) | Deferred revenue arising from multi-element partnership agreements with vendors. The revenue is recognized in accordance with the terms of the agreements. |
| (vi) | Other includes deferred revenue for goods that have not yet been fully delivered or services not yet rendered. The revenue is recognized when the goods have been delivered or by reference to the stage of completion of the service. |
In the ordinary course of business, the Company enters into financial agreements with banks and other financial institutions to reduce underlying risks associated with interest rates and foreign currency. The Company does not hold or issue derivative financial instruments for trading or speculative purposes.
F-33
Financial instrument risk management
The Company is exposed to credit, liquidity and market risk as a result of holding financial instruments. Market risk consists of foreign exchange and interest rate risk.
14.1 Credit risk
Credit risk refers to the possibility that the Company can suffer financial losses due to the failure of the Company’s counterparties to meet their payment obligations. Exposure to credit risk exists for derivative instruments, cash and cash equivalents, short-term investments, accounts receivable and other long-term assets.
Cash and cash equivalents, short-term investments, accounts receivable, derivative financial assets and other long-term assets of $514.9 million as at January 28, 2012 (January 29, 2011: $577.6 million, January 31, 2010: $1,536.5 million) expose the Company to credit risk should the borrower default on maturity of the investment. The Company manages this exposure through policies that require borrowers to have a minimum credit rating of A, and limiting investments with individual borrowers at maximum levels based on credit rating.
The Company is exposed to minimal credit risk from customers as a result of ongoing credit evaluations and review of accounts receivable collectability. As at January 28, 2012, approximately 26.5% (January 29, 2011: 38.7%, January 31, 2010: 44.0%) of the Company’s accounts receivable was due from one customer who was current on their account (January 29, 2011 and January 31, 2010: two customers who were current on their accounts).
14.2 Liquidity risk
Liquidity risk is the risk that the Company may not have cash available to satisfy financial liabilities as they come due. The Company actively maintains access to adequate funding sources to ensure it has sufficient available funds to meet current and foreseeable financial requirements at a reasonable cost.
The following table summarizes the carrying amount and the contractual maturities of both the interest and principal portion of significant financial liabilities as at January 28, 2012:
| | | | | | | | | | | | | | | | | | | | | | | | |
(in CAD millions) | | Carrying
Amount | | | Contractual Cash Flow Maturities | |
| | | Total | | | Within
1 year | | | 1 year to
3 years | | | 3 years to
5 years | | | Beyond
5 years | |
Accounts payable and accrued liabilities | | $ | 576.8 | | | $ | 576.8 | | | $ | 576.8 | | | $ | — | | | $ | — | | | $ | — | |
Long-term obligations including payments due within one year 1 | | | 122.7 | | | | 153.2 | | | | 10.7 | | | | 18.3 | | | | 110.0 | | | | 14.2 | |
Operating lease obligations 2 | | | n/a | | | | 510.1 | | | | 102.7 | | | | 153.0 | | | | 98.0 | | | | 156.4 | |
Royalties 2 | | | n/a | | | | 3.1 | | | | 1.6 | | | | 1.5 | | | | — | | | | — | |
Retirement benefit plans obligations 2,3 | | | n/a | | | | 75.7 | | | | 29.3 | | | | 46.4 | | | | — | | | | — | |
| | | | | | | | | | | | | | | | | | | | | | | | |
| | $ | 699.5 | | | $ | 1,318.9 | | | $ | 721.1 | | | $ | 219.2 | | | $ | 208.0 | | | $ | 170.6 | |
| | | | | | | | | | | | | | | | | | | | | | | | |
| 1 | Cash flow maturities related to long-term obligations, including payments due within one year, include annual interest on finance lease obligations at an average rate of 6.7% and on secured credit facility borrowings at a rate of 3.7%. |
| 2 | Operating lease obligations, royalties and retirement benefit plans funding obligations are not reported on the Consolidated Statements of Financial Position. |
| 3 | Payments beyond 2013 are subject to a funding valuation to be completed as at December 31, 2013. Until then, the Company is obligated to fund in accordance with the most recent valuation completed as at December 31, 2010. |
F-34
Management believes that cash on hand, future cash flow generated from operations and availability of current and future funding will be adequate to support these financial liabilities.
Market risk
Market risk exists as a result of the potential for losses caused by changes in market factors such as foreign currency exchange rates, interest rates and commodity prices.
14.3 Foreign exchange risk
The Company enters into foreign exchange contracts to reduce the foreign exchange risk with respect to U.S. dollar denominated assets and liabilities and purchases of goods or services.
| | • | | As at January 28, 2012, there were no option contracts outstanding (notional value of option contract outstanding as at January 29, 2011: U.S. $372.0 million, as at January 31, 2010: U.S. $298.8 million) and therefore, no derivative financial assets nor derivative financial liabilities were recognized in the Consolidated Statements of Financial Position (January 29, 2011: $3.0 million included in “Derivative financial liabilities”, January 31, 2010: $9.9 million included in “Derivative financial assets”). The intrinsic value portion of derivatives is designated as a cash flow hedge for hedge accounting treatment under IAS 39. Option contracts are intended to reduce the foreign exchange risk with respect to anticipated purchases of U.S. dollar denominated goods and services, including goods purchased for resale (“hedged item”). |
| | • | | As at January 28, 2012, there were also no swap contracts outstanding (notional value of option contract outstanding as at January 29, 2011: U.S. $6.8 million, as at January 31, 2010: U.S. $4.8 million) and therefore, no derivative financial assets nor derivative financial liabilities were recognized in the Consolidated Statements of Financial Position (January 29, 2011: less than $0.1 million, January 31, 2010: less than $0.1 million, both included in “Derivative financial liabilities”). Swap contracts are intended to reduce the foreign exchange risk on U.S. dollar denominated short-term investments pledged as collateral for letter of credit obligations issued under the Company’s offshore merchandise purchasing program. |
While the notional principal of outstanding derivative financial instruments are not recorded on the Consolidated Statements of Financial Position, the fair value of any outstanding contracts is included in “Derivative financial assets” or “Derivative financial liabilities”, depending on the fair value, and classified as current or long-term, depending on the maturities of the outstanding contracts. Changes in the fair value of the designated portion of contracts are included in OCI for cash flow hedges, to the extent the designated portion of the hedges continue to be effective, with the ineffective portion included in “Selling, Administrative and other expenses” in the Consolidated Statements of Net (Loss) Earnings and Comprehensive (Loss) Income. Amounts previously included in OCI are reclassified to “Cost of goods and services sold” in the same period in which the hedged item impacts net (loss) earnings.
During Fiscal 2011, the Company recorded a gain of $0.9 million (2010: loss of $0.7 million), relating to the translation or settlement of U.S. dollar denominated monetary items consisting of cash and cash equivalents, accounts receivable and accounts payable, excluding the reclassification from OCI of the loss on foreign exchange derivatives designated as cash flow hedges.
The period end exchange rate was 0.9993 U.S. dollar to Canadian dollar. A 10% appreciation or depreciation of the U.S. and or the Canadian dollar exchange rate was determined to have an after-tax impact on net (loss) earnings of $7.9 million for U.S. dollar denominated balances included in cash and cash equivalents, accounts receivable and accounts payable.
F-35
14.4 Interest rate risk
From time to time, the Company enters into interest rate swap contracts with approved financial institutions to manage exposure to interest rate risks. As at January 28, 2012, the Company had no interest rate swap contracts in place.
Interest rate risk reflects the sensitivity of the Company’s financial condition to movements in interest rates. Financial assets and liabilities which do not bear interest or bear interest at fixed rates are classified as non-interest rate sensitive.
Cash and cash equivalents and borrowings under the secured revolving credit facility are subject to interest rate risk. The total subject to interest rate risk as at January 28, 2012 was a net asset of $297.7 million (January 29, 2011: net asset of $322.9 million, January 31, 2010: net asset of $1,389.6 million). An increase or decrease in interest rates of 0.25% would cause an immaterial after-tax impact on net (loss) earnings.
14.5 Classification and fair value of financial instruments
The estimated fair values of financial instruments presented are based on relevant market prices and information available at those dates. The following table summarizes the classification and fair value of certain financial instruments as at the specified dates. The Company determines the classification of a financial instrument when it is initially recorded, based on the underlying purpose of the instrument. As a significant number of the Company’s assets and liabilities, including inventories and capital assets, do not meet the definition of financial instruments, values in the tables below do not reflect the fair value of the Company as a whole.
The fair value of financial instruments are classified and measured according to the following three levels, based on the fair value hierarchy.
| | • | | Level 1: Quoted prices in active markets for identical assets or liabilities |
| | • | | Level 2: Inputs other than quoted prices in active markets that are observable for the asset or liability |
either directly (i.e. as prices) or indirectly (i.e. derived from prices)
| | • | | Level 3: Inputs for the asset or liability that are not based on observable market data |
| | | | | | | | | | | | | | | | | | |
| (in CAD millions) | | | | | | | | | | | | | | |
Classification | | Balance Sheet Category | | Fair Value
Hierarchy1 | | | As at
January 28, 2012 | | | As at
January 29, 2011 | | | As at
January 31, 2010 | |
Loans and receivables | | | | | | | | | | | | | | | | | | |
Cash and cash equivalents and restricted cash and cash equivalents | | Cash and cash equivalents 2 | | | Level 1 | | | $ | 177.2 | | | $ | 88.5 | | | $ | 126.9 | |
| | | | | |
Available for sale | | | | | | | | | | | | | | | | | | |
Cash equivalents | | Cash and cash equivalents 2 | | | Level 2 | | | | 220.2 | | | | 343.8 | | | | 100.0 | |
Short-term investments | | Short-term investments 2 | | | Level 2 | | | | — | | | | — | | | | 1,165.5 | |
| | | | | |
Fair value through profit or loss | | | | | | | | | | | | | | | | | | |
U.S. $ derivative contracts | | Derivative financial assets | | | Level 2 | | | | — | | | | — | | | | 9.9 | |
U.S. $ derivative contracts | | Derivative financial liabilities | | | Level 2 | | | | — | | | | 3.0 | | | | — | |
Long-term investments | | Other long-term assets | | | Level 3 | | | | 1.3 | | | | 1.3 | | | | 1.3 | |
| 1 | Classification of fair values relates to 2011. |
| 2 | Interest income related to cash and cash equivalents and short-term investments is disclosed in Note 5. |
All other assets that are financial instruments not listed in the chart above have been classified as “Loans and receivables”. All other financial instrument liabilities have been classified as “Other liabilities” and are measured
F-36
at amortized cost in the Consolidated Statements of Financial Position. The carrying value of these financial instruments approximate fair value given that they are short-term in nature.
| 15. | Accounts payable and accrued liabilities |
The components of “Accounts payable and accrued liabilities” as included in the Consolidated Statements of Financial Position were as follows:
| | | | | | | | | | | | |
(in CAD millions) | | As at
January 28, 2012 | | | As at
January 29, 2011 | | | As at
January 31, 2010 | |
Total accounts payable | | $ | 401.9 | | | $ | 439.3 | | | $ | 492.3 | |
Payroll and employee benefits | | | 28.7 | | | | 28.7 | | | | 33.5 | |
Merchandise accruals | | | 45.3 | | | | 89.2 | | | | 54.6 | |
Short-term leasehold inducements | | | 8.4 | | | | 8.4 | | | | 8.3 | |
Advertising accruals | | | 12.7 | | | | 14.1 | | | | 14.9 | |
Other accrued liabilities | | | 78.5 | | | | 83.9 | | | | 92.5 | |
Miscellaneous accruals | | | 1.3 | | | | 2.0 | | | | 2.2 | |
| | | | | | | | | | | | |
Total accrued liabilities | | $ | 174.9 | | | $ | 226.3 | | | $ | 206.0 | |
| | | | | | | | | | | | |
Total accounts payable and accrued liabilities | | $ | 576.8 | | | $ | 665.6 | | | $ | 698.3 | |
| | | | | | | | | | | | |
The following is a continuity which shows the change in provisions over Fiscal 2011 and Fiscal 2010:
| | | | | | | | | | | | | | | | | | | | |
(in CAD millions) | | As at
January 29, 2011 | | | Additional
Provisions | | | Release of
Provisions | | | Reversed
Provisions | | | As at
January 28, 2012 | |
Insurance (i) | | $ | 23.8 | | | $ | 1.4 | | | $ | (5.8 | ) | | $ | — | | | $ | 19.4 | |
Returns and allowances (ii) | | | 14.3 | | | | 12.2 | | | | (14.3 | ) | | | — | | | | 12.2 | |
Warranties (iii) | | | 13.1 | | | | — | | | | (2.1 | ) | | | — | | | | 11.0 | |
Sales tax (iv) | | | 5.4 | | | | — | | | | (3.8 | ) | | | — | | | | 1.6 | |
Severance (v) | | | 2.7 | | | | 12.9 | | | | (2.1 | ) | | | — | | | | 13.5 | |
Environmental (vi) | | | 5.0 | | | | 2.9 | | | | (2.0 | ) | | | (1.3 | ) | | | 4.6 | |
Other provisions (vii) | | | 1.6 | | | | 2.7 | | | | (1.3 | ) | | | — | | | | 3.0 | |
| | | | | | | | | | | | | | | | | | | | |
Total provisions | | $ | 65.9 | | | $ | 32.1 | | | $ | (31.4 | ) | | $ | (1.3 | ) | | $ | 65.3 | |
| | | | | | | | | | | | | | | | | | | | |
Current | | $ | 65.3 | | | $ | 32.1 | | | $ | (31.3 | ) | | $ | (1.3 | ) | | $ | 64.8 | |
Non-current (iii) | | | 0.6 | | | | — | | | | (0.1 | ) | | | — | | | | 0.5 | |
| | | | | | | | | | | | | | | | | | | | |
Total provisions | | $ | 65.9 | | | $ | 32.1 | | | $ | (31.4 | ) | | $ | (1.3 | ) | | $ | 65.3 | |
| | | | | | | | | | | | | | | | | | | | |
| | | | | | | | | | | | | | | | | | | | |
(in CAD millions) | | As at
January 31, 2010 | | | Additional
Provisions | | | Release of
Provisions | | | Reversed
Provisions | | | As at
January 29, 2011 | |
Insurance (i) | | $ | 24.7 | | | $ | 2.6 | | | $ | (3.4 | ) | | $ | (0.1 | ) | | $ | 23.8 | |
Returns and allowances (ii) | | | 16.0 | | | | 14.3 | | | | (16.0 | ) | | | — | | | | 14.3 | |
Warranties (iii) | | | 16.0 | | | | 18.3 | | | | (20.0 | ) | | | (1.2 | ) | | | 13.1 | |
Sales tax (iv) | | | 5.3 | | | | 0.1 | | | | — | | | | — | | | | 5.4 | |
Severance (v) | | | 2.2 | | | | 3.6 | | | | (2.9 | ) | | | (0.2 | ) | | | 2.7 | |
Environmental (vi) | | | 4.5 | | | | 3.4 | | | | (2.4 | ) | | | (0.5 | ) | | | 5.0 | |
Other provisions (vii) | | | 1.8 | | | | 1.2 | | | | (1.2 | ) | | | (0.2 | ) | | | 1.6 | |
| | | | | | | | | | | | | | | | | | | | |
Total provisions | | $ | 70.5 | | | $ | 43.5 | | | $ | (45.9 | ) | | $ | (2.2 | ) | | $ | 65.9 | |
| | | | | | | | | | | | | | | | | | | | |
Current | | $ | 69.4 | | | $ | 41.8 | | | $ | (44.0 | ) | | $ | (1.9 | ) | | $ | 65.3 | |
Non-current (iii) | | | 1.1 | | | | 1.7 | | | | (1.9 | ) | | | (0.3 | ) | | | 0.6 | |
| | | | | | | | | | | | | | | | | | | | |
Total provisions | | $ | 70.5 | | | $ | 43.5 | | | $ | (45.9 | ) | | $ | (2.2 | ) | | $ | 65.9 | |
| | | | | | | | | | | | | | | | | | | | |
F-37
The following explanations describe the Company’s provisions:
| (i) | The provision for insurance, or general liability claims, represents the Company’s best estimate of the future outflow of economic benefits due to automobile, product and other general liability claims. Insurance claims relating to this provision are expected to be paid over the next several years; however, as the Company has no unconditional right to defer the settlement past at least 12 months, this provision is considered to be current. In estimating the obligation associated with incurred losses, the Company utilizes actuarial methodologies validated by an independent third party. These actuarial methodologies utilize historical data to project future incurred losses. Loss estimates are adjusted based on reported claims and actual settlements. |
| (ii) | The provision for returns and allowances represents the Company’s best estimate of the future outflow of economic benefits due to merchandise returns and allowances. Returns and allowances relating to this provision are expected to be realized over the next 12 months. Uncertainty exists relating to the amount and timing of returns and allowances, therefore, historical data has been used to arrive at this estimate. |
| (iii) | The provision for warranty claims represents the Company’s best estimate of the future outflow of economic benefits that will be required due to the Company’s warranty obligations. Costs incurred to service warranty claims relating to this provision are expected to be paid out over the next 2 years. Uncertainty exists relating to the number of incidents requiring merchandise repair and the related costs. This provision is estimated based on historical warranty trends and costs. The amount of expected reimbursements recorded as at January 28, 2012 was $2.3 million (January 29, 2011: $2.7 million, January 31, 2010: $3.1 million) and is reflected in “Accounts receivable, net” and “Other long-term assets” in the Consolidated Statements of Financial Position. The provision for warranty claims is comprised of both a current (claims realized within 12 months) and non-current component (claims realized between 13 and 24 months), with the balances respectively reflected in “Provisions” and “Other long-term liabilities” (see Note 18) in the Consolidated Statements of Financial Position. |
| (iv) | The Company maintains provisions for sales tax assessments under active discussion, audit, dispute or appeal with tax authorities. These provisions represent the Company’s best estimate of the amount expected to be paid based on qualitative and quantitative assessments. Though uncertainty exists around the timing of settlement of the disputes or appeals with tax authorities, the Company expects that sales tax provisions will be settled within 4 years. However, as the Company has no unconditional right to defer the settlement of these provisions past at least 12 months, these provisions are classified as current. |
| (v) | The provision for severance represents the Company’s best estimate of the future outflow of payments to terminated employees who have made claims. Uncertainty exists relating to the amount of severance that will be awarded in court proceedings. Severance payments are expected to be paid between 1 month to 10 years; however, as the Company has no unconditional right to defer these payments past at least 12 months, this provision is classified as current. |
| (vi) | The environmental provision represents the costs to remediate environmental contamination associated with decommissioning auto centres as well as the cost to remove asbestos to meet regulatory requirements. The provision is based on assessments conducted by third parties as well as historical data. Given the timing of payments to remediate is uncertain and that the Company has no unconditional right to defer these payments past at least 12 months, this provision is classified as current. |
| (vii) | The provisions for other represent the Company’s best estimate of various reserves relating to the future outflow of economic benefits due to obligations for miscellaneous claims. The estimates for these provisions have been made on the basis of information currently available to determine the obligations. These provisions are classified as current. |
F-38
| 17. | Long-term obligations and finance costs |
Long-term obligations
Total outstanding long-term obligations were as follows:
| | | | | | | | | | | | |
(in CAD millions) | | As at
January 28, 2012 | | | As at
January 29, 2011 | | | As at
January 31, 2010 | |
Unsecured medium-term notes | | | | | | | | | | | | |
7.45% due May 10, 2010 | | $ | — | | | $ | — | | | $ | 200.0 | |
7.05% due September 20, 2010 | | | — | | | | — | | | | 100.0 | |
Finance lease obligations-Current | | | 5.1 | | | | 4.7 | | | | 5.4 | |
| | | | | | | | | | | | |
Total principal payments on long-term obligations due within one year | | $ | 5.1 | | | $ | 4.7 | | | $ | 305.4 | |
| | | | | | | | | | | | |
Secured revolving credit facility, net | | $ | 93.1 | | | $ | 97.4 | | | $ | — | |
Finance lease obligations-Non-current | | | 24.5 | | | | 27.0 | | | | 26.1 | |
| | | | | | | | | | | | |
Total long-term obligations | | $ | 117.6 | | | $ | 124.4 | | | $ | 26.1 | |
| | | | | | | | | | | | |
During Fiscal 2010, the Company repaid in full upon maturity, $300.0 million of its unsecured medium-term notes. In September 2010, the Company entered into an $800.0 million senior secured revolving credit facility (the “Credit Facility”) with a syndicate of lenders with a maturity date of September 10, 2015. The Credit Facility is secured with a first lien on inventory and credit card receivables. Availability under the Credit Facility is determined pursuant to a borrowing base formula. The Credit Facility contains covenants which are customary for facilities of this nature and the Company was in compliance with all covenants as at January 28, 2012.
As at January 28, 2012, the Company had drawn $101.1 million (January 29, 2011: $107.5 million, January 31, 2010: Nil) of borrowings and had $6.3 million (January 29, 2011: $6.7 million, January 31, 2010: Nil) of standby letters of credit outstanding under the Credit Facility. Interest on drawings under the Credit Facility is determined based on bankers’ acceptance rates for one to three month terms or the prime rate plus a spread. Interest amounts on the Credit Facility are due monthly and have been added to the principal amount outstanding. As at January 28, 2012, the carrying value of the Credit Facility borrowings included in “Long-term obligations” in the Consolidated Statements of Financial Position is $93.1 million, which is net of the unamortized balance of transaction costs incurred to establish the Credit Facility of $8.0 million (January 29, 2011: borrowings of $97.4 million, net of transaction costs of $10.1 million, January 31, 2010: Nil). Availability under the Credit Facility was $415.1 million as at the end of Fiscal 2011 (January 29, 2011: $510.6 million). This availability may be reduced by reserves which may be applied by the lenders pursuant to the agreement.
As at January 28, 2012, the Company had outstanding merchandise letters of credit of U.S. $5.5 million (January 29, 2011: U.S. $6.6 million, January 31, 2010: U.S. $13.1 million) used to support the Company’s offshore merchandise purchasing program with restricted cash and cash equivalents pledged as collateral.
Finance costs
Interest expense on long-term obligations, including finance lease obligations, the current portion of long-term obligations, amortization of transaction costs and commitment fees on the unused portion of the Credit Facility for Fiscal 2011 totaled $9.3 million (2010: $16.6 million). Interest expense is included in “Finance costs” in the Consolidated Statements of Net (Loss) Earnings and Comprehensive (Loss) Income. Also included in “Finance Costs” for Fiscal 2011, were $5.2 million (2010: Nil) of interest on accruals for uncertain tax positions and $1.5 million (2010: Nil) related to interest on a sales tax assessment.
The Company’s cash payments for interest on long-term obligations, including finance lease obligations, the current portion of long-term obligations and commitment fees on the unused portion of the Credit Facility for Fiscal 2011 totaled $6.8 million (2010: $16.7 million).
F-39
| 18. | Other long-term liabilities |
The components of other long-term liabilities were as follows:
| | | | | | | | | | | | |
(in CAD millions) | | As at
January 28, 2012 | | | As at
January 29, 2011 | | | As at
January 31, 2010 | |
Leasehold inducements | | $ | 66.8 | | | $ | 74.5 | | | $ | 81.0 | |
Straight-line rent liability | | | 6.4 | | | | 7.2 | | | | 8.7 | |
Miscellaneous | | | 2.6 | | | | 3.0 | | | | 3.8 | |
| | | | | | | | | | | | |
Total other long-term liabilities | | $ | 75.8 | | | $ | 84.7 | | | $ | 93.5 | |
| | | | | | | | | | | | |
The non-current portion of the warranties provision (see Note 16) is reflected in the miscellaneous component of “Other long-term liabilities” in the Consolidated Statements of Financial Position.
19.1 Finance lease arrangements – Company as lessee
As at January 28, 2012, the Company had finance lease arrangements related to the building and equipment components of certain leased properties, which include retail, office and warehouse locations. The related land components of these properties have been separately classified as operating leases. The buildings and equipment held under finance leases are used in the normal course of operations and do not contain significant unusual or contingent lease terms or restrictions. Building leases typically run for a period of 1 to 10 years, with some leases providing an option to renew after that date. Equipment leases typically run for a period of 1 to 5 years, with some leases providing an option to renew after that date.
Finance lease buildings and equipment are included in the Consolidated Statements of Financial Position under “Property, plant and equipment.” Note 9 provides further details on the net carrying value of these assets, which as at January 28, 2012 was $28.0 million (January 29, 2011: $31.0 million, January 31, 2010: $31.5 million).
As at January 28, 2012, the corresponding finance lease obligations, current and non-current, were $5.1 million (January 29, 2011: $4.7 million, January 31, 2010: $5.4 million) and $24.5 million (January 29, 2011: $27.0 million, January 31, 2010: $26.1 million), included in the Consolidated Statements of Financial Position under “Principal payments on long-term obligations due within one year” and “Long-term obligations,” respectively (see Note 17).
The table below presents the future minimum lease payments of the Company’s finance lease obligations:
| | | | | | | | | | | | | | | | | | | | | | | | | | | | | | | | | | | | |
| | | As at January 28, 2012 | | | As at January 29, 2011 | | | As at January 31, 2010 | |
(in CAD millions) | | Finance
lease
payments | | | Future
finance
costs | | | Present value of
minimum lease
payments | | | Finance
lease
payments | | | Future
finance
costs | | | Present value of
minimum lease
payments | | | Finance
lease
payments | | | Future
Finance
costs | | | Present value of
minimum lease
payments | |
Within 1 year | | $ | 7.0 | | | $ | 1.9 | | | $ | 5.1 | | | $ | 6.7 | | | $ | 2.0 | | | $ | 4.7 | | | $ | 7.7 | | | $ | 2.3 | | | $ | 5.4 | |
2 years | | | 6.0 | | | | 1.5 | | | | 4.5 | | | | 5.9 | | | | 1.7 | | | | 4.2 | | | | 6.0 | | | | 1.7 | | | | 4.3 | |
3 years | | | 4.8 | | | | 1.2 | | | | 3.6 | | | | 4.9 | | | | 1.5 | | | | 3.4 | | | | 5.2 | | | | 1.4 | | | | 3.8 | |
4 years | | | 3.3 | | | | 1.1 | | | | 2.2 | | | | 4.2 | | | | 1.3 | | | | 2.9 | | | | 4.2 | | | | 1.2 | | | | 3.0 | |
5 years | | | 3.1 | | | | 0.9 | | | | 2.2 | | | | 4.2 | | | | 1.0 | | | | 3.2 | | | | 4.2 | | | | 1.0 | | | | 3.2 | |
Thereafter | | | 14.2 | | | | 2.2 | | | | 12.0 | | | | 16.5 | | | | 3.2 | | | | 13.3 | | | | 15.2 | | | | 3.4 | | | | 11.8 | |
| | | | | | | | | | | | | | | | | | | | | | | | | | | | | | | | | | | | |
Total minimum payments | | $ | 38.4 | | | $ | 8.8 | | | $ | 29.6 | | | $ | 42.4 | | | $ | 10.7 | | | $ | 31.7 | | | $ | 42.5 | | | $ | 11.0 | | | $ | 31.5 | |
| | | | | | | | | | | | | | | | | | | | | | | | | | | | | | | | | | | | |
Interest on finance lease obligations is recognized immediately in “Finance costs” in the Consolidated Statements of Net (Loss) Earnings and Comprehensive (Loss) Income (see Note 17). Included in total “Finance Costs” in Fiscal 2011, was $2.2 million (2010: $2.3 million) of interest related to finance lease obligations.
F-40
19.2 Operating lease arrangements – Company as lessor
The Company has a number of agreements to sub-lease premises to third parties, which are all classified as operating leases. During Fiscal 2011, total sub-lease income from leased premises was $2.8 million (2010: $2.3 million).
As at January 28, 2012, total future minimum lease payments receivable from third party tenants were $3.1 million (2010: $4.2 million).
19.3 Operating lease arrangements – Company as lessee
As at January 28, 2012, the Company had operating lease arrangements related to leased retail and office properties as well as equipment assets. The leases typically run for a period of 1 to 10 years, with some leases providing an option to renew after that date. Some leases include additional or contingent rent payments that are based on sales and step rent payments which are recognized on a straight-line basis over the term of the lease. During Fiscal 2011, contingent rent recognized as an expense in respect of operating leases totaled $0.9 million (2010: $1.0 million). Rental expense for all operating leases totaled $103.4 million in Fiscal 2011 (2010: $106.1 million). These expenses are included in “Selling, administrative and other expenses” in the Consolidated Statements of Net (Loss) Earnings and Comprehensive (Loss) Income.
The table below presents the contractual maturities of future minimum lease payments for the Company’s operating leases:
| | | | | | | | | | | | |
(in CAD millions) | | As at
January 28, 2012 | | | As at
January 29, 2011 | | | As at
January 31, 2010 | |
Within 1 year | | $ | 102.7 | | | $ | 100.7 | | | $ | 100.1 | |
2 years | | | 86.2 | | | | 93.9 | | | | 91.4 | |
3 years | | | 66.8 | | | | 76.0 | | | | 82.4 | |
4 years | | | 55.9 | | | | 62.4 | | | | 67.9 | |
5 years | | | 42.1 | | | | 50.8 | | | | 54.8 | |
Thereafter | | | 156.4 | | | | 187.6 | | | | 214.9 | |
| | | | | | | | | | | | |
Total operating lease obligations 1 | | $ | 510.1 | | | $ | 571.4 | | | $ | 611.5 | |
| | | | | | | | | | | | |
| 1 | Operating lease obligations are not reported in the Consolidated Statements of Financial Position |
| 20. | Retirement benefit plans |
In July 2008, the Company amended its pension plan and introduced a defined contribution component. The defined benefit component continues to accrue benefits related to future compensation increases although no further service credit is earned. In addition, the Company no longer provides medical, dental and life insurance benefits at retirement for associates who had not achieved the eligibility criteria for these non-pension post retirement benefits as at December 31, 2008. Effective December 2009, the Company made the decision to change funding for non-pension post retirement benefits from an actuarial basis to a pay-as-you-go basis to allow the surplus in the health and welfare trust to be utilized to make benefit payments. In addition, to further utilize the surplus, short-term disability payments of eligible associates are paid on a pay-as-you-go basis from the health and welfare trust and are no longer funded by the Company.
The Company currently maintains a defined benefit registered pension plan and a defined contribution registered pension plan which covers eligible, regular full-time associates as well as some of its part-time associates. The defined benefit plan provides pensions based on length of service and final average earnings. In addition to a registered retirement savings plan, the pension plan includes a non-registered supplemental arrangement in respect to the defined benefit plan. The non-registered portion of the plan is maintained to enable certain
F-41
associates to continue saving for retirement in addition to the registered limit as prescribed by the Canada Revenue Agency. The Company also maintains a defined benefit non-pension post retirement plan which provides life insurance, medical and dental benefits to eligible retired associates through a health and welfare trust (“other benefits plan”). Also provided for under the health and welfare trust are short-term disability payments for active associates. The Company’s accounting policies related to retirement benefit plans are described in Note 2.
The Company has elected to early adopt the amendments to IAS 19 beginning January 29, 2012, with retrospective application to prior reporting periods. A description of the nature of the change in accounting policy and a summary of its impact to the Company’s consolidated financial statements are included in Note 2. This note has been revised to align with the amendments to IAS 19 for all periods disclosed.
Risks associated with retirement benefit plans
There is no assurance that the Company’s retirement benefit plans will be able to earn the assumed rate of return. New regulations and market driven changes may result in changes in the discount rates and other variables which would result in the Company being required to make contributions in the future that differ significantly from the estimates. Management is required to use assumptions to account for the plans in conformity with IFRS. However, actual future experience will differ from these assumptions giving rise to actuarial gains or losses. In any year, actual experience differing from the assumptions may be material.
Plan assets consist primarily of cash, alternative investments and marketable equity and fixed income securities. The value of the marketable equity and fixed income investments will fluctuate due to changes in market prices. Plan obligations and annual pension expense are determined by independent actuaries and through the use of a number of assumptions. Although the Company believes that the assumptions used in the actuarial valuation process are reasonable, there remains a degree of risk and uncertainty which may cause results to differ from expectations. Significant assumptions in measuring the benefit obligations and pension plan costs include the discount rate and the rate of compensation increase.
Asset-liability matching strategies
Beginning in Fiscal 2011, the Company adopted an asset-liability matching strategy in the Other Benefits Plan wherein assets are invested in accordance with a short-term fixed income mandate, primarily bonds with maturities not exceeding four years. This investment strategy is aligned with the expected use of the assets, which is to fund the Company’s retiree health benefits and short-term disability payments within the next four to five years.
Plan amendments, curtailments and settlements
There were no significant plan amendments, curtailments or settlements during the 52-week periods ended January 28, 2012 and January 29, 2011.
Maturity profile of retirement benefit plan obligations
The weighted average durations of the Registered Retirement Plans, Non-registered Pension Plan and Other Benefit Plan are approximately 11, 10 and 11.5 years, respectively.
The Company’s contractual cash flow maturity relating to retirement benefit plan obligation payments is included under “Liquidity Risk” in Note 14.
F-42
20.1 Retirement benefit asset and liability
The Company measures its accrued benefit obligations and the fair value of plan assets for accounting purposes as at January 31. The most recent actuarial valuation of the pension plan for funding purposes is dated December 31, 2010. The next actuarial valuation assessment is required as of December 31, 2013. An actuarial valuation of the health and welfare trust is performed at least every 3 years, with the last valuation completed as of September 1, 2011.
The following annual disclosures have been recast to comply with the amendments to IAS 19.
| | | | | | | | | | | | | | | | | | | | | | | | | | | | | | | | |
| | | 2011
(Recast – Note 2) | | | 2010
(Recast – Note 2) | |
(in CAD millions) | | Registered
Retirement
Plans | | | Non-
Registered
Pension
Plan | | | Other
Benefits
Plan | | | Total | | | Registered
Retirement
Plans | | | Non-
Registered
Pension
Plan | | | Other
Benefits
Plan | | | Total | |
Defined benefit plan assets | | | | | | | | | | | | | | | | | | | | | | | | | | | | | | | | |
Fair value, beginning balance | | $ | 1,241.7 | | | $ | 47.4 | | | $ | 89.9 | | | $ | 1,379.0 | | | $ | 1,249.3 | | | $ | 47.5 | | | $ | 107.4 | | | $ | 1,404.2 | |
Actual return on plan assets | | | 50 | | | | 1.0 | | | | 3.1 | | | | 54.1 | | | | 100.3 | | | | 1.0 | | | | 3.3 | | | | 104.6 | |
Employer contributions | | | 0.9 | | | | 6.4 | | | | 0.7 | | | | 8.0 | | | | — | | | | 2.6 | | | | 0.7 | | | | 3.3 | |
Administrative expenses | | | (0.5 | ) | | | — | | | | (0.1 | ) | | | (0.6 | ) | | | (0.6 | ) | | | — | | | | — | | | | (0.6 | ) |
Benefits paid1 | | | (113.2 | ) | | | (5.5 | ) | | | (24.9 | ) | | | (143.6 | ) | | | (107.3 | ) | | | (3.7 | ) | | | (21.5 | ) | | | (132.5 | ) |
| | | | | | | | | | | | | | | | | | | | | | | | | | | | | | | | |
Fair value of plan assets, ending balance | | $ | 1,178.9 | | | $ | 49.3 | | | $ | 68.7 | | | $ | 1,296.9 | | | $ | 1,241.7 | | | $ | 47.4 | | | $ | 89.9 | | | $ | 1,379.0 | |
| | | | | | | | | | | | | | | | | | | | | | | | | | | | | | | | |
Defined benefit plan obligations | | | | | | | | | | | | | | | | | | | | | | | | | | | | | | | | |
Accrued obligations, beginning balance | | $ | 1,354.7 | | | $ | 47.8 | | | $ | 302.7 | | | $ | 1,705.2 | | | $ | 1,297.2 | | | $ | 45.6 | | | $ | 284.3 | | | $ | 1,627.1 | |
Total current service cost | | | 0.9 | | | | — | | | | — | | | | 0.9 | | | | — | | | | — | | | | 0.9 | | | | 0.9 | |
Interest cost | | | 70.9 | | | | 2.5 | | | | 15.8 | | | | 89.2 | | | | 75.1 | | | | 2.6 | | | | 16.6 | | | | 94.3 | |
Benefits paid | | | (113.2 | ) | | | (5.5 | ) | | | (16.4 | ) | | | (135.1 | ) | | | (107.3 | ) | | | (3.7 | ) | | | (13.8 | ) | | | (124.8 | ) |
Actuarial losses | | | 64.4 | | | | 5.3 | | | | 19.3 | | | | 89.0 | | | | 89.7 | | | | 3.3 | | | | 14.7 | | | | 107.7 | |
| | | | | | | | | | | | | | | | | | | | | | | | | | | | | | | | |
Accrued plan obligations, ending balance | | $ | 1,377.7 | | | $ | 50.1 | | | $ | 321.4 | | | $ | 1,749.2 | | | $ | 1,354.7 | | | $ | 47.8 | | | $ | 302.7 | | | $ | 1,705.2 | |
| | | | | | | | | | | | | | | | | | | | | | | | | | | | | | | | |
Funded status of plan – (deficit) | | | (198.8 | ) | | | (0.8 | ) | | | (252.7 | ) | | | (452.3 | ) | | | (113.0 | ) | | | (0.4 | ) | | | (212.8 | ) | | | (326.2 | ) |
| | | | | | | | | | | | | | | | | | | | | | | | | | | | | | | | |
Retirement benefit liability at end of fiscal year, net | | $ | (198.8 | ) | | $ | (0.8 | ) | | $ | (252.7 | ) | | $ | (452.3 | ) | | $ | (113.0 | ) | | $ | (0.4 | ) | | $ | (212.8 | ) | | $ | (326.2 | ) |
| | | | | | | | | | | | | | | | | | | | | | | | | | | | | | | | |
|
| The retirement benefit liability is included in the Company’s Consolidated Statements of Financial Position as follows: | |
| | | | | | | | |
Retirement benefit liability | | $ | (198.8 | ) | | $ | (0.8 | ) | | $ | (252.7 | ) | | $ | (452.3 | ) | | $ | (113.0 | ) | | $ | (0.4 | ) | | $ | (212.8 | ) | | $ | (326.2 | ) |
| | | | | | | | | | | | | | | | | | | | | | | | | | | | | | | | |
Retirement benefit liability at end of fiscal year, net | | $ | (198.8 | ) | | $ | (0.8 | ) | | $ | (252.7 | ) | | $ | (452.3 | ) | | $ | (113.0 | ) | | $ | (0.4 | ) | | $ | (212.8 | ) | | $ | (326.2 | ) |
| | | | | | | | | | | | | | | | | | | | | | | | | | | | | | | | |
| 1 | Benefits paid from the funded assets include retiree benefits and short-term disability of active employees. Other benefits, consisting of health and dental claims. |
F-43
20.2 Fair value of plan assets
The fair value of plan assets disaggregated by asset class and fair value hierarchy level as at January 28, 2012, January 29, 2011 and January 31, 2010, was as follows:
| | | | | | | | | | | | | | | | | | | | | | | | | | | | | | | | | | | | | | | | | | | | | | | | |
| | | As at
January 28, 2012
(Recast – Note 2) | | | As at
January 29, 2011
(Recast – Note 2) | | | As at
January 31, 2010
(Recast – Note 2) | |
| | | Registered
Retirement
Plans | | | Non-
Registered
Pension
Plan | | | Other
Benefits
Plan | | | Total | | | Registered
Retirement
Plans | | | Non-
Registered
Pension
Plan | | | Other
Benefits
Plan | | | Total | | | Retirement
Plans | | | Pension
Plan | | | Benefits
Plan | | | Total | |
| Cash and cash equivalents | | | | | | | | | | | | | | | | | | | | | | | | | | | | | | | | | | | | |
Level 1 | | $ | 25.5 | | | $ | 26.3 | | | $ | — | | | $ | 51.8 | | | $ | 114.6 | | | $ | 25.7 | | | $ | 0.2 | | | $ | 140.5 | | | $ | 5.3 | | | $ | 25.2 | | | $ | — | | | | 30.5 | |
Subtotal | | | 25.5 | | | | 26.3 | | | | — | | | | 51.8 | | | | 114.6 | | | | 25.7 | | | | 0.2 | | | | 140.5 | | | | 5.3 | | | | 25.2 | | | | — | | | | 30.5 | |
Corporate bonds and notes | | | | | | | | | | | | | | | | | | | | | | | | | | | | | | | | | | | | | | | | | | | | | | | | |
Level 1 | | | | | | | — | | | | — | | | | — | | | | 40.0 | | | | 1.5 | | | | 8.2 | | | | 49.7 | | | | 60.9 | | | | 0.7 | | | | 7.8 | | | | 69.4 | |
Level 2 | | | 550.8 | | | | — | | | | 18.6 | | | | 569.4 | | | | 320.1 | | | | — | | | | — | | | | 320.1 | | | | 99.4 | | | | — | | | | — | | | | 99.4 | |
Level 3 | | | 63.1 | | | | — | | | | 0.9 | | | | 64.0 | | | | 70.5 | | | | — | | | | 1.1 | | | | 71.6 | | | | 73.9 | | | | — | | | | 1.1 | | | | 75.0 | |
Subtotal | | | 613.9 | | | | — | | | | 19.5 | | | | 633.4 | | | | 430.6 | | | | 1.5 | | | | 9.3 | | | | 441.4 | | | | 234.2 | | | | 0.7 | | | | 8.9 | | | | 243.8 | |
U.S. Government bonds and securities | | | | | | | | | | | | | | | | | | | | | | | | | | | | | | | | | | | | | | | | | | | | | | | | |
Level 1 | | | 0.1 | | | | — | | | | — | | | | 0.1 | | | | — | | | | — | | | | — | | | | — | | | | — | | | | — | | | | — | | | | — | |
Level 2 | | | 1.8 | | | | — | | | | — | | | | 1.8 | | | | 0.8 | | | | — | | | | — | | | | 0.8 | | | | 1.6 | | | | — | | | | — | | | | 1.6 | |
Subtotal | | | 1.9 | | | | — | | | | — | | | | 1.9 | | | | 0.8 | | | | — | | | | — | | | | 0.8 | | | | 1.6 | | | | — | | | | — | | | | 1.6 | |
Common stock, preferred stock and REITS | | | | | | | | | | | | | | | | | | | | | | | | | | | | | | | | | | | | | | | | | | | | | | | | |
Level 1 | | | 219.6 | | | | — | | | | — | | | | 219.6 | | | | 185.5 | | | | — | | | | — | | | | 185.5 | | | | 0.2 | | | | — | | | | — | | | | 0.2 | |
Level 2 | | | 0.9 | | | | — | | | | — | | | | 0.9 | | | | — | | | | — | | | | — | | | | — | | | | — | | | | — | | | | — | | | | — | |
Subtotal | | | 220.5 | | | | — | | | | — | | | | 220.5 | | | | 185.5 | | | | — | | | | — | | | | 185.5 | | | | 0.2 | | | | — | | | | — | | | | 0.2 | |
Common or collective trusts | | | | | | | | | | | | | | | | | | | | | | | | | | | | | | | | | | | | | | | | | | | | | | | | |
Level 1 | | | — | | | | — | | | | — | | | | — | | | | 164.2 | | | | 7.4 | | | | 21.1 | | | | 192.7 | | | | 249.6 | | | | 7.2 | | | | 21.0 | | | | 277.8 | |
Level 2 | | | 282.9 | | | | 23.0 | | | | — | | | | 305.9 | | | | — | | | | — | | | | — | | | | — | | | | — | | | | — | | | | — | | | | — | |
Level 3 | | | — | | | | — | | | | — | | | | — | | | | — | | | | | | | | | | | | — | | | | — | | | | — | | | | — | | | | — | |
Subtotal | | | 282.9 | | | | 23.0 | | | | — | | | | 305.9 | | | | 164.2 | | | | 7.4 | | | | 21.1 | | | | 192.7 | | | | 249.6 | | | | 7.2 | | | | 21.0 | | | | 277.8 | |
Short-term collective investment funds | | | | | | | | | | | | | | | | | | | | | | | | | | | | | | | | | | | | | | | | | | | | | | | | |
Level 1 | | | — | | | | — | | | | — | | | | — | | | | 13.9 | | | | — | | | | 2.0 | | | | 15.9 | | | | 6.3 | | | | — | | | | 1.4 | | | | 7.7 | |
Level 2 | | | 6.4 | | | | — | | | | 0.9 | | | | 7.3 | | | | — | | | | — | | | | — | | | | — | | | | — | | | | — | | | | — | | | | — | |
Subtotal | | | 6.4 | | | | — | | | | 0.9 | | | | 7.3 | | | | 13.9 | | | | — | | | | 2.0 | | | | 15.9 | | | | 6.3 | | | | — | | | | 1.4 | | | | 7.7 | |
Hedge funds, options and futures | | | | | | | | | | | | | | | | | | | | | | | | | | | | | | | | | | | | | | | | | | | | | | | | |
Level 2 | | | — | | | | — | | | | — | | | | — | | | | 0.2 | | | | — | | | | — | | | | 0.2 | | | | 24.9 | | | | — | | | | 0.1 | | | | 25.0 | |
Level 3 | | | 15.4 | | | | — | | | | 0.2 | | | | 15.6 | | | | 93.0 | | | | 5.5 | | | | 14.7 | | | | 113.2 | | | | 366.1 | | | | 10.9 | | | | 33.6 | | | | 410.6 | |
Subtotal | | | 15.4 | | | | — | | | | 0.2 | | | | 15.6 | | | | 93.2 | | | | 5.5 | | | | 14.7 | | | | 113.4 | | | | 391.0 | | | | 10.9 | | | | 33.7 | | | | 435.6 | |
Receivables | | | | | | | | | | | | | | | | | | | | | | | | | | | | | | | | | | | | | | | | | | | | | | | | |
Level 1 | | | 9.7 | | | | — | | | | 0.7 | | | | 10.4 | | | | 5.8 | | | | — | | | | — | | | | 5.8 | | | | 1.6 | | | | — | | | | — | | | | 1.6 | |
Level 2 | | | (7.1 | ) | | | — | | | | — | | | | (7.1 | ) | | | (2.9 | ) | | | — | | | | — | | | | (2.9 | ) | | | 1.3 | | | | — | | | | — | | | | 1.3 | |
Subtotal | | | 2.6 | | | | — | | | | 0.7 | | | | 3.3 | | | | 2.9 | | | | — | | | | — | | | | 2.9 | | | | 2.9 | | | | — | | | | — | | | | 2.9 | |
Miscellaneous other assets | | | | | | | | | | | | | | | | | | | | | | | | | | | | | | | | | | | | | | | | | | | | | | | | |
Level 1 | | | — | | | | — | | | | — | | | | — | | | | 199.8 | | | | 7.3 | | | | 42.6 | | | | 249.7 | | | | 323.0 | | | | 3.5 | | | | 42.5 | | | | 369.0 | |
Level 2 | | | 9.8 | | | | — | | | | 47.4 | | | | 57.2 | | | | 36.1 | | | | — | | | | — | | | | 36.1 | | | | 34.6 | | | | — | | | | — | | | | 34.6 | |
Level 3 | | | — | | | | — | | | | — | | | | — | | | | 0.1 | | | | — | | | | — | | | | 0.1 | | | | — | | | | — | | | | — | | | | — | |
Subtotal | | | 9.8 | | | | — | | | | 47.4 | | | | 57.2 | | | | 236.0 | | | | 7.3 | | | | 42.6 | | | | 285.9 | | | | 357.6 | | | | 3.5 | | | | 42.5 | | | | 403.6 | |
| | | | | | | | | | | | | | | | | | | | | | | | | | | | | | | | | | | | | | | | | | | | | | | | |
Total fair value of plan assets | | $ | 1,178.9 | | | $ | 49.3 | | | $ | 68.7 | | | $ | 1,296.9 | | | $ | 1,241.7 | | | $ | 47.4 | | | $ | 89.9 | | | $ | 1,379.0 | | | $ | 1,248.7 | | | $ | 47.5 | | | $ | 107.5 | | | $ | 1,403.7 | |
| | | | | | | | | | | | | | | | | | | | | | | | | | | | | | | | | | | | | | | | | | | | | | | | |
F-44
The three levels of the fair value hierarchy referenced above are discussed in Note 14.5.
20.3 Plan assets investment allocation
During Fiscal 2011, the Company changed the target asset allocation to 55-75% fixed income and 25-45% equity for the registered and non-registered pension plans. For the assets in the health and welfare trust, included in Other Benefit Plans, the Company changed the asset allocation to 100% fixed income. As at the end of Fiscal 2011, the assets were in line with the target allocation, with the transitioning of assets from alternative investments near completion. As at the end of Fiscal 2010, the Company was in the process of transitioning to the 2010 target allocation of 60% fixed income and 40% equity, from the 2009 target allocation of 50% fixed income, 30% alternative investments and 20% equity. The asset allocation may be changed from time to time in terms of weighting between fixed income, equity and other asset classes as well as within the asset classes themselves.
The plan’s target allocation is determined taking into consideration the amounts and timing of projected liabilities, the Company’s funding policies and expected returns on various asset classes. To develop the expected long-term rate of return on assets assumption, the Company considered the historical returns and the future expectations for returns for each asset class, as well as the target asset allocation of the pension portfolio.
At as the end of the current and prior fiscal years, plan assets were invested in the following classes of securities:
| | | | | | | | | | | | | | | | | | | | | | | | | | | | | | | | | | | | |
| | | As at
January 28, 2012 | | | As at
January 29, 2011 | | | As at
January 31, 2010 | |
| | | Registered
Retirement
Plans | | | Non-
Registered
Pension
Plan | | | Other
Benefits
Plan | | | Registered
Retirement
Plans | | | Non-
Registered
Pension
Plan | | | Other
Benefits
Plan | | | Registered
Retirement
Plans | | | Non-
Registered
Pension
Plan | | | Other
Benefits
Plan | |
Fixed income securities | | | 69.8 | % | | | 69.5 | % | | | 99.7 | % | | | 63.6 | % | | | 43.5 | % | | | 60.1 | % | | | 48.7 | % | | | 20.1 | % | | | 49.1 | % |
Alternative investments | | | 1.3 | % | | | 0.4 | % | | | 0.3 | % | | | 7.5 | % | | | 24.1 | % | | | 23.5 | % | | | 31.3 | % | | | 48.1 | % | | | 31.3 | % |
Equity securities | | | 28.9 | % | | | 30.1 | % | | | 0.0 | % | | | 28.9 | % | | | 32.4 | % | | | 16.4 | % | | | 20.0 | % | | | 31.8 | % | | | 19.6 | % |
| | | | | | | | | | | | | | | | | | | | | | | | | | | | | | | | | | | | |
Total | | | 100.0 | % | | | 100.0 | % | | | 100.0 | % | | | 100.0 | % | | | 100.0 | % | | | 100.0 | % | | | 100.0 | % | | | 100.0 | % | | | 100.0 | % |
| | | | | | | | | | | | | | | | | | | | | | | | | | | | | | | | | | | | |
F-45
20.4 Pension assumptions
The significant actuarial assumptions were as follows (weighted average assumptions) as at January 28, 2012, January 29, 2011 and January 31, 2010:
| | | | | | | | | | | | | | | | | | | | | | | | | | | | | | | | | | | | |
| | | As at
January 28, 2012
(Recast – Note 2) | | | As at
January 29, 2011
(Recast – Note 2) | | | As at
January 31, 2010
(Recast – Note 2) | |
| | | Registered
Retirement
Plans | | | Non-
Registered
Pension
Plan | | | Other
Benefits
Plan | | | Registered
Retirement
Plans | | | Non-
Registered
Pension
Plan | | | Other
Benefits
Plan | | | Registered
Retirement
Plans | | | Non-
Registered
Pension
Plan | | | Other
Benefits
Plan | |
Discount rate used in calculation of Accrued benefit plan obligations | | | 4.70 | % | | | 4.70 | % | | | 4.60 | % | | | 5.40 | % | | | 5.40 | % | | | 5.40 | % | | | 6.00 | % | | | 6.00 | % | | | 6.00 | % |
Benefit plans expense | | | 4.70 | % | | | 4.70 | % | | | 4.60 | % | | | 5.40 | % | | | 5.40 | % | | | 5.40 | % | | | 6.00 | % | | | 6.00 | % | | | 6.00 | % |
Rate of compensation increase used in calculation of Accrued benefit plan obligations | | | 3.50 | % | | | 3.50 | % | | | 3.50 | % | | | 3.50 | % | | | 3.50 | % | | | 3.50 | % | | | 3.50 | % | | | 3.50 | % | | | 3.50 | % |
Benefit plans expense | | | 3.50 | % | | | 3.50 | % | | | 3.50 | % | | | 3.50 | % | | | 3.50 | % | | | 3.50 | % | | | 3.50 | % | | | 3.50 | % | | | 3.50 | % |
Expected long-term rate of return on plan assets used in calculation of benefit plans expense | | | 4.70 | % | | | 4.70 | % | | | 4.60 | % | | | 5.40 | % | | | 5.40 | % | | | 5.40 | % | | | 6.00 | % | | | 6.00 | % | | | 6.00 | % |
Health care cost trend rates | | | | | | | | | | | | | | | | | | | | | | | | | | | | | | | | | | | | |
Used in calculation of accrued benefit plan obligations | | | | | | | | | | | 6.23 | % | | | | | | | | | | | 6.78 | % | | | | | | | | | | | 6.90 | % |
Used in calculation of benefit plans expense | | | | | | | | | | | 6.78 | % | | | | | | | | | | | 6.90 | % | | | | | | | | | | | 7.05 | % |
Cost trend rate declines to | | | | | | | | | | | 3.82 | % | | | | | | | | | | | 4.48 | % | | | | | | | | | | | 4.48 | % |
Year that the rate reaches assumed constant | | | | | | | | | | | 2030 | | | | | | | | | | | | 2030 | | | | | | | | | | | | 2030 | |
20.5 Sensitivity of significant actuarial assumptions
The following table summarizes the sensitivity of significant actuarial assumptions on the Company’s defined benefit obligation:
| | | | | | | | | | | | | | | | | | | | | | | | |
| | | 2011 (Recast-Note 2) | | | 2010 (Recast-Note 2) | |
(in CAD millions) | | Registered
Retirement
Plans | | | Non-
Registered
Pension
Plan | | | Other
Benefits
Plan | | | Registered
Retirement
Plans | | | Non-
Registered
Pension
Plan | | | Other
Benefits
Plan | |
1% increase in discount rate | | $ | (150.2 | ) | | $ | (5.0 | ) | | $ | (31.0 | ) | | $ | (143.6 | ) | | $ | (4.4 | ) | | | (31.2 | ) |
1% decrease in discount rate | | | 187.7 | | | | 6.0 | | | | 37.0 | | | | 164.1 | | | | 4.9 | | | | 37.7 | |
0.5% decrease in compensation increase rate | | | (19.4 | ) | | | (0.6 | ) | | | n/a | | | | (22.5 | ) | | | (0.4 | ) | | | n/a | |
The methods and assumptions used in determining the above sensitivity are consistent with the methods and assumptions used to determine the pension plan obligations and with the methods and assumptions used in fiscal 2010.
F-46
20.6 Retirement benefit plans expense and contributions
The expense for the defined benefit, defined contribution and other benefit plans for Fiscal 2011 and Fiscal 2010, was as follows:
| | | | | | | | | | | | | | | | | | | | | | | | | | | | | | | | |
| | | 2011 (Recast-Note 2) | | | 2010 (Recast-Note 2) | |
(in CAD millions) | | Registered
Retirement
Plans | | | Non-
Registered
Pension
Plan | | | Other
Benefits
Plan | | | Total | | | Registered
Retirement
Plans | | | Non-
Registered
Pension
Plan | | | Other
Benefits
Plan | | | Total | |
Current service cost, net of employee contributions | | $ | 0.9 | | | $ | — | | | $ | — | | | $ | 0.9 | | | $ | — | | | $ | — | | | $ | 0.9 | | | $ | 0.9 | |
Interest cost | | | 70.9 | | | | 2.5 | | | | 15.8 | | | | 89.2 | | | | 75.1 | | | | 2.6 | | | | 16.5 | | | | 94.2 | |
Interest income on plan assets | | | (64.8 | ) | | | (2.6 | ) | | | (4.1 | ) | | | (71.5 | ) | | | (72.2 | ) | | | (2.7 | ) | | | (5.6 | ) | | | (80.5 | ) |
Administrative expenses | | | 0.5 | | | | — | | | | 0.1 | | | | 0.6 | | | | 0.5 | | | | | | | | | | | | 0.5 | |
| | | | | | | | | | | | | | | | | | | | | | | | | | | | | | | | |
Net defined benefit plans expenses (income) | | $ | 7.5 | | | $ | (0.1 | ) | | $ | 11.8 | | | $ | 19.2 | | | $ | 3.4 | | | $ | (0.1 | ) | | $ | 11.8 | | | $ | 15.1 | |
| | | | | | | | | | | | | | | | | | | | | | | | | | | | | | | | |
Net defined contribution plan expense | | | 10.7 | | | | — | | | | 0.3 | | | | 11.0 | | | | 11.2 | | | | — | | | | 0.3 | | | | 11.5 | |
| | | | | | | | | | | | | | | | | | | | | | | | | | | | | | | | |
Total retirement benefit plans expense (income) 1 | | $ | 18.2 | | | $ | (0.1 | ) | | $ | 12.1 | | | $ | 30.2 | | | $ | 14.6 | | | $ | (0.1 | ) | | $ | 12.1 | | | $ | 26.6 | |
| | | | | | | | | | | | | | | | | | | | | | | | | | | | | | | | |
| 1 | Not included in total expense recognized are short-term disability payments of $8.4 million (2010: $7.7 million) that were paid from the health and welfare trust. Both short-term disability and the retirement benefit plans expense are included in “Selling, administrative and other expenses” in the Company’s Consolidated Statements of Net (Loss) Earnings and Comprehensive (Loss) Income. |
Total payments relating to cash contributed by the Company to its defined benefit, defined contribution and other benefit plans for the fiscal year ended January 28, 2012 were $17.9 million (2010: $13.8 million). For fiscal 2012, it is estimated that the Company will make contributions of approximately $49.1 million to its defined benefit, defined contribution and other benefit plans, which include funding obligations as described in Note 14.2.
20.7 Remeasurements of the net defined retirement benefit liability
| | | | | | | | | | | | | | | | | | | | | | | | | | | | | | | | |
| | | 2011 (Recast – Note 2) | | | 2010 (Recast – Note 2) | |
(in CAD millions) | | Registered
Retirement
Plans | | | Non-
Registered
Pension
Plan | | | Other
Benefits
Plan | | | Total | | | Registered
Retirement
Plans | | | Non-
Registered
Pension
Plan | | | Other
Benefits
Plan | | | Total | |
Actuarial loss on difference between interest income and actual return on plan assets | | $ | (14.8 | ) | | $ | (1.6 | ) | | $ | (1.0 | ) | | $ | (17.4 | ) | | $ | 27.6 | | | $ | (1.8 | ) | | $ | (2.3 | ) | | $ | 23.5 | |
Actuarial gain (loss) due to change in demographic | | | 19.0 | | | | 0.3 | | | | (0.6 | ) | | | 18.7 | | | | — | | | | — | | | | — | | | | — | |
Actuarial loss due to change in economic assumptions | | | (108.6 | ) | | | (3.6 | ) | | | (27.0 | ) | | | (139.2 | ) | | | (74.2 | ) | | | (2.8 | ) | | | (19.3 | ) | | | (96.3 | ) |
Actuarial gain (loss) due to all other experiences | | | 25.2 | | | | (2.0 | ) | | | 8.2 | | | | 31.4 | | | | (15.6 | ) | | | (0.5 | ) | | | 4.6 | | | | (11.5 | ) |
| | | | | | | | | | | | | | | | | | | | | | | | | | | | | | | | |
Total pre-tax remeasurement losses | | $ | (79.2 | ) | | $ | (6.9 | ) | | $ | (20.4 | ) | | $ | (106.5 | ) | | $ | (62.2 | ) | | $ | (5.1 | ) | | $ | (17.0 | ) | | $ | (84.3 | ) |
| | | | | | | | | | | | | | | | | | | | | | | | | | | | | | | | |
Income tax recovery on remeasurement losses | | | | | | | | | | | | | | | 27.4 | | | | | | | | | | | | | | | | 21.7 | |
| | | | | | | | | | | | | | | | | | | | | | | | | | | | | | | | |
Total remeasurement losses, net of income taxes 1 | | | | | | | | | | | | | | $ | (79.1 | ) | | | | | | | | | | | | | | $ | (62.6 | ) |
| | | | | | | | | | | | | | | | | | | | | | | | | | | | | | | | |
F-47
| 1 | Total remeasurement losses, net of income taxes, are included in “Other comprehensive loss” for the 52-Week Period Ended January 28, 2012 in the Company’s Consolidated Statements of Net Earnings (Loss) and Comprehensive Income (Loss). |
The actuarial losses associated with changes in economic assumptions are due to changes in the discount rate. The discount rate as at January 28, 2012 decreased 0.7% for the Registered Retirement Plans and the Non-registered Pension Plan (2010: a decrease of 0.6%), and 0.8% for the Other Benefits Plan (2010: a decrease of 0.6%).
| 21. | Contingent liabilities |
21.1 Legal Proceedings
Three class actions in the provinces of Quebec, Saskatchewan and Ontario were commenced against the Company in 2005 arising out of the Company’s pricing of tires. The plaintiffs allege that the Company inflated the regular retail price of certain brands of tires sold by the Company in order to then claim that the same brands were on sale for up to 45% off the regular retail price so as to induce potential customers into believing that substantial savings were being offered. The plaintiffs seek general damages, special damages, and punitive damages, as well as costs, pre-judgment and post-judgment interest. No dollar amounts are specified. The plaintiffs intend to proceed with the Quebec action and seek certification as a class action on a national basis. The outcome of this action is indeterminable, and the monetary damages, if any, cannot be reliably estimated. Therefore, the Company has not provided for any potential liability.
In addition, the Company is involved in various legal proceedings incidental to the normal course of business. The Company is of the view that although the outcome of such legal proceedings cannot be predicted with certainty, the final disposition is not expected to have a material adverse effect on the Company’s Consolidated Statements of Financial Position or Consolidated Statements of Net (Loss) Earnings and Comprehensive (Loss) Income.
21.2 Commitments and guarantees
Commitments
As at January 28, 2012, cash and cash equivalents that are restricted represent cash and investments pledged as collateral for letter of credit obligations issued under the Company’s offshore merchandise purchasing program of $7.2 million (January 29, 2011: $7.1 million, January 31, 2010: $5.2 million), the Canadian equivalent of U.S. $7.2 million (January 29, 2011: U.S. $7.0 million, January 31, 2010: U.S. $4.8 million), current cash deposits pledged as collateral with counterparties relating to outstanding derivative contracts of Nil (January 29, 2011: $5.1 million, January 31, 2010: $6.4 million) and funds held in trust in accordance with regulatory requirements governing advance ticket sales related to Sears Travel of Nil (January 29, 2011: $3.1 million, January 31, 2010: $4.2 million).
Guarantees
The Company has provided the following significant guarantees to third parties:
Royalty License Agreements
The Company pays royalties under various merchandise license agreements, which are generally based on the sale of products. Certain license agreements require a minimum guaranteed payment of royalties over the term of the contract, regardless of sales. Total future minimum royalty payments under such agreements were $3.1 million as at January 28, 2012 (January 29, 2011: $2.4 million, January 31, 2010: $4.8 million).
F-48
Other Indemnification Agreements
In the ordinary course of business, the Company has provided indemnification commitments to counterparties in transactions such as leasing transactions, royalty agreements, service arrangements, investment banking agreements and director and officer indemnification agreements. The Company has also provided certain indemnification agreements in connection with the sale of the credit and financial services operations in November 2005. The foregoing indemnification agreements require the Company to compensate the counterparties for costs incurred as a result of changes in laws and regulations, or as a result of litigation or statutory claims, or statutory sanctions that may be suffered by a counterparty as a consequence of the transaction. The terms of these indemnification agreements will vary based on the contract and typically do not provide for any limit on the maximum potential liability. Historically, the Company has not made any significant payments under such indemnifications and no amounts have been accrued in the consolidated financial statements with respect to these indemnification commitments.
The average combined federal and provincial statutory income tax rate applicable to the Company was 28.5% for Fiscal 2011 (2010: 29.6%) due to lower legislated statutory tax rates in the current year. A reconciliation of income taxes at the average statutory tax rate to actual income taxes for Fiscal 2011 and Fiscal 2010 is as follows:
| | | | | | | | |
(in CAD millions) | | 2011
(Recast - Note 2) | | | 2010
(Recast - Note 2) | |
(Loss) earnings before income taxes | | $ | (56.9 | ) | | $ | 187.1 | |
| | | | | | | | |
Income taxes at the average statutory tax rate | | $ | (16.2 | ) | | $ | 55.4 | |
Increase (decrease) in income taxes resulting from | | | | | | | | |
Non-taxable portion of capital gain | | | — | | | | (2.5 | ) |
Non-deductible items | | | 2.1 | | | | 0.9 | |
Prior year assessments | | | 5.1 | | | | 2.3 | |
Prior year true-up | | | (0.1 | ) | | | (0.3 | ) |
| | | | | | | | |
| | | (9.1 | ) | | | 55.8 | |
Effective tax rate before the following adjustments | | | 16.0 | % | | | 29.8 | % |
Changes in tax rates or imposition of new taxes | | | 2.5 | | | | 6.3 | |
| | | | | | | | |
Total income tax (recovery) expense | | $ | (6.6 | ) | | $ | 62.1 | |
| | | | | | | | |
Effective tax rate | | | 11.6 | % | | | 33.2 | % |
| | | | | | | | |
The Company’s total net cash refunds or payments of income and other taxes for the current year were a net payment of $21.6 million (2010: net payment of $79.8 million).
In the ordinary course of business, the Company is subject to ongoing audits by tax authorities. While the Company believes that its tax filing positions are appropriate and supportable, periodically, certain matters are challenged by tax authorities. During Fiscal 2011, the Company recorded a charge of $10.3 million for estimated exposure to uncertain tax provisions, comprised of $5.2 million of interest in “Finance costs” and $5.1 million related to income tax exposure, consisting of a charge of $17.9 million to “Income tax (recovery) expense—Current” and a recovery of $12.8 million to “Income tax (recovery) expense—Deferred,” all included in the Consolidated Statements of Net (Loss) Earnings and Comprehensive (Loss) Income. As the Company routinely evaluates and provides for potentially unfavourable outcomes with respect to any tax audits, the Company believes that, other than as noted above, the final disposition of tax audits will not have a material adverse effect on its liquidity, the Consolidated Statements of Financial Position or results of operations. Included in “Other long-term assets” in the Consolidated Statements of Financial Position, as at January 28, 2012, were receivables of $30.3 million (January 29, 2011: $20.9 million, January 31, 2010: $20.9 million) related to payments made by the Company for tax assessments that are being disputed (see Note 12). During Fiscal 2011, the Company made $11.3 million in related payments.
F-49
The tax effects of the significant components of temporary differences giving rise to the Company’s net deferred tax assets and liabilities were as follows:
| | | | | | | | | | | | |
(in CAD millions) | | As at
January 28, 2012
(Recast - Note 2) | | | As at
January 29, 2011
(Recast - Note 2) | | | As at
January 31, 2010
(Recast - Note 2) | |
Prepaid expenses | | $ | (0.4 | ) | | $ | (1.0 | ) | | $ | (0.7 | ) |
Accrued liabilities and other long-term liabilities | | | 57.2 | | | | 56.5 | | | | 57.8 | |
Deferred retirement benefit plans | | | 51.4 | | | | 29.2 | | | | 11.9 | |
Other post-retirement benefits | | | 65.0 | | | | 54.8 | | | | 45.5 | |
Amounts related to tax losses carried forward | | | 0.2 | | | | — | | | | 1.4 | |
Non-depreciable property, plant and equipment | | | (36.6 | ) | | | (36.5 | ) | | | (36.4 | ) |
Depreciable property, plant and equipment | | | (56.6 | ) | | | (79.1 | ) | | | (93.2 | ) |
Deferred charges | | | (0.3 | ) | | | (1.0 | ) | | | (0.6 | ) |
Loyalty program | | | — | | | | 4.8 | | | | 5.5 | |
Other | | | (0.7 | ) | | | (1.2 | ) | | | 0.8 | |
| | | | | | | | | | | | |
Subtotal | | $ | 79.2 | | | $ | 26.5 | | | $ | (8.0 | ) |
| | | | | | | | | | | | |
Amounts related to other comprehensive income (loss) | | | 0.1 | | | | 1.2 | | | | (3.7 | ) |
| | | | | | | | | | | | |
Total deferred tax assets (liabilities), net | | $ | 79.3 | | | $ | 27.7 | | | $ | (11.7 | ) |
| | | | | | | | | | | | |
Deferred tax assets | | $ | 84.6 | | | $ | 33.2 | | | $ | 0.6 | |
Deferred tax liabilities | | | (5.3 | ) | | | (5.5 | ) | | | (12.3 | ) |
| | | | | | | | | | | | |
Total deferred tax assets (liabilities), net | | $ | 79.3 | | | $ | 27.7 | | | $ | (11.7 | ) |
| | | | | | | | | | | | |
On May 18, 2010, the Company filed a Normal Course Issuer Bid with the Toronto Stock Exchange (“TSX”) that permitted the Company to purchase for cancellation up to 5% of its issued and outstanding common shares (“2010 NCIB”). Under the 2010 NCIB, purchases were allowed to commence on May 25, 2010 and terminated on May 24, 2011. On May 24, 2011, the Company renewed the Normal Course Issuer Bid with the TSX for the period of May 25, 2011 to May 24, 2012 (“2011 NCIB”). Pursuant to the 2011 NCIB, the Company is permitted to purchase for cancellation up to 5% of its issued and outstanding common shares, equivalent to 5,268,599 common shares based on the common shares issued and outstanding as at May 9, 2011. The Company may not purchase common shares under the 2011 NCIB if such shares cannot be purchased at prices that the Company considers attractive. Decisions regarding the timing of purchases are based on market conditions and other factors.
During Fiscal 2011, 2,668,800 shares were purchased for $42.0 million (2010: 2,204,500 shares were purchased for $43.0 million) and cancelled. The impact of the share repurchases was a decrease to “Capital stock” and “Retained earnings” in the Consolidated Statements of Financial Position of $0.4 million and $41.6 million (2010: $0.3 million and $42.7 million), respectively. As at January 28, 2012, a total of 4,873,300 shares had been purchased for $85.0 million and cancelled under the 2010 and 2011 NCIB resulting in a total decrease to date of $0.7 million in “Capital stock” and $84.3 million in “Retained earnings.”
F-50
As at the end of January 28, 2012, the only shares outstanding were common shares of the Company. The following table presents a continuity of capital stock for the fiscal years ended January 28, 2012 and January 29, 2011:
| | | | | | | | | | | | | | | | |
| | | 2011 | | | 2010 | |
(in CAD millions, except number of shares) | | Number of
Common
Shares | | | Stated
Value | | | Number of
Common
Shares | | | Stated
Value | |
Balance, beginning of fiscal year | | | 105,417,095 | | | $ | 15.4 | | | | 107,620,995 | | | $ | 15.7 | |
Exercised stock options | | | — | | | | — | | | | 600 | | | | — | |
Repurchases of common shares | | | (2,668,800 | ) | | | (0.4 | ) | | | (2,204,500 | ) | | | (0.3 | ) |
| | | | | | | | | | | | | | | | |
Balance, end of fiscal year | | | 102,748,295 | | | $ | 15.0 | | | | 105,417,095 | | | $ | 15.4 | |
| | | | | | | | | | | | | | | | |
Sears Holdings, the controlling shareholder of the Company, is the beneficial holder of 97,341,670 or 94.7%, of the common shares of the Company as at January 28, 2012 (January 29, 2011: 97,341,670 or 92.3%, January 31, 2010: 78,680,790 or 73.1%). The issued and outstanding shares are fully paid and have no par value.
The Company’s objectives when managing capital are:
| | • | | Maintain financial flexibility thus allowing the Company to preserve its ability to meet financial objectives and continue as a going concern; |
| | • | | Provide an appropriate return to shareholders; and |
| | • | | Maintain a capital structure that allows the Company to obtain financing should the need arise. |
The Company manages and makes adjustments to its capital structure, when necessary, in light of changes in economic conditions, the objectives of its shareholders, the cash requirements of the business and the condition of capital markets. In order to maintain or adjust the capital structure, the Company may pay a dividend or return capital to shareholders, modify debt levels or sell assets.
The Company defines capital as follows:
| | • | | Long-term obligations, including the current portion of long-term obligations (“Total long-term obligations”); and |
The following table presents summary quantitative data with respect to the Company’s capital resources:
| | | | | | | | | | | | |
(in CAD millions) | | As at
January 28, 2012
(Recast - Note 2) | | | As at
January 29, 2011
(Recast - Note 2) | | | As at
January 31, 2010
(Recast - Note 2) | |
Total long-term obligations | | $ | 122.7 | | | $ | 129.1 | | | $ | 331.5 | |
Shareholders’ equity | | | 1,092.0 | | | | 1,260.4 | | | | 2,004.4 | |
| | | | | | | | | | | | |
Total | | $ | 1,214.7 | | | $ | 1,389.5 | | | $ | 2,335.9 | |
| | | | | | | | | | | | |
F-51
The components of the Company’s revenue were as follows:
| | | | | | | | |
(in CAD millions) | | 2011 | | | 2010 | |
Sale of goods | | $ | 4,125.7 | | | $ | 4,404.3 | |
Service revenue | | | 331.4 | | | | 337.5 | |
Commission revenue | | | 116.7 | | | | 144.1 | |
Licensee fee revenue | | | 29.5 | | | | 32.1 | |
Other | | | 16.0 | | | | 20.5 | |
| | | | | | | | |
Total revenue | | $ | 4,619.3 | | | $ | 4,938.5 | |
| | | | | | | | |
| 26. | Employee benefits expense |
The components of the Company’s employee benefits expense for the current and prior fiscal year were as follows:
| | | | | | | | |
(in CAD millions) | | 2011
(Recast -Note 2) | | | 2010
(Recast -Note 2) | |
Wages and salaries | | $ | 685.0 | | | $ | 693.6 | |
Paid absences 1 | | | 67.1 | | | | 69.4 | |
Benefits | | | | | | | | |
Provincial healthcare costs | | | 15.4 | | | | 16.3 | |
Flex benefits | | | 16.2 | | | | 11.4 | |
Retirement benefit plans expense | | | 30.2 | | | | 26.6 | |
Statutory deductions 2 | | | 46.0 | | | | 46.9 | |
Severance 3 | | | 25.3 | | | | 5.5 | |
Other employer paid benefits | | | 2.1 | | | | 2.1 | |
| | | | | | | | |
Total benefits expense | | $ | 887.3 | | | $ | 871.8 | |
| | | | | | | | |
| 1 | Paid absences are expenses related to vacation, statutory holidays and sick days. |
| 2 | Statutory deductions consist of payments to the Canada Pension Plan and Employment Insurance. |
| 3 | Included in Severance for Fiscal 2011 were $19.3 million of costs related to transformation. |
These expenses are included in “Cost of goods and services sold” and “Selling, administrative and other expenses” in the Consolidated Statements of Net (Loss) Earnings and Comprehensive (Loss) Income.
| 27. | Related party transactions |
The indirect parent of the Company is Sears Holdings. The ultimate controlling party of the Company is ESL Investments, Inc. (incorporated in the U.S. in the state of Delaware) through Sears Holdings. The Company also has investments in joint ventures, as described in Note 11.
Balances and transactions between the Company and its subsidiaries, which are related parties of the Company, have been eliminated on consolidation and are not disclosed in this note. Details of transactions between the Company and other related parties are disclosed below.
F-52
27.1 Trading transactions
During the year, the Company entered into the following trading transactions with related parties:
| | | | | | | | | | | | | | | | | | | | | | | | | | | | | | | | |
| | | | | | | | | | | | 2011 | | | | | | | | | | | | 2010 | |
(in CAD millions) | | Purchase
of goods | | | Services
received | | | Other | | | Total | | | Purchase
of goods | | | Services
received | | | Other | | | Total | |
Sears Holdings Corporation | | $ | 0.3 | | | $ | 4.8 | | | $ | 0.5 | | | $ | 5.6 | | | $ | 0.2 | | | $ | 6.6 | | | $ | 0.3 | | | $ | 7.1 | |
Real estate joint ventures | | | — | | | | 4.4 | | | | — | | | | 4.4 | | | | — | | | | 4.9 | | | | — | | | | 4.9 | |
| | | | | | | | | | | | | | | | | | | | | | | | | | | | | | | | |
Total related party transactions | | $ | 0.3 | | | $ | 9.2 | | | $ | 0.5 | | | $ | 10.0 | | | $ | 0.2 | | | $ | 11.5 | | | $ | 0.3 | | | $ | 12.0 | |
| | | | | | | | | | | | | | | | | | | | | | | | | | | | | | | | |
The following balances were outstanding as at the end of the fiscal year:
| | | | | | | | | | | | |
| | | Amounts receivable from related parties | |
(in CAD millions) | | As at
January 28, 2012 | | | As at
January 29, 2011 | | | As at
January 31, 2010 | |
Sears Holdings Corporation | | $ | 0.1 | | | $ | 0.5 | | | $ | 1.0 | |
Real estate joint ventures | | | — | | | | — | | | | — | |
| | | | | | | | | | | | |
Total | | $ | 0.1 | | | $ | 0.5 | | | $ | 1.0 | |
| | | | | | | | | | | | |
| |
| | | Amounts payable to related parties | |
(in CAD millions) | | As at
January 28, 2012 | | | As at
January 29, 2011 | | | As at
January 31, 2010 | |
Sears Holdings Corporation | | $ | 0.6 | | | $ | 0.8 | | | $ | 0.5 | |
Real estate joint ventures | | | — | | | | — | | | | — | |
| | | | | | | | | | | | |
Total | | $ | 0.6 | | | $ | 0.8 | | | $ | 0.5 | |
| | | | | | | | | | | | |
The related party transactions with Sears Holdings are in the ordinary course of business for shared merchandise purchasing services. These transactions were recorded either at fair market value or the exchange amount, which was established and agreed to by the related parties. These balances are included in “Accounts payable and accrued liabilities” and “Accounts receivable, net” in the Consolidated Statements of Financial Position.
The related party transactions with the various real estate joint ventures represent lease payments for the lease of the Company’s stores. These transactions were recorded either at fair market value or the exchange amount, which was established and agreed to by the related parties.
The amounts outstanding are unsecured and will be settled in cash. No guarantees have been given or received. No expense has been recognized in the current or prior fiscal periods for bad or doubtful debts in respect of the amounts owed by related parties.
The Company’s Audit Committee is responsible for pre-approving all related party transactions that have a value greater than $1.0 million.
| 28. | Key management personnel compensation |
Key management personnel are those individuals having the authority and responsibility for planning, directing and controlling the activities of the Company. The Company considers the Board of Directors and the following members of senior management to be key management personnel:
Current and former President and Chief Executive Officer;
Senior Vice-President and Chief Financial Officer;
Executive Vice-President and Chief Administrative Officer;
F-53
Executive Vice-President, Merchandising, Apparel and Accessories;
Former Executive Vice-President, Home and Hardlines;
Senior Vice-President, Major Appliances;
Current and former Senior Vice-President, Marketing;
Senior Vice-President, Financial and Home Services;
Senior Vice-President and General Counsel;
Former Senior Vice-President, Retail Stores; and
Senior Vice-President, Business Capability and Human Resources.
Key management personnel compensation was as follows:
| | | | | | | | |
(in CAD millions) | | 2011 | | | 2010 | |
Salaries and perquisites | | $ | 5.2 | | | $ | 4.0 | |
Annual incentive plans | | | 2.2 | | | | 0.5 | |
Pensions | | | — | | | | 0.4 | |
Termination benefits | | | 1.2 | | | | — | |
| | | | | | | | |
Total key management personnel compensation | | $ | 8.6 | | | $ | 4.9 | |
| | | | | | | | |
| 29. | Net (loss) earnings per share |
A reconciliation of the number of shares used in the net (loss) earnings per share calculation is as follows:
| | | | | | | | |
(Number of shares) | | 2011 | | | 2010 | |
Weighted average number of shares per basic net (loss) earnings per share calculation | | | 104,275,192 | | | | 107,344,264 | |
Effect of dilutive instruments outstanding | | | — | | | | 5,538 | |
| | | | | | | | |
Weighted average number of shares per diluted net (loss) earnings per share calculation | | | 104,275,192 | | | | 107,349,802 | |
| | | | | | | | |
“Net (loss) earnings” as disclosed in the Consolidated Statements of Net (Loss) Earnings and Comprehensive (Loss) Income was used as the numerator in calculating the basic and diluted net (loss) earnings per share. For the fiscal year ended January 28, 2012, the Company incurred a net loss and therefore, all potential common shares were anti-dilutive. For the fiscal year ended January 29, 2011, 22,980 outstanding options were considered in the calculation of diluted net earnings per share as they were dilutive.
| 30. | Changes in non-cash working capital balances |
Cash generated from (used for) non-cash working capital balances were comprised of the following:
| | | | | | | | |
(in CAD millions) | | 2011 | | | 2010 | |
Accounts receivable, net | | $ | 27.8 | | | $ | (11.1 | ) |
Inventories | | | 129.3 | | | | (100.9 | ) |
Prepaid expenses | | | 3.9 | | | | 3.0 | |
Accounts payable and accrued liabilities | | | (95.8 | ) | | | (34.8 | ) |
Deferred revenue | | | (16.0 | ) | | | (11.9 | ) |
Provisions | | | (0.5 | ) | | | (4.1 | ) |
Income and other taxes payable and recoverable | | | (19.2 | ) | | | (0.7 | ) |
Derivative financial assets and liabilities | | | — | | | | 2.9 | |
Effect of foreign exchange rates | | | 0.1 | | | | 1.0 | |
| | | | | | | | |
Cash generated from (used for) non-cash working capital balances | | $ | 29.6 | | | $ | (156.6 | ) |
| | | | | | | | |
F-54
| 31. | Events after the reporting period |
On March 2, 2012, the Company entered an agreement to surrender and terminate early the operating leases on three properties. On the closing date, April 20, 2012, the Company received cash proceeds of $170.0 million for the surrender of the three leases, resulting in a pre-tax gain of $164.3 million for the 13-week period ended April 28, 2012, net of transaction costs of $5.7 million, including the derecognition of leasehold improvements. The Company plans to exit all three properties by October 31, 2012.
| 32. | IFRS 1 – First time adoption of IFRS |
The consolidated financial statements were prepared in accordance with IFRS 1. IFRS 1 requires retrospective application of IFRS standards as at the reporting date, but contains certain optional exemptions and mandatory exceptions from this requirement.
32.1 IFRS 1 optional exemptions and mandatory exceptions
IFRS 1 optional exemptions allow companies to elect non-retrospective or other treatments at transition where retrospective application is deemed to be overly burdensome or impracticable. The voluntary exemptions which were elected by the Company at transition are as follows:
Fair value or revaluation as deemed cost:
An entity may elect to revalue its property, plant and equipment at fair value at the transition date and use this fair value as the deemed transition cost. On transition, the Company elected to measure certain of its land and buildings, investment property and finance lease buildings at fair value and set the fair value as the deemed cost. The election resulted in a material increase in the net carrying value of property, plant and equipment and retained earnings on the transition date of January 31, 2010, with a corresponding increase in depreciation expense for the 52-week periods ended January 29, 2011 and January 28, 2012. Had this election not been taken, the net carrying value of property plant and equipment and retained earnings would be materially lower on the transition date of January 31, 2010, with a significantly lower depreciation expense for the 52-week periods ended January 29, 2011 and January 28, 2012.
Business combinations:
An exemption is available within IFRS 1 that allows an entity to carry forward its previous Generally Accepted Accounting Principles (“GAAP”) accounting for business combinations prior to the transition date. The Company has elected to not apply IFRS 3 – Business Combinations retrospectively to business combinations that occurred before the transition date. No change has been made to the recognition and measurement of business combinations that occurred prior to this date.
Borrowing costs:
IAS 23 – Borrowing Costs (“IAS 23”) requires capitalization of borrowing costs that are directly attributable to, and an allocation of borrowing costs on general debt that relate to, the acquisition, construction or redevelopment of an asset that takes a substantial period of time to prepare for its intended use. IAS 23 requires retrospective application.
IFRS 1 allows an entity to adopt IAS 23 prospectively to projects for which the capitalization commencement date is after January 30, 2010, or it may elect any date earlier than January 31, 2010 for transition. The Company has elected to apply IAS 23 prospectively to the acquisition, construction or redevelopment of assets that occurred on or after the transition date.
Share-based payment transactions:
IFRS 2 – Share-based payment (“IFRS 2”) is applied to all grants of shares, options or other equity instruments made after November 7, 2002. Similarly, IFRS 2 applies to all liabilities arising from share-based (unit-based) payment transactions that exist at the later of the date of transition to IFRS and January 1, 2005.
F-55
IFRS 1 allows first-time adopters to exclude application of IFRS 2 to equity instruments that were granted prior to November 7, 2002. It also allows the first-time adopter to not apply IFRS 2 to equity instruments granted after November 7, 2002 that had vested before transition to IFRS. Finally, it allows first-time adopters to exclude the application of IFRS 2 to liabilities settled before the transition date. The Company has elected these exemptions on transition date.
Arrangements containing leases:
IFRS 1 allows entities to determine whether an arrangement contains a lease in accordance with IFRIC 4 – Determining whether an Arrangement contains a Lease (“IFRIC 4”) based on the facts and circumstances at the transition date rather than at the lease inception date. On transition, the Company has elected not to reapply the criteria for determining whether an arrangement contains a lease on the date of transition, given the same determination was made in accordance with Canadian GAAP in 2004.
IFRS 1 also provides certain mandatory exceptions to the retrospective application requirement. The general premise of IFRS 1 mandatory exceptions is to prevent companies from using hindsight in adopting IFRS’s retrospectively. The mandatory exceptions applicable to the Company are as follows:
Estimates:
Estimates made in accordance with IFRS at transition date remained consistent with those determined under Canadian GAAP, except where they were impacted by a difference in accounting policy.
Hedge accounting
Hedging relationships recognized under Canadian GAAP must be discontinued unless the entity had documented IFRS compliant hedging documentation prior to February 1, 2010 in which case hedge accounting may continue in accordance with IAS 39. The Company’s hedge transactions continue to be effective hedges under IFRS.
Derecognition of financial assets and liabilities
Financial assets and liabilities derecognized before January 31, 2010 are not re-recognized under IFRS. Management did not choose to apply the IAS 39 derecognition criteria to an earlier date. The application of this exemption has no impact to the Company.
32.2 IFRS 1 reconciliations
As these are the first annual IFRS financial statements for the Company, IFRS 1 requires a reconciliation between Canadian GAAP and IFRS equity and comprehensive income, for the comparative reporting period of Fiscal 2010, including the Fiscal 2010 opening Consolidated Statements of Financial Position.
F-56
Presented below are these reconciliations:
32.2.1 Reconciliation of Canadian GAAP to IFRS 2010 Consolidated Statements of Financial Position
| | | | | | | | | | | | | | | | | | | | | | | | | | | | | | | | | | | | | | | | | | | | | | | | | | | | | | | | | | | | | | |
| As at January 29, 2011 | | | | | | | | | | | | | | | | | | | | | | | | | | | | | | | | | | | | | | | | | | | | | | | |
(in millions) | | Ref | | Canadian
GAAP | | | Reclassifications
(j) | | | Canadian
GAAP
Reclassified | | | Property,
Plant &
Equipment
(a) | | | Investment
Property
(a) | | | Joint
Ventures
(b) | | | Leases
(c) | | | Financial
Instruments
(d) | | | Provisions
(e) | | | Employee
Benefits
(f) | | | Intangible
Assets
(g) | | | Loyalty
Program
(h) | | | Income
Taxes
(i) | | | Early adoption of
IAS 19 (Revised),
net of taxes
(f) | | | IFRS | |
Current assets | | | | $ | 1,634.5 | | | $ | (28.1 | ) | | $ | 1,606.4 | | | $ | — | | | $ | — | | | $ | 14.6 | | | $ | (0.1 | ) | | $ | — | | | $ | — | | | $ | — | | | $ | (25.9 | ) | | $ | — | | | $ | — | | | | | | | $ | 1,565.8 | |
Property, plant and equipment | | | | | 577.4 | | | | (0.1 | ) | | | 577.3 | | | | 375.8 | | | | (5.1 | ) | | | (77.3 | ) | | | 30.0 | | | | — | | | | — | | | | — | | | | — | | | | — | | | | — | | | | | | | $ | 900.7 | |
Investment property | | | | | — | | | | — | | | | — | | | | — | | | | 21.7 | | | | — | | | | — | | | | — | | | | — | | | | — | | | | — | | | | — | | | | — | | | | | | | | 21.7 | |
Investment in joint ventures | | | | | — | | | | — | | | | — | | | | — | | | | — | | | | 313.3 | | | | — | | | | — | | | | — | | | | — | | | | — | | | | — | | | | — | | | | | | | | 313.3 | |
Other non-current assets | | | | | 297.9 | | | | 30.9 | | | | 328.8 | | | | — | | | | — | | | | (10.4 | ) | | | (0.1 | ) | | | — | | | | — | | | | 32.1 | | | | (7.8 | ) | | | — | | | | (71.9 | ) | | | (164.7 | ) | | | 106.0 | |
| | | | | | | | | | | | | | | | | | | | | | | | | | | | | | | | | | | | | | | | | | | | | | | | | | | | | | | | | | | | | | |
| | | | $ | 2,509.8 | | | $ | 2.7 | | | $ | 2,512.5 | | | $ | 375.8 | | | $ | 16.6 | | | $ | 211.0 | | | $ | 29.8 | | | $ | — | | | $ | — | | | $ | 32.1 | | | $ | (33.7 | ) | | $ | — | | | $ | (71.9 | ) | | $ | (164.7 | ) | | $ | 2,907.5 | |
| | | | | | | | | | | | | | | | | | | | | | | | | | | | | | | | | | | | | | | | | | | | | | | | | | | | | | | | | | | | | | |
Current liabilities | | | | $ | 1,023.9 | | | $ | 2.7 | | | $ | 1,026.5 | | | $ | — | | | $ | — | | | $ | (19.6 | ) | | $ | 4.0 | | | $ | — | | | $ | 0.6 | | | $ | — | | | $ | — | | | $ | 17.1 | | | $ | 0.2 | | | | | | | $ | 1,028.9 | |
Other non-current liabilities | | | | | 485.4 | | | | — | | | | 485.4 | | | | — | | | | — | | | | (33.4 | ) | | | 26.1 | | | | — | | | | — | | | | (65.3 | ) | | | — | | | | — | | | | 71.1 | | | | 134.3 | | | $ | 618.2 | |
| | | | | | | | | | | | | | | | | | | | | | | | | | | | | | | | | | | | | | | | | | | | | | | | | | | | | | | | | | | | | | |
| | | | | 1,509.3 | | | | 2.7 | | | | 1,512.0 | | | | — | | | | — | | | | (53.0 | ) | | | 30.1 | | | | — | | | | 0.6 | | | | (65.3 | ) | | | — | | | | 17.1 | | | | 71.3 | | | | 134.3 | | | | 1,647.1 | |
| | | | | | | | | | | | | | | | | | | | | | | | | | | | | | | | | | | | | | | | | | | | | | | | | | | | | | | | | | | | | | |
Capital stock | | | | | 15.4 | | | | — | | | | 15.4 | | | | — | | | | — | | | | — | | | | — | | | | — | | | | — | | | | — | | | | — | | | | — | | | | — | | | | | | | $ | 15.4 | |
Retained earnings | | | | | 987.5 | | | | — | | | | 987.5 | | | | 375.8 | | | | 16.6 | | | | 264.0 | | | | (0.3 | ) | | | 0.7 | | | | (0.6 | ) | | | 97.4 | | | | (33.7 | ) | | | (17.1 | ) | | | (143.5 | ) | | | (236.4 | ) | | $ | 1,310.4 | |
Accumulated other comprehensive loss | | | | | (2.4 | ) | | | — | | | | (2.4 | ) | | | — | | | | — | | | | — | | | | — | | | | (0.7 | ) | | | — | | | | — | | | | — | | | | — | | | | 0.3 | | | | (62.6 | ) | | $ | (65.4 | ) |
| | | | | | | | | | | | | | | | | | | | | | | | | | | | | | | | | | | | | | | | | | | | | | | | | | | | | | | | | | | | | | |
| | | | | 1,000.5 | | | | — | | | | 1,000.5 | | | | 375.8 | | | | 16.6 | | | | 264.0 | | | | (0.3 | ) | | | — | | | | (0.6 | ) | | | 97.4 | | | | (33.7 | ) | | | (17.1 | ) | | | (143.2 | ) | | | (299.0 | ) | | | 1,260.4 | |
| | | | | | | | | | | | | | | | | | | | | | | | | | | | | | | | | | | | | | | | | | | | | | | | | | | | | | | | | | | | | | |
| | | | $ | 2,509.8 | | | $ | 2.7 | | | $ | 2,512.5 | | | $ | 375.8 | | | $ | 16.6 | | | $ | 211.0 | | | $ | 29.8 | | | $ | — | | | $ | — | | | $ | 32.1 | | | $ | (33.7 | ) | | $ | — | | | $ | (71.9 | ) | | $ | (164.7 | ) | | $ | 2,907.5 | |
| | | | | | | | | | | | | | | | | | | | | | | | | | | | | | | | | | | | | | | | | | | | | | | | | | | | | | | | | | | | | | |
| | | | | | | | | | | | | | | | | | | | | | | | | | | | | | | | | | | | | | | | | | | | | | | | | | | | | | | | | | | | | | |
| As at January 31, 2010 | | | | | | | | | | | | | | | | | | | | | | | | | | | | | | | | | | | | | | | | | | | | | | | |
(in millions) | | Ref | | Canadian
GAAP | | | Reclassifications
(j) | | | Canadian
GAAP
Reclassified | | | Property,
Plant &
Equipment
(a) | | | Investment
Property
(a) | | | Joint
Ventures
(b) | | | Leases
(c) | | | Financial
Instruments
(d) | | | Provisions
(e) | | | Employee
Benefits
(f) | | | Intangible
Assets
(g) | | | Loyalty
Program
(h) | | | Income
Taxes
(i) | | | Early adoption of
IAS 19 (Revised),
net of taxes
(f) | | | IFRS | |
Current assets | | | | $ | 2,491.4 | | | $ | (26.9 | ) | | $ | 2,464.5 | | | $ | — | | | $ | — | | | $ | (9.6 | ) | | $ | — | | | $ | — | | | $ | — | | | $ | — | | | $ | (26.9 | ) | | $ | — | | | $ | — | | | $ | — | | | $ | 2,428.0 | |
Property, plant and equipment | | | | | 620.2 | | | | — | | | | 620.2 | | | | 400.4 | | | | (5.1 | ) | | | (84.6 | ) | | | 30.1 | | | | — | | | | — | | | | — | | | | — | | | | — | | | | — | | | | — | | | $ | 961.0 | |
Investment property | | | | | — | | | | — | | | | — | | | | — | | | | 21.7 | | | | — | | | | — | | | | — | | | | — | | | | — | | | | — | | | | — | | | | — | | | | — | | | $ | 21.7 | |
Investment in joint ventures | | | | | — | | | | — | | | | — | | | | — | | | | — | | | | 321.0 | | | | — | | | | — | | | | — | | | | — | | | | — | | | | — | | | | — | | | | — | | | $ | 321.0 | |
Other non-current assets | | | | | 293.2 | | | | 29.7 | | | | 322.9 | | | | — | | | | — | | | | (7.8 | ) | | | (0.1 | ) | | | — | | | | — | | | | 36.9 | | | | (6.8 | ) | | | — | | | | (61.1 | ) | | | (207.4 | ) | | $ | 76.6 | |
| | | | | | | | | | | | | | | | | | | | | | | | | | | | | | | | | | | | | | | | | | | | | | | | | | | | | | | | | | | | | | |
| | | | $ | 3,404.8 | | | $ | 2.8 | | | $ | 3,407.6 | | | $ | 400.4 | | | $ | 16.6 | | | $ | 219.0 | | | $ | 30.0 | | | $ | — | | | $ | — | | | $ | 36.9 | | | $ | (33.7 | ) | | $ | — | | | $ | (61.1 | ) | | $ | (207.4 | ) | | $ | 3,808.3 | |
| | | | | | | | | | | | | | | | | | | | | | | | | | | | | | | | | | | | | | | | | | | | | | | | | | | | | | | | | | | | | | |
Current liabilities | | | | $ | 1,376.7 | | | $ | 2.8 | | | $ | 1,379.5 | | | $ | — | | | $ | — | | | $ | (23.0 | ) | | $ | 4.5 | | | $ | — | | | $ | 0.9 | | | $ | — | | | $ | — | | | $ | 19.7 | | | $ | — | | | $ | — | | | $ | 1,381.6 | |
Other non-current liabilities | | | | | 370.6 | | | | — | | | | 370.6 | | | | — | | | | — | | | | (36.3 | ) | | | 24.5 | | | | — | | | | — | | | | (68.9 | ) | | | — | | | | — | | | | 93.6 | | | | 38.8 | | | $ | 422.3 | |
| | | | | | | | | | | | | | | | | | | | | | | | | | | | | | | | | | | | | | | | | | | | | | | | | | | | | | | | | | | | | | |
| | | | | 1,747.3 | | | | 2.8 | | | | 1,750.1 | | | | — | | | | — | | | | (59.3 | ) | | | 29.0 | | | | — | | | | 0.9 | | | | (68.9 | ) | | | — | | | | 19.7 | | | | 93.6 | | | | 38.8 | | | | 1,803.9 | |
| | | | | | | | | | | | | | | | | | | | | | | | | | | | | | | | | | | | | | | | | | | | | | | | | | | | | | | | | | | | | | |
Capital stock | | | | | 15.7 | | | | — | | | | 15.7 | | | | — | | | | — | | | | — | | | | — | | | | — | | | | — | | | | — | | | | — | | | | — | | | | — | | | | — | | | $ | 15.7 | |
Retained earnings | | | | | 1,633.8 | | | | — | | | | 1,633.8 | | | | 400.4 | | | | 16.6 | | | | 278.3 | | | | 1.0 | | | | 1.1 | | | | (0.9 | ) | | | 105.8 | | | | (33.7 | ) | | | (19.7 | ) | | | (155.0 | ) | | | (246.2 | ) | | $ | 1,981.5 | |
Accumulated other comprehensive loss | | | | | 8.0 | | | | — | | | | 8.0 | | | | — | | | | — | | | | — | | | | — | | | | (1.1 | ) | | | — | | | | — | | | | — | | | | — | | | | 0.3 | | | | — | | | $ | 7.2 | |
| | | | | | | | | | | | | | | | | | | | | | | | | | | | | | | | | | | | | | | | | | | | | | | | | | | | | | | | | | | | | | |
| | | | | 1,657.5 | | | | — | | | | 1,657.5 | | | | 400.4 | | | | 16.6 | | | | 278.3 | | | | 1.0 | | | | — | | | | (0.9 | ) | | | 105.8 | | | | (33.7 | ) | | | (19.7 | ) | | | (154.7 | ) | | | (246.2 | ) | | | 2,004.4 | |
| | | | | | | | | | | | | | | | | | | | | | | | | | | | | | | | | | | | | | | | | | | | | | | | | | | | | | | | | | | | | | |
| | | | $ | 3,404.8 | | | $ | 2.8 | | | $ | 3,407.5 | | | $ | 400.4 | | | $ | 16.6 | | | $ | 219.0 | | | $ | 30.0 | | | $ | — | | | $ | — | | | $ | 36.9 | | | $ | (33.7 | ) | | $ | — | | | $ | (61.1 | ) | | $ | (207.4 | ) | | $ | 3,808.3 | |
| | | | | | | | | | | | | | | | | | | | | | | | | | | | | | | | | | | | | | | | | | | | | | | | | | | | | | | | | | | | | | |
F-57
32.2.2 Reconciliation of Canadian GAAP to IFRS 2010 Consolidated Statements of Net Earnings and Comprehensive Income
| | | | | | | | | | | | | | | | | | | | | | | | | | | | | | | | | | | | | | | | | | | | | | | | | | | | | | | | | | |
| For the 52-week period ended January 29, 2011 | |
(in CAD millions) | | Ref | | Canadian
GAAP | | | Reclassifications
(j) | | | Canadian
GAAP
Reclassified | | | Property,
Plant
and
Equipment
(a) | | | Joint
Ventures
(b) | | | Leases
(c) | | | Financial
Instruments
(d) | | | Provisions
(e) | | | Employee
Benefits
(f) | | | Intangible
Assets
(g) | | | Loyalty
Program
(h) | | | Income
Taxes
(i) | | | Early adoption of
IAS 19 (Revised),
net of taxes
(f) | | | IFRS | |
Revenue | | | | $ | 4,957.8 | | | $ | 20.1 | | | $ | 4,977.9 | | | $ | — | | | $ | (46.6 | ) | | $ | — | | | $ | — | | | $ | — | | | $ | — | | | $ | — | | | $ | 7.2 | | | $ | — | | | $ | — | | | $ | 4,938.5 | |
Cost of goods and services sold * | | | | | 4,636.1 | | | | (1,676.9 | ) | | | 2,959.2 | | | | — | | | | — | | | | — | | | | — | | | | — | | | | — | | | | — | | | | 38.5 | | | | — | | | | — | | | | 2,997.7 | |
| | | | | | | | | | | | | | | | | | | | | | | | | | | | | | | | | | | | | | | | | | | | | | | | | | | | | | | | | | |
Gross profit | | | | | 321.7 | | | | 1,697.0 | | | | 2,018.7 | | | | — | | | | (46.6 | ) | | | — | | | | — | | | | — | | | | — | | | | — | | | | (31.3 | ) | | | — | | | | — | | | | 1,940.8 | |
| | | | | | | | | | | | | | | | | | | | | | | | | | | | | | | | | | | | | | | | | | | | | | | | | | | | | | | | | | |
Selling, administrative and other expenses * | | | | | — | | | | 1,785.7 | | | | 1,785.7 | | | | 24.6 | | | | (26.2 | ) | | | (0.9 | ) | | | 0.4 | | | | (0.3 | ) | | | 8.4 | | | | — | | | | (33.9 | ) | | | (0.1 | ) | | | (13.2 | ) | | | 1,744.5 | |
Depreciation and amortization expense ** | | | | | 104.6 | | | | (104.6 | ) | | | — | | | | — | | | | — | | | | — | | | | — | | | | — | | | | — | | | | — | | | | — | | | | — | | | | — | | | | 0.0 | |
Finance costs | | | | | 13.5 | | | | 3.8 | | | | 17.3 | | | | — | | | | (2.9 | ) | | | 2.2 | | | | — | | | | — | | | | — | | | | — | | | | — | | | | — | | | | — | | | | 16.6 | |
Interest income | | | | | — | | | | (4.2 | ) | | | (4.2 | ) | | | — | | | | — | | | | — | | | | — | | | | — | | | | — | | | | — | | | | — | | | | — | | | | — | | | | -4.2 | |
Unusual gains ** | | | | | (16.2 | ) | | | 16.2 | | | | — | | | | — | | | | — | | | | — | | | | — | | | | — | | | | — | | | | — | | | | — | | | | — | | | | — | | | | 0.0 | |
Share of income from joint ventures | | | | | — | | | | — | | | | — | | | | — | | | | (3.2 | ) | | | — | | | | — | | | | — | | | | — | | | | — | | | | — | | | | — | | | | — | | | | -3.2 | |
| | | | | | | | | | | | | | | | | | | | | | | | | | | | | | | | | | | | | | | | | | | | | | | | | | | | | | | | | | |
Expenses before income taxes | | | | | 101.9 | | | | 1,696.9 | | | | 1,798.8 | | | | 24.6 | | | | (32.3 | ) | | | 1.3 | | | | 0.4 | | | | (0.3 | ) | | | 8.4 | | | | — | | | | (33.9 | ) | | | (0.1 | ) | | | (13.2 | ) | | | 1,753.7 | |
| | | | | | | | | | | | | | | | | | | | | | | | | | | | | | | | | | | | | | | | | | | | | | | | | | | | | | | | | | |
Earnings before income taxes | | | | | 219.8 | | | | 0.1 | | | | 219.9 | | | | (24.6 | ) | | | (14.3 | ) | | | (1.3 | ) | | | (0.4 | ) | | | 0.3 | | | | (8.4 | ) | | | — | | | | 2.6 | | | | 0.1 | | | | (13.2 | ) | | | 187.1 | |
| | | | | | | | | | | | | | | | | | | | | | | | | | | | | | | | | | | | | | | | | | | | | | | | | | | | | | | | | | |
Income tax expense (recovery) | | | | | | | | | | | | | | | | | | | | | | | | | | | | | | | | | | | | | | | | | | | | | | | | | | | | | | | | | | |
Current | | | | | 75.4 | | | | — | | | | 75.4 | | | | — | | | | — | | | | — | | | | — | | | | — | | | | — | | | | — | | | | — | | | | — | | | | | | | | 75.4 | |
Deferred | | | | | (5.4 | ) | | | 0.1 | | | | (5.3 | ) | | | — | | | | (0.3 | ) | | | — | | | | — | | | | — | | | | — | | | | — | | | | — | | | | (11.1 | ) | | | 3.4 | | | | -13.3 | |
| | | | | | | | | | | | | | | | | | | | | | | | | | | | | | | | | | | | | | | | | | | | | | | | | | | | | | | | | | |
| | | | | 70.0 | | | | 0.1 | | | | 70.1 | | | | — | | | | (0.3 | ) | | | — | | | | — | | | | — | | | | — | | | | — | | | | — | | | | (11.1 | ) | | | 3.4 | | | | 62.1 | |
| | | | | | | | | | | | | | | | | | | | | | | | | | | | | | | | | | | | | | | | | | | | | | | | | | | | | | | | | | |
Net earnings | | | | $ | 149.8 | | | $ | — | | | $ | 149.8 | | | $ | (24.6 | ) | | $ | (14.0 | ) | | $ | (1.3 | ) | | $ | (0.4 | ) | | $ | 0.3 | | | $ | (8.4 | ) | | $ | — | | | $ | 2.6 | | | $ | 11.2 | | | $ | 9.8 | | | $ | 125.0 | |
| | | | | | | | | | | | | | | | | | | | | | | | | | | | | | | | | | | | | | | | | | | | | | | | | | | | | | | | | | |
Other comprehensive loss | | | | | (10.4 | ) | | | — | | | | (10.4 | ) | | | — | | | | — | | | | — | | | | 0.4 | | | | — | | | | — | | | | — | | | | — | | | | — | | | | (62.6 | ) | | | (72.6 | ) |
| | | | | | | | | | | | | | | | | | | | | | | | | | | | | | | | | | | | | | | | | | | | | | | | | | | | | | | | | | |
Comprehensive income | | | | $ | 139.4 | | | $ | — | | | $ | 139.4 | | | $ | (24.6 | ) | | $ | (14.0 | ) | | $ | (1.3 | ) | | $ | — | | | $ | 0.3 | | | $ | (8.4 | ) | | $ | — | | | $ | 2.6 | | | $ | 11.2 | | | $ | (52.8 | ) | | $ | 52.4 | |
| | | | | | | | | | | | | | | | | | | | | | | | | | | | | | | | | | | | | | | | | | | | | | | | | | | | | | | | | | |
| * | Under Canadian GAAP, “Cost of goods and services sold” and “Selling, administrative and other expenses” were reported in total under “Cost of merchandise sold, operating, administrative and selling expenses.” |
| ** | Under IFRS, “Depreciation and amortization expense” and “Unusual gains” are included in “Selling, administrative and other expenses.” |
F-58
32.2.3 Reconciliation of Canadian GAAP to IFRS 2010 equity
| | | | | | | | | | |
| (in CAD millions) | | Ref | | As at
January 29,
2011 | | | As at
January 31,
2010 | |
Total equity under Canadian GAAP | | | | $ | 1,000.5 | | | $ | 1,657.5 | |
Property, plant and equipment | | a | | | 375.8 | | | | 400.4 | |
Investment property | | a | | | 16.6 | | | | 16.6 | |
Joint ventures | | b | | | 264.0 | | | | 278.3 | |
Leases | | c | | | (0.3 | ) | | | 1.0 | |
Provisions | | e | | | (0.6 | ) | | | (0.9 | ) |
Employee benefits | | f | | | 97.4 | | | | 105.8 | |
Intangible assets | | g | | | (33.7 | ) | | | (33.7 | ) |
Loyalty program | | h | | | (17.1 | ) | | | (19.7 | ) |
Early adoption of IAS 19 (Revised), net of taxes | | f | | | (299.0 | ) | | | (246.2 | ) |
| | | | | | | | | | |
Total IFRS adjustments before taxes | | | | | 403.1 | | | | 501.6 | |
| | | | | | | | | | |
Income taxes | | i | | | (143.2 | ) | | | (154.7 | ) |
| | | | | | | | | | |
Total adjustment to equity | | | | | 259.9 | | | | 346.9 | |
| | | | | | | | | | |
Total equity under IFRS | | | | $ | 1,260.4 | | | $ | 2,004.4 | |
| | | | | | | | | | |
32.2.4 Reconciliation of Canadian GAAP to IFRS 2010 comprehensive income
| | | | | | | | |
| (in CAD millions) | | Ref | | | 2010 | |
Net earnings under Canadian GAAP | | | | | | $ | 149.8 | |
Property, plant and equipment | | | a | | | | (24.6 | ) |
Joint ventures | | | b | | | | (14.0 | ) |
Leases | | | c | | | | (1.3 | ) |
Financial instruments | | | d | | | | (0.4 | ) |
Provisions | | | e | | | | 0.3 | |
Employee benefits | | | f | | | | (8.4 | ) |
Intangible assets | | | g | | | | — | |
Loyalty program | | | h | | | | 2.6 | |
Early adoption of IAS 19 (Revised), net of taxes | | | f | | | | 9.8 | |
| | | | | | | | |
Total IFRS adjustments before taxes | | | | | | | (36.0 | ) |
| | | | | | | | |
Income taxes | | | i | | | | 11.2 | |
| | | | | | | | |
Net earnings under IFRS | | | | | | $ | 125.0 | |
| | | | | | | | |
Other comprehensive loss under Canadian GAAP | | | | | | | (10.4 | ) |
| | | | | | | | |
Financial instruments , net of taxes | | | d | | | | 0.4 | |
Early adoption of IAS 19 (Revised) | | | f | | | | (62.6 | ) |
| | | | | | | | |
Total IFRS adjustments before taxes | | | | | | | (62.2 | ) |
| | | | | | | | |
Other comprehensive loss under IFRS | | | | | | $ | (72.6 | ) |
| | | | | | | | |
Comprehensive income under IFRS | | | | | | $ | 52.4 | |
| | | | | | | | |
F-59
32.2.5 Explanation of significant IFRS adjustments to equity and comprehensive income
The following is an explanation of the adjustments disclosed in the reconciliations in Note 32.2.1 to 32.2.4:
| | (a) | Property, plant and equipment and investment property: On transition, the Company elected to measure certain of its land and buildings at fair value, and set the fair value as the deemed cost at that date, in accordance with the IFRS 1 fair value as deemed cost election option. As a result, the cost of the Company’s property, plant and equipment and its investment property increased materially on transition. Due to the increased building cost, subsequent building depreciation also increased. The adjustment made to equity represents the increase to the cost of the land and buildings. The adjustment to net earnings represents the increase in depreciation in the period due to the increased building cost and the impact of componentization. |
Investment property has been recognized at fair value at the date of transition. Under Canadian GAAP, investment property was previously measured on a depreciated cost basis and classified as property, plant and equipment. The adjustment to fair value for property, plant and equipment and investment property was based on third party valuations performed using various valuation methods.
| | (b) | Joint ventures: The Company selected the equity method to account for its joint ventures. As such, the difference between the end of the reporting periods of the joint ventures and that of the Company can be no more than three months. As a result, the Company has advanced the joint venture reporting periods used in applying the equity method of accounting. In addition, on transition, the Company elected to measure its investments in the joint venture land and buildings at fair value and set the fair value as deemed cost at that date in accordance with the IFRS 1 fair value as deemed cost election option. The adjustment to equity is the result of the advancement of the joint venture reporting periods and the increase to the cost of the land and buildings due to the application of the IFRS 1 election. The adjustment to net earnings represents the increased depreciation in the period due to the increase made to the joint venture building cost. |
| | (c) | Leases: There are minor differences in the criteria used to evaluate whether a lease is a finance lease between IAS 17, Leases (“IAS 17”), and the Canadian GAAP equivalent. Under IFRS, minimum lease payments are allocated between land and building components for leases which contain both. Under IFRS, professional judgment is required to assess the facts and circumstances of a lease to determine if the lease transfers substantially all the risks and rewards incidental to ownership of assets, in which case, the lease would be accounted for as a finance lease. As a result of these differences, a number of leases classified as operating leases under Canadian GAAP were reclassified as finance leases under IFRS. In addition, on transition, the Company elected to measure certain of its finance leased assets at fair value and set the fair value as deemed cost at that date in accordance with the IFRS 1 fair value as deemed cost election option. The adjustment to equity results from the reclassification of these leases to finance leases and the IFRS 1 fair value as deemed cost election. The adjustment to net earnings represents the difference between the depreciation and interest expense under IFRS and the rental expense recognized under Canadian GAAP for the leases classified as finance leases under IFRS. |
| | (d) | Financial instruments: The Company holds foreign exchange option contracts. Under Canadian GAAP, these derivatives were fully designated for hedge accounting. Under IAS 39, Financial Instruments: Recognition and Measurement (“IAS 39”), only the intrinsic portion of these contracts can be designated for hedge accounting. As a result, changes in the value of the undesignated component of these derivatives are required to be recognized in the Consolidated Statements of Net (Loss) Earnings and Comprehensive (Loss) Income. The adjustment to retained earnings represents the recognition of the value of the undesignated portion of the outstanding derivatives which were previously recognized in AOCI under Canadian GAAP. The adjustment to retained earnings is therefore offset by the adjustment to AOCI, and the net impact to equity is Nil. The adjustment to net earnings represents the recognition of the change in value of the undesignated portion of the outstanding derivatives in the period. |
F-60
| | (e) | Provisions: IAS 37, Provisions, contingent liabilities and contingent assets (“IAS 37”), requires onerous contracts to be recognized as liabilities. The Company has onerous contracts relating to leased space which are not fully occupied or sub-leased space which generate less rental income than the costs associated with carrying on the lease. The adjustment to equity reduces equity by the outstanding onerous contract liabilities. The adjustment to net earnings represents the impact of new onerous contract liabilities and the amortization of existing onerous contract liabilities recorded on transition. |
| | (f) | Employee benefits: As described in note 2, the Company recast their financial statements for the adoption of the revised standard on employee benefits, IAS 19 Revised. The Company had previously prepared an opening Consolidated Statement of Financial Position in accordance with a previous version of this standard. Following the recasting of the financial statements, the Company determined the incremental transitional entry required to adjust equity for the full retrospective application of this revised standard. This entry included consideration of the previous transitional entry to equity and is presented separately in the reconciliations presented in 32.2.1 through 32.2.4 above as this appropriately highlights the impact on IFRS transition of the recasting. The impact of IAS 19 Revised on the Company is significant since it incorporates the requirement to recognize the full deficit (or surplus) attached to the defined benefits plans of an entity on the Consolidated Statement of Financial Position. This is in contrast to the former standard under which a policy choice was available to defer and amortize certain amounts over an extended future period. In order to understand the impact of transition from Canadian GAAP to IAS 19 Revised, the transitional entries related to each of the employee benefits standards should be considered in aggregate. |
| | (g) | Intangible assets: Under IAS 38, Intangible Assets (“IAS 38”), costs related to internally generated intangible assets may only be capitalized if they meet specific criteria. The adjustments to equity represent the recognition of expenses that had previously been deferred under Canadian GAAP but do not meet the criteria of intangible assets under IFRS. The adjustment to net earnings represents the change in timing of recognition of expenses incurred in the period that were deferred under Canadian GAAP. |
| | (h) | Loyalty program: Under Canadian GAAP, loyalty points granted under the Sears Club program were expensed at issuance. Under IFRIC 13, Customer Loyalty Programs (“IFRIC 13”), the fair value of the consideration received or receivable at the initial sale is allocated between the merchandise sold and the Sears Club points granted. Revenue related to the fair value of the points granted is deferred at the time of the initial sale transaction and is recognized when the points have been redeemed and the Company’s obligations have been fulfilled. The adjustment to equity as well as net earnings reflects the difference between the policy followed under Canadian GAAP and the policy required by IFRIC 13. |
| | (i) | Income taxes: Under Canadian GAAP and IFRS, deferred tax assets and liabilities are recorded for temporary differences, which are the differences between when an amount is recognized for accounting and tax purposes. The adjustment to equity as well as net earnings reflects changes to temporary differences, and thus the deferred tax assets and liabilities, required by adjustments (a) to (h) listed above. |
| | (j) | Reclassifications: The following reclassifications have been made to the Consolidated Statements of Financial Position: |
| | • | | Deferred tax balances recorded in current assets under Canadian GAAP were reclassified to non-current, as deferred taxes are not permitted to be classified as current under IFRS; and |
| | • | | Reimbursements from manufacturers relating to the warranty liability were reclassified from current liabilities to accounts receivable. |
The following reclassifications have been made to the Consolidated Statements of Net Earnings and Comprehensive Income:
| | • | | Revenue offset against “Selling, administrative and other expenses” prior to IFRS were reclassified to “Revenue”; |
F-61
| | • | | “Cost of goods and services sold” were disaggregated from “Selling, administrative and other expenses”; |
| | • | | “Depreciation and amortization expense” were aggregated with “Selling, administrative and other expenses”, as the Company has selected the function classification method; |
| | • | | “Interest income” was separately presented from “Finance costs” under IFRS; and |
| | • | | “Unusual gains and losses,” not permitted under IFRS, have been reclassified to “Selling, administrative and other expenses.” |
32.3 Explanation of significant changes to the consolidated statements of cash flows
Under Canadian GAAP, the cash flows relating to joint ventures were proportionately consolidated into the Company’s Consolidated Statements of Cash Flows. Under IFRS, given the Company is applying the equity method of accounting for joint ventures, adjustments have been made to eliminate the proportionate consolidation of any joint venture cash flows.
| 33. | Approval of consolidated financial statements |
The consolidated financial statements were approved by the Board of Directors and authorized for issue on May 31, 2012.
F-62
TABLE OF CONTENTS
F-63
SEARS CANADA INC.
CONDENSED CONSOLIDATED STATEMENTS OF FINANCIAL POSITION
Unaudited
| | | | | | | | | | | | | | | | | | | | |
(in CAD millions) | | Notes | | | As at
April 28, 2012
(Recast - Note 2.4.1) | | | As at
January 28, 2012
(Recast - Note 2.4.1) | | | As at
April 30, 2011
(Recast - Note 2.4.1) | | | As at
January 29, 2011
(Recast - Note 2.4.1) | |
ASSETS | | | | | | | | | | | | | | | | | | | | |
Current assets | | | | | | | | | | | | | | | | | | | | |
Cash and cash equivalents | | | 5,14,15 | | | $ | 361.6 | | | $ | 397.4 | | | $ | 198.4 | | | $ | 432.3 | |
Accounts receivable, net | | | 14 | | | | 96.2 | | | | 116.2 | | | | 131.1 | | | | 144.0 | |
Income taxes recoverable | | | | | | | 1.5 | | | | 4.1 | | | | 1.2 | | | | 4.5 | |
Inventories | | | 6 | | | | 883.7 | | | | 823.9 | | | | 981.7 | | | | 953.2 | |
Prepaid expenses | | | | | | | 33.3 | | | | 27.9 | | | | 39.4 | | | | 31.8 | |
Assets classified as held for sale | | | 13 | | | | 31.9 | | | | — | | | | — | | | | — | |
| | | | | | | | | | | | | | | | | | | | |
Total current assets | | | | | | | 1,408.2 | | | | 1,369.5 | | | | 1,351.8 | | | | 1,565.8 | |
Non-current assets | | | | | | | | | | | | | | | | | | | | |
Property, plant and equipment | | | | | | | 853.7 | | | | 872.0 | | | | 887.0 | | | | 900.7 | |
Investment property | | | | | | | 21.7 | | | | 21.7 | | | | 21.7 | | | | 21.7 | |
Intangible assets | | | | | | | 22.5 | | | | 23.6 | | | | 23.6 | | | | 23.5 | |
Goodwill | | | | | | | 8.7 | | | | 8.7 | | | | 11.2 | | | | 11.2 | |
Investment in joint ventures | | | | | | | 298.8 | | | | 301.4 | | | | 309.9 | | | | 313.3 | |
Deferred tax assets | | | 2.4.1 | | | | 75.4 | | | | 84.6 | | | | 66.8 | | | | 33.2 | |
Other long-term assets | | | 7,14,17 | | | | 55.6 | | | | 49.2 | | | | 55.5 | | | | 38.1 | |
| | | | | | | | | | | | | | | | | | | | |
Total assets | | | | | | $ | 2,744.6 | | | $ | 2,730.7 | | | $ | 2,727.5 | | | $ | 2,907.5 | |
| | | | | | | | | | | | | | | | | | | | |
LIABILITIES | | | | | | | | | | | | | | | | | | | | |
Current liabilities | | | | | | | | | | | | | | | | | | | | |
Accounts payable and accrued liabilities | | | 14 | | | $ | 577.7 | | | $ | 576.8 | | | $ | 644.8 | | | $ | 665.6 | |
Deferred revenue | | | | | | | 213.7 | | | | 208.0 | | | | 230.2 | | | | 224.0 | |
Provisions | | | | | | | 54.4 | | | | 64.8 | | | | 61.1 | | | | 65.3 | |
Income taxes payable | | | | | | | 10.9 | | | | 1.0 | | | | 3.1 | | | | 1.0 | |
Other taxes payable | | | | | | | 31.5 | | | | 42.8 | | | | 29.5 | | | | 65.3 | |
Derivative financial liabilities | | | 14 | | | | — | | | | — | | | | 17.1 | | | | 3.0 | |
Principal payments on long-term obligations due within one year | | | 7,14 | | | | 4.9 | | | | 5.1 | | | | 5.7 | | | | 4.7 | |
Liabilities classified as held for sale | | | 13,14 | | | | 28.4 | | | | — | | | | — | | | | — | |
| | | | | | | | | | | | | | | | | | | | |
Total current liabilities | | | | | | | 921.5 | | | | 898.5 | | | | 991.5 | | | | 1,028.9 | |
Non-current liabilities | | | | | | | | | | | | | | | | | | | | |
Long-term obligations | | | 7,14 | | | | 23.3 | | | | 117.6 | | | | 27.7 | | | | 124.4 | |
Deferred revenue | | | | | | | 88.5 | | | | 89.2 | | | | 77.0 | | | | 77.4 | |
Retirement benefit liability | | | 2.4.1,10 | | | | 450.0 | | | | 452.3 | | | | 333.1 | | | | 326.2 | |
Deferred tax liabilities | | | 2.4.1 | | | | 5.4 | | | | 5.3 | | | | 5.5 | | | | 5.5 | |
Other long-term liabilities | | | | | | | 73.6 | | | | 75.8 | | | | 91.4 | | | | 84.7 | |
| | | | | | | | | | | | | | | | | | | | |
Total liabilities | | | | | | | 1,562.3 | | | | 1,638.7 | | | | 1,526.2 | | | | 1,647.1 | |
| | | | | | | | | | | | | | | | | | | | |
SHAREHOLDERS’ EQUITY | | | | | | | | | | | | | | | | | | | | |
Capital stock | | | 8 | | | | 15.0 | | | | 15.0 | | | | 15.4 | | | | 15.4 | |
Retained earnings | | | 2.4.1,8 | | | | 1,308.8 | | | | 1,218.5 | | | | 1,262.5 | | | | 1,310.4 | |
Accumulated other comprehensive loss | | | 2.4.1,10 | | | | (141.5 | ) | | | (141.5 | ) | | | (76.6 | ) | | | (65.4 | ) |
| | | | | | | | | | | | | | | | | | | | |
Total shareholders’ equity | | | | | | | 1,182.3 | | | | 1,092.0 | | | | 1,201.3 | | | | 1,260.4 | |
| | | | | | | | | | | | | | | | | | | | |
Total liabilities and shareholders’ equity | | | | | | $ | 2,744.6 | | | $ | 2,730.7 | | | $ | 2,727.5 | | | $ | 2,907.5 | |
| | | | | | | | | | | | | | | | | | | | |
The accompanying notes are an integral part of these consolidated financial statements.
F-64
SEARS CANADA INC.
CONDENSED CONSOLIDATED STATEMENTS OF NET EARNINGS (LOSS)
AND COMPREHENSIVE INCOME (LOSS)
For the 13-week periods ended April 28, 2012 and April 30, 2011
Unaudited
| | | | | | | | | | |
(in CAD millions, except per share amounts) | | Notes | | 2012 | | | 2011
(Recast - Note 2.4.1) | |
Revenue | | 9 | | $ | 915.1 | | | $ | 992.5 | |
Cost of goods and services sold | | 6 | | | 580.4 | | | | 625.4 | |
Selling, administrative and other expenses | | 2.4.1,10,11,14 | | | 393.5 | | | | 418.0 | |
| | | | | | | | | | |
Operating loss | | | | | (58.8 | ) | | | (50.9 | ) |
| | | | | | | | | | |
Gain on lease terminations | | 12 | | | 164.3 | | | | — | |
Finance costs | | 7,17 | | | 4.0 | | | | 6.8 | |
Interest income | | 5 | | | 0.5 | | | | 0.6 | |
Share of income from joint ventures | | | | | 3.5 | | | | 1.9 | |
| | | | | | | | | | |
Earnings (loss) before income taxes | | | | | 105.5 | | | | (55.2 | ) |
| | | | | | | | | | |
Income tax (expense) recovery | | | | | | | | | | |
Current | | 17 | | | (3.1 | ) | | | (21.2 | ) |
Deferred | | 2.4.1,17 | | | (9.3 | ) | | | 29.4 | |
| | | | | | | | | | |
| | | | | (12.4 | ) | | | 8.2 | |
| | | | | | | | | | |
Net earnings (loss) | | | | $ | 93.1 | | | $ | (47.0 | ) |
| | | | | | | | | | |
Basic net earnings (loss) per share | | 16 | | $ | 0.91 | | | $ | (0.45 | ) |
Diluted net earnings (loss) per share | | 16 | | $ | 0.91 | | | $ | (0.45 | ) |
| | | |
Net earnings (loss) | | | | $ | 93.1 | | | $ | (47.0 | ) |
| | | |
Other comprehensive income (loss), net of taxes: | | | | | | | | | | |
Mark-to-market adjustment on cash equivalents | | | | | 0.1 | | | | — | |
Loss on foreign exchange derivatives | | | | | — | | | | (12.2 | ) |
Reclassification to net earnings (loss) of (gain) loss on foreign exchange derivatives | | | | | (0.1 | ) | | | 1.0 | |
| | | | | | | | | | |
Other comprehensive loss | | | | | — | | | | (11.2 | ) |
| | | | | | | | | | |
Comprehensive income (loss) | | | | $ | 93.1 | | | $ | (58.2 | ) |
| | | | | | | | | | |
The accompanying notes are an integral part of these consolidated financial statements.
F-65
SEARS CANADA INC.
CONDENSED CONSOLIDATED STATEMENTS OF CHANGES IN SHAREHOLDERS’ EQUITY
For the 13-week periods ended April 28, 2012 and April 30, 2011
Unaudited
| | | | | | | | | | | | | | | | | | | | | | | | | | | | | | | | |
(in CAD millions) | | Notes | | | Capital
stock | | | Retained
earnings | | | Mark-to-market on
short-term
investments within
cash and cash
equivalents | | | Foreign exchange
derivatives
designated as cash
flow hedges | | | Remeasurement
gains (losses) | | | Accumulated
other
comprehensive
loss | | | Shareholders’
equity | |
(Recast - Note 2.4.1) | | | | | | | | | | | | | | | | | | | | | | | | | | | | | | | | |
Balance as at January 28, 2012 | | | | | | $ | 15.0 | | | $ | 1,218.5 | | | $ | — | | | $ | 0.2 | | | $ | (141.7 | ) | | $ | (141.5 | ) | | $ | 1,092.0 | |
Comprehensive income (loss) | | | | | | | | | | | | | | | | | | | | | | | | | | | | | | | | |
Net earnings | | | | | | | | | | | 93.1 | | | | | | | | | | | | | | | | — | | | | 93.1 | |
Other comprehensive income (loss) | | | | | | | | | | | | | | | | | | | | | | | | | | | | | | | | |
Mark-to-market gain | | | | | | | | | | | | | | | 0.1 | | | | | | | | | | | | 0.1 | | | | 0.1 | |
Reclassification of gain on foreign exchange derivatives | | | | | | | | | | | | | | | | | | | (0.1 | ) | | | | | | | (0.1 | ) | | | (0.1 | ) |
| | | | | | | | | | | | | | | | | | | | | | | | | | | | | | | | |
Total other comprehensive income (loss) | | | | | | | — | | | | — | | | | 0.1 | | | | (0.1 | ) | | | — | | | | — | | | | — | |
| | | | | | | | | | | | | | | | | | | | | | | | | | | | | | | | |
Total comprehensive income (loss) | | | | | | | — | | | | 93.1 | | | | 0.1 | | | | (0.1 | ) | | | — | | | | — | | | | 93.1 | |
| | | | | | | | | | | | | | | | | | | | | | | | | | | | | | | | |
Repurchases of common shares | | | 8 | | | | — | | | | (2.8 | ) | | | | | | | | | | | | | | | — | | | | (2.8 | ) |
| | | | | | | | | | | | | | | | | | | | | | | | | | | | | | | | |
Balance as at April 28, 2012 | | | | | | $ | 15.0 | | | $ | 1,308.8 | | | $ | 0.1 | | | $ | 0.1 | | | $ | (141.7 | ) | | $ | (141.5 | ) | | $ | 1,182.3 | |
| | | | | | | | | | | | | | | | | | | | | | | | | | | | | | | | |
(Recast - Note 2.4.1) | | | | | | | | | | | | | | | | | | | | | | | | | | | | | | | | |
Balance as at January 29, 2011 | | | | | | $ | 15.4 | | | $ | 1,310.4 | | | $ | — | | | $ | (2.8 | ) | | $ | (62.6 | ) | | $ | (65.4 | ) | | $ | 1,260.4 | |
Comprehensive loss | | | | | | | | | | | | | | | | | | | | | | | | | | | | | | | | |
Net loss | | | | | | | | | | | (47.0 | ) | | | | | | | | | | | | | | | — | | | | (47.0 | ) |
Other comprehensive (loss) income | | | | | | | | | | | | | | | | | | | | | | | | | | | | | | | | |
Loss on foreign exchange derivatives | | | | | | | | | | | | | | | | | | | (12.2 | ) | | | | | | | (12.2 | ) | | | (12.2 | ) |
Reclassification of loss on foreign exchange derivatives | | | | | | | | | | | | | | | | | | | 1.0 | | | | | | | | 1.0 | | | | 1.0 | |
| | | | | | | | | | | | | | | | | | | | | | | | | | | | | | | | |
Total other comprehensive loss | | | | | | | — | | | | — | | | | — | | | | (11.2 | ) | | | — | | | | (11.2 | ) | | | (11.2 | ) |
| | | | | | | | | | | | | | | | | | | | | | | | | | | | | | | | |
Total comprehensive loss | | | | | | | — | | | | (47.0 | ) | | | — | | | | (11.2 | ) | | | — | | | | (11.2 | ) | | | (58.2 | ) |
| | | | | | | | | | | | | | | | | | | | | | | | | | | | | | | | |
Repurchases of common shares | | | 8 | | | | — | | | | (0.9 | ) | | | | | | | | | | | | | | | — | | | | (0.9 | ) |
| | | | | | | | | | | | | | | | | | | | | | | | | | | | | | | | |
Balance as at April 30, 2011 | | | | | | $ | 15.4 | | | $ | 1,262.5 | | | $ | — | | | $ | (14.0 | ) | | $ | (62.6 | ) | | $ | (76.6 | ) | | $ | 1,201.3 | |
| | | | | | | | | | | | | | | | | | | | | | | | | | | | | | | | |
The accompanying notes are an integral part of these consolidated financial statements.
F-66
SEARS CANADA INC.
CONDENSED CONSOLIDATED STATEMENTS OF CASH FLOWS
For the 13-week periods ended April 28, 2012 and April 30, 2011
Unaudited
| | | | | | | | | | |
(in CAD millions) | | Notes | | 2012 | | | 2011
(Recast - Note 2.4.1) | |
Cash flow used for operating activities | | | | | | | | | | |
Net earnings (loss) | | | | $ | 93.1 | | | $ | (47.0 | ) |
Adjustments for: | | | | | | | | | | |
Depreciation and amortization expense | | 11 | | | 28.7 | | | | 28.6 | |
Gain on disposal of property, plant and equipment | | | | | (0.3 | ) | | | (0.2 | ) |
Gain on lease terminations | | 12 | | | (164.3 | ) | | | — | |
Finance costs | | 7 | | | 4.0 | | | | 6.8 | |
Interest income | | 5 | | | (0.5 | ) | | | (0.6 | ) |
Share of income from joint ventures | | | | | (3.5 | ) | | | (1.9 | ) |
Retirement benefit plans expense | | 10 | | | 7.8 | | | | 7.7 | |
Short-term disability expense | | 10 | | | 2.5 | | | | 2.4 | |
Income tax (expense) recovery | | 17 | | | 12.4 | | | | (8.2 | ) |
Interest received | | 5 | | | 0.5 | | | | 0.7 | |
Interest paid | | 7 | | | (1.5 | ) | | | — | |
Retirement benefit plans contributions | | 10 | | | (12.4 | ) | | | (2.7 | ) |
Income tax refunds (payments), net | | 17 | | | 7.8 | | | | (19.7 | ) |
Changes in non-cash working capital | | | | | (65.6 | ) | | | (71.1 | ) |
Changes in long-term assets and liabilities | | | | | (2.0 | ) | | | (7.7 | ) |
| | | | | | | | | | |
| | | | | (93.3 | ) | | | (112.9 | ) |
| | | | | | | | | | |
Cash flow generated from (used for) investing activities | | | | | | | | | | |
Purchases of property, plant and equipment and intangible assets | | | | | (13.2 | ) | | | (16.3 | ) |
Proceeds from sale of property, plant and equipment | | | | | 0.5 | | | | 0.3 | |
Proceeds from lease terminations | | 12 | | | 170.0 | | | | — | |
Dividends received from joint ventures | | | | | 6.3 | | | | 6.7 | |
| | | | | | | | | | |
| | | | | 163.6 | | | | (9.3 | ) |
| | | | | | | | | | |
Cash flow used for financing activities | | | | | | | | | | |
Interest paid on finance lease obligations | | 7 | | | (0.5 | ) | | | (0.6 | ) |
Repayment of long-term obligations | | | | | (134.2 | ) | | | (110.8 | ) |
Proceeds from long-term obligations | | | | | 31.7 | | | | 1.9 | |
Repurchases of common shares | | 8 | | | (2.9 | ) | | | (0.9 | ) |
| | | | | | | | | | |
| | | | | (105.9 | ) | | | (110.4 | ) |
| | | | | | | | | | |
Decrease in cash and cash equivalents | | | | $ | (35.6 | ) | | $ | (232.6 | ) |
| | | | | | | | | | |
Effect of exchange rate on cash and cash equivalents at end of period | | | | | (0.2 | ) | | | (1.3 | ) |
| | | | | | | | | | |
Cash and cash equivalents at beginning of period | | | | $ | 397.4 | | | $ | 432.3 | |
Cash and cash equivalents at end of period | | | | $ | 361.6 | | | $ | 198.4 | |
| | | | | | | | | | |
The accompanying notes are an integral part of these consolidated financial statements.
F-67
NOTES TO THE UNAUDITED CONDENSED CONSOLIDATED FINANCIAL STATEMENTS
1. General information
Sears Canada Inc. is incorporated in Canada. The address of its registered office and principal place of business is 290 Yonge Street, Suite 700, Toronto, Ontario, Canada M5B 2C3. The principal activities of Sears Canada Inc. and its subsidiaries (the “Company”) include the sale of goods and services through the Company’s Retail channel, which includes its Full-line, Sears Home, Hometown Dealer, Outlet, Appliances and Mattresses, Corbeil Electrique Inc. (“Corbeil”) stores, and its Direct (catalogue/internet) channel. It also includes service revenue related to product repair, home improvement, Cantrex Group Inc. (“Cantrex”) and logistics. Commission revenues include travel, insurance, and performance payments received from JPMorgan Chase under the Company’s long-term credit card marketing and servicing alliance with JPMorgan Chase. The Company has partnered with Thomas Cook Canada Inc. (“Thomas Cook”) in a multi-year licensing arrangement, under which Thomas Cook manages the day-to-day operations of all Sears Travel offices. Licensee fee revenues are comprised of payments received from licensees that operate within the Company’s stores. The Company is a party to a number of joint ventures which have been classified as jointly controlled entities for financial reporting purposes. These joint ventures are jointly controlled by the venturers who are entitled to a share of the joint ventures’ income or loss.
The indirect parent of the Company is Sears Holdings Corporation (“Sears Holdings”), incorporated in the U.S. in the State of Delaware. The ultimate controlling party of the Company is ESL Investments, Inc. (incorporated in the U.S. in the State of Delaware) through Sears Holdings.
2. Significant accounting policies
2.1 Statement of compliance
The unaudited condensed consolidated financial statements of the Company for the 13-week period ended April 28, 2012 (the “Financial Statements”) have been prepared in accordance with IAS 34, Interim Financial Reporting (“IAS 34”), and therefore, do not contain all disclosures required by International Financial Report Standards (“IFRS”) for annual financial statements. Accordingly, these Financial Statements should be read in conjunction with the Company’s most recently prepared recast annual consolidated financial statements for the 52-week period ended January 28, 2012 (the “2011 Consolidated Annual Financial Statements”), prepared in accordance with the standards and interpretations issued by the International Accounting Standards Board (“IASB”). These include IFRS, International Accounting Standards (“IAS”) and the interpretations of the International Financial Reporting Interpretations Committee (“IFRIC”) and the Standing Interpretations Committee (“SIC”), which were effective and applicable to the Company as at the end of fiscal 2011.
2.2 Basis of preparation and presentation
The principal accounting policies of the Company have been applied consistently in the preparation of these Financial Statements for all periods presented. These Financial Statements follow the same accounting policies and methods of application as those used in the preparation of the recast 2011 Annual Financial Statements. The Company’s significant accounting policies are described in Note 2 of the recast 2011 Annual Consolidated Financial Statements.
The Company’s Financial Statements incorporate the financial statements of the Company as well as all of its subsidiaries. Real estate joint venture investments are accounted for using the equity method of accounting (described in Note 2.13 of the 2011 Annual Consolidated Financial Statements). Subsidiaries include all entities where the Company has the power to govern the financial and operating policies of the entity so as to obtain benefits from its activities. All intercompany balances and transactions, and any unrealized income and expenses arising from intercompany transactions, are eliminated in the preparation of these Financial Statements.
F-68
The fiscal year of the Company consists of a 52 or 53-week period ending on the Saturday closest to January 31. The 13-week periods presented in these Financial Statements reflect the first quarter of fiscal 2012 ending April 28, 2012 and the first quarter of fiscal 2011 ending April 30, 2011.
The Company has made certain minor revisions to the presentation of the Consolidated Statements of Net Earnings (Loss) and Comprehensive Income (Loss) to provide a more informative presentation to users.
The Company’s Financial Statements are presented in Canadian dollars, which is the Company’s functional currency.
2.3 Seasonality
The Company’s operations are seasonal in nature. Accordingly, merchandise and service revenues, as well as performance payments received from JPMorgan Chase & Co, N.A. (Toronto Branch) (“JP Morgan Chase”) under the long-term credit card marketing and servicing alliance, will vary by quarter based on consumer spending behaviour. Historically, the Company’s revenues and earnings are highest in the fourth quarter due to the holiday season. The Company is able to adjust certain variable costs in response to seasonal revenue patterns; however, costs such as occupancy are fixed, causing the Company to report a disproportionate level of earnings in the fourth quarter. This business seasonality results in quarterly performance that is not necessarily indicative of the year’s performance.
2.4 Changes in accounting policies
2.4.1 IAS 19 (Revised), Employee Benefits (“IAS 19”)
The Company has elected to early adopt IAS 19 (Revised). On June 16, 2011, the IASB issued amendments to IAS 19 which included the elimination of the “corridor approach,” which is the option to defer and amortize the recognition of actuarial gains and losses. The significant amendments to IAS 19 are as follows:
| | • | | The “corridor approach” is to be replaced with full and immediate recognition of actuarial gain and loss remeasurements in “Other comprehensive (loss) income” (“OCI”); |
| | • | | Retirement benefit costs are to consist of service costs, net interest and remeasurements, with remeasurements being recorded in OCI; |
| | • | | Past service costs are to be recognized immediately in the Consolidated Statements of Net Earnings (Loss); |
| | • | | Expected returns on plan assets will no longer be recognized in profit or loss. Instead, interest income on plan assets, calculated using the discount rate used to measure the pension obligation, will be recognized in the Consolidated Statements of Net Earnings (Loss), |
| | • | | Plan administration costs are to be expensed as incurred; and |
| | • | | Disclosures relating to retirement benefit plans will be enhanced and will include discussions on risk associated with each plan, an explanation of items recognized in the consolidated financial statements and descriptions of the amount, timing and uncertainty on the Company’s future cash flows. |
The amendments to IAS 19 are effective for annual periods beginning on or after January 1, 2013 with early adoption permitted.
The amendments are required to be applied retrospectively in accordance with IAS 8, Accounting Policies, Changes in Accounting Estimates and Errors. In connection with the partial spin-off announced by Sears Holdings Corporation in Q2 2012, the Company was required to file Form 20-F for foreign private issuers with the United States Securities Exchange Commission (“SEC”). As the Company adopted the amendments to IAS 19 in Q1 2012, the Company was required to retrospectively recast the adoption to its annual Consolidated
F-69
Financial Statements within the Form 20-F with the effect of recasting extended to the transition date of January 31, 2010. Refer to Note 32 of the recast 2011 Annual Consolidated Financial Statements. The Company has recast the assets and liabilities as at January 28, 2012, January 29, 2011 and January 31, 2010 and the income, expenses and cash flow for the 52-week periods ended January 28, 2012 and January 29, 2011. The impact to the opening Consolidated Statement of Financial Position as at January 31, 2010, and to the income, expenses and cash flow for the 52-week period ended January 29, 2011, is discussed in Note 2.26 of the recast 2011 Annual Consolidated Financial Statements.
Recast of financial statement captions
A summary of the impact arising from the application of the change in accounting policy is as follows:
Consolidated Statements of Financial Position
| | | | | | | | | | | | |
(Increase (decrease) in CAD millions) | | As at
January 28, 2012
(Recast) | | | As at
April 30, 2011
(Recast) | | | As at
January 29, 2011
(Recast) | |
Retirement benefit asset | | $ | (187.7 | ) | | $ | (193.1 | ) | | $ | (197.4 | ) |
Retirement benefit liability | | | 308.2 | | | | 206.2 | | | | 205.3 | |
Net change to retirement benefit asset and liability | | | (495.9 | ) | | | (399.3 | ) | | | (402.7 | ) |
Deferred tax assets | | | 84.0 | | | | 66.1 | | | | 32.7 | |
Deferred tax liabilities | | | (43.6 | ) | | | (36.7 | ) | | | (71.0 | ) |
Net change to deferred tax assets and liabilities | | | 127.6 | | | | 102.8 | | | | 103.7 | |
Accumulated other comprehensive loss | | | (141.7 | ) | | | (62.6 | ) | | | (62.6 | ) |
Retained earnings | | | (226.6 | ) | | | (233.9 | ) | | | (236.4 | ) |
Consolidated Statements of Net Earnings (Loss) and Comprehensive Income (Loss)
| | | | | | | | | | | | |
(Increase (decrease) in CAD millions, except per share
amounts) | | 13-Week
Period Ended
April 28, 2012 | | | 13-Week
Period Ended
April 30, 2011 | | | 52-Week
Period Ended
January 28, 2012 | |
Selling, administrative and other expenses | | $ | (6.1 | ) | | $ | (3.3 | ) | | $ | (13.2 | ) |
Earnings before income taxes | | | 6.1 | | | | 3.3 | | | | 13.2 | |
Deferred income tax expense | | | 1.6 | | | | 0.8 | | | | 3.4 | |
Net earnings | | | 4.5 | | | | 2.5 | | | | 9.8 | |
Basic net earnings per share | | $ | 0.04 | | | $ | 0.02 | | | $ | 0.09 | |
Diluted net earnings per share | | $ | 0.04 | | | $ | 0.02 | | | $ | 0.09 | |
Other comprehensive loss | | | — | | | | — | | | | (79.1 | ) |
Comprehensive income (loss) | | | 4.5 | | | | 2.5 | | | | (69.3 | ) |
Consolidated Statements of Cash Flows
| | | | | | | | | | | | |
(Increase (decrease) in CAD millions) | | 13-Week
Period Ended
April 28, 2012 | | | 13-Week
Period Ended
April 30, 2011 | | | 52-Week
Period Ended
January 28, 2012 | |
Net earnings | | $ | 4.5 | | | $ | 2.5 | | | $ | 9.8 | |
Retirement benefit plans expense | | | (6.1 | ) | | | (3.3 | ) | | | (13.2 | ) |
Income tax expense | | | 1.6 | | | | 0.8 | | | | 3.4 | |
Please refer to Note 10 for fully recast prior year annual comparative figures.
2.4.2 IFRS 7, Financial Instruments: Disclosures (“IFRS 7”)
The IASB first amended IFRS 7 on October 7, 2010, to require additional disclosures regarding transfers of financial assets. These amendments are effective for annual periods beginning on or after July 1, 2011. The
F-70
Company has adopted these amendments beginning January 29, 2012. These amendments do not impact the Company’s disclosures for the 13-week period ended April 28, 2012.
3. Issued standards not yet adopted
The Company monitors the standard setting process for new standards issued by the IASB that the Company may be required to adopt in the future. Since the impact of a proposed standard may change during the review period, the Company does not comment publicly until the standard has been finalized and the effects have been determined.
On December 16, 2011, the IASB issued amendments to three previously released standards. They are as follows:
IAS 32, Financial Instruments: Presentation (“IAS 32”)
The IASB amended IAS 32 to address inconsistencies in current practice in the application of offsetting criteria. The amendments provide clarification with respect to the meaning of ‘currently has a legally enforceable right of set-off’ and that some gross settlement systems may be considered equivalent to net settlement. These amendments are effective for annual periods beginning on or after January 1, 2014. The Company is currently assessing the impact of these amendments on the Company’s consolidated financial statements and related note disclosures.
IFRS 7, Financial Instruments: Disclosures
On December 16, 2011, the IASB approved additional amendments to IFRS 7, which establishes disclosure requirements to help users better assess the effect or potential effect of offsetting arrangements on a company’s financial position. These amendments are effective for annual periods beginning on or after January 1, 2013. The Company will apply these amendments beginning the first quarter of its 2013 fiscal year and is currently assessing the impact on the Company’s disclosures.
IFRS 9, Financial Instruments (“IFRS 9”)
The IASB issued IFRS 9 on November 12, 2009, which will ultimately replace IAS 39, Financial Instruments: Recognition and Measurement (“IAS 39”). The replacement of IAS 39 is a three-phase project with the objective of improving and simplifying the reporting for financial instruments.
The first phase of the project provides guidance on the classification and measurement of financial assets. IFRS 9 was subsequently reissued on October 28, 2010, incorporating new requirements on accounting for financial liabilities. On December 16, 2011, the IASB amended the mandatory effective date of IFRS 9 to fiscal years beginning on or after January 1, 2015. The amendment also provides relief from the requirement to recast comparative financial statements for the effect of applying IFRS 9. The Company is monitoring the impact of amendments to this standard and initial application of this IFRS is expected to impact the classification of a number of financial assets which will require disclosure in the financial statement notes.
On June 16, 2011, the IASB amended IAS 1 to require additional disclosures for items presented in OCI on a before-tax basis and requires items to be grouped and presented in OCI based on whether they are potentially reclassifiable to earnings or loss subsequently (i.e. items that may be reclassified and those that will not be reclassified to earnings or loss). These amendments are effective for annual periods beginning on or after July 1, 2012 and require full retrospective application. The Company will apply these amendments beginning the first quarter of its 2013 fiscal year and is currently assessing the impact to its consolidated financial statements.
On May 12, 2011, the IASB issued four new standards, all of which are applicable to Annual Reporting periods beginning on or after January 1, 2013. The Company is currently assessing the impact of these standards on its
F-71
consolidated financial statements and related note disclosures. The following is a list and description of these standards:
IFRS 10, Consolidated Financial Statements (“IFRS 10”)
IFRS 10 establishes the standards for the presentation and preparation of consolidated financial statements when an entity controls one or more entities;
IFRS 11, Joint Arrangements (“IFRS 11”)
IFRS 11 replaces IAS 31, Interests in Joint Ventures (“IAS 31”) and requires that a party in a joint arrangement assess its rights and obligations to determine the type of joint arrangement and account for those rights and obligations accordingly;
IFRS 12, Disclosure of Involvement with Other Entities (“IFRS 12”)
IFRS 12, along with IFRS 11 described above, replaces IAS 31. IFRS 12 requires the disclosure of information that enables users of financial statements to evaluate the nature of and the risks associated with, the entity’s interests in joint ventures and the impact of those interests on its financial position, financial performance and cash flow; and
IFRS 13, Fair Value Measurement (“IFRS 13”)
IFRS 13 provides guidance to improve consistency and comparability in fair value measurements and related disclosures through a ‘fair value hierarchy’. This standard applies when another IFRS requires or permits fair value measurements or disclosures. IFRS 13 does not apply for share-based payment transactions, leasing transactions and measurements that are similar to, but are not fair value.
4. Critical accounting judgments and key sources of estimation uncertainty
In the application of the Company’s accounting policies, management is required to make judgments, estimates and assumptions about the carrying amounts of assets and liabilities that are not readily apparent from other sources. The estimates and underlying assumptions are based on historical experience and other factors that are considered to be relevant. Actual results may differ from these estimates. The estimates and underlying assumptions are reviewed on an ongoing basis. Revisions to accounting estimates are recognized in the period in which the estimate is revised, if the revision affects only that period, or in the period of the revision and future periods, if the revision affects both current and future periods.
Critical judgments that management has made in the process of applying the Company’s accounting policies, key assumptions concerning the future and other key sources of estimation uncertainty that have the potential to materially impact the carrying amounts of assets and liabilities within the next financial year are described in Note 4 of the 2011 Annual Consolidated Financial Statements. The critical accounting judgments and key sources of estimation uncertainty used in the preparation of these Financial Statements are consistent with those as described in Note 4 of the 2011 Annual Consolidated Financial Statements.
F-72
5. Cash and cash equivalents and interest income
Cash and cash equivalents
The components of cash and cash equivalents were as follows:
| | | | | | | | | | | | | | | | |
(in CAD millions) | | As at
April 28, 2012 | | | As at
January 28, 2012 | | | As at
April 30, 2011 | | | As at
January 29, 2011 | |
Cash | | $ | 70.0 | | | $ | 49.0 | | | $ | 64.8 | | | $ | 46.3 | |
Cash equivalents | | | | | | | | | | | | | | | | |
Government treasury bills | | | 239.9 | | | | 199.9 | | | | 60.0 | | | | 323.8 | |
Bank term deposits | | | 25.0 | | | | 121.0 | | | | 27.6 | | | | 26.9 | |
Investment accounts | | | 20.3 | | | | 20.3 | | | | 20.0 | | | | 20.0 | |
Restricted cash and cash equivalents | | | 6.4 | | | | 7.2 | | | | 26.0 | | | | 15.3 | |
| | | | | | | | | | | | | | | | |
Total cash and cash equivalents | | $ | 361.6 | | | $ | 397.4 | | | $ | 198.4 | | | $ | 432.3 | |
| | | | | | | | | | | | | | | | |
The components of restricted cash and cash equivalents are further discussed in Note 15.
Interest income
Interest income related primarily to cash and cash equivalents for the 13-week period ended April 28, 2012 totaled $0.5 million (2011: $0.6 million). For the same 13-week period, the Company received $0.5 million (2011: $0.7 million) in cash related to interest income.
6. Inventories
The amount of inventories recognized as an expense during the 13-week period ended April 28, 2012 was $527.4 million (2011: $566.8 million), including $22.6 million (2011: $27.7 million) related to write-downs. These expenses are included in “Cost of goods and services sold” in the unaudited Condensed Consolidated Statements of Net Earnings (Loss) and Comprehensive Income (Loss). There were no reversals of prior period inventory write-downs during the 13-week period ended April 28, 2012 (2011: Nil).
Inventory is pledged as collateral under the Company’s revolving credit facility.
7. Long-term obligations and finance costs
Long-term obligations
Total outstanding long-term obligations were as follows:
| | | | | | | | | | | | | | | | |
(in CAD millions) | | As at
April 28, 2012 | | | As at
January 28, 2012 | | | As at
April 30, 2011 | | | As at
January 29, 2011 | |
Finance lease obligations – Current | | $ | 4.9 | | | $ | 5.1 | | | $ | 5.7 | | | $ | 4.7 | |
| | | | | | | | | | | | | | | | |
Total principal payments on long-term obligations due within one year | | $ | 4.9 | | | $ | 5.1 | | | $ | 5.7 | | | $ | 4.7 | |
Secured revolving credit facility, net | | $ | — | | | $ | 93.1 | | | $ | — | | | $ | 97.4 | |
Finance lease obligations – Non-current | | | 23.3 | | | | 24.5 | | | | 27.7 | | | | 27.0 | |
| | | | | | | | | | | | | | | | |
Total long-term obligations | | $ | 23.3 | | | $ | 117.6 | | | $ | 27.7 | | | $ | 124.4 | |
| | | | | | | | | | | | | | | | |
The Company’s debt consists of a secured credit facility and finance lease obligations. In September 2010, the Company entered into an $800.0 million senior secured revolving credit facility (the “Credit Facility”) with a syndicate of lenders with a maturity date of September 10, 2015. The Credit Facility is secured with a first lien on inventory and credit card receivables. Availability under the Credit Facility is determined pursuant to a
F-73
borrowing base formula. Availability under the Credit Facility was $580.9 million as at April 28, 2012 (January 28, 2012: $415.1 million, April 30, 2011: $741.8 million, January 29, 2011: $510.6 million). This availability may be reduced by additional reserves in the borrowing base formula which may be applied by the lenders pursuant to the terms of the Credit Facility. The Credit Facility contains covenants which are customary for facilities of this nature and the Company was in compliance with all covenants as at April 28, 2012.
As at April 28, 2012, the Company had no borrowings on the Credit Facility and had unamortized transaction costs incurred to establish the Credit Facility of $7.7 million included in “Other long-term assets” in the unaudited Condensed Consolidated Statements of Financial Position (January 28, 2012: borrowings of $93.1 million, net of unamortized transaction costs of $8.0 million, included in “Long-term obligations”, April 30, 2011: no borrowings and unamortized transaction costs of $9.7 million, included in “Other long-term assets”, January 29, 2011: borrowings of $97.4 million, net of unamortized transaction costs of $10.1 million, included in “Long-term obligations”). In addition, the Company had $6.7 million (January 28, 2012: $6.3 million, April 30, 2011: $6.3 million, January 29, 2011: $6.7 million) of standby letters of credit outstanding against the Credit Facility. Interest on drawings under the Credit Facility is determined based on bankers’ acceptance rates for one to three month terms or the prime rate plus a spread. Interest amounts on the Credit Facility are due monthly and are added to principal amounts outstanding.
As at April 28, 2012, the Company had outstanding merchandise letters of credit of U.S. $6.2 million (January 28, 2012: U.S. $5.5 million, April 30, 2011: U.S. $6.1 million, January 29, 2011: U.S. $6.6 million) used to support the Company’s offshore merchandise purchasing program with restricted cash and cash equivalents pledged as collateral.
Finance costs
Interest expense on long-term obligations, including finance lease obligations, the current portion of long-term obligations, amortization of transaction costs and commitment fees on the unused portion of the Credit Facility for the 13-week period ended April 28, 2012 totaled $2.4 million (2011: $2.8 million). Interest expense is included in “Finance costs” in the unaudited Condensed Consolidated Statements of Net Earnings (Loss) and Comprehensive Income (Loss). Also included in “Finance costs” for the 13-weeks ended April 28, 2012 was $1.6 million (2011: $4.0 million) of interest on accruals for uncertain tax positions.
The Company’s cash payments for interest on long-term obligations, including finance lease obligations, the current portion of long-term obligations and commitment fees on the unused portion of the Credit Facility for 13-week period ended April 28, 2012 totaled $2.0 million (2011: $0.6 million).
8. Capital stock
On May 18, 2010, the Company filed a Normal Course Issuer Bid with the Toronto Stock Exchange (“TSX”) that permitted the Company to purchase for cancellation up to 5% of its issued and outstanding common shares (“2010 NCIB”). Under the 2010 NCIB, purchases were allowed to commence on May 25, 2010 and terminated on May 24, 2011. On May 24, 2011, the Company renewed the Normal Course Issuer Bid with the TSX for the period of May 25, 2011 to May 24, 2012 (“2011 NCIB”). Pursuant to the 2011 NCIB, the Company is permitted to purchase for cancellation up to 5% of its issued and outstanding common shares, equivalent to 5,268,599 common shares based on the common shares issued and outstanding as at May 9, 2011. The Company may not purchase common shares under the 2011 NCIB if such shares cannot be purchased at prices that the Company considers attractive. Decisions regarding the timing of purchases are based on market conditions and other factors.
During the 13-week period ended April 28, 2012, 235,763 shares were purchased for $2.9 million (2011: 45,100 shares were purchased for $0.9 million) and cancelled. The impact of the share repurchases for the 13-week period was a decrease to “Capital stock” of less than $0.1 million (2011: less than $0.1 million) and a decrease to
F-74
“Retained earnings” of $2.8 million (2011: $0.9 million). As at April 28, 2012, a total of 5,109,063 shares had been purchased for $87.9 million and cancelled under the 2010 and 2011 NCIB resulting in a total decrease to date of $0.7 million in “Capital stock” and $87.2 million in “Retained earnings.”
As at the end of April 28, 2012, 102,512,532 common shares (January 28, 2012: 102,748,295, April 30, 2011: 105,371,995, January 29, 2011: 105,417,095) were issued and outstanding. Sears Holdings, the controlling shareholder of the Company, is the beneficial holder of 97,341,670, or 95.0%, of the common shares of the Company as at April 28, 2012 (January 28, 2012: 97,341,670, or 94.7%, April 30, 2011: 97,341,670, or 92.4%, January 29, 2011: 97,341,670, or 92.3%). The issued and outstanding shares are fully paid and have no par value.
9. Revenue
The components of the Company’s revenue were as follows:
| | | | | | | | |
(in CAD millions) | | 13-Week
Period Ended
April 28, 2012 | | | 13-Week
Period Ended
April 30, 2011 | |
Sale of goods | | $ | 797.9 | | | $ | 873.8 | |
Service revenue | | | 80.5 | | | | 79.3 | |
Commission revenue | | | 25.7 | | | | 27.9 | |
Licensee fee revenue | | | 7.3 | | | | 7.6 | |
Other | | | 3.7 | | | | 3.9 | |
| | | | | | | | |
Total revenue | | $ | 915.1 | | | $ | 992.5 | |
| | | | | | | | |
10. Retirement benefit plans
The Company currently maintains a defined benefit registered pension plan and a defined contribution registered pension plan (“Registered Retirement Plans”) which covers eligible, regular full-time employees as well as some of its part-time employees. The defined benefit plan provides pensions based on length of service and final average earnings. In addition to a registered retirement savings plan, the pension plan includes a non-registered supplemental arrangement in respect to the defined benefit plan (“Non-Registered Pension Plan”). The non-registered portion of the plan is maintained to enable certain employees to continue saving for retirement in addition to the registered limit as prescribed by the Canada Revenue Agency. The Company also maintains a defined benefit non-pension post retirement plan which provides life insurance, medical and dental benefits to eligible retired employees through a health and welfare trust (“Other Benefits Plan”).
The Company has elected to early adopt the amendments to IAS 19 beginning January 29, 2012, with retrospective application to prior reporting periods. A description of the nature of the change in accounting policy and a summary of its impact on the Company’s condensed consolidated financial statements are included in Note 2.4.1. This note contains significant disclosures for the 52-week period ended January 28, 2012 which have been recast as a result of the early adoption of IAS 19.
Risks associated with retirement benefit plans
There is no assurance that the Company’s retirement benefit plans will be able to earn the assumed rate of return. New regulations and market driven changes may result in changes in the discount rates and other variables which would result in the Company being required to make contributions in the future that differ significantly from the estimates. Management is required to use assumptions to account for the plans in conformity with IFRS. However, actual future experience will differ from these assumptions giving rise to actuarial gains or losses. In any year, actual experience differing from the assumptions may be material.
F-75
Plan assets consist primarily of cash, alternative investments, marketable equity and fixed income securities. The value of the marketable equity and fixed income investments will fluctuate due to changes in market prices. Plan obligations and annual pension expense are determined by independent actuaries and through the use of a number of assumptions. Although the Company believes that the assumptions used in the actuarial valuation process are reasonable, there remains a degree of risk and uncertainty which may cause results to differ materially from expectations. Significant assumptions in measuring the benefit obligations and pension plan costs include the discount rate and the rate of compensation increase.
Asset-liability matching strategies
Beginning in fiscal 2011, the Company adopted an asset-liability matching strategy in the Other Benefits Plan wherein assets are invested in accordance with a short-term fixed income mandate, primarily bonds with maturities not exceeding four years. This investment strategy is aligned with the expected use of the assets, which is to fund the Company’s retiree health benefits and short-term disability payments within the next four to five years.
Plan amendments, curtailments and settlements
There were no significant plan amendments, curtailments or settlements during the 52-week period ended January 28, 2012 and the 13-week period ended April 28, 2012.
Sensitivity of significant actuarial assumptions
Beginning in fiscal 2011, the following table summarizes the sensitivity of significant actuarial assumptions on the Company’s defined benefit obligation:
| | | | | | | | | | | | |
| | | 52-Week
Period Ended
January 28, 2012
(Recast - Note 2.4.1) | |
(in CAD millions) | | Registered
Retirement
Plans | | | Non-
Registered
Pension
Plan | | | Other
Benefits
Plan | |
1% increase in discount rate | | $ | (150.2 | ) | | $ | (5.0 | ) | | $ | (31.0 | ) |
1% decrease in discount rate | | | 187.7 | | | | 6.0 | | | | 37.0 | |
0.5% decrease in compensation increase rate | | | (19.4 | ) | | | (0.6 | ) | | | n/a | |
The methods and assumptions used in determining the above sensitivity are consistent with the methods and assumptions used in the 2011 Annual Consolidated Financial Statements.
Maturity profile of retirement benefit plan obligations
The weighted average durations of the Registered Retirement Plans, Non-Registered Pension Plan and Other Benefit Plan are approximately 11, 10 and 11.5 years, respectively.
The Company’s contractual cash flow maturity relating to retirement benefit plan obligation payments is included under “Liquidity Risk” in Note 14.
Retirement benefit plans expense and contributions
The expense for the defined benefit, defined contribution and other benefit plans for the 13-week period ended April 28, 2012 was $2.5 million (2011: $2.0 million), $2.3 million (2011: $2.6 million) and $3.0 million (2011: $3.1 million), respectively. Not included in total retirement benefit plans expense for the 13-week period are
F-76
short-term disability payments of $2.5 million (2011: $2.4 million) that were paid from the other benefit plan. These expenses are included in “Selling, administrative and other expenses” in the Condensed Consolidated Statements of Net Earnings (Loss) and Comprehensive Income (Loss).
Total payments relating to cash contributed by the Company to its defined benefit, defined contribution and other benefit plans for the 13-week period ended April 28, 2012 were $12.4 million (2011: $2.7 million).
Recast of prior year comparatives
The following annual disclosures have been recast to comply with the amendments of IAS 19.
i) Retirement benefit asset and liability
| | | | | | | | | | | | | | | | |
| | | 52-Week
Period Ended
January 28, 2012
(Recast - Note 2.4.1) | |
(in CAD millions) | | Registered
Retiremen
Plans | | | Non -
Registered
Pension
Plan | | | Other
Benefits
Plan | | | Total | |
Defined benefit plan assets | | | | | | | | | | | | | | | | |
Fair value, beginning balance | | $ | 1,241.7 | | | $ | 47.4 | | | $ | 89.9 | | | $ | 1,379.0 | |
Actual return on plan assets | | | 50.0 | | | | 1.0 | | | | 3.1 | | | | 54.1 | |
Employer contributions | | | 0.9 | | | | 6.4 | | | | — | | | | 7.3 | |
Administrative expenses | | | (0.5 | ) | | | — | | | | (0.1 | ) | | | (0.6 | ) |
Benefits paid 1 | | | (113.2 | ) | | | (5.5 | ) | | | (24.2 | ) | | | (142.9 | ) |
| | | | | | | | | | | | | | | | |
Fair value of plan assets, ending balance | | $ | 1,178.9 | | | $ | 49.3 | | | $ | 68.7 | | | $ | 1,296.9 | |
| | | | | | | | | | | | | | | | |
Defined benefit plan obligations | | | | | | | | | | | | | | | | |
Accrued obligations, beginning balance 2 | | $ | 1,354.7 | | | $ | 47.8 | | | $ | 302.7 | | | $ | 1,705.2 | |
Total current service cost | | | 0.9 | | | | — | | | | — | | | | 0.9 | |
Interest cost | | | 70.9 | | | | 2.5 | | | | 15.8 | | | | 89.2 | |
Benefits paid | | | (113.2 | ) | | | (5.5 | ) | | | (16.4 | ) | | | (135.1 | ) |
Actuarial losses | | | 64.4 | | | | 5.3 | | | | 19.3 | | | | 89.0 | |
| | | | | | | | | | | | | | | | |
Accrued plan obligations, ending balance | | $ | 1,377.7 | | | $ | 50.1 | | | $ | 321.4 | | | $ | 1,749.2 | |
| | | | | | | | | | | | | | | | |
Retirement benefit plan asset (liability) at end of fiscal year, net | | $ | (198.8 | ) | | $ | (0.8 | ) | | $ | (252.7 | ) | | $ | (452.3 | ) |
| | | | | | | | | | | | | | | | |
|
| The retirement benefit asset (liability) is included in the Company’s Consolidated Statements of Financial Position as follows: | |
Retirement benefit asset | | $ | — | | | $ | — | | | $ | — | | | $ | — | |
Retirement benefit liability | | $ | (198.8 | ) | | $ | (0.8 | ) | | $ | (252.7 | ) | | $ | (452.3 | ) |
| | | | | | | | | | | | | | | | |
Retirement benefit plan liability at end of fiscal year | | $ | (198.8 | ) | | $ | (0.8 | ) | | $ | (252.7 | ) | | $ | (452.3 | ) |
| | | | | | | | | | | | | | | | |
| 1 | Benefits paid from the funded assets include retiree benefits and short-term disability of active employees. Other benefits, consisting of health and dental claims for active employees, are paid directly by the Company. |
| 2 | Accrued benefit obligation represents the actuarial present value of benefits attributed to employee service rendered to a particular date. |
F-77
ii) Retirement benefit plans expense and contributions
| | | | | | | | | | | | | | | | |
| | | 52-Week
Period Ended
January 28, 2012
(Recast - Note 2.4.1) | |
(in CAD millions) | | Registered
Retiremen
Plans | | | Non-
Registered
Pension
Plan | | | Other
Benefits
Plan | | | Total | |
Current service cost, net of employee contributions | | $ | 0.9 | | | $ | — | | | $ | — | | | $ | 0.9 | |
Interest cost | | | 70.9 | | | | 2.5 | | | | 15.8 | | | | 89.2 | |
Interest income on plan assets | | | (64.8 | ) | | | (2.6 | ) | | | (4.1 | ) | | | (71.5 | ) |
Administrative expenses | | | 0.5 | | | | — | | | | 0.1 | | | | 0.6 | |
| | | | | | | | | | | | | | | | |
Net defined benefit plans expense (income) | | | 7.5 | | | | (0.1 | ) | | | 11.8 | | | | 19.2 | |
Net defined contribution plan expense | | | 10.7 | | | | — | | | | 0.3 | | | | 11.0 | |
| | | | | | | | | | | | | | | | |
Total retirement benefit plans expense (income) 1 | | $ | 18.2 | | | $ | (0.1 | ) | | $ | 12.1 | | | $ | 30.2 | |
| | | | | | | | | | | | | | | | |
| 1 | Not included in total expense recognized, are short-term disability payments of $8.4 million that were paid from the health and welfare trust. Both short-term disability and the retirement benefit plans expense are included in “Selling, administrative and other expenses” in the Company’s Consolidated Statements of Net Earnings (Loss) and Comprehensive Income (Loss). |
iii) Remeasurements of the net defined retirement benefit liability are as follows:
| | | | | | | | | | | | | | | | |
| | | 52-Week
Period Ended
January 28, 2012
(Recast - Note 2.4.1) | |
(in CAD millions) | | Registered
Retirement
Plans | | | Non -
Registered
Pension
Plan | | | Other
Benefits
Plan | | | Total | |
Actuarial loss on difference between interest income and actual return on plan | | $ | (14.8 | ) | | $ | (1.6 | ) | | $ | (1.0 | ) | | $ | (17.4 | ) |
Actuarial gain (loss) due to change in demographic | | | 19.0 | | | | 0.3 | | | | (0.6 | ) | | | 18.7 | |
Actuarial loss due to change in economic assumptions | | | (108.6 | ) | | | (3.6 | ) | | | (27.0 | ) | | | (139.2 | ) |
Actuarial gain (loss) due to all other experiences | | | 25.2 | | | | (2.0 | ) | | | 8.2 | | | | 31.4 | |
| | | | | | | | | | | | | | | | |
Total pre-tax remeasurement losses | | $ | (79.2 | ) | | $ | (6.9 | ) | | $ | (20.4 | ) | | $ | (106.5 | ) |
| | | | | | | | | | | | | | | | |
Income tax recovery on remeasurement losses | | | | | | | | | | | | | | | 27.4 | |
| | | | | | | | | | | | | | | | |
Total remeasurement losses, net of income taxes 1 | | | | | | | | | | | | | | $ | (79.1 | ) |
| | | | | | | | | | | | | | | | |
| 1 | Total remeasurement losses, net of income taxes, are included in “Other comprehensive loss” in the Company’s Consolidated Statements of Net Earnings (Loss) and Comprehensive Income (Loss). |
The actuarial loss associated with changes in economic assumptions is due to changes in the discount rate. The discount rate as at January 28, 2012 decreased 0.7% for the Registered Retirement Plans and the Non-Registered Pension Plan, and 0.8% for the Other Benefits Plan. This loss is in approximate proportion to the impact of a 1.0% decrease in discount rates, as shown in the sensitivity analysis above.
F-78
iv) Actuarial assumptions
The adoption of the amendments to IAS 19 resulted in a change in the following significant actuarial assumption:
| | | | | | | | | | | | |
| | | 52-Week
Period Ended
January 28, 2012
(Recast - Note 2.4.1) | |
| | | Registered
Retirement
Plans | | | Non -
Registered
Pension
Plan | | | Other
Benefits
Plan | |
Expected long-term rate of return on plan assets used in calculation of benefit plans expense | | | 4.70 | % | | | 4.70 | % | | | 4.60 | % |
| | | | | | | | | | | | |
11. Depreciation and amortization expense
The components of the Company’s depreciation and amortization expense, included in “Selling, administrative and other expenses”, were as follows:
| | | | | | | | |
(in CAD millions) | | 13-Week
Period Ended
April 28, 2012 | | | 13-Week
Period Ended
April 30, 2011 | |
Property, plant and equipment | | $ | 26.3 | | | $ | 26.7 | |
Intangible assets | | | 2.4 | | | | 1.9 | |
| | | | | | | | |
Total depreciation and amortization expense | | $ | 28.7 | | | $ | 28.6 | |
| | | | | | | | |
12. Gain on lease terminations
On March 2, 2012, the Company entered an agreement to surrender and terminate early the operating leases on three properties. On the closing date, April 20, 2012, the Company received cash proceeds of $170.0 million for the surrender of the three leases, resulting in a pre-tax gain of $164.3 million for the 13-week period ended April 28, 2012, net of transaction costs of $5.7 million, including the derecognition of leasehold improvements. The Company plans to exit all three properties by October 31, 2012.
F-79
13. Assets and liabilities held for sale
Assets and liabilities held for sale
On April 24, 2012, the Company entered an agreement to sell the operations of its subsidiary, Cantrex Group Inc., to Nationwide Marketing Group, LLC (the “purchaser”) for $3.5 million, equal to the net carrying amount of specified Cantrex assets and liabilities to be sold. The closing date of the transaction was April 29, 2012. As at the end of April 28, 2012, the assets and liabilities of Cantrex held for sale have been separately reclassified on the Company’s unaudited Condensed Consolidated Statements of Financial Position. The major classes of assets and liabilities classified as held for sale were as follows:
| | | | |
(in CAD millions) | | As at
April 28, 2012 | |
Accounts receivable, net | | $ | 30.8 | |
Inventories | | | 0.2 | |
Prepaid expenses | | | 0.3 | |
Current assets classified as held for sale | | | 31.3 | |
Property, plant and equipment | | | 0.6 | |
Non-current assets classified as held for sale | | | 0.6 | |
| | | | |
Assets classified as held for sale | | $ | 31.9 | |
| | | | |
Accounts payable | | $ | 25.1 | |
Accrued liabilities | | | 3.3 | |
Current liabilities classified as held for sale | | | 28.4 | |
Non-current liabilities classified as held for sale | | | — | |
| | | | |
Liabilities classified as held for sale | | $ | 28.4 | |
| | | | |
14. Financial instruments
In the ordinary course of business, the Company enters into financial agreements with banks and other financial institutions to reduce underlying risks associated with interest rates and foreign currency. The Company does not hold or issue derivative financial instruments for trading or speculative purposes.
Financial instrument risk management
The Company is exposed to credit, liquidity and market risk as a result of holding financial instruments. Market risk consists of foreign exchange and interest rate risk.
Credit risk
Credit risk refers to the possibility that the Company can suffer financial losses due to the failure of the Company’s counterparties to meet their payment obligations. Exposure to credit risk exists for derivative instruments, cash and cash equivalents, accounts receivable and investments included in other long-term assets.
Cash and cash equivalents, accounts receivable, derivative financial assets and investments included in other long-term assets of $489.9 million as at April 28, 2012 (January 28, 2012: $514.9 million, April 30, 2011: $330.9 million, January 29, 2011: $577.6 million) expose the Company to credit risk should the borrower default on maturity of the cash and cash equivalents, accounts receivable, derivative financial asset or investment. The Company manages its exposure to credit risk from cash and cash equivalents, derivative financial assets and investments included in other long-term assets through policies that require borrowers to have a minimum credit rating of A, and limiting investments with individual borrowers at maximum levels based on credit rating.
F-80
The Company is exposed to minimal credit risk from customers as a result of ongoing credit evaluations and review of accounts receivable collectability. As at April 28, 2012, approximately 40.0% (January 28, 2012: 26.5%, April 30, 2011: 31.9%, January 29, 2011: 38.7%) of the Company’s accounts receivable was due from two customers who were current on their accounts (January 28, 2012 and April 30, 2011: one customer who was current on their account, January 29, 2011: two customers who were current on their accounts).
Liquidity risk
Liquidity risk is the risk that the Company may not have cash available to satisfy financial liabilities as they come due. The Company actively maintains access to adequate funding sources to ensure it has sufficient available funds to meet current and foreseeable financial requirements at a reasonable cost.
The following table summarizes the carrying amount and the contractual maturities of both the interest and principal portion of significant financial liabilities as at April 28, 2012:
| | | | | | | | | | | | | | | | | | | | | | | | |
| | | Carrying
Amount | | | Contractual Cash Flow Maturities | |
(in CAD millions) | | | Total | | | Within
1 year | | | 1 year to
3 years | | | 3 years to
5 years | | | Beyond
5 years | |
Accounts payable and accrued liabilities | | $ | 577.7 | | | $ | 577.7 | | | $ | 577.7 | | | $ | — | | | $ | — | | | $ | — | |
Liabilities classified as held for sale | | | 28.4 | | | | 28.4 | | | | 28.4 | | | | — | | | | — | | | | — | |
Long-term obligations including payments due within one year 1 | | | 28.2 | | | | 36.5 | | | | 6.6 | | | | 10.1 | | | | 6.3 | | | | 13.5 | |
Operating lease obligations 2 | | | n/a | | | | 507.4 | | | | 103.2 | | | | 156.7 | | | | 94.5 | | | | 153.0 | |
Royalties 2 | | | n/a | | | | 2.8 | | | | 1.3 | | | | 1.5 | | | | — | | | | — | |
Retirement benefit plan obligations 3 | | | 450.0 | | | | 136.7 | | | | 29.3 | | | | 58.6 | | | | 48.8 | | | | — | |
| | | | | | | | | | | | | | | | | | | | | | | | |
| | $ | 1,084.3 | | | $ | 1,289.5 | | | $ | 746.5 | | | $ | 226.9 | | | $ | 149.6 | | | $ | 166.5 | |
| | | | | | | | | | | | | | | | | | | | | | | | |
| 1 | Cash flow maturities relating to long-term obligations, including payments due within one year, include annual interest on finance lease obligations at an average rate of 6.7%. The Company had no borrowings on the Credit Facility as at April 28, 2012. |
| 2 | Operating lease obligations and royalties are not reported on the unaudited Condensed Consolidated Statements of Financial Position. |
| 3 | Retirement benefit plan obligation payments are based on the Company’s most recent valuation, completed as at December 31, 2010. |
Management believes that cash on hand, future cash flow generated from operations and availability of current and future funding will be adequate to support these financial liabilities.
Market risk
Market risk exists as a result of the potential for losses caused by changes in market factors such as foreign currency exchange rates, interest rates and commodity prices.
Foreign exchange risk
The Company may enter into foreign exchange contracts to reduce the foreign exchange risk with respect to U.S. dollar denominated assets and liabilities and purchases of goods or services.
| | • | | As at April 28, 2012, there were no option contracts outstanding (January 28, 2012: no option contracts outstanding, April 30, 2011: notional value of option contracts outstanding was U.S. $279.0 million, January 29, 2011: notional value of option contracts outstanding was U.S. $372.0 million) and therefore, no derivative financial assets nor derivative financial liabilities were recognized in the |
F-81
| | unaudited Condensed Consolidated Statements of Financial Position (January 28, 2012: Nil, April 30, 2011: $17.1 million included in “Derivative financial liabilities”, January 29, 2011: $3.0 million included in “Derivative financial liabilities”). The intrinsic value portion of derivatives is designated as a cash flow hedge for hedge accounting treatment under IAS 39. Option contracts are intended to reduce the foreign exchange risk with respect to anticipated purchases of U.S. dollar denominated goods and services, including goods purchased for resale (“hedged item”). |
| | • | | As at April 28, 2012, there were also no swap contracts outstanding (January 28, 2012: no swap contracts outstanding, April 30, 2011: notional value of swap contracts outstanding was U.S. $6.2 million, January 29, 2011: notional value of swap contracts outstanding was U.S. $6.8 million) and therefore, no derivative financial assets nor derivative financial liabilities were recognized in the unaudited Condensed Consolidated Statements of Financial Position (January 28, 2012: Nil, April 30, 2011: less than $0.1 million included in “Derivative financial assets”, January 29, 2011: less than $0.1 million included in “Derivative financial liabilities”). Swap contracts are intended to reduce the foreign exchange risk on U.S. dollar denominated short-term investments pledged as collateral for letter of credit obligations issued under the Company’s offshore merchandise purchasing program. |
While the notional principal of outstanding financial instruments is not recorded on the unaudited Condensed Consolidated Statements of Financial Position, the fair value of any outstanding contracts is included in “Derivative financial assets” or “Derivative financial liabilities”, depending on the fair value, and classified as current or long-term, depending on the maturities of the outstanding contracts. Changes in the fair value of the designated portion of contracts are included in OCI for cash flow hedges, to the extent the designated portion of the hedges continue to be effective, with the ineffective portion included in “Selling, administrative and other expenses” in the unaudited Condensed Consolidated Statements of Net Earnings (Loss) and Comprehensive Income (Loss). Amounts previously included in OCI are reclassified to “Cost of goods and services sold” in the same period in which the hedged item impacts net earnings (loss).
For the 13-week period ended April 28, 2012, the Company recorded a gain of $1.8 million (2011: gain of $2.6 million) relating to the translation or settlement of U.S. dollar denominated monetary items consisting of cash and cash equivalents, accounts receivable and accounts payable, excluding the reclassification from OCI of the gain (loss) on foreign exchange derivatives designated as cash flow hedges.
The period end exchange rate was 1.0194 U.S. dollar to Canadian dollar. A 10% appreciation or depreciation of the U.S. and/or the Canadian dollar exchange rate was determined to have an after tax impact on net earnings (loss) of $7.3 million for U.S. dollar denominated balances included in cash and cash equivalents, accounts receivable and accounts payable.
Interest rate risk
From time to time, the Company enters into interest rate swap contracts with approved financial institutions to manage exposure to interest rate risks. As at April 28, 2012, the Company had no interest rate swap contracts in place.
Interest rate risk reflects the sensitivity of the Company’s financial condition to movements in interest rates. Financial assets and liabilities which do not bear interest or bear interest at fixed rates are classified as non-interest rate sensitive.
Cash and cash equivalents and borrowings under the secured revolving credit facility are subject to interest rate risk. The total subject to interest rate risk as at April 28, 2012 was a net asset of $362.9 million (January 28, 2012: net asset of $297.7 million, April 30, 2011: net asset of $197.2 million, January 29, 2011: net asset of $322.9 million). An increase or decrease in interest rates of 0.25% would cause an immaterial after-tax impact on quarterly net earnings (loss).
F-82
Classification and fair value of financial instruments
The estimated fair values of financial instruments presented are based on relevant market prices and information available at those dates. The following table summarizes the classification and fair value of certain financial instruments as at the specified dates. The Company determines the classification of a financial instrument when it is initially recorded, based on the underlying purpose of the instrument. As a significant number of the Company’s assets and liabilities, including inventories and capital assets, do not meet the definition of financial instruments, values in the table below do not reflect the fair value of the Company as a whole.
The fair value of financial instruments are classified and measured according to the following three levels, based on the fair value hierarchy.
| | • | | Level 1: Quoted prices in active markets for identical assets or liabilities |
| | • | | Level 2: Inputs other than quoted prices in active markets that are observable for the asset or liability either directly (i.e. as prices) or indirectly (i.e. derived from prices) |
| | • | | Level 3: Inputs for the asset or liability that are not based on observable market data |
| | | | | | | | | | | | | | | | | | | | | | |
(in CAD millions) | | | | | | | | | | | | | | | | | |
Classification | | Balance Sheet Category | | Fair Value
Hierarchy1 | | | As at
April 28, 2012 | | | As at
January 28, 2012 | | | As at
April 30, 2011 | | | As at
January 29, 2011 | |
Loans and receivables | | | | | | | | | | | | | | | | | | | | | | |
Cash and cash equivalents and restricted cash and cash equivalents | | Cash and cash
equivalents 2 | | | Level 1 | | | $ | 101.4 | | | $ | 177.2 | | | $ | 118.4 | | | | 88.5 | |
Available for sale | | | | | | | | | | | | | | | | | | | | | | |
Cash equivalents | | Cash and cash
equivalents 2 | | | Level 2 | | | | 260.2 | | | | 220.2 | | | | 80.0 | | | | 343.8 | |
Short-term investments | | Short-term
investments 2 | | | Level 2 | | | | — | | | | — | | | | — | | | | — | |
Fair value through profit or loss | | | | | | | | | | | | | | | | | | | | | | |
U.S. $ derivative contracts | | Derivative financial
assets | | | Level 2 | | | | — | | | | — | | | | — | | | | — | |
U.S. $ derivative contracts | | Derivative financial
liabilities | | | Level 2 | | | | — | | | | — | | | | 17.1 | | | | 3.0 | |
Long-term investments | | Other long-term
assets | | | Level 3 | | | | 1.3 | | | | 1.3 | | | | 1.3 | | | | 1.3 | |
| 1 | Classification of fair values relates to 2012. |
| 2 | Interest income related to cash and cash equivalents and short-term investments is disclosed in Note 5. |
All other assets that are financial instruments not listed in the chart above have been classified as “Loans and receivables”. All other financial instrument liabilities have been classified as “Other liabilities” and are measured at amortized cost in the unaudited Condensed Consolidated Statements of Financial Position. The carrying value of these financial instruments approximate fair value given that they are short-term in nature.
During the 13-week period ended April 28, 2012, there were no transfers of financial instruments between fair value levels nor were there any changes in the classification of financial assets.
15. Contingent liabilities
Legal proceedings
In addition to the class action lawsuits described in the 2011 Annual Consolidated Financial Statements, the Company is involved in various legal proceedings incidental to the normal course of business. The Company is of the view that, although the outcome of such legal proceedings cannot be predicted with certainty, the final disposition is not expected to have a material adverse effect on the Company’s unaudited Condensed Consolidated Statements of Financial Position or unaudited Condensed Consolidated Statements of Net Earnings (Loss) and Comprehensive Income (Loss).
F-83
Commitments
As at April 28, 2012, cash and cash equivalents that are restricted represent cash and investments pledged as collateral for letter of credit obligations issued under the Company’s offshore merchandise purchasing program of $6.4 million (January 28, 2012: $7.2 million, April 30, 2011: $6.1 million, January 29, 2011: $7.1 million), which is the Canadian equivalent of U.S. $6.5 million (January 28, 2012: U.S. $7.2 million, April 30, 2011: U.S. $6.4 million, January 29, 2011: U.S. $7.0 million). As at April 30, 2011, restricted cash and cash equivalents also included cash deposits pledged as collateral with counterparties relating to outstanding derivative contracts of $17.4 million (January 29, 2011: $5.1 million) and funds held in trust in accordance with regulatory requirements governing advance ticket sales related to Sears Travel of $2.5 million (January 29, 2011: $3.1 million).
Guarantees
The Company has provided the following significant guarantees to third parties:
Royalty License Agreements
The Company pays royalties under various merchandise license agreements, which are generally based on the sale of products. Certain license agreements require a minimum guaranteed payment of royalties over the term of the contract, regardless of sales. Total future minimum royalty payments under such agreements as at April 28, 2012, are $2.8 million (January 28, 2012: $3.1 million, April 30, 2011: $4.5 million, January 29, 2011: $2.4 million).
Other Indemnification Agreements
In the ordinary course of business, the Company has provided indemnification commitments to counterparties in transactions such as leasing transactions, royalty agreements, service arrangements, investment banking agreements and director and officer indemnification agreements. The Company has also provided certain indemnification agreements in connection with the sale of the credit and financial services operations in November 2005. The foregoing indemnification agreements require the Company to compensate the counterparties for costs incurred as a result of changes in laws and regulations, or as a result of litigation or statutory claims, or statutory sanctions that may be suffered by a counterparty as a consequence of the transaction. The terms of these indemnification agreements will vary based on the contract and typically do not provide for any limit on the maximum potential liability. Historically, the Company has not made any significant payments under such indemnifications and no amount has been accrued in the unaudited Condensed Consolidated Financial Statements with respect to these indemnification commitments.
16. Net earnings (loss) per share
A reconciliation of the number of shares used in the net (loss) earnings per share calculation is as follows:
| | | | | | | | |
(Number of shares) | | 13-Week
Period Ended
April 28, 2012 | | | 13-Week
Period Ended
April 30, 2011 | |
Weighted average number of shares per basic net earnings (loss) per share calculation | | | 102,558,643 | | | | 105,392,253 | |
Effect of dilutive instruments outstanding | | | — | | | | — | |
Weighted average number of shares per diluted net earnings (loss) per share calculation | | | 102,558,643 | | | | 105,392,253 | |
“Net earnings (loss)” as disclosed in the unaudited Condensed Consolidated Statements of Net Earnings (Loss) and Comprehensive Income (Loss) was used as the numerator in calculating the basic and diluted net earnings
F-84
(loss) per share. For the 13-week period ended April 28, 2012, 9,920 options were excluded from the calculation of diluted net earnings per share as they were anti-dilutive. For the 13-week period ended April 30, 2011, the Company incurred a net loss and therefore, all potential common shares were anti-dilutive.
17. Income taxes
The Company’s total net cash refunds or payments of income taxes for the 13-week period ended April 28, 2012 were a net refund of $7.8 million (2011: net payment of $19.7 million).
In the ordinary course of business, the Company is subject to ongoing audits by tax authorities. While the Company believes that its tax filing positions are appropriate and supportable, periodically, certain matters are challenged by tax authorities. During the 13-week period ended April 28, 2012, the Company recorded a charge of $2.8 million (2011: $9.1 million) for estimated exposure to uncertain tax provisions, comprised of $1.6 million (2011: $4.0 million) of interest in “Finance costs” and $1.2 million (2011: $5.1 million) related to income tax exposure, consisting of a charge of $1.6 million (2011: $17.9 million) to “Income tax (expense) recovery – Current” and a recovery of $0.4 million (2011: $12.8 million) to “Income tax (expense) recovery – Deferred,” all included in the unaudited Condensed Consolidated Statements of Net Earnings (Loss) and Comprehensive Income (Loss). As the Company routinely evaluates and provides for potentially unfavourable outcomes with respect to any tax audits, the Company believes that, other than as noted above, the final disposition of tax audits will not have a material adverse effect on its liquidity, the unaudited Condensed Consolidated Statements of Financial Position or results of operations.
Included in “Other long-term assets” in the unaudited Condensed Consolidated Statements of Financial Position as at April 28, 2012, were receivables of $30.3 million (January 28, 2012: $30.3 million, April 30, 2011: $20.8 million, January 29, 2011: $20.9 million) related to payments made by the Company for tax assessments that are being disputed.
18. Events after the reporting period
On April 29, 2012, the Company received proceeds of $3.5 million for the sale of specified Cantrex assets and liabilities. As the net carrying amount of assets and liabilities sold equaled the proceeds received, no gain or loss was recognized on the transaction (see Note 13).
On May 17, 2012, the Company announced Sears Holdings’ plans to pursue a distribution, on a pro rata basis to its shareholders, of a portion of its holdings in the Company such that, immediately following the distribution, Sears Holdings would retain approximately 51% of the issued and outstanding shares of Sears Canada. The Company expects that the proposed distribution by Sears Holdings would, if completed, be anticipated to increase the public float and potentially the liquidity of the Company’s shares. In connection with the distribution, the Company is expected to file documents with the United States Securities and Exchange Commission and the Canadian Securities Administrators.
19. Approval of unaudited condensed consolidated financial statements
The unaudited Condensed Consolidated Financial Statements were approved by the Board of Directors and authorized for issue on May 31, 2012.
F-85