UNITED STATES
SECURITIES AND EXCHANGE COMMISSION
Washington, D.C. 20549
FORM N-CSR
CERTIFIED SHAREHOLDER REPORT OF REGISTERED MANAGEMENT INVESTMENT COMPANIES
Investment Company Act file number 811-22732
ETF Series Trust
(Exact name of registrant as specified in charter)
145 Mason St, 2nd Fl
Greenwich, CT 06830
(Address of principal executive offices) (Zip code)
Corporation Service Company
2711 Centerville Road, Suite 400
Wilmington, DE 19808
(Name and address of agent for service)
With a copy to:
Allison Fumai
Dechert LLP
1095 Avenue of the Americas
New York, New York 10036-6797
Registrant's telephone number, including area code: (203) 900-1400
Date of fiscal year end: October 31
Date of reporting period: October 31, 2014
Form N-CSR is to be used by management investment companies to file reports with the Commission not later than 10 days after the transmission to stockholders of any report that is required to be transmitted to stockholders under Rule 30e-1 under the Investment Company Act of 1940 (17 CFR 270.30e-1). The Commission may use the information provided on Form N-CSR in its regulatory, disclosure review, inspection, and policymaking roles.
A registrant is required to disclose the information specified by Form N-CSR, and the Commission will make this information public. A registrant is not required to respond to the collection of information contained in Form N-CSR unless the Form displays a currently valid Office of Management and Budget ("OMB") control number. Please direct comments concerning the accuracy of the information collection burden estimate and any suggestions for reducing the burden to Secretary, Securities and Exchange Commission, 100 F Street, NE, Washington, DC 20549. The OMB has reviewed this collection of information under the clearance requirements of 44 U.S.C. § 3507.
Item 1. Reports to Stockholders.
The Report to Shareholders is attached herewith.
|
| Annual Report |
| October 31, 2014 |
| |
| Recon Capital DAX German ETF |
| Ticker: DAX |
DAX® is a registered trademark of Deutsche Börse AG and has been licensed for use by Recon Capital Partners, LLC and the Recon Capital DAX German ETF (the “Fund”). The Fund is not sponsored, endorsed, issued, sold or promoted by of Deutsche Börse AG, nor does this company make any representation regarding the advisability of investing in the Fund.
The financial statements contained herein are submitted for the general information of the shareholders of the Fund. This report is not authorized for distribution to prospective investors in the Fund unless preceded or accompanied by an effective prospectus.
Not FDIC Insured • No Bank Guarantee • May Lose Value
ETF Distributors, LLC, distributor.
An investment in the Fund is subject to investment risk, including the possible loss of principal amount invested. The risks associated with the Fund are detailed in the prospectus which include: stock market risk, index risk, tracking error risk, replication management risk, market price risk and trading halts risk.
Shares are bought and sold at market price (not NAV), are not individually redeemable, and owners of the Shares may acquire those Shares from the Funds and tender those shares for redemption to the Funds in Creation Unit aggregations only.
|
| TABLE OF CONTENTS |
| October 31, 2014 |
|
| Letter to Shareholders (unaudited) |
| October 31, 2014 |
Dear Shareholder:
For the period ended October 31, 2014, the primary focus for investors was gauging a potential rise in interest rates given the expedited manner in which the Federal Reserve (the “Fed”) had begun to wind down its latest round of monetary stimulus. In 2013, the Fed committed to an open-ended program to purchase $85 billion of mortgage and treasury bonds each month until the unemployment rate fell and the US economy showed consistent signs of growth. At the start of 2014, leadership within the Fed shifted as Chairman Ben Bernanke was relieved of his duties by Chairperson Janet Yellen. The markets watched closely and began hypothesizing of potential fallouts as the Fed began reducing its bond purchase program. Even with the removal of monetary stimulus, the Fed expressed a commitment to keeping short term interest rates low.
Equity markets continued to move higher through mid-September despite geo-political tensions in the Middle East and Russia. Towards the end of September, volatility increased and the markets had a near 10% correction. The energy sector was one of the worst performing, as West Texas Intermediate Crude Oil fell from over $100/barrel in the summer to below $75/barrel at the beginning of October. Shortly after the correction, markets rallied back to pre-selloff levels to end October.
2014 has been a banner year for service related companies which has been vividly illustrated by the outperformance of NASDAQ listed companies. U.S. large capitalization stocks have led the way for 2014. Developed international large cap equities have participated in part of the end of October rally, but overall struggled this year on concerns of slowing growth and deflation in the Eurozone. The European Central Bank (“ECB”) has reiterated their commitment to quantitative easing in the region, which has helped to lift European equities off their lows. Continued accommodative monetary policies, as well as limited signs of inflation are going to be leading themes for the next year, both domestically and abroad.
Investors have continued to seek yield as interest rates are still hovering well below average historical levels. The U.S. 10 Year Treasury has been below 3% all of 2014 and even breached 2% briefly in the beginning of October. High yield corporate bonds in particular have moved higher as investors were willing to assume more risk to obtain higher yield.
Given the current market environment, investors have recognized that in order to attain a successful long-term investment strategy they must have a well-diversified portfolio. Recon Capital focuses on implementing its investment expertise and operational infrastructure to deliver market-driven, value-added products that meet the evolving needs of global investors in the current market of low interest rates and geo-political uncertainty.
I want to personally thank you for your interest in Recon Capital and our investment products. I invite you to visit us at www.ReconFunds.com or call us at (203) 900-1400 for more information on our company and our investment solutions.
Sincerely,
Garrett K. Paolella
Chief Executive Officer
Registered Representative of ETF Distributors LLC
|
| Management Discussion of Fund Performance (unaudited) |
| October 31, 2014 |
RECON CAPITAL DAX GERMANY ETF
The Recon Capital DAX Germany ETF (the “Fund”) seeks to provide investment results that will closely correspond, before fees and expenses, to the price and yield performance of the DAX® Index. The DAX® Index tracks the segment of the largest and most actively traded companies, known as blue chips, on the German equities market. It contains the shares of the 30 largest and most liquid companies admitted to the FWB Frankfurt Stock Exchange in the Prime Standard segment. The DAX® Index represents about 80% of the aggregated prime standard’s market cap. DAX is completely rules based and transparent. On the basis of a clear and publicly available set of rules — the guide to the equity indices of Deutsche Börse — the composition of the index is determined in a manner comprehensive to all market participants.
The Fund implements its strategy by investing in the 30 stocks contained in the DAX® Index and seeks to track the Index’s weighting per each constituent.
For the period ended October 31, 2014, the Fund’s Net Asset Value (“NAV”) returned 2.92% versus 3.30% for the DAX® Index. The Fund’s inception was October 23, 2014.
The principal positive contributors to Fund performance during the period, in aggregate, was the Fund’s exposure to the underlying equities contained in the DAX® Index which appreciated due to many factors including regional market direction, global investor sentiment and shifts in currency markets. There were no significant drivers of negative Fund performance to mention.
Hypothetical Growth of a $10,000 Investment
(Since Inception, 10/23/2014 through 10/31/2014)
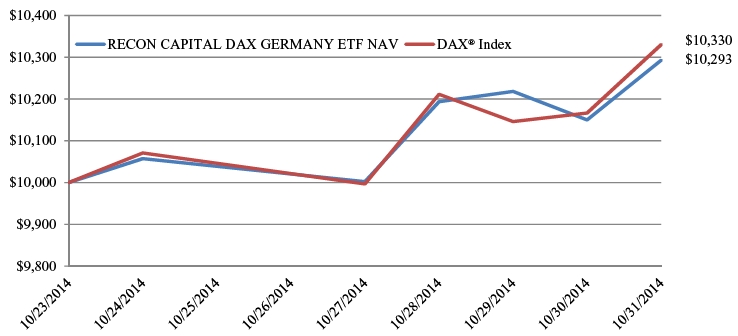
This chart illustrates the performance of a hypothetical $10,000 investment made on the Fund’s inception, and is not intended to imply any future performance.
An Index is a statistical measure of a specified financial market or sector. An index does not actually hold a portfolio of securities, incur expenses or pay any transaction costs. Therefore index returns do not reflect deductions for fees or expenses and are not available for direct investment. In comparison, the Fund’s performance is negatively impacted by these deductions. Fund returns do not reflect brokerage commissions or taxes that a shareholder would pay on Fund distributions or on transactions in Fund shares.
|
| Management Discussion of Fund Performance (unaudited) (concluded) |
| October 31, 2014 |
Fund Performance History
Average Annual Total Returns (%) (for period ended October 31, 2014)
| |
| | Since Inception |
| Market Price1,2 | 3.00% |
| Net Asset Value1 | 2.92% |
| Deutsche Borse DAX Index (USD) | 3.30% |
| 1 | Fund Inception Date: 10/23/2014. |
| 2 | The price used to calculate Market Price returns is determined by using the closing price listed on the NYSE Arca and does not represent returns an investor would receive if shares were traded at other times. |
| • | Past performance is not predictive of future results. |
| • | The investment return and principal value of an investment will fluctuate. An investor’s shares, when redeemed, may be worth more or less than the original cost. |
| • | Total return is calculated assuming reinvestment of all dividends and distributions. |
| • | The graph does not reflect the deduction of taxes that a shareholder would have to pay on Fund distributions or the redemption of the Fund shares. |
| • | For performance information current to the most recent month-end, please call (877) 756-7873. |
|
| Shareholder Expense Example (unaudited) |
| October 31, 2014 |
As a shareholder of the Recon Capital DAX German ETF (the “Fund”), you incur a unitary management fee. The following example is intended to help you understand your ongoing costs (in dollars and cents) of investing in the Fund and to compare these costs with the ongoing costs of investing in other funds. The example is based on an investment of $1,000 invested at the beginning of the period and held throughout the entire period (from October 23, 2014* to October 31, 2014).
Actual expenses
The first line under the Fund in the table below provides information about actual account values and actual expenses. You may use the information in this line, together with the amount you invested, to estimate the expenses that you paid over the period. Simply divide your account value by $1,000 (for example, an $8,600 account value divided by $1,000 = 8.6), then multiply the result by the number in the first line for the Fund under the heading entitled “Expenses Paid During Period” to estimate the expenses you paid on your account during this period.
Hypothetical example for comparison purposes
The second line under the Fund in the table provides information about hypothetical account values and hypothetical expenses based on the Fund’s actual expense ratio and an assumed rate of return of 5% per year before expenses, which is not the Fund’s actual return. The hypothetical account values and expenses may not be used to estimate the actual ending account balance or expenses you paid for the period. You may use this information to compare the ongoing costs of investing in the Fund and other funds. To do so, compare this 5% hypothetical example with the 5% hypothetical examples that appear in the shareholder reports of the other funds.
Please note that the expenses shown in the table are meant to highlight your ongoing costs only and do not reflect any transactional costs, such as brokerage commissions paid on purchases and sales of Fund shares. Therefore, the second line under the Fund in the table is useful in comparing ongoing Fund costs only and will not help you determine the relative total costs of owning different funds. In addition, if these transactional costs were included, your costs would have been higher.
| | | Beginning
Account
Value
10/23/14 | | Ending
Account
Value
10/31/14 | | Annualized
Expense Ratios
for the Period | | Expenses
Paid
During
Period** |
| Recon Capital DAX German ETF | | | | | | | | |
| Actual | | $1,000.00 | | $1,028.40 | | 0.45% | | $0.11 |
| Hypothetical (5% return before expenses) | | $1,000.00 | | $1,001.12 | | 0.45% | | $0.11 |
| * | Commencement of operations |
| ** | Expenses are calculated using the most recent expense ratio, multiplied by the average account value over the period, multiplied by 9/365 (to reflect the commencement of operations through the end of the period). |
|
| Portfolio of Investments — Recon Capital DAX German ETF |
| October 31, 2014 |
| Security Description | | Shares | | Fair
Value ($) |
| Common Stocks — 84.9% | | | | | | | | |
| Consumer Discretionary — 13.8% | | | | | | | | |
| adidas AG | | | 2,500 | | | $ | 181,827 | |
| Bayerische Motoren Werke AG | | | 3,840 | | | | 410,486 | |
| Continental AG | | | 1,290 | | | | 253,184 | |
| Daimler AG | | | 11,920 | | | | 926,392 | |
| | | | | | | | 1,771,889 | |
|
| Consumer Staples — 0.7% | | | | | | | | |
| Beiersdorf AG | | | 1,190 | | | | 96,256 | |
|
| Financials — 15.7% | | | | | | | | |
| Allianz SE | | | 5,430 | | | | 861,971 | |
| Commerzbank AG* | | | 11,280 | | | | 169,805 | |
| Deutsche Bank AG | | | 15,540 | | | | 484,416 | |
| Deutsche Boerse AG | | | 2,200 | | | | 150,250 | |
| Muenchener Rueckversicherungs- | | | | | | | | |
| Gesellschaft AG | | | 1,820 | | | | 357,662 | |
| | | | | | | | 2,024,104 | |
|
| Health Care — 14.0% | | | | | | | | |
| Bayer AG | | | 8,610 | | | | 1,223,839 | |
| Fresenius Medical Care AG & Co. KGaA | | | 2,580 | | | | 189,100 | |
| Fresenius SE & Co. KGaA | | | 4,740 | | | | 243,786 | |
| Merck KGaA | | | 1,550 | | | | 139,959 | |
| | | | | | | | 1,796,684 | |
|
| Industrials — 11.7% | | | | | | | | |
| Deutsche Lufthansa AG | | | 5,520 | | | | 81,540 | |
| Deutsche Post AG | | | 11,430 | | | | 358,804 | |
| Siemens AG | | | 9,420 | | | | 1,061,147 | |
| | | | | | | | 1,501,491 | |
|
| Information Technology — 6.8% | | | | | | | | |
| Infineon Technologies AG | | | 13,420 | | | | 130,156 | |
| SAP SE | | | 10,960 | | | | 744,812 | |
| | | | | | | | 874,968 | |
|
| Materials — 13.2% | | | | | | | | |
| BASF SE | | | 10,990 | | | | 967,161 | |
| HeidelbergCement AG | | | 1,680 | | | | 114,337 | |
| K+S AG | | | 2,130 | | | | 59,418 | |
| LANXESS AG | | | 1,090 | | | | 56,648 | |
| Linde AG | | | 2,060 | | | | 379,790 | |
| ThyssenKrupp AG* | | | 5,210 | | | | 125,167 | |
| | | | | | | | 1,702,521 | |
|
| Telecommunication Services — 4.3% | | | | | | | | |
| Deutsche Telekom AG | | | 37,050 | | | | 557,968 | |
|
| Utilities — 4.7% | | | | | | | | |
| E.ON SE | | | 23,110 | | | | 397,546 | |
| RWE AG | | | 5,770 | | | | 204,298 | |
| | | | | | | | 601,844 | |
| TOTAL COMMON STOCKS | | | | | | | | |
| (Cost $10,595,460) | | | | | | | 10,927,725 | |
| Security Description | | Shares | | Fair
Value ($) |
| Preferred Stocks — 4.7% | | | | | | | | |
| Consumer Discretionary — 3.1% | | | | | | | | |
| Volkswagen AG | | | 1,840 | | | $ | 392,023 | |
| Consumer Staples — 1.6% | | | | | | | | |
| Henkel AG & Co. KGaA | | | 2,090 | | | | 206,290 | |
| TOTAL PREFERRED STOCKS | | | | | | | | |
| (Cost $573,969) | | | | | | | 598,313 | |
| TOTAL INVESTMENTS — 89.6% | | | | | | | | |
| (Cost $11,169,429) | | | | | | | 11,526,038 | |
| Other Assets in Excess of Liabilities — 10.4% | | | | | | | 1,340,104 | |
| Total Net Assets — 100.0% | | | | | | $ | 12,866,142 | |
* Non-income producing security.
| | | |
| Sector Allocation | | |
| (as of October 31, 2014) | | |
| Consumer Discretionary | | | 16.9 | % |
| Financials | | | 15.7 | |
| Health Care | | | 14.0 | |
| Materials | | | 13.2 | |
| Industrials | | | 11.7 | |
| Information Technology | | | 6.8 | |
| Utilities | | | 4.7 | |
| Telecommunication Services | | | 4.3 | |
| Consumer Staples | | | 2.3 | |
| Total Investments | | | 89.6 | |
| Other Assets in Excess of Liabilities | | | 10.4 | |
| Net Assets | | | 100.0 | % |
Percentages indicated are based upon net assets.
The Fund’s portfolio composition is subject to change.
The accompanying notes are an integral part of these financial statements.
|
| Statement of Assets and Liabilities |
| October 31, 2014 |
| | | Recon Capital
DAX German
ETF |
| Assets: | | |
| Investments, at cost: | | $ | 11,169,429 | |
| Investments, at fair value (Note 2) | | $ | 11,526,038 | |
| Cash | | | 1,341,505 | |
| Total Assets | | | 12,867,543 | |
|
| Liabilities: | | | | |
| Payables: | | | | |
| Accrued Advisory fees | | | 1,401 | |
| Total Liabilities | | | 1,401 | |
| Net Assets | | $ | 12,866,142 | |
| |
| Net Assets Consist of: | | | | |
| Paid-in capital | | $ | 12,509,533 | |
| Accumulated net investment loss | | | — | |
| Accumulated net realized loss on investments | | | — | |
| Net unrealized appreciation on investments | | | 356,609 | |
| Net Assets | | $ | 12,866,142 | |
| Shares outstanding (unlimited number of shares of beneficial interest authorized, without par value) | | | 500,000 | |
| Net asset value, per share | | $ | 25.73 | |
The accompanying notes are an integral part of these financial statements.
| | | Recon Capital
DAX German
ETF |
| | | For the Period
October 23, 2014*
Through
October 31, 2014 |
| Investment Income: | | | | |
| Dividend income | | $ | — | |
| Expenses: | | | | |
| Advisory fees | | | 1,401 | |
| Net Investment Loss | | | (1,401 | ) |
| | | | | |
| Realized and Unrealized Gain (Loss) | | | | |
| Net realized gain (loss) on: | | | | |
| Investments | | | — | |
| Net realized loss | | | — | |
| Change in unrealized appreciation (depreciation) on: | | | | |
| Investments | | | 356,609 | |
| Change in unrealized appreciation | | | 356,609 | |
| Net realized and unrealized gain on investments | | | 356,609 | |
|
| Net increase in net assets resulting from operations | | $ | 355,208 | |
* Commencement of operations.
The accompanying notes are an integral part of these financial statements.
|
| Statement of Changes in Net Assets |
| | | Recon Capital
DAX German
ETF |
| | | For the Period
October 23, 2014*
Through
October 31, 2014 |
| Investment Operations: | | | | |
| Net investment loss | | $ | (1,401 | ) |
| Net realized loss on investments | | | — | |
| Net change in unrealized appreciation on investments | | | 356,609 | |
| Net increase in net assets resulting from operations | | | 355,208 | |
| | | | | |
| Distributions to Shareholders from: | | | | |
| Net investment income | | | — | |
| | | | | |
| Shareholder Transactions: | | | | |
| Proceeds from shares sold | | | 12,510,934 | |
| Cost of shares redeemed | | | — | |
| Net increase in net assets resulting from shareholder transactions | | | 12,510,934 | |
| Net increase in net assets | | | 12,866,142 | |
| | | | | |
| Net Assets: | | | | |
| Beginning of period | | | — | |
| End of period | | $ | 12,866,142 | |
| Including accumulated net investment loss at end of period: | | $ | — | |
| | | | | |
| Shares Created and Redeemed: | | | | |
| Shares outstanding, beginning of period | | | — | |
| Shares sold | | | 500,000 | |
| Shares redeemed | | | — | |
| Shares outstanding, end of period | | | 500,000 | |
* Commencement of operations.
The accompanying notes are an integral part of these financial statements.
| | | Recon Capital
DAX German
ETF |
| | | For the Period
October 23, 20141
Through
October 31, 2014 |
| For A Share Outstanding Throughout the Period Presented: | | | | |
| Net asset value, beginning of period | | $ | 25.00 | |
| Investment operations: | | | | |
| Net investment loss2,3 | | | — | |
| Net realized and unrealized gain on investments | | | 0.73 | |
| Total from investment operations | | | 0.73 | |
| Net asset value, end of period | | $ | 25.73 | |
| |
| Total return4 | | | 2.92 | % |
| Ratios/Supplemental Data: | | | | �� |
| Net assets, end of period (000’s omitted) | | $ | 12,866 | |
| |
| Ratios to average net assets: | | | | |
| Expenses5 | | | 0.45 | % |
| Net investment loss5 | | | (0.45 | )% |
| Portfolio turnover rate6,7 | | | 0 | % |
| 1 | Commencement of operations. |
| 2 | Based on average shares outstanding. |
| 3 | Amount is greater than $(0.005). |
| 4 | Total return is calculated assuming an initial investment made at the net asset value on the first day of the period, reinvestment of dividends and distributions at net asset value during the period, and redemption at net asset value on the last day of the period. Total return calculated for a period of less than one year is not annualized. |
| 6 | Portfolio turnover excludes the value of portfolio securities received or delivered as a result of in-kind creations or redemptions of the Fund’s capital shares. |
The accompanying notes are an integral part of these financial statements.
|
| Notes to Financial Statements |
| October 31, 2014 |
1. ORGANIZATION
ETF Series Trust (the “Trust”) was organized as a Delaware statutory trust on May 17, 2012 and is currently comprised of three investment portfolios. These financial statements relate to the Recon Capital DAX Germany ETF (the “Fund”), a series of the Trust. The Fund is classified as a non-diversified, open-end, management investment company under the Investment Company Act of 1940, as amended (“1940 Act”). The Fund commenced operations on October 23, 2014.
The Fund seeks to provide investment results using a passive or indexing investment approach that will closely correspond, before fees and expenses, generally to the price and yield performance of the DAX® Index (“Index”). The Index tracks the segment of the largest and most actively traded companies — known as blue chips — on the German equities market. It contains the shares of the 30 largest German companies in terms of liquidity and market capitalization admitted to the Frankfurt Stock Exchange in the Prime Standard segment. The 30 stocks contained in the Index represents about 80% of the market capitalization listed in Germany.
The Fund will invest at least 80% of its total assets in the common stock of companies included in the Index (“80% Policy”). The Fund employs a replication strategy to track the Index, which means it invests in the common stock included in the Index generally in proportion to its weighting in the Index. However, under various circumstances, it may not be possible or practicable to purchase all of those securities in those weightings. In these circumstances, the Fund may purchase a sample of securities in the Index. There also may be instances in which Recon Capital Advisors, LLC (“Adviser”) may choose to underweight or overweight a security in the Fund’s Index, purchase securities not in the Fund’s Index that the Adviser believes are appropriate to substitute for certain securities in the Index or utilize various combinations of other available investment techniques in seeking to replicate as closely as possible, before fees and expenses, the price and yield performance of the Fund’s Index.
2. SIGNIFICANT ACCOUNTING POLICIES
Use of Estimates
These financial statements are prepared in conformity with accounting principles generally accepted in the United States of America (“GAAP”), which require management to make certain estimates and assumptions that affect the reported amounts of assets and liabilities and disclosure of contingent assets and liabilities at the date of the financial statements and reported amounts of increases and decreases in the net assets from operations during the reporting period. Actual results could differ from those estimates. The following is a summary of significant accounting policies followed by the Fund:
Securities Valuation
Security holdings traded on a national securities exchange are valued based on their last sale price. Price information on listed securities is taken from the exchange where the security is primarily traded. Securities regularly traded in an over the counter market are valued at the latest quoted sale price in such market or in the case of the NASDAQ, at the NASDAQ Official Closing Price. If market quotations are not readily available, or if it is determined that a quotation of a security does not represent fair value, then the security is valued at fair value as determined in good faith using procedures adopted by the Trust’s Board of Trustees (the “Board”). Short-term securities with 60 days or less remaining to maturity are valued using the amortized cost method, which approximates current market value.
Fair Value Measurement
GAAP requires disclosure regarding the inputs and valuation techniques used to measure fair value and any changes in valuation inputs or techniques. In addition, investments shall be disclosed by major category.
The Fund categorizes its fair value measurements according to a three-level hierarchy that maximizes the use of observable inputs and minimizes the use of unobservable inputs by prioritizing that the most observable input be used when available. Observable inputs are those that market participants would use in pricing an investment based on market data obtained from sources independent of the reporting entity. Unobservable inputs are those that reflect the Fund’s assumptions about the information market participants would use in pricing an investment. An investment’s level within the fair value hierarchy is based on the lowest level of any input that is deemed significant to the asset or liability’s fair value measurement. The input levels are not necessarily an indication of the risk or liquidity associated with investments at that level. For example, certain U.S. government securities are generally high quality and liquid, however, they are reflected as Level 2 because the inputs used to determine fair value may not always be quoted prices in an active market.
|
| Notes to Financial Statements (continued) |
| October 31, 2014 |
Fair value inputs are summarized in the three broad levels listed below:
| • | Level 1 — Valuations based on quoted prices for identical investments in active markets that the Fund has the ability to access at the measurement date (including NAV for open-end mutual funds). Valuation adjustments are not applied to Level 1 investments. |
| • | Level 2 — Valuations based on other significant observable inputs (including quoted prices for similar securities, interest rates, prepayment speeds, credit risks, etc.). |
| • | Level 3 — Valuations based on significant unobservable inputs (including the Fund’s own assumptions and judgment in determining the fair value of investments). |
Inputs that are used in determining fair value of an investment may include price information, credit data, volatility statistics, and other factors. These inputs can be either observable or unobservable. The availability of observable inputs can vary between investments, and is affected by various factors such as the type of investment, and the volume and level of activity for that investment or similar investments in the marketplace. The inputs will be considered by the Investment Manager, along with any other relevant factors in the calculation of an investment’s fair value. The Fund uses prices and inputs that are current as of the measurement date, which may include periods of market dislocations. During these periods, the availability of prices and inputs may be reduced for many investments. This condition could cause an investment to be reclassified between the various levels within the hierarchy.
Investments falling into the Level 3 category are primarily supported by quoted prices from brokers and dealers participating in the market for those investments. However, these may be classified as Level 3 investments due to lack of market transparency and corroboration to support these quoted prices. Additionally, valuation models may be used as the pricing source for any remaining investments classified as Level 3. These models may rely on one or more significant unobservable inputs and/or significant assumptions by the Investment Manager. Inputs used in valuations may include, but are not limited to, financial statement analysis, capital account balances, discount rates and estimated cash flows, and comparable company data.
Under the direction of the Board, the Investment Manager’s Valuation Committee (the Committee) is responsible for overseeing the valuation procedures approved by the Board. The Committee consists of voting and non-voting members from various groups within the Adviser’s organization, including operations and accounting, trading and investments, compliance, risk management and legal.
The Committee meets at least monthly to review and approve valuation matters, which may include a description of specific valuation determinations, data regarding pricing information received from approved pricing vendors and brokers and the results of Board-approved valuation control policies and procedures (the Policies). The Policies address, among other things, instances when market quotations are readily available, including recommendations of third party pricing vendors and a determination of appropriate pricing methodologies; events that require specific valuation determinations and assessment of fair value techniques; securities with a potential for stale pricing, including those that are illiquid, restricted, or in default; and the effectiveness of third-party pricing vendors, including periodic reviews of vendors. The Committee meets more frequently, as needed, to discuss additional valuation matters, which may include the need to review back-testing results, review time-sensitive information or approve related valuation actions. The Committee reports to the Board, with members of the Committee meeting with the Board at each of its regularly scheduled meetings to discuss valuation matters and actions during the period, similar to those described earlier.
For investments categorized as Level 3, the Committee monitors information similar to that described above, which may include: (i) data specific to the issuer or comparable issuers, (ii) general market or specific sector news and (iii) quoted prices and specific or similar security transactions. The Committee considers this data and any changes from prior periods in order to assess the reasonableness of observable and unobservable inputs, any assumptions or internal models used to value those securities and changes in fair value. This data is also used to corroborate, when available, information received from approved pricing vendors and brokers. Various factors impact the frequency of monitoring this information (which may occur as often as daily). However, the Committee may determine that changes to inputs, assumptions and models are not required as a result of the monitoring procedures performed.
|
| Notes to Financial Statements (continued) |
| October 31, 2014 |
The following table is a summary of the inputs used to value the Fund’s investments at October 31, 2014:
| | | Level 1 | | Level 2 | | Level 3 | | Total |
| Valuation Inputs | | | | | | | | | | | | | | | | |
| Assets* | | | | | | | | | | | | | | | | |
| Common Stocks | | $ | 10,927,725 | | | $ | — | | | $ | — | | | $ | 10,927,725 | |
| Preferred Stocks | | | 598,313 | | | | — | | | | — | | | | 598,313 | |
| Total | | $ | 11,526,038 | | | $ | — | | | $ | — | | | $ | 11,526,038 | |
| * | See the Portfolio of Investments for breakout by sector. |
For significant movements between levels within the fair value hierarchy, the Fund has adopted a policy of recognizing the transfers into and out of all levels at the beginning of period method. There were no transfers between levels during the period.
A reconciliation of assets in which Level 3 inputs are used in determining fair value is presented when there are significant Level 3 investments at the end of the period. There were no Level 3 investments held during the period.
Indemnification
In the normal course of business, the Fund may enter into contracts that contain a variety of representations which provide general indemnifications for certain liabilities. The Fund’s maximum exposure under these arrangements is unknown. However, the Fund has not had prior claims or losses pursuant to these contracts and expects the risk of loss to be remote.
Cash and Cash Equivalents
Cash and cash equivalents include funds from time to time deposited with financial institutions and short-term, liquid investments in a money market fund. Cash and cash equivalents are carried at cost which approximates fair value.
Concentration of Risk
The Company places its cash and cash equivalents with financial institutions and, at times, cash held in money market accounts may exceed the Federal Deposit Insurance Corporation insured limit.
Investment Valuation
The Net Asset Value (“NAV”) is determined as of the close of trading (generally, 4:00 PM Eastern Time) on each day the New York Stock Exchange (“NYSE”) is open for trading. NAV per share is calculated by dividing the Fund’s net assets by the number of fund shares outstanding.
Security Transactions
Security transactions are accounted for on the trade date. Realized gains and losses on sales of investment securities are calculated using the specific identification.
Investment Income and Expenses
Dividend income is recognized on the ex-dividend date. The Fund distributes all or substantially all of its net investment income to shareholders in the form of dividends. Expenses are recognized on the accrual basis.
3. INVESTMENT MANAGEMENT AND OTHER AGREEMENTS
Investment Advisory and Supervisory Agreement
The Trust has entered into an Investment Advisory Agreement (the “Advisory Agreement”) and Supervisory Agreement (the “Supervisory Agreement”) with the Adviser, on behalf of the Fund. Pursuant to the Supervisory Agreement, the Adviser has overall supervisory responsibility for the general management and investment of the Fund’s securities portfolio. The Adviser is a wholly-owned subsidiary of Recon Capital Partners, LLC, a Delaware limited liability corporation established in 2011 that serves as investment adviser to high net worth individuals through separately managed accounts and private funds. For its services, the Fund pays the Adviser an annual rate of 0.45% of the Fund’s average daily net assets. Such fee, an all-in fee, is accrued daily and paid monthly. It pays for substantially all expenses of the Fund, including the cost of transfer agency, custody, fund administration, legal, audit, printing and certain administrative, distribution and investment advisory services. The advisory fee paid for the period ended October 31, 2014 was $1,401.
|
| Notes to Financial Statements (continued) |
| October 31, 2014 |
Distribution Agreement
ETF Distributors LLC (the “Distributor”) serves as the Fund’s Distributor. The Distributor will not distribute shares in less than Creation Units, as defined in Note 4, and does not maintain a secondary market in shares. The shares are expected to be traded in the secondary market.
The Board has adopted a distribution and service plan, where the Fund is authorized to pay distribution fees in connection with the sale and distribution of its shares and pay service fees in connection with the provision of ongoing services to shareholders. No distribution fees are currently paid by the Fund and there are no current plans to impose the fees.
Administrator, Custodian, Accounting Agent and Transfer Agent
The Bank of New York Mellon (in each capacity, the “Administrator”, “Custodian,” “Accounting Agent” or “Transfer Agent”) serves as the Fund’s Administrator, Custodian, Accounting Agent and Transfer Agent pursuant to the Fund Administration and Accounting Agreement. The Bank of New York Mellon is a subsidiary of The Bank of New York Mellon Corporation, a financial holding company.
4. CREATION AND REDEMPTION TRANSACTIONS
The Fund issues and redeems shares on a continuous basis at NAV in groups of 50,000 shares called “Creation Units.” Creation Units of the Fund are issued and redeemed generally in exchange for specified securities held by the Fund generally included in the Index and a specified cash payment. The Trust reserves the right to permit or require a “cash” option for creations and redemptions of shares. In each instance of such cash creations or redemptions, the Trust may impose transaction fees based on transaction expenses related to the particular exchange that will be higher than the transaction fees associated with in-kind purchase or redemptions.
Only “Authorized Participants” who have entered into contractual arrangements with the Distributor may purchase or redeem shares directly from the Fund. An Authorized Participant is either (i) a broker-dealer or other participant in the clearing process through the Continuous Net Settlement System of the National Securities Clearing Corporation or (ii) a Depository Trust Company (“DTC”) participant and, in each case, must have executed a Participant Agreement with the Distributor. Most retail investors will not qualify as Authorized Participants or have the resources to buy and sell whole Creation Units. Therefore, they will be unable to purchase or redeem the shares directly from the Fund. Rather, most retail investors will purchase shares in the secondary market with the assistance of a broker and will be subject to customary brokerage commissions or fees.
5. FEDERAL INCOME TAX
The Fund intends to qualify as a regulated investment company by complying with the requirements under Subchapter M of the Internal Revenue Code of 1986, as amended, by distributing substantially all of its net investment income and net realized gains to shareholders. Dividends and/or distributions, if any, are paid to shareholders invested in the Fund on the applicable record date, at least annually. Net realized capital gains, if any, will be distributed by the Fund at least annually. The amount of dividends and distributions from net investment income and net realized capital gains are determined in accordance with Federal income tax regulations which may differ from GAAP. These “book/tax” differences are either considered temporary or permanent in nature. To the extent these differences are permanent in nature, such amounts are reclassified within the components of net assets based on their Federal tax basis treatment; temporary differences do not require reclassification.
Management evaluates tax positions taken or expected to be taken in the course of preparing the Fund’s tax returns to determine whether the tax positions are “more-likely-than-not” of being sustained by the applicable tax authority. Tax positions not deemed to meet the more-likely-than-not threshold would be recorded as an expense in the current year. The Fund is required to analyze all open tax years. Open tax years are those years that are open for examination by the relevant income taxing authority. As of October 31, 2014, the Fund’s open tax year is open for examination. There are no examinations in progress at period end.
At October 31, 2014, the cost of investments on a tax basis was as follows:
| Cost | | Gross
Unrealized
Appreciation | | Gross
Unrealized
Depreciation | | Net Unrealized
Appreciation |
| $11,169,429 | | $385,501 | | $(28,892) | | $356,609 |
There were no differences between book and tax basis cost of investments and net unrealized appreciation (depreciation) at October 31, 2014.
|
| Notes to Financial Statements (continued) |
| October 31, 2014 |
At October 31, 2014, the components of undistributed or accumulated earnings/loss on a tax-basis were as follows:
Undistributed
Net Investment
Income/(Loss) | | Accumulated
Capital
and Other
Gains/(Losses) | | Net Unrealized
Appreciation | | Total
Earnings/(Loss) |
| $11,169,429 | | $385,501 | | $(28,892) | | $356,609 |
The differences between book and tax basis components of net assets are primarily attributable to appreciation (depreciation) of investments.
For the period ended October 31, 2014 there were no distributions paid by the Fund.
Capital losses incurred after October 31 (“Post-October Losses”) within the taxable year can be deemed to arise on the first business day of the Fund’s next taxable year. At October 31, 2014, the Fund had no post-October losses.
At October 31, 2014, the effect of permanent book/tax reclassifications resulted in increases (decreases) to the components of net assets as follows:
Undistributed
Net Investment
Income | | Accumulated
Capital
and Other
Gains/(Losses) | | Paid-in Capital |
| $1,401 | | $ — | | $(1,401) |
For financial reporting purposes, capital accounts are adjusted to reflect the tax character of permanent book/tax differences.
6. INVESTMENT TRANSACTIONS
Purchases and sales of investments (excluding in-kind transactions) for the period ended October 31, 2014 were $0 and $0 respectively.
Purchases and sales of in-kind transactions for the period ended October 31, 2014 were $11,169,429 and $0 respectively.
7. INVESTMENT RISKS
The Fund is subject to the principal risks described below, some or all of these risks may adversely affect the Fund’s NAV, yield, total return and ability to meet its investment objective. As with any investment, an investment in the Fund could result in a loss or the performance of the Fund could be inferior to that of other investments.
Risks Related to Investing in Germany
Germany is a significant exporter to its major trading partners, which are other Western European developed nations and the United States. Therefore, Germany’s economy is dependent on the economies of these other countries. As such, reductions by these countries in spending on German exports could adversely impact the German economy. Many of these Western European developed nations, including Germany, are member states of the EU and Economic and EMU. As a result, these member states are dependent upon one another economically and politically.
During the most recent financial crisis, the German economy, along with certain other EU economies, experienced a significant economic slowdown. Recently, new concerns emerged in relation to the economic health of the EU. These concerns have led to tremendous downward pressure on certain financial institutions, including German financial services companies. During the recent European debt crisis, Germany played a key role in stabilizing the euro. However, such efforts may prove unsuccessful, and any ongoing crisis may continue to significantly affect the economies of every country in Europe, including Germany.
The Fund’s investment in German issuers subjects the Fund to legal, regulatory, political, currency, security, and economic risks specific to Germany. The German economy, along with certain other EU economies, experienced a significant economic slowdown during the recent financial crisis.
Structural Risk
Germany is subject to risks of social unrest and heavy governmental control, either of which may adversely affect investments in Germany.
Political and Social Risk
Certain sectors and regions of Germany have experienced high unemployment and labor and social unrest. These issues may cause downturns in the German markets or the German industries or sectors in which the Fund invests.
|
| Notes to Financial Statements (continued) |
| October 31, 2014 |
Heavy Governmental Control and Regulation
Heavy regulation of labor and product markets is pervasive in Germany. These regulations may at times stifle German economic growth or cause prolonged periods of recession.
Equity Risk
The Fund invests in equity securities. Equity risk is the risk that the value of the securities that the Fund holds will fall due to general market and economic conditions, perceptions regarding the industries in which the issuers of securities the Fund holds participate or factors relating to specific companies in which the Fund invest.
Index Tracking Risk
While the Fund seeks to achieve a high degree of correlation with the Index, the Fund’s return may not match the return of the Index due to, among other reasons, operating expenses, transaction costs, cash flows, and operational inefficiencies. For example, the Fund incurs operating expenses not applicable to the Index and incurs costs when buying and selling securities, particularly where the Fund must rebalance its securities holdings to reflect changes in the composition of the Index. Because these and other costs are not factored into the return of the Index, the Fund’s return may deviate significantly from the return of the Index.
Currency Risk
Because the Fund’s NAV is determined in U.S. dollars, the Fund’s NAV could decline if the currency of a non-U.S. market in which the Fund invests depreciates against the U.S. dollar. Currency exchange rates can be very volatile and can change quickly and unpredictably. Therefore, the value of an investment in the Fund may also go up or down quickly and unpredictably and investors may lose money.
Non-U.S. Securities Risk
Investments in the securities of non-U.S. issuers are subject to the risks associated with investing in those non-U.S. markets, such as heightened risks of inflation or nationalization. The Fund may lose money due to political, economic and geographic events affecting issuers of German securities or German markets.
Passive Management Risk
Because the Fund is not “actively” managed, unless a security is removed from the Index, the Fund generally would not sell the security. Therefore, the Fund may underperform funds that actively shift their portfolio assets to take advantage of market opportunities or to move to defensive positions to lessen the impact of a market decline or a decline in the value of one or more issuers.
Non-Diversified Risk
Because the Fund is non-diversified under the 1940 Act and may invest in a smaller number of issuers or a larger proportion of its assets may be invested in a single issuer, the gains and losses on a single investment may have a greater impact on the Fund’s NAV and may make the Fund more volatile than more diversified funds.
New Fund Risk
The Fund is a new fund. As a new fund, there can be no assurance that the Fund will grow to or maintain an economically viable size, in which case the Fund may experience greater tracking error to its Underlying Index than it otherwise would be at higher asset levels or it could ultimately liquidate.
8. SUBSEQUENT EVENTS
The Fund has evaluated subsequent events through the date of issuance of this report and has determined that there are no other material events that would require disclosure.
|
| Report of Independent Registered Public Accounting Firm |
| October 31, 2014 |
To the Board of Directors and Shareholders
Recon Capital DAX Germany ETF
We have audited the accompanying statement of assets and liabilities, including the portfolio of investments, of Recon Capital DAX Germany ETF (the Fund) as of October 31, 2014, and the related statements of operations , changes in net assets and financial highlights for the period from October 23, 2014 (commencement of operations) to October 31, 2014. These financial statements and financial highlights are the responsibility of the Fund’s management. Our responsibility is to express an opinion on these financial statements and financial highlights based on our audit.
We conducted our audit in accordance with the standards of the Public Company Accounting Oversight Board (United States). Those standards require that we plan and perform the audit to obtain reasonable assurance about whether the financial statements and financial highlights are free of material misstatement. The Fund is not required to have, nor were we engaged to perform, an audit of its internal control over financial reporting. Our audit included consideration of internal control over financial reporting as a basis for designing audit procedures that are appropriate in the circumstances, but not for the purpose of expressing an opinion on the effectiveness of the Fund’s internal control over financial reporting. Accordingly, we express no such opinion. An audit also includes examining, on a test basis, evidence supporting the amounts and disclosures in the financial statements. Our procedures included confirmation of securities owned as of October 31, 2014, by correspondence with the custodian. An audit also includes assessing the accounting principles used and significant estimates made by management, as well as evaluating the overall financial statement presentation. We believe that our audit provides a reasonable basis for our opinion.
In our opinion, the financial statements and financial highlights referred to above present fairly, in all material respects, the financial position of Recon Capital DAX Germany ETF as of October 31, 2014, and the results of its operations, and the changes in its net assets and its financial highlights for the period then ended in conformity with accounting principles generally accepted in the United States of America.

Boston, Massachusetts
December 29, 2014
|
| Supplemental Information (unaudited) |
| October 31, 2014 |
INFORMATION ABOUT PORTFOLIO HOLDINGS
The Fund files its complete schedule of portfolio holdings for its first and third fiscal quarters with the Securities and Exchange Commission (“SEC”) on Form N-Q. The Fund’s Form N-Q is available without charge, upon request, by calling toll-free at (877) 756-7873. Furthermore, you may obtain the Form N-Q on the SEC’s website at www.sec.gov. The Fund’s portfolio holdings are posted on the Fund’s website at www.reconfunds.com daily.
INFORMATION ABOUT PROXY VOTING
A description of the policies and procedures the Fund uses to determine how to vote proxies relating to portfolio securities is provided in the Statement of Additional Information (“SAI”). The SAI is available without charge upon request by calling toll-free at (877) 756-7873, by accessing the SEC’s website at www.sec.gov, or by accessing the Fund’s website at www.reconfunds.com.
Information regarding how the Fund voted proxies relating to portfolio securities during the period ended October 31 is available by calling toll-free at (877) 756-7873 or by accessing the SEC’s website at www.sec.gov.
PRIVACY POLICY
The Fund collects non-public information about you from the following sources:
| • | Information we receive about you on applications or other forms; |
| • | Information you give us orally; and |
| • | Information about your transactions with us or others. |
The Fund does not disclose any non-public personal information about its customers or former customers without the customer’s authorization, except as permitted by law or in response to inquiries from governmental authorities. The Fund may share information with affiliated parties and unaffiliated third parties with whom we have contracts for servicing the Fund. The Fund will provide unaffiliated third parties with only the information necessary to carry out their assigned responsibility. The Fund maintains physical, electronic and procedural safeguards to guard your non-public personal information and require third parties to treat your non-public information with the same high degree of confidentially.
In the event that you hold shares of the Fund through a financial intermediary, including, but not limited to, a broker-dealer, bank, or trust company, the privacy policy of your financial intermediary would govern how your nonpublic personal information would be shared by those entities with unaffiliated third parties.
Discount & Premium Information
The table that follows presents information about the differences between the daily market price on secondary markets for shares of a Fund and that Fund’s net asset value. Net asset value, or “NAV”, is the price per share at which the Fund issues and redeems shares. It is calculated in accordance with the standard formula for valuing fund shares. The “Market Price” of the Fund generally is determined using the midpoint between the highest bid and the lowest offer on the stock exchange on which the shares of the Fund are listed for trading, as of the time that the Fund’s NAV is calculated. The Fund’s Market Price may be at, above or below its NAV. The NAV of the Fund will fluctuate with changes in the market value of its portfolio holdings. The Market Price of the Fund will fluctuate in accordance with changes in its NAV, as well as market supply and demand.
Premiums or discounts are the differences (expressed as a percentage) between the NAV and Market Price of the Fund on a given day, generally at the time NAV is calculated. A premium is the amount that the Fund is trading above the reported NAV, expressed as a percentage of the NAV. A discount is the amount that the Fund is trading below the reported NAV, expressed as a percentage of the NAV. The following information shows the frequency distributions of premiums and discounts for the Fund.
|
| Supplemental Information (unaudited) (concluded) |
| October 31, 2014 |
The information shown for the Fund is for the period from inception date of the Fund through October 31, 2014.
Each line in the table shows the number of trading days in which the Fund traded within the premium/discount range indicated. The number of trading days in the premium/discount range is also shown as a percentage of the total number of trading days in the period covered by the table. All data presented here represents past performance, which cannot be used to predict future results.
| | | | | Market Price
Above or Equal to NAV | | Market Price
Below NAV |
| Fund | | Basis Point
Differential | | Number
of Days | | % of
Total Days | | Number
of Days | | % of
Total Days |
| Recon Capital DAX Germany ETF | | | | | | | | | | |
| October 23, 2014 – October 31, 2014 | | 0 – 49.9 | | 7 | | 87.50% | | 1 | | 12.50% |
| | | 50 – 99.9 | | — | | 0.00% | | — | | 0.00% |
| | | 100 – 199.9 | | — | | 0.00% | | — | | 0.00% |
| | | > 200 | | — | | 0.00% | | — | | 0.00% |
| | | Total | | 7 | | 87.50% | | 1 | | 12.50% |
Federal Tax Status of Dividends Declared During the Tax Year
Qualified Dividend Income — Certain dividends paid by the Fund may be subject to a maximum tax rate of 0.00%, as provided for by the Jobs and Growth Tax Relief Reconciliation Act of 2003.
Dividend Received Deduction — For corporate shareholders, the percentage of ordinary income distributions for the year ended October 31, 2014 that qualifies for the dividends received deduction is 0.00%.
In January 2015, you will be advised on IRS Form 1099 DIV as to the Federal tax status of the distributions received by you in calendar year 2014.
|
| Board Review and Approval of Advisory Contracts (unaudited) |
| October 31, 2014 |
Advisory Agreement Review
At an “in-person” meeting held on August 18, 2014 (the “Meeting”) in New York, NY, the Board of Trustees of the ETF Series Trust (the “Trust”), including the trustees who are not “interested persons” of the Trust as defined in Section 2(a)(19) of the Investment Company Act of 1940, as amended (the “Independent Trustees”), discussed issues pertaining to the proposed approval of the Advisory Agreement with respect to Recon Capital DAX Germany ETF (the “Fund”) with representatives from Recon Capital Advisors, LLC (the “Adviser”) and with legal counsel. This information formed the primary basis for the Board’s determinations. During the Meeting, the Board reviewed a memorandum that detailed the duties and responsibilities of the Trustees with respect to their consideration of the Advisory Agreement. The Board also reviewed the advisory agreement approval materials provided by the Adviser including, but not limited to: (1) organizational overviews of the Adviser and biographies of the personnel providing services to the Fund, (2) a copy of the Advisory Agreement, (3) the Adviser’s Form ADV, and (4) exchange-traded fund and mutual fund industry fee comparison data.
The Board, including a majority of the Independent Trustees, determined that approval of the Advisory Agreement was in the best interests of the Fund. The Board of Trustees, including the Independent Trustees, did not identify any single factor or group of factors as all important or controlling and considered all factors together. In evaluating whether to approve the Advisory Agreement for the Fund, the Board considered numerous factors, as described below.
Nature, Extent and Quality of Services. The Board reviewed and considered the nature and extent of the investment advisory services to be provided by the Adviser under the Advisory Agreement and the supervisory services to be provided by the Adviser under the Supervision Agreement (together, the “Management Agreements”).
The Board reviewed and considered the qualifications of the portfolio managers, and other key personnel of the Adviser who will provide the advisory and supervisory services to the Fund and concluded that the nature and extent of the advisory and supervisory services to be provided are necessary and appropriate for the conduct of the business and investment activities of the Fund and supported its decision to approve the Management Agreements.
Performance Relative to Comparable Funds Managed by the Adviser and Other Investment Advisers. The Board considered the Adviser’s plan to arrange for a public offering of shares of the Fund to raise assets for investment and that the offering had not yet begun and determined that, accordingly, it was not appropriate to evaluate the performance of the Fund as compared to funds managed by other investment advisers at this time. It was noted that the Adviser does not currently manage any other comparable funds.
Fees Relative to Other Proprietary Funds Managed by the Adviser With Comparable Investment Strategies. The Board noted that the Adviser did not currently manage any other funds with comparable investment strategies and, accordingly, no comparison of the Fund’s fees to those of other funds and/or accounts managed by the Adviser with comparable investment strategies could be made at this time.
Fees and Expenses Relative to Comparable Funds and Other Accounts Managed by Other Advisers. The Board (i) reviewed the advisory and management fee rates proposed to be paid under the Management Agreements and the anticipated total expense ratios of the Fund and (ii) reviewed information provided by the Adviser regarding the management fee rates paid by an expense peer group for the Fund. The Board noted that DAX had management fees equal to or lower than all comparable funds identified by the Adviser. It was noted that, generally, separate advisory fee information was not available with respect to peer funds due to the prevalence of unified, all-in management fees among such funds. The Board concluded that the proposed management fee rates and anticipated total expense ratio for the Fund were acceptable as compared to peer funds.
|
| Board Review and Approval of Advisory Contracts (unaudited) (concluded) |
| October 31, 2014 |
Economies of Scale. The Board reviewed the structure of the proposed management fee schedules under the Management Agreements and noted that the management fee schedules for the Fund and the unitary fee structure effectively acts as a cap on the fees (excluding certain investment-related and extraordinary expenses) to be paid by the Fund. The Board considered that the Fund’s potential growth was uncertain and concluded that it would be premature to consider economies of scale as a factor in approving the Management Agreements at the present time.
Profitability of the Adviser. Since the Fund has not begun operations and have not paid any fees to the Adviser, the Board concluded that this was not a factor that needed to be considered at the present time. They did note, however, the discussion of the Adviser’s profitability generally.
Other Benefits of the Relationship. The Board considered other benefits to the Adviser derived from its relationship with the Fund. Since the Fund has not begun operations and have not paid any fees to the Adviser, the Board concluded that these benefits were not a factor that needed to be considered at the present time.
Resources of the Adviser. The Board considered whether the Adviser is financially sound and has the resources necessary to perform its obligations under the Management Agreements. The Board also reviewed and considered the organizational structure of the Adviser and the policies and procedures formulated and adopted by the Adviser for managing the Fund’s operations.
General Conclusion. After considering and weighing all of the above factors, the Board concluded that it would be in the best interest of the Fund and its future shareholders to approve the Advisory Agreement, which will remain in effect for two years, and the Supervision Agreement, which will remain in effect for one year, and thereafter must be approved annually by the Board to continue in effect. In reaching this conclusion, the Board did not give particular weight to any single factor referenced above. It is possible that individual Board members may have weighed these factors differently in reaching their individual decisions to approve the Management Agreements.
|
| Trustees and Officers of the Trust (unaudited) |
| October 31, 2014 |
The Board of the Trust consists of four Trustees, three of whom are not “interested persons” (as defined in the 1940 Act), of the Trust (“Independent Trustees”). Robinson Jacobs, an Independent Trustee, serves as Chairman of the Board. The Board is responsible for overseeing the management and operations of the Trust, including the general supervision of the duties and responsibilities performed by the Adviser and other service providers to the Trust. The Adviser is responsible for the day-to-day administration, operation and business affairs of the Trust.
The Board believes that each Trustee’s experience, qualifications, attributes or skills on an individual basis and in combination with those of the other Trustees lead to the conclusion that the Board possesses the requisite skills and attributes to carry out its oversight responsibilities with respect to the Trust. The Board believes that the Trustees’ ability to review, critically evaluate, question and discuss information provided to them, to interact effectively with the Adviser, the Trust’s other service providers, counsel and independent auditors, and to exercise effective business judgment in the performance of their duties, support this conclusion. In reaching its conclusion, the Board also has considered the (i) experience, qualifications, attributes and/or skills, among others, of its members, (ii) each member’s character and integrity, (iii) the length of service as a board member of the Trust, (iv) each person’s willingness to serve and ability to commit the time necessary to perform the duties of a Trustee, and (v) as to each Independent Trustee, such Trustee’s status as not being an “interested person” (as defined in the 1940 Act) of the Trust. In addition, the following specific experience, qualifications, attributes and/or skills apply as to each Trustee.
References to the experience, qualifications, attributes, and skills of Trustees are pursuant to requirements of the SEC, do not constitute the holding out of the Board or any Trustee as having any special expertise or experience, and shall not impose any greater responsibility or liability on any such person or on the Board by reason thereof.
The Trustees of the Trust, their addresses, positions with the Trust, ages, term of office and length of time served, principal occupations during the past five years, the number of portfolios in the Fund Complex overseen by each Trustee and other directorships, if any, held by the Trustees, are set forth below.
Independent Trustees
Name, Address1
and Age | | Position(s)
Held with
the Trust | | Term of
Office2 and
Length of
Time Served | | Principal Occupation(s) During Past Five Years | | Number of
Portfolios
in the Fund
Complex
Overseen | | Other
Directorships
Held By
Trustee During
Past Five Years |
| Robinson Jacobs, 35 | | Trustee and | | Since | | Analyst Gagnon Securities (September 2012 – Present). | | 3 | | None. |
| | | Chairman of | | July 2014 | | Vice President CSL Capital (April 2011 – May 2012). | | | | |
| | | the Board of | | | | Consultant to various hedge fund groups | | | | |
| | | Trustees | | | | | | | | |
| Richard Keary, 51 | | Trustee | | Since | | Principal and Founder, Global ETF Advisors, LLC | | 3 | | None. |
| | | | | October 2014 | | (consulting firm) (April 2009 – Present); Managing | | | | |
| | | | | | | Director — Business Development, NASDAQ OMX Group | | | | |
| | | | | | | (April 2002 – April 2009) | | | | |
| Mark Buckley- | | Trustee | | Since | | Controller and the chief compliance officer of Numina | | 3 | | None. |
| Jones, 34 | | | | July 2014 | | Capital Management, LLC (January 2014 – Present). | | | | |
| | | | | | | Chief financial officer for VS Capital Partners, LP | | | | |
| | | | | | | (August 2011 – December 2013) and Berman Capital | | | | |
| | | | | | | Management, LP (May 2007 – July 2011) | | | | |
| |
| Interested Trustee |
| Garrett Paolella, 28 | | Trustee, | | Since | | Managing Partner, Recon Capital Partners, LLC | | 3 | | None. |
| | | President, | | October 2013 | | (October 2011 – Present); Executive Director, MKM | | | | |
| | | Chief | | | | Partners (research, sales and trading firm) (June 2008 – | | | | |
| | | Executive | | | | January 2011) | | | | |
| | | Officer, | | | | | | | | |
| | | Chief | | | | | | | | |
| | | Financial | | | | | | | | |
| | | Officer and | | | | | | | | |
| | | Secretary | | | | | | | | |
| 1 | The address for each Trustee and officer is 145 Mason Street, 2nd Floor, Greenwich, Connecticut 06830. |
| 2 | Each Trustee serves until resignation, death, retirement or removal. Officers are elected yearly by the Trustees. |
|
| Trustees and Officers of the Trust (unaudited) (concluded) |
| October 31, 2014 |
Officer Information
The Officers of the Trust, their addresses, positions with the Trust, ages and principal occupations during the past five years are set forth below.
Officer’s Name,
Address1 and Age | | Position(s) Held
with the Trust | | Term of Office2
and Length of
Time Served | | Principal Occupation(s) During The Past Five Years |
| Tami M. Pester, 40 | | Chief Compliance | | Since | | Director, Foreside Compliance Services (March 2014 – Present); Associate Counsel |
| | | Officer | | October 2014 | | and Compliance Officer, Acadian Asset Management LLC (June 2008 – |
| | | | | | | December 2012) |
| 1 | The address for each officer is 145 Mason Street, 2nd Floor, Greenwich, Connecticut 06830. |
| 2 | Officers are elected yearly by the Trustees. |
|
| Annual Report |
| October 31, 2014 |
| |
| Recon Capital NASDAQ 100 Covered Call ETF |
| Ticker: QYLD |
NASDAQ 100® is a registered trademark of The NASDAQ Stock Market, Inc. and has been licensed for use by Recon Capital Partners, LLC and the Recon Capital NASDAQ 100® Covered Call ETF (the “Fund”). The Fund is not sponsored, endorsed, issued, sold or promoted by NASDAQ, nor does this company make any representation regarding the advisability of investing in the Fund.
The financial statements contained herein are submitted for the general information of the shareholders of the Fund. This report is not authorized for distribution to prospective investors in the Fund unless preceded or accompanied by an effective prospectus.
Not FDIC Insured • No Bank Guarantee • May Lose Value
ETF Distributors, LLC, distributor.
An investment in the Fund is subject to investment risk, including the possible loss of principal amount invested. The risks associated with the Fund are detailed in the prospectus which include: stock market risk, index risk, tracking error risk, replication management risk, market price risk and trading halts risk.
Shares are bought and sold at market price (not NAV), are not individually redeemable, and owners of the Shares may acquire those Shares from the Funds and tender those shares for redemption to the Funds in Creation Unit aggregations only.
|
| TABLE OF CONTENTS |
| October 31, 2014 |
|
| Letter to Shareholders (unaudited) |
| October 31, 2014 |
Dear Shareholder:
For the period ended October 31, 2014, the primary focus for investors was gauging a potential rise in interest rates given the expedited manner in which the Federal Reserve (the “Fed”) had begun to wind down its latest round of monetary stimulus. In 2013, the Fed committed to an open-ended program to purchase $85 billion of mortgage and treasury bonds each month until the unemployment rate fell and the US economy showed consistent signs of growth. At the start of 2014, leadership within the Fed shifted as Chairman Ben Bernanke was relieved of his duties by Chairperson Janet Yellen. The markets watched closely and began hypothesizing of potential fallouts as the Fed began reducing its bond purchase program. Even with the removal of monetary stimulus, the Fed expressed a commitment to keeping short term interest rates low.
Equity markets continued to move higher through mid-September despite geo-political tensions in the Middle East and Russia. Towards the end of September, volatility increased and the markets had a near 10% correction. The energy sector was one of the worst performing, as West Texas Intermediate Crude Oil fell from over $100/barrel in the summer to below $75/barrel at the beginning of October. Shortly after the correction, markets rallied back to pre-selloff levels to end October.
2014 has been a banner year for service related companies which has been vividly illustrated by the outperformance of NASDAQ listed companies. U.S. large capitalization stocks have led the way for 2014. Developed international large cap equities have participated in part of the end of October rally, but overall struggled this year on concerns of slowing growth and deflation in the Eurozone. The European Central Bank (“ECB”) has reiterated their commitment to quantitative easing in the region, which has helped to lift European equities off their lows. Continued accommodative monetary policies, as well as limited signs of inflation are going to be leading themes for the next year, both domestically and abroad.
Investors have continued to seek yield as interest rates are still hovering well below average historical levels. The U.S. 10 Year Treasury has been below 3% all of 2014 and even breached 2% briefly in the beginning of October. High yield corporate bonds in particular have moved higher as investors were willing to assume more risk to obtain higher yield.
Given the current market environment, investors have recognized that in order to attain a successful long-term investment strategy they must have a well-diversified portfolio. Recon Capital focuses on implementing its investment expertise and operational infrastructure to deliver market-driven, value-added products that meet the evolving needs of global investors in the current market of low interest rates and geo-political uncertainty.
I want to personally thank you for your interest in Recon Capital and our investment products. I invite you to visit us at www.ReconFunds.com or call us at (203) 900-1400 for more information on our company and our investment solutions.
Sincerely,
Garrett K. Paolella
Chief Executive Officer
Registered Representative of ETF Distributors LLC
|
| Management Discussion of Fund Performance (unaudited) |
| October 31, 2014 |
RECON CAPITAL NASDAQ-100 COVERED CALL ETF
The Recon Capital NASDAQ 100 Covered Call ETF (the “Fund”) seeks to provide investment results that will closely correspond, before fees and expenses, generally to the price and yield performance of the CBOE NASDAQ-100® BuyWrite Index. The CBOE NASDAQ-100® BuyWrite Index (“Index”) measures the total return of a portfolio consisting of equity securities of the 100 (104) companies included in the NASDAQ-100® Index and call options systematically written on those securities through a “buy-write” or covered call strategy.
A “buy-write” strategy is an investment strategy in which the Fund buys a specific basket of stocks (such as the NASDAQ-100® Index) and sells covered call options that correspond to that basket of stocks. The Fund implements its strategy by investing in all securities contained in the NASDAQ-100 Index and seeks to track the Index’s weightings per each constituent. The Fund also sells NASDAQ-100® Index call options on a monthly basis. These options are determined by the CBOE but are typically the closest to at-the-money and the position is updated for the next month (rolled) on the third Friday of every month, which is option expiration.
For the period ended October 31, 2014, the Fund’s Net Asset Value (“NAV”) returned 5.11% versus 5.34% for the CBOE NASDAQ-100® BuyWrite Index.
The principal contributors to Fund performance during the period, in aggregate, was the Fund’s exposure to the underlying equities contained in the NASDAQ-100® Index along with periods of elevated volatility which increased the monthly income component of the strategy. A driver that impeded the Fund’s performance included the Special Opening Quotation (SOQ) which determines the final settlement value of the Index on option expiration. There were instances over the trailing 12-month period where the SOQ was higher than the NDX opening level. Another driver that impacted performance was periods of low volatility which reduced the monthly income component.
Hypothetical Growth of a $10,000 Investment
(Since Inception, 12/12/2013 through 10/31/2014)
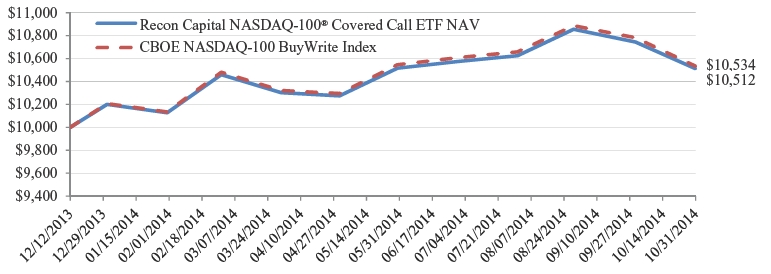
This chart illustrates the performance of a hypothetical $10,000 investment made on the Fund’s inception, and is not intended to imply any future performance.
An Index is a statistical measure of a specified financial market or sector. An index does not actually hold a portfolio of securities, incur expenses or pay any transaction costs. Therefore index returns do not reflect deductions for fees or expenses and are not available for direct investment. In comparison, the Fund’s performance is negatively impacted by these deductions. Fund returns do not reflect brokerage commissions or taxes that a shareholder would pay on Fund distributions or on transactions in Fund shares.
|
| Management Discussion of Fund Performance (unaudited) (concluded) |
| October 31, 2014 |
Fund Performance History
Average Annual Total Returns (%) (for period ended October 31, 2014)
| |
| | Since Inception |
| Market Price1,2 | 5.27% |
| Net Asset Value1 | 5.11% |
| CBOE NASDAQ-100 BuyWrite Index | 5.34% |
| 1 | Fund Inception Date: 12/12/2013. |
| 2 | The price used to calculate Market Price returns is determined by using the closing price listed on the NYSE Arca and does not represent returns an investor would receive if shares were traded at other times. |
| • | Past performance is not predictive of future results. |
| • | The investment return and principal value of an investment will fluctuate. An investor’s shares, when redeemed, may be worth more or less than the original cost. |
| • | Total return is calculated assuming reinvestment of all dividends and distributions. |
| • | The graph does not reflect the deduction of taxes that a shareholder would have to pay on Fund distributions or the redemption of the Fund shares. |
| • | For performance information current to the most recent month-end, please call (877) 756-7873. |
|
| Shareholder Expense Example (unaudited) |
| October 31, 2014 |
As a shareholder of the Recon Capital NASDAQ 100 Covered Call ETF (the “Fund”), you incur a unitary management fee. The following example is intended to help you understand your ongoing costs (in dollars and cents) of investing in the Fund and to compare these costs with the ongoing costs of investing in other funds. The example is based on an investment of $1,000 invested at the beginning of the period and held throughout the entire six-month period from May 1, 2014 to October 31, 2014.
Actual expenses
The first line under the Fund in the table below provides information about actual account values and actual expenses. You may use the information in this line, together with the amount you invested, to estimate the expenses that you paid over the period. Simply divide your account value by $1,000 (for example, an $8,600 account value divided by $1,000 = 8.6), then multiply the result by the number in the first line for the Fund under the heading entitled “Expenses Paid During Period” to estimate the expenses you paid on your account during this period.
Hypothetical example for comparison purposes
The second line under the Fund in the table provides information about hypothetical account values and hypothetical expenses based on the Fund’s actual expense ratio and an assumed rate of return of 5% per year before expenses, which is not the Fund’s actual return. The hypothetical account values and expenses may not be used to estimate the actual ending account balance or expenses you paid for the period. You may use this information to compare the ongoing costs of investing in the Fund and other funds. To do so, compare this 5% hypothetical example with the 5% hypothetical examples that appear in the shareholder reports of the other funds.
Please note that the expenses shown in the table are meant to highlight your ongoing costs only and do not reflect any transactional costs, such as brokerage commissions paid on purchases and sales of Fund shares. Therefore, the second line under the Fund in the table is useful in comparing ongoing Fund costs only and will not help you determine the relative total costs of owning different funds. In addition, if these transactional costs were included, your costs would have been higher.
| | | Beginning
Account
Value
5/01/14 | | Ending
Account
Value
10/31/14 | | Annualized
Expense Ratio
for the Period | | Expenses
Paid
During
Period* |
| Recon Capital NASDAQ 100 Covered Call ETF | | | | | | | | |
| Actual | | $1,000.00 | | $1,023.10 | | 0.60% | | $3.04 |
| Hypothetical (5% return before expenses) | | $1,000.00 | | $1,022.20 | | 0.60% | | $3.04 |
| * | Expenses are calculated using the Fund’s annualized expense ratio, multiplied by the ending value for the period, multiplied by 184/365 (to reflect the six-month period.) |
|
| Portfolio of Investments — Recon Capital NASDAQ 100 Covered Call ETF |
| October 31, 2014 |
| Security Description | | Shares | | Fair
Value ($) |
| Common Stocks — 107.8% | | | | | | | | |
| | | | | | | | | |
| Consumer Discretionary — 19.0% | | | | | | | | |
| Amazon.com, Inc.*† | | | 1,269 | | | $ | 387,629 | |
| Bed Bath & Beyond, Inc.*† | | | 591 | | | | 39,798 | |
| Charter Communications, Inc. Class A*† | | | 295 | | | | 46,725 | |
| Comcast Corp. Class A† | | | 5,977 | | | | 330,827 | |
| DIRECTV*† | | | 1,438 | | | | 124,804 | |
| Discovery Communications, Inc. Class A*† | | | 409 | | | | 14,458 | |
| Discovery Communications, Inc. Class C*† | | | 409 | | | | 14,311 | |
| DISH Network Corp. Class A*† | | | 610 | | | | 38,826 | |
| Dollar Tree, Inc.*† | | | 581 | | | | 35,191 | |
| Expedia, Inc.† | | | 326 | | | | 27,700 | |
| Garmin Ltd.† | | | 542 | | | | 30,070 | |
| Liberty Global PLC Class A*† | | | 621 | | | | 28,237 | |
| Liberty Interactive Corp. Class A*† | | | 1,335 | | | | 34,897 | |
| Liberty Media Corp. Class A*† | | | 295 | | | | 14,166 | |
| Liberty Media Corp. Class C*† | | | 592 | | | | 28,375 | |
| Liberty Ventures Series A*† | | | 189 | | | | 6,634 | |
| Marriott International, Inc. Class A† | | | 839 | | | | 63,554 | |
| Mattel, Inc.† | | | 945 | | | | 29,361 | |
| Netflix, Inc.*† | | | 164 | | | | 64,414 | |
| O’Reilly Automotive, Inc.*† | | | 296 | | | | 52,060 | |
| Priceline Group, Inc. (The)*† | | | 144 | | | | 173,694 | |
| Ross Stores, Inc.† | | | 601 | | | | 48,513 | |
| Sirius XM Holdings, Inc.*† | | | 16,882 | | | | 57,905 | |
| Staples, Inc.† | | | 1,827 | | | | 23,166 | |
| Starbucks Corp.† | | | 2,104 | | | | 158,978 | |
| Tesla Motors, Inc.*† | | | 345 | | | | 83,386 | |
| Tractor Supply Co.† | | | 389 | | | | 28,483 | |
| TripAdvisor, Inc.*† | | | 365 | | | | 32,361 | |
| Twenty-First Century Fox, Inc. Class A† | | | 3,968 | | | | 136,817 | |
| Viacom, Inc. Class B† | | | 1,092 | | | | 79,367 | |
| Wynn Resorts Ltd. † | | | 286 | | | | 54,343 | |
| | | | | | | | 2,289,050 | |
|
| Consumer Staples — 4.8% | | | | | | | | |
| Costco Wholesale Corp. † | | | 1,217 | | | | 162,311 | |
| Keurig Green Mountain, Inc. † | | | 457 | | | | 69,349 | |
| Kraft Foods Group, Inc. † | | | 1,665 | | | | 93,823 | |
| Mondelez International, Inc. Class A † | | | 4,757 | | | | 167,732 | |
| Monster Beverage Corp.*† | | | 468 | | | | 47,212 | |
| Whole Foods Market, Inc. † | | | 1,039 | | | | 40,864 | |
| | | | | | | | 581,291 | |
|
| Health Care — 16.7% | | | | | | | | |
| Alexion Pharmaceuticals, Inc.*† | | | 542 | | | | 103,717 | |
| Amgen, Inc.† | | | 2,113 | | | | 342,686 | |
| Biogen Idec, Inc.*† | | | 656 | | | | 210,629 | |
| Catamaran Corp.*† | | | 581 | | | | 27,696 | |
| Celgene Corp.*† | | | 2,236 | | | | 239,453 | |
| Cerner Corp.*† | | | 960 | | | | 60,807 | |
| Express Scripts Holding Co.*† | | | 2,100 | | | | 161,322 | |
| Gilead Sciences, Inc.*† | | | 4,211 | | | | 471,632 | |
| Henry Schein, Inc.*† | | | 238 | | | | 28,567 | |
| Illumina, Inc.*† | | | 373 | | | | 71,832 | |
| Intuitive Surgical, Inc.*† | | | 105 | | | | 52,059 | |
| Mylan, Inc.*† | | | 1,067 | | | | 57,138 | |
| Regeneron Pharmaceuticals, Inc.*† | | | 276 | | | | 108,667 | |
| Vertex Pharmaceuticals, Inc.*† | | | 650 | | | | 73,216 | |
| | | | | | | | 2,009,421 | |
| Security Description | | Shares | | Fair
Value ($) |
| Common Stocks — 107.8% (continued) | | | | | | | | |
| Industrials — 1.8% | | | | | | | | |
| CH Robinson Worldwide, Inc.† | | | 429 | | | $ | 29,691 | |
| Expeditors International of Washington, Inc.† | | | 581 | | | | 24,786 | |
| Fastenal Co.† | | | 827 | | | | 36,421 | |
| PACCAR, Inc.† | | | 989 | | | | 64,602 | |
| Stericycle, Inc.*† | | | 238 | | | | 29,988 | |
| Verisk Analytics, Inc. Class A*† | | | 468 | | | | 29,180 | |
| | | | | | | | 214,668 | |
| | | | | | | | | |
| Information Technology — 64.1% | | | | | | | | |
| Activision Blizzard, Inc.† | | | 1,950 | | | | 38,902 | |
| Adobe Systems, Inc.*† | | | 1,400 | | | | 98,168 | |
| Akamai Technologies, Inc.*† | | | 497 | | | | 29,969 | |
| Altera Corp.† | | | 895 | | | | 30,761 | |
| Analog Devices, Inc.† | | | 876 | | | | 43,467 | |
| Apple, Inc.† | | | 16,598 | | | | 1,792,584 | |
| Applied Materials, Inc.† | | | 3,370 | | | | 74,443 | |
| Autodesk, Inc.*† | | | 630 | | | | 36,250 | |
| Automatic Data Processing, Inc.† | | | 1,350 | | | | 110,403 | |
| Avago Technologies Ltd.† | | | 694 | | | | 59,858 | |
| Baidu, Inc.*(a)† | | | 765 | | | | 182,659 | |
| Broadcom Corp. Class A† | | | 1,457 | | | | 61,019 | |
| CA, Inc.† | | | 1,256 | | | | 36,499 | |
| Check Point Software Technologies Ltd.*† | | | 551 | | | | 40,912 | |
| Cisco Systems, Inc.† | | | 14,271 | | | | 349,211 | |
| Citrix Systems, Inc.*† | | | 514 | | | | 33,014 | |
| Cognizant Technology Solutions Corp. Class A*† | | | 1,685 | | | | 82,312 | |
| eBay, Inc.*† | | | 3,444 | | | | 180,810 | |
| Equinix, Inc.† | | | 143 | | | | 29,873 | |
| F5 Networks, Inc.*† | | | 218 | | | | 26,810 | |
| Facebook, Inc. Class A*† | | | 6,249 | | | | 468,612 | |
| Fiserv, Inc.*† | | | 724 | | | | 50,304 | |
| Google, Inc. Class A*† | | | 784 | | | | 445,210 | |
| Google, Inc. Class C*† | | | 933 | | | | 521,622 | |
| Intel Corp.† | | | 13,833 | | | | 470,460 | |
| Intuit, Inc.† | | | 792 | | | | 69,704 | |
| KLA-Tencor Corp.† | | | 468 | | | | 37,042 | |
| Linear Technology Corp.† | | | 656 | | | | 28,103 | |
| Maxim Integrated Products, Inc.† | | | 792 | | | | 23,237 | |
| Micron Technology, Inc.*† | | | 2,949 | | | | 97,582 | |
| Microsoft Corp.† | | | 22,826 | | | | 1,071,681 | |
| NetApp, Inc.† | | | 951 | | | | 40,703 | |
| NVIDIA Corp.† | | | 1,588 | | | | 31,030 | |
| NXP Semiconductor NV*† | | | 686 | | | | 47,101 | |
| Paychex, Inc.† | | | 1,020 | | | | 47,879 | |
| QUALCOMM, Inc.† | | | 4,683 | | | | 367,662 | |
| SanDisk Corp.† | | | 630 | | | | 59,308 | |
| Seagate Technology PLC† | | | 905 | | | | 56,861 | |
| Symantec Corp.† | | | 1,941 | | | | 48,176 | |
| Texas Instruments, Inc.† | | | 3,054 | | | | 151,662 | |
| Western Digital Corp.† | | | 656 | | | | 64,531 | |
| Xilinx, Inc.† | | | 744 | | | | 33,093 | |
| Yahoo!, Inc.*† | | | 2,837 | | | | 130,644 | |
| | | | | | | | 7,700,131 | |
The accompanying notes are an integral part of these financial statements.
|
| Portfolio of Investments — Recon Capital NASDAQ 100 Covered Call ETF (concluded) |
| October 31, 2014 |
| Security Description | | Shares | | Fair
Value ($) |
| Common Stocks — 107.8% (continued) | | | | | | | | |
| Materials — 0.4% | | | | | | | | |
| Sigma-Aldrich Corp.† | | | 335 | | | $ | 45,530 | |
| | | | | | | | | |
| Telecommunication Services — 1.0% | | | | | | | | |
| SBA Communications Corp. Class A*† | | | 354 | | | | 39,765 | |
| VimpelCom Ltd. (a)† | | | 5,059 | | | | 32,782 | |
| Vodafone Group PLC (a)† | | | 1,503 | | | | 49,930 | |
| | | | | | | | 122,477 | |
| TOTAL INVESTMENTS — 107.8% | | | | | | | | |
| (Cost $12,083,521) | | | | | | | 12,962,568 | |
| Liabilities in Excess of Other Assets — (7.8)% | | | | | | | (940,913 | ) |
| Total Net Assets — 100.0% | | | | | | $ | 12,021,655 | |
| | | Number of
Contracts | | |
| Options Written — (8.1)% | | | | | | | | |
| NDX Call, Expires 11/22/14, Strike Price $3,830 | | | 30 | | | $ | (974,250 | ) |
| TOTAL OPTIONS WRITTEN — (8.1)% | | | | | | | | |
| (Premiums Received $287,609) | | | | | | $ | (974,250 | ) |
| * | Non-income producing security. |
| (†) | All or a portion of this security has been segregated as collateral for written options contracts. The aggregate market value of the collateral posted was $12,962,568. |
| (a) | American Depositary Receipts. |
PLC Public Limited Company.
| | | |
| Sector Allocation | | |
| (as of October 31, 2014) | | |
| Information Technology | | | 64.1 | % |
| Consumer Discretionary | | | 19.0 | |
| Health Care | | | 16.7 | |
| Consumer Staples | | | 4.8 | |
| Industrials | | | 1.8 | |
| Telecommunication Services | | | 1.0 | |
| Materials | | | 0.4 | |
| Total Investments | | | 107.8 | |
| Liabilities in Excess of Other Assets | | | (7.8 | ) |
| Net Assets | | | 100.0 | % |
Percentages indicated are based upon net assets.
The Fund’s portfolio composition is subject to change.
The accompanying notes are an integral part of these financial statements.
|
| Statement of Assets and Liabilities |
| October 31, 2014 |
| | | Recon Capital
NASDAQ 100
Covered
Call ETF |
| Assets: | | |
| Investments, at cost: | | $ | 12,083,521 | |
| Investments, at fair value (Note 2) | | $ | 12,962,568 | |
| Cash | | | 36,560 | |
| Receivables: | | | | |
| Dividends and interest | | | 2,904 | |
| Total Assets | | | 13,002,032 | |
| |
| Liabilities: | | | | |
| Payables: | | | | |
| Accrued Advisory fees | | | 6,127 | |
| Options written, at value (premiums received $287,609) | | | 974,250 | |
| Total Liabilities | | | 980,377 | |
| Net Assets | | $ | 12,021,655 | |
| |
| Net Assets Consist of: | | | | |
| Paid-in capital | | $ | 12,085,407 | |
| Accumulated net realized loss on investments and options written | | | (256,158 | ) |
| Net unrealized appreciation on investments and options written | | | 192,406 | |
| Net Assets | | $ | 12,021,655 | |
| Shares outstanding (unlimited number of shares of beneficial interest authorized, without par value) | | | 500,000 | |
| Net asset value, per share | | $ | 24.04 | |
The accompanying notes are an integral part of these financial statements.
| | | Recon Capital
NASDAQ 100
Covered Call ETF |
| | | For the Period
December 12, 2013*
Through
October 31, 2014 |
| Investment Income: | | |
| Dividend income | | $ | 63,131 | |
| Expenses: | | | | |
| Advisory fees | | | 28,201 | |
| Net Investment Income | | | 34,930 | |
| | | | | |
| Realized and Unrealized Gain (Loss) | | | | |
| Net realized gain (loss) on: | | | | |
| Investments | | | 4,634 | |
| Options written | | | (350,832 | ) |
| In-kind transactions | | | 90,040 | |
| Net realized loss | | | (256,158 | ) |
| | | | | |
| Change in unrealized appreciation (depreciation) on: | | | | |
| Investments | | | 879,047 | |
| Options written | | | (686,641 | ) |
| Change in unrealized appreciation | | | 192,406 | |
| Net realized and unrealized loss on investments and options written | | | (63,752 | ) |
| Net decrease in net assets resulting from operations | | $ | (28,822 | ) |
| * | Commencement of operations. |
The accompanying notes are an integral part of these financial statements.
|
| Statement of Changes in Net Assets |
| | | Recon Capital
NASDAQ 100
Covered Call ETF |
| | | For the Period
December 12, 2013*
Through
October 31, 2014 |
| Investment Operations: | | | | |
| Net investment income | | $ | 34,930 | |
| Net realized loss on investments and options written | | | (256,158 | ) |
| Net change in unrealized appreciation on investments and options written | | | 192,406 | |
| Net decrease in net assets resulting from operations | | | (28,822 | ) |
| | | | | |
| Distributions to Shareholders from: | | | | |
| Net investment income | | | (34,930 | ) |
| Return of capital | | | (482,211 | ) |
| Total Distributions to Shareholders | | | (517,141 | ) |
| | | | | |
| Shareholder Transactions: | | | | |
| Proceeds from shares sold | | | 16,304,239 | |
| Cost of shares redeemed | | | (3,736,621 | ) |
| Net increase in net assets resulting from shareholder transactions | | | 12,567,618 | |
| Net increase in net assets | | | 12,021,655 | |
| | | | | |
| Net Assets: | | | | |
| Beginning of period | | | — | |
| End of period | | $ | 12,021,655 | |
| Including undistributed net investment income at end of period: | | | — | |
| | | | | |
| Shares Created and Redeemed: | | | | |
| Shares outstanding, beginning of period | | | — | |
| Shares sold | | | 650,000 | |
| Shares redeemed | | | (150,000 | ) |
| Shares outstanding, end of period | | | 500,000 | |
| * | Commencement of operations. |
The accompanying notes are an integral part of these financial statements.
| | | Recon Capital
NASDAQ 100
Covered Call ETF |
| | | For the Period
December 12, 20131
Through
October 31, 2014 |
| For A Share Outstanding Throughout the Period Presented: | | |
| Net asset value, beginning of period | | $ | 25.00 | |
| Investment operations: | | | | |
| Net investment income2 | | | 0.16 | |
| Net realized and unrealized gain on investments and options written7 | | | 1.11 | |
| Total from investment operations | | | 1.27 | |
|
| | | | | |
| Distributions to Shareholders from: | | | | |
| Net investment income | | | (0.35 | ) |
| Return of capital | | | (1.88 | ) |
| Total Distributions to Shareholders | | | (2.23 | ) |
| Net asset value, end of period | | $ | 24.04 | |
|
| | | | | |
| Total return3 | | | 5.11 | % |
| Net assets, end of period (000’s omitted) | | $ | 12,022 | |
|
| | | | | |
| Ratios/Supplemental Data: | | | | |
| Ratios to average net assets: | | | | |
| Expenses4 | | | 0.60 | % |
| Net investment income4 | | | 0.74 | % |
| Portfolio turnover rate5,6 | | | 18 | % |
| 1 | Commencement of operations. |
| 2 | Based on average shares outstanding. |
| 3 | Total return is calculated assuming an initial investment made at the net asset value on the first day of the period, reinvestment of dividends and distributions at net asset value during the period, and redemption at net asset value on the last day of the period. Total return calculated for a period of less than one year is not annualized. |
| 5 | Portfolio turnover excludes the value of portfolio securities received or delivered as a result of in-kind creations or redemptions of the Fund’s capital shares. |
| 7 | The amount of realized and unrealized gain on investments and options written per share does not accord with the amounts reported in the Statement of Operations for the period ended October 31, 2014 due to fluctuating market values in relation to the timing of creation and redemption of Fund shares. |
The accompanying notes are an integral part of these financial statements.
|
| Notes to Financial Statements |
| October 31, 2014 |
1. ORGANIZATION
ETF Series Trust (the “Trust”) was organized as a Delaware statutory trust on May 17, 2012 and is currently comprised of three investment portfolios. These financial statements relate to the Recon Capital NASDAQ 100 Covered Call ETF (the “Fund”), a series of the Trust. The Fund is classified as a non-diversified, open-end, management investment company under the Investment Company Act of 1940, as amended (“1940 Act”). The Fund commenced operations on December 12, 2013.
The Fund’s investment objective is to provide investment results that will closely correspond, before fees and expenses, generally to the price and yield performance of the CBOE NASDAQ-100® BuyWrite Index (the “Index”). The Index measures the total return of a portfolio consisting of common stocks of the 100 companies included in the NASDAQ-100® Index and call options systematically written on those securities through a “buy-write” or covered call strategy. A “buy-write” strategy is an investment strategy in which the Fund buys a specific basket of stocks (such as the NASDAQ-100® Index) and sells covered call options that correspond to that basket of stocks.
2. SIGNIFICANT ACCOUNTING POLICIES
Use of Estimates
These financial statements are prepared in conformity with accounting principles generally accepted in the United States of America (“GAAP”), which require management to make certain estimates and assumptions that affect the reported amounts of assets and liabilities and disclosure of contingent assets and liabilities at the date of the financial statements and reported amounts of increases and decreases in the net assets from operations during the reporting period. Actual results could differ from those estimates. The following is a summary of significant accounting policies followed by the Fund:
Securities Valuation
Security holdings traded on a national securities exchange are valued based on their last sale price. Price information on listed securities is taken from the exchange where the security is primarily traded. Securities regularly traded in an over the counter market are valued at the latest quoted sale price in such market or in the case of the NASDAQ, at the NASDAQ Official Closing Price. If market quotations are not readily available, or if it is determined that a quotation of a security does not represent fair value, then the security is valued at fair value as determined in good faith using procedures adopted by the Trust’s Board of Trustees (the “Board”). Short-term securities with 60 days or less remaining to maturity are valued using the amortized cost method, which approximates current market value.
Purchased and written options contracts listed on exchanges are valued at their reported mean of bid and ask quotations; over-the-counter derivative contracts are fair valued using price evaluations provided by a pricing service approved by the Board of Trustees of the Trust.
Fair Value Measurement
GAAP requires disclosure regarding the inputs and valuation techniques used to measure fair value and any changes in valuation inputs or techniques. In addition, investments shall be disclosed by major category.
The Fund categorizes its fair value measurements according to a three-level hierarchy that maximizes the use of observable inputs and minimizes the use of unobservable inputs by prioritizing that the most observable input be used when available. Observable inputs are those that market participants would use in pricing an investment based on market data obtained from sources independent of the reporting entity. Unobservable inputs are those that reflect the Fund’s assumptions about the information market participants would use in pricing an investment. An investment’s level within the fair value hierarchy is based on the lowest level of any input that is deemed significant to the asset or liability’s fair value measurement. The input levels are not necessarily an indication of the risk or liquidity associated with investments at that level. For example, certain U.S. government securities are generally high quality and liquid, however, they are reflected as Level 2 because the inputs used to determine fair value may not always be quoted prices in an active market.
Fair value inputs are summarized in the three broad levels listed below:
| • | Level 1 — Valuations based on quoted prices for identical investments in active markets that the Fund has the ability to access at the measurement date (including NAV for open-end mutual funds). Valuation adjustments are not applied to Level 1 investments. |
| • | Level 2 — Valuations based on other significant observable inputs (including quoted prices for similar securities, interest rates, prepayment speeds, credit risks, etc.). |
| • | Level 3 — Valuations based on significant unobservable inputs (including the Fund’s own assumptions and judgment in determining the fair value of investments). |
|
| Notes to Financial Statements (continued) |
| October 31, 2014 |
Inputs that are used in determining fair value of an investment may include price information, credit data, volatility statistics, and other factors. These inputs can be either observable or unobservable. The availability of observable inputs can vary between investments, and is affected by various factors such as the type of investment, and the volume and level of activity for that investment or similar investments in the marketplace. The inputs will be considered by the Investment Manager, along with any other relevant factors in the calculation of an investment’s fair value. The Fund uses prices and inputs that are current as of the measurement date, which may include periods of market dislocations. During these periods, the availability of prices and inputs may be reduced for many investments. This condition could cause an investment to be reclassified between the various levels within the hierarchy.
Investments falling into the Level 3 category are primarily supported by quoted prices from brokers and dealers participating in the market for those investments. However, these may be classified as Level 3 investments due to lack of market transparency and corroboration to support these quoted prices. Additionally, valuation models may be used as the pricing source for any remaining investments classified as Level 3. These models may rely on one or more significant unobservable inputs and/or significant assumptions by the Investment Manager. Inputs used in valuations may include, but are not limited to, financial statement analysis, capital account balances, discount rates and estimated cash flows, and comparable company data.
Under the direction of the Board, the Investment Manager’s Valuation Committee (the Committee) is responsible for overseeing the valuation procedures approved by the Board. The Committee consists of voting and non-voting members from various groups within the Adviser’s organization, including operations and accounting, trading and investments, compliance, risk management and legal.
The Committee meets at least monthly to review and approve valuation matters, which may include a description of specific valuation determinations, data regarding pricing information received from approved pricing vendors and brokers and the results of Board-approved valuation control policies and procedures (the Policies). The Policies address, among other things, instances when market quotations are readily available, including recommendations of third party pricing vendors and a determination of appropriate pricing methodologies; events that require specific valuation determinations and assessment of fair value techniques; securities with a potential for stale pricing, including those that are illiquid, restricted, or in default; and the effectiveness of third-party pricing vendors, including periodic reviews of vendors. The Committee meets more frequently, as needed, to discuss additional valuation matters, which may include the need to review back-testing results, review time-sensitive information or approve related valuation actions. The Committee reports to the Board, with members of the Committee meeting with the Board at each of its regularly scheduled meetings to discuss valuation matters and actions during the period, similar to those described earlier.
For investments categorized as Level 3, the Committee monitors information similar to that described above, which may include: (i) data specific to the issuer or comparable issuers, (ii) general market or specific sector news and (iii) quoted prices and specific or similar security transactions. The Committee considers this data and any changes from prior periods in order to assess the reasonableness of observable and unobservable inputs, any assumptions or internal models used to value those securities and changes in fair value. This data is also used to corroborate, when available, information received from approved pricing vendors and brokers. Various factors impact the frequency of monitoring this information (which may occur as often as daily). However, the Committee may determine that changes to inputs, assumptions and models are not required as a result of the monitoring procedures performed.
The following table is a summary of the inputs used to value the Fund’s investments at October 31, 2014:
| | | Level 1 | | Level 2 | | Level 3 | | Total |
| Valuation Inputs | | | | | | | | |
| Assets* | | | | | | | | |
| Common Stocks | | $ | 12,962,568 | | | $ | — | | | $ | — | | | $ | 12,962,568 | |
| Liabilities | | | | | | | | | | | | | | | | |
| Other Financial Instruments** | | | — | | | | (974,250 | ) | | | — | | | | (974,250 | ) |
| Total | | $ | 12,962,568 | | | $ | (974,250 | ) | | $ | — | | | $ | 11,988,318 | |
| * | See the Portfolio of Investments for breakout by sector. |
| ** | Other financial instruments include written option contracts, which are valued at fair value. |
For significant movements between levels within the fair value hierarchy, the Fund has adopted a policy of recognizing the transfers into and out of all levels at the beginning of period method. There were no transfers between levels during the period.
A reconciliation of assets in which Level 3 inputs are used in determining fair value is presented when there are significant Level 3 investments at the end of the period. There were no Level 3 investments held during the period.
|
| Notes to Financial Statements (continued) |
| October 31, 2014 |
Indemnification
In the normal course of business, the Fund may enter into contracts that contain a variety of representations which provide general indemnifications for certain liabilities. The Fund’s maximum exposure under these arrangements is unknown. However, the Fund has not had prior claims or losses pursuant to these contracts and expects the risk of loss to be remote.
Cash and Cash Equivalents
Cash and cash equivalents include funds from time to time deposited with financial institutions and short-term, liquid investments in a money market fund. Cash and cash equivalents are carried at cost which approximates fair value.
Concentration of Risk
The Company places its cash and cash equivalents with financial institutions and, at times, cash held in money market accounts may exceed the Federal Deposit Insurance Corporation insured limit.
Investment Valuation
The Net Asset Value (“NAV”) is determined as of the close of trading (generally, 4:00 PM Eastern Time) on each day the New York Stock Exchange (“NYSE”) is open for trading. NAV per share is calculated by dividing the Fund’s net assets by the number of fund shares outstanding.
Security Transactions
Security transactions are accounted for on the trade date. Realized gains and losses on sales of investment securities are calculated using specific identification.
Master Netting Arrangements
Accounting Standards Update No. 2011-11 “Disclosures about Offsetting Assets and Liabilities” (“ASU 2011-11”) is generally intended to (i) help investors and other financial statement users to better assess the effect or potential effect of offsetting arrangements on a company’s financial position (ii) improve transparency in the reporting of how companies mitigate credit risk and (iii) facilitate comparisons between those entities that prepare their financial statements on the basis of US GAAP and those entities that prepare their financial statements on the basis of international financial reporting standards. ASU 2011-11 requires entities to disclose (i) gross and net information about both instruments and transactions eligible for offset in the financial statements and (ii) instruments and transactions subject to an agreement similar to a master netting agreement. ASU 2011-11 is limited in scope to the following financial instruments, to the extent they are offset in the financial statements or subject to an enforceable master netting arrangement or similar agreement: (i) recognized derivative instruments accounted for under ASC 815 (Derivatives and Hedging); (ii) repurchase agreements and reverse repurchase agreements; and (iii) securities borrowing and securities lending transactions.
In order to better define its contractual rights and to secure rights that will help the Fund mitigate its counterparty risk, the Fund may enter into an International Swaps and Derivatives Association, Inc. Master Agreement (“ISDA Master Agreement”) or similar agreement with its counterparties. An ISDA Master Agreement is a bilateral agreement between the Fund and a counterparty that governs over-the-counter derivatives (“OTC”), including forward contracts, and typically contains, among other things, collateral posting terms, netting and rights of set-off provisions in the event of a default and/or termination event. Under an ISDA Master Agreement, the Fund may, under certain circumstances, offset with the counterparty certain derivative financial instruments’ payables and receivables to create a single net payment. The provisions of the ISDA Master Agreement typically permit a single net payment in the event of a default (close-out netting) or similar event, including the bankruptcy or insolvency of the counterparty.
Collateral requirements generally differ by type of derivative. Collateral terms are contract-specific for OTC derivatives (e.g. foreign exchange contracts, options and certain swaps). Generally, for transactions traded under an ISDA Master Agreement, the collateral requirements are typically calculated by netting the marked to market amount for each transaction under such agreement and comparing that amount to the value of any collateral currently pledged by the Fund and the counterparty. Generally, the amount of collateral due from or to a counterparty must exceed a minimum transfer amount threshold before a transfer is required to be made. To the extent amounts due to the Fund from its derivatives counterparties are not fully collateralized, contractually or otherwise, the Fund bears the risk of loss from counterparty non-performance.
As of October 31, 2014, the Fund had written options fair value of $(974,250).
Investment Income and Expenses
Dividend income is recognized on the ex-dividend date. The Fund distributes all or substantially all of its net investment income to shareholders in the form of dividends. Expenses are recognized on the accrual basis.
|
| Notes to Financial Statements (continued) |
| October 31, 2014 |
3. INVESTMENT MANAGEMENT AND OTHER AGREEMENTS
Investment Advisory and Supervisory Agreement
The Trust has entered into an Investment Advisory Agreement (the “Advisory Agreement”) and Supervisory Agreement (the “Supervisory Agreement”) with the Adviser, on behalf of the Fund. Pursuant to the Supervisory Agreement, the Adviser has overall supervisory responsibility for the general management and investment of the Fund’s securities portfolio. The Adviser is a wholly-owned subsidiary of Recon Capital Partners, LLC, a Delaware limited liability corporation established in 2011 that serves as investment adviser to high net worth individuals through separately managed accounts and private funds. For its services, the Fund pays the Adviser an annual rate of 0.60% of the Fund’s average daily net assets. Such fee, an all-in fee, is accrued daily and paid monthly. It pays for substantially all expenses of the Fund, including the cost of transfer agency, custody, fund administration, legal, audit, printing and certain administrative, distribution and investment advisory services. The advisory fee paid for the period ended October 31, 2014 was $28,201.
Distribution Agreement
ETF Distributors LLC (the “Distributor”) serves as the Fund’s Distributor. The Distributor will not distribute shares in less than Creation Units, as defined in Note 4, and does not maintain a secondary market in shares. The shares are expected to be traded in the secondary market.
The Board has adopted a distribution and service plan, where the Fund is authorized to pay distribution fees in connection with the sale and distribution of its shares and pay service fees in connection with the provision of ongoing services to shareholders. No distribution fees are currently paid by the Fund and there are no current plans to impose the fees.
Administrator, Custodian, Accounting Agent and Transfer Agent
The Bank of New York Mellon (in each capacity, the “Administrator”, “Custodian,” “Accounting Agent” or “Transfer Agent”) serves as the Fund’s Administrator, Custodian, Accounting Agent and Transfer Agent pursuant to the Fund Administration and Accounting Agreement. The Bank of New York Mellon is a subsidiary of The Bank of New York Mellon Corporation, a financial holding company.
4. CREATION AND REDEMPTION TRANSACTIONS
The Fund issues and redeems shares on a continuous basis at NAV in groups of 50,000 shares called “Creation Units.” Creation Units of the Fund are issued and redeemed generally in exchange for specified securities held by the Fund generally included in the Index and a specified cash payment. The Trust reserves the right to permit or require a “cash” option for creations and redemptions of shares. In each instance of such cash creations or redemptions, the Trust may impose transaction fees based on transaction expenses related to the particular exchange that will be higher than the transaction fees associated with in-kind purchase or redemptions.
Only “Authorized Participants” who have entered into contractual arrangements with the Distributor may purchase or redeem shares directly from the Fund. An Authorized Participant is either (i) a broker-dealer or other participant in the clearing process through the Continuous Net Settlement System of the National Securities Clearing Corporation or (ii) a Depository Trust Company (“DTC”) participant and, in each case, must have executed a Participant Agreement with the Distributor. Most retail investors will not qualify as Authorized Participants or have the resources to buy and sell whole Creation Units. Therefore, they will be unable to purchase or redeem the shares directly from the Fund. Rather, most retail investors will purchase shares in the secondary market with the assistance of a broker and will be subject to customary brokerage commissions or fees.
5. FEDERAL INCOME TAX
Tax Information, Dividends and Distributions to Shareholders and Uncertain Tax Positions
The Fund intends to qualify as a regulated investment company by complying with the requirements under Subchapter M of the Internal Revenue Code of 1986, as amended, by distributing substantially all of its net investment income and net realized gains to shareholders. Dividends and/or distributions, if any, are paid to shareholders invested in the Fund on the applicable record date, at least annually. Net realized capital gains, if any, will be distributed by the Fund at least annually. The amount of dividends and distributions from net investment income and net realized capital gains are determined in accordance with Federal income tax regulations which may differ from GAAP. These “book/tax” differences are either considered temporary or permanent in nature. To the extent these differences are permanent in nature, such amounts are reclassified within the components of net assets based on their Federal tax basis treatment; temporary differences do not require reclassification.
Management evaluates tax positions taken or expected to be taken in the course of preparing the Fund’s tax returns to determine whether the tax positions are “more-likely-than-not” of being sustained by the applicable tax authority. Tax positions not deemed to meet the more-likely-than-not threshold would be recorded as an expense in the current year. The Fund is required to analyze all open tax years.
|
| Notes to Financial Statements (continued) |
| October 31, 2014 |
Open tax years are those years that are open for examination by the relevant income taxing authority. As of October 31, 2014, the Fund’s open tax year is open for examination. There are no examinations in progress at period end.
At October 31, 2014, the cost of investments on a tax basis was as follows:
| Cost | | Gross
Unrealized
Appreciation | | Gross
Unrealized
Depreciation | | Net
Unrealized
Appreciation |
| $12,962,568 | | $ — | | $ — | | $ — |
The differences between book and tax basis cost of investments and net unrealized appreciation (depreciation) are primarily attributable to mixed straddle adjustment and nontaxable distributions from regulated investment companies.
At October 31, 2014, the components of undistributed or accumulated earnings/loss on a tax-basis were as follows:
Undistributed
Net Investment
Income/(Loss) | | Accumulated
Capital
and Other
Gains/(Losses) | | Net
Unrealized
Appreciation | | Total
Earnings/
(Loss) |
| $ — | | $(63,752) | | $ — | | $(63,752) |
The differences between book and tax basis components of net assets are primarily attributable to mixed straddles and other book and tax differences.
The tax character of distributions paid during the period ended October 31, 2014 was $34,930 from ordinary income and $482,211 from return of capital.
For financial reporting purposes, capital accounts are adjusted to reflect the tax character of permanent book/tax differences. Reclassifications are primarily due to the tax treatment of mixed straddles and deemed distributions on shareholder redemptions.
Capital loss carryforward is calculated and reported as of a specific date. Results of transactions and other activity after that date may affect the amount of capital loss carryforward actually available for the Fund to utilize. Capital losses generated in years beginning December 22, 2010 can be carried forward for an unlimited period, whereas previous losses expire in 8 tax years. Capital losses with an expiration period may not be used to offset capital gains until all net capital losses without an expiration date have been utilized. Capital loss carryforwards with no expiration date will retain their character as either short-term or long-term capital losses instead of as short-term capital losses as under prior law. The ability to utilize capital loss carryforward in the future may be limited under the Internal Revenue Code and related regulations based on the results of future transactions. The Fund had capital loss carryforward generated in the current year in the amount of $63,752 that does not expire.
6. INVESTMENT TRANSACTIONS
Purchases and sales of investments (excluding in-kind transactions) for the period ended October 31, 2014 were $2,755,589 and $994,296 respectively.
Purchases and sales of in-kind transactions for the period ended October 31, 2014 were $13,965,501 and $3,737,922 respectively.
7. DERIVATIVE FINANCIAL INSTRUMENTS
Options
Transactions in options written during the period ended October 31, 2014, which serve as indicator of the volume of activity, were as follows:
| | | Notional
Amount | | Received
Premiums |
| Options outstanding, at beginning of period | | $ | — | | | $ | — | |
| Options written | | | 191 | | | | 1,142,896 | |
| Options closed | | | (124 | ) | | | (709,675 | ) |
| Options expired | | | (37 | ) | | | (145,612 | ) |
| Options outstanding, at end of period | | $ | 30 | | | $ | 287,609 | |
The Fund may write covered call options on portfolios securities and other financial instruments. Premiums received are recorded as liabilities. The liabilities are subsequently adjusted to reflect the current value of the options written. Premiums received from writing options which expire are treated as realized gains. Premiums received from writing options which are exercised or are closed are added
|
| Notes to Financial Statements (continued) |
| October 31, 2014 |
to or offset against the proceeds or amount paid on the transactions to determine the net realized gain or loss. By writing a covered call option, the Fund, in exchange for the premium, foregoes the opportunity for capital appreciation above the exercise price should the market of the price of the underlying security increase. By writing a put option, the Fund, in exchange for the premium, accepts the risk of having to purchase a security at an exercise price that is above the current price. Changes in value of written options are reported as change in unrealized gain (loss) on written options in the Statement of Operations. When the written option expires, is terminated or is sold, the Fund will record a gain or loss, which is reported as realized gain (loss) on written options in the Statement of Operations.
The Fund may purchase call and put options on the portfolio securities or other financial instruments. The Fund may purchase call options to protect against an increase in the price of the security or financial instrument it anticipates purchasing. The Fund may purchase put options on securities which it holds or other financial instruments to protect against a decline in the value of the security or financial instrument or to close out covered written positions. Changes in value of purchased options are reported as part of change in unrealized gain (loss) on investments in the Statement of Operations. When the purchased option expires, is terminated or is sold, the Fund will record a gain or loss, which is reported as part of realized gain (loss) on investments in the Statement of Operations.
Risks may arise from an imperfect correlation between the change in market value of the securities held by the Fund and the prices of options relating to the securities purchased or sold by the Fund and from possible lack of liquid secondary market for an option. The maximum exposure to loss for any purchased option is limited to the premium initially paid for the option. Written uncovered call options subject the Fund to unlimited risk of loss. Written covered call options limit the upside potential of a security above the strike price. Put options written subject the Fund to risk of loss if the value of the security declines below the exercise price minus the put premium.
Transactions in derivative instruments reflected on the Statement of Assets and Liabilities at October 31, 2014, is:
| | | Equity Risk |
| Liabilities | | |
| Options written, at value | | $ | (974,250 | ) |
| Total Liabilities | | $ | (974,250 | ) |
Transactions in derivative instruments reflected on the Statement of Operations during the period were as follows:
| | | Equity Risk |
| Net Realized Loss | | |
| Options written | | $ | (350,832 | ) |
| Net realized loss | | $ | (350,832 | ) |
| | | Equity Risk |
| Change in Unrealized Depreciation | | |
| Options written | | $ | (686,641 | ) |
| Net unrealized depreciation | | $ | (686,641 | ) |
For the period ended October 31, 2014, the monthly average notional value of the written options contracts held by the Fund was $159,037.
8. INVESTMENT RISKS
The Fund is subject to the principal risks described below, some or all of these risks may adversely affect the Fund’s NAV, yield, total return and ability to meet its investment objective. As with any investment, an investment in the Fund could result in a loss or the performance of the Fund could be inferior to that of other investments.
Equity Risk
The Fund invests in equity securities. Equity risk is the risk that the value of the securities that the Fund holds will fall due to general market and economic conditions, perceptions regarding the industries in which the issuers of securities the Fund holds participate or factors relating to specific companies in which the Fund invest.
|
| Notes to Financial Statements (continued) |
| October 31, 2014 |
Index Tracking Risk
While the Fund seeks to achieve a high degree of correlation with the Index, the Fund’s return may not match the return of the Index due to, among other reasons, operating expenses, transaction costs, cash flows, and operational inefficiencies. For example, the Fund incurs operating expenses not applicable to the Index and incurs costs when buying and selling securities, particularly where the Fund must rebalance its securities holdings to reflect changes in the composition of the Index. The Fund may be unable to write options at the times or at the prices that the Index expects such options to be written. Because these and other costs are not factored into the return of the Index, the Fund’s return may deviate significantly from the return of the Index.
Counterparty Risk
The Fund is exposed to counterparty risk, or the risk that an institution or other entity with which the Fund has unsettled or open transactions will default. The potential loss to the Fund could exceed the value of the financial assets recorded in the Fund’s financial statements. Financial assets, which potentially expose the Fund to counterparty risk, consist principally of cash due from counterparties and investments. The Adviser seeks to minimize the Fund’s counterparty risk by performing reviews of each counterparty and by minimizing concentration of counterparty risk by undertaking transactions with multiple customers and counterparties on recognized and reputable exchanges. Delivery of securities sold is only made once the Fund has received payment. Payment is made on a purchase once the securities have been delivered by the counterparty. The trade will fail if either party fails to meet its obligation.
Non-Diversified Risk
The Fund is non-diversified and can invest a greater portion of its assets in securities of individual issuers than diversified funds. As a result, changes in the market value of a single investment could cause greater fluctuations in share price than would occur in a diversified fund. This may increase the Fund’s volatility and cause the performance of a relatively small number of issuers to have a greater impact on the Fund’s performance.
New Fund Risk
The Fund is a new fund. As a new fund, there can be no assurance that the Fund will grow to or maintain an economically viable size, in which case the Fund may experience greater tracking error to its Underlying Index than it otherwise would be at higher asset levels or it could ultimately liquidate.
9. SUBSEQUENT EVENTS
In preparing these financial statements, the Fund’s management has evaluated events and transactions for potential recognition or disclosure through the date the financial statements were issued. Since October 31, 2014, the Fund paid the following dividends:
| Payable Date | | Per Share Distributed |
| December 3, 2014 | | $0.203405 | |
Other than the above distributions, no notable events have occurred between year-end and the issuance of the financial statements.
|
| Report of Independent Registered Public Accounting Firm |
| October 31, 2014 |
To the Board of Trustees of ETF Series Trust and the Shareholders of Recon Capital NASDAQ 100 Covered Call ETF
We have audited the accompanying statement of assets and liabilities of the Recon Capital NASDAQ 100 Covered Call ETF (the “Fund”), a series of shares of beneficial interest in ETF Series Trust, including the portfolio of investments, as of October 31, 2014, and the related statements of operations, changes in net assets and the financial highlights for the period December 12, 2013 (commencement of operations) through October 31, 2014. These financial statements and financial highlights are the responsibility of the Fund’s management. Our responsibility is to express an opinion on these financial statements and financial highlights based on our audit.
We conducted our audit in accordance with the standards of the Public Company Accounting Oversight Board (United States). Those standards require that we plan and perform the audit to obtain reasonable assurance about whether the financial statements and financial highlights are free of material misstatement. An audit includes examining, on a test basis, evidence supporting the amounts and disclosures in the financial statements. Our procedures included confirmation of securities owned as of October 31, 2014 by correspondence with the custodian and broker. An audit also includes assessing the accounting principles used and significant estimates made by management, as well as evaluating the overall financial statement presentation. We believe that our audit provides a reasonable basis for our opinion.
In our opinion, the financial statements and financial highlights referred to above present fairly, in all material respects, the financial position of Recon Capital NASDAQ 100 Covered Call ETF, as of October 31, 2014, and the results of its operations, the changes in its net assets and its financial highlights for the period December 12, 2013 through October 31, 2014, in conformity with accounting principles generally accepted in the United States of America.

BBD, LLP
Philadelphia, Pennsylvania
December 23, 2014
|
| Shareholder Voting Results (unaudited) |
| October 31, 2014 |
On July 7, 2014, the Board’s Nominating Committee determined to recommend to the Board that it approve and nominate Mark Buckley-Jones, Jared Franken1 and Robinson Jacobs to serve as trustees of the Trust to replace Brian Mandel, Xiwen Fan and Armand Principato upon their resignation from the Board. After considering the Nominating Committee’s recommendation, the Board nominated and determined to recommend to the Trust’s shareholders that they elect Mark Buckley-Jones, Jared Franken and Robinson Jacobs to serve as trustees.
After considering the Board’s recommended nominees, 55.95% of the Trust’s outstanding shares as of July 7, 2014 voted to elect Mark Buckley-Jones, Jared Franken and Robinson Jacobs, to serve as trustees of the Trust. Mark Buckley-Jones’, Jared Franken’s and Robinson Jacobs’ service as trustees of the Trust began on July 27, 2014.
| 1 | Jared Franken subsequently withdrew from his position prior to commencing services as a trustee. |
|
| Supplemental Information (unaudited) |
| October 31, 2014 |
INFORMATION ABOUT PORTFOLIO HOLDINGS
The Fund files its complete schedule of portfolio holdings for its first and third fiscal quarters with the Securities and Exchange Commission (“SEC”) on Form N-Q. The Fund’s Form N-Q is available without charge, upon request, by calling toll-free at (877) 756-7873. Furthermore, you may obtain the Form N-Q on the SEC’s website at www.sec.gov. The Fund’s portfolio holdings are posted on the Fund’s website at www.reconfunds.com daily.
INFORMATION ABOUT PROXY VOTING
A description of the policies and procedures the Fund uses to determine how to vote proxies relating to portfolio securities is provided in the Statement of Additional Information (“SAI”). The SAI is available without charge upon request by calling toll-free at (877) 756-7873, by accessing the SEC’s website at www.sec.gov, or by accessing the Fund’s website at www.reconfunds.com.
Information regarding how the Fund voted proxies relating to portfolio securities during the period ended October 31 is available by calling toll-free at (877) 756-7873 or by accessing the SEC’s website at www.sec.gov.
PRIVACY POLICY
The Fund collects non-public information about you from the following sources:
| • | Information we receive about you on applications or other forms; |
| • | Information you give us orally; and |
| • | Information about your transactions with us or others. |
The Fund does not disclose any non-public personal information about its customers or former customers without the customer’s authorization, except as permitted by law or in response to inquiries from governmental authorities. The Fund may share information with affiliated parties and unaffiliated third parties with whom we have contracts for servicing the Fund. The Fund will provide unaffiliated third parties with only the information necessary to carry out their assigned responsibility. The Fund maintains physical, electronic and procedural safeguards to guard your non-public personal information and require third parties to treat your non-public information with the same high degree of confidentially.
In the event that you hold shares of the Fund through a financial intermediary, including, but not limited to, a broker-dealer, bank, or trust company, the privacy policy of your financial intermediary would govern how your nonpublic personal information would be shared by those entities with unaffiliated third parties.
Discount & Premium Information
The table that follows presents information about the differences between the daily market price on secondary markets for shares of a Fund and that Fund’s net asset value. Net asset value, or “NAV”, is the price per share at which the Fund issues and redeems shares. It is calculated in accordance with the standard formula for valuing fund shares. The “Market Price” of the Fund generally is determined using the midpoint between the highest bid and the lowest offer on the stock exchange on which the shares of the Fund are listed for trading, as of the time that the Fund’s NAV is calculated. The Fund’s Market Price may be at, above or below its NAV. The NAV of the Fund will fluctuate with changes in the market value of its portfolio holdings. The Market Price of the Fund will fluctuate in accordance with changes in its NAV, as well as market supply and demand.
Premiums or discounts are the differences (expressed as a percentage) between the NAV and Market Price of the Fund on a given day, generally at the time NAV is calculated. A premium is the amount that the Fund is trading above the reported NAV, expressed as a percentage of the NAV. A discount is the amount that the Fund is trading below the reported NAV, expressed as a percentage of the NAV. The following information shows the frequency distributions of premiums and discounts for the Fund.
|
| Supplemental Information (unaudited) (concluded) |
| October 31, 2014 |
The information shown for the Fund is for the period from inception date of the Fund through October 31, 2014.
Each line in the table shows the number of trading days in which the Fund traded within the premium/discount range indicated. The number of trading days in the premium/discount range is also shown as a percentage of the total number of trading days in the period covered by the table. All data presented here represents past performance, which cannot be used to predict future results.
| | | | | Market Price
Above or Equal to NAV | | Market Price
Below NAV |
| | | Basis Point
Differential | | Number
of Days | | % of
Total Days | | Number
of Days | | % of
Total Days |
| Recon Capital NASDAQ 100 Covered Call ETF | | | | | | | | | | |
| December 12, 2014 – October 31, 2014 | | 0 – 49.9 | | 139 | | 61.78% | | 65 | | 28.89% |
| | | 50 – 99.9 | | 14 | | 6.22% | | 2 | | 0.89% |
| | | 100 – 199.9 | | 5 | | 2.22% | | — | | 0.00% |
| | | > 200 | | — | | 0.00% | | — | | 0.00% |
| | | Total | | 158 | | 70.22% | | 67 | | 29.78% |
Federal Tax Status of Dividends Declared During the Tax Year
Qualified Dividend Income — Certain dividends paid by the Fund may be subject to a maximum tax rate of 0.00%, as provided for by the Jobs and Growth Tax Relief Reconciliation Act of 2003.
Dividend Received Deduction — For corporate shareholders, the percentage of ordinary income distributions for the year ended October 31, 2014 that qualifies for the dividends received deduction is 0.00%.
In January 2015, you will be advised on IRS Form 1099 DIV as to the Federal tax status of the distributions received by you in calendar year 2014.
|
| Trustees and Officers of the Trust (unaudited) |
| October 31, 2014 |
The Board of the Trust consists of four Trustees, three of whom are not “interested persons” (as defined in the 1940 Act), of the Trust (“Independent Trustees”). Robinson Jacobs, an Independent Trustee, serves as Chairman of the Board. The Board is responsible for overseeing the management and operations of the Trust, including the general supervision of the duties and responsibilities performed by the Adviser and other service providers to the Trust. The Adviser is responsible for the day-to-day administration, operation and business affairs of the Trust.
The Board believes that each Trustee’s experience, qualifications, attributes or skills on an individual basis and in combination with those of the other Trustees lead to the conclusion that the Board possesses the requisite skills and attributes to carry out its oversight responsibilities with respect to the Trust. The Board believes that the Trustees’ ability to review, critically evaluate, question and discuss information provided to them, to interact effectively with the Adviser, the Trust’s other service providers, counsel and independent auditors, and to exercise effective business judgment in the performance of their duties, support this conclusion. In reaching its conclusion, the Board also has considered the (i) experience, qualifications, attributes and/or skills, among others, of its members, (ii) each member’s character and integrity, (iii) the length of service as a board member of the Trust, (iv) each person’s willingness to serve and ability to commit the time necessary to perform the duties of a Trustee, and (v) as to each Independent Trustee, such Trustee’s status as not being an “interested person” (as defined in the 1940 Act) of the Trust. In addition, the following specific experience, qualifications, attributes and/or skills apply as to each Trustee.
References to the experience, qualifications, attributes, and skills of Trustees are pursuant to requirements of the SEC, do not constitute the holding out of the Board or any Trustee as having any special expertise or experience, and shall not impose any greater responsibility or liability on any such person or on the Board by reason thereof.
The Trustees of the Trust, their addresses, positions with the Trust, ages, term of office and length of time served, principal occupations during the past five years, the number of portfolios in the Fund Complex overseen by each Trustee and other directorships, if any, held by the Trustees, are set forth below.
Independent Trustees
Name, Address1
and Age | | Position(s)
Held with
the Trust | | Term of
Office2 and
Length of
Time Served | | Principal Occupation(s)
During Past Five Years | | Number of
Portfolios in
the Fund
Complex
Overseen | | Other
Directorships
Held By
Trustee During
Past Five Years |
| Robinson Jacobs, 35 | | Trustee and | | Since | | Analyst Gagnon Securities (September 2012 – Present). | | 3 | | None. |
| | | Chairman of | | July 2014 | | Vice President CSL Capital (April 2011 – May 2012). | | | | |
| | | the Board of | | | | Consultant to various hedge fund groups | | | | |
| | | Trustees | | | | | | | | |
| | | | | | | | | | | |
| Richard Keary, 51 | | Trustee | | Since | | Principal and Founder, Global ETF Advisors, LLC | | 3 | | None. |
| | | | | October 2013 | | (consulting firm) (April 2009 – Present); Managing | | | | |
| | | | | | | Director — Business Development, NASDAQ OMX Group | | | | |
| | | | | | | (April 2002 – April 2009) | | | | |
| | | | | | | | | | | |
| Mark Buckley- | | Trustee | | Since July | | Controller and the chief compliance officer of Numina | | 3 | | None. |
| Jones, 34 | | | | 2014 | | Capital Management, LLC (January 2014 – Present). | | | | |
| | | | | | | Chief financial officer for VS Capital Partners, LP | | | | |
| | | | | | | (August 2011 – December 2013) and Berman Capital | | | | |
| | | | | | | Management, LP (May 2007 – July 2011) | | | | |
| |
| Interested Trustee |
| Garrett Paolella, 28 | | Trustee, | | Since | | Managing Partner, Recon Capital Partners, LLC (October | | 3 | | None. |
| | | President, | | November | | 2011 – Present); Executive Director, MKM Partners | | | | |
| | | Chief | | 2013 | | (research, sales and trading firm) (June 2008 – January | | | | |
| | | Executive | | | | 2011) | | | | |
| | | Officer, | | | | | | | | |
| | | Chief | | | | | | | | |
| | | Financial | | | | | | | | |
| | | Officer and | | | | | | | | |
| | | Secretary | | | | | | | | |
| 1 | The address for each Trustee and officer is 145 Mason Street, 2nd Floor, Greenwich, Connecticut 06830. |
| 2 | Each Trustee serves until resignation, death, retirement or removal. Officers are elected yearly by the Trustees. |
|
| Trustees and Officers of the Trust (unaudited) (concluded) |
| October 31, 2014 |
Officer Information
The Officers of the Trust, their addresses, positions with the Trust, ages and principal occupations during the past five years are set forth below.
Position(s)
Held with
the Trust | | Term of Office2
and Length of
Time Served | | Principal
Occupation(s) | | During The Past Five Years |
| Tami M. Pester, 40 | | Chief Compliance | | Since | | Director, Foreside Compliance Services (March 2014 – Present); Associate |
| | | Officer | | August 2014 | | Counsel and Compliance Officer, Acadian Asset Management LLC (June 2008 – |
| | | | | | | December 2012) |
| 1 | The address for each officer is 145 Mason Street, 2nd Floor, Greenwich, Connecticut 06830. |
| 2 | Officers are elected yearly by the Trustees. |
Item 2. Code of Ethics.
| (a) | The registrant, as of the end of the period covered by this report, has adopted a code of ethics that applies to the registrant’s principal executive officer, principal financial officer, principal accounting officer or controller, or persons performing similar functions, regardless of whether these individuals are employed by the registrant or a third party. |
| (c) | There have been no amendments, during the period covered by this report, to a provision of the code of ethics that applies to the registrant’s principal executive officer, principal financial officer, principal accounting officer or controller, or persons performing similar functions, regardless of whether these individuals are employed by the registrant or a third party, and that relates to any element of the code of ethics description. |
| (d) | The registrant has not granted any waivers, including an implicit waiver, from a provision of the code of ethics that applies to the registrant’s principal executive officer, principal financial officer, principal accounting officer or controller, or persons performing similar functions, regardless of whether these individuals are employed by the registrant or a third party, that relates to one or more of the items set forth in paragraph (b) of this item’s instructions. |
Item 3. Audit Committee Financial Expert.
As of the end of the period covered by the report, the registrant’s board of trustees has determined that Mark Buckley-Jones is qualified to serve as an audit committee financial expert serving on its audit committee and that he is “independent,” as defined by Item 3 of Form N-CSR.
Item 4. Principal Accountant Fees and Services.
Audit Fees
| (a) | The aggregate fees billed for professional services rendered by the principal accountant for the audit of the registrant's annual financial statements or services that are normally provided by the accountant in connection with statutory and regulatory filings or engagements for the fiscal year ended October 31, 2014 was $26,000. |
Audit-Related Fees
| (b) | The aggregate fees billed for the fiscal year ended October 31, 2014 for assurance and related services by the principal accountant that are reasonably related to the performance of the audit of the registrant's financial statements and are not reported under paragraph (a) of this Item were $0. |
Tax Fees
| (c) | The aggregate fees billed for the year ended October 31, 2014 for professional services rendered by the principal accountant for tax compliance, tax advice, and tax planning were $7,000. |
All Other Fees
| (d) | The aggregate fees billed for the year ended October 31, 2014 for products and services provided by the principal accountant, other than the services reported in paragraphs (a) through (c) of this Item were $0. |
| (e)(1) | Disclose the audit committee's pre-approval policies and procedures described in paragraph (c)(7) of Rule 2-01 of Regulation S-X. |
The Audit Committee will, when required by applicable rules, pre-approve all audit and permissible non-audit services to be provided by the independent accountants to the Trust, to its investment adviser and to any entity controlling, controlled by or under common control with the investment adviser that provides ongoing services to the Trust, if the engagement relates directly to the operations and financial reporting of the Trust.
| (e)(2) | The percentage of services described in each of paragraphs (b) through (d) of this Item that were approved by the audit committee pursuant to paragraph (c)(7)(i)(C) of Rule 2-01 of Regulation S-X are as follows: |
| (f) | The percentage of hours expended on the principal accountant's engagement to audit the registrant's financial statements for the most recent fiscal year that were attributed to work performed by persons other than the principal accountant's full-time, permanent employees was 0%. |
| (g) | The aggregate non-audit fees billed by the registrant's accountant for services rendered to the registrant, and rendered to the registrant's investment adviser (not including any sub-adviser whose role is primarily portfolio management and is subcontracted with or overseen by another investment adviser), and any entity controlling, controlled by, or under common control with the adviser that provides ongoing services to the registrant for the fiscal year ended October 31, 2014 were $0. |
Item 5. Audit Committee of Listed Registrants.
The registrant has a separately designed audit committee consisting of all the independent trustees of the registrant. The members of the audit committee are: Richard Keary, Mark Buckley-Jones, and Robinson Jacobs.
Item 6. Investments.
| (a) | Schedule of Investments in securities of unaffiliated issuers as of the close of the reporting period is included as part of the report to shareholders filed under Item 1 of this form. |
Item 7. Disclosure of Proxy Voting Policies and Procedures for Closed-End Management Investment Companies.
Not applicable.
Item 8. Portfolio Managers of Closed-End Management Investment Companies.
Not applicable.
Item 9. Purchases of Equity Securities by Closed-End Management Investment Company and Affiliated Purchasers.
Not applicable.
Item 10. Submission of Matters to a Vote of Security Holders.
There have been no material changes to the procedures by which the shareholders may recommend nominees to the registrant’s board of trustees, where those changes were implemented after the registrant last provided disclosure in response to the requirements of Item 407(c)(2)(iv) of Regulation S-K (17 CFR 229.407) (as required by Item 22(b)(15) of Schedule 14A (17 CFR 240.14a-101)), or this Item.
Item 11. Controls and Procedures.
| (a) | The registrant’s principal executive and principal financial officers, or persons performing similar functions, have concluded that the registrant’s disclosure controls and procedures (as |
defined in Rule 30a-3(c) under the Investment Company Act of 1940, as amended (the “1940 Act”) (17 CFR 270.30a-3(c))) are effective, as of a date within 90 days of the filing date of the report that includes the disclosure required by this paragraph, based on their evaluation of these controls and procedures required by Rule 30a-3(b) under the 1940 Act (17 CFR 270.30a-3(b)) and Rules 13a-15(b) or 15d-15(b) under the Securities Exchange Act of 1934, as amended (17 CFR 240.13a-15(b) or 240.15d-15(b)).
| (b) | There were no changes in the registrant’s internal control over financial reporting (as defined in Rule 30a-3(d) under the 1940 Act (17 CFR 270.30a-3(d)) that occurred during the registrant’s second fiscal quarter of the period covered by this report that has materially affected, or is reasonably likely to materially affect, the registrant’s internal control over financial reporting. |
Item 12. Exhibits.
| (a)(1) | Code of ethics, or any amendment thereto, that is the subject of disclosure required by Item 2 is attached hereto. |
| (a)(2) | Certification pursuant to Rule 30a-2(a) under the 1940 Act and Section 302 of the Sarbanes-Oxley Act of 2002 is attached hereto. |
| (b) | Certification pursuant to Rule 30a-2(b) under the 1940 Act and Section 906 of the Sarbanes-Oxley Act of 2002 is attached hereto. |
| (12.other) | Not applicable. |
SIGNATURES
Pursuant to the requirements of the Securities Exchange Act of 1934 and the Investment Company Act of 1940, the registrant has duly caused this report to be signed on its behalf by the undersigned, thereunto duly authorized.
| (Registrant) | | ETF Series Trust |
| | | |
| By | (Signature and Title)* | /s/ Garrett Paolella |
| | | Garrett Paolella |
| | | President/Chief Executive Officer |
| | | (principal executive officer) |
| | | |
| Date | 12/30/2014 |
| | | |
| | | |
| Pursuant to the requirements of the Securities Exchange Act of 1934 and the Investment Company Act of 1940, this report has been signed below by the following persons on behalf of the registrant and in the capacities and on the dates indicated. |
| | | |
| | | |
| By | (Signature and Title)* | /s/ Garrett Paolella |
| | | Garrett Paolella |
| | | President/Chief Executive Officer and |
| | | Treasurer/Chief Financial Officer |
| | | (principal executive officer and principal financial officer) |
| | | |
| Date | 12/30/2014 |
* Print the name and title of each signing officer under his or her signature.