As filed with the U.S. Securities and Exchange Commission on January 7, 2019
UNITED STATES
SECURITIES AND EXCHANGE COMMISSION
Washington, D.C. 20549
FORM N-CSR
CERTIFIED SHAREHOLDER REPORT OF REGISTERED
MANAGEMENT INVESTMENT COMPANIES
Investment Company Act file number 811-22732
HORIZONS ETF TRUST I
(Exact name of registrant as specified in charter)
c/o Horizons ETFs Management (US) LLC
625 Madison Avenue, 3rd Floor
New York, NY 10022
(Address of principal executive offices) (Zip code)
Jonathan Molchan
President/Chief Executive Officer
c/o Horizons ETFs Management (US) LLC
625 Madison Avenue, 3rd Floor
New York, New York 10022
(Name and address of agent for service)
212-205-8300
Registrant's telephone number, including area code
Date of fiscal year end: October 31
Date of reporting period: October 31, 2018
Item 1. Reports to Stockholders.
Annual Report
October 31, 2018
Horizons ETF Trust I
Horizons ETF Trust I (the “Trust”), was organized as a Delaware statutory trust on May 17, 2012 and is currently comprised of three investment portfolios. These financial statements relate to the Horizons NASDAQ 100® Covered Call ETF (“QYLD”), Horizons S&P 500® Covered Call ETF (“HSPX”) and Horizons DAX Germany ETF (“DAX”) (each a “Fund” and collectively, the “Funds”). The Horizons NASDAQ 100® Covered Call ETF and Horizons DAX Germany ETF both trade on the NASDAQ Stock Exchange and the Horizons S&P 500® Covered Call ETF trades on the New York Stock Exchange.
NASDAQ 100® is a registered trademark of The NASDAQ Stock Market, Inc. and has been licensed for use by Horizons ETFs Management (US) LLC and QYLD. The Fund is not sponsored, endorsed, issued, sold or promoted by NASDAQ, nor does this company make any representation regarding the advisability of investing in the Fund.
S&P 500® is a registered trademark of Standard & Poor’s Financial Services LLC (“S&P”) and has been licensed for use by Horizons S&P 500® Covered Call ETF. S&P®, S&P 500®, and S&P 500 Stock Covered Call are trademarks of S&P and have been licensed for use by Horizons ETFs Management (US) LLC.
DAX® is a registered trademark of Deutsche Böerse AG and has been licensed for use by Horizons ETFs Management (US) LLC and DAX. The Fund is not sponsored, endorsed, issued, sold or promoted by Deutsche Böerse AG, nor does this company make any representation regarding the advisability of investing in the Fund.
The financial statements contained herein are submitted for the general information of the shareholders of each Fund. This report is not authorized for distribution to prospective investors unless preceded or accompanied by an effective prospectus.
Not FDIC Insured • No Bank Guarantee • May Lose Value
Foreside Fund Services, LLC, distributor.
An investment in each Fund is subject to investment risk, including the possible loss of principal amount invested. The risks associated with the Funds are detailed in the prospectus which include: stock market risk, index risk, tracking error risk, replication management risk, market price risk and trading halts risk.
Shares are bought and sold at market price (not net asset value or “NAV”), are not individually redeemable, and owners of the shares may acquire those shares from the Funds and tender those shares for redemption to the Funds in creation unit aggregations only.
TABLE OF CONTENTS
October 31, 2018 | | | | Page(s)
|
| | | | | 3 |
| | | | | 4 |
| | | | | 10 |
| | | | | 11 |
| | | | | 19 |
| | | | | 20 |
| | | | | 21 |
| | | | | 23 |
| | | | | 26 |
| | | | | 35 |
| | | | | 36 |
| | | | | 37 |
| | | | | 39 |
| | | | | 41 |
2
Letter to Shareholders
October 31, 2018 (Unaudited)
Dear Shareholder,
For the twelve month period that ended on October 31, 2018, investors witnessed a slight rise in U.S. equity benchmarks and the U.S. Dollar while U.S. yields and volatility moved significantly higher. U.S. markets have been the global leader for the past twelve months shrugging off a consistent slew of headlines and uncertainties that have led to a handful of volatility events, which eventually brought the U.S. equity benchmarks to nearly flat for 2018.
The prior years’ trend remained intact as the NASDAQ continued to lead broader equity markets. Technology companies continued to exhibit outperformance relative to other sectors despite headlines that have reshaped the way in which social media and technology companies are perceived by both governments and citizens. After reaching new all-time highs in October, the markets saw a sharp rise in volatility coinciding with higher interest rates. This move lower came in lockstep with ongoing worries of a trade war between the U.S. and China and various tariffs on other U.S. trading partners.
International markets did not participate with U.S. markets as regional economic data and global growth forecasts became more uncertain given tariffs, sanctions, and the potential material impacts of a trade war between the U.S. and China. Europe’s storylines continued to be focused on the potential outcome and effects of Brexit, the regional migrant crisis, and more recently issues in Italy. The stronger dollar negatively impacted Europe and Asia over the past year with most equity markets seeing double digit declines or worse in 2018. Two similarities between the U.S. and broader international markets have been elevated yields, coupled with heightened volatility.
The past twelve months can be categorized as a period of continued domestic growth where yield-focused investors found difficulty sourcing income without forfeiting a total return. At Horizons ETFs U.S. we strive to produce investment strategies that combat the current low yield environment through cost effective products aimed at generating income for investors.
I want to personally thank you for interest in Horizons ETFs U.S. and our investment products.
For more information on our company, and the features and risks of our investment solutions visit us at https://horizonsetfsus.com or call us at 855-496-3837. Investments are subject to Risk. For the Funds’ prospectus please visit https://horizonsetfsus.com. The Funds are distributed by Foreside Fund Services, LLC, which is not affiliated with Horizons ETFs Management (US) LLC, or any of its affiliates.
Sincerely,
Jonathan Molchan
Principal Executive Officer
Horizons ETF Trust I
3
Management Discussion of Fund Performance
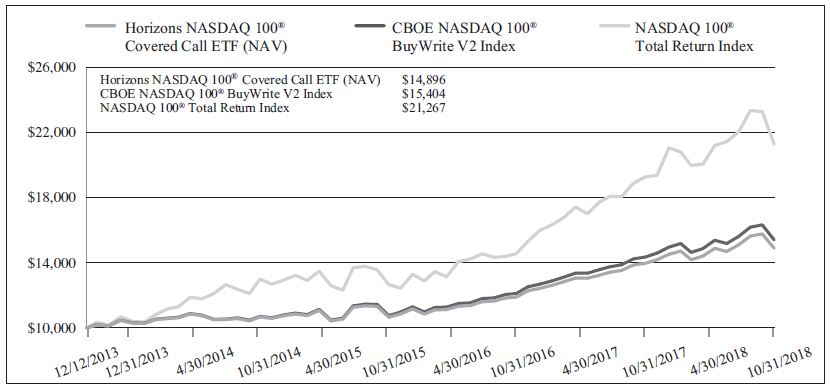
October 31, 2018 (Unaudited)HORIZONS NASDAQ 100® COVERED CALL ETF The Fund seeks to provide investment results that will closely correspond, before fees and expenses, generally to the price and yield performance of the CBOE NASDAQ 100® BuyWrite V2 Index (the “Index”). The Index measures the total return of a portfolio consisting of equity securities of the 100 (103) companies included in the NASDAQ 100® Index and call options systematically written on those securities through a “buy-write” or covered call strategy.
A “buy-write” strategy is an investment strategy in which the Fund buys a specific basket of stocks (such as the NASDAQ 100® Index) and sells covered call options that correspond to that basket of stocks. The Fund implements its strategy by investing in all securities contained in the NASDAQ 100® Index and seeks to track the Index’s weightings per each constituent. The Fund also sells NASDAQ 100® Index call options on a monthly basis. These options are determined by the Chicago Board Options Exchange (“CBOE”) but are typically the closest to at-the-money and the position is updated for the next month (rolled) on the third Friday of every month, which is option expiration.
For the 12-month period ended October 31, 2018, the Fund (NAV) returned 7.44% versus 8.19% for the Index. The Fund’s inception was December 12, 2013.
The principal contributors to Fund performance for the period, in aggregate, were the Fund’s exposure to the underlying equities contained in the NASDAQ 100® Index along with the monthly income component derived from index options of the strategy. Another driver that impacted performance was the constituents of the NASDAQ 100® Index which had positive performance during the year and predominately composed of technology and healthcare names that are considered growth stocks.
Hypothetical Growth of a $10,000 Investment
(Since Inception, 12/12/2013 through 10/31/2018)
Gross Expense Ratio: 0.60%
This chart illustrates the performance of a hypothetical $10,000 investment made on the Fund’s inception, and is not intended to imply any future performance.
4
Management Discussion of Fund Performance (continued)
October 31, 2018 (Unaudited)Fund Performance History
Average Annual Total Returns (%) (for periods ended October 31, 2018)
| | Inception1
| | 3 Year
| | 1 Year
|
Market Price2 | | 8.55% | | 9.70% | | 7.50% |
Net Asset Value | | 8.49% | | 9.73% | | 7.44% |
CBOE NASDAQ 100® BuyWriteV2 Index3 | | 9.24% | | 10.68% | | 8.19% |
NASDAQ 100® Total Return Index | | 16.69% | | 15.78% | | 12.67% |
1 | | Fund Inception Date: 12/12/2013. |
2 | | The price used to calculate Market Price returns is determined by using the closing price and does not represent returns an investor would receive if shares were traded at other times. |
3 | | The Fund switched its index from the CBOE NASDAQ 100® BuyWrite Index (BXN) to the CBOE NASDAQ 100® BuyWrite V2 Index (BXNT). The BXNT index replicates the methodology used to calculate the BXN index, with one exception: In BXNT, the written NASDAQ 100® index covered call options are held until one day prior to the expiration date and in BXN, the written NASDAQ 100® index covered call options are held until expiration. The BXNT index inception is 9/29/2015. Performance shown from 12/12/2013 to 9/28/2015 is that of the BXN index and performance after 9/28/2015 is that of the BXNT index. |
Performance data quoted represents past performance, which does not guarantee future results. The prior graph and table shown do not reflect the deduction of taxes that a shareholder would pay on Fund distributions or the redemption of Fund shares. Investment return and principal value will fluctuate, so that an investor’s shares, when redeemed, may be worth more or less than their original cost; and the current performance may be lower or higher than the performance data quoted. Please call 1-855-496-3837 or visit https://horizonsetfsus.com/qyld-horizons-nasdaq-100-covered-call-etf/ for the most recent month-end performance.
QYLD collects dividends from NASDAQ 100® Index companies and monthly options premium from selling NASDAQ 100® Index options, and portions have been passed to shareholders as monthly distributions. The Fund realizes capital gains from writing options and capital gains or losses whenever it sells securities. Any net realized long-term capital gains are distributed to shareholders as “capital gain distributions.” These do not imply rates for any future distributions. The Fund is not required to make monthly distributions.
Shares are bought and sold at market price (not NAV), are not individually redeemable, and owners of the shares may acquire those shares from the Fund and tender those shares for redemption to the Fund in creation unit aggregations only, consisting of 50,000 shares. Brokerage commissions will reduce returns. The Fund engages in writing covered call Index options on the NASDAQ 100® Index. By selling covered call options, the Fund limits its opportunity to profit from an increase in the price of the underlying Index above the exercise price, but continues to bear the risk of a decline in the index. A liquid market may not exist for options held by the Fund. While the Fund receives premiums for writing the call options, the price it realizes from the exercise of an option could be substantially below the indices current market price. The Fund is considered non-diversified and may be subject to greater risks than a diversified fund. Horizons ETFs Management (US) LLC is the Investment Adviser of the Fund. The Fund is distributed by Foreside Fund Services, LLC, which is not affiliated with Horizons ETFs Management (US) LLC or any of its affiliates. Please visit https://horizonsetfsus.com or call 1-855-496-3837 if you have any questions. Important Disclosures: Authorized for distribution only when preceded or accompanied by a prospectus.
5
Management Discussion of Fund Performance (continued)
October 31, 2018 (Unaudited)HORIZONS S&P 500® COVERED CALL ETF
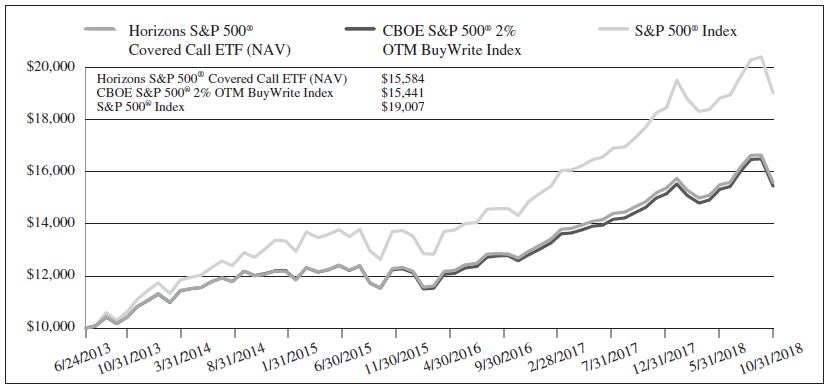
The Fund seeks to provide investment results that will closely correspond, before fees and expenses, generally to the price and yield performance of the CBOE S&P 500® 2% OTM BuyWrite Index (the “Index”). The Index measures the total return of a portfolio consisting of equity securities of the 500 (505) companies included in the S&P 500® Index and call options systematically written on those securities through a “buy-write” or covered call strategy.
A “buy-write” strategy is an investment strategy in which the Fund buys a specific basket of stocks (such as the S&P 500® Index) and sells covered call options that correspond to that basket of stocks. The Fund implements its strategy by investing in all securities contained in the S&P 500® Index and seeks to track the Index’s weightings per each constituent. The Fund also sells S&P 500® Index call options on a monthly basis. These options are determined by the CBOE but are typically the closest to 2% out-of-the-money and the position is updated for the next month (rolled) on the third Friday of every month, which is option expiration.
For the 12-month period ended October 31, 2018, the Fund (NAV) returned 4.97% versus 5.53% for the Index. The Fund’s inception was June 24, 2013.
The principal contributors to Fund performance for the period, in aggregate, were the Fund’s exposure to the underlying equities contained in the S&P 500® Index along with the monthly income component derived from index options of the strategy. Another driver that impacted performance were the constituents of the S&P 500® Index which had positive performance during the year.
Hypothetical Growth of a $10,000 Investment
(Since Inception, 6/24/2013 through 10/31/2018)
Gross Expense Ratio: 0.65%
This chart illustrates the performance of a hypothetical $10,000 investment made on the Fund’s inception, and is not intended to imply any future performance.
6
Management Discussion of Fund Performance (continued)
October 31, 2018 (Unaudited)Fund Performance History
Average Annual Total Returns (%) (for periods ended October 31, 2018)
| | Inception1
| | 5 Year
| | 1 Year
|
Market Price2 | | 9.09% | | 7.98% | | 7.24% |
Net Asset Value | | 8.63% | | 7.53% | | 4.97% |
CBOE S&P 500® 2% OTM BuyWrite Index3 | | 8.44% | | 7.36% | | 5.53% |
S&P 500® Index | | 12.73% | | 11.34% | | 7.35% |
1 | | Fund Inception Date: 6/24/2013. |
2 | | The price used to calculate Market Price returns is determined by using the closing price and does not represent returns an investor would receive if shares were traded at other times. |
3 | | The Fund switched its index from the S&P 500® Stock Covered Call Index (SPXCC) to the CBOE S&P 500® 2% OTM BuyWrite Index (BXY). The BXY index inception is 3/17/2006. Performance shown from 6/24/2013 to 12/13/2017 is that of the SPXCC index and performance after 12/13/2017 is that of the BXY index. |
Performance data quoted represents past performance, which does not guarantee future results. The prior graph and table shown do not reflect the deduction of taxes that a shareholder would pay on Fund distributions or the redemption of Fund shares. Investment return and principal value will fluctuate, so that an investor’s shares, when redeemed, may be worth more or less than their original cost; and the current performance may be lower or higher than the performance data quoted. Please call 1-855-496-3837 or visit https://horizonsetfsus.com/hspx-horizons-sp-500-covered-call-etf/ for the most recent month-end performance.
HSPX collects dividends from the S&P 500® Index companies and monthly options premium from selling single stock options or selling S&P 500® Index Options, and portions have been passed to shareholders as monthly distributions. The Fund realizes capital gains from writing options and capital gains or losses whenever it sells securities. Any net realized long-term capital gains are distributed to shareholders as “capital gain distributions.” These do not imply rates for any future distributions. The Fund is not required to make monthly distributions.
Individual shares of the Fund may be purchased or sold in the secondary market throughout the regular trading day on the New York Stock Exchange through a brokerage account. However, shares are not individually redeemable directly from the Fund. The Fund engages in writing covered call Index options on the S&P 500® Index. By selling covered call options, the Fund limits its opportunity to profit from an increase in the price of the Index above the exercise price, but continues to bear the risk of a decline in the Index. A liquid market may not exist for options held by the Fund. While the Fund receives premiums for writing the call options, the price it realizes from the exercise of an option could be substantially below the current market price. The Fund issues and redeems shares on a continuous basis, at NAV, only in blocks of at least 50,000 shares (“Creation Units”), principally in-kind for securities included in the relevant Index. Before investing you should carefully consider the Fund’s investment objectives, risks, charges and expenses. This and other information is in the prospectus which must precede or accompany this material. Please read the prospectus carefully before you invest. Distributor: Foreside Fund Services, LLC. Please visit https://horizonsetfsus.com or call 1-855-496-3837 if you have any questions. Important Disclosures: Authorized for distribution only when preceded or accompanied by a prospectus.
7
Management Discussion of Fund Performance (continued)
October 31, 2018 (Unaudited)HORIZONS DAX GERMANY ETF
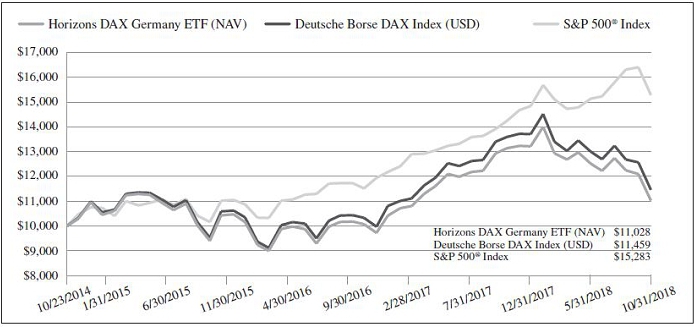
The Fund seeks to provide investment results that will closely correspond, before fees and expenses, to the price and yield performance of the DAX® Index (the “Index”). The Index tracks the segment of the largest and most important companies, known as blue chips, on the German equities market. It contains the shares of the 30 largest and most liquid companies admitted to the FWB Frankfurt Stock Exchange in the Prime Standard segment. The Index represents about 80% of the aggregated prime standard’s market cap. It is completely rules based and transparent. On the basis of a clear and publicly available set of rules — the guide to the equity indices of Deutsche Böerse — the composition of the Index is determined in a manner comprehensive to all market participants.
The Fund implements its strategy by investing in the 30 stocks contained in the Index and seeks to track the Index’s weighting per each constituent.
For the 12-month period ended October 31, 2018, the Fund (NAV) returned -16.05% versus -15.72% for the Index. The Fund’s inception was October 23, 2014.
The contributors to Fund performance for the period, in aggregate, were the Fund’s exposure to the underlying equities contained in the DAX® Index which traded lower over the twelve month period and also benefitted from lack of strength in the euro.
Hypothetical Growth of a $10,000 Investment
(Since Inception, 10/23/2014 through 10/31/2018)
Gross Expense Ratio: 0.45%, Net Expense Ratio: 0.20% (Effective August 1, 2017; Note 3)
This chart illustrates the performance of a hypothetical $10,000 investment made on the Fund’s inception, and is not intended to imply any future performance.
8
Management Discussion of Fund Performance (continued)
October 31, 2018 (Unaudited)Fund Performance History
Average Annual Total Returns (%) (for periods ended October 31, 2018)
| | Inception1
| | 3 Year
| | 1 Year
|
Market Price2 | | 2.36% | | 1.97% | | (17.08)% |
Net Asset Value | | 2.46% | | 1.88% | | (16.05)% |
Deutsche Borse DAX Index (USD) | | 3.44% | | 2.67% | | (15.72)% |
S&P 500® Index | | 11.11% | | 11.52% | | 7.35% |
1 | | Fund Inception Date: 10/23/2014. |
2 | | The price used to calculate Market Price returns is determined by using the closing price and does not represent returns an investor would receive if shares were traded at other times. |
Performance data quoted represents past performance, which does not guarantee future results. The prior graph and table shown do not reflect the deduction of taxes that a shareholder would pay on Fund distributions or the redemption of Fund shares. Investment return and principal value will fluctuate, so that an investor’s shares, when redeemed, may be worth more or less than their original cost; and the current performance may be lower or higher than the performance data quoted. Please call 1-855-496-3837 or visit https://horizonsetfsus.com/horizons-dax-germany-etf-dax/ for the most recent month-end performance.
You should consider the Fund’s investment objectives, risks, and charges and expenses carefully before investing. Contact Horizons ETF Management (US) LLC at 1-855-496-3837 or visit https://horizonsetfsus.com to obtain a prospectus which contains this and other information about the Fund. The prospectus should be read carefully before investing.
Shares are bought and sold at market price (not NAV), are not individually redeemable, and owners of the Shares may acquire those shares from the Fund and tender those shares for redemption to the Fund in Creation Unit aggregations only, consisting of 50,000 shares. Brokerage commissions will reduce returns. Index returns are for illustrative purposes only. Investors cannot directly invest in an index and unmanaged index returns do not reflect any management fees, transaction costs or expenses. In addition, the results actual investors might have achieved would have differed from those shown because of differences in the timing, amounts of their investments, and fees and expenses associated with investments in the Fund. Past performance does not guarantee future results. Investors in the Fund should be willing to accept a high degree of volatility in the price of the Fund’s shares and the possibility of significant losses. An investment in the Fund involves a substantial degree of risk. International investing involves risks, including risks related to foreign currency, limited liquidity, less government regulation and the possibility of substantial volatility due to adverse political, economic or other developments. These risks often are heightened for investments in emerging/ developing markets or in concentrations of single countries. Diversification may not protect against market risk or loss of principal. Brokerage commissions will reduce returns. The Fund is considered non-diversified and may be subject to greater risks than a diversified fund. The Fund is distributed by Foreside Fund Services, LLC, which is not affiliated with Horizons ETFs Management (US) LLC or any of its affiliates. Important Disclosures: Authorized for distribution only when preceded or accompanied by a prospectus.
9
Shareholder Expense Example
October 31, 2018 (Unaudited)
As a shareholder of the Funds, you incur a unitary management fee. Each Fund bears other expenses which are not covered under the unitary management fee that may vary and will affect the total level of expenses paid by the Fund, such as taxes and governmental fees, brokerage fees, commissions and other transaction expenses, costs of borrowing money, including interest expenses, certain custody expenses, acquired fund fees and expenses and extraordinary expenses (such as litigation and indemnification expenses), if any. The following example is intended to help you understand your ongoing costs (in dollars and cents) of investing in the Fund and to compare these costs with the ongoing costs of investing in other funds. The example is based on an investment of $1,000 invested at the beginning of the period and held throughout the entire period (from May 1, 2018 to October 31, 2018)
Actual Expenses
The first line under the Fund in the table below provides information about actual account values and actual expenses. You may use the information in this line, together with the amount you invested, to estimate the expenses that you paid over the period. Simply divide your account value by $1,000 (for example, an $8,600 account value divided by $1,000 = 8.6), then multiply the result by the number in the first line for the Fund under the heading entitled “Expenses Paid During Period” to estimate the expenses you paid on your account during this period.
Hypothetical Example for Comparison Purposes
The second line under the Fund in the table provides information about hypothetical account values and hypothetical expenses based on the Fund’s actual expense ratio and an assumed rate of return of 5% per year before expenses, which is not the Fund’s actual return. The hypothetical account values and expenses may not be used to estimate the actual ending account balance or expenses you paid for the period. You may use this information to compare the ongoing costs of investing in the Fund and other funds. To do so, compare this 5% hypothetical example with the 5% hypothetical examples that appear in the shareholder reports of the other funds.
Please note that the expenses shown in the table are meant to highlight your ongoing costs only and do not reflect any transactional costs, such as brokerage commissions paid on purchases and sales of Fund shares. Therefore, the second line under the Fund in the table is useful in comparing ongoing Fund costs only and will not help you determine the relative total costs of owning different funds. In addition, if these transactional costs were included, your costs would have been higher.
| | Beginning
Account
Value
5/1/2018
| | Ending
Account
Value
10/31/2018
| | Annualized
Expense Ratios
During the Period
5/1/2018 to
10/31/2018
| | Expenses
Paid
During
Period**
5/1/2018 to
10/31/2018
|
Horizons NASDAQ 100® Covered Call ETF | | | | | | | | |
| Actual | | $1,000.00 | | $1,033.40 | | 0.60% | | $3.08 |
| Hypothetical* | | $1,000.00 | | $1,022.18 | | 0.60% | | $3.06 |
Horizons S&P 500® Covered Call ETF | | | | | | | | |
| Actual | | $1,000.00 | | $1,032.20 | | 0.65% | | $3.33 |
| Hypothetical* | | $1,000.00 | | $1,021.93 | | 0.65% | | $3.31 |
Horizons DAX Germany ETF*** | | | | | | | | |
| Actual | | $1,000.00 | | $850.20 | | 0.20% | | $0.93 |
| Hypothetical* | | $1,000.00 | | $1,024.20 | | 0.20% | | $1.02 |
* | | 5% return before expenses |
** | | Expenses are calculated using the most recent expense ratio, multiplied by the average account value over the period, multiplied by 184/365 (to reflect the one-half year period) for QYLD, HSPX and DAX. |
*** | | The Adviser waived a portion of its fee (Note 3). |
10
Portfolio of Investments — Horizons NASDAQ 100® Covered Call ETF
October 31, 2018
| Security Description | | Shares
| | Fair
Value
|
Common Stocks — 100.7% † | | | | | | | | |
Communication Services — 22.8% | | | | | | | | |
Activision Blizzard, Inc. | | | 37,754 | | | $ | 2,606,914 | |
Alphabet, Inc. Class A * | | | 14,863 | | | | 16,209,291 | |
Alphabet, Inc. Class C * | | | 17,385 | | | | 18,719,646 | |
Baidu, Inc. (a)* | | | 13,926 | | | | 2,646,776 | |
Charter Communications, Inc. Class A * | | | 11,776 | | | | 3,772,677 | |
Comcast Corp. Class A | | | 231,411 | | | | 8,826,016 | |
Electronic Arts, Inc. * | | | 15,221 | | | | 1,384,807 | |
Facebook, Inc. Class A * | | | 118,955 | | | | 18,056,179 | |
Liberty Global PLC Class A * | | | 11,215 | | | | 287,440 | |
Liberty Global PLC Class C * | | | 28,792 | | | | 720,952 | |
NetEase, Inc. (a) | | | 3,807 | | | | 791,285 | |
Netflix, Inc. * | | | 21,193 | | | | 6,395,624 | |
Sirius XM Holdings, Inc. | | | 224,192 | | | | 1,349,636 | |
Take-Two Interactive Software, Inc. * | | | 5,760 | | | | 742,291 | |
T-Mobile US, Inc. * | | | 42,660 | | | | 2,924,343 | |
Twenty-First Century Fox, Inc. Class A | | | 52,499 | | | | 2,389,754 | |
Twenty-First Century Fox, Inc. Class B | | | 40,114 | | | | 1,812,350 | |
Vodafone Group PLC (a) | | | 23,570 | | | | 446,180 | |
| | | | | | | 90,082,161 | |
Consumer Discretionary — 15.9% | | | | | | | | |
Amazon.com, Inc. * | | | 23,869 | | | | 38,142,901 | |
Booking Holdings, Inc. * | | | 2,361 | | | | 4,425,883 | |
Ctrip.com International Ltd. (a)* | | | 22,547 | | | | 750,364 | |
Dollar Tree, Inc. * | | | 11,735 | | | | 989,261 | |
eBay, Inc. * | | | 50,442 | | | | 1,464,331 | |
Expedia, Inc. | | | 6,771 | | | | 849,287 | |
Hasbro, Inc. | | | 5,879 | | | | 539,163 | |
JD.Com, Inc. (a)* | | | 45,938 | | | | 1,080,462 | |
Marriott International, Inc. Class A | | | 17,751 | | | | 2,074,914 | |
MercadoLibre, Inc. | | | 2,186 | | | | 709,357 | |
O’Reilly Automotive, Inc. * | | | 4,082 | | | | 1,309,302 | |
Qurate Retail Group, Inc. * | | | 21,432 | | | | 470,218 | |
Ross Stores, Inc. | | | 19,009 | | | | 1,881,891 | |
Starbucks Corp. | | | 68,812 | | | | 4,009,675 | |
Tesla Motors, Inc. * | | | 8,310 | | | | 2,803,129 | |
Ulta Beauty, Inc. * | | | 3,028 | | | | 831,247 | |
Wynn Resorts Ltd. | | | 5,279 | | | | 531,067 | |
| | | | | | | 62,862,452 | |
Consumer Staples — 6.3% | | | | | | | | |
Costco Wholesale Corp. | | | 22,024 | | | | 5,035,347 | |
Kraft Heinz Co. | | | 61,439 | | | | 3,377,302 | |
Mondelez International, Inc. | | | 74,190 | | | | 3,114,496 | |
Monster Beverage Corp. * | | | 28,019 | | | | 1,480,804 | |
PepsiCo, Inc. | | | 70,568 | | | | 7,930,432 | |
Walgreens Boots Alliance, Inc. | | | 49,337 | | | | 3,935,613 | |
| | | | | | | 24,873,994 | |
Health Care — 9.3% | | | | | | | | |
Alexion Pharmaceuticals, Inc. * | | | 10,929 | | | | 1,224,813 | |
Align Technology, Inc. * | | | 3,876 | | | | 857,371 | |
Amgen, Inc. | | | 32,207 | | | | 6,209,188 | |
Biogen, Inc. * | | | 10,564 | | | | 3,214,308 | |
BioMarin Pharmaceutical, Inc. * | | | 8,641 | | | | 796,441 | |
Celgene Corp. * | | | 36,220 | | | | 2,593,352 | |
Cerner Corp. * | | | 16,461 | | | | 942,886 | |
DENTSPLY SIRONA, Inc. | | | 11,555 | | | | 400,150 | |
Express Scripts Holding Co. * | | | 27,318 | | | | 2,649,026 | |
Gilead Sciences, Inc. | | | 65,371 | | | | 4,456,995 | |
Henry Schein, Inc. * | | | 7,577 | | | | 628,891 | |
Hologic, Inc. * | | | 13,904 | | | | 542,117 | |
| | | | | | | | | |
| Security Description | | Shares
| | Fair
Value
|
Common Stocks (continued) | | | | | | | | |
Health Care (Continued) | | | | | | | | |
IDEXX Laboratories, Inc. * | | | 4,227 | | | $ | 896,631 | |
Illumina, Inc. * | | | 7,239 | | | | 2,252,415 | |
Incyte Corp. * | | | 10,254 | | | | 664,664 | |
Intuitive Surgical, Inc. * | | | 5,609 | | | | 2,923,299 | |
Mylan NV * | | | 25,550 | | | | 798,437 | |
Regeneron Pharmaceuticals, Inc. * | | | 5,185 | | | | 1,758,959 | |
Shire PLC (a) | | | 3,445 | | | | 626,301 | |
Vertex Pharmaceuticals, Inc. * | | | 12,571 | | | | 2,130,282 | |
| | | | | | | 36,566,526 | |
Industrials — 2.0% | | | | | | | | |
American Airlines Group, Inc. | | | 23,520 | | | | 825,082 | |
Cintas Corp. | | | 5,110 | | | | 929,356 | |
CSX Corp. | | | 43,397 | | | | 2,988,317 | |
Fastenal Co. | | | 14,317 | | | | 736,037 | |
JB Hunt Transport Services, Inc. | | | 5,402 | | | | 597,515 | |
PACCAR, Inc. | | | 17,490 | | | | 1,000,603 | |
Verisk Analytics, Inc. * | | | 8,304 | | | | 995,151 | |
| | | | | | | 8,072,061 | |
Information Technology — 44.4% | | | | | | | | |
Adobe Systems, Inc. * | | | 24,485 | | | | 6,017,434 | |
Analog Devices, Inc. | | | 18,514 | | | | 1,549,807 | |
Apple, Inc. | | | 240,004 | | | | 52,527,275 | |
Applied Materials, Inc. | | | 49,576 | | | | 1,630,059 | |
ASML Holding NV | | | 3,533 | | | | 608,948 | |
Autodesk, Inc. * | | | 10,885 | | | | 1,406,886 | |
Automatic Data Processing, Inc. | | | 22,025 | | | | 3,173,362 | |
Broadcom, Inc. | | | 21,484 | | | | 4,801,459 | |
CA, Inc. | | | 20,838 | | | | 924,374 | |
Cadence Design Systems, Inc. * | | | 14,275 | | | | 636,237 | |
Check Point Software Technologies Ltd. * | | | 8,034 | | | | 891,774 | |
Cisco Systems, Inc. | | | 233,272 | | | | 10,672,194 | |
Citrix Systems, Inc. | | | 6,684 | | | | 684,909 | |
Cognizant Technology Solutions Class A | | | 29,281 | | | | 2,021,267 | |
Fiserv, Inc. * | | | 20,493 | | | | 1,625,095 | |
Intel Corp. | | | 229,589 | | | | 10,763,132 | |
Intuit, Inc. | | | 12,739 | | | | 2,687,929 | |
KLA-Tencor Corp. | | | 7,646 | | | | 699,915 | |
Lam Research Corp. | | | 8,022 | | | | 1,136,958 | |
Maxim Integrated Products, Inc. | | | 13,936 | | | | 697,079 | |
Microchip Technology, Inc. | | | 11,556 | | | | 760,154 | |
Micron Technology, Inc. * | | | 55,797 | | | | 2,104,663 | |
Microsoft Corp. | | | 379,933 | | | | 40,580,644 | |
NVIDIA Corp. | | | 30,326 | | | | 6,393,630 | |
Paychex, Inc. | | | 18,031 | | | | 1,180,850 | |
Paypal Holdings, Inc. * | | | 57,377 | | | | 4,830,570 | |
QUALCOMM, Inc. | | | 73,116 | | | | 4,598,265 | |
Seagate Technology PLC | | | 14,123 | | | | 568,168 | |
Skyworks Solutions, Inc. | | | 8,983 | | | | 779,365 | |
Symantec Corp. | | | 30,519 | | | | 553,920 | |
Synopsys, Inc. * | | | 7,525 | | | | 673,713 | |
Texas Instruments, Inc. | | | 48,392 | | | | 4,492,229 | |
Western Digital Corp. | | | 14,668 | | | | 631,751 | |
Workday, Inc. * | | | 7,134 | | | | 948,965 | |
Xilinx, Inc. | | | 12,654 | | | | 1,080,272 | |
| | | | | | | 175,333,252 | |
TOTAL COMMON STOCKS | | | | | | | | |
(Cost $364,414,954) | | | | | | | 397,790,446 | |
The accompanying notes are an integral part of these financial statements.
11
Portfolio of Investments — Horizons NASDAQ 100® Covered Call ETF (concluded)
October 31, 2018| Security Description | | Shares
| | Fair
Value
|
INVESTMENTS, AT VALUE — 100.7% | | | | | | | | |
(Cost $364,414,954) | | | | | | $ | 397,790,446 | |
Liabilities in Excess of Other Assets: | | | | | | | | |
Written Call Options — (0.8)% | | | | | | | (3,311,800 | ) |
Other Assets 0.1% | | | | | | | 722,935 | |
Total Liabilities in Excess of
Other Assets — (0.7%) | | | | | | | (2,588,865 | ) |
Total Net Assets — 100.0% | | | | | | $ | 395,201,581 | |
† | | All or a portion of these securities has been segregated as collateral for written options contracts. The aggregate market value of collateral at October 31, 2018 was $397,790,446. |
* | | Non-income producing security. |
(a) | | American Depositary Receipt |
Glossary:
Ltd. — Private Limited Company
PLC — Public Limited Company
Number of
Contractsˆ
| | | | Notional
Value
| | Fair Value
|
| Written Call Options — (0.8)% | | | | | | | | |
| | (571 | ) | | NASDAQ 100® Index,
Strike @ $7,210, Exp 11/16/18 | | $ | (397,821,182 | ) | | $ | (3,311,800 | ) |
| | | | | Total Written Call Options | | | | | | | | |
| | | | | (Premiums Received $8,400,436) | | | | | | $ | (3,311,800 | ) |
ˆ | | Each contract equals 100 shares. |
| Sector Allocation (unaudited) | | | | |
(as of October 31, 2018) | | | | |
Information Technology | | | 44.4 | % |
Communication Services | | | 22.8 | |
Consumer Discretionary | | | 15.9 | |
Health Care | | | 9.3 | |
Consumer Staples | | | 6.3 | |
Industrials | | | 2.0 | |
Total Investments | | | 100.7 | |
Liabilities in Excess of Other Assets | | | (0.7 | ) |
Net Assets | | | 100.0 | % |
Sector allocation excludes derivatives and percentages indicated are based upon net assets.
The accompanying notes are an integral part of these financial statements.
12
Portfolio of Investments — Horizons S&P 500® Covered Call ETF
October 31, 2018| Security Description | | Shares
| | Fair
Value
|
Common Stocks — 99.5%† | | | | | | | | |
Communication Services — 10.0% | | | | | | | | |
Activision Blizzard, Inc. | | | 2,522 | | | $ | 174,144 | |
Alphabet, Inc. Class A* | | | 1,017 | | | | 1,109,120 | |
Alphabet, Inc. Class C* | | | 1,041 | | | | 1,120,918 | |
AT&T, Inc. | | | 24,146 | | | | 740,799 | |
CBS Corp. Class B | | | 1,210 | | | | 69,393 | |
CenturyLink, Inc. | | | 3,230 | | | | 66,667 | |
Charter Communications, Inc. Class A* | | | 669 | | | | 214,328 | |
Comcast Corp. Class A | | | 15,661 | | | | 597,311 | |
Discovery Communications, Inc. Class A* | | | 511 | | | | 16,551 | |
Discovery Communications, Inc. Class C* | | | 1,018 | | | | 29,838 | |
DISH Network Corp.* | | | 758 | | | | 23,301 | |
Electronic Arts, Inc.* | | | 1,024 | | | | 93,163 | |
Facebook, Inc. Class A* | | | 7,886 | | | | 1,197,016 | |
Interpublic Group of Cos., Inc. | | | 1,306 | | | | 30,247 | |
Netflix, Inc.* | | | 1,434 | | | | 432,752 | |
News Corp. Class A | | | 1,270 | | | | 16,751 | |
News Corp. Class B | | | 414 | | | | 5,523 | |
Omnicom Group, Inc. | | | 767 | | | | 57,003 | |
Take-Two Interactive Software, Inc.* | | | 395 | | | | 50,904 | |
TripAdvisor, Inc.* | | | 359 | | | | 18,718 | |
Twenty-First Century Fox, Inc. Class A | | | 3,503 | | | | 159,457 | |
Twenty-First Century Fox, Inc. Class B | | | 1,484 | | | | 67,047 | |
Twitter, Inc.* | | | 2,238 | | | | 77,770 | |
Verizon Communications, Inc. | | | 13,807 | | | | 788,242 | |
Viacom, Inc. Class B | | | 1,172 | | | | 37,481 | |
Walt Disney Co. | | | 5,084 | | | | 583,796 | |
| | | | | | | 7,778,240 | |
Consumer Discretionary — 9.7% | | | | | | | | |
Advance Auto Parts, Inc. | | | 256 | | | | 40,899 | |
Amazon.com, Inc.* | | | 1,357 | | | | 2,168,500 | |
Aptiv PLC | | | 888 | | | | 68,198 | |
AutoZone, Inc.* | | | 101 | | | | 74,080 | |
Best Buy Co., Inc. | | | 884 | | | | 62,021 | |
Booking Holdings, Inc.* | | | 163 | | | | 305,556 | |
BorgWarner, Inc. | | | 669 | | | | 26,365 | |
CarMax, Inc.* | | | 610 | | | | 41,425 | |
Carnival Corp. | | | 1,358 | | | | 76,102 | |
Chipotle Mexican Grill, Inc.* | | | 95 | | | | 43,731 | |
Darden Restaurants, Inc. | | | 417 | | | | 44,431 | |
Dollar General Corp. | | | 865 | | | | 96,344 | |
Dollar Tree, Inc.* | | | 799 | | | | 67,356 | |
DR Horton, Inc. | | | 1,134 | | | | 40,779 | |
eBay, Inc.* | | | 3,313 | | | | 96,176 | |
Expedia, Inc. | | | 416 | | | | 52,179 | |
Foot Locker, Inc. | | | 413 | | | | 19,469 | |
Ford Motor Co. | | | 13,014 | | | | 124,284 | |
Gap Inc. | | | 731 | | | | 19,956 | |
Garmin Ltd. | | | 380 | | | | 25,141 | |
General Motors Co. | | | 4,361 | | | | 159,569 | |
Genuine Parts Co. | | | 487 | | | | 47,687 | |
Goodyear Tire & Rubber Co. | | | 834 | | | | 17,564 | |
H&R Block, Inc. | | | 696 | | | | 18,472 | |
Hanesbrands, Inc. | | | 1,211 | | | | 20,781 | |
Harley-Davidson, Inc. | | | 568 | | | | 21,709 | |
Hasbro, Inc. | | | 356 | | | | 32,649 | |
Hilton Worldwide Holdings, Inc. | | | 678 | | | | 48,253 | |
Home Depot, Inc. | | | 3,919 | | | | 689,274 | |
Kohl’s Corp. | | | 571 | | | | 43,242 | |
L Brands, Inc. | | | 830 | | | | 26,909 | |
Leggett & Platt, Inc. | | | 441 | | | | 16,013 | |
| | | | | | | | | |
| Security Description | | Shares
| | Fair
Value
|
Common Stocks (continued) | | | | | | | | |
Consumer Discretionary (Continued) | | | | | | | | |
Lennar Corp. | | | 676 | | | $ | 29,054 | |
LKQ Corp.* | | | 1,025 | | | | 27,952 | |
Lowe’s Cos., Inc. | | | 2,809 | | | | 267,473 | |
Macy’s, Inc. | | | 1,013 | | | | 34,736 | |
Marriott International, Inc. Class A | | | 1,041 | | | | 121,682 | |
Mattel, Inc.* | | | 1,140 | | | | 15,481 | |
McDonald’s Corp. | | | 2,561 | | | | 453,041 | |
MGM Resorts International | | | 1,733 | | | | 46,236 | |
Michael Kors Holdings Ltd.* | | | 505 | | | | 27,982 | |
Mohawk Industries, Inc.* | | | 221 | | | | 27,565 | |
Newell Brands, Inc. | | | 1,641 | | | | 26,059 | |
NIKE, Inc. Class B | | | 4,382 | | | | 328,825 | |
Nordstrom, Inc. | | | 386 | | | | 25,387 | |
Norwegian Cruise Line Holdings Ltd.* | | | 469 | | | | 20,669 | |
O’Reilly Automotive, Inc.* | | | 293 | | | | 93,980 | |
PulteGroup, Inc. | | | 922 | | | | 22,654 | |
PVH Corp. | | | 257 | | | | 31,043 | |
Ralph Lauren Corp. | | | 194 | | | | 25,144 | |
Ross Stores, Inc. | | | 1,296 | | | | 128,304 | |
Royal Caribbean Cruises Ltd. | | | 572 | | | | 59,906 | |
Starbucks Corp. | | | 4,803 | | | | 279,871 | |
Tapestry, Inc. | | | 950 | | | | 40,194 | |
Target Corp. | | | 1,827 | | | | 152,792 | |
Tiffany & Co. | | | 349 | | | | 38,844 | |
TJX Cos., Inc. | | | 2,117 | | | | 232,616 | |
Tractor Supply Co. | | | 421 | | | | 38,686 | |
Ulta Beauty, Inc.* | | | 194 | | | | 53,257 | |
Under Armour, Inc. Class A* | | | 615 | | | | 13,598 | |
Under Armour, Inc. Class C* | | | 630 | | | | 12,493 | |
VF Corp. | | | 1,085 | | | | 89,925 | |
Whirlpool Corp. | | | 253 | | | | 27,769 | |
Wynn Resorts Ltd. | | | 265 | | | | 26,659 | |
Yum! Brands, Inc. | | | 1,145 | | | | 103,519 | |
| | | | | | | 7,558,510 | |
Consumer Staples — 7.3% | | | | | | | | |
Altria Group, Inc. | | | 6,380 | | | | 414,955 | |
Archer Daniels Midland Co. | | | 1,870 | | | | 88,358 | |
Brown-Forman Corp. Class B | | | 823 | | | | 38,138 | |
Campbell Soup Co. | | | 644 | | | | 24,092 | |
Church & Dwight Co., Inc. | | | 830 | | | | 49,277 | |
Clorox Co. | | | 441 | | | | 65,466 | |
Coca-Cola Co. | | | 12,772 | | | | 611,523 | |
Colgate-Palmolive Co. | | | 2,933 | | | | 174,660 | |
ConAgra Brands, Inc. | | | 1,393 | | | | 49,591 | |
Constellation Brands, Inc. Class A | | | 572 | | | | 113,960 | |
Costco Wholesale Corp. | | | 1,458 | | | | 333,343 | |
Coty, Inc. | | | 1,579 | | | | 16,658 | |
Estee Lauder Cos., Inc. Class A | | | 742 | | | | 101,981 | |
General Mills, Inc. | | | 1,929 | | | | 84,490 | |
Hershey Co. | | | 479 | | | | 51,325 | |
Hormel Foods Corp. | | | 894 | | | | 39,014 | |
JM Smucker Co. | | | 379 | | | | 41,053 | |
Kellogg Co. | | | 827 | | | | 54,152 | |
Kimberly-Clark Corp. | | | 1,174 | | | | 122,448 | |
Kraft Heinz Co. | | | 1,987 | | | | 109,225 | |
Kroger Co. | | | 2,997 | | | | 89,191 | |
McCormick & Co., Inc. | | | 393 | | | | 56,592 | |
Molson Coors Brewing Co. Class B | | | 614 | | | | 39,296 | |
Mondelez International, Inc. | | | 5,016 | | | | 210,572 | |
The accompanying notes are an integral part of these financial statements.
13
Portfolio of Investments — Horizons S&P 500® Covered Call ETF (continued)
October 31, 2018| Security Description | | Shares
| | Fair
Value
|
Common Stocks (continued) | | | | | | | | |
Consumer Staples (Continued) | | | | | | | | |
Monster Beverage Corp.* | | | 1,390 | | | $ | 73,462 | |
PepsiCo, Inc. | | | 4,763 | | | | 535,266 | |
Philip Morris International, Inc. | | | 5,361 | | | | 472,143 | |
Procter & Gamble Co. | | | 8,484 | | | | 752,361 | |
Sysco Corp. | | | 1,615 | | | | 115,198 | |
Tyson Foods, Inc. Class A | | | 960 | | | | 57,523 | |
Walgreens Boots Alliance, Inc. | | | 2,899 | | | | 231,253 | |
Wal-Mart Stores, Inc. | | | 4,868 | | | | 488,163 | |
| | | | | | | 5,704,729 | |
Energy — 5.5% | | | | | | | | |
Anadarko Petroleum Corp. | | | 1,865 | | | | 99,218 | |
Apache Corp. | | | 1,267 | | | | 47,931 | |
Baker Hughes a GE Co. | | | 1,424 | | | | 38,007 | |
Cabot Oil & Gas Corp. | | | 1,549 | | | | 37,532 | |
Chevron Corp. | | | 6,461 | | | | 721,371 | |
Cimarex Energy Co. | | | 317 | | | | 25,192 | |
Concho Resources, Inc.* | | | 505 | | | | 70,240 | |
ConocoPhillips | | | 4,046 | | | | 282,815 | |
Devon Energy Corp. | | | 1,748 | | | | 56,635 | |
EOG Resources, Inc. | | | 1,922 | | | | 202,463 | |
EQT Corp. | | | 797 | | | | 27,074 | |
Exxon Mobil Corp. | | | 14,157 | | | | 1,128,030 | |
Halliburton Co. | | | 2,898 | | | | 100,503 | |
Helmerich & Payne, Inc. | | | 360 | | | | 22,424 | |
Hess Corp. | | | 896 | | | | 51,430 | |
HollyFrontier Corp. | | | 663 | | | | 44,713 | |
Kinder Morgan, Inc. | | | 6,399 | | | | 108,911 | |
Marathon Oil Corp. | | | 2,838 | | | | 53,894 | |
Marathon Petroleum Corp. | | | 1,683 | | | | 118,567 | |
National Oilwell Varco, Inc. | | | 1,265 | | | | 46,552 | |
Newfield Exploration Co.* | | | 663 | | | | 13,393 | |
Noble Energy, Inc. | | | 1,618 | | | | 40,207 | |
Occidental Petroleum Corp. | | | 2,555 | | | | 171,364 | |
ONEOK, Inc. | | | 1,265 | | | | 82,984 | |
Phillips 66 | | �� | 1,428 | | | | 146,827 | |
Pioneer Natural Resources Co. | | | 574 | | | | 84,533 | |
Schlumberger Ltd. | | | 4,634 | | | | 237,771 | |
TechnipFMC PLC | | | 1,460 | | | | 38,398 | |
Valero Energy Corp. | | | 1,481 | | | | 134,904 | |
Williams Cos., Inc. | | | 2,750 | | | | 66,908 | |
| | | | | | | 4,300,791 | |
Financials — 13.8% | | | | | | | | |
Affiliated Managers Group, Inc. | | | 195 | | | | 22,164 | |
Aflac, Inc. | | | 2,648 | | | | 114,049 | |
Allstate Corp. | | | 1,203 | | | | 115,151 | |
American Express Co. | | | 2,439 | | | | 250,558 | |
American International Group, Inc. | | | 3,004 | | | | 124,035 | |
Ameriprise Financial, Inc. | | | 509 | | | | 64,765 | |
Aon PLC | | | 856 | | | | 133,690 | |
Arthur J. Gallagher & Co. | | | 600 | | | | 44,406 | |
Assurant, Inc. | | | 178 | | | | 17,303 | |
Bank of America Corp. | | | 32,647 | | | | 897,792 | |
Bank of New York Mellon Corp. | | | 3,439 | | | | 162,768 | |
BB&T Corp. | | | 2,688 | | | | 132,142 | |
Berkshire Hathaway, Inc. Class B* | | | 6,490 | | | | 1,332,267 | |
BlackRock, Inc. Class A | | | 413 | | | | 169,916 | |
Brighthouse Financial, Inc.* | | | 319 | | | | 12,642 | |
Capital One Financial Corp. | | | 1,609 | | | | 143,684 | |
CBOE Holdings, Inc. | | | 384 | | | | 43,334 | |
| | | | | | | | | |
| Security Description | | Shares
| | Fair
Value
|
Common Stocks (continued) | | | | | | | | |
Financials (Continued) | | | | | | | | |
Charles Schwab Corp. | | | 4,006 | | | $ | 185,237 | |
Chubb Ltd. | | | 1,548 | | | | 193,361 | |
Cincinnati Financial Corp. | | | 506 | | | | 39,792 | |
Citigroup, Inc. | | | 8,821 | | | | 577,423 | |
Citizens Financial Group, Inc. | | | 1,676 | | | | 62,599 | |
CME Group, Inc. | | | 1,140 | | | | 208,894 | |
Comerica, Inc. | | | 583 | | | | 47,549 | |
Discover Financial Services, Inc. Class A | | | 1,238 | | | | 86,251 | |
E*TRADE Financial Corp. | | | 916 | | | | 45,269 | |
Everest Re Group Ltd. | | | 135 | | | | 29,411 | |
Fifth Third Bancorp | | | 2,461 | | | | 66,422 | |
Franklin Resources, Inc. | | | 1,105 | | | | 33,703 | |
Goldman Sachs Group, Inc. | | | 1,198 | | | | 269,993 | |
Hartford Financial Services Group, Inc. | | | 1,210 | | | | 54,958 | |
Huntington Bancshares Inc. | | | 3,626 | | | | 51,961 | |
Intercontinental Exchange, Inc. | | | 1,959 | | | | 150,921 | |
Invesco Ltd. | | | 1,355 | | | | 29,417 | |
Jefferies Financial Group, Inc. | | | 1,051 | | | | 22,565 | |
JPMorgan Chase & Co. | | | 11,718 | | | | 1,277,496 | |
KeyCorp | | | 3,628 | | | | 65,884 | |
Lincoln National Corp. | | | 737 | | | | 44,360 | |
Loews Corp. | | | 919 | | | | 42,789 | |
M&T Bank Corp. | | | 505 | | | | 83,532 | |
Marsh & McLennan Cos., Inc. | | | 1,705 | | | | 144,499 | |
MetLife, Inc. | | | 3,535 | | | | 145,607 | |
Moody’s Corp. | | | 552 | | | | 80,305 | |
Morgan Stanley | | | 4,704 | | | | 214,785 | |
MSCI, Inc. | | | 294 | | | | 44,212 | |
Nasdaq, Inc. | | | 387 | | | | 33,557 | |
Northern Trust Corp. | | | 710 | | | | 66,790 | |
People’s United Financial, Inc. | | | 1,144 | | | | 17,915 | |
PNC Financial Services Group, Inc. | | | 1,592 | | | | 204,556 | |
Principal Financial Group, Inc. | | | 893 | | | | 42,034 | |
Progressive Corp. | | | 1,934 | | | | 134,800 | |
Prudential Financial, Inc. | | | 1,421 | | | | 133,261 | |
Raymond James Financial, Inc. | | | 426 | | | | 32,670 | |
Regions Financial Corp. | | | 3,977 | | | | 67,490 | |
S&P Global, Inc. | | | 856 | | | | 156,066 | |
State Street Corp. | | | 1,242 | | | | 85,388 | |
SunTrust Banks, Inc. | | | 1,610 | | | | 100,883 | |
SVB Financial Group* | | | 169 | | | | 40,092 | |
Synchrony Financial | | | 2,489 | | | | 71,882 | |
T. Rowe Price Group, Inc. | | | 799 | | | | 77,495 | |
Torchmark Corp. | | | 359 | | | | 30,393 | |
Travelers Cos., Inc. | | | 919 | | | | 114,994 | |
Unum Group | | | 760 | | | | 27,558 | |
US Bancorp | | | 5,296 | | | | 276,822 | |
Wells Fargo & Co. | | | 14,875 | | | | 791,796 | |
Willis Towers Watson PLC | | | 446 | | | | 63,849 | |
Zions Bancorporation | | | 695 | | | | 32,700 | |
| | | | | | | 10,682,852 | |
Health Care — 14.9% | | | | | | | | |
Abbott Laboratories | | | 5,779 | | | | 398,404 | |
AbbVie, Inc. | | | 5,459 | | | | 424,983 | |
ABIOMED, Inc.* | | | 135 | | | | 46,062 | |
Aetna, Inc. | | | 1,104 | | | | 219,034 | |
Agilent Technologies, Inc. | | | 1,078 | | | | 69,844 | |
Alexion Pharmaceuticals, Inc.* | | | 740 | | | | 82,932 | |
Align Technology, Inc.* | | | 238 | | | | 52,646 | |
The accompanying notes are an integral part of these financial statements.
14
Portfolio of Investments — Horizons S&P 500® Covered Call ETF (continued)
October 31, 2018| Security Description | | Shares
| | Fair
Value
|
Common Stocks (continued) | | | | | | | | |
Health Care (continued) | | | | | | | | |
Allergan PLC | | | 1,111 | | | $ | 175,549 | |
AmerisourceBergen Corp. | | | 539 | | | | 47,432 | |
Amgen, Inc. | | | 2,217 | | | | 427,415 | |
Anthem, Inc. | | | 884 | | | | 243,604 | |
Baxter International, Inc. | | | 1,676 | | | | 104,767 | |
Becton Dickinson and Co. | | | 889 | | | | 204,914 | |
Biogen, Inc.* | | | 703 | | | | 213,902 | |
Boston Scientific Corp.* | | | 4,568 | | | | 165,087 | |
Bristol-Myers Squibb Co. | | | 5,457 | | | | 275,797 | |
Cardinal Health, Inc. | | | 1,051 | | | | 53,181 | |
Celgene Corp.* | | | 2,615 | | | | 187,234 | |
Centene Corp.* | | | 573 | | | | 74,673 | |
Cerner Corp.* | | | 1,048 | | | | 60,029 | |
Cigna Corp. | | | 834 | | | | 178,318 | |
Cooper Cos., Inc. | | | 163 | | | | 42,104 | |
CVS Health Corp. | | | 3,382 | | | | 244,823 | |
Danaher Corp. | | | 2,032 | | | | 201,981 | |
DaVita, Inc.* | | | 508 | | | | 34,209 | |
DENTSPLY SIRONA, Inc. | | | 763 | | | | 26,423 | |
Edwards Lifesciences Corp.* | | | 702 | | | | 103,615 | |
Eli Lilly & Co. | | | 3,222 | | | | 349,394 | |
Express Scripts Holding Co.* | | | 1,939 | | | | 188,025 | |
Gilead Sciences, Inc. | | | 4,347 | | | | 296,378 | |
HCA Healthcare, Inc. | | | 959 | | | | 128,055 | |
Henry Schein, Inc.* | | | 538 | | | | 44,654 | |
Hologic, Inc.* | | | 931 | | | | 36,300 | |
Humana, Inc. | | | 481 | | | | 154,117 | |
IDEXX Laboratories, Inc.* | | | 291 | | | | 61,727 | |
Illumina, Inc.* | | | 485 | | | | 150,908 | |
Incyte Corp.* | | | 571 | | | | 37,012 | |
Intuitive Surgical, Inc.* | | | 381 | | | | 198,570 | |
IQVIA Holdings, Inc.* | | | 374 | | | | 45,976 | |
Johnson & Johnson | | | 8,918 | | | | 1,248,431 | |
Laboratory Corp. of America Holdings* | | | 349 | | | | 56,032 | |
McKesson Corp. | | | 699 | | | | 87,207 | |
Medtronic PLC | | | 4,507 | | | | 404,819 | |
Merck & Co., Inc. | | | 8,925 | | | | 656,969 | |
Mettler-Toledo International, Inc.* | | | 96 | | | | 52,495 | |
Mylan NV* | | | 1,781 | | | | 55,656 | |
Nektar Therapeutics* | | | 536 | | | | 20,732 | |
PerkinElmer, Inc. | | | 378 | | | | 32,689 | |
Perrigo Co. PLC | | | 442 | | | | 31,073 | |
Pfizer, Inc. | | | 19,755 | | | | 850,650 | |
Quest Diagnostics, Inc. | | | 452 | | | | 42,538 | |
Regeneron Pharmaceuticals, Inc.* | | | 255 | | | | 86,506 | |
ResMed, Inc. | | | 474 | | | | 50,206 | |
Stryker Corp. | | | 1,071 | | | | 173,738 | |
Thermo Fisher Scientific, Inc. | | | 1,331 | | | | 310,988 | |
UnitedHealth Group, Inc. | | | 3,216 | | | | 840,502 | |
Universal Health Services, Inc. Class B | | | 294 | | | | 35,739 | |
Varian Medical Systems, Inc.* | | | 316 | | | | 37,721 | |
Vertex Pharmaceuticals, Inc.* | | | 835 | | | | 141,499 | |
Waters Corp.* | | | 264 | | | | 50,078 | |
WellCare Health Plans, Inc.* | | | 168 | | | | 46,366 | |
Zimmer Biomet Holdings, Inc. | | | 673 | | | | 76,446 | |
Zoetis, Inc. | | | 1,642 | | | | 148,026 | |
| | | | | | | 11,587,184 | |
Industrials — 9.4% | | | | | | | | |
3M Co. | | | 1,987 | | | | 378,047 | |
Alaska Air Group, Inc. | | | 412 | | | | 25,305 | |
| | | | | | | | | |
| Security Description | | Shares
| | Fair
Value
|
Common Stocks (continued) | | | | | | | | |
Industrials (continued) | | | | | | | | |
Allegion PLC | | | 316 | | | $ | 27,091 | |
American Airlines Group, Inc. | | | 1,452 | | | | 50,936 | |
AMETEK, Inc. | | | 767 | | | | 51,450 | |
AO Smith Corp. | | | 486 | | | | 22,128 | |
Arconic, Inc. | | | 1,403 | | | | 28,523 | |
Boeing Co. | | | 1,925 | | | | 683,105 | |
C.H. Robinson Worldwide, Inc. | | | 476 | | | | 42,378 | |
Caterpillar, Inc. | | | 1,965 | | | | 238,394 | |
Cintas Corp. | | | 284 | | | | 51,651 | |
Copart, Inc.* | | | 677 | | | | 33,112 | |
CSX Corp. | | | 3,036 | | | | 209,059 | |
Cummins, Inc. | | | 521 | | | | 71,215 | |
Deere & Co. | | | 1,075 | | | | 145,598 | |
Delta Air Lines, Inc. | | | 2,216 | | | | 121,282 | |
Dover Corp. | | | 516 | | | | 42,745 | |
Eaton Corp PLC | | | 1,482 | | | | 106,215 | |
Emerson Electric Co. | | | 2,127 | | | | 144,381 | |
Equifax, Inc. | | | 411 | | | | 41,692 | |
Expeditors International of Washington, Inc. | | | 601 | | | | 40,375 | |
Fastenal Co. | | | 956 | | | | 49,148 | |
FedEx Corp. | | | 822 | | | | 181,119 | |
Flowserve Corp. | | | 444 | | | | 20,380 | |
Fluor Corp. | | | 475 | | | | 20,834 | |
Fortive Corp. | | | 1,014 | | | | 75,290 | |
Fortune Brands Home & Security, Inc. | | | 511 | | | | 22,908 | |
General Dynamics Corp. | | | 924 | | | | 159,464 | |
General Electric Co. | | | 30,590 | | | | 308,959 | |
Harris Corp. | | | 410 | | | | 60,971 | |
Honeywell International, Inc. | | | 2,534 | | | | 366,974 | |
Huntington Ingalls Industries, Inc. | | | 161 | | | | 35,175 | |
IHS Markit Ltd.* | | | 1,207 | | | | 63,404 | |
Illinois Tool Works, Inc. | | | 1,041 | | | | 132,800 | |
Ingersoll-Rand PLC | | | 854 | | | | 81,933 | |
Jacobs Engineering Group, Inc. | | | 411 | | | | 30,862 | |
JB Hunt Transport Services, Inc. | | | 284 | | | | 31,413 | |
Johnson Controls International PLC | | | 3,100 | | | | 99,107 | |
Kansas City Southern | | | 351 | | | | 35,788 | |
L3 Technologies, Inc. | | | 259 | | | | 49,073 | |
Lockheed Martin Corp. | | | 831 | | | | 244,189 | |
Masco Corp. | | | 1,071 | | | | 32,130 | |
Nielsen Holdings PLC | | | 1,115 | | | | 28,968 | |
Norfolk Southern Corp. | | | 956 | | | | 160,445 | |
Northrop Grumman Corp. | | | 578 | | | | 151,407 | |
PACCAR, Inc. | | | 1,170 | | | | 66,936 | |
Parker-Hannifin Corp. | | | 444 | | | | 67,324 | |
Pentair PLC | | | 549 | | | | 22,042 | |
Quanta Services, Inc.* | | | 504 | | | | 15,725 | |
Raytheon Co. | | | 962 | | | | 168,388 | |
Republic Services, Inc. Class A | | | 762 | | | | 55,382 | |
Robert Half International, Inc. | | | 419 | | | | 25,362 | |
Rockwell Automation, Inc. | | | 426 | | | | 70,175 | |
Rockwell Collins, Inc. | | | 540 | | | | 69,131 | |
Rollins, Inc. | | | 280 | | | | 16,576 | |
Roper Technologies, Inc. | | | 349 | | | | 98,732 | |
Snap-on, Inc. | | | 191 | | | | 29,403 | |
Southwest Airlines Co. | | | 1,832 | | | | 89,951 | |
Stanley Black & Decker, Inc. | | | 509 | | | | 59,309 | |
Stericycle, Inc.* | | | 284 | | | | 14,191 | |
Textron, Inc. | | | 882 | | | | 47,302 | |
TransDigm Group, Inc.* | | | 161 | | | | 53,170 | |
Union Pacific Corp. | | | 2,660 | | | | 388,945 | |
The accompanying notes are an integral part of these financial statements.
15
Portfolio of Investments — Horizons S&P 500® Covered Call ETF (continued)
October 31, 2018| Security Description | | Shares
| | Fair
Value
|
Common Stocks (continued) | | | | | | | | |
Industrials (continued) | | | | | | | | |
United Continental Holdings, Inc.* | | | 860 | | | $ | 73,539 | |
United Parcel Service, Inc. Class B | | | 2,302 | | | | 245,255 | |
United Rentals, Inc.* | | | 290 | | | | 34,820 | |
United Technologies Corp. | | | 2,522 | | | | 313,258 | |
Verisk Analytics, Inc.* | | | 515 | | | | 61,718 | |
Waste Management, Inc. | | | 1,368 | | | | 122,395 | |
WW Grainger, Inc. | | | 174 | | | | 49,411 | |
Xylem, Inc. | | | 606 | | | | 39,741 | |
| | | | | | | 7,295,604 | |
Information Technology — 20.6% | | | | | | | | |
Accenture PLC | | | 2,056 | | | | 324,067 | |
Adobe Systems, Inc.* | | | 1,642 | | | | 403,538 | |
Advanced Micro Devices, Inc.* | | | 2,679 | | | | 48,784 | |
Akamai Technologies, Inc.* | | | 571 | | | | 41,255 | |
Alliance Data Systems Corp. | | | 161 | | | | 33,195 | |
Amphenol Corp. Class A | | | 1,016 | | | | 90,932 | |
Analog Devices, Inc. | | | 1,233 | | | | 103,214 | |
ANSYS, Inc.* | | | 291 | | | | 43,519 | |
Apple, Inc. | | | 15,560 | | | | 3,405,462 | |
Applied Materials, Inc. | | | 3,560 | | | | 117,053 | |
Arista Networks, Inc.* | | | 147 | | | | 33,861 | |
Autodesk, Inc.* | | | 729 | | | | 94,223 | |
Automatic Data Processing, Inc. | | | 1,484 | | | | 213,815 | |
Broadcom, Inc. | | | 1,355 | | | | 302,829 | |
Broadridge Financial Solutions, Inc. | | | 413 | | | | 48,296 | |
CA, Inc. | | | 1,049 | | | | 46,534 | |
Cadence Design Systems, Inc.* | | | 930 | | | | 41,450 | |
Cisco Systems, Inc. | | | 16,108 | | | | 736,941 | |
Citrix Systems, Inc. | | | 478 | | | | 48,981 | |
Cognizant Technology Solutions Class A | | | 1,964 | | | | 135,575 | |
Corning, Inc. | | | 3,004 | | | | 95,978 | |
DXC Technology Co. | | | 948 | | | | 69,043 | |
F5 Networks, Inc.* | | | 222 | | | | 38,912 | |
Fidelity National Information Services, Inc. | | | 1,141 | | | | 118,778 | |
Fiserv, Inc.* | | | 1,400 | | | | 111,020 | |
FleetCor Technologies, Inc.* | | | 325 | | | | 65,010 | |
FLIR Systems, Inc. | | | 454 | | | | 21,025 | |
Fortinet, Inc.* | | | 500 | | | | 41,090 | |
Gartner, Inc.* | | | 300 | | | | 44,256 | |
Global Payments, Inc. | | | 507 | | | | 57,915 | |
Hewlett Packard Enterprise Co. | | | 5,463 | | | | 83,311 | |
HP, Inc. | | | 5,555 | | | | 134,098 | |
Intel Corp. | | | 15,250 | | | | 714,920 | |
International Business Machines Corp. | | | 2,838 | | | | 327,590 | |
Intuit, Inc. | | | 820 | | | | 173,020 | |
IPG Photonics Corp.* | | | 126 | | | | 16,827 | |
Juniper Networks, Inc. | | | 1,265 | | | | 37,026 | |
KLA-Tencor Corp. | | | 520 | | | | 47,601 | |
Lam Research Corp. | | | 540 | | | | 76,534 | |
Mastercard, Inc. Class A | | | 3,104 | | | | 613,568 | |
Microchip Technology, Inc. | | | 771 | | | | 50,716 | |
Micron Technology, Inc.* | | | 3,717 | | | | 140,205 | |
Microsoft Corp. | | | 26,158 | | | | 2,793,936 | |
Motorola Solutions, Inc. | | | 541 | | | | 66,305 | |
NetApp, Inc. | | | 915 | | | | 71,818 | |
NVIDIA Corp. | | | 1,995 | | | | 420,606 | |
Oracle Corp. | | | 10,093 | | | | 492,942 | |
Paychex, Inc. | | | 1,075 | | | | 70,402 | |
Paypal Holdings, Inc.* | | | 3,761 | | | | 316,638 | |
| | | | | | | | | |
| Security Description | | Shares
| | Fair
Value
|
Common Stocks (continued) | | | | | | | | |
Information Technology (continued) | | | | | | | | |
Qorvo, Inc.* | | | 422 | | | $ | 31,021 | |
QUALCOMM, Inc. | | | 4,916 | | | | 309,167 | |
Red Hat, Inc.* | | | 601 | | | | 103,156 | |
salesforce.com, Inc.* | | | 2,271 | | | | 311,672 | |
Seagate Technology PLC | | | 955 | | | | 38,420 | |
Skyworks Solutions, Inc. | | | 611 | | | | 53,010 | |
Symantec Corp. | | | 2,055 | | | | 37,298 | |
Synopsys, Inc.* | | | 509 | | | | 45,571 | |
TE Connectivity Ltd. | | | 1,174 | | | | 88,543 | |
Texas Instruments, Inc. | | | 3,292 | | | | 305,596 | |
Total System Services, Inc. | | | 568 | | | | 51,773 | |
VeriSign, Inc.* | | | 286 | | | | 40,766 | |
Visa, Inc. | | | 5,936 | | | | 818,278 | |
Western Digital Corp. | | | 981 | | | | 42,252 | |
Western Union Co. | | | 1,544 | | | | 27,854 | |
Xerox Corp. | | | 708 | | | | 19,732 | |
Xilinx, Inc. | | | 827 | | | | 70,601 | |
| | | | | | | 16,019,324 | |
Materials — 2.6% | | | | | | | | |
Air Products & Chemicals, Inc. | | | 726 | | | | 112,058 | |
Albemarle Corp. | | | 378 | | | | 37,505 | |
Avery Dennison Corp. | | | 294 | | | | 26,672 | |
Ball Corp. | | | 1,171 | | | | 52,461 | |
CF Industries Holdings, Inc. | | | 772 | | | | 37,079 | |
DowDuPont, Inc. | | | 7,949 | | | | 428,610 | |
Eastman Chemical Co. | | | 482 | | | | 37,765 | |
Ecolab, Inc. | | | 865 | | | | 132,475 | |
FMC Corp. | | | 445 | | | | 34,746 | |
Freeport-McMoRan, Inc. | | | 4,477 | | | | 52,157 | |
International Flavors & Fragrances, Inc. | | | 262 | | | | 37,901 | |
International Paper Co. | | | 1,371 | | | | 62,188 | |
Linde PLC | | | 1,901 | | | | 314,558 | |
LyondellBasell Industries NV Class A | | | 1,079 | | | | 96,322 | |
Martin Marietta Materials, Inc. | | | 206 | | | | 35,284 | |
Mosaic Co. | | | 1,169 | | | | 36,169 | |
Newmont Mining Corp. | | | 1,774 | | | | 54,852 | |
Nucor Corp. | | | 1,073 | | | | 63,436 | |
Packaging Corp of America | | | 322 | | | | 29,563 | |
PPG Industries, Inc. | | | 854 | | | | 89,747 | |
Sealed Air Corp. | | | 600 | | | | 19,416 | |
Sherwin-Williams Co. | | | 284 | | | | 111,745 | |
Vulcan Materials Co. | | | 441 | | | | 44,603 | |
WestRock Co. | | | 855 | | | | 36,739 | |
| | | | | | | 1,984,051 | |
Real Estate — 2.7% | | | | | | | | |
Alexandria Real Estate Equities, Inc. | | | 320 | | | | 39,113 | |
American Tower Corp. | | | 1,426 | | | | 222,185 | |
Apartment Investment & Management Co. | | | 520 | | | | 22,381 | |
AvalonBay Communities, Inc. | | | 457 | | | | 80,149 | |
Boston Properties, Inc. | | | 512 | | | | 61,829 | |
CBRE Group, Inc.* | | | 1,025 | | | | 41,297 | |
Crown Castle International Corp. | | | 1,362 | | | | 148,104 | |
Digital Realty Trust, Inc. | | | 679 | | | | 70,113 | |
Duke Realty Corp. | | | 1,181 | | | | 32,560 | |
Equinix, Inc. | | | 259 | | | | 98,094 | |
Equity Residential | | | 1,232 | | | | 80,031 | |
Essex Property Trust, Inc. | | | 228 | | | | 57,178 | |
Extra Space Storage, Inc. | | | 418 | | | | 37,645 | |
The accompanying notes are an integral part of these financial statements.
16
Portfolio of Investments — Horizons S&P 500® Covered Call ETF (concluded)
October 31, 2018| Security Description | | Shares
| | Fair
Value
|
Common Stocks (continued) | | | | | | | | |
Real Estate (continued) | | | | | | | | |
Federal Realty Investment Trust | | | 238 | | | $ | 29,524 | |
HCP, Inc. | | | 1,558 | | | | 42,923 | |
Host Hotels & Resorts, Inc. | | | 2,462 | | | | 47,049 | |
Iron Mountain, Inc. | | | 889 | | | | 27,212 | |
Kimco Realty Corp. | | | 1,418 | | | | 22,816 | |
Macerich Co. | | | 361 | | | | 18,635 | |
Mid-America Apartment Communities, Inc. | | | 379 | | | | 37,032 | |
Prologis, Inc. | | | 1,770 | | | | 114,112 | |
Public Storage | | | 508 | | | | 104,379 | |
Realty Income Corp. | | | 921 | | | | 55,509 | |
Regency Centers Corp. | | | 504 | | | | 31,933 | |
Resideo Technologies, Inc.* | | | 422 | | | | 8,890 | |
SBA Communications Corp.* | | | 411 | | | | 66,652 | |
Simon Property Group, Inc. | | | 1,044 | | | | 191,595 | |
SL Green Realty Corp. | | | 327 | | | | 29,842 | |
UDR, Inc. | | | 890 | | | | 34,879 | |
Ventas, Inc. | | | 1,182 | | | | 68,603 | |
Vornado Realty Trust | | | 573 | | | | 39,010 | |
Welltower, Inc. | | | 1,229 | | | | 81,200 | |
Weyerhaeuser Co. | | | 2,503 | | | | 66,655 | |
| | | | | | | 2,109,129 | |
Utilities — 3.0% | | | | | | | | |
AES Corp. | | | 2,206 | | | | 32,163 | |
Alliant Energy Corp. | | | 768 | | | | 33,009 | |
Ameren Corp. | | | 805 | | | | 51,987 | |
American Electric Power Co., Inc. | | | 1,644 | | | | 120,604 | |
American Water Works Co., Inc. | | | 603 | | | | 53,384 | |
CenterPoint Energy, Inc. | | | 1,432 | | | | 38,678 | |
CMS Energy Corp. | | | 948 | | | | 46,945 | |
Consolidated Edison, Inc. | | | 985 | | | | 74,860 | |
Dominion Energy, Inc. | | | 2,146 | | | | 153,267 | |
DTE Energy Co. | | | 605 | | | | 68,002 | |
Duke Energy Corp. | | | 2,337 | | | | 193,106 | |
Edison International | | | 1,082 | | | | 75,080 | |
Entergy Corp. | | | 606 | | | | 50,874 | |
Evergy, Inc. | | | 863 | | | | 48,319 | |
Eversource Energy | | | 1,052 | | | | 66,549 | |
Exelon Corp. | | | 3,194 | | | | 139,929 | |
FirstEnergy Corp. | | | 1,488 | | | | 55,473 | |
NextEra Energy, Inc. | | | 1,556 | | | | 268,410 | |
NiSource, Inc. | | | 1,082 | | | | 27,440 | |
NRG Energy, Inc. | | | 1,011 | | | | 36,588 | |
PG&E Corp.* | | | 1,706 | | | | 79,858 | |
Pinnacle West Capital Corp. | | | 381 | | | | 31,337 | |
PPL Corp. | | | 2,273 | | | | 69,099 | |
Public Service Enterprise Group, Inc. | | | 1,682 | | | | 89,869 | |
SCANA Corp. | | | 475 | | | | 19,024 | |
Sempra Energy | | | 832 | | | | 91,620 | |
Southern Co. | | | 3,323 | | | | 149,635 | |
WEC Energy Group, Inc. | | | 1,048 | | | | 71,683 | |
Xcel Energy, Inc. | | | 1,687 | | | | 82,680 | |
| | | | | | | 2,319,472 | |
TOTAL COMMON STOCKS | | | | | | | | |
(Cost $69,229,898) | | | | | | | 77,339,886 | |
| | | | | | | | | |
INVESTMENTS, AT VALUE — 99.5% | | | | | | | | |
(Cost $69,229,898) | | | | | | $ | 77,339,886 | |
Other Assets in Excess of Liabilities: | | | | | | | | |
Written Call Options — (0.1)% | | | | | | | (76,950 | ) |
Other Assets — 0.6% | | | | | | | 437,598 | |
Total Other Assets in Excess of
Liabilities — 0.5% | | | | | | | 360,648 | |
Total Net Assets — 100.0% | | | | | | $ | 77,700,534 | |
† | | All or a portion of these securities has been segregated as collateral for written options contracts. The aggregate market value of collateral at October 31, 2018 was $77,339,886. |
*Non-income producing security.
Glossary:
Ltd. — Private Limited Company
PLC — Public Limited Company
Number of
Contractsˆ
| | | | Notional
Value
| | Fair
Value
|
Written Call Options — (0.1)% | | | | | | | | |
| | (285 | ) | | S&P 500® Index,
Strike @ $2,850, Exp 11/16/18 | | $ | (77,284,590 | ) | | $ | (76,950 | ) |
| | | | | Total Written Call Options | | | | | | | | |
| | | | | (Premiums Received
$432,235) | | | | | | $ | (76,950 | ) |
ˆ | | Each contract equals 100 shares. |
Sector Allocation (unaudited)
| | | | | | |
(as of October 31, 2018) |
Information Technology | | | | | 20.6 | % |
Health Care | | | | | 14.9 | |
Financials | | | | | 13.8 | |
Communication Services | | | | | 10.0 | |
Consumer Discretionary | | | | | 9.7 | |
Industrials | | | | | 9.4 | |
Consumer Staples | | | | | 7.3 | |
Energy | | | | | 5.5 | |
Utilities | | | | | 3.0 | |
Real Estate | | | | | 2.7 | |
Materials | | | | | 2.6 | |
Total Investments | | | | | 99.5 | |
Other Assets in Excess of Liabilities | | | | | 0.5 | |
Net Assets | | | | | 100.0 | % |
Sector allocation excludes derivatives and percentages indicated are based upon net assets.
The accompanying notes are an integral part of these financial statements.
17
Portfolio of Investments — Horizons DAX Germany ETF
October 31, 2018| Security Description | | Shares
| | Fair
Value
|
Common Stocks — 93.7% | | | | | | | | |
Communication Services — 4.8% | | | | | | | | |
Deutsche Telekom AG | | | 48,750 | | | $ | 800,652 | |
| | | | | | | | | |
Consumer Discretionary — 13.7% | | | | | | | | |
adidas AG | | | 2,937 | | | | 692,178 | |
Bayerische Motoren Werke AG | | | 5,308 | | | | 458,467 | |
Continental AG | | | 1,744 | | | | 288,404 | |
Daimler AG | | | 14,736 | | | | 874,239 | |
| | | | | | | 2,313,288 | |
Consumer Staples — 1.0% | | | | | | | | |
Beiersdorf AG | | | 1,586 | | | | 164,248 | |
| | | | | | | | | |
Financials — 15.9% | | | | | | | | |
Allianz SE | | | 6,998 | | | | 1,462,446 | |
Deutsche Bank AG | | | 31,490 | | | | 308,667 | |
Deutsche Boerse AG | | | 3,000 | | | | 380,197 | |
Muenchener Rueckversicherungs-Gesellschaft AG | | | 2,437 | | | | 524,500 | |
| | | | | | | 2,675,810 | |
Health Care — 5.4% | | | | | | | | |
Fresenius Medical Care AG & Co. KGaA | | | 3,418 | | | | 268,461 | |
Fresenius SE & Co. KGaA | | | 6,580 | | | | 419,595 | |
Merck KGaA | | | 2,088 | | | | 223,854 | |
| | | | | | | 911,910 | |
Industrials — 12.7% | | | | | | | | |
Deutsche Lufthansa AG | | | 7,171 | | | | 144,303 | |
Deutsche Post AG | | | 15,386 | | | | 487,257 | |
Siemens AG | | | 13,115 | | | | 1,511,560 | |
| | | | | | | 2,143,120 | |
Information Technology — 14.0% | | | | | | | | |
Infineon Technologies AG | | | 18,029 | | | | 361,777 | |
SAP SE | | | 15,452 | | | | 1,657,304 | |
Wirecard AG | | | 1,860 | | | | 348,577 | |
| | | | | | | 2,367,658 | |
Materials — 21.0% | | | | | | | | |
BASF SE | | | 14,981 | | | | 1,154,761 | |
Bayer AG | | | 15,113 | | | | 1,160,655 | |
Covestro AG | | | 2,777 | | | | 179,727 | |
HeidelbergCement AG | | | 2,409 | | | | 163,772 | |
Linde AG | | | 2,474 | | | | 541,390 | |
Linde PLC | | | 534 | | | | 171,450 | |
ThyssenKrupp AG | | | 7,852 | | | | 165,257 | |
| | | | | | | 3,537,012 | |
Real Estate — 2.1% | | | | | | | | |
Vonovia SE | | | 7,816 | | | | 357,958 | |
| | | | | | | | | |
Utilities — 3.1% | | | | | | | | |
E.ON SE | | | 35,627 | | | $ | 345,383 | |
RWE AG | | | 8,759 | | | | 170,898 | |
| | | | | | | 516,281 | |
TOTAL COMMON STOCKS | | | | | | | | |
(Cost $18,111,899) | | | | | | | 15,787,937 | |
| | | | | | | | | |
Preferred Stocks — 5.0% | | | | | | | | |
Consumer Discretionary — 3.1% | | | | | | | | |
Volkswagen AG (2.66%) | | | 3,132 | | | | 527,909 | |
| | | | | | | | | |
Consumer Staples — 1.9% | | | | | | | | |
Henkel AG & Co. KGaA (1.85%) | | | 2,828 | | | | 309,469 | |
| | | | | | | | | |
TOTAL PREFERRED STOCKS | | | | | | | | |
(Cost $1,066,389) | | | | | | | 837,378 | |
| | | | | | | | | |
INVESTMENTS, AT VALUE — 98.7% | | | | | | | | |
(Cost $19,178,288) | | | | | | | 16,625,315 | |
Other Assets in Excess of Liabilities — 1.3% | | | | | | | 225,566 | |
Total Net Assets — 100.0% | | | | | | $ | 16,850,881 | |
Glossary:
AG — Aktiengesellschaft is both the German and Swiss term for a stock corporation.
KGaA — Kommanditgesellschaft auf Aktien is a German corporate designation standing for partnership limited by shares.
PLC — Public Limited Company
SE — SE Regulation. A European Company which can operate on a Europe-wide basis and be governed by Community law directly applicable in all Member States.
| Sector Allocation (unaudited) | | | |
(as of October 31, 2018) |
Materials | | | | | 21.0 | % |
Consumer Discretionary | | | | | 16.8 | |
Financials | | | | | 15.9 | |
Information Technology | | | | | 14.0 | |
Industrials | | | | | 12.7 | |
Health Care | | | | | 5.4 | |
Communication Services | | | | | 4.8 | |
Utilities | | | | | 3.1 | |
Consumer Staples | | | | | 2.9 | |
Real Estate | | | | | 2.1 | |
Total Investments | | | | | 98.7 | |
Other Assets in Excess of Liabilities | | | | | 1.3 | |
Net Assets | | | | | 100.0 | % |
Percentages indicated are based upon net assets.
The accompanying notes are an integral part of these financial statements.
18
Statements of Assets and Liabilities
October 31, 2018
| | Horizons
NASDAQ 100®
Covered Call ETF
| | Horizons
S&P 500®
Covered Call ETF
| | Horizons DAX
Germany ETF
|
Assets: | | | | | | | | | | | | |
Investments, at cost | | $ | 364,414,954 | | | $ | 69,229,898 | | | $ | 19,178,288 | |
Investments, at value (Note 2) | | $ | 397,790,446 | | | $ | 77,339,886 | | | $ | 16,625,315 | |
Cash | | | 762,114 | | | | 377,990 | | | | 80,301 | |
Receivables: | | | | | | | | | | | | |
Investments Receivable | | | 1,044,766 | | | | 191,472 | | | | 672,325 | |
Dividends and interest | | | 55,299 | | | | 68,951 | | | | 132 | |
Due From Administrator (Note 10) | | | — | | | | — | | | | 64,838 | |
Reclaims | | | — | | | | 620 | | | | 98,841 | |
Total Assets | | | 399,652,625 | | | | 77,978,919 | | | | 17,541,752 | |
| | | | | | | | | | | | | |
Liabilities: | | | | | | | | | | | | |
Payables: | | | | | | | | | | | | |
Options written, at value (premiums received $8,400,436, $432,235 and $—) | | | 3,311,800 | | | | 76,950 | | | | — | |
Investments Payable | | | 940,332 | | | | 157,313 | | | | 687,900 | |
Accrued Advisory fees | | | 198,912 | | | | 44,122 | | | | 2,971 | |
Total Liabilities | | | 4,451,044 | | | | 278,385 | | | | 690,871 | |
Net Assets | | $ | 395,201,581 | | | $ | 77,700,534 | | | $ | 16,850,881 | |
| | | | | | | | | | | | | |
Net Assets Consist of: | | | | | | | | | | | | |
Paid-in capital | | $ | 399,605,331 | | | $ | 77,719,166 | | | $ | 19,721,141 | |
Total distributable earnings (loss) (Note 5) | | | (4,403,750 | ) | | | (18,632 | ) | | | (2,870,260 | ) |
Net Assets | | $ | 395,201,581 | | | $ | 77,700,534 | | | $ | 16,850,881 | |
| | | | | | | | | | | | | |
Shares outstanding (unlimited number of shares of beneficial interest authorized, without par value) | | | 16,850,000 | | | | 1,600,000 | | | | 650,000 | |
Net asset value, per share | | $ | 23.45 | | | $ | 48.56 | | | $ | 25.92 | |
The accompanying notes are an integral part of these financial statements.
19
Statements of Operations
For the Year Ended October 31, 2018
| | Horizons
NASDAQ 100®
Covered Call ETF
| | Horizons
S&P 500®
Covered Call ETF
| | Horizons DAX
Germany ETF
|
Investment Income: | | | | | | | | | | | | |
Dividend income1 | | $ | 2,405,193 | | | $ | 1,108,585 | | | $ | 546,453 | |
| | | | | | | | | | | | | |
Expenses: | | | | | | | | | | | | |
Advisory fees | | | 1,467,560 | | | | 385,304 | | | | 88,874 | |
Excise tax (Note 5) | | | 205,113 | | | | — | | | | — | |
Total Expenses | | | 1,672,673 | | | | 385,304 | | | | 88,874 | |
Advisory fees waived | | | — | | | | — | | | | (49,375 | ) |
Net Expenses | | | 1,672,673 | | | | 385,304 | | | | 39,499 | |
Net Investment Income | | | 732,520 | | | | 723,281 | | | | 506,954 | |
| | | | | | | | | | | | | |
Net Realized and Unrealized Gain (Loss) on: | | | | | | | | | | | | |
Net Realized Gain (Loss) on: | | | | | | | | | | | | |
Payment from Administrator (Note 10) | | | — | | | | — | | | | 64,838 | |
Investments | | | (2,772,195 | ) | | | 260,401 | | | | (189,115 | ) |
Options written | | | (12,924,928 | ) | | | (2,032,147 | ) | | | — | |
In-kind transactions | | | 12,988,461 | | | | 7,209,864 | | | | 191,780 | |
Foreign currency transactions | | | — | | | | — | | | | 355 | |
Net Realized Gain (Loss) | | | (2,708,662 | ) | | | 5,438,118 | | | | 67,858 | |
| | | | | | | | | | | | | |
Net Change in Unrealized Appreciation (Depreciation) on: | | | | | | | | | | | | |
Investments | | | 3,957,090 | | | | (5,401,999 | ) | | | (4,049,181 | ) |
Options written | | | 7,340,224 | | | | 558,038 | | | | — | |
Foreign currency translations | | | — | | | | — | | | | (6,492 | ) |
Net Change in Unrealized Appreciation (Depreciation) | | | 11,297,314 | | | | (4,843,961 | ) | | | (4,055,673 | ) |
| | | | | | | | | | | | | |
Net Realized and Unrealized Gain (Loss) on Investments | | | 8,588,652 | | | | 594,157 | | | | (3,987,815 | ) |
Net Increase (Decrease) in Net Assets Resulting From Operations | | $ | 9,321,172 | | | $ | 1,317,438 | | | $ | (3,480,861 | ) |
Foreign tax withheld | | $ | (505 | ) | | $ | — | | | $ | (81,584 | ) |
1 | | Net of Foreign tax withheld. |
The accompanying notes are an integral part of these financial statements.
20
Statements of Changes in Net Assets
| | Horizons NASDAQ 100® Covered Call ETF
| | Horizons S&P 500® Covered Call ETF
|
| | For the
Year Ended
October 31, 2018
| | For the
Year Ended
October 31, 2017
| | For the
Year Ended
October 31, 2018
| | For the
Period Ended
October 31, 20171
| | For the
Year Ended
April 30, 2017
|
| Investment Operations | | | |
Net investment income | | $ | 732,520 | | | $ | 482,596 | | | $ | 723,281 | | | $ | 432,293 | | | $ | 929,506 | |
Net realized gain (loss) on investments, options written and foreign currency transactions | | | (2,708,662 | ) | | | (6,397,862 | ) | | | 5,438,118 | | | | 260,819 | | | | (142,244 | ) |
Net change in unrealized appreciation (depreciation) on investments, options written and foreign currency translation | | | 11,297,314 | | | | 21,495,772 | | | | (4,843,961 | ) | | | 3,109,570 | | | | 7,748,541 | |
Net increase in net assets resulting from operations | | | 9,321,172 | | | | 15,580,506 | | | | 1,317,438 | | | | 3,802,682 | | | | 8,535,803 | |
| | | | | | | | | | | | | | | | | | | | | |
Distributions to Shareholders From: | | | | | | | | | | | | | | | | | | | | |
Earnings | | | (9,059,626 | ) | | | (7,462,456 | )3 | | | (1,882,552 | ) | | | (671,990 | )3 | | | (2,156,257 | )3 |
Return of capital5 | | | (17,698,697 | ) | | | — | | | | (3,049,443 | ) | | | — | | | | — | |
Total distributions | | | (26,758,323 | ) | | | (7,462,456 | ) | | | (4,931,995 | ) | | | (671,990 | ) | | | 2,156,257 | ) |
| | | | | | | | | | | | | | | | | | | | | |
Shareholder Transactions: | | | | | | | | | | | | | | | | | | | | |
Proceeds from shares sold | | | 283,373,920 | | | | 96,910,375 | | | | 38,709,355 | | | | 4,814,360 | | | | 9,058,596 | |
Cost of shares redeemed | | | (28,715,190 | ) | | | — | | | | (20,022,760 | ) | | | (9,729,200 | ) | | | (11,484,311 | ) |
Net increase (decrease) in net assets resulting from shareholder transactions | | | 254,658,730 | | | | 96,910,375 | | | | 18,686,595 | | | | (4,914,840 | ) | | | (2,425,715 | ) |
Net increase (decrease) in net assets | | | 237,221,579 | | | | 105,028,425 | | | | 15,072,038 | | | | (1,784,148 | ) | | | 3,953,831 | |
| | | | | | | | | | | | | | | | | | | | | |
Net Assets | | | | | | | | | | | | | | | | | | | | |
Beginning of period | | | 157,980,002 | | | | 52,951,577 | | | | 62,628,496 | | | | 64,412,644 | | | | 60,458,813 | |
End of period | | $ | 395,201,581 | | | $ | 157,980,002 | 4 | | $ | 77,700,534 | | | $ | 62,628,496 | 4 | | | 64,412,644 | 4 |
| | | | | | | | | | | | | | | | | | | | | |
Changes in Shares Outstanding: | | | | | | | | | | | | | | | | | | | | |
Shares outstanding, beginning of period | | | 6,500,000 | | | | 2,400,000 | | | | 1,250,000 | | | | 1,352,500 | | | | 1,402,500 | |
Shares sold | | | 11,500,000 | | | | 4,100,000 | | | | 750,000 | | | | 100,000 | | | | 200,000 | |
Shares redeemed | | | (1,150,000 | ) | | | — | | | | (400,000 | ) | | | (202,500 | )2 | | | (250,000 | ) |
Shares outstanding, end of period | | | 16,850,000 | | | | 6,500,000 | | | | 1,600,000 | | | | 1,250,000 | | | | 1,352,500 | |
1 | | Effective October 31, 2017, the Horizons S&P 500® Covered Call ETF changed its fiscal year end from April 30 to October 31. The information presented is from May 1, 2017 through October 31, 2017. |
2 | | Includes the redemption of the Advisor’s seed capital. |
3 | | Includes net investment income distributions of $7,462,456, $671,990 and $2,156,257, respectively. |
4 | | Includes undistributed net investment income of $0, $0 and $0, respectively. |
5 | | Pursuant to Rule 19a-1 under the Investment Company Act of 1940, Notices of Sources of Distributions are posted on the Fund’s website: https://horizonsetfsus.com. |
The accompanying notes are an integral part of these financial statements.
21
Statements of Changes in Net Assets (concluded)
| | Horizons DAX Germany ETF
|
| | For the
Year Ended
October 31, 2018
| | For the
Year Ended
October 31, 2017
|
Investment Operations | | | | | | | | |
Net investment income | | $ | 506,954 | | | $ | 236,269 | |
Net realized gain (loss) on investments, options written, foreign currency transactions and payment from administrator (Note 10) | | | 67,858 | | | | 71,627 | |
Net change in unrealized appreciation (depreciation) on investments, options written and foreign currency translation | | | (4,055,673 | ) | | | 3,237,538 | |
Net increase (decrease) in net assets resulting from operations | | | (3,480,861 | ) | | | 3,545,434 | |
| | | | | | | | | |
Distributions to Shareholders From: | | | | | | | | |
Earnings | | | (244,615 | ) | | | (403,498 | )1 |
Return of capital3 | | | — | | | | (18,200 | ) |
Total distributions | | | (244,615 | ) | | | (421,698 | ) |
| | | | | | | | | |
Shareholder Transactions: | | | | | | | | |
Proceeds from shares sold | | | 4,859,840 | | | | 3,074,616 | |
Cost of shares redeemed | | | (1,469,780 | ) | | | (2,613,010 | ) |
Net increase in net assets resulting from shareholder transactions | | | 3,390,060 | | | | 461,606 | |
Net increase (decrease) in net assets | | | (335,416 | ) | | | 3,585,342 | |
| | | | | | | | | |
Net Assets | | | | | | | | |
Beginning of year | | | 17,186,297 | | | | 13,600,955 | |
End of year | | $ | 16,850,881 | | | $ | 17,186,297 | 2 |
| | | | | | | | | |
Changes in Shares Outstanding: | | | | | | | | |
Shares outstanding, beginning of year | | | 550,000 | | | | 550,000 | |
Shares sold | | | 150,000 | | | | 100,000 | |
Shares redeemed | | | (50,000 | ) | | | (100,000 | ) |
Shares outstanding, end of year | | | 650,000 | | | | 550,000 | |
1 | | Includes net investment income distributions of $403,498. |
2 | | Includes undistributed net investment income of $0. |
3 | | Pursuant to Rule 19a-1 under the Investment Company Act of 1940, Notices of Sources of Distributions are posted on the Fund’s website: https://horizonsetfsus.com. |
The accompanying notes are an integral part of these financial statements.
22
Financial Highlights — Horizons NASDAQ 100® Covered Call ETF
| | For the
Year Ended
October 31,
2018
| | For the
Year Ended
October 31,
2017
| | For the
Year Ended
October 31,
2016
| | For the
Year Ended
October 31,
2015
| | For the Period
December 12, 20131
Through
October 31,
2014
|
| For A Share Outstanding Throughout the Periods Presented: | | | | | | | | | | | | | | | | | | | | |
Net asset value, beginning of period | | $ | 24.30 | | | $ | 22.06 | | | $ | 23.51 | | | $ | 24.04 | | | $ | 25.00 | |
| | | | | | | | | | | | | | | | | | | | | |
Investment operations: | | | | | | | | | | | | | | | | | | | | |
Net investment income2 | | | 0.07 | | | | 0.12 | | | | 0.15 | | | | 0.16 | | | | 0.16 | |
Net realized and unrealized gain on investments and options written | | | 1.71 | | | | 3.93 | | | | 0.53 | | | | 1.47 | | | | 1.11 | |
Total from investment operations | | | 1.78 | | | | 4.05 | | | | 0.68 | | | | 1.63 | | | | 1.27 | |
| | | | | | | | | | | | | | | | | | | | | |
Distributions from: | | | | | | | | | | | | | | | | | | | | |
Net investment income | | | (0.87 | ) | | | (1.81 | ) | | | (1.06 | ) | | | (1.92 | ) | | | (0.35 | ) |
Net realized gain | | | (0.11 | ) | | | — | | | | — | | | | — | | | | — | |
Return of capital7 | | | (1.65 | ) | | | — | | | | (1.07 | ) | | | (0.24 | ) | | | (1.88 | ) |
Total distribution to shareholders | | | (2.63 | ) | | | (1.81 | ) | | | (2.13 | ) | | | (2.16 | ) | | | (2.23 | ) |
Net asset value, end of period | | $ | 23.45 | | | $ | 24.30 | | | $ | 22.06 | | | $ | 23.51 | | | $ | 24.04 | |
Total Return on Market Price8 | | | 7.50 | % | | | 18.81 | % | | | 3.38 | % | | | 7.48 | % | | | 5.91 | % |
Total Return on Net Asset Value3 | | | 7.44 | % | | | 19.04 | % | | | 3.32 | % | | | 7.25 | % | | | 5.11 | % |
Net assets, end of period (000’s omitted) | | $ | 395,202 | | | $ | 157,980 | | | $ | 52,952 | | | $ | 22,337 | | | $ | 12,022 | |
| | | | | | | | | | | | | | | | | | | | | |
Ratios/Supplemental Data: | | | | | | | | | | | | | | | | | | | | |
Ratios to average net assets: | | | | | | | | | | | | | | | | | | | | |
Expenses | | | 0.68 | %9 | | | 0.60 | % | | | 0.60 | % | | | 0.60 | % | | | 0.60 | %4 |
Net investment income | | | 0.30 | % | | | 0.53 | % | | | 0.69 | % | | | 0.67 | % | | | 0.74 | %4 |
Portfolio turnover rate5 | | | 15 | % | | | 4 | % | | | 9 | % | | | 13 | % | | | 18 | %6 |
1 | | Commencement of operations. |
2 | | Based on average shares outstanding. |
3 | | Total Return on Net Asset Value is calculated assuming an initial investment made at the net asset value on the first day of the period, reinvestment of dividends and distributions at net asset value during the period, and redemption at net asset value on the last day of the period. Total Return on Net Asset Value calculated for a period of less than one year is not annualized. |
5 | | Portfolio turnover excludes the value of portfolio securities received or delivered as a result of in-kind creations or redemptions of the Fund’s capital shares. |
7 | | Pursuant to Rule 19a-1 under the Investment Company Act of 1940, Notices of Sources of Distributions are posted on the Fund’s website: https://horizonsetfsus.com. |
8 | | Total Return on Market Price is calculated assuming an initial investment made at the market price on the first day of the period, reinvestment of dividends and distributions at market price during the period, and redemption at market price on the last day of the period. Total Return on Market Price calculated for a period of less than one year is not annualized. |
9 | | Includes excise tax. If this excise expense was not included, the expense ratio would have been 0.60%. |
The accompanying notes are an integral part of these financial statements.
23
Financial Highlights — Horizons S&P 500® Covered Call ETF
| | For the
Year Ended
October 31,
2018
| | For the
Period Ended
October 31,
20178
| | For the
Year Ended
April 30,
2017
| | For the
Year Ended
April 30,
2016
| | For the
Year Ended
April 30,
2015
| | For the Period
June 24, 20131
Through
April 30,
2014
|
For A Share Outstanding Throughout the Period Presented: | | | | | | | | | | | | | | | | | | | | | | | | |
Net asset value, beginning of period | | $ | 50.10 | | | $ | 47.62 | | | $ | 43.11 | | | $ | 45.39 | | | $ | 44.85 | | | $ | 40.00 | |
| | | | | | | | | | | | | | | | | | | | | | | | | |
Investment operations: | | | | | | | | | | | | | | | | | | | | | | | | |
Net investment income2 | | | 0.62 | | | | 0.34 | | | | 0.66 | | | | 0.70 | | | | 0.63 | | | | 0.52 | |
Net realized and unrealized gain on investments and options written | | | 1.88 | | | | 2.67 | | | | 5.39 | | | | (0.90 | ) | | | 2.03 | | | | 5.66 | |
Total from investment operations | | | 2.50 | | | | 3.01 | | | | 6.05 | | | | (0.20 | ) | | | 2.66 | | | | 6.18 | |
| | | | | | | | | | | | | | | | | | | | | | | | | |
Distributions from: | | | | | | | | | | | | | | | | | | | | | | | | |
Net investment income | | | (0.22 | ) | | | (0.53 | ) | | | (1.54 | ) | | | (1.50 | ) | | | (0.83 | ) | | | (0.64 | ) |
Net realized gain | | | (1.22 | ) | | | — | | | | — | | | | — | | | | (0.63 | ) | | | (0.69 | ) |
Return of capital7 | | | (2.60 | ) | | | — | | | | — | | | | (0.58 | ) | | | (0.66 | ) | | | — | |
Total distribution to shareholders | | | (4.04 | ) | | | (0.53 | ) | | | (1.54 | ) | | | (2.08 | ) | | | 2.12 | | | | (1.33 | ) |
Net asset value, end of period | | $ | 48.56 | | | $ | 50.10 | | | $ | 47.62 | | | $ | 43.11 | | | $ | 45.39 | | | $ | 44.85 | |
Total Return on Market Price9 | | | 7.24 | % | | | 6.24 | % | | | 14.54 | % | | | (0.67 | )% | | | 6.47 | % | | | 15.73 | % |
Total Return on Net Asset Value3 | | | 4.97 | % | | | 6.35 | % | | | 14.29 | % | | | (0.29 | )% | | | 5.97 | % | | | 15.59 | % |
Net assets, end of period (000’s omitted) | | $ | 77,701 | | | $ | 62,628 | | | $ | 64,413 | | | $ | 60,459 | | | $ | 77,276 | | | $ | 27,024 | |
| | | | | | | | | | | | | | | | | | | | | | | | | |
Ratios/Supplemental Data: | | | | | | | | | | | | | | �� | | | | | | | | | | |
| Ratios to average net assets: | | | | | | | | | | | | | | | | | | | | | | | | |
Net expenses | | | 0.65 | % | | | 0.65 | %4 | | | 0.65 | % | | | 0.65 | % | | | 0.65 | % | | | 0.65 | %4 |
Net investment income | | | 1.22 | % | | | 1.39 | %4 | | | 1.46 | % | | | 1.61 | % | | | 1.39 | % | | | 1.37 | %4 |
Portfolio turnover rate5 | | | 4 | % | | | 8 | %6 | | | 21 | % | | | 7 | % | | | 12 | % | | | 34 | %6 |
1 | | Commencement of operations. |
2 | | Based on average shares outstanding. |
3 | | Total Return on Net Asset Value is calculated assuming an initial investment made at the net asset value on the first day of the period, reinvestment of dividends and distributions at net asset value during the period, and redemption at net asset value on the last day of the period. Total Return on Net Asset Value calculated for a period of less than one year is not annualized. |
5 | | Portfolio turnover excludes the value of portfolio securities received or delivered as a result of in-kind creations or redemptions of the Fund’s capital shares. |
7 | | Pursuant to Rule 19a-1 under the Investment Company Act of 1940, Notices of Sources of Distributions are posted on the Fund’s website: https://us.horizonsetfs.com. |
8 | | Effective October 31, 2017, the Horizons S&P 500® Covered Call ETF changed its fiscal year end from April 30 to October 31. The information presented is from May 1, 2017 through October 31, 2017. |
9 | | Total Return on Market Price is calculated assuming an initial investment made at the market price on the first day of the period, reinvestment of dividends and distributions at market price during the period, and redemption at market price on the last day of the period. Total Return on Market Price calculated for a period of less than one year is not annualized. |
The accompanying notes are an integral part of these financial statements.
24
Financial Highlights — Horizons DAX Germany ETF
| | For the
Year Ended
October 31, 2018
| | For the
Year Ended
October 31, 2017
| | For the
Year Ended
October 31, 2016
| | For the
Year Ended
October 31, 2015
| | For the Period
October 23, 20141
Through
October 31, 2014
|
For A Share Outstanding Throughout the Periods Presented: | | | | | | | | | | | | | | | | | | | | |
Net asset value, beginning of period | | $ | 31.25 | | | $ | 24.73 | | | $ | 25.82 | | | $ | 25.73 | | | $ | 25.00 | |
Investment operations: | | | | | | | | | | | | | | | | | | | | |
Net investment income (loss)2 | | | 0.77 | | | | 0.48 | | | | 0.45 | | | | 0.73 | | | | (— | )3 |
Net realized and unrealized gain (loss) on investments and foreign currency translations | | | (5.75 | )9 | | | 6.91 | | | | (1.33 | ) | | | (0.37 | ) | | | 0.73 | |
Total from investment operations | | | (4.98 | ) | | | 7.39 | | | | (0.88 | ) | | | 0.36 | | | | 0.73 | |
Distributions from: | | | | | | | | | | | | | | | | | | | | |
Net investment income | | | (0.35 | ) | | | (0.83 | ) | | | (0.21 | ) | | | (0.27 | ) | | | — | |
Return of capital | | | — | | | | (0.04 | ) | | | — | | | | — | | | | — | |
Total distribution to shareholders | | | (0.35 | ) | | | (0.87 | ) | | | (0.21 | ) | | | (0.27 | ) | | | — | |
Net asset value, end of period | | $ | 25.92 | | | $ | 31.25 | | | $ | 24.73 | | | $ | 25.82 | | | $ | 25.73 | |
Total Return on Market Price8 | | | (17.08 | )% | | | 31.52 | % | | | (2.77 | )% | | | 0.56 | % | | | 3.00 | % |
Total Return on Net Asset Value4 | | | (16.05 | )%10 | | | 30.40 | % | | | (3.41 | )% | | | 1.34 | % | | | 2.92 | % |
Net assets, end of period (000’s omitted) | | $ | 16,851 | | | $ | 17,186 | | | $ | 13,601 | | | $ | 15,494 | | | $ | 12,866 | |
Ratios/Supplemental Data: | | | | | | | | | | | | | | | | | | | | |
Ratios to average net assets: | | | | | | | | | | | | | | | | | | | | |
Gross expenses | | | 0.45 | % | | | 0.45 | % | | | 0.45 | % | | | 0.45 | % | | | 0.45 | %5 |
Net expenses | | | 0.20 | % | | | 0.38 | % | | | 0.45 | % | | | 0.45 | % | | | 0.45 | %5 |
Net investment income (loss) | | | 2.57 | % | | | 1.74 | % | | | 1.86 | % | | | 2.70 | % | | | (0.45 | )%5 |
Portfolio turnover rate6 | | | 7 | % | | | 9 | % | | | 14 | % | | | 9 | % | | | 0 | %7 |
1 | | Commencement of operations. |
2 | | Based on average shares outstanding. |
3 | | Amount is less than $(0.005). |
4 | | Total Return on Net Asset Value is calculated assuming an initial investment made at the net asset value on the first day of the period, reinvestment of dividends and distributions at net asset value during the period, and redemption at net asset value on the last day of the period. Total Return on Net Asset Value calculated for a period of less than one year is not annualized. |
6 | | Portfolio turnover excludes the value of portfolio securities received or delivered as a result of in-kind creations or redemptions of the Fund’s capital shares. |
8 | | Total Return on Market Price is calculated assuming an initial investment made at the market price on the first day of the period, reinvestment of dividends and distributions at market price during the period, and redemption at market price on the last day of the period. Total Return on Market Price calculated for a period of less than one year is not annualized. |
9 | | Includes a $0.10 gain per share derived from a payment from the Administrator. See Note 10. |
10 | | Before payment from the Administrator for the loss resulting from the error, the total return for the period would have been (16.37%). See Note 10. |
The accompanying notes are an integral part of these financial statements.
Notes to Financial Statements
October 31, 2018
1. ORGANIZATION
Horizons ETF Trust I (the “Trust”) , formerly known as Recon Capital Series Trust, ETF Series Trust and Sage Quant ETF Trust was organized as a Delaware statutory trust on May 17, 2012 and is currently comprised of three investment portfolios. These financial statements relate to the Horizons NASDAQ 100® Covered Call ETF, Horizons S&P 500® Covered Call ETF and Horizons DAX Germany ETF (each a “Fund” and collectively, the “Funds”), which are series of the Trust. Horizons NASDAQ 100® Covered Call ETF and Horizons DAX Germany ETF are classified as non-diversified and Horizons S&P 500® Covered Call ETF is classified as a diversified, open-end, management investment company under the Investment Company Act of 1940, as amended (the “1940 Act”). The Funds commenced operations on December 12, 2013, June 24, 2013 and October 23, 2014, respectively.
Horizons NASDAQ 100® Covered Call ETF seeks to provide investment results that will closely correspond, before fees and expenses, generally to the price and yield performance of the CBOE NASDAQ 100® BuyWrite V2 Index (the “BXNT Index”). The BXNT Index measures the total return of a portfolio consisting of common stocks of the 100 companies included in the NASDAQ 100® Index and call options systematically written on those securities through a “buy-write” or covered call strategy. A “buy-write” strategy is an investment strategy in which the Fund buys a specific basket of stocks (such as the NASDAQ 100® Index) and sells covered call options that correspond to that basket of stocks.
The S&P 500 Covered Call ETF seeks investment results that, before fees and expenses, generally correspond to the performance of the CBOE S&P 500 2% OTM BuyWrite Index (the “BXY Index”). The BXY Index measures the total return of a portfolio consisting of common stocks of companies included in the S&P 500 Index and call options systematically written on those securities through a “buy-write” or covered call strategy. A “buy-write” strategy is an investment strategy in which the Fund buys a specific basket of stocks (such as the S&P 500 Index) and sells covered call options that correspond to that basket of stocks.
Horizons DAX Germany ETF seeks to provide investment results using a passive or indexing investment approach that will closely correspond, before fees and expenses, generally to the price and yield performance of the DAX® Index (“DAX® Index”). The DAX® Index tracks the segment of the largest and most actively traded companies — known as blue chips — on the German equities market. It contains the shares of the 30 largest German companies in terms of liquidity and market capitalization admitted to the Frankfurt Stock Exchange in the Prime Standard segment. The 30 stocks contained in the Index represents about 80% of the market capitalization listed in Germany.
2. SIGNIFICANT ACCOUNTING POLICIES
The Funds follow the accounting and reporting guidelines issued in Topic 946, “Financial Services — Investment Companies,” by the Financial Accounting Standards Board (“FASB”).
Use of Estimates
These financial statements are prepared in conformity with generally accepted accounting principles in the United States of America (“GAAP”), which require management to make certain estimates and assumptions that affect the reported amounts of assets and liabilities and disclosure of contingent assets and liabilities at the date of the financial statements and reported amounts of increases and decreases in the net assets from operations during the reporting period. Actual results could differ from those estimates. The following is a summary of significant accounting policies followed by the Funds.
Securities Valuation
Security holdings traded on a national securities exchange are valued based on their last sale price. Price information on listed securities is taken from the exchange where the security is primarily traded. Securities regularly traded in an over-the-counter market are valued at the latest quoted sale price in such market or in the case of the NASDAQ, at the NASDAQ Official Closing Price. If there has been no sale or official closing price for a particular security on a particular day, one of the factors that a Fund will use to estimate the market price of that security is the midpoint of the bid/ask price of that security. If market quotations are not readily available, or if it is determined that a quotation of a security does not represent fair value, then the security is valued at fair value as determined in good faith using procedures adopted by the Trust’s Board of Trustees (the “Board”).
Purchased and written options contracts listed on exchanges are valued at their reported mean of bid and ask quotations; over-the-counter derivative contracts are fair valued using price evaluations provided by an independent pricing service.
Fair Value Measurement
GAAP requires disclosure regarding the inputs and valuation techniques used to measure fair value and any changes in valuation inputs or techniques. In addition, investments shall be disclosed by major category.
26
Notes to Financial Statements (continued)
October 31, 2018The Funds categorize their fair value measurements according to a three-level hierarchy that maximizes the use of observable inputs and minimizes the use of unobservable inputs by prioritizing that the most observable input be used when available. Observable inputs are those that market participants would use in pricing an investment based on market data obtained from sources independent of the reporting entity. Unobservable inputs are those that reflect the Funds’ assumptions about the information market participants would use in pricing an investment. An investment’s level within the fair value hierarchy is based on the lowest level of any input that is deemed significant to the asset or liability’s fair value measurement. The input levels and methodology are not necessarily an indication of the risk or liquidity associated with investments at that level. For example, certain U.S. government securities are generally high quality and liquid, however, they are reflected as Level 2 because the inputs used to determine fair value may not always be quoted prices in an active market.
Fair value inputs are summarized in the three broad levels listed below:
• | | Level 1—Valuations based on quoted prices for identical investments in active markets that the Funds have the ability to access at the measurements date (including NAV for open-end mutual funds). Valuation adjustments are not applied to Level 1 investments. |
• | | Level 2—Valuations based on other significant observable inputs (including quoted prices for similar securities, interest rates, prepayments speeds, credit risks, etc.). |
• | | Level 3—Valuations based on significant unobservable inputs (including the Funds’ own assumptions and judgment in determining the fair value of investments). |
The following summarizes inputs used as of October 31, 2018 in valuing the Funds’ assets and liabilities carried at fair value:
Horizons NASDAQ 100® Covered Call ETF
| Assets† | | Level 1
| | Level 2
| | Level 3
| | Total
|
Common Stocks | | $ | 397,790,446 | | | $ | — | | | $ | — | | | $ | 397,790,446 | |
Other Financial Instruments: | | | | | | | | | | | | | | | | |
Options Written* | | | — | | | | (3,311,800 | ) | | | — | | | | (3,311,800 | ) |
Total | | $ | 397,790,446 | | | $ | (3,311,800 | ) | | $ | — | | | $ | 394,478,646 | |
Horizons S&P 500® Covered Call ETF
| Assets† | | Level 1
| | Level 2
| | Level 3
| | Total
|
Common Stocks | | $ | 77,339,886 | | | $ | — | | | $ | — | | | $ | 77,339,886 | |
Other Financial Instruments: | | | | | | | | | | | | | | | | |
Options Written* | | | — | | | | (76,950 | ) | | | — | | | | (76,950 | ) |
Total | | $ | 77,339,886 | | | $ | (76,950 | ) | | $ | — | | | $ | 77,262,936 | |
Horizons DAX Germany ETF
| Assets† | | Level 1
| | Level 2
| | Level 3
| | Total
|
Common Stocks | | $ | 15,787,937 | | | $ | — | | | $ | — | | | $ | 15,787,937 | |
Preferred Stocks | | | 837,378 | | | | — | | | | — | | | | 837,378 | |
Total | | $ | 16,625,315 | | | $ | — | | | $ | — | | | $ | 16,625,315 | |
† | | See the Portfolio of Investments for breakdown by sector. |
* | | Written options contracts listed on exchanges are valued at their reported mean of bid and ask quotations; over the-counter derivative contracts are fair valued using price evaluations provided by a pricing service approved by the Board. |
A reconciliation of assets in which Level 3 inputs are used in determining fair value is presented when there are Level 3 investments at the end of the period. There were no transfers to or from level 3 during the reporting period.
27
Notes to Financial Statements (continued)
October 31, 2018Indemnification
In the normal course of business, the Funds may enter into contracts that contain a variety of representations which provide general indemnifications for certain liabilities. Each Fund’s maximum exposure under these arrangements is unknown as this would involve future claims that may not be made against each Fund that have not yet occurred. However, the Funds have not had prior claims or losses pursuant to these contracts and expect the risk of loss to be remote.
Cash and Cash Equivalents
Cash and cash equivalents include funds from time to time deposited with financial institutions and short-term, liquid investments in a money market fund. Cash and cash equivalents are carried at cost which approximates fair value.
Concentration of Risk
The Funds place cash and cash equivalents with financial institutions and, at times, cash held in money market accounts may exceed the Federal Deposit Insurance Corporation insured limit.
Investment Valuation
The NAV is determined as of the close of trading (generally, 4:00 PM Eastern Time) on each day the New York Stock Exchange (“NYSE”) is open for trading. NAV per share is calculated by dividing each Fund’s net assets by the number of Fund shares outstanding. The price used to calculate Market Price returns is determined by using the closing price and does not represent returns an investor would receive if shares were traded at other times.
Security Transactions
Security transactions are accounted for on the trade date. Realized gains and losses on sales of investment securities are calculated using the specific identification method of cost relief.
Foreign Currency Translation
The books and records of the Funds are maintained in U.S. dollars. Foreign currency amounts are translated into U.S. dollars at the prevailing exchange rates of such currencies against the U.S. dollar. The market value of investment securities and other assets and liabilities are translated at the exchange rate as of the valuation date. Purchases and sales of investment securities, income and expenses are translated at the exchange rate prevailing on the respective dates of such transactions.
Although the net assets of the Funds are presented at the foreign exchange rates and market values at the close of the period, the Funds do not isolate that portion of the results of operations arising as a result of changes in the foreign exchange rates from the fluctuations arising from changes in the market prices of securities held or sold during the period. Accordingly, such foreign currency gains/(losses) are included in the reported net realized and unrealized gains/(losses) on investment transactions.
The Funds may be subject to foreign taxes related to foreign income received, capital gains on the sale of securities and certain foreign currency transactions (a portion of which may be reclaimable). All foreign taxes are recorded in accordance with the applicable regulations and rates that exist in the foreign jurisdiction in which the Funds invest.
Reported realized foreign currency gains or losses arise from the disposition of foreign currency, currency gains or losses realized between the trade and settlement dates on securities transactions, and the difference between the amounts of dividends, interest and foreign withholding taxes recorded on each Fund’s books on the transaction date and the U.S. dollar equivalent of the amounts actually received or paid. Unrealized foreign exchange gains and losses arise from changes (due to the changes in the exchange rate) in the value of foreign currency and other assets and liabilities denominated in foreign currencies, which are held at period end.
Investment Income and Expenses
Dividend income is recognized on the ex-dividend date. The Funds distribute all or substantially all of their net investment income to shareholders in the form of dividends. Expenses are recognized on the accrual basis.
Distributions to Shareholders
Horizons NASDAQ 100® Covered Call ETF and Horizons S&P 500® Covered Call ETF distribute a monthly dividend of net investment company taxable income calculated during each monthly dividend calculation period. If, for any monthly distribution, net investment company taxable income (which term includes net short-term capital gains from option activity, etc.), if any, is less than the amount of the distribution, then the difference will generally be a tax-free return of capital distributed from the Funds’ assets. Horizons DAX Germany ETF expects to declare and distribute all of its net investment income, if any, to shareholders as dividends at least semi-annually.
28
Notes to Financial Statements (continued)
October 31, 2018
The Funds make distributions of remaining net realized capital gains, if any, annually. The Funds may also make distributions at other times in order to improve index tracking or to maintain their eligibility for treatment as a regulated investment companies under the Code and to avoid the imposition of excise taxes. A distribution may also include return of capital, although the Funds intend to take appropriate measures to minimize the return of capital in all events in a manner consistent with the provisions of the 1940 Act.
3. INVESTMENT MANAGEMENT AND OTHER AGREEMENTS
Investment Advisory Agreement
The Trust has entered into an Investment Advisory Agreement (the “Advisory Agreement”) with Horizons ETFs Management (US) LLC (the “Adviser”), on behalf of the Funds. Pursuant to the Advisory Agreement, the Adviser has overall responsibility for the management and investment of the Funds’ securities portfolios. The Adviser is wholly-owned by Horizons ETFs Management (USA) LLC, which is deemed to be indirectly controlled by Hyeon Joo Park through his majority ownership of the ultimate parent of Horizons ETFs Management (USA) LLC. For its services, Horizons NASDAQ 100® Covered Call ETF, Horizons S&P 500® Covered Call ETF and Horizons DAX Germany ETF pay the Adviser an annual rate of 0.60%, 0.65% and 0.45%, respectively of each Fund’s average daily net assets. Such fee, an all-in fee, is accrued daily and paid monthly. It pays for substantially all expenses of the Funds, including the cost of transfer agency, trustees, custody, fund administration, legal, audit, printing and certain administrative, distribution and investment advisory services. The types of Fund expenses that the Adviser is not obligated to pay under the Advisory Agreement are as follows: taxes and governmental fees; brokerage fees, commissions and other portfolio transaction expenses; costs of borrowing money (including interest expenses); acquired fund fees and expenses; extraordinary expenses (including expenses incurred in connection with litigation, proceedings, other claims and the legal obligations of the Fund to indemnify the Trust’s trustees, officers, employees, shareholders, distributors, and agents with respect thereto); organizational and offering expenses of the Trust and each Fund, and any other expenses which are capitalized in accordance with generally accepted accounting principles; and costs and/or fees, including legal fees, incident to meetings of the Trust’s shareholders, the preparation, printing and distribution of Fund product descriptions for distribution to shareholders or authorized participants, notices and proxy statements and reports of the Trust to its shareholders, the filing of reports with regulatory bodies, the maintenance of the Trust’s existence and qualification to do business, and the expenses of issuing, redeeming, registering and qualifying for sale, Fund shares with federal and state securities authorities. The advisory fees paid by Horizons NASDAQ 100® Covered Call ETF, Horizons S&P 500® Covered Call ETF and Horizons DAX Germany ETF for the year ended October 31, 2018 were $1,467,560, $385,304 and $88,874, respectively.
Effective August 1, 2017, the Adviser, has contractually agreed to waive a portion of its management fee, which is 0.45% of the average daily net assets of the Horizons DAX Germany ETF, and/or reimburse fees or expenses to 0.20% of the average daily net assets until July 31, 2019. The advisory fees waived for the year ended October 31, 2018 for the Horizons DAX Germany ETF were $49,375.
Distribution Agreement
Foreside Fund Services, LLC (the “Distributor”) serves as the Funds’ Distributor. The Distributor will not distribute shares in less than Creation Units, as defined in Note 4, and does not maintain a secondary market in shares. The shares are traded in the secondary market.
The Board has adopted a distribution and service plan, where the Funds are authorized to pay distribution fees in connection with the sale and distribution of their shares and pay service fees in connection with the provision of ongoing services to shareholders. No distribution fees are currently paid by the Funds and there are no current plans to impose the fees.
Administrator, Custodian, Accounting Agent and Transfer Agent Agreements
U.S. Bancorp Fund Services, LLC, doing business as U.S. Bank Global Fund Services (“Fund Services”) (in each capacity, the “Administrator”, “Accounting Agent” or “Transfer Agent”) serves as the Funds’ Administrator, Accounting Agent and Transfer Agent pursuant to the fund administration and accounting agreements. U.S. Bank N.A. (the “Custodian”), an affiliate of Fund Services, serves as the Funds’ custodian pursuant to the custody agreement.
Independent Trustees
The Independent Trustees of the Trust receive, in total, annual Trustee fees of $62,000. Independent Trustees are also reimbursed for expenses they incur relating to their services as Trustees by the Adviser.
4. CREATION AND REDEMPTION TRANSACTIONS
The Funds issue and redeem shares on a continuous basis at NAV in groups of 50,000 shares called “Creation Units.” Creation Units of the Funds are issued and redeemed generally in exchange for specified securities held by the Funds generally included in the Index and a specified cash payment. The Trust reserves the right to permit or require a “cash” option for creations and redemptions of shares.
29
Notes to Financial Statements (continued)
October 31, 2018
In each instance of such cash creations or redemptions, the Trust may impose transaction fees based on transaction expenses related to the particular exchange that will be higher than the transaction fees associated with in-kind purchase or redemptions.
Only “Authorized Participants” who have entered into contractual arrangements with the Distributor may purchase or redeem shares directly from the Funds. An Authorized Participant is either (i) a broker-dealer or other participant in the clearing process through the Continuous Net Settlement System of the National Securities Clearing Corporation or (ii) a Depository Trust Company (“DTC”) participant and, in each case, must have executed a participant agreement with the Distributor.
Most retail investors will not qualify as Authorized Participants or have the resources to buy and sell whole Creation Units. Therefore, they will be unable to purchase or redeem the shares directly from the Funds. Rather, most retail investors will purchase shares in the secondary market with the assistance of a broker and will be subject to customary brokerage commissions or fees.
5. FEDERAL INCOME TAX
The Funds intend to qualify as regulated investment companies by complying with the requirements under Subchapter M of the Internal Revenue Code of 1986 (the “Code”), as amended, by distributing substantially all of their net investment income and net realized gains to shareholders. Dividends and/or distributions, if any, are paid to shareholders invested in the Funds on the applicable record date, at least annually. The amount of dividends and distributions from net investment income and net realized capital gains are determined in accordance with federal income tax regulations which may differ from GAAP. These “book/tax” differences are either considered temporary or permanent in nature. To the extent these differences are permanent in nature, such amounts are reclassified within the components of net assets based on their Federal tax basis treatment; temporary differences do not require reclassification.
Although each Fund intends to distribute substantially all of its net investment income and may distribute its capital gains for any taxable year, the Fund will be subject to federal income taxation to the extent any such income or gains are not distributed. Each Fund is treated as a separate corporation for federal income tax purposes. Each Fund therefore is considered to be a separate entity in determining its treatment under the Code. The Funds’ policy is to classify interest and penalties associated with underpayment of federal and state income taxes, if any as income tax expense on its Statement of Operations.
Each Fund will be subject to a nondeductible 4% federal excise tax on certain undistributed income if it does not distribute to its shareholders in each calendar year an amount at least equal to 98% of its ordinary income for the calendar year plus 98.2% of its capital gain net income for the one-year period ending on October 31 of that year, subject to an increase for any shortfall in the prior year’s distribution. In order to qualify as a regulated investment company, and avoid being subject to federal income or excise taxes at the fund level, each Fund intends to distribute substantially all of its net investment income and net realized capital gains within each calendar year as well as on a fiscal year basis (if the fiscal year is other than the calendar year), and intends to comply with other tax rules applicable to regulated investment companies. During the year ended October 31, 2018, the Horizons NASDAQ 100® Covered Call ETF did not distribute all of its required distribution by the excise tax deadline of December 31, 2017 and therefore incurred an excise tax of $205,113 on January 1, 2018, which is reflected in the Statement of Operations.
Management of the Funds is required to analyze all open tax years (2015 – 2018), as defined by IRS statute of limitations, for all major jurisdictions, including federal tax authorities and certain state tax authorities. As of October 31, 2018, the Funds did not have a liability for any unrecognized tax benefits. The Funds have no examination in progress and are not aware of any tax positions for which it is reasonably possible that the amounts of unrecognized tax benefits will significantly change in the next twelve months.
At October 31, 2018, the cost of investments and options written, if applicable, on a tax basis were as follows:
Funds
| | Cost
| | Gross
Unrealized
Appreciation
| | Gross
Unrealized
Depreciation
| | Net Unrealized
Appreciation
(Depreciation)
|
| Horizons NASDAQ 100 Covered Call ETF | | $ | 394,478,646 | | | $ | — | | | $ | — | | | $ | — | |
Horizons S&P 500® Covered Call ETF | | | 77,281,568 | | | | — | | | | (18,632 | ) | | | (18,632 | ) |
| Horizons DAX Germany ETF | | | 19,222,859 | | | | 1,216,098 | | | | (3,817,595 | ) | | | (2,601,497 | ) |
30
Notes to Financial Statements (continued)
October 31, 2018At October 31, 2018, the components of undistributed or accumulated earnings/losses on a tax-basis were as follows:
Funds
| | Undistributed
Net Investment
Income (Loss)
| | Accumulated
Capital and
Other Gains
(Losses)
| | Net Unrealized
Appreciation
(Depreciation)
| | Total Earnings
(Losses)
|
Horizons NASDAQ 100® Covered Call ETF | | $ | — | | | $ | (4,403,750 | ) | | $ | — | | | $ | (4,403,750 | ) |
Horizons S&P 500® Covered Call ETF | | | — | | | | — | | | | (18,632 | ) | | | (18,632 | ) |
| Horizons DAX Germany ETF | | | 262,909 | | | | (531,672 | ) | | | (2,601,497 | ) | | | (2,870,260 | ) |
The differences between book and tax basis components of net assets are primarily attributable to appreciation (depreciation) of investments or a mixed straddle adjustment and non-taxable distribution from regulated investment companies.
The tax character of distributions paid were as follows:
| | Year Ended October 31, 2018
| | Year or Period Ended October 31, 2017**
|
| | Ordinary
Income
| | Long-Term
Capital
| | Return of
Capital
| | Ordinary
Income
| | Long-Term
Capital
| | Return of
Capital
|
Horizons NASDAQ 100® Covered Call ETF | | $ | 8,264,567 | | | $ | 795,059 | | | $ | 17,698,697 | | | $ | 7,462,456 | | | $ | — | | | $ | — | |
Horizons S&P 500® Covered Call ETF* | | | 1,551,694 | | | | 330,858 | | | | 3,049,443 | | | | 671,990 | | | | — | | | | — | |
Horizons DAX Germany ETF | | | 244,615 | | | | — | | | | — | | | | 403,498 | | | | — | | | | 18,200 | |
* | | For the year ended April 30, 2017, the Horizons S&P 500® Covered Call ETF’s tax character of distributions was $2,156,257 from ordinary income. |
** | | Effective October 31, 2017, the Horizons S&P 500® Covered Call ETF changed its fiscal year end from April 30 to October 31. The information presented is from May 1, 2017 through October 31, 2017. |
The capital loss carryover for each fund as of the year or period ended October 31, 2018 were as follows:
| | | Capital Loss Carryover
|
Funds
| | Short Term
| | Long Term
|
Horizons NASDAQ 100® Covered Call ETF | | $ | 4,403,750 | | | $ | — | |
Horizons S&P 500® Covered Call ETF | | | — | | | | — | |
| Horizons DAX Germany ETF | | | 199,239 | | | | 332,433 | |
At October 31, 2018, the Funds did not have any Late-Year ordinary losses.
At October 31, 2018, the effect of permanent book/tax reclassifications resulted in increases (decreases) to the components of net assets as follows:
Funds
| | Total
Distributable
Earnings (Loss)
| | Paid-in Capital
|
Horizons NASDAQ 100® Covered Call ETF | | $ | (12,783,348 | ) | | $ | 12,783,348 | |
Horizons S&P 500® Covered Call ETF | | | (7,183,519 | ) | | | 7,183,519 | |
| Horizons DAX Germany ETF | | | (191,780 | ) | | | 191,780 | |
For financial reporting purposes, capital accounts are adjusted to reflect the tax character of permanent book/tax differences.
6. INVESTMENT TRANSACTIONS
Purchases and sales of investments (excluding in-kind transactions and short term investments) for the year ended October 31, 2018:
| | Purchases
| | Sales
|
Horizons NASDAQ 100® Covered Call ETF | | $ | 36,586,471 | | | $ | 64,782,292 | |
Horizons S&P® 500 Covered Call ETF | | | 2,690,279 | | | | 9,345,885 | |
Horizons DAX Germany ETF | | | 1,599,144 | | | | 1,350,236 | |
31
Notes to Financial Statements (continued)
October 31, 2018Purchases and sales of in-kind transactions for the year ended October 31, 2018:
| | Purchases
| | Sales
|
Horizons NASDAQ 100® Covered Call ETF | | $ | 279,772,048 | | | $ | 28,335,732 | |
Horizons S&P® 500 Covered Call ETF | | | 38,508,053 | | | | 19,682,727 | |
Horizons DAX Germany ETF | | | 4,854,287 | | | | 1,439,081 | |
7. DERIVATIVE FINANCIAL INSTRUMENTS
Certain Funds may either purchase or write options in order to hedge against adverse market movements or fluctuations in value caused by changes in prevailing interest rates, value of equities or foreign exchange rates, with respect to securities which a Fund currently owns or intends to purchase. A Fund’s principal reason for writing options is to realize, through receipt of premiums, a greater current return than would be realized on the underlying security alone.
When a Fund purchases an option, it pays a premium and an amount equal to that premium is recorded as an asset. When a Fund writes an option, it receives a premium and an amount equal to that premium is recorded as a liability. The asset or liability is adjusted daily to reflect the current market value of the option. If an option expires unexercised, a Fund makes an adjustment to the proceeds from the sale or the cost of the purchase in determining whether a Fund has realized a gain or loss. The difference between the premium and the amount received or paid on effecting a closing purchase or sale transaction is also treated as a realized gain or loss. Gain or loss on purchased options is included in net realized gain or loss on investments and gain or loss on written options is presented separately as net realized gain or loss on options written when financial statements are presented. A fund, as writer of options, may have no control over whether the underlying securities may be sold (called) or purchased (put). As a result, a fund bears the market risk of an unfavorable change in the price of the security underlying the written option. A fund, as purchaser of over-the-counter options, bears the risk of the potential inability of the counterparties to meet the terms of their contracts.
Risks may arise from an imperfect correlation between the change in market value of the securities held and the prices of options relating to the securities purchased or sold and from possible lack of a liquid secondary market for an option. The maximum exposure to loss for any purchased option is limited to the premium initially paid for the option. Written uncovered call options subject a fund to unlimited risk of loss. Written covered call options limit the upside potential of a security above the strike price. Put options written expose a fund to risk of loss if the value of the security declines below the strike price.
Horizons NASDAQ 100® Covered Call ETF and Horizons S&P 500® Covered Call ETF may write covered call and put options on portfolio securities and other financial instruments. By writing a covered call option, the Funds, in exchange for the premium, forego the opportunity for capital appreciation above the strike price should the market of the price of the underlying security increase. Conversely, by writing a put option, the Funds, in exchange for the premium, accept the risk of having to purchase a security at a strike price that is above the current price. When the written option expires, is terminated or is sold, the Funds will record a gain or loss.
Horizons NASDAQ 100® Covered Call ETF invests in derivatives in the form of call options as part of its investment strategy to track the performance of the BXNT Index. The type of derivatives used by the Horizons NASDAQ 100® Covered Call ETF are call options on the NASDAQ 100® Index. Consistent with its investment strategy, the Horizons NASDAQ 100® Covered Call ETF wrote (sold) a succession of one-month call options on the BXNT Index and covered such options by holding the securities underlying the options written. The use of the call options helps the Horizons NASDAQ 100® Covered Call ETF track the performance of the BXNT Index.
Horizons S&P 500® Covered Call ETF invests in derivatives in the form of call options as part of its investment strategy to track the performance of the BXY Index. The type of derivatives used by the Horizons S&P 500® Covered Call ETF are call options on the S&P 500® Index. Consistent with its investment strategy, the Horizons S&P 500® Covered Call ETF wrote (sold) a succession of one-month call options on the BXY Index and covered such options by holding the securities underlying the options written. The use of the call options helps the Horizons S&P 500® Covered Call ETF track the performance of the BXY Index.
Transactions in derivative instruments reflected on the Statements of Assets and Liabilities and Statements of Operations at October 31, 2018, are:
| | Equity Risk
|
| | Liabilities (Options
Written, at value)
| | Net Realized
Gain (Loss)
| | Net Change in
Unrealized
Appreciation
(Depreciation)
|
Horizons NASDAQ 100® Covered Call ETF | | $ | (3,311,800 | ) | | $ | (12,924,928 | ) | | $ | 7,340,224 | |
Horizons S&P 500® Covered Call ETF | | | (76,950 | ) | | | (2,032,147 | ) | | | 558,038 | |
For the year ended October 31, 2018, the monthly average fair value of the written options contracts held by the Horizons NASDAQ 100® Covered Call ETF and Horizons S&P 500® Covered Call ETF were $4,031,347 and $236,832, respectively.
32
Notes to Financial Statements (continued)
October 31, 20188. PRINCIPAL RISKS
Each Fund is subject to the principal risks described below, some or all of these risks may adversely affect each Fund’s NAV, yield, total return and ability to meet its investment objective. As with any investment, an investment in the Funds could result in a loss or the performance of the Funds could be inferior to that of other investments.
Foreign Security Risk
Certain of the Funds invest directly or indirectly in the securities of non-U.S. issuers, which involves risks beyond those associated with investments in U.S. securities. These additional risks include greater market volatility, the availability of less reliable financial information, higher transactional and custody costs, taxation by foreign governments, decreased market liquidity and political instability.
Risks Related to Investing in Germany
Germany is a significant exporter to its major trading partners, which are other Western European developed nations and the United States. Therefore, Germany’s economy is dependent on the economies of these other countries. As such, reductions by these countries in spending on German exports could adversely impact the German economy. Many of these Western European developed nations, including Germany, are member states of the European Union (“EU”) and Economic and Monetary Union of the EU (“EMU”). As a result, these member states are dependent upon one another economically and politically.
During the most recent financial crisis, the German economy, along with certain other EU economies, experienced a significant economic slowdown. Recently, new concerns emerged in relation to the economic health of the EU. These concerns have led to tremendous downward pressure on certain financial institutions, including German financial services companies. During the recent European debt crisis, Germany played a key role in stabilizing the euro. However, such efforts may prove unsuccessful, and any ongoing crisis may continue to significantly affect the economies of every country in Europe, including Germany.
Structural Risk
Germany is subject to risks of social unrest and heavy governmental control, either of which may adversely affect investments in Germany.
Heavy Governmental Control and Regulation
Heavy regulation of labor and product markets is pervasive in Germany. These regulations may at times stifle German economic growth or cause prolonged periods of recession.
Equity Risk
The Funds invest in equity securities. Equity risk is the risk that the value of the securities that the Funds hold will fall due to general market and economic conditions, perceptions regarding the industries in which the issuers of securities the Funds hold participate or factors relating to specific companies in which the Funds invest.
Index Tracking Risk
While the Funds seek to achieve a high degree of correlation with the Indices, each Fund’s return may not match the returns of the respective Indices due to, among other reasons, operating expenses, transaction costs, cash flows, and operational inefficiencies. For example, a Fund incurs operating expenses not applicable to an Index and incurs costs when buying and selling securities, particularly where a Fund must rebalance its securities holdings to reflect changes in the composition of an Index. Because these and other costs are not factored into the return of an Index, the Funds’ returns may deviate significantly from the return of the Indices.
The Horizons NASDAQ 100® Covered Call ETF and Horizons S&P 500® Covered Call ETF may be unable to write options at the times or at the prices that the Indices expects such options to be written. Because these and other costs are not factored into the return of the Indices, the Funds’ returns may deviate significantly from the returns of the Indicies.
Counterparty Risk
The Horizons NASDAQ 100® Covered Call ETF and Horizons S&P 500® Covered Call ETF are exposed to counterparty risk, or the risk that an institution or other entity with which the Funds have unsettled or open transactions will default. The potential loss to the Funds could exceed the value of the financial assets recorded in the Funds’ financial statements. Financial assets, which potentially expose the Fund to counterparty risk, consist principally of cash due from counterparties and investments. The Adviser seeks to minimize the Funds’ counterparty risk by performing reviews of each counterparty and by minimizing concentration of counterparty risk by undertaking transactions with multiple customers and counterparties on recognized and reputable exchanges. Delivery of securities sold is only made once the Funds have received payment. Payment is made on a purchase once the securities have been delivered by the counterparty. The trade will fail if either party fails to meet its obligation.
33
Notes to Financial Statements (continued)
October 31, 2018Political and Social Risk
Certain sectors and regions of Germany have experienced high unemployment and labor and social unrest. These issues may cause downturns in the German markets or the German industries or sectors in which the Horizons DAX Germany ETF invests.
Currency Risk
Because the Funds’ NAVs are determined in U.S. dollars, each Fund’s NAV could decline if the currency of a non-U.S. market in which the Fund invests depreciates against the U.S. dollar. Currency exchange rates can be very volatile and can change quickly and unpredictably. Therefore, the value of an investment in the Funds may also go up or down quickly and unpredictably and investors may lose money.
Non-U.S. Securities Risk
Investments in the securities of non-U.S. issuers are subject to the risks of investing in the markets where such issuers are located, including heightened risks of inflation or nationalization and market fluctuations caused by economic and political developments.
Passive Management Risk
Because the Funds are not “actively” managed, unless a security is removed from an Index, the Funds generally would not sell the security. Therefore, the Funds may underperform funds that actively shift their portfolio assets to take advantage of market opportunities or to move to defensive positions to lessen the impact of a market decline or a decline in the value of one or more issuers.
Non-Diversified Risk
Horizons NASDAQ 100® Covered Call ETF and Horizons DAX Germany ETF are non-diversified and can invest a greater portion of their assets in securities of individual issuers than diversified funds. As a result, changes in the market value of a single investment could cause greater fluctuations in share price than would occur in a diversified fund. This may increase each Fund’s volatility and cause the performance of a relatively small number of issuers to have a greater impact on each Fund’s performance.
Because Horizons NASDAQ 100® Covered Call ETF and Horizons DAX Germany ETF are non-diversified under the 1940 Act and may invest in a smaller number of issuers or a larger proportion of its assets may be invested in a single issuer, the gains and losses on a single investment may have a greater impact on each Fund’s NAV and may make each Fund more volatile than more diversified funds.
9. RECENTLY ISSUED ACCOUNTING PRONOUNCEMENTS
In August 2018, the FASB released an accounting standards update (ASU) 2018-13, which changes the fair value measurement disclosure requirements of Topic 820. The amendments in this ASU are the result of a broader disclosure project called FASB Concept Statement, Conceptual Framework for Financial Reporting—Chapter 8: Notes to Financial Statements. The objective and primary focus of the project are to improve the effectiveness of disclosures in the notes to the financial statements by facilitating clear communication of the information required by GAAP that is most important to users of the financial statements. The ASU is effective for all entities for fiscal years beginning after December 15, 2019, including interim periods therein. Early adoption is permitted for any eliminated or modified disclosures upon issuance of the ASU. Management is currently evaluating the impact to the Funds.
10. DUE FROM ADMINISTRATOR
During the year ended October 31, 2018, the Horizons DAX Germany ETF had an error where the Administrator held an incorrect security. This resulted in a loss to the Fund of $64,838. As of the date of issuance of this report, the Administrator reimbursed the Fund, and there is no longer any amount outstanding.
11. SUBSEQUENT EVENTS
At a Board of Trustees meeting held on September 27, 2018, the Board approved the reorganization of each Fund into a corresponding series of the Global X Funds (each an “Acquiring Fund”). The respective reorganizations are subject to the approval of each Fund’s shareholders. The reorganizations will be structured as tax-free reorganizations for federal income tax purposes, under which each Acquiring Fund will acquire all of the assets and liabilities of the corresponding Fund in exchange for shares of Acquiring Fund. Subsequent to the reorganization, the Trust will be formally terminated.
The Funds have evaluated subsequent events through the date of issuance of this report and has determined that there are no other material events that would require disclosure.
34
Report of Independent Registered Public Accounting Firm
October 31, 2018
To the Board of Trustees of Horizons ETF Trust I
and the Shareholders of Horizons NASDAQ 100 Covered Call ETF,
Horizons S&P 500® Covered Call ETF, and Horizons DAX Germany ETF
Opinion on the Financial Statements
We have audited the accompanying statements of assets and liabilities of Horizons NASDAQ 100® Covered Call ETF, a series of shares of beneficial interest in Horizons ETF Trust I (the “Trust” or the “Funds”), including the portfolio of investments, as of October 31, 2018, and the related statement of operations for the year then ended, the statements of changes in net assets for each of the years in the two-year period then ended, the financial highlights for each of the years in the four-year period then ended and for the period December 12, 2013 (commencement of operations) to October 31, 2014, and the related notes to the financial statements. We have also audited the Horizons S&P 500® Covered Call ETF, a series of shares of beneficial interest in the Trust, including the portfolio of investments, as of October 31, 2018, and the related statement of operations for the year then ended, the statements of changes in net assets and the financial highlights for the year then ended and the period May 1, 2017 to October 31, 2017, and the related notes to the financial statements. We have also audited the Horizons DAX Germany ETF, a series of shares of beneficial interest in the Trust, including the portfolio of investments, as of October 31, 2018, and the related statement of operations of the year then ended, the financial highlights for each of the years in the four-year period then ended, and the related notes to the financial statements (all of these statements and notes referred to in the previous three sentences are collectively referred to as the “financial statements”. In our opinion, the financial statements present fairly, in all material respects, the financial position of the Funds as of October 31, 2018, and the results of their operations for the year then ended, and the changes in their net assets and their financial highlights for each of the years or periods described above, in conformity with accounting principles generally accepted in the United States of America. The statement of changes in net assets for the year ended April 30, 2017 and the financial highlights for each of the years in the three-year period then ended, and for the period June 24, 2013 (commencement of operations) through April 30, 2014 for Horizons S&P 500® Covered Call ETF have been audited by other auditors whose report dated June 23, 2017 expressed an unqualified opinion on such financial statements and financial highlights. The financial highlights of Horizons DAX Germany ETF for the period October 23, 2014 (commencement of operations) through October 31, 2014 were audited by other auditors whose report dated December 29, 2014 expressed an unqualified opinion on such financial highlights.
Basis for Opinion
These financial statements are the responsibility of the Funds’ management. Our responsibility is to express an opinion on the Funds’ financial statements based on our audits. We are a public accounting firm registered with the Public Company Accounting Oversight Board (United States) (“PCAOB”) and are required to be independent with respect to the Funds in accordance with the U.S. federal securities law and the applicable rules and regulations of the Securities and Exchange Commission and the PCAOB.
We conducted our audits in accordance with the standards of the PCAOB. Those standards require that we plan and perform the audits to obtain reasonable assurance about whether the financial statements are free of material misstatement, whether due to error or fraud. The Funds are not required to have, nor were we engaged to perform, an audit of their internal control over financial reporting. As part of our audits we are required to obtain an understanding of internal control over financial reporting but not for the purpose of expressing an opinion on the effectiveness of the Funds’ internal control over financial reporting. Accordingly, we express no such opinion.
Our audits included performing procedures to assess the risk of material misstatement of the financial statements, whether due to error or fraud, and performing procedures that respond to those risks. Such procedures included examining, on a test basis, evidence regarding the amounts and disclosures in the financial statements. Our procedures included confirmation of securities owned as of October 31, 2018 by correspondence with the custodian, brokers, or by other appropriate auditing procedures where replies from brokers were not received. Our audits also included evaluating the accounting principles used and significant estimates made by management, as well as evaluating the overall presentation of the financial statements. We believe that our audits provide a reasonable basis for our opinion.
BBD, LLP
We have served as the auditor of one or more of the Funds in the Horizons ETF Trust I since 2014.
Philadelphia, Pennsylvania
December 28, 2018
35
Supplemental Information
October 31, 2018 (Unaudited)
INFORMATION ABOUT PORTFOLIO HOLDINGS
The Funds file complete schedules of portfolio holdings for their first and third fiscal quarters with the Securities and Exchange Commission (“SEC”) on Form N-Q. The Funds’ Form N-Q is available without charge, upon request, by calling toll-free at 1-855-496-3837. Furthermore, you may obtain the Form N-Q on the SEC’s website at www.sec.gov. The Funds’ portfolio holdings are posted daily on the Funds’ website at https://horizonsetfsus.com.
INFORMATION ABOUT PROXY VOTING
A description of the policies and procedures the Funds use to determine how to vote proxies relating to portfolio securities is provided in the Statement of Additional Information (“SAI”). The SAI is available without charge upon request by calling toll-free at 1-855-496-3837, by accessing the SEC’s website at www.sec.gov, or by accessing the Funds’ website at https://horizonsetfsus.com.
Information regarding how the Funds voted proxies relating to portfolio securities during the period ended June 30 is available by calling toll-free at 1-855-496-3837 or by accessing the SEC’s website at www.sec.gov.
FREQUENCY DISTRIBUTION OF PREMIUMS AND DISCOUNTS
Information regarding how often shares of the Funds trade on the exchange at a price above (i.e., at a premium) or below (i.e., at a discount) to their daily net asset value (NAV) is available, without charge, on the Funds’ website at https://horizonsetfsus.com.
PRIVACY POLICY
The Funds collect non-public information about you from the following sources:
• | | Information we receive about you on applications or other forms; |
• | | Information you give us orally; and |
• | | Information about your transactions with us or others. |
The Funds do not disclose any non-public personal information about its customers or former customers without the customer’s authorization, except as permitted by law or in response to inquiries from governmental authorities. The Funds may share information with affiliated parties and unaffiliated third parties with whom we have contracts for servicing the Funds. The Funds will provide unaffiliated third parties with only the information necessary to carry out their assigned responsibility. The Funds maintain physical, electronic and procedural safeguards to guard your non-public personal information and require third parties to treat your non-public information with the same high degree of confidentially.
In the event that you hold shares of the Funds through a financial intermediary, including, but not limited to, a broker-dealer, bank, or trust company, the privacy policy of your financial intermediary would govern how your non-public personal information would be shared by those entities with unaffiliated third parties.
36
Board Review and Approval of Advisory Contracts
October 31, 2018 (Unaudited)
September 27, 2018 Board of Trustees Meeting
At an “in-person” meeting held on September 27, 2018 (the “Meeting”) in New York, New York, the Board of Trustees (the “Board”) of the Horizons ETF Trust I (the “Trust”), including the trustees who are not “interested persons” of the Trust as defined in Section 2(a)(19) of the Investment Company Act of 1940, as amended (the “Independent Trustees”), discussed issues pertaining to the proposed renewal of the amended and restated Investment Advisory Agreement (“Advisory Agreement”) between Horizons ETFs Management (US) LLC (“Horizons US”) and Horizons NASDAQ 100 Covered Call ETF (“QYLD”), Horizons DAX Germany ETF (“DAX”) and Horizons S&P 500 Covered Call ETF (“HSPX”).
The Board met with representatives from Horizons US as well as with legal counsel. This information formed the primary basis for the Board’s determinations. During the Meeting, the Board reviewed a memorandum that detailed the duties and responsibilities of the Trustees with respect to their consideration of the Advisory Agreement. The Board also reviewed the advisory agreement approval materials provided by Horizons US including, but not limited to: (1) organizational overviews of the Horizons US and biographies of its personnel providing services to the Funds, (2) a copy of the Advisory Agreement, (3) the Form ADV of Horizons US, and (4) exchange-traded fund industry fee comparison data.
The Board, including a majority of the Independent Trustees, determined that approvals of the Advisory Agreement was in the best interests of the respective Funds. The Board of Trustees, including the Independent Trustees, did not identify any single factor or group of factors as all important or controlling and considered all factors together. In evaluating whether to approve the Advisory Agreement for the respective Funds, the Board considered numerous factors, as described below.
Nature, Extent and Quality of Services. The Board examined the nature, extent and quality of the services provided by Horizons US to the DAX, HSPX and QYLD (the “Funds”). The Board engaged in discussions with Horizons US’s senior management responsible for the overall functioning of the Funds’ investment operations. The Board reviewed and considered the nature and extent of the investment advisory services provided by Horizons US under the Advisory Agreement.
The Board reviewed and considered the qualifications of the portfolio managers and other key personnel of Horizons US who provide the advisory and services to the Funds and concluded that the nature and extent of the advisory and services provided were necessary and appropriate for the conduct of the business and investment activities of the Funds and supported its decision to reapprove the Advisory Agreement for the Funds.
Performance Relative to Comparable Funds Managed by Other Investment Advisers. The Board discussed each Fund’s performance in comparison to the performance of the specified benchmark index for the various periods.
The Board noted that DAX seeks to provide investment results that correspond, before fees and expenses, to the price and yield performance of the DAX® Index. Since inception through July 31, 2018, DAX on an annualized basis returned 6.62% (NAV) versus 7.72% for the DAX® Index. For the one-year period ended July 31, 2017, DAX returned 4.56% (NAV) versus 4.81% for the DAX® Index. The Fund’s inception was October 22, 2014. It was noted that the primary reason that DAX trailed its benchmark was because DAX, unlike the benchmark, had trading and other expenses.
The Board noted that HSPX seeks to provide investment results that correspond, before fees and expenses, to the price and yield performance of HSPX. Since inception through July 31, 2018, the Fund returned on an annualized basis 9.88% (NAV) versus 10.60% for the BXY Index. For the one-year period ended July 31, 2018, HSPX returned 12.37% (NAV) versus 12.76% for the BXY Index. The Board noted that HSPX was reorganized on July 10, 2017 from the Horizons S&P 500® Covered Call ETF (the “Predecessor Fund”), a series of the Exchange Listed Funds Trust, into HSPX, a series of the Trust. It further noted that HSPX is a continuation of the Predecessor Fund, which was previously advised by Exchange Traded Concepts, LLC and sub-advised by Horizons ETFs Management (USA) LLC. The Board further noted that HSPX’s portfolio managers did not change as a result of the reorganization. It was noted that the primary reason that HSPX trailed its benchmark was because HSPX, unlike the benchmark, had trading and other expenses.
The Board noted that QYLD seeks to provide investment results that will closely correspond, before fees and expenses, generally to the price and yield performance of the CBOE NASDAQ-100® BuyWrite V2 Index. Since inception through July 31, 2018, QYLD on an annualized basis returned 9.30% (NAV) versus 10.83% for the CBOE NASDAQ-100® BuyWrite V2 Index. For the one-year period ended July 31, 2018, the QYLD returned 14.08% (NAV) versus 11.37% for the CBOE NASDAQ-100® BuyWrite V2 Index. It was noted that on October 14, 2015, QYLD changed its index from CBOE NASDAQ-100 BuyWrite Index (BXN) to CBOE NASDAQ-100 BuyWrite V2 Index QYLD’s inception was December 12, 2013. It was noted that the primary reason that QYLD trailed its benchmark since inception was because QYLD, unlike the benchmark, had trading and other expenses.
37
Board Review and Approval of Advisory Contracts (continued)
October 31, 2018 (Unaudited)The Board evaluated the correlation and tracking error between the benchmark indexes and each Fund’s performance. Based on its review, the Board found that the nature and extent of services provided to each Fund under the respective Advisory Agreement were appropriate and that the quality was satisfactory.
Fees Relative to Other Proprietary Funds Managed by the Adviser With Comparable Investment Strategies. The Board noted that Horizons US did not currently manage any other ETFs, mutual funds or private funds with comparable investment strategies and, accordingly, no comparison of the Funds’ fees to those of other funds and/or accounts managed by Horizons US with comparable investment strategies could be made at this time.
Fees and Expenses Relative to Comparable Funds and Other Accounts Managed by Other Advisers. The Board (i) reviewed the advisory fee rates paid under the Advisory Agreement and the total expense ratios of each Fund and (ii) reviewed information provided by Horizons US regarding the management fee rates paid by an expense peer group for each Fund. The Board noted that the aggregate expense ratios for the Funds were: 0.45% (0.20% after fee waiver) of the average daily net assets, 0.65% of the average daily net assets and 0.60% of the average daily net assets, of DAX, HSPX and QYLD, respectively. The Board further noted that the advisory fee for each Fund was a unitary fee pursuant to which Horizons US assumes all expenses of the Fund (including the cost of transfer agency, custody, fund administration, legal, audit and other services) other than the payments under the Advisory Agreement, brokerage expenses, taxes, interest, litigation expenses, acquired fund fees and expenses and other extraordinary expenses.
The Board reviewed the fee information of peer ETFs identified by Horizons US. The Board noted that in the case of DAX, it had a lower investment advisory fee after fee waiver than its peer fund. The Board further noted that Horizons US has contractually agreed to waive a portion of its advisory fee and/or reimburse fees or expenses to 0.20 % of the average daily net assets of DAX.
The Board noted that in the case of HSPX, a relevant peer ETF had a higher expense ratio than HSPX’s expense ratio. The Board concluded that the management fee rates and total expense ratio for HSPX were acceptable as compared to peer funds, but noted that there existed few peer funds because of the uniqueness of its covered call strategy.
The Board noted that in the case of QYLD, there existed few peer funds because of the uniqueness of its covered call strategy. The Board concluded that the management fee rates and total expense ratio for QYLD were acceptable as compared to these few peer funds.
Economies of Scale. The Board reviewed the structure of the management fee schedules under the Advisory Agreement and noted that the management fee schedules for each Fund and the unitary fee structure effectively acts as a cap on the fees (excluding certain investment-related and extraordinary expenses) to be paid by each Fund. The Board considered that each Fund still had a relatively short operating history and that the potential growth was uncertain. The Board therefore concluded that it would be premature to consider economies of scale as a factor in reapproving the Advisory Agreement at the present time.
Profitability of the Adviser. The Board considered the profits realized by Horizons US, taking into consideration other benefits to Horizons US. The Board heard financial profit projections based upon assumptions about asset levels of each Fund and Horizons US’s costs, noting that any such projections are speculative and do not guarantee Horizons US’s profits. He noted that while the management of QYLD generate profits for Horizons US, DAX and HSPX were not profitable. It was the consensus of the Board that Horizons US’s relationship with each Fund was not unreasonably profitable.
Other Benefits of the Relationship. The Board considered other benefits to Horizons US derived from its relationship with each Fund and concluded that the advisory fees in each case were reasonable taking into account any such benefits.
Resources of the Adviser. The Board found that Horizons US and the larger Mirae organization continue to be financially sound and that Horizons US has the resources necessary to perform its obligations under the Advisory Agreement. The Board also reviewed and considered the organizational structure of Horizons US and the policies and procedures formulated and adopted by Horizons US for managing each Fund’s operations.
General Conclusion. After considering and weighing all of the above factors, the Board concluded that it would be in the best interest of each Fund and its shareholders to approve the Advisory Agreement. In reaching this conclusion, the Board did not give particular weight to any single factor referenced above. It is possible that individual Board members may have weighed these factors differently in reaching their individual decisions to approve the Advisory Agreement on behalf of DAX, HSPX and QYLD.
38
Trustees and Officers of the Trust
October 31, 2018 (Unaudited)
The Board of the Trust consists of three Trustees, all of whom are not “interested persons” (as defined in the 1940 Act), of the Trust (“Independent Trustees”). Robinson Jacobs, an Independent Trustee, serves as Chairman of the Board. The Board is responsible for overseeing the management and operations of the Trust, including the general supervision of the duties and responsibilities performed by the Adviser and other service providers to the Trust. The Adviser is responsible for the day-to-day administration, operation and business affairs of the Trust.
The Board believes that each Trustee’s experience, qualifications, attributes or skills on an individual basis and in combination with those of the other Trustees lead to the conclusion that the Board possesses the requisite skills and attributes to carry out its oversight responsibilities with respect to the Trust. The Board believes that the Trustees’ ability to review, critically evaluate, question and discuss information provided to them, to interact effectively with the Adviser, the Trust’s other service providers, counsel and independent auditors, and to exercise effective business judgment in the performance of their duties, support this conclusion. In reaching its conclusion, the Board also has considered the (i) experience, qualifications, attributes and/or skills, among others, of its members, (ii) each person’s character and integrity, (iii) the length of service as a board member of the Trust, (iv) each person’s willingness to serve and ability to commit the time necessary to perform the duties of a Trustee, and (v) as to each Independent Trustee, such Trustee’s status as not being an “interested person” (as defined in the 1940 Act) of the Trust.
References to the experience, qualifications, attributes, and skills of Trustees are pursuant to requirements of the SEC, do not constitute the holding out of the Board or any Trustee as having any special expertise or experience, and shall not impose any greater responsibility or liability on any such person or on the Board by reason thereof.
The Trustees of the Trust, their addresses, positions with the Trust, years of birth, term of office and length of time served, principal occupations during the past five years, the number of portfolios in the fund complex overseen by each Trustee and other directorships, if any, held by the Trustees, are set forth below.
Name, Address1
and Year of Birth
| | Position(s)
Held with
the Trust
| | Term of Office2
and Length of
Time Served
| | Principal Occupation(s) During Past Five Years
| | Number of
Portfolios
in the Fund
Complex
Overseen
| | Other
Directorships
Held By
Trustee During
Past Five Years
|
Independent Trustees | | | | | | | | | | |
Robinson Jacobs, 1978 | | Trustee and Chairman of the Board of Trustees | | Since
July 2014 | | Comprehensive Financial Management (Investment Management) (August 2016 — Present); Analyst, Gagnon Securities (September 2012 — August 2016); Vice President, CSL Capital (April 2011 — May 2012); Consultant to various hedge fund groups. | | 3 | | None. |
Mark Buckley-Jones, 1979 | | Trustee | | Since
July 2014 | | Controller and Chief Compliance Officer, Numina Capital Management, LLC (January 2014 — Present); Chief Financial Officer, VS Capital Partners, LP (August 2011 — December 2013) and Berman Capital Management, LP (May 2007 — July 2011). | | 3 | | None. |
John L. Jacobs, 1959 | | Trustee | | Since September 2015 | | Independent Consultant (January 2015 — Present); Executive Vice President, Global Information Services, of The NASDAQ OMX Group (January 2010 — January 2015). | | 3 | | None. |
1 | | The address for each Trustee is 625 Madison Avenue, 3rd Floor, New York, NY 10022. |
2 | | Each Trustee serves until resignation, death, retirement or removal. Officers are elected yearly by the Trustees. |
39
Trustees and Officers of the Trust (continued)
October 31, 2018 (Unaudited)Name, Address1
and Year of Birth
| | Position(s) Held
with the Trust
| | Term of Office2 and
Length of Time
Served
| | Principal Occupation(s) During the Past Five Years
|
Jonathan Molchan,
1983 | | President and Chief Executive Officer | | Since
June 2018 | | Director, Head of Product Development, and Portfolio Manager at Horizons ETFs Management (US) LLC or related entities since 2013. |
Christopher W. Roleke,
1972 | | Treasurer and Chief Financial Officer | | Since
February 2017 | | 2011 to Present — Managing Director and Fund Principal Financial Officer, Foreside Fund Officer Services, LLC. |
Thomas Calabria, 1968 | | Secretary | | Since
June 2018 | | Chief Compliance Officer of Mirae Asset Global Investments (USA) LLC 2014 to present; and Horizons ETFs Management (USA) LLC 2014 to present; Chief Compliance Officer of Burnham Asset Management from 2007 to 2014 and Burnham Investors Trust from 2006 to 2014. |
Rodney L. Ruehle, 1969 | | Chief Compliance Officer | | Since
December 2016 | | Fund Chief Compliance Officer, Foreside Financial Group, LLC, 2016 to present; Director, Beacon Hill Fund Services, Inc. 2008 to 2016; Chief Compliance Officer of Context Capital Funds, 2015 to present; Chief Compliance Officer of Praxis Mutual Funds, 2015 to present; Chief Compliance Officer, Asset Management Funds, 2009 to 2016; Chief Compliance Officer of Tributary Funds, Inc., 2009 to present; Chief Compliance Officer, Penn Series Funds, Inc., 2012 to 2014. |
1 | | The address for each officer is 625 Madison Avenue, 3rd Floor, New York, NY 10022. |
2 | | Officers are elected yearly by the Trustees. |
The Trust’s Statement of Additional Information (SAI) includes additional information about the Trust’s Trustees and is available, without charge, upon request, by calling 1-855-496-3837.
40
Federal Tax Information
October 31, 2018 (Unaudited)
For the fiscal year ended October 31, 2018, certain dividends paid by the Funds may be subject to a maximum tax rate of 15% (20% for taxpayers with taxable income greater than $425,800 for single individuals and $479,000 for married couples filing jointly), as provided for by the Jobs and Growth Tax Relief Reconciliation Act of 2003 and The Tax Cuts and Jobs Act of 2017. Prior to January 1, 2018, certain dividends paid by the Funds may have been subject to a maximum tax rate of 15% (20% for taxpayers with taxable income greater than $400,000 for single individuals and $450,000 for married couples filing jointly). The percentage of dividends declared from ordinary income designated as qualified dividend income was as follows:
Horizons NASDAQ 100® Covered Call ETF | | | | | 0.00 | % |
Horizons S&P 500® Covered Call ETF | | | | | 0.00 | % |
Horizons DAX Germany ETF | | | | | 100.00 | % |
For corporate shareholders, the percent of ordinary income distributions qualifying for the corporate dividends received deduction for the fiscal year ended October 31, 2018 was as follows:
Horizons NASDAQ 100® Covered Call ETF | | | | | 0.00 | % |
Horizons S&P 500® Covered Call ETF | | | | | 0.00 | % |
Horizons DAX Germany ETF | | | | | 0.00 | % |
The percentage of taxable ordinary income distributions that are designated as short-term capital gain distributions under Internal Revenue Section 871(k)(2)(C) for each Fund was as follows:
Horizons NASDAQ 100® Covered Call ETF | | | | | 88.10 | % |
Horizons S&P 500® Covered Call ETF | | | | | 41.21 | % |
Horizons DAX Germany ETF | | | | | 0.00 | % |
Pursuance to section 853 of the Code, the following Funds designated the following amounts as foreign taxes paid for the fiscal year ended October 31, 2018. Foreign taxes paid for the purposes of section 853 may be less than actual foreign taxes paid for financial statement purposes.
| | | | | | Per Share
|
| | Gross Foreign
Source Income
| | Foreign Taxes
Passthrough
| | Gross Foreign
Source Income
| | Foreign Taxes
Passthrough
|
Horizons DAX Germany ETF | | $627,872 | | $81,584 | | $0.9659574 | | $0.1255138 |
41
Item 2. Code of Ethics.
The registrant has adopted a code of ethics that applies to the registrant’s principal executive officer and principal financial officer. The registrant has not made any substantive amendments to its code of ethics during the period covered by this report. The registrant has not granted any waivers from any provisions of the code of ethics during the period covered by this report.
A copy of the registrant’s Code of Ethics is filed herewith.
Item 3. Audit Committee Financial Expert.
The registrant’s board has determined that there is at least one audit committee financial expert serving on its audit committee. Mark Buckley-Jones is the “audit committee financial expert” and is considered to be “independent” as each term is defined in Item 3(a)(2) of Form N-CSR.
Item 4. Principal Accountant Fees and Services.
The registrant has engaged its principal accountant to perform audit services, audit-related services, tax services and other services during the past two fiscal years. “Audit services” refer to performing an audit of the registrant's annual financial statements or services that are normally provided by the accountant in connection with statutory and regulatory filings or engagements for those fiscal years. “Audit-related services” refer to the assurance and related services by the principal accountant that are reasonably related to the performance of the audit. “Tax services” refer to professional services rendered by the principal accountant for tax compliance, tax advice, and tax planning. There were no “other services” provided by the principal accountant. The following table details the aggregate fees billed or expected to be billed for each of the last two fiscal years for audit fees, audit-related fees, tax fees and other fees by the principal accountant.
| | FYE 10/31/2018 | FYE 10/31/2017 |
| Audit Fees | $39,000 | $35,000 |
| Audit-Related Fees | $0 | $0 |
| Tax Fees | $6,000 | $6,000 |
| All Other Fees | $0 | $0 |
The audit committee has adopted pre-approval policies and procedures that require the audit committee to pre-approve all audit and non-audit services of the registrant, including services provided to any entity affiliated with the registrant.
The percentage of fees billed by BBD, LLP applicable to non-audit services pursuant to waiver of pre-approval requirement were as follows:
| | FYE 10/31/2018 | FYE 10/31/2017 |
| Audit-Related Fees | 0% | 0% |
| Tax Fees | 0% | 0% |
| All Other Fees | 0% | 0% |
All of the principal accountant’s hours spent on auditing the registrant’s financial statements were attributed to work performed by full-time permanent employees of the principal accountant. (If more than 50 percent of the accountant’s hours were spent to audit the registrant's financial statements for the most recent fiscal year, state how many hours were attributed to work performed by persons other than the principal accountant's full-time, permanent employees.)
Item 5. Audit Committee of Listed Registrants.
The registrant is an issuer as defined in Rule 10A-3 under the Securities Exchange Act of 1934, (the “Act”) and has a separately-designated standing audit committee established in accordance with Section 3(a)(58)(A) of the Act. The independent members of the committee are as follows: Mark Buckley-Jones, Robinson Jacobs, and John Jacobs.
Item 6. Investments.
| (a) | Schedule of Investments is included as part of the report to shareholders filed under Item 1 of this Form. |
| (b) | Not applicable since no such divestments during the period covered. |
Item 7. Disclosure of Proxy Voting Policies and Procedures for Closed-End Management Investment Companies.
Not applicable to open-end investment companies.
Item 8. Portfolio Managers of Closed-End Management Investment Companies.
Not applicable to open-end investment companies.
Item 9. Purchases of Equity Securities by Closed-End Management Investment Company and Affiliated Purchasers.
Not applicable to open-end investment companies.
Item 10. Submission of Matters to a Vote of Security Holders.
There have been no material changes to the procedures by which shareholders may recommend nominees to the registrant’s Board of Trustees.
Item 11. Controls and Procedures.
| (a) | The Registrant’s Principal Executive Officer and Principal Financial Officer have reviewed the Registrant's disclosure controls and procedures (as defined in Rule 30a-3(c) under the Investment Company Act of 1940 (the “Act”)) as of a date within 90 days of the filing of this report, as required by Rule 30a-3(b) under the Act and Rules 13a-15(b) or 15d-15(b) under the Securities Exchange Act of 1934. Based on their review, such officers have concluded that the disclosure controls and procedures are effective in ensuring that information |
required to be disclosed in this report is appropriately recorded, processed, summarized and reported and made known to them by others within the Registrant and by the Registrant’s service provider.
| (b) | There were no changes in the Registrant's internal control over financial reporting (as defined in Rule 30a-3(d) under the Act) that occurred during the last fiscal quarter of the period covered by this report that have materially affected, or are reasonably likely to materially affect, the Registrant's internal control over financial reporting. |
Item 12. Disclosure of Securities Lending Activities for Closed-End Management Investment Companies
Not applicable to open-end investment companies.
Item 13. Exhibits.
| (a) | (1) Registrant’s Code of Ethics is filed herewith. |
(2) Certification for each principal executive and principal financial officer pursuant to Section 302 of the Sarbanes-Oxley Act of 2002 is filed herewith.
(3) Not applicable to open-end investment companies.
(4) There was no change in the registrant’s independent public accountant for the period covered by this report.
| (b) | Certifications pursuant to Section 906 of the Sarbanes-Oxley Act of 2002 are filed herewith. |
SIGNATURES
Pursuant to the requirements of the Securities Exchange Act of 1934 and the Investment Company Act of 1940, the registrant has duly caused this report to be signed on its behalf by the undersigned, thereunto duly authorized.
| | (Registrant) | HORIZONS ETF TRUST I |
| | By (Signature and Title) | /s/ Jonathan Molchan |
| | Jonathan Molchan, |
| | President/Chief Executive Officer |
| | (Principal Executive Officer) |
Date January 4, 2019
Pursuant to the requirements of the Securities Exchange Act of 1934 and the Investment Company Act of 1940, this report has been signed below by the following persons on behalf of the registrant and in the capacities and on the dates indicated.
| | By (Signature and Title) | /s/ Jonathan Molchan |
| | Jonathan Molchan, |
| | President/Chief Executive Officer |
| | (Principal Executive Officer) |
Date January 4, 2019
| | By (Signature and Title) | /s/ Christopher W. Roleke |
| | Christopher W. Roleke, |
| | Treasurer/Chief Financial Officer |
| | (Principal Financial Officer) |
Date January 4, 2019