Exhibit (C)-(2)
Qunar Cayman Islands Limited October 19, 2016 Fairness Analysis Presented to the Special Committee of Independent Directors of the Board of Directors The information contained herein is of a confidential nature and is intended for the use of the persons or firm to whom it is furnished by us. The information contained herein is of a confidential nature and is intended for the use of the persons or firm to whom it is furnished by us. Reproduction, publication, or dissemination of any portion hereof may not be made without prior approval of Duff & Phelps, LLC and its affiliates.
Duff & Phelps Disclaimer • The following pages contain materials that are being provided by Duff & Phelps, LLC (“Duff & Phelps”) to the special committee comprised of independent directors (the “Special Committee”) of the board of directors (the “Board of Directors”) of Qunar Cayman Islands Limited (“Qunar” or the “Company”) in the context of a meeting of the Special Committee held to consider the Proposed Transaction (as defined herein). • The accompanying materials are, and any Opinion (as defined herein) will be, compiled and presented on a confidential basis solely for the use and benefit of the Special Committee in connection with their evaluation of the Proposed Transaction, and may not be distributed to any other party, publicly disclosed, or relied upon for any other purpose without the prior written consent of Duff & Phelps. • Because these materials were prepared for use in the context of an oral presentation to the Special Committee, whose members are familiar with the business and affairs of the Company, neither the Company nor Duff & Phelps, nor any of their respective legal or financial advisors or accountants, take any responsibility for the accuracy or completeness of any of the materials if used by persons other than the Special Committee. • These materials are not intended to represent an Opinion and shall not be treated, construed, used or relied upon in any way as an opinion, report, appraisal relating to the fairness of the Proposed Transaction. These materials are intended to serve as discussion materials for the Special Committee and as a summary of the basis upon which Duff & Phelps may render an Opinion, and are incomplete without reference to, and should be viewed solely in conjunction with, the discussion between Duff & Phelps and the Special Committee. • The accompanying material does not, and any Opinion provided by Duff & Phelps will not: (i) address the merits of the underlying business decision of the Special Committee, the Board of Directors or the Company or any other party to the Proposed Transaction to enter into the Proposed Transaction versus any alternative strategy or transaction; (ii) constitute a recommendation to the Special Committee, the Board of Directors, the Company or any other person including security holders of the Company as to how such person should vote or as to any other specific action that should be taken in connection with the Proposed Transaction; or (iii) create any fiduciary duty on the part of Duff & Phelps to any party. • The information utilized in preparing this presentation was obtained from the Company and from public sources. Any estimates and forecasts contained herein have been prepared by or are based on discussions with the senior management of the Company and involve numerous and significant subjective determinations, which may or may not prove to be correct. No representation or warranty, expressed or implied, is made as to the accuracy or completeness of such information and nothing contained herein is, or shall be relied upon as, a representation, whether as to the past or the future. Duff & Phelps did not independently verify such information. • No selected company or selected transaction used in our analysis is directly comparable to the Company or the Proposed Transaction. • Duff & Phelps’ affiliate, Duff & Phelps Securities, LLC (“DPS”), has acted as financial advisor to the Special Committee providing such financial and market related advice and assistance as requested by the Special Committee in connection with the Proposed Transaction, and will receive a fee for certain investment banking services if requested by the Special Committee. CONFIDENTIAL 2
Table of Contents 1. Introduction and Transaction Overview 2. Valuation Analysis – Discounted Cash Flow Analysis – Selected Public Companies / M&A Transactions Analysis Appendix 1. Assumptions, Qualifications, and Limiting Conditions 2. Summary of Premiums Paid – Supplemental CONFIDENTIAL 3
Section 1 Introduction and Transaction Overview
Introduction and Transaction Overview The Engagement • Duff & Phelps was retained by Qunar Cayman Islands Limited, an exempted company with limited liability incorporated under the laws of the Cayman Islands (“Qunar” or the “Company”), to serve as an independent financial advisor to the special committee comprised of independent directors (the “Special Committee”) of the board of directors (the “Board of Directors”) of the Company (solely in its capacity as the Special Committee). • Specifically, Duff & Phelps has been asked to provide an opinion (the “Opinion”) as of the date hereof as to the fairness, from a financial point of view, to (i) the holders of each Class A ordinary share and Class B ordinary share, par value US$0.001 per share, of the Company (individually, a “Share” and collectively, the “Shares”), other than Excluded Shares, Dissenting Shares (each as defined in the Merger Agreement) and Shares represented by ADSs (as defined below), and (ii) the holders of American Depositary Shares of the Company, each representing three Shares (each, an “ADS” and collectively, “ADSs”), other than ADSs representing Excluded Shares of the Merger Consideration (as defined below) to be received by such holders in the Proposed Transaction, as defined below (without giving effect to any impact of the Proposed Transaction on any particular holder of the Shares or ADSs other than in their capacity as holders of Shares or ADSs). The Proposed Transaction • It is Duff & Phelps’ understanding that the Company, Ocean Management Holdings Limited, an exempted company incorporated with limited liability under the laws of the Cayman Islands (“Parent”), and Ocean Management Merger Sub Limited, an exempted company incorporated with limited liability under the laws of the Cayman Islands and a wholly owned subsidiary of Parent (“Merger Sub”), propose to enter into an Agreement and Plan of Merger (the “Merger Agreement”), dated as of the date hereof, the latest draft of which Duff & Phelps has reviewed is dated October 18, 2016. • Pursuant to the Merger Agreement, among other things, and in accordance with the Companies Law (2016 Revision, as consolidated, revised and amended) of the Cayman Islands, Merger Sub and the Company will enter into a statutory merger pursuant to which Merger Sub will merge with and into the Company (the “Merger”) and cease to exist, with the Company surviving the Merger and becoming a wholly owned subsidiary of Parent as a result of the Merger. • In connection with such Merger, (a) each Share issued and outstanding immediately prior to the Effective Time, as defined in the Merger Agreement, (other than the Excluded Shares, the Dissenting Shares and Shares represented by ADSs) shall be cancelled and cease to exist in consideration and exchange for the right to receive US$10.13 in cash per Share without interest (the “Per Share Merger Consideration”); and (b) each ADS issued and outstanding (other than ADSs representing Excluded Shares) shall be cancelled and cease to exist in consideration for the right to receive US$30.39 in cash per ADS without interest (the “Per ADS Merger Consideration”, together with the Per Share Merger Consideration the “Merger Consideration”). The above is collectively referred to as the “Proposed Transaction”. The terms and conditions of the Proposed Transaction are more fully set forth in the Merger Agreement. • For purposes of this analysis, (a) “Excluded Shares” shall mean, collectively, (i) the Shares beneficially owned by each Rollover Shareholder (as defined in the Merger Agreement); (ii) Shares held by Parent, the Company or any of their subsidiaries; and (iii) Shares (including ADSs corresponding to such Shares) held by the depositary and reserved for issuance and allocation pursuant to the Share Incentive Plans (as defined in the Merger Agreement), and (b) “Dissenting Shares” shall have the meaning set forth in the Merger Agreement. CONFIDENTIAL 5
Introduction and Transaction Overview Scope of Analysis Duff & Phelps has made such reviews, analyses and inquiries as it has deemed necessary and appropriate under the circumstances. Duff & Phelps also took into account its assessment of general economic, market and financial conditions, as well as its experience in securities and business valuation, in general, and with respect to similar transactions, in particular. Duff & Phelps’ procedures, investigations, and financial analysis with respect to the preparation of its analysis included, but were not limited to, the items summarized below: 1. Reviewed the following documents:—The Company’s annual reports and audited financial statements on Form 20-F filed with the Securities and Exchange Commission (“SEC”) for the fiscal years ended December 31, 2014 and December 31, 2015;—The Company’s unaudited interim financial statements for the six months ended June 30, 2015 and June 30, 2016 included in the Company’s Form 6-K filed with the SEC;—A detailed financial projection model for the fiscal years ending December 31, 2016 through 2025, prepared and provided to Duff & Phelps by the management of the Company, upon which Duff & Phelps has relied, with your consent, in performing its analysis (the “Management Projections”);—Other internal documents relating to the past and current operations, financial conditions, and probable future outlook of the Company, provided to Duff & Phelps by the management of the Company;—A letter dated October 19, 2016 from the management of the Company, which made certain representations as to the Management Projections and the underlying assumptions for the Company (the “Management Representation Letter”); and—Documents related to the Proposed Transaction, including the Merger Agreement, the latest draft of which Duff & Phelps has reviewed is dated October 18, 2016; 2. Discussed the information referred to above and the background and other elements of the Proposed Transaction with the management of the Company; 3. Discussed with the management of the Company its plans and intentions with respect to the management and operation of the business; 4. Reviewed the historical trading price and trading volume of the ADSs and the publicly traded securities of certain other companies that Duff & Phelps deemed relevant; 5. Performed certain valuation and comparative analyses using generally accepted valuation and analytical techniques including a discounted cash flow analysis, an analysis of selected public companies that Duff & Phelps deemed relevant, an analysis of selected transactions that Duff & Phelps deemed relevant, and a review of premiums paid in selected transactions that Duff & Phelps deemed relevant; and 6. Conducted such other analyses and considered such other factors as Duff & Phelps deemed necessary or appropriate. CONFIDENTIAL 6
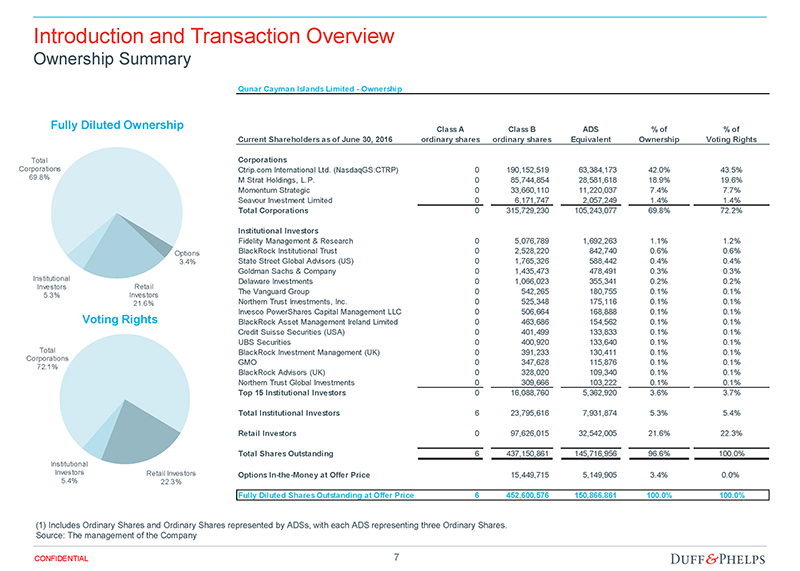
Introduction and Transaction Overview Ownership Summary Qunar Cayman Islands Limited—Ownership Fully Diluted Ownership Total Corporations 69.8% Options 3.4% Institutional Investors Retail 5.3% Investors 21.6% Voting Rights Total Corporations 72.1% Institutional Investors Retail Investors 5.4% 22.3% Class A Class B ADS % of % of Current Shareholders as of June 30, 2016 ordinary shares ordinary shares Equivalent Ownership Voting Rights Corporations Ctrip.com International Ltd. (NasdaqGS:CTRP) 0 190,152,519 63,384,173 42.0% 43.5% M Strat Holdings, L.P. 0 85,744,854 28,581,618 18.9% 19.6% Momentum Strategic 0 33,660,110 11,220,037 7.4% 7.7% Seavour Investment Limited 0 6,171,747 2,057,249 1.4% 1.4% Total Corporations 0 315,729,230 105,243,077 69.8% 72.2% Institutional Investors Fidelity Management & Research 0 5,076,789 1,692,263 1.1% 1.2% BlackRock Institutional Trust 0 2,528,220 842,740 0.6% 0.6% State Street Global Advisors (US) 0 1,765,326 588,442 0.4% 0.4% Goldman Sachs & Company 0 1,435,473 478,491 0.3% 0.3% Delaware Investments 0 1,066,023 355,341 0.2% 0.2% The Vanguard Group 0 542,265 180,755 0.1% 0.1% Northern Trust Investments, Inc. 0 525,348 175,116 0.1% 0.1% Invesco PowerShares Capital Management LLC 0 506,664 168,888 0.1% 0.1% BlackRock Asset Management Ireland Limited 0 463,686 154,562 0.1% 0.1% Credit Suisse Securities (USA) 0 401,499 133,833 0.1% 0.1% UBS Securities 0 400,920 133,640 0.1% 0.1% BlackRock Investment Management (UK) 0 391,233 130,411 0.1% 0.1% GMO 0 347,628 115,876 0.1% 0.1% BlackRock Advisors (UK) 0 328,020 109,340 0.1% 0.1% Northern Trust Global Investments 0 309,666 103,222 0.1% 0.1% Top 15 Institutional Investors 0 16,088,760 5,362,920 3.6% 3.7% Total Institutional Investors 6 23,795,616 7,931,874 5.3% 5.4% Retail Investors 0 97,626,015 32,542,005 21.6% 22.3% Total Shares Outstanding 6 437,150,861 145,716,956 96.6% 100.0% Options In-the-Money at Offer Price 15,449,715 5,149,905 3.4% 0.0% Fully Diluted Shares Outstanding at Offer Price 6 452,600,576 150,866,861 100.0% 100.0% (1) Includes Ordinary Shares and Ordinary Shares represented by ADSs, with each ADS representing three Ordinary Shares. Source: The management of the Company CONFIDENTIAL 7
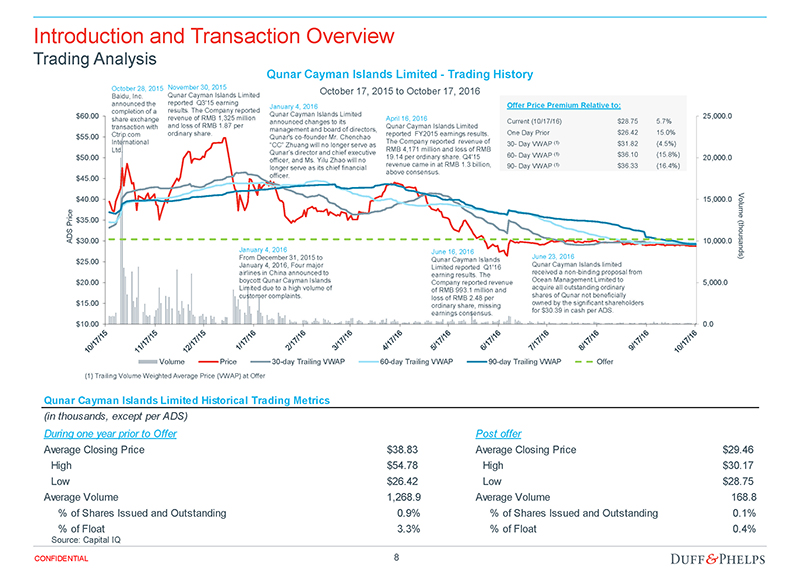
Introduction and Transaction Overview Trading Analysis Qunar Cayman Islands Limited—Trading History October 28, 2015 November 30, 2015 October 17, 2015 to October 17, 2016 Baidu, Inc. Qunar Cayman Islands Limited announced the reported Q3’15 earning Offer Price Premium Relative to: January 4, 2016 completion of a results. The Company reported $60.00 Qunar Cayman Islands Limited 25,000.0 share exchange revenue of RMB 1,325 million April 16, 2016 announced changes to its Current (10/17/16) $28.75 5.7% transaction with and loss of RMB 1.87 per Qunar Cayman Islands Limited management and board of directors, Ctrip.com ordinary share. reported FY2015 earnings results. One Day Prior $26.42 15.0% $55.00 Qunar’s co-founder Mr. Chenchao International The Company reported revenue of 30- Day VWAP (1) $31.82 (4.5%) “CC” Zhuang will no longer serve as Ltd. RMB 4,171 million and loss of RMB Qunar’s director and chief executive 60- Day VWAP (1) $36.10 (15.8%) $50.00 19.14 per ordinary share. Q4’15 20,000.0 officer, and Ms. Yilu Zhao will no (1) revenue came in at RMB 1.3 billion, 90- Day VWAP $36.33 (16.4%) longer serve as its chief financial above consensus. $45.00 officer. $40.00 15,000.0 Vol e um rice $35.00 P ADS $30.00 10,000.0 January 4, 2016 June 16, 2016 From December 31, 2015 to Qunar Cayman Islands June 23, 2016 (thousands) $25.00 Qunar Cayman Islands limited January 4, 2016, Four major Limited reported Q1’16 airlines in China announced to earning results. The received a non-binding proposal from $20.00 boycott Qunar Cayman Islands Company reported revenue Ocean Management Limited to 5,000.0 Limited due to a high volume of of RMB 993.1 million and acquire all outstanding ordinary customer complaints. loss of RMB 2.48 per shares of Qunar not beneficially $15.00 ordinary share, missing owned by the significant shareholders earnings consensus. for $30.39 in cash per ADS. $10.00 0.0 Volume Price 30-day Trailing VWAP 60-day Trailing VWAP 90-day Trailing VWAP Offer (1) Trailing Volume Weighted Average Price (VWAP) at Offer Qunar Cayman Islands Limited Historical Trading Metrics (in thousands, except per ADS) During one year prior to Offer Post offer Average Closing Price $38.83 Average Closing Price $29.46 High $54.78 High $30.17 Low $26.42 Low $28.75 Average Volume 1,268.9 Average Volume 168.8 % of Shares Issued and Outstanding 0.9% % of Shares Issued and Outstanding 0.1% % of Float 3.3% % of Float 0.4% Source: Capital IQ CONFIDENTIAL 8
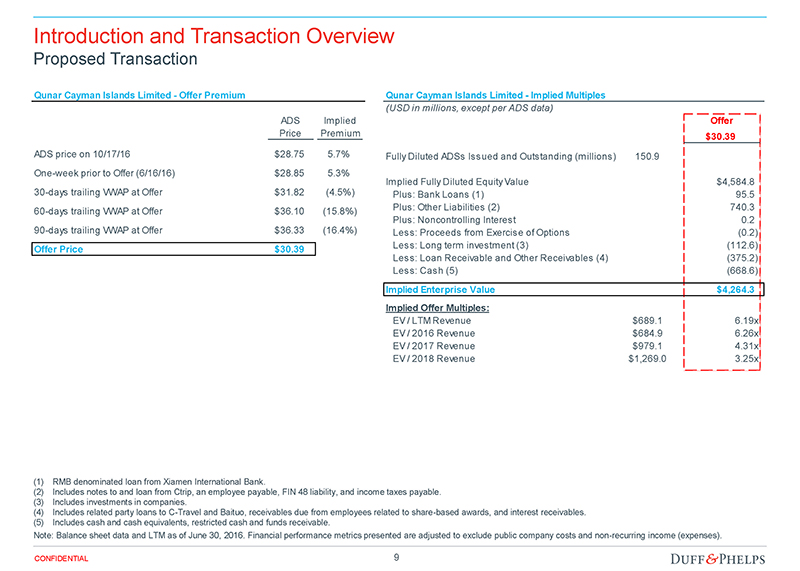
Introduction and Transaction Overview Proposed Transaction Qunar Cayman Islands Limited—Offer Premium ADS Implied Price Premium ADS price on 10/17/16 $28.75 5.7% One-week prior to Offer (6/16/16) $28.85 5.3% 30-days trailing VWAP at Offer $31.82 (4.5%) 60-days trailing VWAP at Offer $36.10 (15.8%) 90-days trailing VWAP at Offer $36.33 (16.4%) Offer Price $30.39 Qunar Cayman Islands Limited—Implied Multiples (USD in millions, except per ADS data) Offer $30.39 Fully Diluted ADSs Issued and Outstanding (millions) 150.9 150.87 1.00 Implied Fully Diluted Equity Value $4,584.8 Plus: Bank Loans (1) $95.5 95.5 Plus: Other Liabilities (2) $740.3 740.3 Plus: Noncontrolling Interest $0.2 0.2 Less: Proceeds from Exercise of Options ($0.2) (0.2) Less: Long term investment (3) ($112.6) (112.6) Less: Loan Receivable and Other Receivables (4) ($375.2) (375.2) Less: Cash (5) ($668.6) (668.6) Implied Enterprise Value $4,264.3 Implied Offer Multiples: EV / LTM Revenue $689.1 6.19x EV / 2016 Revenue $684.9 6.26x EV / 2017 Revenue $979.1 4.31x EV / 2018 Revenue $1,269.0 3.25x (1) RMB denominated loan from Xiamen International Bank. (2) Includes notes to and loan from Ctrip, an employee payable, FIN 48 liability, and income taxes payable. (3) Includes investments in companies. (4) Includes related party loans to C-Travel and Baituo, receivables due from employees related to share-based awards, and interest receivables. (5) Includes cash and cash equivalents, restricted cash and funds receivable. Note: Balance sheet data and LTM as of June 30, 2016. Financial performance metrics presented are adjusted to exclude public company costs and non-recurring income (expenses). CONFIDENTIAL 9
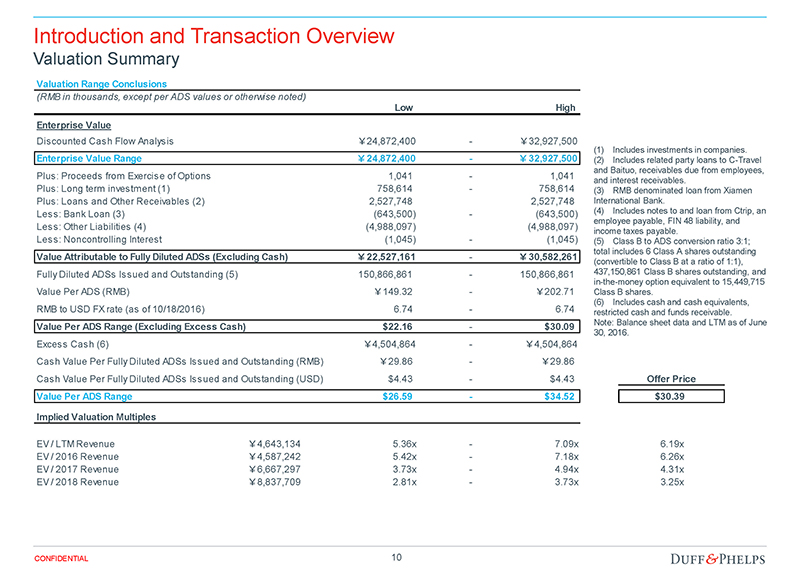
Introduction and Transaction Overview Valuation Summary Valuation Range Conclusions (RMB in thousands, except per ADS values or otherwise noted) Low High Enterprise Value Discounted Cash Flow Analysis ?24,872,400—?32,927,500 Enterprise Value Range ?24,872,400—?32,927,500 Plus: Proceeds from Exercise of Options 1,041—1,041 Plus: Long term investment (1) 758,614—758,614 Plus: Loans and Other Receivables (2) 2,527,748 2,527,748 Less: Bank Loan (3) (643,500)—(643,500) Less: Other Liabilities (4) (4,988,097) (4,988,097) Less: Noncontrolling Interest (1,045)—(1,045) Value Attributable to Fully Diluted ADSs (Excluding Cash) ?22,527,161—?30,582,261 Fully Diluted ADSs Issued and Outstanding (5) 150,866,861—150,866,861 Value Per ADS (RMB) ?149.32—?202.71 RMB to USD FX rate (as of 10/18/2016) 6.74—6.74 Value Per ADS Range (Excluding Excess Cash) $22.16—$30.09 Excess Cash (6) ?4,504,864—?4,504,864 Cash Value Per Fully Diluted ADSs Issued and Outstanding (RMB) ?29.86—?29.86 Cash Value Per Fully Diluted ADSs Issued and Outstanding (USD) $4.43—$4.43 Value Per ADS Range $26.59—$34.52 Implied Valuation Multiples EV / LTM Revenue ?4,643,134 5.36x—7.09x EV / 2016 Revenue ?4,587,242 5.42x—7.18x EV / 2017 Revenue ?6,667,297 3.73x—4.94x EV / 2018 Revenue ?8,837,709 2.81x—3.73x (1) Includes investments in companies. (2) Includes related party loans to C-Travel and Baituo, receivables due from employees, and interest receivables. (3) RMB denominated loan from Xiamen International Bank. (4) Includes notes to and loan from Ctrip, an employee payable, FIN 48 liability, and income taxes payable. (5) Class B to ADS conversion ratio 3:1; total includes 6 Class A shares outstanding (convertible to Class B at a ratio of 1:1), 437,150,861 Class B shares outstanding, and in-the-money option equivalent to 15,449,715 Class B shares. (6) Includes cash and cash equivalents, restricted cash and funds receivable. Note: Balance sheet data and LTM as of June 30, 2016. Offer Price $30.39 6.19x 6.26x 4.31x 3.25x CONFIDENTIAL 10
Section 2 Valuation Analysis
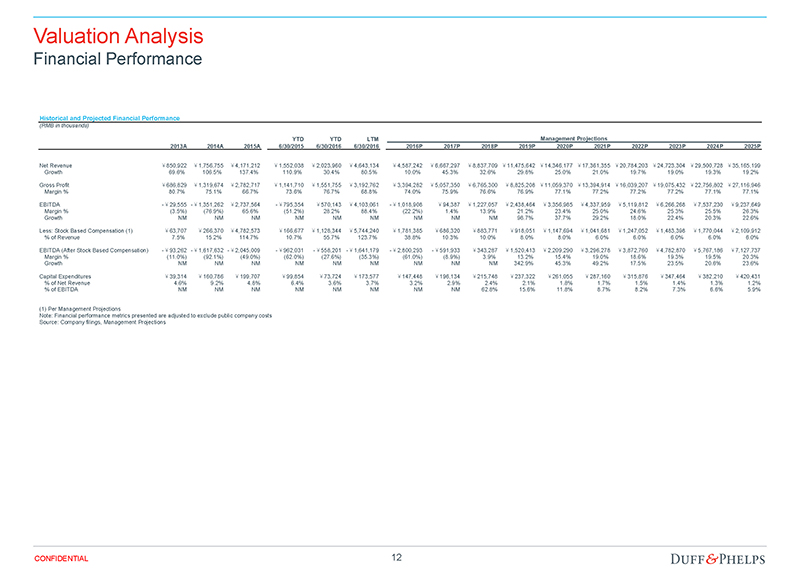
Valuation Analysis Financial Performance Historical and Projected Financial Performance (RMB in thousands) YTD YTD LTM Management Projections 2013A 2014A 2015A 6/30/2015 6/30/2016 6/30/2016 2016P 2017P 2018P 2019P 2020P 2021P 2022P 2023P 2024P 2025P Net Revenue 850,922 1,756,755 4,171,212 1,552,038 2,023,960 4,643,134 4,587,242 6,667,297 8,837,709 11,475,642 14,346,177 17,361,355 20,784,203 24,723,304 29,500,728 35,165,199 Growth 69.6% 106.5% 137.4% 110.9% 30.4% 80.5% 10.0% 45.3% 32.6% 29.8% 25.0% 21.0% 19.7% 19.0% 19.3% 19.2% Gross Profit 686,829 1,319,674 2,782,717 1,141,710 1,551,755 3,192,762 3,394,282 5,057,350 6,765,300 8,825,208 11,059,370 13,394,914 16,039,207 19,075,432 22,756,802 27,116,946 Margin % 80.7% 75.1% 66.7% 73.6% 76.7% 68.8% 74.0% 75.9% 76.6% 76.9% 77.1% 77.2% 77.2% 77.2% 77.1% 77.1% EBITDA—29,555—1,351,262 2,737,564—795,354 570,143 4,103,061—1,018,908 94,387 1,227,057 2,438,464 3,356,985 4,337,959 5,119,812 6,266,268 7,537,230 9,237,649 Margin % (3.5%) (76.9%) 65.6% (51.2%) 28.2% 88.4% (22.2%) 1.4% 13.9% 21.2% 23.4% 25.0% 24.6% 25.3% 25.5% 26.3% Growth NM NM NM NM NM NM NM NM NM 98.7% 37.7% 29.2% 18.0% 22.4% 20.3% 22.6% Less: Stock Based Compensation (1) 63,707 266,370 4,782,573 166,677 1,128,344 5,744,240 1,781,385 686,320 883,771 918,051 1,147,694 1,041,681 1,247,052 1,483,398 1,770,044 2,109,912 % of Revenue 7.5% 15.2% 114.7% 10.7% 55.7% 123.7% 38.8% 10.3% 10.0% 8.0% 8.0% 6.0% 6.0% 6.0% 6.0% 6.0% EBITDA (After Stock Based Compensation)—93,262—1,617,632—2,045,009—962,031—558,201—1,641,179—2,800,293—591,933 343,287 1,520,413 2,209,290 3,296,278 3,872,760 4,782,870 5,767,186 7,127,737 Margin % (11.0%) (92.1%) (49.0%) (62.0%) (27.6%) (35.3%) (61.0%) (8.9%) 3.9% 13.2% 15.4% 19.0% 18.6% 19.3% 19.5% 20.3% Growth NM NM NM NM NM NM NM NM NM 342.9% 45.3% 49.2% 17.5% 23.5% 20.6% 23.6% Capital Expenditures 39,314 160,786 199,707 99,854 73,724 173,577 147,448 196,134 215,748 237,322 261,055 287,160 315,876 347,464 382,210 420,431 % of Net Revenue 4.6% 9.2% 4.8% 6.4% 3.6% 3.7% 3.2% 2.9% 2.4% 2.1% 1.8% 1.7% 1.5% 1.4% 1.3% 1.2% % of EBITDA NM NM NM NM NM NM NM NM 62.8% 15.6% 11.8% 8.7% 8.2% 7.3% 6.6% 5.9% (1) Per Management Projections Note: Financial performance metrics presented are adjusted to exclude public company costs Source: Company filings, Management Projections CONFIDENTIAL 12
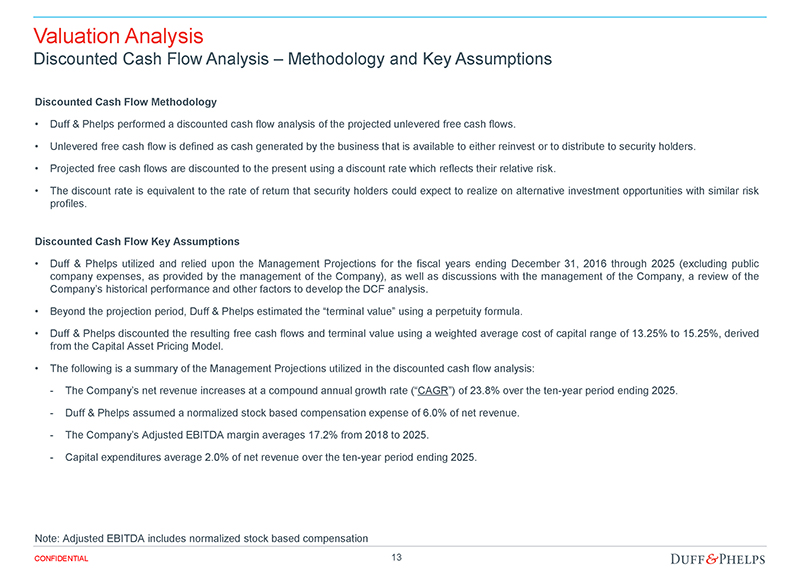
Valuation Analysis Discounted Cash Flow Analysis – Methodology and Key Assumptions Discounted Cash Flow Methodology • Duff & Phelps performed a discounted cash flow analysis of the projected unlevered free cash flows. • Unlevered free cash flow is defined as cash generated by the business that is available to either reinvest or to distribute to security holders. • Projected free cash flows are discounted to the present using a discount rate which reflects their relative risk. • The discount rate is equivalent to the rate of return that security holders could expect to realize on alternative investment opportunities with similar risk profiles. Discounted Cash Flow Key Assumptions • Duff & Phelps utilized and relied upon the Management Projections for the fiscal years ending December 31, 2016 through 2025 (excluding public company expenses, as provided by the management of the Company), as well as discussions with the management of the Company, a review of the Company’s historical performance and other factors to develop the DCF analysis. • Beyond the projection period, Duff & Phelps estimated the “terminal value” using a perpetuity formula. • Duff & Phelps discounted the resulting free cash flows and terminal value using a weighted average cost of capital range of 13.25% to 15.25%, derived from the Capital Asset Pricing Model. • The following is a summary of the Management Projections utilized in the discounted cash flow analysis:—The Company’s net revenue increases at a compound annual growth rate (“CAGR”) of 23.8% over the ten-year period ending 2025.—Duff & Phelps assumed a normalized stock based compensation expense of 6.0% of net revenue.—The Company’s Adjusted EBITDA margin averages 17.2% from 2018 to 2025.—Capital expenditures average 2.0% of net revenue over the ten-year period ending 2025. Note: Adjusted EBITDA includes normalized stock based compensation CONFIDENTIAL 13
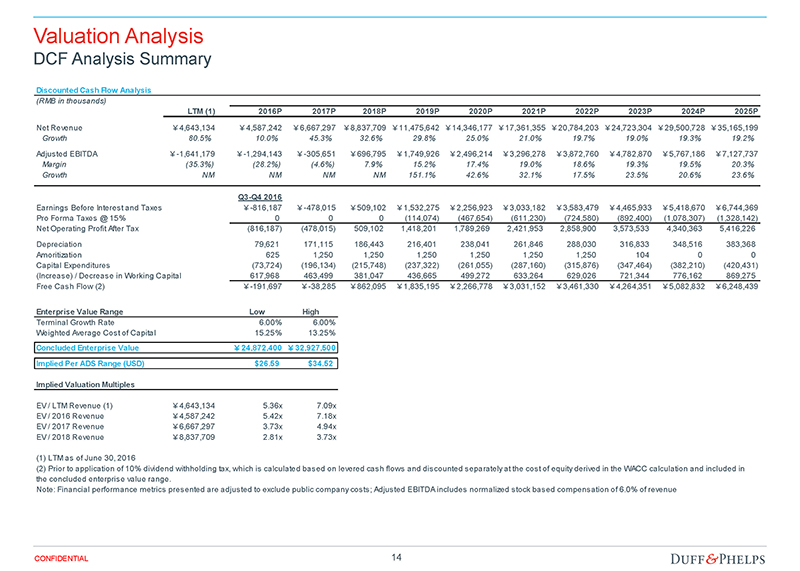
Valuation Analysis DCF Analysis Summary Discounted Cash Flow Analysis (RMB in thousands) LTM (1) 2016P 2017P 2018P 2019P 2020P 2021P 2022P 2023P 2024P 2025P Net Revenue ?4,643,134 ?4,587,242 ?6,667,297 ?8,837,709 ?11,475,642 ?14,346,177 ?17,361,355 ?20,784,203 ?24,723,304 ?29,500,728 ?35,165,199 Growth 80.5% 10.0% 45.3% 32.6% 29.8% 25.0% 21.0% 19.7% 19.0% 19.3% 19.2% Adjusted EBITDA ?-1,641,179 ?-1,294,143 ?-305,651 ?696,795 ?1,749,926 ?2,496,214 ?3,296,278 ?3,872,760 ?4,782,870 ?5,767,186 ?7,127,737 Margin (35.3%) (28.2%) (4.6%) 7.9% 15.2% 17.4% 19.0% 18.6% 19.3% 19.5% 20.3% Growth NM NM NM NM 151.1% 42.6% 32.1% 17.5% 23.5% 20.6% 23.6% Q3-Q4 2016 Earnings Before Interest and Taxes ?-816,187 ?-478,015 ?509,102 ?1,532,275 ?2,256,923 ?3,033,182 ?3,583,479 ?4,465,933 ?5,418,670 ?6,744,369 Pro Forma Taxes @ 15% 0 0 0 (114,074) (467,654) (611,230) (724,580) (892,400) (1,078,307) (1,328,142) Net Operating Profit After Tax (816,187) (478,015) 509,102 1,418,201 1,789,269 2,421,953 2,858,900 3,573,533 4,340,363 5,416,226 Depreciation 79,621 171,115 186,443 216,401 238,041 261,846 288,030 316,833 348,516 383,368 Amoritization 625 1,250 1,250 1,250 1,250 1,250 1,250 104 0 0 Capital Expenditures (73,724) (196,134) (215,748) (237,322) (261,055) (287,160) (315,876) (347,464) (382,210) (420,431) (Increase) / Decrease in Working Capital 617,968 463,499 381,047 436,665 499,272 633,264 629,026 721,344 776,162 869,275 Free Cash Flow (2) ?-191,697 ?-38,285 ?862,095 ?1,835,195 ?2,266,778 ?3,031,152 ?3,461,330 ?4,264,351 ?5,082,832 ?6,248,439 Enterprise Value Range Low High Terminal Growth Rate 6.00% 6.00% Weighted Average Cost of Capital 15.25% 13.25% Concluded Enterprise Value ?24,872,400 ?32,927,500 Implied Per ADS Range (USD) $26.59 $34.52 Implied Valuation Multiples EV / LTM Revenue (1) ?4,643,134 5.36x 7.09x EV / 2016 Revenue ?4,587,242 5.42x 7.18x EV / 2017 Revenue ?6,667,297 3.73x 4.94x EV / 2018 Revenue ?8,837,709 2.81x 3.73x (1) LTM as of June 30, 2016 (2) Prior to application of 10% dividend withholding tax, which is calculated based on levered cash flows and discounted separately at the cost of equity derived in the WACC calculation and included in the concluded enterprise value range. Note: Financial performance metrics presented are adjusted to exclude public company costs; Adjusted EBITDA includes normalized stock based compensation of 6.0% of revenue CONFIDENTIAL 14
Valuation Analysis Selected Public Companies / M&A Transactions Analysis Methodology Selected Public Companies Analysis • Duff & Phelps selected nine publicly traded companies in the online travel agency industry that were deemed relevant to its analysis. • Duff & Phelps analyzed the financial performance of each of the publicly traded companies. Duff & Phelps then analyzed the selected public companies’ trading multiples, including enterprise value to LTM and projected revenue, and enterprise value to LTM and projected EBITDA. • Due to the limited comparability of the selected public companies’ financial metrics relative to those of the Company and negative projected EBITDA and free cash flow for the Company, rather than applying a range of selected multiples from a review of the public companies, Duff & Phelps reviewed various valuation multiples for the Company implied by the valuation range determined from the DCF analysis in the context of the Company’s relative size, forecasted growth in revenue and profits, profit margins, capital spending, revenue mix, and other characteristics that we deemed relevant. Selected M&A Transactions Analysis • Duff & Phelps selected precedent transactions within the online travel agencies industry that it determined to be relevant to its analysis. Duff & Phelps computed the LTM revenue and EBITDA for each of the target companies (where publicly disclosed). Duff & Phelps then calculated the implied enterprise value to LTM revenue and enterprise value to LTM EBITDA multiples for each transaction. • Due to the limited comparability of the target companies’ financial metrics relative to those of the Company and negative EBITDA for the Company, Duff & Phelps did not select valuation multiples for the Company based on the Selected M&A Transactions Analysis. None of the companies utilized for comparative purposes in the following analysis are directly comparable to the Company, and none of the transactions utilized for comparative purposes in the following analysis are directly comparable to the Proposed Transaction. Duff & Phelps does not have access to non-public information of any of the companies used for comparative purposes. Accordingly, a complete valuation analysis of the Company and the Proposed Transaction cannot rely solely upon a quantitative review of the selected companies and selected transactions, and involves complex considerations and judgments concerning differences in financial and operating characteristics of such companies and targets, as well as other factors that could affect their value relative to that of the Company. Therefore, the Selected Public Companies / Selected M&A Transactions Analysis is subject to certain limitations. CONFIDENTIAL 15
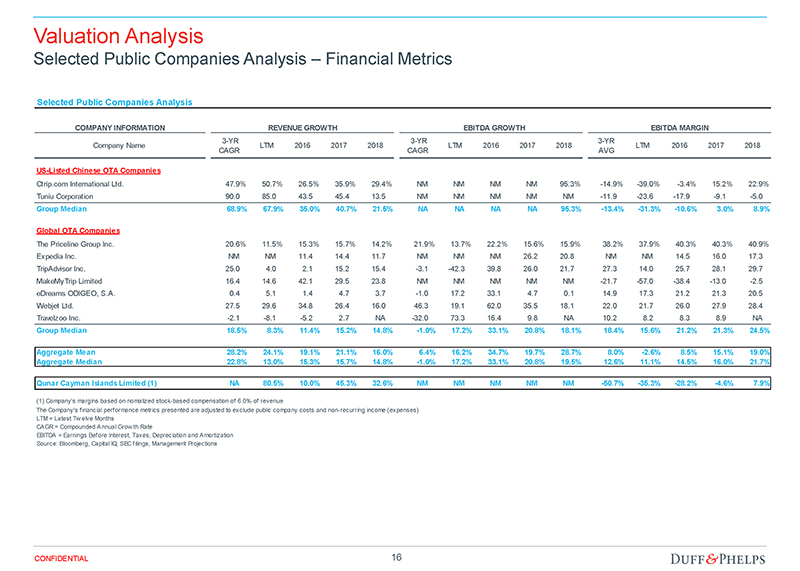
Valuation Analysis Selected Public Companies Analysis – Financial Metrics Selected Public Companies Analysis ($ in millions, except per share data) COMPANY INFORMATION REVENUE GROWTH EBITDA GROWTH EBITDA MARGIN 3-YR 3-YR 3-YR Company Name LTM 2016 2017 2018 LTM 2016 2017 2018 LTM 2016 2017 2018 CAGR CAGR AVG US-Listed Chinese OTA Companies Ctrip.com International Ltd. 47.9% 50.7% 26.5% 35.9% 29.4% NM NM NM NM 95.3% -14.9% -39.0% -3.4% 15.2% 22.9% Tuniu Corporation 90.0 85.0 43.5 45.4 13.5 NM NM NM NM NM -11.9 -23.6 -17.9 -9.1 -5.0 Group Median 68.9% 67.9% 35.0% 40.7% 21.5% NA NA NA NA 95.3% -13.4% -31.3% -10.6% 3.0% 8.9% Global OTA Companies The Priceline Group Inc. 20.6% 11.5% 15.3% 15.7% 14.2% 21.9% 13.7% 22.2% 15.6% 15.9% 38.2% 37.9% 40.3% 40.3% 40.9% Expedia Inc. NM NM 11.4 14.4 11.7 NM NM NM 26.2 20.8 NM NM 14.5 16.0 17.3 TripAdvisor Inc. 25.0 4.0 2.1 15.2 15.4 -3.1 -42.3 39.8 26.0 21.7 27.3 14.0 25.7 28.1 29.7 MakeMyTrip Limited 16.4 14.6 42.1 29.5 23.8 NM NM NM NM NM -21.7 -57.0 -38.4 -13.0 -2.5 eDreams ODIGEO, S.A. 0.4 5.1 1.4 4.7 3.7 -1.0 17.2 33.1 4.7 0.1 14.9 17.3 21.2 21.3 20.5 Webjet Ltd. 27.5 29.6 34.8 26.4 16.0 46.3 19.1 62.0 35.5 18.1 22.0 21.7 26.0 27.9 28.4 Travelzoo Inc. -2.1 -8.1 -5.2 2.7 NA -32.0 73.3 16.4 9.8 NA 10.2 8.2 8.3 8.9 NA Group Median 18.5% 8.3% 11.4% 15.2% 14.8% -1.0% 17.2% 33.1% 20.8% 18.1% 18.4% 15.6% 21.2% 21.3% 24.5% Aggregate Mean 28.2% 24.1% 19.1% 21.1% 16.0% 6.4% 16.2% 34.7% 19.7% 28.7% 8.0% -2.6% 8.5% 15.1% 19.0% Aggregate Median 22.8% 13.0% 15.3% 15.7% 14.8% -1.0% 17.2% 33.1% 20.8% 19.5% 12.6% 11.1% 14.5% 16.0% 21.7% Qunar Cayman Islands Limited (1) NA 80.5% 10.0% 45.3% 32.6% NM NM NM NM NM -50.7% -35.3% -28.2% -4.6% 7.9% (1) Company’s margins based on nomalized stock-based compensation of 6.0% of revenue The Company’s financial performance metrics presented are adjusted to exclude public company costs and non-recurring income (expenses) LTM = Latest Tw elve Months CAGR = Compounded Annual Grow th Rate EBITDA = Earnings Before Interest, Taxes, Depreciation and Amortization Source: Bloomberg, Capital IQ, SEC filings, Management Projections CONFIDENTIAL 16
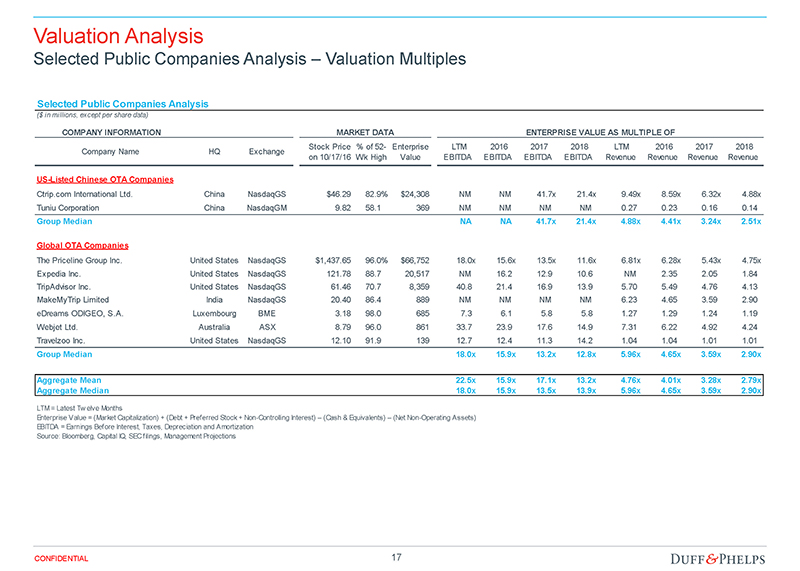
Valuation Analysis Selected Public Companies Analysis – Valuation Multiples Selected Public Companies Analysis ($ in millions, except per share data) COMPANY INFORMATION MARKET DATA ENTERPRISE VALUE AS MULTIPLE OF Stock Price % of 52- Enterprise LTM 2016 2017 2018 LTM 2016 2017 2018 Company Name HQ Exchange on 10/17/16 Wk High Value EBITDA EBITDA EBITDA EBITDA Revenue Revenue Revenue Revenue US-Listed Chinese OTA Companies Ctrip.com International Ltd. China NasdaqGS $46.29 82.9% $24,308 NM NM 41.7x 21.4x 9.49x 8.59x 6.32x 4.88x Tuniu Corporation China NasdaqGM 9.82 58.1 369 NM NM NM NM 0.27 0.23 0.16 0.14 Group Median NA NA 41.7x 21.4x 4.88x 4.41x 3.24x 2.51x Global OTA Companies The Priceline Group Inc. United States NasdaqGS $1,437.65 96.0% $66,752 18.0x 15.6x 13.5x 11.6x 6.81x 6.28x 5.43x 4.75x Expedia Inc. United States NasdaqGS 121.78 88.7 20,517 NM 16.2 12.9 10.6 NM 2.35 2.05 1.84 TripAdvisor Inc. United States NasdaqGS 61.46 70.7 8,359 40.8 21.4 16.9 13.9 5.70 5.49 4.76 4.13 MakeMyTrip Limited India NasdaqGS 20.40 86.4 889 NM NM NM NM 6.23 4.65 3.59 2.90 eDreams ODIGEO, S.A. Luxembourg BME 3.18 98.0 685 7.3 6.1 5.8 5.8 1.27 1.29 1.24 1.19 Webjet Ltd. Australia ASX 8.79 96.0 861 33.7 23.9 17.6 14.9 7.31 6.22 4.92 4.24 Travelzoo Inc. United States NasdaqGS 12.10 91.9 139 12.7 12.4 11.3 14.2 1.04 1.04 1.01 1.01 Group Median 18.0x 15.9x 13.2x 12.8x 5.96x 4.65x 3.59x 2.90x Aggregate Mean 22.5x 15.9x 17.1x 13.2x 4.76x 4.01x 3.28x 2.79x Aggregate Median 18.0x 15.9x 13.5x 13.9x 5.96x 4.65x 3.59x 2.90x LTM = Latest Tw elve Months Enterprise Value = (Market Capitalization) + (Debt + Preferred Stock + Non-Controlling Interest) – (Cash & Equivalents) – (Net Non-Operating Assets) EBITDA = Earnings Before Interest, Taxes, Depreciation and Amortization Source: Bloomberg, Capital IQ, SEC filings, Management Projections CONFIDENTIAL 17
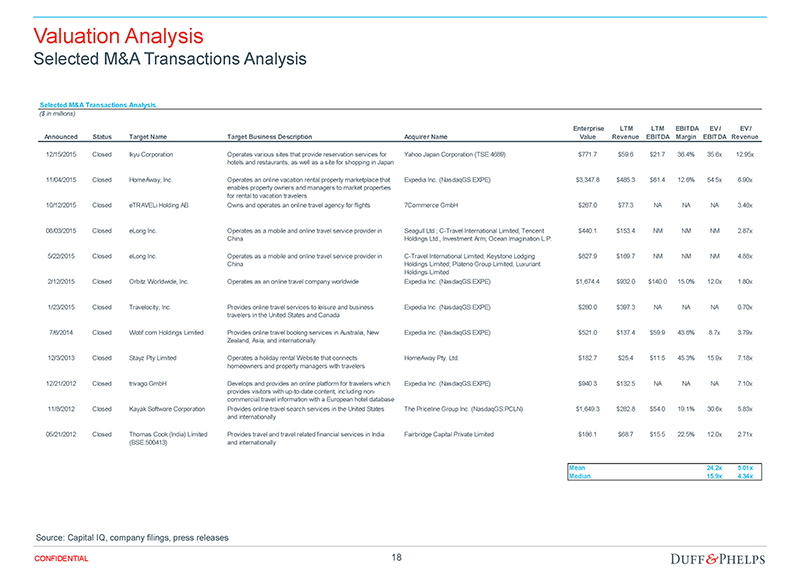
Valuation Analysis Selected M&A Transactions Analysis Selected M&A Transactions Analysis ($ in millions) Enterprise LTM LTM EBITDA EV / EV / Announced Status Target Name Target Business Description Acquirer Name Value Revenue EBITDA Margin EBITDA Revenue 12/15/2015 Closed Ikyu Corporation Operates various sites that provide reservation services for Yahoo Japan Corporation (TSE:4689) $771.7 $59.6 $21.7 36.4% 35.6x 12.95x hotels and restaurants, as well as a site for shopping in Japan 11/04/2015 Closed HomeAway, Inc. Operates an online vacation rental property marketplace that Expedia Inc. (NasdaqGS:EXPE) $3,347.8 $485.3 $61.4 12.6% 54.5x 6.90x enables property owners and managers to market properties for rental to vacation travelers 10/12/2015 Closed eTRAVELi Holding AB Owns and operates an online travel agency for flights 7Commerce GmbH $267.0 $77.3 NA NA NA 3.46x 08/03/2015 Closed eLong Inc. Operates as a mobile and online travel service provider in Seagull Ltd.; C-Travel International Limited; Tencent $440.1 $153.4 NM NM NM 2.87x China Holdings Ltd., Investment Arm; Ocean Imagination L.P. 5/22/2015 Closed eLong Inc. Operates as a mobile and online travel service provider in C-Travel International Limited; Keystone Lodging $827.9 $169.7 NM NM NM 4.88x China Holdings Limited; Plateno Group Limited; Luxuriant Holdings Limited 2/12/2015 Closed Orbitz Worldwide, Inc. Operates as an online travel company worldwide Expedia Inc. (NasdaqGS:EXPE) $1,674.4 $932.0 $140.0 15.0% 12.0x 1.80x 1/23/2015 Closed Travelocity, Inc. Provides online travel services to leisure and business Expedia Inc. (NasdaqGS:EXPE) $280.0 $397.3 NA NA NA 0.70x travelers in the United States and Canada 7/6/2014 Closed Wotif.com Holdings Limited Provides online travel booking services in Australia, New Expedia Inc. (NasdaqGS:EXPE) $521.0 $137.4 $59.9 43.6% 8.7x 3.79x Zealand, Asia, and internationally 12/3/2013 Closed Stayz Pty Limited Operates a holiday rental Website that connects HomeAway Pty. Ltd. $182.7 $25.4 $11.5 45.3% 15.9x 7.18x homeowners and property managers with travelers 12/21/2012 Closed trivago GmbH Develops and provides an online platform for travelers which Expedia Inc. (NasdaqGS:EXPE) $940.3 $132.5 NA NA NA 7.10x provides visitors with up-to-date content, including noncommercial travel information with a European hotel database 11/8/2012 Closed Kayak Software Corporation Provides online travel search services in the United States The Priceline Group Inc. (NasdaqGS:PCLN) $1,649.3 $282.8 $54.0 19.1% 30.6x 5.83x and internationally 05/21/2012 Closed Thomas Cook (India) Limited Provides travel and travel related financial services in India Fairbridge Capital Private Limited $186.1 $68.7 $15.5 22.5% 12.0x 2.71x (BSE:500413) and internationally Mean 24.2x 5.01x Median 15.9x 4.34x Source: Capital IQ, company filings, press releases CONFIDENTIAL 18
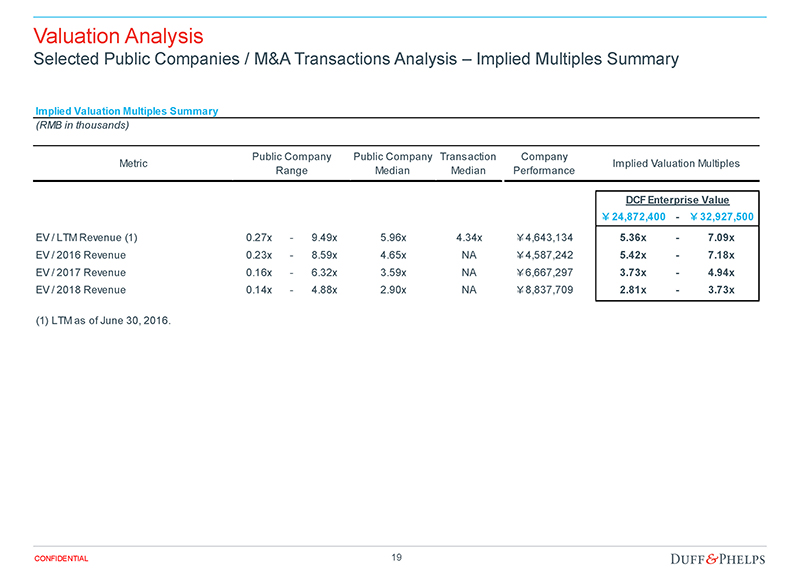
Valuation Analysis Selected Public Companies / M&A Transactions Analysis – Implied Multiples Summary Implied Valuation Multiples Summary (RMB in thousands) Public Company Public Company Transaction Company Metric Implied Valuation Multiples Range Median Median Performance DCF Enterprise Value ?24,872,400—?32,927,500 EV / LTM Revenue (1) 0.27x—9.49x 5.96x 4.34x ?4,643,134 5.36x—7.09x EV / 2016 Revenue 0.23x—8.59x 4.65x NA ?4,587,242 5.42x—7.18x EV / 2017 Revenue 0.16x—6.32x 3.59x NA ?6,667,297 3.73x—4.94x EV / 2018 Revenue 0.14x—4.88x 2.90x NA ?8,837,709 2.81x—3.73x (1) LTM as of June 30, 2016. CONFIDENTIAL 19
Appendix 1 Assumptions, Qualifications, and Limiting Conditions
Assumptions, Qualifications, and Limiting Conditions If issued, our Opinion letter will include assumptions, qualifications and limiting conditions similar to the following. This is not meant to be a complete list of the assumptions, qualifications and limiting conditions which will be included in our Opinion letter, if rendered. Assumptions and Reliance – In performing its analyses with respect to the Proposed Transaction, Duff & Phelps, with the Company’s and the Special Committee’s consent and without independent verification: • Relied upon the accuracy, completeness, and fair presentation of all information, data, advice, opinions and representations obtained from public sources or provided to it from private sources, including the management of the Company; • Relied upon the fact that the Special Committee, the Board of Directors and the Company have been advised by counsel as to all legal matters with respect to the Proposed Transaction, including whether all procedures required by law to be taken in connection with the Proposed Transaction have been duly, validly and timely taken; • Assumed that any estimates, evaluations, forecasts and projections including, without limitation, the Management Projections, furnished to Duff & Phelps were reasonably prepared and based upon the best currently available information and good faith judgment of the person furnishing the same, and Duff & Phelps expresses no view or opinion with respect to such estimates, evaluations, forecasts or projections or their underlying assumptions; • Assumed that the information relating to the Company and the Proposed Transaction provided to Duff & Phelps and representations made by the management of the Company regarding the Company and the Proposed Transaction are accurate in all material respects, did not and does not omit to state a material fact in respect of the Company and the Proposed Transaction necessary to make the information not misleading in light of the circumstances under which the information was provided; • Assumed that the representations and warranties made by all parties in the Merger Agreement and in the Management Representation Letter are true and correct in all material respects and that each party to the Merger Agreement will fully and duly perform all covenants, undertakings and obligations required to be performed by such party; • Assumed that the final versions of all documents reviewed by Duff & Phelps in draft form, including the Merger Agreement, conform in all material respects to the drafts reviewed; • Assumed that there has been no material change in the assets, liabilities, financial condition, results of operations, business, or prospects of the Company since the date of the most recent financial statements and other information made available to Duff & Phelps; • Assumed that all of the conditions required to implement the Proposed Transaction will be satisfied and that the Proposed Transaction will be completed in accordance with the Merger Agreement without any amendments thereto or any waivers of any terms or conditions thereof, and in a manner that complies in all material respects with all applicable laws; and • Assumed that all governmental, regulatory or other consents and approvals necessary for the consummation of the Proposed Transaction will be obtained without any undue delay, limitation, restriction or condition that would have a material effect on the Company or the contemplated benefits expected to be derived in the Proposed Transaction. To the extent that any of the foregoing assumptions or any of the facts on which the Opinion is based prove to be untrue in any material respect, the Opinion cannot and should not be relied upon for any purpose. Furthermore, in Duff & Phelps’ analysis and in connection with the preparation of the Opinion, Duff & Phelps has made numerous assumptions with respect to industry performance, general business, market and economic conditions and other matters, many of which are beyond the control of any party involved in the Proposed Transaction and as to which Duff & Phelps does not express any view or opinion in the Opinion, including as to the reasonableness of such assumptions. CONFIDENTIAL 21
Assumptions, Qualifications, and Limiting Conditions Qualifications – If issued, our Opinion will be qualified by the following: • Duff & Phelps has prepared the Opinion effective as of the date thereof. The Opinion is necessarily based upon the information made available to Duff & Phelps as of the date hereof and market, economic, financial and other conditions as they exist and can be evaluated as of the date thereof, and Duff & Phelps disclaims any undertaking or obligation to (i) advise any person of any change in any fact or matter affecting the Opinion which may come or be brought to the attention of Duff & Phelps after the date thereof or (ii) update, revise or reaffirm the Opinion after the date thereof. • Duff & Phelps did not evaluate the Company’s solvency or conduct an independent appraisal or physical inspection of any specific assets or liabilities (contingent or otherwise) of the Company, nor was Duff & Phelps provided with any such appraisal or evaluation other than the contents of the Management Representation Letter. Duff & Phelps did not estimate, and expresses no opinion regarding, the liquidation value of any entity or business. • Duff & Phelps has not been requested to, and did not, (i) initiate any discussions with, or solicit any indications of interest from, third parties with respect to the Proposed Transaction, the assets, businesses or operations of the Company, or any alternatives to the Proposed Transaction, or (ii) advise the Special Committee or any other party with respect to alternatives to the Proposed Transaction. • Duff & Phelps did not undertake an independent analysis of any potential or actual litigation, regulatory action, possible unasserted claims or other contingent liabilities, to which the Company is or may be a party or is or may be subject, or of any governmental investigation of any possible unasserted claims or other contingent liabilities to which the Company is or may be a party or is or may be subject. • Duff & Phelps is not expressing any opinion as to the market price or value of the Shares or ADSs (or anything else) after the announcement or the consummation of the Proposed Transaction (or any other time). The Opinion should not be construed as a valuation opinion, a credit rating, a solvency opinion, an analysis of the Company’s creditworthiness, tax advice, or accounting advice. Duff & Phelps has not made, and assumes no responsibility to make, any representation, or render any opinion, as to any legal matter. Duff & Phelps expressly disclaims any responsibility or liability in this regard. • In rendering the Opinion, Duff & Phelps is not expressing any opinion with respect to the amount or nature or any other aspect of any compensation payable to or to be received by any of the Company’s officers, directors, or employees, or any class of such persons, relative to the Merger Consideration, or with respect to the fairness of any such compensation. In addition, this Opinion does not address the fairness to, or any other consideration of, the holders of any class of securities, creditors or other constituencies of the Company, other than the holders of the Shares (other than the Excluded Shares, the Dissenting Shares and Shares represented by ADSs) and ADSs (other than ADSs representing the Excluded Shares). CONFIDENTIAL 22
Assumptions, Qualifications, and Limiting Conditions Limiting Conditions – If issued, the use of our Opinion will be strictly limited and will state: • The Opinion is furnished solely for the use and benefit of the Special Committee in connection with its consideration of the Proposed Transaction and is not intended to, and does not, confer any rights or remedies upon any other person, and is not intended to be used, and may not be used, by any other person or for any other purpose, without Duff & Phelps’ prior written consent. • The Opinion (i) does not address the merits of the underlying business decision to enter into the Proposed Transaction versus any alternative strategy or transaction; (ii) does not address any transaction related to the Proposed Transaction; (iii) is not a recommendation as to how the Special Committee, the Board of Directors, the Company or any other person including security holders of the Company as to how such person should vote or act with respect to any matters relating to the Proposed Transaction, or whether to proceed with the Proposed Transaction or any related transaction, and (iv) does not indicate that the Merger Consideration is the best possibly attainable under any circumstances; instead, it merely states whether the Merger Consideration is within a range suggested by certain financial analyses. The decision as to whether to proceed with the Proposed Transaction or any related transaction may depend on an assessment of factors unrelated to the financial analysis on which the Opinion is based. • The Opinion should not be construed as creating any fiduciary duty on the part of Duff & Phelps to any party. • The Opinion is solely that of Duff & Phelps, and Duff & Phelps’ liability in connection with the Opinion shall be limited in accordance with the terms set forth in the engagement letter among Duff & Phelps, DPS, the Company, and the Special Committee dated July 2, 2016 (the “Engagement Letter”). • The Opinion is confidential, and its use and disclosure is strictly limited in accordance with the terms set forth in the Engagement Letter. CONFIDENTIAL 23
Appendix 2 Summary of Premiums Paid
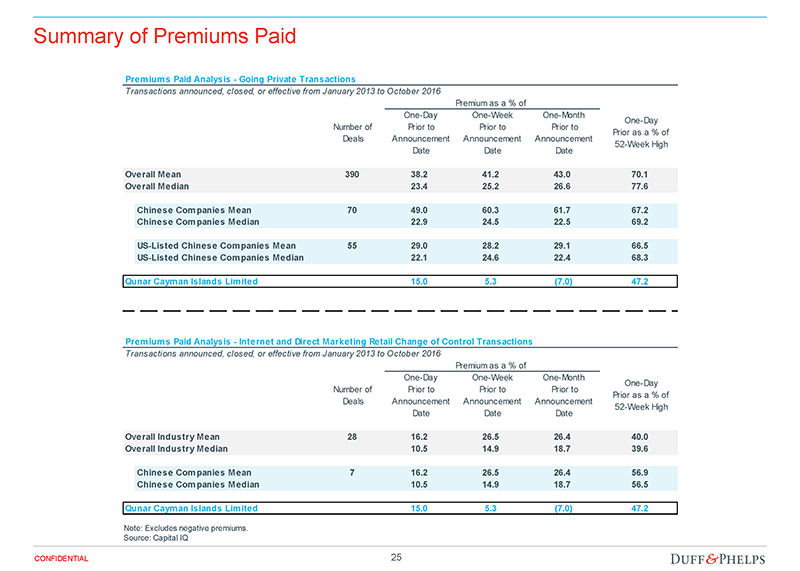
Summary of Premiums Paid Premiums Paid Analysis—Going Private Transactions Transactions announced, closed, or effective from January 2013 to October 2016 Premium as a % of One-Day One-Week One-Month One-Day Number of Prior to Prior to Prior to Prior as a % of Deals Announcement Announcement Announcement 52-Week High Date Date Date Overall Mean 390 38.2 41.2 43.0 70.1 Overall Median 23.4 25.2 26.6 77.6 Chinese Companies Mean 70 49.0 60.3 61.7 67.2 Chinese Companies Median 22.9 24.5 22.5 69.2 US-Listed Chinese Companies Mean 55 29.0 28.2 29.1 66.5 US-Listed Chinese Companies Median 22.1 24.6 22.4 68.3 Qunar Cayman Islands Limited 15.0 5.3 (7.0) 47.2 Premiums Paid Analysis—Internet and Direct Marketing Retail Change of Control Transactions Transactions announced, closed, or effective from January 2013 to October 2016 Premium as a % of One-Day One-Week One-Month One-Day Number of Prior to Prior to Prior to Prior as a % of Deals Announcement Announcement Announcement 52-Week High Date Date Date Overall Industry Mean 28 16.2 26.5 26.4 40.0 Overall Industry Median 10.5 14.9 18.7 39.6 Chinese Companies Mean 7 16.2 26.5 26.4 56.9 Chinese Companies Median 10.5 14.9 18.7 56.5 Qunar Cayman Islands Limited 15.0 5.3 (7.0) 47.2 Note: Excludes negative premiums. Source: Capital IQ CONFIDENTIAL 25