Exhibit 9*
Reconciliation of assets, liabilities, and equity of Japan Bank for International Cooperation (“JBIC”) and its subsidiaries (the “ JBIC Group”) as of March 31, 2018 and 2017, and reconciliation of net profit or loss of the JBIC Group for the fiscal years ended March 31, 2018 and 2017, between accounting principles generally accepted in Japan (“Japanese GAAP”) and International Financial Reporting Standards (“IFRS”) as issued by the International Accounting Standards Board (the “IASB”), and non-GAAP financial information calculated and presented on the basis of methodologies other than in accordance with generally accepted accounting principles (the ”Reconciliation”).*
The Reconciliation was prepared on a non-consolidated basis for the fiscal year ended March 31, 2017 because JBIC had no subsidiaries for the fiscal year ended March 31, 2017. On the other hand, the Reconciliation for the fiscal year ended March 31, 2018, has been prepared on a consolidated basis because subsidiaries of JBIC were established in the fiscal year ended March 31, 2018.
| * | Audited consolidated financial statements of the JBIC Group as of and for the fiscal years ended March 31, 2018 and 2017 prepared in accordance with IFRS as issued by the IASB are being disclosed for reference purposes in order to improve comparability with other issuers outside of Japan. The registrant’s financial statements for reporting purposes are prepared in accordance with Japanese GAAP (see Exhibit 2). |
Reconciliation of assets, liabilities, and equity as of March 31, 2018
| | | | | | | | | | | | | | | | | | |
(Millions of yen) |
Accounts under Japanese GAAP | | Japanese
GAAP | | | Reclassifications | | | Differences in
recognition
and
measurement | | | IFRS | | | Accounts under IFRS |
Assets | | | | | | | | | | | | | | | | | | Assets |
Cash and due from banks | | | 1,751,287 | | | | — | | | | — | | | | 1,751,287 | | | Cash and due from banks |
| | | — | | | | 149,706 | | | | (200 | ) | | | 149,506 | | | Derivative financial instrument assets |
| | | — | | | | 9,838 | | | | (633 | ) | | | 9,204 | | | Financial assets designated as fair value through profit or loss |
Securities | | | 351,605 | | | | (135,919 | ) | | | (7,299 | ) | | | 208,385 | | | Securities |
Loans and bills discounted | | | 13,513,680 | | | | (190,684 | ) | | | 129,954 | | | | 13,452,950 | | | Loans and other receivables |
| | | — | | | | 126,081 | | | | 10,996 | | | | 137,078 | | | Equity method investments |
Property, plant and equipment | | | 28,401 | | | | — | | | | — | | | | 28,401 | | | Property and equipment |
Intangible assets | | | 3,472 | | | | (3,472 | ) | | | — | | | | — | | | |
Other assets | | | 377,809 | | | | (122,763 | ) | | | — | | | | 255,046 | | | Other assets |
Customers’ liabilities for acceptances and guarantees | | | 2,259,369 | | | | — | | | | (2,259,369 | ) | | | — | | | |
Allowance for loan losses | | | (273,564 | ) | | | 273,564 | | | | — | | | | — | | | |
| | | | | | | | | | | | | | | | | | |
Total assets | | | 18,012,060 | | | | 106,350 | | | | (2,126,551 | ) | | | 15,991,860 | | | Total assets |
| | | | | |
Liabilities | | | | | | | | | | | | | | | | | | Liabilities |
| | | — | | | | 287,453 | | | | (23 | ) | | | 287,429 | | | Derivative financial instrument liabilities |
Borrowed money | | | 8,370,758 | | | | — | | | | — | | | | 8,370,758 | | | Borrowings |
Bonds payable | | | 4,392,597 | | | | — | | | | (3,842 | ) | | | 4,388,754 | | | Bonds payable |
| | �� | — | | | | — | | | | 72,285 | | | | 72,285 | | | Financial guarantee contracts |
Net defined benefit liability | | | 6,785 | | | | (6,785 | ) | | | — | | | | — | | | |
Provision for directors’ retirement benefits | | | 25 | | | | (25 | ) | | | — | | | | — | | | |
Other liabilities | | | 435,498 | | | | (173,736 | ) | | | (33,781 | ) | | | 227,980 | | | Other liabilities |
Provision for bonuses | | | 546 | | | | (546 | ) | | | — | | | | — | | | |
Provision for directors’ bonuses | | | 9 | | | | (9 | ) | | | — | | | | — | | | |
Acceptances and guarantees | | | 2,259,369 | | | | — | | | | (2,259,369 | ) | | | — | | | |
| | | | | | | | | | | | | | | | | | |
Total liabilities | | | 15,465,589 | | | | 106,350 | | | | (2,224,731) | | | | 13,347,209 | | | Total liabilities |
| | | | | |
Net assets | | | | | | | | | | | | | | | | | | Equity |
Capital stock | | | 1,765,200 | | | | — | | | | — | | | | 1,765,200 | | | Capital stock |
Retained earnings | | | 883,601 | | | | — | | | | (26,961 | ) | | | 856,640 | | | Retained earnings |
| | | — | | | | (102,558 | ) | | | 125,140 | | | | 22,582 | | | Other reserves |
Valuation difference on available-for-sale securities | | | (1,209 | ) | | | 1,209 | | | | — | | | | — | | | |
Deferred gains or losses on hedges | | | (114,658 | ) | | | 114,658 | | | | — | | | | — | | | |
Foreign currency translation adjustment | | | 13,309 | | | | (13,309 | ) | | | — | | | | — | | | |
Non-controlling interests | | | 227 | | | | — | | | | — | | | | 227 | | | Non-controlling interests |
| | | | | | | | | | | | | | | | | | |
Total net assets | | | 2,546,471 | | | | — | | | | 98,179 | | | | 2,644,651 | | | Total equity |
| | | | | | | | | | | | | | | | | | |
Total liabilities and net assets | | | 18,012,060 | | | | 106,350 | | | | (2,126,551 | ) | | | 15,991,860 | | | Total liabilities and equity |
1
Reconciliation of assets, liabilities, and equity as of March 31, 2017
| | | | | | | | | | | | | | | | | | |
(Millions of yen) |
Accounts under Japanese GAAP | | Japanese
GAAP | | | Reclassifications | | | Differences in
recognition
and
measurement | | | IFRS | | | Accounts under IFRS |
Assets | | | | | | | | | | | | | | | | | | Assets |
Cash and due from banks | | | 1,526,209 | | | | — | | | | — | | | | 1,526,209 | | | Cash and due from banks |
| | | — | | | | 167,277 | | | | — | | | | 167,277 | | | Derivative financial instrument assets |
Securities | | | 281,249 | | | | (93,732 | ) | | | 2,638 | | | | 190,155 | | | Securities |
Loans and bills discounted | | | 14,309,138 | | | | (154,268 | ) | | | 197,851 | | | | 14,352,720 | | | Loans and other receivables |
| | | — | | | | 93,732 | | | | 20,471 | | | | 114,204 | | | Equity method investments |
Property, plant and equipment | | | 27,613 | | | | — | | | | — | | | | 27,613 | | | Property and equipment |
Intangible assets | | | 2,711 | | | | (2,711 | ) | | | — | | | | — | | | |
Other assets | | | 261,790 | | | | (67,028 | ) | | | — | | | | 194,762 | | | Other assets |
Customers’ liabilities for acceptances and guarantees | | | 2,384,997 | | | | — | | | | (2,384,997 | ) | | | — | | | |
Allowance for loan losses | | | (222,036 | ) | | | 222,036 | | | | — | | | | — | | | |
| | | | | | | | | | | | | | | | | | |
Total assets | | | 18,571,673 | | | | 165,304 | | | | (2,164,035 | ) | | | 16,572,942 | | | Total assets |
| | | | | |
Liabilities | | | | | | | | | | | | | | | | | | Liabilities |
| | | — | | | | 498,211 | | | | 717 | | | | 498,928 | | | Derivative financial instrument liabilities |
Borrowed money | | | 9,908,705 | | | | — | | | | — | | | | 9,908,705 | | | Borrowings |
Bonds payable | | | 3,301,565 | | | | — | | | | (2,067 | ) | | | 3,299,498 | | | Bonds payable |
| | | — | | | | — | | | | 84,912 | | | | 84,912 | | | Financial guarantee contracts |
Provision for retirement benefits | | | 6,807 | | | | (6,807 | ) | | | — | | | | — | | | |
Provision for directors’ retirement benefits | | | 16 | | | | (16 | ) | | | — | | | | — | | | |
Other liabilities | | | 461,442 | | | | (325,556 | ) | | | (37,399 | ) | | | 98,486 | | | Other liabilities |
Provision for bonuses | | | 519 | | | | (519 | ) | | | — | | | | — | | | |
Provision for directors’ bonuses | | | 6 | | | | (6 | ) | | | — | | | | — | | | |
Acceptances and guarantees | | | 2,384,997 | | | | — | | | | (2,384,997 | ) | | | — | | | |
| | | | | | | | | | | | | | | | | | |
Total liabilities | | | 16,064,061 | | | | 165,304 | | | | (2,338,833 | ) | | | 13,890,532 | | | Total liabilities |
| | | | | |
Net assets | | | | | | | | | | | | | | | | | | Equity |
Capital stock | | | 1,683,000 | | | | — | | | | — | | | | 1,683,000 | | | Capital stock |
Retained earnings | | | 842,366 | | | | — | | | | 126,897 | | | | 969,264 | | | Retained earnings |
| | | — | | | | (17,755 | ) | | | 47,900 | | | | 30,145 | | | Other reserves |
Valuation difference on available-for-sale securities | | | 2,468 | | | | (2,468 | ) | | | — | | | | — | | | |
Deferred gains or losses on hedges | | | (20,223 | ) | | | 20,223 | | | | — | | | | — | | | |
| | | | | | | | | | | | | | | | | | |
Total net assets | | | 2,507,611 | | | | — | | | | 174,798 | | | | 2,682,409 | | | Total equity |
| | | | | | | | | | | | | | | | | | |
Total liabilities and net assets | | | 18,571,673 | | | | 165,304 | | | | (2,164,035 | ) | | | 16,572,942 | | | Total liabilities and equity |
2
Reconciliation of net loss for the year ended March 31, 2018
| | | | | | | | | | | | | | | | | | |
(Millions of yen) |
Accounts under Japanese GAAP | | Japanese
GAAP | | | Reclassifications | | | Differences in
recognition
and
measurement | | | IFRS | | | Accounts under IFRS |
Interest income | | | 336,768 | | | | (17 | ) | | | 8,050 | | | | 344,801 | | | Interest income |
Interest expense | | | 249,256 | | | | (43,192 | ) | | | 559 | | | | 206,624 | | | Interest expense |
| | | | | | | | | | | | | | | | | | |
| | | | | | | | | | | | | | | 138,177 | | | Net interest income |
| | | | | | | | | | | | | | | | | | |
Fees and commissions | | | 23,914 | | | | — | | | | (8,896 | ) | | | 15,018 | | | Fee and commission income |
Fees and commissions payments | | | 2,043 | | | | — | | | | — | | | | 2,043 | | | Fee and commission expense |
| | | — | | | | 45,410 | | | | 92,979 | | | | 138,389 | | | Net expense from derivative financial instruments |
| | | — | | | | 13 | | | | 133 | | | | 146 | | | Net loss from financial assets designated as fair value through profit or loss |
| | | — | | | | 71 | | | | 16 | | | | 88 | | | Net investment income |
| | | — | | | | 7,234 | | | | (3,682 | ) | | | 3,552 | | | Other income |
Other ordinary income | | | 128 | | | | (128 | ) | | | — | | | | — | | | |
Other income *1 | | | 156 | | | | (156 | ) | | | — | | | | — | | | |
Extraordinary income | | | 9 | | | | (9 | ) | | | — | | | | — | | | |
| | | | | | | | | | | | | | | | | | |
| | | | | | | | | | | | | | | 121,921 | | | Expense other than interest income |
| | | | | | | | | | | | | | | | | | |
| | | | | | | | | | | | | | | 16,256 | | | Total operating income |
| | | | | |
| | | — | | | | 51,528 | | | | 58,449 | | | | 109,978 | | | Impairment losses on financial assets |
Recoveries of written-off claims *1 | | | 0 | | | | (0 | ) | | | — | | | | — | | | |
Provision of allowance for loan losses *2 | | | 51,528 | | | | (51,528 | ) | | | — | | | | — | | | |
| | | | | | | | | | | | | | | | | | |
| | | | | | | | | | | | | | | 93,722 | | | Net operating loss |
| | | | | |
General and administrative expenses | | | 19,660 | | | | — | | | | (114 | ) | | | 19,545 | | | Operating expenses |
| | | — | | | | 3,667 | | | | (2,844 | ) | | | 822 | | | Other expenses |
Other ordinary expenses | | | 5,363 | | | | (5,363 | ) | | | — | | | | — | | | |
Other *2 | | | 144 | | | | (144 | ) | | | — | | | | — | | | |
Extraordinary loss | | | 8 | | | | (8 | ) | | | — | | | | — | | | |
| | | | | | | | | | | | | | | | | | |
| | | | | | | | | | | | | | | 20,367 | | | Total operating expenses |
| | | | | |
Profits of equity method investments *1 | | | 22,207 | | | | 273 | | | | — | | | | 22,480 | | | Profits of equity method investments |
| | | | | |
Gain on investments in partnerships *1 | | | 6,884 | | | | (6,884 | ) | | | — | | | | — | | | |
| | | | | | | | | | | | | | | | | | |
| | | | | | | | | | | | | | | 91,609 | | | Loss before income tax |
| | | | | |
Income tax expense | | | 0 | | | | — | | | | — | | | | 0 | | | Income tax expense |
| | | | | | | | | | | | | | | | | | |
Net income | | | 62,064 | | | | — | | | | (153,674 | ) | | | 91,609 | | | Net loss |
| *1 | The sum of these amounts is included in “Other income” in the income statement prepared under Japanese GAAP. |
| *2 | The sum of these amounts is included in “Other expenses” in the income statement prepared under Japanese GAAP. |
3
| | | | | | | | | | | | | | | | | | |
Reconciliation of net profit for the year ended March 31, 2017 |
(Millions of yen) |
Accounts under Japanese GAAP | | Japanese
GAAP | | | Reclassifications | | | Differences in
recognition
and
measurement | | | IFRS | | | Accounts under IFRS |
Interest income | | | 259,250 | | | | 0 | | | | 2,121 | | | | 261,372 | | | Interest income |
Interest expense | | | 177,433 | | | | (26,836 | ) | | | (372 | ) | | | 150,223 | | | Interest expense |
| | | | | | | | | | | | | | | | | | |
| | | | | | | | | | | | | | | 111,148 | | | Net interest income |
| | | | | | | | | | | | | | | | | | |
Fees and commissions | | | 26,836 | | | | — | | | | (11,293 | ) | | | 15,542 | | | Fee and commission income |
Fees and commissions payments | | | 1,919 | | | | — | | | | — | | | | 1,919 | | | Fee and commission expense |
| | | — | | | | 27,259 | | | | 122,057 | | | | 149,316 | | | Net expense from derivative financial instruments |
| | | — | | | | 493 | | | | (269 | ) | | | 223 | | | Other income |
Other income *1 | | | 148 | | | | (148 | ) | | | — | | | | — | | | |
Extraordinary income | | | 75 | | | | (75 | ) | | | — | | | | — | | | |
| | | | | | | | | | | | | | | | | | |
| | | | | | | | | | | | | | | 135,470 | | | Expense other than interest income |
| | | | | | | | | | | | | | | | | | |
| | | | | | | | | | | | | | | 24,322 | | | Total operating loss |
| | | — | | | | (53,855 | ) | | | 162,495 | | | | 108,639 | | | Reversal of impairment losses on financial assets |
Recoveries of written-off claims *1 | | | 0 | | | | (0 | ) | | | — | | | | — | | | |
Provision of allowance for loan losses *2 | | | 53,855 | | | | (53,855 | ) | | | — | | | | — | | | |
| | | | | | | | | | | | | | | | | | |
| | | | | | | | | | | | | | | 84,317 | | | Net operating income |
General and administrative expenses | | | 16,726 | | | | — | | | | 290 | | | | 17,017 | | | Operating expenses |
| | | — | | | | 2,760 | | | | (1,252 | ) | | | 1,508 | | | Other expenses |
Other ordinary expenses | | | 3,136 | | | | (3,136 | ) | | | — | | | | — | | | |
Other *2 | | | 46 | | | | (46 | ) | | | — | | | | — | | | |
| | | | | | | | | | | | | | | | | | |
| | | | | | | | | | | | | | | 18,525 | | | Total operating expenses |
| | | | | |
| | | — | | | | 8,151 | | | | — | | | | 8,151 | | | Profits of equity method investments |
| | | | | |
Gain on investments in partnerships *1 | | | 8,421 | | | | (8,421 | ) | | | — | | | | — | | | |
| | | | | | | | | | | | | | | | | | |
Net income | | | 41,612 | | | | — | | | | 32,331 | | | | 73,944 | | | Net profit |
| *1 | The sum of these amounts is included in “Other income” in the income statement prepared under Japanese GAAP. |
| *2 | The sum of these amounts is included in “Other expenses” in the income statement prepared under Japanese GAAP. |
4
Notes to the reconciliation of assets, liabilities, and equity as of March 31, 2018 and 2017, and the reconciliation of net profit or loss for the fiscal years ended March 31, 2018 and 2017
| | A. | Derivative financial instrument assets and liabilities |
Under Japanese GAAP, derivative financial instrument assets and derivative financial instrument liabilities which qualify for offsetting criteria are presented on a net basis by counterparty and included in “Other assets” or “Other liabilities.” Under IFRS, however, such assets and liabilities do not qualify for offsetting criteria and are presented on a gross basis as “Derivative financial instrument assets” and “Derivative financial instrument liabilities.”
Under IFRS, the JBIC Group determines fair values of derivative financial instrument assets and liabilities by considering the counterparty credit risk or own credit risk derived from observable market data.
The JBIC Group does not apply hedge accounting under IFRS, which is applied under Japanese GAAP. At the date of transition, the JBIC Group applied International Accounting Standard (IAS) 39 Financial Instruments: Recognition and Measurement to the hedges to which hedge accounting was applied under Japanese GAAP. The JBIC Group reclassified deferred gains or losses on hedges whose hedging relationships did not qualify for IAS 39 to retained earnings. For the hedges which did not meet the conditions for hedge accounting under IAS 39, the JBIC Group discontinued hedge accounting by the types of hedges according to IFRS 1 First-time Adoption of International Financial Reporting Standards as follows:
The JBIC Group reclassifies deferred gains or losses on hedges from equity to profit or loss according to cash flows from the hedged transactions.
The JBIC Group reclassified deferred gains or losses on hedges under Japanese GAAP to retained earnings at the date of transition and adjusted carrying amounts of the hedged items at the lower of the following (a) and (b). The JBIC Group amortizes the adjusted amounts of the hedged items using the effective interest method and recognizes them in profit or loss.
| | a. | cumulative changes in fair values of the hedged items attributable to designated hedged risks and not recognized under Japanese GAAP; and |
| | b. | cumulative changes in fair values of the hedging instruments attributable to designated hedged risks and either not recognized or deferred in equity in the balance sheet under Japanese GAAP. |
| | B. | Financial assets designated as fair value through profit or loss |
Under IFRS, there is an option, on initial recognition, to designate financial assets as fair value through profit or loss for financial assets for which a measurement or recognition inconsistency is eliminated or significantly reduced by the designation, or which are managed and their performance is evaluated on a fair value basis in accordance with a documented risk management or investment strategy. However, under Japanese GAAP, such an option is not available.
From the fiscal year ended March 31, 2018, the JBIC Group has elected to present financial assets designated as fair value through profit or loss held by an investment entity subsidiary as “Financial assets designated as fair value through profit or loss” under IFRS, whereas they are presented as “Securities” under Japanese GAAP.
Under IFRS, the JBIC Group presents gains and losses arising from the changes in fair value and sales of such assets together with interest income and dividend income in “Net gain (loss) from financial assets designated as fair value through profit or loss.” Under Japanese GAAP, the JBIC Group presents the interest income and dividend income as “Interest income” and the gains and losses arising from the changes in fair value and sales of such assets as “Other income” (when it is a gain) or “Other” (when it is a loss).
The JBIC Group presents investments in associates as “Equity method investments” under IFRS, whereas they are presented as “Securities” under Japanese GAAP. For the differences in the measurement method between the accounting standards, see “E. Equity method investments.”
Under Japanese GAAP, the JBIC Group measures unlisted stocks included in securities at cost. Under IFRS, the JBIC Group classifies them as available-for-sale financial assets and measures principally at fair value. The JBIC Group recognizes changes in fair values in “Other reserves” and impairment losses as necessary.
Under Japanese GAAP, the JBIC Group measures investments in partnerships included in securities at net amounts equivalent to its interest in their most recent financial statements available at the reporting date defined in the partnership agreement. Under IFRS, the JBIC Group measures them at fair value in principle and recognizes changes in fair values in “Other reserves” and impairment losses as necessary.
5
| | D. | Loans and other receivables |
The JBIC Group includes accrued interest income on loans included in “Other assets” under Japanese GAAP and financial assets associated with financial guarantee contracts described in “G. Financial guarantee contracts” in “Loans and other receivables” under IFRS.
Under IFRS, the JBIC Group measures loans and other receivables at fair value plus direct transaction costs at initial recognition and subsequently at amortized cost using the effective interest method. The JBIC Group amortizes loan origination fees which are considered indispensable to the origination using the effective interest method. As described in “A. ii. Fair value hedges,” the JBIC Group adjusts the carrying amounts of loans for which hedge accounting was discontinued at the date of transition and amortizes them accordingly.
Under Japanese GAAP, the JBIC Group recognizes general allowance as well as specific allowance for loan losses.
In accordance with the incurred loss model under IFRS, the JBIC Group recognizes impairment losses when it concludes that there is objective evidence of impairment as a result of one or more events that occurred after the initial recognition of the asset (a loss event), and that loss event (or events) has an impact on the estimated cash flows of the financial asset or a group of financial assets that can be reliably measured after its assessment at the reporting date. The JBIC Group recognizes collectively evaluated impairment losses such as incurred but not reported losses by applying historical loss experience to a group of loans and other receivables with similar credit risk characteristics. The carrying amount of loans and other receivables is reduced by the amount of impairment losses through allowance for loan losses.
| | E. | Equity method investments |
The JBIC Group’s investments in associates and joint ventures are comprised mainly of investments in partnerships. Under Japanese GAAP, the JBIC Group did not prepare consolidated financial statements before the fiscal year ended March 31, 2018. Accordingly, the JBIC Group did not apply the equity method for its investments in associates and joint ventures before. Until then, the JBIC Group measured those investments at net amounts equivalent to its share of profits or losses reported in their most recent financial statements available at the reporting date defined in the partnership agreement. From the fiscal year ended March 31, 2018, the JBIC Group prepares consolidated financial statements under Japanese GAAP and applies the equity method to certain investments in partnerships. Under IFRS, the JBIC Group adopts the equity method to all of its investments in partnerships that are determined as an investment in associates and joint ventures. Gains or losses on investments in partnerships to which the equity method is not applied under Japanese GAAP but is applied under IFRS are recognized as “Profits of equity method investments” under IFRS.
The JBIC Group presents exchange differences on translation of foreign operations from applying the equity method as “Other reserves” under IFRS, whereas, from the fiscal year ended March 31, 2018, they are presented as “Foreign currency translation adjustment” under Japanese GAAP.
Under Japanese GAAP, the JBIC Group expenses bond issuance costs as incurred. Under IFRS, the JBIC Group measures bonds payable initially at fair value less transaction costs directly attributable to bond issuance, such as fees paid to underwriters and discounts at issuance, and subsequently at amortized cost using the effective interest method. As described in “A. ii. Fair value hedges,” the JBIC Group adjusts the carrying amounts of bonds payable for which hedge accounting was discontinued at the date of transition and amortizes them accordingly.
| | G. | Financial guarantee contracts |
Under Japanese GAAP, the JBIC Group records the same contractual amounts of financial guarantee obligations in both “Customers’ liabilities for acceptances and guarantees” as assets and in “Acceptances and guarantees” as liabilities. Under IFRS, the JBIC Group initially measures financial liabilities associated with financial guarantee contracts at fair value as well as financial assets associated with financial guarantee contracts, and subsequently measures financial liabilities associated with financial guarantee contracts at the higher of (a) the amount initially recognized less cumulative amortization recognized and (b) the amount of estimated expenditure required to settle the guarantee obligation at the reporting date.
| | H. | Liability for retirement benefits |
Under Japanese GAAP, the JBIC Group expenses actuarial gains or losses on defined benefit plans in profit or loss as incurred.
Under IFRS, the JBIC Group recognizes directly remeasurement of defined benefit plans in “Other reserves” as incurred and reclassifies immediately to retained earnings. The JBIC Group remeasures retirement benefit obligations according to applicable IFRS and recognizes the remeasurement difference due to such as the period allocation method as “Operating expenses.” The JBIC Group includes a liability for retirement benefits in “Other liabilities.”
| | I. | Difference between the date of consolidated financial statements and the reporting date of subsidiaries |
Under Japanese GAAP, if the difference in the reporting date of a subsidiary and the date of consolidated financial statements does not exceed three months, only significant inter-company transactions are reflected in the financial statements of the subsidiary. Therefore, the JBIC Group makes adjustments for only significant inter-company transactions for Japanese GAAP consolidation purposes. On the other hand, under IFRS, the financial statements of consolidated subsidiaries need to be prepared, unless it is impracticable, to the reporting date of the parent company. Accordingly, the JBIC Group prepares the financial statements of the subsidiaries whose reporting dates are different from JBIC to conform to the reporting date of JBIC.
6
Adjusted net profit in accordance with IFRS before IFRS adjustments for hedge accounting (Non-GAAP information calculated and presented on the basis of methodologies other than in accordance with generally accepted accounting principles)
The JBIC Group uses derivatives exclusively to hedge interest rate risk and foreign exchange risk. Under Japanese GAAP, the JBIC Group applies hedge accounting in order not to recognize net gains (losses) from the valuation of derivatives deferred by hedge accounting in net profit. As the JBIC Group discloses its financial statements under IFRS for reference purposes and does not apply hedge accounting under IAS 39, “Net gains (losses) from the valuation of derivative financial instruments” and “Net gains from hedge accounting discontinued at the date of transition” are recognized in net profit (loss) in accordance with IFRS*.
As the JBIC Group uses these derivatives for hedging purposes, these derivatives will not be canceled for realizing temporal net gains (losses) from valuation before their maturity dates. However, depending on market conditions, these net gains (losses) from valuation might have a substantial impact on net profit (loss) in accordance with IFRS. Therefore, “Adjusted net profit in accordance with IFRS before IFRS adjustments for hedge accounting” calculated by excluding temporal net gains (losses) from valuation from net profit in accordance with IFRS is useful for the users of the JBIC Group’s financial statements under IFRS to understand its financial performance and disclosed as a supplementary explanation for the reconciliation between Japanese GAAP and IFRS.
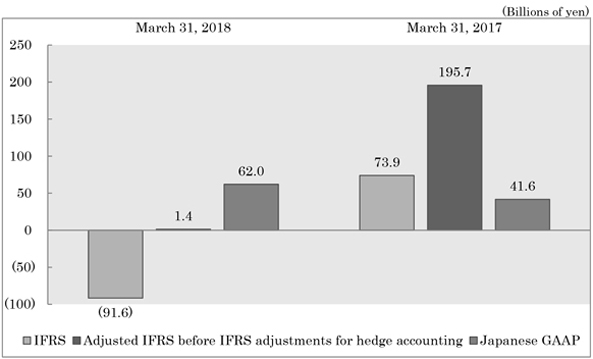
Adjusted net profit in accordance with IFRS before IFRS adjustments for hedge accounting is reconciled from net profit (loss) in accordance with IFRS by excluding the temporary gains or losses from the valuation of derivatives as follows:
| | | | | | | | |
| | | (Billions of yen) | |
| | | March 31, 2018 | | | March 31, 2017 | |
Net profit (loss) in accordance with IFRS (A) | | | (91.6 | ) | | | 73.9 | |
| | | | | | | | |
Net losses from the valuation of derivative financial instruments | | | (93.8 | ) | | | (124.6 | ) |
Net gains from hedge accounting discontinued at the date of transition | | | 0.8 | | | | 2.8 | |
| | | | | | | | |
Sub-total (B) | | | (93.0 | ) | | | (121.8 | ) |
| | | | | | | | |
Adjusted net profit in accordance with IFRS before IFRS adjustments for hedge accounting (A)-(B) | | | 1.4 | | | | 195.7 | |
| | | | | | | | |
Net profit (loss) in accordance with IFRS, adjusted net profit in accordance with IFRS before IFRS adjustments for hedge accounting and net profit in accordance with Japanese GAAP for the fiscal years ended March 31, 2018 and 2017
| * | See “A. Derivative financial instrument assets and liabilities” for the difference between Japanese GAAP and IFRS regarding the accounting policies for derivative financial instruments. |
7